Better Choice Company Reports Third Quarter 2022 Financial Results and Provides Operational and Corporate Updates
•Year-to-Date Net Sales Totaled $45.4 million, an Increase of 30% Year-over-Year
•Gross Profit and Adjusted Gross Profit Margins Improved to 35% and 37% for the Third Quarter
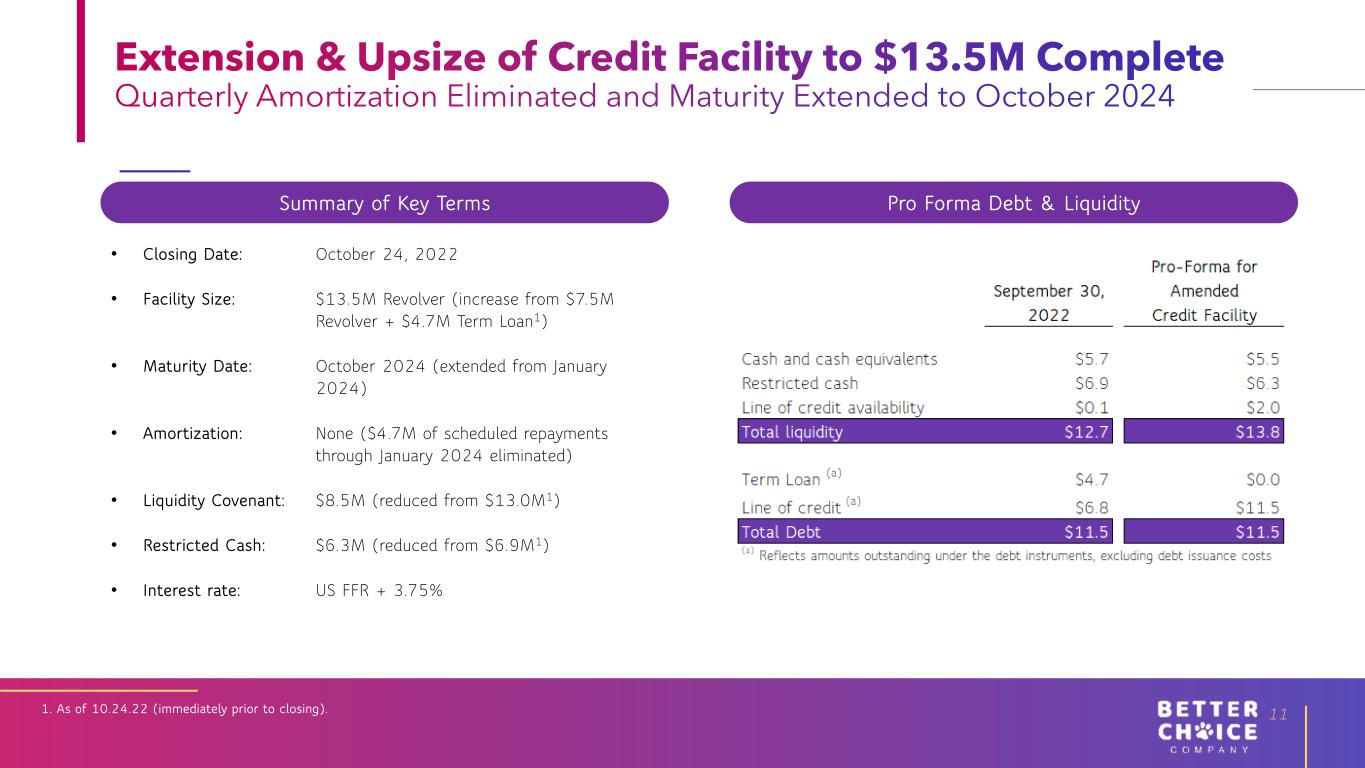
•Extended and Upsized Revolving Credit Facility to $13.5 Million in October 2022, Resulting in Removal of Going Concern Language from our 10-Q
NEW YORK, NY, November 10, 2022 -- Better Choice Company Inc. (NYSE American: BTTR) (the “Company” or “Better Choice”), a pet health and wellness company, today reported its financial results for the third quarter ended September 30, 2022.
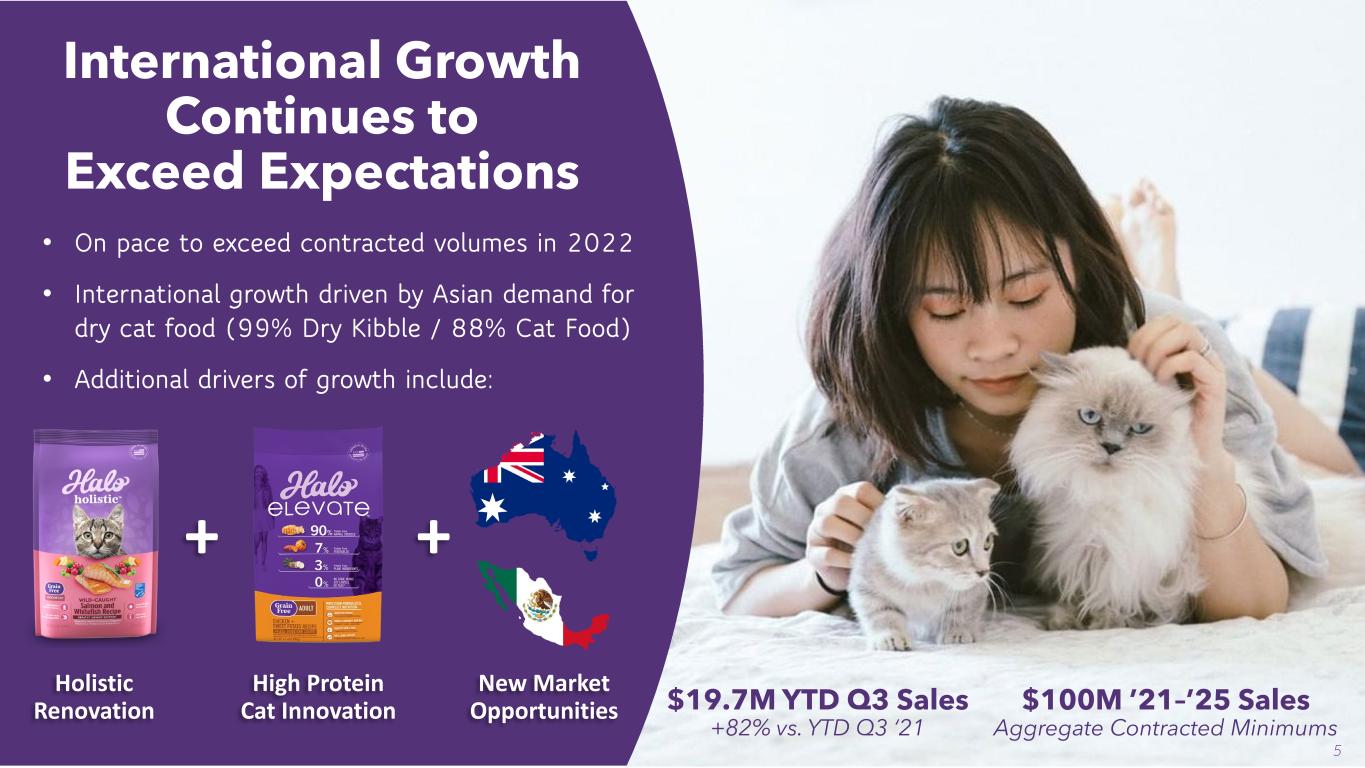
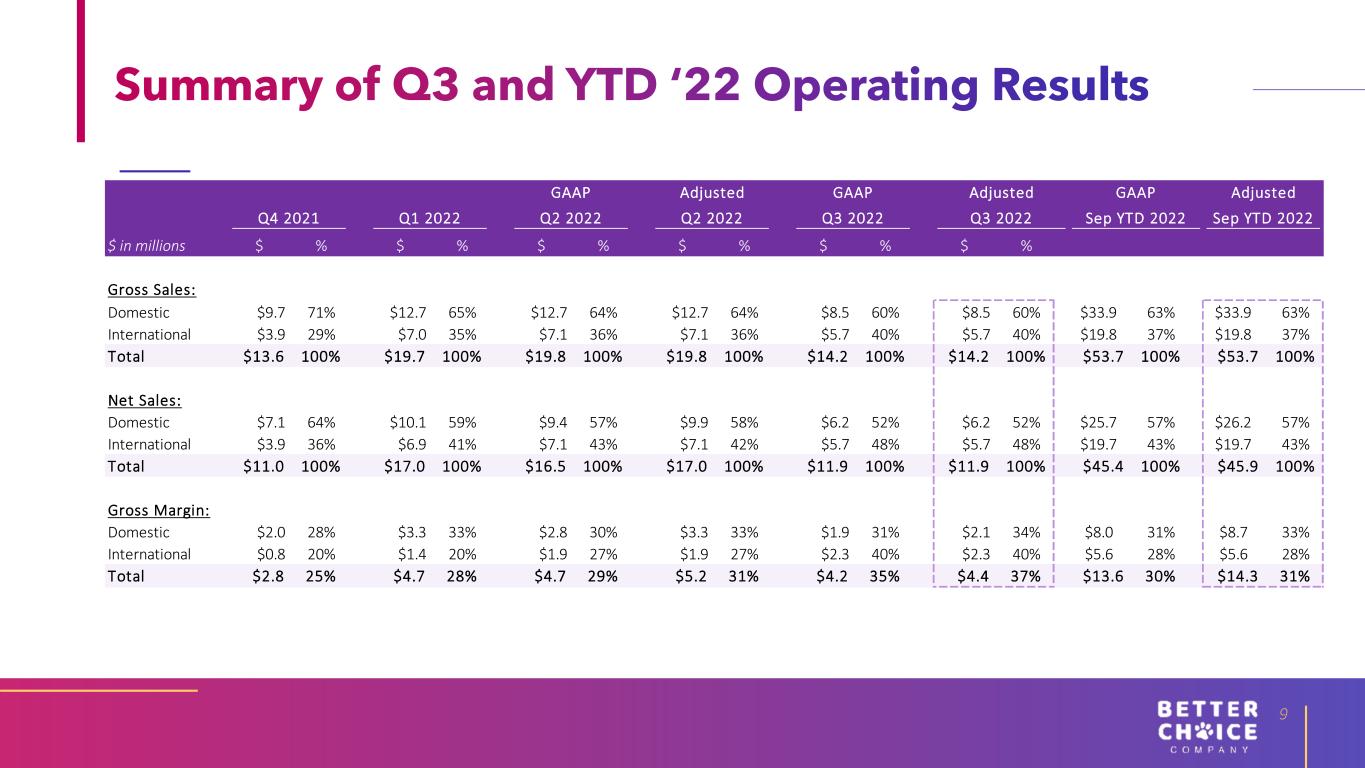
Lionel F. Conacher, Interim CEO of Better Choice, stated, “In the third quarter, we generated $11.9 million in net sales, highlighted by strong performance internationally, where we delivered 31% growth, and relative softness domestically, which we believe is a result of our channel partners electing to reduce weeks of supply as a response to rising interest rates. On a year-to-date basis, net sales totaled $45.4 million, an increase of 30% as compared to the same year-over-year period.”
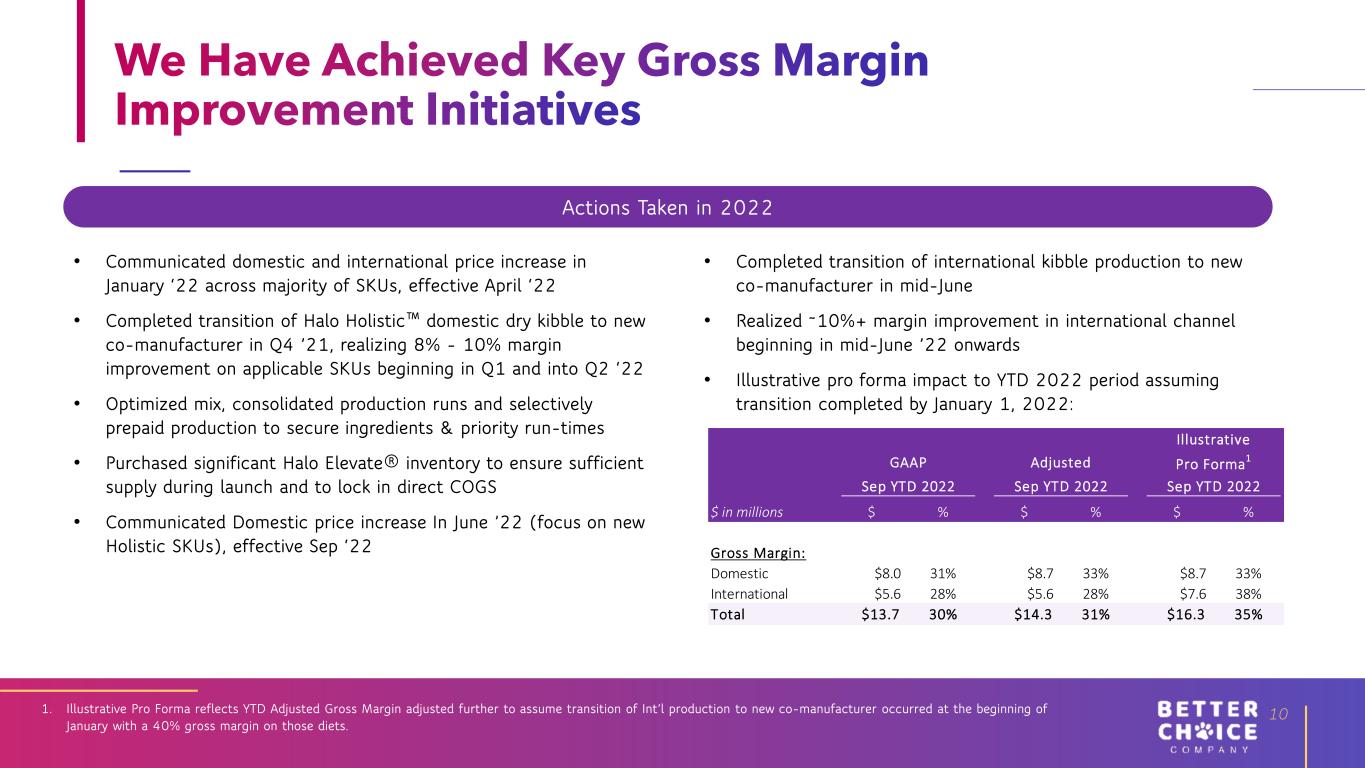
Mr. Conacher continued, “In the third quarter, we delivered a third consecutive quarter of gross margin improvement, with gross profit and adjusted gross profit margins improving to 35% and 37%. This represents a six percentage point improvement from Q2 2022 and a twelve percentage point improvement from Q4 2021. Subsequent to the third quarter, we also made meaningful improvements to our balance sheet by extending and upsizing our current revolving credit facility to $13.5 million. Following the completion of this refinance, we were able to remove the going concern language from our 10-Q.”
“Despite what has been a challenging operating environment so far this year, we have the foundation in place to be able to compete and grow across all of our distribution channels. We have committed Brick & Mortar retail partners, a network of International distributors, a recurring base of online subscribers, strong E-commerce partners and co-manufacturing partners with the capacity to support our growth, and a banking relationship that allows us to strategically deploy working capital. Going forward, it is our plan to focus on execution, reduce our quarterly cash burn, and grow to ultimately deliver a return to shareholders,” said Mr. Conacher.
Year-to-Date 2022 Financial Highlights
•Gross sales of $53.7 million.
•Net sales of $45.4 million.
•Adjusted net sales of $45.9 million.
•International net sales of $19.7 million.
•E-commerce net sales of $11.0 million.
•Brick & Mortar net sales of $9.6 million.
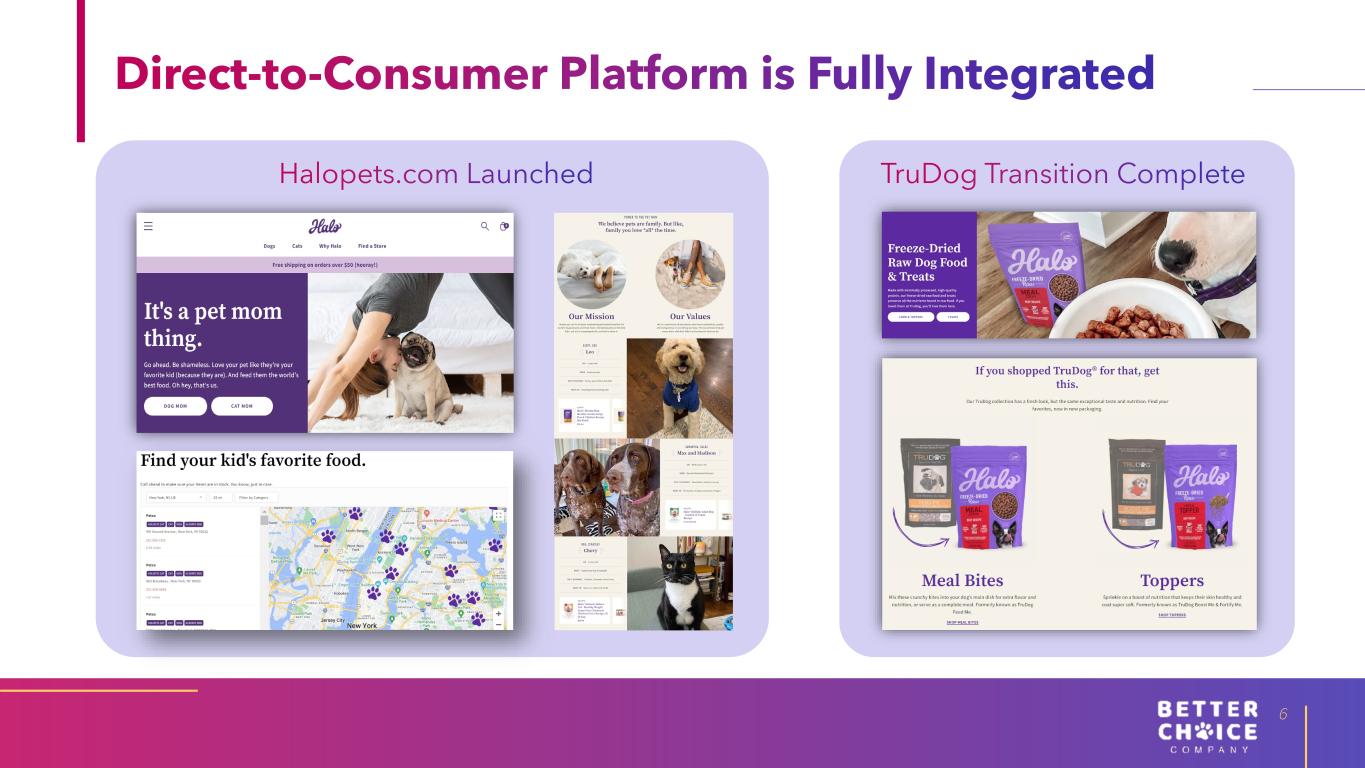
•Direct to Consumer net sales of $5.1 million.
•Gross margin of 30%.
•Adjusted gross margin of 31%.
•Loss from operations of $14.6 million.
•Adjusted EBITDA loss of $7.0 million.
•Net loss available to common stockholders of $15.0 million.
Third Quarter 2022 Financial Highlights
•Gross sales of $14.2 million.
•Net sales of $11.9 million.
•Gross margin of 35%.
•Adjusted gross margin of 37%.
•Loss from operations of $6.4 million.
•Adjusted EBITDA loss of $2.9 million.
•Net loss available to common stockholders of $6.5 million.
Conference Call and Webcast Information
The Company will host a conference call and audio webcast on Thursday, November 10, 2022 at 8:30 am (Eastern Time) to answer questions about the Company's operational and financial highlights for the third quarter of 2022.
| Event: | Better Choice Third Quarter 2022 Earnings Call | ||||
| Date: | Thursday, November 10, 2022 | ||||
| Time: | 8:30 a.m. Eastern Time | ||||
| Live Call: | +1-888-348-8935 (U.S. Toll-Free) or +1-412-317-0454 (International) | ||||
| Webcast: | https://viavid.webcasts.com/starthere.jsp?ei=1576512&tp_key=ccc202c0ba | ||||
For interested individuals unable to join the conference call, a dial-in replay of the call will be available until November 24, 2022 and can be accessed by dialing +1-844-512-2921 (U.S. Toll Free) or +1-412-317-6671 (International) and entering replay pin number: 10169599.
Better Choice Company Inc.
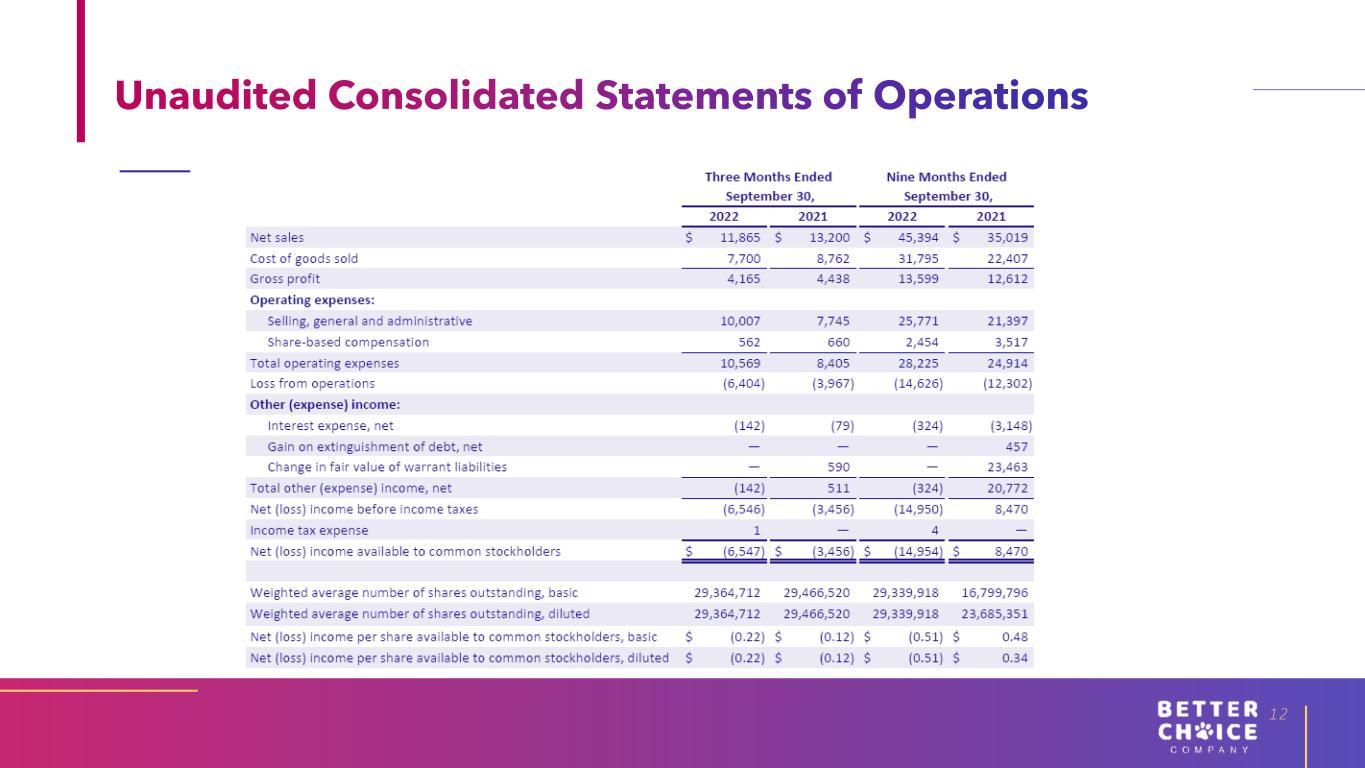
Unaudited Consolidated Statements of Operations
(Dollars in thousands, except share and per share amounts)
| Three Months Ended September 30, | Nine Months Ended September 30, | ||||||||||||||||||||||
| 2022 | 2021 | 2022 | 2021 | ||||||||||||||||||||
| Net sales | $ | 11,865 | $ | 13,200 | $ | 45,394 | $ | 35,019 | |||||||||||||||
| Cost of goods sold | 7,700 | 8,762 | 31,795 | 22,407 | |||||||||||||||||||
| Gross profit | 4,165 | 4,438 | 13,599 | 12,612 | |||||||||||||||||||
| Operating expenses: | |||||||||||||||||||||||
| Selling, general and administrative | 10,007 | 7,745 | 25,771 | 21,397 | |||||||||||||||||||
| Share-based compensation | 562 | 660 | 2,454 | 3,517 | |||||||||||||||||||
| Total operating expenses | 10,569 | 8,405 | 28,225 | 24,914 | |||||||||||||||||||
| Loss from operations | (6,404) | (3,967) | (14,626) | (12,302) | |||||||||||||||||||
| Other (expense) income: | |||||||||||||||||||||||
| Interest expense, net | (142) | (79) | (324) | (3,148) | |||||||||||||||||||
| Gain on extinguishment of debt, net | — | — | — | 457 | |||||||||||||||||||
| Change in fair value of warrant liabilities | — | 590 | — | 23,463 | |||||||||||||||||||
| Total other (expense) income, net | (142) | 511 | (324) | 20,772 | |||||||||||||||||||
| Net (loss) income before income taxes | (6,546) | (3,456) | (14,950) | 8,470 | |||||||||||||||||||
| Income tax expense | 1 | — | 4 | — | |||||||||||||||||||
| Net (loss) income available to common stockholders | $ | (6,547) | $ | (3,456) | $ | (14,954) | $ | 8,470 | |||||||||||||||
| Weighted average number of shares outstanding, basic | 29,364,712 | 29,466,520 | 29,339,918 | 16,799,796 | |||||||||||||||||||
| Weighted average number of shares outstanding, diluted | 29,364,712 | 29,466,520 | 29,339,918 | 23,685,351 | |||||||||||||||||||
| Net (loss) income per share available to common stockholders, basic | $ | (0.22) | $ | (0.12) | $ | (0.51) | $ | 0.48 | |||||||||||||||
| Net (loss) income per share available to common stockholders, diluted | $ | (0.22) | $ | (0.12) | $ | (0.51) | $ | 0.34 | |||||||||||||||
Better Choice Company Inc.
Unaudited Condensed Consolidated Balance Sheets
(Dollars in thousands, except share and per share amounts)
| September 30, 2022 | December 31, 2021 | ||||||||||
| Assets | |||||||||||
| Cash and cash equivalents | $ | 5,652 | $ | 21,729 | |||||||
| Restricted cash | 6,963 | 7,213 | |||||||||
| Accounts receivable, net | 9,594 | 6,792 | |||||||||
| Inventories, net | 11,611 | 5,245 | |||||||||
| Prepaid expenses and other current assets | 1,108 | 2,940 | |||||||||
| Total Current Assets | 34,928 | 43,919 | |||||||||
| Fixed assets, net | 421 | 369 | |||||||||
| Right-of-use assets, operating lease | 186 | 56 | |||||||||
| Intangible assets, net | 10,441 | 11,586 | |||||||||
| Goodwill | 18,614 | 18,614 | |||||||||
| Other assets | 110 | 116 | |||||||||
| Total Assets | $ | 64,700 | $ | 74,660 | |||||||
| Liabilities & Stockholders’ Equity | |||||||||||
| Current Liabilities | |||||||||||
| Accounts payable | $ | 3,852 | $ | 4,553 | |||||||
| Accrued and other liabilities | 3,109 | 1,879 | |||||||||
| Line of credit | 640 | — | |||||||||
| Term loan, net | 1,282 | 855 | |||||||||
| Operating lease liability | 51 | 54 | |||||||||
| Total Current Liabilities | 8,934 | 7,341 | |||||||||
| Non-current Liabilities | |||||||||||
| Line of credit, net | 6,735 | 4,856 | |||||||||
| Term loan, net | 3,495 | 4,559 | |||||||||
| Deferred tax liability | 24 | 24 | |||||||||
| Operating lease liability | 137 | 5 | |||||||||
| Total Non-current Liabilities | 10,391 | 9,444 | |||||||||
| Total Liabilities | 19,325 | 16,785 | |||||||||
| Stockholders’ Equity | |||||||||||
| Common Stock, $0.001 par value, 200,000,000 shares authorized, 29,364,712 and 29,146,367 shares issued and outstanding as of September 30, 2022 and December 31, 2021, respectively | 29 | 29 | |||||||||
| Additional paid-in capital | 319,556 | 317,102 | |||||||||
| Accumulated deficit | (274,210) | (259,256) | |||||||||
| Total Stockholders’ Equity | 45,375 | 57,875 | |||||||||
| Total Liabilities and Stockholders’ Equity | $ | 64,700 | $ | 74,660 | |||||||
Better Choice Company Inc.
Non-GAAP Measures
Adjusted EBITDA
We define Adjusted EBITDA as EBITDA further adjusted to eliminate the impact of certain items that we do not consider indicative of our core operations. Adjusted EBITDA is determined by adding the following items to net (loss) income: interest expense, tax expense, depreciation and amortization, share-based compensation, warrant expense, loss on disposal of assets, change in fair value of warrant liabilities, gain or loss on extinguishment of debt, equity and debt offering expenses and other non-recurring expenses.
We present Adjusted EBITDA as it is a key measure used by our management and board of directors to evaluate our operating performance, generate future operating plans and make strategic decisions regarding the allocation of capital. We believe that the disclosure of Adjusted EBITDA is useful to investors as this non-GAAP measure forms the basis of how our management team reviews and considers our operating results. By disclosing this non-GAAP measure, we believe that we create for investors a greater understanding of and an enhanced level of transparency into the means by which our management team operates our company. We also believe this measure can assist investors in comparing our performance to that of other companies on a consistent basis without regard to certain items that do not directly affect our ongoing operating performance or cash flows.
Adjusted EBITDA does not represent cash flows from operations as defined by GAAP. Adjusted EBITDA has limitations as a financial measure and you should not consider it in isolation, or as a substitute for, or superior to, financial measures calculated in accordance with GAAP. Because of these limitations, you should consider Adjusted EBITDA alongside other financial performance measures, including various cash flow metrics, net (loss) income, gross margin, and our other GAAP results.
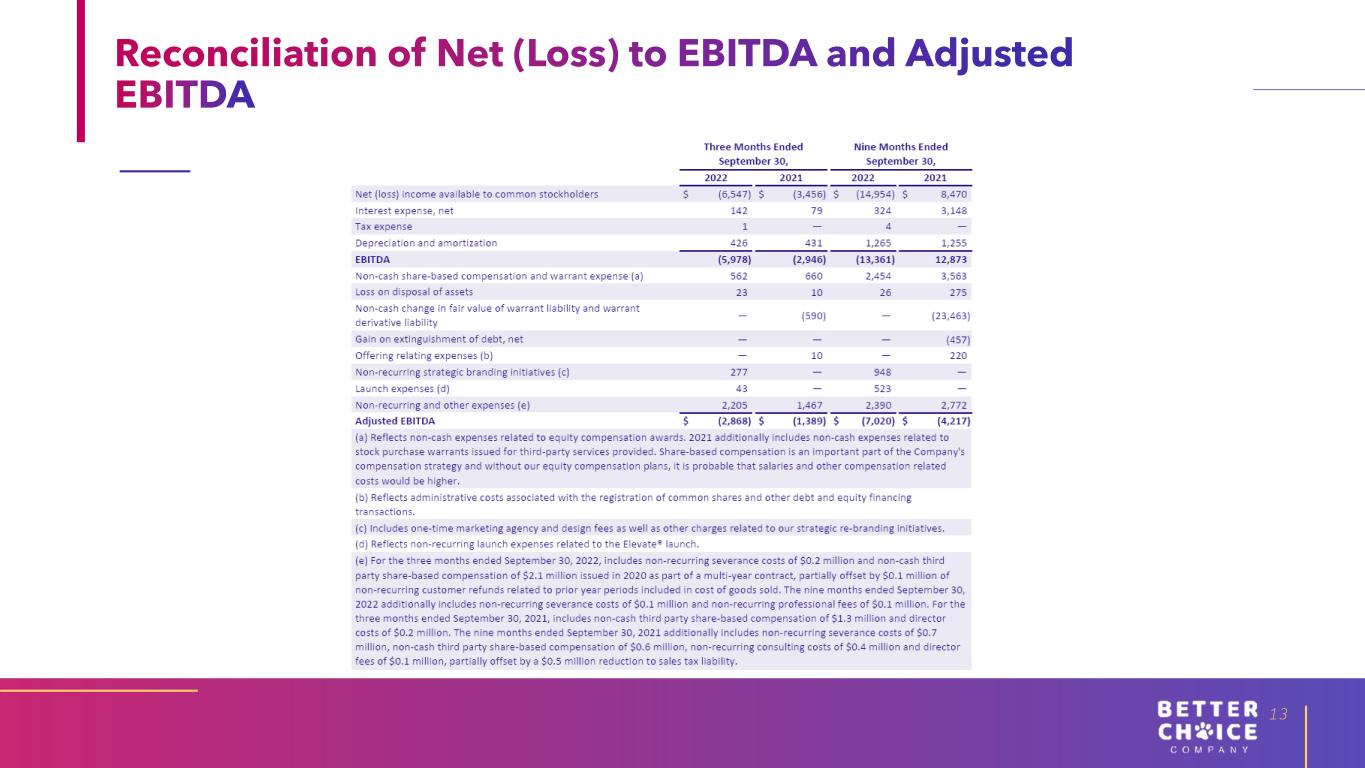
The following table presents a reconciliation of net (loss) income, the closest GAAP financial measure, to EBITDA and Adjusted EBITDA for each of the periods indicated (in thousands):
Reconciliation of Net (Loss) Income to EBITDA and Adjusted EBITDA
| Three Months Ended September 30, | Nine Months Ended September 30, | |||||||||||||||||||||||||
| 2022 | 2021 | 2022 | 2021 | |||||||||||||||||||||||
| Net (loss) income available to common stockholders | $ | (6,547) | $ | (3,456) | $ | (14,954) | $ | 8,470 | ||||||||||||||||||
| Interest expense, net | 142 | 79 | 324 | 3,148 | ||||||||||||||||||||||
| Tax expense | 1 | — | 4 | — | ||||||||||||||||||||||
| Depreciation and amortization | 426 | 431 | 1,265 | 1,255 | ||||||||||||||||||||||
| EBITDA | (5,978) | (2,946) | (13,361) | 12,873 | ||||||||||||||||||||||
| Non-cash share-based compensation and warrant expense (a) | 562 | 660 | 2,454 | 3,563 | ||||||||||||||||||||||
| Loss on disposal of assets | 23 | 10 | 26 | 275 | ||||||||||||||||||||||
| Non-cash change in fair value of warrant liability and warrant derivative liability | — | (590) | — | (23,463) | ||||||||||||||||||||||
| Gain on extinguishment of debt, net | — | — | — | (457) | ||||||||||||||||||||||
| Offering relating expenses (b) | — | 10 | — | 220 | ||||||||||||||||||||||
| Non-recurring strategic branding initiatives (c) | 277 | — | 948 | — | ||||||||||||||||||||||
| Launch expenses (d) | 43 | — | 523 | — | ||||||||||||||||||||||
| Non-recurring and other expenses (e) | 2,205 | 1,467 | 2,390 | 2,772 | ||||||||||||||||||||||
| Adjusted EBITDA | $ | (2,868) | $ | (1,389) | $ | (7,020) | $ | (4,217) | ||||||||||||||||||
| (a) Reflects non-cash expenses related to equity compensation awards. 2021 additionally includes non-cash expenses related to stock purchase warrants issued for third-party services provided. Share-based compensation is an important part of the Company's compensation strategy and without our equity compensation plans, it is probable that salaries and other compensation related costs would be higher. | ||||||||||||||||||||||||||
| (b) Reflects administrative costs associated with the registration of common shares and other debt and equity financing transactions. | ||||||||||||||||||||||||||
| (c) Includes one-time marketing agency and design fees as well as other charges related to our strategic re-branding initiatives. | ||||||||||||||||||||||||||
| (d) Reflects non-recurring launch expenses related to the Elevate® launch. | ||||||||||||||||||||||||||
| (e) For the three months ended September 30, 2022, includes non-recurring severance costs of $0.2 million and non-cash third party share-based compensation of $2.1 million issued in 2020 as part of a multi-year contract, partially offset by $0.1 million of non-recurring customer refunds related to prior year periods included in cost of goods sold. The nine months ended September 30, 2022 additionally includes non-recurring severance costs of $0.1 million and non-recurring professional fees of $0.1 million. For the three months ended September 30, 2021, includes non-cash third party share-based compensation of $1.3 million and director costs of $0.2 million. The nine months ended September 30, 2021 additionally includes non-recurring severance costs of $0.7 million, non-cash third party share-based compensation of $0.6 million, non-recurring consulting costs of $0.4 million and director fees of $0.1 million, partially offset by a $0.5 million reduction to sales tax liability. | ||||||||||||||||||||||||||
Adjusted Financial Performance Measures
The "Adjusted Financial Performance Measures" present non-GAAP financial information and should not be considered a measure of financial performance under GAAP. These measures are presented as an alternative method for assessing our operating results by adjusting for the impact of certain non-recurring, infrequent or unusual items in a manner that is focused on the performance of our underlying operations. Each of these measures are intended to provide greater consistency, comparability and clarity of our results. Management uses this non-GAAP financial information to assess our core operating results and consequently, management believes it is similarly useful information to investors.
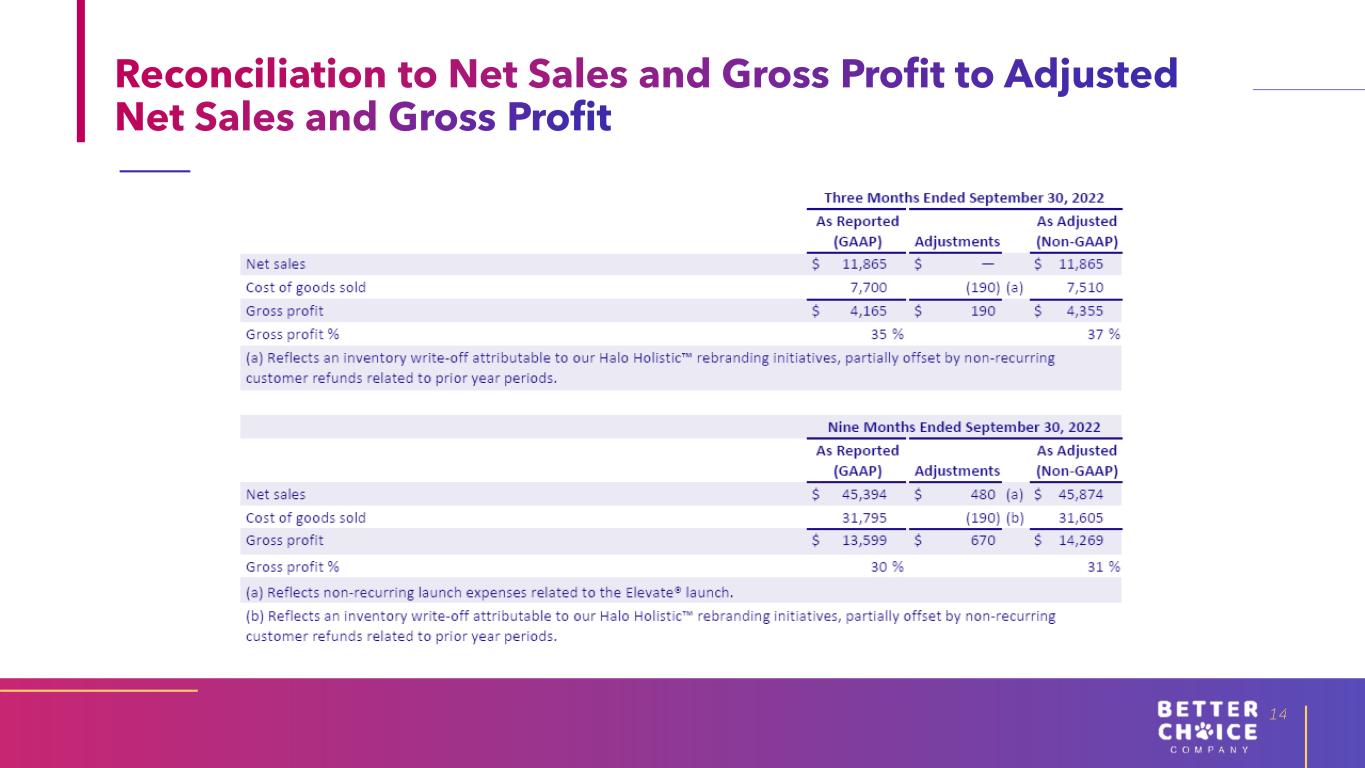
The following table presents a reconciliation of net sales and gross profit to adjusted net sales and gross profit for each of the periods indicated (in thousands):
Reconciliation of Net Sales and Gross Profit to Adjusted Net Sales and Gross Profit
| Three Months Ended September 30, 2022 | |||||||||||||||||
| As Reported (GAAP) | Adjustments | As Adjusted (Non-GAAP) | |||||||||||||||
| Net sales | $ | 11,865 | $ | — | $ | 11,865 | |||||||||||
| Cost of goods sold | 7,700 | (190) | (a) | 7,510 | |||||||||||||
| Gross profit | $ | 4,165 | $ | 190 | $ | 4,355 | |||||||||||
| Gross profit % | 35 | % | 37 | % | |||||||||||||
(a) Reflects an inventory write-off attributable to our Halo Holistic™ rebranding initiatives, partially offset by non-recurring customer refunds related to prior year periods. | |||||||||||||||||
| Nine Months Ended September 30, 2022 | |||||||||||||||||
| As Reported (GAAP) | Adjustments | As Adjusted (Non-GAAP) | |||||||||||||||
| Net sales | $ | 45,394 | $ | 480 | (a) | $ | 45,874 | ||||||||||
| Cost of goods sold | 31,795 | (190) | (b) | 31,605 | |||||||||||||
| Gross profit | $ | 13,599 | $ | 670 | $ | 14,269 | |||||||||||
| Gross profit % | 30 | % | 31 | % | |||||||||||||
| (a) Reflects non-recurring launch expenses related to the Elevate® launch. | |||||||||||||||||
(b) Reflects an inventory write-off attributable to our Halo Holistic™ rebranding initiatives, partially offset by non-recurring customer refunds related to prior year periods. | |||||||||||||||||
About Better Choice Company Inc.
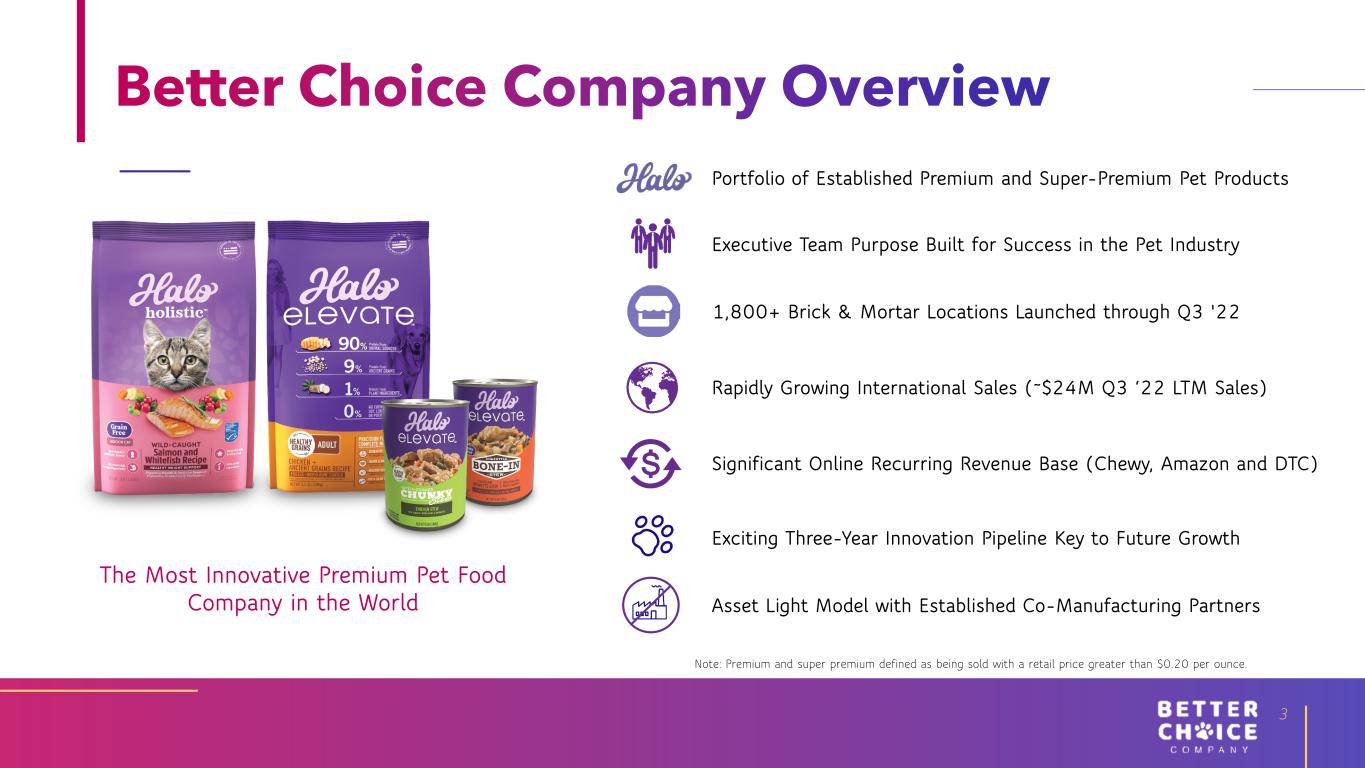
Better Choice Company Inc. is a pet health and wellness company focused on providing pet products and services that help dogs and cats live healthier, happier and longer lives. We offer a broad portfolio of pet health and wellness products for dogs and cats sold under our Halo brand across multiple forms, including foods, treats, toppers, dental products, chews, and supplements. We have a demonstrated, multi-decade track record of success and are well positioned to benefit from the mainstream trends of growing pet humanization and consumer focus on health and wellness. Our products consist of kibble and canned dog and cat food, freeze-dried raw dog food and treats, vegan dog food and treats, oral care products and supplements. Halo’s core products are made with high-quality, thoughtfully sourced ingredients for natural, science-based nutrition. Each innovative recipe is formulated with leading veterinary and nutrition experts to deliver optimal health. For more information, please visit https://www.betterchoicecompany.com.
Forward Looking Statements
This press release contains forward-looking statements within the meaning of the Private Securities Litigation Reform Act of 1995. The words “believe,” “may,” “estimate,” “continue,” “anticipate,” “intend,” “should,” “plan,” “could,” “target,” “potential,” “is likely,” “will,” “expect” and similar expressions, as they relate to us, are intended to identify forward-looking statements. The Company has based these forward-looking statements largely on our current expectations and projections about future events and financial trends that we believe may affect our financial condition, results of operations, business strategy and financial needs. Some or all of the results anticipated by these forward-looking statements may not be achieved. Further information on the Company’s risk factors is contained in our filings with the SEC. Any forward-looking statement made by us herein speaks only as of the date on which it is made. Factors or events that could cause our actual results to differ may emerge from time to time, and it is not possible for us to predict all of them. The Company undertakes no obligation to publicly update any forward-looking statement, whether as a result of new information, future developments or otherwise, except as may be required by law.
Company Contact:
Better Choice Company Inc.
Lionel F. Conacher, Interim CEO
Investor Contact:
KCSA Strategic Communications
Valter Pinto, Managing Director
T: 212-896-1254