false
0000921638
A1
0000921638
2024-02-13
2024-02-13
iso4217:USD
xbrli:shares
iso4217:USD
xbrli:shares
UNITED STATES
SECURITIES AND EXCHANGE COMMISSION
WASHINGTON, D.C. 20549
FORM 8-K
CURRENT REPORT
PURSUANT TO SECTION 13 OR 15(d)
OF THE SECURITIES EXCHANGE ACT OF 1934
Date of Report (Date of earliest event reported):
February 13, 2024
SSR Mining Inc.
(Exact name of Registrant as Specified in Its
Charter)
British Columbia
(State or Other Jurisdiction of Incorporation)
001-35455
(Commission File Number)
98-0211014
(I.R.S. Employer Identification No.)
6900 E.
Layton Ave., Suite 1300, Denver, Colorado USA 80237
(Address of principal executive offices) (zip code)
(303) 292-1299
(Registrant’s telephone number, including
area code)
Not Applicable
(Former Name or Former Address, if Changed Since
Last Report)
Check the appropriate box below if the Form 8-K filing is intended
to simultaneously satisfy the filing obligation of the registrant under any of the following provisions:
| ☐ |
Written communications pursuant to Rule 425 under the Securities Act (17 CFR 230.425) |
| ☐ |
Soliciting material pursuant to Rule 14a-12 under the Exchange Act (17 CFR 240.14a-12) |
| ☐ |
Pre-commencement communications pursuant to Rule 14d-2(b) under the Exchange Act (17 CFR 240.14d-2(b)) |
| ☐ |
Pre-commencement communications pursuant to Rule 13e-4(c) under the Exchange Act (17 CFR 240.13e-4(c)) |
Securities registered pursuant to Section 12(b) of the Act:
| Title of each class |
|
Trading Symbol |
|
Name of each exchange on which registered |
| Common Shares without par value |
|
SSRM |
|
The Nasdaq Stock Market LLC |
Indicate by check mark whether the registrant is an emerging growth
company as defined in Rule 405 of the Securities Act of 1933 (§ 230.405 of this chapter) or Rule 12b-2 of the Securities Exchange
Act of 1934 (§ 240.12b-2 of this chapter).
Emerging growth company ☐
If an emerging growth company, indicate by check mark if the registrant
has elected not to use the extended transition period for complying with any new or revised financial accounting standards provided pursuant
to Section 13(a) of the Exchange Act.
ITEM 2.02. Results of Operations and Financial Condition
On February 13, 2024, SSR Mining Inc., a British
Columbia corporation (the “Company”), issued a news release announcing multi-year guidance and the issuance of technical report
summaries for each of the Company’s four operating assets, featuring production growth approaching 800,000 ounces by 2027 at all-in
sustaining costs trending towards $1,300 per ounce.
As previously announced, the Company will hold
a conference call on February 13, 2024 to release its 2024 and long-term production guidance and discuss the Technical Report Summaries.
Access information for the conference call, and the accompanying presentation to be given on the call, is available on the Company’s
website at http://ir.ssrmining.com/investors/events. On the conference call, the Company will discuss the newly issued multi-year guidance,
new technical report summaries and year-end 2023 Mineral Resources and Mineral Reserves.
A copy of the news release is furnished as Exhibit
99.1 to this report and hereby incorporated in this Item 2.02 by reference.
The information in this Item 2.02 of this Current Report on Form 8-K, including the new release furnished as Exhibit 99.1, shall not be
deemed “filed” for purposes of Section 18 of the Securities Exchange Act of 1934 (as amended, the “Exchange Act”)
or otherwise subject to the liabilities of that Section, and shall not be or be deemed to be incorporated by reference in any filing under
the Securities Act of 1933, as amended, or the Exchange Act, regardless of any general incorporation language in such filing.
ITEM 8.01. Other Events
The Company is hereby filing updated Technical
Report Summaries prepared in accordance with Subpart 1300 of Regulation S-K. The Technical Report Summary on Çöpler Property, Türkiye,
and the corresponding consents of the qualified persons, is filed as Exhibit 96.1 to this report. The Technical Report Summary on the
Marigold Complex, Nevada, USA, and the corresponding consent of the qualified person, is filed as Exhibit 96.2 to this report. The Technical
Report Summary on the Seabee Gold Operations, Saskatchewan, Canada, and the corresponding consent of the qualified person, is filed as
Exhibit 96.3 to this report. The Technical Report Summary on the Puna Operations, Argentina, and the corresponding consent of the qualified
person, is filed as Exhibit 96.4 to this report.
ITEM 9.01. Financial Statements and Exhibits
(d) Exhibits
| Exhibit Number |
|
Description of Exhibit |
| 23.1 |
|
Consent of Qualified Person for Technical Report Summary on Çöpler Property, Türkiye. |
| 23.2 |
|
Consent of Qualified Person for Technical Report Summary on the Marigold Complex, Nevada, USA. |
| 23.3 |
|
Consent of Qualified Person for Technical Report Summary on Seabee Gold Operations, Saskatchewan, Canada. |
| 23.4 |
|
Consent of Qualified Person for Technical Report Summary on the Puna Operations, Argentina. |
| 96.1 |
|
Technical Report Summary on Çöpler Property, Türkiye. |
| 96.2 |
|
Technical Report Summary on the Marigold Complex, Nevada, USA. |
| 96.3 |
|
Technical Report Summary on Seabee Gold Operations, Saskatchewan, Canada. |
| 96.4 |
|
Technical Report Summary on the Puna Operations, Argentina. |
| 99.1 |
|
News Release, dated February 13, 2024, announcing issuance of multi-year guidance and technical reports for key operating assets featuring production growth approaching 800,000 ounces by 2027 at AISC trending towards $1,300 per ounce. |
| 104 |
|
Cover Page Interactive Data File (embedded within the Inline XBRL document) |
SIGNATURE
Pursuant to the requirements of the Securities and Exchange Act of
1934, as amended, the Registrant has duly caused this report to be signed on its behalf by the undersigned hereunto duly authorized.
| |
|
SSR Mining Inc. |
| |
|
|
|
|
| |
|
By: |
|
/s/ Michael J. Sparks |
| |
|
Name: |
|
Michael. J. Sparks |
| |
|
Title: |
|
Executive Vice President and Chief Legal & Administrative Officer |
Dated: February 13, 2024
 |
Exhibit 23.1 |
Richard Kiel, P.E. (Colorado)
WSP USA Inc.
7245 West Alaska Drive, Suite 200,
Lakewood, Colorado, USA 80226
CONSENT OF QUALIFIED PERSON
I, Richard Kiel, state that
I am responsible for preparing or supervising the preparation of part(s) of the technical report summary, titled ‘Technical Report
Summary on the Çöpler Property, Türkiye, SEC S-K 1300’ with an effective date of October 31, 2024, and dated February
12, 2024, as signed and certified by me (the “Technical Report Summary”).
Furthermore, I state that:
| (a) | I consent to the public filing of the Technical Report
Summary by SSR Mining Inc. (”the “Company”); |
| (b) | The Technical Report Summary was prepared in
accordance with Subpart 1300 of Regulation S-K promulgated by the U.S. Securities and Exchange Commission and supports the
Company’s Form 8-K filing to be issued on February 13, 2024 (the “8-K”); |
| (c) | I consent to the use of my name, or any quotation
from or summarization in the 8-K of the parts of the Technical Report Summary for which I am responsible, to the filing of the Technical
Report Summary as an exhibit to the 8-K, and to the incorporation by reference of the Technical Report Summary into the Company’s
Registration Statements on Form S-8 (File Nos. 333-219848, 333-185498, 333-196116, 333-198092, 333-248813, 333-259280 and 333-265661)
collectively, the “Registration Statements”; and |
| (d) | I confirm that I have read the portions of the 8-K
relating to the parts of the Technical Report Summary for which I am responsible for (Sections 1.1.1.4, 1.1.2.4, 1.3.9, 15.9, 22.4 and
23.4) and that such portions of the 8-K fairly and accurately reflect such information. |
Dated at Lakewood,
CO, this 13th of February 2024
/s/ Richard Kiel
Richard Kiel, P.E. (Registered Professional Engineer - Colorado,
U.S. [Registration No. 0034511])
Exhibit 23.1
CONSENT OF AUSENCO SERVICES PTY LTD
In connection with the SSR Mining Inc. (the
“Company”) Current Report on Form 8-K filed with the U.S. Securities and Exchange Commission on February 12, 2024 (the
“Form 8-K”), the undersigned consents to:
| • | the public filing by the Company of the technical report summary titled “Technical Report Summary
on the Çöpler Project, Türkiye” (the “Technical Report Summary”), with an effective date of
October 31, 2023 and dated February 12, 2024, that was prepared in accordance with Subpart 1300 of Regulation S-K promulgated by the U.S.
Securities and Exchange Commission, as an exhibit to the Form 8-K; |
| • | the incorporation by reference of the Technical Report Summary in the Form 8-K, the press release attached
as an exhibit to the Form 8-K (the “Press Release”), and in the Company’s Registration Statements on Form S-8
(File Nos. 333-219848, 333-185498, 333-196116, 333-198092, 333-248813, 333-259280 and 333-265661) (collectively, the “Registration
Statements”); |
| • | the use of and references to our name in connection with the Technical Report Summary, the Press Release,
the Form 8-K, and the Registration Statements; and |
| • | any extracts from or a summary of the Technical Report Summary in the Form 8-K, the Press Release and
incorporated by reference in the Registration Statements and the use of any information derived, summarized, quoted, or referenced from
the Technical Report Summary, or portions thereof, that was prepared by us, that we supervised the preparation of, and/or that was reviewed
and approved by us, that is included or incorporated by reference in the Form 8-K, the Press Release and the Registration Statements. |
Ausenco Services Pty Ltd is responsible for authoring, and this consent
pertains to, the following sections of the Technical Report Summary: 10.2, 10.4.1, 14.3 and 24.
Dated February 13, 2024
Ausenco Services Pty Ltd ABN 82 011 057 837
/s/ Matt Pyle
Matt Pyle
Head of Technical Solutions
Exhibit 23.1
CONSENT OF AUSENCO SERVICES PTY LTD
In connection with the SSR Mining Inc. (the
“Company”) Current Report on Form 8-K filed with the U.S. Securities and Exchange Commission on February 13, 2024 (the
“Form 8-K”), the undersigned consents to:
| • | the public filing by the Company of the technical report summary titled “Technical Report Summary
on the Çöpler Project, Türkiye” (the “Technical Report Summary”), with an effective date of
October 31, 2023 and dated February 12, 2024, that was prepared in accordance with Subpart 1300 of Regulation S-K promulgated by the U.S.
Securities and Exchange Commission, as an exhibit to the Form 8-K; |
| • | the incorporation by reference of the Technical Report Summary in the Form 8-K, the press release attached
as an exhibit to the Form 8-K (the “Press Release”), and in the Company’s Registration Statements on Form S-8
(File Nos. 333-219848, 333-185498, 333-196116, 333-198092, 333-248813, 333-259280 and 333-265661) (collectively, the “Registration
Statements”); |
| • | the use of and references to our name in connection with the Technical Report Summary, the Press Release,
the Form 8-K, and the Registration Statements; and |
| • | any extracts from or a summary of the Technical Report Summary in the Form 8-K, the Press Release and
incorporated by reference in the Registration Statements and the use of any information derived, summarized, quoted, or referenced from
the Technical Report Summary, or portions thereof, that was prepared by us, that we supervised the preparation of, and/or that was reviewed
and approved by us, that is included or incorporated by reference in the Form 8-K, the Press Release and the Registration Statements. |
RSC is responsible for authoring, and this consent pertains to, the
following sections of the Technical Report Summary: 1.3.3-1.3.5, 6, 7 except for 7.1 and 7.2, 8,9, 11, 22.1, 23.1 and 24.
Dated February 13, 2024
RSC Consulting Ltd.
/s/ René Sterk
René Sterk
Managing Director – Principal Consultant
Exhibit 23.1
CONSENT OF QUALIFIED PERSON
In connection with the SSR Mining Inc. (the
"Company") Current Report on Form 8-K filed with the U.S. Securities and Exchange Commission on February 13, 2024 (the
"Form 8-K"), the undersigned consents to:
| • | the public filing by the Company and use of the
technical report summary titled “Technical Report Summary on the Çöpler Property, Türkiye” (the “Technical
Report Summary”), with an effective date of October 31, 2023 and dated February 12, 2024, that was prepared in accordance with
Subpart 1300 of Regulation S-K promulgated by the U.S. Securities and Exchange Commission, as an exhibit to the Form 8-K; |
| • | the incorporation by reference of the Technical
Report Summary in the Form 8-K, the press release attached as an exhibit to the Form 8-K (the “Press Release”), and
in the Company’s Registration Statements on Form S-8 (File Nos. 333-219848, 333-185498, 333-196116, 333-198092, 333-248813, 333-259280
and 333-265661) (collectively, the “Registration Statements”); |
| • | the use of and references to our name in connection
with the Technical Report Summary, the Press Release, the Form 8-K, and the Registration Statements; and |
| • | any extracts from or a summary of the Technical
Report Summary in the Form 8-K, the Press Release and incorporated by reference in the Registration Statements and the use of any information
derived, summarized, quoted, or referenced from the Technical Report Summary, or portions thereof, that was prepared by us, that we supervised
the preparation of, and/or that was reviewed and approved by us, that is included or incorporated by reference in the Form 8-K, the Press
Release and the Registration Statements. |
SLR International Corporation is responsible for authoring, and this
consent pertains to, the following sections of the Technical Report Summary: 1.1, 1.1.1.2, 1.1.1.3, 1.1.1.5, 1.1.1.6, 1.1.2.2, 1.1.2.3,
1.1.2.5, 1.1.2.6, 1.2, 1.3.1, 1.3.2, 1.3.7–1.3.8, 1.3.10–1.3.12, 2–5, 7.1 and 7.2, 10 excluding 10.2 and 10.4.1, 12,
13, 14 excluding 14.3, 15.1–15.8, 16–21, 22.2–22.3, 22.5–22.6, 23.2–23.3, 23.5–23.6 and 25-27.
Dated February 13, 2024
SLR International Corporation
/s/ Grant A. Malensek
Grant A. Malensek
Technical Director - U.S. Mining Advisory
Exhibit 23.2
CONSENT OF QUALIFIED PERSON
In connection with the SSR Mining Inc. (the
"Company") Current Report on Form 8-K filed with the U.S. Securities and Exchange Commission on February 13, 2024 (the
"Form 8-K"), the undersigned consents to:
| • | the public filing by the Company
and use of the technical report summary titled “Technical Report Summary on the Marigold Complex, Nevada, USA” (the “Technical
Report Summary”), with an effective date of September 30, 2023 and dated February 12, 2024, that was prepared in accordance
with Subpart 1300 of Regulation S-K promulgated by the U.S. Securities and Exchange Commission, as an exhibit to the Form 8-K; |
| • | the incorporation by reference
of the Technical Report Summary in the Form 8-K, the press release attached as an exhibit to the Form 8-K (the “Press Release”),
and in the Company’s Registration Statements on Form S-8 (File Nos. 333-219848, 333-185498, 333-196116, 333-198092, 333-248813,
333-259280 and 333-265661) (collectively, the “Registration Statements”); |
| • | the use of and references to
our name in connection with the Technical Report Summary, the Press Release, the Form 8-K, and the Registration Statements; and |
| • | any extracts from or a summary
of the Technical Report Summary in the Form 8-K, the Press Release and incorporated by reference in the Registration Statements and the
use of any information derived, summarized, quoted, or referenced from the Technical Report Summary, or portions thereof, that was prepared
by us, that we supervised the preparation of, and/or that was reviewed and approved by us, that is included or incorporated by reference
in the Form 8-K, the Press Release and the Registration Statements. |
SLR International Corporation is responsible for
authoring, and this consent pertains to, the entire Technical Report Summary.
Dated February 13, 2024
SLR International Corporation
/s/ Grant A. Malensek
Grant A. Malensek
Technical Director - U.S. Mining Advisory
Exhibit 23.3
CONSENT OF QUALIFIED PERSON
In connection with the SSR Mining Inc. (the
"Company") Current Report on Form 8-K filed with the U.S. Securities and Exchange Commission on February 13, 2024 (the
"Form 8-K"), the undersigned consents to:
| • | the public filing by the Company
and use of the technical report summary titled “Technical Report Summary on the Seabee Gold Operation, Saskatchewan, Canada”
(the “Technical Report Summary”), with an effective date of December 31, 2023 and dated February 12, 2024, that was
prepared in accordance with Subpart 1300 of Regulation S-K promulgated by the U.S. Securities and Exchange Commission, as an exhibit to
the Form 8-K; |
| • | the incorporation by reference
of the Technical Report Summary in the Form 8-K, the press release attached as an exhibit to the Form 8-K (the “Press Release”),
and in the Company’s Registration Statements on Form S-8 (File Nos. 333-219848, 333-185498, 333-196116, 333-198092, 333-248813,
333-259280 and 333-265661) (collectively, the “Registration Statements”); |
| • | the use of and references to
our name in connection with the Technical Report Summary, the Press Release, the Form 8-K, and the Registration Statements; and |
| • | any extracts from or a summary
of the Technical Report Summary in the Form 8-K, the Press Release and incorporated by reference in the Registration Statements and the
use of any information derived, summarized, quoted, or referenced from the Technical Report Summary, or portions thereof, that was prepared
by us, that we supervised the preparation of, and/or that was reviewed and approved by us, that is included or incorporated by reference
in the Form 8-K, the Press Release and the Registration Statements. |
SLR International Corporation is responsible for
authoring, and this consent pertains to, the entire Technical Report Summary.
Dated February 13, 2024
SLR International Corporation
/s/ Grant A. Malensek
Grant A. Malensek
Technical Director - U.S. Mining Advisory
Exhibit 23.4
CONSENT OF QUALIFIED PERSON
In connection with the SSR Mining Inc. (the
"Company") Current Report on Form 8-K filed with the U.S. Securities and Exchange Commission on February 13, 2024 (the
"Form 8-K"), the undersigned consents to:
| • | the public filing by the Company
and use of the technical report summary titled “Technical Report Summary on the Puna Operations, Argentina” (the “Technical
Report Summary”), with an effective date of December 31, 2023 and dated February 12, 2024, that was prepared in accordance with
Subpart 1300 of Regulation S-K promulgated by the U.S. Securities and Exchange Commission, as an exhibit to the Form 8-K; |
| • | the incorporation by reference
of the Technical Report Summary in the Form 8-K, the press release attached as an exhibit to the Form 8-K (the “Press Release”),
and in the Company’s Registration Statements on Form S-8 (File Nos. 333-219848, 333-185498, 333-196116, 333-198092, 333-248813,
333-259280 and 333-265661) (collectively, the “Registration Statements”); |
| • | the use of and references to
our name in connection with the Technical Report Summary, the Press Release, the Form 8-K, and the Registration Statements; and |
| • | any extracts from or a summary
of the Technical Report Summary in the Form 8-K, the Press Release and incorporated by reference in the Registration Statements and the
use of any information derived, summarized, quoted, or referenced from the Technical Report Summary, or portions thereof, that was prepared
by us, that we supervised the preparation of, and/or that was reviewed and approved by us, that is included or incorporated by reference
in the Form 8-K, the Press Release and the Registration Statements. |
SLR International Corporation is responsible for
authoring, and this consent pertains to, the entire Technical Report Summary.
Dated February 13, 2024
SLR International Corporation
/s/ Grant A. Malensek
Grant A. Malensek
Technical Director - U.S. Mining Advisory
|
 |
| |
Technical Report Summary on the
Çöpler
Property, Türkiye
S-K 1300 Report
SSR Mining Inc.
SLR Project No.: 138.21581.00006
Effective Date:
October 31, 2023
Signature Date:
February 12, 2024
Prepared by:
SLR International Corporation
RSC Consulting Ltd.
WSP USA Inc.
Ausenco Services Pty Ltd.
|
| |
| |
| |
| |
| |
Making
Sustainability Happen |
Technical Report Summary on the
Çöpler Property, Türkiye
SLR Project No.: 138.21581.00006
Prepared by
|
SLR International Corporation
1658 Cole Blvd, Suite 100
Lakewood, CO 80401 |
WSP USA Inc.
7245 West Alaska Drive, Suite 200
Lakewood, CO 80226 USA |
| |
|
|
RSC Consulting Ltd.
24 Smith Street
Dunedin 9016
New Zealand |
Ausenco Services Pty Ltd.
Level 6, 189 Grey Street
South Brisbane, Queensland 4101
Australia |
for
SSR Mining Inc.
6900 E. Layton Avenue, Suite 1300
Denver, Colorado 80237
USA
Effective Date - October 31, 2023
Signature Date - February 12, 2024
Distribution: 1 copy - SSR Mining Inc.
1 copy - SLR International
Corporation
| SSR Mining Inc. | Çöpler Property S-K 1300 Report | February 12, 2024 SLR Project No.: 138.21581.00006 |
Cautionary Note Regarding Forward-Looking Statements:
Certain statements contained in this report are "forward-looking
statements" within the meaning of Section 27A of the Securities Act of 1933, as amended (the “Securities Act”),
and Section 21E of the Securities Exchange Act of 1934, as amended (the “Exchange Act”), and are intended to be covered
by the safe harbor provided for under these sections. Forward looking statements can be identified with words such as “may,”
“will,” “could,” “should,” “expect,” “plan,” “anticipate,” “believe,”
“intend,” “estimate,” “projects,” “predict,” “potential,” “continue”
and similar expressions, as well as statements written in the future tense. Forward-looking statements are based on information known
at such time and/or with a good faith belief with respect to future events. Such statements are subject to risks and uncertainties that
could cause actual performance or results to differ materially from those expressed in the forward-looking statements. Many of these risks
and uncertainties cannot be controlled or predicted. Given these risks and uncertainties, readers are cautioned not to place undue reliance
on forward-looking statements. Forward-looking statements include, among things: metal price assumptions, cash flow forecasts, projected
capital and operating costs, metal recoveries, mine life and production rates, and other assumptions used in this report.
Such forward-looking information and statements are based on a number
of material factors and assumptions, including, but not limited to: the inherent speculative nature of exploration results; the ability
to explore; communications with local stakeholders; maintaining community and governmental relations; status of negotiations of joint
ventures; weather conditions at our operations; commodity prices; the ultimate determination of and realization of Mineral Reserves; existence
or realization of Mineral Resources; the development approach; availability and receipt of required approvals, titles, licenses and permits;
sufficient working capital to develop and operate the mines and implement development plans; access to adequate services and supplies;
foreign currency exchange rates; interest rates; access to capital markets and associated cost of funds; availability of a qualified work
force; ability to negotiate, finalize, and execute relevant agreements; lack of social opposition to our mines or facilities; lack of
legal challenges with respect to our properties; the timing and amount of future production; the ability to meet production, cost, and
capital expenditure targets; timing and ability to produce studies and analyses; capital and operating expenditures; economic conditions;
availability of sufficient financing; the ultimate ability to mine, process, and sell mineral products on economically favorable terms;
and any and all other timing, exploration, development, operational, financial, budgetary, economic, legal, social, geopolitical, regulatory
and political factors that may influence future events or conditions. While we consider these factors and assumptions to be reasonable
based on information currently available to us, they may prove to be incorrect.
The above list is not exhaustive list of the factors that may affect
any of the forward-looking statements and information included in this report, and such statements and information will not be updated
to reflect events or circumstances arising after the date of such statements or to reflect the occurrence of anticipated or unanticipated
events.
This technical report summary also contains financial measures which
are not recognized under U.S. generally accepted accounting principles.
| | i |  |
| SSR Mining Inc. | Çöpler Property S-K 1300 Report | February 12, 2024 SLR Project No.: 138.21581.00006 |
Table of Contents
| 1.0 Executive Summary |
1-1 |
| 1.1 Summary |
1-1 |
| 1.2 Economic Analysis |
1-9 |
| 1.3 Technical Summary |
1-13 |
| 2.0 Introduction |
2-1 |
| 2.1 Site Visits |
2-1 |
| 2.2 Sources of Information |
2-2 |
| 2.3 List of Abbreviations |
2-4 |
| 3.0 Property Description |
3-1 |
| 3.1 Location |
3-1 |
| 3.2 Land Tenure |
3-5 |
| 3.3 Encumbrances and Royalties |
3-8 |
| 3.4 Required Permits and Status |
3-9 |
| 3.5 Other Significant Factors and Risks |
3-10 |
| 4.0 Accessibility, Climate, Local Resources, Infrastructure, and Physiography |
4-1 |
| 4.1 Accessibility |
4-1 |
| 4.2 Climate |
4-1 |
| 4.3 Local Resources |
4-2 |
| 4.4 Infrastructure |
4-2 |
| 4.5 Physiography |
4-3 |
| 5.0 History |
5-1 |
| 5.1 Prior Ownership |
5-1 |
| 5.2 Exploration and Development History |
5-1 |
| 5.3 Past Production |
5-2 |
| 5.4 Previous NI 43-101 Technical Reports |
5-3 |
| 6.0 Geological Setting, Mineralization, and Deposit |
6-1 |
| 6.1 Regional Geology |
6-1 |
| 6.2 Local Geology |
6-3 |
| 6.3 Property Geology and Mineralization |
6-7 |
| 6.4 Regional Prospects and Targets |
6-21 |
| 6.5 Deposit Types |
6-24 |
| 7.0 Exploration |
7-1 |
| 7.1 Hydrogeological Data |
7-1 |
| | ii | |
| SSR Mining Inc. | Çöpler Property S-K 1300 Report | February 12, 2024 SLR Project No.: 138.21581.00006 |
| 7.2 Geotechnical Data |
7-3 |
| 7.3 Çöpler Deposit Exploration |
7-3 |
| 7.4 Greater Çakmaktepe Exploration |
7-4 |
| 7.5 Drilling |
7-5 |
| 7.6 Sample Collection |
7-13 |
| 8.0 Sample Preparation, Analyses, and Security |
8-1 |
| 8.1 Sample Preparation |
8-1 |
| 8.2 Sample Analysis |
8-1 |
| 8.3 Quality Assurance and Quality Control |
8-2 |
| 8.4 Sample Security |
8-31 |
| 8.5 QP Opinion |
8-31 |
| 9.0 Data Verification |
9-1 |
| 9.1 Site Visit |
9-1 |
| 9.2 Database Validation |
9-1 |
| 9.3 Çöpler Deposit Data Verification |
9-2 |
| 9.4 Greater Çakmaktepe |
9-2 |
| 9.5 Bayramdere Deposit Data Verification |
9-3 |
| 9.6 QP Opinion |
9-3 |
| 10.0 Mineral Processing and Metallurgical Testing |
10-1 |
| 10.1 Oxide Ore for Heap Leaching |
10-1 |
| 10.2 Oxide Ore for Grind / Leach |
10-5 |
| 10.3 Sulfide Ores – Flotation and Pressure Oxidation |
10-8 |
| 10.4 Mineral Processing and Metallurgical Discussion |
10-17 |
| 10.5 QP Opinion |
10-17 |
| 11.0 Mineral Resource Estimates |
11-1 |
| 11.1 Summary |
11-1 |
| 11.2 Çöpler |
11-4 |
| 11.3 Greater Çakmaktepe |
11-28 |
| 11.4 Bayramdere Mineral Resource Estimate |
11-51 |
| 11.5 QP Opinion |
11-62 |
| 12.0 Mineral Reserve Estimates |
12-1 |
| 12.1 Summary |
12-1 |
| 12.2 Mineral Reserves Statement |
12-1 |
| 12.3 Dilution |
12-2 |
| | iii | |
| SSR Mining Inc. | Çöpler Property S-K 1300 Report | February 12, 2024 SLR Project No.: 138.21581.00006 |
| 12.4 Mining Recovery |
12-2 |
| 12.5 Comparison to Previous Estimate |
12-19 |
| 12.6 QP Opinion |
12-19 |
| 13.0 Mining Methods |
13-1 |
| 13.1 Geotechnical |
13-3 |
| 13.2 Mine Plan |
13-20 |
| 13.3 Mine Equipment |
13-37 |
| 13.4 Personnel |
13-38 |
| 13.5 Mine Production Schedule |
13-39 |
| 14.0 Processing and Recovery Methods |
14-1 |
| 14.1 Sulfide Ore Processing |
14-1 |
| 14.2 Oxide Heap Leach Processing |
14-13 |
| 14.3 Oxide Grind Leach Processing |
14-18 |
| 14.4 Personnel |
14-20 |
| 15.0 Infrastructure |
15-1 |
| 15.1 Access Roads |
15-3 |
| 15.2 Power |
15-3 |
| 15.3 Water |
15-3 |
| 15.4 Accommodation Camps |
15-6 |
| 15.5 Existing Infrastructure |
15-6 |
| 15.6 Communications |
15-8 |
| 15.7 Plant Fire Protection System |
15-8 |
| 15.8 Heap Leach Facility |
15-8 |
| 15.9 Tailings Storage Facility |
15-8 |
| 16.0 Market Studies |
16-1 |
| 16.1 Markets |
16-1 |
| 16.2 Contracts |
16-1 |
| 17.0 Environmental Studies, Permitting, and Social Plans, Negotiations, or Agreements with Local Individuals or Groups |
17-1 |
| 17.1 Permitting |
17-1 |
| 17.2 Environmental Studies, Site Information and Management |
17-3 |
| 17.3 Environmental Management |
17-7 |
| 17.4 Mine Closure |
17-9 |
| 17.5 Social and Community Plans |
17-13 |
| 18.0 Capital and Operating Costs |
18-1 |
| | iv | |
| SSR Mining Inc. | Çöpler Property S-K 1300 Report | February 12, 2024 SLR Project No.: 138.21581.00006 |
| 18.1 Capital Costs |
18-1 |
| 18.2 Operating Costs |
18-2 |
| 19.0 Economic Analysis |
19-1 |
| 19.1 Economic Assumptions |
19-1 |
| 19.2 Cash Flow Analysis |
19-3 |
| 19.3 Sensitivity Analysis |
19-4 |
| 20.0 Adjacent Properties |
20-1 |
| 21.0 Other Relevant Data and Information |
21-1 |
| 22.0 Interpretation and Conclusions |
22-1 |
| 22.1 Geology and Mineral Resources |
22-1 |
| 22.2 Mining and Mineral Reserves |
22-3 |
| 22.3 Mineral Processing |
22-3 |
| 22.4 Infrastructure |
22-5 |
| 22.5 Environment |
22-6 |
| 22.6 Capital and Operating Costs |
22-6 |
| 23.0 Recommendations |
23-1 |
| 23.1 Geology and Mineral Resources |
23-1 |
| 23.2 Mining and Mineral Reserves |
23-1 |
| 23.3 Mineral Processing |
23-1 |
| 23.4 Infrastructure |
23-1 |
| 23.5 Environment |
23-2 |
| 23.6 Capital and Operating Costs |
23-3 |
| 24.0 References |
24-1 |
| 25.0 Reliance on Information Provided by the Registrant |
25-1 |
| 26.0 Date and Signature Page |
26-1 |
| 27.0 Appendix 1 |
27-1 |
Tables
| Table 1-1: Gold Royalty Rates |
1-11 |
| Table 1-2: After-Tax Cash Flow Summary |
1-12 |
| Table 1-3: Summary of Çöpler Mine, Greater Çakmaktepe and Bayramdere Mineral Resources (SSR’s
Attributable Share) |
1-16 |
| Table 1-4: Summary of Mineral Reserves as of October 31, 2023 (SSR’s Attributable Share) |
1-19 |
| | v | |
| SSR Mining Inc. | Çöpler Property S-K 1300 Report | February 12, 2024 SLR Project No.: 138.21581.00006 |
| Table 1-5: Capital Cost Summary |
1-23 |
| Table 1-6: Average Operating Costs Unit Rates |
1-23 |
| Table 2-1: Consulting Companies Which Acted as Qualified Persons in Preparing this Report |
2-2 |
| Table 3-1: Granted Licenses and Operating Permits |
3-6 |
| Table 3-2: Gold Royalty Rates |
3-8 |
| Table 5-1: Past Production |
5-2 |
| Table 7-1: Overview of Anagold Exploration at Çöpler Deposit |
7-3 |
| Table 7-2: Overview of Anagold Exploration at Greater Çakmaktepe |
7-4 |
| Table 7-3: Drill Summary by Hole Type for Çöpler Deposit (2000–2023) |
7-6 |
| Table 7-4: Drill Summary by Year for Çöpler Deposit |
7-6 |
| Table 7-5: Drill Summary for Greater Çakmaktepe Deposit (2012–2023) |
7-9 |
| Table 7-6: Greater Çakmaktepe 2012–2023 Drill Summary |
7-9 |
| Table 7-7: Drill Summary for Bayramdere |
7-11 |
| Table 8-1: Summary of Sample Analysis Methods Over Time |
8-1 |
| Table 8-2: Summary of QA and SOP Review |
8-3 |
| Table 8-3: Summary of Çöpler QC Review |
8-6 |
| Table 8-4: Summary of Çakmaktepe Ext QC Review |
8-9 |
| Table 8-5: Summary of Çakmaktepe QC Review |
8-10 |
| Table 8-6: Summary of Bayramdere QC Review |
8-12 |
| Table 8-7: Summary of Çöpler Quality Acceptance Testing |
8-13 |
| Table 8-8: Recovery Summary Statistics for Çöpler, 2021–2023. |
8-17 |
| Table 8-9: Results of Çöpler Distance Buffered QQ-Plot Analysis of Diamond and RC Drilling (Only pairs
separated by <1 m) |
8-18 |
| Table 8-10: Quality Acceptance Testing for Çöpler CRMs (2021–2023) |
8-19 |
| Table 8-11: Recovery Summary Statistics for Çakmaktepe Ext, May 2020–2023. |
8-22 |
| Table 8-12: Summary of Çakmaktepe Ext Quality Acceptance Testing |
8-24 |
| Table 8-13: Quality Acceptance Testing for Çakmaktepe Ext CRMs, 2021–2023. |
8-25 |
| Table 8-14: Summary of Çakmaktepe Quality Acceptance Testing |
8-28 |
| Table 8-15: Summary of Bayramdere Quality Acceptance Testing |
8-30 |
| Table 10-1: Metallurgical and Analytical Laboratories Contributing to the Project |
10-1 |
| Table 10-2: Summary of Çöpler Samples Selected for Historical Test Work |
10-2 |
| Table 10-3: Summary of Çakmaktepe Ext Oxide Samples Selected for 2019 Test Work |
10-3 |
| Table 10-4: Çöpler Gold Recovery (%) Assumptions for Heap Leaching of Oxide |
10-4 |
| | vi | |
| SSR Mining Inc. | Çöpler Property S-K 1300 Report | February 12, 2024 SLR Project No.: 138.21581.00006 |
| Table 10-5: Çakmaktepe Gold Recovery (%) Assumptions for Heap Leaching of Oxide (incl. Bayramdere) |
10-4 |
| Table 10-6: Çakmaktepe Ext. Gold Recovery (%) Assumptions for Heap Leaching of Oxide |
10-4 |
| Table 10-7: Çakmaktepe Ext. Oxide – Grind Leach – Metallurgical Testwork Summary |
10-5 |
| Table 10-8: McClelland (2018) – Çakmaktepe Ext. Oxide Leaching Test Work Results |
10-5 |
| Table 10-9: ALS Kamloops (2023) – Çakmaktepe Ext. Oxide Leaching Testwork Results |
10-6 |
| Table 10-10: ALS Kamloops (2023) – Çakmaktepe Ext. Oxide Comminution Results |
10-7 |
| Table 10-11:
Çakmaktepe Ext. Gold Recovery Estimates for Grind/Leach of Oxide Ore |
10-8 |
| Table 10-12: Gold Deportment in Flotation Separated Streams |
10-9 |
| Table 10-13: ALS Kamloops (2023) – Çakmaktepe Ext. Sulfide Comminution Results |
10-13 |
| Table 10-14: Gold POX Recovery Model Parameters |
10-16 |
| Table 10-15: Commissioning and Ramp-up Allowances |
10-16 |
| Table 11-1: Summary of Çöpler Mine, Greater Çakmaktepe and Bayramdere Mineral Resources (SSR’s
Attributable Only) |
11-2 |
| Table 11-2: Summary of Drill Hole Data Informing Çöpler MRE |
11-4 |
| Table 11-3: Compositing Statistics in the Single Au Mineralization Domain (All Sub-Domains Combined) |
11-11 |
| Table 11-4: Domain Statistics (g/t Au) |
11-12 |
| Table 11-5: Block Model Description |
11-15 |
| Table 11-6: Estimation Kriging Neighbourhood and Variography Settings for All Domains (Au) |
11-17 |
| Table 11-7: Çöpler Density Statistics for Lithology Domains |
11-18 |
| Table 11-8: Summary of Key Parameters Used in 2023 Conceptual Pit Shell at Çöpler |
11-23 |
| Table 11-9: Summary of Çöpler Mineral Resources exclusive of Mineral Reserves |
11-25 |
| Table 11-10: Summary of Drill Hole Data Informing Greater Çakmaktepe MRE |
11-28 |
| Table 11-11: Compositing Statistics in Au HG domain |
11-36 |
| Table 11-12: Greater Çakmaktepe Block Model Description |
11-39 |
| Table 11-13: Kriging Neighbourhood and Variography Settings for Au Domains |
11-40 |
| Table 11-14: Çakmaktepe Density Statistics for Lithology Domains |
11-41 |
| Table 11-15: Summary of Key Parameters used in 2023 Conceptual Pit Shell at Greater Çakmaktepe |
11-47 |
| Table 11-16: Summary of Greater Çakmaktepe Mineral Resources exclusive of Mineral Reserves |
11-48 |
| Table 11-17: Summary of Drill Hole Data Informing Bayramdere MRE |
11-51 |
| Table 11-18: Bayramdere Estimation Domain Statistics |
11-52 |
| Table 11-19: Summary of Variography Model Data in the OK estimation |
11-56 |
| | vii | |
| SSR Mining Inc. | Çöpler Property S-K 1300 Report | February 12, 2024 SLR Project No.: 138.21581.00006 |
| Table 11-20: Bayramdere Block Model Description |
11-56 |
| Table 11-21: Estimation settings for Mineralized Domains |
11-56 |
| Table 11-22: Bayramdere Median Density Values for Lithology Domains |
11-57 |
| Table 11-23: Summary of Key Parameters used in 2023 Conceptual Pit Shell at Bayramdere |
11-59 |
| Table 11-24: Summary of Bayramdere Mineral Resources |
11-61 |
| Table 12-1: Summary of Mineral Reserve Estimates as of October 31, 2023 (SSR’s Attributable Share) |
12-3 |
| Table 12-2: Summary of Mineral Reserves by Process Types and Mining Areas (as of October 31, 2023) |
12-5 |
| Table 12-3: Summary of Metallurgical Inputs Used for Cut-off Grade (COG) Analysis and Scheduling |
12-8 |
| Table 12-4: Summary of Costs Inputs Used for Pit Optimization, COG Analysis, and Scheduling |
12-11 |
| Table 12-5: Sulfide Sulfur and Gold Grade Criteria for Establishing Process Methods Routing |
12-12 |
| Table 13-1: Golder Intact Strength Estimates (General) |
13-5 |
| Table 13-2: Çöpler 2023 Recommended Mine Pit Slope Parameters |
13-13 |
| Table 13-3: Greater Çakmaktepe 2023 Recommended Mine Pit Slope Parameters |
13-14 |
| Table 13-4: Çöpler 2023 Hydraulic Conductivities |
13-18 |
| Table 13-5: Heap Leach Recovery – Gold, Silver, and Copper |
13-22 |
| Table 13-6: Oxide Operating Costs |
13-24 |
| Table 13-7: Grind Leach Recovery |
13-24 |
| Table 13-8: Plant Throughput Limits |
13-25 |
| Table 13-9: Sulfide Operating Costs |
13-25 |
| Table 13-10: Au Cut-off Grade Revenue and Royalty Inputs |
13-25 |
| Table 13-11: Internal Au Cut-off Grades |
13-26 |
| Table 13-12: Key Mine Design Factors |
13-27 |
| Table 13-13: Waste Rock Dump (WRD) Capacities |
13-31 |
| Table 13-14: Waste Rock Dump (WRD) Design Factor of Safety (FOS) |
13-34 |
| Table 13-15: Waste Rock Geochemical Classification |
13-35 |
| Table 13-16: Çöpler Mine Contractor’s Mobile Equipment List |
13-38 |
| Table 13-17: Çöpler Project – Mining Personnel Summary |
13-38 |
| Table 13-18: Çöpler Mining Schedule (2023–2036) |
13-42 |
| Table 13-19: Processing Production Schedule (2023–2038) |
13-46 |
| | viii | |
| SSR Mining Inc. | Çöpler Property S-K 1300 Report | February 12, 2024 SLR Project No.: 138.21581.00006 |
| Table 14-1: Sulphide Process Plant Unit Consumptions of Power, Reagents and Materials |
14-13 |
| Table 14-2: Oxide Grind Leach - Process Design Criteria |
14-20 |
| Table 14-3: Çöpler Mine – Processing Personnel Summary |
14-20 |
| Table 16-1: Economic Analysis Metal Price Assumptions |
16-1 |
| Table 18-1: Capital Cost Summary |
18-1 |
| Table 18-2: Growth Capital Cost Summary |
18-1 |
| Table 18-3: Sustaining Capital Summary |
18-2 |
| Table 18-4: Average Operating Costs Unit Rates |
18-3 |
| Table 18-5: Mine Operating Cost Summary |
18-3 |
| Table 18-6: Process Operating Cost Summary |
18-4 |
| Table 18-7: G&A Operating Cost Summary |
18-4 |
| Table 18-8: Current Workforce |
18-4 |
| Table 18-9: LOM Workforce Levels |
18-5 |
| Table 19-1: Gold Royalty Rates |
19-2 |
| Table 19-2: After-Tax Cash Flow Summary |
19-3 |
| Table 19-3: After-Tax Sensitivity Analyses |
19-5 |
Figures
| Figure
3-1: |
Location
Map |
3-2 |
| Figure
3-2: |
Çöpler
Project License and Surrounding Licenses (UTM Grid) |
3-3 |
| Figure
3-3: |
Çöpler
Operations and Surrounding Population Centers |
3-4 |
| Figure
3-4: |
Land
Tenure Layout |
3-7 |
| Figure
4-1: |
Average
Monthly Rainfall for Çöpler Project Area |
4-2 |
| Figure
6-1: |
Regional
Geological Setting of the Çöpler District |
6-2 |
| Figure
6-2: |
Geological
and Structural Map of the Çöpler District |
6-4 |
| Figure
6-3: |
Çöpler
Deposits Conceptual Cross Section |
6-5 |
| Figure
6-4: |
Regional
Stratigraphic Section of the Project Areas |
6-6 |
| Figure
6-5: |
Çöpler
Deposit Geological Map |
6-9 |
| Figure
6-6: |
Simplified
Schematic Cross-Section of the Çöpler Deposit Structures (Looking East-Northeast) |
6-11 |
| Figure
6-7: |
Geological
Map of the Greater Çakmaktepe Deposit |
6-14 |
| Figure
6-8: |
Schematic
of Greater Çakmaktepe Geological Setting showing Mineralized Zones with Examples |
6-17 |
| | ix | |
| SSR Mining Inc. | Çöpler Property S-K 1300 Report | February 12, 2024 SLR Project No.: 138.21581.00006 |
| Figure
6-9: |
Geological
Map of the Bayramdere Deposit |
6-19 |
| Figure
6-10: |
Bayramdere
Geology Schematic Section |
6-20 |
| Figure
6-11: |
Çöpler
Project Exploration Targets |
6-22 |
| Figure
7-1: |
Groundwater
Wells |
7-2 |
| Figure
7-2: |
Çöpler
Deposit Drill Hole Collar Locations |
7-8 |
| Figure
7-3: |
Greater
Çakmaktepe Drill Hole Collar Locations |
7-10 |
| Figure
7-4: |
Bayramdere
Drill Hole Collars by Hole Type |
7-12 |
| Figure
8-1: |
Diamond
Core Recovery at Çöpler since January 2021 |
8-7 |
| Figure
8-2: |
Relative
Difference Plot for Çöpler DD Second Split (2021–2023) |
8-7 |
| Figure
8-3: |
Relative
Difference Plot for Çöpler RC First Split (2023) |
8-8 |
| Figure
8-4: |
Çöpler
Blank Analyses for Au versus Analysis Date (ALS), 2021–2023 |
8-8 |
| Figure
8-5: |
Shewhart
Control Plot for OREAS504b Au in Çöpler Sample Stream (2021–2023) |
8-9 |
| Figure
8-6: |
RD
Plot Çakmaktepe DD Third Split (SGS Ankara) |
8-11 |
| Figure
8-7: |
RD
plot Çakmaktepe RC Third Split (SGS Ankara) |
8-11 |
| Figure
8-8: |
Çöpler
Distance-Buffered QQ-plot for Au from Diamond and Blasthole GC drilling, pairs separated by <1 m (left) and Box-Whisker Plots
of Paired DD and GC Distributions at Various Buffer Distances (right) |
8-16 |
| Figure
8-9: |
Çöpler
Distance-Buffered QQ-plot for Au from Diamond and RC Drilling, pairs separated by <1 m (left) and Box-Whisker Plots of Paired
DD (red) and RC (blue) Distributions at Various Buffer Distances (right) |
8-17 |
| Figure
8-10: |
Scatter
and QQ Plot from Çöpler Umpire Analysis for Ag, ALS vs BV (2021–2023) |
8-22 |
| Figure
8-11: |
Scatter
and QQ Plot from Çakmaktepe Ext Umpire Analysis for Ag, ALS vs BV, (2021–2023) |
8-28 |
| Figure
10-1: |
Feed
SS% – Mass Pull Relationship |
10-12 |
| Figure
10-2: |
Metasediment
Gold Recovery Results and Model |
10-14 |
| Figure
10-3: |
Diorite
Gold Recovery and Model |
10-15 |
| Figure
10-4: |
Manganese
Diorite Gold Recovery and Model |
10-15 |
| Figure
11-1: |
Plan
View of Mapped Structures, Modeled Diorite and Au Mineralization |
11-6 |
| Figure
11-2: |
Section
Showing the Relationship of Mineralization with Marble-Hornfels Contact |
11-8 |
| Figure
11-3: |
Plan
View Section in the Manganese Pit Showing the Relationship of Mineralization with Marble-Diorite Contact |
11-9 |
| Figure
11-4: |
Log-histograms
of Composites within the Hornfels Sulfide (left) and Diorite (right) Domains |
11-12 |
| Figure
11-5: |
Experimental
and Modelled Variograms for Diorite Domain (Exploration Data only) |
11-14 |
| | x | |
| SSR Mining Inc. | Çöpler Property S-K 1300 Report | February 12, 2024 SLR Project No.: 138.21581.00006 |
| Figure
11-6: |
Çöpler
North-South Section Showing Resource Classification |
11-20 |
| Figure
11-7: |
Trend
Plot in Y Direction Showing Raw Sample Grades (Black), 2-m NN-“Declustered” Sample Grades (Blue), and Block OK Grades
(Green) |
11-21 |
| Figure
11-8: |
Visual
Validation of North-South Section 459,140, Showing Original Topography and Optimized Resource Solid |
11-22 |
| Figure
11-9: |
Greater
Çakmaktepe Section Showing Geometries Created by Thrusting |
11-29 |
| Figure
11-10: |
Distribution
of Mg within Rocks Classified as Ultramafic (left) and Carbonates (right) |
11-30 |
| Figure
11-11: |
Section
Showing Mineralization Limited by Steep Conduit Structure |
11-32 |
| Figure
11-12: |
Strip
Logs showing Relationship of Geology, Assays, and Estimation Domains for Greater Çakmaktepe |
11-34 |
| Figure
11-13: |
Boundary
Analysis |
11-35 |
| Figure
11-14: |
Log-histogram
of Composites within the LG (left) and HG (right) Domains |
11-36 |
| Figure
11-15: |
Experimental
and Modeled Variograms |
11-38 |
| Figure
11-16: |
Çakmaktepe
North-South Section Showing Resource Classification |
11-43 |
| Figure
11-17: |
Visual
Validation of North-South Section 4,367,180, Showing Original Topography and Optimized Resource Shell |
11-45 |
| Figure
11-18: |
Trend
Plot in Z Direction Showing Raw Same Grades (black), 2-m NN-“Declustered” Sample Grades (purple), and Block Grades (pink). |
11-46 |
| Figure
11-19: |
Log-histograms
of Composites Within the Au Low-Grade (left) and High-Grade (right) Estimation Domains |
11-53 |
| Figure
11-20: |
Log-histograms
of Composites Within the Cu Low-Grade (left) and High-Grade (right) Estimation Domains |
11-53 |
| Figure
11-21: |
Experimental
and Modeled Variograms for Au |
11-55 |
| Figure
11-22: |
Bayramdere
North-South Section Showing Resource Classification |
11-58 |
| Figure
12-1: |
Çöpler
Ultimate Pit Design – Plan View |
12-13 |
| Figure
12-2: |
Çöpler
Ultimate Pit – Cross Section A-A’ (Looking West) |
12-14 |
| Figure
12-3: |
Çöpler Ultimate
Pit - Cross Section B-B' (Looking North) |
12-15 |
| Figure
12-4: |
Çakmaktepe
Ultimate Pit Design (Plan View) |
12-16 |
| Figure
12-5: |
Çakmaktepe
Ultimate Pit Design - Cross Section A-A' (Looking Southwest) |
12-17 |
| Figure
12-6: |
Çakmaktepe
Ultimate Pit Design - Cross Section B-B' (Looking Northwest) |
12-18 |
| Figure
13-1: |
Çöpler
Pit - Current Topography and Geology |
13-2 |
| Figure
13-2: |
Geological
Strength Index (GSI) Mapping of Çöpler Main Pit |
13-6 |
| Figure
13-3: |
Locations
of Seepage and Ponding in 2021 |
13-8 |
| Figure
13-4: |
Çöpler
Vibrating Wireline Piezometer (VWP) Data |
13-9 |
| Figure
13-5: |
Çöpler
Geotechnical Units |
13-10 |
| Figure
13-6: |
Çöpler
Recommended Pit Design Interramp Angles – 2023 |
13-16 |
| Figure
13-7: |
Çakmaktepe
2021 Recommended Pit Design Interramp Angle Sectors |
13-17 |
| Figure
13-8: |
Greater
Çakmaktepe Conceptual Groundwater Model |
13-19 |
| Figure
13-9: |
Material
Routing Definition Decision Tree |
13-21 |
| | xi | |
| SSR Mining Inc. | Çöpler Property S-K 1300 Report | February 12, 2024 SLR Project No.: 138.21581.00006 |
| Figure
13-10: |
Ultimate
Pit Designs – Çöpler (West) and Greater Çakmaktepe (East) – 2036 |
13-30 |
| Figure
13-11: |
Mineral
Reserve Base Case Site Plan |
13-33 |
| Figure
13-12: |
Çöpler
LOM Mining Production |
13-39 |
| Figure
13-13: |
Mineral
Reserve Case Processing Schedule |
13-45 |
| Figure
13-14: |
Mineral
Reserve Case Gold Production and Recovery |
13-45 |
| Figure
14-1: |
Çöpler
Process Flow Sheet for Sulfide Plant |
14-1 |
| Figure
14-2: |
Flotation
Block Flow Diagram |
14-2 |
| Figure
14-3: |
Gold
Recovery and Throughput Comparison |
14-4 |
| Figure
14-4: |
Process
Flow Sheet for Sulfide Plant |
14-7 |
| Figure
14-5: |
Heap
Leach Process Flow Sheet |
14-17 |
| Figure
14-6: |
Oxide
Grind Leach - Simplified Process Flow Diagram |
14-19 |
| Figure
15-1: |
Site
Layout |
15-2 |
| Figure
15-2: |
Mine
Water Supply Well Locations |
15-5 |
| Figure
15-3: |
Phase
4 – Top of Embankment and Impoundment Grade |
15-11 |
| Figure
15-4: |
Phase
5 – Top of Embankment and Impoundment Grade |
15-12 |
| Figure
15-5: |
Phase
6 – Top of Embankment and Impoundment Grade |
15-13 |
| Figure
15-6: |
Phase
7 – Top of Embankment and Impoundment Grade |
15-14 |
| Figure
17-1: |
Current
Land Use Types and Cadastral Map |
17-5 |
| Figure
17-2: |
Land
Use Capability Classes |
17-6 |
| Figure
19-1: |
After-Tax
Sensitivity Analysis |
19-6 |
| | xii | |
| SSR Mining Inc. | Çöpler Property S-K 1300 Report | February 12, 2024 SLR Project No.: 138.21581.00006 |
SLR International Corporation (SLR) was retained by SSR Mining Inc.(SSR)
to prepare an independent Technical Report Summary (TRS) on the Çöpler Property (the Property or the Project), located in
Erzincan Province, Türkiye. The Property is owned and operated by Anagold Madencilik Sanayi ve Ticaret Anonim Şirketi (Anagold).
SSR controls 80% of the shares of Anagold, Lidya Madencilik Sanayi ve Ticaret A.Ş. (Lidya), controls 18.5%, and a bank wholly owned
by Çalık Holdings A.Ş., holds the remaining 1.5%.
The purpose of this TRS is to disclose the results of the Mineral
Resource and Mineral Reserve estimates for the Property with an effective date of October 31, 2023. This TRS conforms to the United
States Securities and Exchange Commission’s (SEC) Modernized Property Disclosure Requirements for Mining Registrants as
described in Subpart 229.1300 of Regulation S-K, Disclosure by Registrants Engaged in Mining Operations (S-K 1300) and Item 601
(b)(96) Technical Report Summary. SLR visited the property on August 29-31, 2023. SLR, RSC Consulting Ltd (RSC), WSP USA Inc. (WSP)
and Ausenco Pty Services Limited (Ausenco) are the Qualified Persons (QPs) as required by S-K 1300 for purposes of this TRS.
SSR is a gold mining company with four producing assets located in the
USA, Türkiye, Canada, and Argentina, and with development and exploration assets in the USA, Türkiye and Canada. SSR is listed
on the NASDAQ (NASDAQ: SSRM), the Toronto Stock Exchange (TSX: SSRM), and the Australian Stock Exchange (ASX: SSR).
The Property consists of several mining licenses covering Mineral Resources
on the Çöpler mine, Greater Çakmaktepe (Çakmaktepe and Çakmaktepe Extension (Ext.) - previously referred
to as Ardich), and Bayramdere deposits, Mineral Reserves on the Çöpler and Greater Çakmaktepe deposits, oxide and sulfide
processing facilities, and supporting infrastructure.
This report is an update of SSR's prior Technical Report Summary for
the Property, dated as of September 29, 2022.
The QPs offer the following conclusions by area.
| 1.1.1.1 | Geology and Mineral Resources |
| · | The Çöpler district deposits (Çöpler, Greater Çakmaktepe, and Bayramdere) are best classified as epithermal,
disseminated, and skarn deposits related to a porphyry copper-gold system. Mineralizing fluids, derived from the intrusions, were primarily
controlled by structural fluid pathways and lithology, including traps controlled by lithological contacts, resulting in replacement,
vein and stockwork mineralization. |
| · | The Çöpler property has been the site of considerable mining and exploration, including the drilling and logging of more
than 4,800 drill holes totaling over 725,000 metres drilled. |
| · | The QP has estimated and prepared the Mineral Resources in accordance with the U.S. Securities and Exchange Commission (US SEC) Regulation
S-K subpart 1300 rules for Property Disclosures for Mining Registrants (S-K 1300). |
| | 1-1 | |
| SSR Mining Inc. | Çöpler Property S-K 1300 Report | February 12, 2024 SLR Project No.: 138.21581.00006 |
| · | The QP has classified the Mineral Resources in accordance with the U.S. Securities and Exchange Commission (US SEC) Regulation S-K
subpart 1300 rules for Property Disclosures for Mining Registrants (S-K 1300). |
| · | Mineral Resource estimates were prepared using a domain-controlled, predominantly ordinary kriging technique with verified drillhole
location, density and sample data derived from exploration activities conducted by various companies from 2000 to 2023. Inverse distance
algorithms were used for estimating minor elements, densities, and where kriging results were sub-optimal. |
| · | The QP is of the opinion that the drilling and sampling procedures adopted at Çöpler are consistent with generally recognized
industry best practices. The diamond and reverse circulation (RC) samples were collected by competent personnel using common practices.
The process was conducted or supervised by qualified geologists. |
| · | Overall, the drilling pattern is sufficiently dense to interpret the geometry and the boundaries of gold mineralization with confidence.
Several areas at Çöpler are based on approximately 60-m spaced drilling
which carries a moderate risk; the impact of this has been limited by classifying these areas as Inferred. The QP considers the overall
risk associated with data location, spacing and distribution to be low to moderate and has considered this risk when classifying the Mineral
Resources. |
| · | The data informing the Mineral Resources are collected using RC and core drilling. Overall, the QP is of the opinion that the samples
are representative of the source materials. |
| · | In the RSC QP’s opinion, the sample preparation, security, and analytical procedures are adequate and meet industry standards,
and the QA/QC program, as designed and implemented at Çöpler is adequate. The assay results within the drillhole database
are considered suitable for the purpose of mineral resource estimation and classification in relevant categories. Neither the SSR in-house
quality control nor SSR predecessor’s quality control yielded any indication of material quality concerns. |
| · | The QP was provided unlimited access by SSR for data verification purposes during the site visit. The QP is of the opinion that data
verification procedures for the Project comply with industry standards and are adequate for the purposes of Mineral Resource estimation. |
| · | Based on the site visit, data validation and the results of quality acceptance testing, the QP is of the opinion that the sampling
methods, chain of custody procedures, and analytical techniques are adequate and meet acceptable industry standards. The assay and bulk
density databases are of sufficient quality for Mineral Resource estimation at the Çöpler district deposits (Çöpler,
Greater Çakmaktepe, and Bayramdere). |
| · | The QP considers that the knowledge of the deposit setting, lithologies, controls on mineralization, and the mineralization style
and setting, is sufficient to support the Mineral Resource classifications assigned. Alternative geological interpretations are possible.
At Çöpler and Greater Çakmaktepe, the domains were updated to better align with previous mining reconciliation, however,
a moderate–high risk is inherently carried in the domaining. It is anticipated that alternative geological interpretations could
lead to tonnage or grade swings of up to ±20% in Inferred parts of the Mineral Resources. |
| · | The assumptions, parameters and methods used in the estimations have been transparently reported. The estimation settings are considered
conservative and have been reconciled with previous mining at Çöpler and Greater Çakmaktepe to provide a robust result.
Sensitivity testing has demonstrated that the estimation settings carry a moderate risk. |
| | 1-2 | |
| SSR Mining Inc. | Çöpler Property S-K 1300 Report | February 12, 2024 SLR Project No.: 138.21581.00006 |
| · | The Mineral Resource estimates for Çöpler, Greater Çakmaktepe, and Bayramdere have an effective date of October
31, 2023. |
| · | Appropriate cut-off grades and pit optimization parameters have been used to establish those portions of the block models that meet
the requirement for reasonable prospects for economic extraction for this style of gold-copper deposit and mineralization. In assessing
the potential of economic extraction, the QP reviewed mining, metallurgical, economic, environmental, social and geotechnical factors. |
| · | The Mineral Resources estimates exclusive of Mineral Reserves at the Property include the following by deposit area (SSR 80% attributable
share): |
| · | Çöpler: 5.0 million tonnes (Mt) Measured Mineral Resources at an average grade of 1.31 g/t gold (Au) containing 0.21 million
ounces (Moz) Au, 11.1 Mt Indicated Mineral Resources at an average gold (Au) grade of 1.29 g/t containing 0.46 million ounces (Moz) Au
and an additional 14.0 Mt at an average grade of 1.53 g/t Au containing 0.69 Moz Au of Inferred Mineral Resources. |
| · | Greater Çakmaktepe: 3.6 Mt Measured Mineral Resources at an average grade of 0.94 g/t Au containing 0.11 Moz Au, 7.3 Mt Indicated
Mineral Resources at an average grade of 1.10 g/t Au containing 0.26 Moz Au and an additional 4.8 Mt at an average grade of 1.87 g/t Au
containing 0.29 Moz Au of Inferred Mineral Resources. |
| · | Bayramdere: 0.1 Mt Indicated Mineral Resources at an average grade of 2.36 g/t Au containing 0.01 Moz Au. There are no Measured or
Inferred Resources at Bayramdere. |
| · | The level of uncertainty has been adequately reflected in the classification of Mineral Resources for the Çöpler Project.
The Mineral Resources presented may be materially impacted by any future changes in the break-even cut-off grade, which may result from
changes in mining method selection, mining costs, processing recoveries and costs, metal price fluctuations, or significant changes in
geological knowledge. |
The QP is of the opinion that with consideration of the recommendations
summarized in Sections 1 and 23 of this TRS, any issues relating to all relevant technical and economic factors likely to influence the
prospect of economic extraction can be resolved with further work.
| 1.1.1.2 | Mining and Mineral Reserves |
| · | The total Mineral Reserve for the Çöpler Project is estimated to be approximately 67.4 Mt at an average grade of
2.32 g/t gold, totaling 5.1 Moz of contained gold, and SSR’s (80%) portion is 53.9 Mt at an average grade of 2.32 g/t Au, totaling 4.1 Moz of contained gold. Average oxide gold recoveries
are 61% and average sulfide gold recoveries range from 81% to 91%. SSR’s portion of the Mineral Reserves for both Çöpler
pit and Greater Çakmaktepe pit is 80%. The Çöpler pit represents approximately 41% of the total Mineral Reserve and
the Greater Çakmaktepe pit represents the remaining 59%. |
| · | The SLR QP reviewed the assumptions, parameters, and methods used to prepare the Mineral Reserves Statement and is of the opinion
that the Mineral Reserves are estimated appropriately and disclosed in accordance with S-K 1300. |
| · | This mine has operated profitably since 2011. Open pit mining at the Çöpler Project
is carried out by a mining contractor and managed by Anagold. |
| | 1-3 | |
| SSR Mining Inc. | Çöpler Property S-K 1300 Report | February 12, 2024 SLR Project No.: 138.21581.00006 |
| · | The mining method is a conventional open pit method with drill and blast operations and using excavators and trucks operating on bench
heights of 5 m. The mining contractor provides operators, line supervisors, equipment, and ancillary facilities required for the mining
operation. Anagold provides management, technical, mine planning, engineering, and grade control functions for the mining operation. |
| · | Production schedules and costs associated with the Mineral Reserves have been updated by SSR based on current site performance and
contracts. |
| 1.1.1.3 | Mineral Processing |
Pressure Oxidation Sulfide Plant
| · | The throughput from crushing and grinding was designed with a nominal capacity of 306 tph which was increased up to a maximum of 400 tph.
The pressure oxidation (POX) autoclave circuit has demonstrated it can process a long-term average maximum of 280 tph feed (two autoclaves
operating in parallel) and 13.75 tph sulfide sulfur, compared to design of 245 tph and 12.5 tph respectively. The limit
of 13.75 tph sulfide sulfur is dictated by the capacity of the oxygen supply to effect oxidation of the sulfides, design 96%. The
gold recovery has remained at approximately 87.5%. |
| · | The flotation plant feed rate is variable between 50–150 tph based on sulfide sulfur feed grade and the oxidation capacity
of the POX autoclaves to oxidize sulfides. |
| · | The addition of a flotation circuit to the sulfide plant provides stability and flexibility to the POX circuit operation to maximize
throughput and oxygen utilization by maintaining optimum sulfur grade to the autoclaves. |
| · | A large amount of POX test work has been performed on Çöpler sulfide ore across several pilot plant campaigns. The current
POX process works well, as demonstrated by actual operational performance. |
| · | Comminution test work indicates that Çakmaktepe Ext. sulfide ore (jasperoid) is significantly harder and more abrasive than
Çöpler sulfide ores and is not amenable for feeding to the existing Sulfide plant primary sizer. The ore will be crushed using
the heap leach crushing plant and then delivered to POX plant grinding circuit. |
| · | No test work has been completed for direct POX processing of Çakmaktepe Ext. sulfide ores or flotation concentrates. |
| · | Further metallurgical testing of Çakmaktepe Ext. material types, both oxide and sulfide, is recommended to optimize the feeds
to POX and slip stream flotation circuit. Further mineralogical work is recommended to understand the main gold associations. |
| · | The silver recovery pattern is much less clear than gold because silver is not released by the oxidation process. Silver recovery
is determined from actual plant recovery over the period January 2019 through February 2020. The silver recovery calculates to 3.0%. |
| · | From the test work, it is estimated that the flotation concentrate reporting to the POX circuit will achieve the same overall recovery
as the ore directly reporting to POX. Gold recovery to the flotation concentrate is estimated to be 55%. |
| · | The flotation tails reporting directly to the leach circuit are estimated to have a gold recovery of 43%, based on test work using
samples collected while processing large amounts of formerly stockpiled ore. When processing freshly mined sulfide ore, flotation tails
recoveries can vary between 10% and 30% in CIP. |
| | 1-4 | |
| SSR Mining Inc. | Çöpler Property S-K 1300 Report | February 12, 2024 SLR Project No.: 138.21581.00006 |
Heap Leach
| · | The oxide heap leaching facilities were commissioned in late 2010. The process was originally designed to treat approximately 6.0 Mtpa
of ore by three-stage crushing (primary, secondary, and tertiary) to 80% passing 12.5 mm, agglomeration, and heap leaching on a lined
heap leach pad with dilute alkaline sodium cyanide solution. Gold is recovered through a carbon-in-column (CIC) adsorption system, followed
by carbon elution, electrowinning and smelting of the precipitate to produce doré ingots for sale. |
| · | The ore contains cyanide soluble copper that consumes cyanide increasing operating cost. Copper cyanide in the leach solutions is
treated in a sulfidation, acidification, recycling, and thickening (SART) plant which precipitates the copper as copper sulfide and regenerates
sodium cyanide, which is recycled in the leach solutions. |
| · | Metallurgical test work on Çakmaktepe oxide ore for heap leaching was performed in the on-site Çöpler metallurgical
laboratory, initially under the supervision of Kappes, Cassiday & Associates (KCA). The results compare to the Çöpler
oxide ore, with similar behavior and leach kinetics. Subsequently, Çakmaktepe oxide ore was heap leached together with Çöpler
oxide ore. |
| · | Metallurgical test work on Çakmaktepe Ext. oxide material for heap leaching was performed at McClelland Laboratories Inc. and
supervised by Metallurgium consulting. The initial program in 2019 identified two distinct domains with respect to gold recovery based
on sulfide sulfur (SS) content of <1% and between 1% to 2%. |
| · | Metallurgical heap leach test work has been completed to characterize the Bayramdere oxide mineralization. In the column test, final
gold extraction was 84% in the two duplicate columns with reasonable leach kinetics. |
| · | The current heap leaching gold recovery assumptions are summarized for Çöpler oxide zone, Çakmaktepe oxide zone
(including Bayramdere), and Çakmaktepe Ext. oxide zone in the report and vary by ore type and location. The main ore types include
diorite, metasediment (Hornfels), limestone/marbles, gossan, manganese diorite, Jasperoid and ophiolite. The Çakmaktepe Ext. oxide
ores include Jasperite, Listwanite and Dolomite and were extensively tested during 2023 by Ausenco and ALS. |
Grind Leach
| · | The proposed process to treat oxide and low sulfur (< 2% sulfur) ores from the Çakmaktepe Ext. open pit is a conventional
grind leach process. The grind leach process plant is designed to treat 248 tph of ore during 8,059 hours per year of operation
or 92% availability for a total of 2 Mtpa. The operating availability of the crushing section will be 70%. The process will comprise primary
jaw crushing, SAG mill and ball mill grinding closed by hydrocyclones, carbon-in-leach (CIL) cyanidation, carbon elution, electrowinning,
and refining of electrowinning precipitate to produce a final precious metal (doré) product. |
| · | In 2023, ALS Metallurgy - Kamloops completed a metallurgical test program supervised by Ausenco to evaluate grind/leach processing
of Çakmaktepe Ext. oxide ores. Both standard and CIL bottle roll tests were completed at a grind size P80 of 75 µm.
Testing on master composite samples indicated that gold recovery is insensitive to grind size over a range from 53 µm to 212 µm. |
| · | Samples were selected to be representative of spatial, lithological and grade variability. Sample selection also took into consideration
the preliminary mining sequence, with higher sample density in areas expected to be mined in the earlier years of the grind/leach plant
operation. |
| | 1-5 | |
| SSR Mining Inc. | Çöpler Property S-K 1300 Report | February 12, 2024 SLR Project No.: 138.21581.00006 |
| · | Test work is planned to understand metallurgical and mineralogical variability across the deposit. Gold recovery for the Jasperoid,
Listwanite, and Dolomite lithologies were 60%, 90%, and 83%, respectively. |
| · | The existing heap leach pad comprises four phases with an estimated capacity of 63 Mt of oxide ore heaps, with a maximum heap height
of 100 m above the pad liner. Two additional phases (phase 5 and phase 6), with a total of 18.5 Mt capacity (13.5 Mt and 5.0 Mt, respectively),
will be added to accommodate oxide ore extracted from Greater Çakmaktepe. |
| · | The current tailings storage facility (TSF-1) is in the process of development and construction and will have seven phases when it
reaches the ultimate phase. Currently the TSF holds 13.3 Mt of tailings as of the Effective Date of this report. Construction of Phase
4 of TSF-1 has been finalized, and it received approval for operation from the Ministry of Environment, Urbanisation and Climate Change
(MoEUCC) in November 2023. The design capacity for TSF-1 is currently 65.8 Mt. |
| · | However, the ultimate capacity required for TSF-1 that will have to incorporate the 60.4 Mt of tailings generated from the
LOM plan is estimated to be 73.7 Mt (13.3 Mt plus 60.4 Mt). There are a number of options currently being studied to further expand
TSF-1 capacity but these have not been finalized. A conceptual design to increase the crest elevation of Phase 7 embankment from
1,275 MASL to 1,280 MASL, thus increasing the total capacity to approximately 77 Mt, has been selected for the LOM plan. |
| · | Limestone and marble overburden are currently used as embankment rockfill for TSF construction. According to the current mine plan,
there will be a limestone shortage in 2025 but SSR has plans to quarry limestone near the mine area to produce the required amount required
for the TSF expansion. |
| · | The existing infrastructure, as well as the areas designated for tailings storage and the leach pad, will meet the demands of the
current Mineral Reserves once the planned expansions are completed. |
| · | The Çöpler mining and processing operations have a well-established and effective environmental, social and permitting
management program (10+ years) that follows National and International Standards. |
| · | Site staff is knowledgeable and experienced in site and regulatory requirements and supported by corporate technical and Environmental,
Social and Governance (ESG) personnel as well as outside (Türkiye and International) technical experts. |
| · | Budgets and planned schedules for permit development are reasonable and there were no critical path permitting items noted that would
limit production and Reserve/Resource development. A reclamation/closure plan and estimates to perform this activity are in place. |
| · | The budgets and staffing to perform required programs are adequate and indicative of site activities, requirements, and responsibilities. |
| | 1-6 | |
| SSR Mining Inc. | Çöpler Property S-K 1300 Report | February 12, 2024 SLR Project No.: 138.21581.00006 |
| · | The SLR QP’s opinion is that it is reasonable to rely on the information provided by SSR as outlined above for use in the this
TRS because a significant environmental and social analysis has been conducted for the project over an extended period, the Project has
been in operation for a number of years, and SSR employs professionals and other personnel with responsibility in these areas and these
personnel have a good understanding of the permitting, regulatory, and environmental requirements for the Project. |
| 1.1.1.6 | Capital and Operating Costs |
| · | SSR’s forecasted capital and operating costs estimates related to the development of Mineral Reserves are derived from annual
budgets and historical actuals over the long life of the current operation. According to the American Association of Cost Engineers (AACE)
classifications, these estimates would be Class 2 with an accuracy range of -5% to -15% to +5% to +20% except where noted elsewhere. |
The QPs offer the following recommendations by area.
| 1.1.2.1 | Geology and Mineral Resources |
| 1. | Carry out an infill drill program of 50,000 m with a proposed budget of US$11.3 million over the
next three years at Çöpler and Greater Çakmaktepe. The objective of the infill drill program is to increase
orebody knowledge and improve the confidence in resource estimates and classification. |
| 2. | Carry out resource extension drill program of 30,000 m with a proposed budget of
US$6.8 million over the next three years at Çöpler
and Greater Çakmaktepe. The drill program is planned to convert Inferred Resources to Indicated Resources within the current reserve
pit. The drill program will also target higher-grade structures closer to the current resource boundary with an objective of expanding
the Mineral Resources. |
| 3. | Carry out continuous pit mapping and updating of the structural and geological model at Çöpler
and Greater Çakmaktepe. The data will be incorporated in resource models to increase the confidence in resource estimates and classification. |
| 4. | Audit the grade control process in 2024. Based on the outcomes of the audit, any changes, if
warranted, will be implemented. |
The RSC QP agrees with the objectives and overall scope of these planned
activities.
| 1.1.2.2 | Mining and Mineral Reserves |
| 1 | Complete the Greater Çakmaktepe pit area hydrological model within the upcoming year (2024). |
| 2. | Update geotechnical model for the Greater Çakmaktepe pit area in 2024. |
| 3. | Pit dewatering should become a higher priority in both the Çöpler and Greater Çakmaktepe pit areas within the next
few years as the pits are deepened. |
| 4. | Perform a study to optimize Waste Rock Dump (WRD) locations to improve the haulage profiles. |
| 1.1.2.3 | Mineral Processing |
| 1. | Carry out additional test work to understand the significant metallurgical and mineralogical variability across the deposit, including
gold recovery and grind size for the Jasperoid mineralization. |
| | 1-7 | |
| SSR Mining Inc. | Çöpler Property S-K 1300 Report | February 12, 2024 SLR Project No.: 138.21581.00006 |
| 2. | Implement further testing to determine optimum circuit design parameters including grind size. |
| 1 | Develop an execution plan for constructing TSF 1 phase 5 within the next 2.5 years to account for the current rate of rise in the
facility and to mitigate any risk of reduced tailings capacity in the TSF-1 impoundment driven by excess water from the heap leach operations. |
| 2 | Evaluate and plan for the operation of water treatment facilities to filter the TSF reclaim water and manage discharges as soon as
possible. |
| 3. | Expedite the permitting and initiation of limestone quarry operations to avoid delays in the construction of future TSF phases given
the projected limestone shortage in 2025 in the current mine plan. |
| 4. | Develop a well-defined closure plan for the current TSF. The closure plan should be integrated with operations and life-of-mine planning. |
| 5. | Conduct further studies and install instrumentation for TSF-1 as the facility is expanded beyond Phase 5. The instrumentation should
include inclinometers within the downstream abutments used to supplement the existing monitoring and instrumentation plan. These changes
are proposed for the 2024 fiscal year. |
| 6. | Conduct further studies for the proposed TSF options, as listed below, during the next stage of their design. |
| o | Geotechnical Investigation with Boreholes & Test pits |
| o | Tailings Sample (pilot) and testing |
| o | Tailings Large Strain Consolidation Modeling |
| o | Seismic Deformation Modeling |
| o | Probabilistic Water Balance Modeling |
| o | Diversion Channel Design |
| o | Credible Failure Modes Analysis |
| 1 | Evaluate whether there may be an opportunity to use the heap drain-down solution in the sulfide circuit rather than disposing of it
by forced evaporation, potentially reducing costs. This would require changes to the design of the evapotranspiration cells included in
the current estimate. |
| 2. | Evaluate the technical and regulatory/permitting requirements for treating and discharging water. The SLR QP understands that the
current operations are designed as “Zero Discharge”; however, suggests that treating and discharging water may enhance sustainability
goals by reducing fresh-water make-up and expedite closure timing. |
| | 1-8 | |
| SSR Mining Inc. | Çöpler Property S-K 1300 Report | February 12, 2024 SLR Project No.: 138.21581.00006 |
| 3. | Conduct further studies and design work for the mitigation of potential acid
generating (PAG) materials exposed in the pits to verify whether the proposed one
metre of non-PAG cover is practical and effective to implement. |
| 4. | Compare the growth media inventory and expected amount to be recovered over the course of the Project to the sum of the growth media
requirements of the Project facilities. Further work (as part of a Test Plot Program) is recommended to determine the most sustainable
revegetation covers to be employed. |
| 5. | Evaluate and, where possible, implement additional concurrent reclamation opportunities to minimize costs and requirements at the
end of operations. |
| 6. | Track and, if necessary, participate in the development of new environmental and mine permitting regulations. |
| 7. | Continue to perform internal and external (independent) ESG Audits. |
| 8. | Continue to update Asset Retirement Obligations (ARO) as well as overall reclamation/closure cost estimates on a regular basis. |
| 1.1.2.6 | Capital and Operating Costs |
| 1. | Evaluate the technical and regulatory/permitting requirements for treating and discharging water. The SLR QP understands that the
current operations are designed as “Zero Discharge”; however, suggests that treating and discharging water may enhance sustainability
goals by reducing fresh-water make-up and expedite closure timing. |
An after-tax Cash Flow Projection has been generated from the Life of
Mine production schedule and capital and operating cost estimates and is summarized in Table 1-2. A summary of the key criteria is
provided below. The complete cash flow is presented in Section 27.0 Appendix. The analysis is based on Q4 2023 real US dollar basis with
no escalation.
| 1.2.1 | Economic Assumptions |
| · | Approximately 13,000 tonnes per day processed (4.5 Mt per year) at an average overall head grade of 2.32 g/t gold, including the following
circuits: |
| o | POX: Approximately 7,800 tpd milled (2.7 Mt per year) averaging 2.42 g/t gold, |
| o | Heap Leach: 3,800 tpd stacked (1.3 Mt per year) averaging 1.93 g/t gold, and |
| o | Grind-Leach: 5,340 tpd milled (1.9 Mt per year) averaging 2.26 g/t gold. |
| · | LOM average 281,000 ounces per year gold recovered with LOM recovery averaging 84.7% over the 15 years of full process capacity (2024
to 2038). Total 4.25 Moz gold recovered over LOM with the following recovery rates: |
| o | POX: 87.9%; Heap Leach: 70.4%, and Grind-Leach: 81.3% |
| · | The economic analysis was carried out on a total of 100% basis of Mineral Reserves, of which SSR owns 80%. |
| · | Metal price: US$1,780 per ounce gold (LOM realized), US$1,755 per ounce gold long term price (2028+). |
| | 1-9 | |
| SSR Mining Inc. | Çöpler Property S-K 1300 Report | February 12, 2024 SLR Project No.: 138.21581.00006 |
| · | Gold at refinery 100% payable (with de minimis silver and copper production not included in this analysis). |
| · | Net Smelter Return (NSR) of $106/t processed includes freight/transport costs averaging $3.84/oz gold. Refining costs are
included in process operating costs. |
| · | Revenue is recognized at the time of gold production. |
| · | Mine life: 15 years (11 years of mining with four years of stockpile processing). |
| · | Life of Mine production plan as summarized in Table 13-18. |
| · | Greater Çakmaktepe starter pit, TSF expansion to 77 Mt, and G-L circuit construction growth capital totals $475.1 million. |
| · | Mine life sustaining capital totals $61.3 million. |
| · | Final reclamation costs total $100 million at end of mine life. |
| · | Average site operating cost over the mine life is $54.45 per tonne processed. |
| 1.2.1.3 | Taxation and Royalties |
| 1.2.1.3.1 | Corporate Income Taxes |
In Türkiye, the standard income tax rate is 25% but some of the
site’s income streams qualify for a reduced rate, thus the effective LOM income tax rate is 24.5%.
For tax purposes, a 10 year double declining balance methodology is
used for all new and replacement capital starting in 2024 totaling $536 million. For the existing depreciation balance of $290 million
as of Q3 2023, a combination of accelerated, straight line, and unit of production depreciation methods is used as modeled by the SSR
tax group. All remaining depreciation at the end of the mine life is written off in the last year of production.
Investment incentive certificates (IIC) are available for investments
that promote economic development. IIC’s can be classified as strategic in specific circumstances, thereby providing additional
incentives. An IIC generates credits that offset corporate income taxes generated by the investment. In this analysis, income tax
credits totaling 29% over the LOM were applied to the income tax payable estimate, in 90% credits applied in 2024 and 2025 and 80% credits
applied in 2026 to 2028, as modeled by the SSR tax group.
| 1.2.1.3.2 | VAT and Import Duties |
This analysis assumes the annual operating and capital cost are subject
to value-added tax (VAT) in Türkiye. VAT is levied at 4% of all operating and capital costs (less labor costs) starting July 2023,
and the Project is eligible for the Turkish exemptions for mining projects and mining equipment purchases. VAT payments are expected to
end in 2025.
Import duties are not included in the capital cost estimate for mining
related imported equipment because they are exempted in the IICs.
| | 1-10 | |
| SSR Mining Inc. | Çöpler Property S-K 1300 Report | February 12, 2024 SLR Project No.: 138.21581.00006 |
Under Turkish Mining Law, the royalty rate for precious metals is variable
and tied to metal prices. The Çöpler Project is subject to a mineral production royalty which is based on a sliding scale
to gold price and is payable to the Turkish government.
Table 1-1 details the current prescribed royalty rates applicable
to POX, heap leach and G-L production (revised September 2020). The royalties are calculated on total revenue with deductions allowed
for processing and haulage costs of ore. Royalty rates are reduced by 40% for ore processed in country, as an incentive to process ore
locally.
Table 1-1: Gold Royalty Rates
|
Metal Price
($/oz Gold) |
Prescribed Royalty Rate
(%) |
Royalty After 40% In-Country Processing Incentive
(%) |
| From |
To |
| 0 |
800 |
1.25 |
0.75 |
| 800 |
900 |
2.50 |
1.50 |
| 900 |
1,000 |
3.75 |
2.25 |
| 1,000 |
1,100 |
5.00 |
3.00 |
| 1,100 |
1,200 |
6.25 |
3.75 |
| 1,200 |
1,300 |
7.50 |
4.50 |
| 1,300 |
1,400 |
8.75 |
5.25 |
| 1,400 |
1,500 |
10.00 |
6.00 |
| 1,500 |
1,600 |
11.25 |
6.75 |
| 1,600 |
1,700 |
12.50 |
7.50 |
| 1,700 |
1,800 |
13.75 |
8.25 |
| 1,800 |
1,900 |
15.00 |
9.00 |
| 1,900 |
2,000 |
16.25 |
9.75 |
| 2,000 |
2,100 |
17.50 |
10.50 |
| 2,100 |
+ |
18.75 |
11.25 |
The Çöpler Project effective LOM royalty rate based on the
metal price assumptions and applicable deductions is approximately 8.4%.
Other than the royalty payments, there are no other known back-in rights,
payments, or other agreements and encumbrances to which the Project is subject.
Considering the Çöpler Project on a stand-alone basis, the
undiscounted after-tax cash flow totals $2,368 million over the mine life. The after-tax Net Present Value (NPV) at a 5% discount rate
(midpoint with November 1, 2023 as time zero) is $1,643 million, as shown in Table 1-2. An Internal Rate of Return (IRR) metric is
not reported as the operation is cash positive in each year of the mine plan until closure.
| | 1-11 | |
| SSR Mining Inc. | Çöpler Property S-K 1300 Report | February 12, 2024 SLR Project No.: 138.21581.00006 |
Table 1-2: After-Tax Cash Flow
Summary
| Description |
US$ million |
| Realized Market Prices |
|
| Au ($/oz) |
$1,780 |
| Payable Metal |
|
| Au (koz) |
4,254 |
| Total Gross Revenue |
7,564 |
| Mining Cost |
(1,213) |
| Process Cost |
(1,998) |
| G & A Cost |
(441) |
| VAT Payments |
(9) |
| Dore Freight/Insurance |
(16) |
| Mining Royalties |
(429) |
| Total Operating Costs |
(4,107) |
| Operating Margin (EBITDA) |
3,457 |
| Cash Taxes Payable |
(452) |
| Working Capital1 |
0 |
| Operating Cash Flow |
3,005 |
| Development Capital |
(475) |
| Sustaining Capital |
(61) |
| Total Closure/Reclamation Capital |
(100) |
| Total Capital |
(637) |
| |
|
| Pre-tax Free Cash Flow |
2,821 |
| Pre-tax NPV @ 5% |
1,931 |
| |
|
| After-tax Free Cash Flow |
2,368 |
| After-tax NPV @ 5% |
1,643 |
Notes:
| 1. | All working capital adjustments net to zero at end of mine life |
The World Gold Council Adjusted Operating Cost (AOC) is US$965/oz Au.
The mine life capital unit cost, including sustaining and closure/reclamation, is US$38/oz, for an All in Sustaining Cost (AISC) of US$1,003/oz
Au. The average annual gold production during operation is 281,000 ounces per year over ROM operations.
| 1.2.3 | Sensitivity Analysis |
Project risks can be identified in both economic and non-economic terms.
Key economic risks were examined by running cash flow sensitivities:
| | 1-12 | |
| SSR Mining Inc. | Çöpler Property S-K 1300 Report | February 12, 2024 SLR Project No.: 138.21581.00006 |
After-tax IRR sensitivity over the base case has been calculated for
-20% to +20% variations for head grade, recovery (only -20% to +15% variation), and gold price, and -15% to +15% variations for operating
and capital costs. The Project is most sensitive to changes in head grade, metallurgical recovery, and metal price (usually with same
magnitude of impact) followed by operating cost and finally capital costs.
| 1.3.1 | Property Description |
The Project is serviced by road and rail networks. The mine is accessed
from the main paved highway between Erzincan and Kemaliye. The Project area is in the Eastern Anatolia geographical district of Türkiye.
Mining operations are conducted year-round. The climate is typically continental with cold wet, winters and hot dry, summers.
Anagold holds the exclusive right to engage in mining activities within
the Çöpler project area. Anagold holds six granted licenses covering a combined area of approximately 16,600 ha. Mineral
title is held in the name of Anagold. Kartaltepe holds six licenses covering approximately 7,250 ha. The total near-mine tenement package
is approximately 23,850 ha. Anagold currently holds sufficient surface rights to allow continued operation of the mining operation
in the Reserve Case.
The Çöpler region has been subject to gold and silver mining
dating back at least to Roman times. The Turkish Geological Survey (MTA) carried out regional exploration work in the early1960s that
was predominately confined to geological mapping. In 1964, a local Turkish company started mining for manganese, continuing through until
closing in 1973. Unimangan Manganez San A.Ş. (Unimangan) acquired the property in January 1979 and re-started manganese production,
continuing until 1992. In 1998, Anatolia Minerals Development Ltd (Anatolia) identified several porphyry-style gold–copper prospects
in east central Türkiye and applied for exploration licenses for these prospects. During this work, Anatolia identified a prospect
in the Çöpler basin. This prospect and the supporting work were the basis for a joint venture agreement for exploration with
Rio Tinto and Anatolia and in January 2004, Anatolia acquired the interests of Rio Tinto and Unimangan.
In August 2009, a joint venture agreement between Anatolia and Lidya
was executed.
In February 2011, Anatolia merged with Avoca Resources Limited, an Australian
company, to become Alacer Gold Corp. (Alacer). In September 2020, Alacer merged with SSR.
Technical Reports have been prepared on the Project in accordance with
NI 43-101 Standards for Disclosure for Mineral Projects since 2003. In 2022, a Technical Report Summary was prepared, in accordance with
S-K 1300, that presented an Initial Assessment for a copper recovery circuit.
| | 1-13 | |
| SSR Mining Inc. | Çöpler Property S-K 1300 Report | February 12, 2024 SLR Project No.: 138.21581.00006 |
| 1.3.3 | Geological Setting, Mineralization, and Deposit |
The Çöpler Project, including Çöpler, Greater
Çakmaktepe, and Bayramdere deposits, is within the Tethyan mineral belt, a terrane stretching from Indo-China to Europe through
Eurasia that contains economically significant gold, copper, and base metal deposits.
The Çöpler deposit is centred on composite diorite to monzonite
porphyry stocks that are part of the Eocene Çöpler Kabataş magmatic complex. The magmatic rocks have intruded into both
the Keban and Munzur Formations. The mineralisation is considered to be related to fluids associated with diorite intrusions at depth.
Three types of mineralization are prevalent at the deposits; 1) intermediate
sulfidation epithermal gold 2) replacement gold and 3) skarn gold. At Ҫӧpler there is also evidence of an earlier low grade
porphyry copper-gold system.
The Greater Çakmaktepe area mainly comprises Palaeozoic metamorphic
rocks and marble belonging to the Keban Formation and Mesozoic platform carbonate such as the Munzur Formation limestone. All these units
are tectonically overlain by ophiolitic mélange rocks. Mineralisation similar to Çöpler is also thought to be the result
of intrusive activity that generated suitable conditions for mineralisation of ophiolite, limestone, and hornfels lithologies. The mineralisation
is controlled by a complex system of structural fluid pathways and traps controlled by lithological contacts, in typical replacement-style
processes.
The Bayramdere deposit is an oxide gold and copper deposit with similar
geological and mineralisation characteristics to Greater Çakmaktepe deposits. The Bayramdere deposit is structurally controlled,
displaying a replacement gold (minor copper, minor silver) mineralisation style. The deposit is dominantly represented by near-surface
oxide mineralisation, primarily associated with iron-rich gossan.
Core (Diamond Drilling-DD) and RC drilling on the Property is the principal
method of exploration and delineation of gold mineralization after initial targeting using soil sampling and geophysical surveys.
As of the effective date of this TRS, SSR and its predecessor companies
have completed 725,840 m of drilling in 4,834 drillholes in the property.
| 1.3.5 | Mineral Resource Estimates |
Mineral Resources have been classified in accordance with the definitions
for Mineral Resources in S-K 1300. RSC Consulting Ltd. (RSC) has prepared, reviewed, and accepted the Mineral Resource estimates. The
Mineral Resource estimates are based on block model values developed from assays on the mineralized properties.
The Mineral Resource estimates were completed using conventional block
modelling approach in Seequent’s Leapfrog Geo (Leapfrog Geo) software.
Estimates were validated using standard industry techniques including
statistical comparisons with composite samples and parallel nearest neighbor (NN) estimates, swath plots, and visual reviews in cross-section
and plan. A visual review comparing blocks to drill holes was completed after the block modelling work was performed to ensure general
lithologic and analytical conformance and was peer reviewed prior to finalization. Mineral Resources (SSR ownership 80% only) have been
summarised based on deposit, resource classification and processing methodology.
| | 1-14 | |
| SSR Mining Inc. | Çöpler Property S-K 1300 Report | February 12, 2024 SLR Project No.: 138.21581.00006 |
The Mineral Resource estimates are presented in Table 1-3.
| | 1-15 | |
| SSR Mining Inc. | Çöpler Property S-K 1300 Report | February 12, 2024 SLR Project No.: 138.21581.00006 |
Table 1-3: Summary of Çöpler
Mine, Greater Çakmaktepe and Bayramdere Mineral Resources (SSR’s Attributable Share)
| Deposit |
Measured
Mineral Resources |
Indicated
Mineral Resources |
Measured
+ Indicated Mineral Resources |
Inferred
Mineral Resources |
NSR
Cut-off Values |
| Amount |
Grade |
Rec |
Amount |
Grade |
Rec |
Amount |
Grade |
Rec |
Amount |
Grade |
Rec |
| Gold |
(Mt) |
(g/t
Au) |
(%) |
(Mt) |
(g/t
Au) |
(%) |
(Mt) |
(g/t
Au) |
(%) |
(Mt) |
(g/t
Au) |
(%) |
($/t) |
| Ҫӧpler
Mine |
5.0 |
1.31 |
40
- 91 |
11.1 |
1.29 |
40
- 91 |
16.2 |
1.29 |
40
- 91 |
14.0 |
1.53 |
40
- 91 |
18.34
- 39.87 |
| Greater
Çakmaktepe |
3.6 |
0.94 |
40
- 91 |
7.3 |
1.10 |
40
- 91 |
10.9 |
1.05 |
40
- 91 |
4.8 |
1.87 |
40
- 91 |
18.34
- 44.37 |
| Bayramdere |
- |
- |
- |
0.1 |
2.36 |
75 |
0.1 |
2.36 |
75 |
- |
- |
- |
18.34 |
| Total
Gold |
8.6 |
1.15 |
40
- 91 |
18.6 |
1.22 |
40
- 91 |
27.2 |
1.20 |
40
- 91 |
18.9 |
1.61 |
40
- 91 |
18.34
- 44.37 |
| Silver |
(Mt) |
(g/t
Ag) |
(%) |
(Mt) |
(g/t
Ag) |
(%) |
(Mt) |
(g/t
Ag) |
(%) |
(Mt) |
(g/t
Ag) |
(%) |
($/t) |
| Ҫӧpler
Mine |
5.0 |
3.33 |
0
- 38 |
11.1 |
3.38 |
0
- 38 |
16.2 |
3.36 |
0
- 38 |
14.0 |
4.92 |
0
- 38 |
18.34
- 39.87 |
| Greater
Çakmaktepe |
3.6 |
3.75 |
0
- 20 |
7.3 |
2.56 |
0
- 20 |
10.9 |
2.95 |
0
- 20 |
4.8 |
2.26 |
0
- 20 |
18.34
- 44.37 |
| Bayramdere |
- |
- |
- |
0.1 |
25.55 |
0
- 54 |
0.1 |
25.55 |
0
- 54 |
- |
- |
- |
18.34 |
| Total
Silver |
8.6 |
3.51 |
0
- 54 |
18.6 |
3.20 |
0
- 54 |
27.2 |
3.29 |
0
- 54 |
18.9 |
4.24 |
0
- 54 |
18.34
- 44.37 |
| Copper |
(Mt) |
(%
Cu) |
(%) |
(Mt) |
(%
Cu) |
(%) |
(Mt) |
(%
Cu) |
(%) |
(Mt) |
(%
Cu) |
(%) |
($/t) |
| Ҫӧpler
Mine |
5.0 |
0.08 |
0
- 15 |
11.1 |
0.07 |
0
- 15 |
16.2 |
0.07 |
0
- 15 |
14.0 |
0.07 |
0
- 15 |
18.34
- 39.87 |
| Greater
Çakmaktepe |
3.6 |
0.03 |
0 |
7.3 |
0.02 |
0 |
10.9 |
0.02 |
0 |
4.8 |
0.02 |
0 |
18.34
- 44.37 |
| Bayramdere |
- |
- |
- |
0.1 |
0.00 |
1 |
0.1 |
0.00 |
1 |
- |
- |
- |
18.34 |
| Total
Copper |
8.6 |
0.06 |
0
- 15 |
18.6 |
0.05 |
0
- 15 |
27.2 |
0.05 |
0
- 15 |
18.9 |
0.06 |
0
- 15 |
18.34
- 44.37 |
Notes:
| 1. | The definitions for Mineral Resources in S-K 1300 were followed. |
| 2. | Mineral Resources are reported based on October 31, 2023 topography surface. |
| 3. | Mineral Resources are reported exclusive of Mineral Reserves. |
| 4. | The numbers reflect SSR attributed share of 80%. |
| 5. | Heap Leach Oxide is defined as material <2% total sulfur. |
| 6. | Grind Leach Oxide is defined as material <2% total sulfur. Processing route will be available approximately in 2027. |
| 7. | Sulfide is defined as material ≥2% total sulfur. |
| 8. | Heap leach oxide uses an NSR cut-off $18.34/t, grind leach oxide uses an NSR cut-off value $19.26/t, Çöpler sulfide ore
uses a cut-off value of $39.87/t, Greater Çakmaktepe sulfide ore uses a cut-off value of $44.37/t . All cut-off values include
allowances for royalty payable. |
| | 1-16 | |
| SSR Mining Inc. | Çöpler Property S-K 1300 Report | February 12, 2024 SLR Project No.: 138.21581.00006 |
| 9. | Metallurgical gold recovery for heap leach oxide and grind leach varies between 40–78% and 53–90%, respectively, based
on lithology; metallurgical recovery for sulfide varies between 81–91% based on lithology. |
| 10. | Metallurgical silver recoveries for heap leach and grind leach oxide vary between 0 and 54% based on lithology. Metallurgical recovery
for sulfide varies between 0 and 3%. |
| 11. | Metallurgical copper recoveries for heap leach and grind leach oxide vary between 0 and 15% based on lithology. Metallurgical recovery
for sulfide is 0%. |
| 12. | Metal prices used to report the Mineral Resources are $1,750/oz Au, $22.00/oz Ag, and $3.95/lb Cu with allowances for payability,
deductions, transport, and royalties. |
| 13. | The point of reference for Mineral Resources is the point of feed into the processing facility for grind leach and sulfide material;
or for Heap Leach oxide, it is the Carbon columns. |
| 14. | All Mineral Resources estimates were constrained within conceptual pit shells to meet reasonable prospects for economic extraction
criteria. |
| 15. | Mineral Resources that are not Mineral Reserves do not have demonstrated economic viability. |
| 16. | Totals may vary due to rounding. |
| | 1-17 | |
| SSR Mining Inc. | Çöpler Property S-K 1300 Report | February 12, 2024 SLR Project No.: 138.21581.00006 |
| 1.3.6 | Mineral Reserve Estimates |
Mineral Reserve estimates as prepared by SSR, and reviewed and accepted
by the SLR QP, have been classified in accordance with the definitions for Mineral Reserves in S-K 1300.
The Mineral Reserves were developed based on mine planning work completed
in 2023 and estimated based on an October 31, 2023, topography surface. The total Mineral Reserve for the Çöpler Project is
estimated to be approximately 67.4 Mt at an average grade of 2.32 g/t Au, totaling 5.1 Moz of contained gold, and SSR’s portion
is 53.9 Mt at an average grade of 2.32 g/t
Au, totaling 4.1 Moz of contained gold. SSR’s portion of the Mineral Reserves for both Çöpler and Greater Çakmaktepe is
80%.
Average oxide gold recoveries are 61% and average sulfide gold recoveries
range from 81% to 91% for the Mineral Reserves.
The Mineral Reserve estimates have an effective date of October 31,
2023. SSR’s 80% attributable portion of the Mineral Reserves have been summarized by pit area and reserve classification category
in Table 1-4.
| | 1-18 | |
| SSR Mining Inc. | Çöpler Property S-K 1300 Report | February 12, 2024 SLR Project No.: 138.21581.00006 |
Table 1-4: Summary of Mineral
Reserves as of October 31, 2023 (SSR’s Attributable Share)
| |
Proven |
Probable |
Total |
Cut-off Value |
Metallurgical Recovery |
| Tonnage |
Grade |
Tonnage |
Grade |
Tonnage |
Grade |
Contained Metal |
| Gold |
(Mt) |
(g/t Au) |
(Mt) |
(g/t Au) |
(Mt) |
(g/t Au) |
(koz Au) |
($/t) |
(%) |
| Çöpler |
5.7 |
2.03 |
10.3 |
1.77 |
16.1 |
1.86 |
962 |
21.32 - 45.58 |
40 - 91 |
| Greater Çakmaktepe |
7.3 |
2.42 |
20.2 |
2.79 |
27.5 |
2.69 |
2,383 |
21.32 - 45.58 |
40 - 91 |
| Stockpiles |
- |
- |
10.3 |
2.05 |
10.3 |
2.05 |
678 |
21.32 - 45.58 |
40 - 91 |
| Leach Pad Inventory |
- |
- |
- |
- |
- |
- |
49 |
- |
- |
| Total |
13.0 |
2.25 |
40.9 |
2.35 |
53.9 |
2.32 |
4,072 |
21.32 - 45.58 |
40 -91 |
| Silver |
(Mt) |
(g/t Ag) |
(Mt) |
(g/t Ag) |
(Mt) |
(g/t Ag) |
(koz Ag) |
($/t) |
(%) |
| Çöpler |
5.7 |
4.85 |
10.3 |
4.97 |
16.1 |
4.93 |
2,547 |
21.32 - 45.58 |
0 - 38 |
| Greater Çakmaktepe |
7.3 |
3.52 |
20.2 |
4.32 |
27.5 |
4.11 |
3,636 |
21.32 - 45.58 |
0 - 20 |
| Stockpiles |
- |
- |
10.3 |
– |
10.3 |
– |
- |
21.32 - 45.58 |
- |
| Total |
13.0 |
4.10 |
40.9 |
3.40 |
53.9 |
3.57 |
6,183 |
21.32 - 45.58 |
0 - 38 |
| Copper |
(Mt) |
(% Cu) |
(Mt) |
(% Cu) |
(Mt) |
(% Cu) |
(Mlb Cu) |
($/t) |
(%) |
| Çöpler |
5.7 |
0.06 |
10.3 |
0.05 |
16.1 |
0.05 |
18.8 |
21.32 - 45.58 |
0 - 15 |
| Greater Çakmaktepe |
7.3 |
0.02 |
20.2 |
0.01 |
27.5 |
0.01 |
8.7 |
21.32 - 45.58 |
- |
| Stockpiles |
- |
- |
10.3 |
– |
10.3 |
– |
- |
21.32 - 45.58 |
- |
| Total |
13.0 |
0.04 |
40.9 |
0.02 |
53.9 |
0.00 |
27.5 |
21.32 - 45.58 |
0 - 15 |
Notes:
| 1. | The Mineral Reserves were scheduled based on end of October 31, 2023 surface. Small differences between the Mineral Reserve statement
and the production schedule may occur. |
| 2. | The numbers reflect SSR’s attributed share of 80%. SSR owns 80% of both Anagold and Kartaltepe licenses. |
| 3. | Heap Leach Oxide is defined as material <2% total sulfur. |
| 4. | Grind Leach Oxide is defined as material <2% total sulfur. Processing route will be available approximately in 2027. |
| 5. | Sulfide is defined as material ≥2% total sulfur. |
| | 1-19 | |
| SSR Mining Inc. | Çöpler Property S-K 1300 Report | February 12, 2024 SLR Project No.: 138.21581.00006 |
| 6. | At Çöpler and Greater Çakmaktepe - heap leach oxide uses a NSR cut-off value $21.32/t, grind leach uses a
NSR cut-off value $21.77/t while sulfide ore uses a cut-off value of $45.58/t. All cut-off values include allowances for royalty
payable. |
| 7. | Metallurgical gold recoveries for heap leach oxide and grind leach vary between 40-78% and 53-90%, respectively, based on lithology,
while for sulfide it is 81-91% |
| 8. | Metallurgical silver recoveries for heap leach and grind leach oxide vary between 0 and 54% based on lithology. Metallurgical recovery
for sulfide varies between 0 and 3%. |
| 9. | Metallurgical copper recoveries for heap leach and grind leach oxide vary between 0 and 15% based on lithology. Metallurgical recovery
for sulfide is 0%. |
| 10. | Metal prices used to report the Mineral Reserves are $1,450/oz Au, $18.50/oz Ag, and $3.30/lb Cu with allowances for payable deductions,
transport, and royalties. |
| 11. | The point of reference for Mineral Reserves is the point of feed into the processing facility for grind leach and sulfide while for
Heap Leach oxide it is Carbon columns. |
| 12. | Heap leach inventory was mined based on the heap leach cut-off value. |
| 13. | Totals may vary due to rounding. |
| | 1-20 | |
| SSR Mining Inc. | Çöpler Property S-K 1300 Report | February 12, 2024 SLR Project No.: 138.21581.00006 |
The mining method is an open pit method, which includes:
| · | Drill and blast of 5-m high benches, |
| · | Loading by way of excavators and loaders, and |
| · | Haulage by 40-t class-size trucks. |
Open pit mining at the Çöpler project is performed by a
mining contractor and managed by Anagold. The mining contractor, who has been with the Project since it started in 2011 provides equipment
operators, maintenance personnel, line supervisors, equipment, and ancillary facilities required for the mining operation. Anagold provides
management, technical, mine planning, engineering, and grade control.
Anagold currently operates a sulfide process plant and an oxide heap
leach facility. Costs are based on the actual operational costs and the Project budget assumptions.
Pit designs for the Çöpler pit were reviewed and updated
in 2023. The Greater Çakmaktepe pit designs were prepared in 2022 and 2023. Production schedules and costs have been updated based
on recent site performance and updated contracts.
| 1.3.8 | Processing and Recovery Methods |
Processing and recovery methods are determined by sulfur content
in the ore. Oxide ore (<2% sulfur) is processed via a three-stage crushing circuit followed by agglomeration prior to being stacked
on a heap leach. The pregnant leach solution from the heap leach is processed through carbon adsorption, desorption and refining to produce
doré bars. The ore contains cyanide soluble copper that consumes cyanide increasing operating cost. Copper cyanide in the leach
solutions is treated in a sulfidation, acidification, recycling, and thickening (SART) plant which precipitates the copper as copper sulfide
and regenerates sodium cyanide, which is recycled into the leach solutions.
The sulfide processing plant (>2% sulfur ore) comprises a POX
sulfide processing plant, which began operation in 2018 and comprises crushing, grinding, acidulation, pressure oxidation, iron / arsenic
precipitation, gold cyanide leaching, carbon adsorption, carbon desorption and refining. The original sulfide circuit, before the addition
of flotation, demonstrated additional capacity in the crushing, grinding and autoclave circuits. A sulfide flotation circuit was added
to process a portion of the grinding thickener feed to generate a sulfide concentrate that is added to the POX feed to control the sulfide
feed concentration. The flotation tailings containing carbonates bypass the acidulation and sulfide oxidation portion of the plant and
report directly to the cyanide leach feed for recovery of any cyanide soluble gold. Sulfide flotation allows the POX autoclaves to maximize
throughput and sulfide sulfur oxidation capacity and increase overall plant throughput. Tailings are thickened and routed to the TSF.
A new processing facility is being considered at Çöpler.
The proposed process is intended to treat oxide and low sulfur (< 2% sulfur) ores from the Çakmaktepe Ext. open pit
and is a conventional grind leach process. The grind leach process plant is designed to treat 248 tph of ore during 8,059 hours
per year of operation or 92% availability for a total of 2 Mtpa. The operating availability of the crushing section will be 70%. The process
will comprise primary jaw crushing, SAG mill and ball mill grinding closed by hydrocyclones, carbon-in-leach (CIL) cyanidation, carbon
elution, electrowinning, and refining of electrowinning precipitate to produce a final precious metal (doré) product.
| | 1-21 | |
| SSR Mining Inc. | Çöpler Property S-K 1300 Report | February 12, 2024 SLR Project No.: 138.21581.00006 |
Existing Infrastructure
The existing facility infrastructure supports the mine and process areas
of oxide heap leach and sulfide plant. The existing infrastructure, and the tailings storage and heap leach pad area once the planned
expansions for each are complete, will be sufficient for the current Mineral Reserves. The infrastructure for flotation circuit at the
sulfide plant commissioned in 2021 was supported by the existing facility infrastructure with some components modified to meet the addition
of the flotation circuit.
The current leach pad consists of four phases with an estimated capacity
of 63 Mt of oxide ore heap and a nominal maximum heap height of 100 m above the pad liner. An additional phase 5, with a capacity
of 13.8 Mt will be added to accommodate some of the oxide to be mined from Greater Çakmaktepe.
The current TSF is being developed and constructed in stages. The
development of TSF-1 includes seven phases. TSF 1 phase 4 construction has been completed and approval for use was granted in
November 2023 by the Ministry of Environment, Urbanisation and Climate Change (MoEUCC). TSF-1 is permitted through phase 5, and a
design application amendment to provide MoEUCC approval for phases 6 and 7 is planned. Ongoing work in ensuring sufficient long-term
capacity for storage of tailings has been undertaken. Studies by Anagold have determined that the effect of the addition of the
flotation circuit to the sulfide plant would result in an increase in the solids content and improvement in the final settled
density based on an increase in the rate of tailings consolidation. Currently TSF-1 holds 13.3 Mt of tailings as of the Effective
Date of this report and has a design capacity of to 65.8 Mt.
Planned Future Infrastructure
Anagold is investigating TSF sites with the potential to increase
tailings capacity beyond the currently 65.5 Mt design capacity pending environmental, social, and community relations engagements.
WSP is currently working with Anagold to develop PFS-level TSF design options including a scenario to complete a lift in TSF-1 from
1,275 MASL to 1,280 MASL which would provide an expected 77 Mt of capacity which be adequate to contain the expected 73.3 Mt of
tailings anticipated by the end of the LOM.
The markets for gold and silver doré are readily accessed and
available to gold producers. Currently, 100% of the gold and silver is delivered to the Istanbul Gold Refinery. Copper precipitate is
currently produced from the SART plant and sold into local markets in Türkiye.
| 1.3.11 | Environmental Studies, Permitting and Plans, Negotiations, or Agreements with Local Individuals or Groups |
The Çöpler mining and processing operations have a well-established
and effective environmental, social, and permitting management program (10+ years). Site staff is knowledgeable and experienced in site
and regulatory requirements and supported by corporate technical and ESG personnel as well as outside (Turkey and International) technical
experts. Budgets are reasonable and there were no critical path permitting items noted that would limit production and Reserve/Resource
development. A reclamation/closure plan and estimates to perform this activity are in place. The budgets and staffing to perform required
programs are adequate and indicative of site activities, requirements, and responsibilities.
| | 1-22 | |
| SSR Mining Inc. | Çöpler Property S-K 1300 Report | February 12, 2024 SLR Project No.: 138.21581.00006 |
| 1.3.12 | Capital and Operating Cost Estimates |
LOM project capital costs total $636.6 million, which considers all
costs incurred before November 1, 2023, as sunk; the capital costs are summarized in Table 1-4.
Table 1-5: Capital Cost Summary
| Description |
Unit |
Value |
| Growth |
$ million |
475.1 |
| Sustaining |
$ million |
61.3 |
| Final Closure/Reclamation |
$ million |
100.3 |
| Total |
$ million |
636.6 |
The projected LOM unit operating cost estimate is summarized in Table
1-5.
Table 1-6: Average Operating
Costs Unit Rates
| Activity |
Unit |
Avg LOM |
| Mining (contract) |
$/t mined |
2.11 |
| Mining (contract) |
$/t ore processed |
18.04 |
| Processing – All Types |
$/t ore processed |
29.73 |
| General and Administrative |
$/t ore processed |
6.56 |
| VAT1 Payments |
$/t ore processed |
0.13 |
| Total Operating Costs |
$/t ore processed |
54.45 |
Notes:
| 1. | Value-Added Tax payments through 2025 |
| | 1-23 | |
| SSR Mining Inc. | Çöpler Property S-K 1300 Report | February 12, 2024 SLR Project No.: 138.21581.00006 |
SLR International Corporation (SLR) was retained by SSR Mining Inc.
(SSR) to prepare an independent Technical Report Summary (TRS) on the Çöpler Property (the Property or the Project), located
in Erzincan Province, Türkiye. The Çöpler Project consists of several mining licenses covering Mineral Resources on the
Çöpler, Greater Çakmaktepe, and Bayramdere deposits, Mineral Reserves on the Çöpler and Greater Çakmaktepe
open pit mines, oxide and sulfide processing facilities, and supporting infrastructure.
The purpose of this TRS is to disclose the results of the Mineral Resource
and Mineral Reserve estimates for the Project with an effective date of October 31, 2023. This TRS conforms to United States Securities
and Exchange Commission’s (SEC) Modernized Property Disclosure Requirements for Mining Registrants as described in Subpart 229.1300
of Regulation S-K, Disclosure by Registrants Engaged in Mining Operations (S-K 1300) and Item 601 (b)(96) Technical Report Summary.
SSR is a gold mining company with four producing assets located in the
USA, Türkiye, Canada, and Argentina, and with development and exploration assets in the USA, Türkiye, and Canada. SSR is listed
on the Nasdaq Stock Exchange (NASDAQ: SSRM), the Toronto Stock Exchange (TSX: SSRM), and the Australian Stock Exchange (ASX: SSR).
The Çöpler property area is owned and operated by Anagold
Madencilik Sanayi ve Ticaret Anonim Şirketi (Anagold). SSR controls 80% of the shares of Anagold, Lidya Madencilik Sanayi ve Ticaret
A.Ş. (Lidya) controls 18.5%, and a bank wholly owned by Çalık Holdings A.Ş. holds the remaining 1.5% of Anagold.
The Greater Çakmaktepe property area is wholly owned by Kartaltepe
Madencilik Sanayi ve Ticaret Anonim Şirketi (Kartaltepe). SSR controls 80% of the shares of Kartaltepe and Lidya holds the remaining
20% of Kartaltepe.
This TRS was prepared by qualified persons (QPs), as defined by S-K
1300, from SLR, RSC Consulting Ltd. (RSC), Ausenco Services Pty Ltd. (Ausenco), and WSP USA Inc. (WSP).
SLR QPs visited the Project on August 29 to 31, 2023. During the site
visit, the SLR QPs received a Project overview by site management with specific activities as follows:
| · | SLR’s QP for Mining and Mineral Reserves visited production, development, and critical infrastructure areas in the open pit
mine. Both the Çöpler and Çakmaktepe pits were visited where discussions were carried out on the mining cycle, productivities,
dilution, and mining recovery. The QP discussed mining methods, mine economics, planning and scheduling activities, and geotechnical procedures
with relevant subject matter experts. In addition, the mining QP toured the tailings storage facility (TSF) with the WSP site engineer. |
| · | SLR’s QP for Process and Metallurgical Engineer visited the mineral processing facilities including 1) heap leach facilities:
three stage crushing, agglomeration and conveying systems, heap leach pads and ponds, carbon adsorption and desorption, sulfidation, acidification,
recycling and thickening (SART) for copper precipitation and cyanide recovery, and electrowinning; and 2) pressure oxidation (POX) sulfide
processing facilities including process control room, crushing, grinding, sulfide flotation, acidulation, autoclave systems, neutralization,
carbon in pulp cyanidation, cyanide destruction, neutralization, tailings thickening and high pressure pumping systems, carbon elution
and electrowinning. The QP also toured all of the mine pits, ore storage, stockpiling and blending, tailings storage facilities (TSF),
reagent mixing and storage and laboratories. Meetings were then held with the metallurgists to discuss the flowsheets, laboratory, and
plant metallurgical testing, and operating and maintenance information. |
| | 2-1 | |
| SSR Mining Inc. | Çöpler Property S-K 1300 Report | February 12, 2024 SLR Project No.: 138.21581.00006 |
| · | SLR’s Project Manager and QP for Economics visited the main operational facilities along with SLR’s QPs for mining and
processing, but also had additional discussions with site financial and environmental personnel as well as geological staff to understand
SSR’s future exploration and development strategy to sustain and expand mine production. |
The RSC QP for Geology and Mineral Resource estimation visited the site
from April 14 to 17, 2023, and September 1 to 15, 2023. The RSC QP reviewed the Project geology, standard operating procedures (SOPs),
collar locations, downhole surveys, logs, core, pulps, and laboratory certificates. The RSC QP checked database entries against logs and
chip trays, core and pulp samples retained on site. The WSP QP for tailings management most recently visited the site on November 3 to
10, 2022, and has visited the site annually since 2012. The WSP QP visited the TSF-1 as part of ongoing annual dam safety inspections
and in support of the Engineer-of-Record (EoR) duties with other WSP responsible staff. Potential identified TSF sites were also visited
as were the existing TSF and sulfide plant infrastructure such as the tailings pipeline corridor, overdrain-underdrain ponds, dump tank,
and the sulfide plant area. Meetings were held with staff to review general construction progress, the overall TSF and site water balance,
quality assurance records, deposition plans, monitoring data, issues related to source of limestone for future construction, and the construction
of the Sabirli Village Road.
Representatives of Ausenco visited the Project from July 3 to 11, 2023.
The site visit included briefings with corporate, mine, processing, maintenance, and projects personnel, and site inspections of the current
processing plant and locations for future processing infrastructure. The Ausenco QP has not visited the site.
Table 2-1 lists the consulting companies whose personnel are QPs
in this Report and the sections for which they are responsible.
Table 2-1: Consulting Companies
Which Acted as Qualified Persons in Preparing this Report
| Qualified Person Firms |
Report Sections |
| SLR International Corporation |
1.1,
1.1.1.2, 1.1.1.3, 1.1.1.5, 1.1.1.6, 1.1.2.2, 1.1.2.3, 1.1.2.5, 1.1.2.6, 1.2, 1.3.1, 1.3.2, 1.3.7–1.3.8, 1.3.10–1.3.12,
2–5, 7.1 and 7.2, 10 excluding 10.2 and 10.4.1, 12, 13, 14 excluding 14.3, 15.1–15.8, 16–21, 22.2–22.3,
22.5–22.6, 23.2–23.3, 23.5–23.6, 25 to 27 |
| RSC Consulting Ltd. |
1.3.3–1.3.5, 6, 7 except for 7.1 and 7.2, 8, 9, 11, 22.1, 23.1 |
| WSP
USA Inc. |
1.1.1.4, 1.1.2.4, 1.3.9, 15.9 (Tailings Storage Facility), 22.4, 23.4 |
| Ausenco
Services Pty Ltd. |
10.2, 10.4.1, 14.3 |
| All |
24 |
| 2.2 | Sources of Information |
During the preparation of this TRS, discussions were held with personnel
from SSR, Anagold, and SRK Consulting Inc.:
| | 2-2 | |
| SSR Mining Inc. | Çöpler Property S-K 1300 Report | February 12, 2024 SLR Project No.: 138.21581.00006 |
| · | John Ebbett, EVP Growth and Innovation, SSR |
| · | Rex Brommecker, SVP Exploration and Geology, SSR |
| · | Jonathan Holden, VP Innovation and Technical Services, SSR |
| · | John Harmse, Capital Projects Contractor, SSR |
| · | Jered Kullos, Principal Mine Engineer, SSR |
| · | Bill Patterson, Studies Contractor, SSR |
| · | Micaela Muro, Study Manager, SSR |
| · | Karthik Rathnam, Director, Resource Geology, SSR |
| · | Osman Uludağ, Director, Resource Development, SSR |
| · | Brandon Heser, Director, Mine Technical Services, SSR |
| · | Nitin Laddha, Business Evaluation Manager, SSR |
| · | Volkan Aşgın, Resource Development Manager, SSR |
| · | Seyfettin Genç, Resource Geologist, SSR |
| · | Can Serdar Hastürk, Environmental Manager, Anagold |
| · | Sera Tuncay, Environmental Engineer, Anagold |
| · | Seda Çağatay, Mineral and Land Rights Manager, Anagold |
| · | Can Serdar Hastürk, Environmental Manager, Anagold |
| · | Goktuğ Özer, Mine Planning Chief, Anagold |
| · | Faruk Değirminci, Sulfide Plant Process Manager, Anagold |
| · | Murat Bayrakdar, Oxide Plant Process Manager, Anagold |
| · | Ali Sert, Technical Services Manager, Anagold |
| · | Benjamin Fuller, Senior Project Engineer, Anagold |
| · | Goktuğ Evin, Hydrogeology Principal, SRK |
This report is an update of a Technical Report Summary with a report
date of September 29, 2022 (OreWin, 2022).
The documentation reviewed, and other sources of information, are listed
at the end of this TRS in Section 24.0 References.
| | 2-3 | |
| SSR Mining Inc. | Çöpler Property S-K 1300 Report | February 12, 2024 SLR Project No.: 138.21581.00006 |
Units of measurement used in this TRS conform to the metric system.
All currency in this TRS is US dollars (US$) unless otherwise noted.
| μ |
micron |
kVA |
kilovolt-amperes |
| μg |
microgram |
kW |
kilowatt |
| a |
annum |
kWh |
kilowatt-hour |
| A |
ampere |
L |
litre |
| bbl |
barrels |
lb |
pound |
| Btu |
British thermal units |
L/s |
litres per second |
| °C |
degree Celsius |
L/h/m2 |
liters per hour per square meter |
| C$ |
Canadian dollars |
m |
metre |
| cal |
calorie |
M |
mega (million); molar |
| cfm |
cubic feet per minute |
m2 |
square metre |
| cm |
centimetre |
m3 |
cubic metre |
| cm2 |
square centimetre |
MASL |
metres above sea level |
| d |
day |
m3/h |
cubic metres per hour |
| dia |
diameter |
mi |
mile |
| dmt |
dry metric tonne |
min |
minute |
| dwt |
dead-weight ton |
μm |
micrometre |
| °F |
degree Fahrenheit |
mm |
millimetre |
| ft |
foot |
mph |
miles per hour |
| ft2 |
square foot |
MVA |
megavolt-amperes |
| ft3 |
cubic foot |
MW |
megawatt |
| ft/s |
foot per second |
MWh |
megawatt-hour |
| g |
gram |
oz |
troy ounce (31.1035 g) |
| G |
giga (billion) |
oz/st, opt |
ounce per short ton |
| gal |
US gallon |
ppb |
part per billion |
| g/L |
gram per litre |
ppm |
part per million |
| gpm |
US gallons per minute |
psia |
pound per square inch absolute |
| g/t |
gram per tonne |
psig |
pound per square inch gauge |
| gr/ft3 |
grain per cubic foot |
RL |
relative elevation |
| gr/m3 |
grain per cubic meter |
s |
second |
| ha |
hectare |
st |
short ton |
| hp |
horsepower |
stpa |
short ton per year |
| h |
hour |
stpd |
short ton per day |
| Hz |
hertz |
t |
metric tonne |
| in. |
inch |
tpa |
metric tonne per year |
| in2 |
square inch |
tpd |
metric tonne per day |
| J |
joule |
US$ |
United States dollar |
| k |
kilo (thousand) |
V |
volt |
| kcal |
kilocalorie |
W |
watt |
| kg |
kilogram |
wmt |
wet metric tonne |
| km |
kilometer |
wt% |
weight percent |
| km2 |
square kilometer |
yd3 |
cubic yard |
| km/h |
kilometer per hour |
yr |
year |
| kPa |
kilopascal |
|
|
| | 2-4 | |
| SSR Mining Inc. | Çöpler Property S-K 1300 Report | February 12, 2024 SLR Project No.: 138.21581.00006 |
The Project is located in east central Türkiye (Figure 3-1),
120 km west of the city of Erzincan, in Erzincan Province, 40 km east of the iron-mining city of Divriği, and 550 km east of Türkiye’s
capital city, Ankara. The nearest urban centre, Iliç, is located six kilometres east of the current Çöpler pit.
The Project uses the European 1950 (E1950) datum coordinate system,
which is a Turkish Government requirement. The Project is in UTM6 zone 37N of the E1950 coordinate system; its centroid is situated at
approximately 459,975 mE and 4,364,420 mN and has an approximate elevation of 1,160 m above mean sea level (MASL).
The Çöpler mining operations are located 900 m south-west
of the Iliç district centre, 650 m south of the Bağıştaş-Bahçe villages, 250 m south of the Çöpler
village, and 180 m north of the Sabırlı Village. The Project site lies within the licence areas numbered 847, 49729, and 20067313
(Figure 3-2), which have been granted by the General Directorate of Mining and Petroleum Affairs (MAPEG).
The Greater Çakmaktepe mining operation is located six kilometres
east of the Çöpler pit and 1.5-km south of Iliç. The Greater Çakmaktepe pits are located within Kartaltepe Licence
1054 and Anagold Licenses 49729 and 20067313. Ore mined at Greater Çakmaktepe is hauled and treated at the Çöpler facilities.
Figure 3-3 shows the location of the Çöpler and Greater Çakmaktepe operations in relation to the nearest population
centers.
The Çöpler operations currently permitted Environmental
Impact Assessment (EIA) boundary incorporates 1,747 ha, whereas the footprint of the mine units covers a combined 1,089 ha. The currently
permitted Greater Çakmaktepe EIA boundary incorporates 360 ha, after approval of 2nd Capacity Increase EIA Permit Area
on March 30, 2022. An EIA for a 3rd capacity expansion for Çakmaktepe is being prepared that is anticipated to increase the Greater
Çakmaktepe EIA boundary to 486 ha.
| | 3-1 | |
| SSR Mining Inc. | Çöpler Property S-K 1300 Report | February 12, 2024 SLR Project No.: 138.21581.00006 |
Figure 3-1: Location Map
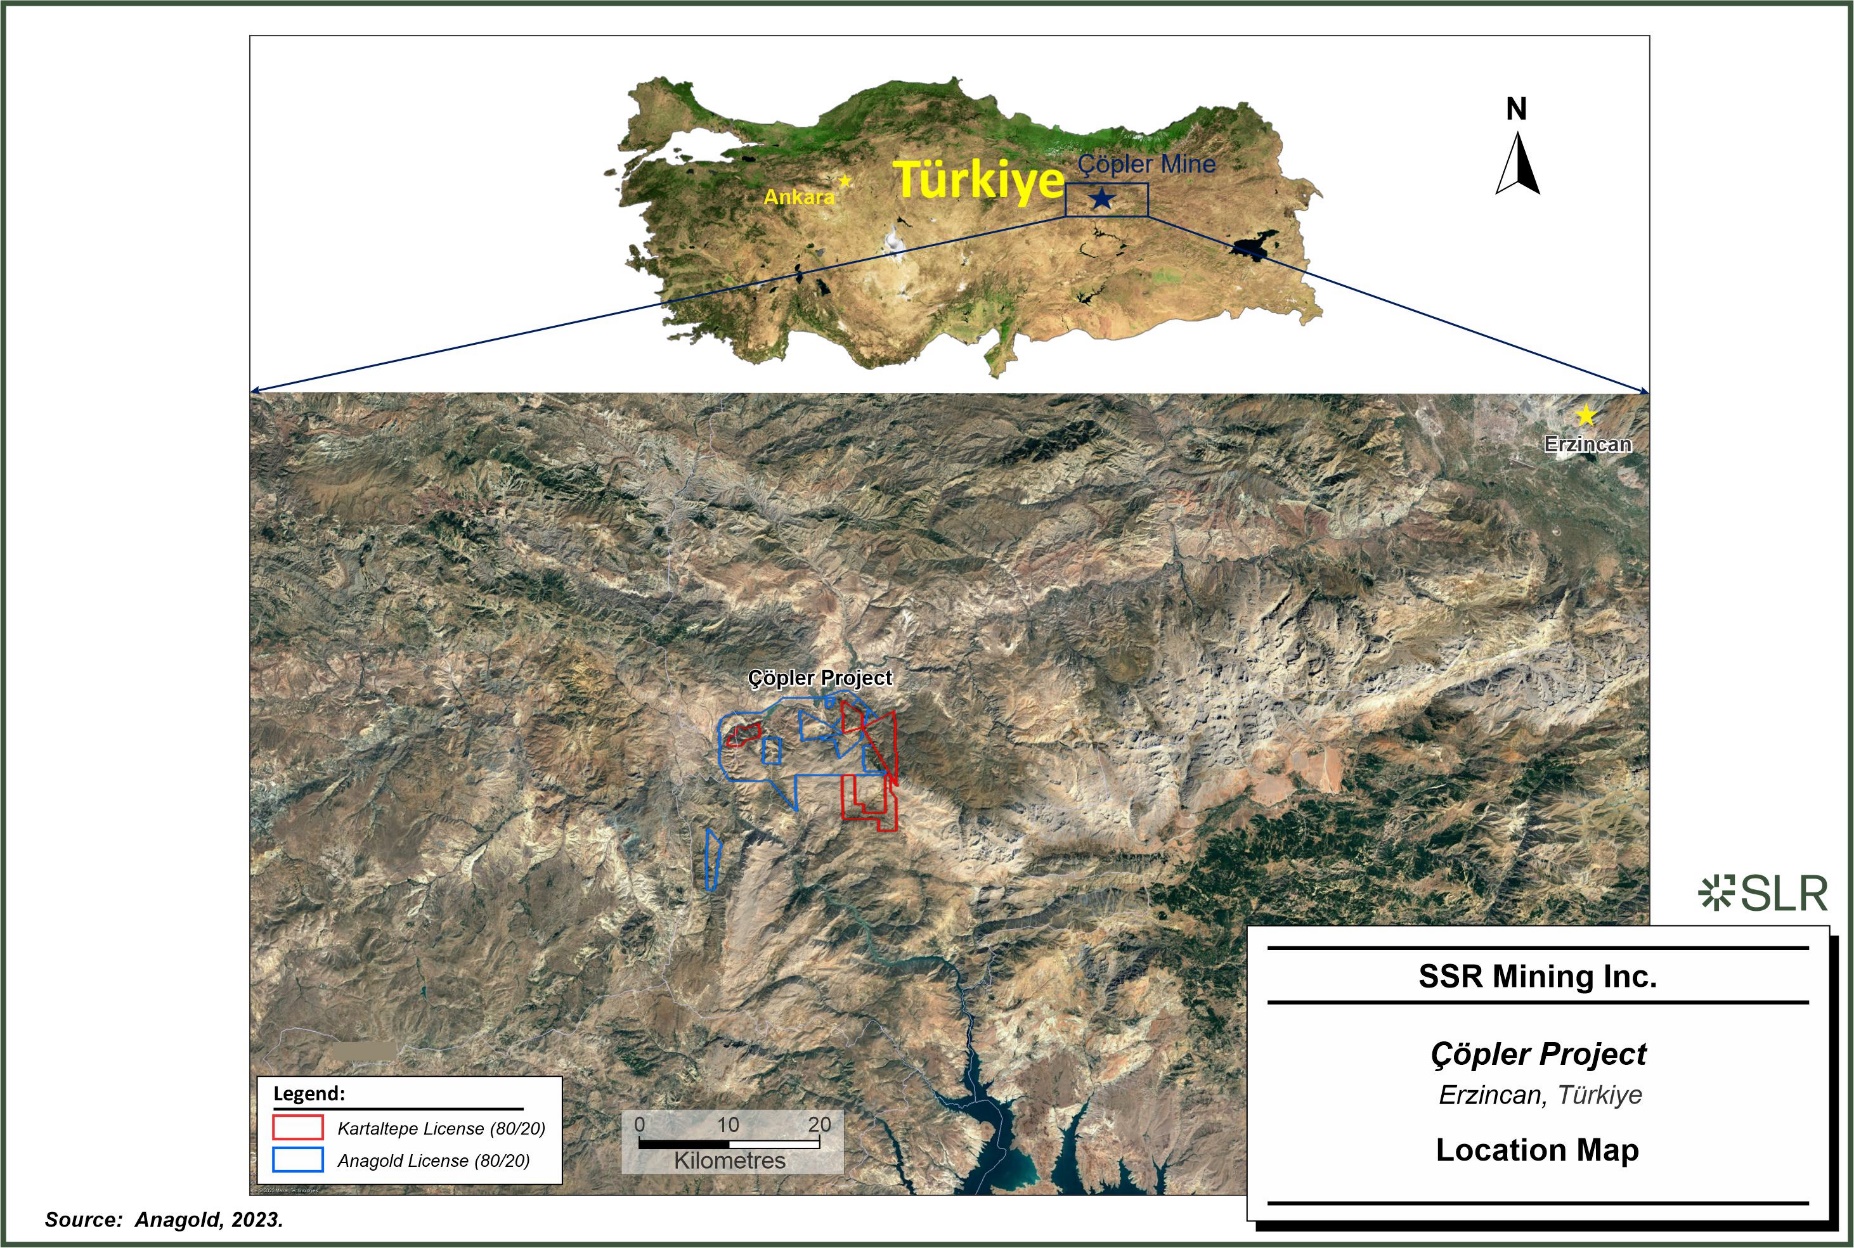
SSR
Mining Inc. Copler Project Erzincan, Turkiye Location Map
| | 3-2 | |
| SSR Mining Inc. | Çöpler Property S-K 1300 Report | February 12, 2024 SLR Project No.: 138.21581.00006 |
Figure 3-2: Çöpler
Project License and Surrounding Licenses (UTM Grid)
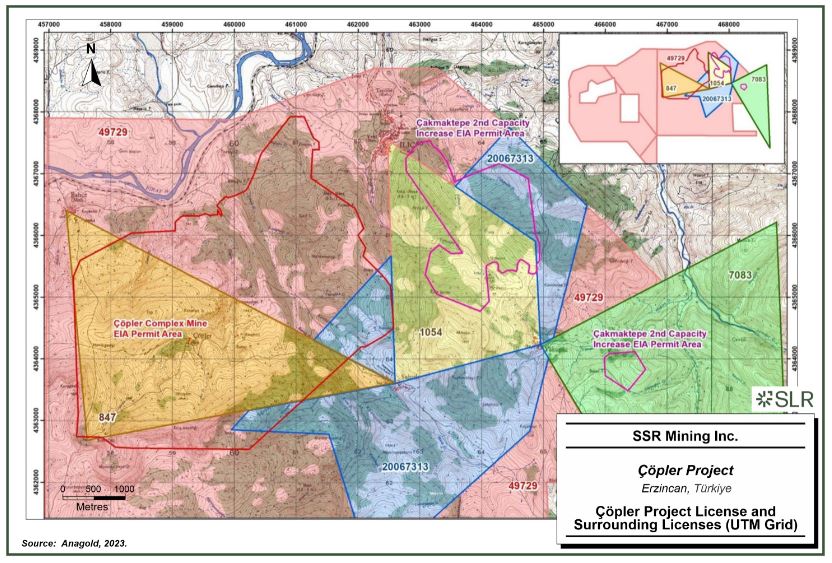
SSR
Mining Inc. Copler Project Erzincan, Turkiye Copler Project License and Surrounding Licenses (Utm Grid)
| | 3-3 | |
| SSR Mining Inc. | Çöpler Property S-K 1300 Report | February 12, 2024 SLR Project No.: 138.21581.00006 |
Figure 3-3: Çöpler
Operations and Surrounding Population Centers
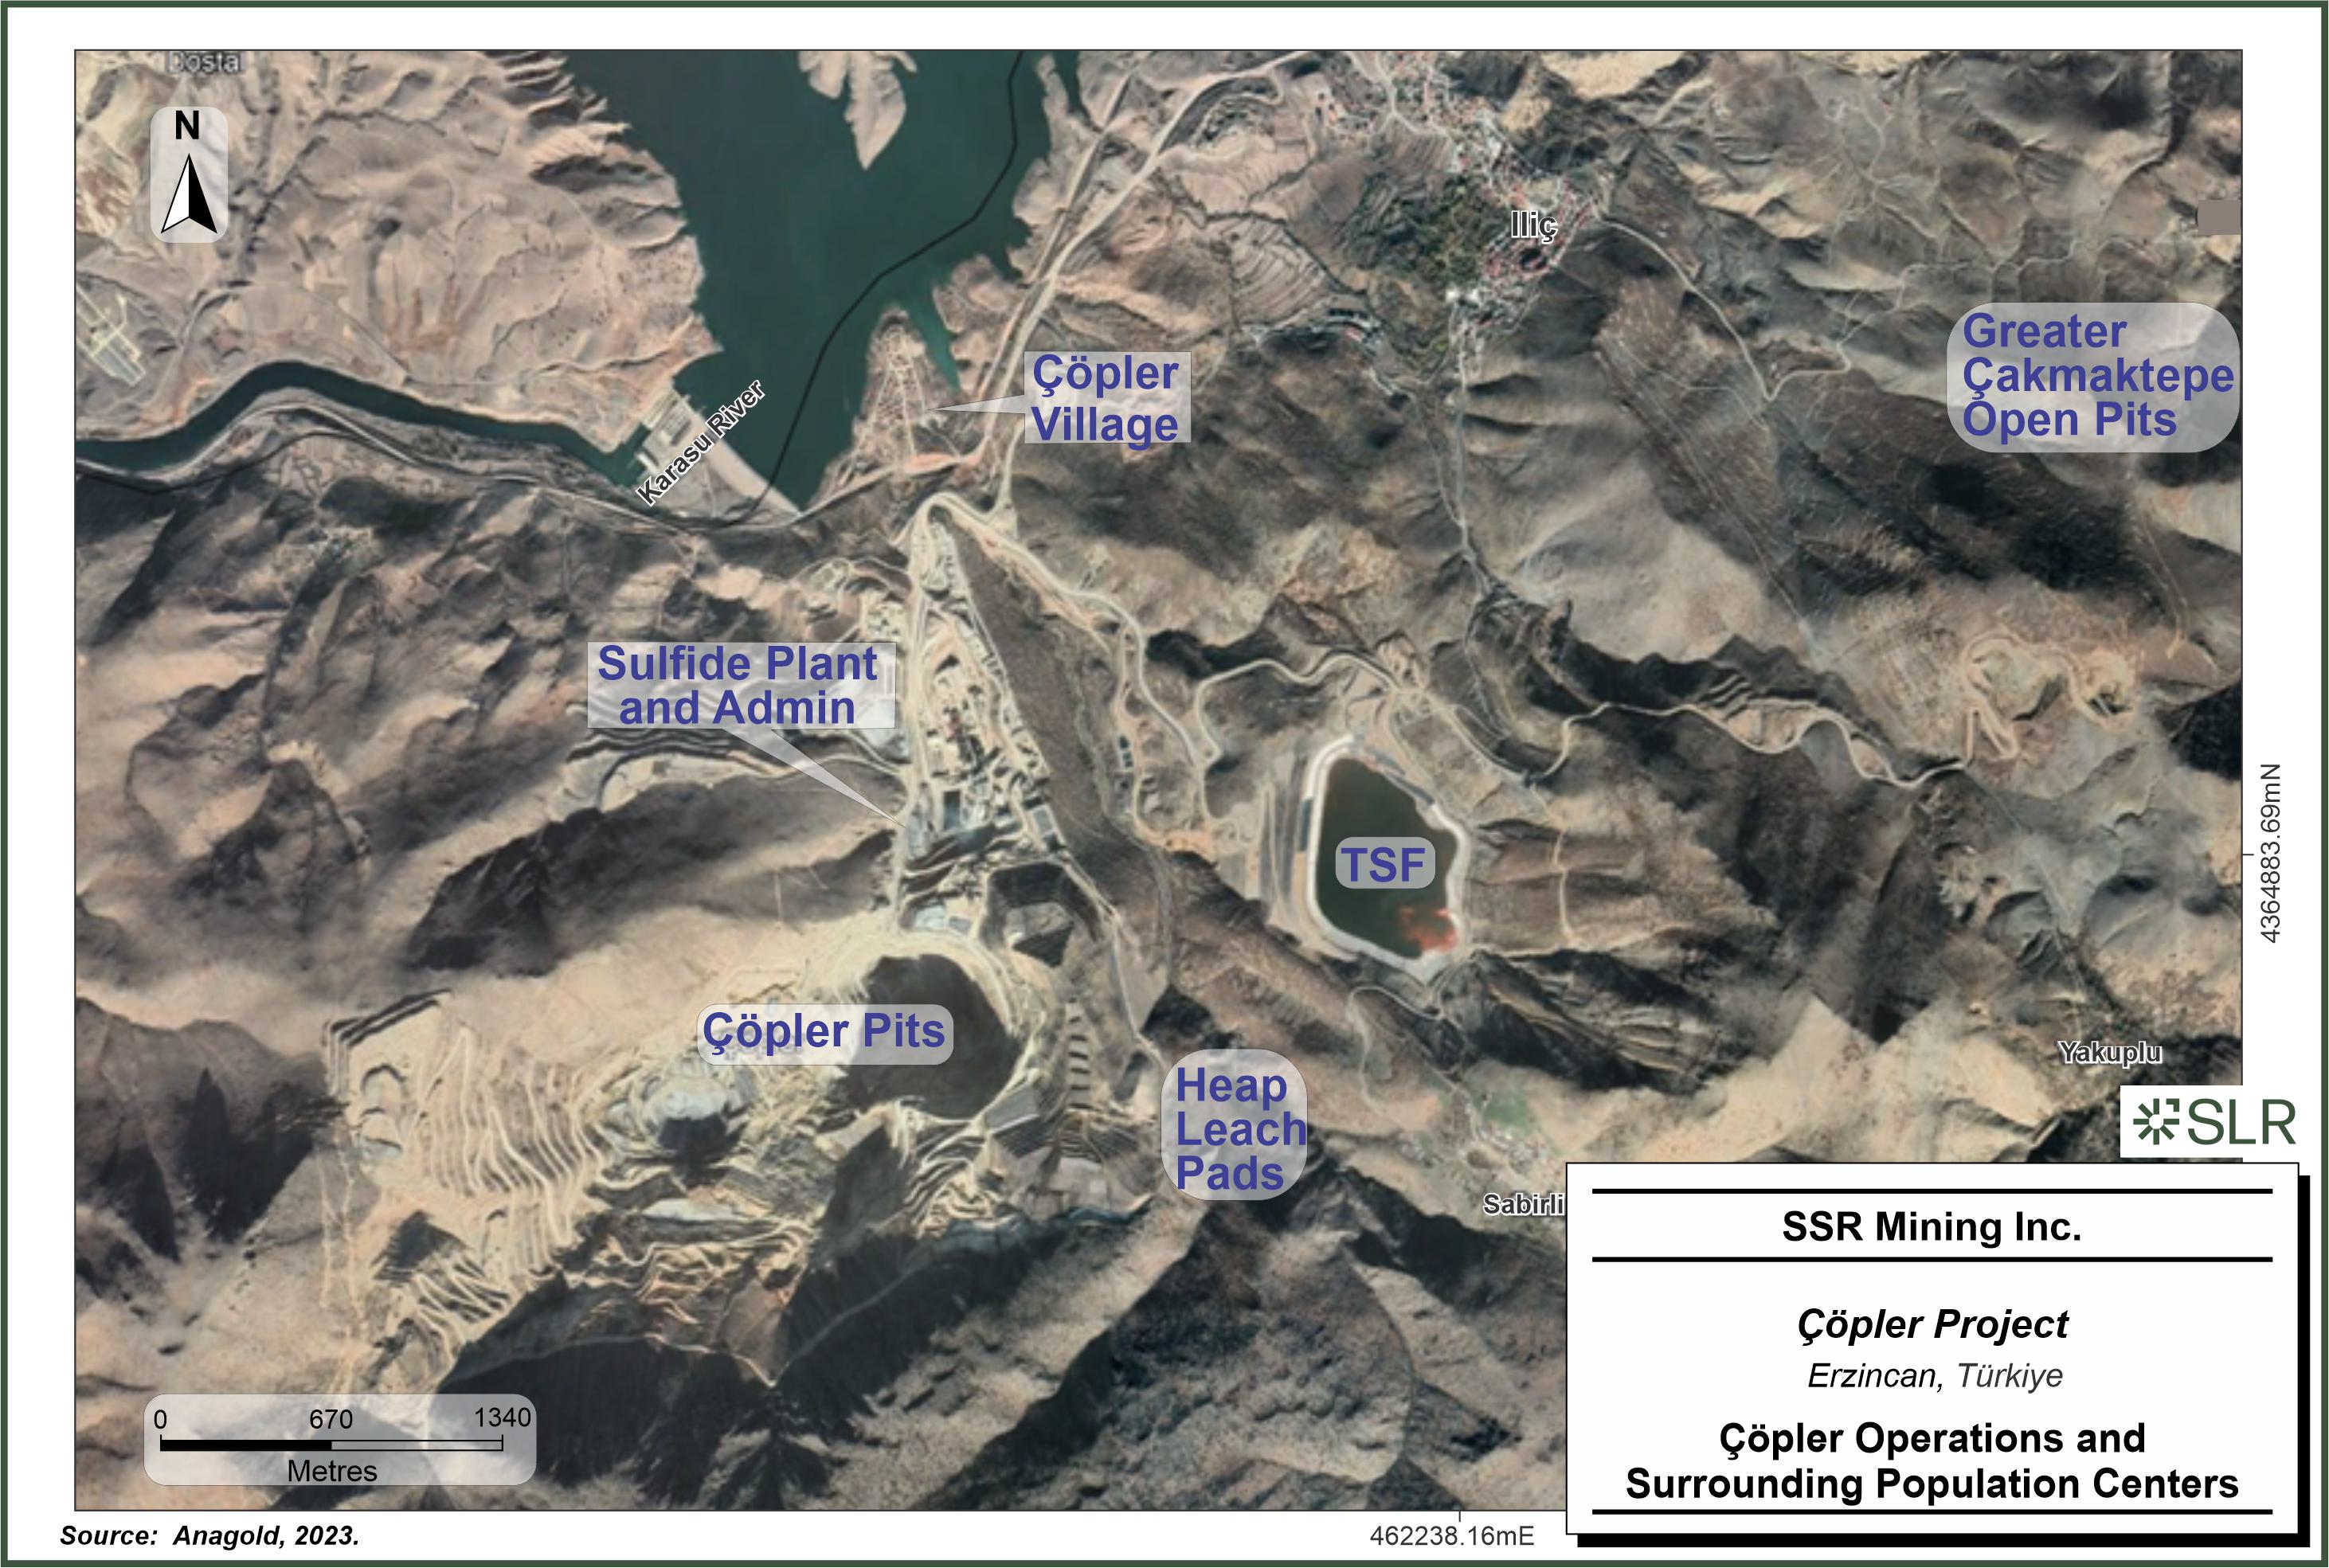
SSR
Mining Inc. Copler Project Erzincan, Turkiye Copler Operations and Surrounding Population Centers
| | 3-4 | |
| SSR Mining Inc. | Çöpler Property S-K 1300 Report | February 12, 2024 SLR Project No.: 138.21581.00006 |
The Çöpler property is owned and operated by Anagold. SSR
controls 80% of the shares of Anagold, Lidya controls 18.5%, and a bank wholly owned by Çalık Holdings A.Ş., holds the
remaining 1.5%. The license that hosts the Çöpler deposit, including the Mineral Resources and Mineral Reserves, is wholly
owned by Anagold.
Exploration tenures surrounding the Project area and mining at Greater
Çakmaktepe are subject to joint venture agreements between SSR and Lidya that have varying interest proportions. SSR controls
80% of the shares of Kartaltepe Madencilik Sanayi ve Ticaret Anonim Şirketi (Kartaltepe) and 30% of Tunçpinar Madencilik Sanayi
ve Ticaret Anonim Şirketi (Tunçpinar). Lidya holds the remaining 20% of Kartaltepe and 70% of the Tunçpınar.
The Greater Çakmaktepe property is owned by both Kartaltepe and
Anagold. The Mavialtin, Bayramdere, Aslantepe, and Findiklidere prospects have areas owned by Kartaltepe.
Anagold holds the exclusive right to engage in mining activities within
the Çöpler property area. Anagold holds six granted licenses (Table 3-1) covering a combined area of approximately 16,600
ha (Figure 3-4). Mineral title is held in the name of Anagold. Kartaltepe holds six licenses covering approximately 7,250 ha. The
total near-mine tenement package is approximately 23,850 ha. Anagold currently holds sufficient surface rights to allow continued operation
of the mining operation in the Base Case. The Çöpler property area is held by SSR (80%), Lidya (18.5%), and a bank wholly
owned by Çalık Holdings A.Ş. (1.5%).
The granted licenses include two clay borrow pit licenses, numbered
76817 and 76818, that have been extended to July 15, 2029.
The Çöpler open pit mine and associated infrastructure are
hosted within the triangular-shaped concession 847. Property facilities are located within the Licenses 49729 and 20067313. Anagold also
holds License 50237, and the license has been extended until March 21, 2028.
Anagold has confirmed that charges and administrative expenses due to
the Turkish Ministry of Energy and Natural Resources, Directorate General of Mining and Petroleum Affairs (MAPEG) have been paid, and
all Anagold licenses are currently in good standing.
Three Kartaltepe licenses (200707602, 200707605, and 200707606) were
combined, and operation license 90047 was granted, on November 22, 2022. Kartaltepe also maintains Licenses 58473, 57004, and 7161. The
Greater Çakmaktepe property area is owned by Kartaltepe, which is held by SSR (80%) and Lidya (20%).
The mined Greater Çakmaktepe pits are all under Kartaltepe License
1054 and Anagold Licenses 49729 and 20067313. The Bayramdere prospect is on Kartaltepe Licence 7083.
All Kartaltepe licenses are currently in good standing.
| | 3-5 | |
| SSR Mining Inc. | Çöpler Property S-K 1300 Report | February 12, 2024 SLR Project No.: 138.21581.00006 |
Table 3-1: Granted Licenses
and Operating Permits
| Province |
Town |
Village |
Registration No. |
License No. |
License Area (ha) |
License Type |
Licence Group |
Operation Permit |
Operation Permit Area (ha) |
License Issue Date |
License Expiry Date |
Licensee |
Project |
| Erzincan |
İliç |
Çöpler |
1027313 |
847 |
941.92 |
Operation |
IV (c) |
Au+Ag+Cu+Hg, Mn |
941.92 |
6/Nov/1986 |
6/Nov/2026 |
Anagold |
Çöpler/
Çöpler Saddle |
| Erzincan |
İliç |
Çöpler |
2384036 |
49729 |
13,747.51 |
Operation |
IV (c) |
Au+Ag+Cu+Mo |
1,100.99 |
4/Aug/2016 |
4/Aug/2026 |
Anagold |
Çakmaktepe/
Çöpler/
Çöpler Saddle |
| Erzincan |
İliç |
Ortatepe |
2386272 |
50237 |
600.00 |
Operation |
IV (c) |
Au |
18.07 |
21/Mar/2018 |
21/Mar/2028 |
Anagold |
Demirmağara |
| Erzincan |
İliç |
Sabırlı |
3095732 |
20067313 |
1,184.91 |
Operation |
IV (c) |
Au+Ag+Cu |
406.57 |
25/Oct/2021 |
25/Oct/2031 |
Anagold |
Çakmaktepe/ Çöpler |
| Erzincan |
İliç |
Çöpler |
3201587 |
76817 |
49.32 |
Operation |
I (b) |
Clay |
37.05 |
15/July/2019 |
15/July/2029 |
Anagold |
Clay Licence |
| Erzincan |
İliç |
Çöpler |
3201588 |
76818 |
49.09 |
Operation |
I (b) |
Clay |
49.09 |
15/July/2019 |
15/July/2029 |
Anagold |
Clay Licence |
| Total |
|
|
|
|
16,572.75 |
|
|
|
|
|
|
|
|
| Erzincan |
Kemaliye |
Kabataş |
2450158 |
57004 |
1,564.69 |
Operation |
IV (c) |
Au+Cu |
931.87 |
9/Sep/2022 |
9/Sep/2027 |
Kartaltepe |
Mavidere |
| Erzincan |
Kemaliye |
Kabataş |
3439805 |
90047 |
1,999.33 |
Operation |
IV (a) |
– |
– |
22/Nov/2022 |
22/Nov/2032 |
Kartaltepe |
Mavidere |
| Erzincan |
İliç |
Yakuplu |
1032544 |
58473 |
606.60 |
Operation |
IV (c) |
Fe+Cu |
7.54 |
16/Nov/2017 |
16/Nov/2027 |
Kartaltepe |
Fındıklıdere |
| Erzincan |
İliç |
Yakuplu |
1032719 |
7083 |
1,756.55 |
Operation |
IV (c) |
Au+Ag+Cu+Fe, Cr |
175.00
507.47 |
2/Apr/2021 |
2/Apr/2031 |
Kartaltepe |
Bayramdere/
Aslantepe/
Sarıdere |
| Erzincan |
İliç |
Yakuplu |
1027026 |
1054 |
660.87 |
Operation |
IV (c) |
Au+Ag+Cu+Fe |
660.87 |
30/July/2017 |
30/July/2027 |
Kartaltepe |
Çakmaktepe |
| Erzincan |
İliç |
Ortatepe |
2003094 |
7161 |
642.68 |
Operation |
IV (c) |
Au+Cu+Fe |
214.65 |
5/Oct/2022 |
5/Oct/2027 |
Kartaltepe |
Ortatepe |
| Total |
|
|
|
|
7,230.72 |
|
|
|
|
|
|
|
|
| | 3-6 | |
| SSR Mining Inc. | Çöpler Property S-K 1300 Report | February 12, 2024 SLR Project No.: 138.21581.00006 |
Figure 3-4: Land Tenure Layout
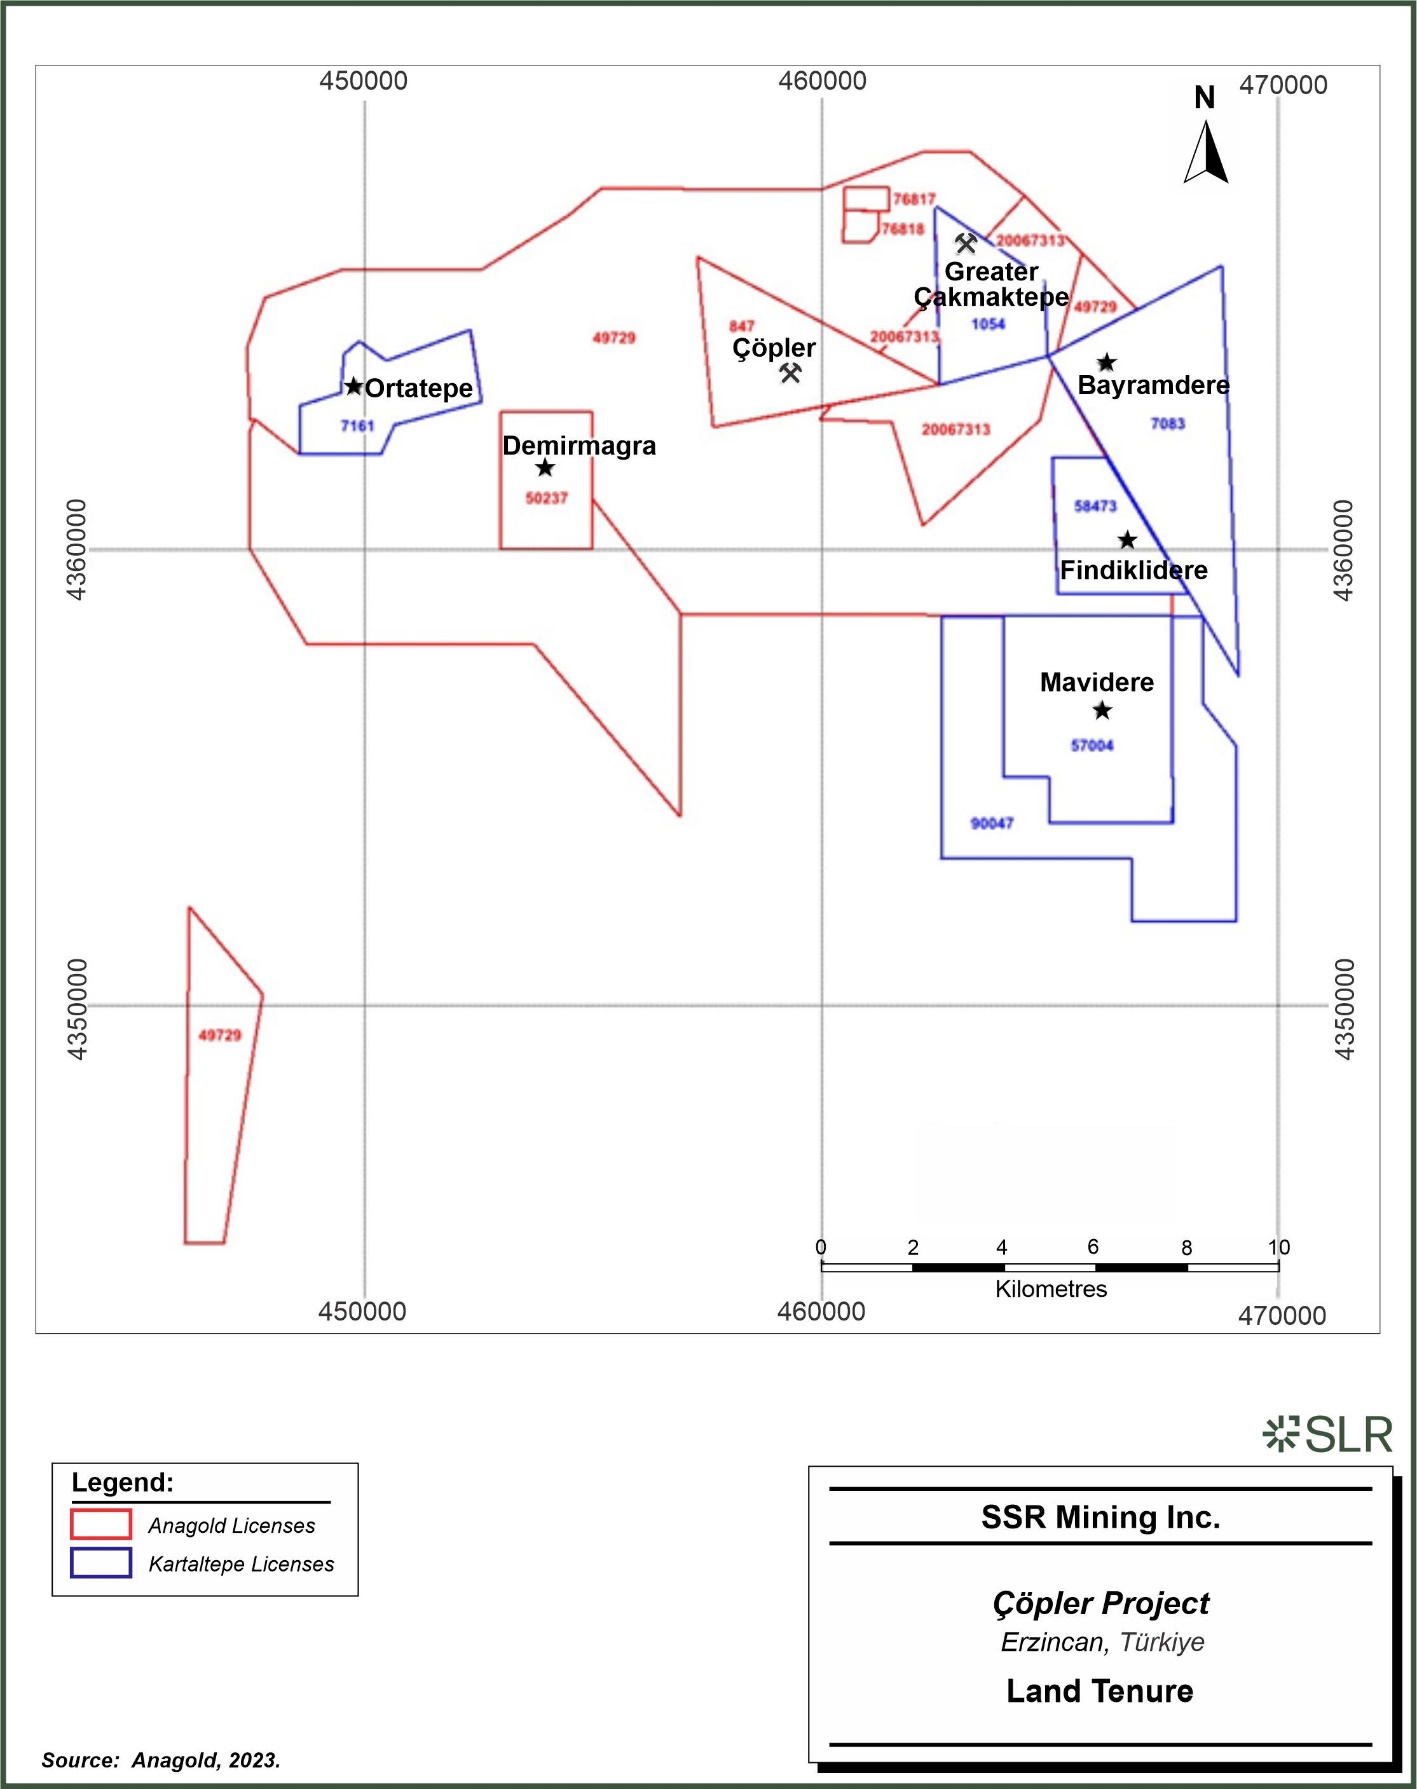
SSR
Mining Inc. Copler Project Erzincan, Turkiye Land Tenure
| | 3-7 | |
| SSR Mining Inc. | Çöpler Property S-K 1300 Report | February 12, 2024 SLR Project No.: 138.21581.00006 |
Anagold and Kartaltepe currently hold sufficient surface rights to support
the Base Case, which includes oxide heap leach mining operations, sulfide processing, and tailings disposal.
| 3.3 | Encumbrances and Royalties |
The following subsection has been modified from OreWin (2022).
At present, there are no known environmental liabilities to which the
Project is subject. Further discussion on environmental matters with respect to the Project is provided in Section Environmental Studies,
Permitting, and Social Plans, Negotiations, or Agreements with Local Individuals or Groups.
Under Turkish Mining Law, the royalty rate for precious metals is variable
and tied to metal prices. The Çöpler project is subject to a mineral production royalty that is based on a sliding scale to
gold price and is payable to the Turkish government. In September 2020 a presidential decree was issued, increasing the prescribed royalty
rates by 25%.
Table 3-2 details the relevant prescribed royalty rates along with
the revised rates following the September 2020 presidential decree. The royalties are calculated on total revenue with deductions allowed
for processing and haulage costs of ore. Revenue from by-products (silver and copper) is included in the total revenue used for royalty
calculations.
The royalty rates outlined in Table 3-2 apply to gold production
from heap leaching. Royalty rates are reduced by 40% for ore processed in country, as an incentive to process ore locally. As the Çöpler
Project produces its gold doré on site, the Çöpler Project is eligible for a 40% reduction to the royalty rate for
gold produced from pressure oxidation (POX) processing.
Table 3-2: Gold Royalty Rates
Metal Price
($/oz Gold) |
Prescribed Royalty Rate (%) |
Royalty After 40% In-Country Processing Incentive (%) |
| From |
To |
| 0 |
800 |
1.25 |
0.75 |
| 800 |
900 |
2.50 |
1.50 |
| 900 |
1,000 |
3.75 |
2.25 |
| 1,000 |
1,100 |
5.00 |
3.00 |
| 1,100 |
1,200 |
6.25 |
3.75 |
| 1,200 |
1,300 |
7.50 |
4.50 |
| 1,300 |
1,450 |
8.75 |
5.25 |
| 1,450 |
1,500 |
10.00 |
6.00 |
| 1,500 |
1,600 |
11.25 |
6.75 |
| 1,600 |
1,700 |
12.50 |
7.50 |
| 1,700 |
1,800 |
13.75 |
8.25 |
| 1,800 |
1,900 |
15.00 |
9.00 |
| 1,900 |
2,000 |
16.25 |
9.75 |
| 2,000 |
2,100 |
17.50 |
10.50 |
| 2,100 |
+ |
18.75 |
11.25 |
| | 3-8 | |
| SSR Mining Inc. | Çöpler Property S-K 1300 Report | February 12, 2024 SLR Project No.: 138.21581.00006 |
The Çöpler Project effective life-of-mine (LOM) royalty
rate based on the financial model metal price assumptions and applicable deductions is approximately 8.4%.
Other than the royalty payments, there are no other known back-in rights,
payments, or other agreements and encumbrances to which the Project is subject.
| 3.4 | Required Permits and Status |
The following subsections have been modified from OreWin
(2022).
The EIA permitting for the Çöpler Mine oxide ore was completed
in April 2008 with the issuance of an EIA positive certificate. All the necessary operation permits have already been obtained for the
oxide inventory, as follows:
| · | Explosive and explosive storage permit |
| · | Permit for water abstraction from groundwater sources |
| · | EIA positive certificate for power transmission line construction |
| · | Environmental permits and licenses |
| · | Land acquisition permits for forest areas and pasturelands |
| · | Workplace opening permit |
The EIA permitting process for the Sulfide Expansion Project was commenced
on April 7, 2014, and completed with the receipt of an ’EIA Positive Statement‘ on December 24, 2014. In addition to an EIA
approval, other permits required for the Sulfide Expansion Project involved an expanded workplace opening permit, additional operating
permits, and land acquisition permits for forest areas and pasture lands.
Additional EIA studies conducted and environmental permits received
for the Çöpler and Greater Çakmaktepe mine since the start of the gold mining operations are as follows:
| · | EIA permit dated April 10, 2012, for the operation of mobile crushing plant. |
| · | EIA permit dated May 17, 2012, for the capacity expansion involving: |
| · | Increasing operation rate to 23,500 tpd. |
| · | Increasing Çöpler waste rock dump (WRD) footprint area. |
| · | Adding a sulfidization, acidification, recovery, and thickening (SART) plant to the process to decrease the cyanide consumption due
to the high copper content of the ore. |
| | 3-9 | |
| SSR Mining Inc. | Çöpler Property S-K 1300 Report | February 12, 2024 SLR Project No.: 138.21581.00006 |
| · | EIA permit, dated December 24, 2014, for the capacity expansion involving: |
| · | Heap leach area expansion |
| · | EIA permit dated October 7, 2021, for the capacity expansion (the 2021 Çöpler EIA or COP 3) involving: |
| · | EIA permit dated January 26, 2017, for the Çakmaktepe satellite pits expansion. |
| · | EIA permit dated August 9, 2018, for the Çakmaktepe expansion for the newly defined Central pit. |
| · | EIA permit dated March 30, 2022, for the Çakmaktepe second expansion, including the Çakmaktepe Ext starter pit. (the
2022 Çakmaktepe EIA or CAK 2 EIA) |
| 3.5 | Other Significant Factors and Risks |
SLR is not aware of any environmental liabilities on the Project. SSR
Mining Inc. has all required permits to conduct work on the Project and has a reasonable plan, schedule, and budget to obtain current
required permits and authorizations. SLR is not aware of any other significant factors and risks that may affect access, title, or the
right or ability to perform the proposed work program on the Project.
| | 3-10 | |
| SSR Mining Inc. | Çöpler Property S-K 1300 Report | February 12, 2024 SLR Project No.: 138.21581.00006 |
| 4.0 | Accessibility, Climate, Local Resources, Infrastructure, and Physiography |
The following subsections have been extracted from OreWin (2022).
The Çöpler project is accessed from the main paved highway
between Erzincan and Kemaliye, crossing the Karasu River and passing by the village of İliç. From İliç there is
an additional 4.5 km of road to reach the entrance to the Çöpler mine site.
The Ankara to Erzincan railway line, operated by the Turkish State Railway
Company (TCDD), runs parallel to the south bank of the Karasu River and passes within two kilometres north of the Project at a point between
the train stations at İliç and Bağıştaş. The railway line connects the site with Ankara and the west as
well as with seaports to the north on the Black Sea, and to the south on the Mediterranean Sea. Overnight passenger sleeper cars are available
between Erzincan and Ankara.
The reservoirs of the Bağıştaş I and II hydro-electric
power plants (HEPP) are 350 m and 1,800 m away from the Çöpler mine site, respectively. The embankment of Bağıştaş
I Dam originally covered a portion of the existing highway, railroad, and railroad station until these were relocated before dam construction
was completed. Construction routes for the railroad and highway were located between the new Çöpler village and the Çöpler
mine site. The bridge on the north-east side of İliç was relocated to further east of the embankment.
There are regular commercial airline flights from Istanbul and Ankara
to the regional cities of Erzincan, Erzurum, Malatya, Elazığ, and Sivas. Driving from the regional cities to the Project site
takes between two to four hours on paved highways. Driving from Ankara to the site takes approximately eight hours.
Mining operations are conducted year-round. The climate is typically
continental with cold wet winters and hot dry summers. In winter, the night-time temperature can drop to –25°C although the
average is usually a few degrees below freezing. The July temperature frequently exceeds +40°C but the climate is usually pleasantly
warm outside of these extremes. The average monthly temperature ranges from +3.7°C for the coldest month of January to +23.9°C
for August, the warmest month.
Most precipitation occurs in the winter and spring. Monthly average
rainfall values are shown in Figure 4-1. The average annual rainfall for the site is 384.3 mm. Snowfall is common during the
period mid-November through February, but with little, if any, accumulation. Snow depth assessments are based on the Divriği meteorological
weather station, located 41 km west of the Project area, which shows maximum snow-pack depths at approximately 200 mm for 1985.
| | 4-1 | |
| SSR Mining Inc. | Çöpler Property S-K 1300 Report | February 12, 2024 SLR Project No.: 138.21581.00006 |
Figure 4-1: Average Monthly
Rainfall for Çöpler Project Area
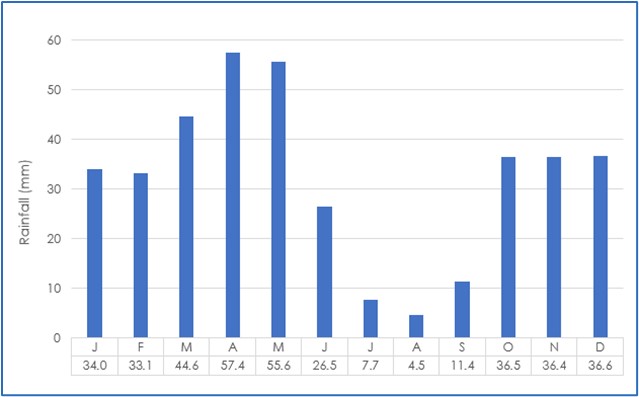
Source: Anagold, 2016
The frost depth is less than 0.3 m, based on local information,
with 0.5 m selected as the design frost depth limit.
The maximum wind speed recorded at the Divriği weather station
in 2004 ranges from 15 m/s to 25 m/s, with variable directions mainly from the north, south, and east.
The district of İliç has a population of approximately 3,800
inhabitants and is located approximately six kilometres east of the current Çöpler open pit. The district has a hospital,
schools, municipal offices, a fire station, a police station, and a Gendarmerie post. The primary economic activity in the region is sheep
herding for wool, meat, and dairy products. Other agricultural activities include bee keeping for honey production and, some wheat farming
along the Karasu River. Additionally, there is some light manufacturing and grain milling performed in İliç.
The workforce for the Anagold exploration programs has primarily included
residents drawn from the local communities of Çöpler, İliç, and Sabırlı.
Turkish telecommunications are up to European standards. High-speed,
fibre-optic internet access is available at the mine site.
Initially, electrical power at 380 V and 50 Hz was available in İliç
and at the mine site. This was upgraded to support the Project by the construction of a 40 km long 154 kV power line from the sub-station
at Divriği to the mine site. The power supply was further upgraded when the hydroelectric dam near the mine site was commissioned.
Çöpler is now connected to the national grid by a 6 km, 154 kV powerline from the Bağıştaş sub-station.
Sufficient local fresh water supply exists to support the mining and
processing operations. Ground water resources include seven production wells with a 25,728 m3/day extraction permit. Further
information on project infrastructure is included in Section 15. Section 17.3 contains additional data on the Project social
setting.
| | 4-2 | |
| SSR Mining Inc. | Çöpler Property S-K 1300 Report | February 12, 2024 SLR Project No.: 138.21581.00006 |
The Çöpler project is located in a roughly east–west
oriented valley at altitudes ranging from 1,100 MASL to 1,300 MASL. The valley is surrounded by limestone mountains that rise to more
than 2,500 MASL on the north and south sides of the Project area. These mountains are at the western end of the Munzur range, which rises
to more than 3,300 MASL between Ovacık and Kemah.
The region is sparsely vegetated, predominantly with semi-arid brush
and scrub trees including dwarf oaks and junipers.
The following are the site data developed during previous studies for
the design of the Project:
| · | Wind load: 40 m/sec, Exposure ‘C’ |
| · | Earthquake zone: second order, Ao = 0.20 |
| · | Atmospheric pressure (average): 880.5 millibars |
| · | Maximum design temperature: +40°C |
| · | Minimum design temperature: –25°C |
| · | Maximum snowfall depth: 200 mm (estimated) |
| · | Design maximum 24-hour rainfall: 76 mm |
| | 4-3 | |
| SSR Mining Inc. | Çöpler Property S-K 1300 Report | February 12, 2024 SLR Project No.: 138.21581.00006 |
The following subsections have been modified from OreWin (2022).
The region around the Project has been subject to gold and silver mining
that appears to date back at least the ancient Roman times. A copper-rich slag pile of approximately 2,500 t is located at the western
edge of the district and is believed to be waste from ancient production. Although the district contains copper mineralization, there
appears to have been little production targeting copper. There are several additional minor slag piles scattered around the Project area
thought to be from ancient, small-scale gold and by-product copper production.
The Turkish Geological Survey (MTA) carried out regional exploration
work in the early 1960s that was predominately confined to geological mapping. In 1964, a local Turkish company started mining for manganese,
continuing until closing in 1973 and producing approximately 7,300 t of manganese ore during its active life. Unimangan Manganez San A.Ş.
(Unimangan) acquired the property in January 1979 and re-started manganese production, producing one to five thousand tonnes per annum
(ktpa) of ore until ceasing operations in 1992.
In 1998, Anatolia Minerals Development Ltd (Anatolia) identified several
porphyry-style gold-copper prospects in east central Türkiye and applied for exploration licenses for these prospects. This work
was based upon the earlier work by MTA in the 1960s. During this effort, Anatolia delineated a prospect in the Çöpler basin
formed by an altered and mineralized granodiorite, intruded metasediment, and limestone. This prospect and the supporting work were the
basis for a joint venture agreement for exploration with Rio Tinto.
During the period of the joint venture, exploration drilling of the
Çöpler Deposit was completed and a Mineral Resource estimate was developed with three mineralized zones: Main, Manganese,
and Marble. In January 2004, Anatolia acquired sole control over the Project and maintained exclusivity until 2009, at which time a joint
venture with Lidya was executed.
In February 2011, Anatolia merged with Avoca Resources Limited to form
Alacer Gold Corp. (Alacer). In September 2020, Alacer merged with SSR.
The Çöpler property area is currently owned and operated
by Anagold, which is held by SSR (80%), Lidya (18.5%), and a bank wholly owned by Çalık Holdings A.Ş. (1.5%).
The Greater Çakmaktepe property area is owned by Kartaltepe,
which is held by SSR (80%) and Lidya (20%).
| 5.2 | Exploration and Development History |
Exploration of the Çöpler Deposit has been conducted by
Anagold and its predecessors since September 1998. Work completed has included the following:
| · | Geological and reconnaissance mapping |
| · | Rock chip, grab, soil, channel, and stream sediment geochemical sampling |
| · | Ground geophysical surveys including ground magnetic, complex resistivity / induced polarization (IP), time domain IP, and controlled
source audio-frequency magneto-telluric (CSAMT) surveys |
| | 5-1 | |
| SSR Mining Inc. | Çöpler Property S-K 1300 Report | February 12, 2024 SLR Project No.: 138.21581.00006 |
| · | A regional helicopter-borne geophysical survey |
| · | Reverse circulation (RC) and diamond core (DD) drilling programs |
| · | Acquisition of satellite imagery |
| · | Mining technical studies |
| · | Geotechnical and hydrogeological studies |
| · | Environmental baseline studies |
| · | Studies in support of project permitting |
| · | Metallurgical testwork and studies |
| · | Condemnation evaluations |
The principal exploration technique used at the Project has been RC
and DD drilling, conducted in multiple campaigns since 2000. Initially, exploration was directed at evaluating the economic potential
of the near-surface oxide mineralization for the recovery of gold by either heap leaching or conventional milling techniques.
In 2013, drilling occurred primarily in the western portion of the Main
Zone and on the northern edge of the Çöpler Deposit. Drilling during 2014 focused on verification of existing drilling results
through a twin-hole program. Drilling in 2015 provided data coverage at depth in the Manganese Zone, infill drilling in the Main Zone,
and testing of low-sulfur mineralization below the oxidation boundary.
Drilling continues to better define both the oxide and sulfide portions
of the Çöpler Deposit.
Annual production (produced) from the start of operations to the effective
date of this TRS is presented in Table 5-1
Table 5-1: Past Production
| Year |
Gold Ounces Produced |
| 2010 |
512 |
| 2011 |
185,418 |
| 2012 |
188,756 |
| 2013 |
271,063 |
| 2014 |
227,927 |
| 2015 |
204,665 |
| 2016 |
119,036 |
| 2017 |
168,163 |
| 2018 |
170,865 |
| 2019 |
391,213 |
| 2020 |
326,908 |
| 2021 |
329,276 |
| 2022 |
191,366 |
| Total |
2,775,168 |
Source: Alacer/SSR Annual reports
| | 5-2 | |
| SSR Mining Inc. | Çöpler Property S-K 1300 Report | February 12, 2024 SLR Project No.: 138.21581.00006 |
| 5.4 | Previous NI 43-101 Technical Reports |
The following subsection has been modified from OreWin (2022).
The most recent Technical Report was the 2021 Çöpler District
Master Plan 2021 NI 43-101 Technical Report dated September 29, 2022.
The previous reporting of Mineral Resources and Mineral Reserves was
in the SSR Annual Information Form (SSR, 2023). Those statements on Mineral Resources and Mineral Reserves have been used for comparison.
The following Technical Reports and Technical Report Summaries have
been filed on the Çöpler project (in chronological order):
| · | Watts, Griffis and McQuat Limited, 2003. Update of the Geology and Mineral Resources of the Çöpler Prospect, May 1, 2003. |
| · | Independent Mining Consultants, Inc., 2005. Çöpler Project Resource Estimate, October 19, 2005. |
| · | Marek, J.M., Pennstrom, W.J., Reynolds, T., 2006. Çöpler Gold Project Feasibility Study, May 30, 2006. |
| · | Marek, J.M., Moores, R.C., Pennstrom, W.J., Reynolds, T., 2007. Çöpler Gold Project, March 2, 2007, as amended April 30,
2007. |
| · | Easton, C.L., Malhotra, D., Marek, J.M., Moores, R.C., and Pennstrom, W.J., 2008. Çöpler Gold Project East Central Turkey
Preliminary Assessment Sulfide Ore Processing, February 4, 2008. |
| · | Marek, J.M., Benbow, R.D., and Pennstrom, W.J., 2008. Çöpler Gold Project East Central Turkey, December 5, 2008 (amended
and restated; supersedes July 11, 2008 version). |
| · | Altman, K., Liskowich, M., Mukhopadhyay, D.K., and Shoemaker, S.J., 2011. Çöpler Sulfide Expansion Project Prefeasibility
Study, March 27, 2011. |
| · | Altman, K., Bascombe, L., Benbow, R.D., Mach, L., and Shoemaker, S.J., 2012. Çöpler Resource Update, Erzincan Province,
Turkey, March 30, 2012. |
| · | Altman, K., Bair, D., Bascombe, L., Benbow, R., Mach, L., and Swanson, B., 2013. Çöpler Mineral Resource Update, Erzincan
Province, Turkey, March 28, 2013. |
| · | Armstrong, D., Bascombe, L., Bohling, R., Kiel, R., Liskowich, M., Parker, H.M., Parshley, J., Seibel, G., and Swanson, B., 2014.
Çöpler Sulfide Expansion Project Feasibility Study, Erzincan Province, Turkey, 29 July 2014. |
| · | Bascombe, L., Benbow, R.D., Birch, R.G., Bohling, R., Francis, J., Khoury, C., Kiel, R., Liskowich, M., Marsden, J., Parker, H.M.,
Parshley, J., Seibel, G., and Statham, S., 2015. Çöpler Sulfide Expansion Project Feasibility Update, Erzincan Province Turkey,
March 27, 2015. |
| | 5-3 | |
| SSR Mining Inc. | Çöpler Property S-K 1300 Report | February 12, 2024 SLR Project No.: 138.21581.00006 |
| · | David, D., Kiel, R., Liskowich, M., Parshley, J., Marsden, J., Seibel, G., Parker, H., Bascombe, L., Benbow, R., Statham, S., Francis,
J., and Smolonogov, S., 2016. Çöpler Mine, Erzincan Province, Turkey, June 9, 2016. |
| · | OreWin Pty. Ltd., 2020. Çöpler District Master Plan 2020, November 27, 2020. |
| · | OreWin Pty. Ltd., 2022. Çöpler District Master Plan 2021, September 29, 2022. |
| | 5-4 | |
| SSR Mining Inc. | Çöpler Property S-K 1300 Report | February 12, 2024 SLR Project No.: 138.21581.00006 |
| 6.0 | Geological Setting, Mineralization, and Deposit |
Türkiye is predominantly situated on the Anatolian Plate which
is bounded by the Eurasian plate to the north, the Arabian Plate to the southeast, the African Plate to the south, and the Aegean Plate
to the west. Due to the convergence between the Eurasian and Arabian plates, the Anatolian Plate is displaced westward along two major
strike-slip fault zones: the North Anatolian Fault and the East Anatolian Fault. The North Anatolian Fault has a right-lateral displacement
and forms the boundary between the Anatolian Plate and the Eurasian Plate to the north. The East Anatolian Fault has left-lateral displacement
and forms the boundary between the Anatolian Fault and the Arabian Plate to the southeast. The region is also influenced by the subduction
of the Neo-Tethys oceanic plate which led to arc and back arc magmatism during the Late Cretaceous and Middle Miocene era and continuing
to the present.
A regional geology plan is presented in Figure 6-1.
| | 6-1 | |
| SSR Mining Inc. | Çöpler Property S-K 1300 Report | February 12, 2024 SLR Project No.: 138.21581.00006 |
Figure 6-1: Regional Geological
Setting of the Çöpler District
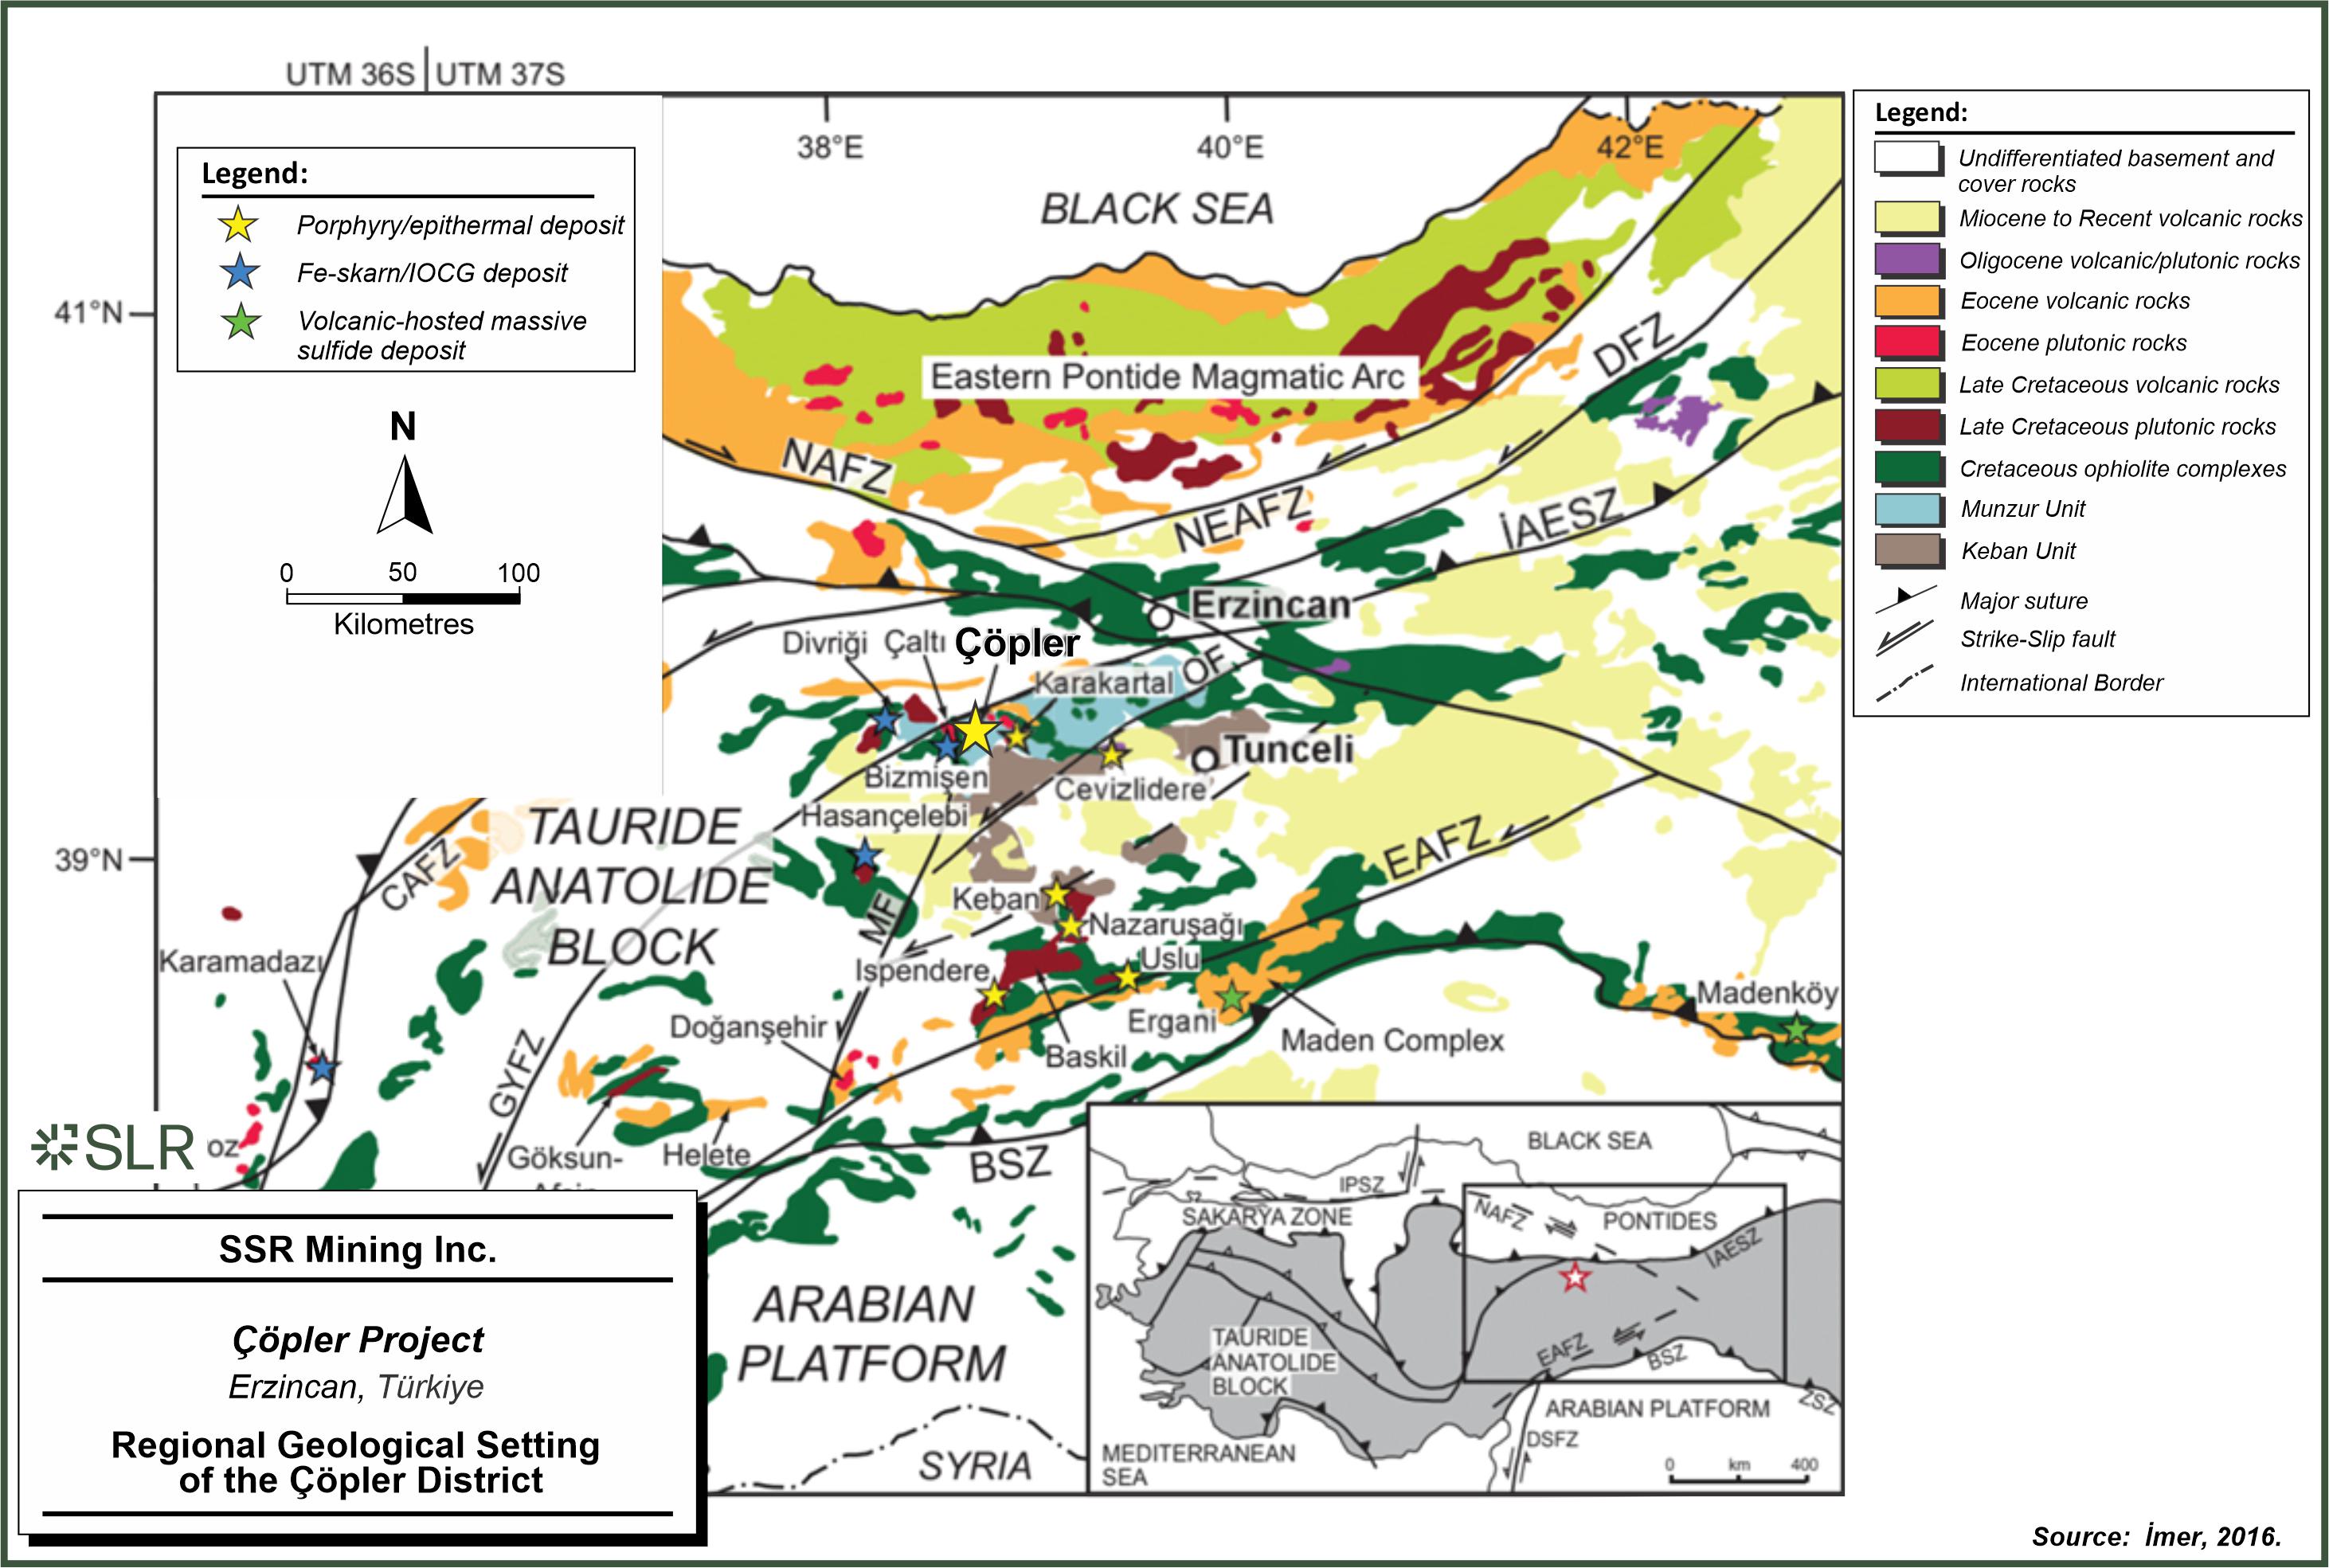
SSR
Mining Inc. Copler Project Erzincan, Turkiye Regional Geological Setting of the Copler District
| | 6-2 | |
| SSR Mining Inc. | Çöpler Property S-K 1300 Report | February 12, 2024 SLR Project No.: 138.21581.00006 |
The Çöpler Project, including Çöpler, Greater
Çakmaktepe, and Bayramdere deposits, is within the Tethyan mineral belt, a terrane stretching from Indo-China to Europe through
Eurasia that contains economically significant gold, copper, and base metal deposits.
The Çöpler Project is located near the north margin of a
complex collision zone and to the south of the prominent North Anatolian Fault Zone (Figure 6-2). The collision zone, and subsequent
crustal thickening, is related to the closure of the northern branch of the Neotethys ocean, resulting from the northward subduction and
coming together of the Pontides and Tauride Anatolide Block in the Late Cretaceous to Early Tertiary. In this intensely deformed tectonic
region, east trending imbricated structures were cut by north–northeast trending strike-slip faults during the Late Cretaceous to
Paleogene period.
Three main rock assemblages are exposed in the Çöpler district
(Figure 6-2 and Figure 6-3):
| · | The first assemblage includes the Keban Metamorphics (Hornfels, Clastics), Munzur Carbonates (Limestone, Dolomite), and Kemaliye Formations.
These units are tectonically overlain by ophiolitic nappes (Ovacık Formation of Özgül and Turşucu 1984). |
| · | The second assemblage includes Middle Eocene magmatic (Granodiorite – Diorite) and sedimentary rocks. Intrusions develop byproducts
like jasperoid, listwanite, gossan, and silica cap. |
| · | The third assemblage includes the Cretaceous ophiolitic mélange which is overthrusted onto Munzur Limestone from northeast
to southwest. |
The local geology is a complex structural assemblage of fault-bounded
blocks (Figure 6-3) including the following rock types:
| · | Limestone: grey to blue-grey, fine-grained to recrystallised marbles. Much of the unit displays various degrees of karst development.
Bedding within the unit is indistinct to massive. |
| · | Hornfels: fine-grained argillite sequences consisting of interbedded siltstones, shale units, marls, and sandy siltstones. The thermal
and hydrothermal impact on this unit from the intrusions resulted in the creation of the skarns and hornfels. |
| · | Ophiolitic mélange: ophiolitic mélange consists of diabase and serpentinite units. Serpentinization is non-uniform and
appears to be best developed near major fault zones. |
| · | Diorite to granodiorite intrusions: beige and light brown, medium to coarse-grained plutons. This formation has intruded into the
pre-existing argillites and Munzur limestone. This includes fine to medium-grained quartz, feldspar, biotite, and amphibole minerals. |
Figure 6-4 shows a generalized stratigraphic column for the Çöpler
area.
| | 6-3 | |
| SSR Mining Inc. | Çöpler Property S-K 1300 Report | February 12, 2024 SLR Project No.: 138.21581.00006 |
Figure 6-2: Geological and Structural
Map of the Çöpler District
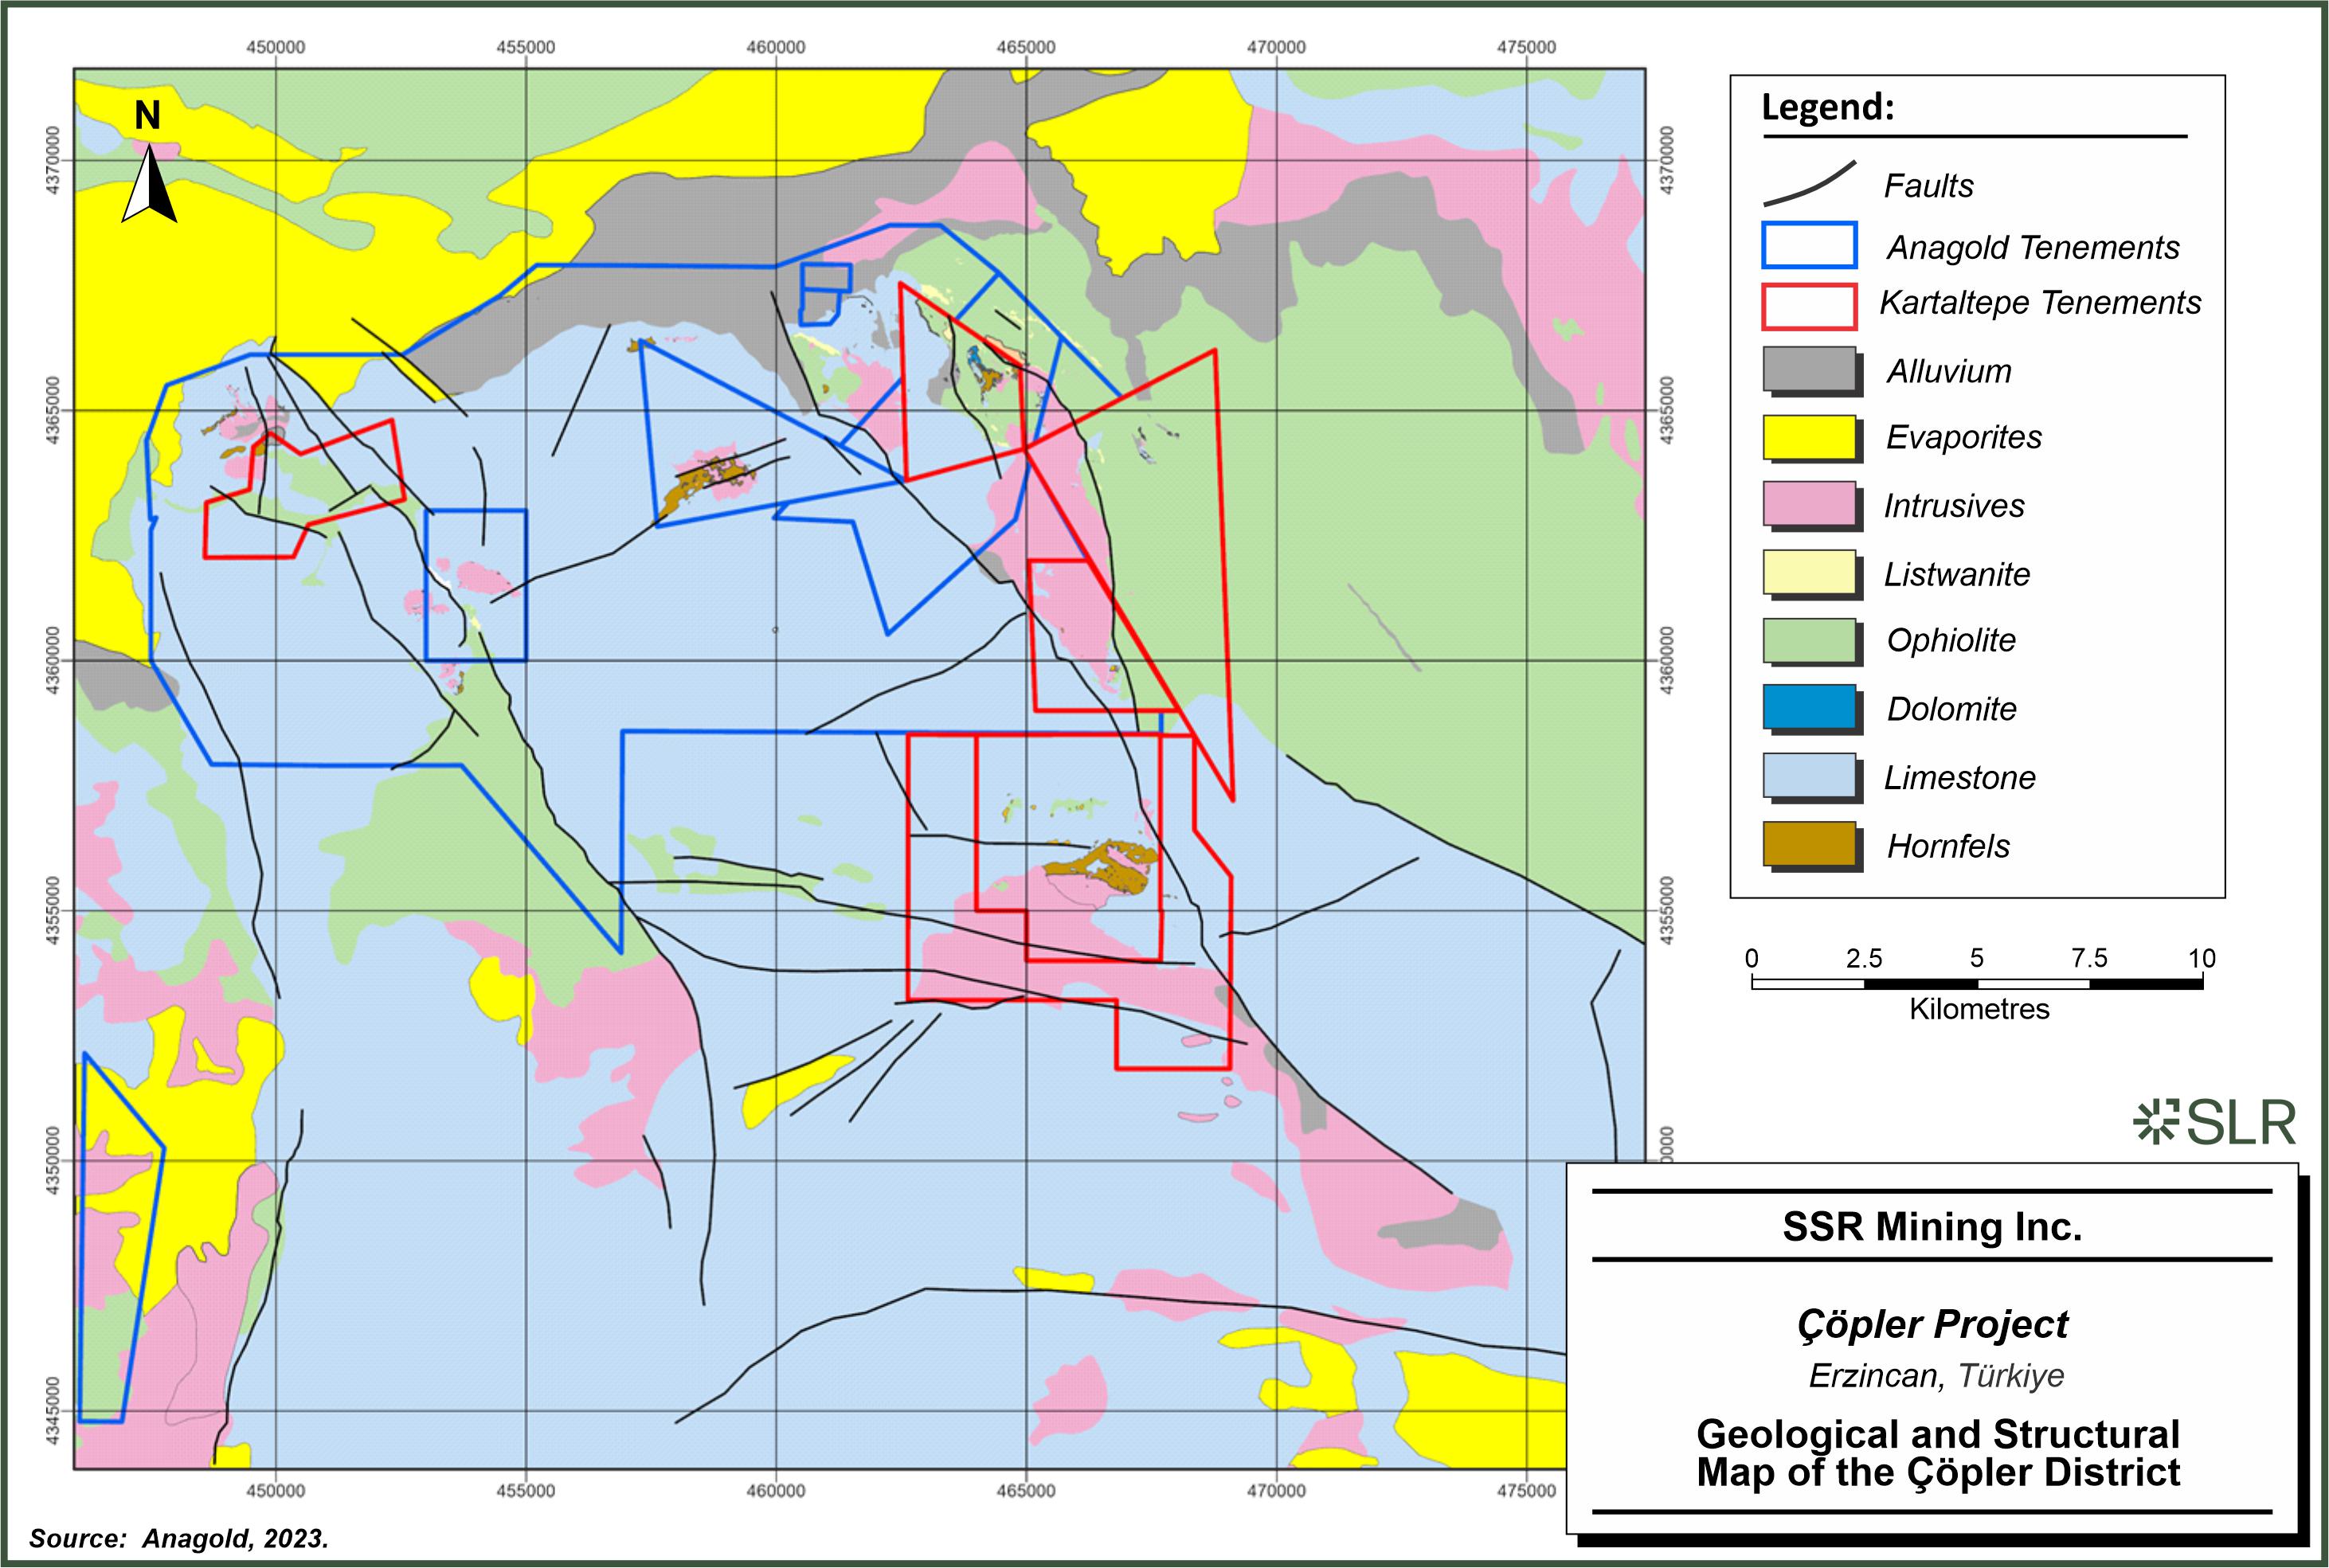
SSR
Mining Inc. Copler Project Erzincan, Turkiye Geological and Structural Map of the Copler District
| | 6-4 | |
| SSR Mining Inc. | Çöpler Property S-K 1300 Report | February 12, 2024 SLR Project No.: 138.21581.00006 |
Figure 6-3: Çöpler
Deposits Conceptual Cross Section
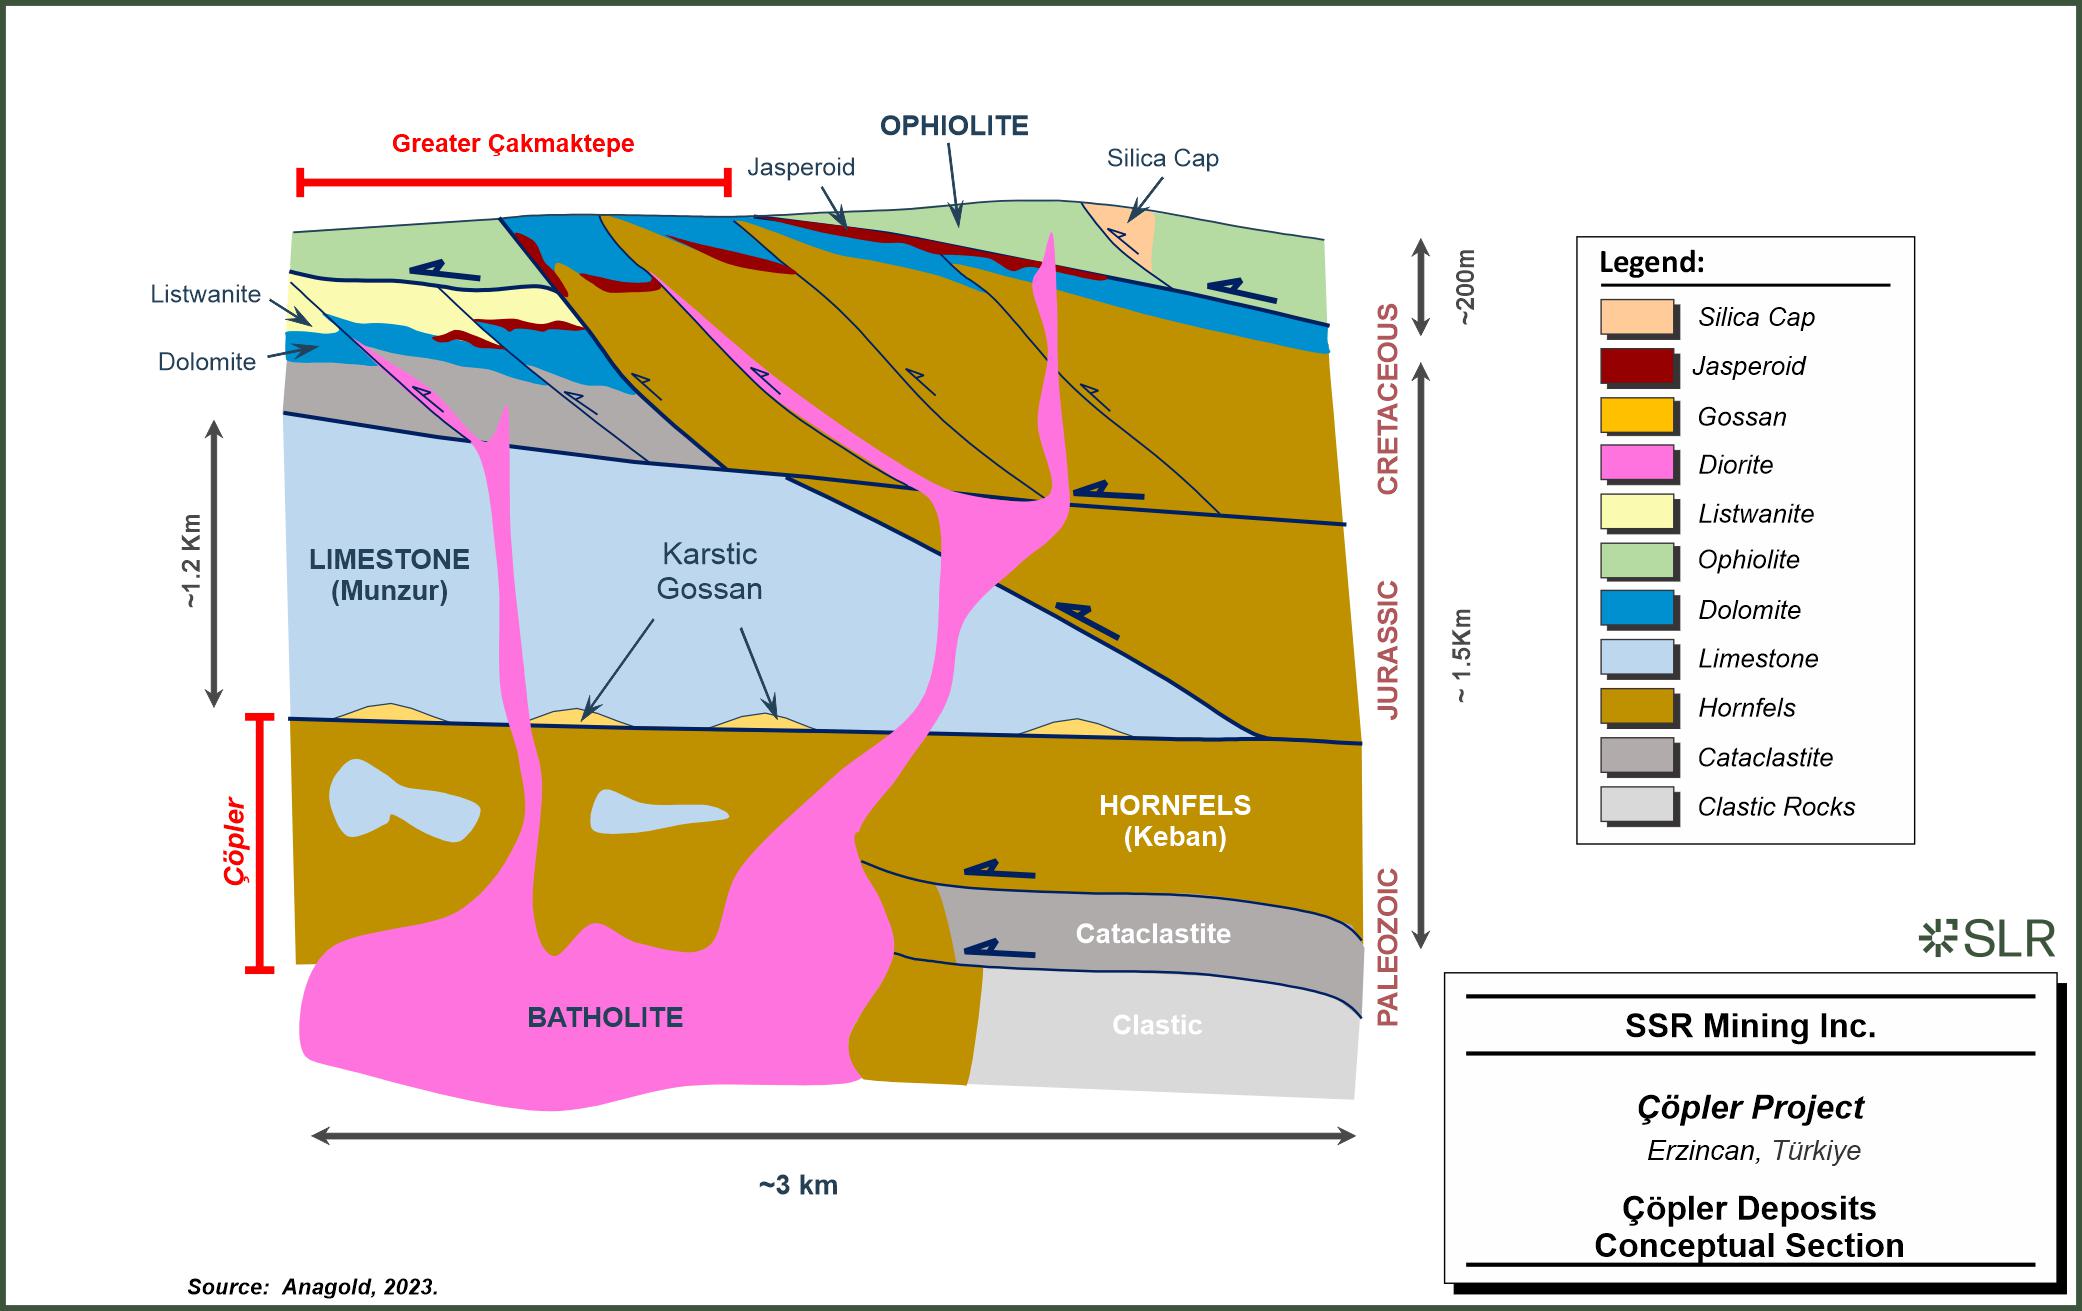
SSR
Mining Inc. Copler Project Erzincan, Turkiye Copler Deposits Conceptual Section
| | 6-5 | |
| SSR Mining Inc. | Çöpler Property S-K 1300 Report | February 12, 2024 SLR Project No.: 138.21581.00006 |
Figure 6-4: Regional Stratigraphic
Section of the Project Areas
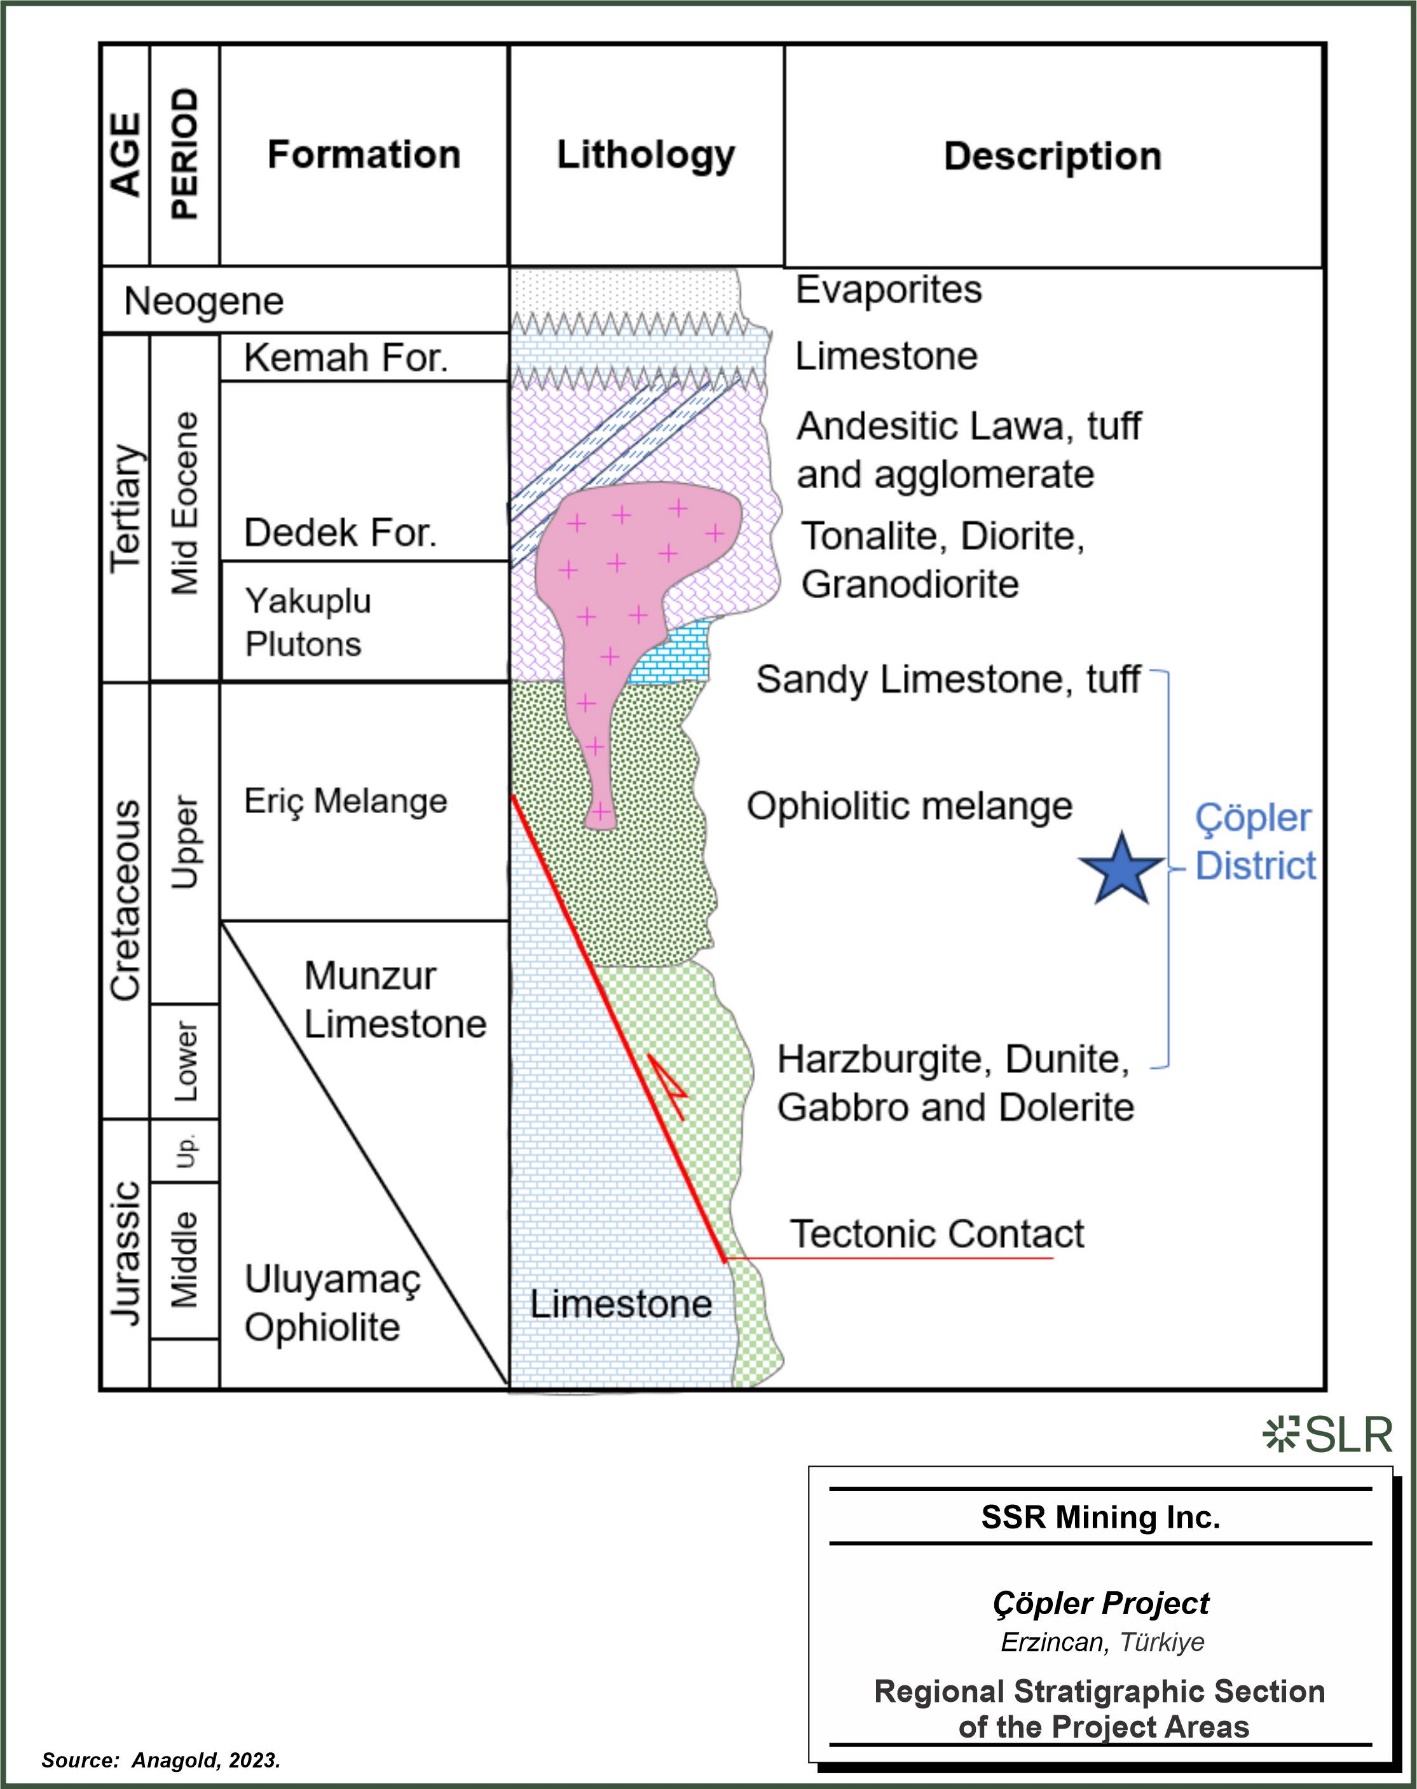
SSR
Mining Inc. Copler Project Erzincan, Turkiye Regional Stratigraphic Section of the Project Areas
| | 6-6 | |
| SSR Mining Inc. | Çöpler Property S-K 1300 Report | February 12, 2024 SLR Project No.: 138.21581.00006 |
| 6.3 | Property Geology and Mineralization |
| 6.3.1.1 | Deposit Dimensions |
Economic Çöpler mineralization occurs predominantly between
elevations 1,590 m and 740 m and across a 3,000 m by 1,300 m wide surface area.
The Çöpler Deposit is centred on composite diorite to monzonite
porphyry stocks that are part of the Eocene Çöpler Kabataş magmatic complex dated (by İmer et al., 2013) at:
| · | 43.8 ± 0.3 Ma and 44.2 ± 0.2 Ma (from 40 Ar / 39 Ar analysis of igneous biotite), and |
| · | 44.1 ± 0.4 Ma (from igneous hornblende). |
The magmatic rocks have intruded into both the Keban and Munzur formations.
Rocks of the Permian to Upper Cretaceous Keban Formation shelf sequences
vary in composition between siliciclastic and calcareous, with fine to medium-grained sandstone interbedded with mudstone, and locally
thick sections of fine laminated mudstone. The sedimentary units are folded with a fold axis oriented at approximately 25→200 (plunge→plunge
direction) resolved from bedding measurements in the Çöpler pits. Limestone of the Upper Triassic to Late Cretaceous (Upper
Campanian) Munzur Formation structurally overlies the folded Keban Formation with the contact represented by cataclasite at the base of
the Munzur Formation. Intense shearing of the underlying sedimentary rocks is observed, with top-to-south kinematics.
Stratigraphically, the Munzur Formation overlies the Keban. However,
mapping of the Munzur Formation to the north of Çöpler shows homoclinal structure with consistent bedding in the limestones
(40/060, dip/ dip-direction) indicating juxtaposition of structural blocks. The Munzur allochthon was thrusted onto Permo-Triassic metamorphic
basement in the Late Cretaceous (Özgül and Turşucu, 1984). This structural contact pre-dates Eocene Çöpler
Kabataş intrusions, which appear to have intruded across the sheared contact between Keban Formation metamorphic rocks (Main Zone)
and Munzur Formation limestone (Manganese Zone).
The Çöpler intrusion is a hornblende–quartz diorite-porphyry
that shows strong argillic alteration. Some fresh outcrop occurs in the central part of the Main Zone and as remnants within the Manganese
Zone. In its least-altered state, the diorite-porphyry is relatively pristine with well-preserved hornblende, biotite, and K-feldspar
phenocrysts in a granular matrix of plagioclase and quartz with prominent magnetite. Flow alignment of the hornblende phenocrysts can
be seen in places. Gradational transitions to argillic-altered rocks are evident in outcrop and drill core on a centimetre scale.
The geology of the area is controlled by a dominant east-northeast-trending
tectonic fabric that formed during a major sinistral strike-slip event. This trend is the primary driver of fault geometry, intrusion
emplacement and controls on mineralization.
| | 6-7 | |
| SSR Mining Inc. | Çöpler Property S-K 1300 Report | February 12, 2024 SLR Project No.: 138.21581.00006 |
The contact of the Çöpler intrusion has a roughly rectilinear
shape, suggesting control by pre-existing east–northeast trending faults, and by a set of north–northwest trending fractures
(Figure 6-5). The north–northwest striking bedding may also have exerted a local control in the central part of the intrusion
where many intrusive contacts are parallel to bedding and have a sill-like morphology. However, it is considered more likely that this
reflects the north–northwest trending fracture control referred to above.
A pronounced ground magnetic anomaly is centred on the core of the porphyry,
which has been modeled to reflect the potassically altered core of the stock-like barren porphyry system dipping steeply towards the south.
In addition, there are several dykes and intrusive apophyses; most notably, a brecciated and strongly clay-altered intrusion centred on
the Manganese Zone.
| | 6-8 | |
| SSR Mining Inc. | Çöpler Property S-K 1300 Report | February 12, 2024 SLR Project No.: 138.21581.00006 |
Figure 6-5: Çöpler
Deposit Geological Map
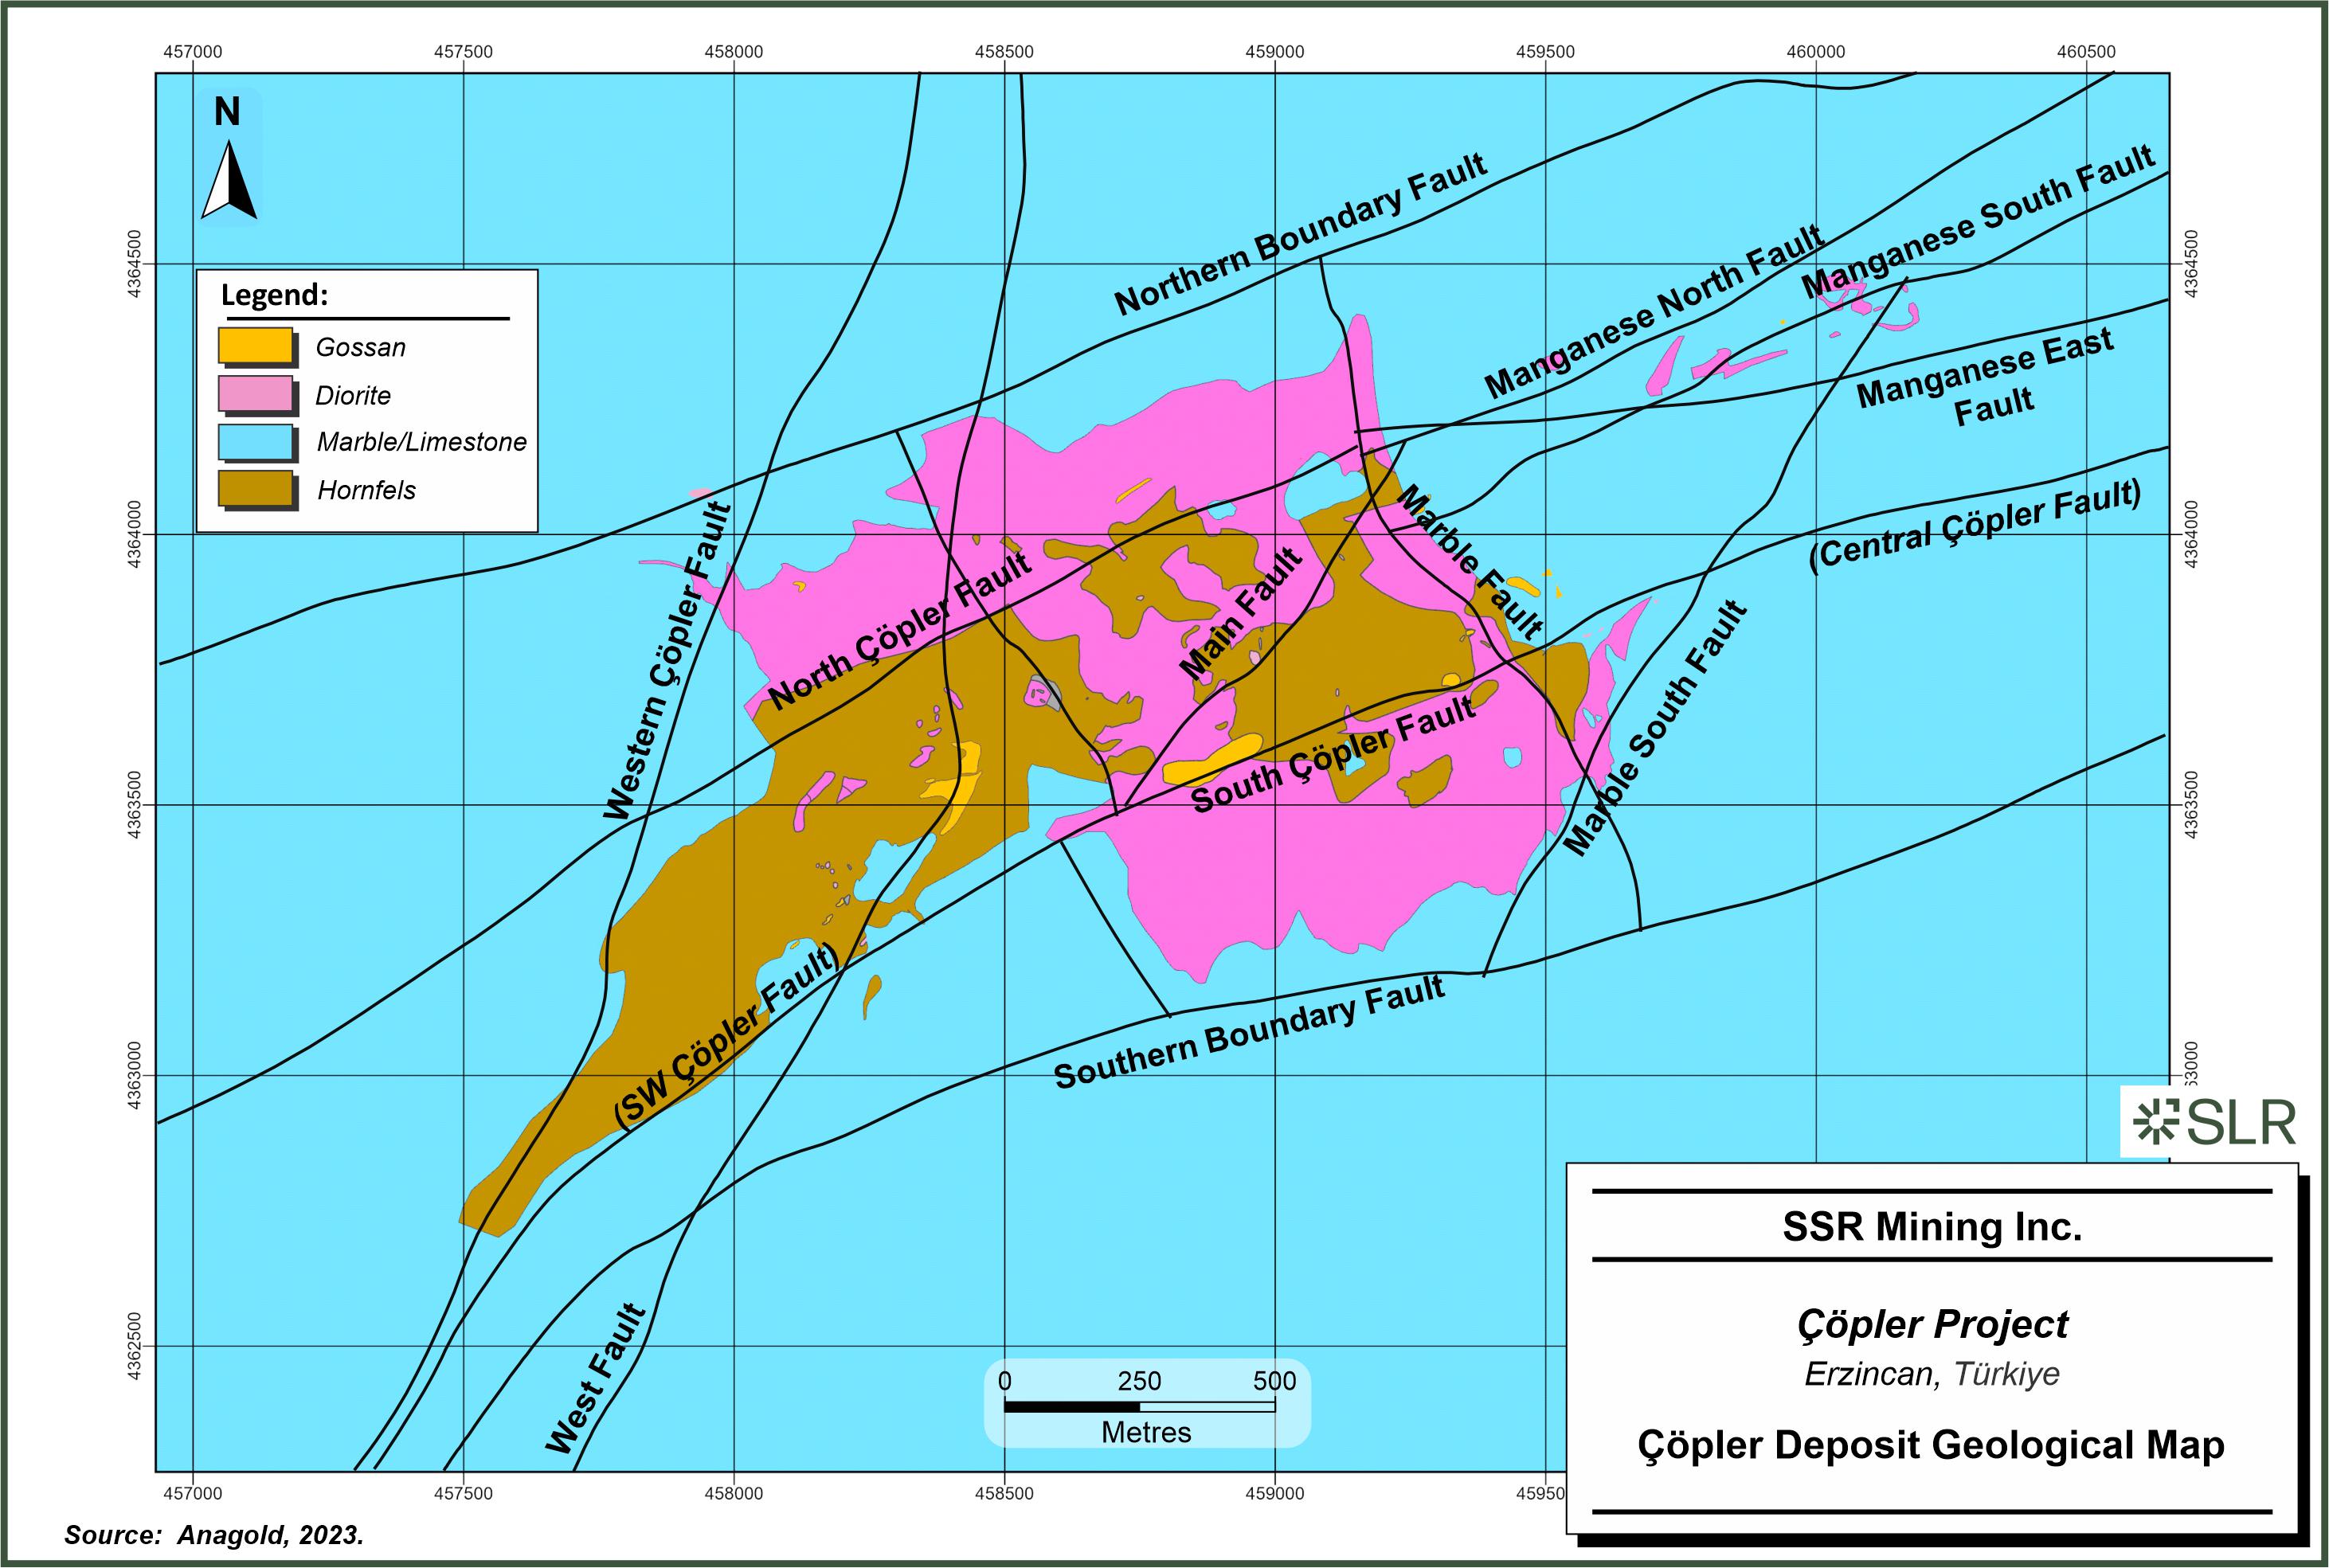
SSR
Mining Inc. Copler Project Erzincan, Turkiye Copler Deposit Geological Map
| | 6-9 | |
| SSR Mining Inc. | Çöpler Property S-K 1300 Report | February 12, 2024 SLR Project No.: 138.21581.00006 |
Structures are one of the three primary mineralization controls at Çöpler,
the others being the hornfels-marble contact and diorite geometry.
In the area of the Çöpler deposit, two dominant sets of
faults are present. These faults are approximately parallel to the long axis of the deposit and are oriented east–northeast. These
are referred to as longitudinal faults. The other set of faults are transverse to the longitudinal faults and referred to as cross-faults
(Figure 6-5). The major cross-faults include (from east to west) the Manganese North fault, Marble fault, Main fault, and West fault.
The longitudinal faults include the Northern Boundary fault, North Çöpler
fault, Central Çöpler fault, SW Çöpler fault, and Southern Boundary fault. The Central and SW Çöpler
faults dip to the south and were previously thought to be the same fault. The South Çöpler Fault Zone and associated faults
represent the most recent significant fault activity and have divided the north and south parts of the mine into two principal structural
domains.
The Çöpler deposit area demonstrates trans-tensional deformation.
The extensional deformation in the area dominates over strike-slip motion as indicated by the lack of compressional structures and the
presence of normal movement on all faults. Structurally, the Çöpler deposit occurs in a horst-like feature developed within
a sinistral trans-tensional strike-slip setting (Figure 6-6). The two boundary faults delimit the northern and southern extent of
the gossan-like, oxidized, supergene, gold-bearing deposits. The northern and southern boundary faults are located almost at the present
boundaries of the mine, and dip away from the mine, thereby defining the horst-like geometry. In addition, the deposit is traversed by
several cross-cutting normal faults (with or without strike-slip components) in various orientations that complicate but localise the
geometry and position of oxidized ore (Kaymakçı, 2017).
| | 6-10 | |
| SSR Mining Inc. | Çöpler Property S-K 1300 Report | February 12, 2024 SLR Project No.: 138.21581.00006 |
Figure 6-6: Simplified Schematic
Cross-Section of the Çöpler Deposit Structures (Looking East-Northeast)
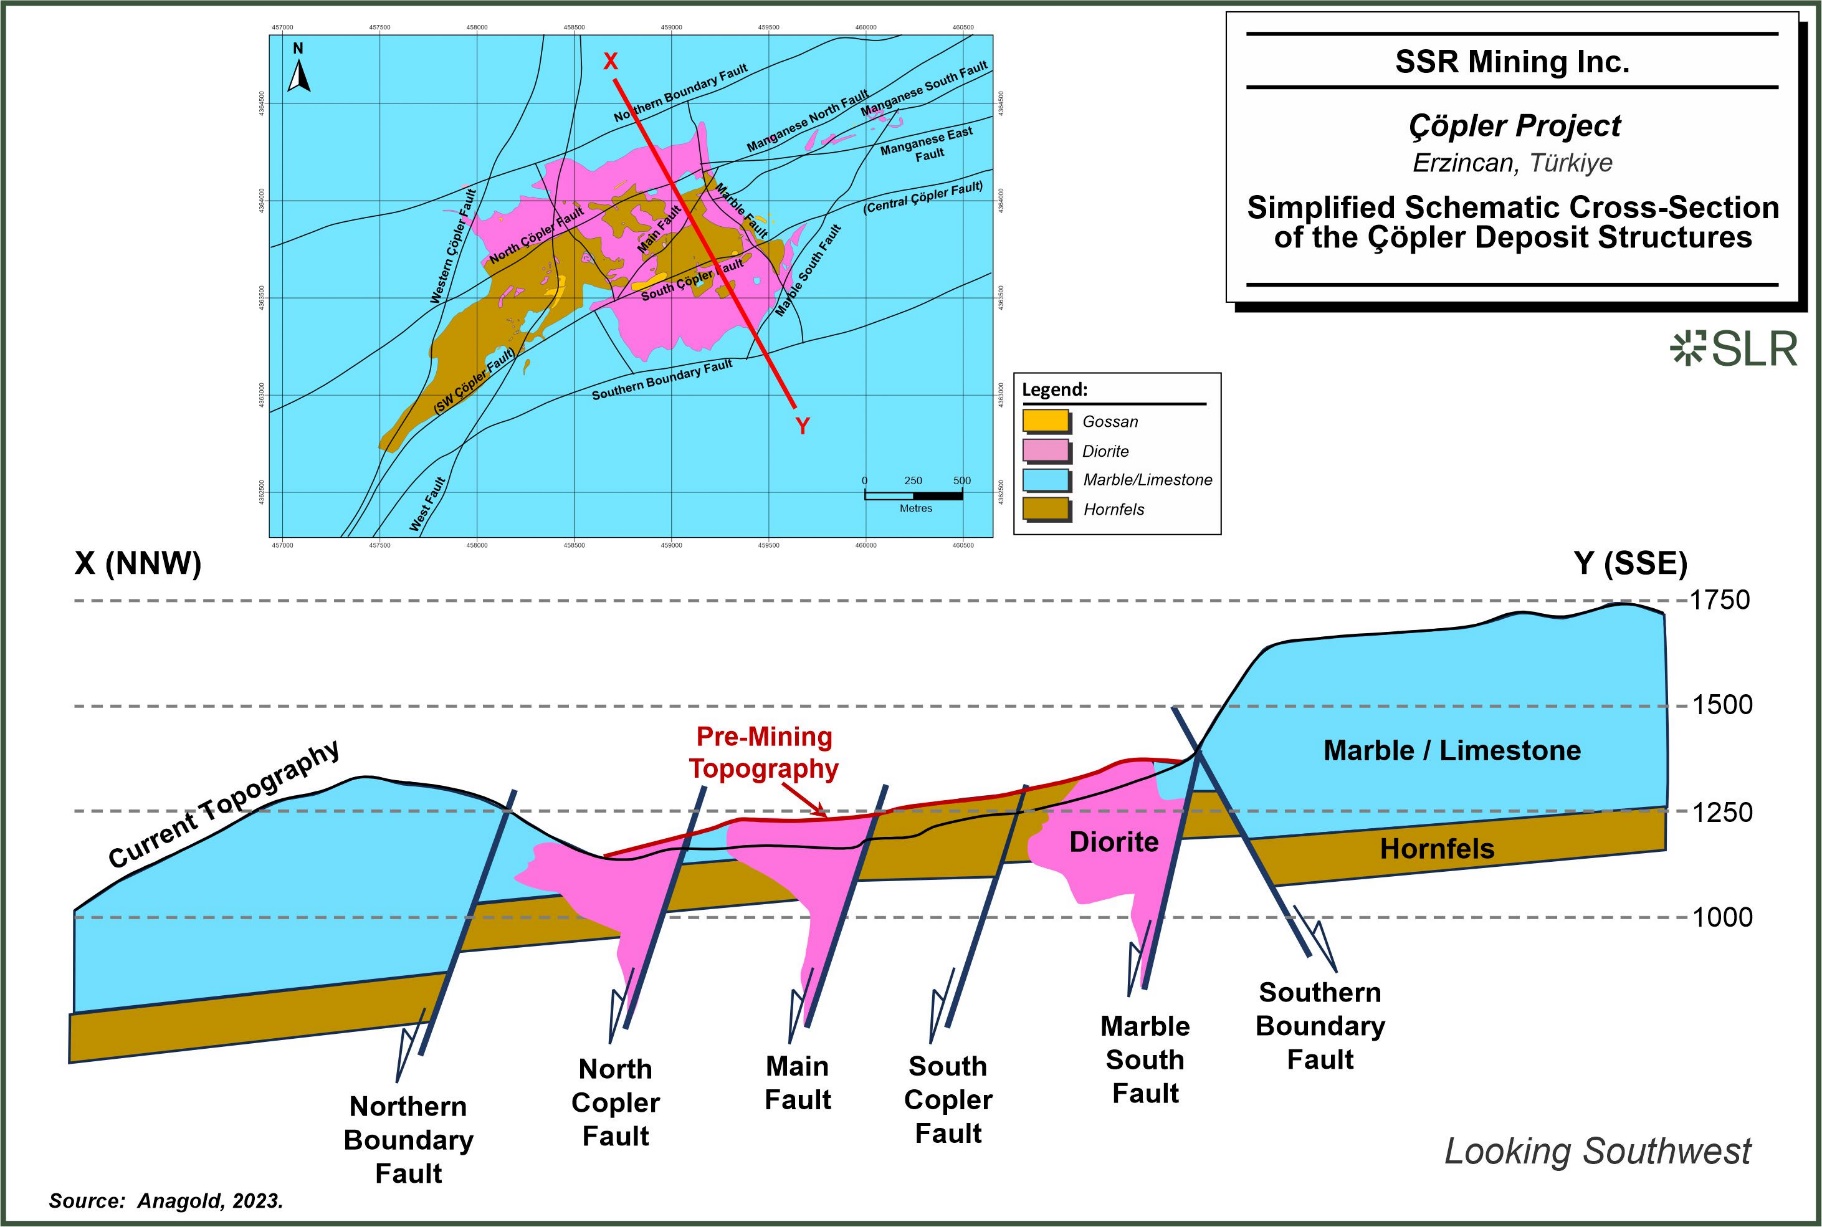
SSR
Mining Inc. Copler Project Erzincan, Turkiye Simplified Schematic Cross-Section of the Copler Deposit Structures
| | 6-11 | |
| SSR Mining Inc. | Çöpler Property S-K 1300 Report | February 12, 2024 SLR Project No.: 138.21581.00006 |
| 6.3.1.4 | Weathering and Alteration |
Weathering has resulted in oxidation of the mineralization close to
surface. The oxidized cap is underlain by primary and secondary sulfide mineralization. In addition to the gold–silver–copper
mineralization of economic interest, arsenic, lead, magnesium, manganese, mercury, and zinc are also present.
The Çöpler Deposit gold, silver, and copper mineralization
is exposed in four adjacent open pits from east to west: Manganese Pit, Marble Pit, Main Pit, and West Pit.
The mineralization is considered to be related to fluids associated
with diorite intrusions at depth; mineralization is generally controlled by structural fluid pathways, intrusion contacts, and traps associated
with lithological contacts. More specifically, there are three primary controls on mineralization: the hornfels-marble contact, the diorite
geometry, and 2nd or 3rd order fault structures and their confluence.
Most of the Çöpler mineralization is controlled by the physical
trap/seal that the hornfels formed for the diorite-derived fluids and associated with typical replacement-style processes (e.g. jasperoid).
Mineralization generally manifests as three closely related styles:
| · | Iron skarn and carbonate replacement mineralization |
| · | Intermediate sulfidation epithermal mineralization |
| · | Low-grade porphyry vein mineralization |
Iron Skarn and Carbonate Replacement Mineralization
Carbonate replacement oxide gold mineralization developed within karstic
spaces and along faults and shear zones. The carbonate-siliciclastic contact is the most dominant control on mineralization, where diorite-derived
fluids have replaced limestones on the marble-hornfels contact.
It is observed as iron oxide-rich zones as well as gossan-like and jarosite
units developed by oxidation of previous pyrite-rich mineralization. This replacement type mineralization appears may be derived from
previously formed distal skarn mineralization. Development of gossan and jasperoid is potentially related to weathering of primary Eocene
sulfide deposits in situ or remobilised from a nearby source.
Manganese skarn mineralization is primarily observed in the Manganese
Pit. The geometries of mineralization in the Manganese pit are typically consistent with those of the diorite intrusion; manganese skarns
wrap around the contact and display internal porphyry-style mineralization.
Intermediate Sulfidation Epithermal Mineralization
Intermediate sulfidation epithermal mineralization is primarily observed
in the Manganese Pit as clusters of bright pink, banded, colloform, rhodochrosite base metal sulfide veins and breccia lodes.
Carbonate base metal veins contain base metal sulfides sphalerite±galena±chalcopyrite in a gangue of calcite, ferroan dolomite,
and/or rhodochrosite and realgar.
In the Main Pit, the base metal carbonate veins are coarsely crystalline
whereas veins in the Manganese Pit display brecciation, colloform banding, and locally quartz pseudomorphs of bladed calcite. The change
in vein style suggests the Manganese Pit represents a higher level position with respect to the mineralising system.
| | 6-12 | |
| SSR Mining Inc. | Çöpler Property S-K 1300 Report | February 12, 2024 SLR Project No.: 138.21581.00006 |
Epithermal veins and mineralized faults are mostly thin and hosted in
the hornfels within the Main Pit. Elevated gold grades occur in blowout zones where 2nd-to-3rd order faults intersect.
Low-Grade Porphyry Vein Mineralization
Sub-economic porphyry copper–gold–molybdenum mineralization
is characterised by well-developed alteration zones that are complex and superimposed on each other. Late-stage porphyry mineralization
is hosted in diorite-tonalite porphyry as dominant sheeted veinlet arrays and as stockworks in metamorphic wall rocks.
| 6.3.2.1 | Deposit Dimensions |
Greater Çakmaktepe mineralization occurs approximately between
elevations 1,020 m and 1,615 m, is approximately 2,500 m long (northwest–southeast) by 950 m wide (northeast–southwest), and
ranges in thickness from 10 m to 200 m.
The Greater Çakmaktepe deposit is made up of several mineralized
zones including Çakmaktepe, Çakmaktepe North, and Çakmaktepe Ext (Figure 6-7). While there are some characteristic
differences between Çakmaktepe Ext and Çakmaktepe, the local geology is generally very similar.
The deposit area mainly comprises Palaeozoic metamorphic rocks and marble
belonging to the Keban Formation and Mesozoic platform carbonate such as the Munzur Formation limestone. All these units are tectonically
overlain by ophiolitic mélange rocks. These ophiolitic rocks originated from the northern branch of the NeoTethys ocean, the former
position of which is delineated by the Ankara–Erzincan suture zone. The emplacement of the ophiolitic units took place at the end
of the Upper Cretaceous with north-to-south motion.
The youngest units include Eocene and younger magmatic rocks, volcaniclastics
rocks and sedimentary units that unconformably overlie and seal the Munzur Formation limestone, its basement and the ophiolitic units.
All these units are intruded by intermediate igneous rocks that are exposed mainly at the northern and western parts of the Munzur mountains
and southern margin of the Sivas Basin.
Listwanite formed in structurally deformed areas by the percolation
of CO2-rich fluids along the margins of ultramafic rocks within the ophiolite complex. Sulfidic jasperoid is present, a result
of silica-sulfide metasomatism of Munzur Formation carbonate rocks. Both listwanite and jasperoid are important host rocks for gold and
silver mineralization.
| | 6-13 | |
| SSR Mining Inc. | Çöpler Property S-K 1300 Report | February 12, 2024 SLR Project No.: 138.21581.00006 |
Figure 6-7: Geological Map of
the Greater Çakmaktepe Deposit
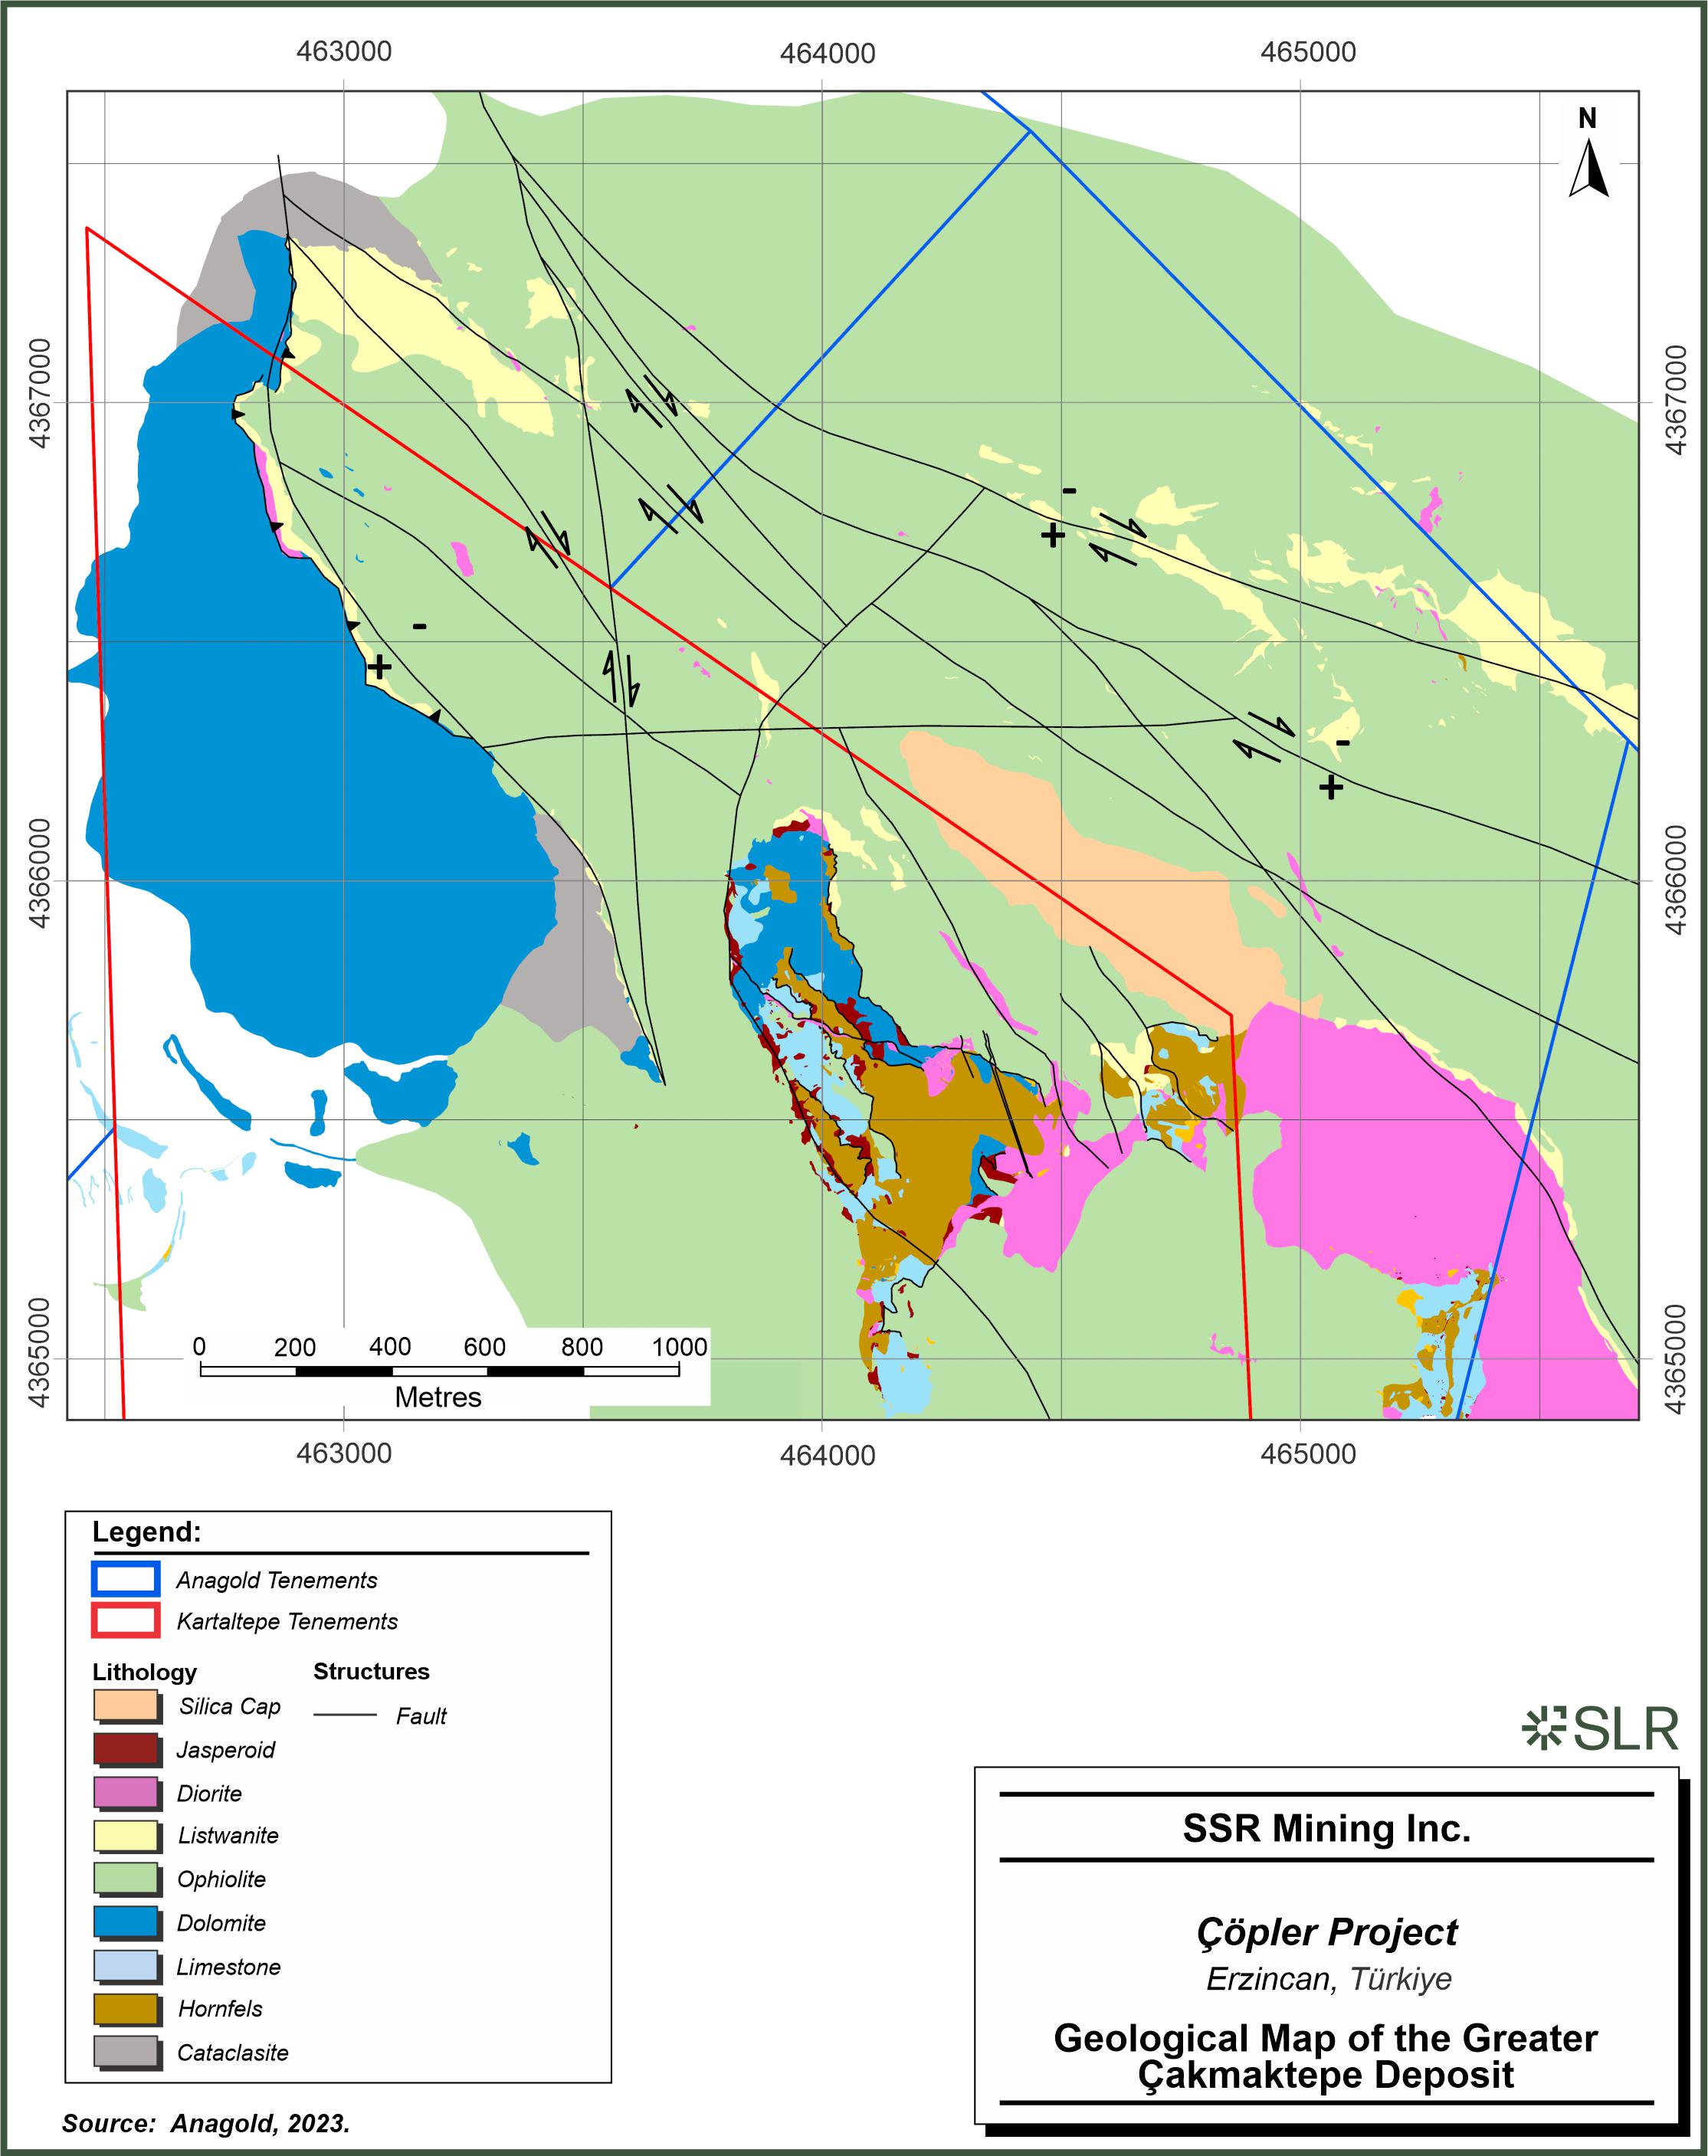
SSR
Mining Inc. Copler Project Erzincan, Turkiye Geological Map of the Greater Cakmaktepe Deposit
| | 6-14 | |
| SSR Mining Inc. | Çöpler Property S-K 1300 Report | February 12, 2024 SLR Project No.: 138.21581.00006 |
The Greater Çakmaktepe (Çakmaktepe and Çakmaktepe
Ext) deposit is a structurally controlled gold–silver–copper deposit, displaying typical replacement mineralization styles.
Mineralization is primarily associated with jasperoid and listwanite.
The mineralization at Çakmaktepe Ext occurs at a higher stratigraphic
level than that seen at Çakmaktepe. The emphasis at Çakmaktepe Ext is on the ophiolitic mélange rocks that have been
thrust into place on top of the basement metasediment and carbonate lithologies.
As with the Çöpler deposit, Çakmaktepe is thought
to be the result of intrusive activity that generated suitable conditions for mineralization of ophiolite, limestone, and hornfels lithologies.
The mineralization is controlled by a complex system of structural fluid pathways and traps controlled by lithological contacts, in typical
replacement-style processes, rather than being constrained by relatively discrete fault or shear zones characteristic of epithermal-style
mineralization.
The mineralization at Çakmaktepe Ext is also considered to be
related to fluids associated with diorite intrusions at depth, much like those observed at the Çöpler and Çakmaktepe
deposits. However, diorite dykes are less common at Çakmaktepe Ext, unlike the adjacent Çakmaktepe deposit and nearby Çöpler
deposit where diorite is a dominant lithology.
Mineralization is strongly structurally controlled. Two steep faults
are intruded by diorites and played a role as conduits for mineralization at Greater Çakmaktepe.
Relatively shallowly dipping thrust-related mineralization is characterised
at Çakmaktepe East, Çakmaktepe South-East, Çakmaktepe Central, and Çakmaktepe North. This is interpreted as
a ramp-flat stacked thrust system that has resulted in rollover/stack geometries. Key to each structurally associated style of mineralization
is the juxtaposition of ophiolites against limestone and hornfels. Contacts between ophiolite and limestone, limestone and hornfels, and
all lithologies in contact with intrusive diorite sills and dykes are generally mineralized. The listwanite horizon is the most favourable
host rock for gold mineralization. Diorite intrusions show evidence of hydrothermal activity that either takes the form of massive iron-dominated
replacement (magnetite, specular hematite, or pyrite) or sheeted crystalline quartz vein bearing jasperoid closer to diorite contacts.
In the north at Çakmaktepe Ext., mineralization also occurs along
low-angle thrust zones between ophiolite, listwanite, and dolomite and limestone (Figure 6-8); however, at Çakmaktepe Ext the
thrust planes have not resulted in stacking and forelimb-backlimb geometries. The thrust zones occur within a complex northwest trending
structural zone that is cut by multiple high-angle faults that together result in multiple rotated fault blocks and mineralized zones.
Other mineralized zones within the Çakmaktepe deposit are referred
to as ‘contact’ styles of mineralization where iron, sulfur, gold, copper, and silver have been emplaced along thrust surfaces
where ophiolite is next to limestone and metasediment. Epithermal veining and replacement alteration and textures are prevalent. Skarn
and metasomatic mineralization occur in contact with intrusive diorite dykes, sills, and stocks.
Oxide mineralization at Çakmaktepe is predominantly characterised
by silica–iron–carbonate-rich jasperoid, less-siliceous iron-rich gossan, and epithermal veined and brecciated limestone.
The mineralization at Çakmaktepe Ext is related to crystalline
and chalcedonic quartz veins within the brecciated and silicified listwanite and dolomite zones. The mineralization is predominantly in
the form of oxide, with sulfide mineralization confined to limited pyrite-rich jasperoid zones. Clay/gossan in jasperoid or limestone
karstic boundaries also contain high-grade gold across Çakmaktepe Ext.
| | 6-15 | |
| SSR Mining Inc. | Çöpler Property S-K 1300 Report | February 12, 2024 SLR Project No.: 138.21581.00006 |
Gold grades increase at dolomite/listwanite contacts and within silica-rich
listwanite that acts as horizontal traps for higher-grade gold-bearing mineralization. Increases in gold grade can be seen along the lithological
contacts. Elevated grades can exist within either contact lithology. Several drill holes show a very rapid downhole change in gold grade
from mineralized to unmineralized material, indicating that mineralization is tightly constrained instead of disseminated across the deposit.
| | 6-16 | |
| SSR Mining Inc. | Çöpler Property S-K 1300 Report | February 12, 2024 SLR Project No.: 138.21581.00006 |
Figure 6-8: Schematic of Greater
Çakmaktepe Geological Setting showing Mineralized Zones with Examples
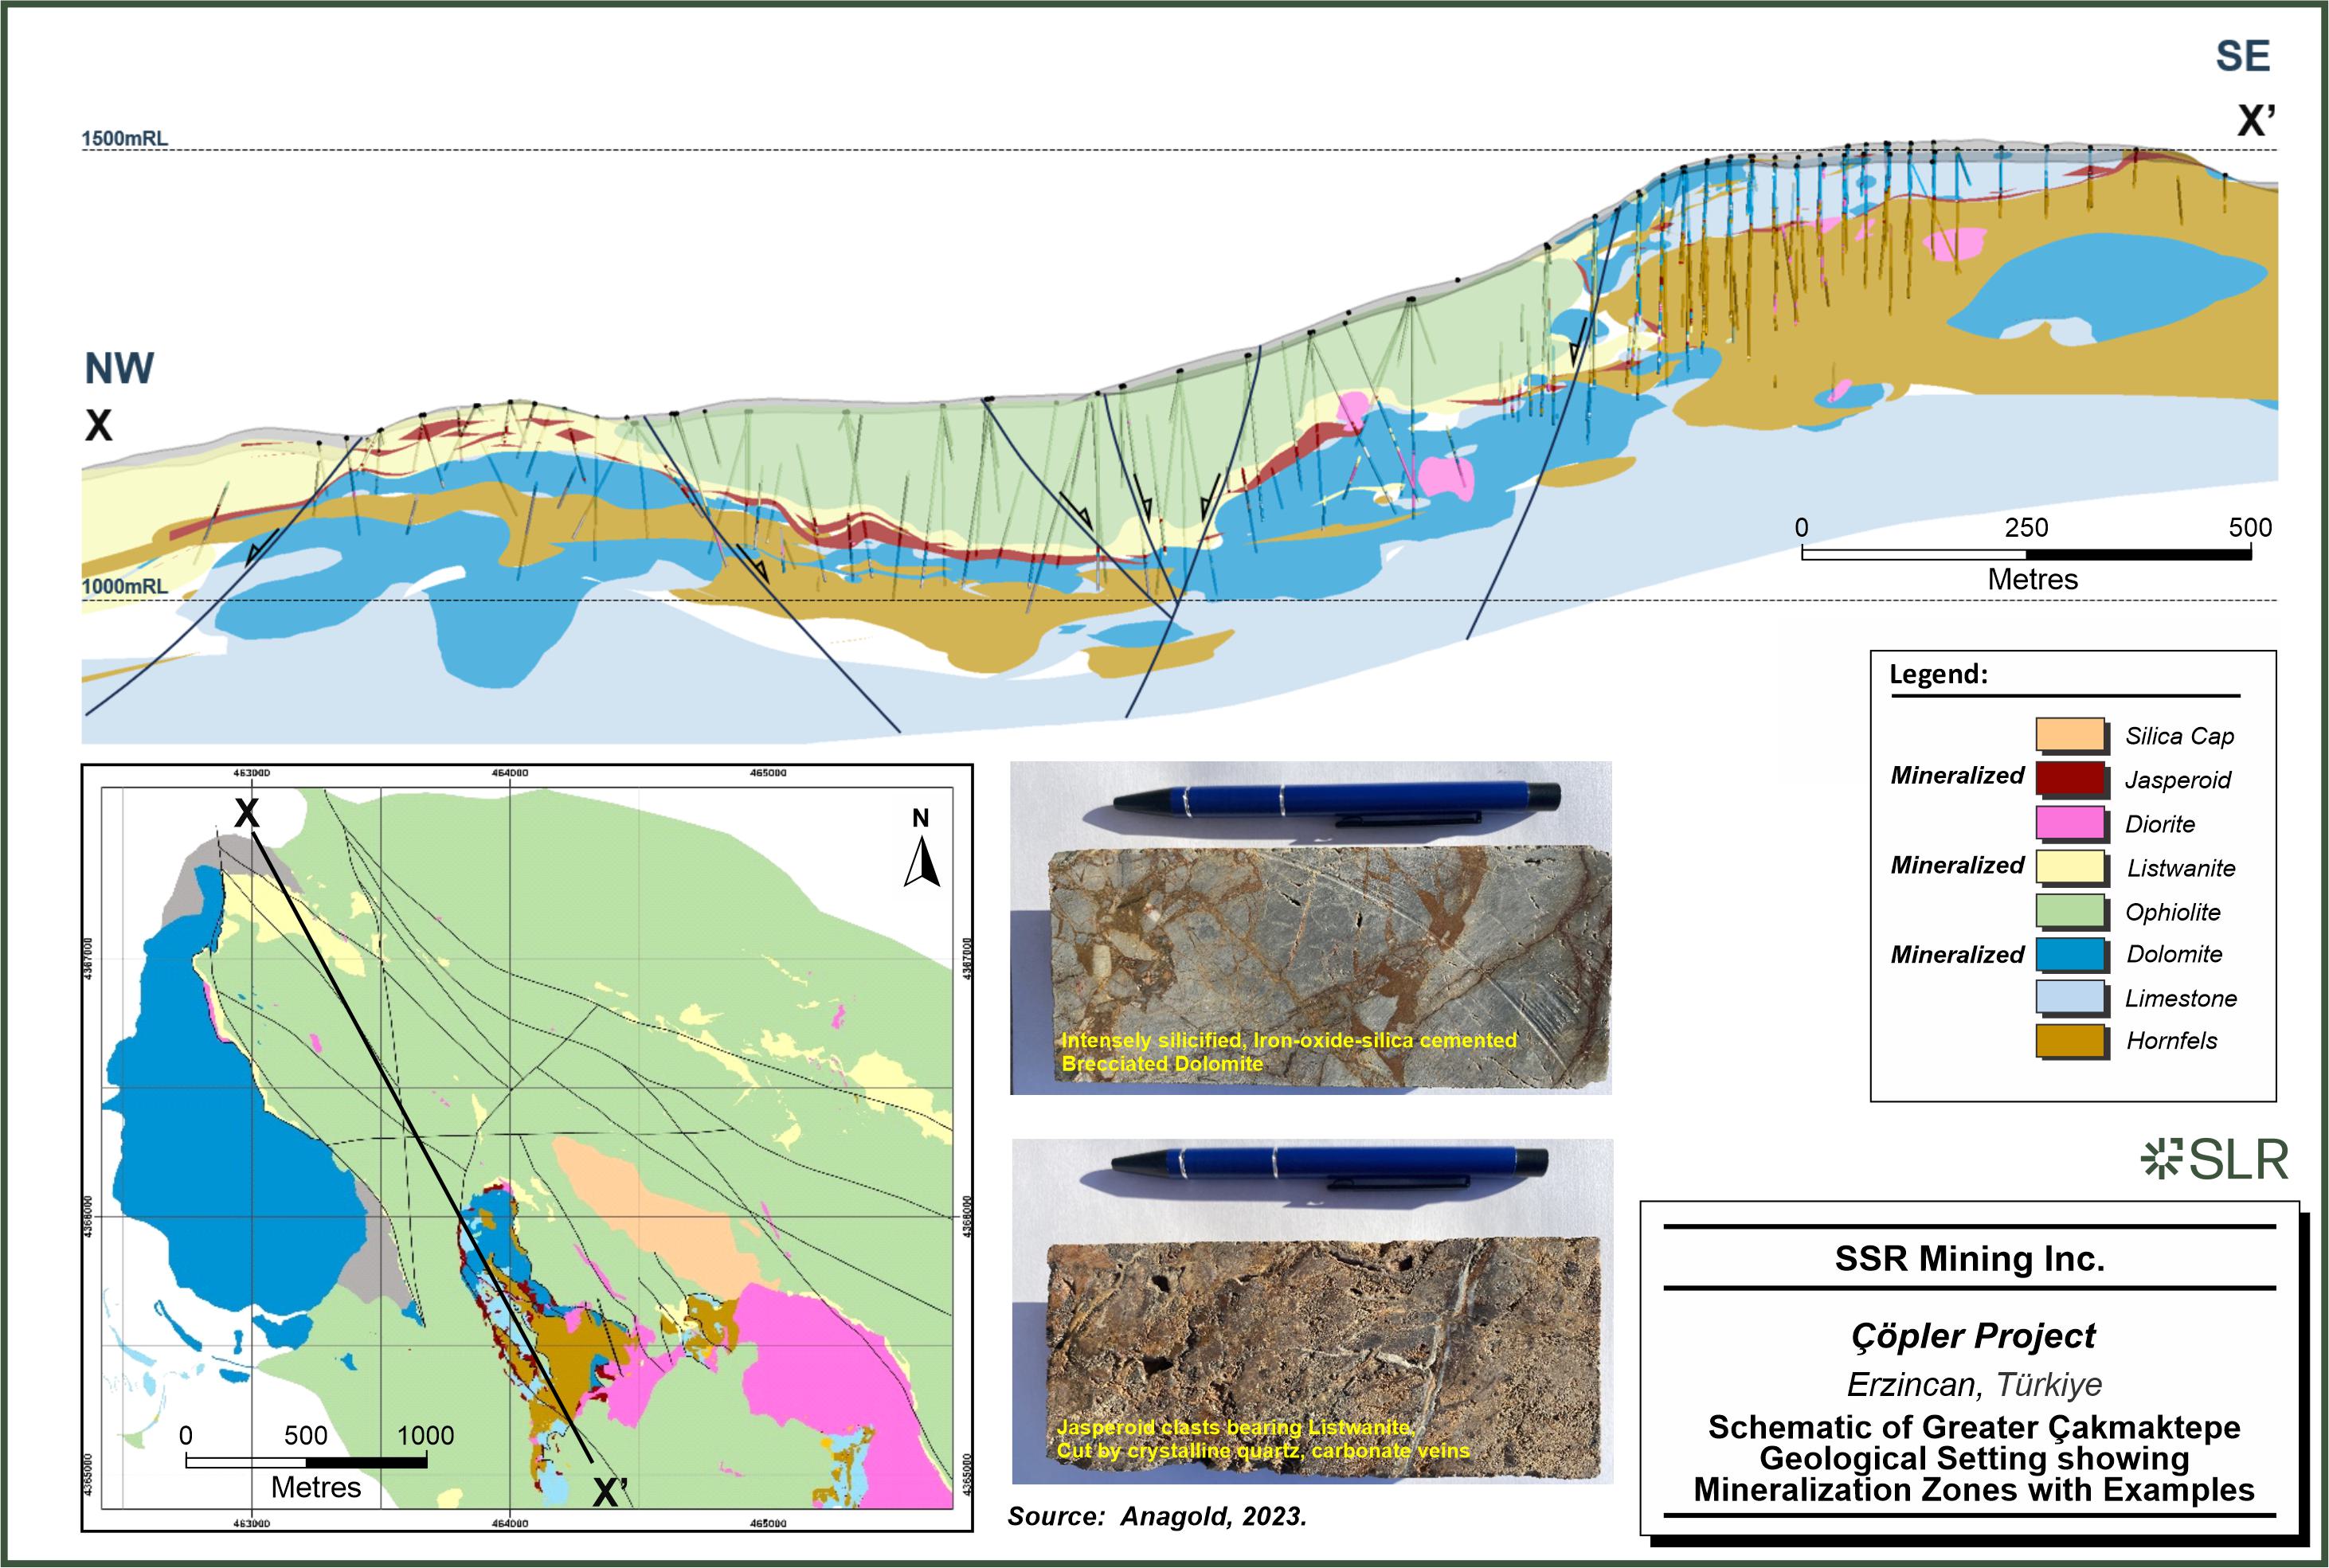
SSR
Mining Inc. Copler Project Erzincan, Turkiye Schematic of Greater Cakmaktepe Geological Setting showing Mineralization Zones with Examples
| | 6-17 | |
| SSR Mining Inc. | Çöpler Property S-K 1300 Report | February 12, 2024 SLR Project No.: 138.21581.00006 |
| 6.3.3.1 | Deposit Dimensions |
Bayramdere mineralization occurs approximately between elevations 1,290
m and 1,370 m, is approximately 370 m long (east–west) by 50 m to 110 m wide (north–south), and ranges in thickness from 5
m to 20 m.
The Bayramdere deposit is an oxide gold and copper deposit with similar
geological and mineralization characteristics to the Greater Çakmaktepe deposit. The geology is characterised by ophiolite thrust
over the limestone and dolomite, which are in turn intruded by granodioritic stocks (Figure 6-9 and Figure 6-10). Gossans are
generally observed as lenses and confined by normal faults.
The Bayramdere deposit is structurally controlled, displaying a replacement
gold (minor copper, minor silver) mineralization style. The deposit is dominantly represented by near-surface oxide mineralization, primarily
associated with iron-rich gossan.
The Bayramdere deposit is thought to be the result of intrusive activity
that generated suitable conditions for mineralization. A complex system of faults enabled emplacement of diorite intrusions and transport
of metalliferous fluids associated with the mineralising system. Key to each structurally associated style of mineralization is the juxtaposition
of ophiolite against limestone (±hornfels) to create the right geochemical conditions for the deposition of gold and other metals.
| | 6-18 | |
| SSR Mining Inc. | Çöpler Property S-K 1300 Report | February 12, 2024 SLR Project No.: 138.21581.00006 |
Figure 6-9: Geological Map of
the Bayramdere Deposit
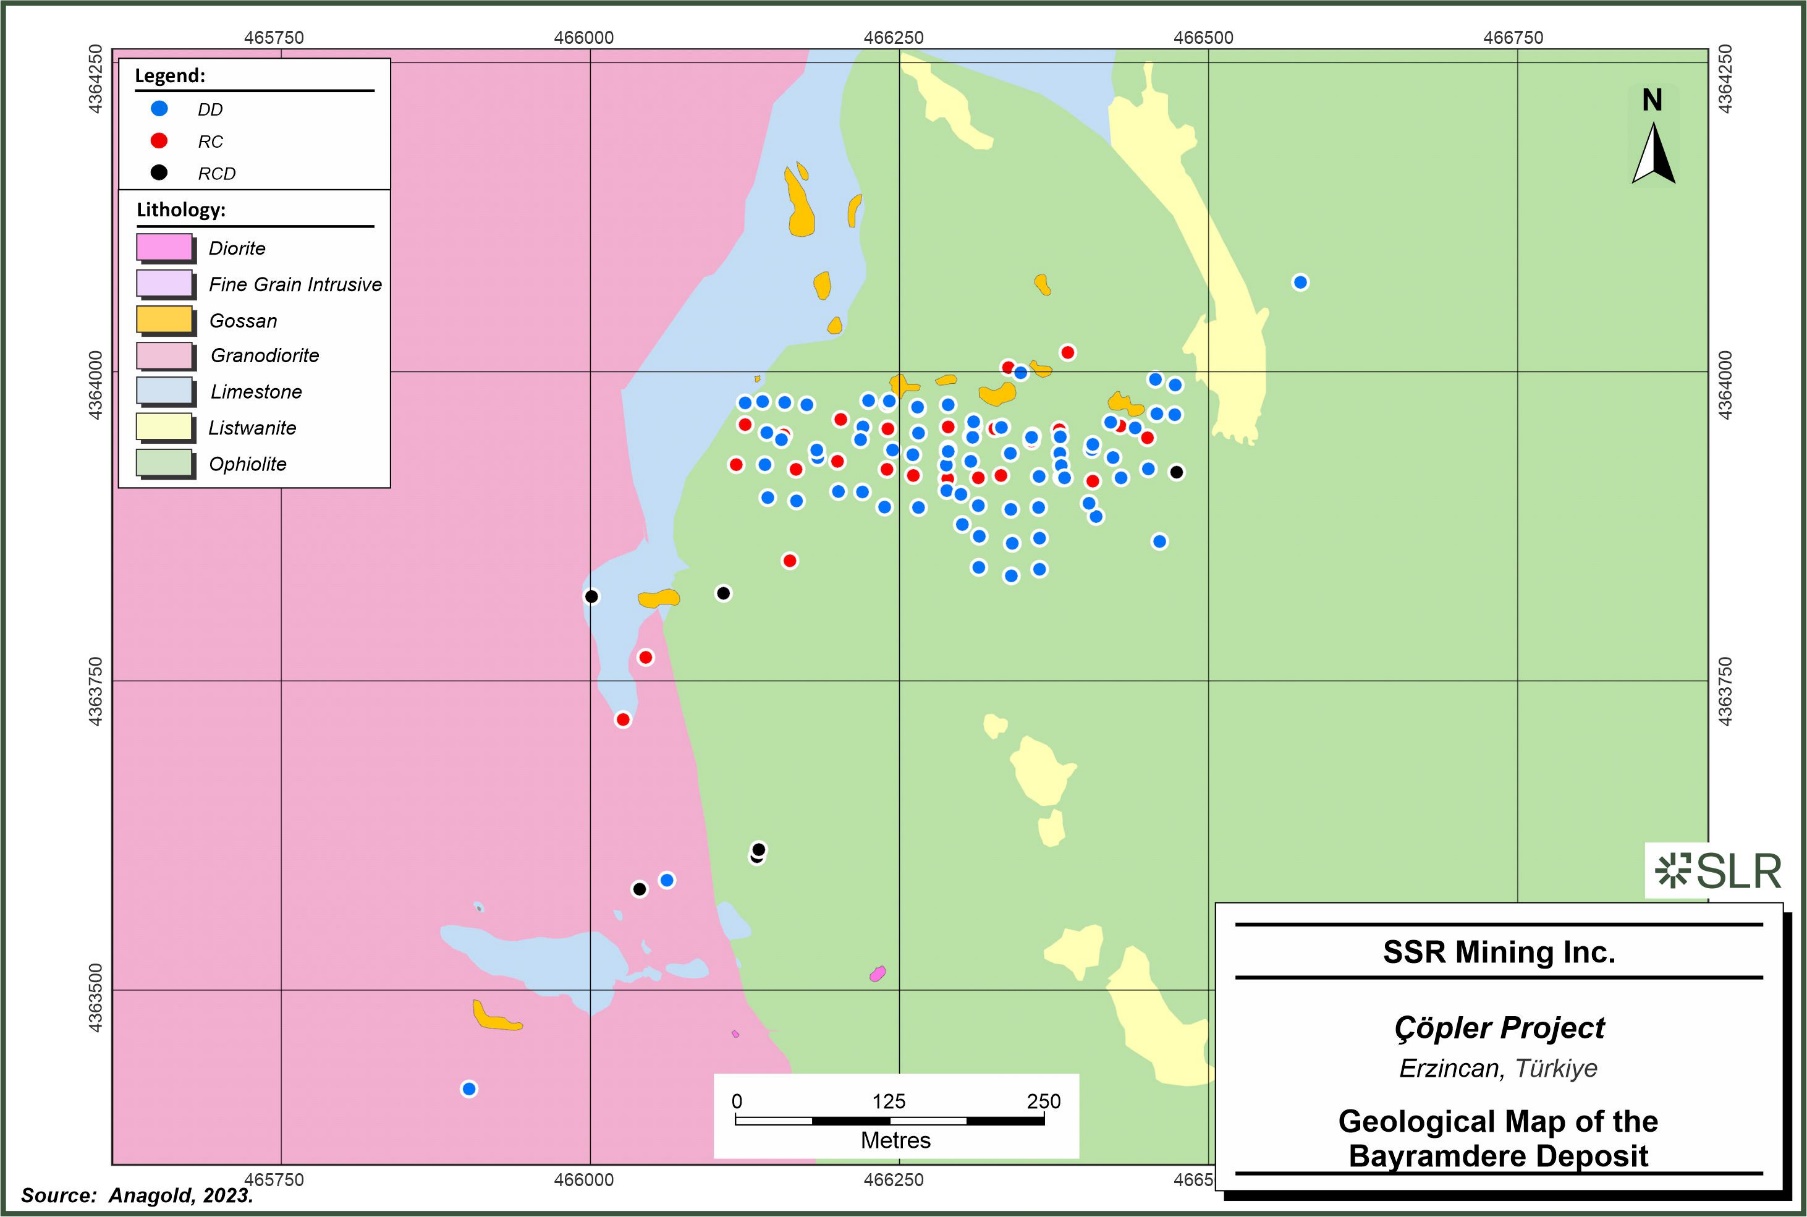
SSR
Mining Inc. Copler Project Erzincan, Turkiye Geological Map of the Bayramdere Deposit
| | 6-19 | |
| SSR Mining Inc. | Çöpler Property S-K 1300 Report | February 12, 2024 SLR Project No.: 138.21581.00006 |
Figure 6-10: Bayramdere Geology
Schematic Section
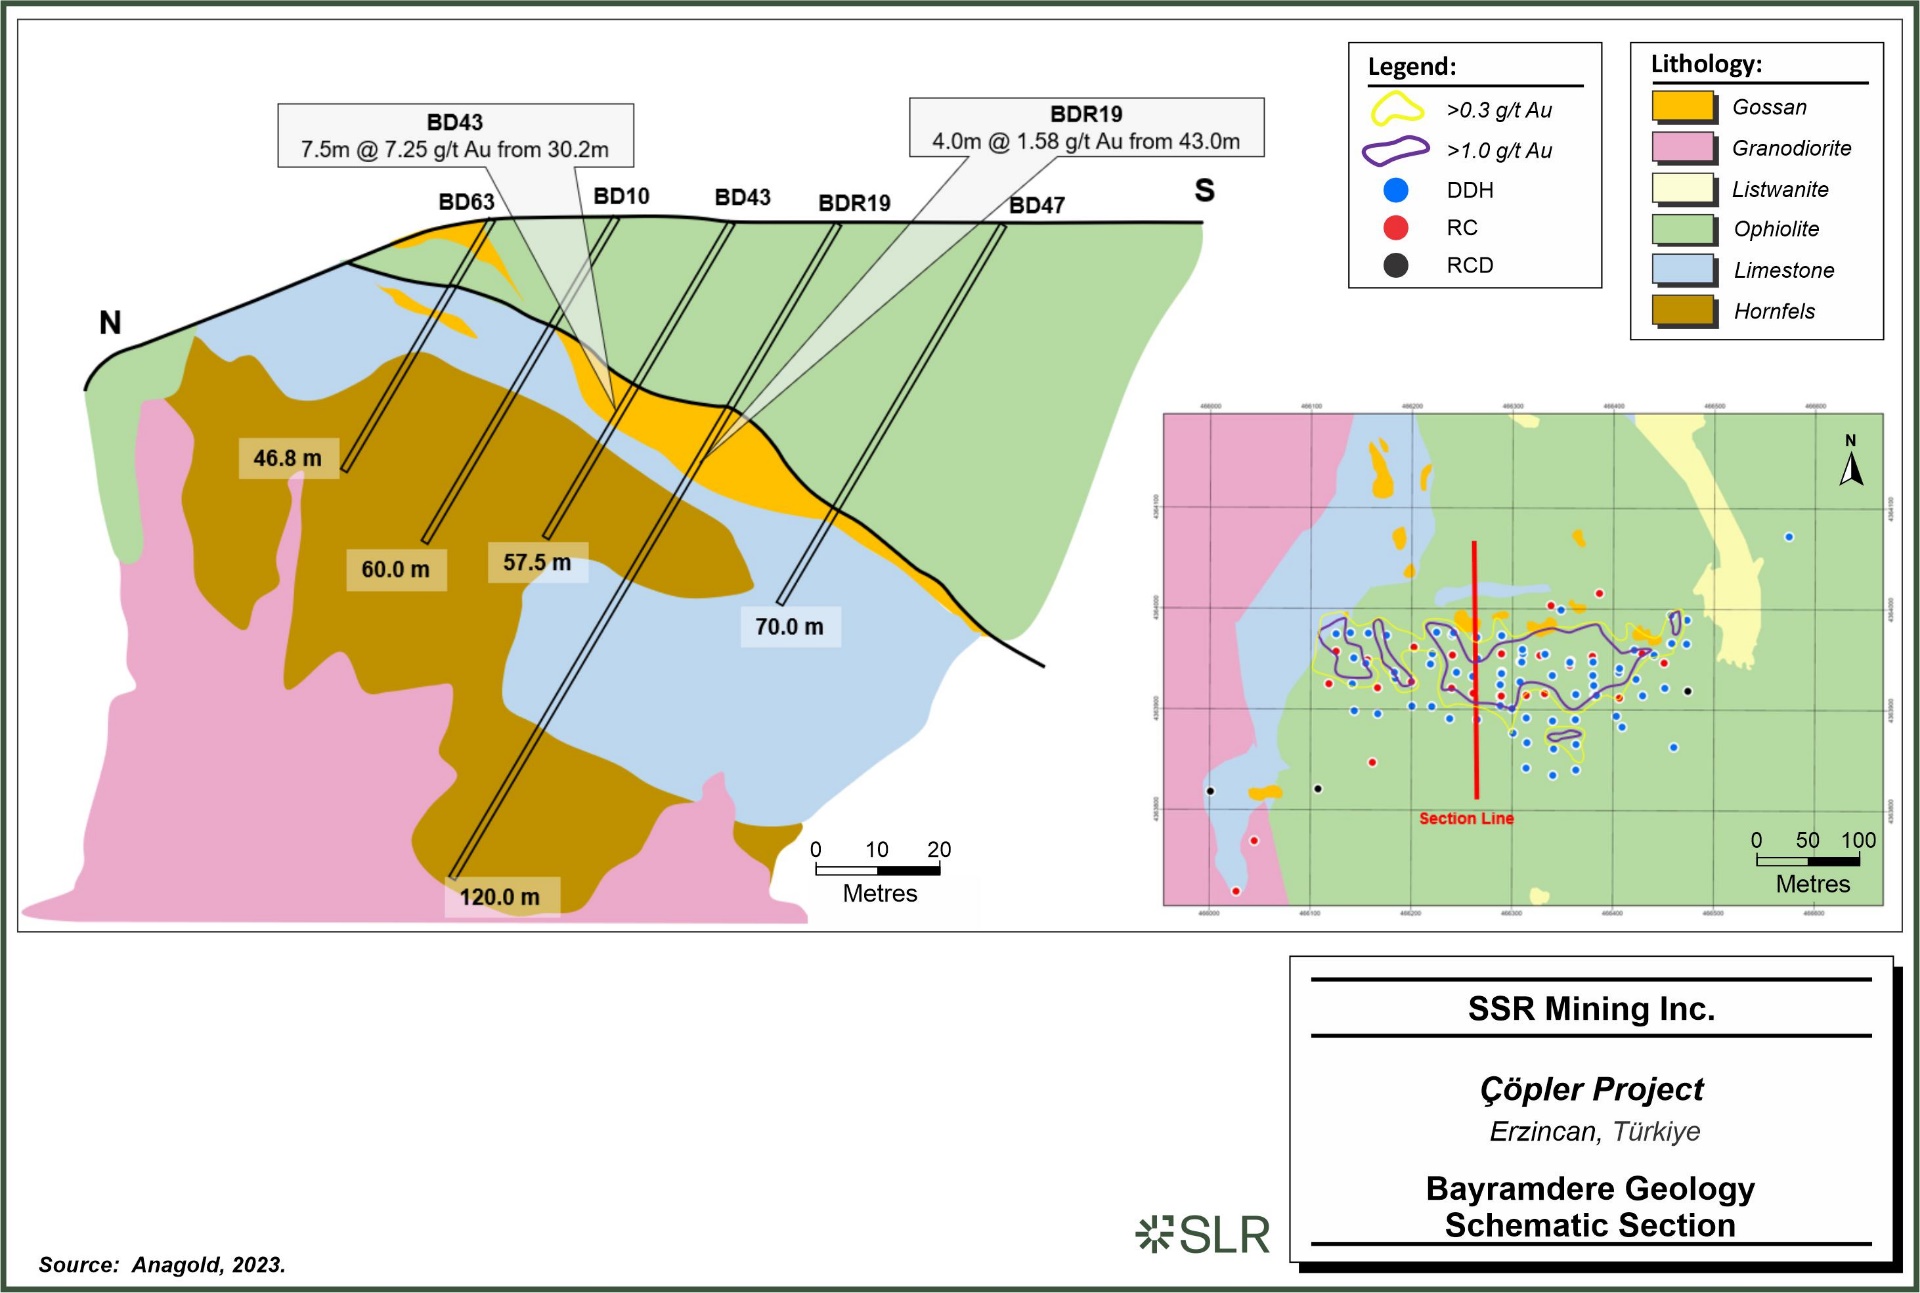
SSR
Mining Inc. Copler Project Erzincan, Turkiye Bayramdere Geology Schematic Section
| | 6-20 | |
| SSR Mining Inc. | Çöpler Property S-K 1300 Report | February 12, 2024 SLR Project No.: 138.21581.00006 |
The Bayramdere mineralization is localized within three stacked, shallow-dipping
zones that formed at the contact of limestone and ophiolite, with mineralization having replaced limestone along the contacts. The limestone /
ophiolite contacts are low-angle thrusts, typified by limestone wedges within a dominantly ophiolite stratigraphy. Mineralization occurs
within shallow iron-rich gossan horizons.
| 6.4 | Regional Prospects and Targets |
Since 2000, Anagold exploration programs within the Çöpler
district have identified several new gold-dominant and copper-gold prospects. The gold-dominant regional prospects include the Çöpler
Saddle and Elmadere. Copper–gold prospects are Aslantepe, Sarıdere, Findiklidere and Mavidere porphyries, located within the
Mavialtin Porphyry Belt (Figure 6-11), and the early exploration stage Meşeburnu porphyry, located west of the Çöpler
deposit.
Each of these prospects is discussed below.
| | 6-21 | |
| SSR Mining Inc. | Çöpler Property S-K 1300 Report | February 12, 2024 SLR Project No.: 138.21581.00006 |
Figure 6-11: Çöpler
Project Exploration Targets
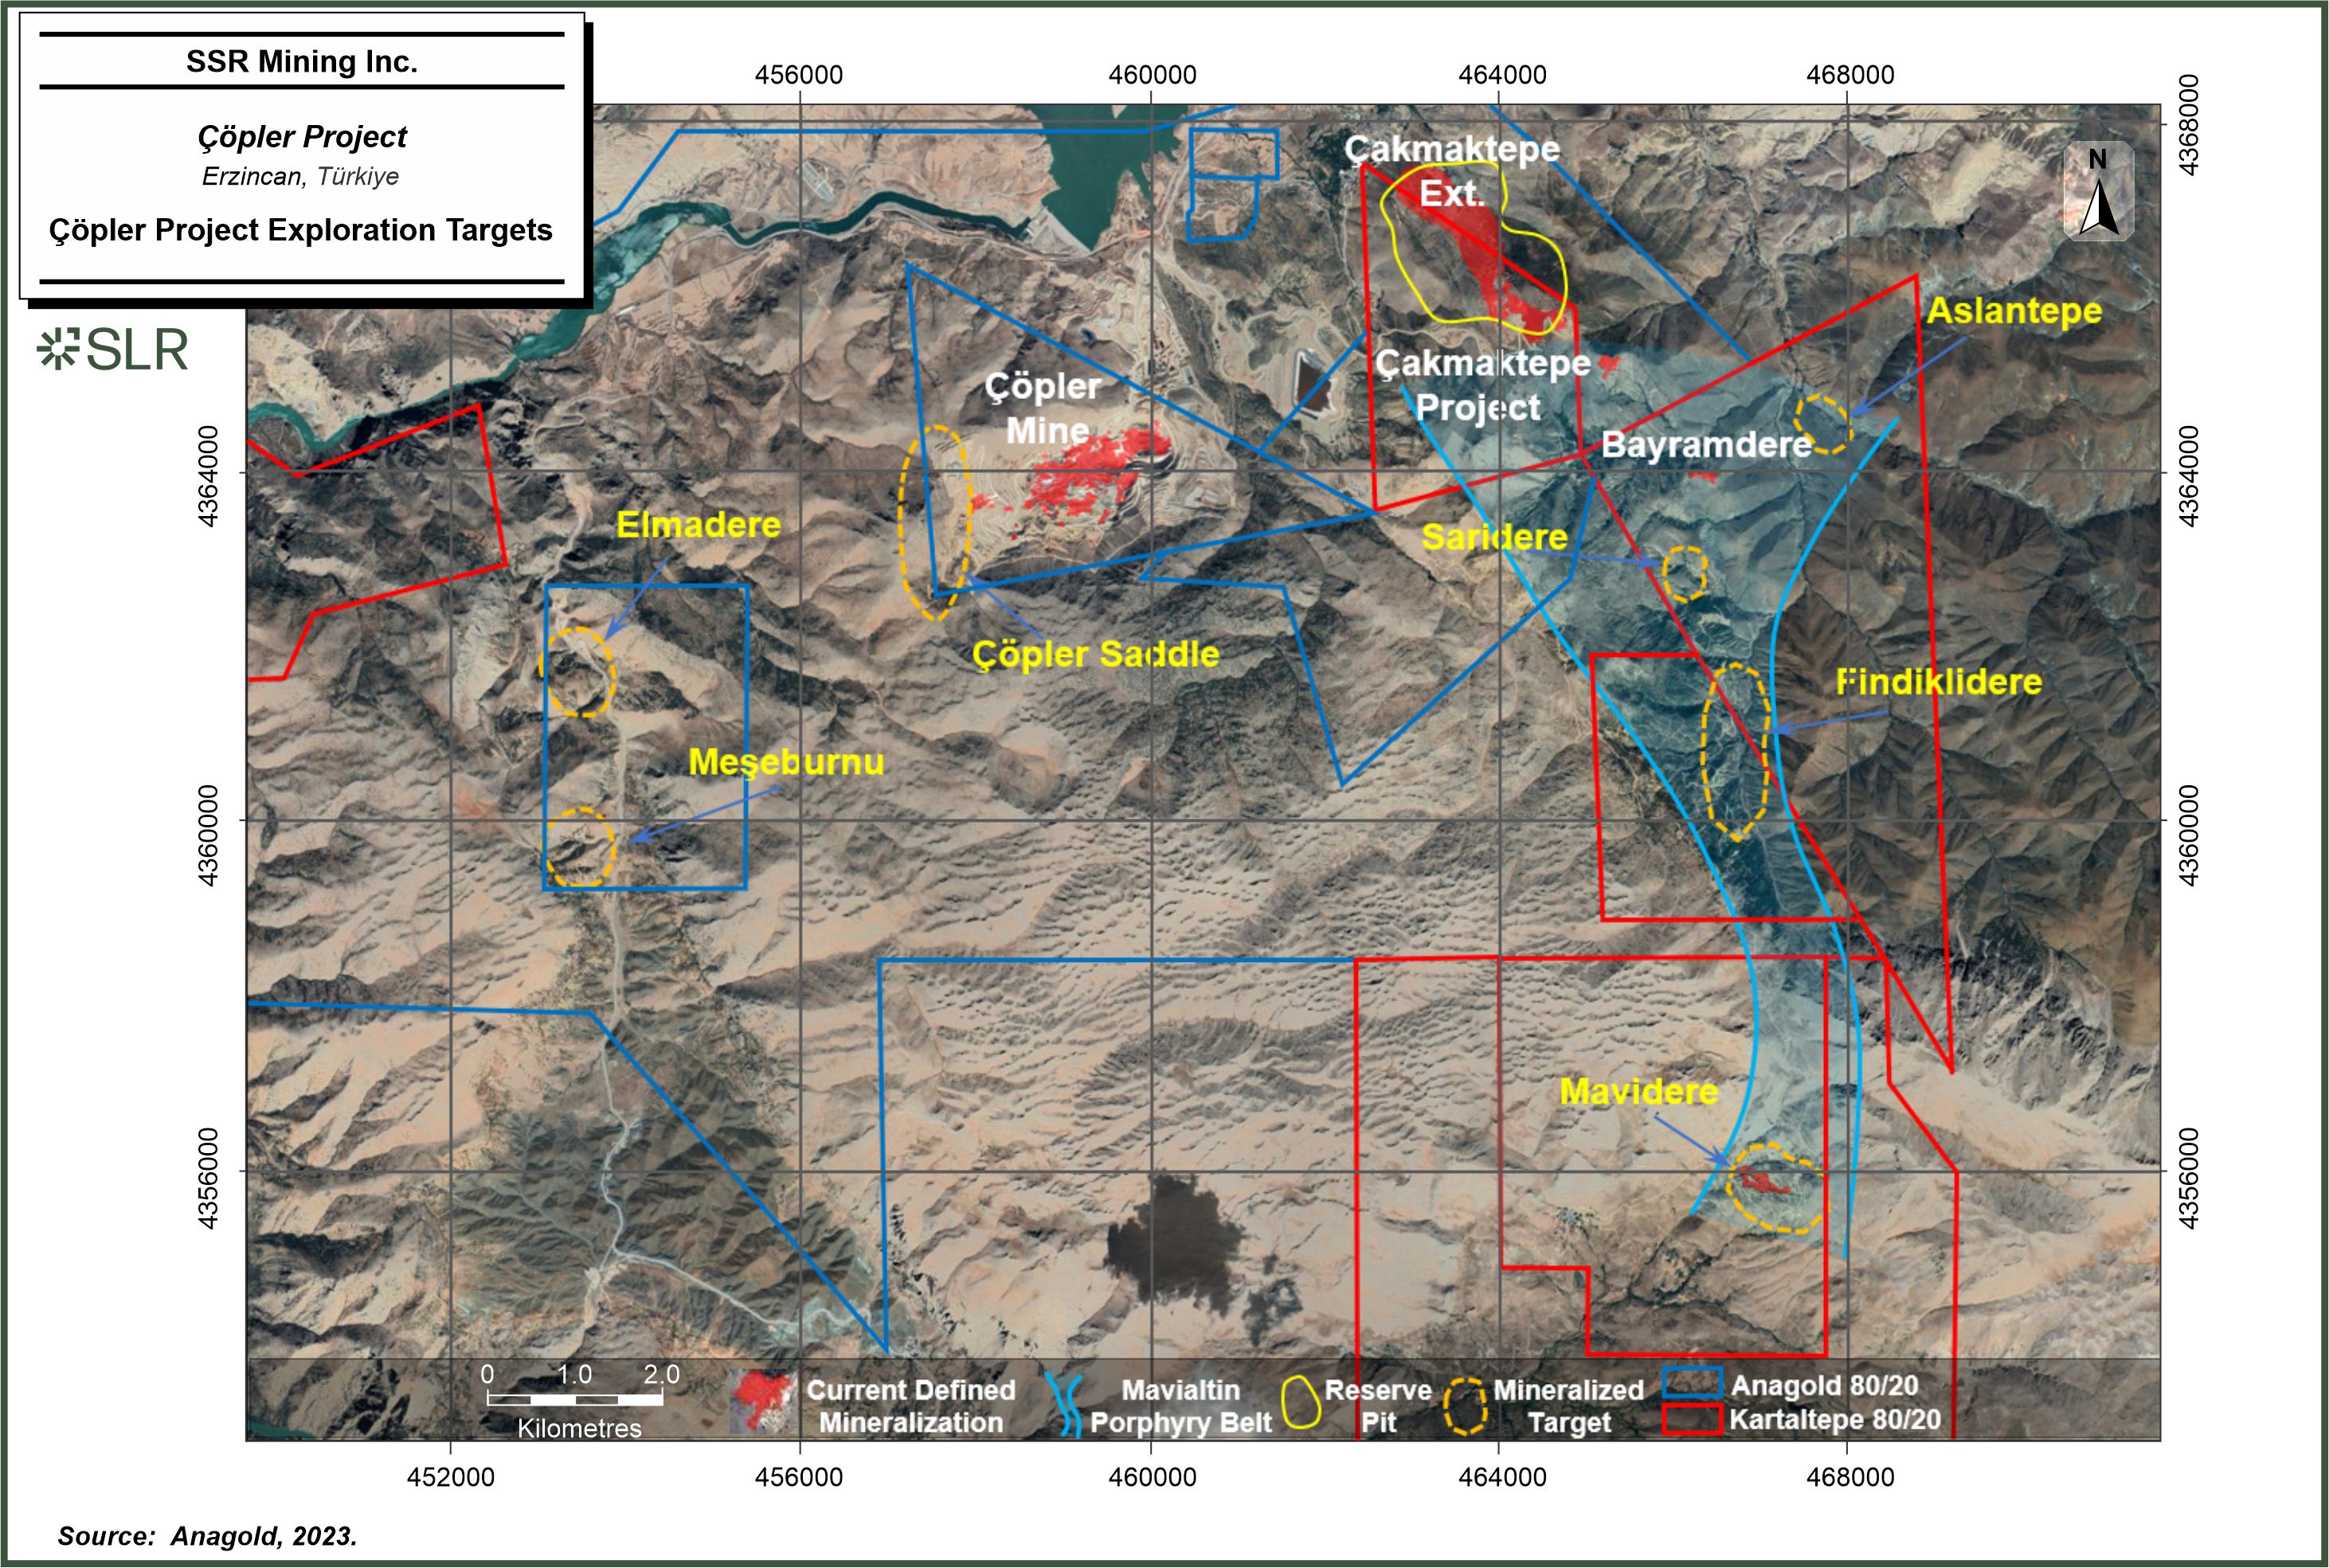
SSR
Mining Inc. Copler Project Erzincan, Turkiye Copler Project Exploration Targets
| | 6-22 | |
| SSR Mining Inc. | Çöpler Property S-K 1300 Report | February 12, 2024 SLR Project No.: 138.21581.00006 |
| 6.4.1 | Geology – Çöpler Saddle |
The Çöpler Saddle prospect borders the western flank of
the Çöpler mine. The Çöpler Saddle is associated with a shear zone defined as an arc-like structure that trends
north–south for approximately two kilometres. Along the shear zone, the geology is dominated by limestone, marble, and hornfels
units that are in turn intruded by small-scale microdioritic to granodioritic stocks. These lithologies were subjected to silica-clay
alteration with iron oxide developments along the local structures as well as clay-pyrite alteration. At the south of the zone, silica
is mainly observed as jasperoid lenses, of approximately two metres long and one metre wide, which occur along the hornfels and marble
contacts. At the centre of the zone, less silica is observed and larger gossan-like mineralized iron oxide bodies have formed.
| 6.4.2 | Geology – Meşeburnu and Elmadere |
The Meşeburnu and Elmadere prospects (former Demirmağara project
licence group) are located approximately seven kilometres southwest of the Çöpler deposit. The area is covered by ophiolites,
limestone, and metamorphic rocks that are intruded by dioritic to granodioritic stocks. Three types of mineralization have been identified
in the area:
| · | Gold-bearing skarn and jasperoid occurrences along limestone and granodiorite contacts. |
| · | Epithermal gold mineralization developed along ophiolite, listwanite, and limestone structural contacts (referred to as Elmadere mineralization). |
| · | Meşeburnu copper-gold porphyry mineralization. |
| 6.4.3 | Geology – Mavialtin Porphyry Belt Prospects |
The Mavialtin Porphyry Belt is a structural corridor approximately 6–7
km wide and extending over approximately 20 km from the Çakmaktepe deposit in the north to the Mavidere porphyry deposit in
the south. The Mavialtin Porphyry Belt contains the Mavidere, Findiklidere, Saridere, and Aslantepe porphyry copper-gold prospects.
| 6.4.3.1 | Geology – Mavidere |
The Mavidere porphyry copper-gold mineralization is hosted by hornblende–biotite
monzonite to monzogranite to granodioritic phases of a shallow porphyritic intrusive hosted by metamorphic and crystallised limestone.
At the centre of the porphyry system, the intrusive phases were subjected to mainly potassic alteration with clay and minor sericite overprinting
covering an area of approximately 800 m x 400 m. The porphyry system appears to continue underneath the moraine cover to the east and
south.
| 6.4.3.2 | Geology – Aslantepe |
The geology of the Aslantepe porphyry copper-gold prospect is dominated
by ophiolites thrusted over Jurassic to Cretaceous limestone, both of which are intruded by dioritic to granodioritic stocks and dykes.
The Aslantepe intrusives outcrop in a narrow corridor subjected to propylitic, potassic, and clay alteration. The potassic zone is characterised
by well-developed intense quartz–sulfide stockwork veinlets with secondary biotite, K-feldspar, and magnetite.
| | 6-23 | |
| SSR Mining Inc. | Çöpler Property S-K 1300 Report | February 12, 2024 SLR Project No.: 138.21581.00006 |
| 6.4.3.3 | Geology – Sarıdere |
The Sarıdere porphyry copper-gold prospect is covered by metamorphic
limestone and ophiolite, which are in turn intruded by tonalitic to granodioritic stocks. The prospect was initially identified by stream
sediment and soil anomalies. In 2018 and 2019, exploration activities identified potassic-altered porphyry intrusive outcrops covering
an area of approximately 800 m x 500 m, with a phyllic alteration halo around the potassic zone of 4.3 km x 0.6 km.
| 6.4.3.4 | Geology – Fındıklıdere |
The Findiklidere porphyry copper-gold prospect is covered by massive
Jurassic to Cretaceous limestone, which has been over-thrusted by ophiolites on the eastern flank. These units were intruded by fine to
medium-grained tonalitic to granodioritic intrusive stocks. The porphyry copper mineralization is characterised by well-developed stockwork
quartz-magnetite-pyrite veins with copper. Peripheral iron-copper-gold skarns are observed within the limestone. In 2018, the geology,
structure, and alteration were re-mapped to better understand the porphyry potential of the prospect which indicated that the porphyry
mineralization was potentially continuing underneath the ophiolitic body to the southwest of the known porphyry mineralization.
Porphyry copper-gold systems host some of the most widely distributed
mineralization types at convergent plate boundaries, including porphyry deposits centred on intrusions; skarn, carbonate-replacement,
and sediment-hosted gold deposits in increasingly peripheral locations; and high to intermediate-sulfidation epithermal deposits.
The alteration and mineralization in porphyry copper-gold systems are
zoned outward from the stocks or dyke swarms, which typically comprise several generations of intermediate to felsic porphyry intrusions.
Porphyry copper (± gold, ± molybdenum) deposits are centred on the intrusions, whereas carbonate wall rocks commonly host
proximal copper-gold skarns, less common distal zinc-lead and/or gold skarns, and, beyond the skarn front, carbonate-replacement copper
and/or zinc-lead-silver (± gold) deposits, and/or sediment-hosted (distal-disseminated) gold deposits. Peripheral mineralization
is less conspicuous in non-carbonate wall rocks but may include base metal-bearing or gold-bearing veins and mantos (Sillitoe, 2010).
Skarn deposits are typically hosted in mineralogically simple fine-grained clastic and carbonate sedimentary rocks. Skarn mineralogy and
metal content is largely dependent on the crystallisation history and genesis of associated plutons (Meinert et al., 2005).
The Çöpler district is located at the edge of a convergent
plate boundary. It is characterised by a complex structural history and is associated with intermediate intrusive and carbonate-rich host
lithologies. As such, porphyry copper-gold systems and related styles of mineralization are appropriate models to be applied across the
Çöpler district.
The Çöpler deposit consists of three major mineralization
types that are closely associated with each other: low-grade sub-economic porphyry copper-gold-molybdenum mineralization characterised
by well-developed alteration zones and stockwork quartz veins (Main Zone); intermediate sulfidation epithermal mineralization observed
in the Manganese Zone as clusters of bright pink, banded, colloform rhodochrosite base metal sulfide veins and breccia lodes; and iron-gold
(± copper) skarn with related carbonate replacement gold mineralization.
| | 6-24 | |
| SSR Mining Inc. | Çöpler Property S-K 1300 Report | February 12, 2024 SLR Project No.: 138.21581.00006 |
The setting, alteration mineralogy, and mineralization characteristics
of the Manganese Zone are somewhat consistent with an intermediate sulfidation epithermal system, as defined in Hedenquist et al., (2000).
Exploration programs modeled on epithermal-style deposits have shown
success in the Çöpler district. A multi-phase porphyry model with a barren trapping system and a possible mineralized porphyry
underneath it is also applicable.
| | 6-25 | |
| SSR Mining Inc. | Çöpler Property S-K 1300 Report | February 12, 2024 SLR Project No.: 138.21581.00006 |
SRK (2021) compiled and updated the Project conceptual hydrogeological
model with new geological data, established a numerical model and used it to evaluate the hydrogeology of the Project area.
| 7.1.1 | Existing Data Evaluation, Field Investigation, and Hydrogeology Conceptual Model |
Within the regional hydrology area, lithological units are defined in
three main classes according to their underground water transport and transmission properties. These units are:
| · | Low permeate units: such units contain some thin layers that are more permeable than other layers with small extensions and provide
water through sources with a flow rate of less than 1 L/s. |
| · | Conductive and very permeable units: Munzur Formation limestone and Quaternary alluvium units. |
A total of 49 wells for groundwater observation and water supply purposes
have been drilled. Twenty-one of the 49 are still active; the others have been decommissioned. Fourteen of these 21 are being used for
observation and the remaining seven are used for water supply purposes.
A total of four geotechnical and hydrogeological test holes was completed
for the Çöpler Expansion Pre-feasibility Studies in 2023.
The locations of the hydrogeology wells are presented in Figure 7-1.
| | 7-1 | |
| SSR Mining Inc. | Çöpler Property S-K 1300 Report | February 12, 2024 SLR Project No.: 138.21581.00006 |
Figure 7-1: Groundwater Wells
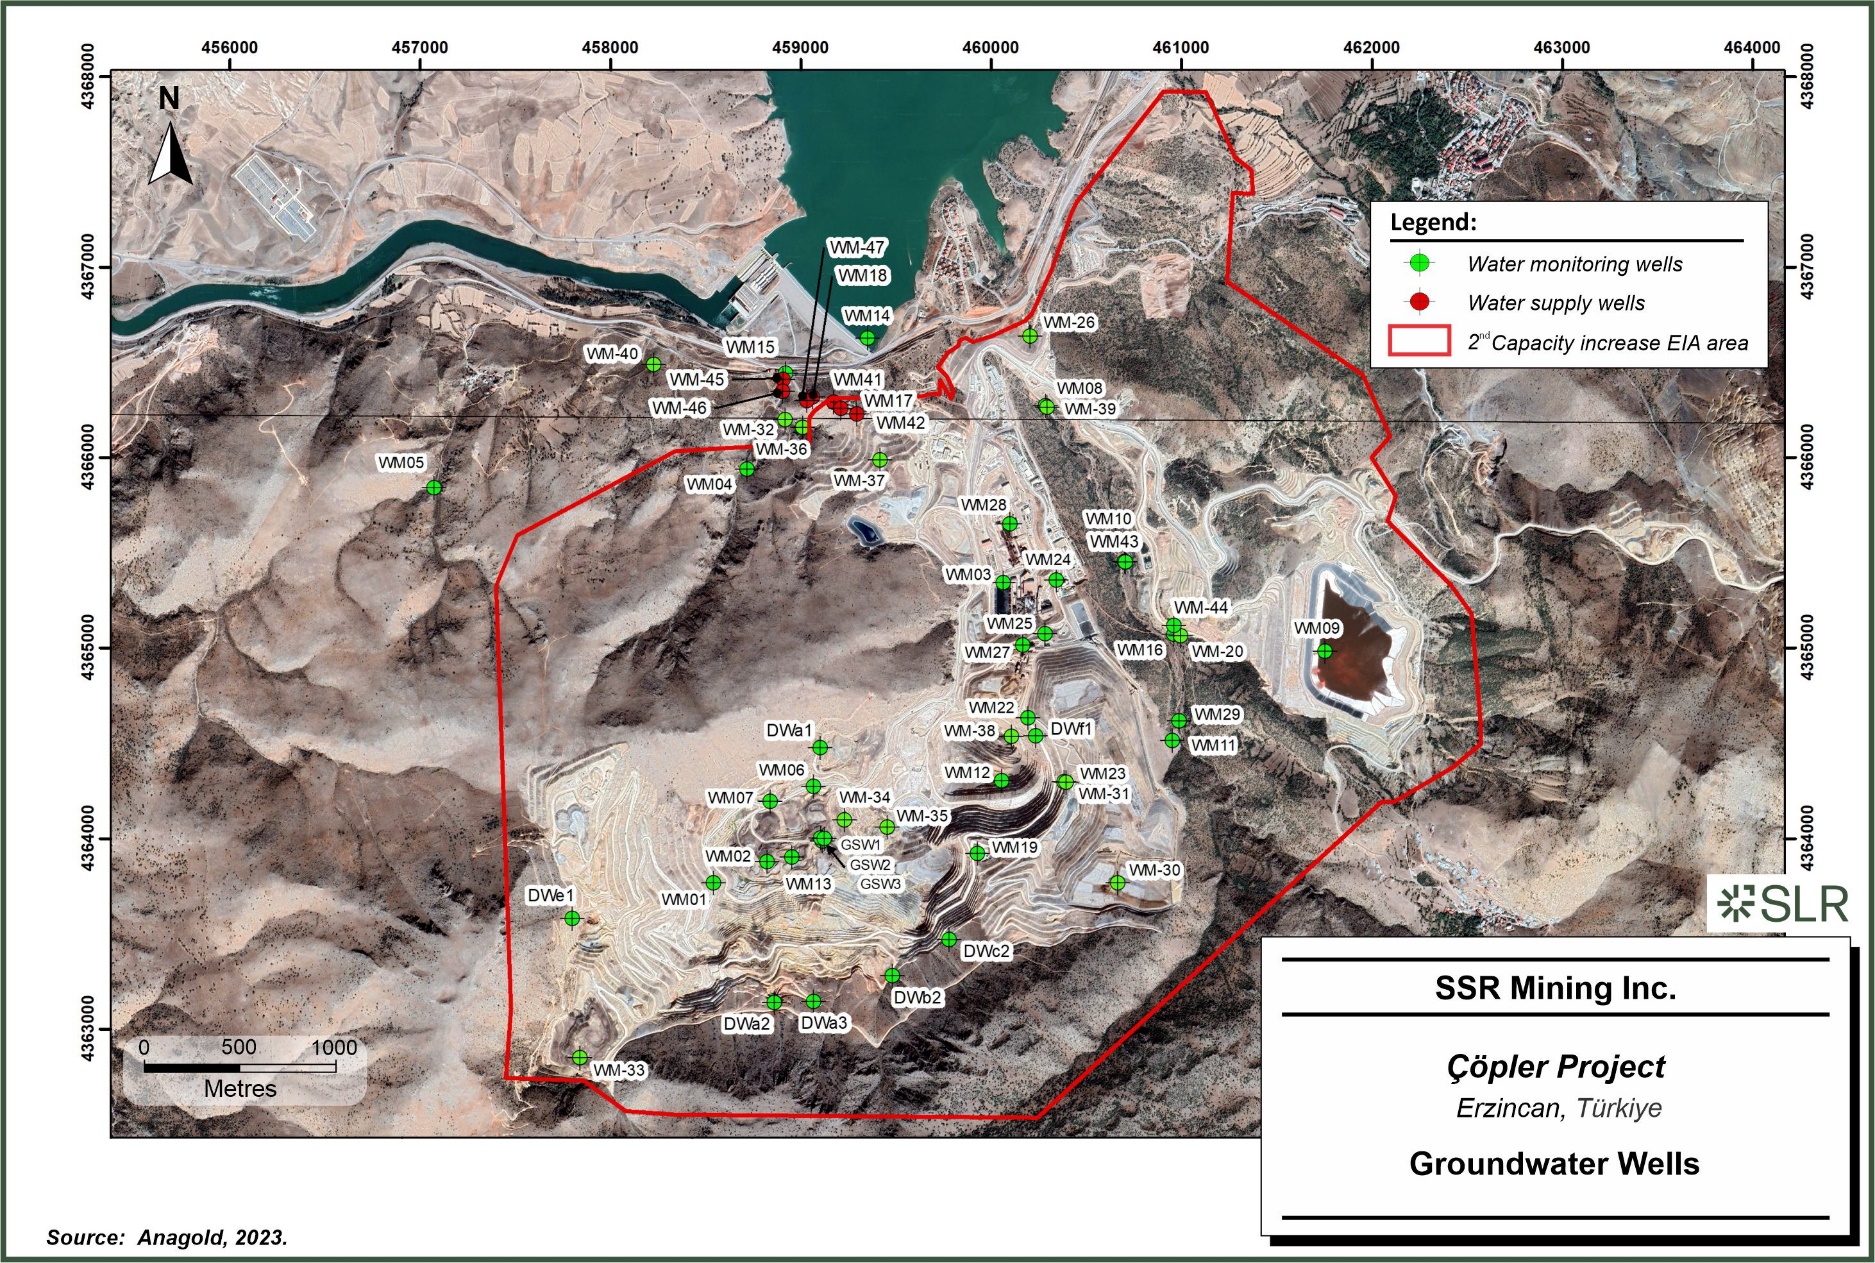
SSR
Mining Inc. Copler Project Erzincan, Turkiye Groundwater Wells
| | 7-2 | |
| SSR Mining Inc. | Çöpler Property S-K 1300 Report | February 12, 2024 SLR Project No.: 138.21581.00006 |
Groundwater recharges from the infiltration of precipitation through
secondary porosity in the bedrock terrain. Groundwater elevation data indicate that the flow direction is typically northward to the Karasu
River through the Munzur limestone. During the resource drilling and subsequent monitoring well installation programs, perched groundwater
conditions were reported above the clay-altered intrusions. The full extent and volume of perched groundwater is unknown, although Anagold
anticipated that the perched groundwater is only present in restricted areas.
Groundwater elevations at the Çöpler Project range from
1,328.5 m at Well GMW-10 (southern end of the site) to 864.7 m at Well GMW-09 (northern end of the site). Observations of cavernous features
(karst) during drilling and high-values of hydraulic conductivity from aquifer tests suggest an area of karst development in the limestone
near the Karasu River, at boreholes GMW-09 and GMW-24. This was incorporated into the groundwater flow model as an area of high hydraulic
conductivity near these wells and along the Sabırlı Fault.
Geotechnical studies have been conducted since 2011. A summary of the
work completed, including geotechnical recommendations, is presented in Section 13.1.
| 7.3 | Çöpler Deposit Exploration |
Exploration of the Çöpler deposit has been conducted by
Anagold and its predecessors since September 1998. A summary of work completed to date is provided in Table 7-1.
Table 7-1: Overview of Anagold
Exploration at Çöpler Deposit
| Year |
Deposit |
Exploration Type |
Details |
| 1998–1999 |
Çöpler |
Surface Studies |
Geological and reconnaissance mapping. Rock chip, grab, soil, channel, and stream sediment geochemical sampling. |
| 2000–2013 |
Çöpler |
Geophysics |
Ground geophysical surveys including ground magnetic, complex resistivity
/ induced polarisation (IP), time domain IP, and controlled source audio-frequency magneto-telluric (CSAMT) surveys.
A regional helicopter-borne geophysical survey.
Acquisition of satellite imagery. |
| 2014–2016 |
Çöpler |
Drilling |
Resource expansion and definition drilling |
| 2017-2020 |
Çöpler |
Geological and Structural Mapping |
Kinematic interpretation of major structures. Define/confirm main faults and their relationships with mineralization. Structural pit mapping and analyse of ore triggering features. |
| 2017–2020 |
Çöpler |
Drilling |
Oxide Resource expansion drilling and Resource definition drilling |
| 2021–2023 |
Çöpler |
Geophysics |
Reprocessing of geophysical data |
| | 7-3 | |
| SSR Mining Inc. | Çöpler Property S-K 1300 Report | February 12, 2024 SLR Project No.: 138.21581.00006 |
| 7.3.1 | Geological Mapping – Çöpler Deposit |
Surface mapping and sampling have been undertaken over the life of the
Project, culminating in detailed geological maps of the Çöpler valley, e.g. Figure 6-5. Geological mapping is used in
support of exploration vectoring, exploration activities, infrastructure locations, mine planning, and environmental monitoring.
| 7.3.2 | Geochemical Sampling – Çöpler Deposit |
Owing to the long history of the Çöpler area, geochemical
sampling techniques used for exploration purposes have been typically superseded by data from drilling and open pit mining. Current exploration
combines the use of surface sampling methods (rock-chip, stream-sediment, and soils), following industry standard sampling and quality
assurance and quality control (QA/QC), along with structural modeling and drilling (downhole geochemistry) to explore for mineralization.
A total of 2,608 soil samples, 128 stream-sediment, and 4,959 rock-chip samples have been collected at Çöpler.
| 7.3.3 | Geophysics – Çöpler District |
Various ground and airborne geophysical surveys have been conducted
at the Çöpler deposit as well as across the wider Çöpler district since mid-2000. Surveys carried out include
ground magnetic, complex resistivity / induced polarisation (IP), time domain IP, and CSAMT surveys, as well as a regional helicopter-borne
aeromagnetic survey that included the broader Çöpler district. Raw data from helicopter-borne aeromagnetic, ground-mag and
IP/R surveys were re-processed in 2023 as part of a district-wide target generation program.
| 7.4 | Greater Çakmaktepe Exploration |
The Çakmaktepe deposit and surrounding mineralized zones were
identified by stream sediment samples with elevated gold geochemistry. Drilling at Çakmaktepe started in 2012. Exploration activities
began at the Çakmaktepe Ext deposit in 2017 and included geological mapping, geochemical sampling, and DD drilling programs.
Drilling at Çakmaktepe since 2019 has been designed to improve
the Mineral Resources identified at Çakmaktepe North. Data collected to date include magnetic geophysical surveys, outcrop and
bench wall mapping, rock and soil sampling, and both RC and DD drilling.
Table 7-2: Overview of Anagold
Exploration at Greater Çakmaktepe
| Year |
Deposit |
Exploration Type |
Details |
| 2000–2012 |
Çakmaktepe |
Surface Studies |
Regional geological and reconnaissance mapping. |
| 2012–2019 |
Çakmaktepe |
Surface Studies |
Geological mapping, rock chip, grab, soil, channel, and stream sediment geochemical sampling |
| 2015-2018 |
Çakmaktepe Ext |
Surface Studies |
Geological mapping, rock chip, grab, soil, channel, and stream sediment geochemical sampling |
| | 7-4 | |
| SSR Mining Inc. | Çöpler Property S-K 1300 Report | February 12, 2024 SLR Project No.: 138.21581.00006 |
| 7.4.1 | Geological Mapping – Greater Çakmaktepe |
The first geological mapping study in the area was conducted in 2000.
Surface mapping and sampling have been regularly undertaken over the life of the Project, culminating in detailed geological maps of Greater
Çakmaktepe, shown in Figure 6-7. Geological mapping is used in support of exploration vectoring, exploration activities, infrastructure
locations, mine planning, and environmental monitoring. Detailed lithology and structural mapping are currently ongoing on the benches
exposed after production.
| 7.4.2 | Geochemical Sampling – Çakmaktepe Deposit |
Geochemical sampling programs, following industry standard sampling
and QA/QC procedures, were initiated at Çakmaktepe in 2014 and included rock-chip and soil sampling. A total of 5,160 rock-chip
and 2,249 soil samples have been collected from the Çakmaktepe deposit since 2014. The deposit has been fully covered with a 50
m x 50 m soil sampling grid. No rock-chip or soil samples were collected from 2021to 2023.
| 7.4.1 | Geochemical Sampling – Çakmaktepe Ext Deposit |
Geochemical sampling programs at Çakmaktepe Ext have included
rock-chip/channel and soil sampling following industry standard sampling and QA/QC procedures. A total of 2,107 rock-chip/channel samples
and 1,843 soil samples have been collected from the Çakmaktepe Ext deposit. No rock-chip or soil samples were collected from 2021
to 2023.
Drill hole totals presented in this section include holes drilled for resource
definition, geotechnical, and metallurgical purposes before the effective date October 31, 2023.
| 7.5.1 | Drilling – Çöpler Deposit |
The Çöpler deposit continues to be tested by reverse circulation
(RC) and diamond core (DD) drilling. A total of 2,679 drill holes have been drilled for a total of 407,589.4 m drilled
(Table 7-3 and Table 7-4).
Drill hole spacing at surface is at a nominal 50 m; however, in some
areas, the drill spacing has been reduced to 25 m. Step-out drilling at the Çöpler deposit has defined most of the lateral
boundaries of the mineralization.
Drilling since 2021 has focused on testing the main Au-bearing
structures to improve geological and grade continuity to aid mineral resource definition and pit design. A total of 421 drill holes
were drilled from 2022 to 2023 (Table 7-4). The drilling campaigns were designed to test push-back options of near-surface oxide
mineralization for short-term production plans, infill existing drilling and test possible extensions. Moreover, model update,
validation and de-risking drilling programs were carried out increase the level of confidence in the Mineral Resources and the
execution of near-mine development.
| | 7-5 | |
| SSR Mining Inc. | Çöpler Property S-K 1300 Report | February 12, 2024 SLR Project No.: 138.21581.00006 |
Table 7-3: Drill Summary by
Hole Type for Çöpler Deposit (2000–2023)
| Hole Type |
Number of Holes |
Metres Drilled |
Minimum Hole Depth
(m) |
Average Hole Depth
(m) |
Maximum Hole Depth
(m) |
| DD |
1,321 |
272,171.60 |
12.8 |
206.03 |
806.5 |
| RC |
1,358 |
135,417.80 |
8.0 |
99.71 |
270.5 |
| Total |
2,679 |
407,589.40 |
20.8 |
305.74 |
1,077 |
Table 7-4: Drill Summary by
Year for Çöpler Deposit
| Year |
Hole Type |
Number of Holes |
Metres Drilled |
| 2000 |
DD |
4 |
971.25 |
| 2001 |
DD |
10 |
2,253.45 |
| |
RC |
33 |
4,168.60 |
| 2002 |
DD |
31 |
6,575.45 |
| |
RC |
1 |
120.00 |
| 2003 |
DD |
33 |
2,975.70 |
| 2004 |
DD |
11 |
1,218.45 |
| |
RC |
207 |
9,866.50 |
| 2005 |
DD |
24 |
4,776.40 |
| |
RC |
171 |
28,673.70 |
| 2006 |
DD |
15 |
1,967.60 |
| |
RC |
92 |
12,823.00 |
| 2007 |
DD |
75 |
16,613.30 |
| |
RC |
125 |
16,998.50 |
| 2008 |
DD |
14 |
4,053.00 |
| |
RC |
41 |
4,904.00 |
| 2009 |
DD |
25 |
6,178.50 |
| |
RC |
33 |
4,441.50 |
| 2010 |
DD |
12 |
1,879.10 |
| |
RC |
1 |
144.50 |
| 2011 |
DD |
117 |
29,618.80 |
| |
RC |
160 |
18,615.00 |
| 2012 |
DD |
145 |
50,290.40 |
| |
RC |
120 |
13,879.50 |
| | 7-6 | |
| SSR Mining Inc. | Çöpler Property S-K 1300 Report | February 12, 2024 SLR Project No.: 138.21581.00006 |
| Year |
Hole Type |
Number of Holes |
Metres Drilled |
| 2013 |
DD |
125 |
33,005.80 |
| |
RC |
53 |
4,545.00 |
| 2014 |
DD |
16 |
1,846.00 |
| 2015 |
DD |
40 |
5,752.90 |
| |
RC |
70 |
6,759.00 |
| 2016 |
DD |
0 |
0.00 |
| |
RC |
94 |
2,194.00 |
| 2017 |
DD |
41 |
3,370.50 |
| 2018 |
DD |
108 |
10,674.40 |
| 2019 |
DD |
62 |
7,607.70 |
| 2020 |
DD |
131 |
23,029.40 |
| 2021 |
DD |
68 |
18,491.80 |
| 2022 |
DD |
96 |
15,440.60 |
| 2023 |
DD |
118 |
23,581.10 |
| |
RC |
157 |
7,285.00 |
| Total |
RC |
1,358 |
135,417.80 |
| |
DD |
1,321 |
272,171.60 |
| |
All Types |
2,679 |
407,589.40 |
| | 7-7 | |
| SSR Mining Inc. | Çöpler Property S-K 1300 Report | February 12, 2024 SLR Project No.: 138.21581.00006 |
Figure 7-2: Çöpler
Deposit Drill Hole Collar Locations
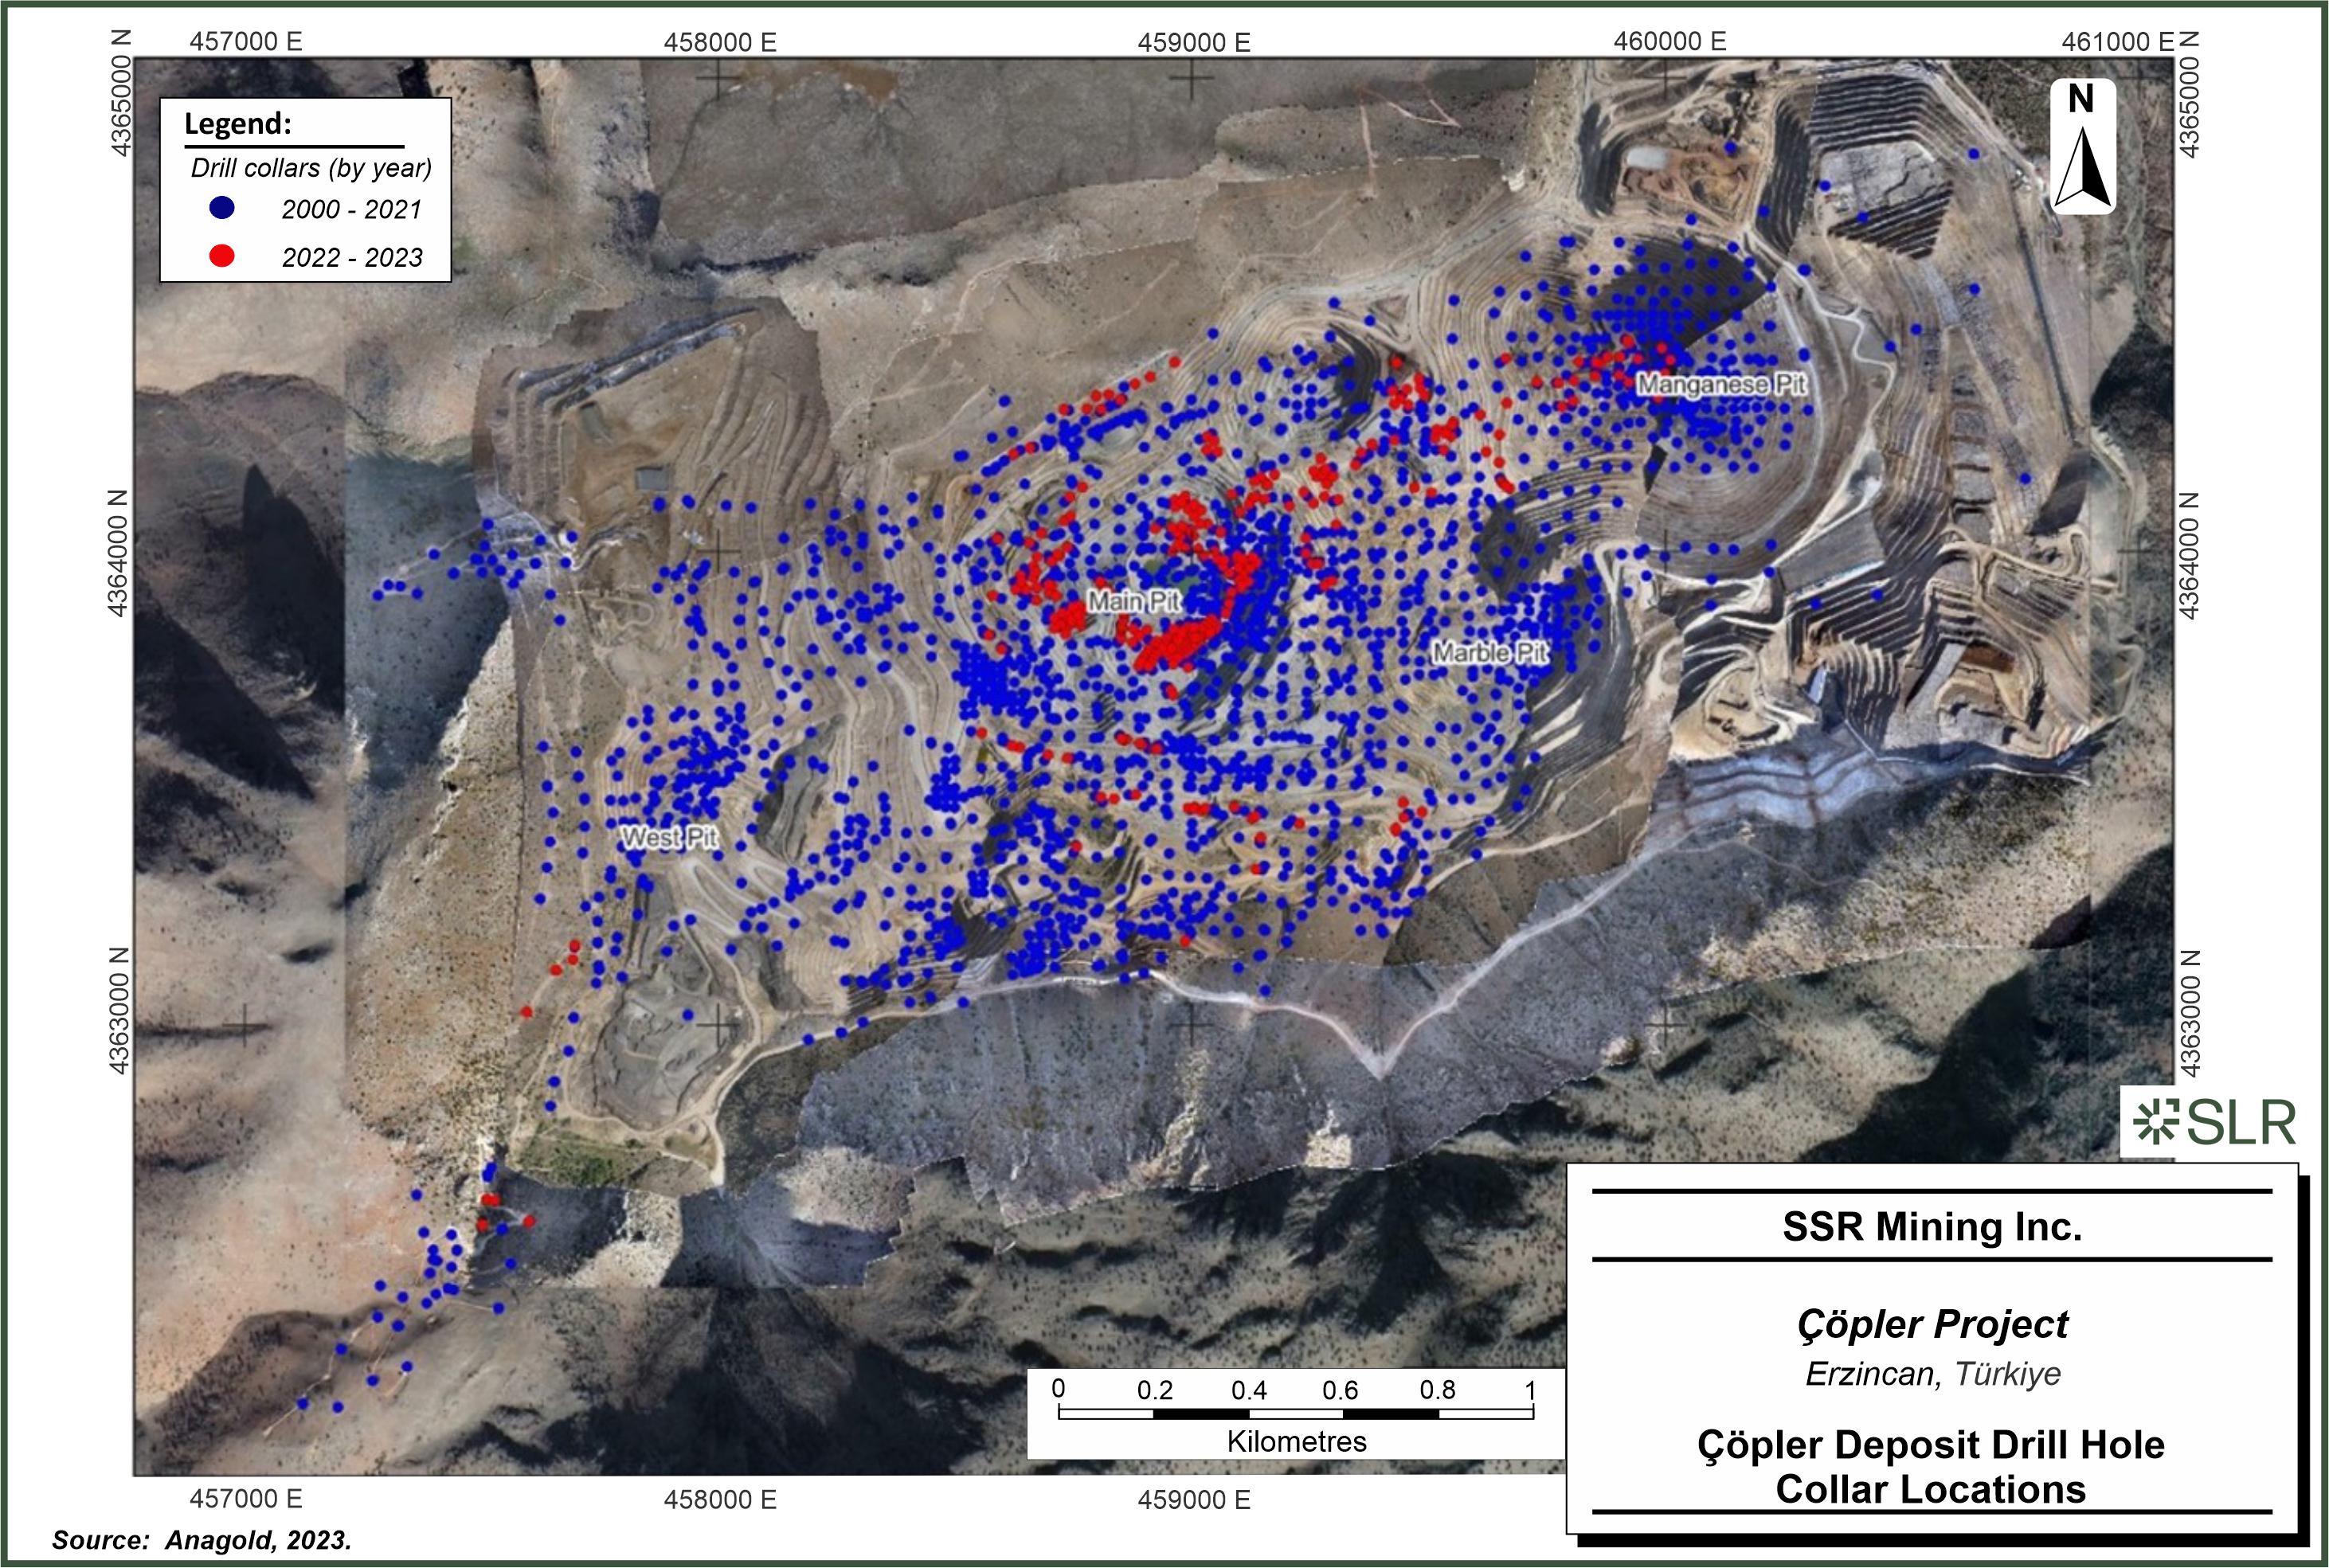
SSR
Mining Inc. Copler Project Erzincan, Turkiye Copler Deposit Drill Hole Collar Locations
| | 7-8 | |
| SSR Mining Inc. | Çöpler Property S-K 1300 Report | February 12, 2024 SLR Project No.: 138.21581.00006 |
| 7.5.2 | Drilling – Greater Çakmaktepe Deposit |
Since 2012, Anagold has drilled a total of 1,971 drill holes for a total
of 292,544 m at Greater Çakmaktepe (Table 7-5 and Table 7-6). This includes 1,352 DD, 567 RC, and 52 drill holes with an
RC pre-collar and diamond tail (RCD). All drilling since 2021 has been conducted at the Çakmaktepe Ext prospect. A total of 217
DD holes have been drilled from 2022 to the effective date of this report (Table 7-6).
Table 7-5: Drill Summary for
Greater Çakmaktepe Deposit (2012–2023)
| Hole Type |
Number of Holes |
Metres Drilled |
Minimum Hole Depth
(m) |
Average Hole Depth
(m) |
Maximum Hole Depth
(m) |
| DD |
1,352 |
219,822.80 |
11.6 |
164.31 |
520.1 |
| RC |
567 |
58,660.50 |
10.0 |
97.82 |
221 |
| RCD |
52 |
14,060.70 |
220.0 |
270.39 |
358.5 |
| Total |
1,971 |
292,544.00 |
10.0 |
177.5 |
520.1 |
Table 7-6: Greater Çakmaktepe
2012–2023 Drill Summary
| |
Çakmaktepe |
Çakmaktepe Ext. |
Greater Çakmaktepe |
| Year |
Number of Holes |
Drilled Metres |
Number of Holes |
Drilled Metres |
Number of Holes |
Drilled Metres |
| 2012 |
21 |
2,287.50 |
|
|
21 |
2,287.50 |
| 2013 |
7 |
962.00 |
|
|
7 |
962.00 |
| 2014 |
162 |
15,976.70 |
|
|
162 |
15,976.70 |
| 2015 |
279 |
25,506.20 |
|
|
279 |
25,506.20 |
| 2016 |
501 |
67,072.20 |
|
|
501 |
67,072.60 |
| 2017 |
116 |
9,366.20 |
9 |
1,374.10 |
125 |
10,740.30 |
| 2018 |
|
|
91 |
14,216.40 |
91 |
14,216.40 |
| 2019 |
75 |
5,919.40 |
133 |
27,821.20 |
208 |
33,740.60 |
| 2020 |
62 |
8,983.70 |
147 |
32,393.30 |
209 |
41,377.00 |
| 2021 |
|
|
151 |
33,004.20 |
151 |
33,004.20 |
| 2022 |
|
|
128 |
25,432.10 |
128 |
25,432.10 |
| 2023 |
|
|
89 |
22,228.40 |
89 |
22,228.40 |
| Total |
1,223 |
136,073.90 |
748 |
156,469.70 |
1,971 |
292,544.00 |
| | 7-9 | |
| SSR Mining Inc. | Çöpler Property S-K 1300 Report | February 12, 2024 SLR Project No.: 138.21581.00006 |
Figure 7-3: Greater Çakmaktepe
Drill Hole Collar Locations
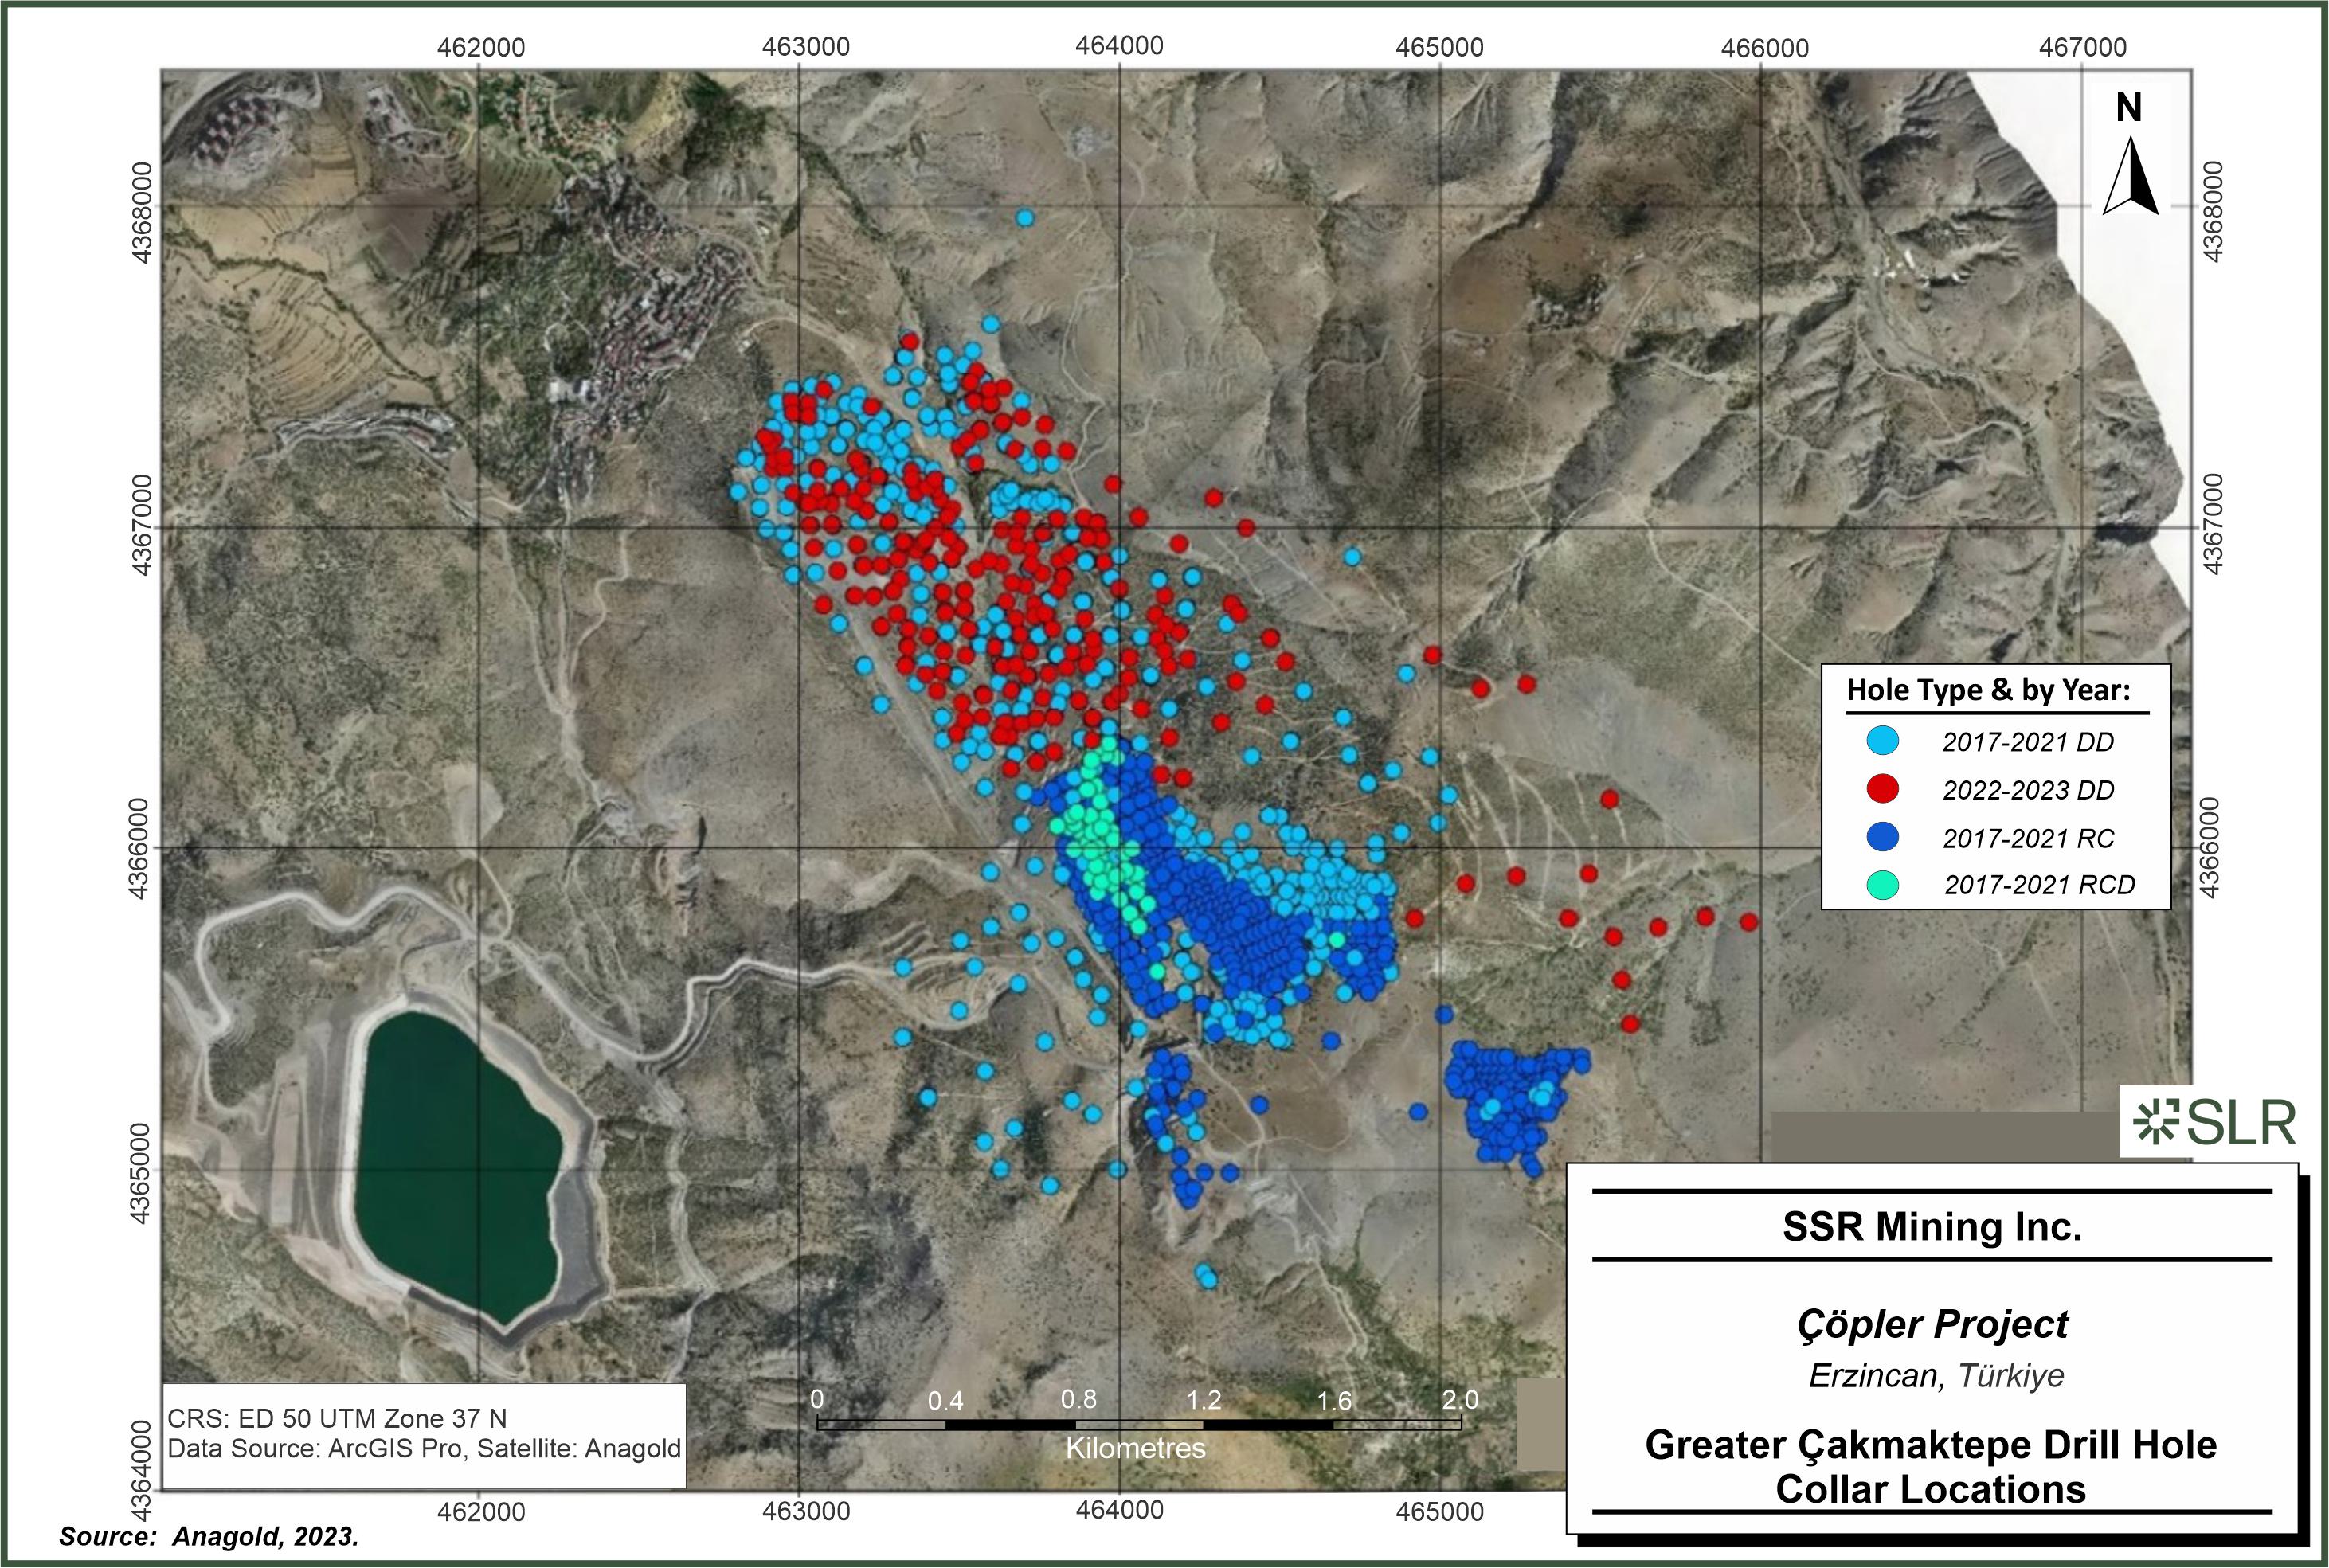
SSR
Mining Inc. Copler Project Erzincan, Turkiye Greater Cakmaktepe Drill Hole Collar Locations
| | 7-10 | |
| SSR Mining Inc. | Çöpler Property S-K 1300 Report | February 12, 2024 SLR Project No.: 138.21581.00006 |
| 7.5.3 | Drilling – Bayramdere |
Drilling at the Bayramdere Deposit began in 2007. A total of 120
resource definition, geotechnical, and metallurgical holes have been drilled. This includes both RC and DD holes for a total of 11,189
m drilled (Table 7-7; Figure 7-4). One hydrology hole to test groundwater depth has also been drilled. No drilling has been conducted
at Bayramdere since the end of 2020.
Table 7-7: Drill Summary for
Bayramdere
| Hole Type |
Number of Holes |
Metres Drilled |
Minimum Hole Depth
(m) |
Average Hole Depth
(m) |
Maximum Hole Depth
(m) |
| DD |
81 |
6,752 |
19.7 |
83.5 |
301 |
| RC |
32 |
2,946 |
55 |
92.1 |
173 |
| RCD |
7 |
1,491 |
155.5 |
213 |
242.5 |
| Total |
120 |
11,189 |
19.7 |
93.3 |
301 |
| | 7-11 | |
| SSR Mining Inc. | Çöpler Property S-K 1300 Report | February 12, 2024 SLR Project No.: 138.21581.00006 |
Figure 7-4: Bayramdere Drill
Hole Collars by Hole Type
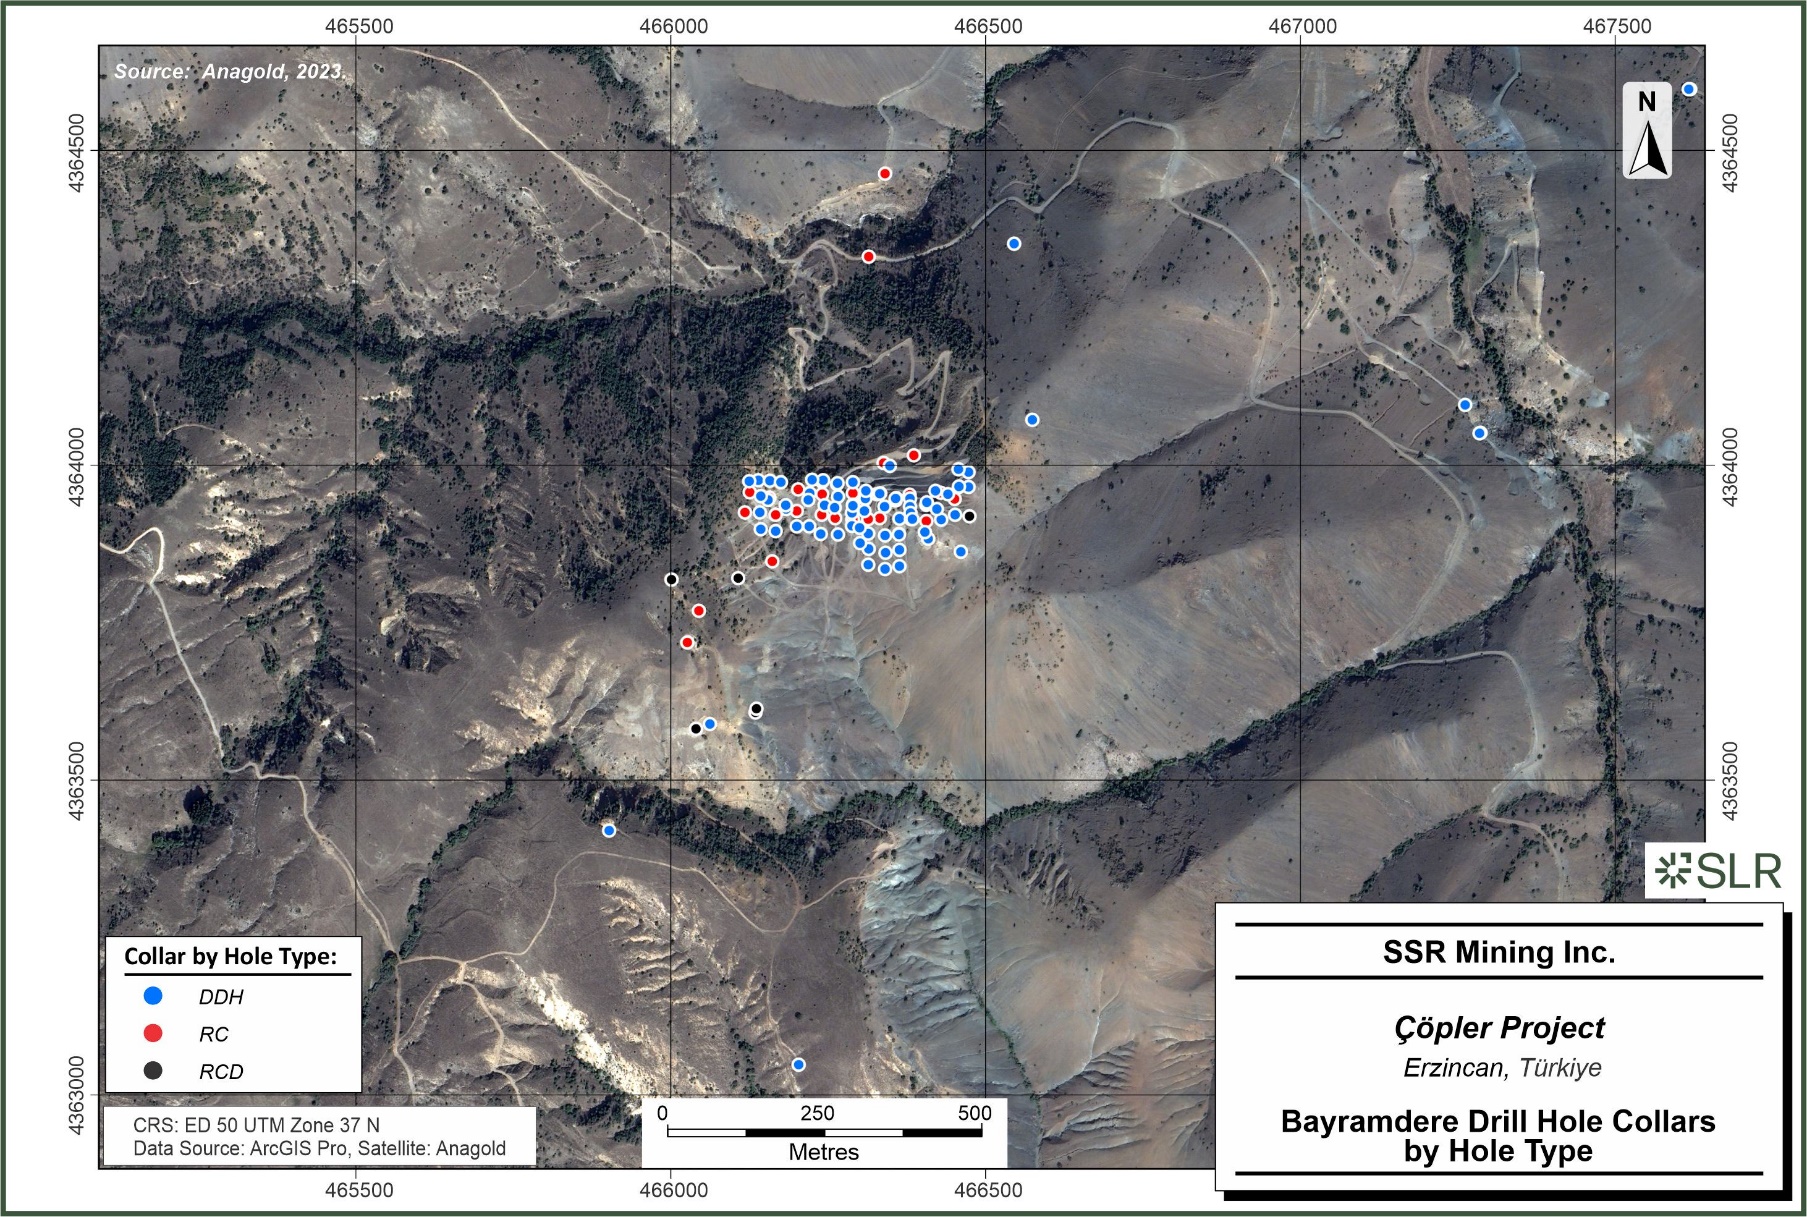
SSR
Mining Inc. Copler Project Erzincan, Turkiye Bayramdere Drill Hole Collars by Hole Type
| | 7-12 | |
| SSR Mining Inc. | Çöpler Property S-K 1300 Report | February 12, 2024 SLR Project No.: 138.21581.00006 |
| 7.5.4 | Grid Coordinate Systems |
The Çöpler Project uses the European 1950 (E1950) datum
coordinate system; this is a Turkish Government requirement.
The Çöpler Project is in UTM6 zone 37N of the E1950 coordinate
system. Until 2014, drill hole collars were surveyed by the mine surveyors in the E1950 UTM3 coordinate system and then converted to E1950
UTM6 before making them available to other personnel. The conversion from UTM3 to UTM6 was achieved by subtracting 1,746 m (–1,746 m)
from the UTM3 northing coordinate and adding 17 m (+17 m) to the UTM3 easting coordinate. There is no rotation, scaling, or
change in elevation between the E1950 UTM3 and E1950 UTM6 systems. Since March 2014, collar coordinates have been and are being collected
in the E1950 UTM6 coordinate system.
| 7.6.1 | Reverse Circulation Drilling Sample Collection |
RC drilling was completed with a 4.5 inch to 4.75 inch (11.4 cm to 12.0
cm) diameter down-the-hole hammer drill rig between 2000 and 2015. RC samples were collected every one metre from the cyclone underflow
in large, reinforced plastic bags. The samples were then split using a Jones splitter.
Between 2015 to 2023, RC drilling has been completed with a nominal
5.25 inch face sampling hammer with centre sample return to a rig-side mounted sampling system. The sampling system included a cyclone,
sending one-metre samples through a rotary cone splitter. RC samples, weighing 2 kg to 5 kg, were collected in calico or cloth bags for
analysis. All sample bags are clearly numbered and labelled with the drill hole name and sample number.
A representative sample from every metre of drilling is sieved and placed
in a numbered chip tray for logging and future record.
RC drilling has been generally used above the water table.
| 7.6.2 | Diamond Drilling Sample Collection |
Up until 2017, diamond drilling at the Project was generally PQ or HQ
diameter. Although NQ diameter is not generally preferred, it is used in cases of ground-related problems. Approximately 90% of the DD
core drilled at Çöpler and Çakmaktepe is HQ.
PQ core has a nominal diameter of 85 mm, HQ core has a nominal diameter
of 63.5 mm, and NQ has a nominal size of 47.6 mm.
Of the more recent drilling at Çakmaktepe Ext, approximately
60% was completed with HQ core, and the remainder was mostly PQ-sized core. A few drill holes early in at Çakmaktepe Ext were NQ
core.
Drill core is boxed at the rig by the driller and transported to the
sample preparation facility on site for logging by Anagold exploration staff.
| | 7-13 | |
| SSR Mining Inc. | Çöpler Property S-K 1300 Report | February 12, 2024 SLR Project No.: 138.21581.00006 |
| 7.6.3 | Drill Hole Logging and Data Collection |
RC chip samples are collected by field staff for review by the logging
geologist. Similarly, core samples are metre-marked by field staff in preparation for the logging geologist.
Drill core is subjected to detail logging using Anagold geological codes
and logging formats. Information captured includes lithology, structure, alteration, mineralization, and geotechnical data on veining,
joint frequency, and joint sets. Since 2017, drill core has also undergone a detailed geotechnical logging process including a detailed
‘mining rock mass rating’ to ‘rock mass rating’ system. In addition, core samples are collected every 10 m
to undertake point load IS50 testing to determine uniaxial compressive strength (UCS).
Until September 2019, all geological data were recorded onto hard-copy
logs and then transcribed into text files, using data-loading templates, ready for loading into Maxwell Datashed. Since September 2019,
hard copy logs have been replaced with data loading templates on touchpads with direct links to the company server. Files located on the
server are uploaded into Datashed regularly following appropriate checking of the data entry.
As of May 2023, Resource Development migrated all the data from Maxwell
Datashed to Seequent Mx Deposit. Logging is currently carried out directly in Mx Deposit.
The RSC QP is of the opinion that the drilling and sampling procedures
adopted at Çöpler and Greater Çakmaktepe are fit for the purpose of resource classification in high-confidence categories
and generally consistent with industry common practices. The drilling spacing is sufficiently dense to demonstrate grade and geological
continuity with sufficient confidence for the Inferred, Indicated and measured Classifications. Drilling samples were collected by trained
personnel and the process was supervised by suitably qualified geologists.
The RSC QP is of the opinion that the samples are representative of
the source materials, and there is no evidence that the sampling process introduced statistically significant bias.
| | 7-14 | |
| SSR Mining Inc. | Çöpler Property S-K 1300 Report | February 12, 2024 SLR Project No.: 138.21581.00006 |
| 8.0 | Sample Preparation, Analyses, and Security |
| 8.1.1 | Diamond Drilling (DD) Sample Preparation |
Diamond drill samples collected prior to 2012 were prepared at ALS İzmir,
an ISO-9001:2008 certified facility in Izmir, Türkiye. From late-2012 through to the end of 2013, pulp samples weighing approximately
150 g were sent to ALS Vancouver an ISO/IEC 17025:2005 accredited laboratory for precious and base metal assay methods, located in Vancouver,
Canada. All samples in 2014 were generated and analyzed by ALS İzmir. From 2015 to 2016, samples were sent to the SGS laboratory,
located in Ankara, Türkiye (SGS Ankara), for preparation and assay. SGS Ankara is certified to ISO 9001:2008 and OHSAS 18001. Since
2017, ALS İzmir has been used as the main laboratory. All laboratories are independent of SSR.
Cut core samples were prepared by laboratory technicians at ALS İzmir.
The DD samples were crushed to 70% passing <2 mm (CRU-31, PREP31BY), split by a Body rotary splitter (PREP-31BY), before being pulverized
to 85% passing <75 µm (PUL-32). Duplicate (coarse crush) samples were collected by a rotary splitter (SPL-22), and pulp duplicates
were collected by riffle splitter.
| 8.1.2 | Reverse Circulation Sample Preparation |
RC samples collected prior to 2012 were prepared at ALS İzmir.
From late 2012 through to the end of 2013, pulp samples weighing approximately 150 g were sent to ALS Vancouver. All samples in 2014 were
generated and analyzed by ALS İzmir. From 2015 to 2016, samples were sent to SGS Ankara for preparation and assay. Since 2017, ALS
İzmir has been used as the main laboratory.
Once at the laboratory, samples underwent fine crushing (70% passing
<2 mm; ALS method code CRUI-31). The crushed samples were riffle split (ALS method code: SPL-21) before being pulverized to 85% passing
<75 mm (ALS method code: PUL-32).
The sample analysis methodology from 2004 to 2023 is summarized in Table
8-1. Anagold is independent of all laboratories used to analyze samples.
Table 8-1: Summary of Sample
Analysis Methods Over Time
| Date |
Laboratory |
Assay Methodology |
| 2004–2014 |
ALS Vancouver |
Au-AA25: 30 g fire assay (FA) with atomic absorption spectroscopy (AAS)
finish. Lower detection limit: 0.01 g/t Au. Upper detection limit: 100 g/t Au.
Over-limit samples were re-analyzed using the gravimetric method Au-GRA21.
ME-ICP61: Additional 33 elements analyzed including Ag, Cu, Pb,
Zn, and Mn. Involves a four-acid (perchloric, nitric, hydrofluoric, and hydrochloric acid) digestion (4A digest), followed by inductively
coupled plasma-atomic emission spectroscopy (ICP-AES). |
| | 8-1 | |
| SSR Mining Inc. | Çöpler Property S-K 1300 Report | February 12, 2024 SLR Project No.: 138.21581.00006 |
| Date |
Laboratory |
Assay Methodology |
| 2015 |
SGS Ankara |
FAA303: 30 g FA with ICP-AES finish. Lower detection limit: 0.01 g/t
Au. When Au grades were detected above 3 g/t Au, method FAG303 using a gravimetric finish was added.
ICP40B: Additional 36 elements analyzed by 4A digest followed by inductively
coupled plasma-optical emission spectroscopy (ICP-OES). |
| 2016–2019 |
ALS İzmir |
Au-AA23: 30 g FA followed by AAS. Lower detection limit: 0.01 g/t Au. Upper detection limit: 10 g/t Au. Over-limit samples were re-analyzed using Au-GRA21. |
| 2019–present |
ALS İzmir |
Au-AA24: 50 g FA with AAS finish.
ME-IR08: Total carbon (C) and sulfur (S) concentrations were measured
by induction furnace finished by infrared (IR) spectroscopy. A subsample was also analyzed for 33 elements by 4A digest with ICP-AES finish.
Overlimit samples for Au, Ag or Cu were re-analyzed by FA with gravimetric
finish (Au-GRA22), hydrofluoric nitric perchloric digestion with hydrochloric acid leach with ICP-AES finish (Ag-OG62), or four acid digestion
and ICP finish (Cu-OG62), respectively. |
| 8.3 | Quality Assurance and Quality Control |
The quality assurance and quality control (QA/QC) program consisted
of a combination of QC sample types (duplicates, blanks and certified reference materials (CRMs)) that are used to monitor different aspects
of the sample preparation and assaying process. Duplicate samples were used to monitor preparation, assay precision, and grade variability
as a function of sample homogeneity and sample preparation or laboratory error. Blank material was used to assess contamination or sample-cross
contamination during sample preparation and to identify special-cause variation at the laboratory, to identify issues with specific batches,
and determine analytical biases.
Field duplicates have historically been submitted at a nominal rate
of 1-in-40 samples. In 2015, the field duplicate insertion rate was increased to 1-in-20. Since 2017 for DD samples, duplicate samples
have only been collected as laboratory coarse crush (second-split) duplicates, instead of as first-split (core-split) duplicates. From
Q3 2023, duplicate samples have been collected as field duplicates. If the cores are PQ diameter, duplicate samples are quartered, and
if they are HQ diameter, they are halved. In addition, duplicate samples from Çöpler are now taken at a rate of 1-in-5, from
mineralized zones only.
Blank samples have been inserted routinely into all sample batches.
Prior to 2015, blank pulp samples were used; however, in 2015, the blank samples were switched from pulp to a coarse quartz material to
allow monitoring of sample contamination from crushing and pulverising to analysis. The first sample in a drill hole was typically a blank,
after which blanks were inserted into the sample batch at a nominal rate of 1-in-60 samples until 2015. The insertion rate was updated
in 2015 to 1-in-30 samples. As of 2020, blank sources have been increased to two in 30 samples and coarse blanks prepared by ALS and Bureau
Veritas Laboratories have started to be used. Blanks are inserted randomly to provide an overall 15% insertion rate.
| | 8-2 | |
| SSR Mining Inc. | Çöpler Property S-K 1300 Report | February 12, 2024 SLR Project No.: 138.21581.00006 |
CRMs have historically been inserted into sample submissions at a nominal
rate between 1-in-30 and 1-in-20. The frequency was increased from 3% to 5% in 2015. Several different CRMs have been selected for use
at varying Au and Cu grades over the life of the Project. Starting from 2020, CRM insertion has been random at an average rate of 5%.
CRMs used have various grade ranges as oxide and sulfide are used according to their Au, Cu, and Ag contents. While CRMs from Rocklabs
and Geostats Pty Ltd were used between 2012 and 2017, CRMs provided by OREAS have been preferred since 2018.
RSC has independently reviewed standard operating procedures (SOPs)
and quality control data relevant to the Project area. This review focused on processes that could have affected the quality of the final
drill hole dataset that is used in the 2023 Mineral Resource estimation. The processes and components are sub-divided into those aspects
that are relevant to the quality of the estimation:
| · | Location of data points (collar surveys and downhole surveys) |
A final data quality determination is made for all the deposits in section
8.3.4.
| 8.3.1 | Data Quality Objective |
Every data collection process implicitly comes with expectations for
the accuracy and precision of the data being collected. Data quality can only be discussed in the context of the objective for which the
data is being collected. In the minerals industry, the term ‘fit for purpose’ is typically used to convey the principle that
data should suit the objective. In the context of data quality objectives (DQOs), fit for purpose could be translated as ‘meeting
the DQO’.
The Çöpler Project deposits vary in stage between advanced
exploration to mining. For all deposits described in this section, data should be of a quality that is ‘fit for the purpose of classifying
at an Indicated Mineral Resource classification in accordance with the CRIRSCO-code affiliated global guidelines of classifying Mineral
Resources.
Quality assurance (QA) is about error prevention and establishing processes
that are repeatable and self-checking. This can be achieved using technically sound, simple, and prescriptive SOPs and management systems.
RSC has reviewed SSR’s SOPs. A summary of RSC’s audit is
presented in Table 8-2. For each part of the sampling, preparation and analytical process, a comment on the expected associated risk
with respect to resource classification is provided. For each category, RSC determined whether the following best practices were included:
| · | Processes are documented in an SOP and represent good practice. |
| · | The SOP includes clear details on quality control (QC) measures. |
| · | The SOP includes clearly defined data quality objectives. |
Table 8-2: Summary of QA and
SOP Review
| Category |
Availability of SOP |
QC Measures in SOP |
Clear DQO in SOP |
Summary of Process/Comments |
QA Risk Factor |
| Location |
Yes |
Yes |
Marginal |
Collar location data are collected using differential GPS. Site confirmed that QC procedures have been implemented since 2021. |
Low |
| | 8-3 | |
| SSR Mining Inc. | Çöpler Property S-K 1300 Report | February 12, 2024 SLR Project No.: 138.21581.00006 |
| Category |
Availability of SOP |
QC Measures in SOP |
Clear DQO in SOP |
Summary of Process/Comments |
QA Risk Factor |
| Density |
Yes |
No |
Marginal |
Standard industry water-immersion practice.
Risk of selection bias due to non-fractured and non-deformed core. No QC procedures (duplicates measurements, standard weights) in SOP; however, site confirmed that QC procedures have been implemented since 2021. |
Low-moderate |
| Diamond: Primary Sampling |
Yes |
Marginal |
Marginal |
The primary sample is collected at the drill bit. The SOP does not contain clear guidance on how to manage drilling and improve sample recovery. |
Low-moderate |
| Diamond: First Split |
Yes |
No |
Marginal |
Standard industry markup and cutting practice. No core-split duplicates were collected during the review period. RSC recommended resuming the collection of core-split duplicates, which was commenced in Q3 2023. |
Low |
| RC: Primary Sample |
Yes |
Marginal |
Marginal |
The SOP notes that “issues with sample quality should be discussed with the driller, as they may be related to poor drilling conditions or other problems”; however, no further commentary on how to make decisions or improvements is provided. |
Low-moderate |
| RC: First Split |
Yes |
Not specified in SOP (but duplicates are collected) |
No |
The first split takes place on-site when the RC chip material is passed through the cyclone and over a conical splitter to generate a 2 kg to 5 kg sample. Wet samples are not split and are instead speared. |
Low |
| | 8-4 | |
| SSR Mining Inc. | Çöpler Property S-K 1300 Report | February 12, 2024 SLR Project No.: 138.21581.00006 |
| Category |
Availability of SOP |
QC Measures in SOP |
Clear DQO in SOP |
Summary of Process/Comments |
QA Risk Factor |
| Second Split |
No |
No SOP but QC does occur at laboratory |
n/a |
The second splitting process takes place at the laboratory after the coarse crush when a sub-sample is collected for pulverization. QA follows laboratory best practices and industry standard procedures. |
Low |
| Third Split |
No |
No SOP but QC does occur at laboratory |
n/a |
The third splitting process (pulp scoop/spoon) takes place at the laboratory after pulverization when a sub-sample is collected for analysis. QA follows laboratory best practices and industry standard procedures. |
Low |
| Analytical |
No |
No SOP but QC does occur at laboratory |
n/a |
SSR uses ISO-certified laboratories that follow industry best practices for its analytical analyses. |
Low |
The purpose of quality control (QC) is to detect and correct errors
while a measuring or sample-collection system is in operation. The outcome of a good QC program is that it can be demonstrated that errors
were fixed during operation and that the system delivering the data was always in control. Together with good QA, it ensures that the
quality objective is met.
Good QC is achieved by inserting and constantly evaluating checks and
balances. These checks and balances can be incorporated at every stage of the sample process (location, primary sample collection, preparation,
and analytical phases) and, if in place, should be monitored during data collection, allowing the operator to identify and fix errors
as they occur.
QC data are available for diamond core primary sampling, diamond splitting,
RC second split samples, and the analytical process. No QC data are available for collar location, downhole surveys, density, primary
RC sampling (RC sample weights), diamond first-split (core-split), or third-split (pulp repeats).
| | 8-5 | |
| SSR Mining Inc. | Çöpler Property S-K 1300 Report | February 12, 2024 SLR Project No.: 138.21581.00006 |
A brief summary of RSC’s QC data review is provided in Table 8-3
and several associated figures are presented in Figure 8-1 through Figure 8-5.
Table 8-3: Summary of Çöpler
QC Review
| Category |
QC Method |
Comments and Conclusion |
| Diamond: Primary Sampling |
Consistency can be monitored by reviewing core recovery. |
While there are some intervals with significant core loss, no trends are observed (Figure 8-1). There was sufficient control, at the scale of the entire drilling period supporting the resources. |
| Diamond: Second split |
Consistency can be monitored by relative difference of second-split (coarse crush) duplicates. |
The splitting process was relatively consistent except in January 2023 and October 2023 (Figure 8-2). In January 2023, the variance noticeably increased in both Ag and Cu; however, these are within tolerance limits. |
| RC: First Split |
Consistency can be monitored by relative difference of first-split (cone-split) duplicates. |
Mostly in control; no trends or step changes observed (Figure 8-3). Acceptable consistency and suitable to support mineral resource estimations. |
| Analytical |
Consistency can be monitored by CRMs and blanks (e.g. Figure 8-4,
Figure 8-5). Unwanted, special-cause variation (as opposed to “common-cause variation”) can be assessed
for each CRM using statistical process control plots (SCPs). When a blank or CRM fails, Anagold requests reanalysis for the interval from
the previous to the next CRM. If the distance between the previous and next QC sample is less than 20 samples, this interval is increased
to 20 samples.
RSC reviewed past CRM performance on SCPs created using the process
mean and the CRM-certified standard deviation. Westgard rules 1(3s), 2(2s), 4(1s), R(4s), 7X, 6T, J-Chart and 14O (Westgard et al., 1981)
were used to identify possible transgressions.
CRM results were plotted on a heatmap to provide a holistic review and
identify periods where multiple transgressions occurred across various CRMs. |
RSC’s review of analytical results of blanks inserted in the sample
stream indicates all Au results were below the limit of quantification and therefore Au contamination was not an issue (Figure 8-4).
The review of the Au and Cu CRM heat maps using RSC’s in-house
QC tool does not reveal any significant periods of special cause variation across multiple CRMs.
Therefore, the laboratory was sufficiently in control and provided consistent
and fit-for-purpose data. |
| | 8-6 | |
| SSR Mining Inc. | Çöpler Property S-K 1300 Report | February 12, 2024 SLR Project No.: 138.21581.00006 |
Figure 8-1: Diamond Core Recovery
at Çöpler since January 2021
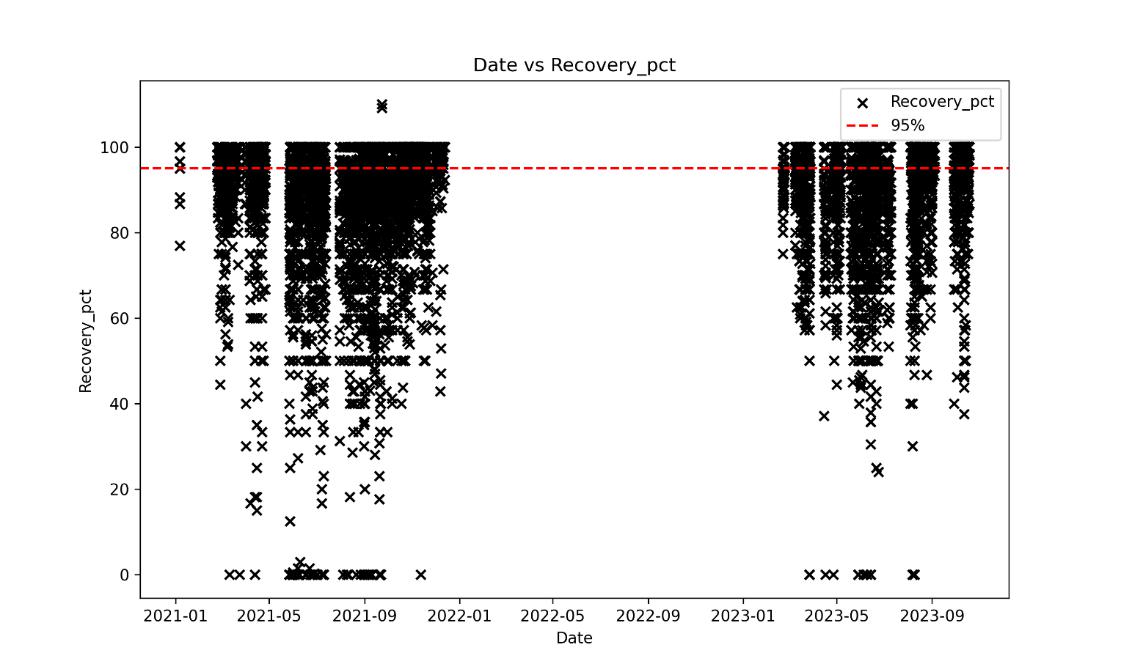
Figure 8-2: Relative Difference
Plot for Çöpler DD Second Split (2021–2023)
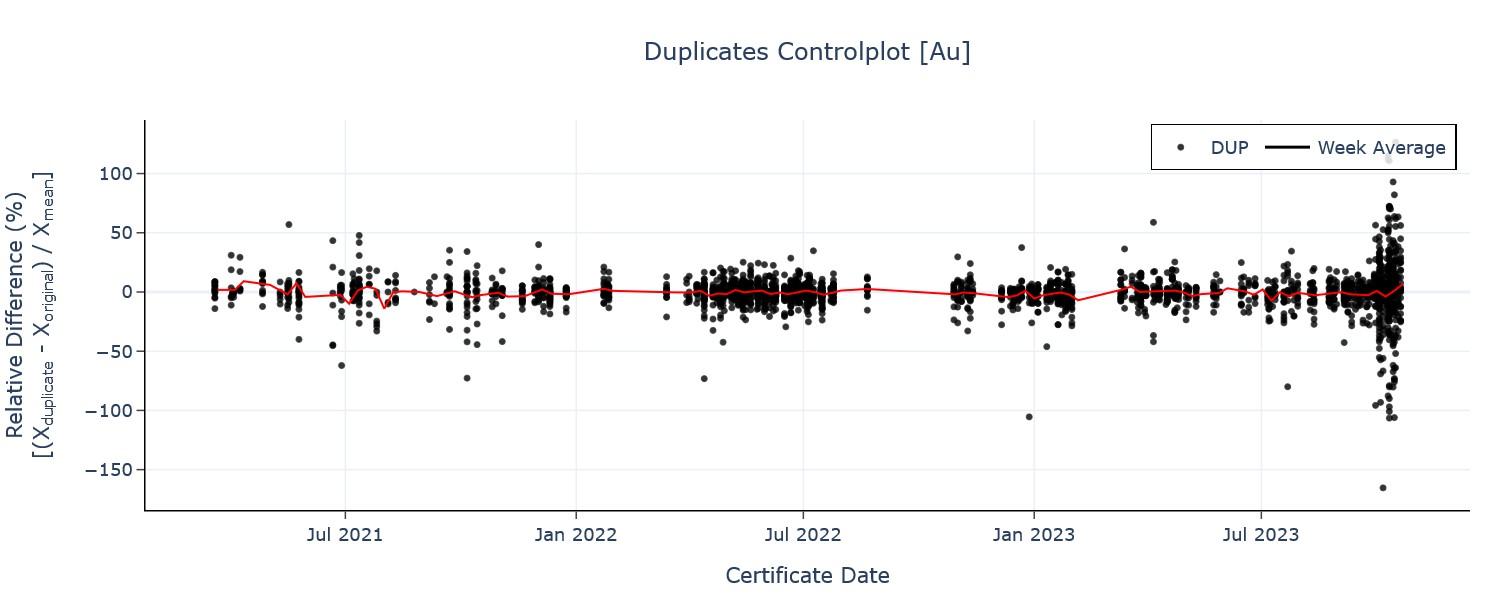
Notes: The Relative Difference (RD) plot illustrates the relative difference
in gold grades between the original and duplicate DD second split samples against date.
| | 8-7 | |
| SSR Mining Inc. | Çöpler Property S-K 1300 Report | February 12, 2024 SLR Project No.: 138.21581.00006 |
Figure 8-3: Relative Difference
Plot for Çöpler RC First Split (2023)
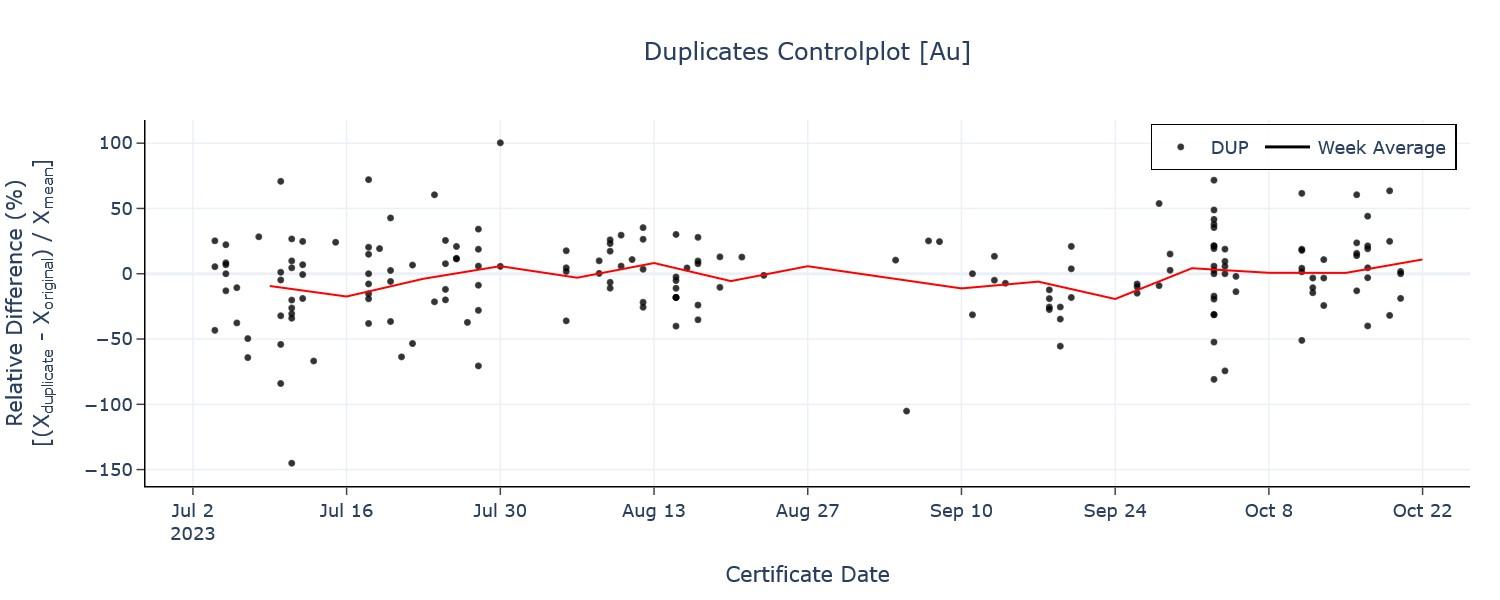
Notes: The RD plot illustrates the relative difference in gold grades
between the original and duplicate RC first split samples against date.
Figure 8-4: Çöpler
Blank Analyses for Au versus Analysis Date (ALS), 2021–2023
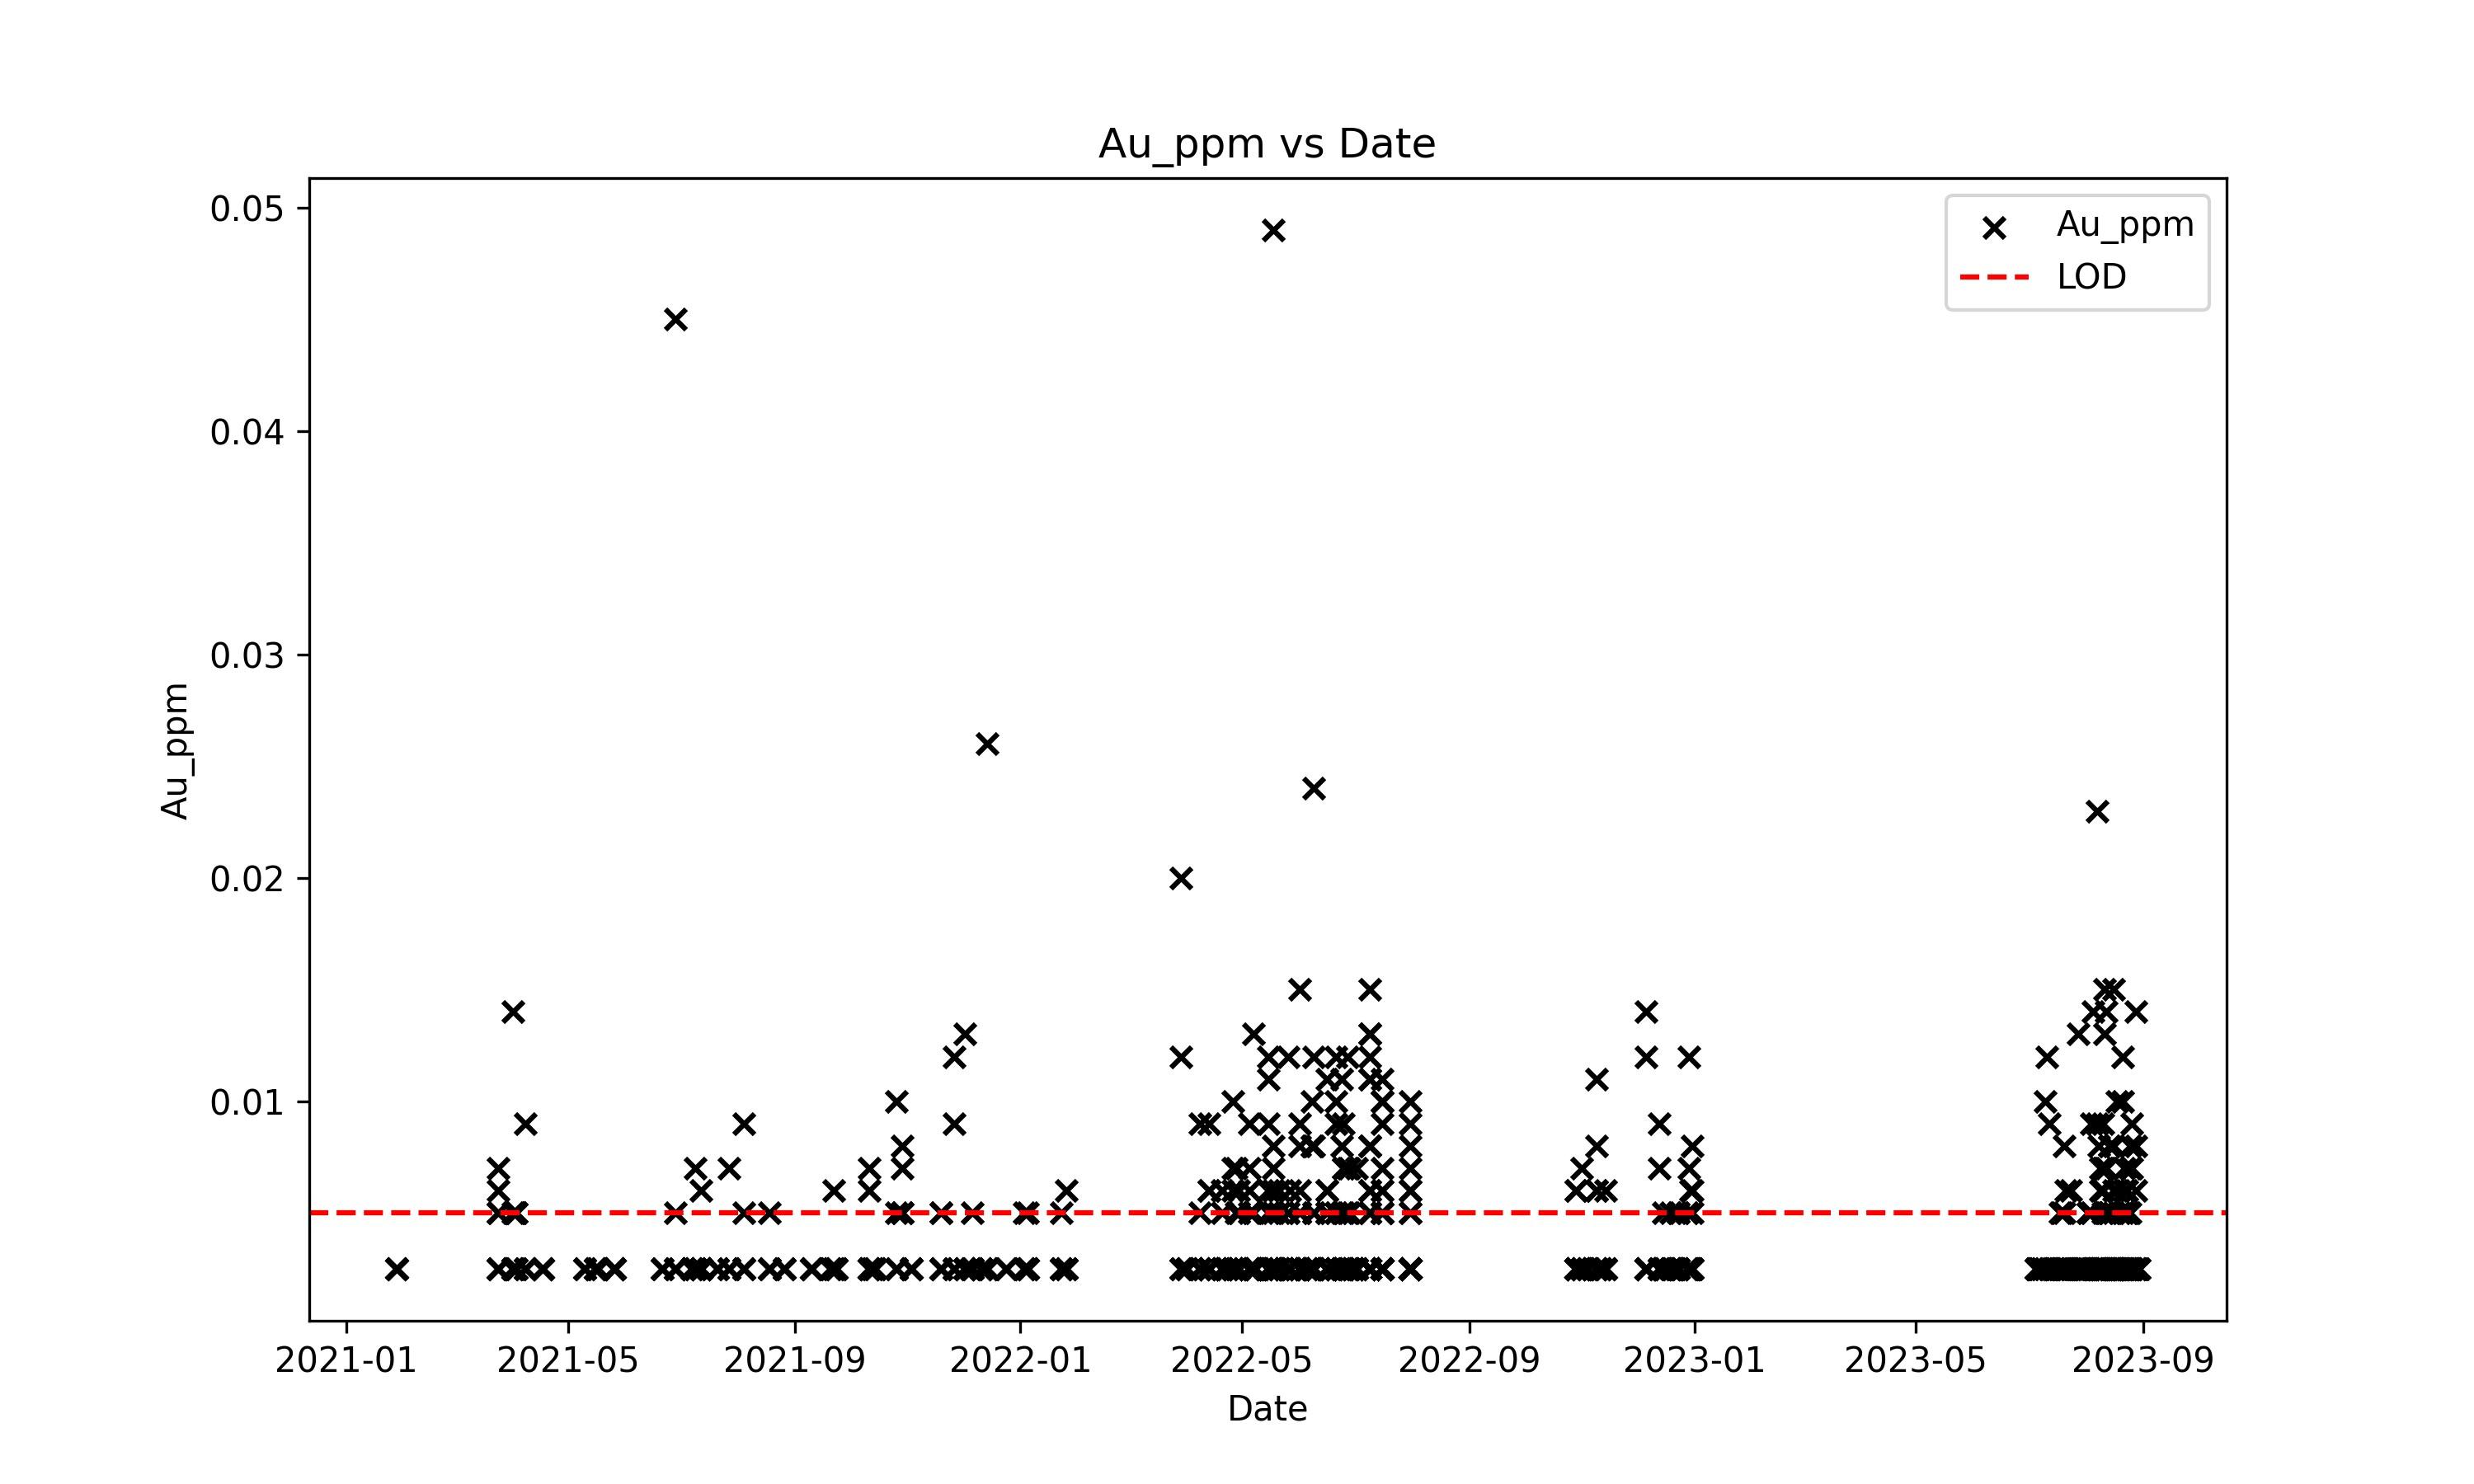
| | 8-8 | |
| SSR Mining Inc. | Çöpler Property S-K 1300 Report | February 12, 2024 SLR Project No.: 138.21581.00006 |
Figure 8-5: Shewhart Control
Plot for OREAS504b Au in Çöpler Sample Stream (2021–2023)

Notes: Colored points represent Westgard rule transgressions. Westgard
transgressions must be reviewed holistically.
| 8.3.3.2 | Greater Çakmaktepe |
Çakmaktepe Ext
A summary of RSC’s QC data review for Çakmaktepe Ext is
provided in Table 8-4.
Table 8-4: Summary of Çakmaktepe
Ext QC Review
| Category |
QC Method |
Comments and Conclusion |
| Collar Location |
Consistency monitored by repeat measurements. |
Acceptable consistency established. |
| Diamond: Primary Sampling |
Consistency is monitored by reviewing core recovery. |
While there are intervals with significant core loss, no trends are observed. Acceptable consistency. |
| Diamond: Second split |
Consistency is monitored by relative difference of second-split (coarse crush) duplicates. |
The Au second-split duplicate pair data do not exhibit any systematic trends, step changes, or threshold breaches.
The Cu data demonstrate a preference towards the duplicate; however, this is associated with low-grade samples.
Acceptable consistency overall. |
| Analytical |
Consistency is monitored by CRMs and blanks. CRM SCP results were plotted on a heatmap to identify periods multiple transgressions occurred across various CRMs. |
A review of the Au and Cu CRM heat maps using RSC’s in-house QC
tool does not reveal any significant periods of special cause variation across multiple CRMs.
The review of blank performance confirmed contamination was not an issue.
The laboratory was mostly in control and provided consistent data. |
| | 8-9 | |
| SSR Mining Inc. | Çöpler Property S-K 1300 Report | February 12, 2024 SLR Project No.: 138.21581.00006 |
No QC data for downhole surveys, density, first-split (core-split),
or third-split (pulp repeats) were independently reviewed.
Çakmaktepe
RSC completed a brief review of historical QC data available for the
Çakmaktepe project to establish out-of-control periods where data should be excluded from quality testing.
No QC data were available for review on collar location, downhole surveys,
density, primary sampling (diamond recovery or RC sample weights), RC second-splitting, CRMs and blanks.
A brief summary of RSC’s QC data review, for where data were available,
is provided in Table 8-5 and the relevant data are presented in Figure 8-6–Figure 8-7. Quality control concerns from
2015–2016 are considered low risk as the areas drilled have since been mined.
Table 8-5: Summary of Çakmaktepe
QC Review
| Category |
QC Method |
Comment & Conclusion |
| Diamond: First split |
Consistency is monitored by relative difference of first-split (core-split) duplicates. |
The first-split duplicate data pairs demonstrate consistent splitting, and the data are suitable to support mineral resource classification in appropriate categories. |
| Diamond: Second split |
Consistency is monitored by relative difference of second-split (coarse crush) duplicates. |
The second-split duplicate data pairs demonstrate consistent splitting, and the data are suitable to support mineral resource classification in appropriate categories. |
| Diamond: Third split |
Consistency is monitored by relative difference of third-split (pulp) duplicates/repeats. |
Gold and copper diamond repeat pair data for the third split (e.g. Figure 8-6) suggest that some process consistency issues occurred from April 2015 to April 2016 at SGS Ankara; however, these have minimal impact on the mineral resource confidence. The third-split duplicate data pairs from ALS demonstrate consistent splitting occurred. |
| RC: Third Split |
Consistency is monitored by relative difference of third split (pulp) duplicate/repeats |
Gold, silver, and copper RC repeat pair data (e.g., Figure 8-7) suggest that the process was not always in control at SGS Ankara. The same out-of-control period as in the Au diamond data is present from April 2015 to April 2016 at SGS Ankara. Its impact on the resource classification is minimal, and taken into account when classifying the resource. The third-split duplicate data pairs from ALS demonstrate consistent splitting. |
| | 8-10 | |
| SSR Mining Inc. | Çöpler Property S-K 1300 Report | February 12, 2024 SLR Project No.: 138.21581.00006 |
Figure 8-6: RD Plot Çakmaktepe
DD Third Split (SGS Ankara)
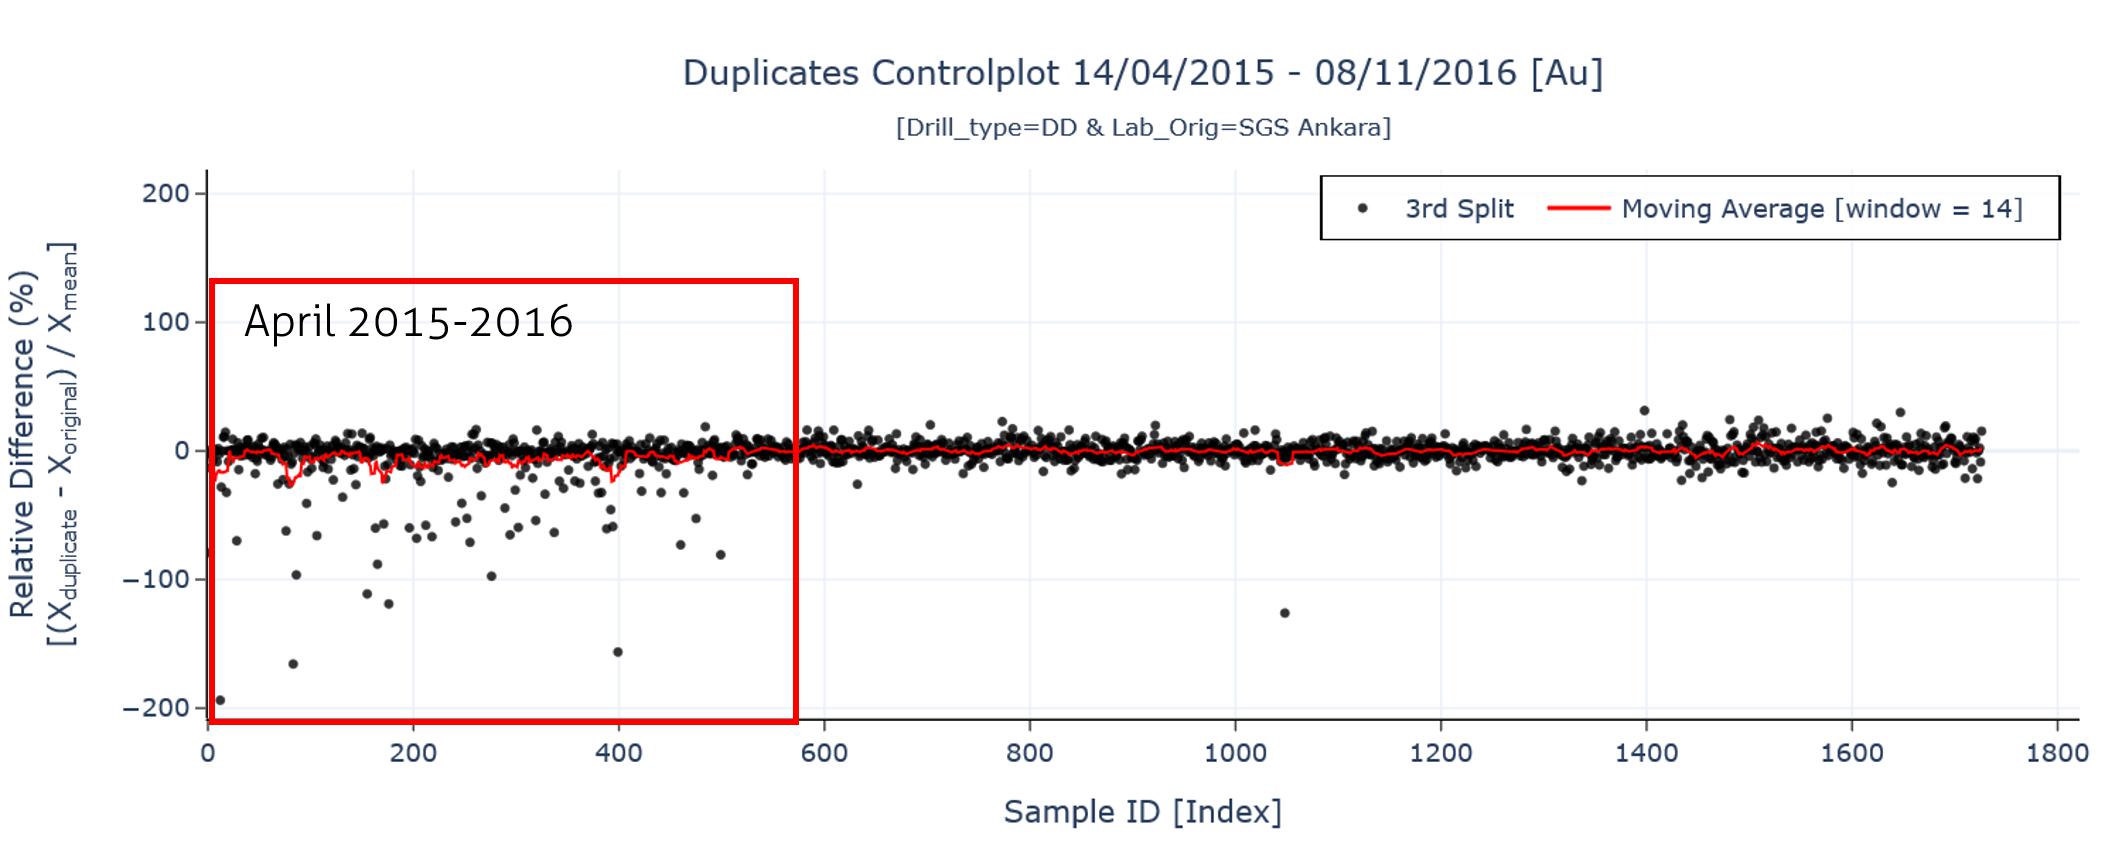
Notes: The RD plot illustrates the relative difference in gold grades
between the original and duplicate DD third split samples against sample ID.
Figure 8-7: RD plot Çakmaktepe
RC Third Split (SGS Ankara)
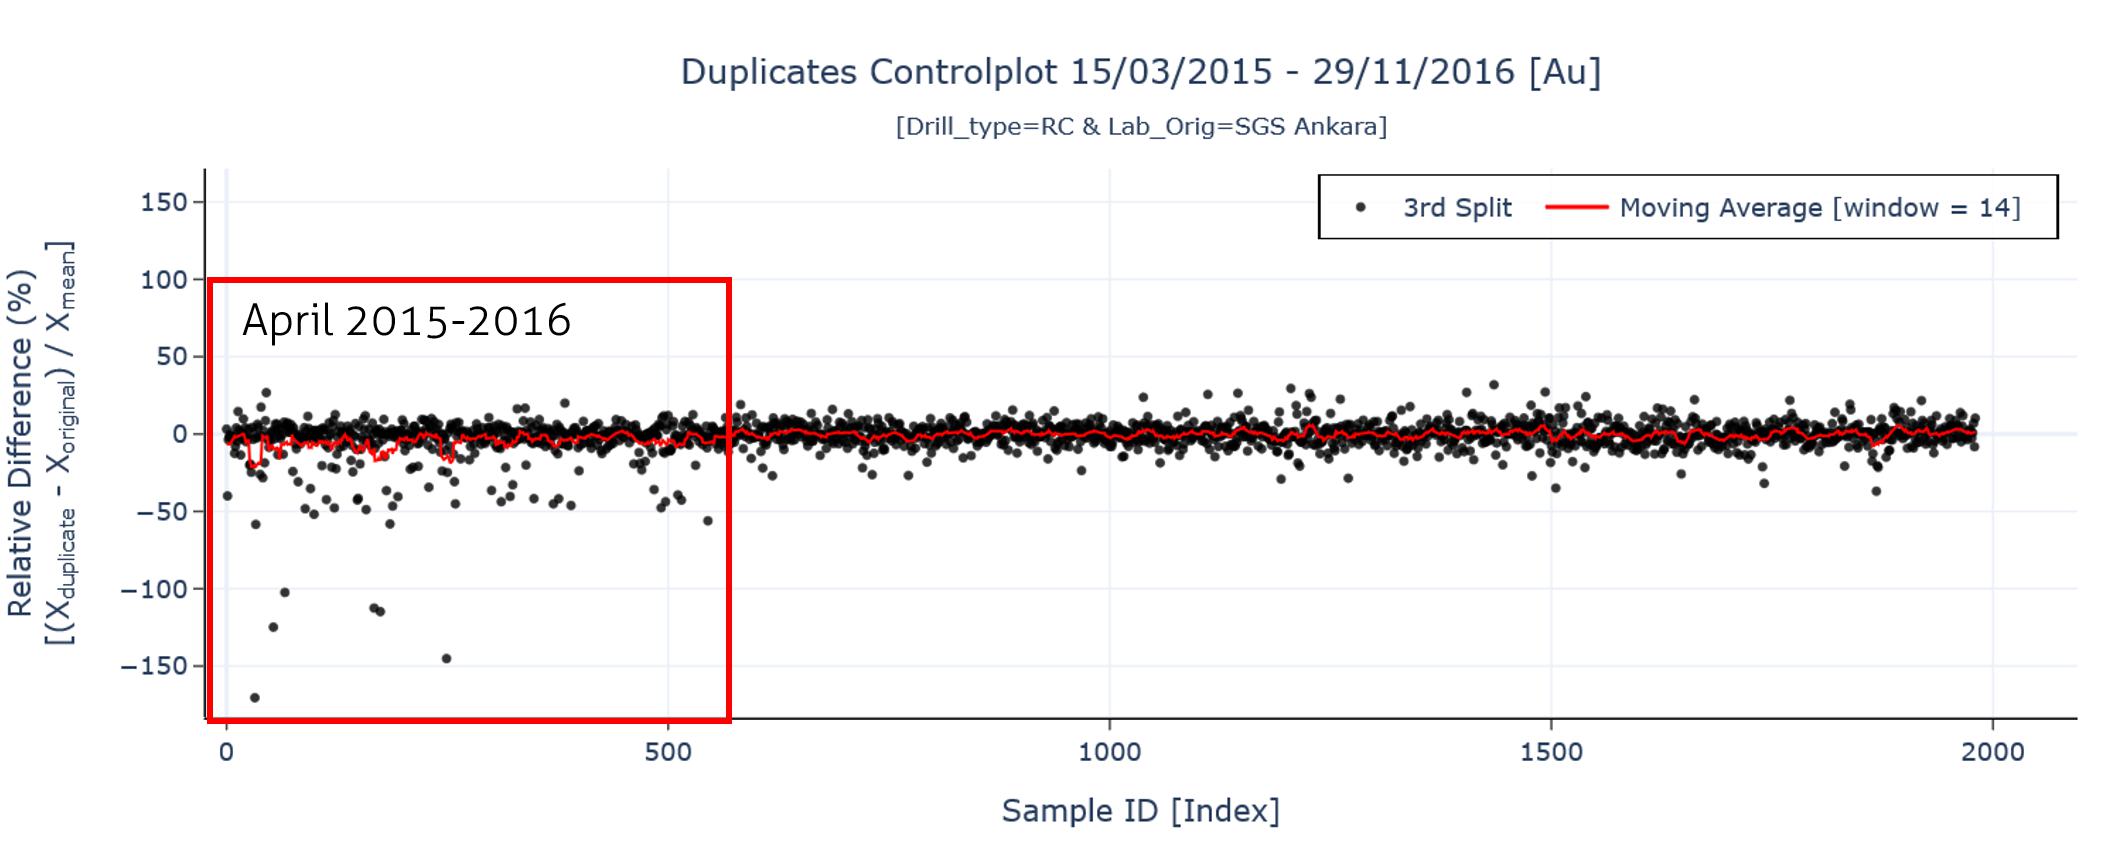
Notes: The RD plot illustrates the relative difference in gold grades
between the original and duplicate RC third split samples against sample ID.
RSC completed a brief review of historical QC data available for the
Bayramdere project to establish out-of-control periods where data should be excluded from quality testing.
No, or insufficient, QC data were available for review on collar location,
downhole surveys, density, primary sampling (diamond recovery or RC sample weights), second-splitting (diamond or RC), CRMs, and blanks.
A summary of RSC’s QC data review for the Bayramdere deposit,
for data nodes where QC data are available, is provided in Table 8-6.
| | 8-11 | |
| SSR Mining Inc. | Çöpler Property S-K 1300 Report | February 12, 2024 SLR Project No.: 138.21581.00006 |
Table 8-6: Summary of Bayramdere
QC Review
| Category |
Comment |
Consistency |
| Diamond: Third split |
Consistency is monitored by relative difference of third-split (pulp) duplicates/repeats. |
Mostly in control, no trends or step changes are observed in third-split duplicate pair data. Acceptable consistency. |
| 8.3.4 | Quality Acceptance Testing |
Quality acceptance testing (QAT) is where a final judgement of the data
is made by assessing the accuracy and precision of the data, for those periods where the process was demonstrated to be in control. Accuracy
and precision are evaluated, and a final risk assessment is made based on the DQO. RSC notes that where quality data were not available,
it has considered its review of processes, systems, and tools used, and/or its experience with certified laboratories, to make a final
judgement on data quality and risk.
A summary of RSC’s Çöpler QAT is provided in Table
8-7. Where relevant, summary text and figures are provided in the following sections.
| | 8-12 | |
| SSR Mining Inc. | Çöpler Property S-K 1300 Report | February 12, 2024 SLR Project No.: 138.21581.00006 |
Table 8-7: Summary of Çöpler
Quality Acceptance Testing
| Category |
Quality Acceptance Testing |
2021–2023 Summary |
Pre-2021 Summary |
Risk Factor |
| Location |
-- |
Some drill holes intersect or scissor, where there are high grades in one and below-detection material in the other. This is usually an indication that either downhole surveys or collar surveys are inaccurate and presents a minor risk. |
Reviewed and considered fit-for-purpose. |
Low–moderate |
| Density |
Density data accuracy was assessed by reviewing umpire (ACME) density data on scatter and QQ plots. No statistically significant biases are present. |
ACME data confirm that the Anagold density data are accurate. RSC considers the data fit for purpose; however, there is a minor risk due to possible selection bias. |
Reviewed and considered fit-for-purpose. |
Low–moderate |
| Diamond: Primary Sampling |
Review of recovery vs grade and distance buffered quantile-quantile (QQ) plot with grade control (GC) data. |
SSR uses blasthole drilling for GC which RSC has found to be biased high compared to the DD results (Figure 8-8). Refer to body text. The true quality of the diamond primary sampling is unknown; however, the overall cover recovery is acceptable for the purpose of classifying resources in their appropriate categories, and there is no correlation between recovery and grade.
In some parts of the resource, there is a reasonable amount of core loss present (Table 8-8), which represents a low–moderate risk that has been taken into account during resource estimation and classification. |
Low–moderate |
| Diamond: First split |
-- |
No first-split (core-split) duplicates were collected by SSR from 2021 to Q3 2023. RSC considers the risk associated with the first-split process to be low and considers the data fit for purpose. |
Reviewed and considered fit-for-purpose. |
Low |
| Diamond: Second split |
Scatter and QQ plots were reviewed for data from in control periods. No statistically significant biases are present. Precisions (CV[1]) were calculated as ~9.0%, ~7.3%, and ~7.5% for Au, Ag and Cu, respectively, which is consistent with the mineralization style and comminution. |
Overall, second-split data are consistent with the DQO. Data from October 2023 are imprecise; although, the impact of this variance is probably limited. |
Reviewed and considered fit-for-purpose. |
Low–moderate |
1
Root mean square coefficient of variation (CV), Stanley & Lawie (2007) & Abzalov (2008).
| | 8-13 | |
| SSR Mining Inc. | Çöpler Property S-K 1300 Report | February 12, 2024 SLR Project No.: 138.21581.00006 |
| Category |
Quality Acceptance Testing |
2021–2023 Summary |
Pre-2021 Summary |
Risk Factor |
| Diamond: Third split |
-- |
No third-split (pulp) quality data are available from 2021–2023. RSC considers the risk associated with the third-split process to be low and considers the data fit for purpose. |
Reviewed and considered fit-for-purpose. |
Low |
| RC: Primary Sample |
A thorough investigation into the relative quality of data for RC drilling was carried using a distance-buffered QQ analysis against DD results (Figure 8-9, Table 8-9). The data show a statistically significant bias (~20–30%) with the RC drilling having higher grades than the DD grades.
Refer to body text for further details. |
As many parts of the resource model that rely on RC drilling information have already been mined, the impact of this bias, which may be around 20–30% between the relevant grade bin of 1–4 g/t Au, is probably limited. However, it is taken into account when classifying the Mineral Resource. |
Low-moderate |
| RC: First Split |
Scatter and QQ plots were reviewed. No statistically significant biases are present. Precisions were calculated as ~29.1% and ~19.2% for Au and Cu, consistent with the mineralization style and split-stage. |
The data resulting from the RC first-split are accurate and precise and therefore consistent with the DQO. |
Reviewed and considered fit-for-purpose. |
Low |
| RC: Second Split |
-- |
No quality data were available for review. RSC considers the risk associated with the second-split process to be low and the data fit for purpose. |
Reviewed and considered fit-for-purpose. |
Low |
| RC: Third Split |
-- |
No quality data were available for review. RSC considers the risk associated with the third-split process to be low and the data fit for purpose. |
Reviewed and considered fit-for-purpose. |
Low |
| | 8-14 | |
| SSR Mining Inc. | Çöpler Property S-K 1300 Report | February 12, 2024 SLR Project No.: 138.21581.00006 |
| Category |
Quality Acceptance Testing |
2021–2023 Summary |
Pre-2021 Summary |
Risk Factor |
| Analytical |
Analytical quality was assessed by calculating the bias and precision from the CRM data and reviewing umpire data. Small biases and variance issues are present in some of the data; however, this is mostly in the low-grade CRMs (Table 8-10). Umpire analyses were reviewed using QQ plots. Gold results at ALS are not biased. Low-grade Ag results at ALS are biased low and Cu results may be slightly high-biased (<2%). Refer to body text for details. |
Considering the magnitude (Table 8-10) of the biases and variance in CRM results, the nature (low-grade and negative) of the Ag and (low-magnitude) Cu biases in the umpire results, RSC considers the analytical accuracy and precision acceptable for the DQO. |
Reviewed and considered fit-for-purpose. |
Low |
| | 8-15 | |
| SSR Mining Inc. | Çöpler Property S-K 1300 Report | February 12, 2024 SLR Project No.: 138.21581.00006 |
Diamond: Primary Sample
A practical way to check and verify the quality of a primary sample
is to validate it against, or compare it with, a sample of a known grade. In simple terms, the difference between the measured value and
the ‘known’ value is then defined as the bias, a measure of sample quality.
For the primary sample, i.e., the sample collected at the drill
bit, such options do not readily exist. The next practical way to determine the quality of the primary sample is to compare it with a
sample of better quality, taken at the same location. This process is usually called ‘twin drilling’, but it can be used anywhere
where a sample from drill type A is close enough to a sample from drill/sample type B.
For diamond core, ‘twin’ holes can be drilled using optimal
quality control. However, SSR uses blasthole drilling for grade control which RSC has found to be biased high compared to the diamond
results (Figure 8-8). RSC recommends that SSR use RC drilling for input grade control drilling due to its advantages over blasthole
drilling.
Figure 8-8: Çöpler
Distance-Buffered QQ-plot for Au from Diamond and Blasthole GC drilling, pairs separated by <1 m (left) and Box-Whisker Plots of Paired
DD and GC Distributions at Various Buffer Distances (right)
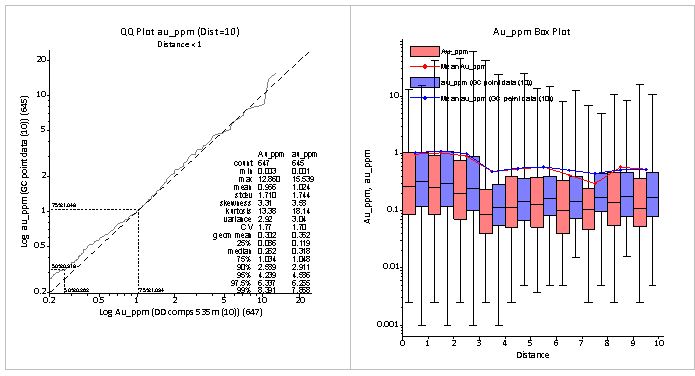
While RSC considers that the primary diamond samples are acceptable
for use in the Mineral Resource estimation, it notes that there is a reasonable amount of core loss present and that this represents
a low to moderate risk. Since 2021, 51% of samples have recovery recorded as >95% (Table 8-8) and many samples have low recovery.
This risk has been taken into account when classifying the Mineral Resource.
| | 8-16 | |
| SSR Mining Inc. | Çöpler Property S-K 1300 Report | February 12, 2024 SLR Project No.: 138.21581.00006 |
Table 8-8: Recovery Summary
Statistics for Çöpler, 2021–2023.
| Recovery Range |
Percentage of Samples |
No. of Samples |
| Above 95% Recovery |
51% |
5,675 |
| Below 95% Recovery |
49% |
5,360 |
RC: Primary Sample
A thorough investigation into the relative quality of data for RC drilling
was carried out by running a distance-buffered analysis on 1-m composites from both DD and RC drilling campaigns. At a 1-m buffer distance
between an RC and a DD sample, this generated 1,015 RC-DD sample pairs.
The data show a bias (Figure 8-9, Table 8-9), with the RC drilling
showing statistically higher grades than the DD grades (a Wilcoxon signed-rank test shows that there is a better than 50% chance that
an RC sample is of a higher grade than a DD sample, with a p-value of 0.00001235). This relationship is consistent, regardless of the
buffer distance (Figure 8-9); a 10 m buffer creates 14,000 paired DD-RC samples.
As many parts of the resource model that rely on RC drilling information
have already been mined, the impact of this bias, which may be around 20–30% between the relevant grade bin of 1–4 g/t Au,
is probably limited. However, it is taken into account when classifying the Mineral Resource.
Figure 8-9: Çöpler
Distance-Buffered QQ-plot for Au from Diamond and RC Drilling, pairs separated by <1 m (left) and Box-Whisker Plots of Paired DD (red)
and RC (blue) Distributions at Various Buffer Distances (right)
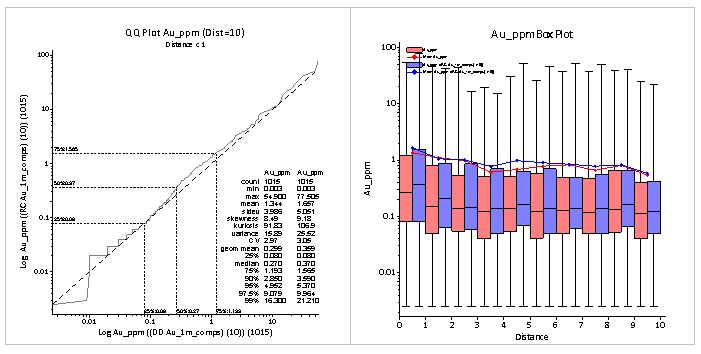
| | 8-17 | |
| SSR Mining Inc. | Çöpler Property S-K 1300 Report | February 12, 2024 SLR Project No.: 138.21581.00006 |
Table 8-9: Results of Çöpler
Distance Buffered QQ-Plot Analysis of Diamond and RC Drilling (Only pairs separated by <1 m)
| Metric |
RC |
DD |
Bias (RC vs DD) |
| Mean |
1.657 |
1.344 |
23% |
| 25% |
0.08 |
0.08 |
0% |
| Median |
0.37 |
0.27 |
37% |
| 75% |
1.565 |
1.193 |
31% |
| Metric |
RC |
DD |
Bias (RC vs DD) |
Analytical
The quality of the fire assaying and analytical process can be determined
from the performance of the CRMs, for those periods where the laboratory systems were in control as demonstrated by the SPC analysis,
and from the results of umpire testing. In addition, masked and spiked CRMs and blind pulp repeats can be used to test the laboratory’s
relative performance.
RSC assessed the analytical performance by calculating bias and precision
of the CRM results from 2021–2023 (Table 8-10). CRM accuracy performance is recorded as marginal or not acceptable when a statistically
significant (based on p-values) bias is calculated. Statistical significance does not consider magnitude; RSC made a final judgement after
considering all factors.
The statistically significant biases noted in the Au CRM results are
either of small magnitude (≤3%) and calculated from small sample populations, or relate to low-grade CRMs. Statistically significant
variance in Au results also relates to low-grade CRMs. Assessment of scatter- and QQ-plots of umpire analyses against original results
confirm that ALS Au results are accurate and not statistically significantly biased.
For the most part, the statistically significant biases and variance
noted in the Ag CRM results are either of small magnitude or relate to low-grade CRMs. In addition to the negative bias noted in the OREAS507
Ag results (Table 8-10), assessment of BV (formerly ACME) umpire analyses against original results also suggests that ALS’s
low-grade Ag results are biased low (statistically significant) and below 5 ppm Ag the results may be biased by up to ~15% (Table 8-10).
Since this is a negative bias and Ag is a minor component of the Çöpler mineralization, this is not considered a material
risk to the resource estimation; however, RSC recommends that SSR discusses Ag analytical performance with the laboratory.
The statistically significant biases noted in the Cu CRM results are
either of small magnitude, or relate to low-grade CRMs. Statistically significant variance in Cu results also relates to low-grade CRMs.
Assessment of scatter- and QQ-plots of umpire analyses against original results confirm that ALS Cu results are accurate and not biased.
Considering the magnitudes and nature of the CRM biases and variance,
and the acceptable Au and Cu umpire results, RSC considers the analytical accuracy and precision for this period acceptable and the overall
risk is low.
| | 8-18 | |
| SSR Mining Inc. | Çöpler Property S-K 1300 Report | February 12, 2024 SLR Project No.: 138.21581.00006 |
Table 8-10: Quality Acceptance
Testing for Çöpler CRMs (2021–2023)
| CRM ID |
Analyte |
Date
From |
Date
To |
No. of Samples |
CRM Mean
(ppm) |
Assay Mean
(ppm) |
Bias |
Accuracy |
CRM SD*
(ppm) |
Assay SD
(ppm) |
Precision |
Summary |
| OREAS61f |
Au |
2/04/21 |
26/08/23 |
37 |
4.6 |
4.72 |
3% |
Marginal |
0.134 |
0.128 |
Excellent |
Small magnitude positive bias; however, small sample population. Low risk. |
| OREAS504b |
Au |
7/07/21 |
8/09/23 |
61 |
1.61 |
1.61 |
0% |
Excellent |
0.037 |
0.044 |
Acceptable |
-- |
| OREAS524 |
Au |
29/04/22 |
1/09/23 |
34 |
1.54 |
1.57 |
2% |
Marginal |
0.046 |
0.04 |
Good |
Small magnitude positive bias; however, small sample population. Low risk. |
| OREAS604 |
Au |
21/06/21 |
6/10/23 |
119 |
1.43 |
1.45 |
2% |
Acceptable |
0.055 |
0.056 |
Excellent |
-- |
| OREAS253 |
Au |
19/03/21 |
31/08/23 |
32 |
1.22 |
1.23 |
1% |
Good |
0.044 |
0.03 |
Acceptable |
-- |
| OREAS251 |
Au |
19/03/21 |
16/09/23 |
44 |
0.5 |
0.51 |
2% |
Marginal |
0.015 |
0.011 |
Acceptable |
Small magnitude positive bias; however, relatively small sample population. Low risk. |
| OREAS502b |
Au |
19/03/21 |
20/09/23 |
81 |
0.49 |
0.5 |
1% |
Good |
0.015 |
0.018 |
Acceptable |
-- |
| OREAS153a |
Au |
1/04/22 |
6/10/23 |
64 |
0.31 |
0.32 |
2% |
Marginal |
0.012 |
0.01 |
Good |
Small magnitude positive bias. Low risk. |
| OREAS153b |
Au |
25/05/21 |
5/10/23 |
84 |
0.31 |
0.31 |
0% |
Excellent |
0.009 |
0.011 |
Good |
-- |
| OREAS501c |
Au |
10/05/21 |
4/10/23 |
189 |
0.22 |
0.23 |
2% |
Marginal |
0.007 |
0.008 |
Acceptable |
Small magnitude positive bias. Low risk. |
| OREAS908 |
Au |
19/03/21 |
19/09/23 |
88 |
0.19 |
0.19 |
2% |
Marginal |
0.007 |
0.007 |
Good |
Low-grade, small magnitude positive bias. Low risk. |
| OREAS507 |
Au |
30/03/22 |
19/09/23 |
47 |
0.18 |
0.18 |
2% |
Marginal |
0.006 |
0.006 |
Excellent |
Low-grade, small magnitude positive bias. Low risk. |
| | 8-19 | |
| SSR Mining Inc. | Çöpler Property S-K 1300 Report | February 12, 2024 SLR Project No.: 138.21581.00006 |
| CRM ID |
Analyte |
Date
From |
Date
To |
No. of Samples |
CRM Mean
(ppm) |
Assay Mean
(ppm) |
Bias |
Accuracy |
CRM SD*
(ppm) |
Assay SD
(ppm) |
Precision |
Summary |
| OREAS152b |
Au |
16/05/21 |
12/09/23 |
136 |
0.13 |
0.14 |
1% |
Good |
0.005 |
0.006 |
Good |
-- |
| OREAS907 |
Au |
19/03/21 |
19/09/23 |
68 |
0.1 |
0.106 |
6% |
Not Acceptable |
0.004 |
0.015 |
Not Acceptable |
Positive bias and large variance; however, low-grade, below COG, Au CRM (Cu target CRM).
Low risk. |
| OREAS604 |
Ag |
21/06/21 |
6/10/23 |
116 |
490.7 |
487.8 |
-1% |
Acceptable |
10.29 |
7.82 |
Acceptable |
-- |
| OREAS36 |
Ag |
21/06/21 |
7/07/23 |
109 |
10.17 |
10.14 |
0% |
Excellent |
0.634 |
0.307 |
Acceptable |
-- |
| OREAS61f |
Ag |
2/04/21 |
26/08/23 |
35 |
3.64 |
3.71 |
2% |
Acceptable |
0.148 |
0.131 |
Good |
-- |
| OREAS504b |
Ag |
7/07/21 |
8/09/23 |
54 |
3.07 |
3.13 |
2% |
Acceptable |
0.225 |
0.147 |
Acceptable |
-- |
| OREAS908 |
Ag |
19/03/21 |
19/09/23 |
81 |
2.4 |
2.47 |
3% |
Marginal |
0.109 |
0.145 |
Acceptable |
Small magnitude positive bias. Low risk. |
| OREAS153b |
Ag |
25/05/21 |
5/10/23 |
78 |
1.45 |
1.45 |
0% |
Excellent |
0.09 |
0.125 |
Marginal |
Large variance; however, low-grade Ag CRM. Low risk. |
| OREAS907 |
Ag |
19/03/21 |
19/09/23 |
66 |
1.35 |
1.35 |
0% |
Excellent |
0.115 |
0.126 |
Good |
-- |
| OREAS507 |
Ag |
30/03/22 |
19/09/23 |
45 |
1.34 |
1.29 |
-4% |
Not Acceptable |
0.081 |
0.103 |
Acceptable |
Low-grade, negative bias. Low risk. |
| OREAS152b |
Ag |
16/05/21 |
12/09/23 |
134 |
0.86 |
0.86 |
0% |
Excellent |
0.096 |
0.117 |
Acceptable |
-- |
| OREAS604 |
Cu |
30/03/22 |
6/10/23 |
46 |
21,641 |
21,323 |
-1% |
Marginal |
485.2 |
429.9 |
Good |
Small magnitude, negative bias. Low risk. |
| OREAS908 |
Cu |
19/03/21 |
19/09/23 |
58 |
12,604 |
12,497 |
-1% |
Good |
293.9 |
264.3 |
Good |
-- |
| OREAS907 |
Cu |
19/03/21 |
19/09/23 |
38 |
6,377 |
6,428 |
1% |
Good |
188.4 |
272.4 |
Not Acceptable |
Large variance; however, low-grade Cu CRM. Low risk. |
| | 8-20 | |
| SSR Mining Inc. | Çöpler Property S-K 1300 Report | February 12, 2024 SLR Project No.: 138.21581.00006 |
| CRM ID |
Analyte |
Date
From |
Date
To |
No. of Samples |
CRM Mean
(ppm) |
Assay Mean
(ppm) |
Bias |
Accuracy |
CRM SD*
(ppm) |
Assay SD
(ppm) |
Precision |
Summary |
| OREAS152b |
Cu |
16/05/21 |
12/09/23 |
55 |
3,753 |
3,866 |
3% |
Not Acceptable |
83.4 |
100.2 |
Good |
Low-grade, small magnitude, positive bias. Low risk. |
| OREAS501c |
Cu |
10/05/21 |
4/10/23 |
70 |
2,755 |
2,818 |
2% |
Marginal |
80.7 |
74.2 |
Excellent |
Low-grade, small magnitude, positive bias. Low risk. |
| | 8-21 | |
| SSR Mining Inc. | Çöpler Property S-K 1300 Report | February 12, 2024 SLR Project No.: 138.21581.00006 |
Figure 8-10: Scatter and QQ
Plot from Çöpler Umpire Analysis for Ag, ALS vs BV (2021–2023)
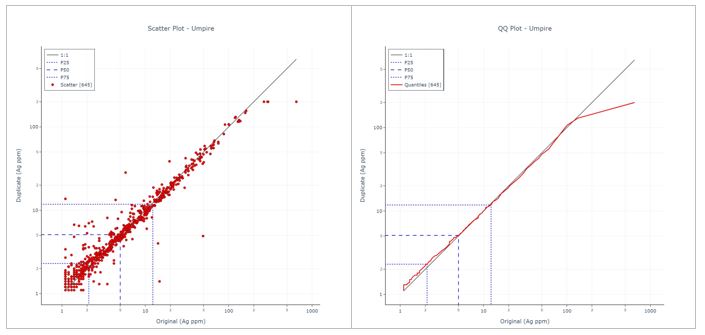
| 8.3.4.2 | Greater Çakmaktepe |
Çakmaktepe Ext
A summary of RSC’s Çakmaktepe Ext QAT is provided in Table
8-12. Where relevant, summary sections and figures are provided in the following sections.
RSC data quality review of the data presented in OreWin (2020) confirmed
that the Çakmaktepe Ext drill hole data, sampling and assaying before 2021 is of a good standard and suitable for the purpose of
mineral resource estimation and the reporting of exploration results.
Diamond: Primary Sample
While RSC considers that the primary samples are acceptable for use
in the mineral resource estimation, it notes that there is a reasonable amount of core loss present and that this represents a low–moderate
risk. Since 2020, only 34% of samples have recovery recorded as >95% (Table 8-11). This risk has been taken into account when classifying
the Mineral Resource.
Table 8-11: Recovery Summary
Statistics for Çakmaktepe Ext, May 2020–2023.
| Recovery Range |
Percentage of Samples |
No. of Samples |
| Above 95% Recovery |
34% |
13,509 |
| Below 95% Recovery |
66% |
26,269 |
Analytical
RSC assessed the analytical performance by calculating the bias and
precision of the CRM results from 2021–2023 (Table 8-13).
| | 8-22 | |
| SSR Mining Inc. | Çöpler Property S-K 1300 Report | February 12, 2024 SLR Project No.: 138.21581.00006 |
The statistically significant biases noted in the Au CRM results are
either of small magnitude (≤3%), or relate to low-grade CRMs. Statistically significant variance in Au results also relates to low-grade
CRMs. Assessment of scatter- and QQ-plots of umpire analyses against original results confirm that ALS Au results are accurate and not
biased.
The statistically significant bias noted in the Ag CRM results only
relates to a low-grade Ag CRM. However, similar to Çöpler, the assessment of BV umpire analyses against original results on
scatter- and QQ-plots demonstrates that ALS’s Ag results are biased (conditional linear; Figure 8-11). The positive bias, up
to approximately 13%, in the higher-grade (10 ppm to 200 ppm) Ag umpire results is in a grade range that was not quality-controlled by
any of the CRMs at ALS. Statistically significant variance is also common in the Ag CRM results at ALS. Even though Ag is a minor component
of the Çakmaktepe Ext mineralization with low recovery by heap leach, this represents a low–moderate risk to the Ag resource
estimation. RSC recommends that SSR discuss Ag analytical performance with the laboratory.
The statistically significant biases noted in the Cu CRM results are
either of small magnitude (≤4%) or relate to low-grade CRMs. Assessment of scatter- and QQ-plots of umpire analyses against original
results confirm that ALS Cu results are accurate and not biased. Statistically significant variance in Cu results also relates to low-grade
CRMs.
| | 8-23 | |
| SSR Mining Inc. | Çöpler Property S-K 1300 Report | February 12, 2024 SLR Project No.: 138.21581.00006 |
Table 8-12: Summary of Çakmaktepe
Ext Quality Acceptance Testing
| Category |
Quality Acceptance Testing |
2021–2023
Summary |
Pre-2021 Summary |
Risk Factor |
| Location |
-- |
RSC considers the location data fit for the purpose of estimation and resource classification. |
Reviewed and considered fit-for-purpose. |
Low |
| Density |
Density data accuracy was assessed by reviewing umpire (ACME) data on scatter and QQ plots. |
ACME data confirm that the Anagold density data are accurate. RSC considers the data fit for purpose; however, there is a minor risk due to possible selection bias. |
Reviewed and considered fit-for-purpose. |
Low–moderate |
| Diamond: Primary Sampling |
Comparison of recovery vs grade |
There is a reasonable amount of core loss present (Table 8-11) which represents a low–moderate risk to be taken into account during resource estimation and classification. |
Reviewed and considered fit-for-purpose. |
Low–moderate |
| Diamond: First split |
-- |
No first-split (core-split) duplicates were collected by SSR from 2021–2023. RSC considers the risk associated with the first-split process to be low and considers the data fit for purpose. |
Reviewed and considered fit-for-purpose. |
Low |
| Diamond: Second split |
Scatter and QQ plots were reviewed. No statistically significant biases are present for Au, Ag or Cu. Acceptable precision values of ~9.7%, ~9.9% and ~15.4% for Au, Ag and Cu were calculated. |
The data resulting from the second split are accurate and precise and therefore fit for the purpose of resource estimation in high-confidence classification categories. |
Reviewed and considered fit-for-purpose. |
Low–moderate |
| Diamond: Third split |
-- |
No third-split (pulp) quality data are available from 2021–2023. RSC considers the risk associated with the third-split process to be low and considers the data fit for purpose. |
Reviewed and considered fit-for-purpose. |
Low |
| Analytical |
Assessed using bias and precision of the CRM data and reviewing umpire data. Biases and variance issues are present in some of the data, particularly Ag (Table 8-13Table 8-10). Refer to body text for details. |
Overall, Au and Cu analytical data are considered accurate and precise at grades of interest. Silver data may be biased up to ~13% across the grade range and are imprecise at low grades. As Ag is a minor component, this represents a moderate risk. |
Reviewed and considered fit-for-purpose. |
Low–moderate (Ag) |
| | 8-24 | |
| SSR Mining Inc. | Çöpler Property S-K 1300 Report | February 12, 2024 SLR Project No.: 138.21581.00006 |
Table 8-13: Quality Acceptance
Testing for Çakmaktepe Ext CRMs, 2021–2023.
| CRM ID |
Analyte |
Date
From
DD / MM / YY |
Date
To
DD / MM / YY |
No. of Samples |
CRM Mean
(ppm) |
Assay Mean
(ppm) |
Bias |
Accuracy |
CRM SD (ppm) |
Assay SD
(ppm) |
Precision |
Summary |
| OREAS256b |
Au |
26/07/21 |
31/07/23 |
33 |
7.84 |
7.88 |
1% |
Good |
0.207 |
0.212 |
Good |
-- |
| OREAS256 |
Au |
25/06/21 |
7/08/23 |
35 |
7.66 |
7.72 |
1% |
Good |
0.238 |
0.155 |
Good |
-- |
| OREAS254b |
Au |
26/03/21 |
31/12/22 |
56 |
2.53 |
2.55 |
1% |
Acceptable |
0.061 |
0.065 |
Good |
-- |
| OREAS604 |
Au |
14/01/21 |
10/07/23 |
191 |
1.427 |
1.45 |
2% |
Acceptable |
0.055 |
0.061 |
Good |
-- |
| OREAS253 |
Au |
24/03/21 |
28/07/23 |
82 |
1.22 |
1.23 |
1% |
Good |
0.044 |
0.045 |
Excellent |
-- |
| OREAS251 |
Au |
19/03/21 |
27/07/23 |
110 |
0.5 |
0.51 |
2% |
Marginal |
0.015 |
0.022 |
Not Acceptable |
Small magnitude, positive bias and variance. Low-grade CRM. Low risk. |
| OREAS153b |
Au |
14/01/21 |
2/08/23 |
138 |
0.31 |
0.32 |
1% |
Acceptable |
0.009 |
0.0102 |
Good |
-- |
| OREAS153a |
Au |
11/05/22 |
3/08/23 |
34 |
0.31 |
0.32 |
2% |
Marginal |
0.012 |
0.01 |
Good |
Small magnitude, positive bias; however, small sample population and low-grade CRM. Low risk. |
| OREAS501c |
Au |
19/03/21 |
2/08/23 |
119 |
0.22 |
0.23 |
2% |
Marginal |
0.0065 |
0.0071 |
Good |
Small magnitude, positive bias. Low-grade CRM. Low risk. |
| OREAS908 |
Au |
14/01/21 |
29/07/23 |
170 |
0.187 |
0.191 |
2% |
Marginal |
0.0066 |
0.007 |
Good |
Small magnitude, positive bias. Low-grade CRM. Low risk. |
| OREAS507 |
Au |
1/04/22 |
28/07/23 |
96 |
0.18 |
0.18 |
1% |
Acceptable |
0.0059 |
0.008 |
Marginal |
Small imprecision. Low-grade CRM. Low risk. |
| OREAS152b |
Au |
14/01/21 |
22/07/23 |
234 |
0.13 |
0.13 |
0% |
Excellent |
0.0055 |
0.0052 |
Excellent |
-- |
| | 8-25 | |
| SSR Mining Inc. | Çöpler Property S-K 1300 Report | February 12, 2024 SLR Project No.: 138.21581.00006 |
| CRM ID |
Analyte |
Date
From
DD / MM / YY |
Date
To
DD / MM / YY |
No. of Samples |
CRM Mean
(ppm) |
Assay Mean
(ppm) |
Bias |
Accuracy |
CRM SD (ppm) |
Assay SD
(ppm) |
Precision |
Summary |
| OREAS907 |
Au |
14/01/21 |
2/08/23 |
239 |
0.1 |
0.103 |
3% |
Not Acceptable |
0.0038 |
0.008 |
Not Acceptable |
Small magnitude, positive bias and variance. Small imprecision. Low-grade CRM. Low risk. |
| OREAS604 |
Ag |
14/01/21 |
10/07/23 |
186 |
490.6 |
486.6 |
-1% |
Acceptable |
10.29 |
7.71 |
Acceptable |
-- |
| OREAS36 |
Ag |
17/06/21 |
20/07/23 |
207 |
10.17 |
10.17 |
0% |
Excellent |
0.634 |
0.313 |
Acceptable |
-- |
| OREAS908 |
Ag |
14/01/21 |
29/07/23 |
163 |
2.4 |
2.42 |
1% |
Good |
0.109 |
0.173 |
Not Acceptable |
Imprecision, relatively low-grade Ag CRM. Low Risk |
| OREAS153b |
Ag |
14/01/21 |
2/08/23 |
138 |
1.45 |
1.46 |
1% |
Good |
0.09 |
0.123 |
Not Acceptable |
Imprecision, low-grade Ag CRM. Low Risk |
| OREAS256b |
Ag |
26/07/21 |
31/07/23 |
31 |
1.45 |
1.43 |
-2% |
Acceptable |
0.064 |
0.124 |
Not Acceptable |
Imprecision, low-grade Ag CRM. Low Risk |
| OREAS907 |
Ag |
14/01/21 |
2/08/23 |
232 |
1.35 |
1.34 |
-1% |
Excellent |
0.115 |
0.17 |
Marginal |
Imprecision, low-grade Ag CRM. Low risk. |
| OREAS507 |
Ag |
1/04/22 |
28/07/23 |
88 |
1.34 |
1.29 |
-4% |
Marginal |
0.081 |
0.104 |
Acceptable |
Negative bias (similar to Çöpler, Table 8-10), low-grade CRM. Low risk. |
| OREAS152b |
Ag |
14/01/21 |
22/07/23 |
234 |
0.86 |
0.84 |
-3% |
Acceptable |
0.096 |
0.112 |
Acceptable |
-- |
| OREAS908 |
Cu |
14/01/21 |
29/07/23 |
167 |
12,604 |
12,548 |
0% |
Excellent |
293.9 |
209.5 |
Good |
-- |
| OREAS153a |
Cu |
11/05/22 |
3/08/23 |
34 |
7,117 |
7,174 |
1% |
Good |
252 |
177 |
Good |
-- |
| OREAS153b |
Cu |
14/01/21 |
2/08/23 |
48 |
6,782 |
6,919 |
2% |
Marginal |
152 |
182 |
Acceptable |
Small magnitude positive bias. Low risk. |
| OREAS907 |
Cu |
14/01/21 |
2/08/23 |
236 |
6,377 |
6376 |
0% |
Excellent |
188.4 |
158.5 |
Good |
-- |
| | 8-26 | |
| SSR Mining Inc. | Çöpler Property S-K 1300 Report | February 12, 2024 SLR Project No.: 138.21581.00006 |
| CRM ID |
Analyte |
Date
From
DD / MM / YY |
Date
To
DD / MM / YY |
No. of Samples |
CRM Mean
(ppm) |
Assay Mean
(ppm) |
Bias |
Accuracy |
CRM SD (ppm) |
Assay SD
(ppm) |
Precision |
Summary |
| OREAS507 |
Cu |
1/04/22 |
28/07/23 |
97 |
6,224 |
6,252 |
0% |
Excellent |
127.9 |
135.2 |
Good |
-- |
| OREAS152b |
Cu |
14/01/21 |
22/07/23 |
232 |
3,753 |
3,865 |
3% |
Not Acceptable |
83 |
111 |
Not Acceptable |
Small magnitude, positive bias and imprecision. Low risk. |
| OREAS501c |
Cu |
19/03/21 |
2/08/23 |
120 |
2,755 |
2,822 |
2% |
Marginal |
80.7 |
68.7 |
Good |
Small magnitude positive bias. Low risk. |
| OREAS256b |
Cu |
26/07/21 |
31/07/23 |
31 |
94 |
96 |
2% |
Acceptable |
4.267 |
6.529 |
Not Acceptable |
Imprecision; however, small sample population and low-grade Cu CRM. Low risk. |
| OREAS251 |
Cu |
1/04/22 |
27/07/23 |
55 |
48 |
55 |
17% |
Not Acceptable |
2.382 |
4.504 |
Not Acceptable |
Large positive bias and imprecision. However, very low-grade CRM. Low risk |
| OREAS254b |
Cu |
1/04/22 |
20/06/23 |
45 |
43 |
45 |
4% |
Marginal |
2.411 |
2.885 |
Acceptable |
Positive bias; however, very low-grade Cu CRM.
Low risk. |
| | 8-27 | |
| SSR Mining Inc. | Çöpler Property S-K 1300 Report | February 12, 2024 SLR Project No.: 138.21581.00006 |
Figure 8-11: Scatter and QQ
Plot from Çakmaktepe Ext Umpire Analysis for Ag, ALS vs BV, (2021–2023)
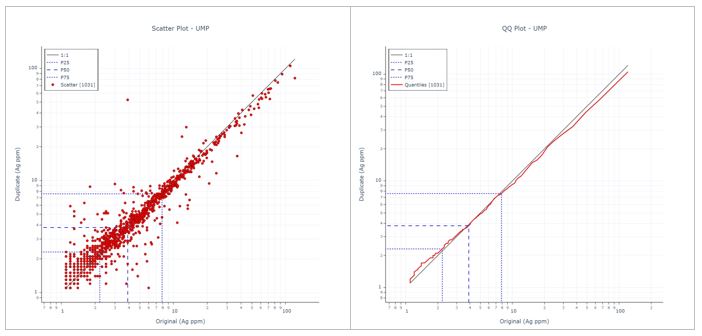
Çakmaktepe
No new drill hole data have been collected since the previous Technical
Report Summary, completed by OreWin (2022). A summary of RSC’s Çakmaktepe QAT is provided in Table 8-14.
Table 8-14: Summary of Çakmaktepe
Quality Acceptance Testing
| Category |
Quality Testing |
Summary |
Risk Factor |
| Location |
-- |
Previously reviewed and considered fit-for-purpose. |
Low |
| Density |
-- |
Previously reviewed and considered fit-for-purpose. |
Low–moderate |
| Diamond: Primary Sampling |
Comparison of recovery vs grade. |
A substantial number of samples have low to very low recoveries (only 23% of samples have recovery >95%), with a significant proportion of poor recovery samples having Au grades well above the expected cut-off grades. This represents a low–moderate risk to be taken into account during resource estimation and classification. |
Low–moderate |
| Diamond: First split |
Scatter and QQ plots were reviewed. Acceptable precision values were calculated for Au, Ag and Cu and no statistically significant biases are present. |
The data resulting from the diamond first split are accurate and sufficiently precise for use in resource estimation. |
Low |
| | 8-28 | |
| SSR Mining Inc. | Çöpler Property S-K 1300 Report | February 12, 2024 SLR Project No.: 138.21581.00006 |
| Category |
Quality Testing |
Summary |
Risk Factor |
| Diamond: Second split |
Scatter and QQ plots were reviewed. Acceptable precision values were calculated for Au, Ag and Cu and no statistically significant biases are present |
The data resulting from the diamond second-split are accurate and precise for use in resource estimation and classification. |
Low |
| Diamond: Third split |
An out-of-control periods was identified in the Au repeat data from
April 2015–April 2016 at SGS Ankara. This relates to drilling in an area that has since been mined.
Outside of this period, scatter and QQ plots demonstrate that the third
split (pulp) repeat data are accurate and precise. |
When the system was in control, the Au, Ag and Cu data delivered were sufficiently accurate and precise for use in resource estimation. |
Low |
| RC: Primary Sampling |
An investigation into the relative quality of data for RC drilling was
carried out by running a distance-buffered analysis against DD results.
The results indicate a bias with the RC drilling showing statistically
significant higher (~5–10%) grades than the DD grades on average. This bias appears to be more profound when opening up the buffer
distance, with 5,000 RC/DDD sample pairs within 3 m of each other having a grade bias of up to 25%. |
The impact of this 5–10% bias is probably limited; however, it is taken into account when classifying the Mineral Resource. |
Low–moderate |
| RC: First Split |
-- |
Previously reviewed and considered fit-for-purpose. |
Low |
| RC: Second Split |
-- |
Previously reviewed and considered fit-for-purpose. |
Low |
| RC: Third Split |
An out-of-control period was identified in the Au from April 2015–April 2016 at SGS Ankara. Scatter and QQ plots were reviewed. Acceptable precision values were calculated for Au, Ag and Cu. The small Ag dataset (65 pairs) from ALS Izmir is low-biased. |
When the system was in control, the Au and Cu data delivered were sufficiently accurate and precise. Given the nature (low bias) of the Ag results, this is considered low risk. |
Low |
| Analytical |
-- |
Previously reviewed and considered fit-for-purpose: |
Low |
The RSC QP completed a brief review of the reported historical quality
data verification completed by Cube Consulting (2016b) for the Bayramdere project. The RSC QP concluded that the sample data are considered
to be of an acceptable standard and appropriate for the purpose of classification of Mineral Resources in appropriate categories.
| | 8-29 | |
| SSR Mining Inc. | Çöpler Property S-K 1300 Report | February 12, 2024 SLR Project No.: 138.21581.00006 |
A summary of RSC’s Bayramdere QAT is provided in Table 8-15.
Table 8-15: Summary of Bayramdere
Quality Acceptance Testing
| Category |
Quality Testing |
Summary |
Risk Factor |
| Location |
-- |
Previously reviewed and considered fit-for-purpose. |
Low |
| Density |
-- |
Previously reviewed and considered fit-for-purpose. |
Low–moderate |
| Diamond: Primary Sampling |
-- |
Previously reviewed and considered fit-for-purpose. |
Low–moderate |
| Diamond: First split |
Insufficient quality data available to reach statistical conclusions. |
Based on a review of processes and systems, and a visual review of the available duplicate pair data in scatterplot, RSC considers the data are fit for the purpose of estimation; however, the lack of quality data should be taken into consideration when classifying the mineral resource. |
Low |
| Diamond: Second split |
-- |
Based on a review of processes and systems, data resulting from the diamond second-split are considered fit-for-purpose for resource estimation. |
Low–moderate |
| Diamond: Third split |
Scatter and QQ plots were reviewed for data from ALS and SGS. Acceptable precision values were calculated for Au. The QQ plots do not suggest any significant biases; however, a ranked Wilcoxon test confirms an average ~3.5% bias towards the duplicate at SGS is statistically significant at 95% confidence. |
Given the magnitude of the bias, its nature (low original results) and the larger contribution of ALS results, RSC considers the third split data are sufficiently accurate and precise for the purpose of resource estimation; however, the risk of a bias should be taken into consideration when classifying the mineral resource. |
Low–moderate |
| RC: Primary Sampling |
-- |
Previously reviewed and considered fit-for-purpose. |
Low |
| RC: First Split |
Insufficient quality data available to reach statistical conclusions. |
Based on a review of processes and systems, and a visual review of the available duplicate pair data in scatterplot, RSC considers the data are fit for the purpose of estimation; however, the lack of quality data should be taken into consideration when classifying the mineral resource. |
Low |
| | 8-30 | |
| SSR Mining Inc. | Çöpler Property S-K 1300 Report | February 12, 2024 SLR Project No.: 138.21581.00006 |
| Category |
Quality Testing |
Summary |
Risk Factor |
| RC: Second Split |
-- |
Previously reviewed and considered fit-for-purpose. |
Low |
| RC: Third Split |
An out-of-control period was identified in the Au from April 2015–April 2016 at SGS Ankara. The small Ag dataset (65 pairs) from ALS Izmir is biased (higher duplicate grades). |
When the system was in control, the Au and Cu data delivered were sufficiently accurate and precise. Given the nature (low bias) of the Ag results, this is considered low risk. |
Low |
| Analytical |
-- |
Previously reviewed and considered fit-for-purpose: Analytical results of CRMs and umpire analyses demonstrate that analytical results for Au, Ag, Cu and S are precise and mostly accurate. |
Low |
Drill core and RC chips are transported to the core storage facility
by either the drilling company personnel or Anagold geological staff. Once at the facility, the samples are kept in a secure location
while logging and sampling are conducted. The DD core storage facility is enclosed by a fence and gate that is locked at night and when
the geology staff are absent. When samples are transported off site, a commercial carrier is used.
In the opinion of the QP, the sample preparation, security, and analytical
procedures are adequate and meet industry standards for data quality and integrity. There are no factors related to sampling or sample
preparation that would materially impact the accuracy or reliability of the samples or the assay results. The QC results indicate that
the assay results are within acceptable levels of accuracy and precision and the resulting database is sufficient to support the estimation
of Mineral Resources and classification in the relevant confidence categories.
| | 8-31 | |
| SSR Mining Inc. | Çöpler Property S-K 1300 Report | February 12, 2024 SLR Project No.: 138.21581.00006 |
Data verification is the process of checking and verifying hard-copy
logs and digital records for accuracy, ensuring the data on which mineral resource estimates are based can be linked from digital databases
or records to log sheets and drilling or sampling intervals. It is an additional verification process to determine that QA and QC processes
have been effectively applied and that these were working to assure and control the quality of the data. Data verification is carried
out after samples have been collected, assays have been returned, and data have been stored in the database. Where relevant, data verification
may also include check sampling carried out by the Competent Person, especially if SOPs are not available or difficult to audit, and QC
data are limited to demonstrate processes were in control.
The RSC QP for Geology and Mineral Resource estimation visited the site
from April 14 to 17, 2023, and September 1 to 15, 2023.
The RSC QP reviewed the Project geology, SOPs, collar locations, downhole
surveys, logs, core, pulps, and laboratory certificates. The location data of a selection of collars were checked using a handheld GPS.
The locations captured generally match and are within acceptable variance with the DGPS values that are recorded in the database. The
RSC QP checked database entries against logs and chip trays, core and pulp samples retained on site. No noteworthy issues or discrepancies
were observed.
A selection of check samples and spiked CRMs were sent to the laboratory.
Forty samples of high-grade intercepts over different geological domains at Çöpler were selected for assay check, sampled
under RSC supervision, and sent to ALS to confirm grade tenor and verify the laboratory. A batch of ten CRMs, of which two were spiked
with one spoon of another CRM, was prepared under RSC supervision. The ten CRMs were distributed in three identical batches and submitted
over the course of three weeks to ALS. No issues or discrepancies were observed.
Checks completed by the RSC QP only uncovered minor database errors
which were corrected. Check samples indicated an expected correlation compared with the original sampling. In the RSC QP’s opinion,
the Çöpler district data were collected through proper processes and quality controlled to be fit for the purpose of exploration
targeting, Mineral Resource estimation, and resource classification in suitable categories.
Digital database exports were supplied to RSC by SSR for use in the
Mineral Resource estimates. The data are from the various drilling campaigns that have taken place at the Project deposits since 2000.
A list of 330 drill holes that were to be ignored, for various reasons,
was provided by SSR, and removed from RSC’s estimation work. These holes were drilled for geotechnical, water monitoring, and metallurgical
studies, as well as grade control holes that were drilled on stockpiles. All data were then further validated and reviewed, where possible,
and other than some minor data adjustments and corrections, no additional data were excluded from the estimation process. All numerical
data were transferred to the modeling software, where collar, survey, lithology, assay, and density tables were validated, and inconsistencies
checked. Below-detection values were replaced by two-thirds of the detection limit in the model; for these samples, the original entries
were retained in the database.
| | 9-1 | |
| SSR Mining Inc. | Çöpler Property S-K 1300 Report | February 12, 2024 SLR Project No.: 138.21581.00006 |
The data checks completed are summarized below.
| · | Consistency checks of alphanumeric fields, numeric fields, assay data, density, and interval tables (i.e. assays, lithology and surveys). |
| · | Checks for erroneous drill hole collar outliers — easting, northing, elevation. |
| · | Discrepancies in maximum hole depths between collar and assay, survey, and geology records. |
| · | Survey table drill hole dips and azimuths checked to be within the expected range (in degrees), and that no excessive deviation exists
between successive downhole readings. |
| · | Survey table checked for any positive or near-zero drill hole inclinations. |
| · | Assay table checked for overlaps of assay sample intervals. |
| · | Assay table checked for negative assays (other than below detection limit values), missing assays or assays outside of expected ranges. |
| · | Visual inspection of the drill holes in 3D to identify spatial inconsistencies of drill hole traces (i.e., unlikely hole deviations). |
| 9.3 | Çöpler Deposit Data Verification |
As detailed in OreWin (2020), various independent database audits have
been conducted since 2014. SSR also completes an internal data and QA/QC review of new data every quarter.
Before estimating the 2023 Mineral Resource, RSC completed data verification
following the process outlined in Sections 9.1 and 9.2. The QA/QC review and data quality summary are detailed in Section 8.3.4.
In the RSC QP’s opinion, the Çöpler data were collected
through proper processes and quality controlled to be fit for the purpose of Mineral Resource estimation and classification in suitable
categories; the data resulting from the process is managed well in appropriate management systems.
| 9.4.1 | Çakmaktepe Deposit Data Verification |
No new drill hole data has been collected since OreWin (2020) for the
Çakmaktepe Deposit. As detailed in OreWin (2020), various independent database audits have been conducted since 2014.
Before estimating the 2023 Mineral Resource, RSC completed data verification
following the process outlined in Sections 9.1 and 9.2. A data quality summary for Çakmaktepe is detailed in Section 8.3.4.
In the RSC QP’s opinion, the Çakmaktepe data was collected
through proper processes and quality controlled to be fit for the purpose of Mineral Resource estimation and classification in suitable
categories; the data resulting from the process is managed well in appropriate management systems.
| | 9-2 | |
| SSR Mining Inc. | Çöpler Property S-K 1300 Report | February 12, 2024 SLR Project No.: 138.21581.00006 |
| 9.4.2 | Çakmaktepe Ext Deposit Data Verification |
Previous Çakmaktepe Ext data reviews were undertaken on a campaign
basis at milestone times in the evolution of the exploration program. The collective results up to May 29, 2021, were reported in OreWin
(2022). SSR also completes an internal data and QA/QC review of new data every quarter.
Before estimating the 2023 Mineral Resource, RSC completed data verification
following the process outlined in Sections 9.1 and 9.2. A QA/QC review and data quality summary for Çakmaktepe Ext are detailed
in Section 8.3.4.
In the RSC QP’s opinion, the Çakmaktepe Ext data was collected
through proper processes and quality controlled to be fit for the purpose of Mineral Resource estimation and classification in suitable
categories; the data resulting from the process is managed well in appropriate management systems.
| 9.5 | Bayramdere Deposit Data Verification |
No new drill hole data have been collected at Bayramdere since 2016.
As detailed in OreWin (2020), independent data verification was conducted during and immediately following the 2015 Bayramdere drilling
program, and a data audit was completed in January 2016 (Cube Consulting, 2016b).
Before estimating the 2023 Mineral Resource, RSC completed data verification
following the process outlined in Sections 9.1 and 9.2. A data quality summary for Bayramdere is detailed in Section 8.3.
In the RSC QP’s opinion, the Bayramdere data were collected through
proper processes and quality controlled to be fit for the purpose of Mineral Resource estimation and classification in suitable categories;
the data resulting from the process is managed well in appropriate management systems.
The RSC QP is of the opinion that database verification procedures for
the Çöpler Project comply with industry standards and are adequate for the purposes of Mineral Resource estimation and classification
in suitable categories.
| | 9-3 | |
| SSR Mining Inc. | Çöpler Property S-K 1300 Report | February 12, 2024 SLR Project No.: 138.21581.00006 |
| 10.0 | Mineral Processing and Metallurgical Testing |
| 10.1 | Oxide Ore for Heap Leaching |
This subsection is modified from OreWin (2022).
Material referred to as “oxide” in these subsections is
defined as having a sulfur grade lower than 2%.
| 10.1.1 | Test Work – Çöpler Oxide |
Metallurgical test work for Çöpler oxide ore for heap leaching
commenced in September 2004. Much of this testing was carried out by independent laboratory, Resource Development Inc. (RDi) of Wheat
Ridge Colorado, USA, with oversight from Ausenco Pty Limited of Brisbane, Australia, and Pennstrom Consulting of Highlands Ranch, Colorado.
RDi is a metallurgical laboratory specializing in bench-scale testing and process flowsheet development. RDi makes no claims on their
website or in reports to ISO certification. Additional follow-up metallurgical test work was conducted by independent laboratories, AMMTEC
Limited (AMMTEC) of Perth, Australia, in 2009 and by McClelland Laboratories Inc. (McClelland) and supervised by Metallurgium between
2018 and 2019.
McClelland complies to the requirements of ISO/IEC 17025 for specific
tests as listed on their respective scope of accreditation documents.
Table 10-1 presents a list of the metallurgical and analytical laboratories
that contributed to the Project and their accreditation.
Table 10-1: Metallurgical and
Analytical Laboratories Contributing to the Project
| Laboratory |
Accreditation |
| SGS Ankara, Turkey |
ISO/IEC 17020 conformity assessment, accredited by TURKAK, the national accreditation body |
| ISO/IEC 17025 general requirements for the competence of testing and calibration laboratories, accredited by TURKAK |
| ISO 9001 Quality Management System Standard certified |
| SGS Perth, Australia |
Quality management and operational guidelines set out in ISO/IEC 17025 and ISO 9001 Quality Management Systems |
| ALS Metallurgy, Perth, Australia, formerly AMMTEC Ltd, Perth, Australia |
ISO/IEC 17025 and ISO 9001 Quality Management Systems |
| ALS Metallurgy - Kamloops, British Columbia Canada |
ISO/IEC 17025 and ISO 9001 Quality Management Systems |
| Kappes, Cassiday and Associates, and Florin Analytical Services, Reno Nevada USA |
No certifications listed on Website. |
| | 10-1 | |
| SSR Mining Inc. | Çöpler Property S-K 1300 Report | February 12, 2024 SLR Project No.: 138.21581.00006 |
| Laboratory |
Accreditation |
| McClelland Laboratories, Inc, Sparks, Nevada USA |
ISO/IEC 17025, ILAC-MRA, IAS International Accreditation Service. Nevada State Certified NV-00933 for MWMP & HC Testing Procedures and Wastewater Certification. |
| Resource Development Inc., Wheat Ridge Colorado, recently merged with Forte Analytical, Fort Collins, Colorado USA |
Quality Management ISO 17025 – Testing and Calibration Laboratories (In Progress) |
| Hazen Research, Inc., Golden, Colorado |
Hazen holds analytical certifications from state regulatory agencies and from the US Environmental Protection Agency (EPA). Certifications available for client inspection. |
The heap leaching facilities were commissioned at the Project in late-2010
and have operated continuously since that time. Operations are currently ongoing. A summary of the samples selected for the historical
test work is presented in Table 10-2.
Table 10-2: Summary of Çöpler
Samples Selected for Historical Test Work
| Lithology |
Sample Count |
Avg Gold Grade
(g/t) |
Gold Grade Range
(g/t) |
Avg Total Sulfur
(%) |
Total Sulfur Range |
| Diorite |
20 |
0.64 |
0.02 |
2.60 |
2.61% |
0.7% |
5.9% |
| Metasediment |
10 |
1.14 |
0.24 |
2.77 |
2.59% |
0.6% |
4.8% |
| Master Composites |
6 |
1.44 |
0.05 |
2.80 |
3.52% |
1.1% |
5.1% |
| Manganese |
2 |
6.44 |
5.07 |
7.80 |
6.03% |
1.4% |
10.6% |
| Gossan |
1 |
2.30 |
2.30 |
2.30 |
0.73% |
0.7% |
0.7% |
| Marble |
1 |
5.20 |
5.20 |
5.20 |
1.48% |
1.5% |
1.5% |
| Massive Py |
1 |
2.80 |
2.80 |
2.80 |
32.13% |
32.1% |
32.1% |
| 10.1.2 | Test Work – Çakmaktepe Oxide |
Metallurgical testwork on Çakmaktepe oxide ore for heap leaching
was undertaken at the on-site metallurgical laboratory, initially under the supervision of Kappes, Cassiday & Associates (KCA). The
initial testwork in 2015 undertook bottle roll and column leach tests. The results compare to the Çöpler oxide ore, with similar
behaviour and leach kinetics. Subsequently, Çakmaktepe oxide ore was heap leached together with Çöpler oxide ore.
| 10.1.3 | Test Work – Çakmaktepe Ext. Oxide |
| 10.1.3.1 | Previous Test Work |
Metallurgical test work on Çakmaktepe Ext. oxide for heap leaching
has been undertaken at McClelland and supervised by Metallurgium. An initial test work program, including bottle roll and column leach,
was carried out in 2019. This initial program identified two distinct domains with respect to gold recovery based on sulfide sulfur (SS)
content of <1% and between 1% to 2%. The column test results indicated that the listwanite, dolomite, and jasperoid lithologies have
physical properties amenable to heap leaching. The column tests were undertaken at a crush size of P80 of 12.5 mm.
| | 10-2 | |
| SSR Mining Inc. | Çöpler Property S-K 1300 Report | February 12, 2024 SLR Project No.: 138.21581.00006 |
Table 10-3: Summary of Çakmaktepe
Ext Oxide Samples Selected for 2019 Test Work
| Lithology |
Sample Count |
Avg Gold Grade
(g/t) |
Gold Grade Range
(g/t) |
| Cataclastite |
2 |
1.03 |
1.01 |
1.05 |
| Dolomite |
20 |
2.00 |
0.18 |
11.60 |
| Jasperoid |
17 |
3.78 |
0.76 |
15.40 |
| Listwanite |
32 |
1.52 |
0.42 |
4.38 |
| 10.1.3.2 | Çakmaktepe Ext. Historical Crushing Testwork |
Crushing test work on six Çakmaktepe Ext. composite samples was
performed as part of the 2019 McClelland test work program. The crusher work index (CWi) values ranged from 4.0 to 6.9 kWh/t, indicating
that the material was very soft. The jasperoid was the hardest material, with a CWi of 6.9 kWh/t. The abrasion index (Ai) values ranged
from 0.12 to 0.90. The jasperoid was the most abrasive (0.90, Very Abrasive), whereas all other lithology types ranged from 0.12 to 0.26
(Abrasive to Moderately Abrasive).
| 10.1.4 | Test Work – Bayramdere Oxide |
Metallurgical test work has been completed to characterize the Bayramdere
oxide mineralisation and determine its suitability for heap leaching. A total of 11 intermittent bottle roll leach (IBRL) tests were completed
on diamond drill core samples, for which the gold extraction ranged from 54% to 97% with an average cyanide consumption of 0.85 kg/t NaCN.
In the column test, final gold extraction was 84% in the two duplicate columns with reasonable leach kinetics.
| 10.1.5 | Heap Leach Gold Recovery |
The original gold recovery assumptions for Çöpler ores were
developed in 2008, based on the results of column leach and bottle roll testing performed by RDi between 2005 and 2008. These recovery
assumptions are reviewed and updated annually based on the following information:
| · | An analysis of the results of additional column leach and bottle roll tests performed on routine composite samples of heap leach feed
material conducted at the Çöpler project. |
| · | Use of a MS Excel-based heap leach production model that is calibrated against actual gold production data at the Çöpler
mine from start-up. This model has been audited periodically by Metallurgium. |
The current heap leaching gold recovery assumptions are summarized for
Çöpler oxide in Table 10-4, Çakmaktepe oxide in Table 10-5 (including Bayramdere), and Çakmaktepe Ext.
oxide in Table 10-6.
The recovery values listed in Table 10-4, Table 10-5, and Table
10-6 consider heap leaching of ore crushed to 80% passing 12.5 mm, agglomerated, and placed on a lined heap leach pad for treatment.
| | 10-3 | |
| SSR Mining Inc. | Çöpler Property S-K 1300 Report | February 12, 2024 SLR Project No.: 138.21581.00006 |
Table 10-4: Çöpler
Gold Recovery (%) Assumptions for Heap Leaching of Oxide
| Oxide Ore Type |
Çöpler Zone |
| Manganese |
Marble |
Main |
Main East |
Main West |
West |
| Diorite |
71.2 |
62.3 |
71.2 |
71.2 |
62.3 |
62.3 |
| Metasediment (Hornfels) |
66.8 |
66.8 |
66.8 |
66.8 |
66.8 |
66.8 |
| Limestone / Marble |
78.4 |
75.7 |
68.6 |
78.4 |
75.7 |
75.7 |
| Gossan |
71.2 |
65.1 |
71.2 |
71.2 |
65.1 |
65.1 |
| Manganese Diorite |
71.2 |
62.3 |
71.2 |
71.2 |
62.3 |
62.3 |
Table 10-5: Çakmaktepe
Gold Recovery (%) Assumptions for Heap Leaching of Oxide (incl. Bayramdere)
| Oxide Ore Type |
Çakmaktepe Zone |
| Central |
North |
East |
South-east |
Bayramdere |
| Limestone / Marble |
70.0 |
59.0 |
67.0 |
– |
75.0 |
| Metasediment (Hornfels) |
80.0 |
14.0 |
– |
– |
– |
| Gossan |
– |
59.0 |
67.0 |
75.0 |
75.0 |
| Jasperoid |
73.0 |
59.0 |
– |
– |
– |
| Diorite |
61.0 |
38.0 |
– |
– |
– |
| Ophiolite |
70.0 |
63.0 |
67.0 |
75.0 |
75.0 |
Table 10-6: Çakmaktepe
Ext. Gold Recovery (%) Assumptions for Heap Leaching of Oxide
| Ore Type |
Çakmaktepe Ext. Zone |
| Main |
East |
| Sulfur <1% |
| Jasperoid |
50.0 |
50.0 |
| Listwanite |
73.0 |
55.0 |
| Dolomite |
73.0 |
55.0 |
| Sulfur 1%–2% |
| Jasperoid |
40.0 |
40.0 |
| Listwanite |
58.0 |
45.0 |
| Dolomite |
58.0 |
45.0 |
| | 10-4 | |
| SSR Mining Inc. | Çöpler Property S-K 1300 Report | February 12, 2024 SLR Project No.: 138.21581.00006 |
| 10.2 | Oxide Ore for Grind / Leach |
| 10.2.1 | Metallurgical Testwork – Çakmaktepe Ext. Oxide |
Exploration of the Çakmaktepe Ext. deposit commenced in 2017.
Since then, two metallurgical test work programs have evaluated samples from Çakmaktepe Ext. Table 10-7 provides a summary
of the metallurgical test work completed to support processing of Çakmaktepe Ext. oxide ore.
Table 10-7: Çakmaktepe
Ext. Oxide - Grind Leach - Metallurgical Testwork Summary
| Year |
Laboratory |
Test Work Performed |
| 2018 |
McClelland Laboratories Inc. (Phase I)
Reviewed by Metallurgium |
Standard cyanide bottle roll tests at 75 µm of six Çakmaktepe
Ext. oxide composites as part of a wider program to evaluate Çakmaktepe Ext. oxide amenability to heap leach.
Tests were conducted both with and without activated carbon |
| 2019 |
McClelland Laboratories Inc. (Phase II and III)
Reviewed by Metallurgium |
Standard Bond abrasion tests for six Çakmaktepe Ext. oxide composites |
| 2020 |
McClelland Laboratories Inc. (Phase IV)
Partially completed.
No review |
Bond ball mill work index tests and abrasion tests for three Çakmaktepe
Ext. oxide composites.
Recovery sensitivity to grind size using standard cyanide bottle roll
tests on seven Çakmaktepe Ext. oxide composites, including tests at a k80 of 75 µm |
| 2023 |
ALS Kamloops
Supervised by Ausenco |
SMC®, Bond ball mill work index and abrasion index tests on 25 variability
oxide samples.
Cyanide leaching bottle roll tests at a k80 of 75 µm
of 16 listwanite, 11 dolomite, and one jasperoid samples.
Tests were conducted both with and without activated carbon |
ALS Kamloops operates a Quality Management System
which complies to the requirements of ISO 9001:2015 for provision of consultancy services to the mining industry including metallurgical,
mineralogical and assay testing services; and design and analysis of processing systems.
| 10.2.1.1 | McClelland Test Work |
Phase I – Leaching (2018)
In 2018/19, McClelland completed both standard and carbon-in-leach (CIL)
cyanide bottle roll tests at a P80 of 75 µm for six Çakmaktepe Ext. oxide lithology composite samples. Table
10-8 summarizes leaching test results.
Table 10-8: McClelland (2018)
– Çakmaktepe Ext. Oxide Leaching Test Work Results
| Lithology |
No. of Samples |
Min |
Max |
Avg. |
| Standard Cyanide Bottle Roll Test (75 µm) - Au Recovery (%) |
| Listwanite |
4 |
73.4 |
88.2 |
83.0 |
| Dolomite |
2 |
76.7 |
83.4 |
82.5 |
| | 10-5 | |
| SSR Mining Inc. | Çöpler Property S-K 1300 Report | February 12, 2024 SLR Project No.: 138.21581.00006 |
| Lithology |
No. of Samples |
Min |
Max |
Avg. |
| CIL Bottle Roll Test (75 µm) - Au Recovery (%) |
| Listwanite |
4 |
77.4 |
87.5 |
84.2 |
| Dolomite |
2 |
83.2 |
90.1 |
86.7 |
Phase II and III – Comminution
(2019)
Phase II and III of the 2019 McClelland test work included standard
Bond abrasion tests on twelve Çakmaktepe Ext. lithology composites, consisting of five dolomite, six listwanite, and a single jasperoid
sample. The average Ai for listwanite and dolomite was 0.15 g and 0.25 g, respectively, indicating moderate abrasiveness, while
the jasperoid sample was 0.91 g, indicating very high abrasiveness.
Phase IV – Comminution and Leaching (2020)
In 2020, McClelland Laboratories completed both Bond ball mill work
index and abrasion index testing on three Çakmaktepe Ext. oxide composite samples. The range of BWi was 14.7 to 19.6 kWh/t
and the Ai range was 0.12 to 0.69 g.
Grind and leach tests were conducted at P80- sizes between
50 and 150 µm; the oxide samples showed no sensitivity to grind size and recovery was flat through the size range tested. The range
of recoveries was 50 to 90%, with an average of 73%. Composites were not separated by lithology.
| 10.2.1.2 | ALS Kamloops Test Work |
Leaching (2023)
In 2023, ALS Kamloops, an independent laboratory completed a test work
program supervised by Ausenco to evaluate grind/leach processing of Çakmaktepe Ext. oxide ores. ALS Canada Ltd. Metallurgy Services
of Kamloops, BC, Canada, is a metallurgical laboratory specializing in bench- and pilot-scale flotation testing and various metallurgical
investigations. ALS Kamloops is an ISO 9001:2015 certified laboratory. Both standard and CIL bottle roll tests were completed at a grind
size P80 of 75 µm. Table 10-9 summarizes the Çakmaktepe Ext. oxide leaching results.
Testing on master composite samples indicated that gold recovery is
insensitive to grind size over a range from 53 µm to 212 µm. Further testing is on-going to determine optimum grind size
for the CIL circuit design, as well as isolating any deleterious lithologies or geochemistry.
Table 10-9: ALS Kamloops (2023)
– Çakmaktepe Ext. Oxide Leaching Testwork Results
| Lithology |
Variability Samples |
Master Composite Result |
| No. of samples |
Min |
Max |
Avg. |
| Standard Cyanide Bottle Roll Test (75 µm) - Au Recovery (%) 24 hours |
| Jasperoid |
1 |
N/A |
N/A |
69.1 |
N/A |
| Listwanite |
15 |
71.0 |
93.1 |
84.1 |
88.51 |
| Dolomite |
10 |
66.9 |
82.5 |
74.9 |
80.0 |
| | 10-6 | |
| SSR Mining Inc. | Çöpler Property S-K 1300 Report | February 12, 2024 SLR Project No.: 138.21581.00006 |
| Lithology |
Variability Samples |
Master Composite Result |
| No. of samples |
Min |
Max |
Avg. |
| CIL Cyanide Bottle Roll Test (75 µm) - Au Recovery (%) 24 hours |
| Jasperoid |
1 |
N/A |
N/A |
75.0 |
N/A |
| Listwanite |
6 |
67.9 |
88.0 |
80.1 |
85.9 |
| Dolomite |
9 |
75.7 |
88.1 |
82.7 |
80.7 |
Notes:
| 1. | While the Listwanite Master Composite sample gold recovery was 88.5%, the planning assumption is 90% recovery as the composite only
reached the median grade of the resource and historic work has shown a strong grade-recovery relationship. |
Comminution Test Work (2023)
Comminution test work was completed on 10 dolomite, 14 Listwanite, and
a single jasperoid oxide sample. Table 10-10 outlines the summary of results of the Çakmaktepe Ext. oxide comminution test
work.
Table 10-10: ALS Kamloops (2023)
– Çakmaktepe Ext. Oxide Comminution Results
| Comminution Parameter |
|
Dolomite |
Listwanite |
Jasperoid oxide |
| JK SAG mill hardness (Axb) |
25th percentile |
43.0 |
47.7 |
30.4 |
| Range |
31.0 – 103.2 |
36.1 – 96.9 |
- |
|
BWi (kWh/t)
Closing screen |
75th percentile |
13.9 |
17.5 |
17.1 |
| Range |
8.0 – 18.6 |
10.7 – 18.4 |
- |
| Ai (g) |
Average |
0.12 |
0.24 |
0.63 |
| Range |
0.02 – 0.50 |
0.06 – 0.60 |
- |
| 10.2.2 | Metallurgical Variability – Çakmaktepe Ext. Oxide |
Sample selection for the 2023 metallurgical test work program was developed
by Ausenco using a drill hole database and block model provided by SSR. Samples were selected to be representative of both lithological
and grade variability. Spatial coverage was assessed by visualising the samples in 3D using Cancha software. Sample selection also took
into consideration the preliminary mining sequence, with higher sample density in areas expected to be mined in the earlier years of the
grind/leach plant operation.
| 10.2.3 | Deleterious Elements – Çakmaktepe Ext. Oxide |
Mercury head grades in the Çakmaktepe Ext. test work samples
were in the range of 0.52 to 34.8 ppm.
Existing controls for mercury at Çöpler include monitoring
and capturing fumes from the electrowinning cells. Gold sludge recovered from electrowinning is heated and in a mercury retort for extraction
and recovery of mercury prior to smelting. Exhaust systems are installed over the furnace and in the gold room. New controls for Çakmaktepe
Ext. ore will include capture of off-gas from the new carbon regeneration kiln, which will then pass through a sulfur impregnated carbon
mercury scrubber.
| | 10-7 | |
| SSR Mining Inc. | Çöpler Property S-K 1300 Report | February 12, 2024 SLR Project No.: 138.21581.00006 |
| 10.2.4 | Grind / Leach Gold Recovery Estimates – Çakmaktepe Ext. Oxide |
Table 10-11 presents the gold recovery estimates for grind/leach
processing of Çakmaktepe Ext. oxide lithologies. Further test work is planned to understand metallurgical and mineralogical variability
across the deposit, gold recovery variability, and grind size to recovery insensitivity.
Table 10-11: Çakmaktepe
Ext. Gold Recovery Estimates for Grind/Leach of Oxide Ore
| Lithology |
Gold Recovery (%) |
| Jasperoid |
60 |
| Listwanite |
90 |
| Dolomite |
83 |
| 10.3 | Sulfide Ores – Flotation and Pressure Oxidation |
Sulfide material (i.e., material with >2% sulfur content) is not
suitable for treatment by the heap leaching process.
| 10.3.1 | Historical Test Work – Çöpler Sulfide |
This subsection is modified from OreWin (2022).
Historical testing was conducted on samples from the sulfide material
in several phases. RDi performed several sulfide processing scoping-level investigations from 2006–2009. A two-phase program on
sulfide samples was conducted at SGS laboratory in Ankara, Türkiye (SGS Ankara) in 2009 and 2010 to support a pre-feasibility study
(PFS) completed in 2011 (Samuel, 2011). A QEMSCAN (quantitative evaluation of minerals by scanning electron microscopy) mineralogy study
on three sulfide (and six oxide) samples was performed by AMMTEC in December 2008.
The historical work completed at both RDi and SGS Ankara concentrated
on evaluating sulfide processing options, including direct cyanidation, flotation, cyanidation of flotation concentrates, pressure oxidation
(POX) coupled with cyanidation, and roasting coupled with cyanidation. The evaluation of the historical data in the PFS resulted in the
selection of POX coupled with cyanidation as the process to further evaluate with testing and a FS.
Initial metallurgical test work carried out by RDi indicated that 11%
to 30% of the gold content in the Çöpler sulfide material may be amenable to whole-ore cyanidation, as demonstrated by diagnostic
leaching. Between 60% to 80% of the gold content was found to be associated with sulfide minerals and would require some type of oxidation
step to liberate the gold for cyanidation.
The RDi scoping studies indicated that pre-treatment using POX was the
most effective treatment and displayed the potential to achieve greater than 90% gold extractions. Flotation tests indicated that gold
could be recovered by flotation, but the concentrates were low-grade with relatively high mass pulls and low gold recovery. Test work
indicated that flotation concentrate and tailings did not leach well using cyanide, even after being finely ground.
| 10.3.2 | Historical Test Work – Çakmaktepe Ext. Sulfide |
A metallurgical testing program was competed by McClelland and supervised
by Metallurgium between 2018 and 2020. In 2023, ALS Kamloops completed a test work program supervised by Ausenco. The two programs combined
provide comminution parameters for Çakmaktepe Ext. sulfide and preliminary results for mineralogy, direct cyanidation, and rougher
flotation with flotation tailings leaching.
| | 10-8 | |
| SSR Mining Inc. | Çöpler Property S-K 1300 Report | February 12, 2024 SLR Project No.: 138.21581.00006 |
| 10.3.3 | Mineralogy – Çöpler Sulfide |
This subsection is extracted from OreWin (2022).
In December 2008, Anagold commissioned AMMTEC to complete a QEMSCAN
precious metals search (PMS), trace mineral search (TMS), and energy dispersive spectra signal (EDS) mineralogy analyses performed on
three sulfide mineralisation samples. Analyses were performed on samples of diorite, metasediment, and massive pyrite rock types.
The findings from the 2008 QEMSCAN analyses indicated that the gangue
mineralisation in the sulfide mineralisation is composed mainly of quartz, micas / clays, and feldspars, (displaying relative abundances
of approximately 31%, 27%, and 21%, respectively). The sulfide mineralisation consists of pyrite, arsenopyrite, chalcopyrite, and sphalerite.
A gold deportment study was performed by AMTEL Ltd. (AMTEL) on samples
of MC4 composite after flotation separation. Although flotation was not part of the flow sheet, it is a useful method of concentrating
the sulfides (the main gold carriers) to improve analysis statistics. The Advanced
Mineral Technology Laboratory (AMTEL) of London, ON, Canada, is an independent analytical laboratory specializing in mineralogical services
to produce detailed gold deportment analysis. AMTEL makes no claims on their website or in reports to ISO certification. The combined
concentrate represented 18.5% of the feed mass and assayed 9.8 g/t Au and 23% SS. Recoveries of gold and sulfur to concentrate were
72.7% and 90% respectively. Flotation tailings assayed 0.68 g/t Au and 0.48% SS.
The detailed mineralogical analysis confirms that the gold is primarily
carried by sulfide minerals. In the calculated head, 83% of all gold is in sulfides (free or locked) and only 2.4% was held in rock. The
remainder of the gold (14%) was present as free gold, and this correlates well with a direct cyanidation recovery of only 17% when the
ore was ground to a P80 of 90 µm.
Of the gold that is in sulfides, the majority (78%) is in sub-microscopic
form. This confirms the refractory nature of the ore and explains why oxidation of the sulfides is necessary to make the gold available
for leaching. Arsenopyrite was the sulfide mineral found to have the highest contained gold, averaging 123 g/t Au by one measure
and 182 g/t Au by a second. Gold in pyrite was more than an order of magnitude lower than arsenopyrite and averaged 7.0 g/t
Au. Marcasite, a mineral chemically similar to pyrite, carried an average of 17.8 g/t Au. Of the gold contained in sulfides, 50%
was found to be in arsenopyrite, 25% in pyrite, and 20% in marcasite.
In summary, the AMTEL gold deportment study is consistent with previous
mineralogy studies and confirms that a large portion of the gold is present as sub-microscopic particles, primarily in sulfides, largely
arsenopyrite. The study also concluded that whole-ore oxidation would be required as a pre-treatment to cyanidation to liberate the majority
of the gold contained in the sulfide materials. The gold deportment summary can be found in Table 10-12, below.
Table 10-12: Gold Deportment
in Flotation Separated Streams
| Form and Carrier of Gold |
Concentrate
(g/t) |
Tails
(g/t) |
| Assayed Grade |
10.187 ± 0.167 |
0.837 ± 0.028 |
| Free / Liberated Gold Grains |
| >40 µm |
0.106 |
0.004 * |
| 5–4 µm |
0.346 |
0.003 |
| <5 µm |
0.871 |
0.146 |
| | 10-9 | |
| SSR Mining Inc. | Çöpler Property S-K 1300 Report | February 12, 2024 SLR Project No.: 138.21581.00006 |
| Form and Carrier of Gold |
Concentrate
(g/t) |
Tails
(g/t) |
| Exposed Associated Gold Grains |
| Free Sulfides +5 µm |
0.350 |
0.018 |
| –5 µm |
– |
– |
| Rock-Sulfide Composites |
0.125 |
0.052 |
| Rock Particles |
0.021 |
0.035 |
| Enclosed Associated Gold Grains |
| Free Sulfides +5 µm |
0.977 |
0.007 |
| –5 µm |
0.292 |
0.029 |
| Rock-Sulfide Composites |
0.338 |
0.023 |
| Rock Particles |
0.014 |
0.031 |
| Sub-microscopic Gold |
| Free Sulfides +5 µm |
4.156 |
0.020 |
| –5 µm |
1.244 |
0.157 |
| Associated Sulfides |
1.605 |
0.304 |
| Total (mineralogically counted) |
10.444(102.5%) |
0.829(99.0%) |
* From a very small number of grains (1 free grain, from ~2 kg of material)
| 10.3.4 | Mineralogy – Çakmaktepe Ext. Sulfide |
In 2023, ALS Kamloops completed
a mineralogical assessment of a master composite jasperoid sample by Particle Mineral Analysis (PMA) QEMSCAN protocols. The results indicated
that gangue mineralogy consisted of mainly of quartz and carbonates displaying relative abundances of 72.2% and 10.1% respectively. Sulfide
mineralisation consists of pyrite (83% of sulfur), sulfate minerals including barite, jarosite, and calcium sulfate (15% of sulfur), and
other minor sulfides including arsenopyrite and chalcopyrite. Arsenic was primarily in arsenopyrite and other arsenic sulfides (77%) with
remaining arsenic in goethite/limonite and arsenate (23%). Copper grade in the sample was low (0.01%).
Size-by-size analysis indicated
that gold concentrated in the finer sizes (<12 µm) and appeared to be directly related with arsenic and iron elemental assays.
This was noted in the preliminary flotation tests, where gold recovery followed arsenic recovery.
| 10.3.5 | Direct Cyanidation – Çöpler Sulfide |
This subsection is extracted from OreWin (2022).
Hazen performed direct cyanidation carbon-in-leach (CIL) tests at various
grind sizes with no pre-treatment on the individual sulfide rock type composites to establish baseline gold extractions. The goal of these
tests was to examine gold extraction variability with grind size. These samples were subsequently used to prepare feed composites used
in the Hazen pilot plant program.
The test work demonstrated that the bulk of the Çöpler sulfide
samples are refractory to direct cyanidation, and that extractions do not improve significantly with finer grinding.
| | 10-10 | |
| SSR Mining Inc. | Çöpler Property S-K 1300 Report | February 12, 2024 SLR Project No.: 138.21581.00006 |
| 10.3.6 | Direct Cyanidation – Çakmaktepe Ext. Sulfide |
In 2019, as part of the McClelland broader heap leaching focused program,
cyanide bottle roll testing with a target P80 of 12.5 mm was completed on seven Çakmaktepe Ext. sulfide (>2% sulfur)
composites. The reported gold recovery ranged from 16%–62% (average of 29%). This showed a relatively poor response of the sulfide
jasperoid material to direct cyanidation. Finer grind sizes were not investigated in the McClelland program.
In 2023, ALS Kamloops completed direct cyanidation testing by standard
cyanide bottle roll tests of four variability samples and a jasperoid sulfide master composite. The leach feed grind size target was a
P80 of 75 µm. Gold recovery ranged from 22.5%–69.7% (with an average of 47.0%). The jasperoid composite gold
recovery was 43.7%, suggesting refractory characteristics.
| 10.3.7 | Flotation Test Work – Çöpler Sulfide |
This subsection is modified from OreWin (2022).
Flotation test work has been undertaken on Çöpler sulfide
samples since before 2006 with a series of test work programs and studies undertaken by RDi, FLSmidth, and the on-site metallurgical laboratory.
Initially, the test work was focused on development of a viable flowsheet
to recover gold to enable subsequent recovery as doré. This work was unsuccessful due to a generally poor flotation response, resulting
in the adoption of the current POX and CIP gold recovery flowsheet.
In 2019, flotation was again considered for incorporation into the POX / CIP
circuit to improve both sulfur and gold recovery and enable the POX circuit to operate at optimum conditions.
Test work was conducted on fresh material from the existing sulfide
circuit. A total of 20 tests were conducted as part of this program.
The key variables considered in determining throughput for flotation
are sulfide sulfur (SS) flotation recovery and flotation mass pull. Gold recovery to concentrate and gold recovery of the flotation tails
are also determined. Of the 20 tests undertaken, a total of eight flotation test work tests are considered representative due to their
relative commonality of flotation conditions, and the SS feed grade is within the range that the flotation plant is expected to operate.
The results ranged from 65% to 81% SS recovery and 43% to 55% Au recovery to concentrate.
The mass pull for sulfide flotation is typically related to SS grade.
Figure 10-1 shows the relationship of mass pull to SS feed grade.
| | 10-11 | |
| SSR Mining Inc. | Çöpler Property S-K 1300 Report | February 12, 2024 SLR Project No.: 138.21581.00006 |
Figure 10-1: Feed SS% –
Mass Pull Relationship
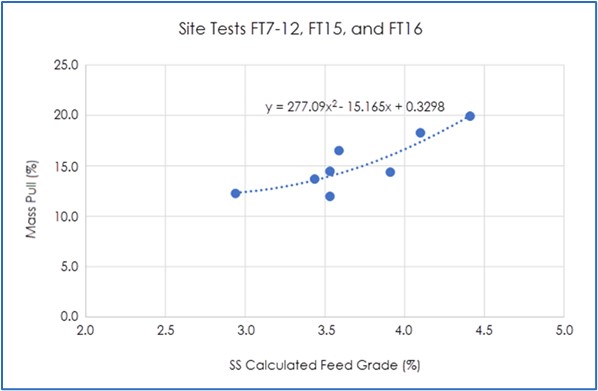
Source: Anagold, 2020
Notes: Float Concentrate Mass Pull = 277.09 x (Feed SS%)2
– 15.165 x (Feed SS%) + 0.3298
| 10.3.8 | Flotation Test Work – Çakmaktepe Ext. Sulfide |
| 10.3.8.1 | McClelland Test Work (2019) |
This subsection is modified from OreWin (2022).
Metallurgical test work on Çakmaktepe Ext. sulfide was undertaken
by McClelland in 2019. Six jasperoid composites were tested by rougher flotation with agitated cyanidation of the flotation tailings.
Gold recovery to the flotation bulk sulfide rougher concentrate ranged from 40.3% to 55.0%, with an average of 46.5%. Gold extracted by
cyanide leaching of the flotation tailings ranged from 24.9% to 39.9% (average of 34.1%) of gold contained in the samples. The combined
gold recovery of the flotation concentrates and tailings cyanidation processes ranged from 72.7% to 87.1% (with an average of 80.6%) and
do not include gold losses from subsequent processing of the flotation concentrate.
Two cataclastite samples were found to be of very refractory nature,
with flotation gold recoveries of 68.5% and 73.7% (71.1% average) and low gold leaching recoveries of 2.9% and 6%, respectively.
| 10.3.8.2 | ALS Kamloops Test Work (2023) |
The 2023 ALS Kamloops test work program included flotation test work
on a jasperoid sulfide master composite and 15 variability samples.
The test work on the jasperoid master composite explored conditions
of feed density, grind size, and collector dosage. Gold recovery to the flotation bulk sulfide rougher concentrate was 66.9%, and gold
extracted by cyanide leaching of the flotation tailings was 20.0% of gold contained in the sample. The combined flotation concentrate
and tailings leaching recovery was 86.9% at a grind size P80 of 75 µm. The ore required relatively very high collector additions
(1 kg/t) to improve flotation kinetics.
| | 10-12 | |
| SSR Mining Inc. | Çöpler Property S-K 1300 Report | February 12, 2024 SLR Project No.: 138.21581.00006 |
Test work on the 15 variability samples was in progress at the time
the report was written.
| 10.3.9 | Test Work – Comminution – Çöpler Sulfide |
This subsection is extracted from OreWin (2022).
The comminution properties for the three major
ore domains (metasediment, diorite, and manganese diorite) have been measured during all test work stages. Rock competence drives semi-autogenous
grind (SAG) mill selection, Bond ball mill work index (BWi) drives ball mill selection, and Ai is used to estimate media and mill liner
consumption rates. The major domains exhibit moderate comminution characteristics.
| 10.3.10 | Test Work – Comminution – Çakmaktepe Ext. Sulfide |
Comminution test work was completed on 14 variability
jasperoid sulfide samples by ALS Kamloops in 2023. Table 10-13 summarizes the results of the Çakmaktepe Ext. sulfide comminution
testwork. Çakmaktepe Ext. sulfide is significantly harder and more abrasive than Çöpler sulfide ores and is not amenable
for feeding to the existing Sulfide plant primary sizer.
Table 10-13: ALS Kamloops (2023)
– Çakmaktepe Ext. Sulfide Comminution Results
| Comminution Parameter |
|
Jasperoid sulfide |
| JK SAG mill hardness (Axb) |
25th percentile |
30.2 |
| Range |
28.0 – 45.8 |
|
BWi (kWh/t)
Closing screen size of 106 µm |
75th percentile |
19.3 |
| Range |
14.2 – 20.3 |
| Ai (g) |
Average |
0.55 |
| Range |
0.09 – 0.88 |
This subsection is modified from OreWin (2022).
Three continuous pilot plant programs have been
conducted for the POX sulfide plant: the first two programs at Hazen Research, Inc. (Hazen) comprising a total of four test campaigns,
and the third program at SGS Lakefield Oretest, Perth, Australia (SGS Perth). Three campaigns were completed during the first pilot plant
program, with the first campaign commencing in February 2012. The second pilot program, incorporating one campaign, was conducted in December
2012. The third pilot program, conducted in August 2015, included a single campaign that tested multiple lithologies at high and low-acidulation
extents.
The pilot plant facility for the first pilot program
included the following continuous circuits: acidulation, POX autoclave, hot cure (HC), primary neutralisation (PN), six-stage counter
current decantation (CCD), and mixed sulfide precipitation (MSP). Ore preparation (grinding), cyanidation, activated carbon gold recovery,
cyanide destruction, tailings neutralisation, and final tailings production were all completed on a batch basis.
In 2015, Anagold performed confirmatory pilot testing
on a range of ore-types and composite blends treated at ‘high’ and ‘low’ acidulation conditions. This program
comprised a single pilot plant campaign, Campaign 5, which was conducted at SGS Perth during August and September. Apart from testing
the impact of acidulation chemistry, one of the key purposes of the campaign was to produce samples for repeat thickener vendor testing.
This was prompted by the inconsistent vendor data generated during Campaigns 1–4.
| | 10-13 | |
| SSR Mining Inc. | Çöpler Property S-K 1300 Report | February 12, 2024 SLR Project No.: 138.21581.00006 |
| 10.3.12 | Test Work – Overall Circuit Performance |
This subsection is extracted from OreWin (2022).
The recovery of gold across a laboratory carbon-in-pulp
(CIP) circuit was measured for a number of variability samples representing each of the three major ore types.
In addition to the test work, the commercial sulfide
POX plant commenced commissioning in December 2018, with actual results reviewed to validate the recovery.
| 10.3.12.1 | POX Gold Recovery |
The gold recovery results of the acceptable tests
are plotted in Figure 10-2, Figure 10-3, and Figure 10-4, together with an appropriate recovery model curve in each instance.
Figure 10-2: Metasediment Gold
Recovery Results and Model
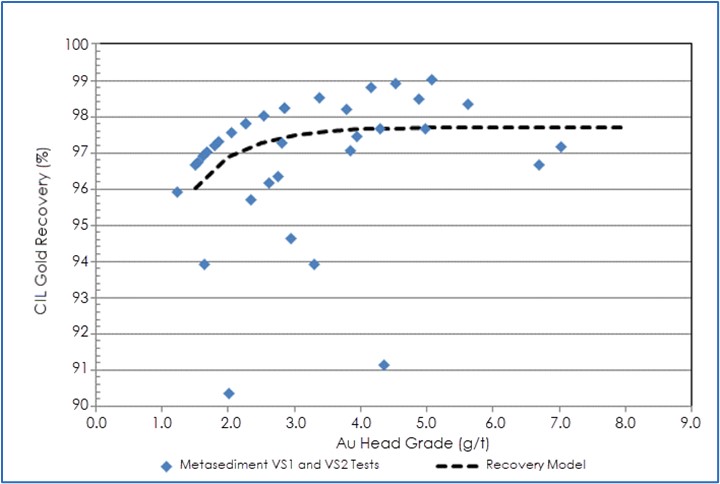
Source: Anagold, 2016
The results are plotted in terms of feed grade
so that predictions of recovery during operations can be made by knowing the feed grade.
| | 10-14 | |
| SSR Mining Inc. | Çöpler Property S-K 1300 Report | February 12, 2024 SLR Project No.: 138.21581.00006 |
Figure 10-3: Diorite Gold Recovery
and Model
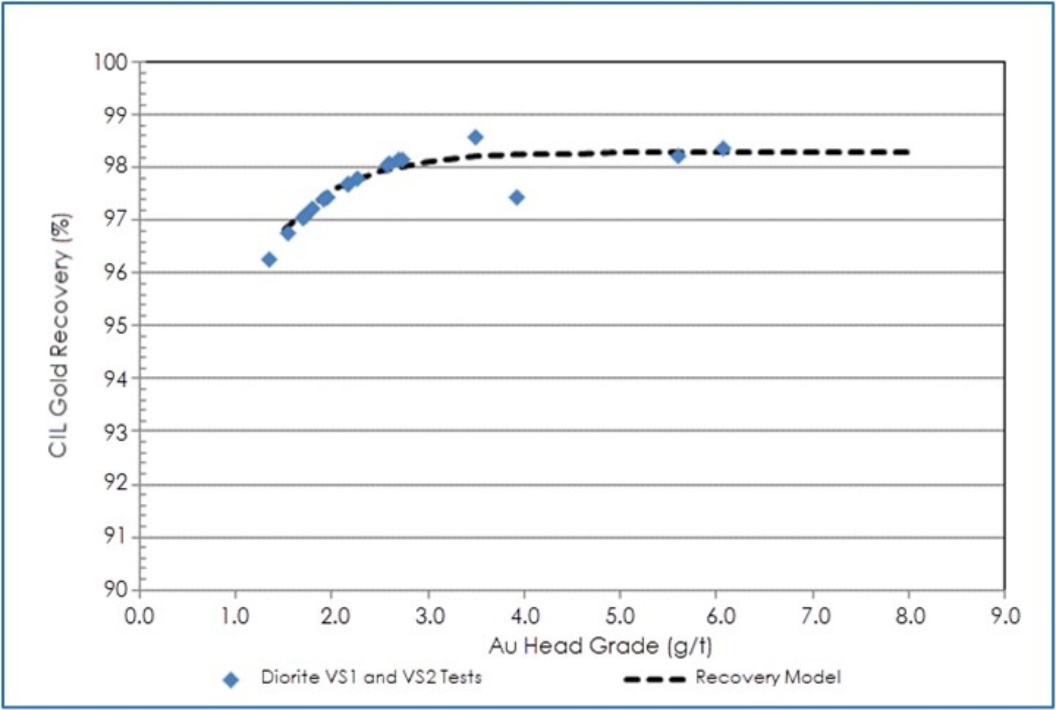
Source: Anagold, 2016
Note that Figure 10-2 and Figure 10-3 show
a number of results that tend to form a regular curve at the top of the datasets. In each instance when the results are on this curve,
the solid tails Au grade was below the limit of detection and an assigned tails grade equal to half the limit of detection was set for
calculation purposes.
Figure 10-4: Manganese Diorite
Gold Recovery and Model
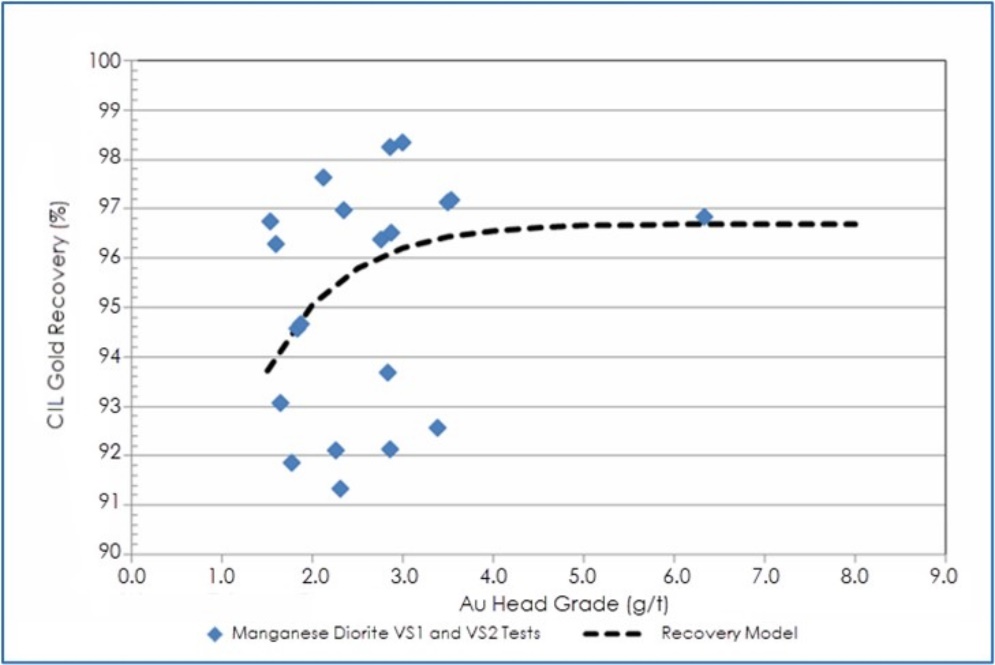
Source: Anagold, 2016
| | 10-15 | |
| SSR Mining Inc. | Çöpler Property S-K 1300 Report | February 12, 2024 SLR Project No.: 138.21581.00006 |
The recovery model is represented by the equation:

Parameter ‘a’ is the only one of the
four that has a direct process meaning, representing the maximum recovery the equation can generate. The parameter ‘d’ represents
circuit losses in a commercial operation.
The parameters used to generate the curves in Figure
10-2, Figure 10-3, and Figure 10-4 are shown in Table 10-14, and include an allowance for operational losses of 1%.
Table 10-14: Gold POX Recovery
Model Parameters
| Material Type |
a |
b |
c |
d |
| Metasediment |
97.7 |
1.4 |
–1.4 |
–1.0 |
| Diorite |
98.3 |
1.4 |
–1.5 |
–1.0 |
| Manganese Diorite |
96.7 |
1.2 |
–1.4 |
–1.0 |
The POX commissioning and ramp-up allowances in Table 10-15 have
been made on top of the base recoveries.
Table 10-15: Commissioning and
Ramp-up Allowances
| Recovery Corrections |
Gold Recovery Deduction
(%) |
| Commissioning to June 2019 |
–3.30 |
| Ramp-up July 2019 to June 2020 |
–2.30 |
| Flotation Commissioning |
–0.75 |
10.3.12.2
POX Silver Recovery
The silver recovery pattern is much less clear
than gold because silver is not released by the oxidation process. Silver recovery is determined from actual plant recovery over the period
January 2019 through February 2020. The silver recovery calculates to 3.0%.
10.3.12.3
Flotation Gold Recovery
From the test work, it is estimated that the flotation
concentrate reporting to the POX circuit will achieve the same overall recovery as the ore directly reporting to POX. Gold recovery to
the flotation concentrate is estimated to be 55%.
The flotation tails reporting directly to the leach
circuit are estimated to have a gold recovery of 43%, based on test work using samples collected while processing large amounts of formerly
stockpiled ore. When processing freshly mined sulfide ore, flotation tails recoveries can vary between 10% and 30% in CIP.
An allowance of 0.75% reduced gold recovery during
commissioning and ramp-up of the flotation circuit (Year 1 of flotation operation) has been included.
| | 10-16 | |
| SSR Mining Inc. | Çöpler Property S-K 1300 Report | February 12, 2024 SLR Project No.: 138.21581.00006 |
| 10.4 | Mineral Processing and Metallurgical Discussion |
| 10.4.1 | Grind / Leach Processing – Çakmaktepe Ext. Oxides |
Since exploration of Çakmaktepe Ext. commenced
in 2017, two test work programs have investigated leaching of Çakmaktepe Ext. oxide ores.
Sufficient comminution testwork exists to support
the design criteria for the grind/leach process plant. Test work indicates that Çakmaktepe Ext. oxide ores are amenable to cyanide
leaching. Gold recovery is variable by lithology. There is significant variability within each lithology which is currently not well understood.
Recovery estimates are based on a grind size of
75 µm and a leach time of 24 hours. The test work indicates that gold recovery is insensitive to grind size between 53
and 212 µm.
Further test work is planned to understand metallurgical
and mineralogical variability across the deposit, gold recovery variability, grind size to recovery insensitivity, and CIL benefits.
| 10.4.2 | Flotation and POX Processing – Çöpler Sulfides |
This subsection is modified from OreWin (2022).
A large amount of POX test work has been performed
on Çöpler sulfide ore across several pilot plant campaigns. The processes used have been shown to be robust, as demonstrated
through operational performance during commissioning, ramp-up, and operations.
The addition of a flotation circuit to the sulfide
plant provides stability and flexibility to the POX circuit operation to maximize throughput and oxygen utilization by maintaining optimum
sulfur grade to the autoclaves.
Ongoing test work and analysis is also recommended
on POX oxidation and leach recovery to improve and optimize circuit performance. This should include detailed assessment of gold deportment
in final tailings.
| 10.4.3 | Flotation and POX Processing - Çakmaktepe Ext. Sulfides |
Comminution test work indicates that Çakmaktepe
Ext. sulfide ore (jasperoid) is significantly harder and more abrasive than Çöpler sulfide ores and is not amenable for feeding
to the existing Sulfide plant primary sizer. No test work has been completed for direct POX processing of Çakmaktepe Ext. sulfide
ores or flotation concentrates.
Further metallurgical testing of Çakmaktepe
Ext. material types, both oxide and sulfide, is recommended to optimize the feeds to POX and slip stream flotation circuit. Further mineralogical
work is recommended to understand the main gold associations.
In the opinion of the QP, the data, including metallurgical test
work and operating experience with the various ores within the deposit, are adequate for the purposes used in this Technical Report and
the analytical procedures used in the analyses are of conventional industry practice. The test work focuses on new ore types and
mineralization being encountered as a result of ongoing exploration and expansion. Much more work will be performed in future to
characterize the new materials and to determine the affects of the variable ores on the existing operating plants.
The main deletrious elements in the Copler ores are arsenic and
mercury. The arsenic is encountered in the sulfide plant from arsenopyrite, which is oxidized in the autoclaves. The arsenic is
oxidized and reacted with ferric iron in the autoclave to form insoluble ferric arsenate which is further reacted and precipitated
in the subsequent Fe/As precipitation circuit of the sulfide plant. Mercury is encountered in the cyanide leaching circuits and is
recovered in the electrowinning and refining areas as described in Section 13.2.3. The QP considers these methods of mitigation to
be consistent with best industry practices.
| | 10-17 | |
| SSR Mining Inc. | Çöpler Property S-K 1300 Report | February 12, 2024 SLR Project No.: 138.21581.00006 |
| 11.0 | Mineral Resource Estimates |
Mineral Resources have been classified in accordance with the U.S. Securities
and Exchange Commission (US SEC) Regulation S-K subpart 1300 rules for Property Disclosures for Mining Registrants (S-K 1300) and were
estimated by RSC. Mineral Resources are presented on a project basis and have an effective date of October 31, 2023.
The RSC QP has prepared the Mineral Resource estimates derived from
drilling on the properties that are subject of this report. SLR has reviewed, audited, and accepted the Mineral Resource estimate prepared
by RSC which are based on block model values developed from reported drilling results and assays on the mineralized properties.
The Mineral Resource estimates were completed and validated using a
combination of various software tools, including Seequent’s Leapfrog Geo (Leapfrog Geo), Datamine Studio and Supervisor software. Estimates
were validated using standard industry techniques including statistical comparisons with composite samples and nearest neighbor (NN) estimates,
swath plots, and visual reviews in cross-section and plan. A visual review comparing blocks to drill holes was completed after the block
modeling work was performed to ensure general lithologic and analytical conformance and was peer reviewed prior to finalization.
Mineral Resources are not Mineral Reserves and do not have demonstrated
economic viability, nor is there certainty that all or any part of the Mineral Resource estimated here will be converted to Mineral Reserves
through further study. Sources of uncertainty that may affect the reporting of Mineral Resources include sampling or drilling methods,
data processing and handling, geologic modelling, and estimation.
Mineral Resources are reported exclusive of Mineral Reserves and have
been summarized by project, Mineral Resource classification, and oxidation state in Table 11-1 which also summarises the cut-off values,
metallurgical recoveries, and SSR ownership percentage associated with the Mineral Resources.
In the opinion of the RSC QP,
the resource evaluation reported herein is an appropriate representation of the gold, silver and copper Mineral Resources found at the
Ҫӧpler Project at the current level of sampling. The RSC QP is of the opinion that with consideration of the recommendations
summarized in Sections 1 and 23 of this TRS, any issues relating to all relevant technical and economic factors likely to influence the
prospect of economic extraction can be resolved with further work.
| | 11-1 | |
| SSR Mining Inc. | Çöpler Property S-K 1300 Report | February 12, 2024 SLR Project No.: 138.21581.00006 |
Table 11-1: Summary of Çöpler
Mine, Greater Çakmaktepe and Bayramdere Mineral Resources (SSR’s Attributable Only)
| Deposit |
Measured Mineral Resources |
Indicated Mineral Resources |
Measured + Indicated Mineral Resources |
Inferred Mineral Resources |
NSR Cut-off Values |
| Amount |
Grade |
Rec |
Amount |
Grade |
Rec |
Amount |
Grade |
Rec |
Amount |
Grade |
Rec |
| Gold |
(Mt) |
(g/t Au) |
(%) |
(Mt) |
(g/t Au) |
(%) |
(Mt) |
(g/t Au) |
(%) |
(Mt) |
(g/t Au) |
(%) |
($/t) |
| Ҫӧpler Mine |
5.0 |
1.31 |
40 - 91 |
11.1 |
1.29 |
40 - 91 |
16.2 |
1.29 |
40 - 91 |
14.0 |
1.53 |
40 - 91 |
18.34 - 39.87 |
| Greater Çakmaktepe |
3.6 |
0.94 |
40 - 91 |
7.3 |
1.10 |
40 - 91 |
10.9 |
1.05 |
40 - 91 |
4.8 |
1.87 |
40 - 91 |
18.34 - 44.37 |
| Bayramdere |
- |
- |
- |
0.1 |
2.36 |
75 |
0.1 |
2.36 |
75 |
- |
- |
- |
18.34 |
| Total Gold |
8.6 |
1.15 |
40 - 91 |
18.6 |
1.22 |
40 - 91 |
27.2 |
1.20 |
40 - 91 |
18.9 |
1.61 |
40 - 91 |
18.34 - 44.37 |
| Silver |
(Mt) |
(g/t Ag) |
(%) |
(Mt) |
(g/t Ag) |
(%) |
(Mt) |
(g/t Ag) |
(%) |
(Mt) |
(g/t Ag) |
(%) |
($/t) |
| Ҫӧpler Mine |
5.0 |
3.33 |
0 - 38 |
11.1 |
3.38 |
0 - 38 |
16.2 |
3.36 |
0 - 38 |
14.0 |
4.92 |
0 - 38 |
18.34 - 39.87 |
| Greater Çakmaktepe |
3.6 |
3.75 |
0 - 20 |
7.3 |
2.56 |
0 - 20 |
10.9 |
2.95 |
0 - 20 |
4.8 |
2.26 |
0 - 20 |
18.34 - 44.37 |
| Bayramdere |
- |
- |
- |
0.1 |
25.55 |
0 - 54 |
0.1 |
25.55 |
0 - 54 |
- |
- |
- |
18.34 |
| Total Silver |
8.6 |
3.51 |
0 - 54 |
18.6 |
3.20 |
0 - 54 |
27.2 |
3.29 |
0 - 54 |
18.9 |
4.24 |
0 - 54 |
18.34 - 44.37 |
| Copper |
(Mt) |
(% Cu) |
(%) |
(Mt) |
(% Cu) |
(%) |
(Mt) |
(% Cu) |
(%) |
(Mt) |
(% Cu) |
(%) |
($/t) |
| Ҫӧpler Mine |
5.0 |
0.08 |
0 - 15 |
11.1 |
0.07 |
0 - 15 |
16.2 |
0.07 |
0 - 15 |
14.0 |
0.07 |
0 - 15 |
18.34 - 39.87 |
| Greater Çakmaktepe |
3.6 |
0.03 |
0 |
7.3 |
0.02 |
0 |
10.9 |
0.02 |
0 |
4.8 |
0.02 |
0 |
18.34 - 44.37 |
| Bayramdere |
- |
- |
- |
0.1 |
0.00 |
1 |
0.1 |
0.00 |
1 |
- |
- |
- |
18.34 |
| Total Copper |
8.6 |
0.06 |
0 - 15 |
18.6 |
0.05 |
0 - 15 |
27.2 |
0.05 |
0 - 15 |
18.9 |
0.06 |
0 - 15 |
18.34 - 44.37 |
Notes:
| 1. | The definitions for Mineral Resources in S-K 1300 were followed. |
| 2. | Mineral Resources are reported based on October 31, 2023 topography surface. |
| 3. | Mineral Resources are reported exclusive of Mineral Reserves. |
| 4. | The numbers reflect SSR attributed share of 80%. |
| 5. | Heap Leach Oxide is defined as material <2% total sulfur. |
| 6. | Grind Leach Oxide is defined as material <2% total sulfur. Processing route will be available approximately in 2027. |
| 7. | Sulfide is defined as material ≥2% total sulfur. |
| 8. | Heap leach oxide uses a NSR cut-off $18.34/t, grind leach oxide uses a NSR cut-off value $19.26/t, and Çöpler sulfide
ore uses a cut-off grade of $39.87/t, Greater Çakmaktepe sulfide ore uses a cut-off grade of $44.37/t . All cut-off values include
allowances for royalty payable. |
| | 11-2 | |
| SSR Mining Inc. | Çöpler Property S-K 1300 Report | February 12, 2024 SLR Project No.: 138.21581.00006 |
| 9. | Metallurgical gold recovery for heap leach oxide and grind leach varies between 40-78% and 53-90%, respectively, based on lithology;
metallurgical recovery for sulfide varies between 81% and 91% based on lithology. |
| 10. | Metallurgical silver recoveries for heap leach and grind leach oxide varies between 0 and 54% based on lithology. Metallurgical recovery
for sulfide varies between 0 and 3%. |
| 11. | Metallurgical copper recoveries for heap leach and grind leach oxide varies between 0 and 15% based on lithology. Metallurgical recovery
for sulfide is 0%. |
| 12. | Metal prices used to report the Mineral Resources are $1,750/oz Au, $22.00/oz Ag, and $3.95/lb Cu with allowances for payability,
deductions, transport, and royalties. |
| 13. | The point of reference for Mineral Resources is the point of feed into the processing facility for grind leach and sulfide material;
or for Heap Leach oxide, it is the Carbon columns. |
| 14. | All Mineral Resources estimates were constrained within conceptual pit shells to meet reasonable prospects for economic extraction
criteria. |
| 15. | Mineral Resources that are not Mineral Reserves do not have demonstrated economic viability. |
| 16. | Totals may vary due to rounding. |
| | 11-3 | |
| SSR Mining Inc. | Çöpler Property S-K 1300 Report | February 12, 2024 SLR Project No.: 138.21581.00006 |
The digital drill hole data used in the Mineral Resource Estimate (MRE)
are from the various drilling campaigns that have taken place at the deposits since 2000. A list of 330 drill holes that were to be excluded
was provided by SSR to RSC, and following a review of these holes, these holes were removed from any estimation work. These holes were
drilled for the purposes of geotechnical, hydrogeological monitoring and metallurgical studies. Additionally, holes drilled for grade
control purposes on stockpiles were also removed. All data were then further validated and reviewed, where possible, and other than some
minor data adjustments and corrections, no additional data were excluded from the estimation process. A summary of the informing drill
hole data is presented in Table 11-2.
All numerical data were transferred to implicit modeling software as
csv files. Below-detection values were replaced by two-thirds of the detection limit after they had been imported into the implicit modeling
software; the original entries for these samples were retained in the Access database.
Both pre-mining surface and post-mining digital terrain models (DTM)
surfaces were loaded in the 3D modeling workspace. All modeling was clipped against the pre-mining surface, with the post-mining surface
used to reconcile estimates against production data.
Grade control data were loaded from a point database provided by the
mining department. A bias correction was applied to the grade-control data for Au grades less than 1 ppm. As noted in section 8.3.4.1
the positive bias identified in the RC drill data was taken into account when classifying the Mineral Resource.
Table 11-2: Summary of Drill
Hole Data Informing Çöpler MRE
| Drill Type |
No. of Holes |
Total Drill Metres |
| DD |
1,284 |
268,054.90 |
| RC |
1,325 |
132,535.75 |
| Total |
2,609 |
400,590.65 |
| 11.2.2 | Geological Interpretation |
| 11.2.2.1 | Primary Lithologies & Rationale |
The primary rock types modeled at Çöpler are carbonates
(limestone and marble of Munzur Formation), siliciclastic/volcaniclastic sediments (hornfels of Keban Formation) and intrusives (diorite
porphyries of Çöpler-Kabataş magmatic complex).
At Çöpler, the Munzur carbonate rocks overlie the Keban
sediments and are intruded by diorites. The carbonate-siliciclastic contact was modeled as a sedimentary contact with additional manual
refinement as most of the Çöpler mineralization is controlled by the physical trap that the hornfels formed for the diorite-derived
fluids, which then replace limestones on the contact.
| | 11-4 | |
| SSR Mining Inc. | Çöpler Property S-K 1300 Report | February 12, 2024 SLR Project No.: 138.21581.00006 |
The geology of the area is controlled by a dominant northeast-trending
tectonic fabric that was formed during a major sinistral strike-slip event. This trend is the primary driver of fault geometry, intrusion
emplacement and controls on mineralization. A plethora of faults have been mapped and digitised over the years by various consultants
(Figure 6-5; Kaymakci, 2017; Tripp, 2017; Bartsch, 2018). A global southwest trend was used to honor the control of the large-scale
structures that control the diorite intrusion geometries.
The intense faulting observed in the Manganese pit with a somewhat radial
pattern has caused the weakening resulting in the diorite intruding there; however, in most cases, the geometries of the mineralization
follow the contact of the diorite intrusion more than they do the individual structures.
| | 11-5 | |
| SSR Mining Inc. | Çöpler Property S-K 1300 Report | February 12, 2024 SLR Project No.: 138.21581.00006 |
Figure 11-1: Plan View of Mapped
Structures, Modeled Diorite and Au Mineralization
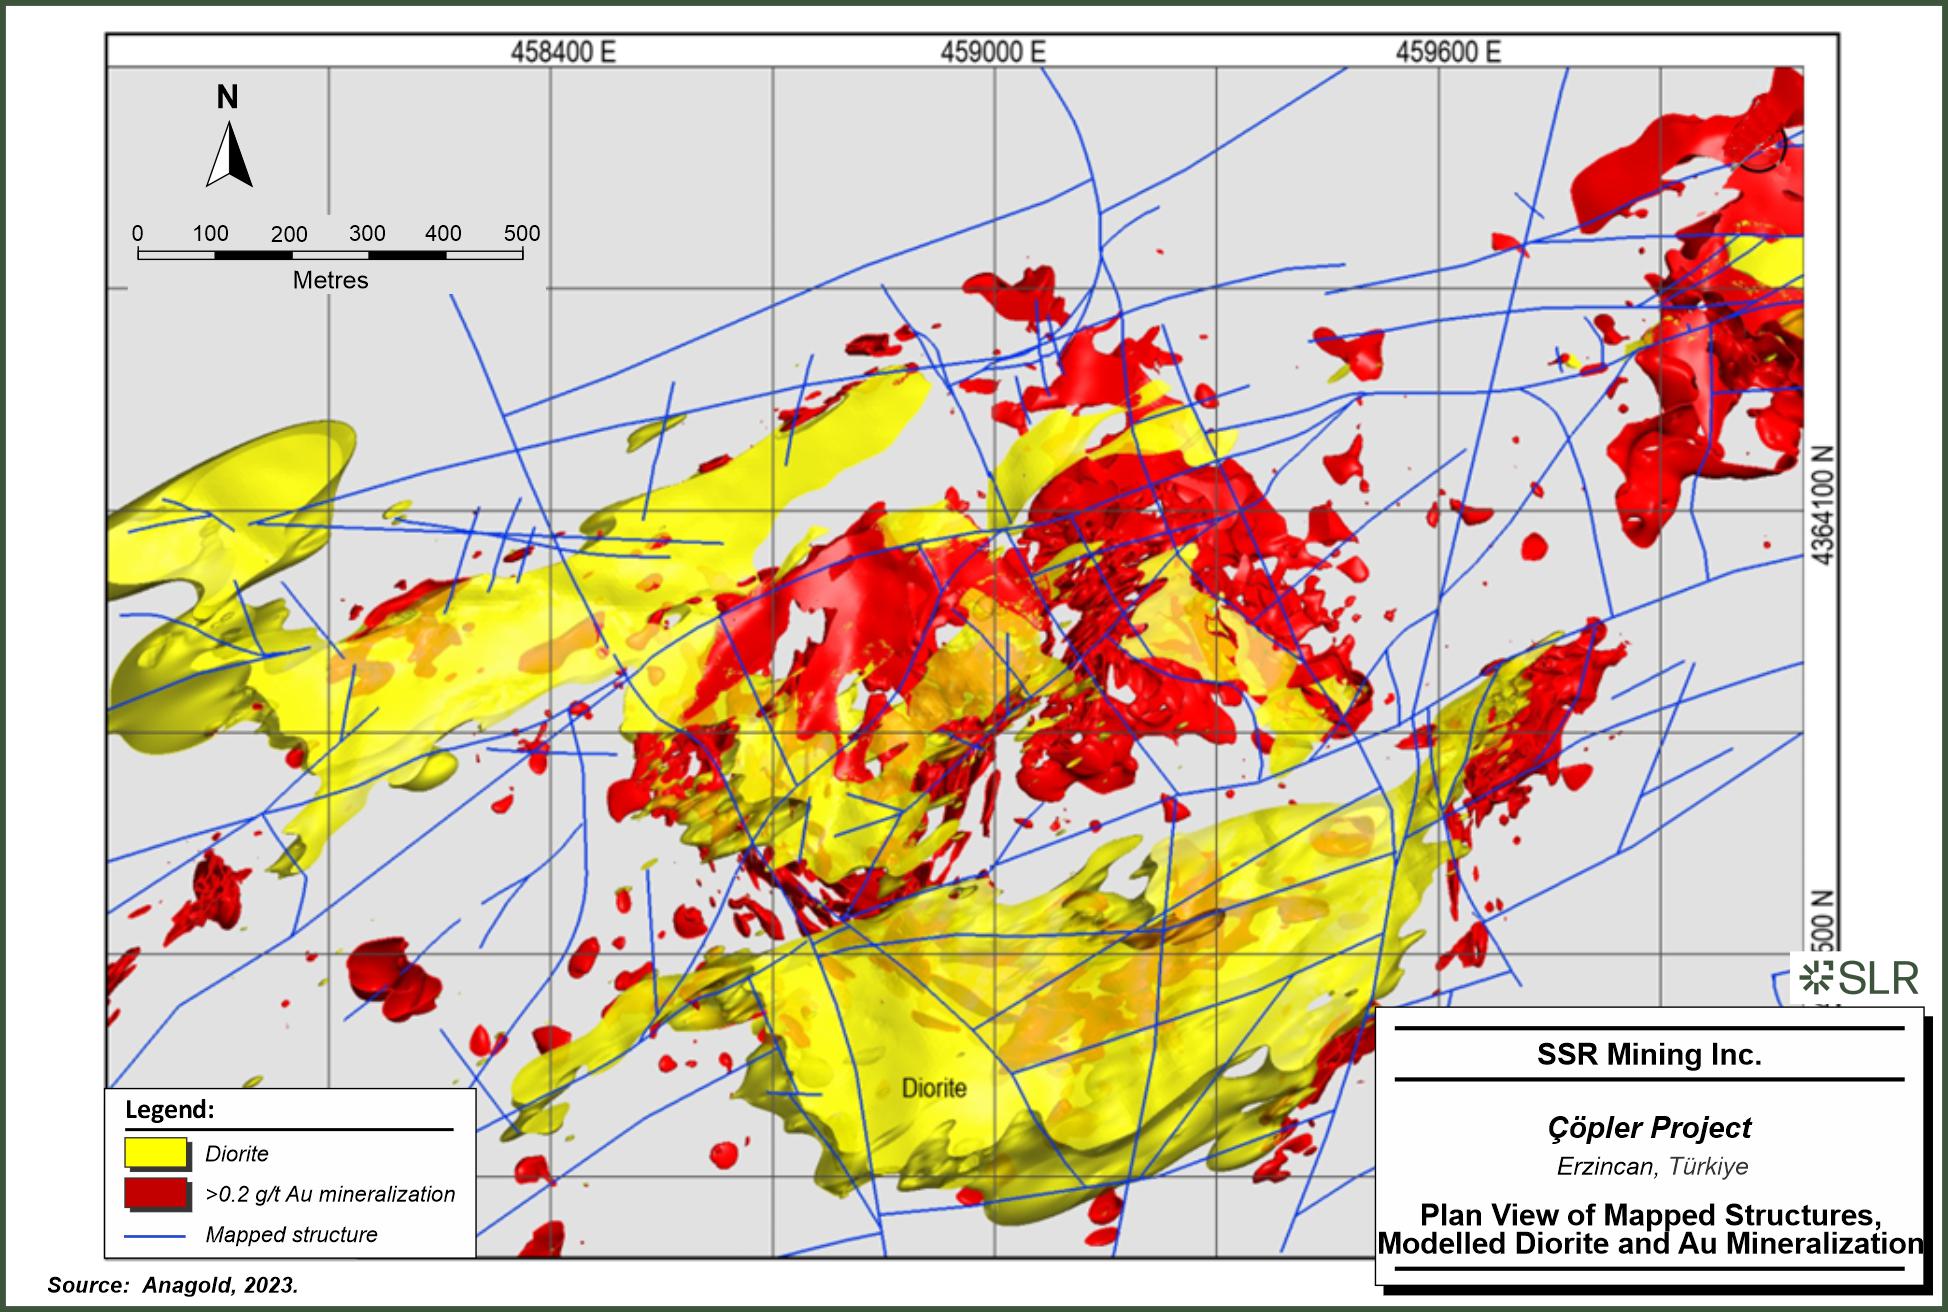
SSR
Mining Inc. Copler Project Erzincan, Turkiye Plan View of Mapped Structures, Modelled Diorite and Au Mineralization
| | 11-6 | |
| SSR Mining Inc. | Çöpler Property S-K 1300 Report | February 12, 2024 SLR Project No.: 138.21581.00006 |
Quantitative sulfide (S) concentration thresholds, determined for each
lithology to mark the transition between sulfide and oxide material, were used to model the oxide and sulfide domains.
It is important to note that from a mining and metallurgical perspective,
material below 2% S is considered as “Oxidized” and above 2% S as “Sulfide”, whereas the geologist’s logging
and the geological relationships, which were used in the geological model, indicate the oxidation front to be better represented by a
lower value (between 0.2% and 0.9% S depending on rock type).
| 11.2.3 | Estimation Domain Interpretation |
| 11.2.3.1 | Çöpler Estimation Domaining |
The mineralization controls are critical to understand when establishing
estimation domains. The spatial continuity, stationarity, and modality of gold grades, in the context of the established geological and
structural model, were assessed, and estimation domains were refined by applying an implicit approach guided by the geological and structural
knowledge of the deposit.
The estimation domains developed differ significantly from the previous
models.
The mineralization is controlled by structural fluid pathways, intrusion
contacts, and traps controlled by lithological contacts, in typical replacement-style processes (e.g. jasperoid).
The estimation domains honor three key controls on mineralization:
| 1 | Hornfels-Marble Contact — This contact has a major control on the mineralization. The thick carbonate sequence once overlying
the deposit acted as a pressure seal, forming a physical trap for the mineralizing fluids. At the resource model resolution, the hornfels-marble
contact appears to be a highly continuous, geometrically simple doming feature, perhaps with its contacts showing minor offsets and some
small-scale folding in places. This contact, modeled as a single doming plane, was used to set the primary anisotropic ratios in the creation
of estimation domains, getting progressively weaker further away from the contact, up to 80 m away. |
| 2. | Diorite and Diorite Contact — The geometry of mineralization in the Manganese pit strongly mimics the diorite geometry
(Figure 11-3), creating manganese skarns that wrap around the contact and display internal porphyry-style mineralization. In the Main
Pit, the diorites also define the trend of high-grade mineralization at the Hornfels-Diorite contacts. The diorite contact was used to
define the anisotropy of nearby mineralization in the grade estimation domains. |
| 3. | Epithermal Veins, Mineralized Faults, and confluence of faults — These mostly form thin, discreet and tabular geometries,
hosted mostly in the hornfels in the Main Pit. Often, they are not continuous across long distances. Other times, where they intersect,
or where there are multiple 2nd-to-3rd-order faults intersecting, grade blow-outs occur. Modeling of these zones incorporated trend planes
(guided by mapped faults). |
| | 11-7 | |
| SSR Mining Inc. | Çöpler Property S-K 1300 Report | February 12, 2024 SLR Project No.: 138.21581.00006 |
Figure 11-2: Section Showing
the Relationship of Mineralization with Marble-Hornfels Contact
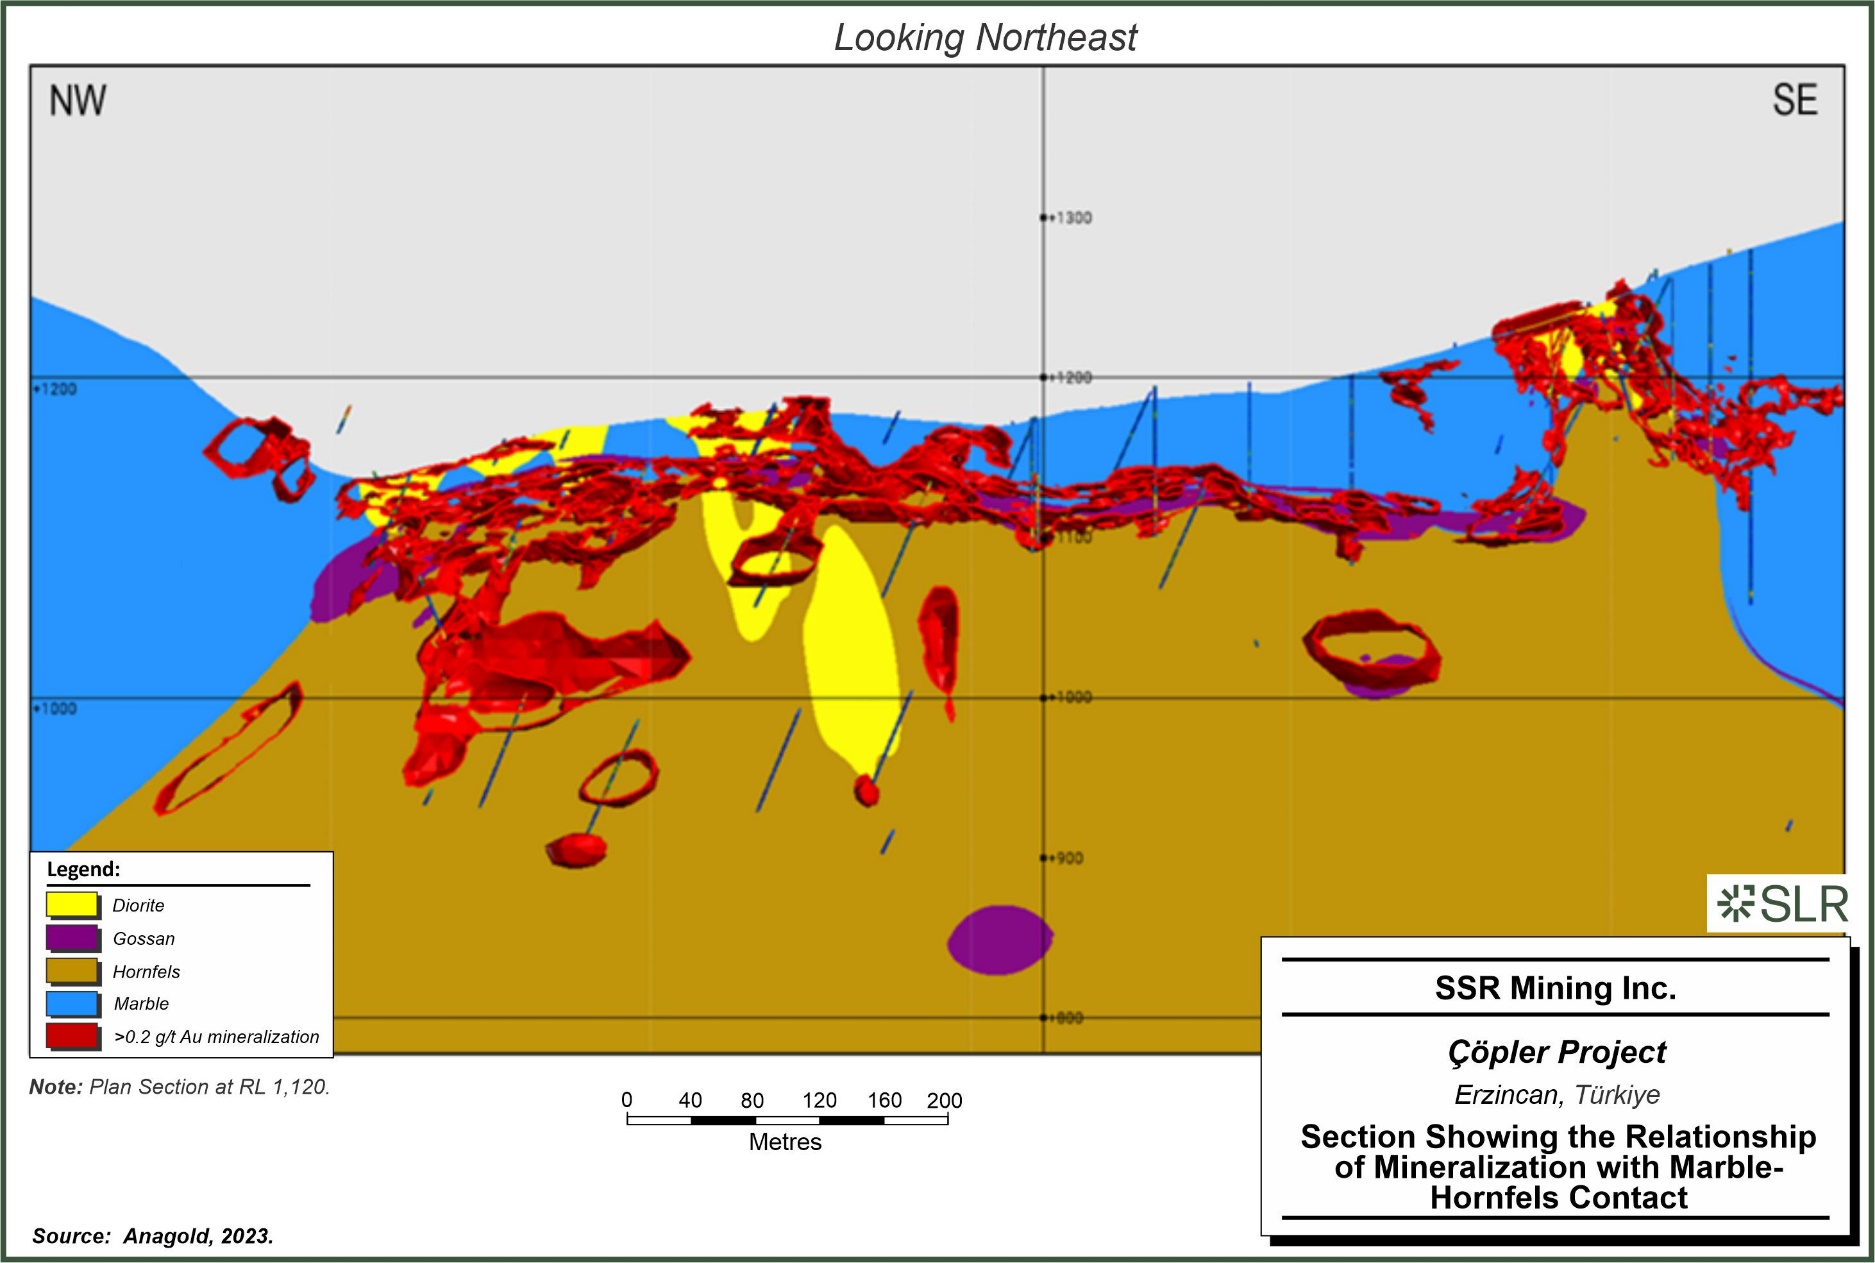
SSR
Mining Inc. Copler Project Erzincan, Turkiye Section Showing the Relationship of Mineralization with Marble-Hornfels Contact
| | 11-8 | |
| SSR Mining Inc. | Çöpler Property S-K 1300 Report | February 12, 2024 SLR Project No.: 138.21581.00006 |
Figure 11-3: Plan View Section
in the Manganese Pit Showing the Relationship of Mineralization with Marble-Diorite Contact
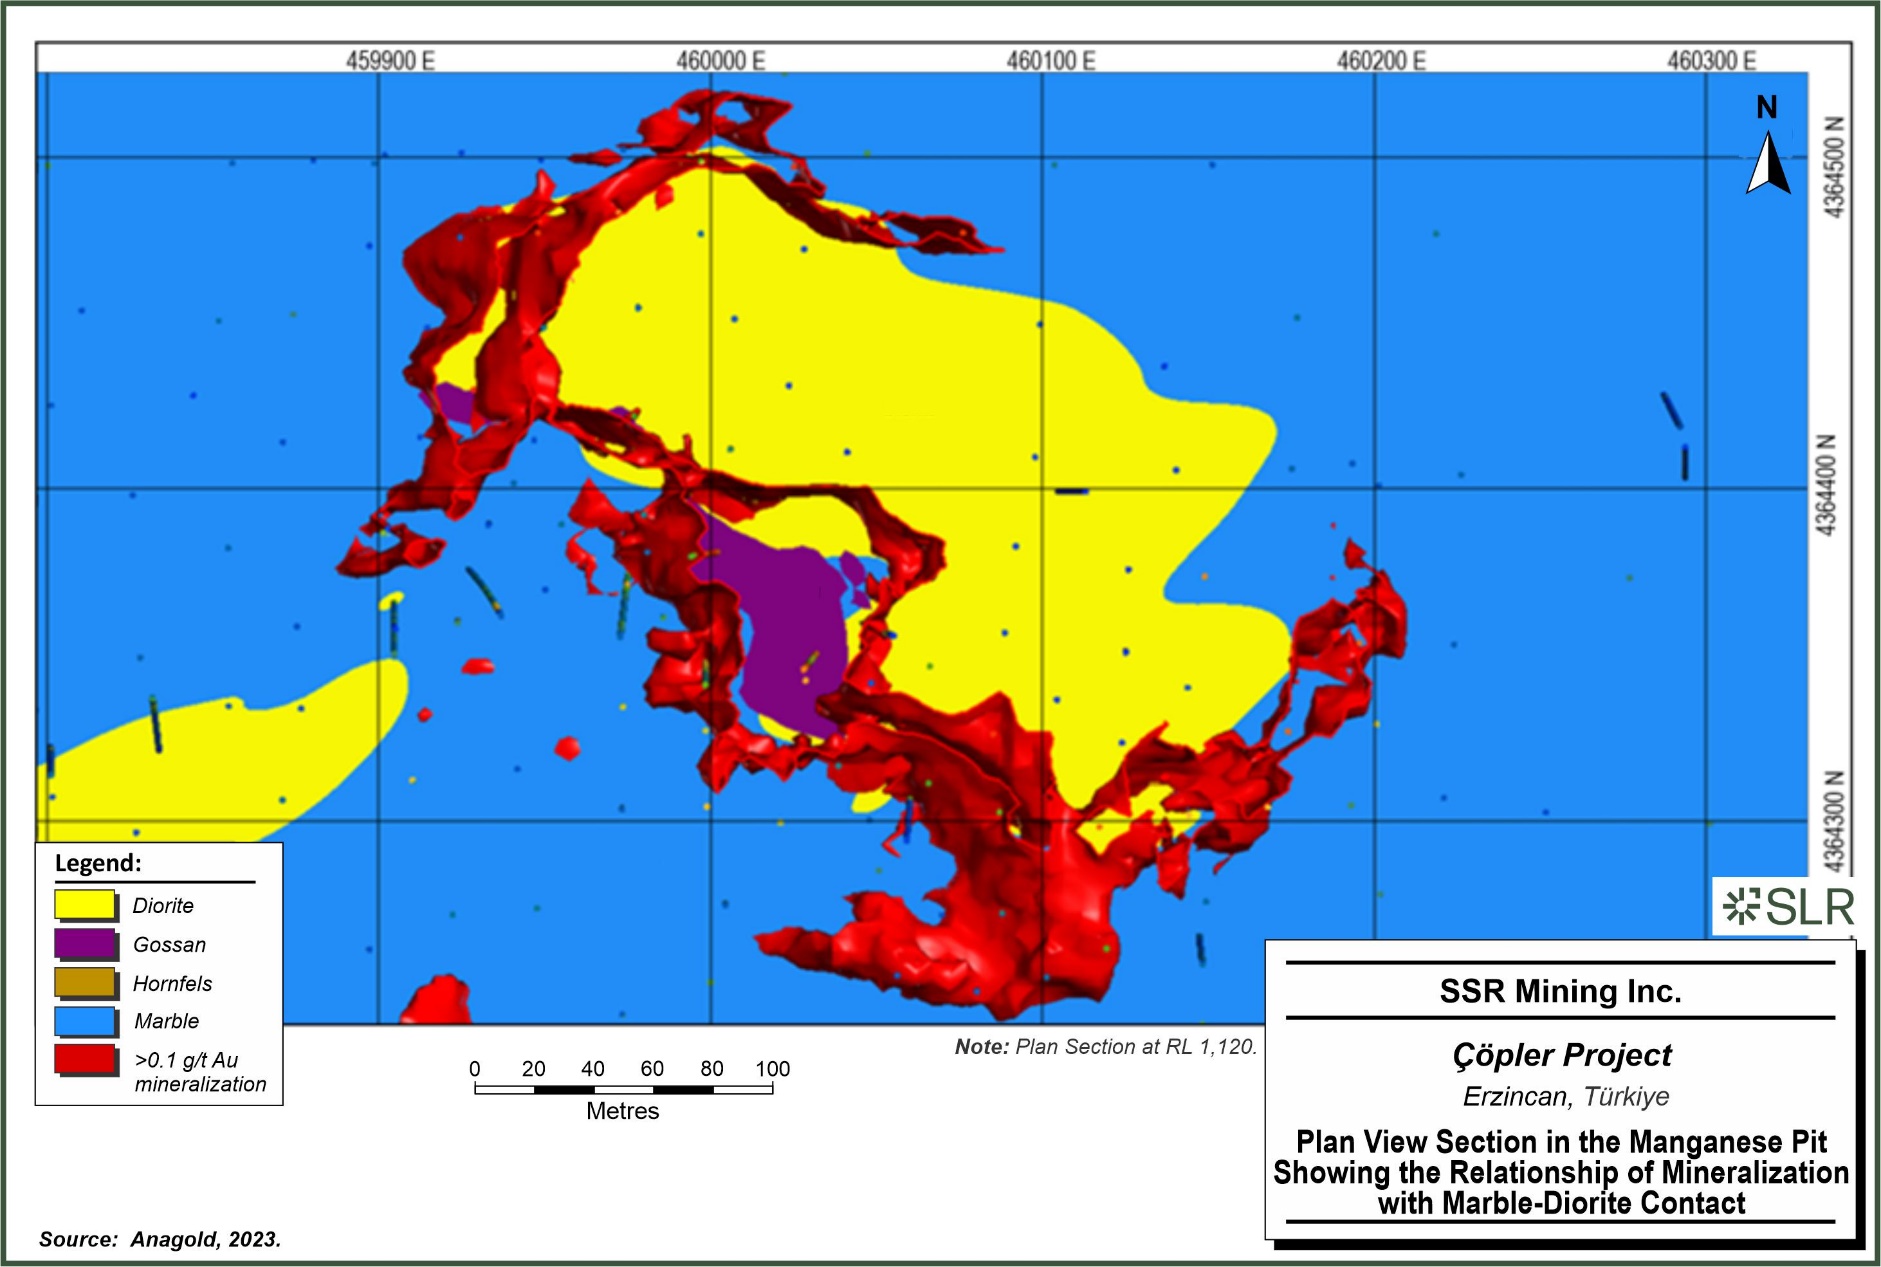
SSR
Mining Inc. Copler Project Erzincan, Turkiye Plan View Section in the Manganese Pit Showing the Relationship of Mineralization with Marble-Diorite
Contact
| | 11-9 | |
| SSR Mining Inc. | Çöpler Property S-K 1300 Report | February 12, 2024 SLR Project No.: 138.21581.00006 |
A categorical domaining approach using the raw Au grade data and trend
planes was implemented. The domain-building process was iterative with both geological and numerical data used to build, validate, and
adjust the domains. The domain statistics and behaviour around contacts were investigated to support the final estimation domain decisions.
Following a statistical analysis, including a boundary analysis, nine
Au sub-domains describing different ore and grade characteristics were developed: Manganese Sulfide, Manganese Oxide, Diorite, Hornfels
Oxide, Hornfels Sulfide, Marble Oxide, Marble Sulfide, Gossan, and Jasperoid. Four of these domains represent alteration processes that
have led to different grade distributions and do not necessarily represent primary lithology (Manganese Oxide, Manganese Sulfide, Gossan,
and Jasperoid).
Different grade domains were also generated for other elements (Ag,
Cu, Fe, C, S, As) as there is a clear zonation of these elements in this largely porphyry-driven system, with Cu particularly becoming
progressively higher grade to the south of the Main Pit.
The deposit has been reasonably well closed off in most directions;
hence, there is low risk in incorrect estimates due to extrapolation assumptions. The inherent settings in the indicator domains mean
that the key estimation domains have not been extended to more than roughly half the drill spacing, which in most cases is 25 m.
| 11.2.3.3 | Alternative Interpretation and Risk in Domaining |
International public reporting codes and best-practice guidelines encourage
practitioners to discuss the impact of any alternative geological interpretation, and both qualify and quantify the risk these have on
resource estimation.
As with almost every deposit, alternative geological interpretations
are possible. In some areas, like in the Main Pit, the steep and narrow, high-grade structures are not well constrained by the current
estimation domaining approach and improved estimation domains could be developed for the Çöpler deposit following further
work. Detailed mapping in the pit should integrate with more detailed domaining of particularly discrete vein and fault domains. Local
controls are still quite uncertain in many places, and the blanket approach of trend planes based on three broad controls on mineralization
will not be applicable in some under-drilled areas. This was taken into account when classifying the Mineral Resource estimate. Variance
in reconciliation on a monthly basis should be expected until further upgrades to domains are made.
In terms of quantification of the overall risk on the total tonnages
and grades associated with the interpretation of the estimation domains, given the relatively poor density of drilling in key deeper parts
of the deposit, it is anticipated that the risk in alternative interpretations of the geological model may lead to tonnage or grade swings
of up to ±20% in Inferred parts of the Mineral Resource.
The data informing the MRE are from RC and diamond core drilling. The
samples resulting from each of these drilling techniques have a different sample support, which may lead to a difference in variance in
the data used in estimation.
A comparison between RC and DD drilling demonstrated that difference
to be insignificant, with CVs of 2.95 and 2.85, respectively. Notwithstanding a potential bias between RC and DD sampling (Section 8.3.4.1),
this is an acceptable difference in variance for the purpose of resource classification.
| | 11-10 | |
| SSR Mining Inc. | Çöpler Property S-K 1300 Report | February 12, 2024 SLR Project No.: 138.21581.00006 |
Differences in sample support also occur. The predominant part of the
drill holes (85%) has been sampled at approximately one-metre lengths. Of those intervals that are longer than one metre, most samples
have grades below the grade cut-off. Only a small percentage of samples are of intervals larger than 1.3 m and with grades higher than
the cut-off grade. Therefore, one metre was selected as the composite interval. Testing of 2.5 m composites did not significantly improve
the kriging metrics.
The impact of core loss on the compositing algorithm was also considered.
The minimum coverage function was set to 50%; for core loss intervals less than 50 cm, the algorithm disregards the core loss and
continues the downhole averaging process undisturbed. For core loss over 50 cm, a break is assumed, and no composite value was calculated.
Compositing was carried out within hard boundaries, and residual sample lengths were distributed equally along the hole where they were
less than 30 cm. Compositing statistics for the combined Au domains are presented in Table 11-3.
Table 11-3: Compositing Statistics
in the Single Au Mineralization Domain (All Sub-Domains Combined)
| |
Count |
Length |
Mean (g/t) |
SD |
CV |
Variance |
Minimum (g/t) |
Q1 (g/t) |
Q2 (g/t) |
Q3 (g/t) |
Maximum (g/t) |
| Composited |
109,500 |
108,109 |
1.42 |
4.3 |
3.1 |
18.87 |
0.0025 |
0.3 |
0.6 |
1.4 |
935 |
| Uncomposited |
102,077 |
108,849 |
1.41 |
4.4 |
3.2 |
19.75 |
0.0025 |
0.3 |
0.5 |
1.3 |
935 |
| 11.2.5 | Exploratory Data Analysis |
Following estimation domaining and compositing, the statistics for the
domains were evaluated further. The CVs of the composites within the nine estimation domains range between 1.1 and 5.5, and no multi-modality
was noted in the individual distributions of domains (Figure 11-4, Table 11-4).
| | 11-11 | |
| SSR Mining Inc. | Çöpler Property S-K 1300 Report | February 12, 2024 SLR Project No.: 138.21581.00006 |
Figure 11-4: Log-histograms
of Composites within the Hornfels Sulfide (left) and Diorite (right) Domains
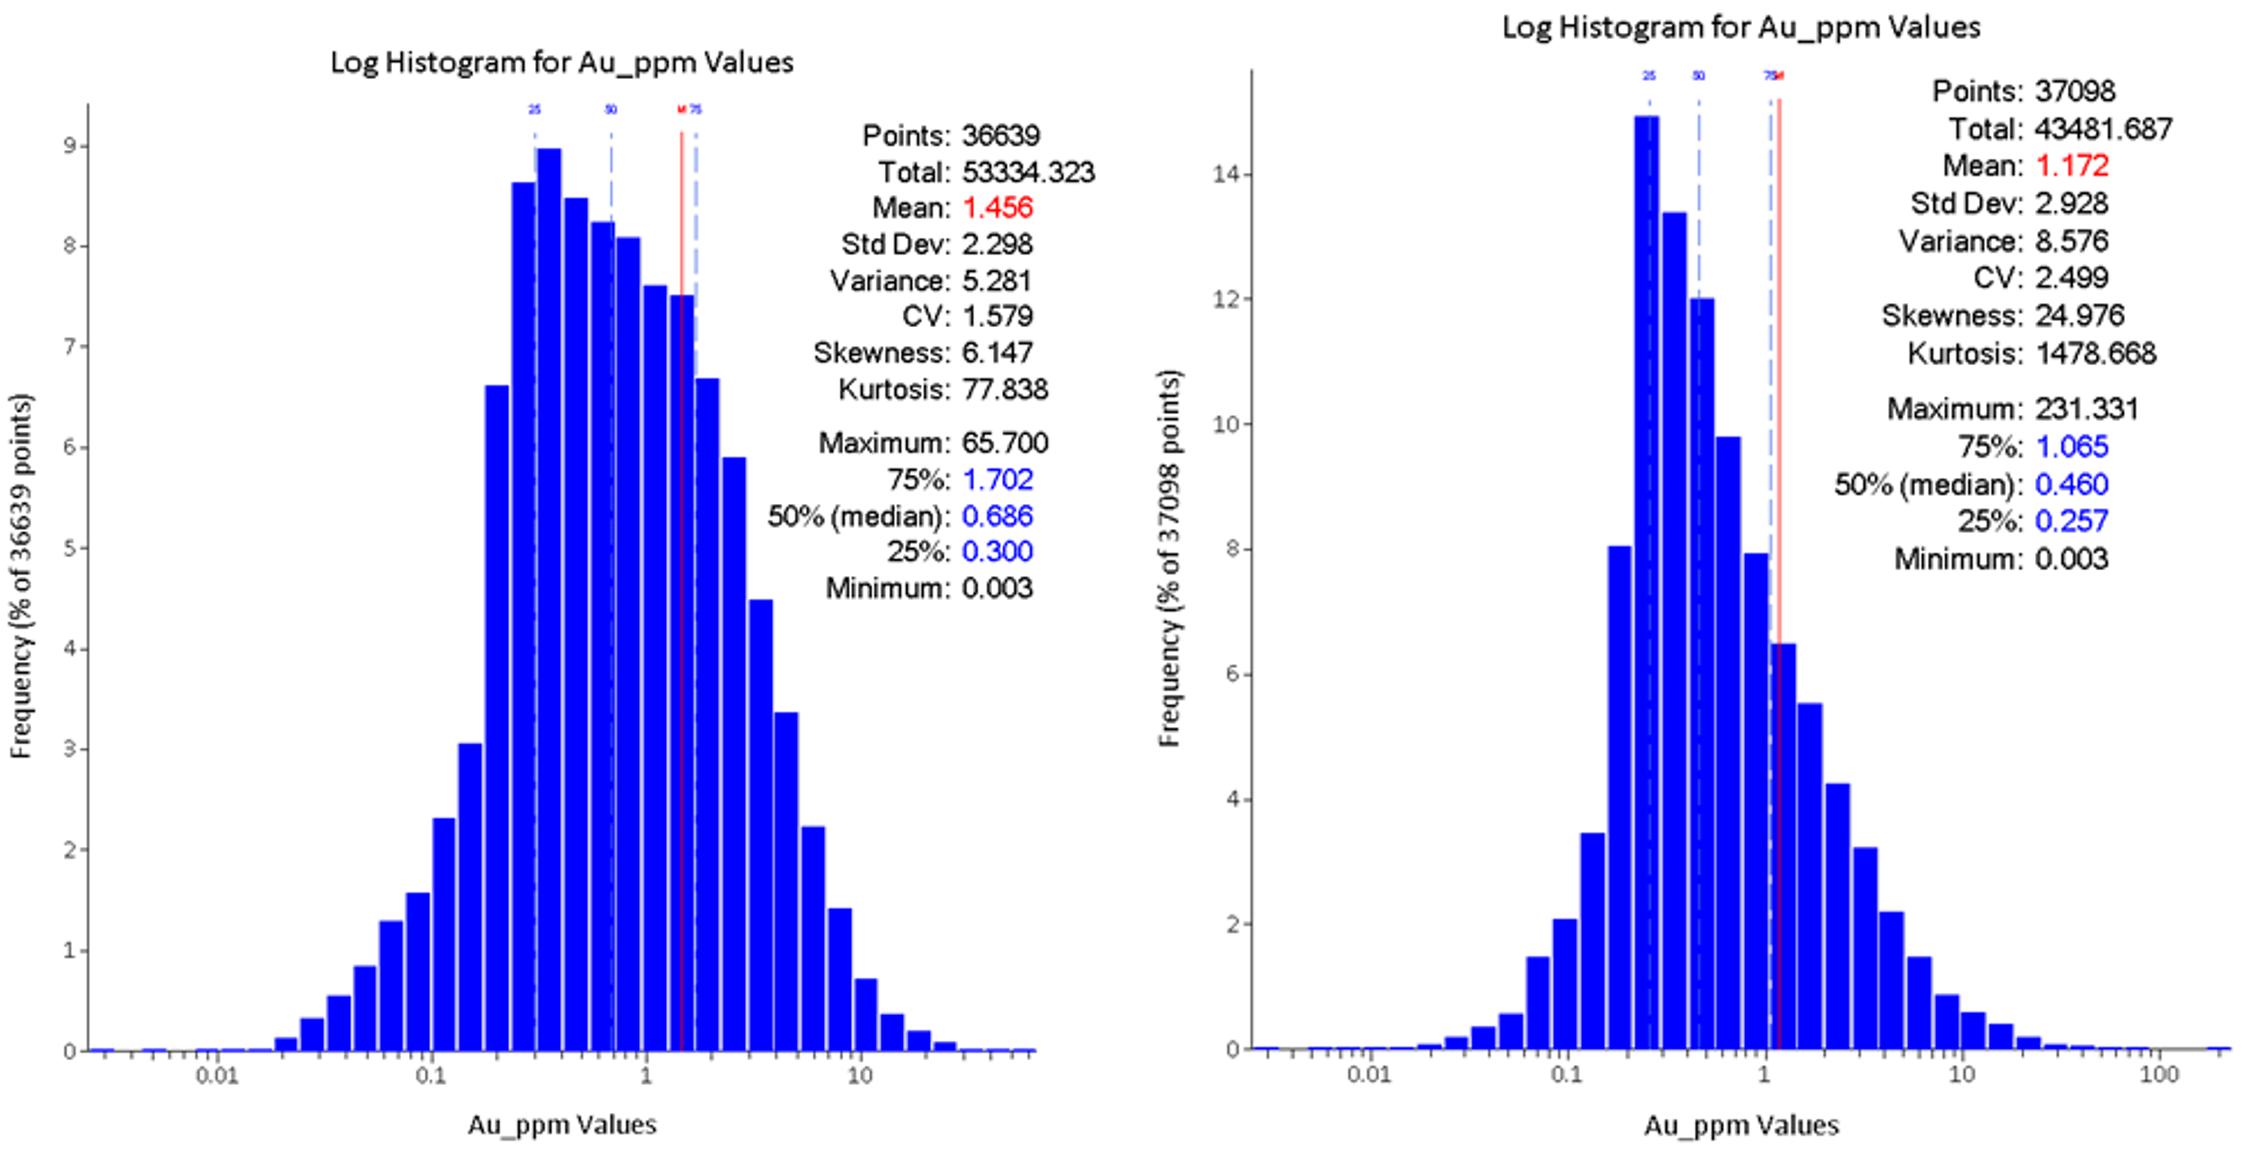
Table 11-4: Domain Statistics
(g/t Au)
| Domain Name |
Manganese Sulfide |
Manganese Oxide |
Diorite |
Hornfels Oxide |
Hornfels Sulfide |
Marble Oxide |
Marble Sulfide |
Gossan |
Jasperoid |
| CV |
2.06 |
1.14 |
2.5 |
2.63 |
1.58 |
5.46 |
2.18 |
2.15 |
2.43 |
| Mean |
1.86 |
4.87 |
1.17 |
1.06 |
1.46 |
1.19 |
2.16 |
2.87 |
2.17 |
| 11.2.6 | Treatment of High-Grade Assays |
Where the assay distribution is skewed positively or approaches log-normal,
erratic high grade assay values can have a disproportionate effect on the average grade of a deposit. One method of treating these outliers
to reduce their influence on the average grade is to cut or cap them at a specific grade level.
At Çöpler, global grade capping has not been applied, as
most domains demonstrate a relatively low CV.
| 11.2.6.2 | High Grade Restriction |
An alternative approach to reducing the influence of high-grade composites
is to restrict the influence of high-grade samples during the estimation process. The threshold grade levels and buffer distances were
selected from the basic statistics and from visual inspection of the apparent continuity of very high grades within each estimation domain.
| | 11-12 | |
| SSR Mining Inc. | Çöpler Property S-K 1300 Report | February 12, 2024 SLR Project No.: 138.21581.00006 |
In all but the Manganese Oxide domain, a distance-buffered capping
was applied (usually up to 15 m). Given the low amount of grade outliers and the relatively low grade of these, model sensitivity testing
confirms that the extent of the grade cap has a very low impact on Project risk.
Experimental variograms were created for each of the nine estimation
domains. All variograms were calculated on composited, non-capped data, and transformed to normal scores. Long and short ranges were validated
by reviewing spatial continuity of low-and-high-grade implicit grade shells respectively. Nuggets were compared to domain CVs as a broad
check of alignment of domain variance characteristics. As an example of the experimental variograms, the results of the Diorite domain
are presented in Figure 11-5.
The variography model data used in the ordinary kriging (OK) estimation
are detailed in summary form in Table 11-6.
Since the geological and grade continuities are heavily influenced by
three different mineralization controls, it is important to orient the search ellipse at each block appropriately. This process, often
referred to as ‘dynamic anisotropy’, or as ‘variable orientation’ in the software package used, can be set by
referencing a variety of meshes. Several reference surfaces were trialled to optimise this process. In an effort to still honor the controls,
and in particular the influence of diorite contacts and steep mineralized fault zones, simplified trend planes were generated. These trend
planes are the same trend planes that also guide the formation of the categorical grade estimation domains. Future mapping and improved
geological knowledge should be continually integrated to update and improve these trend planes.
| | 11-13 | |
| SSR Mining Inc. | Çöpler Property S-K 1300 Report | February 12, 2024 SLR Project No.: 138.21581.00006 |
Figure 11-5: Experimental and
Modelled Variograms for Diorite Domain (Exploration Data only)
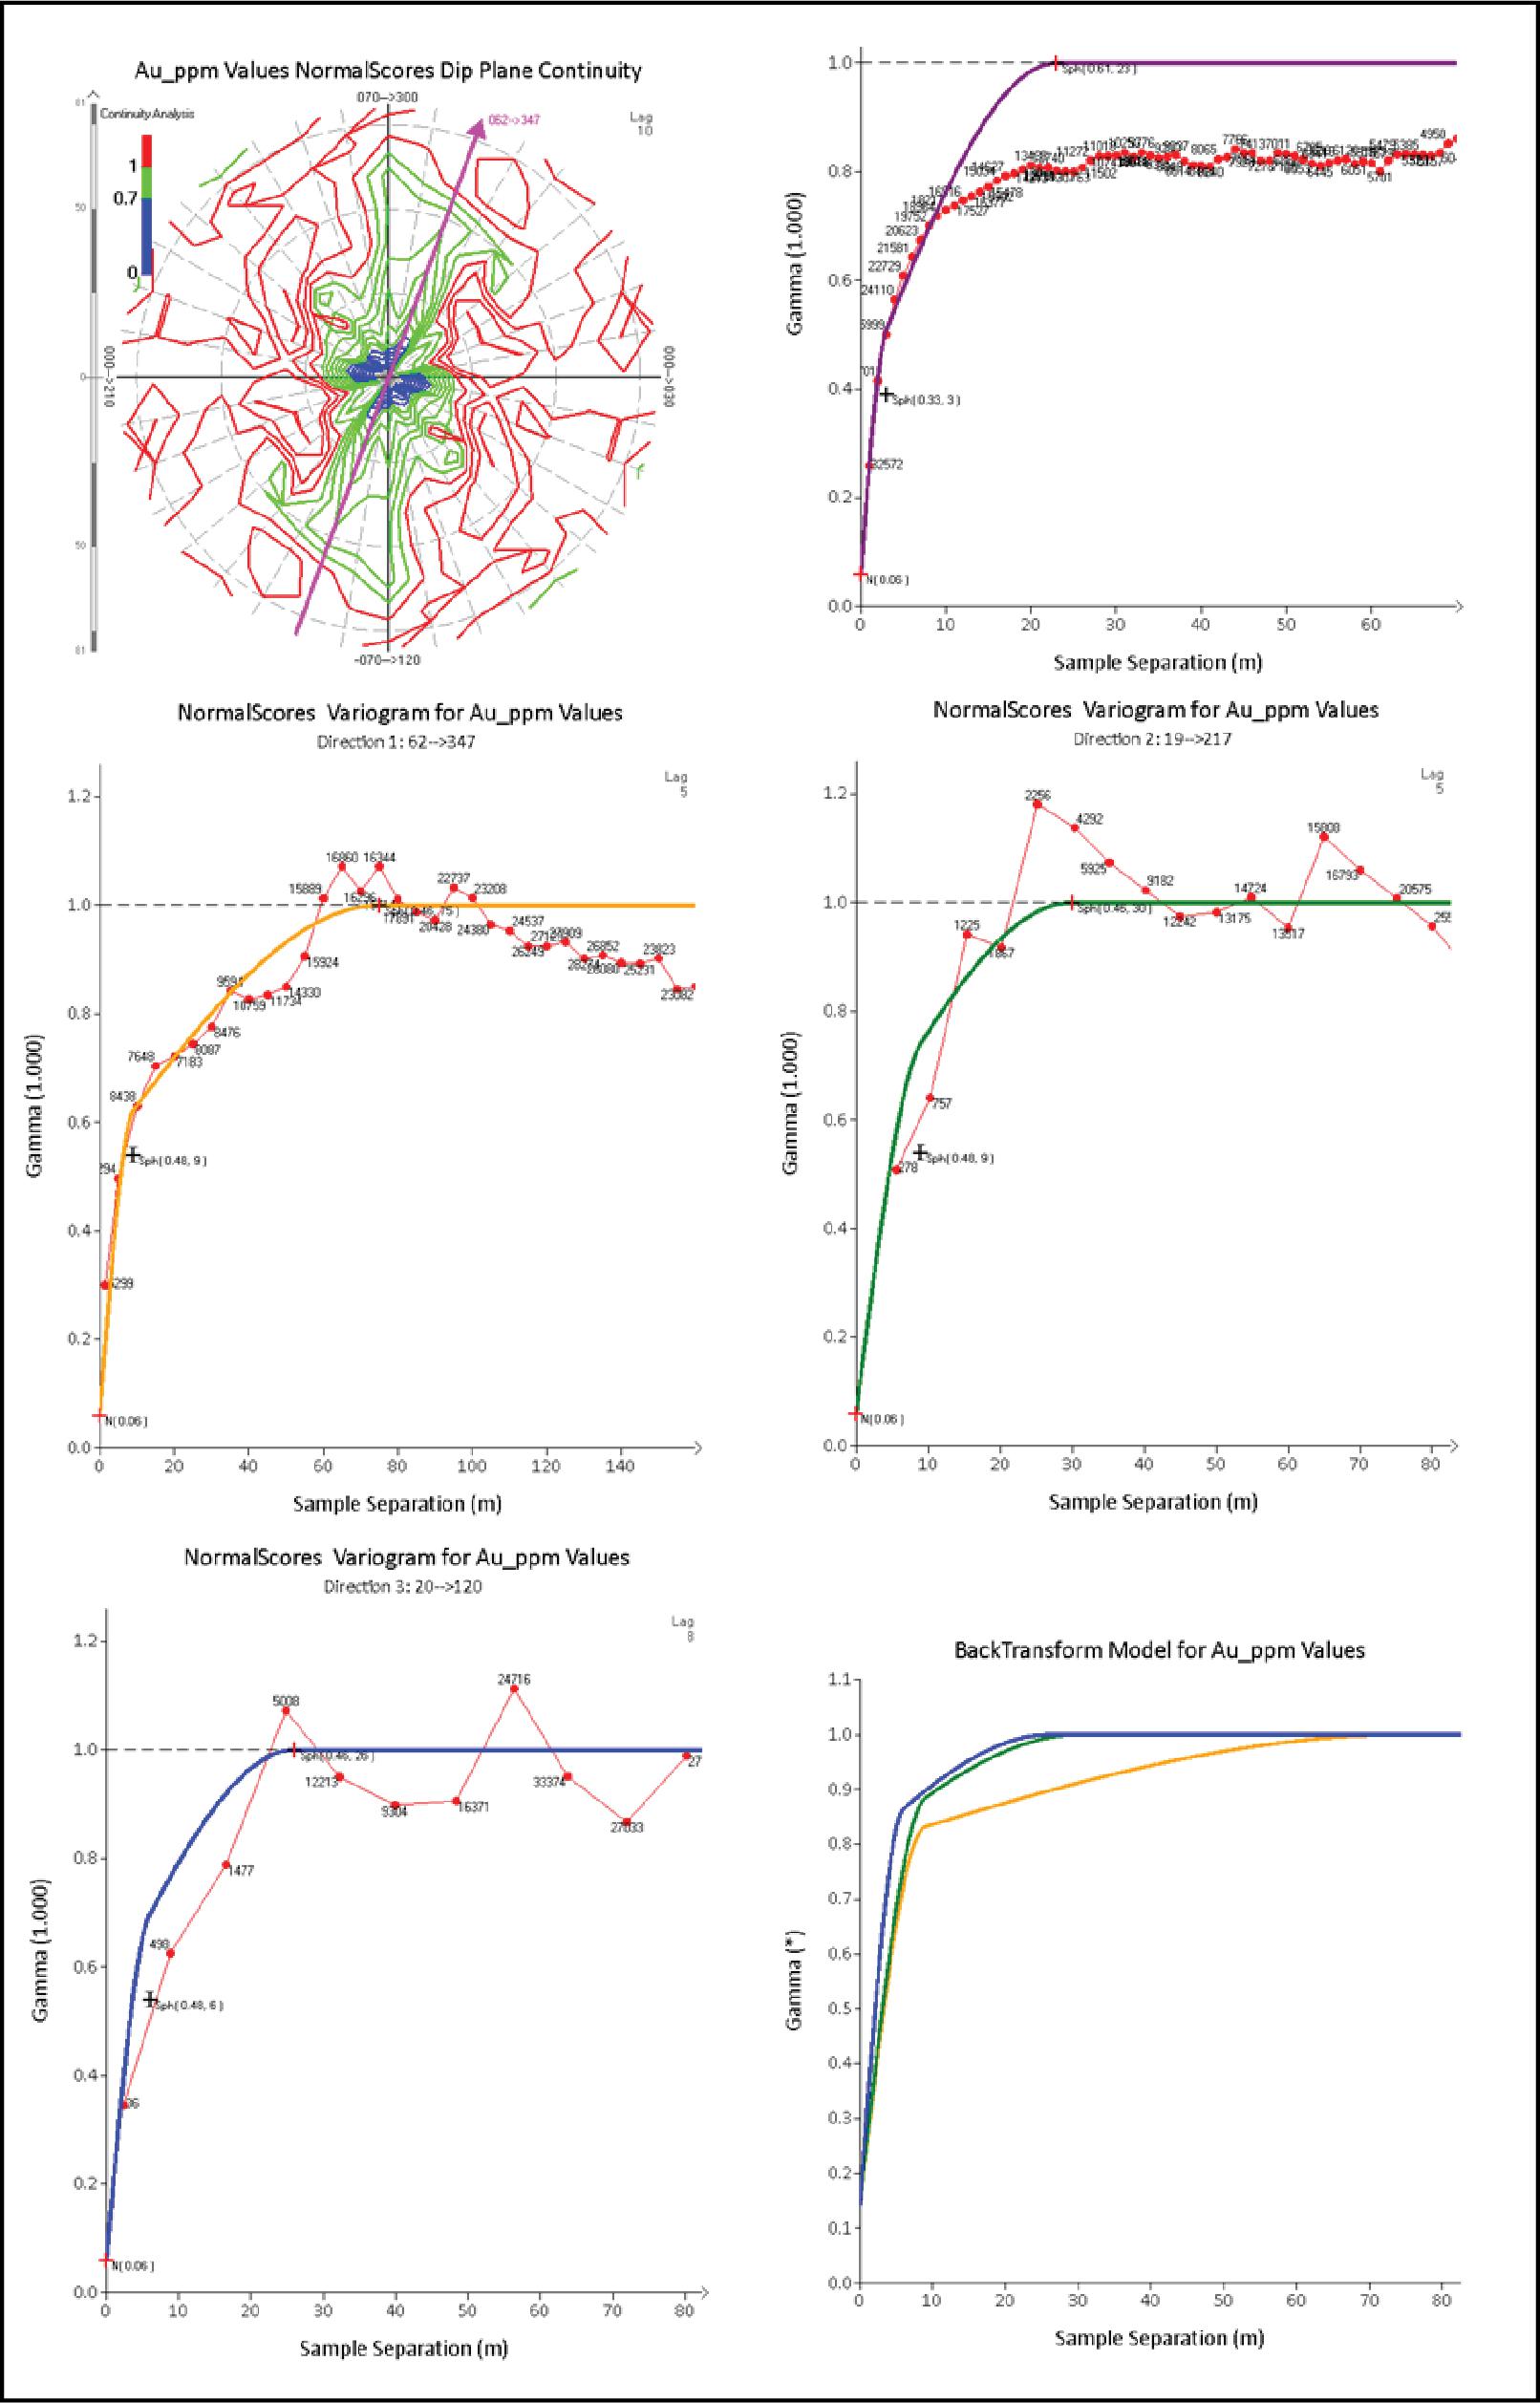
| | 11-14 | |
| SSR Mining Inc. | Çöpler Property S-K 1300 Report | February 12, 2024 SLR Project No.: 138.21581.00006 |
| 11.2.8 | Search Strategy and Grade Estimation Parameters |
The block model covers the entire geological model area and has 12 m
x 12 m x 5 m parent blocks in the X, Y, Z directions, respectively (Table 11-5). A study of optimal block size was undertaken, and
the final size was selected based on the weighted average of kriging statistics in high-metal blocks. The block model is sub-blocked to
3 m x 3 m x 5 m to provide volume resolution and to match the grade control (GC) block size. Grid origins match the grid of the GC model
so that each sub-block exactly matches each GC block. Discretization was set to 3 m x 3 m x 4 m.
Table 11-5: Block Model Description
| Parameter |
X |
Y |
Z |
| Parent block size (m) |
12 |
12 |
5 |
| Sub-block size (m) |
3 |
3 |
5 |
| Sub block divisions |
4 |
4 |
1 |
| Minimum parent centroid |
456,906 |
4,361,907 |
437.5 |
| Maximum parent centroid |
460,818 |
4,364,955 |
1,857.5 |
| Minimum corner |
456,900 |
4,361,901 |
435 |
| Maximum corner |
460,824 |
4,364,961 |
1,860 |
| Size (m) |
327 |
255 |
285 |
| Azimuth (°) |
0 |
|
|
| Dip (°) |
0 |
| Pitch (°) |
0 |
Gold
Gold data were interpolated using search ellipses that were slightly
larger than the variogram ranges to select samples around blocks. Minimum and maximum samples were set for each domain, finding a balance
between conditional bias and over smoothing. Blocks estimated by a low number of samples are assigned a lower confidence in the classification
of the resource. All estimation settings are summarized in Table 11-6.
Grade control data were used to inform an area of 20 m below the current
pit. These data were first corrected for bias in the lower grade (<1 ppm Au) range. These higher variance data do negatively affect
the kriging statistics; however, the amount of available GC data provides better local accuracy and this is important in the making of
short-term mine planning decisions.
Because of the low nugget in the variogram, a few negative kriging weights
exist, particularly in the 20-m buffer zone where the GC data are allowed to inform the model, which in some minor blocks have led to
negative Au grades. For these blocks, and for those blocks with a total sum of negative weights below -0.2, the estimate was overwritten
by an inverse distance algorithm. This has a negligible impact on the overall MRE but provides better local accuracy.
| | 11-15 | |
| SSR Mining Inc. | Çöpler Property S-K 1300 Report | February 12, 2024 SLR Project No.: 138.21581.00006 |
The estimation strategy also included a separate restricted search outside
the main domains, where the domaining could not generate sensible shapes in areas of poor drill spacing or without contiguous mineralization.
Silver and Copper
Silver and copper were estimated into numeric indicator interpolant
domains and estimated using ordinary kriging algorithms with similar settings as those used for Au. Similar trend planes were used to
guide these domains. Dynamic anisotropy was used to control the orientation of the ellipse. Grade data did not require grade capping.
While indicator interpolants do not always show logical geometries,
this is considered fit-for-purpose as the Ag and Cu mineralization is mostly at very low grades that are not material to the Project economics.
Sulfur
The sulfur grades were estimated in oxidation domains using inverse
distance with a power of 1.5. Dynamic anisotropy was used for the estimation, following the general trend of the oxidation front as well
as the mineralization.
Carbon
Carbon grades were estimated, constrained within lithological domains
from the updated geological model, due to the lithological control on carbon content. Grades were estimated using inverse distance and
using dynamic anisotropy to guide the search ellipse, based on simplified lithological contacts.
| | 11-16 | |
| SSR Mining Inc. | Çöpler Property S-K 1300 Report | February 12, 2024 SLR Project No.: 138.21581.00006 |
Table 11-6: Estimation Kriging
Neighbourhood and Variography Settings for All Domains (Au)
| Domain Name |
CV |
Mean
(g/t Au) |
Min Samples
(No.) |
Max Samples
(No.) |
Outlier
Dist
|
Outlier
Cap
|
Major (m) |
Semi (m) |
Minor (m) |
Nugget |
J1 |
Major Range (m) |
Semi Range (m) |
Minor Range (m) |
2nd Major Range (m) |
2nd Semi Range (m) |
2nd Minor Range (m) |
Var
Dir1
(m) |
Var
Dir2
(m) |
Var
Dir3
(m) |
| Manganese Sulfide |
2.06 |
1.86 |
6 |
30 |
20% |
35 |
150 |
75 |
50 |
0.1 |
0.67 |
135 |
40 |
30 |
40 |
8 |
7 |
70 |
215 |
10 |
| Manganese Oxide |
1.14 |
4.87 |
6 |
25 |
- |
- |
1750 |
75 |
50 |
0.06 |
0.37 |
165 |
40 |
30 |
100 |
12 |
5 |
5 |
70 |
0 |
| Diorite |
2.5 |
1.17 |
6 |
35 |
15% |
60 |
100 |
50 |
40 |
0.14 |
0.65 |
75 |
30 |
25 |
9 |
9 |
6 |
70 |
120 |
110 |
| Hornfels Oxide |
2.63 |
1.06 |
6 |
35 |
10% |
35 |
150 |
100 |
25 |
0.29 |
0.59 |
135 |
60 |
20 |
100 |
30 |
4 |
35 |
60 |
10 |
| Hornfels Sulfide |
1.63 |
1.46 |
6 |
25 |
15% |
70 |
125 |
75 |
25 |
0.11 |
0.66 |
100 |
60 |
20 |
9 |
9 |
4 |
60 |
320 |
110 |
| Marble Oxide |
5.46 |
1.19 |
6 |
40 |
15% |
75 |
100 |
50 |
20 |
0.47 |
0.46 |
60 |
30 |
15 |
8 |
8 |
3 |
60 |
325 |
90 |
| Marble Sulfide |
2.18 |
2.16 |
6 |
30 |
50% |
35 |
500 |
150 |
50 |
0.07 |
0.63 |
400 |
125 |
30 |
30 |
30 |
4 |
50 |
35 |
50 |
| Gossan |
2.15 |
2.87 |
6 |
30 |
10% |
60 |
150 |
100 |
25 |
0.11 |
0.57 |
125 |
60 |
10 |
35 |
10 |
4 |
85 |
310 |
0 |
| Jasperoid |
2.43 |
2.17 |
6 |
35 |
50% |
25 |
125 |
125 |
25 |
0.13 |
0.66 |
100 |
100 |
18 |
35 |
30 |
4 |
25 |
35 |
285 |
| | 11-17 | |
| SSR Mining Inc. | Çöpler Property S-K 1300 Report | February 12, 2024 SLR Project No.: 138.21581.00006 |
| 11.2.8.3 | Density Estimation |
Density grade estimates were constrained within lithological domains
from the updated geological model, due to the clear lithological control on density. Grades were estimated using inverse distance and
using a lithology-driven dynamic search to guide the search ellipse. Any remaining blocks not estimated were assigned the median grade
of their population, except in the case of the Gossan domain, where a nominated value of 2.62 t/m3 was used based on a review
of the population histogram. Summary bulk density statistics for the lithological domains are presented in Table 11-7.
Table 11-7: Çöpler
Density Statistics for Lithology Domains
| Domain |
Count |
Mean
(t/m3) |
CV |
Median
(t/m3) |
| Diorite |
3,392 |
2.55 |
0.12 |
2.57 |
| Gossan |
145 |
2.65 |
0.14 |
2.65 |
| Hornfels |
5,504 |
2.65 |
0.09 |
2.67 |
| Jasperoid |
68 |
2.70 |
0.23 |
2.59 |
| Manganese |
459 |
2.51 |
0.11 |
2.51 |
| Marble |
7,154 |
2.64 |
0.06 |
2.66 |
Mineral Resources have been classified by the QP in accordance with
the U.S. Securities and Exchange Commission (US SEC) Regulations S-K subpart 1300 rules for Property Disclosures for Mining Registrants
(S-K 1300).
A Mineral Resource is defined as a concentration or occurrence of material
of economic interest in or on the Earth’s crust in such form, grade or quality, and quantity that there are reasonable prospects
for economic extraction. A mineral resource is a reasonable estimate of mineralization, considering relevant factors such as cut-off
grade, likely mining dimensions, location, or continuity, that with the assumed and justifiable technical and economic conditions, is
likely to, in whole or in part, become economically extractable. It is not merely an inventory of all mineralization drilled or
sampled.
Based on this definition of Mineral Resources, the Mineral Resources
estimated in this TRS have been classified according to the definitions below based on geology, grade continuity, and drill hole spacing.
Measured Mineral Resource is that part of a mineral resource
for which quantity and grade or quality are estimated on the basis of conclusive geological evidence and sampling. The level of
geological certainty associated with a measured mineral resource is sufficient to allow a qualified person to apply modifying factors,
as defined in this section, in sufficient detail to support detailed mine planning and final evaluation of the economic viability of the
deposit. Because a measured mineral resource has a higher level of confidence than the level of confidence of either an indicated
mineral resource or an inferred mineral resource, a measured mineral resource may be converted to a proven mineral reserve or to a probable
mineral reserve.
| | 11-18 | |
| SSR Mining Inc. | Çöpler Property S-K 1300 Report | February 12, 2024 SLR Project No.: 138.21581.00006 |
Indicated Mineral Resource is that part of a mineral resource
for which quantity and grade or quality are estimated on the basis of adequate geological evidence and sampling. The level of geological
certainty associated with an indicated mineral resource is sufficient to allow a qualified person to apply modifying factors in sufficient
detail to support mine planning and evaluation of the economic viability of the deposit. Because an indicated mineral resource has
a lower level of confidence than the level of confidence of a measured mineral resource, an indicated mineral resource may only be converted
to a probable mineral reserve.
Inferred Mineral Resource is that part of a mineral resource
for which quantity and grade or quality are estimated on the basis of limited geological evidence and sampling. The level of geological
uncertainty associated with an inferred mineral resource is too high to apply relevant technical and economic factors likely to influence
the prospects of economic extraction in a manner useful for evaluation of economic viability. Because an inferred mineral resource
has the lowest level of geological confidence of all mineral resources, which prevents the application of the modifying factors in a manner
useful for evaluation of economic viability, an inferred mineral resource may not be considered when assessing the economic viability
of a mining project and may not be converted to a mineral reserve.
The QP has classified the Mineral Resource based on a workflow that
includes the assessment of geological continuity, of the confidence in the estimation domains, and of the quality of the informing data.
The drill spacing at Çöpler is exceptionally challenging and erratic, leading to various areas that, on balance, are more
under-drilled than others. Additionally, the geometries of the estimation domains are highly variable as well, creating a rather undesirable
set of conditions to classify.
Therefore, in assessing the effect of drill spacing on classification,
the QP used quantitative kriging metrics such as SoR and KE, which inherently carry information on drill spacing, as well as a simple
distance buffer mesh to informing samples, to inform 10 reasonably continuous areas that are, on balance, less informed or of lower estimation
quality than others. These areas were hand-digitised to minimise the spotted-dog effect, and further informed by geological confidence.
An example of classification approach can be seen in Figure 11-6.
The Measured part of the resource (light green) is the area 20 m immediately below the current pit floor, as this area is informed by
detailed knowledge of the geology and grade distribution, and correlates well with drilling right under the pit floor. One of the hand-digitised
low-confidence areas is shown in blue in this figure, showing the lack of information between drill holes on this section.
| | 11-19 | |
| SSR Mining Inc. | Çöpler Property S-K 1300 Report | February 12, 2024 SLR Project No.: 138.21581.00006 |
Figure 11-6: Çöpler
North-South Section Showing Resource Classification
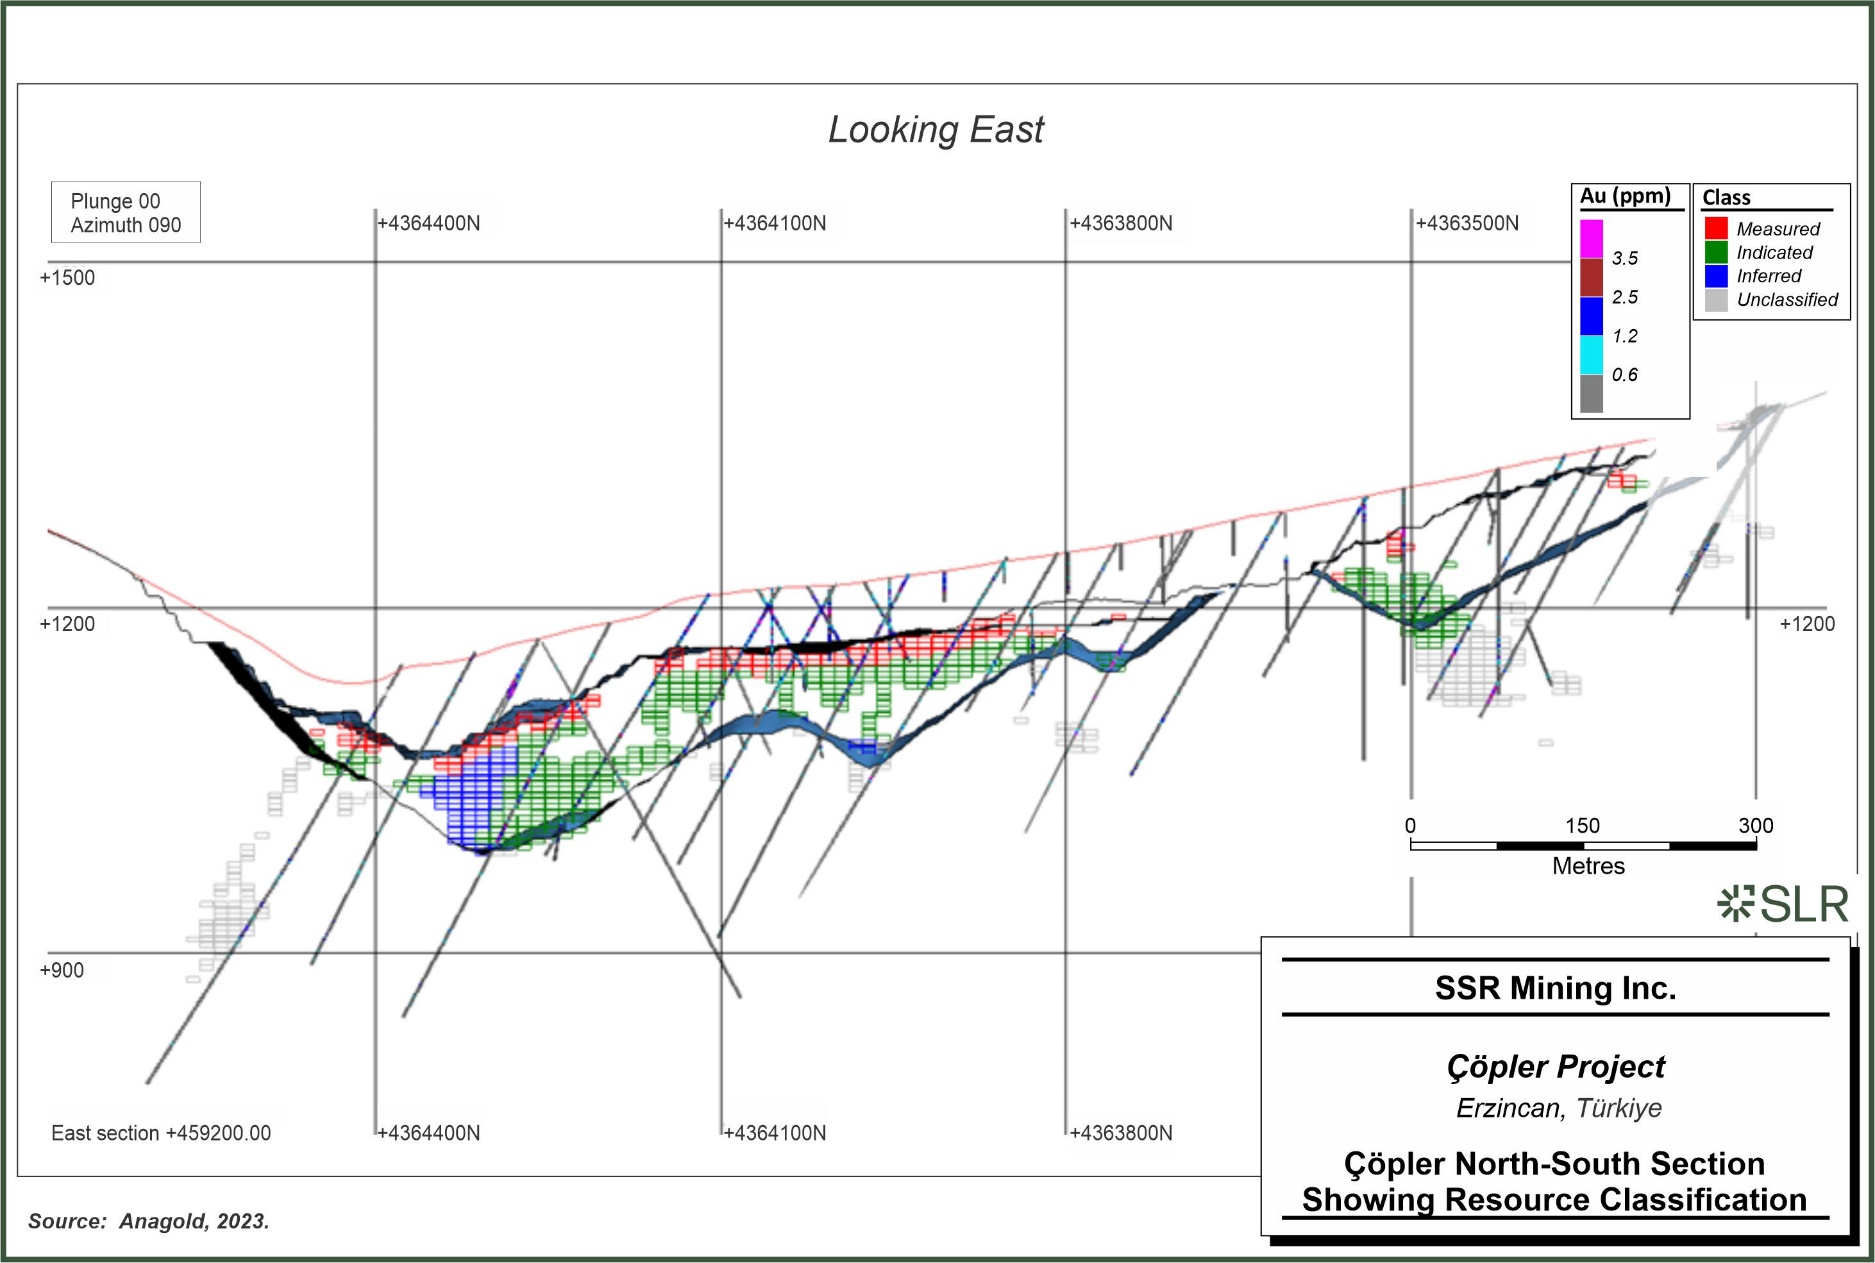
SSR
Mining Inc. Copler Project Erzincan, Turkiye Copler North-South Section Showing Resource Classification
| | 11-20 | |
| SSR Mining Inc. | Çöpler Property S-K 1300 Report | February 12, 2024 SLR Project No.: 138.21581.00006 |
| 11.2.10 | Estimation Validation |
The estimate was validated using conventional procedures such as swath
plots (Figure 11-7) and visual validations. The swath plots demonstrate that the kriging results have good agreement with the declustered
composite grade mean and show that there is good spatial correlation with the grade trends across the strike of the deposit.
Figure 11-7: Trend Plot in Y
Direction Showing Raw Sample Grades (Black), 2-m NN-“Declustered” Sample Grades (Blue), and Block OK Grades (Green)
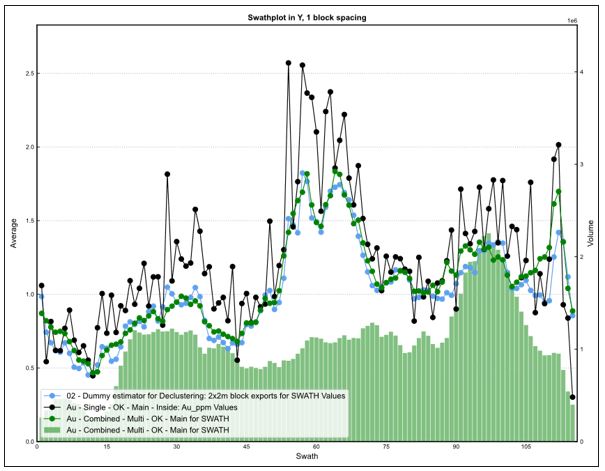
| | 11-21 | |
| SSR Mining Inc. | Çöpler Property S-K 1300 Report | February 12, 2024 SLR Project No.: 138.21581.00006 |
Figure 11-8: Visual Validation
of North-South Section 459,140, Showing Original Topography and Optimized Resource Solid
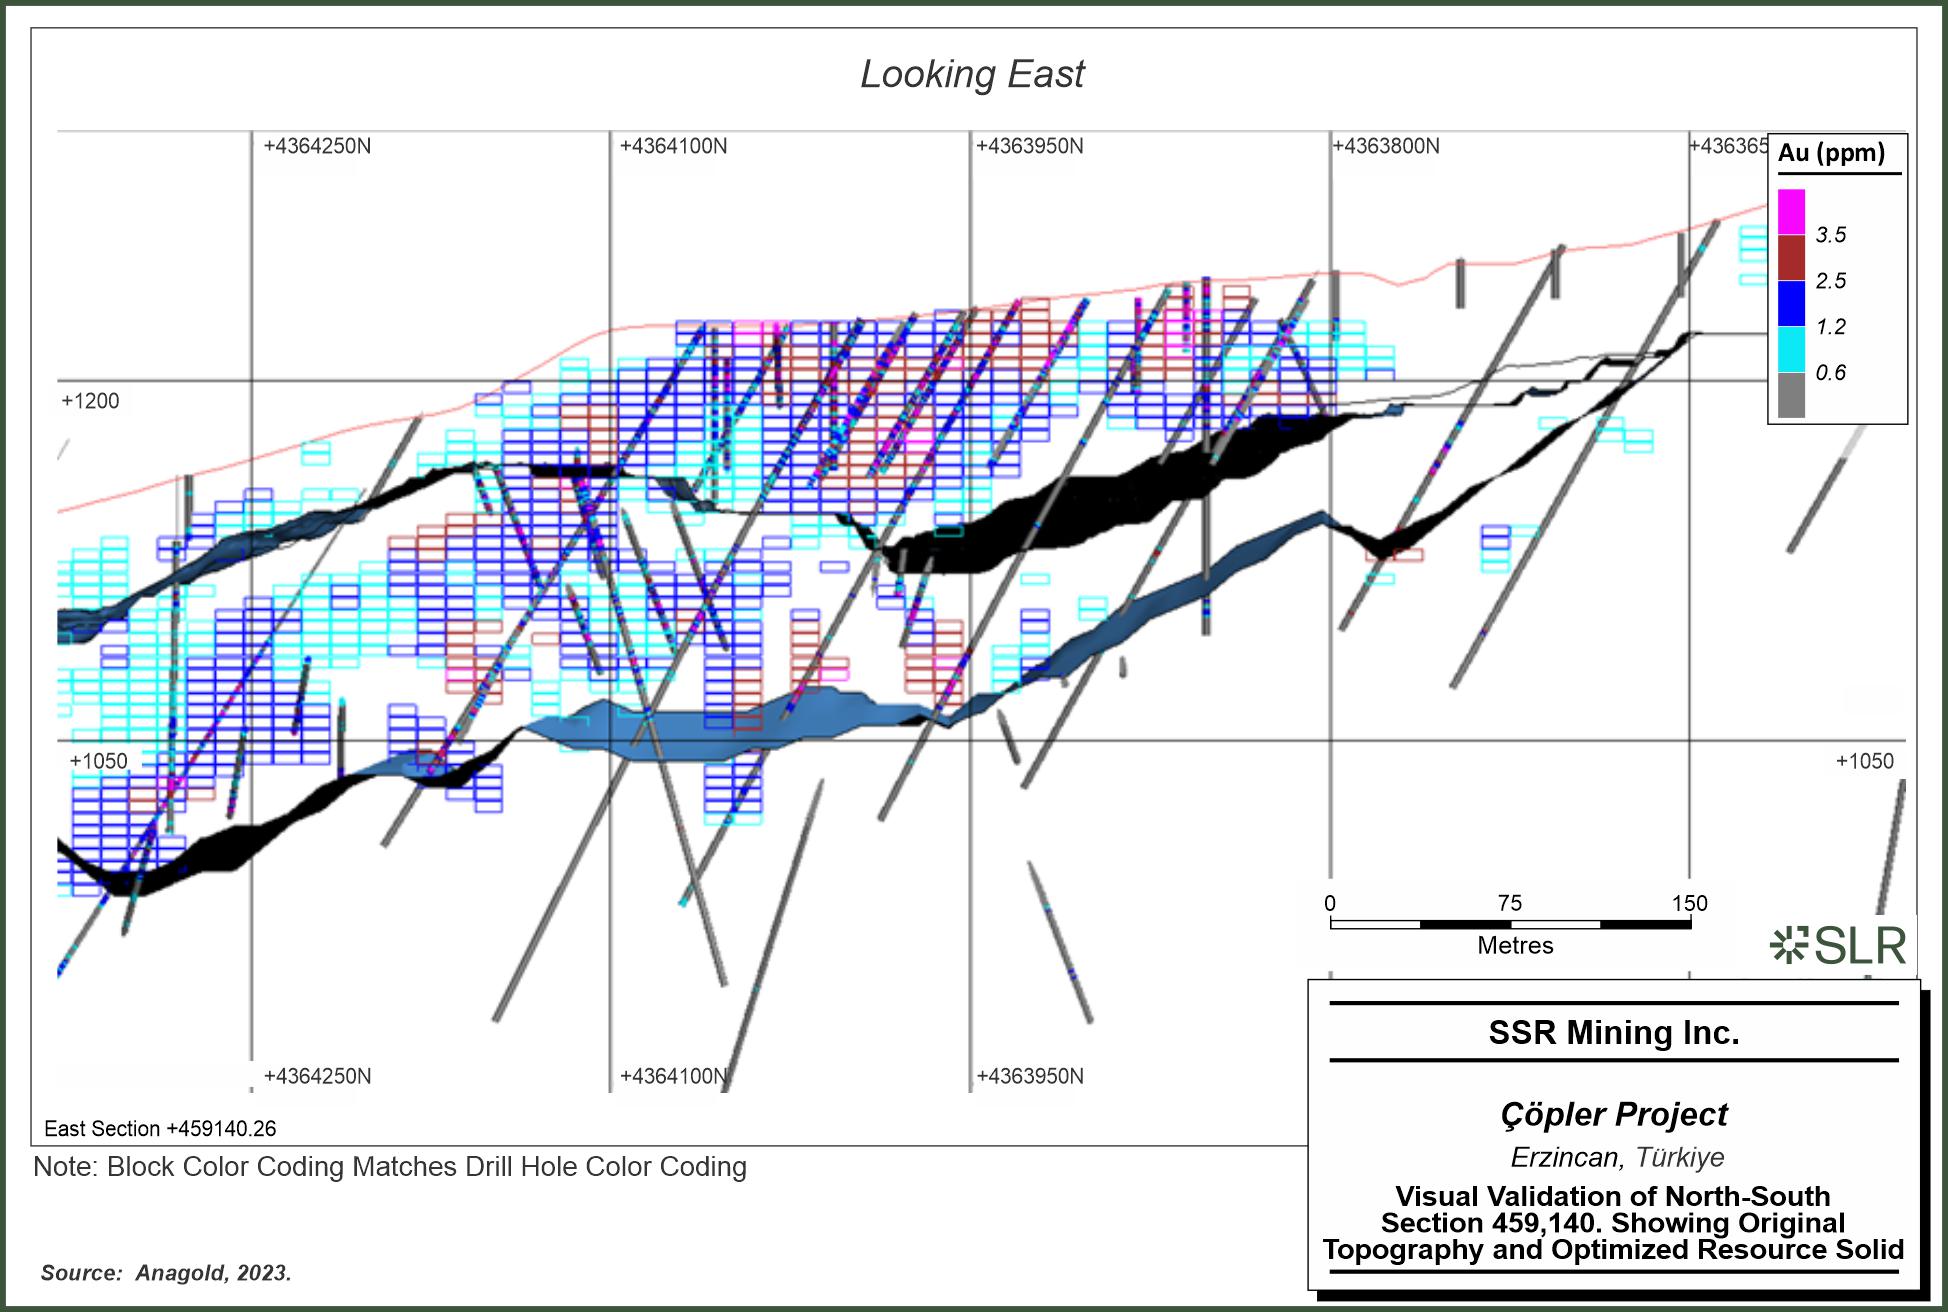
SSR
Mining Inc. Copler Project Erzincan, Turkiye Visual Validation of North-South Section 459,140. Showing Original Topography and Optimized
Resource Solid
| | 11-22 | |
| SSR Mining Inc. | Çöpler Property S-K 1300 Report | February 12, 2024 SLR Project No.: 138.21581.00006 |
| 11.2.11 | Reasonable Prospects for Economic Extraction and Cut-off Grade |
The RSC QP has considered the potential of reasonable prospects for
economic extraction (RPEE) of the Çöpler Mineral Resource. In assessing the potential of economic extraction, the RSC QP has
reviewed mining, metallurgical, economic, environmental, social, and geotechnical factors. Metal prices used for resources and reserves
are based on consensus, long-term forecasts from banks, financial institutions, and other sources. For resources, metal prices used are
higher than those for reserves.
A reporting cut-off grade for the Project based on assumed costs for
open pit extraction through heap leach, grind leach, and POX processing methods and using commodity prices that provide a reasonable basis
for establishing the prospects of economic extraction for Mineral Resources was established and reviewed by the RSC QP.
The Mineral Resource is reported within a conceptual optimised pit shell
using a gold price of US$1,750/oz. The key pit optimization parameters are summarized in Table 11-8.
Portions of the deposit that do not have reasonable prospects for economic
extraction are not included in the Mineral Resource. Future work should seek to decrease the drill spacing, improve sample and analytical
quality control, and improve the estimation domains.
Table 11-8: Summary of Key Parameters
Used in 2023 Conceptual Pit Shell at Çöpler
| Input Area |
Units |
Value |
| Mining Cost |
$/t |
$2.06 |
| Fill Cost |
$/t |
$1.75 |
| Oxide G&A |
$/t |
$4.44 |
| Sulfide G&A |
$/t |
$4.5 |
| CIP G&A |
$/t |
$4.44 |
| Sulfide Process Cost |
$/t |
$35.37 |
| Oxide Process Cost |
$/t |
$13.91 |
| CIP Process Cost |
$/t |
$14.82 |
| Sulfide CAPEX |
$/t |
$1.21 |
| Oxide CAPEX |
$/t |
$2.97 |
| CIL CAPEX |
$/t |
$2.51 |
| Au Price |
$/oz |
$1,750 |
| Ag Price |
$/oz |
$22.00 |
| Cu Price |
$/lb |
$3.95 |
| Oxide Sell Cost |
$/oz |
$6.61 |
| Sulfide Sell Cost |
$/oz |
$6.87 |
| Oxide Royalty |
% |
3.40% |
| Sulfide Royalty |
% |
2.00% |
| | 11-23 | |
| SSR Mining Inc. | Çöpler Property S-K 1300 Report | February 12, 2024 SLR Project No.: 138.21581.00006 |
Recovery parameters for various lithologies are provided in Table 12-3.
| 11.2.12 | Mineral Resource Reporting |
The Mineral Resources were estimated by an independent Qualified Person
employed by consultancy RSC. The Mineral Resource estimate presented in Table 11-9 has an effective date of October 31, 2023.
The RSC QP is not aware of any environmental issues and understands
that social issues are well-managed.
Mineral Resources are not Mineral Reserves and do not have demonstrated
economic viability, nor is there certainty that all or any part of the Mineral Resource estimated here will be converted to Mineral Reserves
through further study. Sources of uncertainty that may affect the reporting of Mineral Resources include sampling or drilling methods,
data processing and handling, geologic modelling, and estimation.
| | 11-24 | |
| SSR Mining Inc. | Çöpler Property S-K 1300 Report | February 12, 2024 SLR Project No.: 138.21581.00006 |
Table 11-9: Summary of Çöpler
Mineral Resources exclusive of Mineral Reserves
| Resource Category |
Type |
Total Mineral Resources |
SSR Attributed Basis |
SSR Attributed Mineral Resources (80%) |
NSR Cut-off Values |
Rec |
| Tonnage |
Grade |
Contained Metal |
Tonnage |
Grade |
Contained Metal |
| Au |
Ag |
Cu |
Au |
Ag |
Cu |
Au |
Ag |
Cu |
Au |
Ag |
Cu |
| (Mt) |
(g/t) |
(g/t) |
(%) |
(koz) |
(koz) |
(Klb) |
(%) |
Mt) |
(g/t) |
(g/t) |
(%) |
(koz) |
(koz) |
(Klb) |
($/t) |
(%) |
| Measured |
Oxide Heap Leach |
0.01 |
0.15 |
21.26 |
0.91 |
0 |
10 |
297 |
80 |
0.0 |
0.15 |
21.26 |
0.91 |
0 |
8 |
237 |
18.34 |
40 - 78 |
| |
Sulfide |
4.6 |
1.37 |
4.10 |
0.08 |
202 |
606 |
7,794 |
80 |
3.7 |
1.37 |
4.10 |
0.08 |
162 |
484 |
6,235 |
39.87 |
81 - 91 |
| |
Oxide Grind Leach CIL |
1.7 |
1.14 |
1.09 |
0.08 |
62 |
59 |
3,108 |
80 |
1.3 |
1.14 |
1.09 |
0.08 |
49 |
47 |
2,486 |
19.26 |
53 - 90 |
| Total Measured |
Total |
6.3 |
1.31 |
3.33 |
0.08 |
264 |
675 |
11,199 |
80 |
5.0 |
1.31 |
3.33 |
0.08 |
211 |
540 |
8,959 |
|
|
| Indicated |
Oxide Heap Leach |
0.0 |
0.06 |
113.13 |
0.36 |
0 |
14 |
31 |
80 |
0.0 |
0.06 |
113.13 |
0.36 |
0 |
11 |
25 |
18.34 |
40 - 78 |
| |
Sulfide |
13.2 |
1.28 |
3.42 |
0.07 |
546 |
1,454 |
19,413 |
80 |
10.6 |
1.28 |
3.42 |
0.07 |
437 |
1,163 |
15,530 |
39.87 |
81 - 91 |
| |
Oxide Grind Leach CIL |
0.7 |
1.41 |
1.95 |
0.04 |
30 |
42 |
654 |
80 |
0.5 |
1.41 |
1.95 |
0.04 |
24 |
34 |
523 |
19.26 |
53 - 90 |
| Total Indicated |
Total |
13.9 |
1.29 |
3.38 |
0.07 |
577 |
1,510 |
20,098 |
80 |
11.1 |
1.29 |
3.38 |
0.07 |
461 |
1,208 |
16,079 |
|
|
| Total Measured + Indicated |
Oxide Heap Leach |
0.0 |
0.13 |
40.54 |
0.80 |
0 |
24 |
328 |
80 |
0.0 |
0.13 |
40.54 |
0.80 |
0 |
20 |
263 |
18.34 |
40 - 78 |
| |
Sulfide |
17.8 |
1.31 |
3.59 |
0.07 |
749 |
2,059 |
27,207 |
80 |
14.3 |
1.31 |
3.59 |
0.07 |
599 |
1,647 |
21,766 |
39.87 |
81 - 91 |
| |
Oxide Grind Leach CIL |
2.4 |
1.22 |
1.34 |
0.07 |
92 |
101 |
3,762 |
80 |
1.9 |
1.22 |
1.34 |
0.07 |
74 |
81 |
3,009 |
19.26 |
53 - 90 |
| Total M + I |
Total |
20.2 |
1.29 |
3.36 |
0.07 |
841 |
2,185 |
31,297 |
80 |
16.2 |
1.29 |
3.36 |
0.07 |
673 |
1,748 |
25,037 |
|
|
| Inferred |
Oxide Heap Leach |
0.0 |
0.00 |
0.00 |
0.00 |
0 |
0 |
0 |
80 |
0.0 |
0.00 |
0.00 |
0.00 |
0 |
0 |
0 |
18.34 |
40 - 78 |
| |
Sulfide |
15.8 |
1.53 |
5.13 |
0.08 |
779 |
2,607 |
27,657 |
80 |
12.6 |
1.53 |
5.13 |
0.08 |
623 |
2,086 |
22,125 |
39.87 |
81 - 91 |
| |
Oxide Grind Leach CIL |
1.7 |
1.45 |
3.01 |
0.01 |
81 |
169 |
278 |
80 |
1.4 |
1.45 |
3.01 |
0.01 |
65 |
135 |
223 |
19.26 |
53 - 90 |
| Total Inferred |
Total |
17.5 |
1.53 |
4.92 |
0.07 |
860 |
2,776 |
27,935 |
80 |
14.0 |
1.53 |
4.92 |
0.07 |
688 |
2,220 |
22,348 |
|
|
Notes:
| 1. | The definitions for Mineral Resources in S-K 1300 were followed. |
| 2. | Mineral Resources are reported based on October 31, 2023 topography surface. |
| 3. | Mineral Resources are reported exclusive of Mineral Reserves. |
| 4. | The Mineral Resource estimates are presented at both a 100% Project level and SSR’s 80% attributable share. |
| 5. | Heap Leach Oxide is defined as material <2% total sulfur. |
| 6. | Grind Leach Oxide is defined as material <2% total sulfur. Processing route will be available approximately in 2027. |
| | 11-25 | |
| SSR Mining Inc. | Çöpler Property S-K 1300 Report | February 12, 2024 SLR Project No.: 138.21581.00006 |
| 7. | Sulfide is defined as material ≥2% total sulfur. |
| 8. | Heap leach oxide uses a NSR cut-off $18.34/t, grind leach oxide uses a NSR cut-off value $19.26/t, and Çöpler sulfide
ore uses a cut-off grade of $39.87/t, Greater Çakmaktepe sulfide ore uses a cut-off grade of $44.37/t . All cut-off values include
allowances for royalty payable. |
| 9. | Metallurgical gold recovery for heap leach oxide and grind leach varies between 40-78% and 53-90%, respectively, based on lithology;
metallurgical recovery for sulfide varies between 81% and 91% based on lithology. |
| 10. | Metallurgical silver recoveries for heap leach and grind leach oxide varies between 0 and 54% based on lithology. Metallurgical recovery
for sulfide varies between 0 and 3%. |
| 11. | Metallurgical copper recoveries for heap leach and grind leach oxide varies between 0 and 15% based on lithology. Metallurgical recovery
for sulfide is 0%. |
| 12. | Metal prices used to report the Mineral Resources are $1,750/oz Au, $22.00/oz Ag, and $3.95/lb Cu with allowances for payability,
deductions, transport, and royalties. |
| 13. | The point of reference for Mineral Resources is the point of feed into the processing facility for grind leach and sulfide material;
or for Heap Leach oxide, it is the Carbon columns. |
| 14. | All Mineral Resources estimates were constrained within conceptual pit shells to meet reasonable prospects for economic extraction
criteria. |
| 15. | Mineral Resources that are not Mineral Reserves do not have demonstrated economic viability. |
| 16. | Totals may vary due to rounding. |
| | 11-26 | |
| SSR Mining Inc. | Çöpler Property S-K 1300 Report | February 12, 2024 SLR Project No.: 138.21581.00006 |
| 11.2.13 | Comparison with Previous Estimates |
The 2023 Mineral Resource exclusive of Mineral Reserves has been compared
with previous Mineral Resource estimate as reported in SSR’s 2022 Form 10-K filing (SSR, 2022).
There has been a decrease in Measured and Indicated contained gold ounces
of 1,155 koz and a decrease in Inferred gold ounces of 1,710 koz. The change can be attributed due to the following:
| · | Re-interpretation of the mineralized envelopes using the most updated drill hole, blasthole, and geological mapping information |
| · | Change to optimization parameters with regards to processing methodology |
| | 11-27 | |
| SSR Mining Inc. | Çöpler Property S-K 1300 Report | February 12, 2024 SLR Project No.: 138.21581.00006 |
In contrast to the previous model, the 2023 model for Greater Çakmaktepe
contains the Çakmaktepe and Çakmaktepe Ext deposits within a single model.
The digital drill hole data used in the Greater Çakmaktepe MRE
are from the various drilling campaigns that have taken place at the deposits since 2002. All data were validated and reviewed, where
possible, 13 drillholes totalling to 1,770 m were excluded from estimation due to core recovery issues, duplication of holes and drillholes
drilled for other reasons. A summary of the informing drill hole data is presented in Table 11-10.
All numerical data were transferred to implicit modeling software as
csv files. Below-detection values were replaced by two-thirds of the detection limit after they had been imported into the implicit modeling
software.
Previous wireframes from 2016, 2017, and 2020 resource estimation campaigns
were also loaded to allow comparisons.
Both pre-mining surface and post-mining surface Digital Terrain Models
were loaded into the 3D modeling workspace. All modeling was clipped against the pre-mining surface, with the post-mining surface used
to reconcile estimates against production data.
Table 11-10: Summary of Drill
Hole Data Informing Greater Çakmaktepe MRE
| Drill Type |
No. of Holes |
Total Drill Metres |
| DD |
1,348 |
221,433.75 |
| RC |
529 |
51,490.50 |
| RCD |
52 |
14,060.70 |
| Total |
1,933 |
287,866.75 |
| 11.3.2 | Geological Interpretation |
| 11.3.2.1 | Primary Lithologies |
The four primary rock types modeled at Çakmaktepe are carbonates
(limestone and dolomite), siliciclastic/volcaniclastic sediments, ultramafics (ophiolite and serpentinite), and intrusives (diorite).
The Çakmaktepe area was modeled as a rollover/stack on a ramp-flat
stacked thrust system, with the ophiolite obduction over and across the carbonate rocks and sediments, and later intruded by diorites.
The three main thrust planes causing this geometry are shown in thick red lines in Figure 11-9.
Other thrust planes depicted are conceptual and not relevant at the
resolution of the model. Thrust planes are also identified at Çakmaktepe Ext; however, it has not resulted in stacking and forelimb–backlimb
geometries.
| | 11-28 | |
| SSR Mining Inc. | Çöpler Property S-K 1300 Report | February 12, 2024 SLR Project No.: 138.21581.00006 |
Figure 11-9: Greater Çakmaktepe
Section Showing Geometries Created by Thrusting
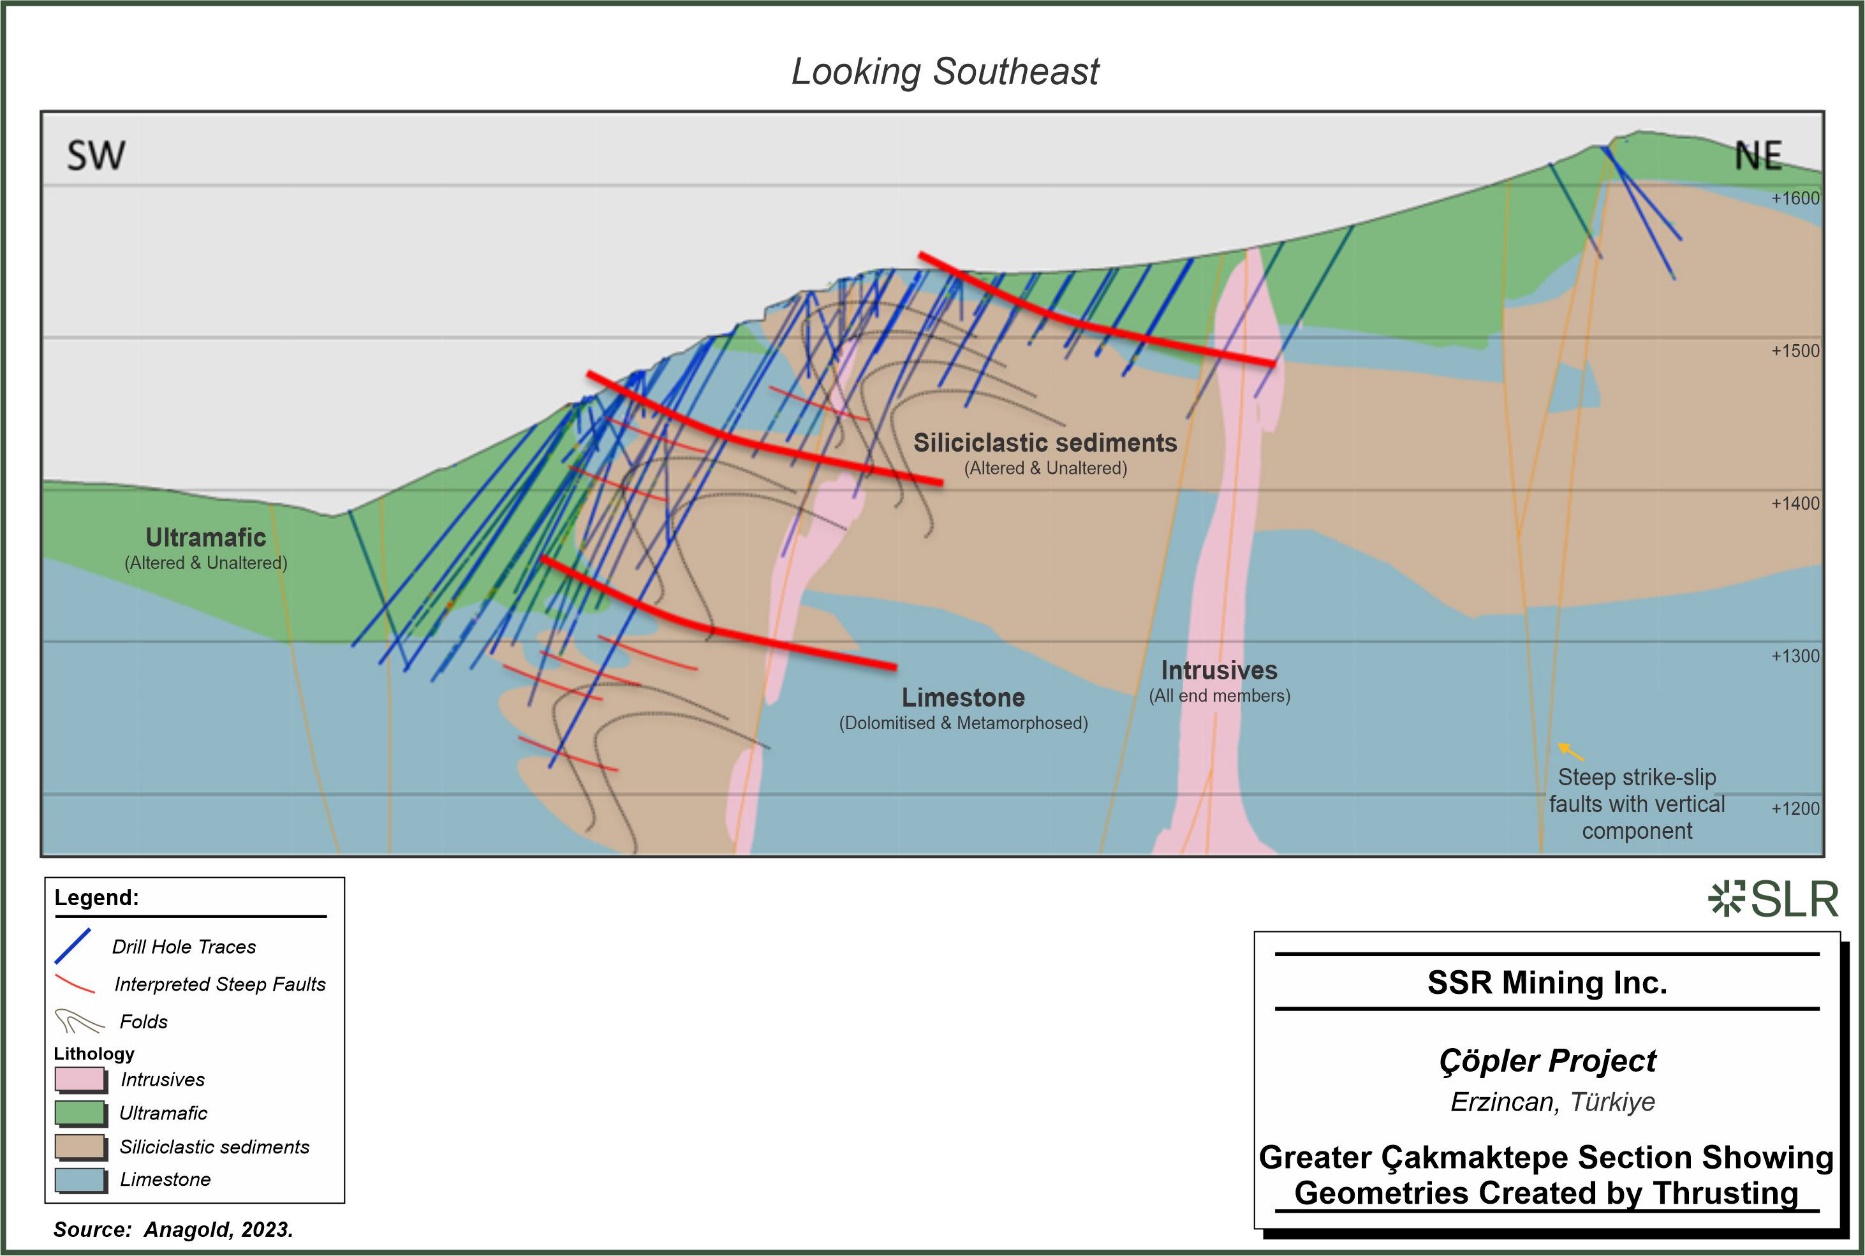
SSR
Mining Inc. Copler Project Erzincan, Turkiye Greater Cakmaktepe Section Showing Geometries Created by Thrusting
| | 11-29 | |
| SSR Mining Inc. | Çöpler Property S-K 1300 Report | February 12, 2024 SLR Project No.: 138.21581.00006 |
All geological domains were modeled implicitly, with additional steering
and refinement by applying anisotropy (following a SE–NW control along low-angle thrust planes created by the ophiolite obduction)
or with manual manipulation, where required to achieve the desired outcomes. Domains were iteratively refined for faults and shears. Particularly,
two key faults (Çakmaktepe South Fault and Bayramdere NE Fault) were adjusted based on the diorite, which has intruded along these
faults.
| 11.3.2.2 | Secondary Lithologies |
Further sub-domaining was undertaken to consider secondary processes.
Listwanites form as a result of the chemical reaction between serpentinite
and CO2-rich fluids. These fluids usually migrate along faults or fractures along the contact of serpentinite and the adjacent
country rocks. Following the creation of the primary lithological architecture, listwanite alteration of the ultramafic rocks was modeled
within the constraints of the ultramafic domain using a geochemical cut-off of 12% Mg, with the distribution of Mg being perfectly bimodal
with ‘Unaltered’ and ‘Altered’ end members (Figure 11-10). This created a realistic ‘skin’ alteration
halo honoring this genetic model.
Within the carbonate unit, a similar process to that used for listwanite
was used to model dolomite, with a Mg grade cut-off of 7%.
The jasperoids are an important alteration that controls high gold grades.
The silica-sulfide metasomatism of dolomites has formed discrete gossan horizons anastomosing through the carbonate unit. These were modeled
implicitly, with minor manual manipulation used to achieve acceptable outcomes.
Figure 11-10: Distribution of
Mg within Rocks Classified as Ultramafic (left) and Carbonates (right)
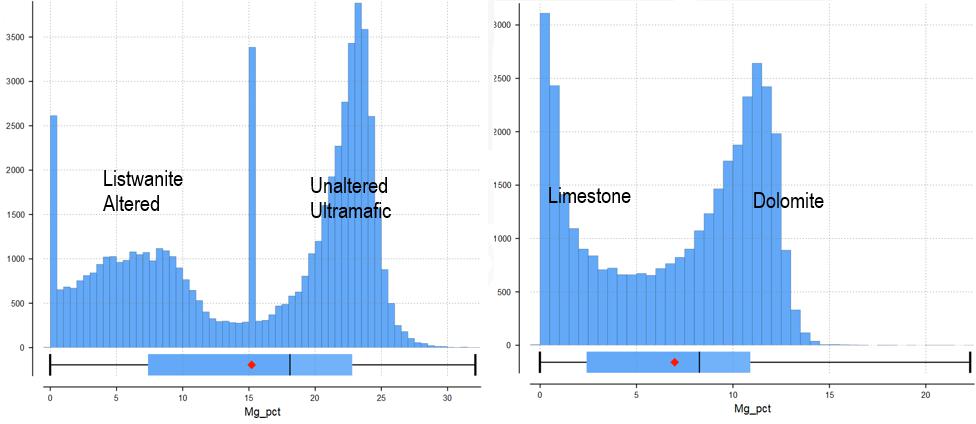
Notes: The single stick in the middle of the ultramafics (left image)
is an upper-detection limit issue with an older assay technique.
The oxide/sulfide domains are contained in a separate geological model.
Modeling for oxidation was carried out using the logging codes. The final oxidation categories have good contrast with the sulfur grades.
Oxide and sulfur domains were modeled using an intrusion algorithm which provided good results that were generally consistent with the
geologists’ interpretations.
| | 11-30 | |
| SSR Mining Inc. | Çöpler Property S-K 1300 Report | February 12, 2024 SLR Project No.: 138.21581.00006 |
It is important to note that the mining and metallurgical departments
consider material below 2% S to be categorised as “oxidized” and above 2% as “sulfide”, whereas the geologists’
logging and the geological relationships indicate the oxidation front to be better represented by a lower value (between 0.2 and 0.6%
S, depending on rock type).
| 11.3.3 | Estimation Domain Interpretation |
| 11.3.3.1 | Greater Çakmaktepe Estimation Domaining |
At Çakmaktepe, geological and numerical data have been reviewed
together in order to develop robust estimation domains. The domain-building process was iterative and geological and numerical data have
both been used to build, validate, and adjust any domains.
Mineralization follows the lithological contacts and the stacked thrust
geometries; mineralization is controlled by structural fluid pathways, and traps controlled by lithological contacts, in typical replacement-style
processes (e.g. jasperoid and listwanite as main hosts for Au), rather than being constrained by relatively discrete fault or shear zones
characteristic of epithermal-style mineralization. Mineralization does not appear to have any vertical continuation down-dip from a steep
conduit structure (Figure 11-11). This has important implications for the estimation domaining strategy.
| | 11-31 | |
| SSR Mining Inc. | Çöpler Property S-K 1300 Report | February 12, 2024 SLR Project No.: 138.21581.00006 |
Figure 11-11: Section Showing
Mineralization Limited by Steep Conduit Structure
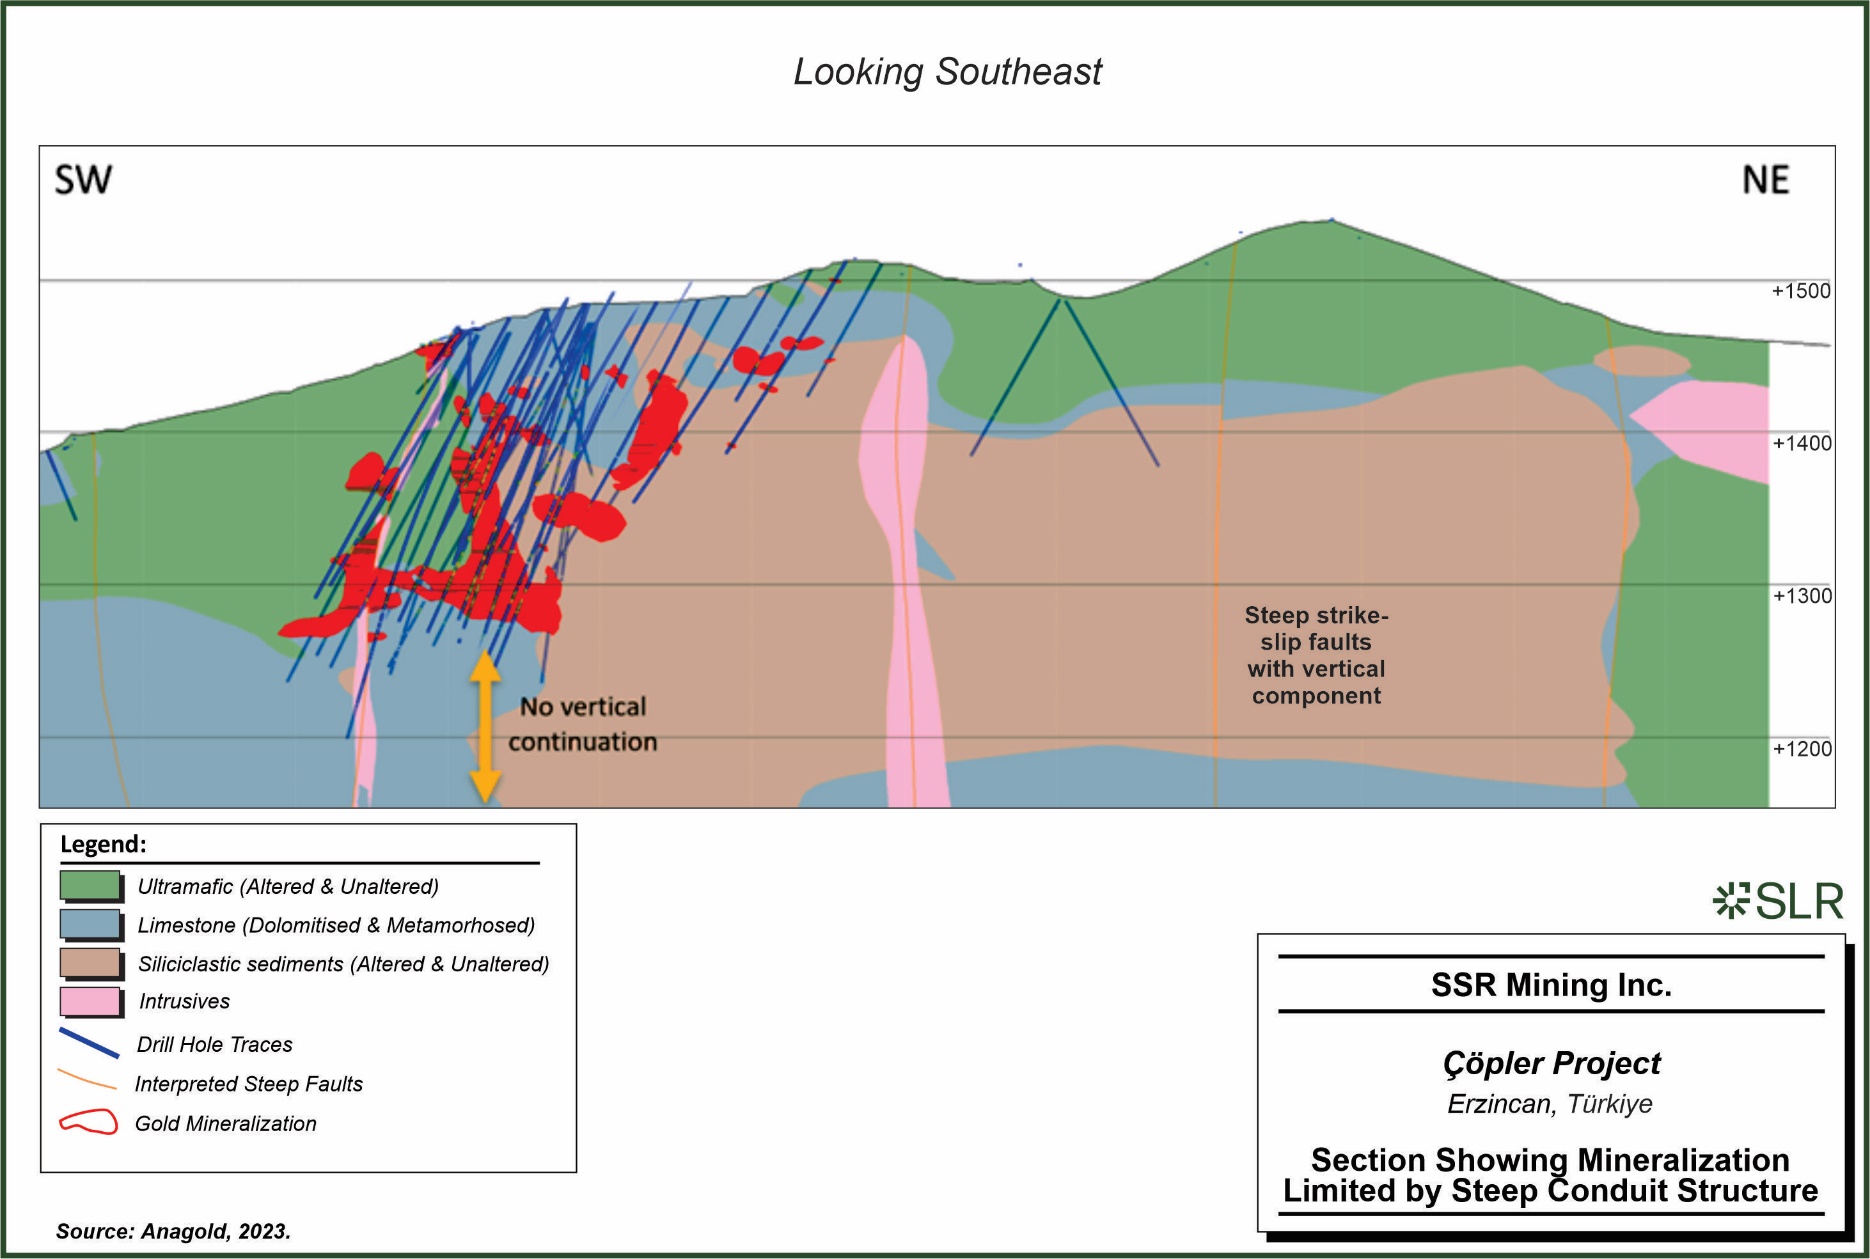
SSR
Mining Inc. Copler Project Erzincan, Turkiye Section Showing Mineralization Limited by Steep Conduit Structure
| | 11-32 | |
| SSR Mining Inc. | Çöpler Property S-K 1300 Report | February 12, 2024 SLR Project No.: 138.21581.00006 |
Two steep faults (coined the Cross Fault and Çakmaktepe North
Fault) play a role as conduits for mineralization at Greater Çakmaktepe. Both faults are intruded by diorites. The Cross Fault,
in particular, has gold mineralization associated with it and bisects the Çakmaktepe North deposit.
The Bayramdere Fault and the Ilic-Yakuplu Faults are regarded as confining
the broader Greater Çakmaktepe deposit area to the northwest and southeast, respectively. These faults, along with the Cross Fault
and Çakmaktepe North Fault, are all considered first-order structures. Some smaller steep faults in the area have an important
purpose in ‘redirecting’ mineralization.
The mineralization often shows fairly “hard” boundaries
where ultramafic rocks have been altered to listwanite, but shows more diffuse and gradational contacts into the jasperoid-metasomatosed
carbonate rocks (Figure 11-12). In particular, there are large parts within the listwanite domain that are not mineralized. At the
same time, the jasperoid geological domains needed to be honored as these are controlling the high-grade mineralization. However, as these
domains are very thin, often discontinuous, representing a gradational hydrothermal process, a higher-grade shell approach was used to
represent this jasperoid metasomatism.
The resulting estimation domains are therefore a combination of a “primary
control”, modeled by a grade-based “vein” model, within which a nested indicator interpolant defines the higher grade
jasperoid mineralization. This is supported by a full boundary analysis which shows that a 0.2 g/t Au grade cut-off generates a relatively
hard contact. The contact analysis for the selected 0.2 g/t Au grade cut-off at Greater Çakmaktepe is presented in Figure 11-13.
As both the high- and low-grade domains represent different controls
on mineralization, they are treated as hard boundaries and samples from across domain boundaries do not influence the block estimate.
Estimation domains were also reviewed beyond the control of the jasperoid
domain, to determine whether rock type or oxidation caused different grade distributions and whether they would warrant separate estimation;
however, the grade distributions were consistent and further estimation domaining was not required.
| | 11-33 | |
| SSR Mining Inc. | Çöpler Property S-K 1300 Report | February 12, 2024 SLR Project No.: 138.21581.00006 |
Figure 11-12: Strip Logs showing
Relationship of Geology, Assays, and Estimation Domains for Greater Çakmaktepe
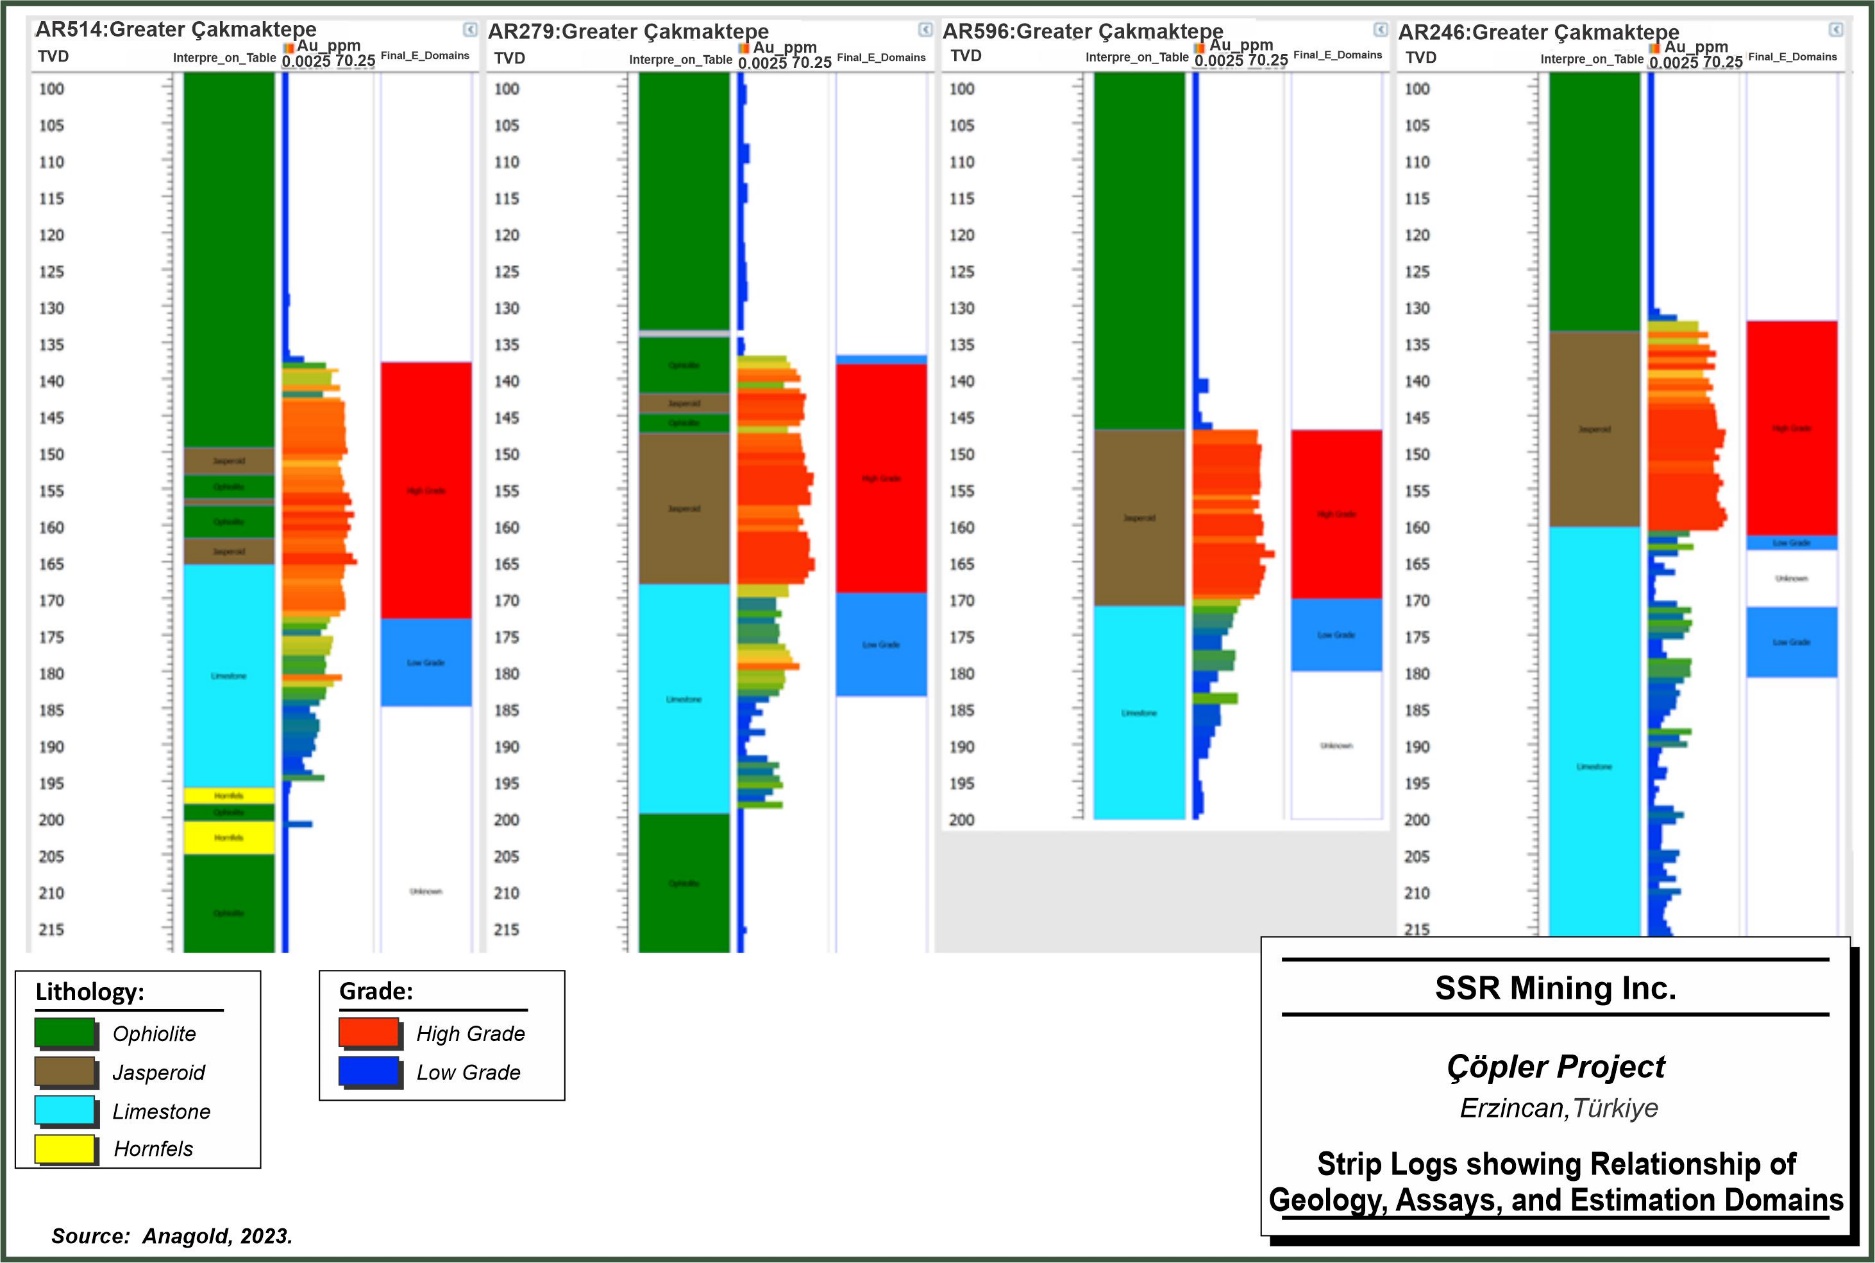
SSR
Mining Inc. Copler Project Erzincan, Turkiye Strip Logs showing Relationshp of Geology, Assays, and Estimation Domains
| | 11-34 | |
| SSR Mining Inc. | Çöpler Property S-K 1300 Report | February 12, 2024 SLR Project No.: 138.21581.00006 |
Figure 11-13: Boundary Analysis
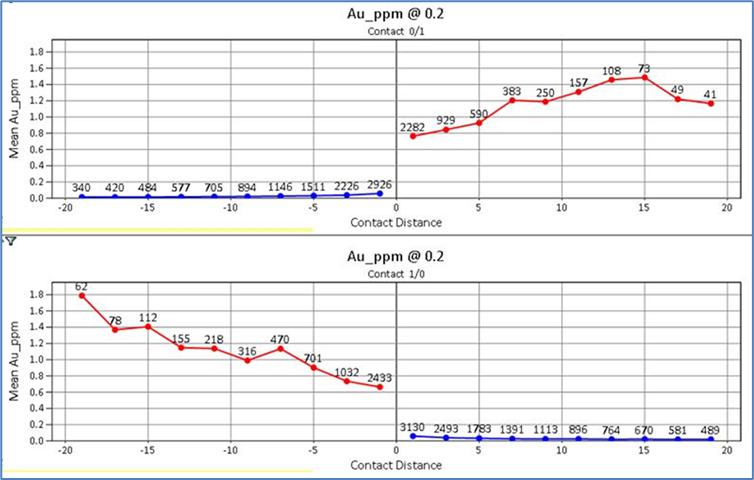
As the deposit has been well drilled and closed off in most directions,
there is little risk due to extrapolation assumptions. The inherent settings in the indicator domains mean that the key estimation domains
have not been extended to more than roughly half the drill spacing, which in most cases is 25 m.
| 11.3.3.3 | Alternative Interpretations and Risk in Domaining |
Given the relatively high density of drilling of the deposit, and regardless
of the high-level structural interpretation of the deposit, it is anticipated that the overall risk on the total tonnages and grades associated
with alternative interpretations of the geological model does not exceed ±10%. This number should be broadly interpreted as the
impact on either tonnes or grade, either positive or negative, due to factors related to geological interpretation and domaining.
The data informing the MRE are from RC and diamond core drilling. The
samples resulting from each of these drilling techniques have a different sample support, which leads to a difference in variance in the
data used in estimation. A comparison between RC and DD drilling showed that difference to be small, with coefficients of variations (CV)
of 4.0 and 4.5, respectively. Notwithstanding a small potential bias issue between RC and diamond sampling (Section 8.3.4.2), this is
an acceptable difference in variance for the purpose of resource classification.
| | 11-35 | |
| SSR Mining Inc. | Çöpler Property S-K 1300 Report | February 12, 2024 SLR Project No.: 138.21581.00006 |
Differences in sample support also occur due to different sample lengths.
The predominant part of the samples (81%) has been sampled at one metre lengths. Of those intervals that are longer than one metre, most
samples have grades below the grade cut-off. Only a small percentage of samples are of intervals larger than 1.3 m and with grades higher
than the cut-off grade. Ultimately, one metre was selected as the composite interval. Testing of 2.5 m composites did not significantly
improve the kriging metrics.
The impact of core loss on the compositing algorithm was also considered.
The 50% minimum coverage function leads to a discrepancy between total composite and total assay lengths, which demonstrates the significant
impact of core loss on the integrity of this process (Table 11-11). Compositing was carried out within hard boundaries and residual
sample lengths were distributed equally along the hole where they were less than 30 cm.
Table 11-11: Compositing Statistics
in Au HG domain
| |
Count |
Length |
Mean |
SD |
CV |
Variance |
Min |
Q1 |
Q2 |
Q3 |
Max |
| Composited |
15,405 |
15,102 |
2.63 |
2.99 |
1.14 |
8.94 |
0.005 |
0.98 |
1.72 |
3.17 |
52.8 |
| Uncomposited |
14,970 |
15,061 |
2.63 |
3.16 |
1.2 |
9.99 |
0.0025 |
0.87 |
1.69 |
3.18 |
52.8 |
| 11.3.5 | Exploratory Data Analysis |
Following estimation domaining and compositing, the statistics for the
domains were evaluated further. The CV of the composites within the combined high-grade and low-grade domain is 1.78, which indicates
a fairly low/moderate skewedness for a gold deposit (Figure 11-14). The CV in the high-grade (HG) and low-grade (LG) domains is 1.16
and 1.92, respectively.
Figure 11-14: Log-histogram
of Composites within the LG (left) and HG (right) Domains
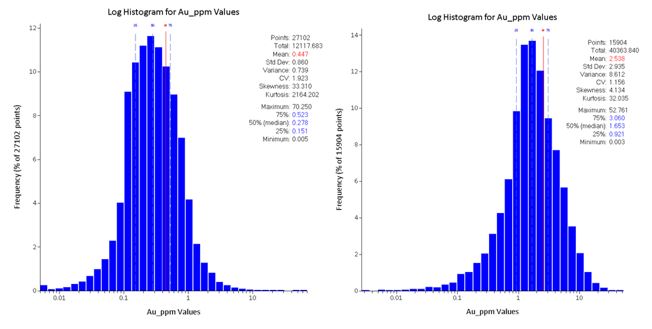
| | 11-36 | |
| SSR Mining Inc. | Çöpler Property S-K 1300 Report | February 12, 2024 SLR Project No.: 138.21581.00006 |
| 11.3.6 | Treatment of High-Grade Assays |
Where the assay distribution is skewed positively or approaches log-normal,
erratic high grade assay values can bias the estimation of a block. One method of treating these outliers to reduce their influence on
the average grade is to cut or cap them at a specific grade level.
At Greater Çakmaktepe, global grade capping has not been applied.
| 11.3.6.2 | High Grade Restriction |
An alternative approach to reducing the influence of high-grade composites
is to restrict the influence of high-grade samples during the estimation process. The threshold grade levels and buffer distances were
selected from the basic statistics and from visual inspection of the apparent continuity of very high grades within each estimation domain.
In the LG domain, a minor distance-buffered grade capping was applied, to ensure that small stray high-grade samples in this domain do
not unduly influence blocks at large distances.
Given the low amount of grade outliers and the relatively low grade
of these, model sensitivity testing confirms that the extent of the grade cap has a very low impact on project risk.
Experimental variograms were created for the estimation domains. The
estimation domain was reduced to a smaller area in which the orientation of mineralization did not change much, to allow a more robust
experimental variography analysis, resulting in ~2,400 composites. In analysing the experimental variography, mineralization grade continuity
at Greater Çakmaktepe is interpreted as broadly consistent in terms of the controls and statistically, for the strict purpose of
variography modeling.
The experimental directional variograms are reasonably consistent, showing
short and maximum ranges of approximately 50 m and 100 m in the direction of maximum continuity, and 75 m and 40 m, respectively, in the
semi-major direction. The γ0 was derived from the downhole variogram on 1-m composited exploration data without grade
caps and provides a robust estimate of the variance at zero distance (0.11). The models are presented in Figure 11-15.
Since the mineralization is heavily controlled by the orientation of
the lithological contacts, the search ellipse at each block needs to be appropriately oriented. Simplified trend planes, extracted from
the vein domains (that were used to create primary mineralization constraints) were used as variable orientations (dynamic anisotropy)
during the estimation process.
| | 11-37 | |
| SSR Mining Inc. | Çöpler Property S-K 1300 Report | February 12, 2024 SLR Project No.: 138.21581.00006 |
Figure 11-15: Experimental and
Modeled Variograms
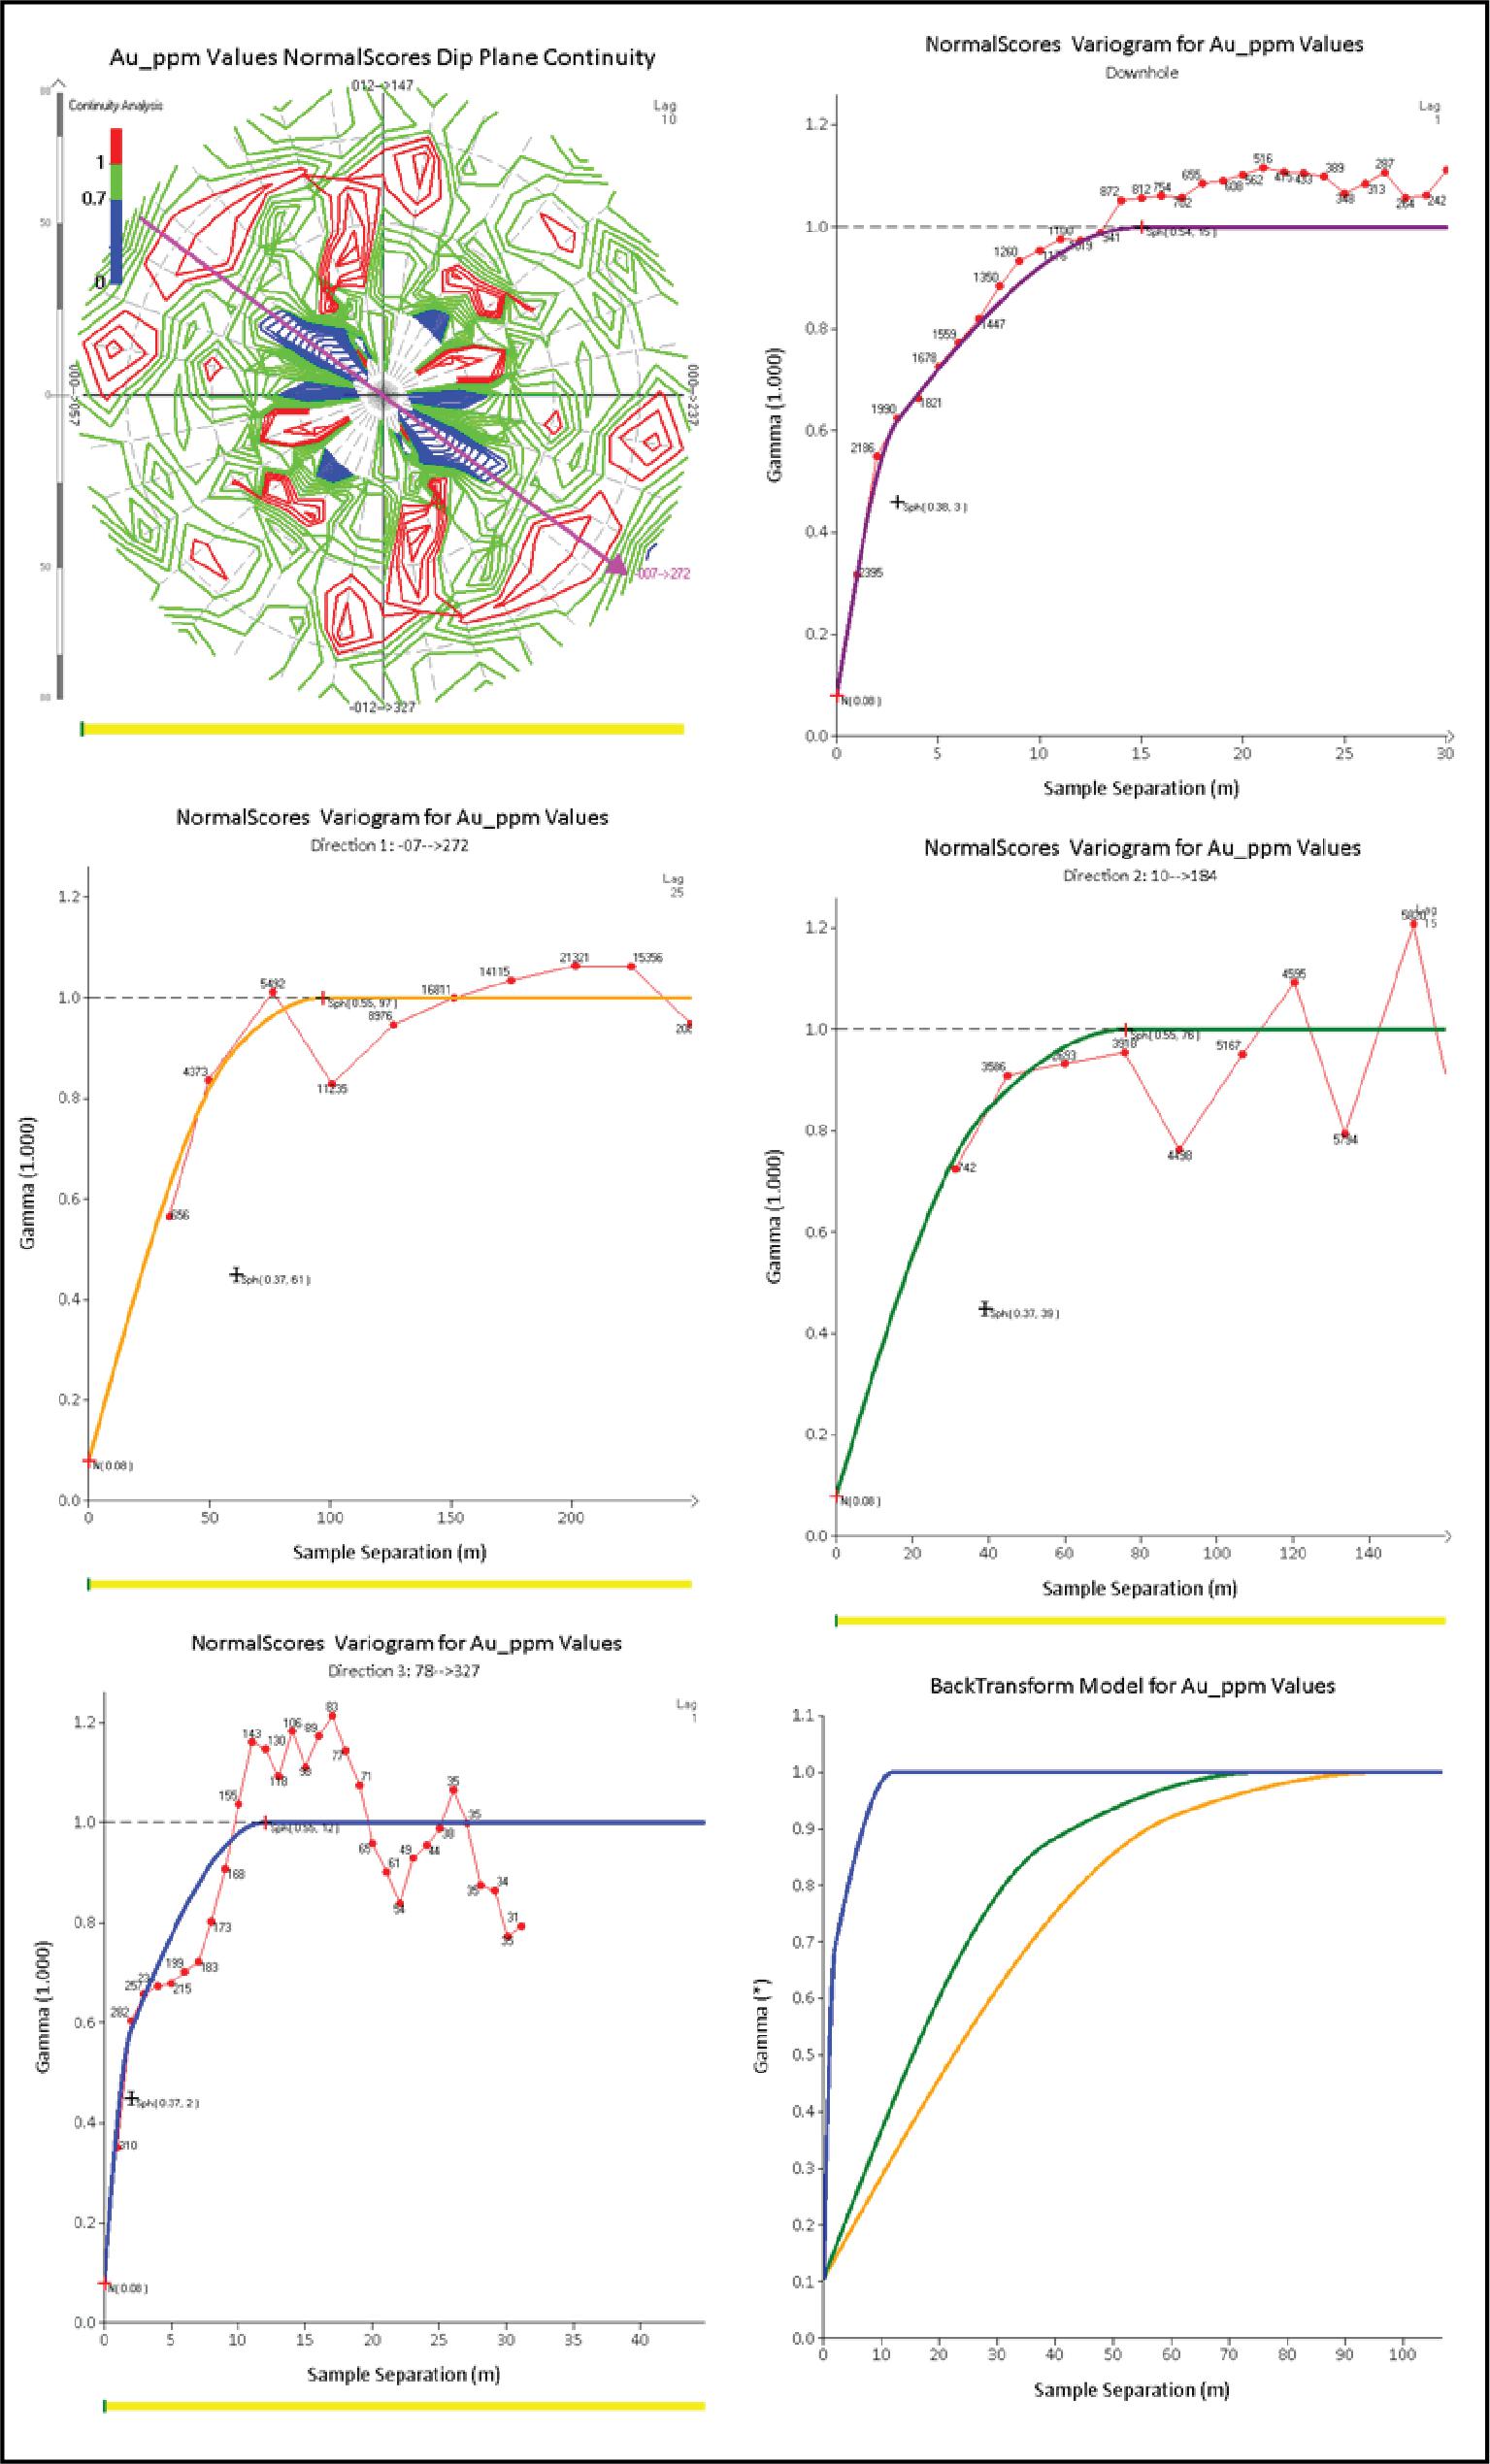
| | 11-38 | |
| SSR Mining Inc. | Çöpler Property S-K 1300 Report | February 12, 2024 SLR Project No.: 138.21581.00006 |
| 11.3.8 | Search Strategy and Grade Estimation Parameters |
The block model covers the entire geological model area and has 12 m
x 12 m x 5 m parent blocks in the X, Y, Z directions, respectively (Table 11-12). A study on optimal block size was undertaken, and
the final size was selected based on the weighted average of kriging statistics in high-metal blocks. The block model is sub-blocked to
3 m x 3 m x 5 m to provide volume resolution. Discretization was set to 4 x 4 x 5 points.
Table 11-12: Greater Çakmaktepe
Block Model Description
| Parameter |
X |
Y |
Z |
| Parent Block Size (m) |
12 |
12 |
5 |
| Sub-block Size (m) |
3 |
3 |
5 |
| Sub block Divisions |
4 |
4 |
1 |
| Minimum parent centroid |
462,716 |
4,364,876 |
837.5 |
| Maximum parent centroid |
464,912 |
4,367,672 |
1,727.5 |
| Minimum corner |
462,710 |
4,364,870 |
835 |
| Maximum corner |
464,918 |
4,367,678 |
1730 |
| Size (blocks) |
184 |
234 |
179 |
| Azimuth (°) |
0 |
|
|
| Dip (°) |
0 |
| Pitch (°) |
0 |
Gold
Ordinary kriging estimates were run separately in three domains: the
HG and LG domains, and the “outside” domain. Data were interpolated in the mineralized domains using a single 150 m x 100
m x 25 m search ellipse to select samples and using a minimum of four and maximum of 35 samples, into parent blocks discretized at 4 x
4 x 5 points. Blocks estimated by a low number of samples are assigned a lower confidence in the classification of the resource. Estimation
in the outside domain picks up stray intercepts that were not domained and uses a very tight estimation search so as not to smear grades.
All estimation settings are summarized in Table 11-13.
Because of the low nugget in the variogram, there were a few negative
kriging weights, which in some minor blocks have led to negative gold grades. For these blocks, and for those blocks with a total sum
of negative weights below -0.2, the OK estimate was overwritten by an inverse distance algorithm. This has a negligible impact.
| | 11-39 | |
| SSR Mining Inc. | Çöpler Property S-K 1300 Report | February 12, 2024 SLR Project No.: 138.21581.00006 |
Table 11-13: Kriging Neighbourhood
and Variography Settings for Au Domains
| |
Au HG |
Au LG |
Outside |
| CV |
1.14 |
1.9 |
5.19 |
| Mean |
2.59 |
0.45 |
0.03 |
| Min samples |
4 |
4 |
8 |
| Max Samples |
35 |
35 |
35 |
| Outlier Dist |
N/A |
15 |
1.25 |
| Outlier Cap |
N/A |
20 |
20 |
| Major Search |
150 |
150 |
25 |
| Semi-Major Search |
100 |
100 |
25 |
| Minor Search |
25 |
25 |
5 |
| Nugget |
0.1 |
0.1 |
0.1 |
| J1 |
0.5 |
0.45 |
0.3 |
| Major Range |
40 |
40 |
25 |
| Semi Range |
20 |
35 |
15 |
| Minor Range |
2 |
3 |
3 |
| 2nd Major Range |
100 |
110 |
130 |
| 2nd Semi Range |
75 |
65 |
65 |
| 2nd Minor Range |
12 |
7 |
13 |
| Var Dir 1 |
272 |
337 |
262 |
| Var Dir 2 |
4 |
247 |
353 |
| Var Dir 3 |
147 |
147 |
133 |
Silver and Copper
Silver and copper were estimated into numeric indicator interpolant
domains and estimated using ordinary kriging algorithms with similar settings as those used for Au. Similar trend planes were used to
guide these domains. Dynamic anisotropy was used to control the orientation of the ellipse. Grade data did not require grade capping.
Sulfur
The sulfur grades were estimated in oxidation domains using inverse
distance with a power of 2. Estimation used dynamic anisotropy, following the general trend of oxidation front as well as the mineralization.
However, the complex nature of this contact provided mixed results and this is an area of potential future improvements.
Carbon
Carbon grades were estimated within lithological domains from the updated
geological model, due to the clear lithological control on carbon content. Grades were estimated using inverse distance and using dynamic
anisotropy to guide the search ellipse, based on simplified lithological contacts.
| | 11-40 | |
| SSR Mining Inc. | Çöpler Property S-K 1300 Report | February 12, 2024 SLR Project No.: 138.21581.00006 |
| 11.3.8.3 | Density Estimation |
Density grades were estimated within lithological domains from the updated
geological model due to the clear lithological control on density. The search was also constrained within weathering domains (“fresh”
and “weathered”). Grades were estimated using inverse distance and using a lithology-driven dynamic search to guide the search
ellipse.
Any remaining blocks not estimated were assigned a value based on a
review of the population histogram. Summary density statistics for the lithological domains are presented in Table 11-22.
Table 11-14: Çakmaktepe
Density Statistics for Lithology Domains
| Name |
Weathering State |
Count |
Mean (t/m3) |
CV |
Median (t/m3) |
Assigned Density (t/m3) |
| Diorite |
Fresh |
640 |
2.70 |
0.06 |
2.67 |
2.63 |
| Diorite |
Weathered |
747 |
2.38 |
0.07 |
2.41 |
2.48 |
| Dolomite |
Fresh |
4872 |
2.72 |
0.05 |
2.73 |
2.55 |
| Dolomite |
Weathered |
1123 |
2.41 |
0.07 |
2.45 |
2.71 |
| Hornfels |
Fresh |
4804 |
2.76 |
0.07 |
2.74 |
2.71 |
| Hornfels |
Weathered |
2068 |
2.38 |
0.07 |
2.42 |
2.53 |
| Jasperoid |
Fresh |
1116 |
2.74 |
0.05 |
2.71 |
2.55 |
| Jasperoid |
Weathered |
479 |
2.42 |
0.08 |
2.45 |
2.77 |
| Limestone |
Fresh |
1912 |
2.70 |
0.05 |
2.70 |
2.55 |
| Limestone |
Weathered |
467 |
2.38 |
0.08 |
2.43 |
2.71 |
| Listwanite |
Fresh |
2410 |
2.69 |
0.06 |
2.67 |
2.63 |
| Listwanite |
Weathered |
2670 |
2.42 |
0.07 |
2.44 |
2.55 |
| Silica Cap |
Fresh |
159 |
2.64 |
0.04 |
2.63 |
2.62 |
| Silica Cap |
Weathered |
24 |
2.48 |
0.03 |
2.51 |
2.54 |
| Unaltered Ultramafics |
Fresh |
336 |
2.71 |
0.07 |
2.67 |
2.69 |
| Unaltered Ultramafics |
Weathered |
9473 |
2.41 |
0.05 |
2.42 |
2.45 |
Mineral Resources have been classified in accordance with the U.S. Securities
and Exchange Commission (US SEC) Regulations S-K subpart 1300 rules for Property Disclosures for Mining Registrants (S-K 1300).
The QP has classified the Mineral Resource based on a workflow that
includes the assessment of geological continuity, of the confidence in the estimation domains, and of the quality of the informing data.
The drill spacing at Greater Çakmaktepe is irregular, leading to various areas that, on balance, are more under-drilled than others.
| | 11-41 | |
| SSR Mining Inc. | Çöpler Property S-K 1300 Report | February 12, 2024 SLR Project No.: 138.21581.00006 |
Therefore, in assessing the effect of drill spacing on classification,
the QP used quantitative kriging metrics such as SoR and KE, which inherently carry information on drill spacing, as well as a simple
distance buffer mesh to informing samples, to inform two reasonably continuous areas that are, on balance, less informed or of lower estimation
quality than others. These areas were hand-digitised to minimise the spotted-dog effect, and further informed by geological confidence.
An example of classification approach can be seen in Figure 11-16.
| | 11-42 | |
| SSR Mining Inc. | Çöpler Property S-K 1300 Report | February 12, 2024 SLR Project No.: 138.21581.00006 |
Figure 11-16: Çakmaktepe
North-South Section Showing Resource Classification
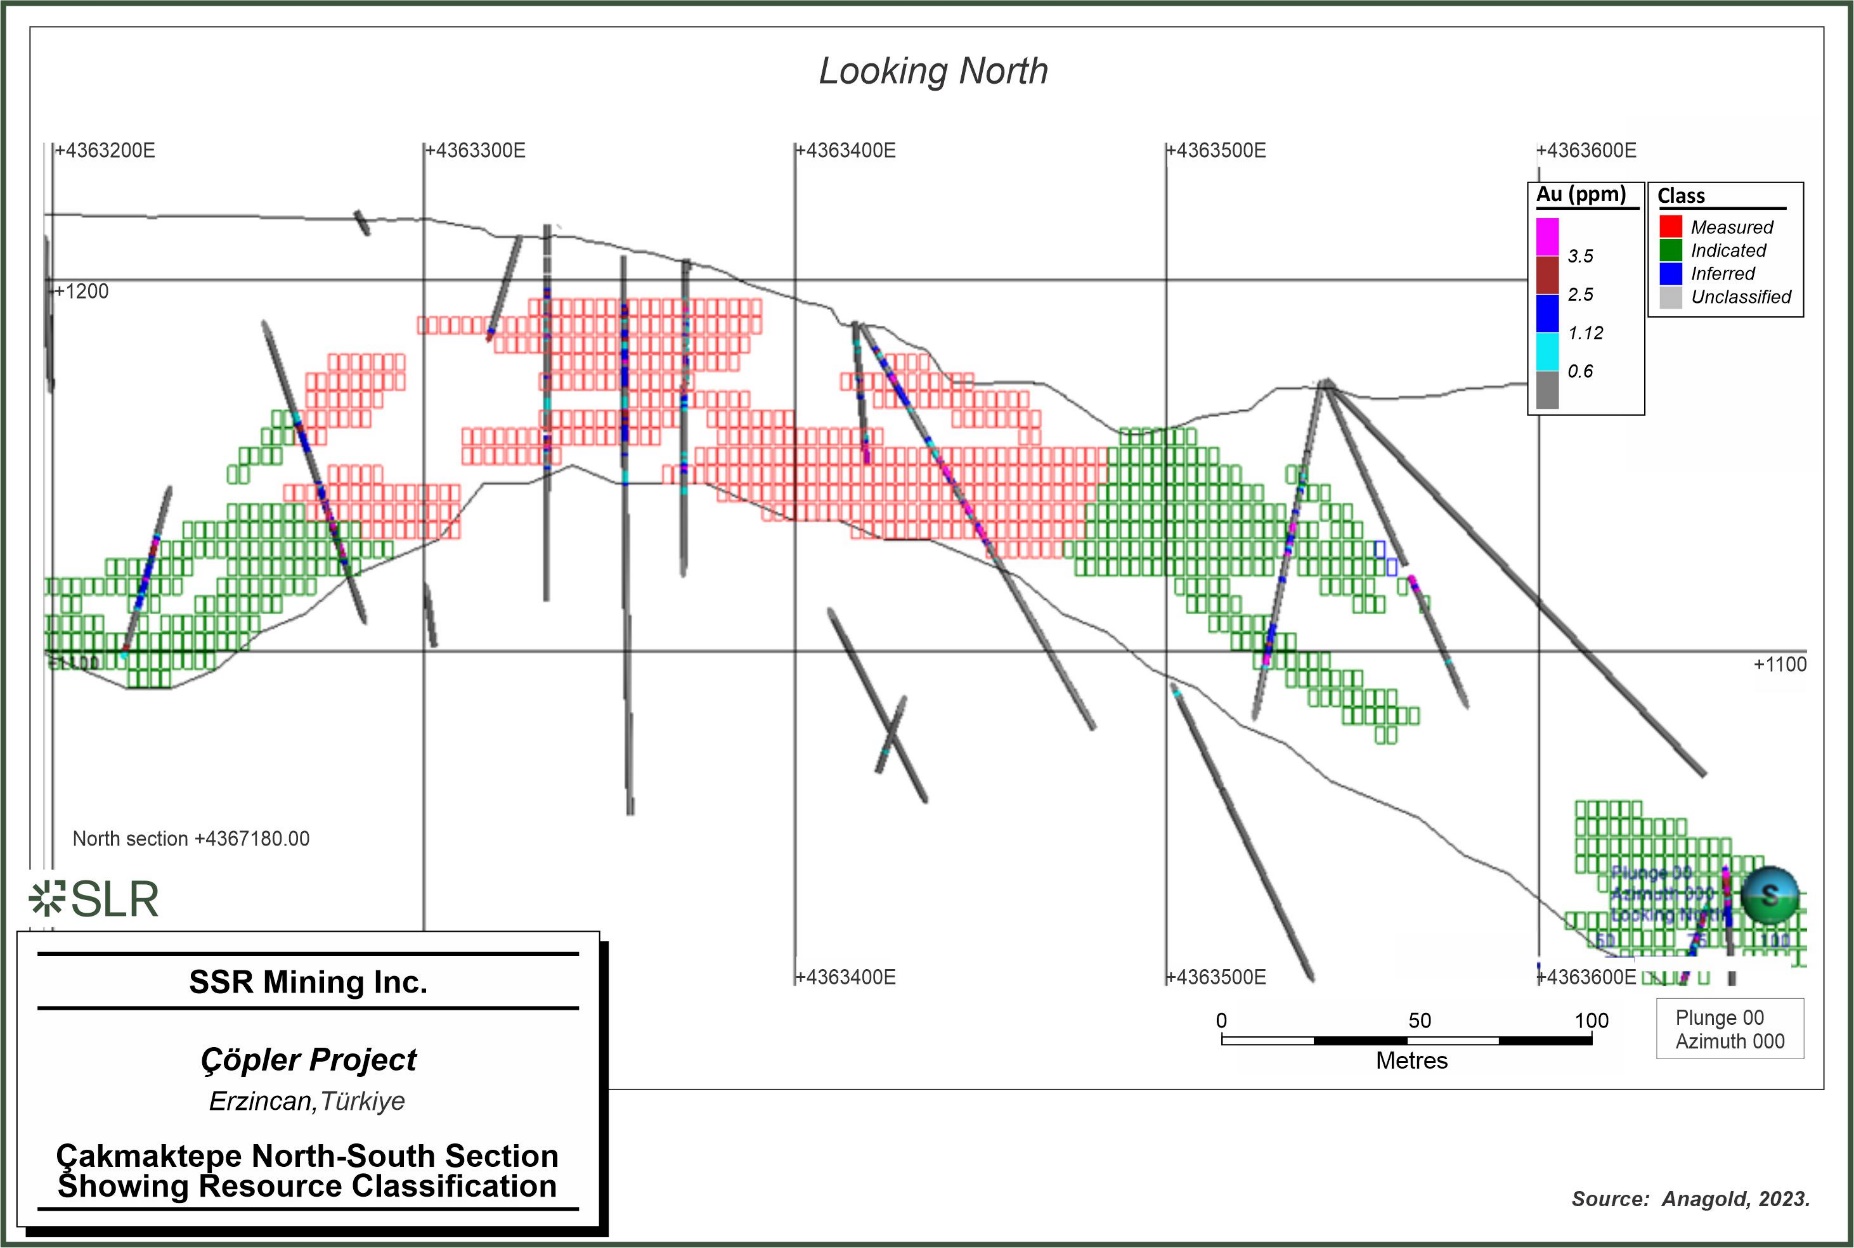
SSR
Mining Inc. Copler Project Erzincan, Turkiye Cakmaktepe North-South Section Showing Resource Classification
| | 11-43 | |
| SSR Mining Inc. | Çöpler Property S-K 1300 Report | February 12, 2024 SLR Project No.: 138.21581.00006 |
| 11.3.10 | Estimation Validation |
The estimate was validated using conventional procedures such as swath
plots (Figure 11-18), global mean comparisons and visual validations which demonstrated that the kriging results match the declustered
grade mean very well and map the grade trend across the strike of the deposit well too. In addition, the block interrogator was used to
query and validate settings for high-grade blocks, to ensure that the settings applied generate reasonable estimates. All results are
acceptable.
| | 11-44 | |
| SSR Mining Inc. | Çöpler Property S-K 1300 Report | February 12, 2024 SLR Project No.: 138.21581.00006 |
Figure 11-17: Visual Validation
of North-South Section 4,367,180, Showing Original Topography and Optimized Resource Shell
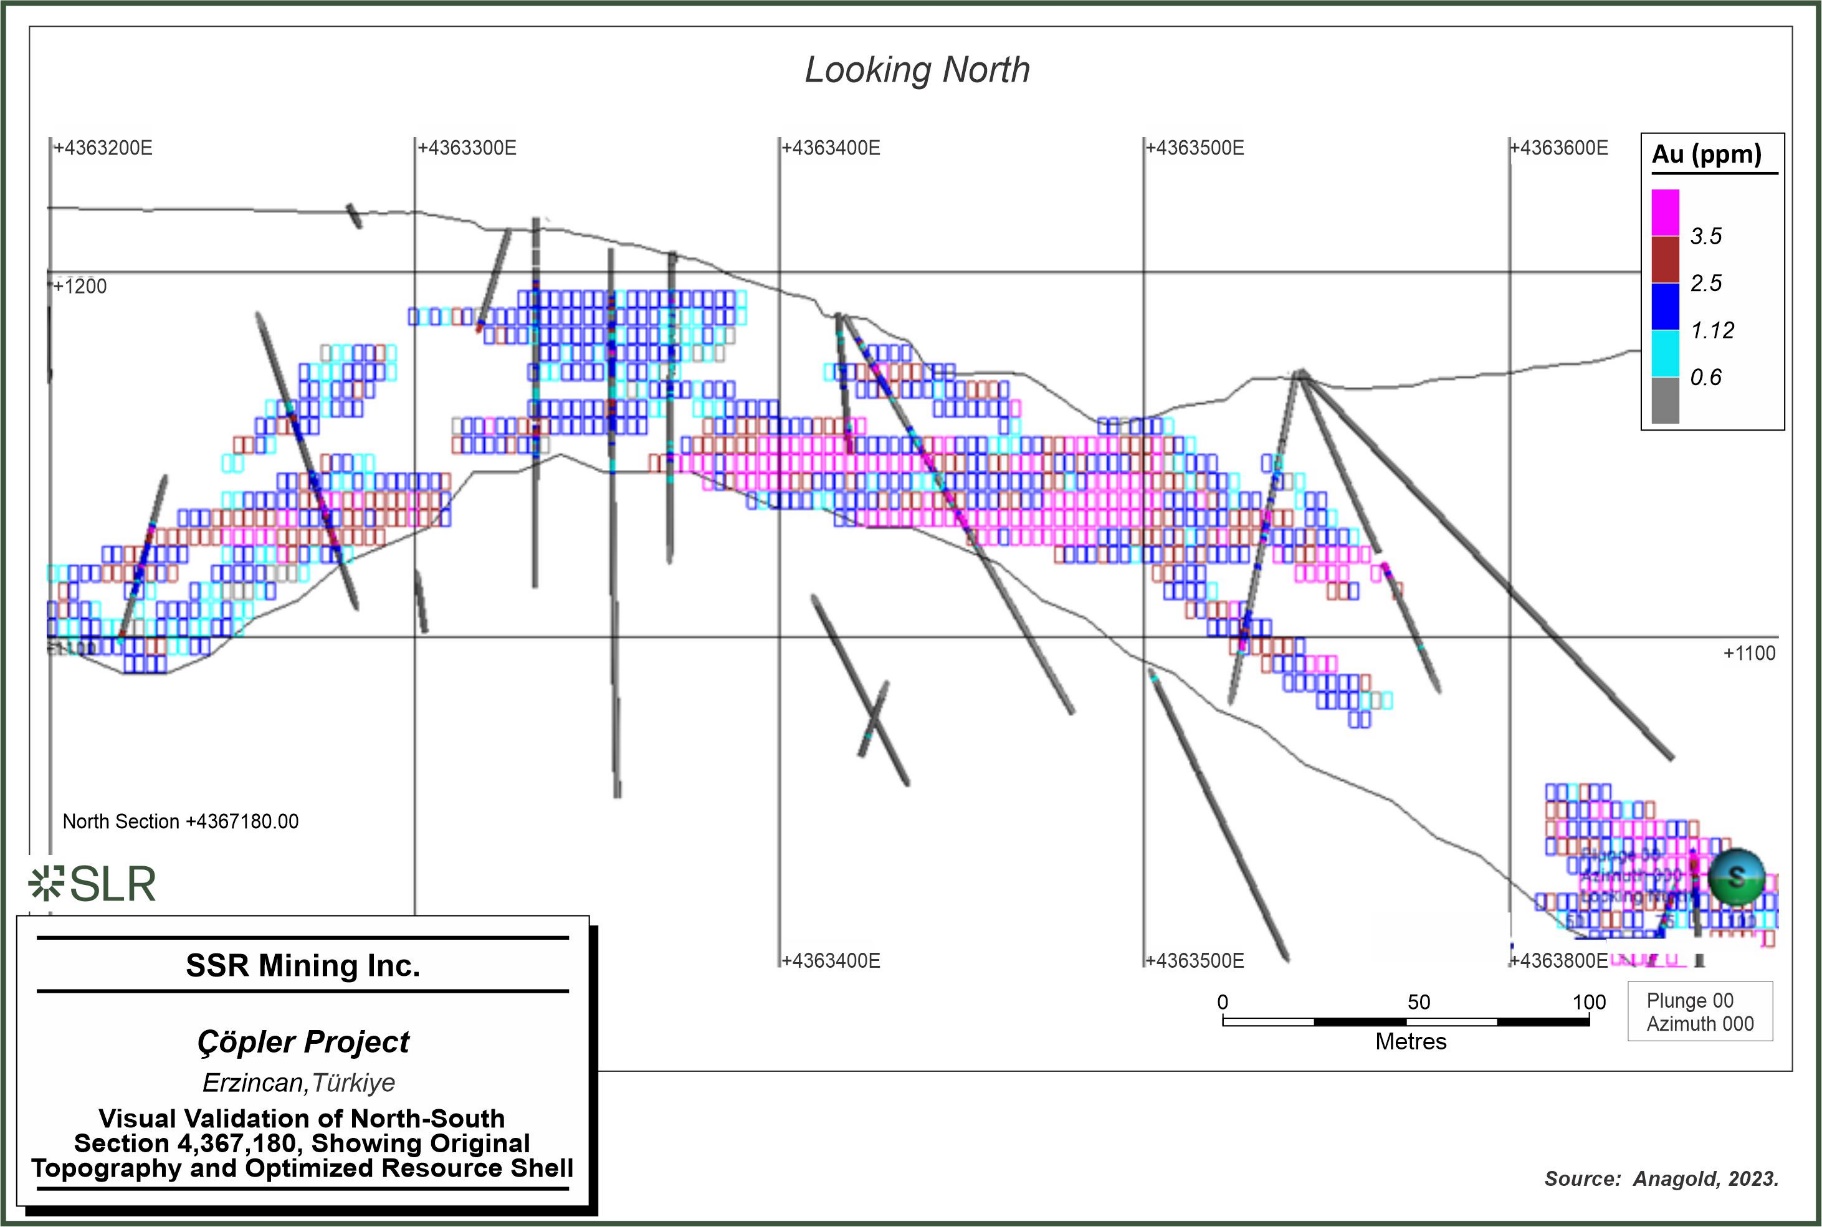
SSR
Mining Inc. Copler Project Erzincan, Turkiye Visual Validation of North-South Section 4,367,180, Showing Original Topography and Optimized
Resource Shell
| | 11-45 | |
| SSR Mining Inc. | Çöpler Property S-K 1300 Report | February 12, 2024 SLR Project No.: 138.21581.00006 |
Figure 11-18: Trend Plot in
Z Direction Showing Raw Same Grades (black), 2-m NN-“Declustered” Sample Grades (purple), and Block Grades (pink).
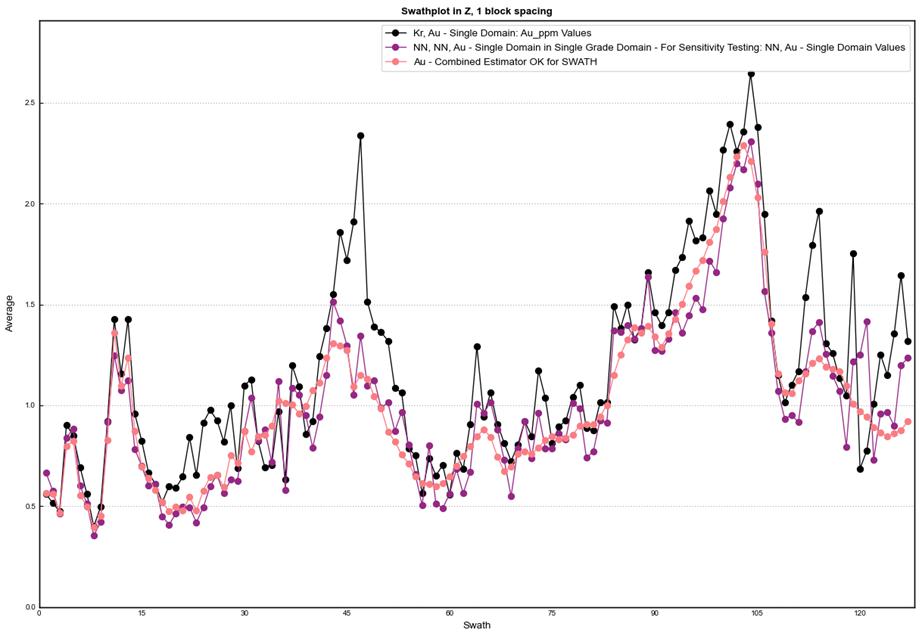
| 11.3.11 | Reasonable Prospects for Economic Extraction and Cut-off Grade |
The RSC QP has considered the potential of economic extraction of the
Greater Çakmaktepe Mineral Resource. In assessing the potential of economic extraction, the QP has reviewed mining, metallurgical,
economic, environmental, social and geotechnical factors. Extensive metallurgical results are available. The RSC QP is not aware of any
environmental issues and understands that social issues are well-managed.
The Mineral Resource is reported within a conceptual optimised pit shell
using a gold price of USD 1,750/oz with the parameters summarized in Table 11-15.
| | 11-46 | |
| SSR Mining Inc. | Çöpler Property S-K 1300 Report | February 12, 2024 SLR Project No.: 138.21581.00006 |
Table 11-15: Summary of Key
Parameters used in 2023 Conceptual Pit Shell at Greater Çakmaktepe
| Input Area |
Units |
Value |
| Mining Cost |
$/t |
$2.79 |
| Fill Cost |
$/t |
$2.48 |
| Oxide G&A |
$/t |
$4.44 |
| Sulfide G&A |
$/t |
$9.00 |
| CIP G&A |
$/t |
$4.44 |
| Sulfide Process Cost |
$/t |
$35.37 |
| Oxide Process Cost |
$/t |
$13.91 |
| CIP Process Cost |
$/t |
$14.82 |
| Sulfide CAPEX |
$/t |
$1.21 |
| Oxide CAPEX |
$/t |
$2.97 |
| CIP CAPEX |
$/t |
$2.51 |
| Au Price |
$/oz |
$1,750 |
| Ag Price |
$/oz |
$22.00 |
| Cu Price |
$/lb |
$3.95 |
| Oxide Sell Cost |
$/oz |
$6.61 |
| Sulfide Sell Cost |
$/oz |
$6.87 |
| Oxide Royalty |
% |
3.40% |
| Sulfide Royalty |
% |
2.00% |
Recoveries for different lithologies are provided in Table 12.3
| 11.3.12 | Mineral Resource Reporting |
The Mineral Resource estimate presented in Table 11-16 was prepared
by independent consultancy RSC and has an effective date of October 31, 2023.
The RSC QP is not aware of any environmental issues and understands
that social issues are well-managed.
Mineral Resources are not Mineral Reserves and do not have demonstrated
economic viability, nor is there certainty that all or any part of the Mineral Resource estimated here will be converted to Mineral Reserves
through further study. Sources of uncertainty that may affect the reporting of Mineral Resources include sampling or drilling methods,
data processing and handling, geologic modelling, and estimation.
| | 11-47 | |
| SSR Mining Inc. | Çöpler Property S-K 1300 Report | February 12, 2024 SLR Project No.: 138.21581.00006 |
Table 11-16: Summary of Greater
Çakmaktepe Mineral Resources exclusive of Mineral Reserves
| Resource Category |
Type |
Total Mineral Resources |
SSR Attributed Basis |
SSR Attributed Mineral Resources (80%) |
NSR Cut-off Values |
Au Recovery |
| Tonnage |
Grade |
Contained Metal |
Tonnage |
Grade |
Contained Metal |
| Au |
Ag |
Cu |
Au |
Ag |
Cu |
Au |
Ag |
Cu |
Au |
Ag |
Cu |
| (Mt) |
(g/t) |
(g/t) |
(%) |
(koz) |
(koz) |
(Klb) |
(%) |
(Mt) |
(g/t) |
(g/t) |
(%) |
(koz) |
(koz) |
(Klb) |
($/t) |
(%) |
| Measured |
Oxide Heap Leach |
1.5 |
0.76 |
2.65 |
0.03 |
36 |
125 |
1,088 |
80 |
1.2 |
0.76 |
2.65 |
0.03 |
29 |
100 |
871 |
18.34 |
40 - 78 |
| |
Sulfide |
0.2 |
1.22 |
5.90 |
0.04 |
7 |
34 |
150 |
80 |
0.1 |
1.22 |
5.90 |
0.04 |
6 |
27 |
120 |
44.37 |
81 - 91 |
| |
Oxide Grind Leach CIL |
2.8 |
1.01 |
4.20 |
0.03 |
91 |
380 |
1,765 |
80 |
2.3 |
1.01 |
4.20 |
0.03 |
73 |
304 |
1,412 |
19.26 |
53 - 90 |
| Total Measured |
Total |
4.5 |
0.94 |
3.75 |
0.03 |
135 |
539 |
3,003 |
80 |
3.6 |
0.94 |
3.75 |
0.03 |
108 |
431 |
2,402 |
|
|
| Indicated |
Oxide Heap Leach |
0.6 |
0.75 |
1.66 |
0.01 |
14 |
31 |
132 |
80 |
0.5 |
0.75 |
1.66 |
0.01 |
11 |
25 |
106 |
18.34 |
40 - 78 |
| |
Sulfide |
0.9 |
2.08 |
3.68 |
0.02 |
60 |
106 |
475 |
80 |
0.7 |
2.08 |
3.68 |
0.02 |
48 |
85 |
380 |
44.37 |
81 - 91 |
| |
Oxide Grind Leach CIL |
7.7 |
1.01 |
2.50 |
0.02 |
249 |
616 |
3,137 |
80 |
6.1 |
1.01 |
2.50 |
0.02 |
199 |
493 |
2,509 |
19.26 |
53 - 90 |
| Total Indicated |
Total |
9.2 |
1.10 |
2.56 |
0.02 |
323 |
753 |
3,743 |
80 |
7.3 |
1.10 |
2.56 |
0.02 |
259 |
603 |
2,995 |
|
|
| Total Measured + Indicated |
Oxide Heap Leach |
2.1 |
0.76 |
2.37 |
0.03 |
50 |
156 |
1,220 |
80 |
1.6 |
0.76 |
2.37 |
0.03 |
40 |
125 |
976 |
18.34 |
40 - 78 |
| |
Sulfide |
1.1 |
1.94 |
4.06 |
0.03 |
67 |
141 |
624 |
80 |
0.9 |
1.94 |
4.06 |
0.03 |
54 |
113 |
499 |
44.37 |
81 - 91 |
| |
Oxide Grind Leach CIL |
10.5 |
1.01 |
2.95 |
0.02 |
340 |
995 |
4,902 |
80 |
8.4 |
1.01 |
2.95 |
0.02 |
272 |
796 |
3,921 |
19.26 |
53 - 90 |
| Total M + I |
Total |
13.6 |
1.05 |
2.95 |
0.02 |
458 |
1,292 |
6,746 |
80 |
10.9 |
1.05 |
2.95 |
0.02 |
366 |
1,034 |
5,397 |
|
|
| Inferred |
Oxide Heap Leach |
0.1 |
1.32 |
2.57 |
0.02 |
2 |
4 |
28 |
80 |
0.0 |
1.32 |
2.57 |
0.02 |
2 |
3 |
22 |
18.34 |
40 - 78 |
| |
Sulfide |
0.7 |
2.58 |
2.36 |
0.02 |
56 |
51 |
229 |
80 |
0.5 |
2.58 |
2.36 |
0.02 |
45 |
41 |
184 |
44.37 |
81 - 91 |
| |
Oxide Grind Leach CIL |
5.3 |
1.78 |
2.25 |
0.02 |
306 |
386 |
1,797 |
80 |
4.3 |
1.78 |
2.25 |
0.02 |
244 |
308 |
1,438 |
19.26 |
53 - 90 |
| Total Inferred |
Total |
6.1 |
1.87 |
2.26 |
0.02 |
364 |
441 |
2,054 |
80 |
4.8 |
1.87 |
2.26 |
0.02 |
291 |
353 |
1,644 |
|
|
Notes:
| 1. | The definitions for Mineral Resources in S-K 1300 were followed. |
| 2. | Mineral Resources are reported based on October 31, 2023 topography surface. |
| 3. | Mineral Resources are reported exclusive of Mineral Reserves. |
| 4. | The Mineral Resource estimates are presented at both a 100% Project level and SSR’s 80% attributable share. |
| 5. | Heap Leach Oxide is defined as material <2% total sulfur. |
| 6. | Grind Leach Oxide is defined as material <2% total sulfur. Processing route will be available approximately in 2027. |
| | 11-48 | |
| SSR Mining Inc. | Çöpler Property S-K 1300 Report | February 12, 2024 SLR Project No.: 138.21581.00006 |
| 7. | Sulfide is defined as material ≥2% total sulfur. |
| 8. | Heap leach oxide uses a NSR cut-off $18.34/t, grind leach oxide uses a NSR cut-off value $19.26/t, and Çöpler sulfide
ore uses a cut-off grade of $39.87/t, Greater Çakmaktepe sulfide ore uses a cut-off grade of $44.37/t . All cut-off values include
allowances for royalty payable. |
| 9. | Metallurgical gold recovery for heap leach oxide and grind leach varies between 40-78% and 53-90%, respectively, based on lithology;
metallurgical recovery for sulfide varies between 81% and 91% based on lithology. |
| 10. | Metallurgical silver recoveries for heap leach and grind leach oxide varies between 0 and 54% based on lithology. Metallurgical recovery
for sulfide varies between 0 and 3%. |
| 11. | Metallurgical copper recoveries for heap leach and grind leach oxide varies between 0 and 15% based on lithology. Metallurgical recovery
for sulfide is 0%. |
| 12. | Metal prices used to report the Mineral Resources are $1,750/oz Au, $22.00/oz Ag, and $3.95/lb Cu with allowances for payability,
deductions, transport, and royalties. |
| 13. | The point of reference for Mineral Resources is the point of feed into the processing facility for grind leach and sulfide material;
or for Heap Leach oxide, it is the Carbon columns. |
| 14. | All Mineral Resources estimates were constrained within conceptual pit shells to meet reasonable prospects for economic extraction
criteria. |
| 15. | Mineral Resources that are not Mineral Reserves do not have demonstrated economic viability. |
| 16. | Totals may vary due to rounding. |
| | 11-49 | |
| SSR Mining Inc. | Çöpler Property S-K 1300 Report | February 12, 2024 SLR Project No.: 138.21581.00006 |
| 11.3.13 | Comparison with Previous Estimates |
The 2023 Mineral Resource exclusive of Mineral Reserves has been compared
with previous Mineral Resource estimate as reported in SSR’s 2022 Form 10-K filing (SSR, 2022).
There was a decrease in contained Measured and Indicated Resources by
252 koz and 409 koz in Inferred, these changes can be attributed to:
| · | Conversion of Inferred Resource to Indicated |
| · | Conversion of Resources to Reserves |
| | 11-50 | |
| SSR Mining Inc. | Çöpler Property S-K 1300 Report | February 12, 2024 SLR Project No.: 138.21581.00006 |
| 11.4 | Bayramdere Mineral Resource Estimate |
Bayramdere represents a small satellite deposit within the wider Çöpler
Project.
The data used in the mineral resource estimate are from the various
drilling campaigns that have taken place at the deposits since 2007. Anagold provided drill hole data to RSC in an MS Access database.
All data were validated and reviewed.
A total of 120 drill holes (excluding water monitoring holes) have been
drilled at Bayramdere for a total length of 11,189.4 m (Table 11-17). The assay database includes 8,758 sample intervals for a total
assayed length of 10,965.1 m. Of the 120 holes, only 104 were drilled within the central part of the Bayramdere deposits and are
covered and used by the resource model. The remaining 16 holes have been drilled on the outer edges of the prospect and are too widely
spaced from the central part of the deposit to be used in the resource estimation, other than for a generic understanding of the geology
of the area. No further data were excluded from the domaining and estimation process.
All numerical data were linked to the implicit modeling software from
an MS Access database. Below-detection values were replaced by half of the detection limit after they had been imported into the implicit
modeling software; the original entries for these samples were retained in the database.
Table 11-17: Summary of Drill
Hole Data Informing Bayramdere MRE
| Drill Type |
No. of Holes |
Total Drill Metres |
| DD |
81 |
6,752 |
| RC |
32 |
2,946 |
| RCD |
7 |
1,491 |
| Total |
120 |
11,189 |
| 11.4.2 | Geological Interpretation |
The primary geological units modeled at Bayramdere are Limestone, Ophiolite,
Hornfels and Diorite. Limestone, Ophiolite and Hornfels have been thrust over one another along shallow-dipping shear zones. Subsequently,
diorite intruded into the stacked units.
Gossan is closely associated with limestone and an important host for
mineralization. Gossan was formed from the interaction of metal-enriched fluids with the country rock and subsequent oxidation due to
weathering.
All five geological domains were modeled implicitly, with manual manipulation
used where required to achieve the desired outcomes.
| 11.4.3 | Estimation Domain Interpretation |
The estimation domains cannot be represented by any of the primary geological
domains in isolation. Hence, grade-based domains were used to constrain the mineralization while still honoring the geology and controls
on mineralization, particularly the Gossan geological domains. Since the Gossan domains are very thin and often discontinuous, representing
a gradational hydrothermal and weathering process, a higher-grade shell was used to represent this domain.
| | 11-51 | |
| SSR Mining Inc. | Çöpler Property S-K 1300 Report | February 12, 2024 SLR Project No.: 138.21581.00006 |
Separate domains were created for low-grade and high-grade Au, Ag, Cu,
and As. Sulfur was also estimated in two grade-based domains based on a 0.45% S threshold.
At depth, mineralization transitions below the base of complete oxidation
to disseminated pyrite, vein sulfides, and massive sulfide horizons generally occurring within shear zones, along shallow thrusts and
diorite sill and dyke margins. The extent of sulfide mineralization has not been tested. The inherent settings in the indicator estimation
domains mean that the key estimation domains have not been extended to more than roughly half the drill spacing, which in most cases is
25 m.
| 11.4.3.2 | Alternative Interpretation & Risk in Domaining |
In terms of quantification of the overall risk on the total tonnages
and grades associated with the interpretation of the estimation domains, given the relatively poor density of drilling in key deeper parts
of the deposit, it is anticipated that the risk in alternative interpretations of the geological model may lead to tonnage or grade variance
of up to ±20%.
The data informing the estimate are from RC and diamond core drilling.
The samples resulting from each of these drilling techniques have a different sample support, which leads to a difference in variance
in the data used in estimation.
Differences in sample support also occur. The predominant part of the
samples (65%) has been sampled at 1-m lengths. Of those intervals that are longer than 1 m, most samples have grades below the grade cut-off.
Only a small percentage of samples are of intervals larger than 2.0 m and with grades higher than the cut-off grade.
A 1 m composite length was selected and compositing was carried out
within hard boundaries and residual sample lengths were distributed equally along the hole where they were less than 30 cm.
| 11.4.5 | Exploratory Data Analysis |
Following estimation domaining and compositing, the statistics for the
domains were evaluated further (Table 11-20, Figure 11-19, Figure 11-20). The CV of the composites in the high-grade and low-grade
Au domains is 1.05 and 1.10, respectively.
Table 11-18: Bayramdere Estimation
Domain Statistics
| Variable |
Domain |
Count |
Length
(m) |
Mean
(ppm) |
SD
(ppm) |
CV |
Variance |
Min |
Max |
| Au |
HG |
46 |
46.85 |
14.4 |
15.2 |
1.05 |
231.82 |
4 |
96 |
| LG |
396 |
372.77 |
0.7 |
0.7 |
1.1 |
0.53 |
0.005 |
3.9 |
| background |
9,243 |
9,199.65 |
0.0 |
0.1 |
3.54 |
0.01 |
0.005 |
5.92 |
| | 11-52 | |
| SSR Mining Inc. | Çöpler Property S-K 1300 Report | February 12, 2024 SLR Project No.: 138.21581.00006 |
| Variable |
Domain |
Count |
Length
(m) |
Mean
(ppm) |
SD
(ppm) |
CV |
Variance |
Min |
Max |
| Ag |
HG |
474 |
480.56 |
39.0 |
96 |
2.46 |
9211.74 |
1.1 |
992 |
| LG |
694 |
679.70 |
2.7 |
2.6 |
0.96 |
6.54 |
0.25 |
50.8 |
| background |
7,324 |
7,310.71 |
0.4 |
1.6 |
3.81 |
2.44 |
0.25 |
68 |
| Cu |
HG |
465 |
452.30 |
4,947 |
8988 |
1.82 |
80,777,183 |
84 |
127,369 |
| LG |
665 |
632.59 |
1,039 |
1948.4 |
1.88 |
3,796,345 |
18 |
33,092 |
| background |
7,413 |
7,369.64 |
115 |
457.2 |
3.98 |
209,061 |
0.5 |
22,790 |
Figure 11-19: Log-histograms
of Composites Within the Au Low-Grade (left) and High-Grade (right) Estimation Domains
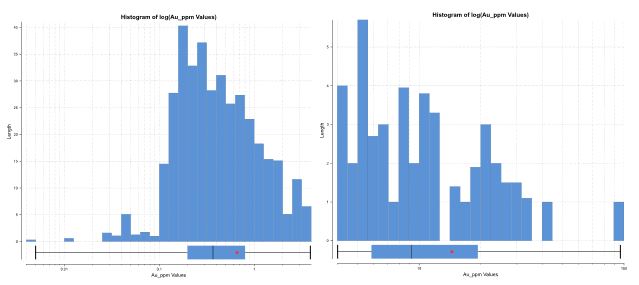
Figure 11-20: Log-histograms
of Composites Within the Cu Low-Grade (left) and High-Grade (right) Estimation Domains
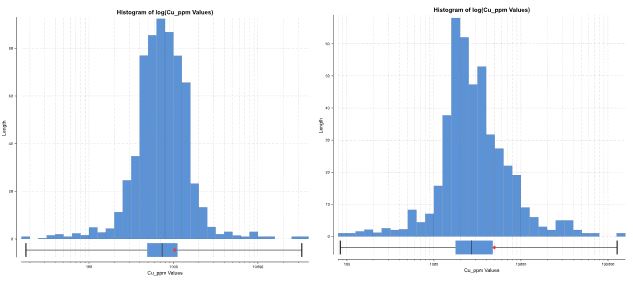
| | 11-53 | |
| SSR Mining Inc. | Çöpler Property S-K 1300 Report | February 12, 2024 SLR Project No.: 138.21581.00006 |
| 11.4.6 | Treatment of High-Grade Assays |
Where the assay distribution is skewed positively or approaches log-normal,
erratic high grade assay values can have a disproportionate effect on the average grade of a deposit. One method of treating these outliers
to reduce their influence on the average grade is to cut or cap them at a specific grade level.
Global grade capping has not been applied as most domains demonstrate
relatively low CV.
| 11.4.6.2 | High Grade Restriction |
In addition to capping thresholds, a secondary approach to reducing
the influence of high-grade composites is to restrict the search ellipse dimension (high yield restriction) during the estimation process.
The threshold grade levels, chosen from the basic statistics and from visual inspection of the apparent continuity of very high grades
within each estimation domain, may indicate the need to further limit their influence by restricting the range of their influence.
A distance-buffered capping has been applied to all the mineralized
domains to ensure that a small amount of stray high-grade samples influence blocks in the immediate vicinity (usually up to approximately
15 m to 25 m) but do not unduly influence blocks at large distances.
Experimental variograms were generated with Au composites from the high-grade
and Low-grade domains combined since there weren't sufficient samples for variography on the HG alone.
All variograms were calculated on composited, non-capped data, and transformed
to normal scores. Long and short ranges were validated by reviewing the spatial continuity of implicit grade shells. Nuggets were compared
to the domain CVs as a broad check of alignment to domain variance characteristics. The results established from the combined Au domains
are presented in Figure 11-21.
| | 11-54 | |
| SSR Mining Inc. | Çöpler Property S-K 1300 Report | February 12, 2024 SLR Project No.: 138.21581.00006 |
Figure 11-21: Experimental and
Modeled Variograms for Au
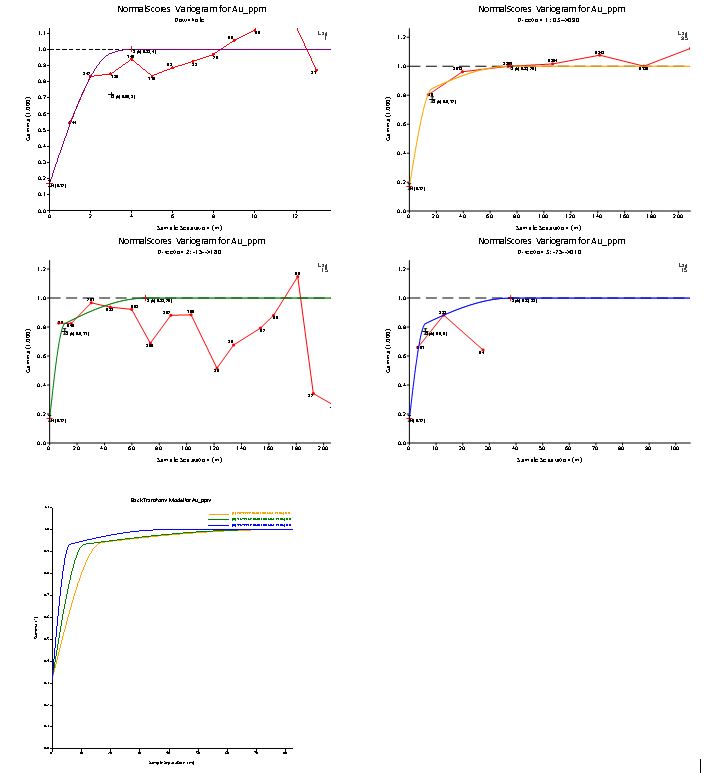
The variography model established from the combined Au domain data was
used in the OK estimation of Au, Ag and Cu. The variography model data are detailed in summary form in Table 11-19. The Au domains
were also estimated using variable orientation settings established from a simplified trend plane.
| | 11-55 | |
| SSR Mining Inc. | Çöpler Property S-K 1300 Report | February 12, 2024 SLR Project No.: 138.21581.00006 |
Table 11-19: Summary of Variography
Model Data in the OK estimation
| Domain |
Nugget |
J1 |
Major Range |
Semi Range |
Minor Range |
2nd Major Range |
2nd Semi Range |
2nd Minor Range |
VarDir1 |
VarDir2 |
VarDir3 |
| Au, Ag, Cu (LG & HG) |
0.1 |
0.83 |
17 |
11 |
6 |
75 |
70 |
40 |
270 |
180 |
10 |
| 11.4.8 | Search Strategy and Grade Estimation Parameters Block Model |
The block model is not rotated and has 12 m x 12 m x 5 m parent blocks
in the X, Y, Z directions, respectively (Table 11-20). A brief study of optimal block size was undertaken, and the final size was
selected based on the weighted average of kriging statistics in high-metal blocks. It is sub-blocked to 3 m x 3 m x 1 m to provide volume
resolution.
Table 11-20: Bayramdere Block
Model Description
| Parameter |
X |
Y |
Z |
| Parent Block Size (m) |
12 |
12 |
5 |
| Sub-block Size (m) |
3 |
3 |
1 |
| Sub block divisions |
4 |
4 |
5 |
| Minimum parent centroid |
465,995 |
4,363,730 |
1,137 |
| Maximum parent centroid |
466,595 |
4,364,125 |
1,417 |
| Minimum corner |
466,600 |
4,363,700 |
1,135 |
| Maximum corner |
466,600 |
4,364,100 |
1,420 |
| Size (blocks) |
51 |
34 |
57 |
| Azimuth (°) |
0 |
|
|
| Dip (°) |
0 |
| Pitch (°) |
0 |
Ordinary kriging was used to estimate Au, Ag, and Cu into the numeric
interpolant domains. Minimum and maximum samples were set for each domain, finding a balance between conditional bias and over smoothing.
Dynamic anisotropy was used to control the orientation of the ellipse for Au only. Blocks estimated by a low number of samples are assigned
a lower confidence in the classification of the resource. All kriging estimation settings are summarized in Table 11-21.
Table 11-21: Estimation settings
for Mineralized Domains
| Domain |
Min samples |
Max samples |
Outlier
Distance (m) |
Outlier
Cap (ppm) |
Major Search (m) |
Semi Search (m) |
Minor Search (m) |
| Au HG |
3 |
35 |
13 |
10 |
50 |
45 |
15 |
| | 11-56 | |
| SSR Mining Inc. | Çöpler Property S-K 1300 Report | February 12, 2024 SLR Project No.: 138.21581.00006 |
| Domain |
Min samples |
Max samples |
Outlier
Distance (m) |
Outlier
Cap (ppm) |
Major Search (m) |
Semi Search (m) |
Minor Search (m) |
| Au LG |
5 |
35 |
8 |
2 |
50 |
45 |
15 |
| Ag HG |
5 |
25 |
22 |
300 |
110 |
80 |
40 |
| Ag LG |
5 |
25 |
28 |
10 |
110 |
80 |
40 |
| Cu HG |
5 |
25 |
22 |
30,000 |
110 |
80 |
40 |
| Cu LG |
5 |
25 |
28 |
5,000 |
110 |
80 |
40 |
| 11.4.8.2 | Density Estimation |
Density grades have been estimated using data from DD core water-immersion
measurements, and constrained within lithological domains from the updated geological model, due to the clear lithological control on
density. Grades were estimated using inverse distance and using a lithology-driven dynamic search to guide the search ellipse. Any remaining
blocks not estimated were assigned the mean value of their population (Table 11-22).
Table 11-22: Bayramdere Median
Density Values for Lithology Domains
| Name |
Weathering State |
Count |
Mean (t/m3) |
CV |
Median (t/m3) |
| Diorite |
Weathered |
12 |
2.31 |
0.15 |
2.13 |
| Diorite |
Fresh |
23 |
2.57 |
0.13 |
2.53 |
| Gossan |
Weathered |
60 |
2.54 |
0.19 |
2.39 |
| Hornfels |
Weathered |
111 |
2.33 |
0.12 |
2.29 |
| Hornfels |
Fresh |
103 |
2.74 |
0.10 |
2.75 |
| Limestone |
Weathered |
182 |
2.55 |
0.09 |
2.61 |
| Limestone |
Fresh |
8 |
2.68 |
0.05 |
2.68 |
| Ophiolite |
Weathered |
202 |
2.35 |
0.10 |
2.33 |
| Ophiolite |
Fresh |
291 |
2.35 |
0.08 |
2.34 |
Mineral Resources have been classified in accordance with the U.S. Securities
and Exchange Commission (US SEC) Regulations S-K subpart 1300 rules for Property Disclosures for Mining Registrants (S-K 1300).
The QP has classified the Mineral Resource based on a workflow that
includes the assessment of geological continuity, of the confidence in the estimation domains, and of the quality of the informing data.
The drill spacing at Bayramdere is irregular, leading to various areas that, on balance, are more under-drilled than others.
Therefore, in assessing the effect of drill spacing on classification,
the QP used quantitative kriging metrics such as SoR and KE, which inherently carry information on drill spacing, as well as a simple
distance buffer mesh to informing samples, to inform two reasonably continuous areas that are, on balance, less informed or of lower estimation
quality than others. These areas were hand-digitised to minimise the spotted-dog effect, and further informed by geological confidence.
An example of classification approach can be seen in Figure 11-22.
| | 11-57 | |
| SSR Mining Inc. | Çöpler Property S-K 1300 Report | February 12, 2024 SLR Project No.: 138.21581.00006 |
Figure 11-22: Bayramdere North-South
Section Showing Resource Classification
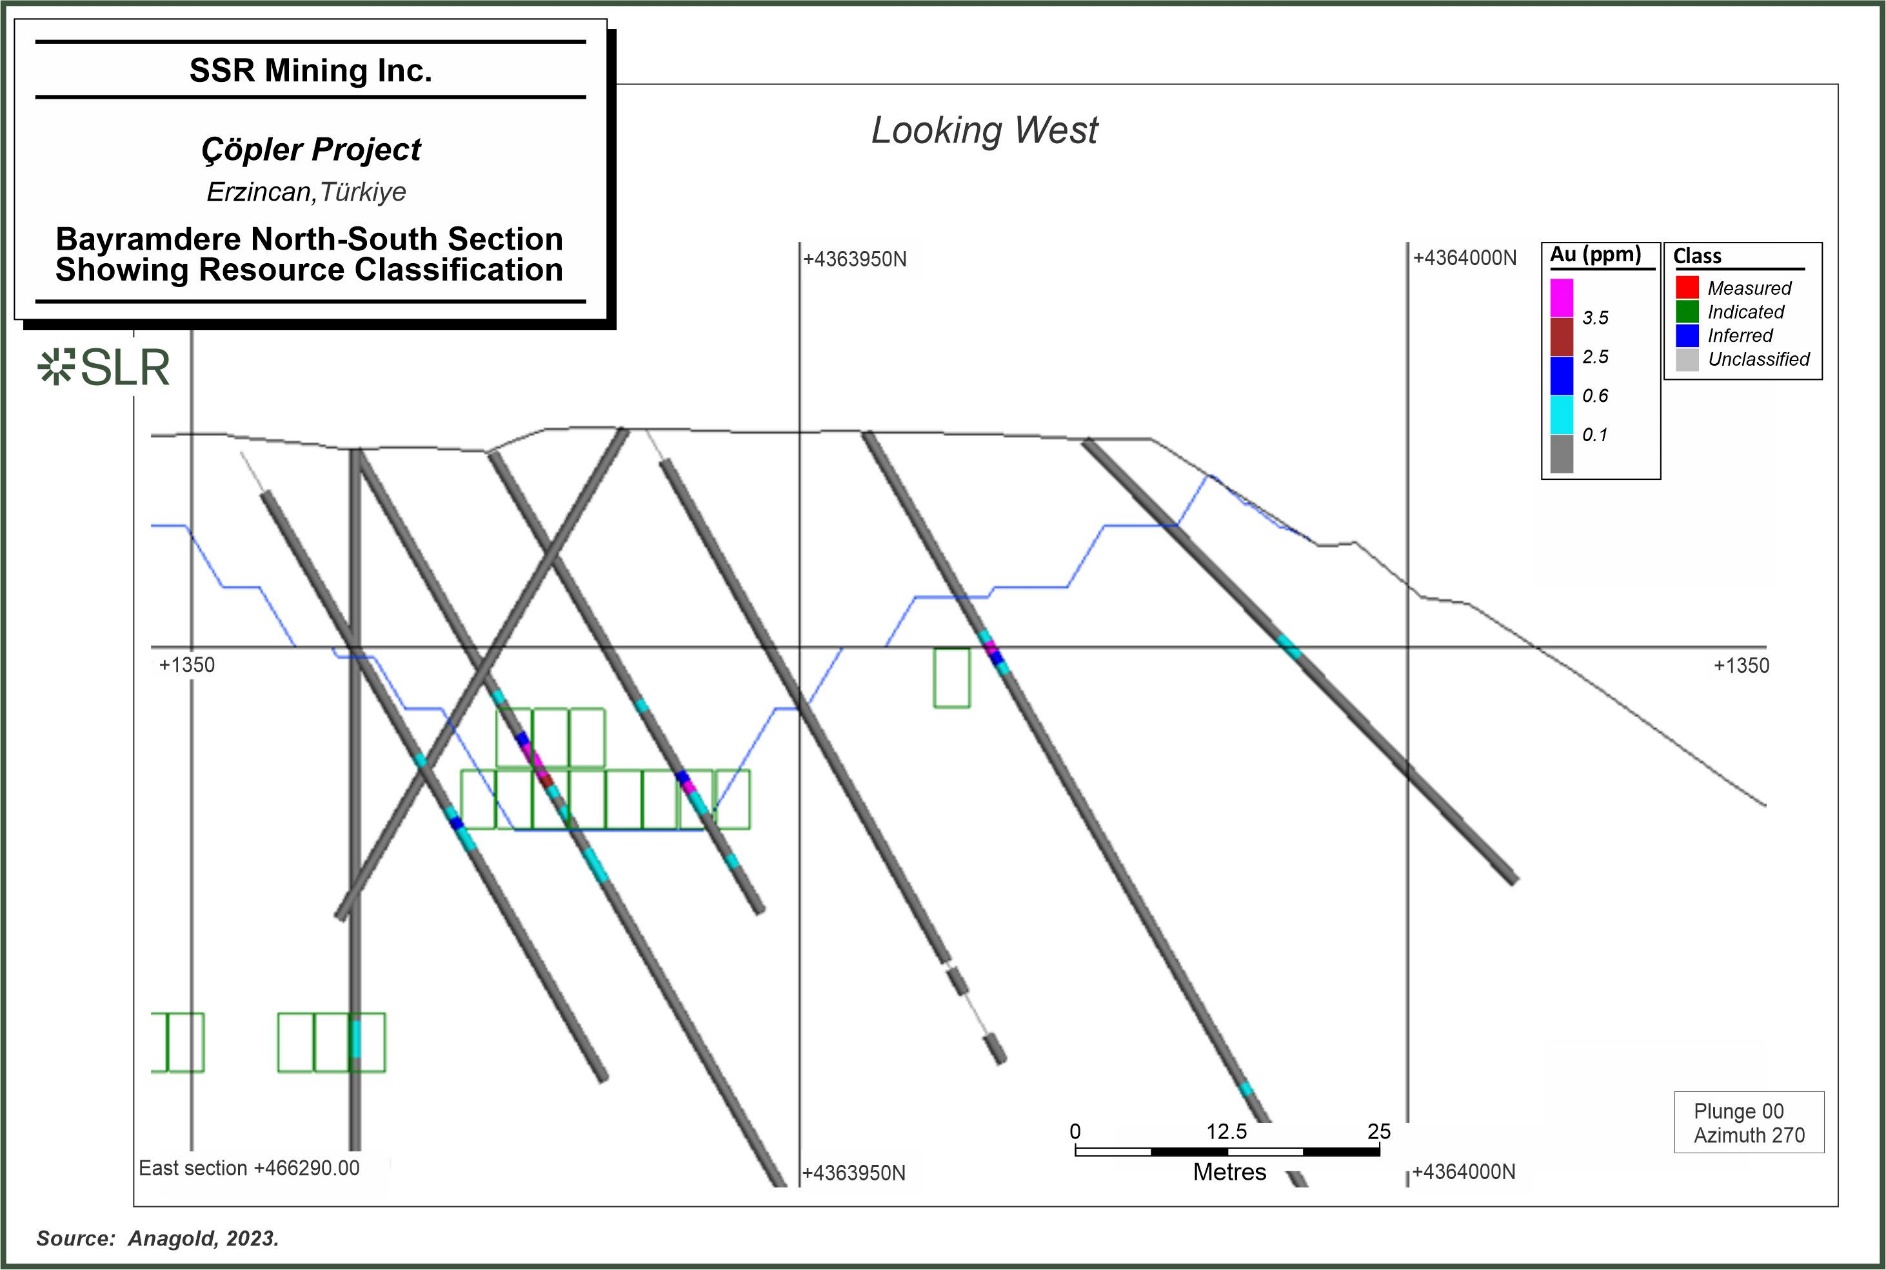
SSR
Mining Inc. Copler Project Erzincan, Turkiye Bayramdere North-South Section Showing Resource Classification
| | 11-58 | |
| SSR Mining Inc. | Çöpler Property S-K 1300 Report | February 12, 2024 SLR Project No.: 138.21581.00006 |
| 11.4.10 | Estimation Validation |
Bayramdere grade estimates were validated against alternate interpolation
methods. Swath plots were used to check for a local bias. The estimated Au grades in the model were compared to the composite grades by
visual inspection in plan views and cross-sections. Composite samples were queried by domain to confirm appropriate sample flagging.
| 11.4.11 | Reasonable Prospects for Economic Extraction and Cut-off Grade |
The RSC QP has considered the potential of economic extraction of the
Bayramdere Mineral Resource. In assessing the reasonable prospects of economic extraction, the RSC QP has reviewed mining, metallurgical,
economic, environmental, social and geotechnical factors. Extensive metallurgical results are available. The QP is not aware of any environmental
issues and understands that social issues are well-managed.
The Mineral Resource is reported within a conceptual optimised pit shell
using a gold price of USD 1,750/oz and the parameters summarised in Table 11-23. The QP considers that with consideration of the recommendations
summarised in Sections 1.1.2.1 and 23.1 of this TRS, any outstanding issues relating to technical and economic factors likely to influence
the prospect of economic extraction are likely to be resolved with further work.
Table 11-23: Summary of Key
Parameters used in 2023 Conceptual Pit Shell at Bayramdere
| Input Area |
Units |
Value |
| Mining Cost |
$/t |
$2.79 |
| Oxide G&A |
$/t |
$4.44 |
| Oxide Process Cost |
$/t |
$13.91 |
| Oxide CAPEX |
$/t |
$2.97 |
| Au Price |
$/oz |
$1,750 |
| Ag Price |
$/oz |
$22.00 |
| Cu Price |
$/lb |
$3.95 |
| Oxide Sell Cost |
$/oz |
$6.61 |
| Oxide Royalty |
% |
3.40% |
Recoveries for all lithologies were considered to be 75%.
| 11.4.12 | Mineral Resource Reporting |
The Mineral Resource estimate presented in Table 11-16 was prepared
by independent consultancy RSC and has an effective date of October 31, 2023.
The RSC QP is not aware of any environmental issues and understands
that social issues are well-managed.
| | 11-59 | |
| SSR Mining Inc. | Çöpler Property S-K 1300 Report | February 12, 2024 SLR Project No.: 138.21581.00006 |
Mineral Resources are not Mineral Reserves and do not have demonstrated
economic viability, nor is there certainty that all or any part of the Mineral Resource estimated here will be converted to Mineral Reserves
through further study. Sources of uncertainty that may affect the reporting of Mineral Resources include sampling or drilling methods,
data processing and handling, geologic modelling, and estimation.
| | 11-60 | |
| SSR Mining Inc. | Çöpler Property S-K 1300 Report | February 12, 2024 SLR Project No.: 138.21581.00006 |
Table 11-24: Summary of Bayramdere
Mineral Resources
| Resource Category |
Type |
Total Mineral Resources |
SSR Attributed Basis |
SSR Attributed Mineral Resources (80%) |
NSR Cut-off Values |
Au Recovery |
| Tonnage |
Grade |
Contained Metal |
Tonnage |
Grade |
Contained Metal |
| Au |
Ag |
Cu |
Au |
Ag |
Cu |
Au |
Ag |
Cu |
Au |
Ag |
Cu |
| (Mt) |
(g/t) |
(g/t) |
(%) |
(koz) |
(koz) |
(klb) |
(%) |
(Mt) |
(g/t) |
(g/t) |
(%) |
(koz) |
(koz) |
(klb) |
($/t) |
(%) |
| Measured |
Oxide Heap Leach |
0.0 |
0.00 |
0.00 |
0.00 |
0 |
0 |
0 |
80 |
0.0 |
0.00 |
0.00 |
0.00 |
0 |
0 |
0 |
18.34 |
75 |
| Indicated |
Oxide Heap Leach |
0.1 |
2.36 |
25.55 |
0.00 |
11 |
122 |
0 |
80 |
0.1 |
2.36 |
25.55 |
0.00 |
9 |
98 |
0 |
18.34 |
75 |
| Total M + I |
Total |
0.1 |
2.36 |
25.55 |
0.00 |
11 |
122 |
0 |
80 |
0.1 |
2.36 |
25.55 |
0.00 |
9 |
98 |
0 |
|
|
| Inferred |
Oxide Heap Leach |
0.1 |
0.00 |
0.00 |
0.00 |
0 |
0 |
0 |
80 |
0.04 |
0.00 |
0.00 |
0.00 |
0 |
0 |
0 |
|
|
Notes:
| 1. | The definitions for Mineral Resources in S-K 1300 were followed. |
| 2. | Mineral Resources are reported based on October 31, 2023 topography surface. |
| 3. | Mineral Resources are reported exclusive of Mineral Reserves. |
| 4. | The Mineral Resource estimates are presented at both a 100% Project level and SSR’s 80% attributable share. |
| 5. | Heap Leach Oxide is defined as material <2% total sulfur. |
| 6. | Grind Leach Oxide is defined as material <2% total sulfur. Processing route will be available approximately in 2027. |
| 7. | Sulfide is defined as material ≥2% total sulfur. |
| 8. | Heap leach oxide uses a NSR cut-off $18.34/t, grind leach oxide uses a NSR cut-off value $19.26/t, and Çöpler sulfide
ore uses a cut-off grade of $39.87/t, Greater Çakmaktepe sulfide ore uses a cut-off grade of $44.37/t . All cut-off values include
allowances for royalty payable. |
| 9. | Metallurgical gold recovery for heap leach oxide and grind leach varies between 40-78% and 53-90%, respectively, based on lithology;
metallurgical recovery for sulfide varies between 81% and 91% based on lithology. |
| 10. | Metallurgical silver recoveries for heap leach and grind leach oxide varies between 0 and 54% based on lithology. Metallurgical recovery
for sulfide varies between 0 and 3%. |
| 11. | Metallurgical copper recoveries for heap leach and grind leach oxide varies between 0 and 15% based on lithology. Metallurgical recovery
for sulfide is 0%. |
| 12. | Metal prices used to report the Mineral Resources are $1,750/oz Au, $22.00/oz Ag, and $3.95/lb Cu with allowances for payability,
deductions, transport, and royalties. |
| 13. | The point of reference for Mineral Resources is the point of feed into the processing facility for grind leach and sulfide material;
or for Heap Leach oxide, it is the Carbon columns. |
| 14. | All Mineral Resources estimates were constrained within conceptual pit shells to meet reasonable prospects for economic extraction
criteria. |
| 15. | Mineral Resources that are not Mineral Reserves do not have demonstrated economic viability. |
| 16. | Totals may vary due to rounding. |
| | 11-61 | |
| SSR Mining Inc. | Çöpler Property S-K 1300 Report | February 12, 2024 SLR Project No.: 138.21581.00006 |
| 11.4.13 | Comparison with Previous Estimates |
The 2023 Mineral Resource exclusive of Mineral Reserves has been compared
with the previous December 31, 2022 Mineral Resource estimate as reported in SSR’s 2022 Form 10-K filing (SSR, 2023).
Compared to EOY 2022 Resources there is a decrease in 1,000 oz in the
Inferred category; this is attributed to change in the estimation and classification methodology. There are no Inferred Resources in the
current estimate.
In the opinion of the RSC QP,
the resource estimation reported herein is an appropriate representation of the gold Mineral Resources found at the Çöpler
Project at the current level of sampling. The RSC QP is of the opinion that with consideration of the recommendations summarized in Sections
1 and 23 of this TRS, any issues relating to all relevant technical and economic factors likely to influence the prospect of economic
extraction can be resolved with further work.
| | 11-62 | |
| SSR Mining Inc. | Çöpler Property S-K 1300 Report | February 12, 2024 SLR Project No.: 138.21581.00006 |
| 12.0 | Mineral Reserve Estimates |
The Mineral Reserves were developed based on mine planning work completed
in 2023 and estimated based on an end of October 31, 2023, topography surface, projected to an October 31, 2023 surface. The total Mineral
Reserve for the Çöpler Project is estimated to be approximately 67.4 Mt at an average grade of 2.32 g/t gold, totaling
5.071 Moz of contained gold, and SSR’s portion is 4.057 Moz of contained gold. Average oxide gold recoveries are 61% and average
sulfide gold recoveries range from 81% to 91%. SSR’s portion of the Mineral Reserves for both Çöpler and Greater Çakmaktepe
is 80%.
The cut-off grades for the Mineral Reserve estimates are based on a
gold price of $1,450/oz. There are no credits for silver or copper in the cut-off grade calculations. Economic analysis has been carried
out using a long-term metal price of $1,755/oz gold, and an average metal price of $1,780/oz gold. Metal prices were selected after consideration
of the pricing information described in Section 16, which includes a description of the time frame used for the selection of the price
and the reasons for selection of such a time frame. The metal prices are representative of the range of price estimates publicly reported
for Mineral Reserve cut-off grades.
| 12.2 | Mineral Reserves Statement |
A summary of the Mineral Reserves estimate is shown in Table 12-1.
Additional detail by process method is provided in Table 12-2. The Mineral Reserves estimates were prepared by SSR and have been classified
in accordance with S-K 1300 and were confirmed by the SLR QP. The Mineral Reserves reported represent a SSR attributable gold ounce
portion basis and have an effective date of October 31, 2023.
The Mineral Reserve is at a feasibility level of study. The Project
Mineral Reserve has been demonstrated to be viable by a financial analysis, and Çöpler has been an operating, profitable mine
since 2011. The Mineral Resource models include dilution, which has been modeled into the block that is much bigger than the selective
mining unit (SMU). Measured Mineral Resources were converted to Proven Mineral Reserves, and Indicated Mineral Resources were converted
to Probable Mineral Reserves. Inferred Mineral Resources were treated as waste and were not converted to Mineral Reserve.
The ultimate pits and subsequent phase designs were developed from the
gold price of $1,450/oz for the optimization runs. The gold price assumption was based on an internal assessment of recent market prices,
long-term forward curve prices, and consensus among analysts regarding price estimates.
Mineral Reserves for the Project will be sourced from either the Çöpler
pit or the Greater Çakmaktepe pit. There are three primary processing methods at the Project:
| · | Pressure Oxidation (POX) followed by cyanide leaching and gold recovery using the carbon in pulp (CIP) process |
| · | Grind-Leaching using the carbon in leach process, CIL |
| · | Heap Leaching with carbon adsorption using carbon in columns (CIC) |
| | 12-1 | |
| SSR Mining Inc. | Çöpler Property S-K 1300 Report | February 12, 2024 SLR Project No.: 138.21581.00006 |
Most of the Reserves will be processed by POX followed by cyanide leaching
and gold adsorption onto carbon using either carbon in pulp (CIP) or carbon in leach (CIL) processes. Process method constraints, and
the associated material routing, have a major impact on how the Çöpler and Greater Çakmaktepe Mineral Reserves are
mined.
SSR performs a rigorous evaluation to determine the most profitable
method of processing: POX-CIP, direct cyanide leaching followed by CIP, direct leaching using CIL, or Heap Leaching. This evaluation includes
the following inputs:
| · | Oxidation State, either oxide or sulfide |
| · | Amount of sulfide sulfur (SS), which dictates the amount and rate at which certain ores can be fed into the POX and/or CIP circuits. |
| · | Amount of organic carbon, which would require the use of carbon in leach (CIL) |
| · | Rock Types. The type of rock can have a significant impact on how the ore is processed, e.g., low gold grade oxide ores would report
to the heap leach versus low grade sulfide material might be waste due to poor heap leach recoveries. |
| · | Treatment cost: POX followed by cyanide leaching is the most expensive, next is direct cyanide leaching followed by CIP, followed
closely by heap leaching. |
Table 12-3 shows the areas, rock types, and metallurgical recoveries
used as inputs to determine the Mineral Reserves. Table 12-4 is a summary of the cost inputs used for pit optimization, cut-off grades,
and scheduling. Table 12-5 summarizes the gold grade and sulfide sulfur criteria used in the determination of the different processing
ore types.
The ultimate pit design for the Çöpler Mine is shown in
Figure 12-1. Figure 12-2 and Figure 12-3 are cross sections of the Çöpler ultimate pit. The Greater Çakmaktepe
ultimate pit is presented in Table 12-4. Figure 12-5 and Figure 12-6 are cross sections of the Greater Çakmaktepe ultimate
pit.
No mining dilution was applied to the grade of the cells. Dilution intrinsic
to the Mineral Resource model is considered sufficient to represent the stated mining selectivity.
Mining recovery was assumed to be 100% of the Measured and Indicated
Mineral Resources. Inferred Mineral Resources were considered waste.
| | 12-2 | |
| SSR Mining Inc. | Çöpler Property S-K 1300 Report | February 12, 2024 SLR Project No.: 138.21581.00006 |
Table 12-1: Summary of Mineral
Reserve Estimates as of October 31, 2023 (SSR’s Attributable Share)
| |
Proven |
Probable |
Total |
Cut-off Value |
Metallurgical Recovery |
| Tonnage |
Grade |
Tonnage |
Grade |
Tonnage |
Grade |
Contained Metal |
| Gold |
(Mt) |
(g/t Au) |
(Mt) |
(g/t Au) |
(Mt) |
(g/t Au) |
(koz Au) |
($/t) |
(%) |
| Çöpler |
5.7 |
2.03 |
10.3 |
1.77 |
16.1 |
1.86 |
962 |
18.34–44.37 |
40–91 |
| Greater Çakmaktepe |
7.3 |
2.42 |
20.2 |
2.79 |
27.5 |
2.69 |
2,383 |
18.34–44.37 |
40–91 |
| Stockpiles |
- |
- |
10.3 |
2.05 |
10.3 |
2.05 |
678 |
18.34–44.37 |
40–91 |
| Leach Pad Inventory |
- |
- |
- |
- |
- |
- |
49 |
18.34–44.37 |
40–91 |
| Total |
13.0 |
2.25 |
40.9 |
2.35 |
53.9 |
2.32 |
4,072 |
18.34–44.37 |
40-91 |
| Silver |
(Mt) |
(g/t Ag) |
(Mt) |
(g/t Ag) |
(Mt) |
(g/t Ag) |
(koz Ag) |
($/t) |
(%) |
| Çöpler |
5.7 |
4.85 |
10.3 |
4.97 |
16.1 |
4.93 |
2,547 |
18.34–44.37 |
40–91 |
| Greater Çakmaktepe |
7.3 |
3.52 |
20.2 |
4.32 |
27.5 |
4.11 |
3,636 |
18.34–44.37 |
40–91 |
| Stockpiles |
- |
- |
10.3 |
– |
10.3 |
– |
- |
18.34–44.37 |
40–91 |
| Total |
13.0 |
4.10 |
40.9 |
3.40 |
53.9 |
3.57 |
6,183 |
18.34–44.37 |
40–91 |
| Copper |
(Mt) |
(% Cu) |
(Mt) |
(% Cu) |
(Mt) |
(% Cu) |
(Mlb Cu) |
($/t) |
(%) |
| Çöpler |
5.7 |
0.06 |
10.3 |
0.05 |
16.1 |
0.05 |
18.8 |
18.34–44.37 |
40–91 |
| Greater Çakmaktepe |
7.3 |
0.02 |
20.2 |
0.01 |
27.5 |
0.01 |
8.7 |
18.34–44.37 |
40–91 |
| Stockpiles |
- |
- |
10.3 |
– |
10.3 |
– |
- |
18.34–44.37 |
40–91 |
| Total |
13.0 |
0.04 |
40.9 |
0.02 |
53.9 |
0.00 |
27.5 |
18.34–44.37 |
40–91 |
Notes:
| 1. | The Mineral Reserves were scheduled based on end of October 31, 2023 surface. Small differences between the Mineral Reserve statement
and the production schedule may occur. |
| 2. | The numbers reflect SSR’s attributed share of 80%. SSR owns 80% of both Anagold and Kartaltepe licenses. |
| 3. | Heap Leach Oxide is defined as material <2% total sulfur. |
| 4. | Grind Leach Oxide is defined as material <2% total sulfur. Processing route will be available approximately in 2027. |
| 5. | Sulfide is defined as material ≥2% total sulfur. |
| | 12-3 | |
| SSR Mining Inc. | Çöpler Property S-K 1300 Report | February 12, 2024 SLR Project No.: 138.21581.00006 |
| 6. | At Çöpler and Greater Çakmaktepe - heap leach oxide uses a NSR cut-off value $21.32/t, grind leach uses a
NSR cut-off value $ 21.77/t while sulfide ore uses a cut-off grade of $45.58/t. All cut-off values include allowances for royalty
payable. |
| 7. | Metallurgical gold recoveries for heap leach oxide and grind leach varies between 40–78% and 53–90% respectively based
on lithology while for sulfide it is 81-91% |
| 8. | Metallurgical silver recoveries for heap leach and grind leach oxide vary between 0 and 54% based on lithology. Metallurgical recovery
for sulfide varies between 0 and 3%. |
| 9. | Metallurgical copper recoveries for heap leach and grind leach oxide vary between 0 and 15% based on lithology. Metallurgical recovery
for sulfide is 0%. |
| 10. | Metal prices used to report the Mineral Reserves are $1,450/oz Au, $18.50/oz Ag, and $3.30/lb Cu with allowances for payable deductions,
transport, and royalties. |
| 11. | The point of reference for Mineral Reserves is the point of feed into the processing facility for grind leach and sulfide while for
Heap Leach oxide it is carbon columns. |
| 12. | Heap leach inventory was mined based on the heap leach cut-off value. |
| 13. | Totals may vary due to rounding. |
| | 12-4 | |
| SSR Mining Inc. | Çöpler Property S-K 1300 Report | February 12, 2024 SLR Project No.: 138.21581.00006 |
Table 12-2: Summary of Mineral
Reserves by Process Types and Mining Areas (as of October 31, 2023)
| Deposit |
Reserve Category |
Tonnage
|
Grades |
Contained Metal |
Tonnage
(SSR Share 80%) |
Contained Metal
(SSR Share 80%) |
Cut-off Value
$/t |
Met. Recovery
% Au |
| (kt) |
Au
(g/t) |
Ag
(g/t) |
Cu
(%) |
Au
(koz) |
Ag
(koz) |
Cu
(klb) |
(kt) |
Au
(koz) |
Ag
(koz) |
Cu
(klb) |
Çöpler Mine
Oxide Heap Leach |
Proven |
|
|
|
|
|
|
|
– |
– |
– |
– |
21.32 |
40–78 |
| Probable |
2 |
0.03 |
143.78 |
0.42 |
0 |
9 |
18 |
2 |
0 |
7 |
15 |
| Probable - Stockpile |
69 |
2.73 |
– |
– |
6 |
– |
– |
55 |
5 |
– |
– |
| Heap Leach inventory |
|
|
|
|
61 |
|
|
– |
49 |
– |
– |
| Total |
71 |
2.65 |
3.99 |
0.01 |
67 |
9 |
18 |
57 |
54 |
7 |
15 |
Çöpler Mine
Sulfide |
Proven |
6,574 |
2.09 |
4.71 |
0.06 |
441 |
996 |
8,831 |
5,259 |
353 |
797 |
7,064 |
45.59 |
81–91 |
| Probable |
12,202 |
1.82 |
4.89 |
0.05 |
713 |
1,919 |
12,413 |
9,762 |
571 |
1,535 |
9,930 |
| Probable - Stockpile |
12,798 |
2.05 |
– |
– |
842 |
– |
– |
10,238 |
673 |
– |
– |
| Total |
31,574 |
1.97 |
2.87 |
0.03 |
1,996 |
2,915 |
21,244 |
25,259 |
1,597 |
2,332 |
16,995 |
Çöpler Mine
Oxide Grind Leach CIL |
Proven |
584 |
1.43 |
6.47 |
0.10 |
27 |
122 |
1,268.16 |
467 |
21 |
97 |
1,015 |
21.77 |
58–90 |
| Probable |
728 |
0.93 |
5.89 |
0.06 |
22 |
138 |
949.06 |
582 |
17 |
110 |
759 |
| Probable - Stockpile |
|
|
|
|
|
|
|
– |
– |
– |
– |
| Total |
1,312 |
1.15 |
6.15 |
0.08 |
49 |
259 |
2,217 |
1,050 |
39 |
207 |
1,774 |
Greater Çakmaktepe
Oxide Heap Leach |
Proven |
2,749 |
1.84 |
1.19 |
0.00 |
163 |
105 |
232 |
2,199 |
130 |
84 |
185 |
21.32 |
40–78 |
| Probable |
2,577 |
2.04 |
1.62 |
0.00 |
169 |
134 |
236 |
2,062 |
135 |
107 |
189 |
| Probable - Stockpile |
– |
– |
– |
– |
– |
– |
– |
– |
– |
– |
– |
| Total |
5,325 |
1.94 |
1.40 |
0.00 |
332 |
239 |
468 |
4,260 |
266 |
191 |
374 |
Greater Çakmaktepe
Sulfide |
Proven |
1,423 |
2.77 |
4.04 |
0.01 |
127 |
185 |
424 |
1,138 |
101 |
148 |
339 |
45.59 |
81–91 |
| Probable |
6,851 |
4.00 |
7.15 |
0.01 |
881 |
1,575 |
1,355 |
5,481 |
705 |
1,260 |
1,084 |
| Probable - Stockpile |
– |
– |
– |
– |
– |
– |
– |
– |
– |
– |
– |
| Total |
8,274 |
3.79 |
6.62 |
0.01 |
1,008 |
1,760 |
1,779 |
6,619 |
807 |
1,408 |
1,424 |
Greater Çakmaktepe
Oxide Grind Leach CIL |
Proven |
4,961 |
2.64 |
4.67 |
0.04 |
422 |
745 |
3,934 |
3,969 |
337 |
596 |
3,147 |
21.77 |
58–90 |
| Probable |
15,869 |
2.38 |
3.53 |
0.01 |
1,217 |
1,802 |
4,721 |
12,695 |
973 |
1,441 |
3,777 |
| Probable - Stockpile |
– |
– |
– |
– |
– |
– |
– |
– |
– |
– |
– |
| Total |
20,830 |
2.45 |
3.80 |
0.02 |
1,638 |
2,546 |
8,655 |
16,664 |
1,311 |
2,037 |
6,924 |
| | 12-5 | |
| SSR Mining Inc. | Çöpler Property S-K 1300 Report | February 12, 2024 SLR Project No.: 138.21581.00006 |
| Deposit |
Reserve Category |
Tonnage
|
Grades |
Contained Metal |
Tonnage
(SSR Share 80%) |
Contained Metal
(SSR Share 80%) |
Cut-off Value
$/t |
Met. Recovery
% Au |
| (kt) |
Au
(g/t) |
Ag
(g/t) |
Cu
(%) |
Au
(koz) |
Ag
(koz) |
Cu
(klb) |
(kt) |
Au
(koz) |
Ag
(koz) |
Cu
(klb) |
| Summary by Process |
|
|
|
|
|
|
| Total Oxide Heap Leach |
Proven |
2,749 |
1.84 |
1.19 |
0.00 |
163 |
105 |
232 |
2,199 |
130 |
84 |
185 |
$21.32 |
40–78 |
| Probable |
2,579 |
2.04 |
1.73 |
0.00 |
169 |
143 |
255 |
2,063 |
135 |
115 |
204 |
| Probable - Stockpile |
69 |
2.73 |
0.00 |
0.00 |
6 |
0 |
0 |
55 |
5 |
0 |
0 |
| Heap Leach inventory |
– |
– |
– |
– |
61 |
– |
– |
– |
54 |
– |
– |
| Total |
5,397 |
1.95 |
1.43 |
0.00 |
399 |
248 |
486 |
4,318 |
319 |
198 |
389 |
| Total Sulfide |
Proven |
7,997 |
2.21 |
4.59 |
0.05 |
568 |
1,180 |
9,255 |
6,398 |
454 |
944 |
7,404 |
$45.59 |
81–91 |
| Probable |
19,052 |
2.60 |
5.70 |
0.03 |
1,595 |
3,494 |
13,768 |
15,242 |
1,276 |
2,795 |
11,015 |
| Probable - Stockpile |
12,798 |
2.05 |
0.00 |
– |
842 |
0 |
– |
10,238 |
673 |
– |
– |
| Total |
39,848 |
2.35 |
3.65 |
0.03 |
3,004 |
4,674 |
23,023 |
31,878 |
2,403 |
3,739 |
18,418 |
| Total Oxide Grind Leach CIL |
Proven |
5,546 |
2.52 |
4.86 |
0.04 |
448 |
866 |
5,202 |
4,437 |
359 |
693 |
4,161 |
$21.77 |
58–90 |
| Probable |
16,596 |
2.32 |
3.63 |
0.02 |
1,239 |
1,939 |
5,671 |
13,277 |
991 |
1,552 |
4,536 |
| Probable - Stockpile |
|
|
|
|
|
|
|
|
– |
– |
– |
| Total |
22,142 |
2.37 |
3.94 |
0.02 |
1,687 |
2,806 |
10,872 |
17,714 |
1,350 |
2,245 |
8,698 |
| Project
Total |
|
|
|
|
|
|
| Total Project |
Proven |
16,292 |
2.25 |
4.11 |
0.04 |
1,179 |
2,151 |
14,688 |
13,034 |
943 |
1,721 |
11,750 |
$21.32–$45.59 |
40–91 |
| Probable |
38,227 |
2.44 |
4.54 |
0.02 |
3,003 |
5,577 |
19,693 |
30,582 |
2,402 |
4,461 |
15,755 |
| Probable - Stockpile |
12,868 |
2.05 |
0.00 |
0.00 |
848 |
0 |
0 |
10,294 |
678 |
0 |
0 |
| Heap Leach inventory |
|
|
|
|
61 |
|
|
– |
54 |
0 |
0 |
| Total |
67,386 |
2.32 |
3.57 |
0.02 |
5,090 |
7,728 |
34,381 |
53,909 |
4,072 |
6,183 |
27,505 |
Notes:
| 1. | The Mineral Reserves were scheduled based on end of October 31, 2023 surface. Small differences between the Mineral Reserve statement
and the production schedule may occur. |
| | 12-6 | |
| SSR Mining Inc. | Çöpler Property S-K 1300 Report | February 12, 2024 SLR Project No.: 138.21581.00006 |
| 2. | Mineral Reserves are reported both on a Project and SSR attributable basis. SSR owns 80% of both Anagold and Kartaltepe licenses. |
| 3. | Heap Leach Oxide is defined as material <2% total sulfur. |
| 4. | Grind Leach Oxide is defined as material <2% total sulfur. Processing route will be available approximately in 2027. |
| 5. | Sulfide is defined as material ≥2% total sulfur. |
| 6. | At Çöpler and Greater Çakmaktepe - heap leach oxide uses a NSR cut-off value $21.32 grind leach uses a NSR cut-off
value $21.77/t while sulfide ore uses a cut-off grade of $45.58/t. All cut-off values include allowances for royalty payable. |
| 7. | Metallurgical gold recoveries for heap leach oxide and grind leach varies between 40–78% and 53–90% respectively based
on lithology while for sulfide it is 81–91% |
| 8. | Metallurgical silver recoveries for heap leach and grind leach oxide vary between 0 and 54% based on lithology. Metallurgical recovery
for sulfide varies between 0 and 3%. |
| 9. | Metallurgical copper recoveries for heap leach and grind leach oxide vary between 0 and 15% based on lithology. Metallurgical recovery
for sulfide is 0%. |
| 10. | Metal prices used to report the Mineral Reserves are $1,450/oz Au, $18.50/oz Ag, and $3.30/lb Cu with allowances for payable, deductions,
transport, and royalties. |
| 11. | The point of reference for Mineral Reserves is the point of feed into the processing facility for grind leach and sulfide while for
Heap Leach oxide it is Carbon columns. |
| 12. | Heap leach inventory was mined based on the heap leach cut-off value. |
| 13. | Totals may vary due to rounding.
|
| | 12-7 | |
| SSR Mining Inc. | Çöpler Property S-K 1300 Report | February 12, 2024 SLR Project No.: 138.21581.00006 |
Table 12-3: Summary of Metallurgical
Inputs Used for Cut-off Grade (COG) Analysis and Scheduling
| Deposit |
Zone No. |
Area Name |
Rock Type Name |
Gold CIP Recovery
(%) |
Silver CIP Recovery
(%) |
POX Recovery
(%) |
Heap Leach Recoveries
(%) |
| S%<1 |
1 <=S% <2 |
S%<1 |
1 <=S% <2 |
|
Greater Çakmaktepe |
1 |
Çakmaktepe Main - Oxide |
Limestone |
68% |
53% |
20.00% |
81-91% |
73.00% |
58.00% |
| Metasediments (Hornfels) |
68% |
53% |
20.00% |
81-91% |
73.00% |
58.00% |
| Listwanite |
90% |
90% |
20.00% |
81-91% |
73.00% |
58.00% |
| Gossan |
68% |
53% |
20.00% |
81-91% |
73.00% |
58.00% |
| Jasperoid |
60% |
60% |
20.00% |
81-91% |
50.00% |
40.00% |
| Diorite |
68% |
53% |
20.00% |
81-91% |
73.00% |
58.00% |
| Dolomite |
83% |
83% |
0.55% |
81-91% |
73.00% |
58.00% |
| Manganese Diorite |
68% |
53% |
20.00% |
81-91% |
73.00% |
58.00% |
| Ophiolite |
68% |
53% |
20.00% |
81-91% |
73.00% |
58.00% |
| Silica Cap. |
68% |
53% |
20.00% |
81-91% |
73.00% |
58.00% |
| Cataclastite |
68% |
53% |
20.00% |
81-91% |
73.00% |
58.00% |
| Fill or Leach Pad |
68% |
53% |
20.00% |
81-91% |
73.00% |
58.00% |
| 2 |
Çakmaktepe Main - East |
Limestone |
68% |
53% |
15.00% |
81-91% |
55.00% |
45.00% |
| Metasediments (Hornfels) |
68% |
53% |
15.00% |
81-91% |
55.00% |
45.00% |
| Listwanite |
90% |
90% |
15.00% |
81-91% |
55.00% |
45.00% |
| Gossan |
68% |
53% |
15.00% |
81-91% |
55.00% |
45.00% |
| Jasperoid |
60% |
60% |
15.00% |
81-91% |
50.00% |
40.00% |
| Diorite |
68% |
53% |
15.00% |
81-91% |
55.00% |
45.00% |
| Dolomite |
83% |
83% |
15.00% |
81-91% |
55.00% |
45.00% |
| Manganese Diorite |
68% |
53% |
15.00% |
81-91% |
55.00% |
45.00% |
| Ophiolite |
68% |
53% |
15.00% |
81-91% |
55.00% |
45.00% |
| Silica Cap. |
68% |
53% |
15.00% |
81-91% |
55.00% |
45.00% |
| Cataclastite |
68% |
53% |
15.00% |
81-91% |
55.00% |
45.00% |
| Fill or Leach Pad |
68% |
53% |
15.00% |
81-91% |
55.00% |
45.00% |
| | 12-8 | |
| SSR Mining Inc. | Çöpler Property S-K 1300 Report | February 12, 2024 SLR Project No.: 138.21581.00006 |
| Deposit |
Zone No. |
Area Name |
Rock Type Name |
Gold CIP Recovery
(%) |
Silver CIP Recovery
(%) |
POX Recovery
(%) |
Heap Leach Recoveries
(%) |
| S%<1 |
1 <=S% <2 |
S%<1 |
1 <=S% <2 |
|
|
3 |
Çakmaktepe North |
Limestone |
68% |
53% |
17.00% |
81-91% |
59.00% |
59.00% |
| Metasediments (Hornfels) |
68% |
53% |
19.00% |
81-91% |
14.00% |
14.00% |
| Listwanite |
90% |
90% |
|
81-91% |
|
|
| Gossan |
68% |
53% |
17.00% |
81-91% |
59.00% |
59.00% |
| Jasperoid |
60% |
60% |
17.00% |
81-91% |
59.00% |
59.00% |
| Diorite |
68% |
53% |
40.00% |
81-91% |
38.00% |
38.00% |
| Dolomite |
83% |
83% |
|
81-91% |
|
|
| Manganese Diorite |
68% |
53% |
|
81-91% |
|
|
| Ophiolite |
68% |
53% |
24.00% |
81-91% |
63.00% |
63.00% |
| Silica Cap. |
68% |
53% |
|
81-91% |
|
|
| Cataclastite |
68% |
53% |
|
81-91% |
|
|
| Fill or Leach Pad |
68% |
53% |
|
81-91% |
|
|
| Çakmaktepe Central |
Limestone |
68% |
53% |
17.00% |
81-91% |
70.00% |
70.00% |
| Metasediments (Hornfels) |
68% |
53% |
28.00% |
81-91% |
80.00% |
80.00% |
| Listwanite |
90% |
90% |
|
81-91% |
|
|
| Gossan |
68% |
53% |
|
81-91% |
|
|
| Jasperoid |
60% |
60% |
17.00% |
81-91% |
73.00% |
73.00% |
| Diorite |
68% |
53% |
24.00% |
81-91% |
61.00% |
61.00% |
| Dolomite |
83% |
83% |
|
81-91% |
|
|
| Manganese Diorite |
68% |
53% |
|
81-91% |
|
|
| Ophiolite |
68% |
53% |
19.00% |
81-91% |
70.00% |
70.00% |
| Silica Cap. |
68% |
53% |
|
81-91% |
|
|
| Cataclastite |
68% |
53% |
|
81-91% |
|
|
| Fill or Leach Pad |
68% |
53% |
|
81-91% |
|
|
| | 12-9 | |
| SSR Mining Inc. | Çöpler Property S-K 1300 Report | February 12, 2024 SLR Project No.: 138.21581.00006 |
| Deposit |
Zone No. |
Area Name |
Rock Type Name |
Gold CIP Recovery
(%) |
Silver CIP Recovery
(%) |
POX Recovery
(%) |
Heap Leach Recoveries
(%) |
| S%<1 |
1 <=S% <2 |
S%<1 |
1 <=S% <2 |
| Çöpler |
|
|
Limestone |
68% |
53% |
27.30% |
81-91% |
78.40% |
|
| Metasediments (Hornfels) |
68% |
53% |
32.50% |
81-91% |
66.80% |
|
| Listwanite |
90% |
90% |
20.00% |
81-91% |
|
|
| Gossan |
68% |
53% |
27.50% |
81-91% |
71.20% |
|
| Jasperoid |
60% |
60% |
20.00% |
81-91% |
|
|
| Diorite |
68% |
53% |
37.80% |
81-91% |
71.20% |
|
| Dolomite |
83% |
83% |
0.55% |
81-91% |
|
|
| Manganese Diorite |
68% |
53% |
37.80% |
81-91% |
71.20% |
|
| Ophiolite |
68% |
53% |
20.00% |
81-91% |
|
|
| Silica Cap. |
68% |
53% |
20.00% |
81-91% |
|
|
| Cataclastite |
68% |
53% |
20.00% |
81-91% |
|
|
| Fill or Leach Pad |
68% |
53% |
20.00% |
81-91% |
|
|
| | 12-10 | |
| SSR Mining Inc. | Çöpler Property S-K 1300 Report | February 12, 2024 SLR Project No.: 138.21581.00006 |
Table 12-4: Summary of Costs
Inputs Used for Pit Optimization, COG Analysis, and Scheduling
| Input Area |
Units |
Çöpler |
Greater Çakmaktepe |
| Mining Cost |
$/t |
2.06 |
2.79 |
| Fill Cost |
$/t |
1.75 |
2.48 |
| Oxide G&A |
$/t |
4.44 |
4.44 |
| Sulfide G&A |
$/t |
9.00 |
9.00 |
| CIP G&A |
$/t |
4.44 |
4.44 |
| Sulfide Process Cost |
$/t |
35.37 |
35.37 |
| Oxide Process Cost |
$/t |
13.91 |
13.91 |
| CIP Process Cost |
$/t |
14.82 |
14.82 |
| Sulfide CAPEX |
$/t |
1.21 |
1.21 |
| Oxide CAPEX |
$/t |
2.97 |
2.97 |
| CIP CAPEX |
$/t |
2.51 |
2.51 |
| Au Price |
$/oz |
1,450 |
1,450 |
| Ag Price |
$/oz |
18.50 |
18.50 |
| Cu Price |
$/lb |
3.30 |
3.30 |
| Oxide Sell Cost |
$/oz |
6.61 |
6.61 |
| Sulfide Sell Cost |
$/oz |
6.87 |
6.87 |
| Oxide Royalty |
% |
3.40 |
3.40 |
| Sulfide Royalty |
% |
2.00 |
2.00 |
| Grams to Ounce |
g/oz |
31.1 |
31.1 |
| Cu% to Pounds |
% |
22 |
22 |
| Average Bulk Density |
t/m3 |
2.78 |
2.57 |
| | 12-11 | |
| SSR Mining Inc. | Çöpler Property S-K 1300 Report | February 12, 2024 SLR Project No.: 138.21581.00006 |
Table 12-5: Sulfide Sulfur and
Gold Grade Criteria for Establishing Process Methods Routing
| ORECT Code Name |
ORECT Number |
Description |
Sulfide Sulfur Range,
(% SS) |
Gold Grade Range
(g/t Au) |
Process Stream |
| Unknown |
948 |
Unknown |
|
|
Waste |
| R_PAG |
949 |
Re-handle Potential Acid Generating (PAG) |
|
|
Waste |
| R_NAG |
950 |
Re-handle Non-Acid Generating (NAG) |
|
|
Waste |
| PAG |
951 |
Potential Acid Generating (PAG) |
|
|
Waste |
| NAG |
952 |
Non-Acid Generating (NAG) |
|
|
Waste |
| R_OX |
953 |
Re-handle Oxide |
|
|
Heap Leach |
| OX |
954 |
Oxide |
<1% |
|
Heap Leach |
| HS_OX |
955 |
High Sulfur Oxide |
1% <S<2% |
|
Heap Leach |
| CILOX |
956 |
Grind Leach Oxide |
<2% |
|
CIP |
| OXPOX |
957 |
Oxide Sent to Autoclave (POX) |
<2% |
>4g/t Au |
Heap Leach |
| CILPOX |
958 |
Grind Leach Sent to POX |
<2% |
>4g/t Au |
CIP |
| LGLSS |
964 |
Low Grade Low Sulfide Sulfur |
SS%<3.494% |
1.12 g/t =<Auppm<2.5 g/t |
POX |
| LGMSS |
965 |
Low Grade Medium Sulfide Sulfur |
3.494%<SS%=<4.15 |
1.12 g/t =<Auppm<2.5 g/t |
POX |
| LGHSS |
966 |
Low Grade High Sulfide Sulfur |
SS>=4.15% |
1.12 g/t =<Auppm<2.5 g/t |
POX |
| MGLSS |
967 |
Medium Grade Low Sulfide Sulfur |
SS%<3.494% |
2.5 g/t =<Auppm<4 g/t |
POX |
| MGMSS |
968 |
Medium Grade Medium Sulfide Sulfur |
3.494%<SS%=<4.15 |
2.5 g/t =<Auppm<4 g/t |
POX |
| MGHSS |
969 |
Medium Grade High Sulfide Sulfur |
SS>=4.15% |
2.5 g/t =<Auppm<4 g/t |
POX |
| HGLSS |
970 |
High Grade Low Sulfide Sulfur |
SS%<3.494% |
Auppm>4 g/t |
POX |
| HGMSS |
971 |
High Grade Medium Sulfide Sulfur |
3.494%<SS%=<4.15 |
Auppm>4 g/t |
POX |
| HGHSS |
972 |
High Grade High Sulfide Sulfur |
SS>=4.15% |
Auppm>4 g/t |
POX |
| | 12-12 | |
| SSR Mining Inc. | Çöpler Property S-K 1300 Report | February 12, 2024 SLR Project No.: 138.21581.00006 |
Figure 12-1: Çöpler
Ultimate Pit Design – Plan View
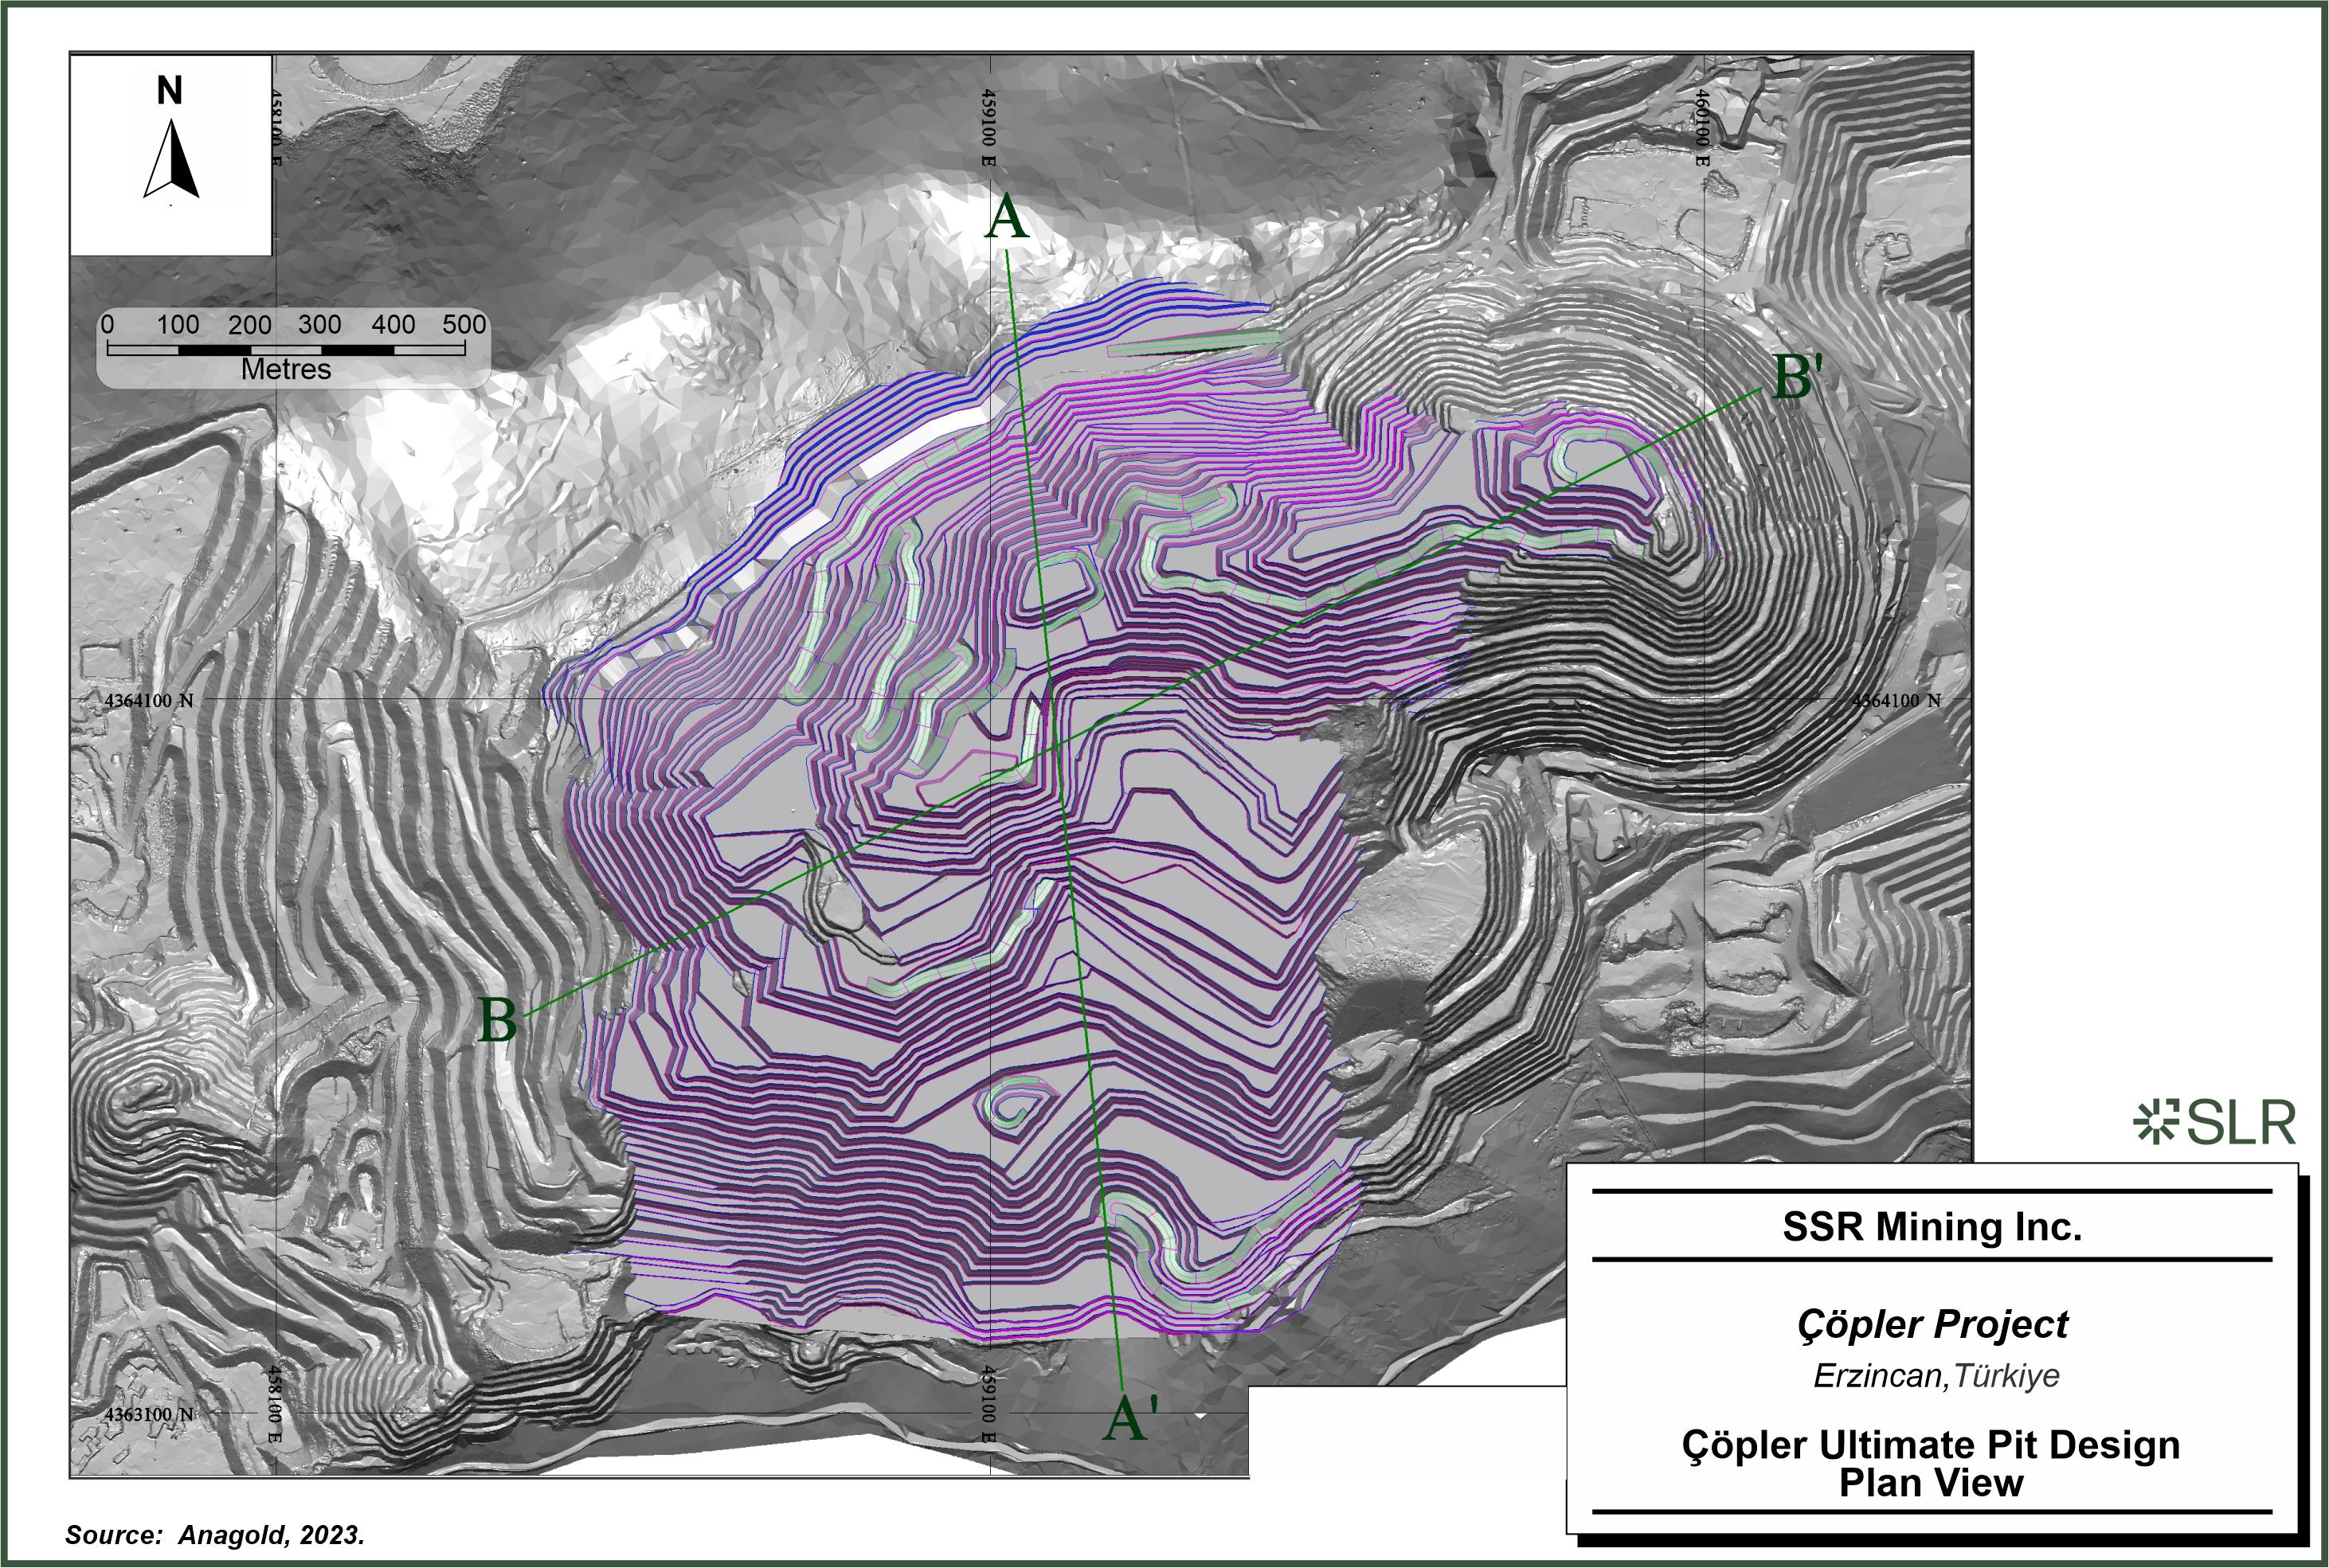
SSR
Mining Inc. Copler Project Erzincan, Turkiye Copler Ultimate Pit Design Plan View
| | 12-13 | |
| SSR Mining Inc. | Çöpler Property S-K 1300 Report | February 12, 2024 SLR Project No.: 138.21581.00006 |
Figure 12-2: Çöpler Ultimate Pit – Cross
Section A-A’ (Looking West)
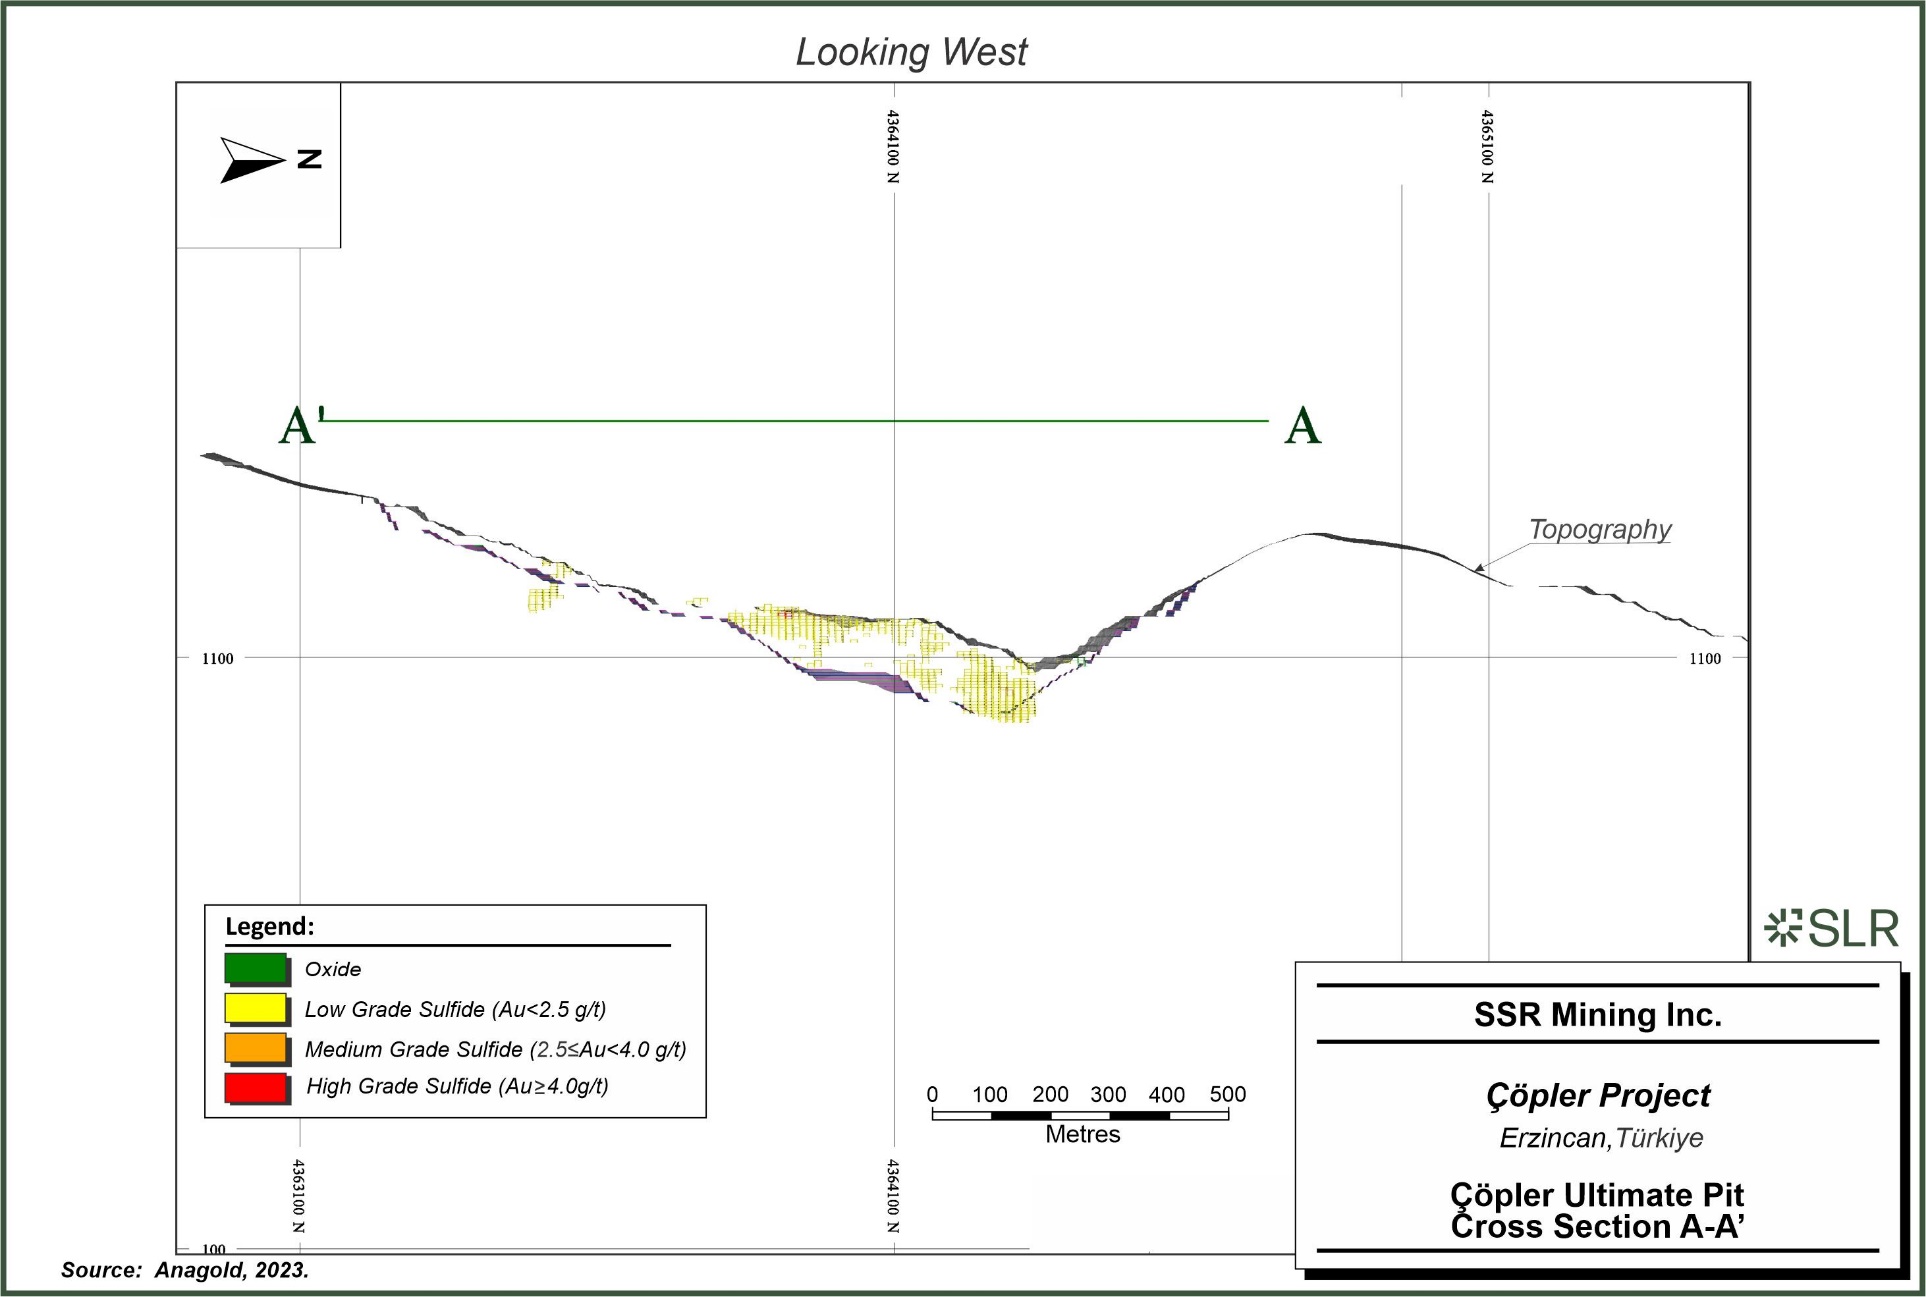
SSR
Mining Inc. Copler Project Erzincan, Turkiye Copler Ultimate Pit Cross Section A-A’
| | 12-14 | |
| SSR Mining Inc. | Çöpler Property S-K 1300 Report | February 12, 2024 SLR Project No.: 138.21581.00006 |
Figure 12-3: Çöpler Ultimate Pit – Cross
Section B-B’ (Looking North)
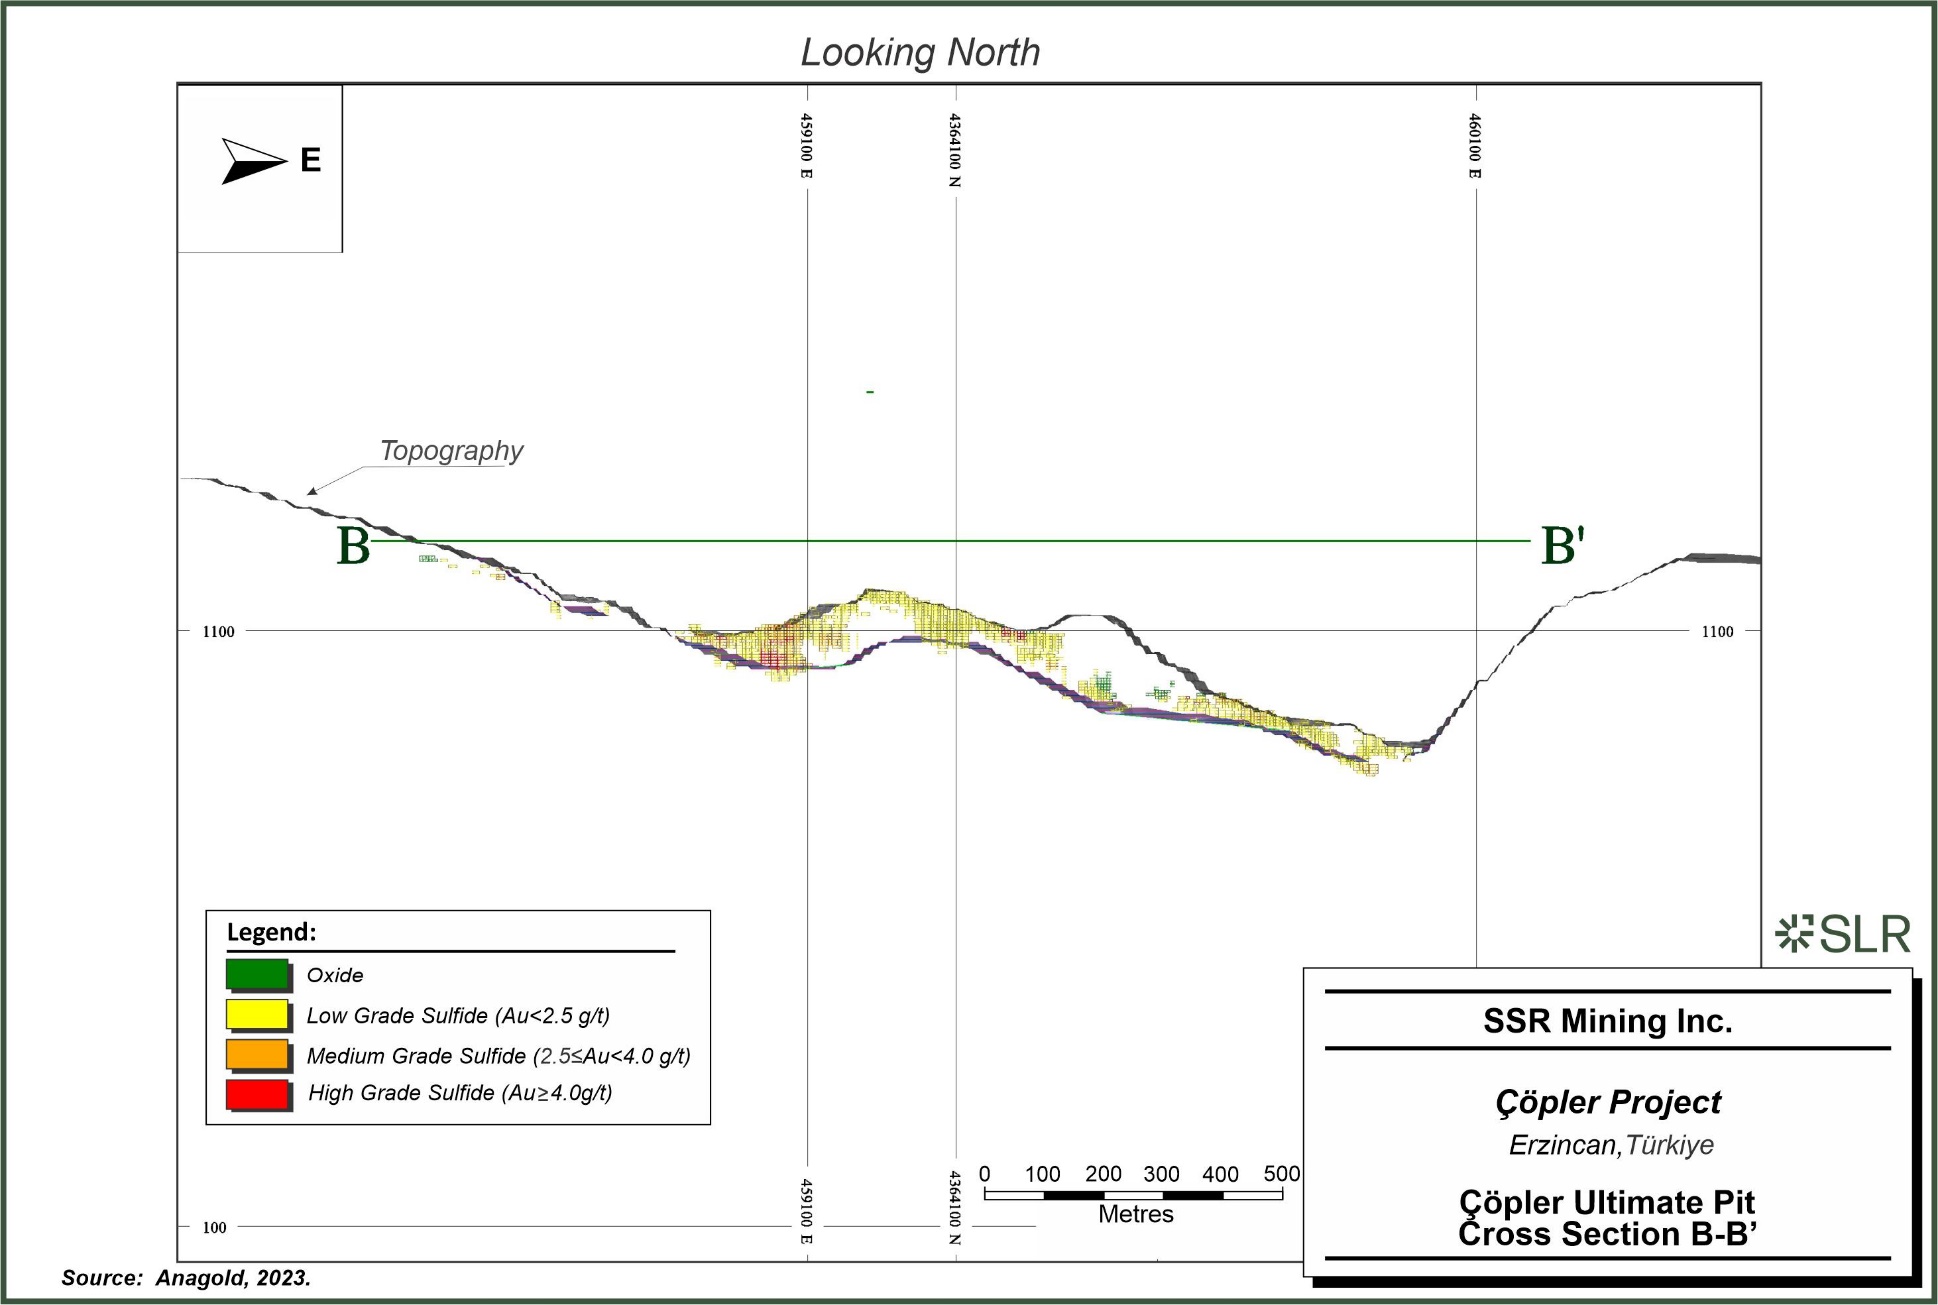
SSR
Mining Inc. Copler Project Erzincan, Turkiye Copler Ultimate Pit Cross Section B-B’
| | 12-15 | |
| SSR Mining Inc. | Çöpler Property S-K 1300 Report | February 12, 2024 SLR Project No.: 138.21581.00006 |
Figure 12-4: Çakmaktepe
Ultimate Pit Design (Plan View)
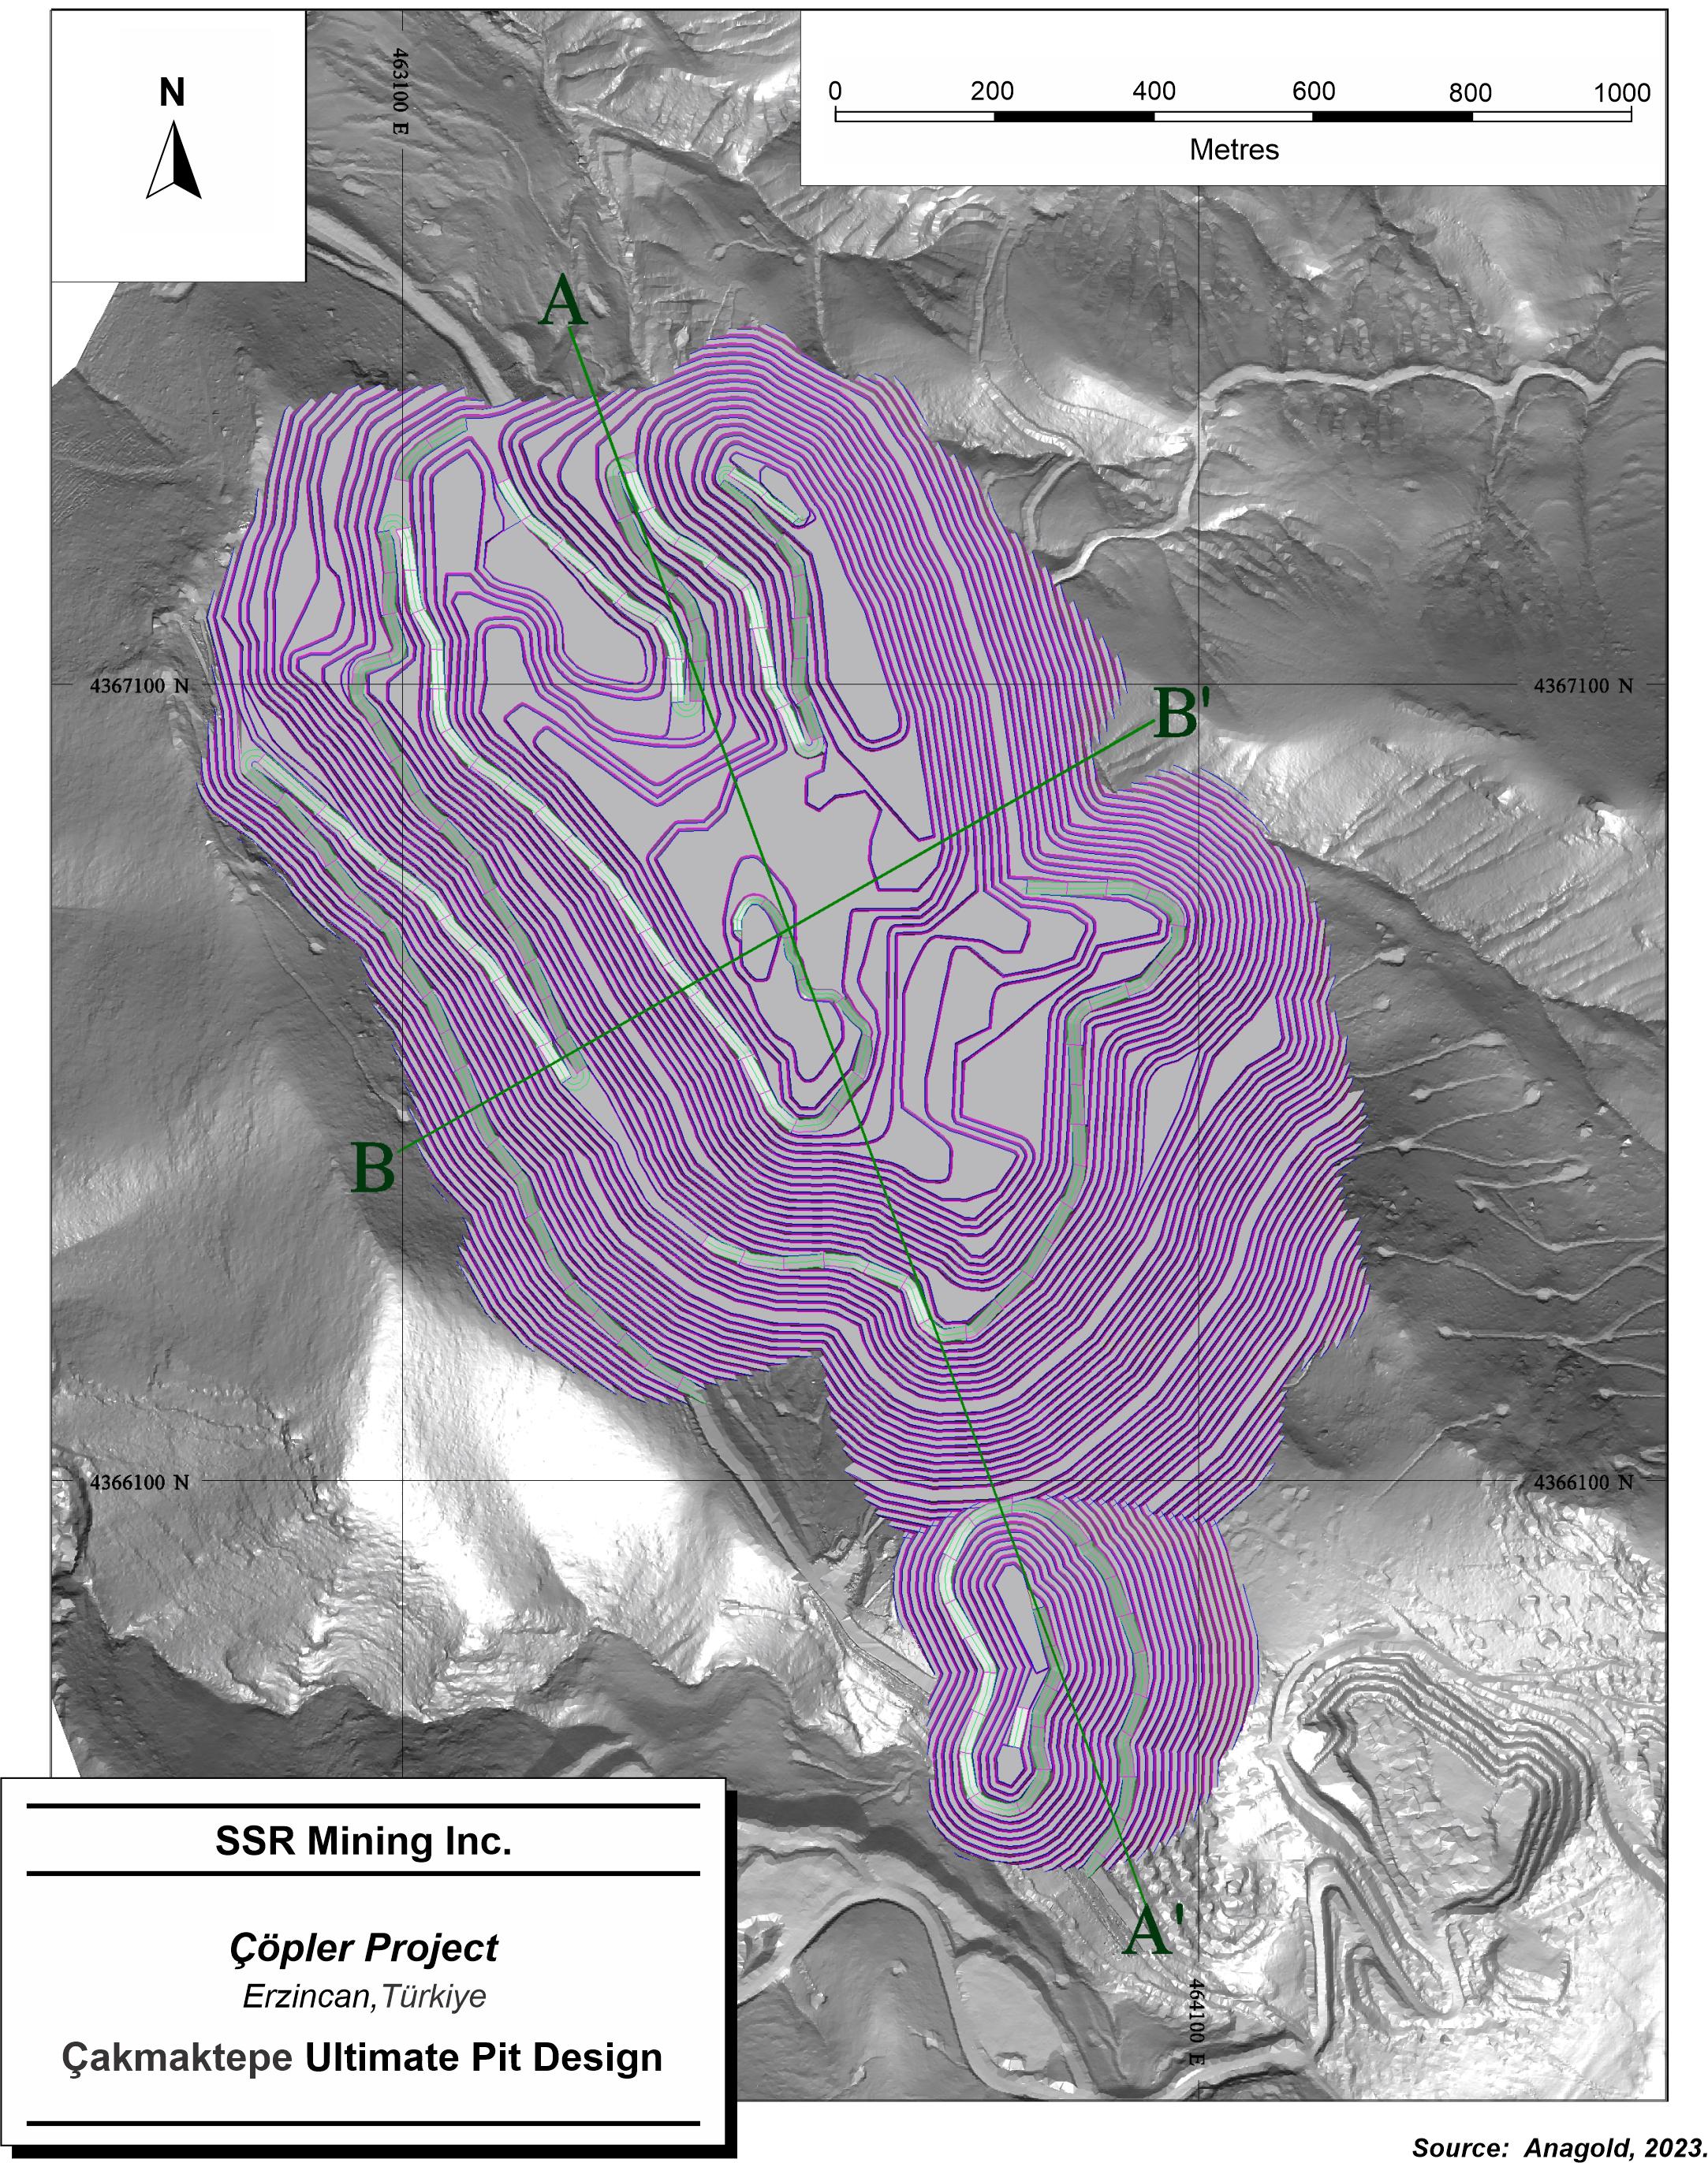
SSR
Mining Inc. Copler Project Erzincan, Turkiye Cakmaktepe Ultimate Pit Design
| | 12-16 | |
| SSR Mining Inc. | Çöpler Property S-K 1300 Report | February 12, 2024 SLR Project No.: 138.21581.00006 |
Figure 12-5: Çakmaktepe Ultimate Pit Design –
Cross Section A-A’ (Looking Southwest)
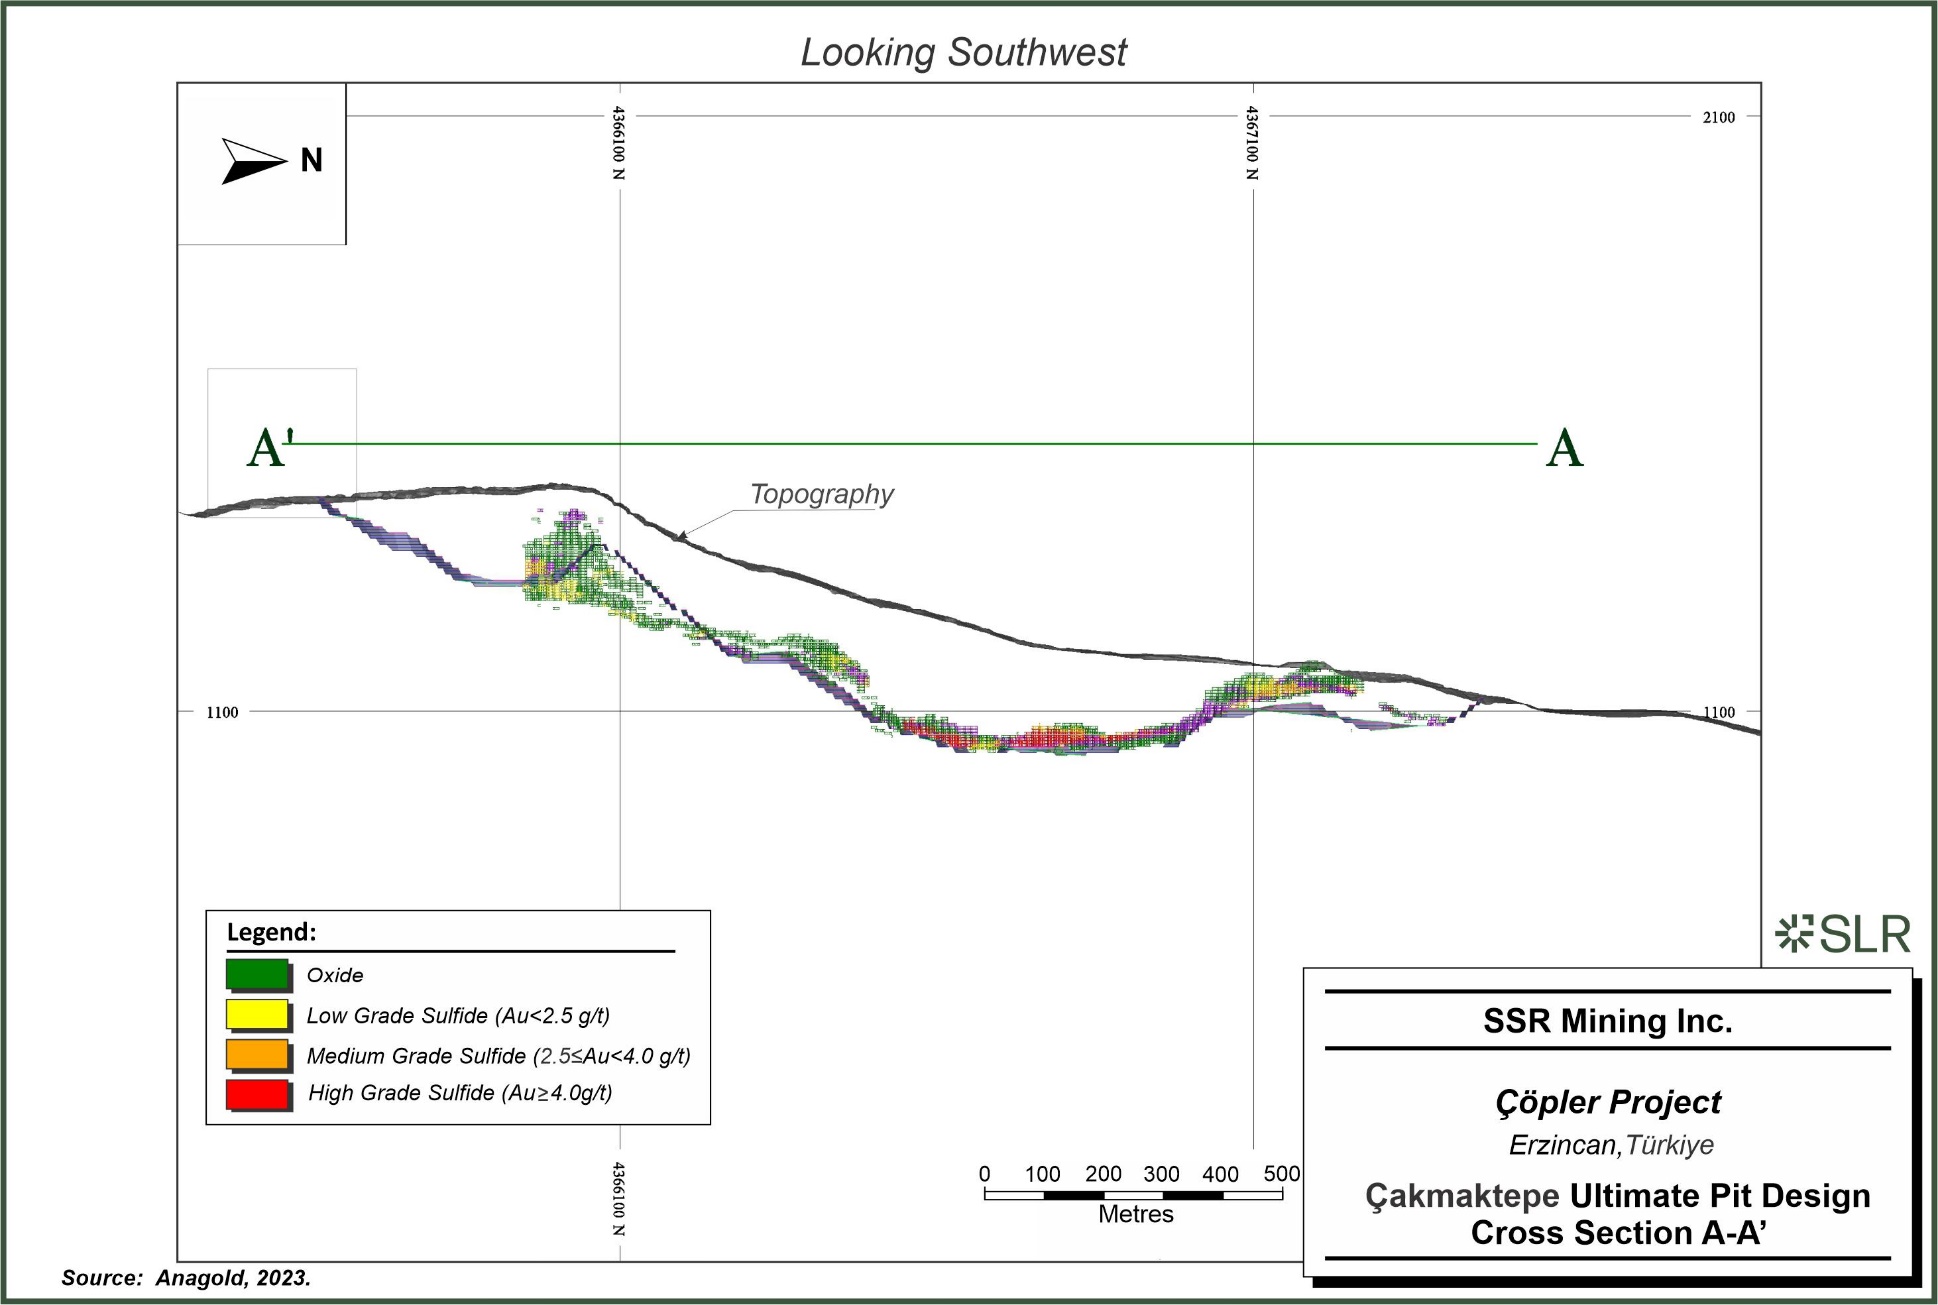
SSR
Mining Inc. Copler Project Erzincan, Turkiye Cakmaktepe Ultimate Pit Design Cross Section A-A’
| | 12-17 | |
| SSR Mining Inc. | Çöpler Property S-K 1300 Report | February 12, 2024 SLR Project No.: 138.21581.00006 |
Figure 12-6: Çakmaktepe Ultimate Pit Design –
Cross Section B-B’ (Looking Northwest)
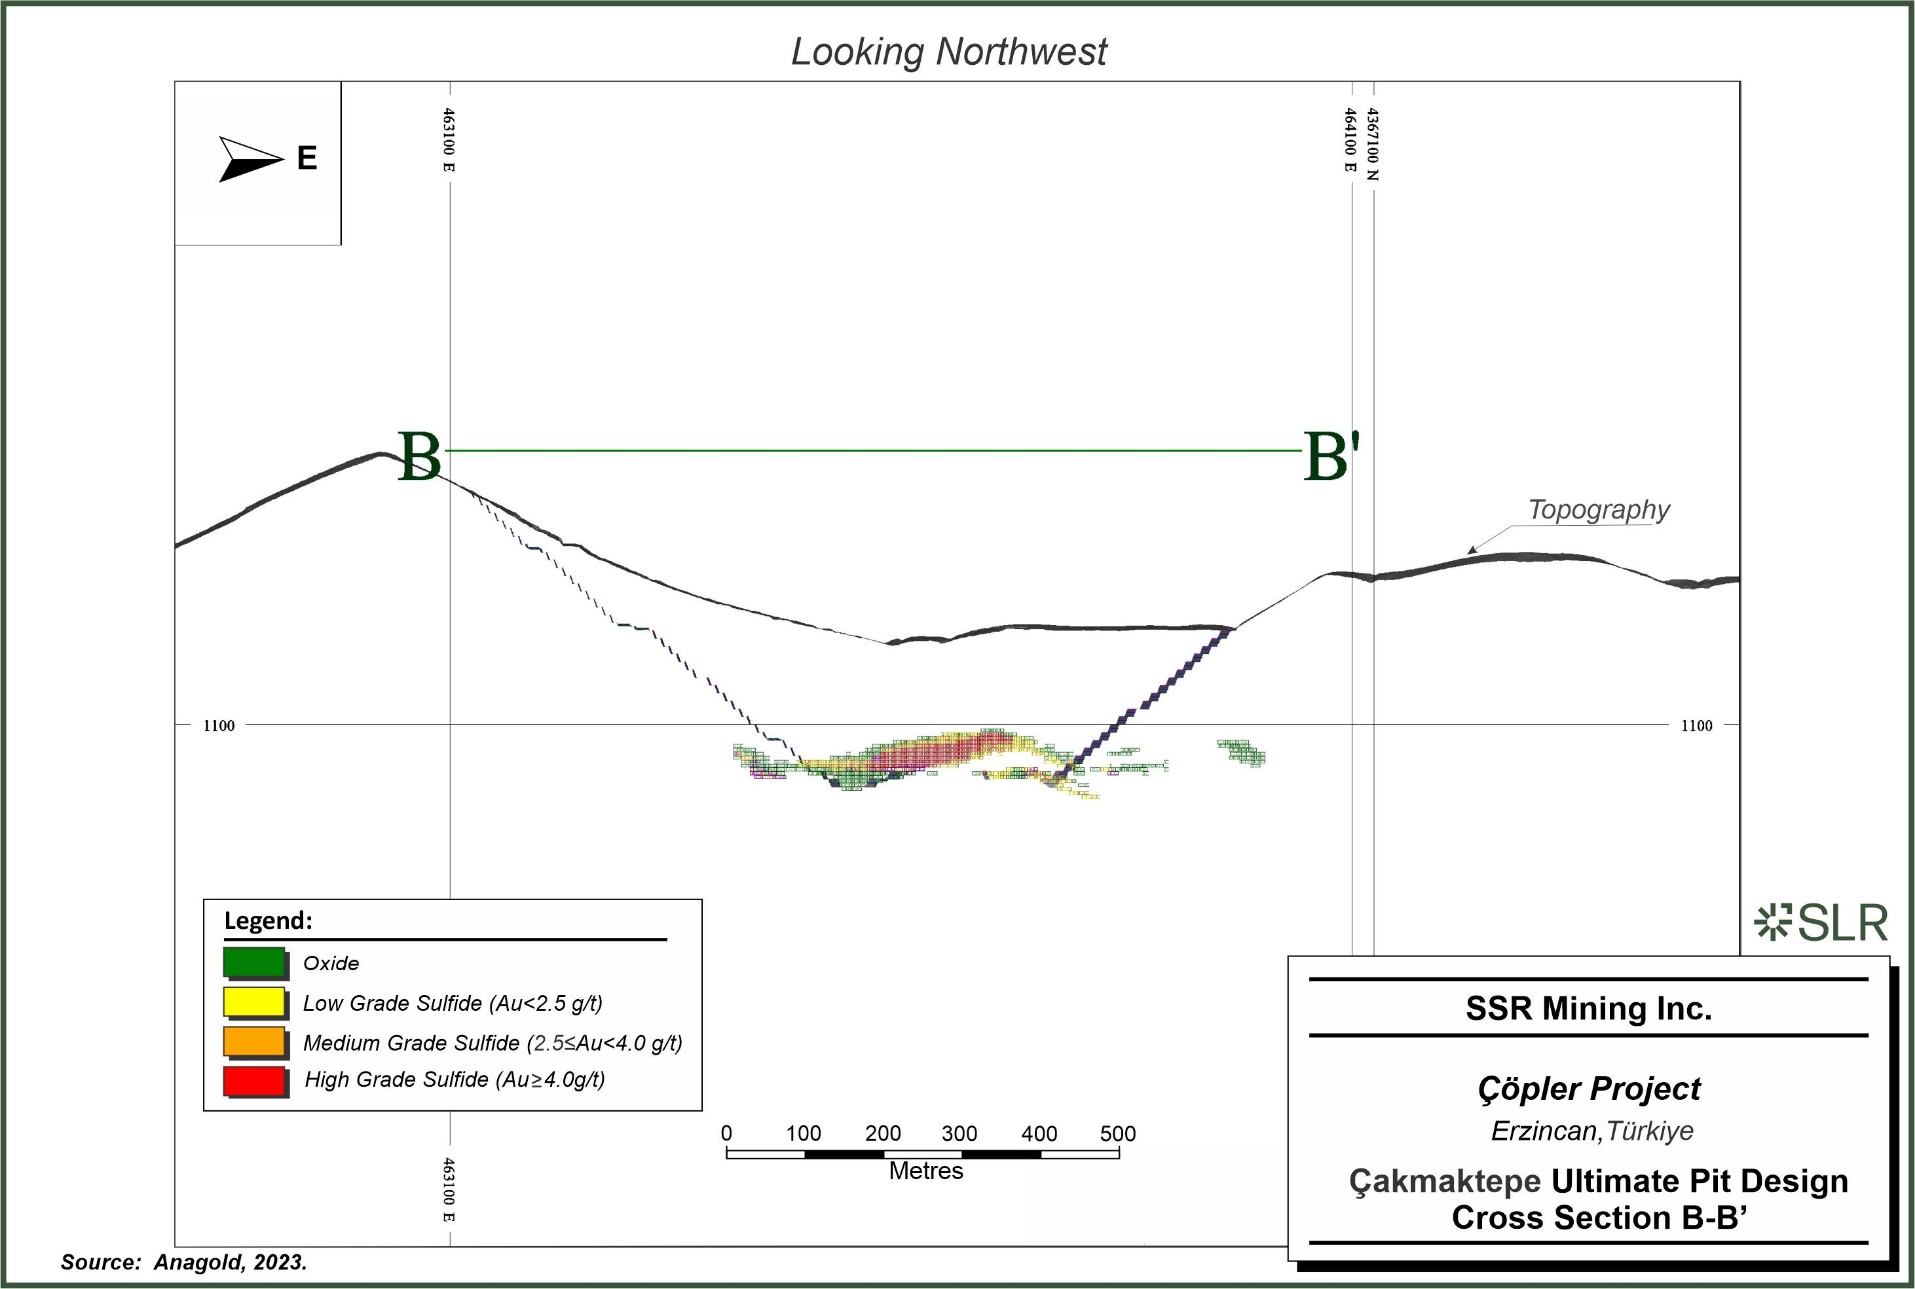
SSR
Mining Inc. Copler Project Erzincan, Turkiye Cakmaktepe Ultimate Pit Design Cross Section B-B’
| | 12-18 | |
| SSR Mining Inc. | Çöpler Property S-K 1300 Report | February 12, 2024 SLR Project No.: 138.21581.00006 |
Significant factors that could materially affect the Mineral Reserve
are:
| · | Metal price impacts – Gold is the primary revenue element, and silver and copper are produced as by-products. The ore is mined
at an elevated cut-off grade and low-grade ore is stockpiled for processing after mining is completed in 2036. |
| · | Processing impacts – The processing analysis in the Reserve Case includes consideration of the existing sulfide flotation circuit
in the sulfide plant used to upgrade sulfide sulfur (SS) to fully utilize grinding and pressure oxidation (POX) autoclave capacity. Continued
debottlenecking of the sulfide plant and optimization of the flotation circuit may improve costs and recoveries, thus lowering the cut-off
grades and positively impacting the Mineral Reserve. The sulfide plant flotation circuit requires grade control protocols and associated
stockpile strategies to manage the required sulfide plant feed blend. It is likely that there will need to be ongoing modification of
the stockpiling cut-offs and procedures for both short-term and long-term blending as the mine progresses. Measures such as increasing
the number of active mining areas, increasing the mining rate, and increasing the size or number of run-of-mine (ROM) stockpiles may be
required. |
| · | Geotechnical impacts – Slope recommendations have significant impacts on the Mineral Reserve. Geotechnical studies are ongoing;
future revisions to the geotechnical guidance may allow the Mineral Reserves to be maximized. |
| · | Seismic impacts – The Project is in an area with a history of significant seismic activity that could negatively impact mining
operations. |
| · | Mining impacts – The mining equipment is suitable for a selective mining unit (SMU) of approximately 3 m x 3 m x 5 m.
This allows for selectivity in mining and enhances the opportunities for blending the feed to the sulfide plant. The total mining rate
in the mine plan is at 22.5 Mtpa (Çöpler mining only), In the past, total mining rates of 36.5 Mtpa (combination
of Çöpler and Çakmaktepe mining) have been achieved. Increasing the total mining rate may allow gold to be brought
forward in the production schedule. |
| · | Environmental, Permitting, Social, and Community – The Çöpler Project is subject to the laws and regulations of
Türkiye, and the mine has several local communities that are nearby. Anagold must maintain appropriate relations with all the authorities
and stakeholders. Social, community and government relations are managed by Anagold and include programs and engagement with the local
communities and both local and national governments. Anagold has remained in compliance with all aspects of the Environmental Impact Assessments
(EIA) and operating permits throughout the history of the Project. |
| 12.5 | Comparison to Previous Estimate |
The Mineral Reserve estimate for the Çöpler Project has
been compared to the previous December 31, 2022 Mineral Reserve estimate as reported in SSR’s 2022 Form 10-K filing (SSR, 2023).
Comparison of the current Mineral Reserve with the 2022 Mineral Reserve shows a net increase in contained gold of 89 koz (SSR Share only)
in the Proven and Probable categories. Changes have occurred from mine depletion, infill drilling results, Mineral Resource model updates,
updates to metallurgical and geotechnical parameters, design changes and addition of leach pad inventory.
The SLR QP reviewed the assumptions, parameters, and methods used to
prepare the Mineral Reserves Statement and is of the opinion that the Mineral Reserves are estimated and prepared in accordance with the
U.S. Securities and Exchange Commission (US SEC) Regulation S-K subpart 1300 rules for Property Disclosures for Mining Registrants (S-K
1300).
| | 12-19 | |
| SSR Mining Inc. | Çöpler Property S-K 1300 Report | February 12, 2024 SLR Project No.: 138.21581.00006 |
The total Mineral Reserves at the Project are estimated to be 67.4 Mt
grading 2.32 g/t Au containing 5.1 Moz of gold, of which 53.9 Mt at an average grade of 2.32 g/t Au, totaling 4.1 Moz of gold is SSR’s 80% share. The Project total Mineral Reserves
support a LOM of 17 years of operational life, including 14 years of active mining followed by an additional three years of processing
the heap leach pad inventory, which currently contains 61 koz of gold, and stockpiles.
| | 12-20 | |
| SSR Mining Inc. | Çöpler Property S-K 1300 Report | February 12, 2024 SLR Project No.: 138.21581.00006 |
The mining method at the Project is open pit mining, carried out by
a mining contractor and managed by Anagold, using conventional drill and blast to facilitate extraction using excavators and trucks. Anagold
currently operates a sulfide process plant, a CIP circuit, and an oxide heap leach facility. Costs are based on actual operational costs
and the Anagold budget assumptions.
The current Çöpler mine
consists of three interconnected open pits aligned in a southwest to northeast direction–the Çöpler Main (west),
Marble (middle), and Manganese (east) pits, as shown in Figure 13-1. Work has begun on the Greater Çakmaktepe pit, which represents
approximately 59% of the stated Mineral Reserve.
The Çöpler pit expansion is proposed to expand the Çöpler
pit area to the south and west. Slopes in the south and southwest pit area will be formed in marble and diorite with slopes approximately
380 m high. Slopes in the west and northwest will be developed in metasediment and diorite with slopes approximately 190 m high. The proposed
expansion also includes a deepening of the Main pit north of the Marble Pit Failure area. This slope will be approximately 220 m high,
and it is expected to be developed primarily in metasediment.
| | 13-1 | |
| SSR Mining Inc. | Çöpler Property S-K 1300 Report | February 12, 2024 SLR Project No.: 138.21581.00006 |
Figure 13-1: Çöpler
Pit - Current Topography and Geology
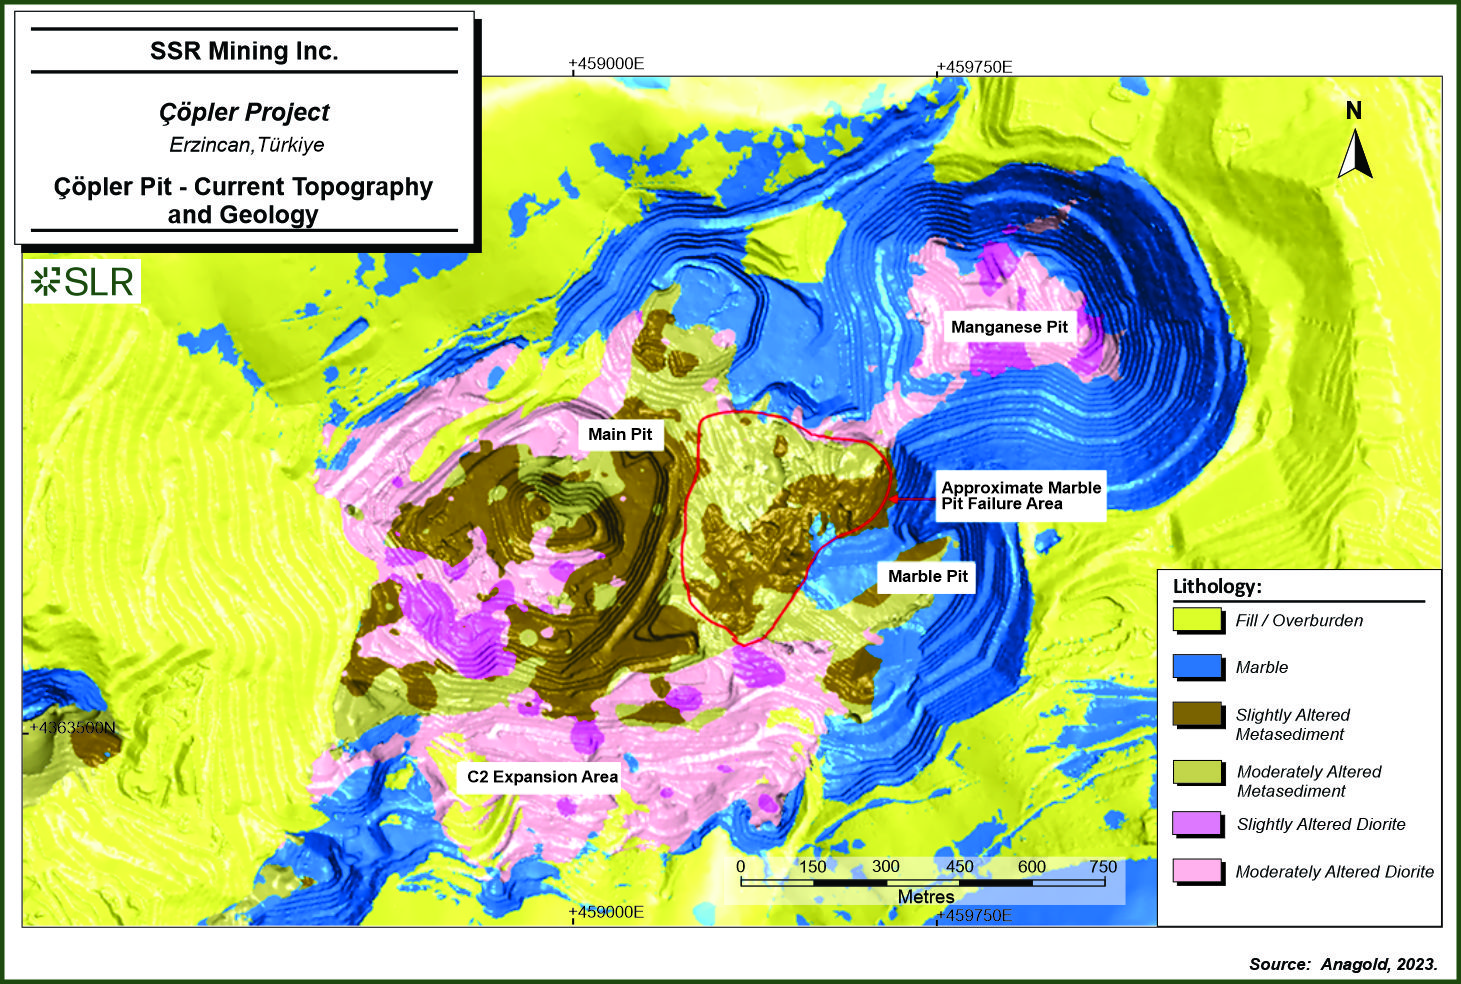
SSR
Mining Inc. Copler Project Erzincan, Turkiye Copler Pit - Current Topography and Geology
| | 13-2 | |
| SSR Mining Inc. | Çöpler Property S-K 1300 Report | February 12, 2024 SLR Project No.: 138.21581.00006 |
This section contains a summary of the feasibility study level mining
geotechnical investigation and design conducted for the Project, which includes the Çöpler pit and the Çakmaktepe pit.
Much of this work has been prepared prior to 2023, however, the work and the recommendations are still applicable to the current mine
designs and workings.
Approximately 41% of the Mineral Reserve is found in the Çöpler
pit, whereas 59% of the Mineral Reserve is found in the Greater Çakmaktepe pit. The bulk of the proceeding discussion involves
the Çöpler pit, because it has been mined since 2011. Much of the knowledge learned from the Çöpler pit geotechnical
analyses is used for the Çakmaktepe pit, because both pits are relatively close to one another and have similar lithological units.
| 13.1.1 | Pit Slope Stability Summary– Çöpler Mine |
A description of each of the pits in the Çöpler Mine follows:
| · | The Main Pit is located to the west of the Manganese and Marble pits. This pit is developed in limestone and marble
in the upper portions of the north slopes and developed in metasediment and diorite in the
remaining slopes. Altered metasediments and diorite are encountered in final slopes, which cause bench and inter-ramp scale instability.
Metasediment and diorite are observed to have varying degrees of alteration in this pit. |
| · | The Marble Pit is located in the southeast portion of the current Çöpler Mine layout. Slopes on the eastern side of the
pit were developed in limestone and marble. SSR did not encounter significant slope instability issues
in eastern slopes. Slopes on the western portion of the Marble pit are developed in metasediments. A large slope instability occurred
in the western slopes starting in November 2014, referred to in this report as the Marble Pit failure area (Figure 13-1). This failure
is interpreted to have been caused by sliding through highly altered metasediment material.
Mitigation of this failure by the engineering and mine department is ongoing as of the date of this report. |
| · | Mining in the Manganese Pit is complete and SSR does not expect significant development to the pit configuration during the pit expansion.
The pit is primarily developed in limestone and marble; intrusive diorite was encountered in the lower regions of the pit. SSR did not
encounter significant slope instability issues while mining the Manganese Pit. |
The Çöpler mine maintains an on-site geotechnical monitoring
program that consists of 120 prisms, nine tiltmeters, a long-range synthetic aperture radar, and daily data and field monitoring.
Additional work is currently in progress to implement pit slope depressurisation. It is expected that pit slope depressurisation will
be used extensively throughout the Main Pit as the sulfide pit phases are progressed.
In 2021, nine oriented core holes were drilled within the Greater Çakmaktepe
ultimate pit boundary. Physical properties, laboratory testing, and both kinematic and 2D limit equilibrium (LE) analyses were completed
to determine the appropriate design slope angles for the pit. It should be noted that Golder (2021c) recommends a 16-m wide geotechnical
berm in highwalls greater than 120 m.
| 13.1.2 | Geotechnical Studies |
Geotechnical studies at the Project were conducted starting in 2004,
and mining began in the Çöpler pit in 2011. In 2014, a major highwall failure occurred in the Marble Pit. Golder Associates
Inc. (Golder, now WSP) has provided geotechnical slope recommendations since 2014, as well as geotechnical recommendations for other site
facilities and WRDs. The most recent recommendations were presented in Golder 2021a, 2021b, and 2021c.
| | 13-3 | |
| SSR Mining Inc. | Çöpler Property S-K 1300 Report | February 12, 2024 SLR Project No.: 138.21581.00006 |
| 13.1.2.1 | Geotechnical Domains |
Golder (now WSP) completed a geotechnical site review in 2014. Based
on Golder (2014c), the following geotechnical domain categories are considered appropriate for design recommendations:
| · | Marble / limestone – characterized by competent rocks and marble-ized near the Çöpler intrusion. |
| · | Fresh diorite – characterized as a fresh to slightly weathered or altered moderately strong rock. |
| · | Hydrothermally altered diorite – alteration sufficient to significantly reduce strength relative to fresh diorite, but
without the shearing and intense clay alteration of contact and fault zones. |
| · | Weathered diorite and metasediment – highly weathered, extremely weak rock and soil that occurs in the oxidized zone
(typically to 30 m depth). |
| · | Fresh metasediment – fresh to slightly weathered, weak to moderately strong rock consisting of a turbidite sequence that
may also be structurally complex near faults. |
| · | Hydrothermally altered metasediment – alteration sufficient to significantly reduce strength relative to fresh metasediment,
but without the shearing and intense clay alteration of contact and fault zones. |
| · | Fault gouge including intrusive contact and intense sulfide alteration – slicken sided plastic clay with rock fragments
that occurs in fault zones including the intrusive contacts. |
Where data are insufficient within the alteration zones, the most conservative
pit slope angle is assumed. There is an upside potential to increase the slope if the alteration zone is defined in the geological model.
The above listed geotechnical domains are mostly well known and modeled in the geologic model. The alteration zones vary significantly
and have not been modeled. It has been recommended by Golder that the best way to identify alteration zones is by modeling RQD in the
geologic model. For this purpose, RQD values of 15% and less are considered altered and RQD values greater than 15% are considered unaltered,
or fresh. Currently, the resource model does not contain RQDs, however, SSR has a separate model for Greater Çakmaktepe generated
by WSP (Golder) based on RQD data. There is an internal working model at Çöpler, which is used for slope guidelines in their
pit designs, and this model has been verified by Furgo.
| 13.1.2.2 | Rock Quality Designation (RQD) Model |
RQD is used as a simple and inexpensive indication of rock mass quality.
At the Çöpler Project, it has been determined that RQD is a reliable indicator of alteration; areas with RQD modeled as being
less than 15% are considered altered.
Standard testing of RQD was collected on 661 diamond core holes, and
30 of these drill holes were drilled within the pit for metallurgical purposes. The 661 holes represent approximately 34% of all drilling
in the Çöpler deposit. The Main pit contains RQD measurements for holes evenly spaced with data gaps occurring in the Manganese,
Marble, and West pits. The West pits are mined out as of October 31, 2023.
| | 13-4 | |
| SSR Mining Inc. | Çöpler Property S-K 1300 Report | February 12, 2024 SLR Project No.: 138.21581.00006 |
RQD was interpolated in the resource model using the inverse distance
method, weighted to the power of two (ID2) with 2 m drill hole composites. A total of six domains were used to estimate RQD values
and included a distinction between oxide and sulfide material. To account for the variance in sample spacing, a two-pass approach was
used to capture available samples. Model cell estimates were limited to the search distances used with no attempt to assign RQDs to un-estimated
cells.
| 13.1.2.3 | Rock Strength and Rock Mass Quality |
Golder (2021a) included an update on rock and soil strengths, as summarized
in Table 13-1, which indicated uniaxial compressive strengths (UCS) could be lower by nominally 35% for diorite and 12% for metasediments
than those summarized in Golder (2019), based on Hoek & Brown envelopes and with a comparison over a normal stress range of 40 kPa
to 700 kPa.
Table 13-1: Golder Intact Strength
Estimates (General)
| Rock Type |
Golder 2019 |
Golder 20211 |
| UCS (MPa) |
mi |
UCS (MPa) |
mi |
| Metasediments |
49 |
22 |
41 |
14 |
| Diorite |
42 |
28 |
22 |
24 |
| Carbonates |
41 |
10 |
|
|
Source: Golder, 2021a.
Notes:
| 1. | 35% percentile values suggested by Golder |
Anagold had undertaken mapping of rock mass quality, the geological
strength index (GSI), within the Çöpler pit between 2015 and 2017.
The mapping indicated geological strength index (GSI) values typically
below 40. Figure 13-2 provides the data from mapping of the Çöpler Main pit, where most of the mapping took place (225
measurements, predominantly of diorite and metasediments). Additional mapping of the Marble and Manganese pits also took place, with a
total of 42 data points. It was interpreted the alteration noted as OX relates to oxidized/altered materials and SU relates to presence
of sulfides, i.e., fresh rock. The data from Anagold’s GSI mapping exercise, as presented in Figure 13-2, infers median GSI
values of nominally 19 for altered diorite, less than 20 for fresh diorite, 23 for altered metasediments, and 38 for fresh metasediments.
| | 13-5 | |
| SSR Mining Inc. | Çöpler Property S-K 1300 Report | February 12, 2024 SLR Project No.: 138.21581.00006 |
Figure 13-2: Geological Strength
Index (GSI) Mapping of Çöpler Main Pit
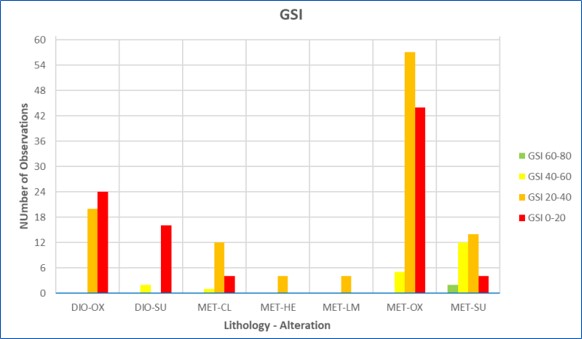
The Anagold mapping identified lower rock mass quality than what was
adopted in the previous Golder studies and with the following values noted for rock like materials by Golder:
With this additional information, Golder assigned the lower GSIs in
2021 as mapped by Anagold because of three factors (Golder, 2021a):
| 1 | Observed intact strengths and RQD in the field were lower than typically seen in the core, which had been used by Golder in assessing
rock mass quality of the rock-like materials. |
| 22. | Greater percentage of soil-like material in the exposures with significantly lower GSIs. |
| 23. | Golder has assumed the percentages of rock-like material comprise 60% of the diorite and 75% of the metasediments. |
Golder recommended a rock mass quality model be created to allow the
slope design recommendations to be appropriately implemented. Such a model needed to take into consideration the Anagold rock mass quality
mapping, which suggested a higher proportion of soil-like materials in the slopes than the Golder estimates.
WSP (2023a) emphasises that the slopes need to be depressurized in order
to maintain adequate Factors of Safety in the pit wall slopes.
| 13.1.2.4 | Seepage Locations and Piezometer Data |
The available seepage locations and piezometer data are provided by
Golder (2021c), however, there is key information that is not addressed by Golder and these comprise:
| | 13-6 | |
| SSR Mining Inc. | Çöpler Property S-K 1300 Report | February 12, 2024 SLR Project No.: 138.21581.00006 |
| · | The seepage is focused on the contact between Diorite and Metasediments, as can be noted in comparing the lithology in Figure 13-1
and seepage locations in Figure 13-3. |
| · | There is no clear indication of the significance of the piezometer data. |
| · | The nominal piezometer locations are presented in Figure 13-3 (red dots) and the compiled data in form of a hydrograph in Figure
13-4. The followings trends observed are as follows: |
| · | Significant compartmentalization in piezometer Pa3. |
| · | Lower groundwater level near limestone contact, piezometer Pa1. |
| · | Groundwater conditions elsewhere indicating phreatic surface at the mined slope and with a Hu of nominally 70% (i.e., 70% of hydrostatic)
(The Hu value is a factor between 0 and 1, by which the vertical distance from a point (in the soil or rock) to a Water Surface (i.e.
Piezo Line) is multiplied to obtain the pressure head and indicating depressurization of the slopes). |
| | 13-7 | |
| SSR Mining Inc. | Çöpler Property S-K 1300 Report | February 12, 2024 SLR Project No.: 138.21581.00006 |
Figure 13-3: Locations of Seepage
and Ponding in 2021
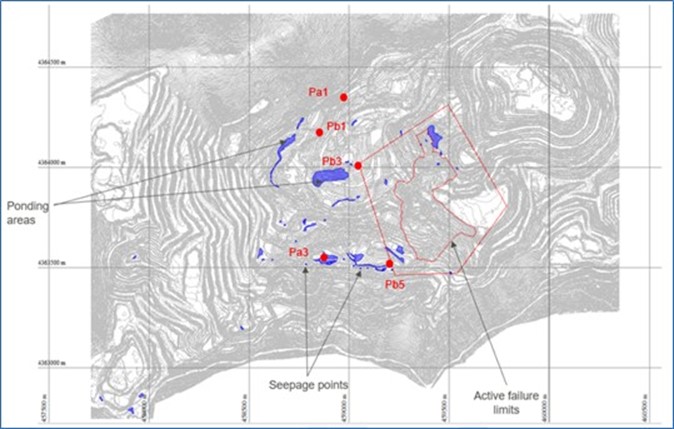
| | 13-8 | |
| SSR Mining Inc. | Çöpler Property S-K 1300 Report | February 12, 2024 SLR Project No.: 138.21581.00006 |
Figure 13-4: Çöpler
Vibrating Wireline Piezometer (VWP) Data
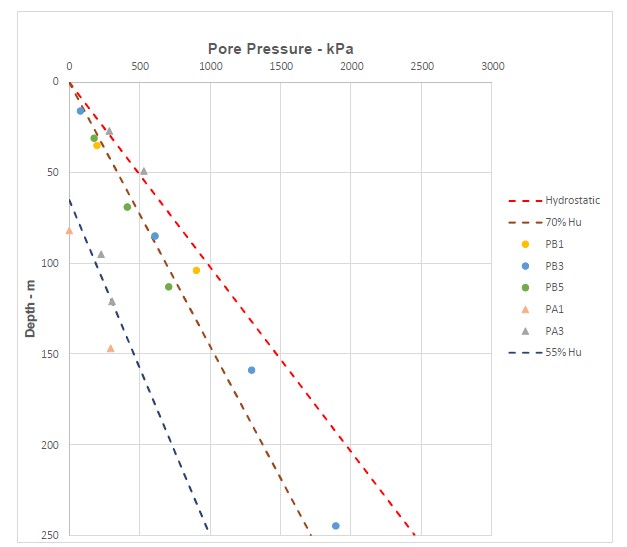
Source: Golder, 2021.
| 13.1.2.5 | Pit Slopes and Interaction with Ultimate Pit Design |
Golder in 2021 and 2023 provided updates on structural data where faults
provided potential control on overall pit slopes for the circled areas shown in Figure 13-5.
| | 13-9 | |
| SSR Mining Inc. | Çöpler Property S-K 1300 Report | February 12, 2024 SLR Project No.: 138.21581.00006 |
Figure 13-5: Çöpler
Geotechnical Units
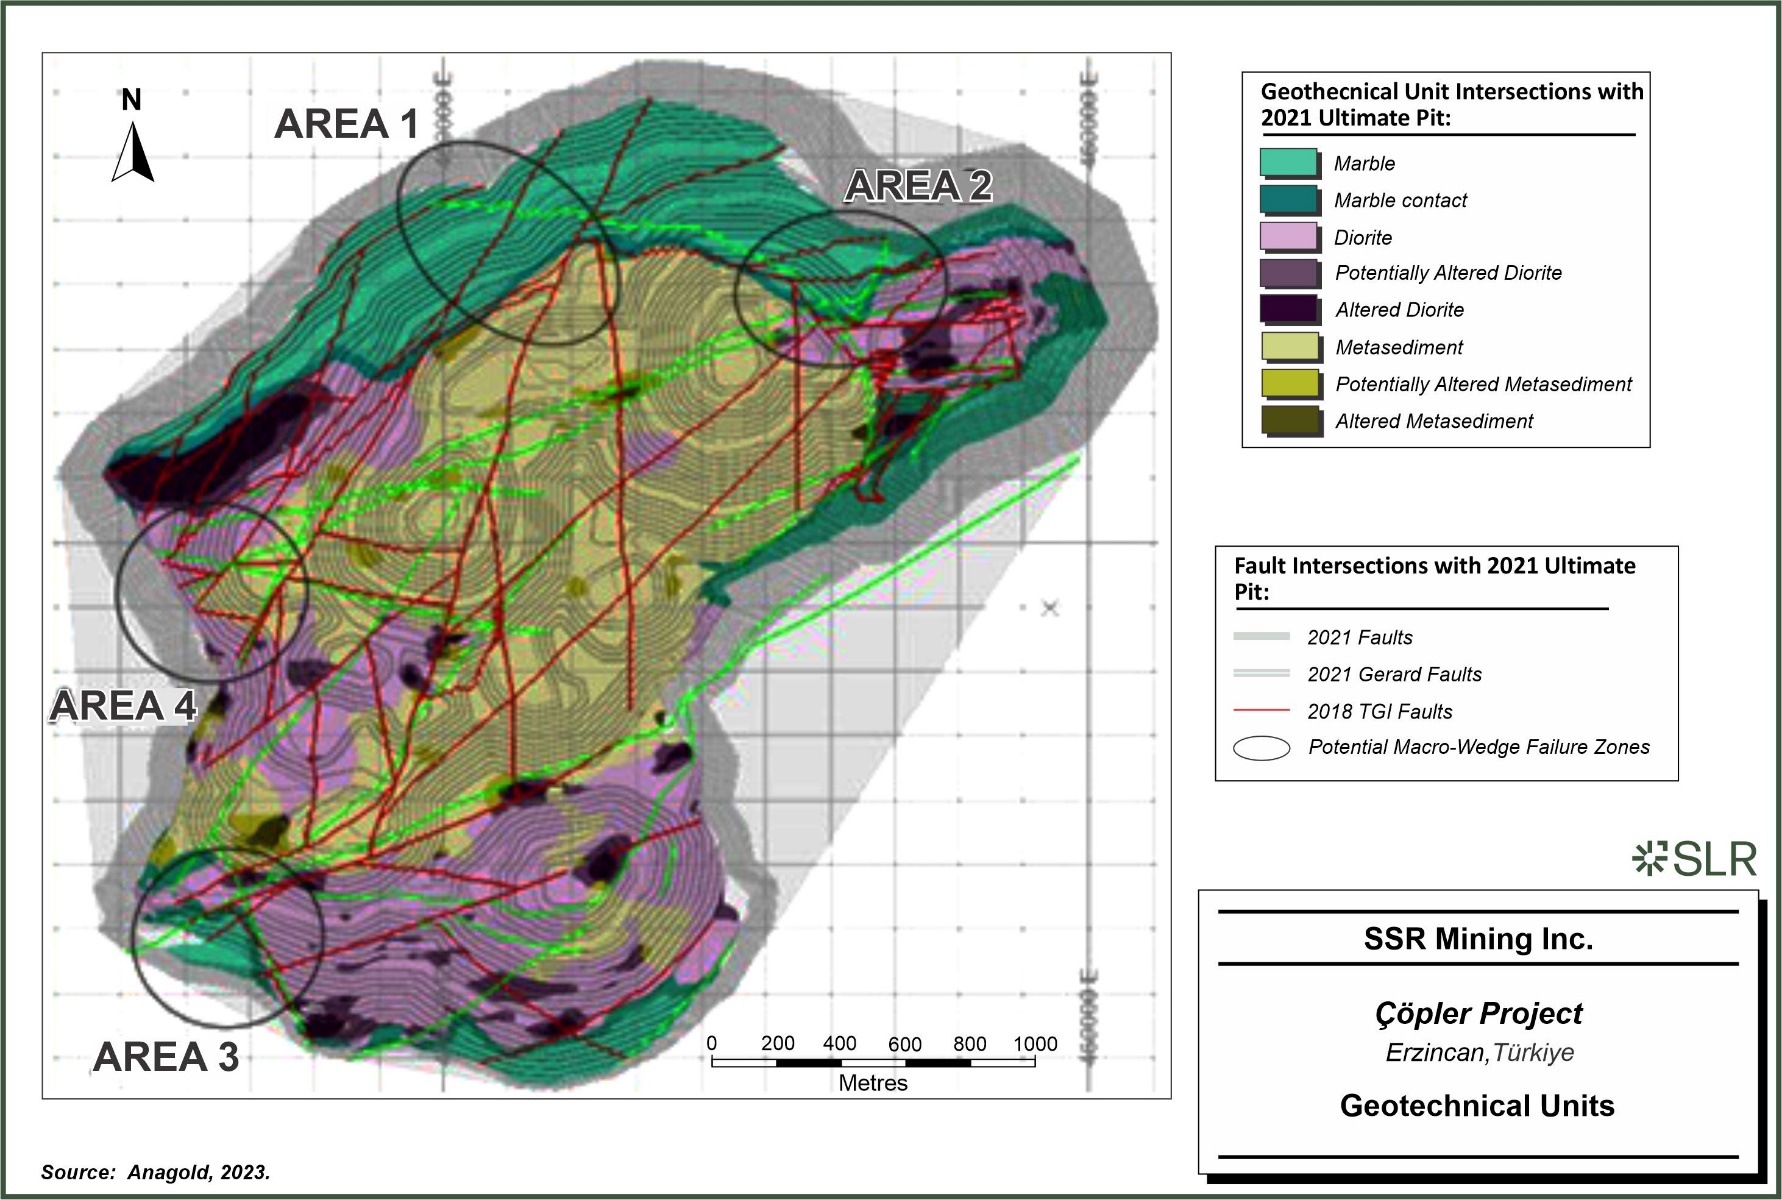
SSR
Mining Inc. Copler Project Erzincan, Turkiye Geotechnical Units
| | 13-10 | |
| SSR Mining Inc. | Çöpler Property S-K 1300 Report | February 12, 2024 SLR Project No.: 138.21581.00006 |
Golder (2021c) notes several studies, including both external and internal
reports. Two reports relate to internal design checks, which indicate a requirement for localized flattening of designs in areas of altered
materials. For the two examples presented, the issues relate to potential impacts on slopes over two benches high and with very high Factors
of Safety (FOS) for global stability. Golder also notes “local instabilities may occur where pockets of altered rock mass are exposed
on benches. If the altered rock mass area is significant, i.e., exposed over more than two benches, or if the local instabilities cannot
be managed by operations, then the mine may need to locally adapt the slope configuration to the altered rock mass slope design or change
the whole domain to the shallower altered rock mass design angles”.
With regards to the LOM designs completed in 2021, Golder (2021c) noted
that the geometric design for the Çöpler pits conforms with Golder pit slope design recommendations. During this review, some
areas were identified and further design evaluations were recommended.
Details of the operational pit slope performance were unknown to Golder.
The pit slope performance would provide valuable information. Golder (2021c) notes a requirement for slope stability analyses to address
“maximum vertical height for uninterrupted interramp slopes and geotechnical berm widths” as well as set back distances from
the designed pit crest to the existing WRDs. Further, Golder noted that Anagold had recently developed 3D solids for altered and potentially
altered rock masses based on the RQD evaluation from the entire database.
| 13.1.2.6 | Geotechnical Recommendations and Further Studies |
Golder (2021c) highlighted potential issues of concern. The SLR QP concurs
with Golder’s key recommendations, as follows:
| · | Appropriate interaction between Anagold and Golder is required such that an appropriate rock mass quality model is developed either
“backboned” to existing Anagold models or appropriately using geotechnical borehole logging data and rock mass quality mapping
to develop a model. The primary aim, regardless of approach, is that the Golder slope design recommendations relate to an Anagold rock
mass quality model so that designs can be appropriately implemented. |
| · | Future and ongoing design revisions must be based on a feedback loop that includes an appropriate revision of rock strengths based
on back analysis of failure and review of slope performance. |
| · | Pit highwall stability analyses must be completed once the above components are completed and with appropriate revision of slope design
parameters. |
As part of the Çöpler Expansion Project, WSP performed an
updated geotechnical model review in 2023 (WSP, 2023a). In summary, the WSP findings stress the importance of depressurizing and dewatering
in both unaltered and altered rock units. The need to have dewatered and depressurized slopes is critical in the altered metasediments
and diorites.
Professor Tamer Topal from Middle East Technical University (METU) has
prepared geotechnical evaluation reports on slope stability for the open pit mine, specifically addressing the south wall failure in the
Marble pit, which occurred in 2014. The scope appeared to be limited to a single stability analysis (i.e., one cross-section) based on
piezometer data from specific drilled boreholes and utilising all available monitoring (inclusive of inclinometers). The slow landslide
movements and groundwater levels have been evaluated in these reports. Landslides are being monitored continuously by Anagold and derived
results were used in stability analyses for static and dynamic conditions.
| | 13-11 | |
| SSR Mining Inc. | Çöpler Property S-K 1300 Report | February 12, 2024 SLR Project No.: 138.21581.00006 |
It is also noted by Professor Topal that Çöpler is located
in a first-degree earthquake seismic zone (Sial 2004), which can experience acceleration values that range from 0.3 g to 0.4 g.
| 13.1.3 | Pit Slope Design Parameters |
The 2023 recommended pit slope design parameters for the Çöpler
pit are presented in Table 13-2. Figure 13-6 illustrates the geotechnical domains for the Çöpler pit as well as specific
geotechnical recommendations on pit design.
The recommended 2023 pit slope design parameters for Greater Çakmaktepe
are shown in Table 13-3. The design parameters for Greater Çakmaktepe are in relation to the Central pit.
| | 13-12 | |
| SSR Mining Inc. | Çöpler Property S-K 1300 Report | February 12, 2024 SLR Project No.: 138.21581.00006 |
Table 13-2: Çöpler
2023 Recommended Mine Pit Slope Parameters
| Geotechnical Domain |
Slope Design Sector |
Wall Orientation (Azimuth) |
Bench Height
(m) |
Design BFA1
(deg.) |
Catch Bench Width
(m) |
IRA2
(deg.) |
Comments |
| Marble |
MA1 |
190 - 290 |
15 |
55 |
7.5 |
40 |
BFA limited by southwest dipping structural set 1, which has reduced dip angle in expansion area. |
| MA2 |
290 – 350 |
15 |
60 |
7.5 |
43 |
BFA limited by northwest dipping structural set 2. |
| MA3 |
All Other Orientations |
15 |
70 |
7.5 |
49 |
Maximum achievable BFA |
| Slightly and Moderately Altered Diorite |
DIO1 |
040 - 100 |
10 |
50 |
6 |
35 |
BFA limited by northwest dipping structural set 6. |
| DIO2 |
100 – 160 |
10 |
55 |
6 |
37.5 |
BFA limited by wedges formed between structural sets 5 and 6. |
| DIO3 |
All Other Orientations |
10 |
60 |
6 |
40 |
Maximum BFA; IRA recommendation assumes depressurization targets achieved (5 m to 15 m behind highwall) |
| Slightly Altered Metasediments |
MET1 |
330 – 020 |
10 |
50 |
6 |
35 |
BFA limited by wedges formed between structural sets 6 and 7a. |
| MET2 |
020 – 055 |
10 |
45 |
6 |
32 |
BFA limited by northwest dipping structural set 6. |
| MET3 |
055 - 120 |
10 |
60 |
6 |
40 |
BFA limited by wedges formed between structural sets 4a and 6 |
| MET4 |
120 - 170 |
10 |
70 |
6 |
46 |
Maximum achievable BFA |
| MET5 |
170 – 300 |
10 |
65 |
6 |
43 |
BFA limited by structural controls |
| MET6 |
300 – 330 |
10 |
70 |
6 |
46 |
Maximum achievable BFA |
| Moderately Altered Metasediment (Depressurization Targets) |
AMET4 |
120 – 170 |
10 |
70 |
6.5 |
45 |
Increased catch bench to achieve 45⁰ IRA |
| AMET6 |
300 – 330 |
10 |
70 |
6.5 |
45 |
Increased catch bench to achieve 45⁰ IRA |
| |
All Other Orientations |
BFA structurally controlled. Refer to recommendations of Slightly altered Metasediment. |
| Moderately
Altered Metasediment (Undrained)3 |
AMET1 |
330 – 020 |
10 |
50 |
6 |
35 |
BFA limited by wedges formed between structural sets 6 and 7a. |
| AMET2 |
020 – 055 |
10 |
45 |
6 |
32 |
BFA limited by northwest dipping structural set 6. |
| AMET3 |
055 - 120 |
10 |
60 |
8.5 |
35 |
Increase catch bench width to achieve 35⁰ IRA |
| AMET4 |
120 - 330 |
10 |
70 |
10.5 |
35 |
Increase catch bench width to achieve 35⁰ IRA |
| AMET5 |
170 – 300 |
10 |
65 |
9.5 |
35 |
Increase catch bench width to achieve 35⁰ IRA |
| AMET6 |
300 – 330 |
10 |
70 |
10.5 |
35 |
Increase catch bench width to achieve 35⁰ IRA |
| |
|
|
|
|
|
|
|
|
|
|
|
| | 13-13 | |
| SSR Mining Inc. | Çöpler Property S-K 1300 Report | February 12, 2024 SLR Project No.: 138.21581.00006 |
Notes:
| 3. | For slopes that are not depressurized. |
Source: WSP, 2023a
Table 13-3: Greater Çakmaktepe
2023 Recommended Mine Pit Slope Parameters
| Slope Design Sector |
Wall Dip Direction
(°) |
Max OSA1
(°)1 |
Max IRA2
(°) |
BFA3
(°) |
Bench Width
(m) |
Comments |
| Overburden |
- |
- |
26 |
35 |
6.0 |
Apply 2H:1V.
Must be effectively depressurized and protected from erosion |
| Fault or Contact Influenced Rock Mass |
- |
- |
25 |
45 |
5.0 |
Design requires bench height of 5 m.
Not currently anticipated, however, these design sectors might be required
locally (e.g., the Southeast corner)
Stability will be sensitive to presence of groundwater |
| 1a (NE) |
195° - 295° |
42 |
42 |
65 |
6.5 |
BFA controlling factor, entire slope is in Ophiolite.
Opportunity to increase BFA to 70° and IRA 45° depending on quality
of Ophiolite benches. |
| 1b (E) |
42 |
42 |
65 |
6.5 |
BFA controlling factor, entire slope is in Ophiolite.
Opportunity to increase BFA to 70° and IRA 45° depending on quality
of Ophiolite benches. |
| 2a (N) |
140° - 195° |
42 |
42 |
65 |
6.5 |
BFA controlling factor, entire slope is in Ophiolite.
Sector 2a is extremely small and no longer exposes sub-horizontal faults
on this wall. As design is further updated, review possible fault exposure on the wall and associated stability concerns.
Opportunity to increase BFA to 70° and IRA 45° depending on quality
of Ophiolite benches. |
| 2b (W wall in NE corner) |
000° - 090° |
38 |
38 |
65 |
8 |
IRA controlled by local sub-horizontal fault; shallow slope to avoid undercutting. |
| 3 |
105° - 140° |
34 |
36 |
65 |
9.0 |
Weak contacts govern angle. Shallow angle mines out the contacts and
increases stability on remaining contacts.
One 16 m wide geotechnical are required at approx. elevation 1185 m
asl in addition to shallow slope angles. |
| | 13-14 | |
| SSR Mining Inc. | Çöpler Property S-K 1300 Report | February 12, 2024 SLR Project No.: 138.21581.00006 |
| Slope Design Sector |
Wall Dip Direction
(°) |
Max OSA1
(°)1 |
Max IRA2
(°) |
BFA3
(°) |
Bench Width
(m) |
Comments |
| 4 |
040° - 105° |
40
(43) |
42
(45) |
65
(70) |
6.5 |
Increase in BFA when in Cataclastite or Dolomite (angles in brackets)
Opportunity to increase BFA to 70° and IRA 45° in Ophiolite depending
on quality of Ophiolite benches. |
| 5 |
010° - 040° |
40 |
42 |
65 |
6.5 |
Opportunity to increase BFA to 70° and IRA 45° in Ophiolite depending
on quality of Ophiolite benches when not impacted by contacts.
Stability is sensitive to the presence of groundwater. Installation of
a vibrating wire piezometer in this Sector is recommended. |
| 6 |
280° - 010° |
40
(43) |
42
(45) |
65
(70) |
6.5 |
Bracketed slope angles are for areas in which Ophiolite is not the dominant
bench lithology.
Local contact issues in isolated areas are possible. May need to apply
design for fault or contact influenced rock masses (Southeast corner).
Opportunity to increase BFA to 70° and IRA 45° in Ophiolite depending
on quality of Ophiolite benches. |
| 7 |
280° - 195° |
40 |
42 |
65 |
6.5 |
BFA controlling factor, entire slope is in Ophiolite.
Opportunity to increase BFA to 70° and IRA 45° in Ophiolite depending
on quality of Ophiolite benches. |
| 8 (SE) |
065° - 190° |
42 |
42 |
65 |
6.5 |
BFA controlling factor, entire slope is in Ophiolite.
Opportunity to increase BFA to 70° and IRA 45° in Ophiolite depending
on quality of Ophiolite benches. |
Notes:
Source: WSP, 2023a
| | 13-15 | |
| SSR Mining Inc. | Çöpler Property S-K 1300 Report | February 12, 2024 SLR Project No.: 138.21581.00006 |
Figure 13-6: Çöpler
Recommended Pit Design Interramp Angles – 2023
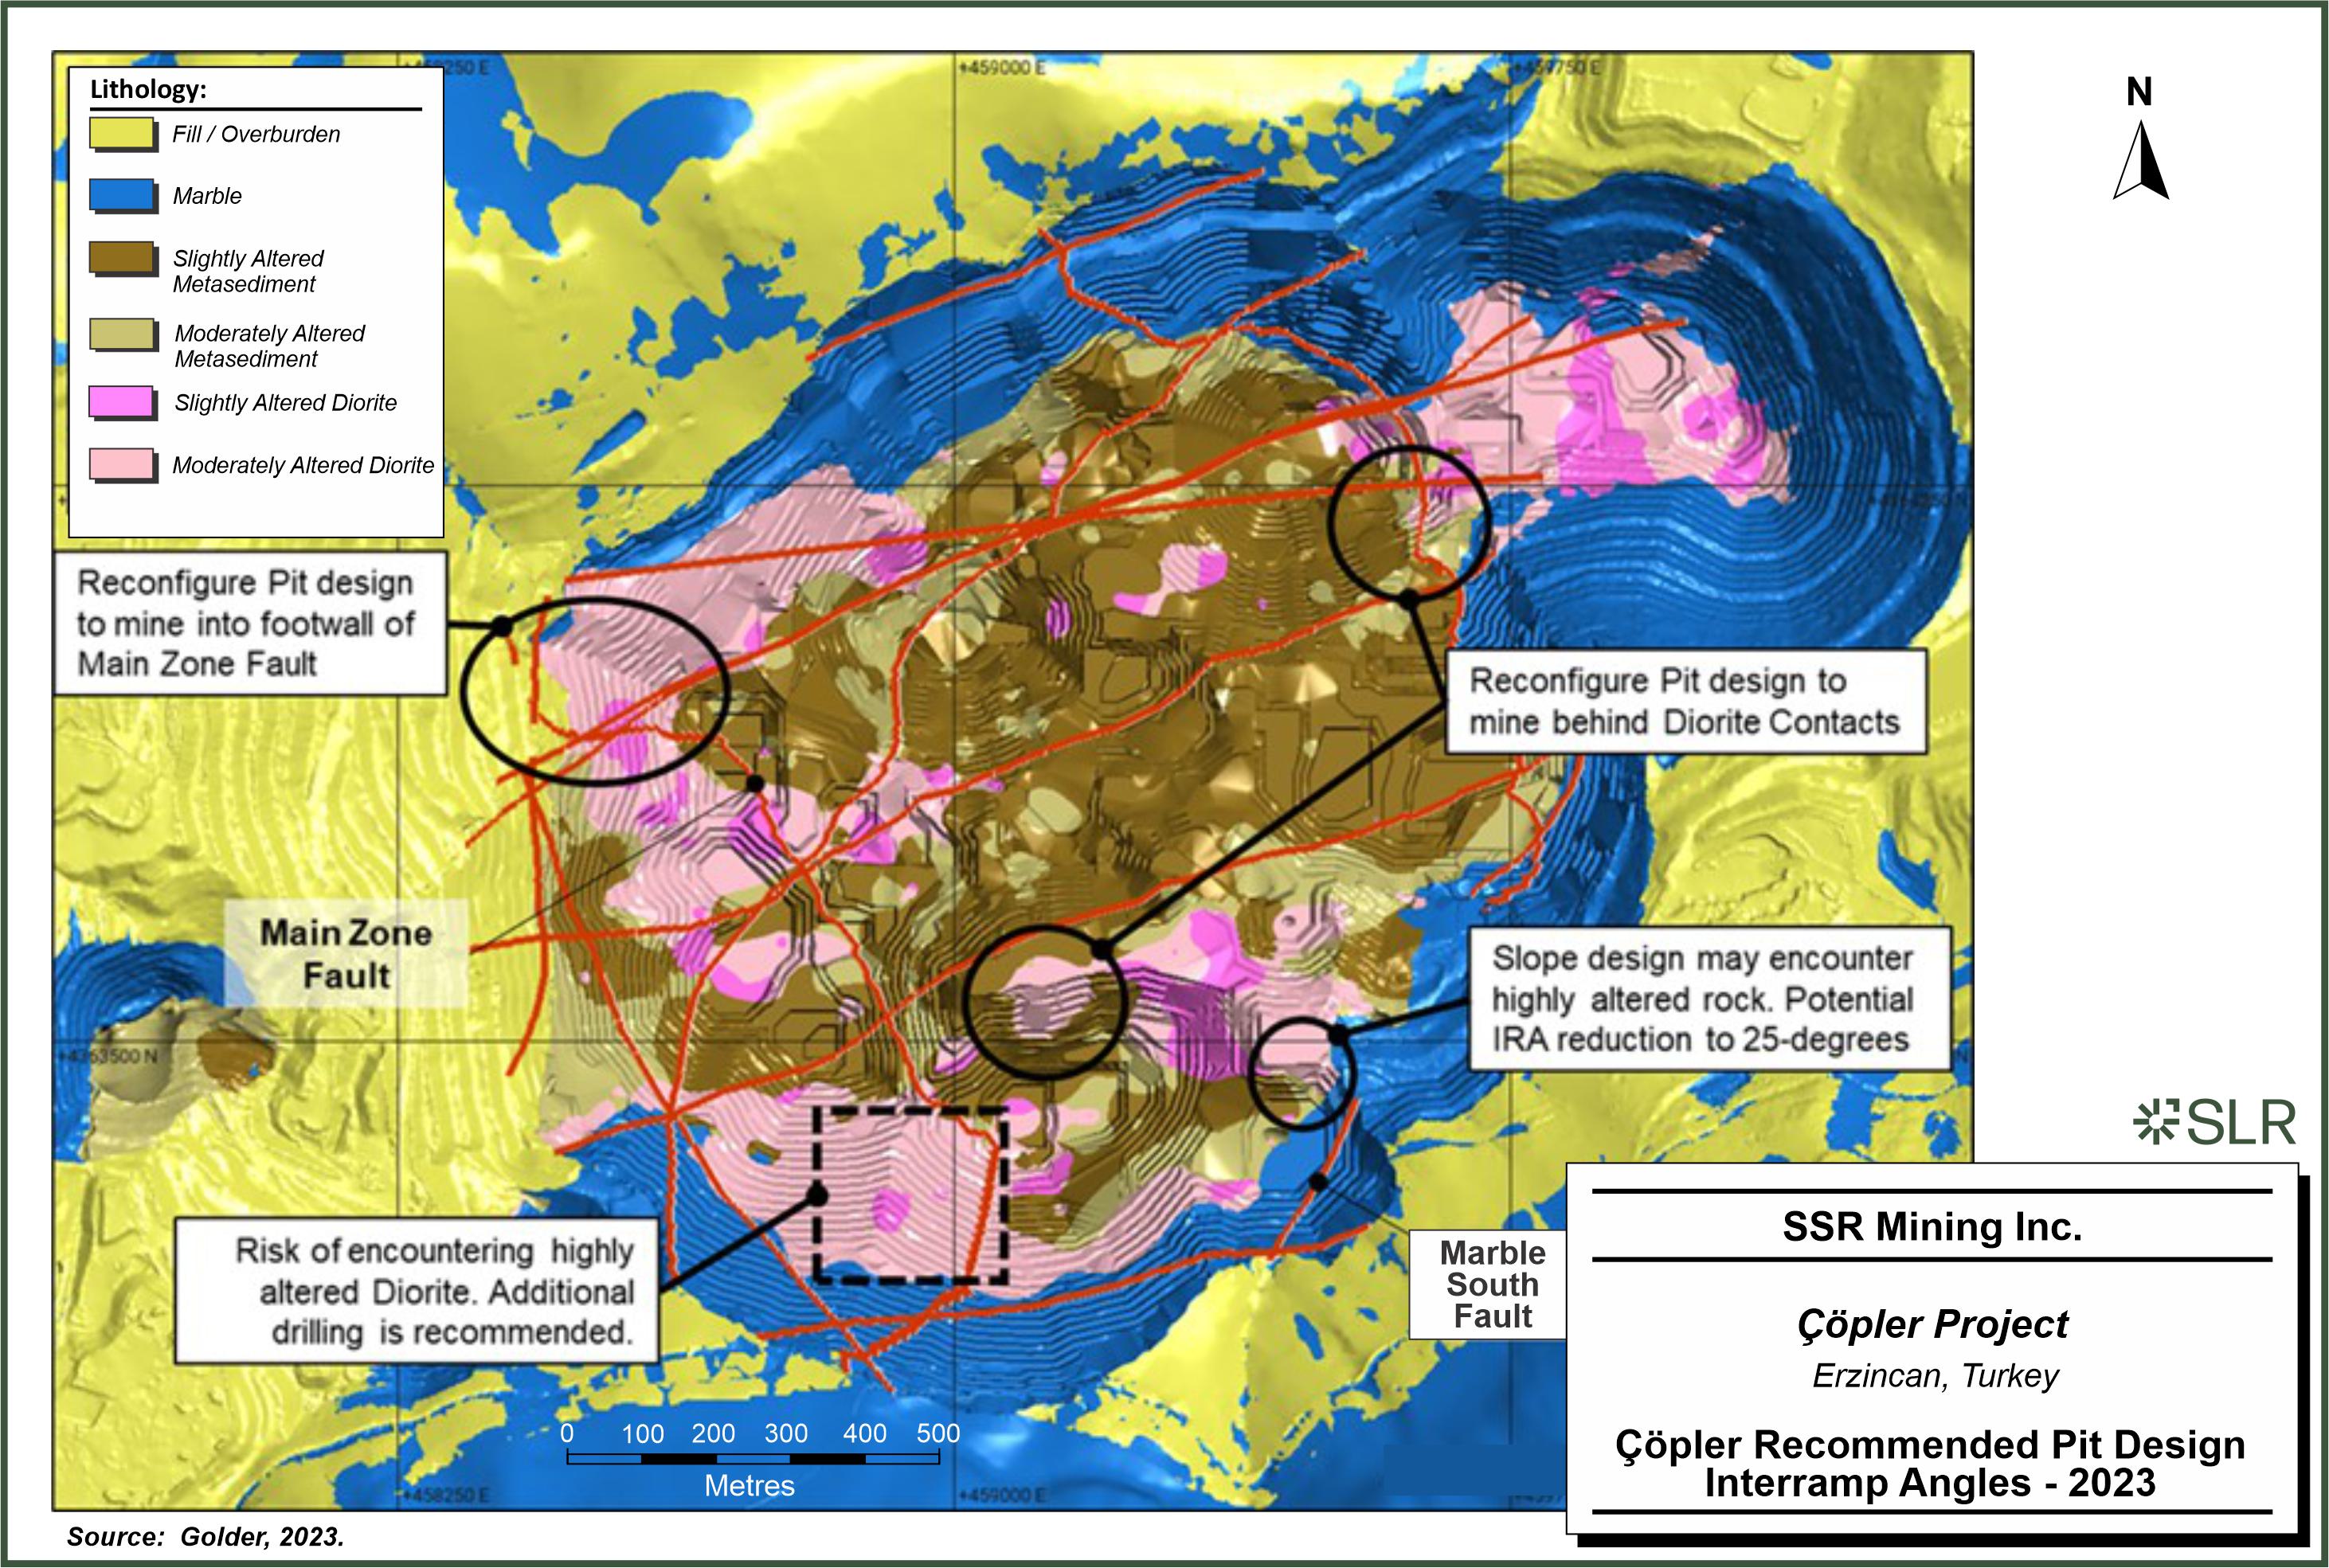
SSR
Mining Inc. Copler Project Erzincan, Turkiye Copler Recommended Pit Design Interramp Angles - 2023
| | 13-16 | |
| SSR Mining Inc. | Çöpler Property S-K 1300 Report | February 12, 2024 SLR Project No.: 138.21581.00006 |
Figure 13-7: Çakmaktepe
2021 Recommended Pit Design Interramp Angle Sectors
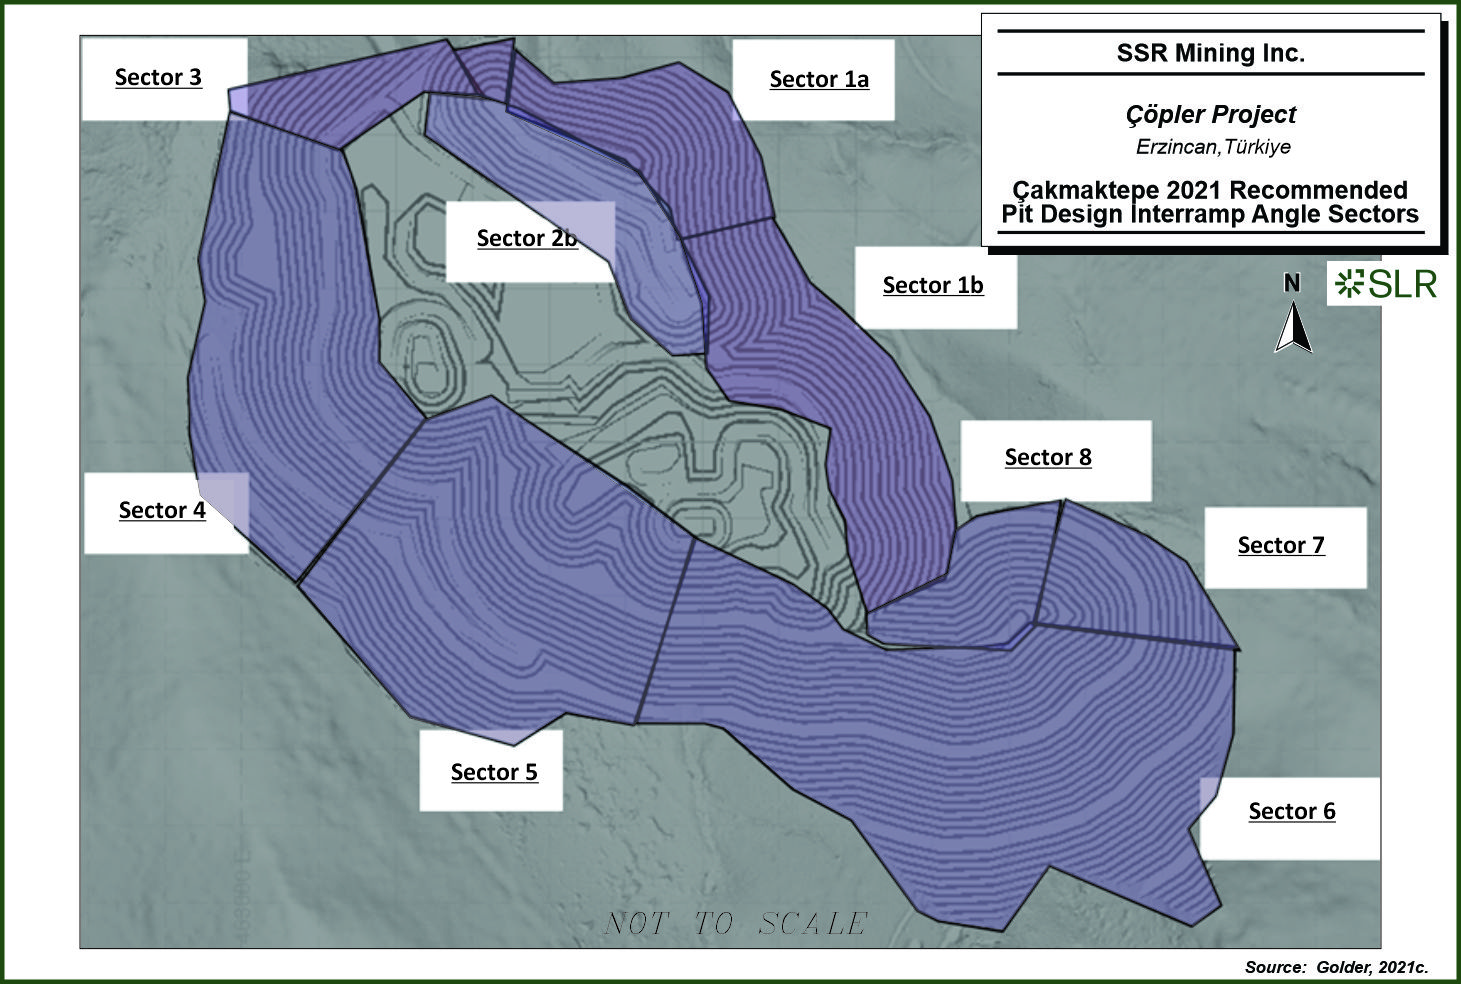
SSR
Mining Inc. Copler Project Erzincan, Turkiye Cakmaktepe 2021 Recommended Pit Design Interramp Angle Sectors
| | 13-17 | |
| SSR Mining Inc. | Çöpler Property S-K 1300 Report | February 12, 2024 SLR Project No.: 138.21581.00006 |
SRK’s groundwater flow model predicts that a pit lake would form
over time after mining for the Çöpler pit is completed. These results, in conjunction with the acid rock drainage (ARD) work
being conducted by SRK Türkiye, are being used to predict pit lake water quality. This work is on-going and a new model will be issued
in 2024 for both the Çöpler and Greater Çakmaktepe pits.
Sources of groundwater recharge include direct infiltration of precipitation
and/or infiltration during storm water run-off events throughout the entire site. The predominant pathways for water infiltration into
the open pits are fractured or karstic openings in the bedrock and alluvial sediments along drainages. The main hydrogeological units,
horizontal hydraulic conductivity al (Kh) and vertical hydraulic conductivity considered in the 2023 groundwater model are listed in were
Table 13-4.
Table 13-4: Çöpler
2023 Hydraulic Conductivities
| Hydrological Unit |
2023 Model Hydraulic Conductivities |
| |
Kh (m/d) |
Kv (m/d) |
| Alluvium |
10 |
10 |
| Lacustrine Sediments |
0.1 |
0.01 |
| Conglomerate |
5 |
5 |
| Limestone (General) |
0.05 |
0.005 |
| Fractured Limestone |
100 |
20 |
| Limestone (Transition Zone) |
10 |
1 |
| Compact Marble |
0.0005 |
0.0005 |
| Diorite (mine area) |
0.00035 |
0.00035 |
| Diorite (regional) |
0.00025 |
0.0002 |
| Diorite (Greater Çakmaktepe) |
0.0002 |
0.0002 |
| Serpentinite/Ophiolite |
0.01 |
0.01 |
| Metasediments (Mine Area) |
0.0004 |
0.0004 |
| Lower K Metasediments West of Çöpler Mine Area |
0.0002 |
0.0002 |
| Metasediments |
0.005 |
0.005 |
| Clastic |
0.0001 |
0.0001 |
Source: SRK 2023
Hydraulic conductivities were based on 40 pumping tests and 15 Packer
tests.
SRK estimated that water levels in and around the Çöpler
pit can be considered elevated to the adjacent country rock. Inflow into the Çöpler pit is estimated to be 3 L/s to 5 L/s
by SRK, which equates to 432 m3/day.
| | 13-18 | |
| SSR Mining Inc. | Çöpler Property S-K 1300 Report | February 12, 2024 SLR Project No.: 138.21581.00006 |
Water level information was gathered from 75 large diameter wells,
24 HQ-size core holes with vibrating wireline piezometers, and six shallow monitoring wells. Golder’s study in 2021 (Golder (2021b)
calibrated a groundwater model to predict pit inflows and pit lake development based on a pit design with a maximum depth to 875 m.
This analysis estimated pit inflow at less than approximately 1,100 m3/day. Estimations
of pit lake formation suggest that over a 100-year scenario, based on a pit design with a maximum depth to 875 m, pit lake water
elevations are projected to reach the 906 m elevation (±20 m). Golder’s modeling results indicate that water from
beneath the Lower Çöpler West waste rock dump (WRD) will take more than 1,000 years to flow to the Karasu River. Groundwater
located beneath the Lower Çöpler East WRD is estimated to discharge to the Karasu River within approximately 300 years.
Revisions to the pit design since the Çöpler groundwater
model was constructed and calibrated (in 2012) show that the minimum pit elevation (895 mRL) will be higher than the minimum pit
elevation simulated in the model (875 mRL). Additionally, the area on the north side of the pit and the southern and southeastern
portions of the pit will be mined to a lower elevation than simulated in the model. Limestone in these areas may increase discharge to
the pit during dewatering and may impact the formation of a pit lake following closure. Updating and possibly recalibrating the model
based on the revised ultimate pit configuration and available data since 2012 would be required to better quantify the magnitude of the
increase or impact.
There have been 12 large-diameter monitoring wells and eight standpipe
piezometers installed at the Greater Çakmaktepe pit area. Water table is currently measured at 1,080 MASL. Dolomites and limestones
that lay to the west and beneath the ore zones have demonstrated moderate to high permeability (hydraulic conductivity ranging from 10-5
metres per second (m/s) to 10-7 m/s. Ophilites and Listwanite units overlay
the dolomite and limestone formations with permeability around 10-6. Diorite dikes with permeabilities ranging from 10-7
to 10-9 m/s.
Pumping tests that vertical, in-pit and intercept wells should prevent
high water flows into the pit and depressurize the highwalls.
Figure 13-8: Greater Çakmaktepe
Conceptual Groundwater Model
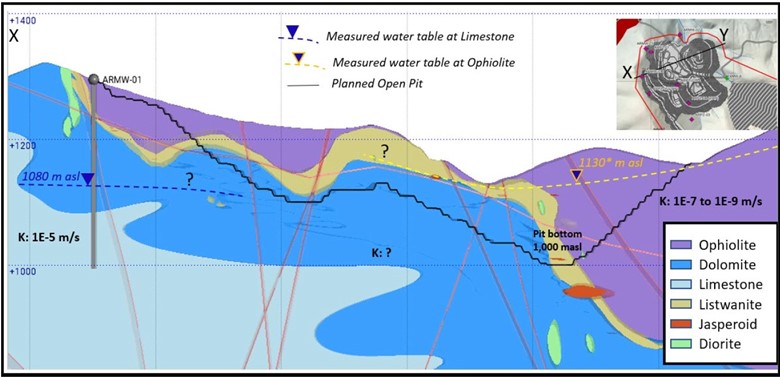
Source: SRK, 2023
| | 13-19 | |
| SSR Mining Inc. | Çöpler Property S-K 1300 Report | February 12, 2024 SLR Project No.: 138.21581.00006 |
| 13.1.5 | Monitoring and Management |
Pit slopes in the Çöpler and Greater Çakmaktepe pits
are monitored daily to ensure safety and stability. Daily inspections of the active mining areas are conducted by shift engineers to identify
hazards such as unstable rock on benches above the active working areas, excessive water in and around the highwalls, and any visible
cracking and movement of the highwalls.
In addition, Anagold employs a geotechnical management team consisting
of surveyors, geologists, and geotechnical engineers. This team conducts regular highwall inspections, measurement of movement through
extensometers and prism surveys, and data collection and interpretation of the long-range synthetic aperture radar measurements.
Mining at Çöpler utilizes perimeter pre-split blasting techniques
in areas where competent rock is encountered (typically, limestone/marble, unaltered metasediment, and unaltered diorite). The pre-split
holes are drilled according to the bench face angle recommendations as shown in Table 13-2. Blasting is conducted in a manner to minimize
back-break through the use of delays and providing adequate relief for shock waves and air blast in the rock.
Where pre-splitting is not practical, highwalls are sloped by excavator
to the recommended bench face angle.
Open pit mining at the Çöpler project is carried out by
Çiftay, a Turkish mining contractor, and managed by Anagold. Çiftay has been the only primary mining contract since mining
commenced in 2011.
The mining method is a conventional open pit method with drill and blast
and using excavators and trucks operating on bench heights of 5 m. The mining contractor provides operators, line supervisors, equipment,
and ancillary facilities required for the mining operation. SSR provides management, technical, mine planning, engineering, and grade
control functions for the operation.
SSR currently operates a sulfide process plant that includes pressure
oxidation of sulfides using an autoclave (POX) followed by cyanidation and CIP, and a heap leach facility. Costs used in the mine plan
are based on the actual operational costs and Project budget assumptions. Production schedules and costs are based on current site performance
and contracts.
The parameters, costs, and throughput assumptions used to prepare cut-off
grades and the production schedule are listed in the following sections.
A revised set of processing parameters was used to calculate the internal
gold cut-off grades for ore definition. The cut-off grades for the Mineral Reserves were calculated using the parameters described in
the following sections.
| 13.2.1.1 | Assumptions, Model Variables and Other Inputs |
Material routing is based on gold and sulfur grades, as illustrated
in Figure 13-9.
| | 13-20 | |
| SSR Mining Inc. | Çöpler Property S-K 1300 Report | February 12, 2024 SLR Project No.: 138.21581.00006 |
Figure 13-9: Material Routing
Definition Decision Tree
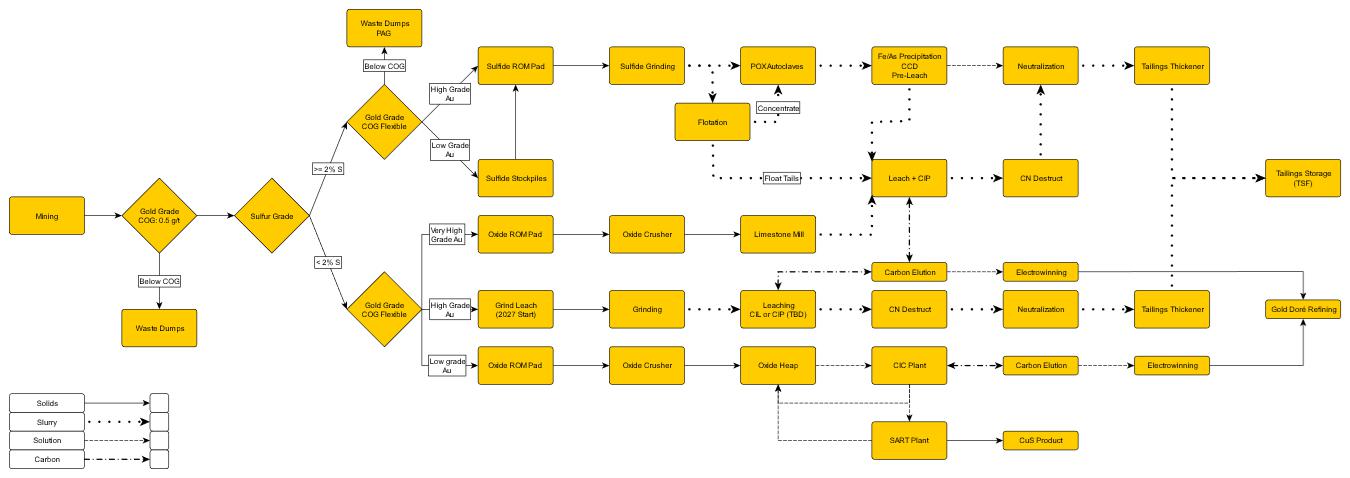
Table 13-5 details the heap leach gold recovery parameters by location,
and the amount sulfur.
| | 13-21 | |
| SSR Mining Inc. | Çöpler Property S-K 1300 Report | February 12, 2024 SLR Project No.: 138.21581.00006 |
Table 13-5: Heap Leach Recovery
– Gold, Silver, and Copper
| Mine Area |
Recovery Zone |
Lithology |
S% |
Au |
Ag |
Cu |
| Çöpler |
Main |
Limestone/Marble |
S%<2 |
68.6% |
24.6% |
0.0% |
| Metasediments |
66.8% |
32.5% |
13.8% |
| Gossan |
71.2% |
27.5% |
3.3% |
| Diorite |
71.2% |
37.8% |
15.8% |
| Manganese Diorite |
71.2% |
37.8% |
15.8% |
| Main East |
Limestone/Marble |
S%<2 |
78.4% |
27.3% |
0.0% |
| Metasediments |
66.8% |
32.5% |
13.8% |
| Gossan |
71.2% |
27.5% |
3.3% |
| Diorite |
71.2% |
37.8% |
15.8% |
| Manganese Diorite |
71.2% |
37.8% |
15.8% |
| Main West |
Limestone/Marble |
S%<2 |
75.7% |
34.0% |
0.0% |
| Metasediments |
66.8% |
32.5% |
13.8% |
| Gossan |
65.1% |
27.5% |
3.3% |
| Diorite |
62.3% |
32.0% |
15.8% |
| Manganese Diorite |
62.3% |
32.0% |
15.8% |
| Manganese |
Limestone/Marble |
S%<2 |
78.4% |
27.3% |
0.0% |
| Metasediments |
66.8% |
32.5% |
13.8% |
| Gossan |
71.2% |
27.5% |
3.3% |
| Diorite |
71.2% |
37.8% |
15.8% |
| Manganese Diorite |
71.2% |
37.8% |
15.8% |
| Marble |
Limestone/Marble |
S%<2 |
75.7% |
34.0% |
0.0% |
| Metasediments |
66.8% |
32.5% |
13.8% |
| Gossan |
65.1% |
27.5% |
3.3% |
| Diorite |
62.3% |
32.0% |
15.8% |
| Manganese Diorite |
62.3% |
32.0% |
15.8% |
| West |
Limestone/Marble |
S%<2 |
75.7% |
34.0% |
0.0% |
| Metasediments |
66.8% |
32.5% |
13.8% |
| Gossan |
65.1% |
27.5% |
3.3% |
| Diorite |
62.3% |
32.0% |
15.8% |
| Manganese Diorite |
62.3% |
32.0% |
15.8% |
| | 13-22 | |
| SSR Mining Inc. | Çöpler Property S-K 1300 Report | February 12, 2024 SLR Project No.: 138.21581.00006 |
| Mine Area |
Recovery Zone |
Lithology |
S% |
Au |
Ag |
Cu |
| Çakmaktepe |
Çakmaktepe North |
Limestone/Breccia |
S%<2 |
59.0% |
17.0% |
0.0% |
| Metasediments |
14.0% |
19.0% |
0.0% |
| Ophiolite |
63.0% |
24.0% |
0.0% |
| Gossan |
59.0% |
17.0% |
0.0% |
| Jasperoid |
59.0% |
17.0% |
0.0% |
| Diorite |
38.0% |
40.0% |
0.0% |
| Çakmaktepe East |
Limestone/Marble |
S%<2 |
67.0% |
27.0% |
0.0% |
| Ophiolite |
67.0% |
27.0% |
0.0% |
| Gossan |
67.0% |
27.0% |
0.0% |
| Çakmaktepe SE |
Ophiolite |
S%<2 |
75.0% |
45.0% |
0.0% |
| Gossan |
75.0% |
45.0% |
0.0% |
| Bayramdere |
Limestone/Marble |
S%<2 |
75.0% |
45.0% |
0.0% |
| Ophiolite |
75.0% |
45.0% |
0.0% |
| Gossan |
75.0% |
45.0% |
0.0% |
| Çakmaktepe Central |
Limestone/Breccia |
S%<2 |
70.0% |
17.0% |
0.0% |
| Jasperoid |
73.0% |
17.0% |
0.0% |
| Diorite |
61.0% |
24.0% |
0.0% |
| Metasediments |
80.0% |
28.0% |
0.0% |
| Ophiolite |
70.0% |
19.0% |
0.0% |
| Greater Çakmaktepe |
Main |
Listwanite |
S%<1 |
73.0% |
20.0% |
0.0% |
| 1<=S%<2 |
58.0% |
20.0% |
0.0% |
| Dolomite |
S%<1 |
73.0% |
20.0% |
0.0% |
| 1<=S%<2 |
58.0% |
20.0% |
0.0% |
| Jasperoid |
S%<1 |
50.0% |
20.0% |
0.0% |
| 1<=S%<2 |
40.0% |
20.0% |
0.0% |
| All other lith. |
S%<1 |
73.0% |
20.0% |
0.0% |
| 1<=S%<2 |
58.0% |
20.0% |
0.0% |
| East |
Listwanite |
S%<1 |
55.0% |
15.0% |
0.0% |
| 1<=S%<2 |
45.0% |
15.0% |
0.0% |
| Dolomite |
S%<1 |
55.0% |
15.0% |
0.0% |
| 1<=S%<2 |
45.0% |
15.0% |
0.0% |
| Jasperoid |
S%<1 |
50.0% |
15.0% |
0.0% |
| 1<=S%<2 |
40.0% |
15.0% |
0.0% |
| All other lith. |
S%<1 |
55.0% |
15.0% |
0.0% |
| 1<=S%<2 |
45.0% |
15.0% |
0.0% |
Table 13-6 details the operating costs for oxide material.
| | 13-23 | |
| SSR Mining Inc. | Çöpler Property S-K 1300 Report | February 12, 2024 SLR Project No.: 138.21581.00006 |
Table 13-6: Oxide Operating
Costs
| Parameter |
Unit |
Greater Çakmaktepe |
Çöpler |
| Mining Costs |
$/t mined |
1.89 |
1.59 |
| Rehandle Cost |
$/t |
0.32 |
0.64 |
| Processing – Fixed |
$/t |
3.05 |
3.05 |
| Processing – Variable |
$/t |
8.94 |
8.94 |
| Royalty / Export Duties & Credits |
$/t |
$0.14 |
$0.14 |
| Sustaining Capital |
$/t |
$2.97 |
$2.97 |
Table 13-7 details the recovery for the Grind Leach plant.
Table 13-7: Grind Leach Recovery
| Mine Area |
Lithology |
S% |
Recovery |
| Çöpler1 |
Limestone |
S%<2 |
75.6% |
| Metasediments |
73.8% |
| Gossan |
78.2% |
| Diorite |
78.2% |
| Manganese Diorite |
78.2% |
| Greater Çakmaktepe |
Listwanite |
S%<2 |
90.0% |
| Dolomite |
83.0% |
| Jasperoid |
60.0% |
| All other lithology |
S%<1 |
68.0% |
| 1<=S%<2 |
53.0% |
Notes:
| 1. | Based on historical metallurgical test work, the Çöpler oxide ores will have a higher recovery in a grind-leach circuit
and will also have a tighter, less sulfur sensitive, recovery curve. |
| 13.2.1.2 | Sulfide Plant Parameters |
The following sections outline the processing parameters for the sulfide
plant. Average life-of-mine (LOM) sulfide gold recoveries range from 88% to 91%.
Throughput
Total Plant Throughput = Direct POX Feed + Float Plant Feed
POX Plant Throughput = Direct POX Feed + Float Plant Concentrate
Table 13-8 details the maximum plant throughputs for each part of
the plant. Plant throughput is defined as follows:
Total Plant Throughput = Direct POX Feed + Float Plant Feed
POX Plant Throughput = Direct POX Feed + Float Plant Concentrate
| | 13-24 | |
| SSR Mining Inc. | Çöpler Property S-K 1300 Report | February 12, 2024 SLR Project No.: 138.21581.00006 |
The front-end limit of 400 tph means when the flotation plant is
running at full capacity, i.e., 150 tph, the direct feed to the pressure oxidation (POX) circuit will be limited to 250 tph.
Table 13-8: Plant Throughput
Limits
| Parameter |
Unit |
Maximum Throughput |
| Float Plant |
tph |
150 |
| POX Plant |
tph |
280 |
| Total |
tph |
400 |
The POX circuit throughput is also limited by the sulfide sulfur (SS)
in the feed to the autoclave, which must be less than 13.75 tonne per hour (tph). If the SS content is too high, then the POX circuit
throughput will need to be reduced until the rate is less than 13.75 tph of sulfide sulfur (SS).
Recovery – Pressure Oxidation (POX) Gold
Recoveries for material that has been subjected to POX will range from
88% to 91%.
Recovery – Float Plant
Average recovery from the flotation plant is listed below:
Float Concentrate Gold Recovery = 55%.
Float Tails Gold Recovery = 43%.
Float Concentrate SS Recovery = 75%.
Table 13-9 details the operating costs by location.
Table 13-9: Sulfide Operating
Costs
| Parameter |
Unit |
Amount |
| Rehandle Cost |
$/t |
0.90 |
| Processing – Fixed |
$/t |
8.32 |
| Processing – Variable |
$/t |
19.10 |
| Processing – Variable (SS) |
$/t SS |
2.68 |
| G&A (Process and Site) |
$/t |
6.60 |
| 13.2.1.4 | Metal Prices and Royalty Inputs |
Cut-off grades were determined using a gold price of US$1,450/oz. There
are no credits for silver or copper in the cut-off grade calculations. Table 13-10 details revenue and royalty inputs for the gold
cut-off grades.
Table 13-10: Au Cut-off Grade
Revenue and Royalty Inputs
| Parameter |
Unit |
Au Cut-off Assumption |
| Payment and Deductions |
| Gold |
$/oz |
1,450 |
| Payable |
% |
100 |
| | 13-25 | |
| SSR Mining Inc. | Çöpler Property S-K 1300 Report | February 12, 2024 SLR Project No.: 138.21581.00006 |
| Parameter |
Unit |
Au Cut-off Assumption |
| Treatment and Refining |
| Selling |
$/oz |
8.54 |
| Royalties |
| Çöpler |
% |
2 |
| Çakmaktepe |
% |
4 |
Internal cut-off grades calculated for each of the material types based
on the economic inputs and assumptions are shown in Table 13-10. Internal cut-off grades have been used to calculate process quantities
within the Mineral Reserve pits.
The addition of the flotation circuit to the sulfide plant required
new grade control protocols and associated stockpile strategies to be implemented to manage the required sulfide plant feed blend. It
is likely that there will need to be ongoing modification of the stockpiling cut-off grades and procedures for both short-term and long-term
blending as the mine progresses. Measures such as increasing the number of active mining areas, increasing the mining rate, and increasing
the size or number of ROM stockpiles may be required.
Table 13-11: Internal Au Cut-off
Grades
| Mining Area |
Ore Type |
Rock Type |
Zone |
COG
(Au g/t) |
| Çöpler |
Oxide |
Limestone / Marble |
Manganese |
0.47 |
| Main |
0.53 |
| Marble |
0.48 |
| Metasediment/ Hornfels |
Manganese |
0.55 |
| Main |
| Marble |
| Gossan |
Manganese |
0.51 |
| Main |
0.51 |
| Marble |
0.56 |
| Diorite |
Manganese |
0.51 |
| Main |
0.51 |
| Marble |
0.59 |
| Mn Diorite |
Manganese |
0.51 |
| Main |
0.51 |
| Marble |
0.59 |
| Sulfide |
All |
All |
1.05 |
| | 13-26 | |
| SSR Mining Inc. | Çöpler Property S-K 1300 Report | February 12, 2024 SLR Project No.: 138.21581.00006 |
| Mining Area |
Ore Type |
Rock Type |
Zone |
COG
(Au g/t) |
| Greater Çakmaktepe |
Oxide |
Limestone / Breccia |
Central |
0.60 |
| Jasperoid |
0.57 |
| Diorite |
0.69 |
| Metasediment/ Hornfels |
0.52 |
| Ophiolite |
0.60 |
| Greater Çakmaktepe |
Sulfide |
All |
All |
1.12 |
New pit designs for the Mineral Reserves were created in 2023 based
on updated Mineral Resource models, metal prices, and costs.
The key aims of the optimised pit designs are:
| · | Minimize mining costs and maximize economic return by exposing the highest value ore while minimizing the amount of waste mining. |
| · | Address operational requirements for loading, hauling, slope stability, and rockfall, as follows: |
| · | Loading – the phases were designed with a minimum operational width of 15 m to 30 m between phases (depending on bench configuration)
to allow efficient mining for the equipment scale. |
| · | Hauling – generally, two exit haul roads per phase were included: the west bound exit to the crusher, low-grade stockpile, and
west dump; and the east bound exit to the potentially acid generating (PAG) and non-acid generating (NAG) dumps. Haul roads are generally
15-m wide at a 10% gradient. Single lane haulage traffic is allowed in the lower benches of each pit and is set at 10-m wide. Figure 13-10
presents the ultimate pit designs and the main haul road network. |
A summary of key mine design inputs and factors is presented in Table
13-12. Pit designs for the Çöpler pit were updated in 2023. Çakmaktepe pit designs were prepared in 2021 and updated
in 2023. The Çöpler and Greater Çakmaktepe ultimate pit designs, at the end of 2036, are shown in Figure 12-1 and
Figure 12-4, respectively. Following completion of in-pit mining, the sulfide plant will be fed from stockpiles until 2039.
Table 13-12: Key Mine Design
Factors
| Item |
Units |
Value Used |
| Gold Price |
US$/oz |
1,450 |
| Silver Price |
US$/oz |
18.50 |
| Copper Price |
US$/lb |
3.30 |
| Off-site Costs, Copper |
US$/lb |
0.413 |
| Off-site Costs, Gold |
US$/oz |
6.61 (oxide) /6.87 (sulfide) |
| Copper Payable |
% |
96.5 |
| Gold Payable |
% |
94.0 |
| | 13-27 | |
| SSR Mining Inc. | Çöpler Property S-K 1300 Report | February 12, 2024 SLR Project No.: 138.21581.00006 |
| Item |
Units |
Value Used |
| Mining Cost |
US$/t - mined |
2.06-2.79 |
| Processing + G&A Cost |
US$/t - milled Sulfide |
44.37 |
| Processing + G&A Cost |
US$/t - milled Oxide |
19.26 |
| Processing + G&A Cost |
US$/t - Heap Leach |
18.34 |
| Gold Recovery Range |
% |
40-91 |
| Mining Loss |
% |
0 |
| Bench Height |
m |
10 |
| Mining Height |
m |
5 |
| Minimum Mining Width |
m |
15 |
| Berm Spacing |
m |
6 - 9 |
| Ramp Width |
m |
15 |
| Typical Road Grade |
% |
10 |
| Geotechnical Berms |
m |
100 |
| Number of Pit Phases |
No. |
17 |
| Mine Life |
years |
17 |
| Waste Rock Dump Lift Height |
m |
15 |
| Final Waste Rock Dump Slope |
Horizontal Distance:Vertical Distance (m:m) |
2.5H:1V |
| Natural Angle of Repose |
Degree |
37° |
| Cut-off Value NSR POX |
US$/t |
45.59 |
| Cut-off Value NSR Heap Leach |
US$/t |
21.77 |
| Cut-off Value NSR Grind Leach |
US$/t |
21.32 |
| Powder Factor (explosive to rock) |
kg/t |
0.80 |
| Mining Schedule |
hr/day |
24 |
| Mining Schedule |
day/yr |
365 |
| Average Yearly Mined Required (yr 1 to yr 13 |
Mtpa |
43.7 |
| Average Daily Mined Required (yr 1 to yr 13 |
ktpd |
71(Çöpler)
100(Greater Çakmaktepe) |
| Bank Bulk Density |
t/bcm1 |
02.59 (waste) to 2.81 (sulfide) |
| Swell Percent |
% |
22% |
| Bucket Fill Factor |
% |
95 |
| Effective Loader Productivity |
tph |
440 |
| Effective Excavator Productivity |
tph |
627 |
| | 13-28 | |
| SSR Mining Inc. | Çöpler Property S-K 1300 Report | February 12, 2024 SLR Project No.: 138.21581.00006 |
| Item |
Units |
Value Used |
| Effective Drill Penetration Rate |
m/hr |
47 |
| Blasthole Diameter |
mm |
102 - 115 |
| Subdrill Length |
m |
1.6 |
| Stemming Length |
m |
3.6 |
| |
|
|
| Milling Rate |
tpd |
7,397 |
| LOM Average of Annual Gold Produced |
koz/yr |
280 |
| LOM Average Gold Recovery |
% |
85.1 |
Notes:
| | 13-29 | |
| SSR Mining Inc. | Çöpler Property S-K 1300 Report | February 12, 2024 SLR Project No.: 138.21581.00006 |
Figure 13-10: Ultimate Pit Designs
– Çöpler (West) and Greater Çakmaktepe (East) – 2036
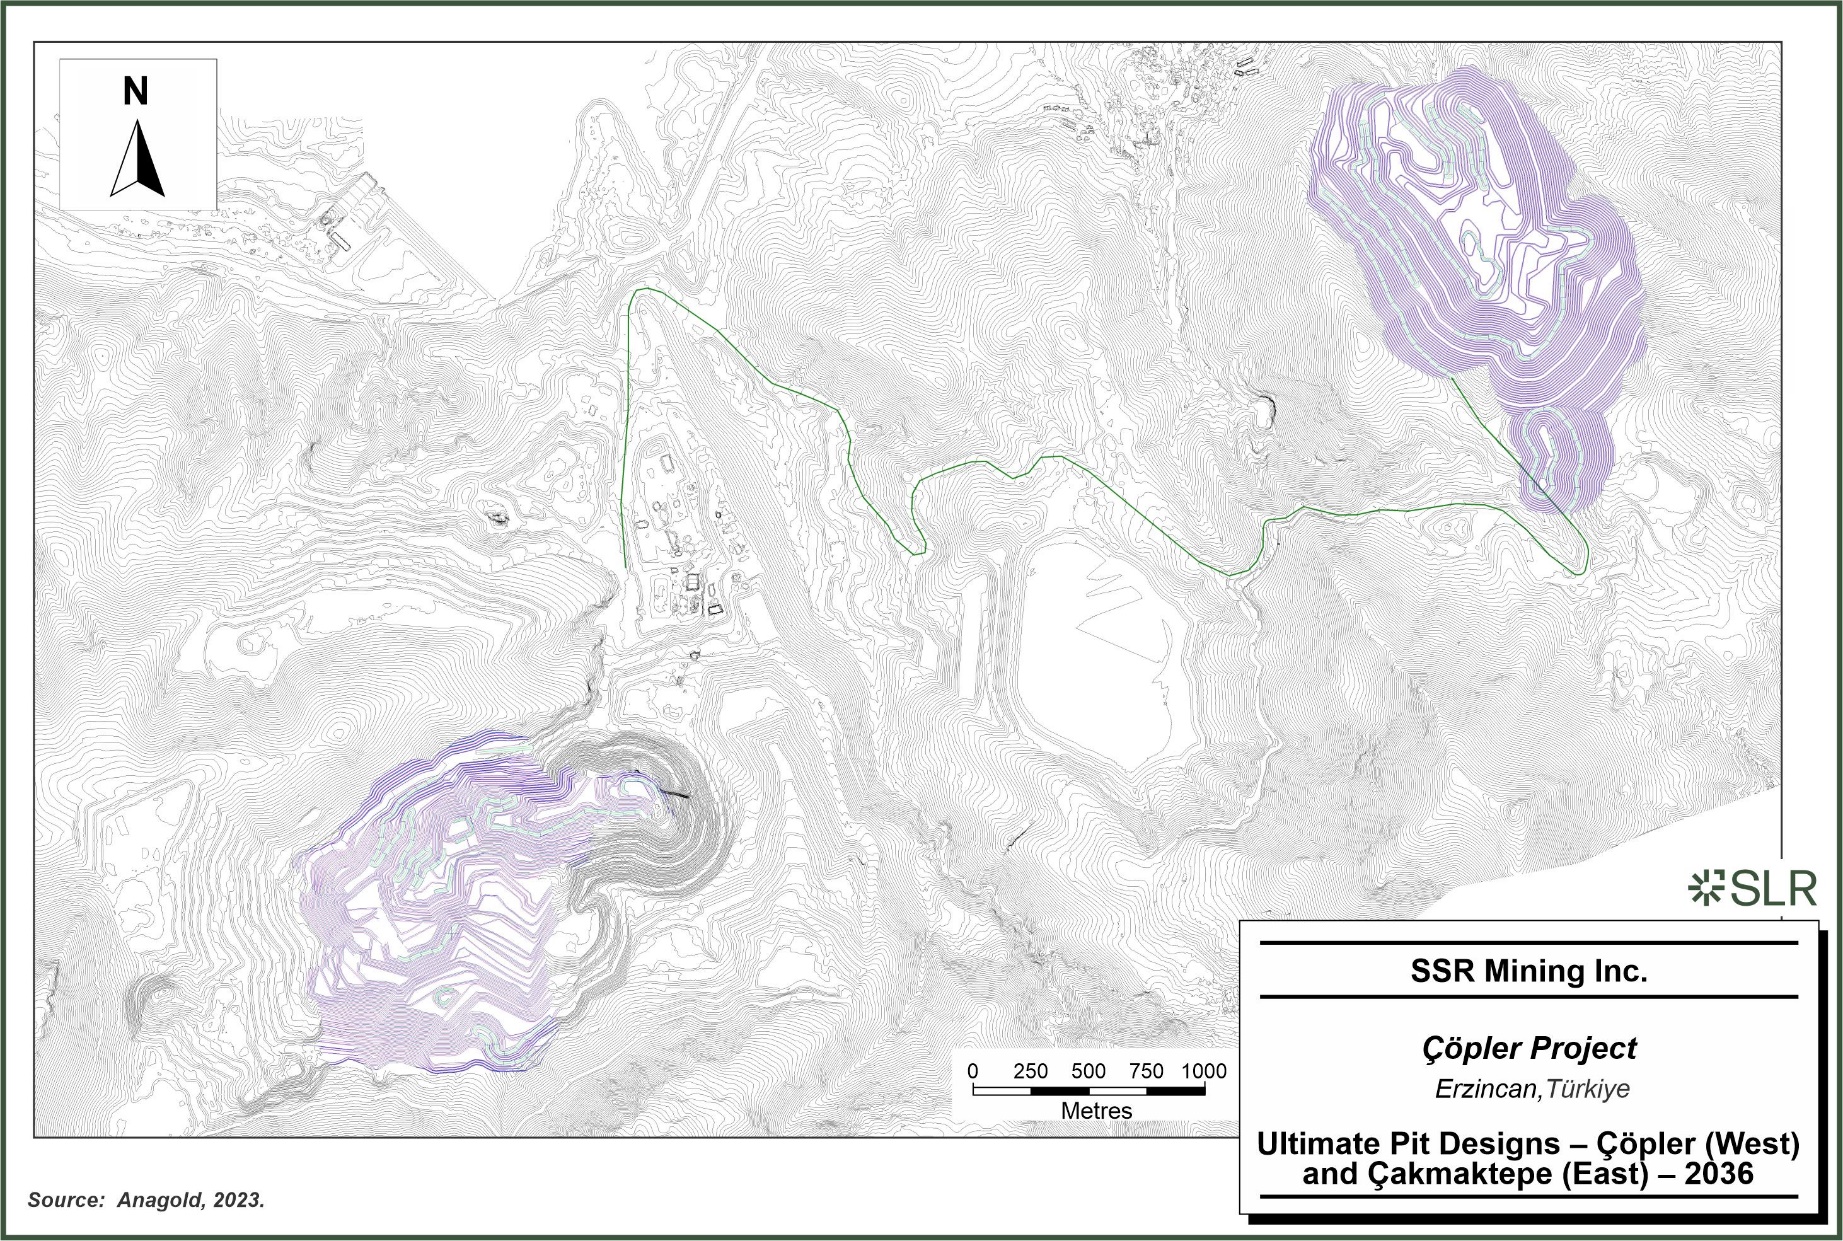
SSR
Mining Inc. Copler Project Erzincan, Turkiye Ultimate Pit Designs - Copler (West) and Cakmaktepe (East) - 2036
| | 13-30 | |
| SSR Mining Inc. | Çöpler Property S-K 1300 Report | February 12, 2024 SLR Project No.: 138.21581.00006 |
| 13.2.4 | Waste Rock Dump and Stockpile Design |
The mine plan allows for the use of five Waste Rock Dumps (WRDs) to
store mined waste rock and sulfide ore that is extracted during mining operations. These five WRDs are Lower Çöpler East,
Lower Çöpler West, Upper Çöpler, West, and Marble Backfill WRDs. There are eight waste rock dump locations for
the Greater Çakmaktepe area, as listed in Table 13-13. Current operations do not use the Lower Çöpler West and
Marble Backfill WRDs. The Lower Çöpler West and Upper Çöpler WRDs will primarily be used as sulfide ore stockpile
areas, with the Upper Çöpler WRD being mined out to allow for future pushback extension of the Marble pit towards the north
and allow for leach pad extensions to the west. Figure 13-11 shows the site layout.
Table 13-13 summarizes the life of mine WRD capacities.
Table 13-13: Waste Rock Dump
(WRD) Capacities
| Waste Rock Dump Name – Material Type |
Volume
(Mm3) |
Tonnage
(Mt) |
Surface Area Impacted
(ha) |
| Lower Çöpler East - Waste |
14.9 |
26.8 |
51.5 |
| Lower Çöpler West - Waste |
94.6 |
170.3 |
206.5 |
| Lower Çöpler West – Sulfide Ore |
12.4 |
22.3 |
18.3 |
| Upper Çöpler – Sulfide Ore |
7.6 |
13.6 |
33.3 |
| West - Waste |
34.4 |
61.9 |
108.9 |
| Tailings Storage Facility |
|
69.8 |
|
| Koyun |
19.3 |
38.4 |
60.5 |
| Çakmaktepe Main Backfill |
1.9 |
3.7 |
8.0 |
| Çakmaktepe East Backfill |
1.0 |
2.0 |
4.9 |
| North Dump |
5.8 |
11.6 |
28.4 |
| Çakmaktepe Top |
5.9 |
11.8 |
28.8 |
| Çakmaktepe Early |
3.9 |
7.9 |
16.8 |
| Çakmaktepe South |
79.7 |
158.6 |
114.5 |
| Sabırlı Valley |
50.2 |
99.9 |
102.5 |
| Greater Çakmaktepe Backfill |
14.8 |
29.4 |
27.6 |
| Totals |
346.4 |
728.0 |
810.5 |
Source: SSR 2023
An estimated 69.8 Mt of waste rock will be consumed in the construction
of the tailings storage facility, haul road, and tailings pipeline corridor. Total constructed waste rock storage capacity is 346.4.0 Mm3
(728.0 Mt). The total surface area impacted by all WRDs and stockpiles is 810.5 ha. When possible and economically
preferable, waste rock will be backfilled within mined out areas of the pits as they become available.
| 13.2.4.1 | Waste Rock Dump (WRD) Geotechnical Design |
The WRDs will generally consist of 15 m tall lifts deposited at
the waste material’s angle of repose of approximately 1.33H:1V. The typical bench width will be 17 m, and 15 m wide haul
roads will be used to construct the WRDs. The WRDs will have overall slopes ranging from 2.5H:1V to 2.6H:1V.
| | 13-31 | |
| SSR Mining Inc. | Çöpler Property S-K 1300 Report | February 12, 2024 SLR Project No.: 138.21581.00006 |
In February 2014, Golder completed an evaluation of the geotechnical
stability of the four WRD designs (Golder, 2014a), later updated in May 2015 (Golder, 2015b) to account for the updated material properties
developed by Golder during the pit slope optimisation study and the updated WRD designs and layouts developed by Anagold. Six of the most
critical cross-sections were evaluated to determine the minimum Factor of Safety (FOS) for the proposed Çöpler WRDs. The sections
were aligned to pass through the highest part of the waste piles, the steepest waste pile slopes, and the steepest foundation grades.
The Çakmaktepe WRDs have yet to be evaluated.
In addition to static stability analyses, pseudo-static stability analyses
were performed to account for seismic loading conditions for the Çöpler WRDs. The pseudo-static analyses were conducted based
on the procedure proposed by Hynes-Griffin and Franklin (1984) in which a horizontal acceleration equal to 50% of the peak ground acceleration
at bedrock is applied to the model. The design criteria peak ground acceleration is 0.30 g for the magnitude 7.0 operating basis
earthquake (OBE). A horizontal pseudo-static acceleration of 0.15 g was applied to the WRD sections in the seismic stability analyses.
The results of the Çöpler stability analysis are summarized
in Table 13-14.
WRDs should be as stable or even more stable at the Greater Çakmaktepe
as compared to the Çöpler WRDs. LOM waste rock dumps at the Greater Çakmaktepe site have been designed by SSR based
on the same geometrical criteria as was applied to the design of the Çöpler site waste rock dumps:
| · | 15-m tall lifts deposited |
| · | Waste material’s angle of repose at a slope of approximately 1.33H:1V |
| · | Typical catch berm width of 17-m |
| · | Overall slopes ranging from 2.5H:1V to 2.6H:1V. |
A design review and limit equilibrium slope stability analysis for these
facilities has been awarded to WSP, and it is expected to be completed by the first quarter (Q1) of 2024. Geotechnical characterization
of the rock mass at the Greater Çakmaktepe pits that will ultimately make up the waste rock piles show a predominance of geotechnical
domains with fair to good rock quality, generally exceeding average RMR values observed in the geotechnical domains presented at Çöpler
pits. Intact rock strength, measured in Uniaxial Compressive Strength (UCS) tests, also indicate higher resistance parameters, on average,
for the Greater Çakmaktepe intact rock versus Çöpler intact rock. These would indicate that, under similar blasting
conditions, shear strength values for the Greater Çakmaktepe waste should be in average similar to, or better than Çöpler
waste.
SSR preliminary estimations indicate that all factors of safety at critical
sections should achieve or exceed the minimum acceptable factor of safety (FOS) for waste rock storage facilities of 1.4 for static loads
and 1.1 under pseudo-static conditions. If the geotechnical review by WSP in Q1 2024 indicates critical sections with factors of safety
lower than what was previously assessed, the geometric designs will be revised to achieve the required FOS. In that case, WSP will provide
recommendations to revise the designs.
| | 13-32 | |
| SSR Mining Inc. | Çöpler Property S-K 1300 Report | February 12, 2024 SLR Project No.: 138.21581.00006 |
Figure 13-11: Mineral Reserve
Base Case Site Plan
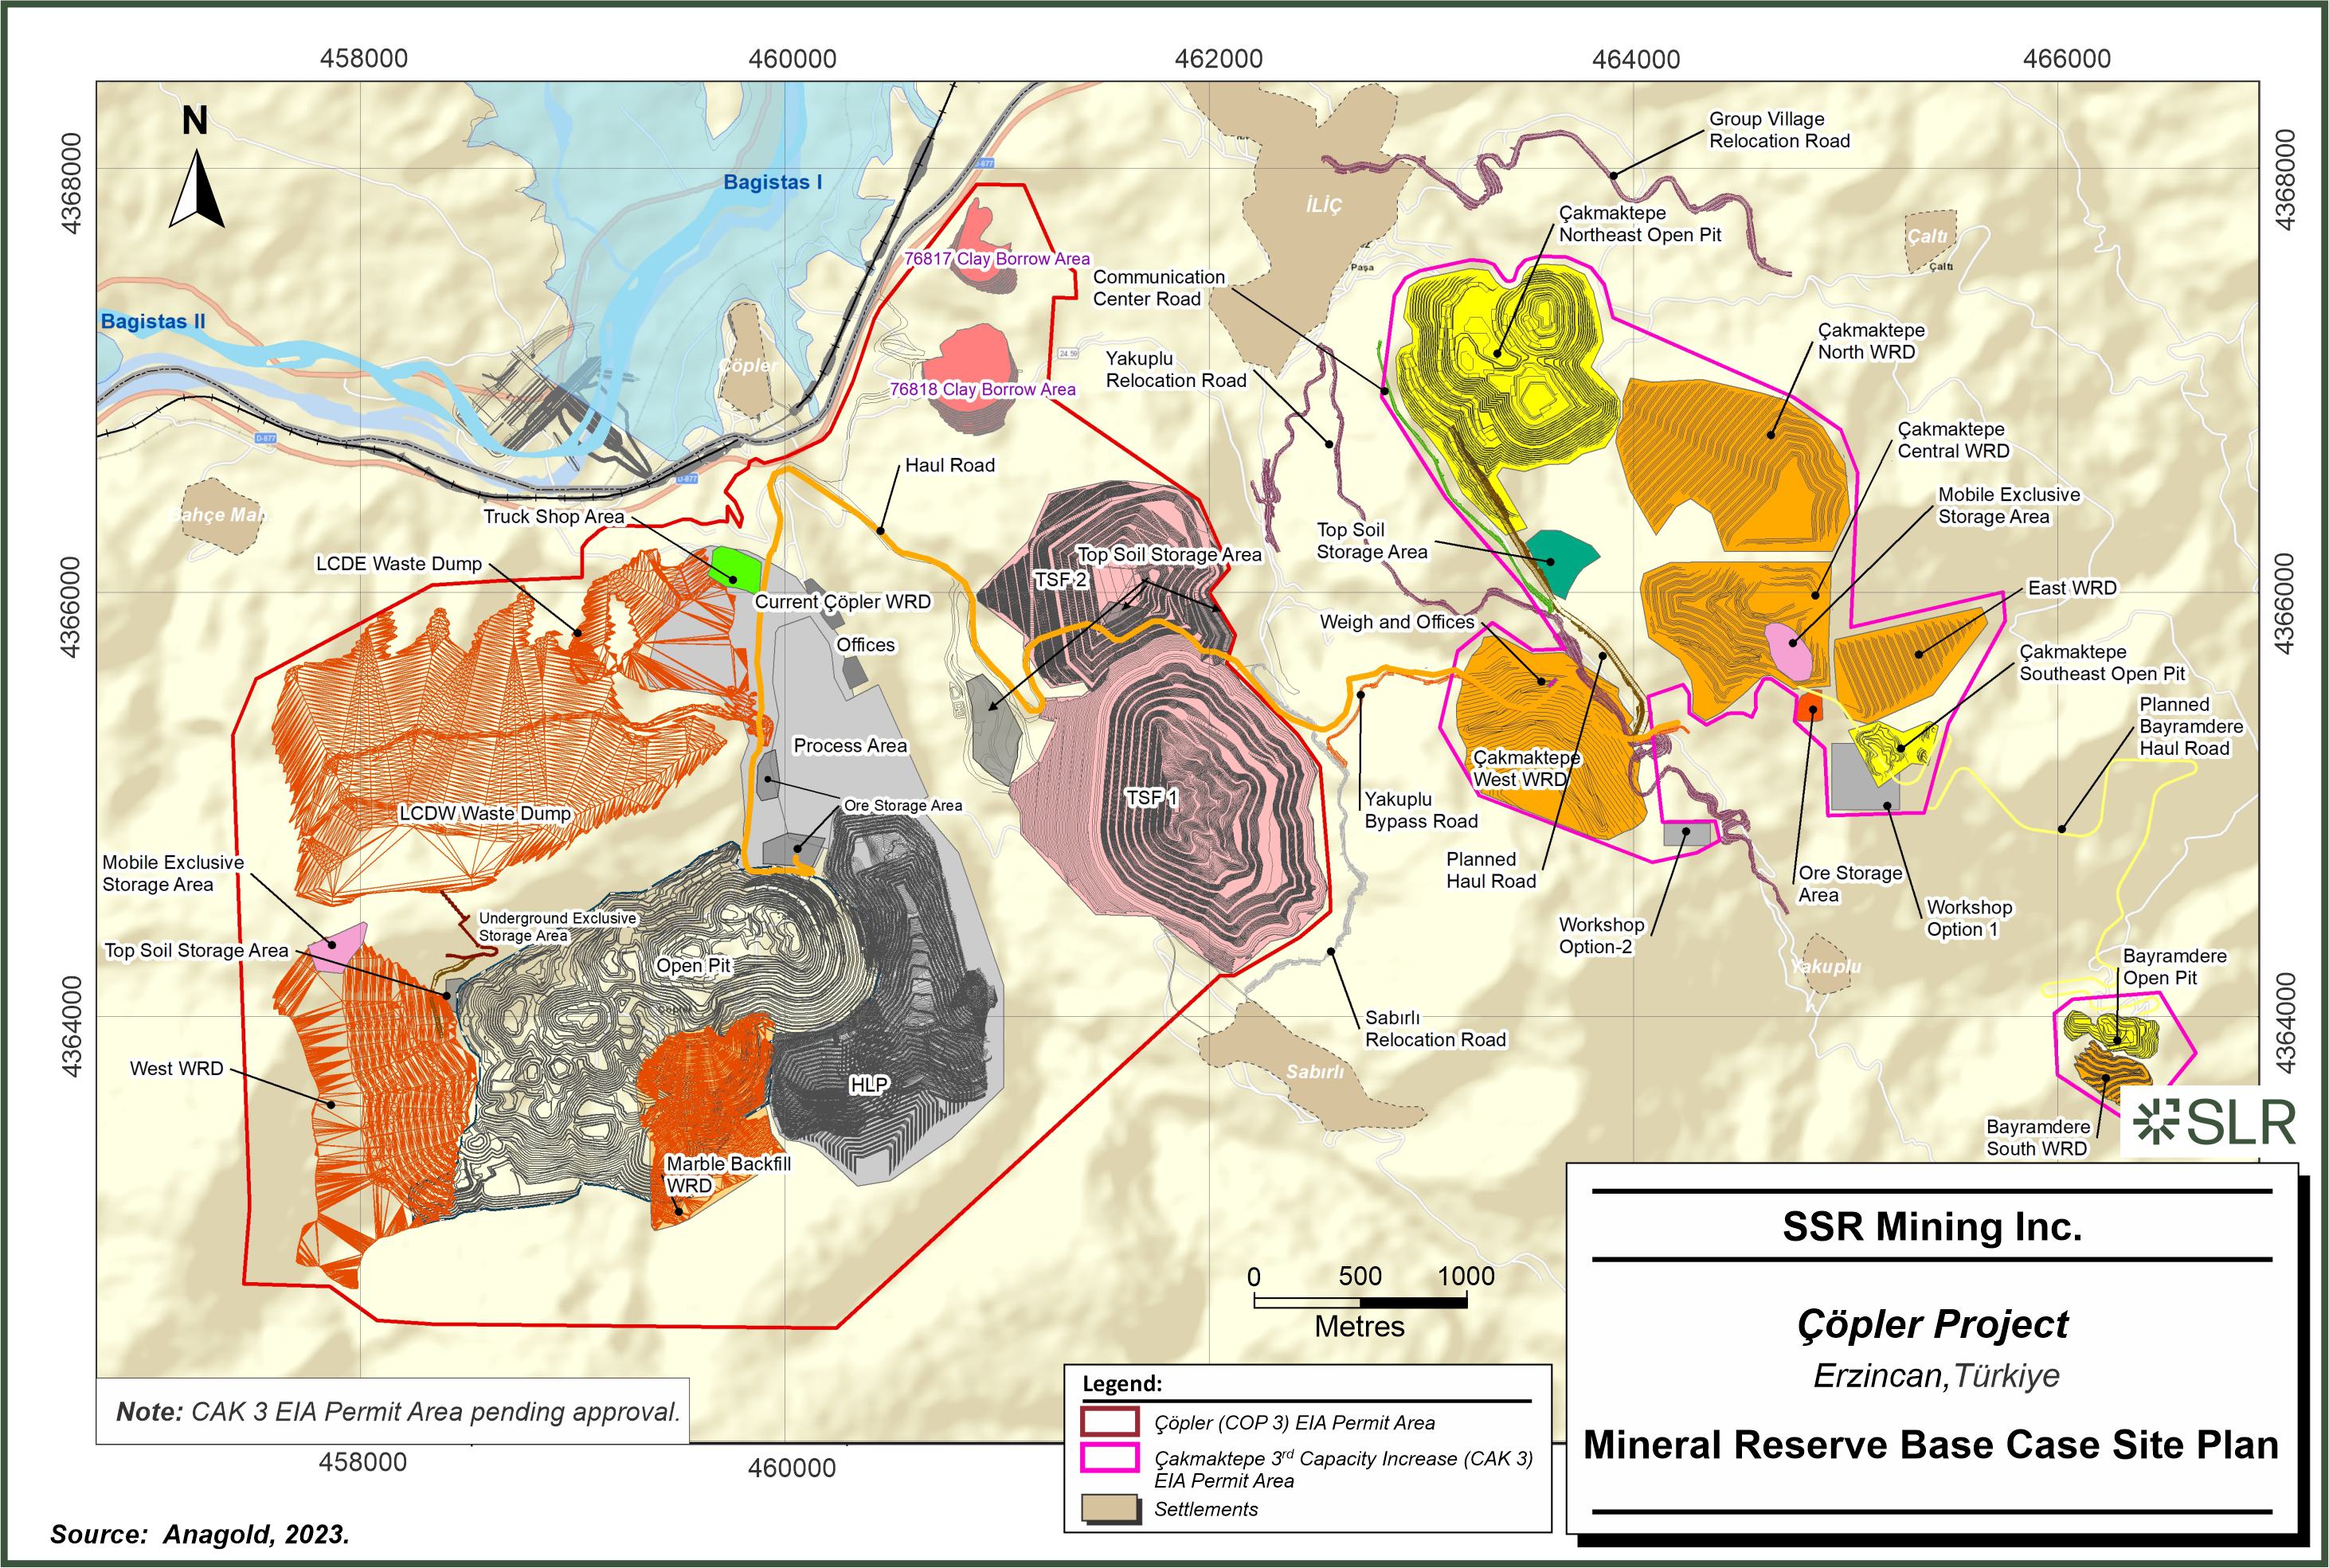
SSR
Mining Inc. Copler Project Erzincan, Turkiye Mineral Reserve Base Case Site Plan
| | 13-33 | |
| SSR Mining Inc. | Çöpler Property S-K 1300 Report | February 12, 2024 SLR Project No.: 138.21581.00006 |
Table 13-14: Waste Rock Dump
(WRD) Design Factor of Safety (FOS)
| WRD |
Section |
Loading Condition |
Failure Surface Location |
Minimum Computed FOS |
| Lower Çöpler East |
A |
Static |
Shallow |
1.4 |
| Pseudo-static |
1.1 |
| Static |
Deep |
1.9 |
| Pseudo-static |
1.3 |
| B |
Static |
Shallow |
1.7 |
| Pseudo-static |
1.3 |
| Static |
Deep |
1.9 |
| Pseudo-static |
1.3 |
| Lower Çöpler West |
C |
Static |
Shallow |
1.7 |
| Pseudo-static |
1.3 |
| Static |
Deep |
1.9 |
| Pseudo-static |
1.3 |
| D |
Static |
Shallow |
1.6 |
| Pseudo-static |
1.2 |
| Static |
Deep |
1.8 |
| Pseudo-static |
1.3 |
| West Çöpler |
E |
Static |
Shallow |
1.6 |
| Pseudo-static |
1.1 |
| Static |
Deep |
1.9 |
| Pseudo-static |
1.3 |
| F |
Static |
Shallow |
1.6 |
| Pseudo-static |
1.2 |
| Static |
Deep |
2.0 |
| Pseudo-static |
1.4 |
Source: Golder 2015
The Lower Çöpler East WRD facility will be constructed over
a portion of the existing Northeast WRD. Foundation conditions underlying the existing northeast WRD and the proposed Lower Çöpler
East facility consist of Munzur Limestone. Minimum computed factors of safety for the Lower Çöpler East facility are 1.4 and
1.1 for static and seismic loading conditions, respectively.
The Lower Çöpler West WRD facility will be founded on Munzur
limestone. Limit equilibrium stability analyses indicate minimum computed FOS of 1.6 and FOS of 1.2 for static and seismic loading conditions,
respectively (Golder, 2015b).
The West WRD is to be constructed adjacent to the Çöpler
open pit and will be founded on Munzur Formation limestone and metasediment with sporadic diorite intrusions. Minimum computed FOS are
1.9 and 1.3 for static and seismic loading conditions, respectively.
| 13.2.4.2 | Waste Rock Geochemical Review |
Anagold mines and monitors the waste rock types to determine PAG and
NAG material, as defined in the Çöpler waste rock management plan, to ensure proper disposal of PAG material as it is encountered
during the grade control process. SRK (2015) established the criteria for identifying PAG and NAG material, as shown in Table 13-15.
| | 13-34 | |
| SSR Mining Inc. | Çöpler Property S-K 1300 Report | February 12, 2024 SLR Project No.: 138.21581.00006 |
Table 13-15: Waste Rock Geochemical
Classification
| Lithology |
Sulfide Sulfur (SS%) Cut-off Grade |
Waste Rock Groups |
Descriptions |
| Diorite |
0.8 |
PAG/High-sulfide diorite |
Diorite with SS ≥0.8% |
| NAG/Low-sulfide diorite |
Diorite SS <0.8% |
| Metasediment |
0.8 |
PAG/High-sulfide MTS |
Metasediment with SS ≥0.8% |
| NAG/Low-sulfide MTS |
Metasediment with SS <0.8% |
| Limestone / Marble |
2.0 |
High-sulfide LMS |
Limestone with SS ≥2%. |
| Low-sulfide LMS |
Limestone with SS <2%. |
| Gossan |
0.0 |
Gossan – NAG |
All Gossan unit |
| MnOx |
0.0 |
MnOx – NAG |
All MnOx unit |
| Massive Pyrite |
– |
Massive Pyrite – PAG |
All Massive Pyrite unit |
SRK (2015) completed a geochemical impact assessment for the Çöpler
WRD facilities. The key findings from the SRK report suggests that all WRD facilities at Çöpler, except one, have a neutralising
potential (NP) to acid potential (AP) ratio of greater than 20:1; indicating that the Çöpler material has excellent neutralisation
capacity for ARD. The one exception to this was the West WRD, which was estimated to have a NP:AP ratio 1:3. It was recommended that Anagold
optimise the WRD construction sequencing in order to take advantage of the neutralisation potential of the other WRD facilities by blending
higher quantities of NAG material into the West WRD. Changes to Çöpler ultimate pit, phasing, and addition of a limestone
phase has resolved the net neutralizing potential (NNP) issues going forward.
A series of waste rock samples representing the LOM distribution were
tested by SRK to measure the immediate reactivity, future acid potential, and long-term acid potential of the waste rock.
Regarding immediate reactivity, a paste pH test was conducted that resulted
in all samples generating near-neutral and slightly alkaline paste pH.
Regarding future acid potential, a large majority of all samples taken
reside above the NP:AP 1:1 boundary. The remainder of the samples that fall below the 1:1 boundary is extremely close to the 1:1 boundary,
and should only pose a minimal risk to ARD generation. In terms of long-term acid potential, for sulfide zone diorite and metasediment,
the NP:AP ratio is observed to be mostly in uncertain or PAG zones.
| 13.2.5 | Ore Stockpiles, Rehandle and Blending Discussion |
Oxide and sulfide ore are processed through separate crushing circuits.
Oxide ore that is unable to be directly dumped into the crushing circuit
is placed on the appropriate stockpile for processing later. Oxide ore is typically segregated by clay content and gold grade. The processing
engineer determines the desired blend to maintain a consistent feed grade and rock type daily blend going to the heap leach pad.
| | 13-35 | |
| SSR Mining Inc. | Çöpler Property S-K 1300 Report | February 12, 2024 SLR Project No.: 138.21581.00006 |
All sulfide ore is currently placed in one of three primary stockpiles:
High-grade, medium-grade, or low-grade. Sulfide ore is directed to the primary stockpiles or to the crusher pad. There is no allowance
for material to be directly dumped into the sulfide crushing circuit. All material is rehandled by a loader from the crushing pad into
the crushing circuit.
The following gold grade bin assumptions were used for the Mineral Reserves:
| · | High-grade Gold >4.0 g/t Au |
| · | Medium-grade Gold 2.5 g/t Au to 4.0 g/t Au |
| · | Low-grade Gold 1.05 g/t Au to 2.5 g/t Au |
Maintaining proper sulfide sulfur (SS) feed percentages for the POX
plant is a challenge. The flotation plant was designed to upgrade (increase) the sulfide sulfur POX circuit feed. For the POX autoclave
to operate autogenously, SS feed must be above 10.20 tph and less than 13.75 tph to achieve target oxidation with current oxygen availability.
If the SS feed rate is too high, then the feed to the plant will need to be reduced until the POX SS feed rate is less than 13.75 tph
limit. Operating performance of the autoclaves to date indicates that higher than design oxygen utilisation efficiencies are possible,
which may allow a higher throughput than the 13.75 tph sulfide sulfur limit. This oxygen utilisation efficiency along with increased oxygen
availability is upside to the Mineral Reserve Base Case throughput.
Plant feed will therefore need to be blended to achieve the target SS
feed range of 10.20 tph to 13.75 tph into POX circuit.
To blend on SS feed, new grade control protocols have been developed
and implemented on site. Site grade control is currently being done on gold and sulfide sulfur grades to aid in achieving the ideal range
for SS feed into the plant and assist with the development of a new stockpile strategy.
The following SS grade bin assumptions were used for the Mineral Reserves
inside each Au grade bin:
| · | Medium-grade SS 3.494% to 4.15% SS |
The effectiveness of these new grade bins in controlling the SS blend
will need to be monitored on an ongoing basis as the plant matures and adjustments to the grade bin parameters (and size of stockpiles)
may be required. This work will need to continue as the mine progresses and new mining areas are included.
The smallest parcel size for plant feed considered for the scheduling
of the Mineral Reserves was one month. The following items are key elements in optimizing the blending and throughput of the process plant.
Mine Working Areas
Given the relatively small size of the equipment in the mining fleet,
the number of active mining working areas can be increased, increasing mining selectivity, and therefore improving the blending capacity
from the mine.
| | 13-36 | |
| SSR Mining Inc. | Çöpler Property S-K 1300 Report | February 12, 2024 SLR Project No.: 138.21581.00006 |
Stockpile Size
The size of stockpiles could be adjusted to reduce feed impacts from
short-term fluctuations coming from the mine.
Mining Rate
The site has the ability to ramp up the mining rates to reach sufficient
material (of the required type) to maintain the required blend for the process plant(s), by using the contractor’s ability to increase
their fleet size.
Variation of Grade Bins
Grade bin designations can be adjusted as necessary to achieve better
control of the grade bands.
All grade control operations are managed by Anagold technical staff.
Anagold maintains an on-site laboratory with the capacity to assay an average of 600 blasthole samples per day.
Prior to sampling, blastholes are identified as ‘potential ore’
(oxide or sulfide) or ‘potential waste’ (oxide or sulfide) based on grade control data from the bench above and the mining
model prediction. A 10-m wide outside buffer is then applied to the potential ore areas to ensure appropriate sampling density. All potential
ore blastholes are sampled for gold fire assay (AuFA). Approximately 50% of potential ore blastholes are sampled for cyanide soluble gold
assay (AuCN), total carbon, and total sulfur. Additionally, all potential sulfide ore blastholes are sampled for sulfide sulfur (SS).
Approximately 25% of potential waste blastholes are sampled for gold fire assay (AuFA), cyanide soluble gold (AuCN), total carbon, and
total sulfur.
Sampling of the blasthole drill cuttings is performed according to the
defined procedure by using a sample scoop to extract a complete cross-section of the cuttings pile. The sampled cuttings are deposited
into a canvas bag, which is labelled with a drillhole identifier (ID) and with a laboratory information management system (LIMS) bar code
tag inserted into the bag of cuttings. Sample bags are then sealed and sent to the on-site laboratory for analysis. The sample scoop is
cleaned prior to collecting each sample to avoid contamination between samples.
Assay results are uploaded to the grade control database with reference
to each specific drillhole ID. The assay results are then estimated into a cell model with parent cell sizes of 3 m x 3 m
x 5 m using ordinary kriging (OK) to estimate ore grade and type. The grade control geologist will then digitize mining shapes with
a minimum width of 3 m (to match the SMU) and minimum tonnage of 500 tonnes. These mining shapes are then sent to the survey
group for layout in the mine using colour coded flagging under the supervision of the grade control geologist.
To effectively blend the sulfide feed on SS content, new grade control
protocols were developed and implemented on site in 2021. They are undergoing further review to optimize and improve production.
A summary of the mine contractor’s mobile equipment list is provided
in Table 13-16. The mine contractor is responsible for the manning and maintenance of the equipment.
| | 13-37 | |
| SSR Mining Inc. | Çöpler Property S-K 1300 Report | February 12, 2024 SLR Project No.: 138.21581.00006 |
Table 13-16: Çöpler
Mine Contractor’s Mobile Equipment List
| Equipment Category |
Typical Brand Name/ Model |
Typical Size |
Number of Units |
| Explosive Truck |
MERCEDES-BENES |
|
2 |
| Drill Rig |
AC FLEXIROC T35-11LF, EPIROC T40 |
168 kW, 64-115 mm |
6 |
| Loader |
CAT 980 L, CAT 950 |
292 kW - 10 m3 |
19 |
| Excavator |
CAT 330 GC, CAT 374 |
361 kW - 3.3 m3 |
30 |
| Haul Truck |
MB AROCS 4145 K |
405 Hp, 40 t |
140 |
| Mine Truck |
VOLVO A40G |
350 kW - 39 t |
6 |
| Water Truck |
|
|
8 |
| Grader |
CAT 140 M |
139 kW - 4 m |
7 |
| Track Dozer |
CAT D8T, CAT D7E |
233 kW - 39.4 t - 4 m |
8 |
| Forklift |
MANITOU, CAT |
|
4 |
| Hydraulic Breaker |
ATLAS COPCO, EPIROC, KOMAC |
22t to 38 t - 170 bar |
8 |
| Compactor |
CAT CS78B |
130 kW - 18.7 t - 2 m |
6 |
| Field Mechanical Services |
MERCEDES-BENES, MITSUBISHI |
|
4 |
| Tower |
MB ACTROS 1845 LS |
330 kW |
7 |
| Fuel Truck |
MB AXOR 1823 |
170kW |
5 |
| Fuel Truck |
Tanker |
32 m3 |
4 |
| Breaker (Mobile Crusher) |
METSO LT1213 KIRICI |
310 kW - 1.32 x 0.9 m |
3 |
| Screen |
METSO ST 4.8, TEREX POWERSCREEN 2100 |
|
2 |
| Light Tower |
AC QLT M10, WACKER NEUSON LTN 6L |
9 kW - 4000 W |
29 |
| Light Vehicle |
ISUZU, FORD RANGER |
|
35 |
| Bus |
ISUZU, FORD 440e |
|
3 |
| Mini Bus |
FORD |
|
3 |
Personnel associated with the mining operations is tabulated in Table
13-17.
Table 13-17: Çöpler
Project – Mining Personnel Summary
| Disciplines |
Çöpler |
Çakmaktepe |
|
| |
Anagold |
Çiftay (Contractor) |
Anagold |
Çiftay (Contractor) |
Totals |
| Engineering/Admin. Support |
0 |
9 |
0 |
3 |
12 |
| Mine Operations |
49 |
443 |
0 |
200 |
692 |
| Mine Maintenance |
0 |
120 |
0 |
0 |
120 |
| Totals |
49 |
572 |
0 |
203 |
824 |
| | 13-38 | |
| SSR Mining Inc. | Çöpler Property S-K 1300 Report | February 12, 2024 SLR Project No.: 138.21581.00006 |
| 13.5 | Mine Production Schedule |
The Mineral Reserve Case has examined production from three open pit
mining locations at the Project: the Çöpler deposit and the Greater Çakmaktepe deposit area which includes the Çakmaktepe
pit and the Çakmaktepe Ext. The Çakmaktepe pit, which contains only oxide ore, is almost exhausted.
Anagold has prepared the open pit production schedules. Figure 13-9
shows total mine production and the tonnages and grades for each ore type on a 100% project basis.
Figure 13-12: Çöpler
LOM Mining Production
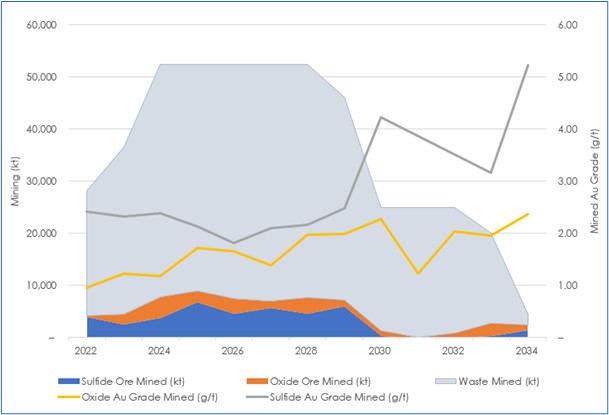
Source: SSR, 2023
| 13.5.2 | Scheduling Assumptions |
The following scheduling criteria were used to balance mine, mill, and
stockpile quantities:
Heap leach:
| · | Oxide ore is not limited by processing capacity. |
| · | Oxide ore that is unable to be directly dumped into the oxide crushing circuit is placed in the appropriate stockpile for future processing. |
| · | Oxide ore is segregated dependent on clay content and average grade. |
| | 13-39 | |
| SSR Mining Inc. | Çöpler Property S-K 1300 Report | February 12, 2024 SLR Project No.: 138.21581.00006 |
Sulfide plant:
| · | All sulfide ore is segregated into one of three primary gold stockpiles: high-grade, medium-grade, and low-grade, which are each further
split by sulfide sulfur (SS) grade. |
| · | High-Grade: Au Grade >= 4.0 g/t |
| · | Medium Grade: 4.0 g/t>Au Grade >= 2.5 g/t |
| · | Low Grade: Au Grade=<2.50 g/t |
| · | Existing stockpiles are mined at the average grade of each stockpile. |
| · | All material is re-handled by a loader from the crushing pad into the crushing circuit (no direct tipping). |
| · | The flotation circuit was commissioned in December 2021 with circuit ramp up and a transition to stable operations achieved in 2022. |
| · | Plant throughput capacity is calculated from the available mill hours and varies by material type. |
Grind Leach CIL:
| · | Grind leach CIL ore begins processing in 2027. |
| · | First year production of grind leach CIL ore is reduced by 15% to account for plant ramping up to full capacity. |
| · | Plant throughput from 2028-LOM is 2 Mt per annum. |
| · | Oxide CIL ore that cannot be processed due to limited capacity is stockpiled and processed at a later date. |
The production schedules are based on Proven and Probable Mineral Reserves
only. No Inferred Mineral Resources were used in the production schedules. The open pit schedules were based on mining inventories by
bench reported within the pit stages. Low-grade stockpiling was used to balance the mining rate where necessary.
| 13.5.3 | Production Schedule |
The input assumptions for Mineral Reserve Case were adjusted based on
current mine and production performances including throughput rates and recoveries.
All throughput rates are reported inclusive of all availability and
utilization factors on a calendar year. Total mine production is limited to an annual average of 22.5 Mtpa (approximately 62 ktpd).
The throughput assumptions are supported by current mining rates including productivity allowances for winter and summer conditions. Mining
rates are limited based on vertical advance and bench configuration to ensure that the schedule is achievable. Production is not limited
by the mining rate and increases in rate would be possible to bring forward oxide ore or increase stockpiling to bring higher grade feed
to the sulfide plant.
Mining is completed in 2036, after which, the sulfide plant is fed from
stockpiles until 2039.
The objective of the production schedule is to maximise the early cash
flow by delaying costs and bringing revenue forward with ore feed to meet concentrator throughput capacity. Considerations for the LOM
scheduling include:
| | 13-40 | |
| SSR Mining Inc. | Çöpler Property S-K 1300 Report | February 12, 2024 SLR Project No.: 138.21581.00006 |
| · | Ensuring continuous ore supply to the concentrator by delivering the highest value ore first and meeting physical mining and milling
hours capacity constraints. |
| · | Achieving excavator productivities and sinking rates to deliver ore at maximum utilisation of milling hours available at the concentrator. |
| · | Maximizing annual utilization hours for the mine loading equipment. |
| · | Maintaining a balance of ore throughput rates (material types) and mill cut-off grades that allows milling hours to be maximized. |
The mine schedule incorporates strategic stockpiling considerations
by optimising the number of excavators on the benches of early phases, increasing the opportunity to raise mill cut-off grades. This leads
to stockpiling medium-grade and low-grade material and sending higher grade ore to the mill sooner. The open pit total movement is shown
in Table 13-18 on a 100% Project basis.
| | 13-41 | |
| SSR Mining Inc. | Çöpler Property S-K 1300 Report | February 12, 2024 SLR Project No.: 138.21581.00006 |
Table 13-18: Çöpler
Mining Schedule (2023–2036)
| |
Units |
Totals |
2023 |
2024 |
2025 |
2026 |
2027 |
2028 |
2029 |
2030 |
2031 |
2032 |
2033 |
2034 |
2035 |
2036 |
| Çöpler Heap Leach |
kt |
- |
- |
- |
- |
- |
- |
- |
- |
- |
- |
- |
- |
- |
- |
- |
| Çakmaktepe Heap Leach |
kt |
6,743 |
110 |
975 |
1,739 |
1,353 |
1,131 |
1,435 |
- |
- |
- |
- |
- |
- |
- |
- |
| Çöpler POX Plant |
kt |
8,987 |
1 |
616 |
1,085 |
1,885 |
2,007 |
1,275 |
1,269 |
849 |
- |
- |
- |
- |
- |
- |
| Çakmaktepe POX Plant |
kt |
8,208 |
4 |
83 |
336 |
315 |
727 |
1,075 |
1,329 |
239 |
886 |
82 |
1,949 |
1,182 |
- |
- |
| Çöpler Oxide Grind Leach |
kt |
896 |
- |
- |
- |
- |
34 |
207 |
203 |
452 |
- |
- |
- |
- |
- |
- |
| Çakmaktepe Grind Leach |
kt |
12,800 |
- |
- |
- |
- |
1,701 |
1,537 |
1,562 |
957 |
1,166 |
2,150 |
2,150 |
1,579 |
- |
- |
| Çöpler Stockpile |
kt |
10,109 |
110 |
703 |
621 |
1,495 |
2,742 |
885 |
1,731 |
1,822 |
- |
- |
- |
- |
- |
- |
| Çakmaktepe Stockpile |
kt |
6,617 |
0 |
18 |
16 |
220 |
177 |
379 |
140 |
53 |
91 |
278 |
3,579 |
1,665 |
- |
- |
| Çöpler Waste |
kt |
157,437 |
2,480 |
20,343 |
22,823 |
25,708 |
25,078 |
18,838 |
22,133 |
12,684 |
2,058 |
2,069 |
2,074 |
1,147 |
1 |
1 |
| Çöpler Stock Waste |
kt |
6,857 |
1,587 |
130 |
810 |
128 |
- |
4,202 |
- |
- |
- |
- |
- |
- |
- |
- |
| Çakmaktepe Waste |
kt |
355,365 |
1,328 |
8,292 |
10,050 |
20,151 |
40,718 |
40,158 |
41,428 |
43,210 |
42,317 |
42,070 |
34,948 |
30,694 |
- |
- |
| Çakmaktepe Stock Waste |
kt |
- |
- |
- |
- |
- |
- |
- |
- |
- |
- |
- |
- |
- |
- |
- |
| Total Material Movement |
kt |
574,020 |
5,620 |
31,161 |
37,481 |
51,255 |
74,316 |
69,991 |
69,794 |
60,266 |
46,517 |
46,650 |
44,700 |
36,267 |
1 |
1 |
| |
|
|
|
|
|
|
|
|
|
|
|
|
|
|
|
|
| Total Ore |
kt |
37,634 |
115 |
1,675 |
3,160 |
3,554 |
5,600 |
5,528 |
4,363 |
2,496 |
2,051 |
2,232 |
4,099 |
2,761 |
- |
- |
| Total Stockpile |
kt |
16,727 |
111 |
722 |
637 |
1,715 |
2,920 |
1,264 |
1,871 |
1,875 |
91 |
278 |
3,579 |
1,665 |
- |
- |
| Total Waste |
kt |
519,659 |
5,395 |
28,765 |
33,683 |
45,987 |
65,796 |
63,198 |
63,561 |
55,895 |
44,375 |
44,140 |
37,022 |
31,841 |
1 |
1 |
| Total Material Movement |
kt |
574,020 |
5,620 |
31,161 |
37,481 |
51,255 |
74,316 |
69,991 |
69,794 |
60,266 |
46,517 |
46,650 |
44,700 |
36,267 |
1 |
1 |
| |
|
|
|
|
|
|
|
|
|
|
|
|
|
|
|
|
| Çöpler Heap Leach |
g/t |
- |
- |
- |
- |
- |
- |
- |
- |
- |
- |
- |
- |
- |
- |
- |
| Çakmaktepe Heap Leach |
g/t |
1.939 |
1.932 |
1.761 |
1.706 |
2.022 |
2.040 |
2.184 |
- |
- |
- |
- |
- |
- |
- |
- |
| Çöpler POX Plant |
g/t |
2.339 |
2.316 |
2.910 |
2.121 |
2.324 |
2.533 |
2.254 |
1.988 |
2.430 |
- |
- |
- |
- |
- |
- |
| | 13-42 | |
| SSR Mining Inc. | Çöpler Property S-K 1300 Report | February 12, 2024 SLR Project No.: 138.21581.00006 |
| |
Units |
Totals |
2023 |
2024 |
2025 |
2026 |
2027 |
2028 |
2029 |
2030 |
2031 |
2032 |
2033 |
2034 |
2035 |
2036 |
| Çakmaktepe POX Plant |
g/t |
4.210 |
3.173 |
2.627 |
2.247 |
2.767 |
2.857 |
3.061 |
4.843 |
3.996 |
3.420 |
2.844 |
5.692 |
4.720 |
- |
- |
| Çöpler Grind Leach |
g/t |
1.190 |
- |
- |
- |
- |
2.246 |
1.691 |
0.989 |
0.973 |
- |
- |
- |
- |
- |
- |
| Çakmaktepe Grind Leach |
g/t |
2.489 |
- |
- |
- |
- |
2.438 |
2.567 |
2.544 |
2.266 |
2.015 |
2.021 |
3.098 |
2.710 |
- |
- |
| Çöpler Stockpile |
g/t |
1.510 |
1.881 |
1.463 |
1.549 |
1.533 |
1.522 |
1.402 |
1.485 |
1.530 |
- |
- |
- |
- |
- |
- |
| Çakmaktepe Stockpile |
g/t |
1.970 |
1.760 |
2.733 |
2.108 |
1.689 |
1.995 |
1.909 |
1.513 |
1.970 |
1.900 |
1.374 |
2.040 |
2.001 |
- |
- |
| Average Grade |
g/t |
2.143 |
1.932 |
2.007 |
1.849 |
2.022 |
2.138 |
2.290 |
2.553 |
1.948 |
2.591 |
1.976 |
3.263 |
2.980 |
- |
- |
| |
|
|
|
|
|
|
|
|
|
|
|
|
|
|
|
|
| Çöpler Heap Leach |
koz |
0 |
0 |
0 |
0 |
0 |
0 |
0 |
0 |
0 |
0 |
0 |
0 |
0 |
0 |
0 |
| Çakmaktepe Heap Leach |
koz |
420 |
7 |
55 |
95 |
88 |
74 |
101 |
0 |
0 |
0 |
0 |
0 |
0 |
0 |
0 |
| Çöpler POX Plant |
koz |
676 |
0 |
58 |
74 |
141 |
163 |
92 |
81 |
66 |
0 |
0 |
0 |
0 |
0 |
0 |
| Çakmaktepe POX Plant |
koz |
1,111 |
0 |
7 |
24 |
28 |
67 |
106 |
207 |
31 |
97 |
7 |
357 |
179 |
0 |
0 |
| Çöpler Grind Leach |
koz |
34 |
0 |
0 |
0 |
0 |
2 |
11 |
6 |
14 |
0 |
0 |
0 |
0 |
0 |
0 |
| Çakmaktepe Grind Leach |
koz |
1,024 |
0 |
0 |
0 |
0 |
133 |
127 |
128 |
70 |
75 |
140 |
214 |
138 |
0 |
0 |
| Çöpler Stockpile |
koz |
491 |
7 |
33 |
31 |
74 |
134 |
40 |
83 |
90 |
0 |
0 |
0 |
0 |
0 |
0 |
| Çakmaktepe Stockpile |
koz |
419 |
0 |
2 |
1 |
12 |
11 |
23 |
7 |
3 |
6 |
12 |
235 |
107 |
0 |
0 |
| Total Gold Ounces |
koz |
4,176 |
14 |
155 |
226 |
343 |
586 |
500 |
512 |
274 |
178 |
160 |
806 |
424 |
- |
- |
Notes:
| 1. | Production schedule is shown at a 100% basis. SSR’s portion is 80%. |
| | 13-43 | |
| SSR Mining Inc. | Çöpler Property S-K 1300 Report | February 12, 2024 SLR Project No.: 138.21581.00006 |
| 13.5.4 | Processing Schedule |
The processing schedule was balanced to meet the maximum build rates
for the oxide heap leach pads and the available mill hours for the sulfide plant.
Sulfide ore processing throughputs are limited dependent on ore tonnage,
SS tonnage, and carbonate content (expressed as C). The sulfide plant crusher / grinding circuit is limited to 400 tph, while the
limitations on SS tonnage exist due to (1) the consumption of oxygen by SS in the POX circuit and (2) carbonate content to maintain an
operable acid balance through the acidulation and POX circuits. The process facilities are limited by the amount of oxygen that can be
provided to the POX process. Based on current performance, high-SS is unlikely to be a problem, and any higher material would be blended
down using low-SS material. The carbonate:SS ratio will potentially be an issue with declining SS grades in the final years of the mine.
The main issue currently appears to be a lack of SS in the feed, forming the justification for the flotation circuit. The flotation circuit
upgrades the SS content into the autoclave feed and rejects carbonate.
To target the highest value material, the sulfide processing schedule
targets the highest value material, while also balancing the plant throughput rates and required range of sulfide sulfur into the autoclave.
The production is predominantly from sulfide ore. The oxide heap leach
and sulfide plant processing schedules feed type, Au grade, and gold production are shown in Figure 13-13. Gold production and recovery
is shown in Figure 13-14. The annual processing schedule is in Table 13-19. Schedules shown are on a 100% Project basis.
The production includes 6.8 Mt at 1.93 g/t Au oxide ore processed
by heap leaching, 18.7 Mt at 2.26 g/t processed by direct cyanide leaching and CIP, and 41.7 Mt at 2.42 g/t Au processed in
the sulfide plant. Total ore processed is 67.2 Mt at 2.32 g/t Au. Total contained gold processed is 5.0 Moz (SSR 80%
share is 4.0 Moz).
Mining at the Çöpler pit is completed in 2030 and at Greater
Çakmaktepe in 2034. Oxide heap leach stacking is completed in in 2028, while sulfide processing will continue from stockpiles until
2038. The processing schedule is for the period October 31, 2023, through 2038.
| | 13-44 | |
| SSR Mining Inc. | Çöpler Property S-K 1300 Report | February 12, 2024 SLR Project No.: 138.21581.00006 |
Figure 13-13: Mineral Reserve
Case Processing Schedule
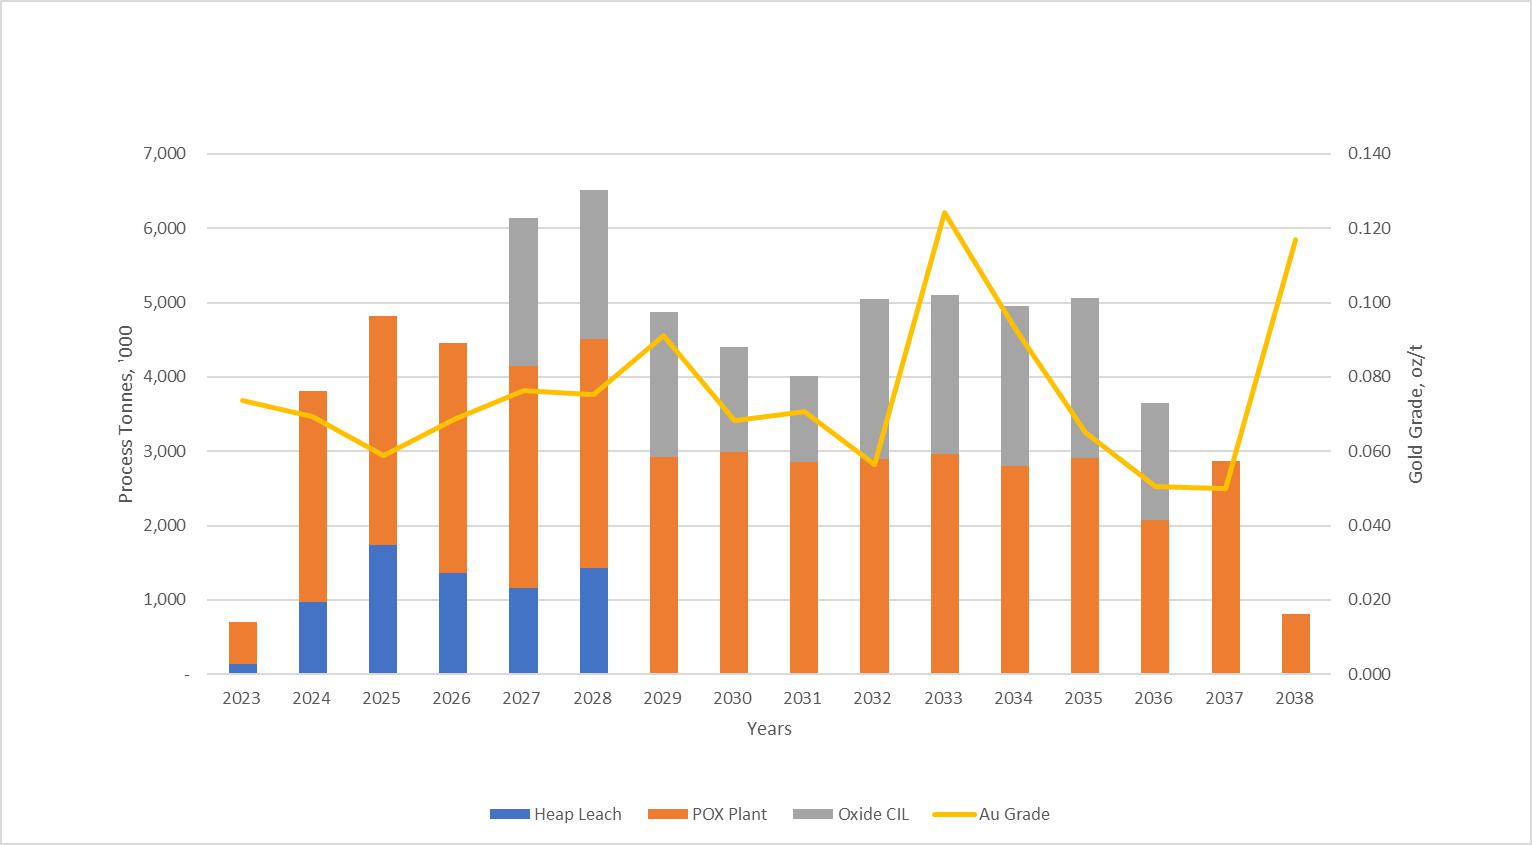
Source: SSR, 2023
Notes:
| 1. | Processing schedule is shown at a 100% basis. SSR’s portion is 80%. Oxide CIL process is also known as G-L. |
Figure 13-14: Mineral Reserve
Case Gold Production and Recovery
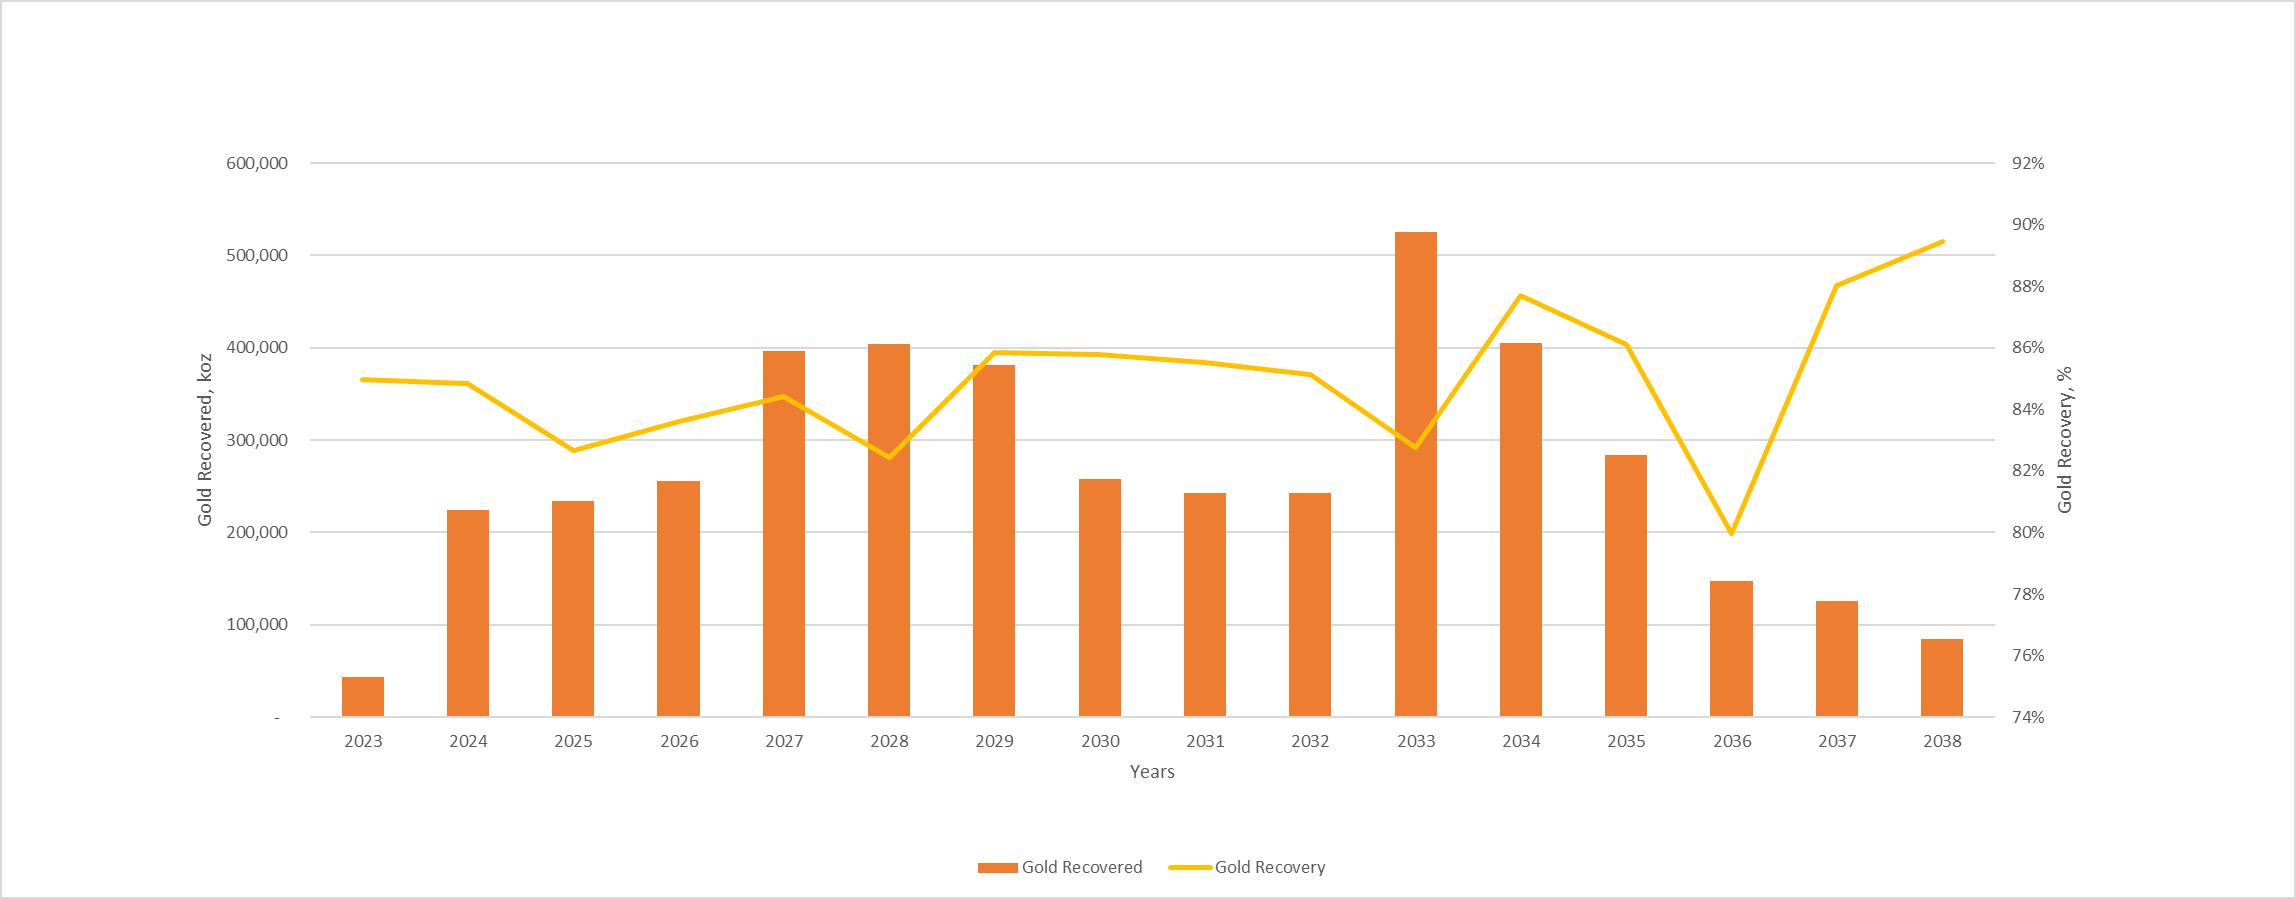
Source: SSR, 2023
Notes:
| 1. | Gold production is shown at a 100% basis. SSR’s portion is 80%. |
| | 13-45 | |
| SSR Mining Inc. | Çöpler Property S-K 1300 Report | February 12, 2024 SLR Project No.: 138.21581.00006 |
Table 13-19: Processing Production
Schedule (2023–2038)
| Item |
Process Description |
Units |
Total |
2023 |
2024 |
2025 |
2026 |
2027 |
2028 |
2029 |
2030 |
2031 |
2032 |
2033 |
2034 |
2035 |
2036 |
2037 |
2038 |
| Process Tonnes |
Heap Leach |
kt |
6,811 |
144 |
975 |
1,740 |
1,361 |
1,157 |
1,435 |
- |
- |
- |
- |
- |
- |
- |
- |
- |
- |
| Process Tonnes |
POX Plant |
kt |
41,718 |
557 |
2,839 |
3,073 |
3,095 |
2,983 |
3,080 |
2,919 |
2,995 |
2,851 |
2,901 |
2,958 |
2,805 |
2,907 |
2,081 |
2,865 |
811 |
| Process Tonnes |
Grind Leach |
kt |
18,699 |
- |
- |
- |
- |
2,000 |
2,000 |
1,956 |
1,412 |
1,166 |
2,150 |
2,150 |
2,150 |
2,150 |
1,565 |
- |
- |
| Process Tonnes |
Process Feed Total |
kt |
67,229 |
700 |
3,814 |
4,813 |
4,455 |
6,140 |
6,514 |
4,875 |
4,408 |
4,016 |
5,051 |
5,108 |
4,955 |
5,057 |
3,646 |
2,865 |
811 |
| |
|
|
|
|
|
|
|
|
|
|
|
|
|
|
|
|
|
|
|
| Contained Au |
Heap Leach |
koz |
424 |
9 |
55 |
95 |
88 |
75 |
101 |
- |
- |
- |
- |
- |
- |
- |
- |
- |
- |
| Contained Au |
POX Plant |
koz |
3,244 |
43 |
209 |
187 |
217 |
244 |
238 |
305 |
217 |
208 |
145 |
421 |
272 |
190 |
109 |
143 |
95 |
| Contained Au |
Grind Leach |
koz |
1,358 |
- |
- |
- |
- |
150 |
152 |
139 |
84 |
75 |
140 |
214 |
191 |
139 |
75 |
- |
- |
| Contained Au |
Process Feed Total |
koz |
5,025 |
52 |
264 |
283 |
305 |
469 |
490 |
444 |
301 |
284 |
285 |
635 |
463 |
330 |
184 |
143 |
95 |
| |
|
|
|
|
|
|
|
|
|
|
|
|
|
|
|
|
|
|
|
| Recovered Au |
Heap Leach |
koz |
298 |
6 |
40 |
69 |
64 |
51 |
68 |
- |
- |
- |
- |
- |
- |
- |
- |
- |
- |
| Recovered Au |
POX Plant |
koz |
2,852 |
38 |
184 |
165 |
191 |
213 |
208 |
267 |
192 |
183 |
128 |
368 |
239 |
168 |
97 |
126 |
85 |
| Recovered Au |
Grind Leach |
koz |
1,104 |
- |
- |
- |
- |
131 |
128 |
114 |
66 |
60 |
114 |
157 |
166 |
115 |
50 |
- |
- |
| Recovered Au |
Process Feed Total |
koz |
4,254 |
44 |
224 |
234 |
255 |
396 |
404 |
381 |
258 |
243 |
243 |
525 |
406 |
284 |
147 |
126 |
85 |
| |
|
|
|
|
|
|
|
|
|
|
|
|
|
|
|
|
|
|
|
| Contained Ag |
Heap Leach |
koz |
291 |
2 |
40 |
55 |
53 |
67 |
72 |
- |
- |
- |
- |
- |
- |
- |
- |
- |
- |
| Contained Ag |
POX Plant |
koz |
5,011 |
3 |
37 |
131 |
385 |
282 |
340 |
475 |
318 |
232 |
711 |
800 |
474 |
400 |
122 |
299 |
1 |
| Contained Ag |
Grind Leach |
koz |
2,418 |
- |
- |
- |
- |
89 |
206 |
177 |
134 |
143 |
274 |
421 |
403 |
325 |
246 |
- |
- |
| Contained Ag |
Process Feed Total |
koz |
7,720 |
6 |
76 |
187 |
438 |
438 |
618 |
652 |
452 |
375 |
986 |
1,221 |
877 |
725 |
368 |
299 |
1 |
| |
|
|
|
|
|
|
|
|
|
|
|
|
|
|
|
|
|
|
|
| |
Stockpile In1 |
kt |
36,690 |
1,698 |
852 |
1,447 |
1,843 |
2,920 |
5,466 |
1,871 |
1,875 |
91 |
278 |
3,579 |
1,665 |
- |
- |
- |
- |
| |
Stockpile Out |
kt |
36,690 |
585 |
3,587 |
2,157 |
1,843 |
541 |
986 |
3,810 |
2,815 |
1,965 |
2,819 |
1,009 |
2,194 |
5,057 |
3,646 |
2,865 |
811 |
Notes:
| 1. | Total Stockpile In includes the opening balance of 13,106 kt. |
| 2. | Production schedule is shown at a 100% basis. SSR’s portion is 80%. |
| | 13-46 | |
| SSR Mining Inc. | Çöpler Property S-K 1300 Report | February 12, 2024 SLR Project No.: 138.21581.00006 |
| 14.0 | Processing and Recovery Methods |
The following section describes the Projects existing
and proposed processing operations.
| 14.1 | Sulfide Ore Processing |
The sulfide plant commenced commissioning in the
fourth quarter of 2018. The basic flow sheet is shown in Figure 14-1 and comprises:
| · | Crushing and ore handling |
| · | Iron / arsenic precipitation |
| · | Counter current decantation (CCD) |
| · | Gold leach, carbon adsorption, and detoxification |
| · | Carbon desorption and refining |
| · | Neutralization and tailings |
| · | Tailings storage facility (TSF) |
Figure 14-1: Çöpler
Process Flow Sheet for Sulfide Plant
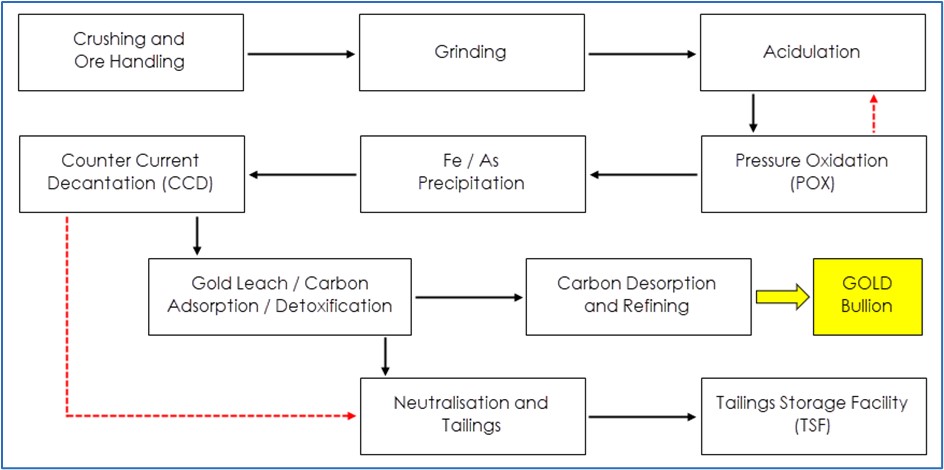
Source: Anagold, 2020
The incorporation of a flotation circuit into the
sulfide plant to upgrade sulfide sulfur (SS) to fully utilize grinding and pressure oxidation (POX) autoclave capacity was commissioned
in January 2022. The flotation circuit is located between grinding and acidulation, as shown in Figure 14-2. A bleed / slip stream
from the grinding thickener feed, floating sulfides, and returning the sulfide concentrate to the grinding thickener to be combined with
direct feed. The flotation tails bypass the sulfide oxidation portion of the plant and report directly to the leach feed for recovery
of any cyanide soluble gold.
| | 14-1 | |
| SSR Mining Inc. | Çöpler Property S-K 1300 Report | February 12, 2024 SLR Project No.: 138.21581.00006 |
The flotation circuit also rejects carbonates to
flotation tails, bypassing acidulation and POX, providing additional benefits in the acid balance through POX.
Figure 14-2: Flotation Block
Flow Diagram
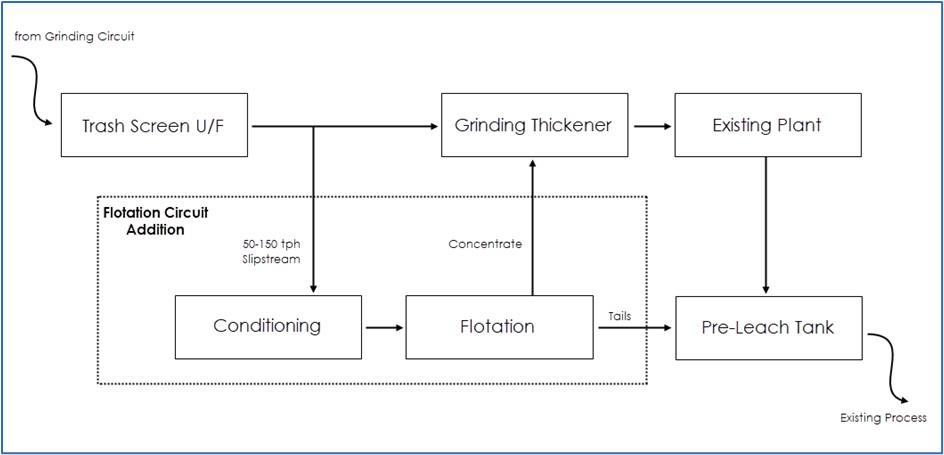
Source: Anagold, 2020
The original sulfide circuit, before the addition
of flotation, demonstrated additional latent capacity in throughput controlling sections of the circuit: grinding and autoclaves. The
incorporation of flotation allows the POX autoclaves to maximize throughput and sulfide sulfur oxidation capacity. Fully utilizing this
latent capacity with the addition of a small flotation plant allows the increase in overall plant throughput.
The throughput from crushing and grinding was designed
with a nominal volumetric capacity of 306 tph which was increased up to a maximum of 400 tph. Additionally, the POX autoclave circuit
has demonstrated it can process up to a long-term average maximum of 280 tph feed (two autoclave operation) and 13.75 tph sulfide
sulfur, compared to design of 245 tph and 12.5 tph respectively. The limit of 13.75 tph sulfide sulfur is dictated by the
capacity of the oxygen supply to effect oxidation of the sulfides, design 96%.
The flotation plant feed rate is variable between
50–150 tph based on sulfide sulfur feed grade and the oxidation capacity of the POX autoclaves to oxidize sulfides. Operating
performance of the autoclaves indicates that higher than design oxygen utilization efficiencies are possible, which may allow greater
than 13.75 tph sulfide sulfur to be treated. Alternatively, increased autoclave throughput with reduced sulfide oxidation is possible,
with a resultant reduction in overall gold recovery, however, at higher tonnage rates.
| 14.1.1 | Sulfide Plant Performance |
The operating performance is summarized in Figure 14-3 for throughput
and recovery against the design.
| | 14-2 | |
| SSR Mining Inc. | Çöpler Property S-K 1300 Report | February 12, 2024 SLR Project No.: 138.21581.00006 |
Since completing ramp-up of the sulfide plant in June 2020, POX throughput
has progressively improved to exceed design up to a monthly average peak of 330 tph and at the maximum SS of 13.7 tph. The gold
recovery has remained at around 91%, lower than design, with the tailings grade remaining stable between 0.25–0.30 g/t Au.
Further improvements have been implemented during 2020–2021. Oxygen
addition to the leach tanks to supplement air to maintain sufficient oxygen levels for gold leaching has led to improved recoveries.
| | 14-3 | |
| SSR Mining Inc. | Çöpler Property S-K 1300 Report | February 12, 2024 SLR Project No.: 138.21581.00006 |
Figure 14-3: Gold Recovery and
Throughput Comparison
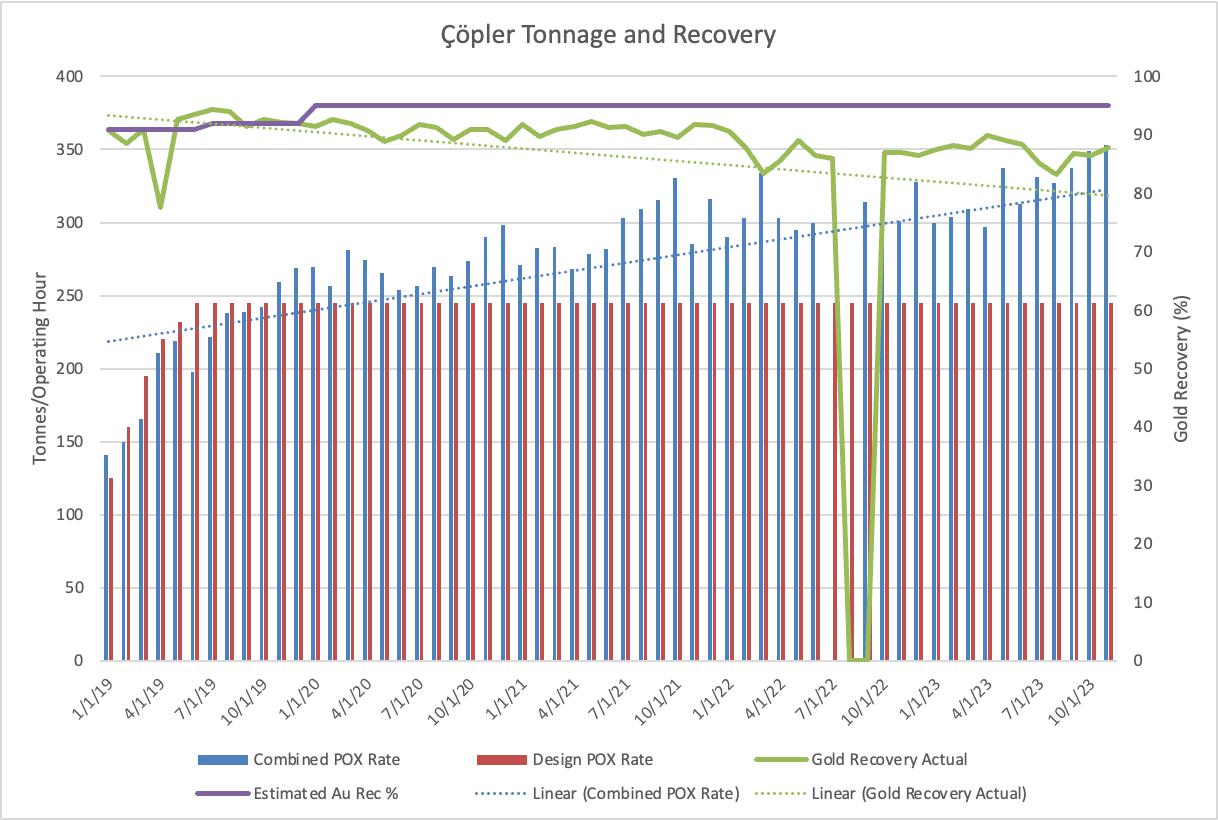
Source: Anagold, 2023.
Notes: Reduced throughput in mid-2022 was due to suspension of operations.
| | 14-4 | |
| SSR Mining Inc. | Çöpler Property S-K 1300 Report | February 12, 2024 SLR Project No.: 138.21581.00006 |
| 14.1.2 | Sulfide Plant Comminution Performance |
The design maximum feed rate of 306 tph is achievable.
An average throughput rate of 370 tph was achieved in the period late-2019 through early-2020 with the SAG and ball mills drawing approximately
half of their design power.
A study completed by Ausenco in 2023 used the Ausgrind
comminution power model to assess whether the SAG and Ball Mills can achieve 450 tph. The SAG mill is able to achieve 450 tph,
drawing 2.2 MW when the Axb is greater than 62. With some modifications to increase use of installed power to 2.5 MW, this could
be reduced to an Axb of 52 (the lowest measured Axb for Çöpler ore is 55).
Grind size becomes a constraint for the ball mill
at higher BWi values. The ball mill is able to achieve 450 tph at a grind size of 100 µm up to a BWi of 15.6 kWh/t and
with a ball filling of 37% v/v.
Çakmaktepe Ext. sulfide ore (jasperoid)
with an Axb of 30 and BWi of 19.9 kWh/t is significantly more competent and harder than Çöpler ore. If 100% jasperoid
ore is fed to the plant, the maximum throughput with a grind size of 110 µm will be 300 tph to 350 tph. The throughput can
be increased to above 400 tph by blending Çakmaktepe Ext. and Çöpler ore in a ratio of 20:80.
Due to the competency, hardness, and abrasiveness
of the Çakmaktepe Ext. jasperoid ore, it cannot be crushed in the primary sizer. An alternate crushing and feeding strategy is
required.
| 14.1.3 | Sulfide Plant Description |
The sulfide plant process flow sheet is shown in
Figure 14-4.
| 14.1.3.1 | Crushing and Ore Handling |
Haul trucks from the mine tip ore onto designated
stockpile fingers. The ore is withdrawn from stockpiles by front end loader (FEL) and deposited into the run-of-mine (ROM) dump hopper.
A static grizzly is fitted to the top of the ROM bin to remove oversize.
ROM ore is reclaimed from the bin by the sizer
apron feeder, which discharges material into the mineral sizer. The sizer is a tooth roll unit which crushes the ore from a feed top size
of 500 mm to a nominal top size of 250 mm.
The sizer teeth are configured to direct oversize
rocks to one end where they pass through a spring-loaded oversize rejection gate and fall to a reject bunker. The crushed product is carried
by the sizer product conveyor to the semi-autogenous grind (SAG) mill feed conveyor.
The SAG mill feed conveyor has a belt scale to
monitor the ore flow to the SAG mill and control the sizer apron feeder speed. A moisture analyzer and Prompt-Gamma Neutron Activation
Analysis (PGNAA) device, which is used for elemental analysis of the feed with an emphasis on sulfur, are installed on the same belt.
The SAG mill grinds the crushed ore to produce
a P80 of approximately 1,400 µm. The SAG mill discharge passes over a trommel
screen where particles too large for ball milling are retained as oversize and discharged onto a conveyor. Slurry passes through the
trommel into the grinding cyclone feed pump box where it mixes with the ball mill discharge slurry and water for density control.
| | 14-5 | |
| SSR Mining Inc. | Çöpler Property S-K 1300 Report | February 12, 2024 SLR Project No.: 138.21581.00006 |
The combined SAG and ball mill slurry is pumped
to the grinding cyclone cluster. The cyclones produce an overflow product with a P80 of
100 µm, which is screened to remove any trash (organic material, etc.) by the grinding trash screen. Coarse particles report
to cyclone underflow, which is returned to the ball mill.
After the trash screen, the cyclone overflow enters
a splitter box where a portion can be diverted to flotation. The split to flotation can be turned off completely or vary between 50 and
150 tph depending on the POX autoclave sulfide sulfur requirements. The remaining cyclone overflow slurry passes through an autosampler
before it is mixed with the flotation concentrate and then thickened in a high-rate thickener. The thickener overflow is re-used within
the grinding circuit. The thickened slurry is pumped to the grinding thickener underflow storage tanks.
When necessary, a portion of the grinding trash
screen undersize can be diverted to the flotation circuit and pumped to the conditioning tanks. This proportion, between 50 and 150 tph,
depends on SS feed grade and POX autoclave requirements. The flotation circuit can operate as a single or dual train, each train has a
maximum throughput of 75 tph.
The flotation plant consists of two equally sized
conditioning tanks, in series, for copper sulfate and potassium amyl xanthate (PAX) addition with a nominal residence time of seven minutes
each tank. From conditioning, the slurry is pumped to two equally sized flotation trains consisting of six 50 m3
tank cells with a nominal residence time of 60 minutes at maximum throughput. Frother dosing and supplemental collector
dosing occurs down the trains in every second cell. The plant is designed to handle high mass pull to maximize sulfide recovery, with
preference to high recovery over high selectivity.
The flotation concentrate is pumped to the grinding
thickener feed mixing with slurry directly from the grinding circuit upgrading the sulfide sulfur material fed to the acidulation and
POX circuit. The flotation tail is pumped to the gold leach tanks for recovery of gold present in the non-sulfidic portions of the ore.
| | 14-6 | |
| SSR Mining Inc. | Çöpler Property S-K 1300 Report | February 12, 2024 SLR Project No.: 138.21581.00006 |
Figure 14-4: Process Flow Sheet
for Sulfide Plant
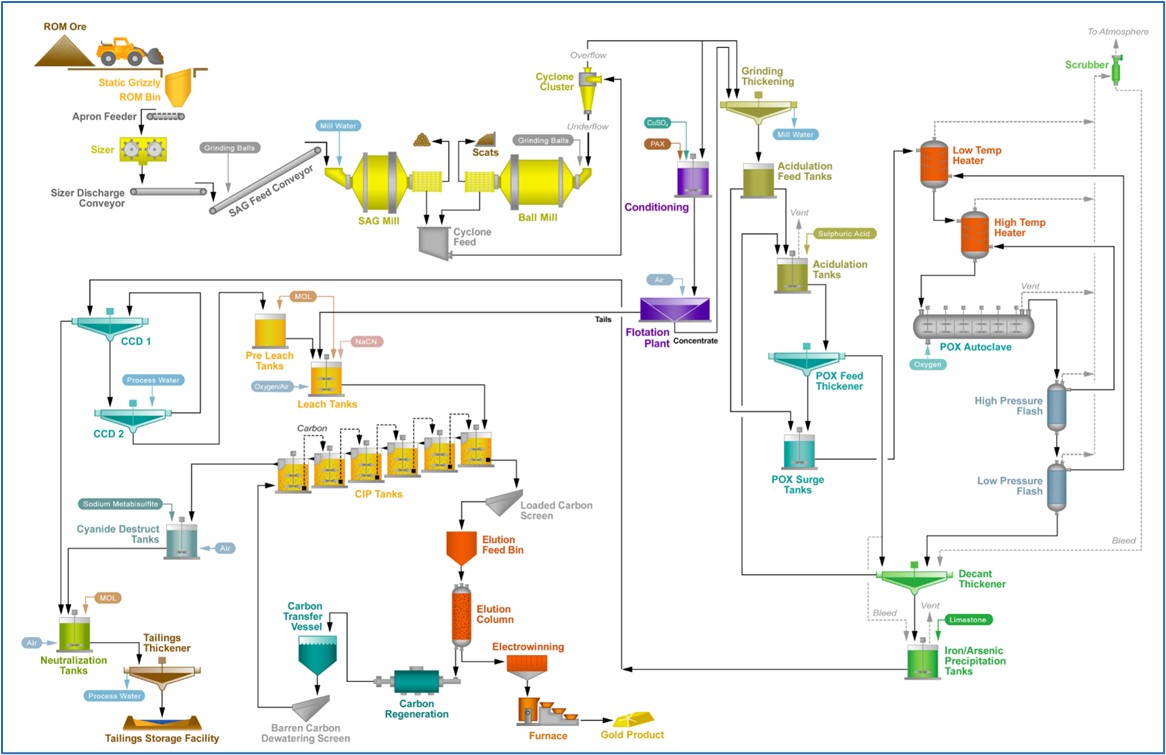
Source: Anagold, 2020
| | 14-7 | |
| SSR Mining Inc. | Çöpler Property S-K 1300 Report | February 12, 2024 SLR Project No.: 138.21581.00006 |
The grinding thickener underflow storage tanks
have a residence time of 12 hours and provide process surge capacity and short-term blending to effectively decouple the upstream crushing,
grinding, and flotation circuits from the downstream hydrometallurgical circuit. Antiscalant can be added to these tanks, if necessary,
to reduce scale build-up in the downstream acidulation circuit.
The slurry from the grinding thickener underflow
storage tanks is split between the acidulation tanks and the POX feed tanks depending on the ore type. The split is determined by how
much carbonate in the feed material requires destruction to achieve the target free acid content in the POX autoclave discharge slurry
of 22.5 g/L. At this free acid level, the formation of hematite is favored over jarosite, which exhibits better settling behavior
in the downstream thickeners. This acid level also reduces the potential for excessive CO2 gas evolution and gypsum scaling
in the POX autoclaves.
The acidulation process targets nearly complete
destruction of acid soluble carbonates in the ore. Acidulation is conducted in two reaction tanks. Recycled solution from the decant thickener
containing free acid and additional concentrated sulfuric acid is used to leach the carbonate minerals in the ore. Slurry overflows from
acidulation tank 1 into acidulation tank 2 and then discharges into the POX feed thickener mix tank. Either of the acidulation tanks can
be bypassed.
When there are low carbonate levels in the feed,
and little or no acidulation is required, POX feed thickener overflow solution is recycled to the acidulation tanks (instead of decant
thickener overflow solution) to limit the maximum concentration in the tanks to 30% solids.
The diluted slurry from acidulation is thickened
in the POX feed thickener prior to storage in the POX feed tanks. POX feed thickener overflow is transferred to either the decant thickener
(as wash water), and/or to the iron / arsenic precipitation circuit (to maintain the water balance in the acidulation circuit) or is recycled
to acidulation tank 1.
POX thickener underflow slurry is pumped to the
POX feed thickener underflow surge tank where it is blended in the correct proportions with the un-acidulated grinding thickener underflow
slurry to ensure the total level of acid soluble carbonates in the POX feed slurry is within target levels.
The decant thickener recovers acid (that is generated
in the POX autoclaves) from the POX discharge slurry and recycles it to the acidulation circuit. The decant thickener underflow slurry
is pumped to the iron / arsenic precipitation circuit. Thickener overflow goes to the decant thickener overflow tank from where it is
pumped to the acidulation tanks. Solution is bypassed to the POX feed thickener overflow tank when processing low-carbonate ores.
| 14.1.3.5 | Pressure Oxidation |
This subsection is extracted from OreWin (2022).
The POX feed surge tanks 1 and 2 are a common feed
system that services both POX autoclave trains (T1 and T2). The tanks are agitated to blend the incoming slurry and provide approximately
18 hours of slurry storage to minimize disruptions to the POX circuit. For simplicity, only POX T1 is discussed in this document,
as both T1 and T2 have identical configurations and controls.
Slurry is pumped to the POX low-temperature heater
by the POX heating feed pumps. The low-temperature (LT) heater receives incoming feed slurry and vent gas (predominantly steam) recovered
from the LT flash vessel. The gas heats the slurry to approximately 95ºC before being transferred to the high-temperature (HT) heater.
The steam in the gas condenses and any excess is vented to the wetted elbow of the POX T1 Venturi scrubber.
| | 14-8 | |
| SSR Mining Inc. | Çöpler Property S-K 1300 Report | February 12, 2024 SLR Project No.: 138.21581.00006 |
The HT heater receives slurry from the LT heater
and vent gas (predominantly steam) recovered from the HT flash vessel. The gas heats the slurry to approximately 150ºC before being
pumped to the POX autoclave. The steam in the gas condenses and any non-condensing gases accumulate in the vapor space at the top of the
vessel, prior to being vented.
Slurry is pumped to the autoclave by two pumping
trains.
If one full autoclave train is offline, the remaining
autoclave train can operate at 150% of normal capacity, provided both of its feed pumping trains are operating.
A horizontal multi-compartment autoclave is used
to oxidize the sulfides in the ore at high temperature and pressure using gaseous oxygen. The oxidation of sulfide material in the autoclave
generates heat and when the rate of heat generation exceeds that required to achieve the target temperature of 220°C quench water
is added. Sufficient quench water is added to control the temperature to the target. The quench water is pumped through the same sparge
pipe that introduces gaseous oxygen addition into the autoclave. There is one sparge pipe underneath each autoclave agitator.
A vent controls the pressure in the autoclave
to prevent the water boiling. This pressure is called overpressure and results from the presence of gases such as oxygen, nitrogen, and
CO2.
Slurry discharges from the autoclave through a
severe service let down valve to the HT flash vessel. The HT flash vessel operates at a lower pressure than the autoclave and the resulting
pressure drop for the discharge slurry entering the HT flash results in steam being flashed from the slurry. The flashing of steam cools
the slurry to the equilibrium temperature corresponding to the pressure in the flash vessel.
Steam vented from the HT flash is sent to the HT
heater to heat the feed to the autoclave, excess steam is vented to the venturi scrubber for treatment prior to discharge.
Slurry discharges from the HT flash vessel through
a severe service let down valve to the LT flash vessel. The LT flash vessel operates at a lower pressure than the HT flash vessel, the
resulting pressure drop for the discharge slurry entering the LT flash results in steam being flashed from the slurry. The flashing of
steam cools the slurry to approximately 100°C at a pressure just above atmospheric. Slurry is forced from the HT flash vessel to the
LT flash vessel by the pressure difference between the two vessels.
Steam vented from the LT flash is sent to the LT
heater to heat the feed to the HT heater, excess steam is vented from the LT heater to the Venturi scrubber for treatment prior to discharge.
Steam, entrained slurry together with gas, including
carbon dioxide and unreacted oxygen vented from various points in the autoclave circuit, is scrubbed in Venturi scrubber to remove entrained
acidic slurry droplets.
Demineralized water is used in the POX circuit
for steam production and for seal water.
Flashed slurry is pumped from the LT flash vessel
by decant thickener feed. The decant thickener was described previously and the decant thickener underflow is feed to iron / arsenic
precipitation.
| 14.1.3.6 | Fe/As Precipitation |
This subsection is extracted from OreWin (2022).
Iron / arsenic precipitation uses limestone
slurry addition to the decant thickener underflow slurry to neutralize the free acid and raise the pH to approximately 2.8, which removes
ferric iron and arsenic from solution.
| | 14-9 | |
| SSR Mining Inc. | Çöpler Property S-K 1300 Report | February 12, 2024 SLR Project No.: 138.21581.00006 |
The decant thickener underflow duty pump transfers
the thickener underflow slurry to iron / arsenic precipitation tank 1. Limestone is added for pH control, and low-pressure air is
sparged into the tanks to oxidize any ferrous iron that may be present to ferric iron. The ferric ions combine with the residual arsenic,
also leached in the POX circuit, and precipitate together as the pH of the solution is raised. Limestone reacting with the free acid generates
carbon dioxide gas and gypsum.
The two iron / arsenic precipitation tanks
normally operate in series. The treated slurry overflows from the second iron / arsenic precipitation tank to the CCD 1 Mix Tank.
The low-pressure air and CO2
generated during the limestone neutralization reactions rise above the slurry surface on top of the tanks and carry some
entrained solution / slurry.
These off gases from the iron / arsenic precipitation
tanks (1 and 2) are vented via the iron / arsenic precipitation tank fans 1 and 2 and fed to the iron / arsenic scrubber. The
iron / arsenic scrubber is a Venturi type scrubber. The off gases are cooled and scrubbed of the entrained solution / slurry
in the scrubber. The clean gases are emitted to the atmosphere.
| 14.1.3.7 | Counter Current Decantation |
This subsection is modified from OreWin (2022).
Counter current decantation (CCD) washes the iron /
arsenic stage discharge slurry with process water using two stages of thickeners operating in counter current mode. The remaining soluble
metals in solution the iron / arsenic precipitation circuit are washed from the slurry and report to CCD 1 overflow. The slurry discharging
from CCD 2 underflow has the soluble metals washed from the slurry to sufficiently low levels to feed into the cyanide leach circuit.
CCD Thickener 1 overflow solution flows into the
CCD Thickener 1 overflow tank which is then pumped to the neutralization circuit. Process water is added in the CCD 2 mix tank as wash
solution to wash the solids. Diluted flocculant solution is added in the CCD 1 and 2 thickener feeds to aid in the settling of solids
in the thickeners. The CCD Thickener 2 underflow is then pumped 2 to the pre-leach tank.
| 14.1.3.8 | Cyanide Leach, Carbon Adsorption and Detoxification |
This subsection is modified from OreWin (2022).
The cyanide leach circuit consists of one pre-leach
tank and two leach tanks. Slurry is received in the pre-leach tank from the duty CCD thickener 2 underflow pump and flotation tails.
The pre-leach tank has a volume of 150 m3 and a nominal residence time of 10 minutes and
is used to raise the pH of the slurry to pH 10–11 prior to the slurry entering the leach tanks where cyanide is added for gold
leaching.
The leach tanks have a volume of 2,200 m3
each and a total residence time of up to six hours at the maximum throughput. Slurry flows through the leach tanks by gravity
and discharges the final leach tank to enter the carbon adsorption circuit. The leach tanks operate at 30% solids concentration and have
low-pressure air and oxygen, from the Air Liquide oxygen plant, added to maintain sufficient oxygen in solution for gold leaching.
The carbon adsorption circuit consists of six
agitated, 1,885 m3 tanks with a total residence time of up to 12-hours. Each tank contains
activated carbon to adsorb the leached gold contained in solution. Slurry flows by gravity from tank 1 to tank 6 and discharges into
the detoxification circuit. Carbon flow is counter-current to slurry and therefore is transferred stage wise from tank 6 through to tank
1, using dedicated recessed impeller pumps. Each tank has interstage screens installed so that the carbon remains in each tank and does
not follow the direction of the slurry flow.
| | 14-10 | |
| SSR Mining Inc. | Çöpler Property S-K 1300 Report | February 12, 2024 SLR Project No.: 138.21581.00006 |
Gold is loaded onto the carbon as it moves from
tank 6 to tank 1 and reaches its maximum loading in adsorption tank 1. The loaded carbon is pumped from adsorption tank 1 to the loaded
carbon screen where spray water on the screen washes the carbon prior to it entering the elution column for carbon desorption and recovery
of gold through the refining circuit.
Slurry exiting adsorption tank 6 flows to the
detoxification circuit where destruction of the residual cyanide contained in the slurry occurs. The detoxification circuit consists
of a 1050 m3 tank with a total residence time of one-hour. Air and sodium metabisulfite
are added to the circuit to destroy the residual cyanide down to a concentration of less than 5.0 mg/L CNWAD.
Residual copper in the slurry catalyzes the cyanide destruction process.
| 14.1.3.9 | Carbon Desorption and Refining |
This subsection is modified from OreWin (2022).
The carbon desorption method selected is a split
AARL elution. A single column is used for acid wash, cold cyanide strip for copper, and a hot caustic / cyanide elution cycle to recover
gold. The elution column is a 6-tonne, stainless-steel vessel and is designed to handle the stripping of three carbon batches per day.
Loaded carbon enters the elution column via the loaded carbon screen.
The first step of stripping the carbon is an acid
wash using nitric acid solution to remove loaded impurities such as calcium. After the acid wash, a pre-soak solution is added to the
elution column prior to commencement of the eluent recycle for initial stripping of copper, when required, followed by a hot elution cycle
to strip gold from the carbon.
Pregnant eluate is collected in the pregnant eluate
tank and pumped through electrowinning cells with gold metal plated out onto stainless steel cathodes. Smelting of gold recovered from
the stainless-steel cathodes is conducted in the gold refinery.
Desorbed carbon from the elution column is regenerated
through a horizontal diesel fired rotary kiln to remove organic material loaded onto the carbon and reactivate the carbon for re-use.
| 14.1.3.10 | Neutralization and Tailings |
This subsection is modified from OreWin (2022).
Slurry from cyanide destruction and the CCD 1 thickener
overflow solution are neutralized with lime to precipitate residual metals in solution. Air is added for the oxidation and removal of
ferrous iron and manganese.
Typically, the two 1050 m3 neutralization
tanks operate in series. Discharge from the neutralization feed box gravity flows into neutralization tank 1 prior to overflowing into
neutralization tank 2. Discharge from neutralization tank 2 moves into the tailings thickener mix tank.
The first neutralization tank is equipped with
a sodium metabisulfite addition system, and this allows it to be used for the detoxification step when the normal detoxification tank
is bypassed for maintenance or descaling. Both neutralization tanks can also be bypassed as required to allow for maintenance.
The discharge slurry from neutralization flows
by gravity into the tailings thickener mix tank before flowing into the tailings thickener. Tailings thickener overflow water overflows
directly into the process water storage tank. The underflow slurry from the tailings thickener is pumped to the agitated tailings tank.
The discharge slurry from the tailings tank is pumped to a TSF on a continuous basis via the 4.3 km long tailings pipeline.
| | 14-11 | |
| SSR Mining Inc. | Çöpler Property S-K 1300 Report | February 12, 2024 SLR Project No.: 138.21581.00006 |
| 14.1.3.11Tailing | Storage Facility |
This subsection is extracted from OreWin (2022).
The process tailings slurry is deposited into the
Tailings Storage Facility (TSF) for final storage. Operators alternate the location within the facility where the tailings are deposited
to maximize the settling rate and dewatering within the facility. In the TSF, the solids compact and reject excess water which is recovered
for recycling to the process plant. The decant water collected within the pond area is recycled to the process water system tank via the
tailings water reclaim pumps.
The TSF is developed and constructed in stages
ahead of requirements.
This subsection is extracted from OreWin (2022).
There are ten major reagents used in the process
plant, listed as follows:
The flotation plant has the following main reagents:
All reagents are delivered in bulk tankers, containers,
or bags with storage on site. Any reagents that require dilution or mixing prior to use are prepared on site on a batch wise basis, as
required. Oxygen is produced on-site supplied from an Air Liquide owned and operated oxygen plant under a gas supply agreement. Additional
oxygen can be delivered as liquid into on-site storage.
Table 14-1 presents the key unit consumptions
of power, reagents, and materials for the process facilities.
| | 14-12 | |
| SSR Mining Inc. | Çöpler Property S-K 1300 Report | February 12, 2024 SLR Project No.: 138.21581.00006 |
Table 14-1: Sulphide Process
Plant Unit Consumptions of Power, Reagents and Materials
| Item |
Units |
2023 YTD |
Inception to Date |
| SAG mill power |
kWh/t |
5.1 |
52.0 |
| Ball mill power |
kWh/t |
7.1 |
5.9 |
| Milk of lime ball mill mill power |
kWh/t |
19.0 |
18.0 |
| SAG mill balls |
kg/t |
258.9 |
169.6 |
| Ball mill balls |
kg/t |
442.2 |
452.4 |
| Total MOL mill balls |
kg/t |
0.3 |
0.4 |
| Oxygen |
Nm3/ts-2 |
1,495.0 |
1,487.0 |
| Sulfuric acid |
kg/t |
33.9 |
35.0 |
| Sodium cyanide |
kg/t |
0.9 |
1.2 |
| Quicklime (CaO) |
kg/t |
34.6 |
46.9 |
| Sodium metabisulfite (SMBS) |
kg/t |
2.2 |
3.3 |
| Limestone |
kg/t |
0.0 |
2.1 |
| Activated carbon |
g/t |
54.0 |
52.0 |
Source: SSR Monthly Production Summary
This subsection is extracted from OreWin (2022).
The major utilities used in the process plant are
as follows:
| · | Iron / arsenic low-pressure air |
| · | Cyanide leach low-pressure air |
These utilities are reticulated throughout the
process plant to their end user.
| 14.2 | Oxide Heap Leach Processing |
This subsection is modified from OreWin (2022).
| | 14-13 | |
| SSR Mining Inc. | Çöpler Property S-K 1300 Report | February 12, 2024 SLR Project No.: 138.21581.00006 |
The oxide heap leaching and associated facilities
were commissioned in the second half of 2010 and initial gold production was achieved in late 2010. The process was originally designed
to treat approximately 6.0 Mtpa of ore by three-stage crushing (primary, secondary, and tertiary) to 80% passing 12.5 mm, agglomeration,
and heap leaching on a lined heap leach pad with dilute alkaline sodium cyanide solution. Gold is recovered through a carbon-in-column
(CIC) system, followed by stripping of metal values from carbon, electrowinning, and melting to yield a doré (containing gold and
silver) suitable for sale. Control of copper in leach solutions is undertaken in a sulfidization, acidification, recycling, and thickening
(SART) plant which also regenerates cyanide.
| 14.2.1 | Oxide Heap Leach Performance |
Since commissioning through September 2023, an estimated 59.8 Mt
of oxide ore has been placed on the heap at an average contained grade of 1.48 g/t Au. Of the 2,848 koz of contained gold, 1,953
koz is determined to be extractable, an ultimate expected recovery of 68.6%. At the end of September 2023, a total of 1,879 koz had been
produced as bullion.
| 14.2.2 | Oxide Circuit Description |
A detailed oxide flow sheet is shown in Figure
14-5. The following description of the oxide plant includes the existing heap leach, CIC plant, and SART circuit.
| 14.2.2.1 | Primary and Secondary Crushing |
Durable rock is fed to a primary gyratory crusher
from haul trucks directly from the mine or rehandled from the oxide ROM piles (either from a front-end loader or haul trucks). The primary
crusher is a METSO Superior MK-2 with a 500-kW motor, crushing to a P80 of 150 mm. The crushed product falls into a 400-t surge
bin before being fed to the primary ore conveyor belt. This belt is equipped with a magnetic separator and belt scale. The nominal capacity
is 925 tph.
The primary ore belt feeds a 1,400-t secondary
crushing surge bin. The ore passes through the bin onto a three-layer screen, nominally fitted with 90 mm, 45 mm, and 25 mm square opening
panels. The largest oversize material flows into a METSO Nordberg HP800 cone crusher with a 450-kW motor for secondary crushing; the maximum
throughput of this crusher is 500 tph. The plus 25 mm and secondary crushed material falls onto the tertiary return conveyor belt.
Fines and clay-bearing ores are not suitable to
be fed into the primary crusher and are instead routed to a separate feed pocket. Materials here are typically fed by a front-end loader,
and the feed rate is set to maintain a specified ratio of durable to fine material. This ratio is dictated by clay content and agglomeration
quality necessary for effective heap leaching and varies depending on the ore.
A 150-t feed bin is connected to an apron feeder
that controls the feed rate to a MMD 625 Series mineral sizer with a 250-kW motor. The maximum throughput on this equipment is 600 tph
at an output of 130 mm P80. The sized material is then screened through two sets of double screens, with a nominal output size
of 25 mm. The oversize material falls to the tertiary transfer belt.
| 14.2.2.3 | Tertiary Crushing |
The midsize from the secondary feed screen, secondary
crushed, and sizer screen oversize materials are combined on the tertiary feed belt and transported back to the top of the secondary /
tertiary building to fill the two 700-t tertiary crushing surge bins. Each bin feeds double-decked screen, nominally fitted with 40 mm
and 25 mm square opening screen panels. Each screen’s oversize material then feeds a METSO Nordberg HP800 cone crusher with a 450-kW
motor for tertiary crushing. The crushed product then falls onto the same tertiary return conveyor belt as the secondary crushed product
to return to the tertiary screens.
| | 14-14 | |
| SSR Mining Inc. | Çöpler Property S-K 1300 Report | February 12, 2024 SLR Project No.: 138.21581.00006 |
The secondary screening undersize, clay sizer undersize,
and tertiary screen undersize material all falls to the fine ore collection belt. This belt is equipped with a belt scale and a sweep-style
belt sampler for collection of a representative “crushed product” sample that is assayed each shift for moisture content and
composited daily for gold grade. The fine ore collection belt passes to the original leach pad feed conveyor, where lime and cement are
dosed from silos to modify the ore pH and provide a binder for agglomeration.
The agglomerator is a 4-m diameter by 12-m long
drum, where water is added and the material tumbled to generate small balls of material. The cement and water added to the ore, once placed
on the heap leach, will cure to produce a stronger and more stable heap leach material. Regular samples are taken to check the agglomerate
quality.
Once the ore has been agglomerated, it is transported
over a series of overland and grasshopper conveyors to the top of the heap. The site has 35 grasshopper conveyors on hand for reaching
various locations at the top of the heap. Stacking is typically conducted by dumping a pile off the last conveyor and using a dozer or
loader to push the material to the edge. Alternatively, there is a radial stacker that can be used in larger areas.
The heap leach pad consists of a series of constructed
phases stretching south from the barren ponds up a slope, creating a natural gradient for the pregnant solution to flow to the CIC plant.
In low-angle regions, a layer of clay is placed to create an impermeable base; in high-angle areas, a geosynthetic clay liner (GCL) is
emplaced. The base layer is covered with a HDPE geomembrane. Next, drainpipes are arranged in a herringbone structure that feed progressively
larger pipes for the transport of gold bearing solution. Finally, a layer of graded gravel is added above the drainpipe network to promote
rapid transport to the pipes and reduce the hydraulic head on the liner.
The available leach pad area is divided into cells
of specific sizes for inventory and irrigation control. The heap leach operating parameters include quantity and lift height of ore placed,
barren solution (cyanide leach solution, very low gold grade) irrigation rate per unit area, duration of irrigation (leach cycle) and
time between lifts to manage future ore placement. Barren solution is applied selectively to each cell. At any given time, approximately
100k m2 of pad area is being leached, with other areas draining or being made ready to
accept ore for the next lift. Typical flowrate to the leach pad is 1,000 m3/hour with
a target application rate of 8 to 10 L/h/m2. Application is made via irrigation drip emitters.
The barren solution percolates through the ore
collecting precious metals and exits the heap material at one of several collection areas as pregnant solution. The pregnant solution
is conveyed by gravity flow to the recovery plant or recycled to the barren ponds. The recovery plant consists of two parallel Carbon-in-Column
(CIC) trains comprising of six tanks each. The first train is a typical open-top design. The second, smaller train is closed vessel with
integrated screens for carbon separation; it is operated in a carousel manner where carbon is not moved, but the head tank rotates. Column
discharge solution reports to either the SART plant or the barren ponds where fresh and reclaim water is added to maintain the appropriate
water balance and cyanide is added to bring the free CN concentration to a target level.
| | 14-15 | |
| SSR Mining Inc. | Çöpler Property S-K 1300 Report | February 12, 2024 SLR Project No.: 138.21581.00006 |
Loaded carbon is pumped from the top tank in the
CIC train to the acid wash tank. The carbon is subjected to a nitric acid wash to remove inorganic scale and neutralized with caustic;
the washed carbon is then pumped to one of two elution vessels. As necessary, a cold cyanide copper strip is performed as a first stage
to elution. A split pressure Zadra elution process is followed using caustic and cyanide solution to remove the gold from the carbon and
concentrate for electrowinning. The stripped carbon is then transferred to a carbon regeneration kiln to remove organics and reactivate
the carbon for re-use.
Pregnant eluate is collected in the pregnant eluate
tank and pumped through electrowinning cells with gold metal plated out onto stainless steel cathodes. Smelting of gold recovered from
the stainless-steel cathodes is conducted in the gold refinery.
High copper levels in leach solution increase cyanide
consumption and reduce the ability of the carbon circuit to effectively adsorb gold and silver. For high copper ores the Sulfidization,
Acidification, Recycle, Thickening (SART) process limits the consumption of cyanide and produces a saleable copper by-product. Either
pregnant leach solution (PLS) or barren leach solution (BLS) can be processed, the current method is treating the BLS at a split rate
of approximately 300 m3/h.
In the SART processes, copper is recovered as
a synthetic chalcocite (Cu2S) and copper-complexed cyanide is regenerated to yield free
cyanide. The chalcocite copper product is sold for its metal value, including minor gold content, and the regenerated free cyanide solution
is recycled to the heap leach.
| 14.2.2.10 | | Barren Ponds & Pumping |
There are two HDPE lined barren ponds, PP1 and
PP2, with capacities of 20,000 m3 and 34,000 m2,
respectively. In the current operation, cyanide is only added to PP2 as it is fed to the newest ore. PP1 is used for solution recycle,
water balancing, and rinsing of older regions of the leach pad. A pair (duty and standby) of submersible pumps in each pond feed a middle-booster
station. The middle-booster pumps are a pair (duty and standby) of 550-kW centrifugal pumps that push the barren solution to the final-booster
station. At the final-booster station, BLS1 is pumped with a single 280-kW centrifugal (plus an installed spare) to the lower, older
portions of the leached pad. BLS2 goes through a pair of 280-kW centrifugal pumps in series to increase the pressure sufficiently to
reach the top lift of the designed pad.
| | 14-16 | |
| SSR Mining Inc. | Çöpler Property S-K 1300 Report | February 12, 2024 SLR Project No.: 138.21581.00006 |
Figure 14-5: Heap Leach Process
Flow Sheet
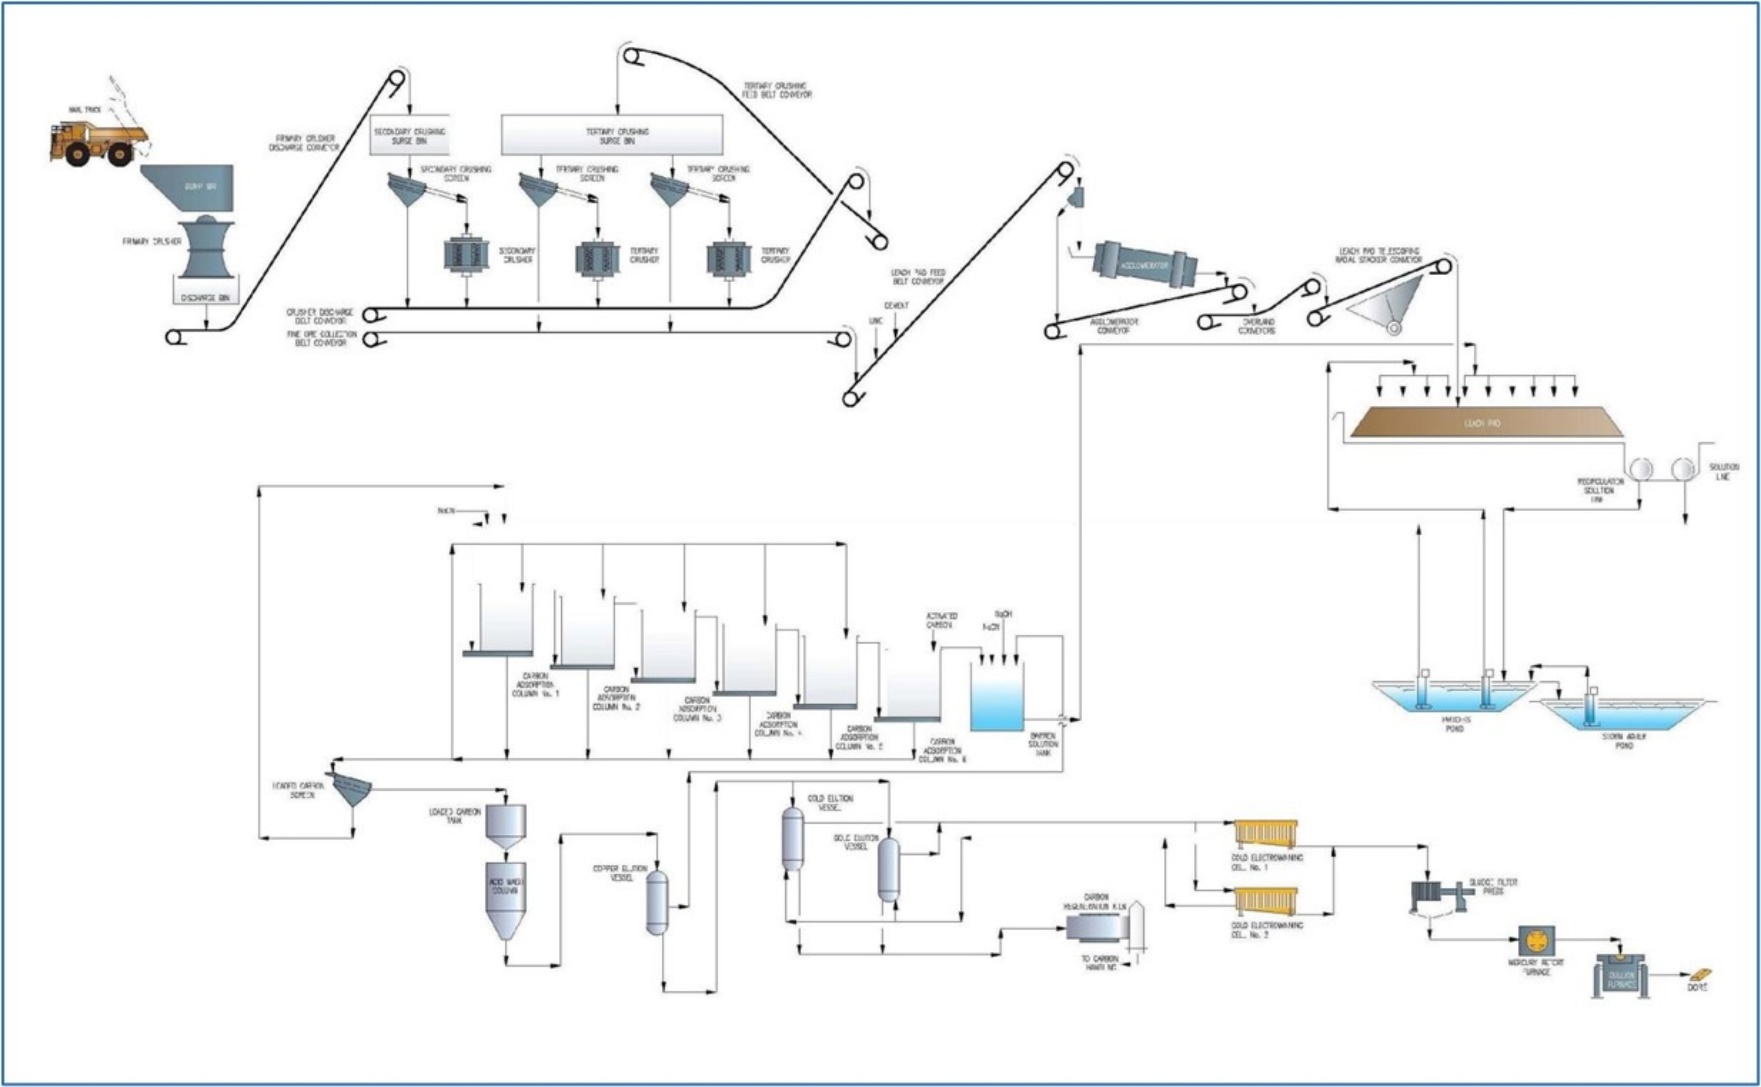
Source: Anagold, 2016
| | 14-17 | |
| SSR Mining Inc. | Çöpler Property S-K 1300 Report | February 12, 2024 SLR Project No.: 138.21581.00006 |
| 14.3 | Oxide Grind Leach Processing |
| 14.3.1 | Oxide Grind Leach - Overview |
The proposed process is to treat oxide and low
sulfur (< 2% sulfur) ores from the Çakmaktepe Ext. open pit. Based on the information and metallurgical test results
summarized in Section 10 the Çakmaktepe Ext. oxide and low sulfur mineralization is amenable to cyanide leaching as a recovery
method.
The throughput of the proposed plant is 2 Mtpa,
and the process is an industry standard crushing, grinding, and carbon-in-leach (CIL) cyanide leaching plant with recovery of gold and
silver from the leach solution by carbon adsorption, desorption, electrowinning, and refining to produce a final precious metal (doré)
product.
The
total connected electrical load for the Oxide Grind Leach plant is 15.4 MW with an average demand of 11.6 MW. The Oxide Grind
Leach plant requires 261 m3/h of make-up water from a combination of raw and process
water sources.
| 14.3.2 | Oxide Grind Leach - Process Flowsheet |
The process flowsheet includes:
| · | crushed ore bin and emergency stockpile |
| · | SAG and ball mill grinding in closed circuit with classification by hydrocyclones |
| · | desorption and carbon regeneration |
The simplified overall process flow diagram is shown in Figure 14-6.
| | 14-18 | |
| SSR Mining Inc. | Çöpler Property S-K 1300 Report | February 12, 2024 SLR Project No.: 138.21581.00006 |
Figure 14-6: Oxide
Grind Leach - Simplified Process Flow Diagram
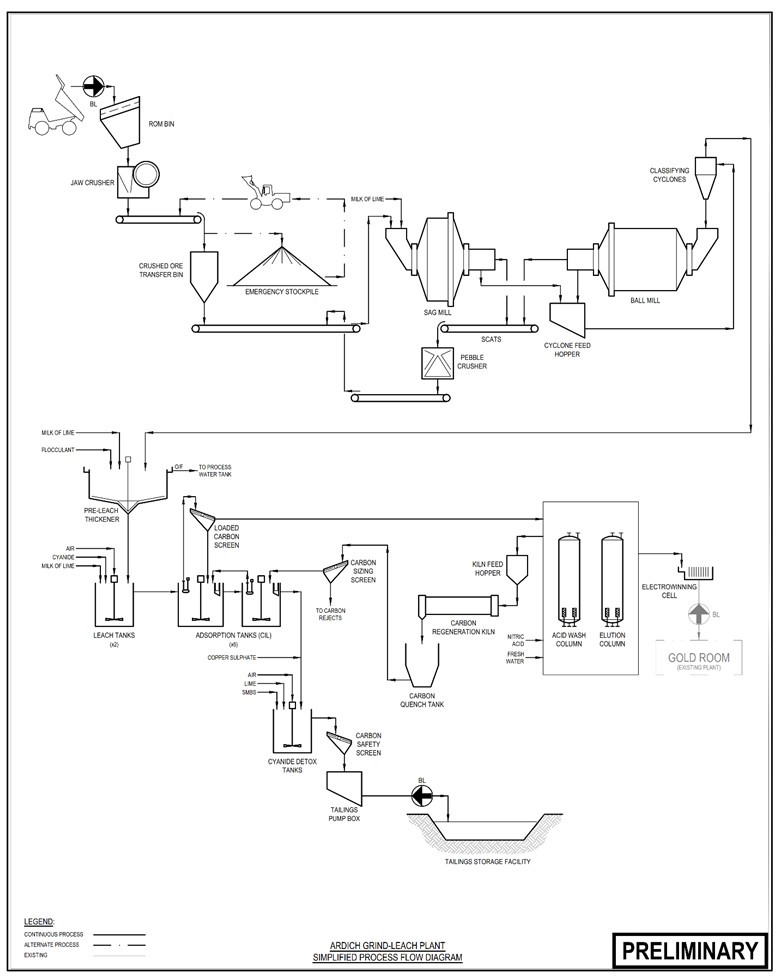
PRELIMINARY
| | 14-19 | |
| SSR Mining Inc. | Çöpler Property S-K 1300 Report | February 12, 2024 SLR Project No.: 138.21581.00006 |
| 14.3.3 | Oxide Grind Leach - Process Design Criteria |
The process plant is designed for a treatment rate
of 248 tph on an availability of 8,059 hours per year or 92%. The crushing section is set at 70% availability. Table 14-2
presents the key process design criteria.
Table 14-2: Oxide Grind Leach
- Process Design Criteria
| Description |
Units |
Process Design Criteria
(design) |
| JK Axb |
- |
43 |
| Bond Ball Mill Work Index |
kWh/t |
19.6 |
| Bond Abrasion Index (Ai) |
g |
0.43 |
| Product Particle Size, P80 |
µm |
75 |
| Leaching Process |
|
L/CIL |
| Leach time required |
hours |
24 |
| Ore Head Grade, Au |
g/t |
1.92 |
| Leach Recovery |
% |
84 |
Personnel associated with the processing operations is tabulated in
Table 14-3.
Table 14-3: Çöpler
Mine – Processing Personnel Summary
| Disciplines |
Process |
|
| |
Anagold |
Contractor |
Totals |
| Engineering/Admin. Support |
203 |
272 |
475 |
| Process Operations – Oxide |
57 |
5 |
62 |
| Process Operation – Sulfide |
123 |
11 |
134 |
| Process Maintenance |
125 |
53 |
178 |
| Process Engineering and Laboratory |
83 |
0 |
83 |
| Totals |
591 |
341 |
932 |
| | 14-20 | |
| SSR Mining Inc. | Çöpler Property S-K 1300 Report | February 12, 2024 SLR Project No.: 138.21581.00006 |
The facility infrastructure supports the mine and processing facilities,
including the oxide heap leach and sulfide plant. The existing infrastructure and the planned expansion, which includes the tailings storage
facility (TSF) and heap leach pad area expansion, will be sufficient for the current Mineral Reserves.
The locations of the processing facilities, Çöpler mine,
Greater Çakmaktepe Reserve pit, TSF, and the haul road from Greater Çakmaktepe to Çöpler are shown in the site
plan in Figure 15.1.
The current leach pad consists of four phases currently estimated to
accommodate a total of approximately 63 Mt of oxide ore heap with a nominal maximum heap height of 100 m above the pad liner.
Phase 5, with a capacity of 13.4 Mt, will be constructed during 2024 to 2026 to accommodate part of the Greater Çakmaktepe
Reserve. The Phase 5 pad construction has been approved by the Ministry of Environment, Urbanisation, and Climate Change (MoEUCC).
The TSF, referred to as TSF 1, design includes a total of seven phases
that are developed and constructed sequentially. TSF 1 phase 4 has been constructed, and approval for use was received in 2023 by the
MoEUCC. Ongoing work in ensuring sufficient long-term capacity for storage of tailings has been undertaken. Studies by Anagold have determined
that the addition of the flotation plant to the sulfide plant circuit in 2021 has resulted in an increase in the solids content and improvement
in the final settled density based on an increase in the rate of tailings consolidation.
Construction and development of the remaining phases of TSF 1 will
provide storage of tailings for up to 70 Mt (at an average slurry density of 1.18 t/m3),
sufficient to accommodate the tailings to be produced in the current LOM.
A PFS level study (TSF 2) has been carried out that identifies approximately
13.9 Mt additional tailings storage capacity, in a site adjacent to TSF 1, should it be required in the future.
| | 15-1 | |
| SSR Mining Inc. | Çöpler Property S-K 1300 Report | February 12, 2024 SLR Project No.: 138.21581.00006 |
Figure 15-1: Site Layout
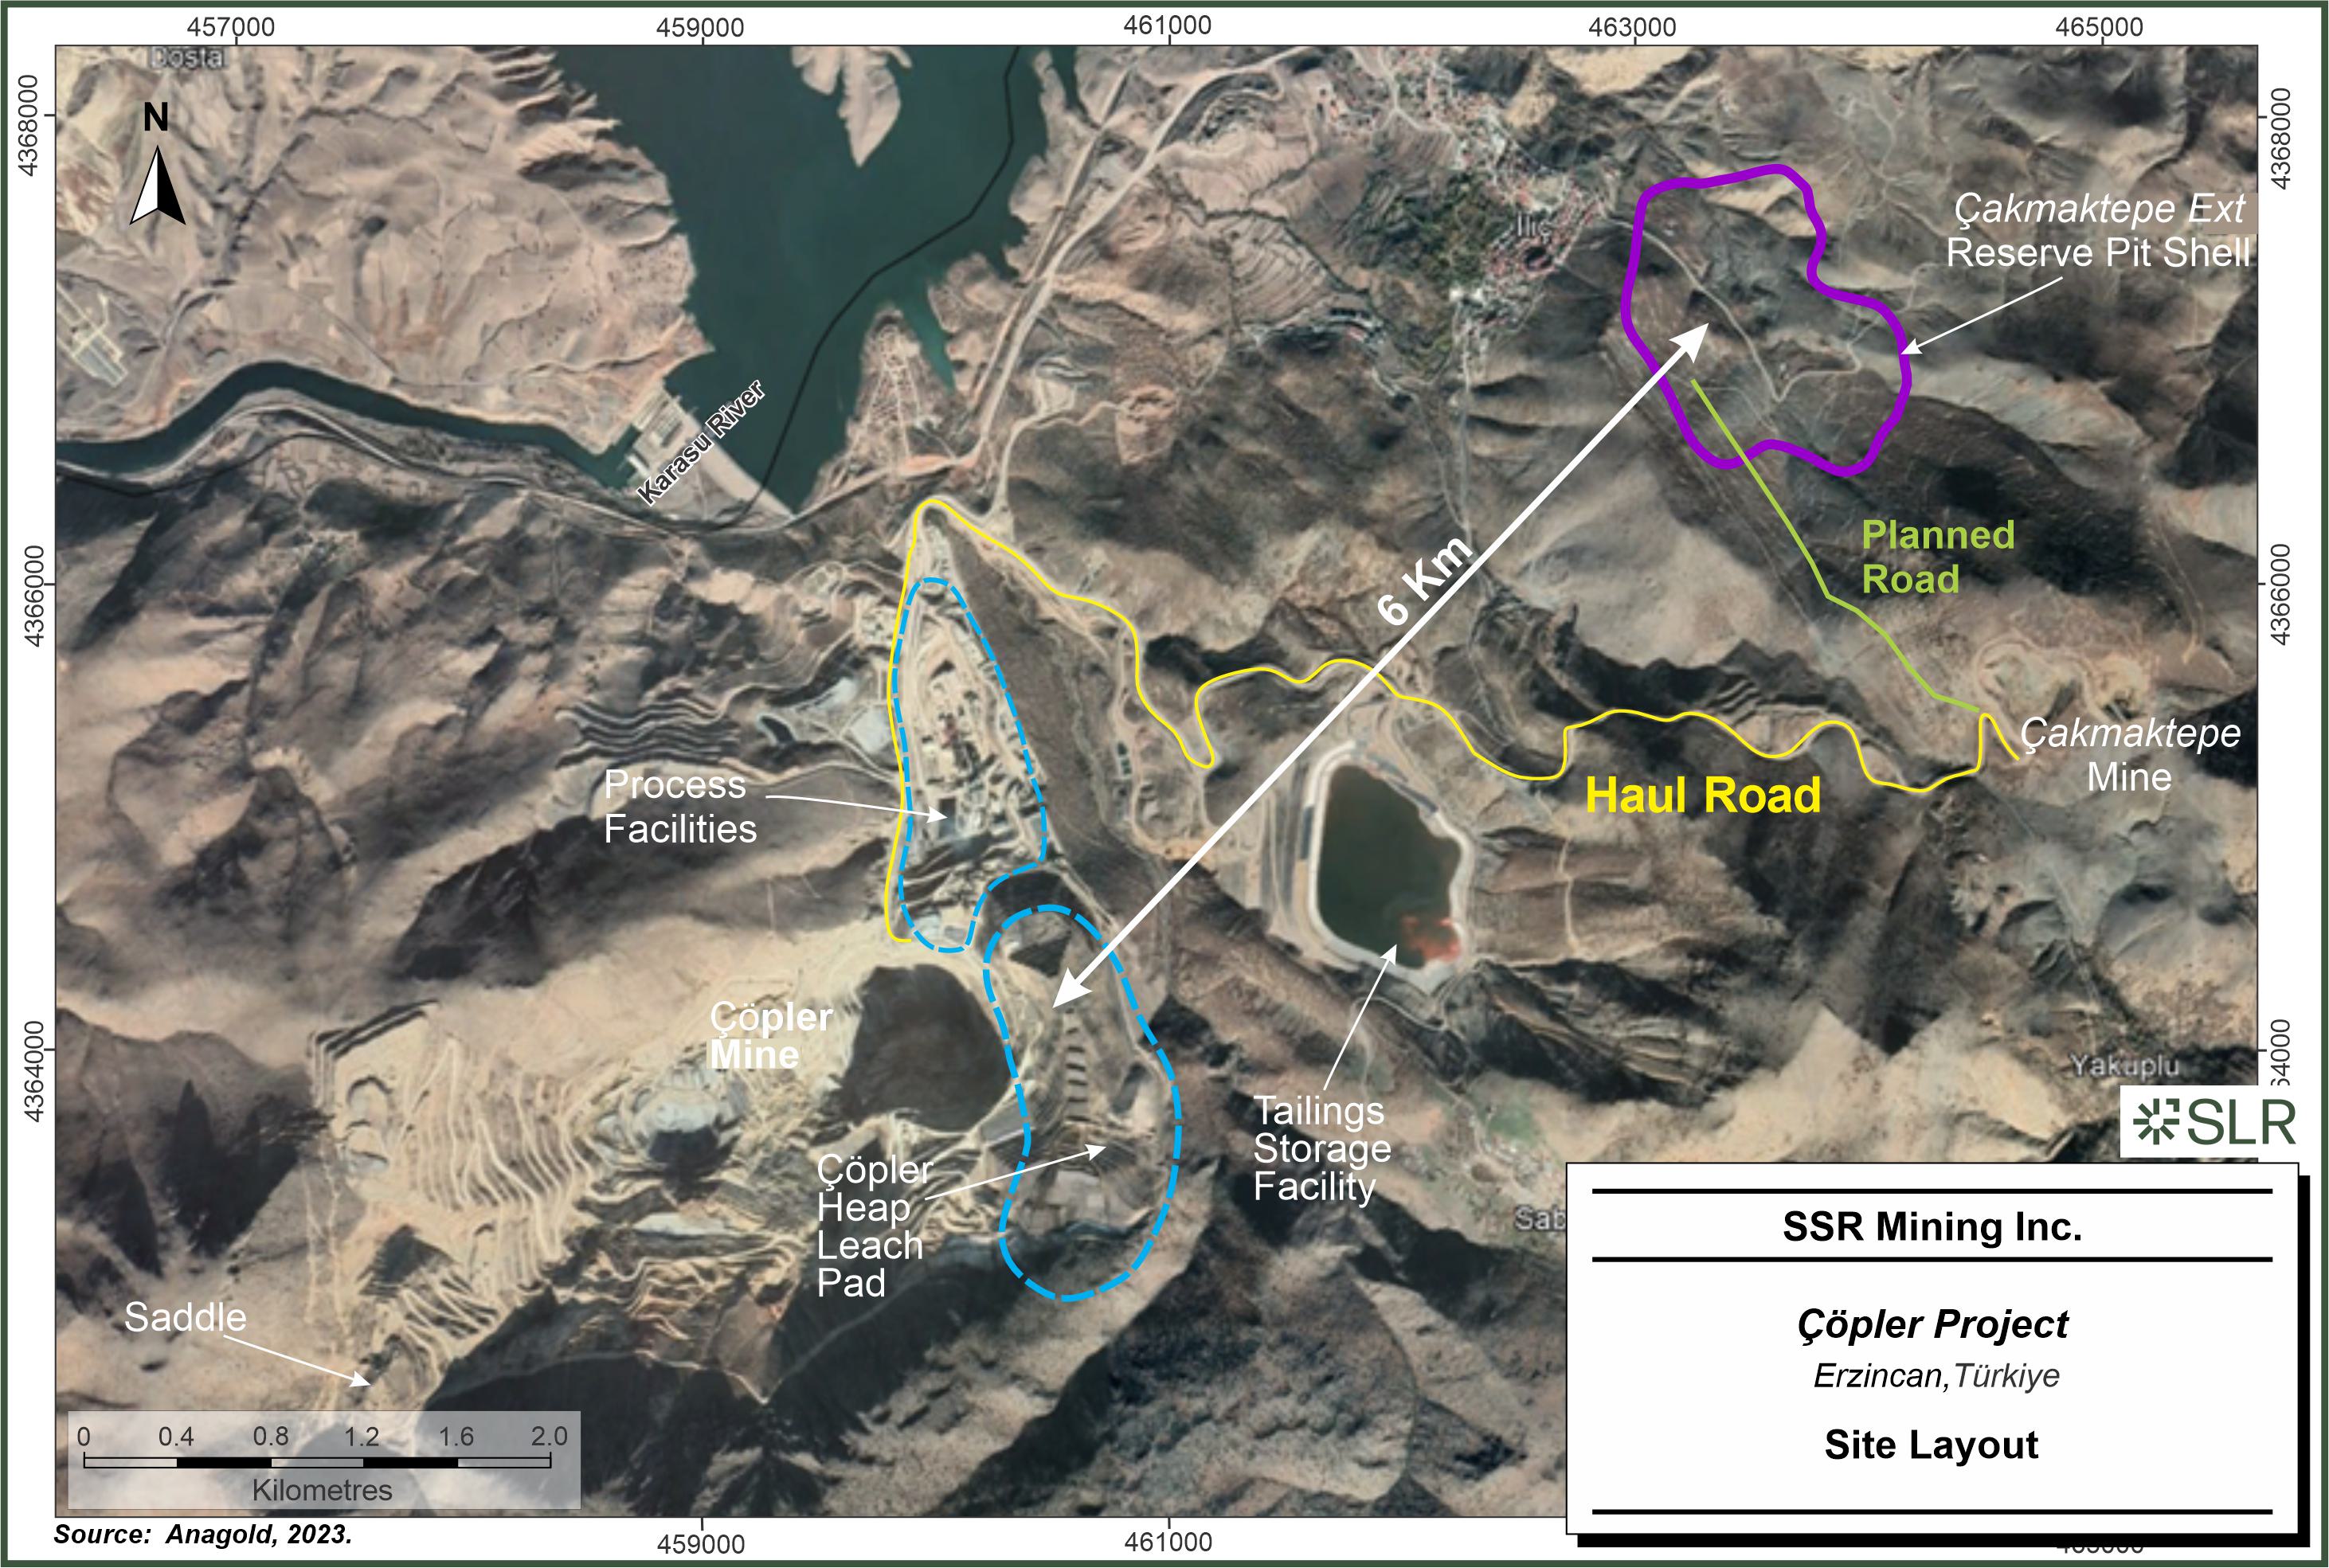
SSR
Mining Inc. Copler Project Erzincan, Turkiye Site Layout
| | 15-2 | |
| SSR Mining Inc. | Çöpler Property S-K 1300 Report | February 12, 2024 SLR Project No.: 138.21581.00006 |
The Çöpler Project has access via the main access road and
sulfide plant roads.
Generally, site roads have an overall width of six metres and provide
everyday operational access for large trucks or facility access for site personnel vehicles. These roads are limited to a maximum grade
of 9%. All access roads are paved and cross-sloped to provide positive drainage.
The existing 154 kV line provides power to the mine and process plant.
The following structures are associated with site power distribution:
| · | High Voltage switchyard 154 kV |
| · | Main electrical building |
| · | Crushing electrical building |
| · | Grinding electrical building |
| · | Carbon elution electrical room |
| · | TSF area electrical buildings |
| · | Bore field area electrical building |
Motors and loads for certain critical equipment and systems were identified
as requiring power in the event of a utility outage. A load shedding scheme is applied to feed critical electrical users automatically
in the event of a utility outage.
Generators are diesel fueled; onsite storage includes a minimum of eight-hours
of diesel based on generators operating under full load.
| 15.3.1 | Hydrology Background |
The only perennial surface water in the vicinity of the Çöpler
Mine is the Karasu River flowing in the northern and western part of the area. All other valleys are either ephemeral streams or dry valleys.
The average flow rate of the Karasu River, measured at the Bağıştaş / Karasu Gauging Station in the upper Euphrates
Basin, is approximately 145 m³/sec, draining an area of 15,562 km². A hydroelectric dam (Bağıştaş
-1 Dam) was built on the Karasu River downstream of the mine site. When the reservoir is at high levels the impoundment will extend into
the very lower reaches of both the Çöpler and Sabırlı creeks and the maximum inundation elevation will be 916.5 m
as it is released into the spillway. The Çöpler and Sabırlı creeks in the Project area do not flow perennially.
They both discharge into the Karasu River. The drainage area of the Sabırlı Creek is approximately 35 km² and that
of the Çöpler Creek is approximately 10 km².
| | 15-3 | |
| SSR Mining Inc. | Çöpler Property S-K 1300 Report | February 12, 2024 SLR Project No.: 138.21581.00006 |
The Project submitted a Five-Year Water Management Report in December
2019, prepared by SRK Danışmanlık ve Mühendislik A.Ş., as part of the Environmental Impact Assessment’s
(EIA) conditions (SRK, 2019). This report benchmarks the expected results with those achieved. Overall results achieved were generally
as predicted. In 2020, as part of updating the EIA, further hydrogeology studies were undertaken by SRK Danışmanlık ve
Mühendislik A.Ş. SRK updated the surface water and hydrological models based on actual data over the operating period of the
mine to improve the model (SRK, 2021).
| 15.3.2 | Site-Wide Surface Water Hydrology |
Existing mine site facilities are located primarily within the Çöpler
and Sabırlı creek watersheds immediately upstream of their confluence with the Karasu River. Site-wide surface water management
for the included diversion facilities consist of a network of diversion channels and retention structures to minimise storm water run-on
to the mine site facilities to prevent mine-impacted storm water run-off from exiting the site and discharging to the Karasu River.
The sub-basin areas, characterization of the surface run-off conditions,
and design rainfall data were used to construct the existing conditions hydrology model. The hydrology analysis utilised HEC-HMS software
to develop estimates of the peak flow rates and volumes generated by the existing watersheds.
| 15.3.3 | Surface Water Management Structures |
Engineered surface water management structures are constructed to minimize
effects of storm water run-off to critical mine facilities and to control the release of mine-impacted water to the environment. A combination
of interim and permanent diversion channels and retention ponds are utilised to achieve these goals. Interim structures will be reclaimed
at closure while permanent structures will remain in place post-closure. Other flood control structures were developed to control or direct
run-off away from pit crests and are planned for run-off that does not discharge to surface water drainages or streams and, therefore,
do not require lining.
Sediment ponds to control run-off and sediment release are lined based
on the EIA commitments. Interim diversion channels are designed to convey the 25-year storm event with 1.5 m of freeboard and the
100-year storm with no freeboard. Permanent diversion channels are designed to convey the 100-year storm with 0.5 m of freeboard.
Lined sediment ponds are downgradient of the waste rock dumps and are sized to contain the 100-year run-off volume with an emergency spillway
to safely discharge the peak flow. The TSF is designed to contain the volume generated by the 72-hour probable maximum precipitation (PMP)
within the operating freeboard.
Fresh water is supplied by existing wells to the site, supporting the
operation. Figure 15.2 shows the location of the mine water extraction wells. An additional three wells were developed in 2018, wells
WM-45, WM-46 and WM-47, to increase water supply for the Project. Two raw water storage tanks support the demands of the heap leach and
sulfide process equipment and the fire water requirements.
| | 15-4 | |
| SSR Mining Inc. | Çöpler Property S-K 1300 Report | February 12, 2024 SLR Project No.: 138.21581.00006 |
Figure 15-2: Mine Water Supply
Well Locations
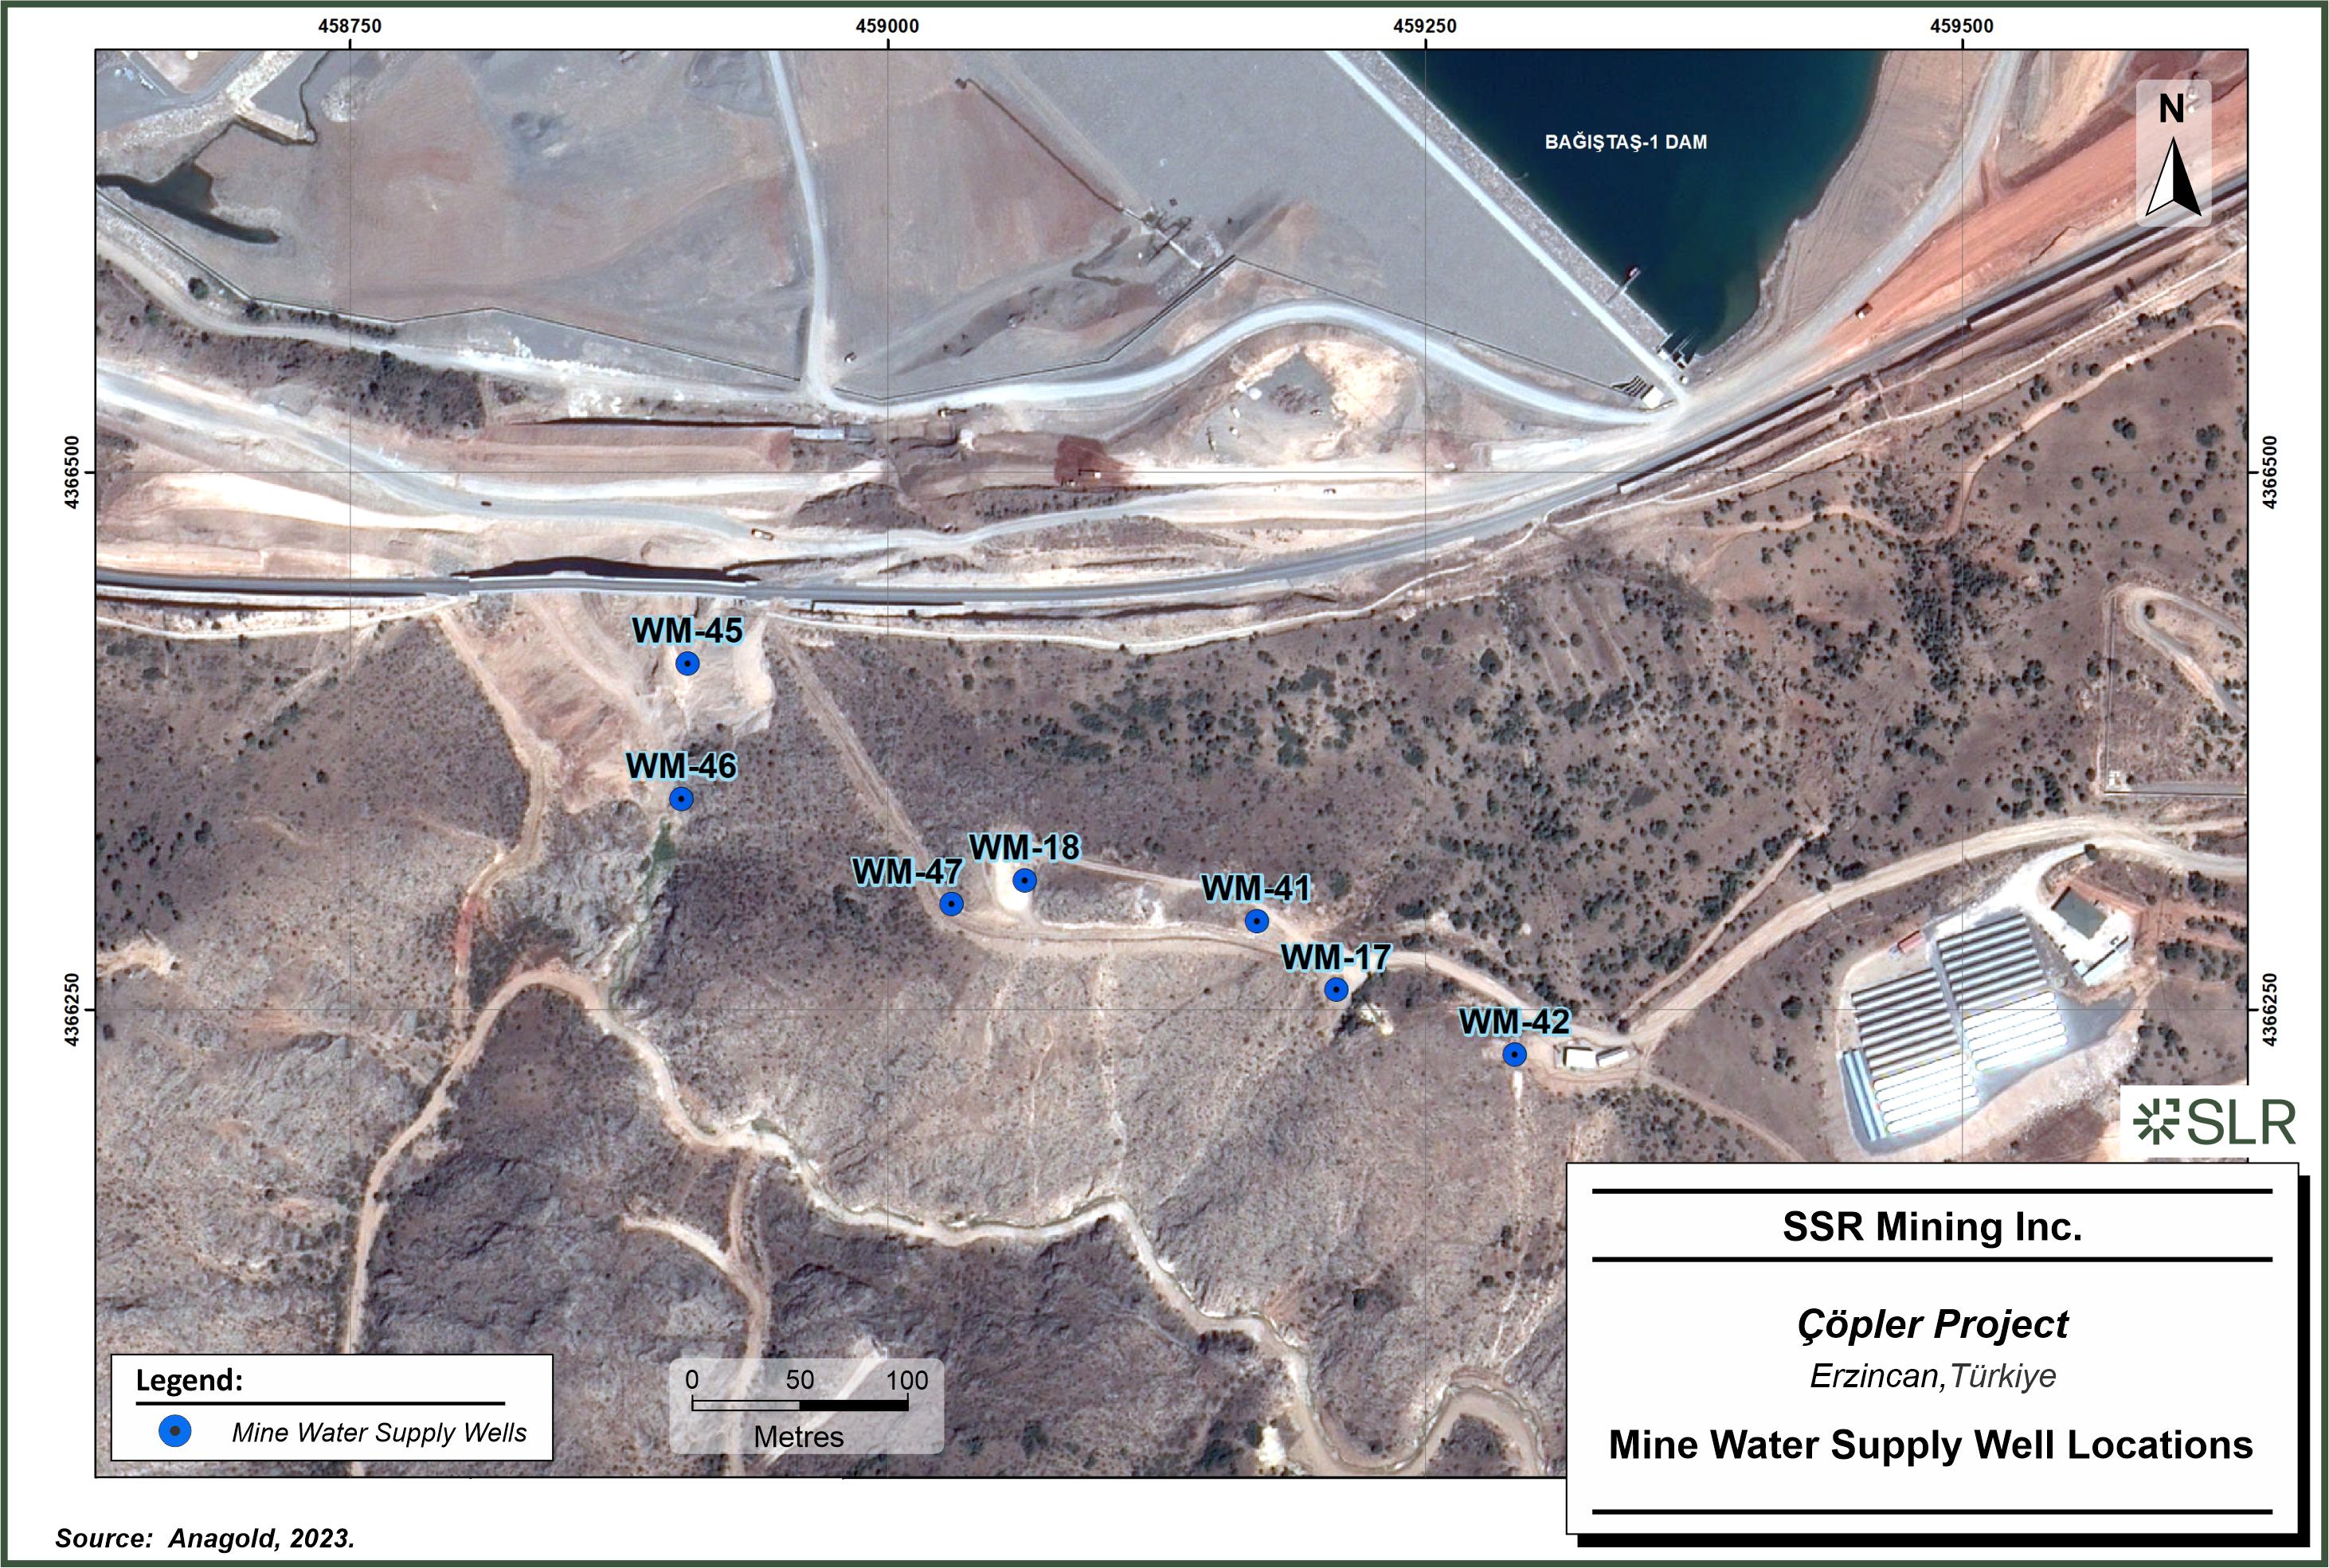
SSR
Mining Inc. Copler Project Erzincan, Turkiye Mine Water Supply Well Locations
| | 15-5 | |
| SSR Mining Inc. | Çöpler Property S-K 1300 Report | February 12, 2024 SLR Project No.: 138.21581.00006 |
| 15.3.5 | Potable Water Treatment |
The site is serviced by a potable water treatment system and distribution
system. The system consists of multi-media filtration, carbon filtration, and an ultraviolet (UV) disinfection system that directly feeds
the site potable water distribution system. For water used in the dining room, the water system uses further softening and reverse osmosis.
Waste will be generated from multiple sources such as human waste, food
spoilage, and process and maintenance wastes.
Hazardous wastes will be contained, packaged, and disposed of in accordance
with local, regional, and national regulations. Non-hazardous wastes will either be buried on-site or transported off site to the appropriate
processing site in accordance with local, regional, and national regulations.
Accommodation facilities include the following:
| · | Site kitchens and eating areas |
| · | Site single living dormitory with adjacent multi-purpose room |
| · | Contractor (mining) dormitories, kitchens, and offices |
| 15.5 | Existing Infrastructure |
The existing site infrastructure supporting the existing operation includes
the following:
| · | Site security gate and guard station |
| · | Site administration building |
| · | Container or modular type offices |
| · | Cyanide receiving and mixing system |
| · | Site raw water wells, pumping system and storage tanks |
| · | Site potable water treatment and distribution system |
| · | Two sanitary wastewater collection and treatment systems |
| · | Sulfide maintenance building |
| · | Combined oxide and sulfide gold refinery building |
| · | Oxide carbon desorption and reactivation building |
| · | Sulfidization, acidification, recovery, and thickening (SART) building |
| | 15-6 | |
| SSR Mining Inc. | Çöpler Property S-K 1300 Report | February 12, 2024 SLR Project No.: 138.21581.00006 |
| · | Sulfide process buildings: |
| · | Pressure oxidation (POX) building |
| · | Carbon desorption building |
| · | Main control room and electrical building |
| · | HV switchyard electrical building |
| · | Crusher electrical building |
| · | Potable water booster pump house |
| · | Tailings and process water pump house |
| · | Plant and instrument air compressor building |
| · | Counter current decantation (CCD) electrical building |
| · | Leach air compressor building |
| · | Lime slaking (MOL) building |
| · | Fe/As air compressor building |
| · | Emergency diesel generators building |
| · | TSF reclaim electrical building |
| · | TSF drainage tank electrical building |
| · | TSF Overdrain-Underdrain pond electrical building |
| · | Pump shelters with monorails |
| · | Carbon elution building – electrical room |
| · | Raw water bores P/P house and electrical building |
| · | Community relations centre |
| | 15-7 | |
| SSR Mining Inc. | Çöpler Property S-K 1300 Report | February 12, 2024 SLR Project No.: 138.21581.00006 |
The Project uses networks for the distributed control system (DCS),
the integrated process related and security CCTV system, security systems (access control / card reader), information technology (IT),
and telephones and communication between the DCS and packaged control systems.
Single mode fibre and copper cabling is distributed within the sulfide
plant area and selected buildings for the tailing pipeline and dam.
| 15.7 | Plant Fire Protection System |
A separate plant fire protection system is provided for the sulfide
facility and includes the flotation building.
A combined sprinkler, hose reel and hydrant underground piping system
is provided for the active fire protection of the facility.
A gas-based fire suppression system is used in the main control and
electrical building.
The heap leach includes the leach pad and collection ponds that consist
of process ponds and a storm pond. The existing leach pad consists of four phases and is currently estimated to accommodate approximately
63 Mt of oxide ore with a nominal maximum heap height of 100 m above the pad liner. The additional phase 5 has an ultimate
capacity of 13.4 Mt of stacked ore at a density of 1.8 t/m3. Phase 5 has received
construction approval from MoEUCC in November 2021.
The heap leach facility is stacked in 8-m thick horizontal lifts at
the natural angle-of-repose with intermediate benches to achieve an overall heap slope of 2H:1V. The pad has a composite liner system
comprising a 2.0-mm (80 mil) double-sided textured high-density polyethylene (HDPE) geomembrane. In areas where grades are 3H:1V or flatter,
the geomembrane is underlain by a minimum of 0.5-m thick compacted low-permeability clay liner, and when grades are steeper than 3H:1V,
the geomembrane is underlain by a geosynthetic clay liner (GCL). Additionally, in pad areas with grades steeper than 2.5H:1V, the geomembrane
is overlaid by a single layer of 8-oz (270-g/m2) geotextile that serves as a friction
break to counter potential settlement of the ore on these steep slopes.
The solution and storm flows gravity-drain towards a 600-mm solid transfer
pipe located at the northeast corner of the pad. The transfer pipe conveys the flow through the pad toe berm to conveyance pipes that
lead to intermediate and pregnant header pipes. The intermediate and pregnant header pipes transport the flows by gravity to the process
pond and the gold recovery system (i.e., the CIC), respectively.
| 15.9 | | Tailings Storage Facility |
The existing tailings storage facility (TSF 1) at the Çöpler
mine was designed by Golder with support from Golder Associates Türkiye, Ltd (Golder Türkiye), now part of the WSP Group of
Companies. TSF 1 has been designed to provide a capacity of 65.8 Mt through seven phases with a crest elevation of 1,275 m.
TSF 1 was permitted through submission of a Turkish Design Application Report (DAR) to the MoEUCC and subsequently approved based on the
design through Phase 5. An amendment to the DAR to obtain permits through Phase 7 is planned.
Select engineering evaluation of Phase 7 has been completed to support
the updated TSF 1 design report including updated stability analysis, dynamic deformation, water balance, and consolidation modeling.
The updated design report for TSF 1 was completed in October 2023 (WSP, 2023b) for use in future planning and in support of the DAR amendment.
| | 15-8 | |
| SSR Mining Inc. | Çöpler Property S-K 1300 Report | February 12, 2024 SLR Project No.: 138.21581.00006 |
Expansion beyond Phase 3 of TSF 1 was limited by the construction and
re-routing of a new road to Sabırlı Village as well as purchase of some small tracts of private land located within the Phase
4 limits on the east side of the existing road to Sabırlı Village. Construction of the new Sabırlı Village Road commenced
in Q3 2021 and was completed in Q4 2022. Acquisition of the private land parcels was also completed in 2022. Subsequently, construction
of Phase 4 of TSF 1 was completed in October 2023.
Anagold is currently considering other TSF sites with potential to increase
tailings capacity, should it be needed, and is working with WSP to develop TSF design options.
Figure 15-3 through Figure 15-6 show the revised TSF 1 design
for Phases 4 through 7.
| 15.9.1 | | TSF 1 Development and Summary of Current Operations |
Construction of Phase 1 of TSF 1 began in December 2016 and was
completed in November 2018 with commissioning of the sulfide plant. Tailings were deposited initially from the emergency spigot and then
typically from two to three spigots around the perimeter of the 1,190 m crest of the Phase 1 embankment. The tailings initially exhibited
a solids content on the order of 24% for the first eight months of operations. The solids content improved and averaged around 30% for
the next three years of operations and has been averaging around 32% for the last year after the addition of the flotation plant to the
process circuit. Since the beginning of operations, four metres to five metres of water has been present over the top of the tailings
surface. Reclaim water was managed by pumps on a rail-mounted sidehill reclaim system during Phase 1. Starting with Phase 2, the reclaim
system transitioned to conventional pumps mounted on a floating barge accessible for maintenance from ramps constructed within the northern
portion of the impoundment. The second raise, or Phase 2 of TSF 1, was completed in April 2020 and construction of Phase 3 was completed
in December 2020. Anagold completed the Phase 4 construction in October 2023 and started the tailings deposition from Phase 4 crest elevation
of 1,235 m.
Bathymetry surveys were performed monthly for the last few years and
a recent survey from September 2023 indicated a tailings average dry density of 0.85 t/m3
and tailings sloping at 0.2% to 0.3% subaqueously. Based on the September 2023 bathymetry survey, there is approximately 1.5 million
m3 of water in the TSF 1 impoundment. Current reclaim rates have averaged 7,500 m3/day
for the last year.
| 15.9.1.1 | Site Classification |
TSF 1 is classified in accordance with the Global Industry Standard
for Tailings Management (GISTM) as “High” for the operational phase and post-closure phases. In accordance with Table 1 of
the GISTM, a high dam classification assumes that in the event of failure that the population at risk would be between 10 and 100 and
that incremental losses would include the following criteria:
| · | Potential Loss of Life – Possible (1-10). |
| · | Environmental and cultural values – Significant loss or deterioration of critical habitat or rare and endangered species. Potential
contamination of livestock/ fauna water supply with no health effects. Process water moderately toxic. Low potential for acid rock drainage
or metal leaching effects of released tailings. Potential area of impact 10 km2 – 20 km2. Restoration possible but difficult and
could take > 5 years. |
| | 15-9 | |
| SSR Mining Inc. | Çöpler Property S-K 1300 Report | February 12, 2024 SLR Project No.: 138.21581.00006 |
| · | Infrastructure and Economics – High economic losses affecting infrastructure, public transportation, and commercial facilities,
or employment. Moderate relocation/compensation to communities. <US$100 million |
For TSF 1, a dam breach assessment and credible failure modes analyses
were conducted. The selected potential credible failure mode was considered as a collapse due to slope failure (i.e., sliding or abutment
failure) or foundation failure that leads to a sudden partial collapse of the crest followed by overtopping that progresses the breach
formation. WSP assumed the crest deformation was greater than the operating freeboard. Two additional potential failure modes were also
considered and determined to be non-credible or near non-credible. The likelihood of overtopping from a storm event was deemed to be very
rare due to the available freeboard to store large precipitation events and the constructed upgradient diversions. The dam consists of
durable waste rock that is unlikely to erode from shallow overtopping. The dam is also sized to contain the probable maximum flood (PMF),
and a diversion channel located upgradient from the TSF 1 is sized to convey the 500-yr, 24-hour storm event. Given these capacities,
it is unlikely that the dam will catastrophically fail from a hydrologic event alone. Similarly, catastrophic failure from internal erosion
(or piping) is unlikely based on the filter capability of the liners and the robust design of the overdrain and underdrain systems. In
addition, monitoring is in place to confirm the working ability of the drainage systems.
It should be noted that dam breach and related inundation studies are
based on hypothetical scenarios. They are performed to inform dam consequence classification and/or as input to emergency plans enacted
in the occurrence of a dam breach event. A dam breach and inundation study does not constitute, nor imply any likelihood of failure. Rather,
it assumes that a breach is initiated, irrespective of likelihood, and assumes hypothetical credible failure modes based on assumed site
conditions and historic dam failures at other locations.
| | 15-10 | |
| SSR Mining Inc. | Çöpler Property S-K 1300 Report | February 12, 2024 SLR Project No.: 138.21581.00006 |
Figure 15-3: Phase 4 –
Top of Embankment and Impoundment Grade
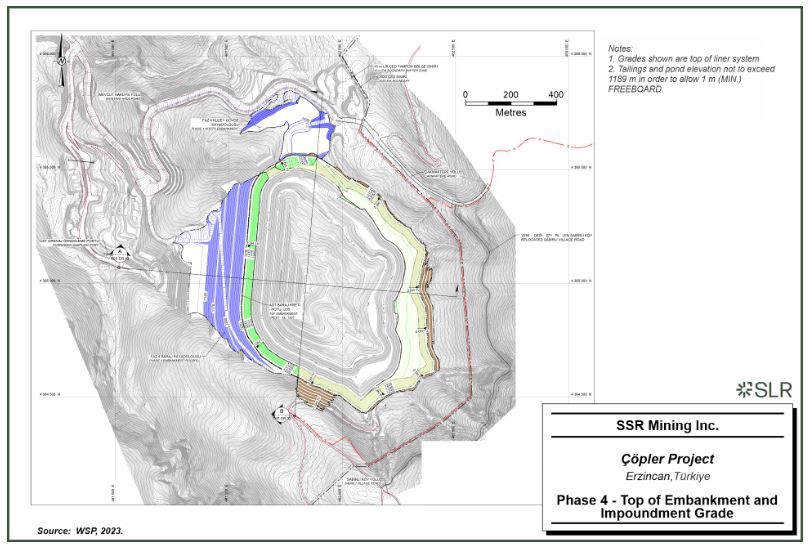
SSR
Mining Inc. Copler Project Erzincan, Turkiye Phase 4 - Top of Embankment and Impoundment Grade
| | 15-11 | |
| SSR Mining Inc. | Çöpler Property S-K 1300 Report | February 12, 2024 SLR Project No.: 138.21581.00006 |
Figure 15-4: Phase 5 –
Top of Embankment and Impoundment Grade
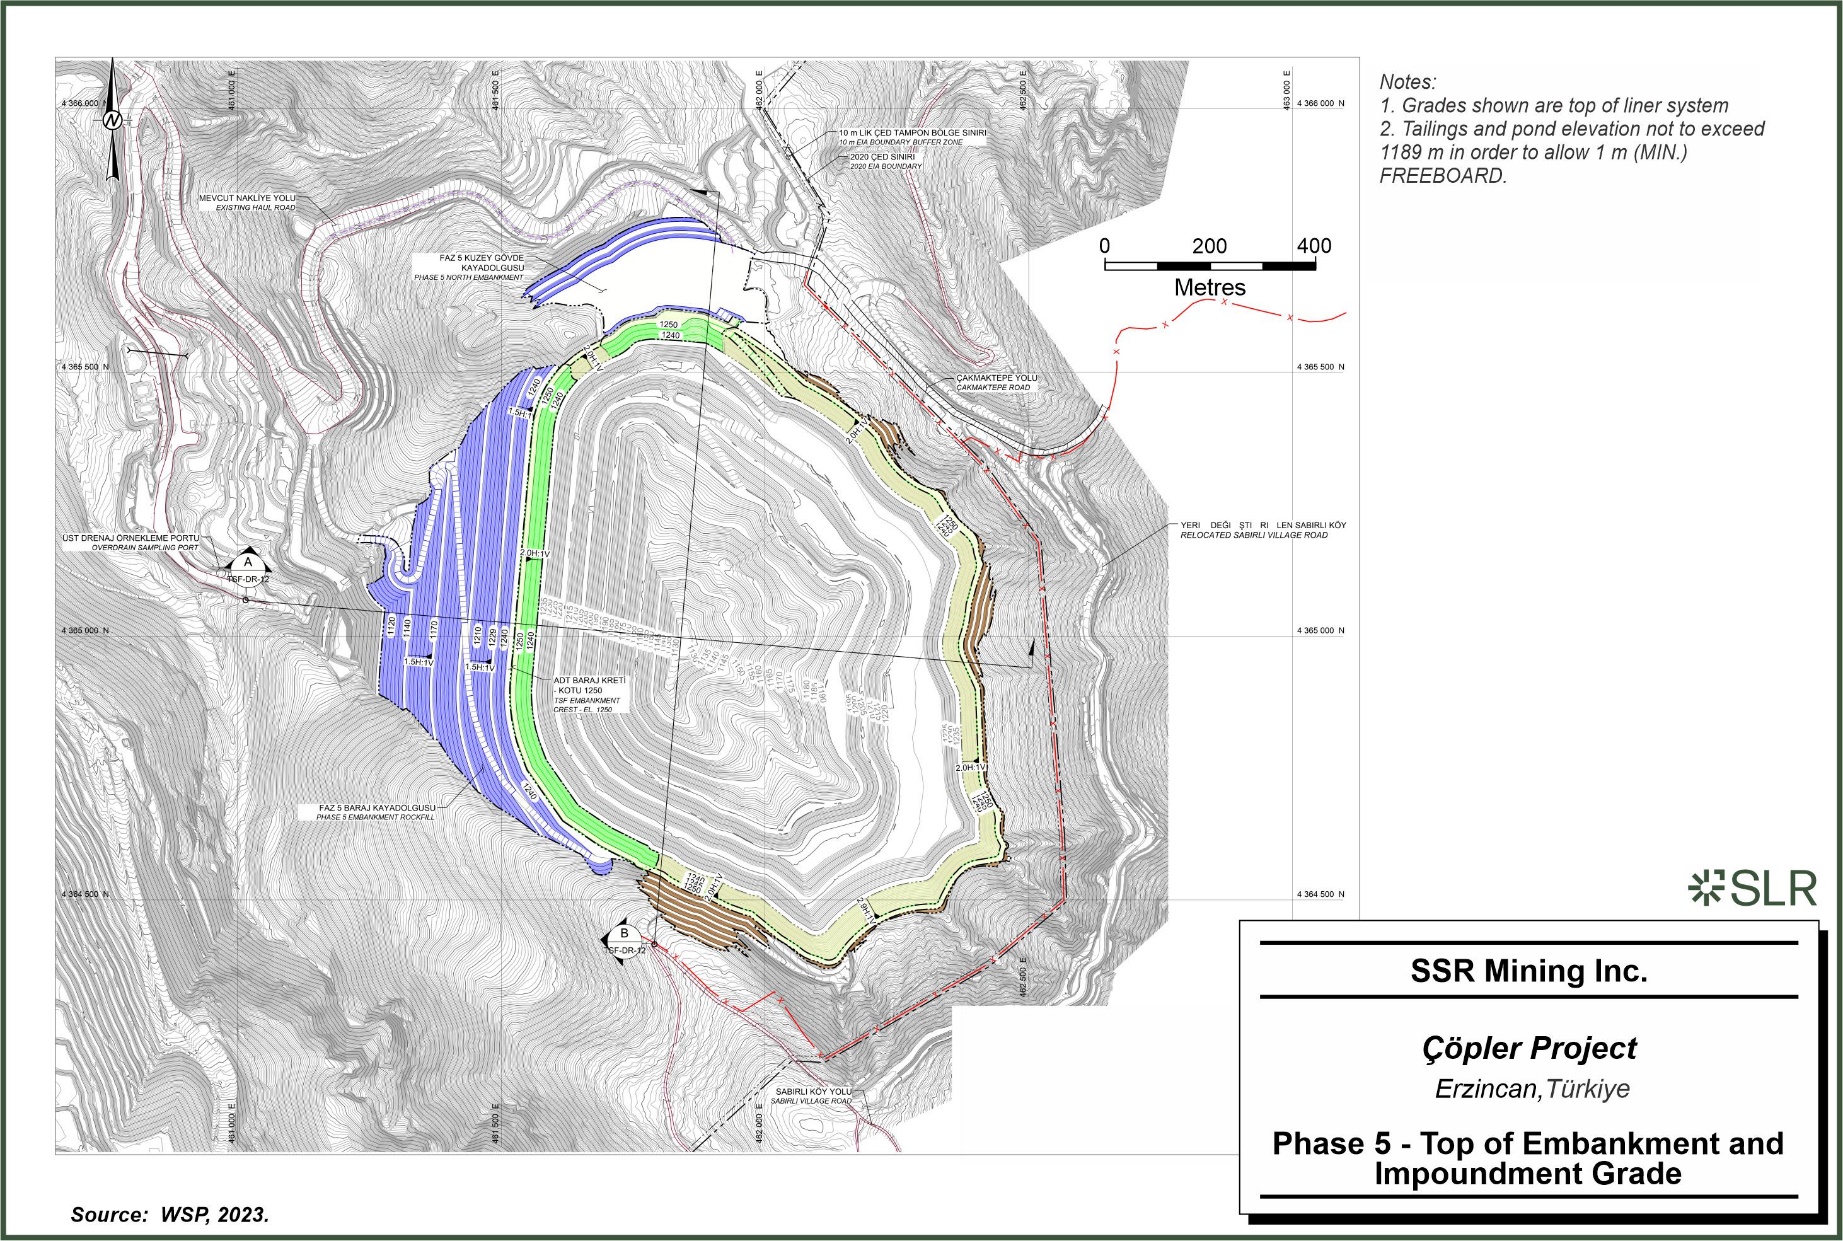
SSR
Mining Inc. Copler Project Erzincan, Turkiye Phase 5 - Top Embankment and Impoundment Grade
| | 15-12 | |
| SSR Mining Inc. | Çöpler Property S-K 1300 Report | February 12, 2024 SLR Project No.: 138.21581.00006 |
Figure 15-5: Phase 6 –
Top of Embankment and Impoundment Grade

SSR
Mining Inc. Copler Project Erzincan, Turkiye Phase 6 - Top of Embankment and Impoundment Grade
| | 15-13 | |
| SSR Mining Inc. | Çöpler Property S-K 1300 Report | February 12, 2024 SLR Project No.: 138.21581.00006 |
Figure 15-6: Phase 7 –
Top of Embankment and Impoundment Grade
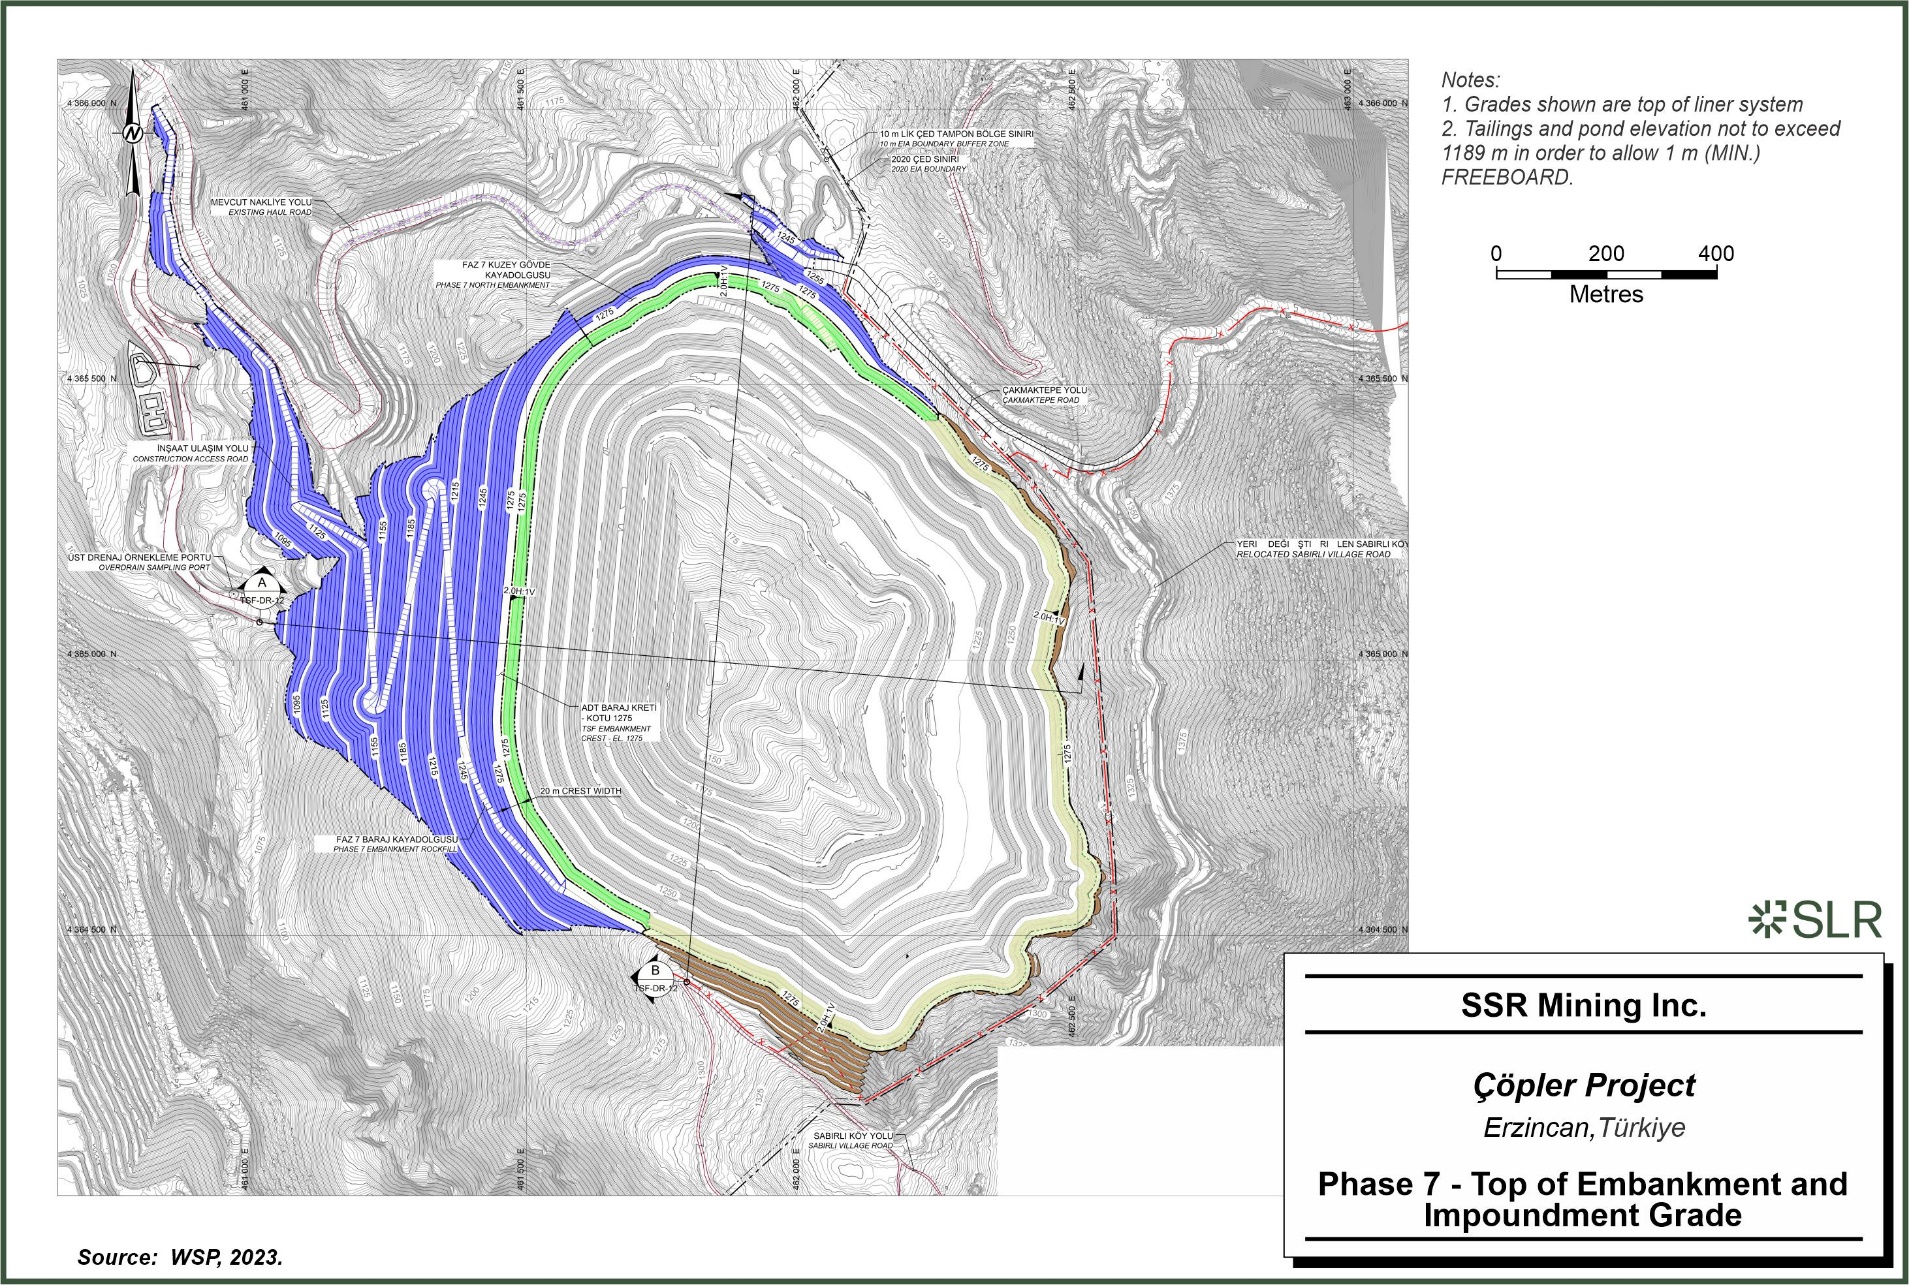
SSR
Mining Inc. Copler Project Erzincan, Turkiye Phase 7 - Top of Embankment and Impoundment Grade
| | 15-14 | |
| SSR Mining Inc. | Çöpler Property S-K 1300 Report | February 12, 2024 SLR Project No.: 138.21581.00006 |
| 15.9.1.2 | Monitoring and Inspection |
An Operational, Maintenance, and Surveillance (OMS) Manual was prepared
by WSP with input and support from Anagold. The OMS Plan was prepared in accordance with the Turkish Mining Waste Regulations (MoEUCC,
2015) with additional guidance published by the Mining Association of Canada (MAC, 2019). The OMS Manual is a ‘living document’
that is updated on an annual basis. In addition to providing the basic guidance for the management of process fluids, the OMS Manual does
the following:
| · | Summarizes the roles and responsibilities of Anagold personnel. |
| · | Presents a description of the facility and pertinent design details. |
| · | Provides maintenance and surveillance parameters and procedures. |
| · | Outlines abnormal operating conditions. |
| · | Details emergency preparedness and response protocols. |
| · | Presents a conceptual closure plan. |
The OMS Manual provides a documented framework for action, as well as
a sound basis for measuring performance and demonstrating due diligence. It is intended to be a dynamic document that is reviewed and
revised by site personnel and the Engineer of Record (EoR) on an annual basis and as operating conditions require. The OMS Manual (WSP,
2022) includes a requirement for the annual dam safety inspection performed by the EoR which includes a series of inspections at site
that is documented in an annual Dam Safety Inspection Report. The first annual inspection for TSF 1 was conducted in Q4 2019. Since then,
annual inspections have been performed by the EoR, and the findings have been presented in annual dam safety inspection reports. The results
of the latest inspection in 2023 and data review indicated that the Çöpler TSF 1 is in good condition and operating in
general accordance with the intended design of the facility. A review of the instrumentation indicated normal data trends and no unanticipated
abnormal readings or ‘triggering events’ observed. Of the action items included in the report, none were considered serious
in nature or otherwise a concern to the safety of the TSF 1.
In addition, TSF 1 is subject to fortnightly external official audits
by the Erzincan Provincial Environmental Directorate. The authorised hydraulic structures inspection company, Ore Mineral, is always on-site
during construction, on behalf of the MoEUCC. The TSF design and engineering consultant is also on-site during construction to ensure
quality and conformance to design.
Anagold has engaged an Independent Tailings Review Board (ITRB), as
per leading international best practices, to review tailings facilities as part of the review and oversight process. The ITRB reports
directly to the senior management at a corporate level.
TSF 1 is a downstream, earth and rockfill dam. The technical specifications
for the construction of TSF 1 conform with both Turkish national requirements and accepted good practice standards for tailings facilities,
including the International Council on Mining and Metals’ (ICMM) GISTM, World Bank Standards, Canadian Dam Association Safety guidelines,
Mining Association of Canada (MAC) Guides, and the International Commission on Large Dams (ICOLD) bulletins for the dam safety.
| | 15-15 | |
| SSR Mining Inc. | Çöpler Property S-K 1300 Report | February 12, 2024 SLR Project No.: 138.21581.00006 |
The TSF 1 design consists of a fully lined impoundment, including a
compacted earth and rockfill embankment. TSF 1 is a downstream raise construction which will consist of seven phases (six raises). The
TSF 1 embankment overlies mostly the granodiorite and limestone bedrock units except for the small area on the north abutment which sits
on the ophiolite bedrock unit. The ultimate embankment toe will overlie the competent limestone when the embankment reaches its final
design elevation at 1,275 m. During all phases of construction, weaker alluvial materials are removed from the bottom of the TSF 1 valley.
Rockfill has been keyed into the bedrock on the north and south abutments during the previous embankment phases construction and will
continue to be placed as keyed-in material with the further dam raises. The unweathered granodiorite rock mass contains closely to widely
space discontinuities and is classified as strong (50 to 100 MPa UCS) to very strong (100 to 200 MPa UCS) based on the Unified Rock Classification
System (URCS). Similarly, limestone is also classified as medium strong to strong. Foundation shear wave velocities near the surface generally
ranged between 200 and 950 m/s, with an average value of about 800 m/s. The depth to higher velocity strata varied significantly, between
0 and approximately 50 m, with an average of approximately 20 m. Velocities at depth were higher, up to approximately 4,000 m/s with an
average value of approximately 2,000 m/s. Rock exhibiting seismic velocities of below 2,000 m/s is considered rippable with a D9 dozer.
WSP’s limit equilibrium study modeled the foundation materials based on the available laboratory and field data and indicated that
TSF constructed through Phase 7 with 1.7H:1V downstream composite slopes will be stable under static loading conditions and OBE and MDE
seismic conditions. The TSF 1 design includes the following primary components:
| · | A compacted earth and rockfill embankment with a zoned upstream granular filter protection system. TSF 1 will have 1 m minimum
freeboard under its crest elevation and is designed to contain the Probable Maximum Precipitation (PMP) storm event. The downstream face
of the ultimate embankment will be constructed at a composite slope of 1.7H:1V. The upstream face of the embankment will be constructed
at a slightly shallower slope with slopes of 2.0H:1V to facilitate placement of the filter layers and liner system and a resultant composite
slope on the order of 2.6H:1V after considering the operational benches. The filter layers and low-permeability soil layers are designed
to be 1.5 m thick, as measured perpendicular to the slope. Measured horizontally, the layers are designed at 3.3 m wide each. |
| · | A composite liner system consisting of a 2 mm thick, double-sided, textured high-density polyethylene (HDPE) geomembrane and
geosynthetic clay liner (GCL) over a low-permeability soil (i.e., clay) liner system that provides an equivalent protection to that provided
by 5 m of a geologic barrier with k <10-9 m/s. A GCL is also substituted with low-permeability clay on select slopes steeper
than 3H:1V as allowed by Turkish regulations. |
| · | An impoundment gravity flow underdrain system for collection and monitoring of naturally occurring seeps and springs. |
| · | An upstream diversion channel was constructed concurrent with the Phase 4 expansion along the new Sabırlı Village Road to
convey the 100-yr 24-hr storm event plus freeboard or the 500-yr, 24-hr event without freeboard. The design by INR Consulting and Engineering
(INR) routes the upgradient surface water around the TSF 1 valley and to the adjacent Kuruçeşme Valley. |
| · | An impoundment overdrain system for the collection and management of tailings seepage water through natural consolidation and drainage
of excess process water. |
| · | Perimeter roads and benches within and around the impoundment area for access and tailings distribution / reclaim water pipes. |
| · | Tailings delivery and distribution system. |
| | 15-16 | |
| SSR Mining Inc. | Çöpler Property S-K 1300 Report | February 12, 2024 SLR Project No.: 138.21581.00006 |
Embankment Stability Analyses
Slope stability analyses were performed on the ultimate TSF configuration
(i.e., at the end of filling of Phase 7) using Slide2 by RocScience, a two-dimensional limit equilibrium slope stability program. The
Spencer (1967) method was used to compute a factor of safety as this procedure satisfies both force and moment equilibrium, thereby yielding
a more rigorous solution than other commonly used methods. Per the project design criteria, the minimum allowable FOS is 1.5 for static
analyses. Pseudo-static stability analyses using the Hynes-Griffin and Franklin (Hynes-Griffin and Franklin 1984) method were used as
an initial screening tool to evaluate whether embankment deflections under seismic loading conditions will be acceptable.
The FOS values calculated for four different cross-sections through
TSF 1 ranged from 1.8 to 2.0 therefore exceeding the minimum design criteria, indicating the TSF will be stable under static loading conditions.
To achieve the minimum required FOS, it was assumed that unsuitable surficial soil near downgradient embankment toe will be excavated,
removed, and replaced with structural fill as needed. This has been performed as part of construction to-date and has been documented
in the daily field reports and CQA Reports for each phase constructed.
Pseudo-static stability analyses were performed on the four sections
for operational and closure conditions. Under the OBE, the minimum FOS value is 1.2 for Ultimate TSF with 1.7H:1V composite downstream
slopes. Under MDE, the minimum FOS value is 1.0 for the Ultimate TSF. WSP also evaluated the seismic loading conditions for an annual
exceedance probability (AEP) of one-in-10,000-year event as recommended by guidelines included in the GISTM. Two of the sections resulted
with FOS smaller than 1.0 under 10,000-yr earthquake event. These results indicate the TSF may experience some deflection during seismic
loading conditions. Therefore, detailed seismic deformation analysis was performed to assess the magnitude of earthquake induced movements.
Seismic Deformation Evaluation
The current deformation model provides the deformations under seismic
loading conditions for a TSF 1 with 1,275 m crest elevation, which corresponds to Phase 7 in the current design. The seismically
induced deformations were evaluated against earthquake ground motions with an annual exceedance probability (AEP) of 1 in 10,000 years
using the two-dimensional finite difference FLAC 8.0 software in which both the horizontal and vertical displacements are evaluated independently.
Source earthquakes were of moment magnitude (M) 6.9 to 7.9 centered at M7.5 which was the preferred MCE magnitude in the project design
criteria. WSP weighted the Arias Intensity (AI) and D5-75 direct measures after comparing the intensity measures of the scaled Earthquake
Acceleration Time Histories (EATHs) to the predicted intensity measures. The D5-75 and AI of the scaled EATHs were generally within the
16th and 84th percentile range of the predicted values with few scaled EATHs that were outside the range. The D5-95 and CAV were on average
close to or slightly larger than the 84th percentile which was relatively conservative.
Based on the average predicted deformations and the expected levels
of liner strain, the TSF 1 phase 7 embankment is expected to remain stable when subjected to the design strong motion events.
| | 15-17 | |
| SSR Mining Inc. | Çöpler Property S-K 1300 Report | February 12, 2024 SLR Project No.: 138.21581.00006 |
Tailings Consolidation and Capacity
WSP updated the tailings consolidation modeling to account for the tailings
characteristics obtained from 2020 laboratory tests on POX and Flotation tailings. The updated consolidation model also included the current
mine plan.
Based on the results of the updated consolidation model, an overall
maximum tailings elevation of 1,274 m (i.e., crest elevation of 1,275 m) above mean sea level (MASL) provides capacity within the TSF
for 59.2 Mm³ of tailings deposited at average end of life settled density of 1.18 t/m³ resulting in capacity approximately
for 70.0 Mt of tailings. This elevation considers struck-level tailings deposition only. This means that tailings beach slopes, water
storage pond volumes, and freeboard are not considered. Considering a 1% tailings sub-aqueous beach slope under the water pool, the tailings
capacity would be reduced to 65.8 Mt.
The tailings tonnage estimate requires the sulfide plant feed to be
adjusted to allow for the limestone added during processing for pH control. The limestone reacts with the acid to form gypsum. The applicable
factor is 1.146.
TSF Schedule Assumptions
The key assumptions related to the ongoing construction and expansion
of TSF 1 as follows:
| · | Based on the current LOM plan and schedule, there is sufficient capacity in Phase 4 through Q1 2026. |
| · | Phase 5 construction was initiated in 2023 and is currently ongoing with embankment rockfill placement. Construction is scheduled
to be completed by 2025. Phase 5 will have approximately 39 Mt of tailings capacity at struck level. |
| · | The LOM plan that constitutes the basis for this TRS requires approximately 60.4 Mt of tailings storage capacity. |
| · | TSF 1 already contains approximately 13.3 Mt of tailings that have been deposited. The total required capacity for tailings storage,
considering the existing stored tailings and the LOM plan, is 73.7 Mt. |
| 15.9.2 | TSF Expansion and Further Planned Development |
There are opportunities that may offer significant reduction in capital
costs with consideration of the following:
| · | Current TSF can be expanded to Phase 7 with crest elevation of 1,275 MASL and will provide a capacity of 65.8 Mt after consideration
of the tailings beach slope and allowance for operational water storage based on current operational practices. Some additional storage
capacity may be gained through improvements in tailings density and water management practices. |
| · | WSP has developed a concept design to increase the crest elevation of Phase 7 embankment to 1,280 MASL, increasing the total capacity
to approximately 77 Mt, if sufficient land can be secured within the impoundment area for this expansion. |
| · | A site directly adjacent to TSF 1, TSF 2, was the subject of a PFS-level study in 2020; TSF 2 can provide approximately 13.9 Mt of
additional tailings storage capacity, if required in the future, however, the development of this facility is not within the scope of
the case presented in this TRS. A detailed design of TSF-2 was advanced to support permitting efforts, and in November 2022 an application
was submitted to the MoEUCC. |
| | 15-18 | |
| SSR Mining Inc. | Çöpler Property S-K 1300 Report | February 12, 2024 SLR Project No.: 138.21581.00006 |
| · | Anagold is currently considering other TSF sites, beyond TSF 1, TSF 2, and potentially dry stack tailings, with potential to increase
tailings capacity should this additional capacity be needed for future expansions. In that regard, WSP is currently working with Anagold
to develop PFS-level TSF design options. |
| | 15-19 | |
| SSR Mining Inc. | Çöpler Property S-K 1300 Report | February 12, 2024 SLR Project No.: 138.21581.00006 |
The markets for gold and silver doré are readily accessed and
available to gold producers. Currently, 100% of the gold and silver is delivered to the Istanbul Gold Refinery. Copper precipitate is
currently produced from the SART plant and sold into local markets in Türkiye. However, the amounts sold to the market are de minimis
and not considered as part of the economic analysis.
However, with the current Mineral Reserves estimate and production schedule
which includes the addition of the Grind-Leach circuit to process mainly oxide ores from the Greater Çakmaktepe deposit, saleable
silver and copper quantities are considered de minimis and not included in the economic analysis.
Metal prices for the economic analysis were estimated after analysis
of consensus industry metal price forecasts and compared to those used in other published studies. The metal prices selected have taken
into account the current Project life. The metal prices used for the economic analysis, shown in Table 16-1, are considered to be
representative of industry forecasts.
Table 16-1: Economic Analysis
Metal Price Assumptions
| Metal Price |
Units |
2023 |
2024 |
2025 |
2026 |
2027 |
Long-Term |
| Gold |
$/oz |
1,925 |
1,930 |
1,890 |
1,810 |
1,780 |
1,755 |
| Copper |
$/lb |
3.85 |
3.90 |
4.05 |
4.10 |
4.00 |
3.85 |
| Silver |
$/oz |
23.50 |
24.00 |
23.95 |
23.70 |
23.35 |
22.75 |
No external consultants or market studies were directly relied on to
assist with the sales terms and commodity price projections used in this TRS. The SLR QP agrees with the assumptions and projections presented.
Anagold contracts the mining operations to a Turkish mining contractor.
The contract contains provisions for escalation / de-escalation of fuel prices, foreign exchange rates, haul grade and distance and
Turkish inflation. The terms and prices for the mining contract are within industry standards for mining contracts.
| | 16-1 | |
| SSR Mining Inc. | Çöpler Property S-K 1300 Report | February 12, 2024 SLR Project No.: 138.21581.00006 |
| 17.0 | Environmental Studies, Permitting, and Social Plans, Negotiations, or Agreements with Local Individuals or Groups |
The Çöpler mining and processing operations have a well-established
and effective environmental social and permitting management program. Site staff are knowledgeable and experienced in site and regulatory
requirements and supported by corporate environmental, social and governance (ESG) personnel. Budgets are reasonable and there were no
critical path permitting items referenced that would limit production and reserve/resource development. A reclamation/closure plan and
estimates to perform this activity are in place. The budgets and staffing to perform required programs are adequate and indicative of
activities, requirements and responsibilities.
The following sections describe the existing environment, monitoring,
Project operations, planned ESG activities and closure.
The Çöpler mining and processing operations involve open
pit mining from multiple pits, construction of multiple waste dumps to accommodate mined materials, processing of oxide ores and placement
on a heap leach pad, and processing of sulfide ores with placement of tailings in a tails storage facility (TSF). Exploration/development
work continues to add Mineral Resources and Mineral Reserves to extend the mine life and operations at site. These activities and facilities
are carried out on treasury, pasture, and forestry lands, including some private lands.
In addition to the direct impacts on the involved lands, the operations
impact on the surrounding lands and the local communities. Physical impacts may include changes to local surface and groundwater (including
potential pollution), air quality impacts particularly from dust, and increased noise and vibration from mining and processing operations.
Operation of the Çöpler mining and processing facilities,
and subsequent mining at Çakmaktepe, has been investigated and authorised by means of a series of Environmental Impact Assessments
(EIAs), with positive decisions obtained from the Turkish Ministry of Environment, Urbanisation, and Climate Change (MoEUCC). These EIAs
include specific actions designed to address all material impacts of the mining and processing operations. Anagold has remained in compliance
with all aspects of the EIA and operating permits throughout the history of the Project.
The original 2008 EIA for Project, obtained on April 16, 2008, included
three main open pits (Manganese, Marble, and Main zones), five waste rock dumps (WRDs), a heap leach pad, a processing plant, and a TSF.
The 2008 project description involved only the oxide resources.
The Project started its open pit and heap leach operation in 2010 and
first gold was poured in December 2010. Additional EIA investigations have been submitted and approved, as required, to support ongoing
mining and processing operations, including:
| · | EIA permit dated April 10, 2012, for the operation of mobile crushing plant. |
| · | EIA permit dated May 17, 2012, for the capacity expansion involving: |
| · | Increasing operation rate to 23,500 tpd. |
| | 17-1 | |
| SSR Mining Inc. | Çöpler Property S-K 1300 Report | February 12, 2024 SLR Project No.: 138.21581.00006 |
| · | Increasing Çöpler waste rock dump (WRD) footprint area. |
| · | Adding a sulfidization, acidification, recovery, and thickening (SART) plant to the process to decrease the cyanide consumption due
to the high copper content of the ore. |
| · | EIA permit, dated December 24, 2014, for the capacity expansion involving: |
| · | Heap leach area expansion |
| · | EIA permit dated October 7, 2021, for the capacity expansion (the 2021 Çöpler EIA or COP 3) involving: |
| · | Operation of a flotation plant |
| · | EIA permit dated January 26, 2017, for the Çakmaktepe satellite pits expansion. |
| · | EIA permit dated August 9, 2018, for the Çakmaktepe expansion for the newly defined Central pit. |
| · | EIA permit dated March 30, 2022, for the Çakmaktepe second expansion, including the Çakmaktepe Ext starter pit. (the
2022 Çakmaktepe EIA or CAK 2 EIA) |
In addition,
pending EIA processes include an EIA to allow a Çöpler and Greater Çakmaktepe
third capacity increase (CAK 3). In order to do this, an EIA project description file was prepared by SRK and was submitted by
Anagold to the environmental regulatory authority in August 2023. Anagold has since received comments back from the Ministry. Based upon
this feedback, Anagold is developing a combined Çöpler and Greater Çakmaktepe presentation that includes not only CAK
3, but also Çöpler Expansion, which includes the lime quarry, lime plant and increased daily production rates at both sites.
After the EIA positive decisions, additional permits and licenses are
required to be issued by government agencies consistent with the Turkish governing laws and regulations. These include land access permits
(pasture and forestry); environmental permits and licenses; workplace opening and operating permits; and licenses and certificates. The
status of Project permits and operating licenses is listed in Table 3-1.
In the period following the receipt of the 2008 EIA permit, Anagold
has conducted further technical studies to supplement the Turkish EIA studies and to establish plans and procedures to manage potential
project impacts and meet IFC requirements. Significant operational management plans established as a result of these prior and ongoing
studies include:
| · | Non-mining Wastes Management Plan |
| · | Mining Waste Management Plan |
| · | Water Resources Management Plan |
| · | Biodiversity Management Plan |
| | 17-2 | |
| SSR Mining Inc. | Çöpler Property S-K 1300 Report | February 12, 2024 SLR Project No.: 138.21581.00006 |
| · | Air Quality and Emissions Management Plan |
| · | Mine Closure and Rehabilitation Plan |
| · | Environmental Management System Framework |
| · | Environmental Noise and Vibration Management Plan |
| · | Hazardous Substances Management Plan |
| · | Resource Efficiency and Pollution Prevention Management Plan |
| 17.2 | Environmental Studies, Site Information and Management |
The Project site is in a transition region between Central and Eastern
Anatolian climates. The region has a continental climate, where summers are hot and dry, and winters are cold and relatively humid. Owing
to the mountain ranges bordering Erzincan Province on all sides, the region has a milder climate than the neighbouring provinces.
The long-term annual average precipitation for the Project site is 367 mm,
including snow in the winter months. The annual average wind speed is 2.6 m/s. Maximum wind speeds are observed in spring. The prevailing
wind direction is south.
The project site is in a rural area with no significant commercial or
industrial air pollution sources. Scattered slag piles and ore extraction sites remain from the former manganese mining operations.
The ambient air quality monitoring programme on site indicated that
SO2 and NO2 levels, and particulate matter
(PM10) and dust deposition levels in ambient air are well below the limit values defined in Turkish Air Quality Standards. Heavy metal
concentrations in dust were well below the limit values defined by European Commission (EC), World Health Organisation (WHO), and Turkish
standards.
The railway and the İliç-Kemaliye Road passing near the
Euphrates River are the mobile sources of noise in the area. The Euphrates-Karasu River is the largest surface water body near the Project;
it borders the northern edge of the Project area. Peak flow rates are observed in April and May following the snow melt and rainfalls.
All other streams in the vicinity of the Project area are intermittent, flowing between March and June.
The surface water quality within the site was investigated at various
water sampling locations throughout the site. Water quality is classified from class I (very good quality) to class IV (highly polluted,
poor-quality water). Sampling has indicated class IV water quality for Sabırlı and Çöpler creeks, and Karabudak
Stream. Similarly, the Euphrates-Karasu River is classified as a class IV water resource. For all streams, metal concentrations, including
aluminium, iron, copper, and arsenic are high, especially in the drainage from Sabırlı and Çöpler creek catchments.
Elevated metal concentrations in these catchments are attributed to natural metallic enrichment from the surrounding geology.
| | 17-3 | |
| SSR Mining Inc. | Çöpler Property S-K 1300 Report | February 12, 2024 SLR Project No.: 138.21581.00006 |
The prevalent land use and cadastral information for the Project and
its environs is presented in Figure 17-1. The land use patterns are based on maps produced by the General Directorate of Rural Services.
Most of the Project area consists of pastureland, treasury, and forest. The Land Use Capability Classes (LUCC) for the Project area and
environs are given in Figure 17-2.
Under the LUCC system, there are three main categories and eight classes
(ranging between I and VIII).
The first category covers classes I through IV and describes lands which
are suitable for cultivation and animal husbandry. This category has few limitations, except for class IV, which requires very careful
management because of its greater limitations.
The second category covers classes V through VII, which are unsuitable
for cultivation, but which can support perennial plants when intensive conservation and development practices are applied. Under controlled
conditions, this land may also support grazing and forestry. The soil type included in class VII has severe limitations, preventing the
growth of cultivated plants due to characteristics such as the formation of steep slopes (which are exposed to medium to severe erosion)
and shallow soil layers, possessing stony, salty, and sodic texture. As such their utilisation for agricultural purposes is very limited.
The third category contains only the class VIII, which is suitable only
for wildlife, sports, and tourism-related activities.
As shown in Figure 17-2, the Project area has VI, VII, and VIII
classes of LUCC. The land use types in the Project area and its vicinity are listed:
| · | Degraded forest lands and coppice |
The Project area and surroundings are generally of low-land use capability
and not suitable for sustainable agricultural activities. Although the agricultural activities are limited in the area, there are several
small gardens which belong to the local villagers.
The forests in the area are under stress due to high grazing and illegal
land use practices; pasture lands are used for the purpose of grazing, but it is illegal to use forestry lands for grazing. In general,
the local soil has poor fertility due to its nature and elevation such that it only supports limited species of vegetation.
| | 17-4 | |
| SSR Mining Inc. | Çöpler Property S-K 1300 Report | February 12, 2024 SLR Project No.: 138.21581.00006 |
Figure 17-1: Current Land Use
Types and Cadastral Map
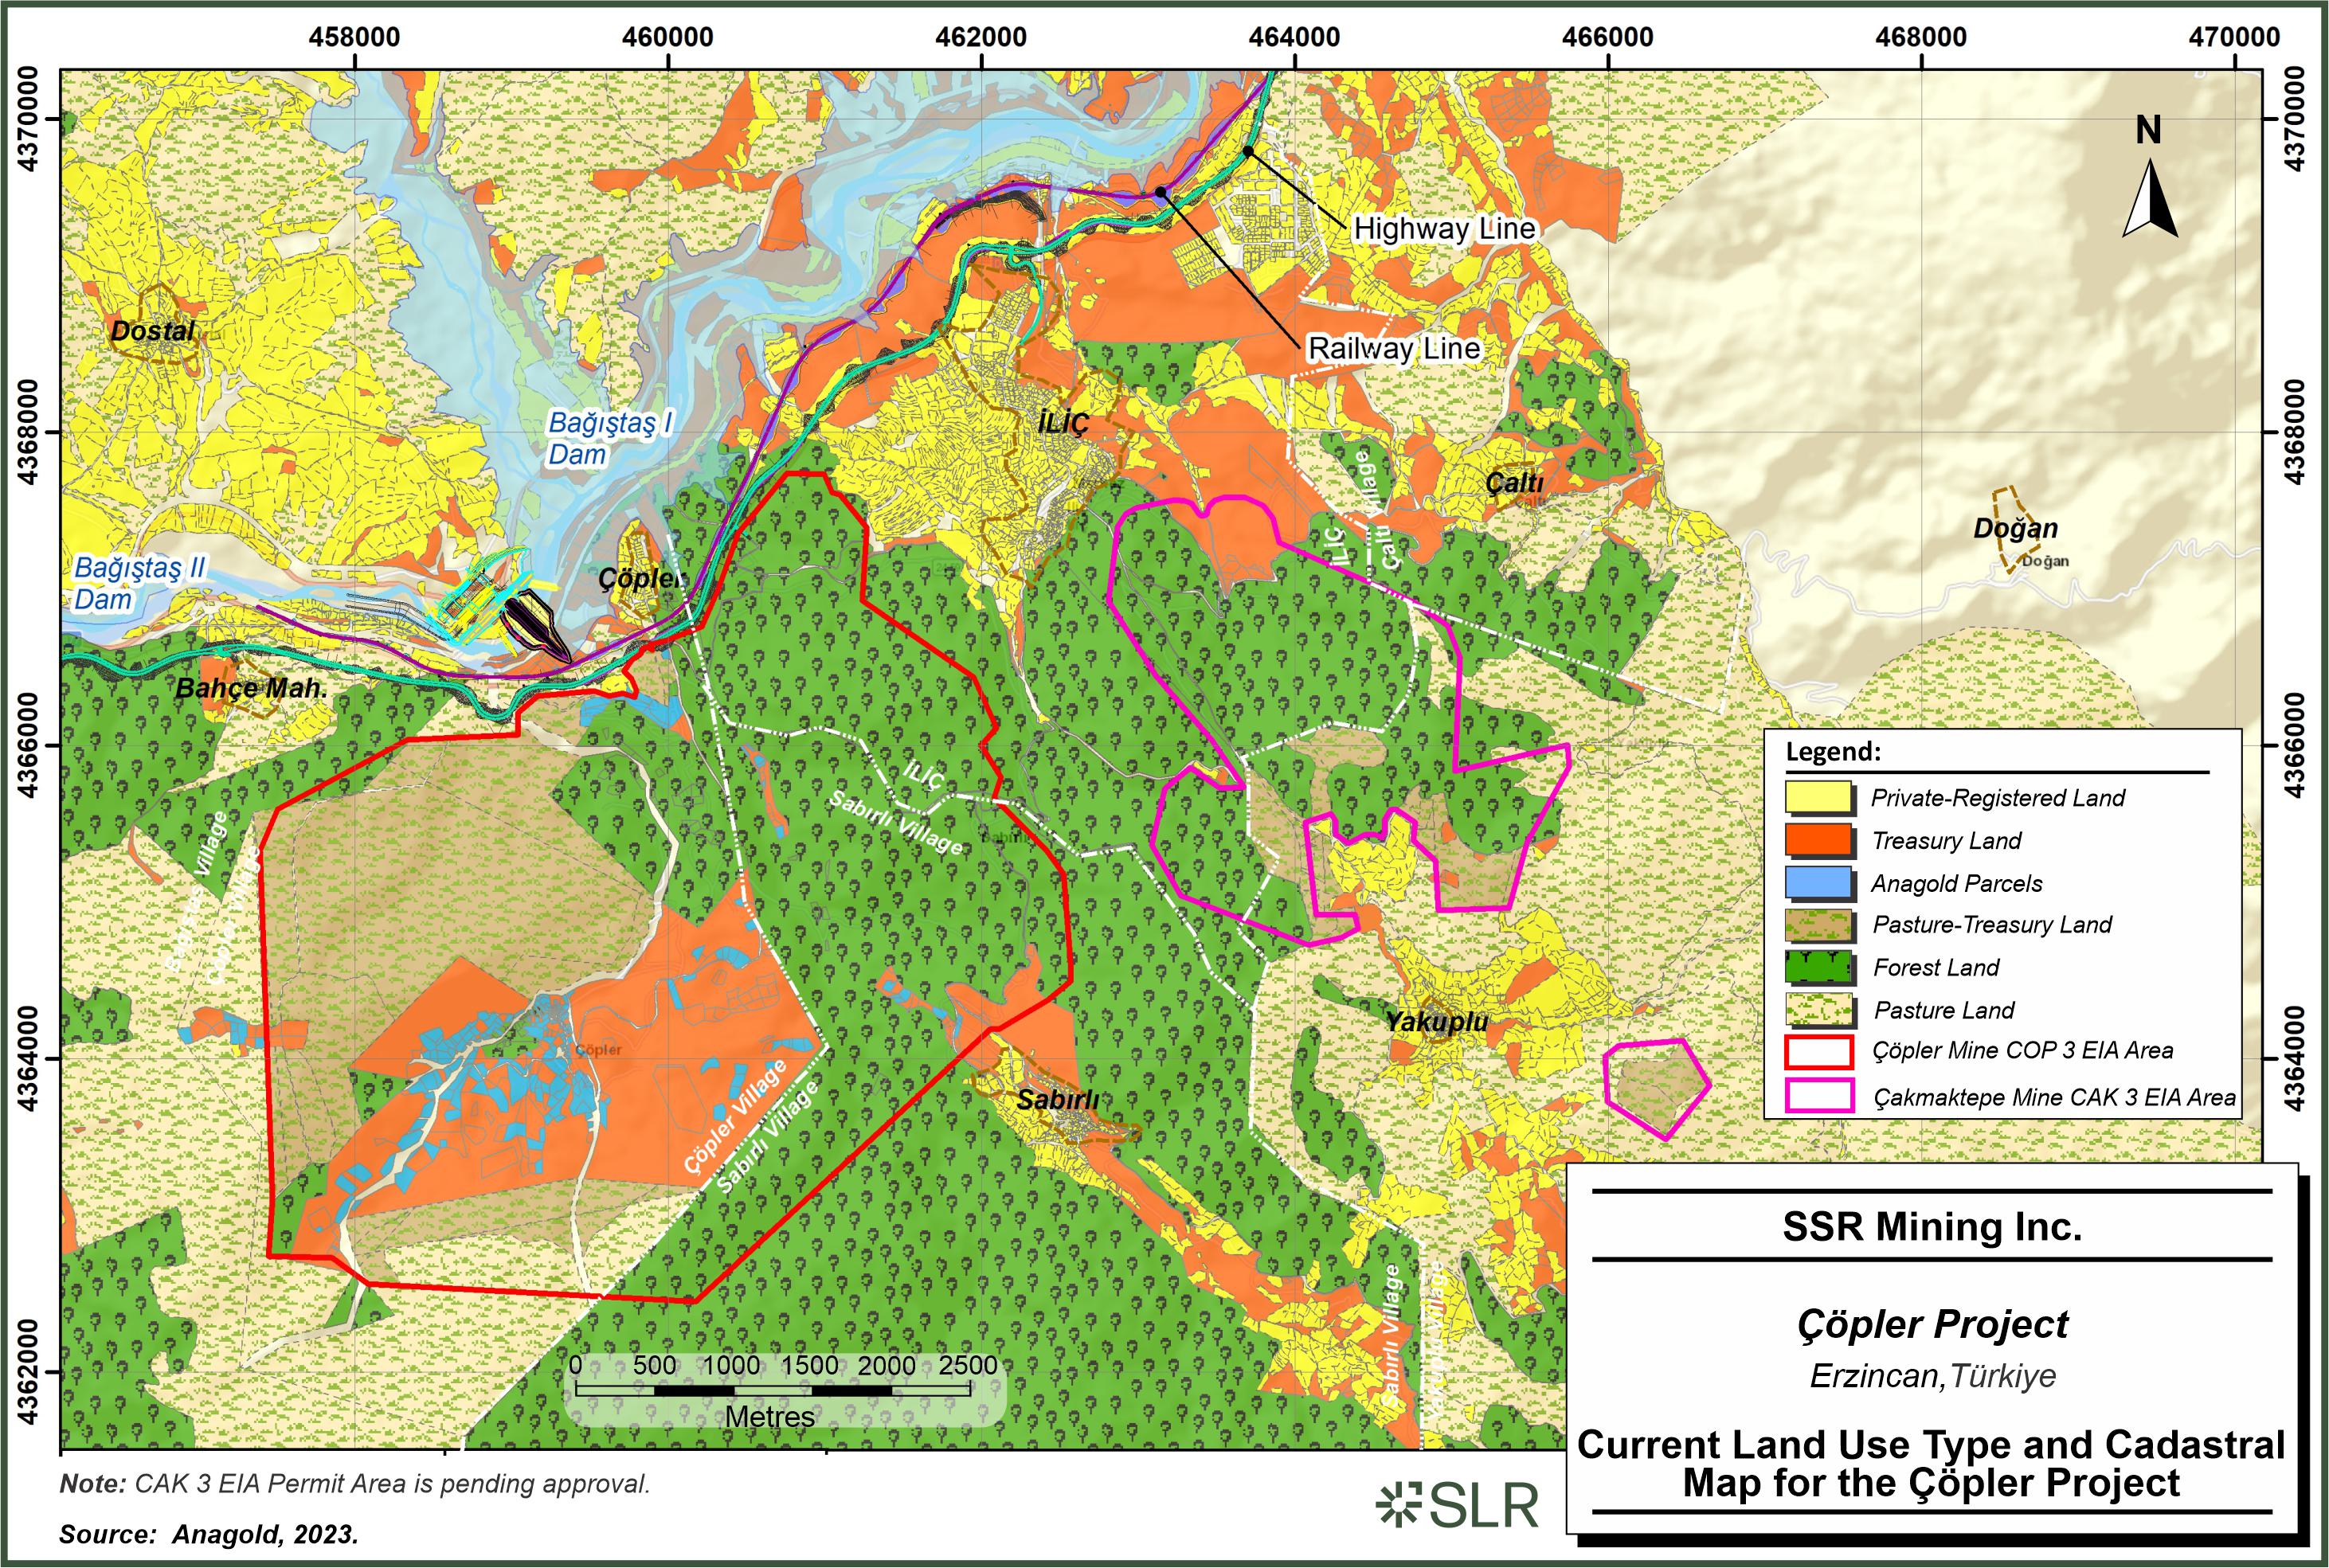
SSR
Mining Inc. Copler Project Erzincan, Turkiye Current Land Use Type and Cadastral Map for the Copler Project
| | 17-5 | |
| SSR Mining Inc. | Çöpler Property S-K 1300 Report | February 12, 2024 SLR Project No.: 138.21581.00006 |
Figure 17-2: Land Use Capability
Classes
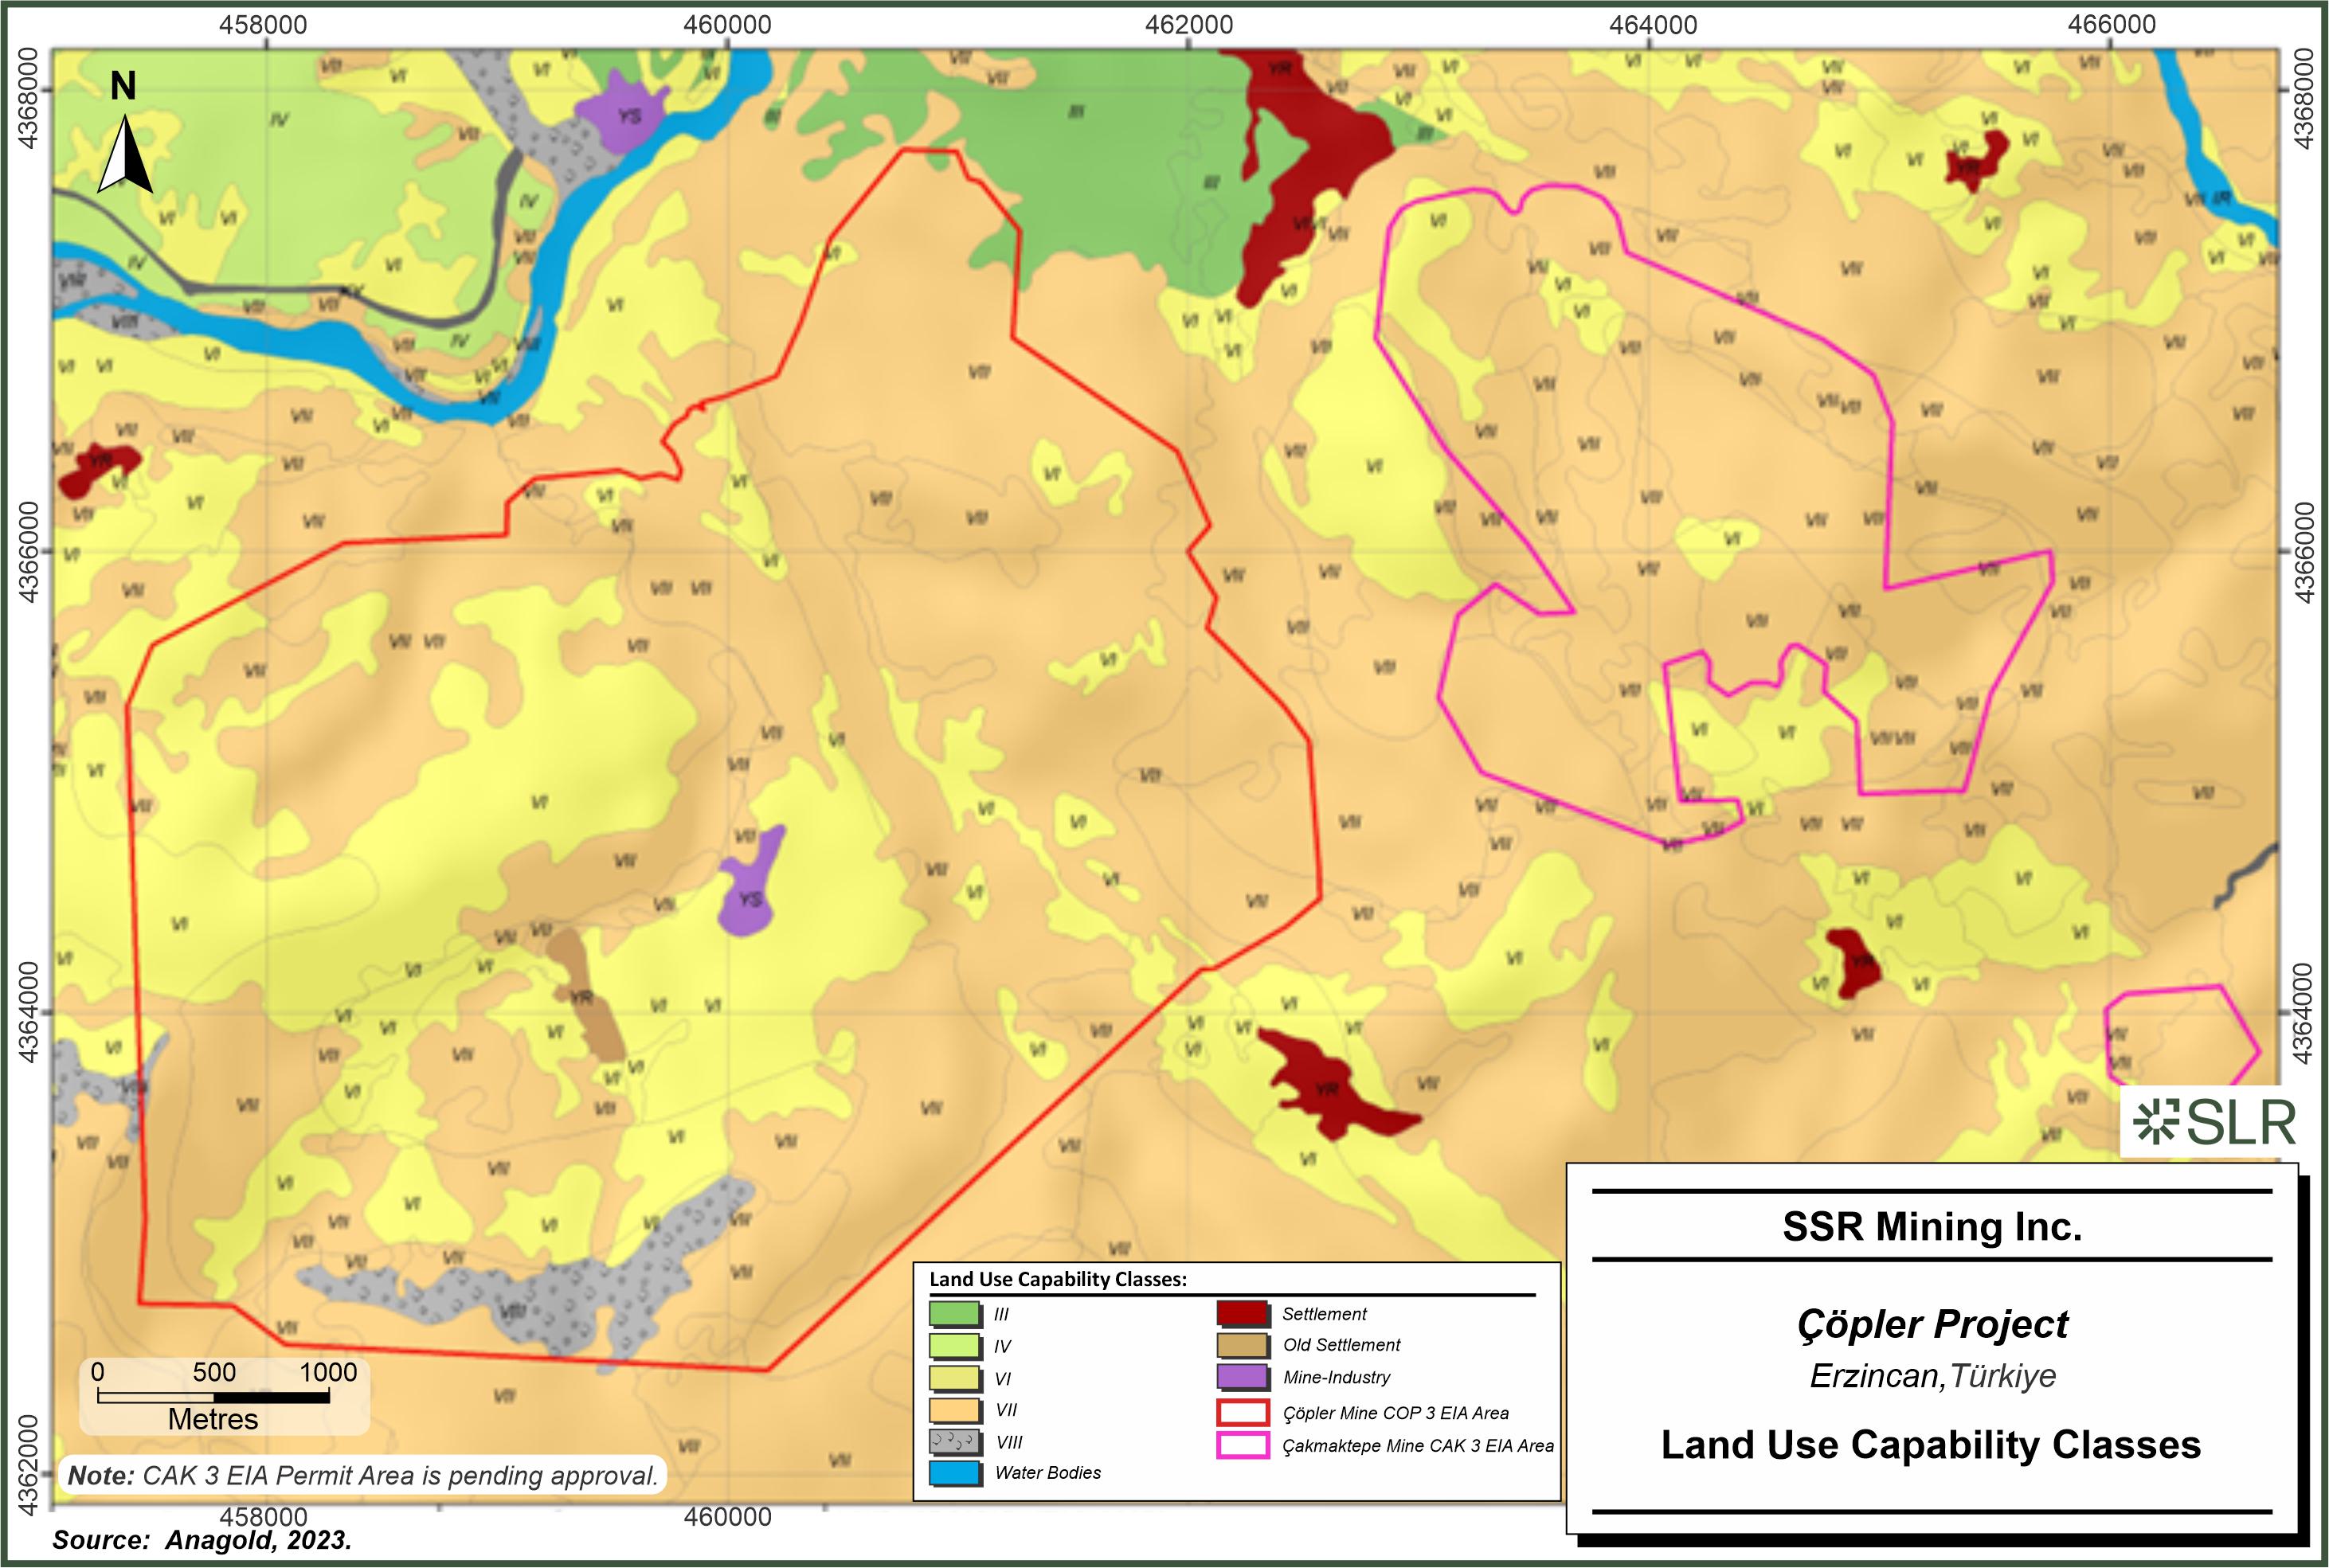
SSR
Mining Inc. Copler Project Erzincan, Turkiye Land Use Capability Classes
| | 17-6 | |
| SSR Mining Inc. | Çöpler Property S-K 1300 Report | February 12, 2024 SLR Project No.: 138.21581.00006 |
| 17.2.3 | Biological Features |
Floral species from the Irano-Turanian and Mediterranean phytogeographic
regions are dominantly observed at the site. Most of the flora species are identified in the dry meadow habitats in the Project area.
Ruderal habitat (such as roadsides etc.) and rocky areas follow dry meadow habitats with respect to the floristic species diversity.
Flora and fauna surveys were conducted in the framework of the environmental
baseline studies conducted between 2005 and 2007 by specialists from Hacettepe University. Biodiversity of the site has been updated by
the specialists from Gazi University and Hacettepe University via three seasonal surveys conducted during 2011 and 2012. A Biodiversity
Action Plan (BAP) was prepared, and a BAP Report was provided as an appendix of the Environmental and Social Impact Assessment (ESIA)
Report for the Sulfide Expansion Project. The flora species were classified according to their thread status with respect to Turkish Red
Data Book of Plants and the International Union for Conservation of Nature (IUCN) and European Red List (ERL) Categories and Criteria.
There are four main vegetation types in the area namely: Quercus
petraea subsp. pinnatiloba; Quercus libani and Quercus brantii forests; Irano-Anatolian steppe vegetation; and wooded
steppes and rock habitat, while the rest of the site is designated for main mining activities. The faunal composition of the site is considered
weak.
| 17.3 | Environmental Management |
Anagold’s commitment to responsible environmental management is
set out in the Environmental Policy, which complies with in-country legislation, the IFC Performance Standards, and the Equator Principles.
The Çöpler Environmental Management System (EMS) is certified to the international ISO 14001: 2015 standard. The latest ISO
14001: 2015 external audit was completed successfully in December 2019. A new updated audit is expected to be completed by the end of
2023.
The Project is in a high desert region in Eastern Türkiye near
the culturally significant Euphrates River. All water used at Çöpler is governed by strict permitting rules regarding withdrawal(s)
and discharge under Turkish regulations. The approach to water management is to use water as efficiently as possible and to only draw
as much needed and allowed within permitted limits. All extracted water is groundwater. Water used on site is recycled and re-used in
the process plant. Water is not discharged to the environment.
| 17.3.2 | Energy and Climate Change |
All the electricity used by the Project is drawn from the Turkish national
grid. Approximately 41% of Türkiye’s national grid capacity comes from hydropower stations. The treatment of sulfide ore requires
a more energy and CO2 intensive process than the oxide ore process that was previously
the only ore treated at the Project. Anagold plans to use 2019 as the baseline year for electricity use (269 GWh) and efficiency,
and to set electricity usage and greenhouse gas (GHG) targets, accordingly. The greenhouse gas emissions are published in the Anagold
Sustainability Report.
| | 17-7 | |
| SSR Mining Inc. | Çöpler Property S-K 1300 Report | February 12, 2024 SLR Project No.: 138.21581.00006 |
| 17.3.3 | Tailings Dam Management |
Tailings produced by the Project are classified as class II non-hazardous.
All tailings are sent to a carefully engineered TSF. Anagold has procedures in place to ensure that all parts of the TSF life cycle from
construction to closure align with international best practice standards.
The TSF at the Project is a downstream mass filled dam. It became fully
operational during the final quarter of 2018 with the start-up of the sulfide plant. The technical specifications for the construction
of the Project TSF conforms with both Turkish national requirements and accepted good practice standards for tailings facilities, including:
| · | Canadian Dam Association Safety Guidelines |
| · | ICOLD (International Commission on Large Dams) Bulletins |
| · | Turkish Hydraulic Works’ Technical Codes |
| · | Mining Association of Canada (MAC) Guide to the Management of Tailings Facilities. |
The TSF has been designed to withstand significant earthquakes up to
a magnitude of 7.5 on the Richter scale. Modelling showed that even in the most severe seismic event, the wall of the TSF will heave with
minimal risk of altering facility location or strength. There are no communities living directly downstream of the TSF.
The Project uses a combination of technology, regular inspections, and
external oversight and audits to monitor the TSF (Section 15.9.1.2).
In addition to stability designs and monitoring, Anagold also has three
groundwater monitoring wells in place both above and below the TSF, to monitor for signs of groundwater contamination. It was designed
to meet the best-in-class requirements for class I (hazardous) waste, even though all tailings are classified as class-II (non-hazardous).
The process of removing ore from the ground and extracting gold creates
significant non-hazardous and some hazardous waste, which must be appropriately dealt with over the long- and short-term. Ensuring all
waste is responsibly dealt with is crucial to protecting the health of the local environment and neighbouring communities.
To ensure that all waste, whether hazardous or non-hazardous, is reduced
and dealt with in a safe and responsible manner, the Project has a detailed and comprehensive Waste Management Plan. This is underpinned
by the goal to reduce the amount of waste generated and to maximise the proportion of waste sent for recycling.
The bulk of the waste created at the Project is waste rock. All the
waste rock created by the Project is carefully disposed of in engineered waste rock dumps. The design and management of all waste rock
dumps is overseen by geotechnical engineers to ensure they have safe slope angles, maximum structural stability and management of any
potentially acid forming materials are conducted appropriately by mine operations and thus meet the requirements of Turkish national regulations,
industrial best practices and the IFC Performance Standards.
The use of cyanide is a critical part of the gold mining process. However,
if not handled correctly, cyanide can have significant impacts on both environmental and human health. The use of cyanide at the Project
is governed both by the requirements of Turkish national laws and regulations and aligned with industrial best practice. SSR became a
signatory to the International Cyanide Management Code on January 23, 2023, which will require certification within three years of signing.
All employees and contractors who handle, transport, or dispose of cyanide are required to undertake specialized training in cyanide handling.
| | 17-8 | |
| SSR Mining Inc. | Çöpler Property S-K 1300 Report | February 12, 2024 SLR Project No.: 138.21581.00006 |
The size, scale, and location of mining operations means they can have
a negative impact on local biodiversity. Failure to manage these risks and minimise the impacts on biodiversity could affect the social
licence to operate and reputation. The Anagold aim is to restore sites (both operational and exploratory) and repair any damage done to
the extent practicable. To do this, detailed records of the full range of biodiversity present are a part of feasibility studies of any
project or expansion. These studies form the basis for a Biodiversity Action Plan (BAP). The BAP sets out how impacted ecosystems are
to be restored to their original state (or as close as possible) at the time of closure. The Project, including the TSF and exploration
prospects, have Biodiversity Action Plans in place. Anagold also conducts biodiversity monitoring studies each quarter with experts from
Gazi and Hacettepe Universities.
There is a potential for dust to be generated across many parts of the
operation, including blasting, crushing, and milling, and the movement of large vehicles on haul roads. Dust management is a key focus
across all facets of the operation. Air quality and the presence of dust is an important factor for local communities and workers. Ensuring
management air quality for workers and communities is an important part of environmental management. Anagold has put in place a dust management
plan at the Project to minimise the levels of dust in the air and ensure they fall within Turkish and IFC guideline limits. There are
several monitoring stations across site and in the local communities. These stations record levels of airborne particulate matter and
dust fall out. The results from the monitoring stations are reported to the relevant national authorities, and to local communities.
Anagold is currently modeling the air quality impact(s) of increasing
operational throughput from 70 ktpd to 100 ktpd and the potential impact(s) to support future permitting.
The most recent integrated regulatory environmental audit was performed
in June 2023 by the Erzincan Provincial Environmental Directorate and it is reported that no issues were reported with this official audit.
No notice(s) of violation or fines were issued as of the writing of this Report.
Mine rehabilitation and closure obligations are prepared and updated
annually for the Project. Scheduling and costing of the closure tasks are made in accordance with the Anagold mine plan.
Cost estimates rely on data from mine operations including labour and
equipment rates, material costs, groundwater well inventories, and electronic topography data.
Closure costs are estimated using the Standardised Reclamation Cost
Estimator (SRCE) Model developed by SRK Consultants. The SRCE is an industry standard tool developed to facilitate accuracy, completeness,
and consistency in the calculation of costs for mine site reclamation.
SRCE uses lengths, areas, volumes, flow rates, quantities, etc., provided
or estimated by the user (based on the reclamation or closure actions). Some actions require crews and fleets with productivities either
provided by the SRCE default settings or those provided by Anagold to estimate the time it takes to perform the work. Where available,
these times are then multiplied by labour and equipment rates provided by Anagold.
| | 17-9 | |
| SSR Mining Inc. | Çöpler Property S-K 1300 Report | February 12, 2024 SLR Project No.: 138.21581.00006 |
The Heap Leach Draindown Estimator (HLDE) model is another industry
standard tool used for estimating heap leach pad draindown curves for reclamation bonding purposes. The HLDE inputs are derived from site-specific
data.
| 17.4.1 | Closure Cost Estimate Assumptions – Waste Rock Dumps |
All slopes on the WRDs will be regraded to 2.5H:1V to prepare them for
covering, scarification, and revegetation. The sequence of costs in the schedule corresponds to the assumption that reclamation will occur
as soon as each WRD reaches final configuration.
Anagold plans to encapsulate all potentially acid-generating (PAG) waste
rock within the WRDs as part of mining operations, leaving no PAG material on the surface or outer portions of the WRDs at closure. Therefore,
although some PAG cells are currently exposed, costs for construction of a buffer layer encapsulating PAG waste rock are accounted under
operational costs and no additional costs for mitigation of current configurations are included in the ARO estimates.
Per the EIA Report, waste rock management will be carried out to allow
for the construction of a buffer layer to prevent degradation of seepage and these costs are accounted under operational costs. The seepage
collection ponds active during the operations period will be reclaimed during closure. Seepage from the WRDs will not be monitored during
closure and post-closure.
| 17.4.2 | Closure Cost Estimate Assumptions – Pits |
Berms will be constructed around the perimeter of the pit to discourage
public access. There are no other physical reclamation measures assumed for the pit walls.
Rapid refilling of the pits with water is the preferred method for the
western part of the pit. Costs for pit refilling by pumping flow of 66 litres per second (L/s) for four years are included in the ARO
estimates.
Some PAG rock will remain exposed in the pit walls after formation of
a pit lake; therefore, some reclamation work will be necessary to address the requirement (legal obligation) to cover remaining PAG materials
exposed in the pit after mining ceases.
It is assumed that areas within the pit where PAG materials are exposed
will be covered with one metre of non-PAG (or non-acid-generating – NAG) material. The PAG materials exposed within the pit walls
are assumed to be located on gentle or nearly flat slopes. Additional measures (e.g., reduction of pit wall slopes in exposed PAG
areas to facilitate cover placement) are not taken into consideration at this time. No PAG cover will be required below the final pit
lake elevation.
All slopes on the heap leach pads will be regraded to 2.5H:1V or flatter
to establish a geotechnically stable closure configuration. Following regrading, the areas will be covered, scarified, and revegetated.
The ARO estimates reflect the requirement per the EIA report that identifies two to three metres of cover placement on the heap leach
pad followed by growth medium placement after the reduction of heap and pond fluid inventory.
| | 17-10 | |
| SSR Mining Inc. | Çöpler Property S-K 1300 Report | February 12, 2024 SLR Project No.: 138.21581.00006 |
Although not a requirement in the EIA plan, there is a provision for
extending half of the heap leach pad perimeter liner to contain heap material regraded beyond the existing liner during reclamation.
East and west buttresses are considered part of the heap leach pad area.
The physical reclamation of this area by growth media placement and revegetation is included as a WRD.
The 2014 EIA discusses rinsing of the heap with fresh water with no
subsequent fluid management. Rinsing of heap leach pads has been shown to be typically unnecessary and potentially detrimental to long-term
chemical stability of gold heap leach.
Per the approach of the HLDE model mentioned above, heap drain-down
will be initially managed for inventory reduction via recirculation and active evaporation, followed by active evaporation only. Active
evaporation will continue until drain-down flows are reduced to a rate amenable to management with passive evaporation.
Following active solution management, when the heap drain-down flow
rate decreases to a level where it can be managed exclusively within available emergency and process pond via passive evaporation, the
two ponds will be converted to evapotranspiration (ET) cells. To convert process ponds to ET-cells, the ponds will require relining followed
by backfilling with select material and revegetation.
Conversion costs are calculated based on experience from multiple Nevada
sites.
In scheduling costs, the cost of construction of ET-cells is included
at a time when drain-down rates reach a level that will allow fluid to be managed through the evapo-transpirative capacity of ET-cells.
| 17.4.4 | Tailings Storage Facility |
Anagold submitted an EIA in 2014 that included TSF 1 and TSF 2. The
current designs for TSF 1 and TSF 2 are within the 2014 EIA boundaries, except for a small portion of TSF 1 phase 7.
TSF 1 phase 4 has been constructed and approved for use in October 2023 by the MoEUCC. The current mine plan only requires construction
of TSF 1. Long-term management costs are included in the estimate and proportioned for the size of the TSF construction.
Reclamation of the life-of-mine (LOM) TSF includes the following actions:
| · | Reclamation of the TSF surface by placing a traffic layer and growth media followed by revegetation. |
| · | Reclamation of the final TSF embankment. |
| · | Fluid management including managing drainage from the TSF and removal of water ponding on the TSF surface due to consolidation of
the tailings. |
The estimate includes costs for placement of a traffic layer over the
tailings material in addition to the growth media layer. The starter embankment is built at 1.5H:1V with the final embankment at 2.0H:1V.
The costs of placing 1 m cover over the embankment are also included.
Costs are included for tailings fluid management crews, pumping for
recirculation and forced evaporation, as well as removal of the supernatant in the period soon after the TSF operations end.
| | 17-11 | |
| SSR Mining Inc. | Çöpler Property S-K 1300 Report | February 12, 2024 SLR Project No.: 138.21581.00006 |
SRCE estimates costs to demolish buildings using productivities in conjunction
with building volumes, wall areas, and slab volumes. Decontamination costs are included in the estimate for a decontamination crew to
pressure-wash the plant site over a nominal number of weeks.
Production wells are assumed to be closed at the end of operation of
the sulfide plant and monitoring wells are assumed to be abandoned at the end of the post-closure monitoring period.
The water quality and flow monitoring schedule during the operation,
closure and post-closure monitoring period includes numbers of samples, frequencies, and durations for each closure phase. The monitoring
locations include the groundwater monitoring wells around the heaps, WRDs, TSF and springs as well as pit lake water quality once the
rapid filling begins.
Closure planning costs are typical industry costs for development of
closure plans and studies, reporting and preparation of closure designs and engineering.
| 17.4.5.3 | Construction Management |
Construction management costs include one supervisor during active reclamation.
Costs are included for road maintenance, which will be carried out with a water truck and grader during active reclamation.
Closure personnel include a closure general manager, environmental manager,
environmental technician, security, and surveyor for whom terminal benefits are included. Under the LOM schedule, the closure general
manager would be present during the years of active reclamation and closure. Camp costs are included under general and administration
costs.
For solution management, the cost of the heap drain-down management
crew is assumed to be shared with those of the TSF.
Closure is scheduled separately for the oxide and sulfide projects according
to the mine plan and is consistent with the long-term management obligations expected for the TSF.
Heap drain-down management starts at the end of heap leaching operations
in the mine plan. Ore will be sent to the leach pad until the end-of-2030, although it has been at a reduced rate since 2020. Management
and reclamation on the heap will take place while other components of the Çöpler sulfide project continue to operate, with
the active closure period starting after the end of deposition in the TSF.
| 17.4.6 | Closure Cost Estimates |
The annual Asset Retirement Obligation (ARO) reports for EOY 2022 and
EOY 2023 have been completed. Current estimates for the close of 2023 are US$69.1 million. These amounts are updated annually using the
SRCE Model which uses a unit cost approach and categorizes direct cost estimates into seven elements, representing different property
closure aspects. These seven elements are: 1) Earthwork/Contouring, 2) Revegetation/Stabilization, 3) Detoxification/Water Treatment/Disposal
of Wastes, 4) Structure, Equipment, and Facility Removal, 5) Monitoring, 6) Construction Management and Support, and 7) Closure planning,
G&A, Human Resources. The total reclamation cost is the sum of these seven elements (direct costs) plus the indirect costs (a percentage
of the direct costs).
| | 17-12 | |
| SSR Mining Inc. | Çöpler Property S-K 1300 Report | February 12, 2024 SLR Project No.: 138.21581.00006 |
The life of mine closure cost has been estimated in the economic analysis
at $100 million with some estimates ranging up to approximately $114 million.
No financial assurance is required to guarantee that reclamation/closure
will occur; however, Anagold does pay a fee to the government based upon disturbance that can be used for reclamation should reclamation
not occur. The amount collected to date is no where close to equaling the total closure estimated amount.
| 17.5 | Social and Community Plans |
The EIA studies are conducted according to the format stipulated by
the Turkish EIA Regulation. The scope of the Turkish EIA studies differs from the scope of international ESIA studies (as established
by the International Finance Corporation’s (IFC)’s Environmental and Social Performance Standards), especially in terms of
social impacts and public disclosure processes. While the social impact assessment and public disclosure processes are also parts of the
Turkish EIA studies, they are treated less rigorously than in IFC standards.
Anagold has conducted further investigations to supplement the Turkish
EIA studies, initially to support the original project establishment and, then subsequently, to monitor the social and community attitudes
and the impacts of ongoing mining operations on the adjacent communities. The fundamental data to assess social impact is derived from
direct survey of the local community members in villages impacted by the mining operation. Significant (primary) surveys have included:
| · | Initial survey of 51 households in three villages (Sabırlı, Bağıştaş, and Dostal) presented collectively
as part of the 2009 Çöpler Gold Project Social Impact Assessment (SIA) by KORA. |
| · | Survey of 153 households in six villages (Çöpler, Bağıştaş, Bahcecik, Dostal, Yakuplu, and Sabırlı)
presented individually performed by Middle East Technical University (January 2013). |
| · | Survey of six villages performed by UDA Consulting (December 2014). |
| · | Survey by TANDANS Company (2017). |
| · | Çöpler Mine Phase 2 SIA Peer Review Report by Intersocial Company. |
| · | Çakmaktepe 2nd Expansion Project SIA Works by SRK (2021-2022). |
| · | Survey by TANDANS Company (Ongoing). |
| · | Çakmaktepe 3rd Expansion Project SIA Works by SRM Consulting (ongoing) |
Anagold has considered the outcomes from the community surveys and SIA
assessments as a key input to establish and monitor the social action plans associated with the Project. These are also the basis to develop
a strategic and planned approach to community investment and development programmes. Some significant social and community plans and policies
developed as a result of these investigations address the following:
| | 17-13 | |
| SSR Mining Inc. | Çöpler Property S-K 1300 Report | February 12, 2024 SLR Project No.: 138.21581.00006 |
| · | Community health and safety |
| · | Community development fund (SKF) |
| · | Stakeholder engagement and community relations |
| · | Environmental and social sustainability |
| · | Land access and resettlement |
The performance and effectiveness of social and community plans are
monitored, reviewed, and updated, as required, to meet changing community needs and expectations.
| 17.5.1 | Social and Sustainability |
Anagold aims to provide sustainability governance that not only meet
or exceed the requirements of Turkish legislation, but also align with the expectations of ICMM (International Council of Mining &
Metals) guidance and International Finance Corporation (IFC) Performance Standards, and the World Gold Council. The Anagold approach to
policy development is to identify the most stringent standards and integrate them into project policy.
Çöpler project policies are supplemented by site-specific
environmental and safety standards, management plans and procedures that are specifically tailored to the unique environmental and social
challenges and permitting regulations of the site. These plans are certified to the requirements of international standards including
ISO14001: 2015 and ISO45001.
Anagold maintains annual sustainability reporting for the Project, the
report is produced to be in accordance with GRI Standards. The 2022 Sustainability Report has been completed and is publicly available.
The 2023 Sustainability Report is currently under development.
Anagold has a dedicated Environmental, Health, Safety and Sustainability
(EHS&S) Committee. The EHS&S Committee oversees, monitors, and reviews practice and performance in areas of safety, health, stakeholder
relationships, environmental management, and other sustainability issues.
Sustainability is also a key responsibility for group level executives
and site teams. The approach to sustainability is underpinned by the principle of collective responsibility and a belief that every employee
must contribute to our sustainability performance – particularly on issues of health and safety and reporting of incidents.
| 17.5.2 | Stakeholder Engagement |
At the Çöpler project, Anagold has a wide-ranging stakeholder
engagement programme which sets out the ways in which Anagold engages with stakeholders and ensures regular communication with stakeholder
groups.
| | 17-14 | |
| SSR Mining Inc. | Çöpler Property S-K 1300 Report | February 12, 2024 SLR Project No.: 138.21581.00006 |
Stakeholder consultations included meetings with shareholders, analysts,
local communities, local and national authorities, contractors, government representatives, NGOs, universities, political parties, and
trade union officials. Some of the key topics discussed included the Mine Expansion Project, Social Development Fund, exploration activities,
cyanide and environmental awareness, local procurement, local contracting opportunities, training, and job creation.
The grievance mechanism is an important part of the Anagold local stakeholder
engagement programme and the overall governance of sustainability. The community grievance mechanism has been developed to meet the requirements
of both Turkish regulations and the IFC Performance Standards. The mechanism is designed to be widely accessible and there are access
points available throughout each of the affected communities. There is also a dedicated access point for suppliers.
Health and Safety Policy is guided by two key goals. First, to eliminate
fatalities and serious injuries from our operations, and second, to continually reduce the number of minor injuries occurring on site.
To fulfill these goals on the ground we implement:
| · | Robust systems and plans |
| · | Risk assessment and controls |
Anagold measures safety performance by tracking a range of leading and
lagging safety indicators, the safety statistics reported also include exploration activities. All significant incidents are investigated
and, based on findings, corrective action plans are developed to prevent recurrence.
| 17.5.4 | Training and Development |
The approach to the development of people is to strategically and continuously
invest in staff training to ensure the business and operational needs both now and in the future are met. The development opportunities
provided include technical skill development, leadership and business literacy skills, procedures and standards, and career development
for staff. Çöpler has a specialized training centre with a capacity of 150 trainees.
Anagold carries out training and capability development programmes for
our neighbouring community. Training is directed to future roles with the Project, while other training is focused on general skills development
to enable people to seek gainful employment in other industries and locations throughout Türkiye. This will help to broaden the economy
and skills base in the Iliç District.
| 17.5.5 | Industrial Relations |
The workforce has no restrictions on union representation. Approximately
60% of the workforce at the Çöpler project are union members and have collective agreements in place. There have been no instances
of industrial action.
| 17.5.6 | Diversity and Inclusion |
Anagold does not set diversity or gender quotas for the workforce. Personnel
are appointed based on merit and have specific objectives in place to ensure that the candidate pools for any position available throughout
the company are made up of a range of qualified and diverse candidates. Women are paid equal with men in similar positions. The Anagold
Diversity Policy commits the Project to provide:
| | 17-15 | |
| SSR Mining Inc. | Çöpler Property S-K 1300 Report | February 12, 2024 SLR Project No.: 138.21581.00006 |
| · | An environment in which all employees are treated with fairness and respect; and |
| · | Equal access to opportunities, regardless of race, gender, sexual orientation and/or religious beliefs. |
The approach to recruitment is to first look to local communities with
appropriate skills. If unsuccessful, this is followed by recruiting from the wider region, followed by nationally, before finally looking
internationally. The Anagold commitment to employing and developing local and national workers is reflected by the targets set for the
Çöpler project:
| · | 90% of unskilled workers to be drawn from communities impacted and affected by Anagold operations. |
| · | 80% of semi-skilled workers to be drawn from impacted and affected communities. |
| · | 80% of skilled workers to be Turkish citizens. |
Suppliers are also encouraged to employ local workers whenever possible.
Local supply chains are preferred. Where supplier skills are lacking,
Anagold works with the suppliers to build capacity by providing training and mentoring.
| 17.5.7 | Sustainable Community Development |
To promote economic development in the communities neighbouring the
Çöpler mine a Social Development Fund (SDF) was established in 2018. The SDF provides a structure under which Anagold will
work in partnership with communities neighbouring the Çöpler mine, applicable Government agencies, third-party development
partners and other relevant stakeholders, with the objectives of:
| · | Ensuring Anagold’s SDF funding of community programs and projects is managed and distributed in a fair, transparent, and equitable
manner. |
| · | Building capacity within the local communities to participate in the benefits afforded by the mine and related regional economic and
social development more actively. |
| · | Moving away from donations type community relations expenditure by developing sustainable projects and programs which address agreed
social and community development priorities in the areas of agriculture, health, education, non-mine related income generation, and empowerment
of underrepresented and disadvantaged groups. |
| · | Where appropriate, reviving and promoting traditional customs and practices. |
| · | Promoting independence from Anagold operations and assisting the communities to prepare for life beyond mining. |
| · | Where appropriate, community relations expenditure by developing sustainable projects and programs which address agreed social and
community development priorities and/or benefit of public such as infrastructure, renovation, sponsorship, and construction. |
Anagold will work with the community and other development partners
in a manner that reflects the core values and principles of the SDF which include:
| | 17-16 | |
| SSR Mining Inc. | Çöpler Property S-K 1300 Report | February 12, 2024 SLR Project No.: 138.21581.00006 |
| · | Fairness and Equality – Impartial administration of the SDF, with all sectors of the SDF communities treated equally. |
| · | Transparency – Clear, publicly available processes for how the SDF is managed, and timely and fulsome reporting of decisions
that are made, including financial reporting. Everyone has access to the same information. |
| · | Cooperation and Partnership – Anagold working with the Community to focus on agreed development priorities. The SDF will not
initiate programs that are not requested by the community and in which the community does not have active and meaningful participation. |
| · | Mutual respect – Everyone has a right to be heard and their opinion considered. |
| · | Sustainability – Focusing on what counts over the long term and preparing for life beyond mine closure. |
| · | At all times being fully compliant with relevant Turkish and International laws and conventions, and Anagold corporate policies and
commitments. |
While recipients of the SDF expenditure are the communities neighbouring
the Çöpler mine, Anagold will retain ownership and governance control over all aspects of Anagold’s financial and in-kind
contributions to the SDF. Anagold’s contribution to the SDF includes direct financial support, managerial/administrative support,
and limited technical support.
Direct financial support has been approved by Anagold’s partners
(SSR and Lidya) for ongoing annual funding to the SDF of $2 per ounce of gold produced from the Çöpler orebody. The SDF will
replace a substantial proportion of Anagold’s existing discretionary community expenditure and direct funding towards development
proprieties which are agreed with the community. The continuation of Anagold’s support to the SDF is at Anagold’s discretion,
and will be influenced by, among other things, the success of the SDF and the community’s participation in ensuring the objectives
of the SDF are achieved.
Managerial and administration support will be provided to the recipients
of the SDF and Anagold’s policies, procedures, and management plans. Anagold will also cover the costs associated with stakeholder
communication and consultation during the roll-out of the SDF, including support for the first three years in establishing a helpdesk
facility for SDF applicants to receive assistance in preparing their applications.
While support to the SDF applicants on how to apply and administer their
applications and projects will be available through a dedicated SDF helpdesk, where appropriate, and where relevant skills exist within
the Company (and timing permits), Anagold will also support the SDF applicants with limited ad-hoc technical support as projects are being
developed, and during the implementation phase. However, where a project requires specific and ongoing technical support, project applicants
must ensure this is identified and resourced appropriately using third-party technical resources.
| | 17-17 | |
| SSR Mining Inc. | Çöpler Property S-K 1300 Report | February 12, 2024 SLR Project No.: 138.21581.00006 |
Anagold’s intensions for the SDF initiative are based on goodwill
and respect for its neighbouring communities, however, Anagold acknowledges that other individuals, organisations, and government agencies
may be more skilled and adept at identifying and implementing social and community development programmes and projects. As such it is
Anagold’s desire that the SDF be implemented in such a way that third parties are attracted to participate in supporting community-based
SDF initiatives. In this way, the SDF can realise a greater funding base as well as attract leading skills in social and community development
programme implementation. Third-party partners can include organisations providing development support or financial support including
Government agencies, NGOs, or other credible development organisations. The SDF will not be used to fund third-party projects outside
the approved SDF catchment area. Where a third-party partnership is part of an SDF application, the working relationships between Anagold,
project applicants, and third-party partners must be clearly detailed in the Project application. Details of these relationships will
form part of the application review process and be thoroughly scrutinised with respect to Anagold’s FCPA policy.
While Anagold’s annual contribution to the SDF is substantial,
not every project will receive funding. The SDF will be established to focus on participatory needs-based development priorities which
support the abovementioned purpose. It is proposed that development priorities will be re-assessed every three-years.
| | 17-18 | |
| SSR Mining Inc. | Çöpler Property S-K 1300 Report | February 12, 2024 SLR Project No.: 138.21581.00006 |
| 18.0 | Capital and Operating Costs |
SSR’s forecasted capital and operating costs estimates related
to the development of Mineral Reserves are derived from annual budgets and historical actuals over the long life of the current POX and
heap leach operations, as well as a detailed cost estimate for the new Grind-Leach (G-L) circuit.
SSR’s forecasted capital cost estimates related to the development
of Mineral Reserves are derived from annual budgets and historical actuals over the long life of the current operation. According to the
American Association of Cost Engineers (AACE) classifications, these estimates would mainly be Class 2 with an accuracy range of -5% to
-15% to +5% to +20% except where noted in this section. LOM project capital costs total $632.8 million, which considers all costs incurred
before November 1, 2023, as sunk; the capital costs are summarized in Table 18 1.
Table 18-1: Capital Cost Summary
| Description |
Unit |
Value |
| Growth |
$ million |
475.1 |
| Sustaining |
$ million |
61.3 |
| Final Closure/Reclamation |
$ million |
100.3 |
| Total |
$ million |
636.6 |
The $475.1 million growth capital estimate includes $193.8 million for
installing the Grind-Leach (G-L) circuit for processing Greater Çakmaktepe ore which is summarized in Table 18-2 and includes
a 28% contingency factor. In the SLR QP’s opinion, these estimates are an AACE Class 3 classification (-10% to -20% to +10% to +30%)
based on the amount of engineering completed by Ausenco and SSR.
In addition, $29.4 million has been estimated for the initial starter
pit at Greater Çakmaktepe. The TSF 1 expansion to the 77 Mt capacity includes a cost estimate of $186.3 million based on an average
unit rate of $3.96/t ore and averages approximately $14.3 million over a 13 year period from 2024 to 2036. Capitalized stripping costs
of limestone waste for the TSF total $65.5 million over LOM.
Table 18-2: Growth Capital Cost
Summary
| Work Breakdown Structure |
US$ Millions |
| Total Greater Çakmaktepe Starter Pit |
29.4 |
| G-L Circuit |
|
| Process Plant |
75.1 |
| | 18-1 | |
| SSR Mining Inc. | Çöpler Property S-K 1300 Report | February 12, 2024 SLR Project No.: 138.21581.00006 |
| Work Breakdown Structure |
US$ Millions |
| Additional Process Facilities |
7.2 |
| On Site Infrastructure |
6.0 |
| Subtotal Direct Costs |
88.3 |
| Project Indirects |
16.8 |
| Project Delivery |
24.1 |
| Owner’s Costs |
21.9 |
| Subtotal Indirect Costs |
62.8 |
| Contingency |
42.7 |
| Total G-L Circuit |
193.8 |
| Total TSF Expansion Construction |
186.3 |
| Total Capitalized Waste Stripping for TSF |
65.5 |
| Grand Total Growth Capital |
475.1 |
Sustaining capital costs estimates are shown in Table 18-3. Annual
plant maintenance costs of $2.5 million and $1.2 million for the POX and G-L circuits, respectively, were estimated at 0.625% of initial
capital costs. Provision for an on site lime plant to commence operations in 2027 have been added to lower lime costs in POX circuit.
Table 18-3: Sustaining Capital
Summary
| Description |
Unit |
Avg Cost/Year |
Total LOM |
| On Site Lime Plant |
$ million |
8.3 |
16.7 |
| POX Maintenance |
$ million |
2.5 |
35.0 |
| G-L Maintenance |
$ million |
1.2 |
9.6 |
| Total |
$ million |
32.2 |
61.3 |
| 18.1.3 | Final Closure/Reclamation Costs |
The costs associated with reclamation and closure activities were estimated
to be $100.3 million spent over two years after the end of mine production in 2039.
Operating costs were estimated based on current site cost performance
and contract costs including actual operational costs for labor, consumables, contracts, and budget assumptions. According to the AACE
classifications, these estimates would mainly be Class 2 with an accuracy range of -5% to -15% to +5% to +20% except where noted in this
section.
| | 18-2 | |
| SSR Mining Inc. | Çöpler Property S-K 1300 Report | February 12, 2024 SLR Project No.: 138.21581.00006 |
The projected average LOM unit operating cost estimate is summarized
in Table 18-4.
Table 18-4: Average Operating
Costs Unit Rates
| Activity |
Unit |
Avg LOM |
| Mining (contract) |
$/t mined |
2.11 |
| Mining (contract) |
$/t ore processed |
18.04 |
| Processing – All Types |
$/t ore processed |
29.73 |
| General and Administrative |
$/t ore processed |
6.56 |
| VAT1
Payments |
$/t ore processed |
0.13 |
| Total Operating Costs |
$/t ore processed |
54.45 |
Notes:
| 1. | Value-Added Tax payments through 2025 |
Mining operations for the mine are currently contracted to a Turkish
mining contractor. No capital cost is included for mining equipment or facilities. All such costs are built into the unit rate for mining
operations included in the operating cost estimate. Average mining unit rates are summarized in Table 18-5.
Table 18-5: Mine Operating Cost
Summary
| Description |
Average Annual Mining Costs
(US$ million) |
LOM Average
($/t moved) |
| Mining Çöpler Total (ore + waste) |
37.2 |
1.83 |
| Mining Greater Çakmaktepe Ore |
7.5 |
2.52 |
| Mining Greater Çakmaktepe Waste |
73.5 |
2.29 |
| Mining Çöpler Rehandle |
3.0 |
1.26 |
| Total Mining |
121.2 |
2.11 |
The following processing costs in Table 18-6 for POX and heap leach
process circuits are based on the 2024 operating budget estimates. The G-L operating costs were estimated by Ausenco as part of their
2023 work and are considered to be classified as an AACE Class 3 estimate (-10% to -20%, +10% to +30%).
| | 18-3 | |
| SSR Mining Inc. | Çöpler Property S-K 1300 Report | February 12, 2024 SLR Project No.: 138.21581.00006 |
Table 18-6: Process Operating
Cost Summary
| Description |
Average Annual Processing Costs
(US$ million) |
LOM Average
($/t ore) |
| POX (2024-2037) |
111.0 |
40.47 |
| Heap Leach (2024-2028) |
12.8 |
9.63 |
| Grind-Leach (2027-2036) |
21.9 |
12.04 |
| Total (2024-2037) |
138.4 |
29.73 |
| 18.2.3 | General and Administration Costs |
The General and Administrative (G&A) costs include costs not directly
attributable to operational output such as the mining and processing operations. The following costs in Table 18-7 are based on the 2024
operating budget estimates.
Table 18-7: G&A Operating
Cost Summary
| Description |
Average Annual G&A Costs
(US$ million) |
LOM Average
($/t ore) |
| Salaries |
4.6 |
1.03 |
| Consultants and Services |
3.2 |
0.73 |
| Insurance |
4.4 |
1.00 |
| Supplies, rents, land lease |
1.0 |
0.22 |
| Permit |
2.4 |
0.54 |
| Community Outreach & Donations |
1.7 |
0.38 |
| Social Development Fund |
0.6 |
0.14 |
| Other |
3.5 |
0.79 |
| Corp Allocations |
7.6 |
1.73 |
| Total |
29.0 |
6.56 |
The current Çöpler workforce totals 478 persons, consisting
of 408 salaried and 70 hourly employees, as of the effective date of this report. The breakdown by department is shown in Table 18-8.
Table 18-8: Current Workforce
| |
Hourly FTE |
Salary FTE |
Total |
| Mine |
234 |
13 |
247 |
| Plant |
41 |
11 |
52 |
| G&A |
30 |
17 |
47 |
| Tech Services |
8 |
15 |
23 |
| Total |
408 |
70 |
478 |
The LOM workforce is expected to be similar throughout the remaining
15 years of mine life with a reduction of workforce during the last three years of stockpile processing.
| | 18-4 | |
| SSR Mining Inc. | Çöpler Property S-K 1300 Report | February 12, 2024 SLR Project No.: 138.21581.00006 |
The Çöpler full time equivalent (FTE) workforce for the
years 2020 to 2023 (actuals) and the LOM plan (projected) is summarized in Table 18-9.
Table 18-9: LOM Workforce Levels
| |
Hourly FTE |
Salary FTE |
Total |
| 2020 Actual |
367 |
73 |
440 |
| 2021 Actual |
358 |
79 |
437 |
| 2022 Actual |
375 |
86 |
461 |
| 2023 Actual |
395 |
83 |
478 |
| 2024 to 2036 Projected |
405 |
90 |
495 |
| | 18-5 | |
| SSR Mining Inc. | Çöpler Property S-K 1300 Report | February 12, 2024 SLR Project No.: 138.21581.00006 |
An after-tax Cash Flow Projection has been generated by SLR from
the Life of Mine production schedule and capital and operating cost estimates and is summarized in Table 19 1. A summary of the key
criteria is provided below. The complete cash flow is presented in Section 27.0 Appendix. The analysis is based on Q4 2023 real US
dollar basis with no escalation.
| · | Approximately 13,000 tonnes per day processed (4.5 Mt per year) at an average overall head grade of 2.32 g/t gold, including the following
circuits: |
| · | POX: Approximately 7,800 tpd milled (2.7 Mt per year) averaging 2.42 g/t gold, |
| · | Heap Leach: 3,800 tpd stacked (1.3 Mt per year) averaging 1.93 g/t gold, and |
| · | Grind-Leach: 5,340 tpd milled (1.9 Mt per year) averaging 2.26 g/t gold. |
| · | LOM average 281,000 ounces per year gold recovered with LOM recovery averaging 84.7% over the 15 years of full process capacity (2024
to 2038). Total 4.25 Moz gold recovered over LOM with the following recovery rates: |
| · | POX: 87.9%; Heap Leach: 70.4%, and Grind-Leach: 81.3% |
| · | The economic analysis was carried out on a total of 100% basis of Mineral Reserves, of which SSR owns 80%. |
| · | Metal price: US$1,780 per ounce gold (LOM realized), US$1,755 per ounce gold long term price (2028+), |
| · | Gold at refinery 100% payable (with de minimis silver and copper production not included in this analysis). |
| · | Net Smelter Return of $106/t processed includes freight/transport costs averaging $3.84/oz gold. Refining costs are included in process
operating costs. |
| · | Revenue is recognized at the time of gold production. |
| · | Mine life: 15 years (11 years of mining with four years of stockpile processing). |
| · | Life of Mine production plan as summarized in Table 13-18. |
| · | Greater Çakmaktepe starter pit, TSF-1 expansion to 77 Mt capacity, and G-L circuit construction growth capital totals $475.1
million. |
| · | Mine life sustaining capital totals $61.3 million. |
| · | Final reclamation costs total $100 million at end of mine life. |
| · | Average site operating cost over the mine life is $54.45 per tonne processed. |
| | 19-1 | |
| SSR Mining Inc. | Çöpler Property S-K 1300 Report | February 12, 2024 SLR Project No.: 138.21581.00006 |
| 19.1.3 | Taxation and Royalties |
| 19.1.3.1 | Corporate Income Taxes |
In Türkiye, the standard income tax rate is 25% but some of the
site’s income streams qualify for a reduced rate, thus the effective LOM income tax rate is 24.5%.
For tax purposes, a 10 year double declining balance methodology is
used for all new and replacement capital starting in 2024 totaling $536 million. For the existing depreciation balance of $290 million
as of Q3 2023, a combination of accelerated, straight line, and unit of production depreciation methods is used as modeled by the SSR
tax group. All remaining depreciation at the end of the mine life is written off in the last year of production.
Investment incentive certificates (IIC) are available for investments
that promote economic development. IIC’s can be classified as strategic in specific circumstances, thereby providing additional
incentives. An IIC generates credits that offset corporate income taxes generated by the investment. In this analysis, income tax
credits totalling 29% over the LOM were applied to the income tax payable estimate as 90% credits applied in 2024 and 2025 and 80% credits
applied in 2026 to 2028, as modeled by the SSR tax group.
| 19.1.3.2 | VAT and Import Duties |
This analysis assumes the annual operating and capital cost are subject
to value-added tax (VAT) in Türkiye. VAT is levied at 4% of all operating and capital costs (less labor costs) starting July 2023,
and the Project is eligible for the Turkish exemptions for mining projects and mining equipment purchases. VAT payments are expected to
end in 2025.
Import duties are not included in the capital cost estimate for mining
related imported equipment because they are exempted in the IICs.
Under Turkish Mining Law, the royalty rate for precious metals is variable
and tied to metal prices. The Çöpler Project is subject to a mineral production royalty which is based on a sliding scale
to gold price and is payable to the Turkish government.
Table 19-1 details the current prescribed royalty rates applicable
to POX, heap leach and G-L production (revised September 2020). The royalties are calculated on total revenue with deductions allowed
for processing and haulage costs of ore. Royalty rates are reduced by 40% for ore processed in country, as an incentive to process ore
locally.
Table 19-1: Gold Royalty Rates
|
Metal Price
($/oz Gold) |
Prescribed Royalty Rate
(%) |
Royalty After 40% In-Country Processing Incentive
(%) |
| From |
To |
| 0 |
800 |
1.25 |
0.75 |
| 800 |
900 |
2.50 |
1.50 |
| 900 |
1,000 |
3.75 |
2.25 |
| 1,000 |
1,100 |
5.00 |
3.00 |
| 1,100 |
1,200 |
6.25 |
3.75 |
| | 19-2 | |
| SSR Mining Inc. | Çöpler Property S-K 1300 Report | February 12, 2024 SLR Project No.: 138.21581.00006 |
|
Metal Price
($/oz Gold) |
Prescribed Royalty Rate
(%) |
Royalty After 40% In-Country Processing Incentive
(%) |
| From |
To |
| 1,200 |
1,300 |
7.50 |
4.50 |
| 1,300 |
1,400 |
8.75 |
5.25 |
| 1,400 |
1,500 |
10.00 |
6.00 |
| 1,500 |
1,600 |
11.25 |
6.75 |
| 1,600 |
1,700 |
12.50 |
7.50 |
| 1,700 |
1,800 |
13.75 |
8.25 |
| 1,800 |
1,900 |
15.00 |
9.00 |
| 1,900 |
2,000 |
16.25 |
9.75 |
| 2,000 |
2,100 |
17.50 |
10.50 |
| 2,100 |
+ |
18.75 |
11.25 |
The Çöpler Project effective LOM royalty rate based on the
metal price assumptions and applicable deductions is approximately 8.4%.
Other than the royalty payments, there are no other known back-in rights,
payments, or other agreements and encumbrances to which the Project is subject.
Considering the Çöpler Project on a stand-alone basis, the
undiscounted after-tax cash flow totals $2,368 million over the mine life. The after-tax Net Present Value (NPV) at a 5% discount rate
(midpoint with November 1, 2023 as time zero) is $1,643 million, as shown in Table 19-2. An Internal Rate of Return (IRR) metric is not
reported as the operation is cash positive in each year of the mine plan until closure.
Table 19-2: After-Tax Cash
Flow Summary
| Description |
US$ million |
| Realized Market Prices |
|
| Au ($/oz) |
$1,780 |
| Payable Metal |
|
| Au (koz) |
4,254 |
| Total Gross Revenue |
7,564 |
| Mining Cost |
(1,213) |
| Process Cost |
(1,998) |
| G & A Cost |
(441) |
| VAT Payments |
(9) |
| Dore Freight/Insurance |
(16) |
| Mining Royalties |
(429) |
| | 19-3 | |
| SSR Mining Inc. | Çöpler Property S-K 1300 Report | February 12, 2024 SLR Project No.: 138.21581.00006 |
| Description |
US$ million |
| Total Operating Costs |
(4,107) |
| Operating Margin (EBITDA) |
3,457 |
| Cash Taxes Payable |
(452) |
| Working Capital1 |
0 |
| Operating Cash Flow |
3,005 |
| Development Capital |
(475) |
| Sustaining Capital |
(61) |
| Total Closure/Reclamation Capital |
(100) |
| Total Capital |
(637) |
| |
|
| Pre-tax Free Cash Flow |
2,821 |
| Pre-tax NPV @ 5% |
1,931 |
| |
|
| After-tax Free Cash Flow |
2,368 |
| After-tax NPV @ 5% |
1,643 |
Notes:
| 1. | All working capital adjustments net to zero at end of mine life |
The World Gold Council Adjusted Operating Cost (AOC) is S$965/oz Au.
The mine life capital unit cost, including sustaining and closure/reclamation, is $38/oz, for an All in Sustaining Cost (AISC) of US$1,003/oz
Au. The average annual gold production during operation is 281,000 ounces per year over ROM operations.
Project risks can be identified in both economic and non-economic terms.
Key economic risks were examined by running cash flow sensitivities:
After-tax IRR sensitivity over the base case has been calculated for
-20% to +20% variations for head grade, recovery (only -20% to +15% variation), and gold price, and -15% to +15% variations for operating
and capital costs. The sensitivities are shown in Figure 19-1 and Table 19-3. The Project is most sensitive to changes in head
grade, metallurgical recovery, and metal price (usually with same magnitude of impact) followed by operating cost and finally capital
costs.
| | 19-4 | |
| SSR Mining Inc. | Çöpler Property S-K 1300 Report | February 12, 2024 SLR Project No.: 138.21581.00006 |
Table 19-3: After-Tax Sensitivity
Analyses
| Variance |
Head Grade
(g/t Au) |
NPV at 5%
(US$ million) |
| 80% |
1.59 |
925 |
| 90% |
1.94 |
1,291 |
| 100% |
2.32 |
1,643 |
| 110% |
2.74 |
1,991 |
| 120% |
3.20 |
2,338 |
| Variance |
Recovery
(% Au) |
NPV at 5%
(US$ million) |
| 80% |
67.7 |
925 |
| 90% |
76.2 |
1,291 |
| 100% |
84.7 |
1,643 |
| 110% |
93.1 |
1,991 |
| 115% |
97.3 |
2,164 |
| Variance |
Metal Prices
(US$/oz Au) |
NPV at 5%
(US$ million) |
| 80% |
1,420 |
895 |
| 90% |
1,600 |
1,289 |
| 100% |
1,780 |
1,643 |
| 110% |
1,960 |
1,978 |
| 120% |
2,130 |
2,304 |
| Variance |
Operating Costs
(US$M) |
NPV at 5%
(US$ million) |
| 85% |
3,369 |
1,810 |
| 93% |
3,515 |
1,727 |
| 100% |
3,661 |
1,643 |
| 108% |
3,807 |
1,559 |
| 115% |
3,952 |
1,474 |
| Variance |
Capital Costs
(US$M) |
NPV at 5%
(US$ million) |
| 85% |
468 |
1,681 |
| 93% |
548 |
1,662 |
| 100% |
637 |
1,643 |
| 108% |
734 |
1,622 |
| 115% |
841 |
1,601 |
| | 19-5 | |
| SSR Mining Inc. | Çöpler Property S-K 1300 Report | February 12, 2024 SLR Project No.: 138.21581.00006 |
Figure 19-1: After-Tax Sensitivity
Analysis
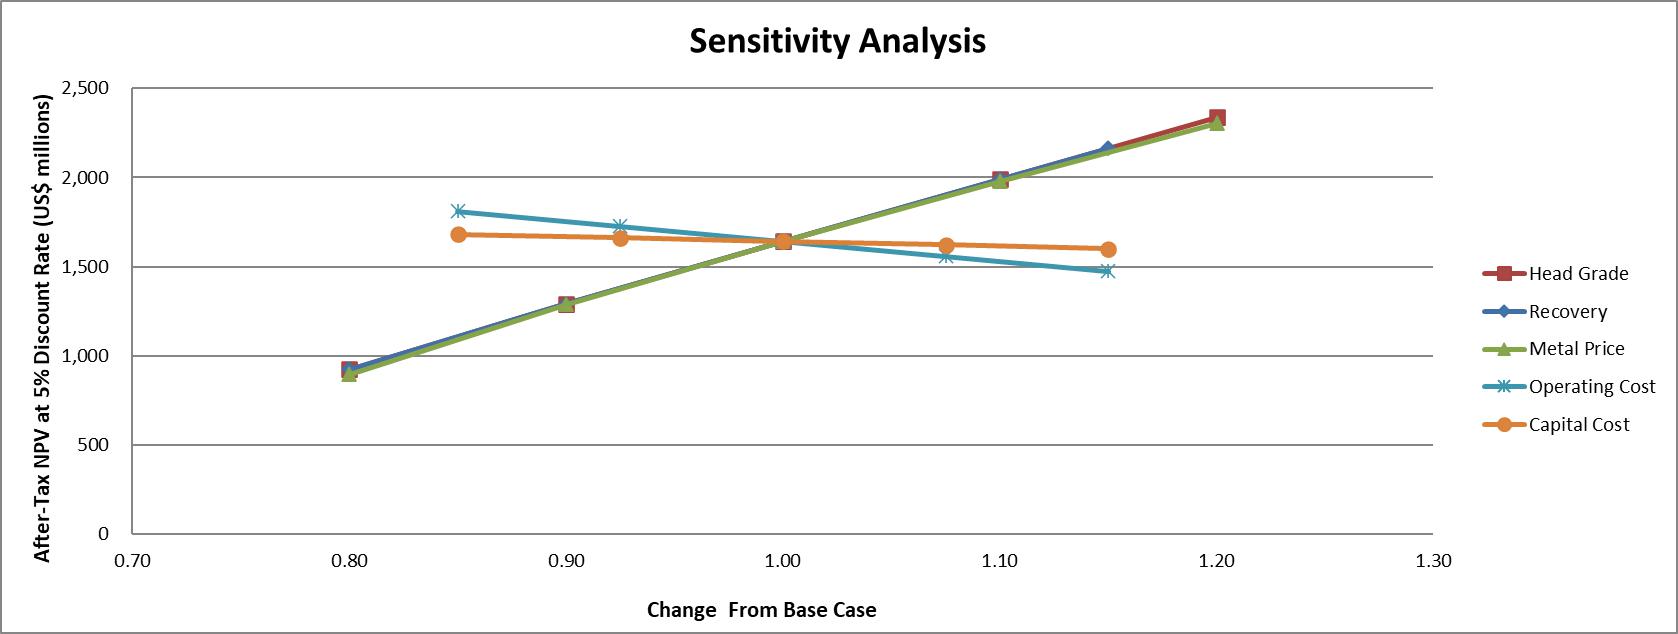
| | 19-6 | |
| SSR Mining Inc. | Çöpler Property S-K 1300 Report | February 12, 2024 SLR Project No.: 138.21581.00006 |
There are no adjacent properties that are applicable to the Çöpler
Project.
| | 20-1 | |
| SSR Mining Inc. | Çöpler Property S-K 1300 Report | February 12, 2024 SLR Project No.: 138.21581.00006 |
| 21.0 | Other Relevant Data and Information |
No additional information or explanation is necessary to make this TRS
understandable and not misleading.
| | 21-1 | |
| SSR Mining Inc. | Çöpler Property S-K 1300 Report | February 12, 2024 SLR Project No.: 138.21581.00006 |
| 22.0 | Interpretation and Conclusions |
The QPs offer the following conclusions by area.
| 22.1 | Geology and Mineral Resources |
| · | The Çöpler district deposits (Çöpler, Greater Çakmaktepe, and Bayramdere) are best classified as epithermal,
disseminated, and skarn deposits related to a porphyry copper-gold system. Mineralizing fluids, derived from the intrusions, were primarily
controlled by structural fluid pathways and lithology, including traps controlled by lithological contacts, resulting in replacement,
vein and stockwork mineralization. |
| · | The Çöpler property has been the site of considerable mining and exploration, including the drilling and logging of more
than 4,800 drill holes totaling over 725,000 metres drilled. |
| · | The QP has estimated and prepared the Mineral Resources in accordance with the U.S. Securities and Exchange Commission (US SEC) Regulation
S-K subpart 1300 rules for Property Disclosures for Mining Registrants (S-K 1300). |
| · | The QP has classified the Mineral Resources in accordance with the U.S. Securities and Exchange Commission (US SEC) Regulation S-K
subpart 1300 rules for Property Disclosures for Mining Registrants (S-K 1300). |
| · | Mineral Resource estimates were prepared using a domain-controlled, predominantly ordinary kriging technique with verified drillhole
location, density and sample data derived from exploration activities conducted by various companies from 2000 to 2023. Inverse distance
algorithms were used for estimating minor elements, densities, and where kriging results were sub-optimal. |
| · | The QP is of the opinion that the drilling and sampling procedures adopted at Çöpler are consistent with generally recognized
industry best practices. The diamond and reverse circulation (RC) samples were collected by competent personnel using common practices.
The process was conducted or supervised by qualified geologists. |
| · | Overall, the drilling pattern is sufficiently dense to interpret the geometry and the boundaries of gold mineralization with confidence.
Several areas at Çöpler are based on approximately 60-m spaced drilling
which carries a moderate risk; the impact of this has been limited by classifying these areas as Inferred. The QP considers the overall
risk associated with data location, spacing and distribution to be low to moderate and has considered this risk when classifying the Mineral
Resources. |
| · | The data informing the Mineral Resources are collected using RC and core drilling. Overall, the QP is of the opinion that the samples
are representative of the source materials. |
| · | In the RSC QP’s opinion, the sample preparation, security, and analytical procedures are adequate and meet industry standards,
and the QA/QC program, as designed and implemented at Çöpler is adequate. The assay results within the drillhole database
are considered suitable for the purpose of mineral resource estimation and classification in relevant categories. Neither the SSR in-house
quality control nor SSR predecessor’s quality control yielded any indication of material quality concerns. |
| · | The QP was provided unlimited access by SSR for data verification purposes during the site visit. The QP is of the opinion that data
verification procedures for the Project comply with industry standards and are adequate for the purposes of Mineral Resource estimation. |
| | 22-1 | |
| SSR Mining Inc. | Çöpler Property S-K 1300 Report | February 12, 2024 SLR Project No.: 138.21581.00006 |
| · | Based on the site visit, data validation and the results of quality acceptance testing, the QP is of the opinion that the sampling
methods, chain of custody procedures, and analytical techniques are adequate and meet acceptable industry standards. The assay and bulk
density databases are of sufficient quality for Mineral Resource estimation at the Çöpler district deposits (Çöpler,
Greater Çakmaktepe, and Bayramdere). |
| · | The QP considers that the knowledge of the deposit setting, lithologies, controls on mineralization, and the mineralization style
and setting, is sufficient to support the Mineral Resource classifications assigned. Alternative geological interpretations are possible.
At Çöpler and Greater Çakmaktepe, the domains were updated to better align with previous mining reconciliation, however,
a moderate–high risk is inherently carried in the domaining. It is anticipated that alternative geological interpretations could
lead to tonnage or grade swings of up to ±20% in Inferred parts of the Mineral Resources. |
| · | The assumptions, parameters and methods used in the estimations have been transparently reported. The estimation settings are considered
conservative and have been reconciled with previous mining at Çöpler and Greater Çakmaktepe to provide a robust result.
Sensitivity testing has demonstrated that the estimation settings carry a moderate risk. |
| · | The Mineral Resource estimates for Çöpler, Greater Çakmaktepe, and Bayramdere have an effective date of October
31, 2023. |
| · | Appropriate cut-off grades and pit optimization parameters have been used to establish those portions of the block models that meet
the requirement for reasonable prospects for economic extraction for this style of gold-copper deposit and mineralization. In assessing
the potential of economic extraction, the QP reviewed mining, metallurgical, economic, environmental, social and geotechnical factors. |
| · | The Mineral Resources estimates exclusive of Mineral Reserves at the Property include the following by deposit area (SSR 80% attributable
share): |
| o | Çöpler: 5.0 million tonnes (Mt) Measured Mineral Resources at an average grade of 1.31 g/t gold (Au) containing 0.21 million
ounces (Moz) Au, 11.1 Mt Indicated Mineral Resources at an average gold (Au) grade of 1.29 g/t containing 0.46 million ounces (Moz) Au
and an additional 14.0 Mt at an average grade of 1.53 g/t Au containing 0.69 Moz Au of Inferred Mineral Resources. |
| o | Greater Çakmaktepe: 3.6 Mt Measured Mineral Resources at an average grade of 0.94 g/t Au containing 0.11 Moz Au, 7.3 Mt Indicated
Mineral Resources at an average grade of 1.10 g/t Au containing 0.26 Moz Au and an additional 4.8 Mt at an average grade of 1.87 g/t Au
containing 0.29 Moz Au of Inferred Mineral Resources. |
| o | Bayramdere: 0.1 Mt Indicated Mineral Resources at an average grade of 2.36 g/t Au containing 0.01 Moz Au. There are no Measured or
Inferred Resources at Bayramdere. |
| · | The level of uncertainty has been adequately reflected in the classification of Mineral Resources for the Çöpler Project.
The Mineral Resources presented may be materially impacted by any future changes in the break-even cut-off grade, which may result from
changes in mining method selection, mining costs, processing recoveries and costs, metal price fluctuations, or significant changes in
geological knowledge. |
The QP is of the opinion that with consideration of the recommendations
summarized in Sections 1 and 23 of this TRS, any issues relating to all relevant technical and economic factors likely to influence the
prospect of economic extraction can be resolved with further work.
| | 22-2 | |
| SSR Mining Inc. | Çöpler Property S-K 1300 Report | February 12, 2024 SLR Project No.: 138.21581.00006 |
| 22.2 | Mining and Mineral Reserves |
| · | The total Mineral Reserve for the Çöpler Project is estimated to be approximately 67.4 Mt at an average grade of
2.32 g/t gold, totaling 5.1 Moz of contained gold, and SSR’s (80%) portion is 4.1 Moz of contained gold. Average oxide gold recoveries
are 61% and average sulfide gold recoveries range from 81% to 91%. SSR’s portion of the Mineral Reserves for both Çöpler
pit and Greater Çakmaktepe pit is 80%. The Çöpler pit represents approximately 41% of the total Mineral Reserve and
the Greater Çakmaktepe pit represents the remaining 59%. |
| · | The SLR QP reviewed the assumptions, parameters, and methods used to prepare the Mineral Reserves Statement and is of the opinion
that the Mineral Reserves are estimated appropriately and disclosed in accordance with S-K 1300. |
| · | This mine has operated profitably since 2011. Open pit mining at the Çöpler Project
is carried out by a mining contractor and managed by Anagold. |
| · | The mining method is a conventional open pit method with drill and blast operations and using excavators and trucks operating on bench
heights of 5 m. The mining contractor provides operators, line supervisors, equipment, and ancillary facilities required for the mining
operation. Anagold provides management, technical, mine planning, engineering, and grade control functions for the mining operation. |
| · | Production schedules and costs associated with the Mineral Reserves have been updated by SSR based on current site performance and
contracts. |
Pressure Oxidation Sulfide Plant
| · | The throughput from crushing and grinding was designed with a nominal capacity of 306 tph which was increased up to a maximum of 400 tph.
The pressure oxidation (POX) autoclave circuit has demonstrated it can process a long-term average maximum of 280 tph feed (two autoclaves
operating in parallel) and 13.75 tph sulfide sulfur, compared to design of 245 tph and 12.5 tph respectively. The limit
of 13.75 tph sulfide sulfur is dictated by the capacity of the oxygen supply to effect oxidation of the sulfides, design 96%. The
gold recovery has remained at approximately 87.5%. |
| · | The flotation plant feed rate is variable between 50–150 tph based on sulfide sulfur feed grade and the oxidation capacity
of the POX autoclaves to oxidize sulfides. |
| · | The addition of a flotation circuit to the sulfide plant provides stability and flexibility to the POX circuit operation to maximize
throughput and oxygen utilization by maintaining optimum sulfur grade to the autoclaves. |
| · | A large amount of POX test work has been performed on Çöpler sulfide ore across several pilot plant campaigns. The current
POX process works well, as demonstrated by actual operational performance. |
| · | Comminution test work indicates that Çakmaktepe Ext. sulfide ore (jasperoid) is significantly harder and more abrasive than
Çöpler sulfide ores and is not amenable for feeding to the existing Sulfide plant primary sizer. The ore will be crushed using
the heap leach crushing plant and then delivered to POX plant grinding circuit. |
| | 22-3 | |
| SSR Mining Inc. | Çöpler Property S-K 1300 Report | February 12, 2024 SLR Project No.: 138.21581.00006 |
| · | No test work has been completed for direct POX processing of Çakmaktepe Ext. sulfide ores or flotation concentrates. |
| · | Further metallurgical testing of Çakmaktepe Ext. material types, both oxide and sulfide, is recommended to optimize the feeds
to POX and slip stream flotation circuit. Further mineralogical work is recommended to understand the main gold associations. |
| · | The silver recovery pattern is much less clear than gold because silver is not released by the oxidation process. Silver recovery
is determined from actual plant recovery over the period January 2019 through February 2020. The silver recovery calculates to 3.0%. |
| · | From the test work, it is estimated that the flotation concentrate reporting to the POX circuit will achieve the same overall recovery
as the ore directly reporting to POX. Gold recovery to the flotation concentrate is estimated to be 55%. |
| · | The flotation tails reporting directly to the leach circuit are estimated to have a gold recovery of 43%, based on test work using
samples collected while processing large amounts of formerly stockpiled ore. When processing freshly mined sulfide ore, flotation tails
recoveries can vary between 10% and 30% in CIP. |
Heap Leach
| · | The oxide heap leaching facilities were commissioned in late 2010. The process was originally designed to treat approximately 6.0 Mtpa
of ore by three-stage crushing (primary, secondary, and tertiary) to 80% passing 12.5 mm, agglomeration, and heap leaching on a lined
heap leach pad with dilute alkaline sodium cyanide solution. Gold is recovered through a carbon-in-column (CIC) adsorption system, followed
by carbon elution, electrowinning and smelting of the precipitate to produce doré ingots for sale. |
| · | The ore contains cyanide soluble copper that consumes cyanide increasing operating cost. Copper cyanide in the leach solutions is
treated in a sulfidation, acidification, recycling, and thickening (SART) plant which precipitates the copper as copper sulfide and regenerates
sodium cyanide, which is recycled in the leach solutions. |
| · | Metallurgical test work on Çakmaktepe oxide ore for heap leaching was performed in the on-site Çöpler metallurgical
laboratory, initially under the supervision of Kappes, Cassiday & Associates (KCA). The results compare to the Çöpler
oxide ore, with similar behavior and leach kinetics. Subsequently, Çakmaktepe oxide ore was heap leached together with Çöpler
oxide ore. |
| · | Metallurgical test work on Çakmaktepe Ext. oxide material for heap leaching was performed at McClelland Laboratories Inc. and
supervised by Metallurgium consulting. The initial program in 2019 identified two distinct domains with respect to gold recovery based
on sulfide sulfur (SS) content of <1% and between 1% to 2%. |
| · | Metallurgical heap leach test work has been completed to characterize the Bayramdere oxide mineralization. In the column test, final
gold extraction was 84% in the two duplicate columns with reasonable leach kinetics. |
| · | The current heap leaching gold recovery assumptions are summarized for Çöpler oxide zone, Çakmaktepe oxide zone
(including Bayramdere), and Çakmaktepe Ext. oxide zone in the report and vary by ore type and location. The main ore types include
diorite, metasediment (Hornfels), limestone/marbles, gossan, manganese diorite, Jasperoid and ophiolite. The Çakmaktepe Ext. oxide
ores include Jasperite, Listwanite and Dolomite and were extensively tested during 2023 by Ausenco and ALS. |
| | 22-4 | |
| SSR Mining Inc. | Çöpler Property S-K 1300 Report | February 12, 2024 SLR Project No.: 138.21581.00006 |
Grind Leach
| · | The proposed process to treat oxide and low sulfur (< 2% sulfur) ores from the Çakmaktepe Ext. open pit is a conventional
grind leach process. The grind leach process plant is designed to treat 248 tph of ore during 8,059 hours per year of operation
or 92% availability for a total of 2 Mtpa. The operating availability of the crushing section will be 70%. The process will comprise primary
jaw crushing, SAG mill and ball mill grinding closed by hydrocyclones, carbon-in-leach (CIL) cyanidation, carbon elution, electrowinning,
and refining of electrowinning precipitate to produce a final precious metal (doré) product. |
| · | In 2023, ALS Metallurgy - Kamloops completed a metallurgical test program supervised by Ausenco to evaluate grind/leach processing
of Çakmaktepe Ext. oxide ores. Both standard and CIL bottle roll tests were completed at a grind size P80 of 75 µm.
Testing on master composite samples indicated that gold recovery is insensitive to grind size over a range from 53 µm to 212 µm. |
| · | Samples were selected to be representative of spatial, lithological and grade variability. Sample selection also took into consideration
the preliminary mining sequence, with higher sample density in areas expected to be mined in the earlier years of the grind/leach plant
operation. |
| · | Test work is planned to understand metallurgical and mineralogical variability across the deposit. Gold recovery for the Jasperoid,
Listwanite, and Dolomite lithologies were 60%, 90%, and 83%, respectively. |
| · | The existing heap leach pad comprises four phases with an estimated capacity of 63 Mt of oxide ore heaps, with a maximum heap height
of 100 m above the pad liner. Two additional phases (phase 5 and phase 6), with a total of 18.5 Mt capacity (13.5 Mt and 5.0 Mt, respectively),
will be added to accommodate oxide ore extracted from Greater Çakmaktepe. |
| · | The current tailings storage facility (TSF-1) is in the process of development and construction and will have seven phases when it
reaches the ultimate phase. Currently the TSF holds 13.3 Mt of tailings as of the Effective Date of this report. Construction of Phase
4 of TSF-1 has been finalized, and it received approval for operation from the Ministry of Environment, Urbanisation and Climate Change
(MoEUCC) in November 2023. The design capacity for TSF-1 is currently 65.8 Mt. |
| · | However, the ultimate capacity required for TSF-1 that will have to incorporate the 60.4 Mt of tailings generated from the LOM
plan is estimated to be 73.7 Mt (13.3 Mt plus 60.4 Mt). There are a number of options currently being studied to further expand TSF-1
capacity but have not been finalized. A conceptual design to increase the crest elevation of Phase 7 embankment to from 1,275 MASL to
1,280 MASL, thus increasing the total capacity to approximately 77 Mt, has been selected for the LOM plan. |
| · | Limestone and marble overburden are currently used as embankment rockfill for TSF construction. According to the current mine plan,
there will be a limestone shortage in 2025 but SSR has plans to quarry limestone near the mine area to produce the required amount required
for the TSF expansion. |
| | 22-5 | |
| SSR Mining Inc. | Çöpler Property S-K 1300 Report | February 12, 2024 SLR Project No.: 138.21581.00006 |
| · | The existing infrastructure, as well as the areas designated for tailings storage and the leach pad, will meet the demands of the
current Mineral Reserves once the planned expansions are completed. |
| · | The Çöpler mining and processing operations have a well-established and effective environmental, social and permitting
management program (10+ years) that follows National and International Standards. |
| · | Site staff is knowledgeable and experienced in site and regulatory requirements and supported by corporate technical and Environmental,
Social and Governance (ESG) personnel as well as outside (Türkiye and International) technical experts. |
| · | Budgets and planned schedules for permit development are reasonable and there were no critical path permitting items noted that would
limit production and Reserve/Resource development. A reclamation/closure plan and estimates to perform this activity are in place. |
| · | The budgets and staffing to perform required programs are adequate and indicative of site activities, requirements, and responsibilities. |
| · | The SLR QP’s opinion is that it is reasonable to rely on the information provided by SSR as outlined above for use in the this
TRS because a significant environmental and social analysis has been conducted for the project over an extended period, the Project has
been in operation for a number of years, and SSR employs professionals and other personnel with responsibility in these areas and these
personnel have a good understanding of the permitting, regulatory, and environmental requirements for the Project. |
| 22.6 | Capital and Operating Costs |
| · | SSR’s forecasted capital and operating costs estimates related to the development of Mineral Reserves are derived from annual
budgets and historical actuals over the long life of the current operation. According to the American Association of Cost Engineers (AACE)
classifications, these estimates would be Class 2 with an accuracy range of -5% to -15% to +5% to +20% except where noted elsewhere. |
| | 22-6 | |
| SSR Mining Inc. | Çöpler Property S-K 1300 Report | February 12, 2024 SLR Project No.: 138.21581.00006 |
The QPs offer the following recommendations by area.
| 23.1 | Geology and Mineral Resources |
| 1 | Carry out an infill drill program of 50,000 m with a proposed budget of US$11.3 million over the next three years at Çöpler and Greater
Çakmaktepe. The objective of the infill drill program is to increase orebody knowledge and improve the confidence in resource estimates
and classification. |
| 2 | Carry out resource extension drill program of 30,000 m with a proposed budget of
US$6.8 million over the next three years at Çöpler
and Greater Çakmaktepe. The drill program is planned to convert Inferred Resources to Indicated Resources within the current reserve
pit. The drill program will also target higher-grade structures closer to the current resource boundary with an objective of expanding
the Mineral Resources. |
| 3 | Carry out continuous pit mapping and updating of the structural and geological model at Çöpler
and Greater Çakmaktepe. The data will be incorporated in resource models to increase the confidence in resource estimates and classification. |
| 4 | Audit the grade control process in 2024. Based on the outcomes of the audit, any changes, if
warranted, will be implemented. |
The RSC QP agrees with the objectives and overall scope of these planned
activities.
| 23.2 | Mining and Mineral Reserves |
| 1 | Complete the Greater Çakmaktepe pit area hydrological model within the upcoming year (2024). |
| 2 | Update geotechnical model updates for the Greater Çakmaktepe pit area in 2024. |
| 3 | Pit dewatering should become a higher priority in both the Çöpler and Greater Çakmaktepe pit areas within the next
few years as the pits are deepened. |
| 4 | Perform a study to optimize Waste Rock Dump (WRD) locations to improve the haulage profiles. |
| 1 | Carry out additional test work to understand the significant metallurgical and mineralogical variability across the deposit, including
gold recovery and grind size for the Jasperoid mineralization. |
| 2 | Implement further testing to determine optimum circuit design parameters including grind size. |
| 1 | Develop an execution plan for constructing TSF 1 phase 5 within the next 2.5 years to account for the current rate of rise in the
facility and to mitigate any risk of reduced tailings capacity in the TSF-1 impoundment driven by excess water from the heap leach operations. |
| 2 | Evaluate and plan for the operation of water treatment facilities to filter the TSF reclaim water and manage discharges as soon as
possible. |
| | 23-1 | |
| SSR Mining Inc. | Çöpler Property S-K 1300 Report | February 12, 2024 SLR Project No.: 138.21581.00006 |
| 40. | Expedite the permitting and initiation of limestone quarry operations to avoid delays in the construction of future TSF phases given
the projected limestone shortage in 2025 in the current mine plan. |
| 41. | Develop a well-defined closure plan for the current TSF. The closure plan should be integrated with operations and life-of-mine planning. |
| 42. | Conduct further studies and install instrumentation for TSF-1 as the facility is expanded beyond Phase 5. The instrumentation should
include inclinometers within the downstream abutments used to supplement the existing monitoring and instrumentation plan. These changes
are proposed for the 2024 fiscal year. |
| 43. | Conduct further studies for the proposed TSF options, as listed below, during the next stage of their design. |
| o | Geotechnical Investigation with Boreholes & Test pits |
| o | Tailings Sample (pilot) and testing |
| o | Tailings Large Strain Consolidation Modeling |
| o | Seismic Deformation Modeling |
| o | Probabilistic Water Balance Modeling |
| o | Diversion Channel Design |
| · | Credible Failure Modes Analysis |
| 1 | Evaluate whether there may be an opportunity to use the heap drain-down solution in the sulfide circuit rather than disposing of it
by forced evaporation, potentially reducing costs. This would require changes to the design of the evapotranspiration cells included in
the current estimate. |
| 44. | Evaluate the technical and regulatory/permitting requirements for treating and discharging water. The SLR QP understands that the
current operations are designed as “Zero Discharge”; however, suggests that treating and discharging water may enhance sustainability
goals by reducing fresh-water make-up and expedite closure timing. |
| 45. | Conduct further studies and design work for the mitigation of PAG materials exposed in the pits to verify whether the proposed one
metre of non-PAG cover is practical and effective to implement. |
| 46. | Compare the growth media inventory and expected amount to be recovered over the course of the Project to the sum of the growth media
requirements of the Project facilities. Further work (as part of a Test Plot Program) is recommended to determine the most sustainable
revegetation covers to be employed. |
| 47. | Evaluate and, where possible, implement additional concurrent reclamation opportunities to minimize costs and requirements at the
end of operations. |
| | 23-2 | |
| SSR Mining Inc. | Çöpler Property S-K 1300 Report | February 12, 2024 SLR Project No.: 138.21581.00006 |
| 48. | Track and, if necessary, participate in the development of new environmental and mine permitting regulations. |
| 49. | Continue to perform internal and external (independent) ESG Audits. |
| 50. | Continue to update Asset Retirement Obligations (ARO) as well as overall reclamation/closure cost estimates on a regular basis. |
| 23.6 | Capital and Operating Costs |
| 1 | Evaluate the technical and regulatory/permitting requirements for treating and discharging water. The SLR QP understands that the
current operations are designed as “Zero Discharge”; however, suggests that treating and discharging water may enhance sustainability
goals by reducing fresh-water make-up and expedite closure timing. |
| | 23-3 | |
| SSR Mining Inc. | Çöpler Property S-K 1300 Report | February 12, 2024 SLR Project No.: 138.21581.00006 |
AACE International, 2012, Cost Estimate
Classification System – As applied in the Mining and Mineral Processing Industries, AACE International Recommended Practice No.
47R-11, 17 p.
Abzalov, M.Z., 2008. Quality Control
of Assay Data: A Review of Procedures for Measuring and Monitoring Precision and Accuracy, Exploration and Mining Geology, 17(3–4):
1–14, 2008.
Altman, K, Liskowich, M, Mukhopadhyay,
D K, Shoemaker, S J, 2011. Çöpler Sulfide Expansion Project Prefeasibility Study. March 27, 2011.
Altman, K, Bascombe, L, Benbow, R, Mach,
L, Shoemaker, SJ, 2012. Çöpler Resource Update, Erzincan Province Turkey. March 30, 2012.
Altman, K, Bair, D, Bascombe, L, Benbow,
R, Mach, L, Swanson, B, 2013. Çöpler Resource Update, Erzincan Province Turkey.March 28, 2013.
Amec Foster Wheeler, 2015. Çöpler
Sulfide Expansion Project Feasibility Update 2015.
Anatolia, 2009. Çöpler Project,
East Central Turkey Preliminary Mine Reclamation & Closure Plan, 2009, Anatolia Minerals Development, Limited.
Barr, 2012. Pit Wall Stability Analysis,
Çöpler Mine, August 2012
Bloom, L., 2002. Analytical Services
and QA/QC, for Society of Exploration Geologists, April 2002. Project Documents.
Cube Consulting, 2016b, Database Validation
and Verification, and QAQC Review for Çöpler Near Mine Projects by Adrian Shepard, Cube Consulting, January 4, 2016
Easton, C L, Pennstrom, W J, Malhotra,
D, Moores, R C, Marek, J M., 2008. Çöpler Gold Project East Central Turkey Preliminary Assessment Sulfide Ore Processing.
February 4, 2008.
Golder, 2013a. Çöpler Mine
Sulfide Expansion Project, Flood Management Plan, May 2013 Golder Associates.
Golder, 2013b. Çöpler Mine
Sulfide Expansion Project, Groundwater Modeling Report, September 2013 Golder Associates.
Golder, 2013c. Çöpler Sulfide
Project Tailings Storage Facility Siting Study, 17 December 2013, Golder Associates.
Golder, 2014a. Çöpler Sulfide
Project – Stability Evaluation of Planned Waste Dump Facilities, Technical Memorandum, 28 February 2014, Golder Associates.
Golder, 2014b. Geotechnical Report, Sulfide
Plant Facilities – Updated Report Çöpler Sulfide Project, 10 March 2014, Golder Associates.
Golder, 2014c. Çöpler Mine
– Pit Slope Design Review, April 2014, Golder Associates.
Golder, 2014d. Çöpler Sulfide
Project – Tailings Storage Facility Analysis and Design, 28 July 2014, Golder Associates.
Golder, 2015a. Çöpler Sulfide
Project – Tailings Storage Facility, Summary of Design and Expansion to 46.6Mt Capacity, Technical Memorandum, March 2015.
| | 24-1 | |
| SSR Mining Inc. | Çöpler Property S-K 1300 Report | February 12, 2024 SLR Project No.: 138.21581.00006 |
Golder, 2015b. Çöpler Sulfide
Expansion Project – Stability Evaluation of Planned Waste Dump Facilities, Technical Memorandum, 14 May 2015, Golder Associates.
Golder, 2015c. Geotechnical Report, Sulfide
Plant Facilities – Detailed Design Recommendations, Çöpler Sulfide Project, 8 October 2015, Golder Associates.
Golder, 2016a. Tailings Storage Facility,
Detailed Design Criteria, Revision 3, February 2016.
Golder, 2016b. Çöpler Sulfide
Project – Tailings Storage Facility Summary of Design and Expansion to 45.9Mt Capacity, Technical Memorandum, April 2016.
Golder, 2019. Pit Slope Stability Evaluation,
Çöpler Open Pit Mine, November 2019.
Golder, 2021a. Data Review and Geotechnical
Model, Çöpler Geotechnical Design Review 2021, October 2021.
Golder, 2021b. Çöpler Pit
Slope Design Review, November 2021.
Golder, 2021c. 2021 Greater Çakmaktepe
Project Slope Stability Study, Geotechnical Support for the Pre Feasibility Study, December 2021.
Hacettepe University, Gazi University
(Hacettepe and Gazi Universities, 2014 (Interim), İliç (Erzincan) Çöpler Complex Mine Capacity Increase Project
– Report on Biological Diversity, 2014 (Interim).
Independent Mining Consultants, Inc.
(IMC), 2005. Çöpler Project Resource Estimate Technical Report, October 19, 2005.
International Union for Conservation
of Nature (IUCN), 1994: Red List: http://www.iucnredlist.org/static/categories_criteria_3_1.
Imer, A., Richards, J.P., and Creaser,
R.A., 2013, Age and tectonomagmatic setting of the Çöpler-Kabatas¸ magmatic complex and porphyry-epithermal Au deposit,
east central Anatolia, Turkey: Mineralium Deposita, v. 48, 557-583.
Jacobs, 2012. Çöpler Sulfide
Project Feasibility Study, Site Conditions, May 30, 2012.
Jacobs, 2014a. Çöpler Sulfide
Expansion Project Definitive Feasibility Report, June 15, 2014
Jacobs, 2014b. Crushing and Grinding
Systems for Handling Clayey Ore Trade-Off Study, January 21, 2014.
Marek, J M, Pennstrom, W J, Reynolds,
T, 2006. Technical Report Çöpler Gold Project Feasibility Study, Prepared by Samuel Engineering, Inc. May 30, 2006.
Marek, J M, Moores, R C, Pennstrom, W
J, Reynolds, T, 2007. Technical Report Çöpler Gold Project, Prepared by Independent Mining Consultants, Inc. March 2, 2007
as amended April 30, 2007
Marek, J M, Benbow, R D, Pennstrom, W
J, 2008. Technical Report Çöpler Gold Project East Central Turkey, December 5, 2008 (Amended and Restated; supersedes 11.07.2008
version).
Marsden, J. O., 2014. Çöpler
Project – Heap Leach Model Review, October 24, 2014, Metallurgium, Phoenix, AZ.
Marsden, J. O., 2015a. Çöpler
Heap Leach Project Gold Recovery Assumptions – Rev 1. March 26, 2015, Metallurgium, Phoenix, AZ.
Mining Association of Canada (MAC), 2019.
Developing an Operation, Maintenance and Surveillance Manual for Tailings and Water Management Facilities (the OMS Guide).
| | 24-2 | |
| SSR Mining Inc. | Çöpler Property S-K 1300 Report | February 12, 2024 SLR Project No.: 138.21581.00006 |
MoEUCC, Turkish Republic, The Ministry
of Environment, Urbanization and Climate Change, The Regulation on Mining Wastes, Official Gazette Numbered 29417, July 15, 2015
Marsden, J. O., 2015b. Çöpler
Project Heap Leach Model Development and Gold Recovery Assessment – Final Rev 2. March 27, 2015. Metallurgium, Phoenix, AZ.
OreWin Pty. Ltd. (OreWin), 2020. Çöpler
District Master Plan 2020. Prepared for SSR Mining Inc. November 27, 2020.
OreWin, 2021. Çöpler District
Mineral Resource 2021 Technical Report Summary. Prepared for SSR Mining Inc. 29 September 2022.
OreWin, 2022. Çöpler District
Master Plan 2021 Technical Report Summary. Prepared for SSR Mining Inc. September 29, 2022.
Outotec, 2015a. Thickening Test Report
S1482TE Çöpler, September 16, 2015, Perth, Australia.
Outotec, 2015b. Thickening Test Report
S1482TE_B Çöpler, September 16, 2015, Perth, Australia.
Outotec, 2015c. Thickening Test Report
S1482TF Çöpler Appendix, September 16, 2015, Perth, Australia.
Outotec, 2015d. Thickening Test Report
S1482TF Çöpler (repeats), November 20, 2015, Perth, Australia.
Outotec, 2015e. Thickening Test Report
S1482TE_B Çöpler (Repeats), November 20, 2015, Perth Australia.
Ozgul, N. and Tursucu, A., 1984. Stratigraphy
of the Mesozoic carbonate sequence of the Munzuer Mountains (Easter Taurides), http://pascal-francis.inist.fr/vibad/index.php?action=getRecordDetail&idt=9240403
Parrish, I.S. 1997. Geologist's Gordian
knot: to cut or not to cut. Mining Engineering, vol. 49. pp 45–49.
Pyper, R., Description of Process Gold
Production Model and Assumptions, 4 February 2015, Kappes, Cassiday & Associates, Australia Pty Ltd., Perth, Western Australia.
Samuel Engineering Inc., 2011. Çöpler
Sulfide Expansion Project Prefeasibility Study, March 27, 2011.
SGS Lakefield Oretest, 2015. Anagold
Çöpler Sulfide Pilot Plant and Batch Testing Program, Pressure Oxidation and Cyanidation Campaign 5 Main Report, Job No: CP100,
October 30, 2015, Perth, Australia.
SRK, 2008. Çöpler Complex
(Manganese, Gold, Silver, Copper) Mining Project EIA Report, 2008, SRK Consulting.
SRK, 2012a. Assessment of Çöpler
Sulfide Tailings According to Waste Acceptance Criteria, August 17, 2012 (Memorandum) SRK Consulting.
SRK, 2012b. Çöpler Mine Sulfide
Expansion Feasibility Study – Environment and Permitting, November 2012, SRK Consulting (Turkey).
SRK, 2012c. Çöpler Gold Mine-Sulfide
Project Waste Geochemical Assessment, September 2012, SRK Consulting (Turkey).
| | 24-3 | |
| SSR Mining Inc. | Çöpler Property S-K 1300 Report | February 12, 2024 SLR Project No.: 138.21581.00006 |
SRK, 2014. Çöpler Complex
Mine Capacity Expansion Project, Final EIA Report. October 2014, SRK Consulting (Turkey).
SRK, 2015. Volume 1: Çöpler
Gold Mine Sulfide Expansion Project, ESIA Report. September 2015, SRK Consulting (Turkey).
SRK, 2019. Five-Year Water Management
Report. December 2019, SRK Consulting (Türkiye).
SRK, 2021. Çöpler Complex
Mine 2nd Capacity Expansion and Flotation Plant Project, Final EIA Report. March 2021, SRK Consulting (Türkiye).
SSR Mining Inc., 2023. Form 10-K. Annual
Report for the Fiscal Year Ended December 31, 2022. Filed on EDGAR on February 22, 2023.
SSR, 2022. Announcement: SSR Mining Announces
Exploration Results on the In-pit Copper-Gold Porphyry C2 Target at Çöpler, November 25, 2002.
Watts, Griffis and McQuat Limited, 2003.
Update of the Geology and Mineral Resources of the Çöpler Prospect, May 1, 2003.
WSP Golder, 2022. Çöpler
Tailings Storage Facility Operations Maintenance and Surveillance (OMS) Manual. June 2022. Golder Associates USA Inc.
WSP, 2023a. Copler Expansion Pit Slope
Designs. Prepared by WSP Danışmanlık ve Mühendislik Ltd.Şti
WSP, 2023b. Çöpler Mine Tailings
Storage Facility TSF-1 Design Report. October 2023. WSP USA Inc.
| | 24-4 | |
| SSR Mining Inc. | Çöpler Property S-K 1300 Report | February 12, 2024 SLR Project No.: 138.21581.00006 |
| 25.0 | Reliance on Information Provided by the Registrant |
This TRS has been prepared by SLR for SSR Mining Inc. The information,
conclusions, opinions, and estimates contained herein are based on:
| · | Information available to SLR at the time of preparation of this TRS. |
| · | Assumptions, conditions, and qualifications as set forth in this TRS. |
| · | Data, reports, and other information supplied by SSR and other third party sources. |
For the purpose of this TRS, SLR has relied on ownership information
provided by SSR in a legal opinion by Travis A. Cottrell, Land Manager & Permit Compliance Advisor, dated December 14, 2023, entitled
Çöpler Land Tenure Status Report. SLR has not researched property title or mineral rights for the Çöpler Project
as we consider it reasonable to rely on SSR and their legal counsel who is responsible for maintaining this information.
SLR has relied on SSR for guidance on applicable taxes, royalties, and
other government levies or interests, applicable to revenue or income from the Project in the Executive Summary and Section 19. As the
Project has been in operation for over ten years, SSR has considerable experience in this area.
The Qualified Persons have taken all appropriate steps, in their professional
opinion, to ensure that the above information from SSR is sound.
Except as provided by applicable laws, any use of this TRS by any third
party is at that party’s sole risk.
| | 25-1 | |
| SSR Mining Inc. | Çöpler Property S-K 1300 Report | February 12, 2024 SLR Project No.: 138.21581.00006 |
| 26.0 | Date and Signature Page |
This report titled “Technical Report Summary on the Çöpler
Property, Türkiye” with an effective date of October 31, 2023 was prepared and signed by:
| |
(Signed)
SLR International Corporation |
| |
|
| Dated
at Lakewood, CO |
|
| February
12, 2024 |
SLR
International Corporation |
| |
|
| |
|
|
(Signed)
RSC Consulting Ltd. |
| |
|
| Dated
at Dunedin, New Zealand |
|
| February
12, 2024 |
RSC
Consulting Ltd. |
| |
|
| |
|
| |
(Signed)
WSP USA Inc. |
| |
|
| Dated
at Lakewood, CO |
|
| February
12, 2024 |
WSP
USA Inc. |
| |
|
| |
(Signed)
Ausenco Services Pty Ltd. |
| |
|
| Dated
at South Brisbane, Australia |
|
| February
12, 2024 |
Ausenco
Services Pty Ltd. |
| | 26-1 | |
| SSR Mining Inc. | Çöpler Property S-K 1300 Report | February 12, 2024 SLR Project No.: 138.21581.00006 |
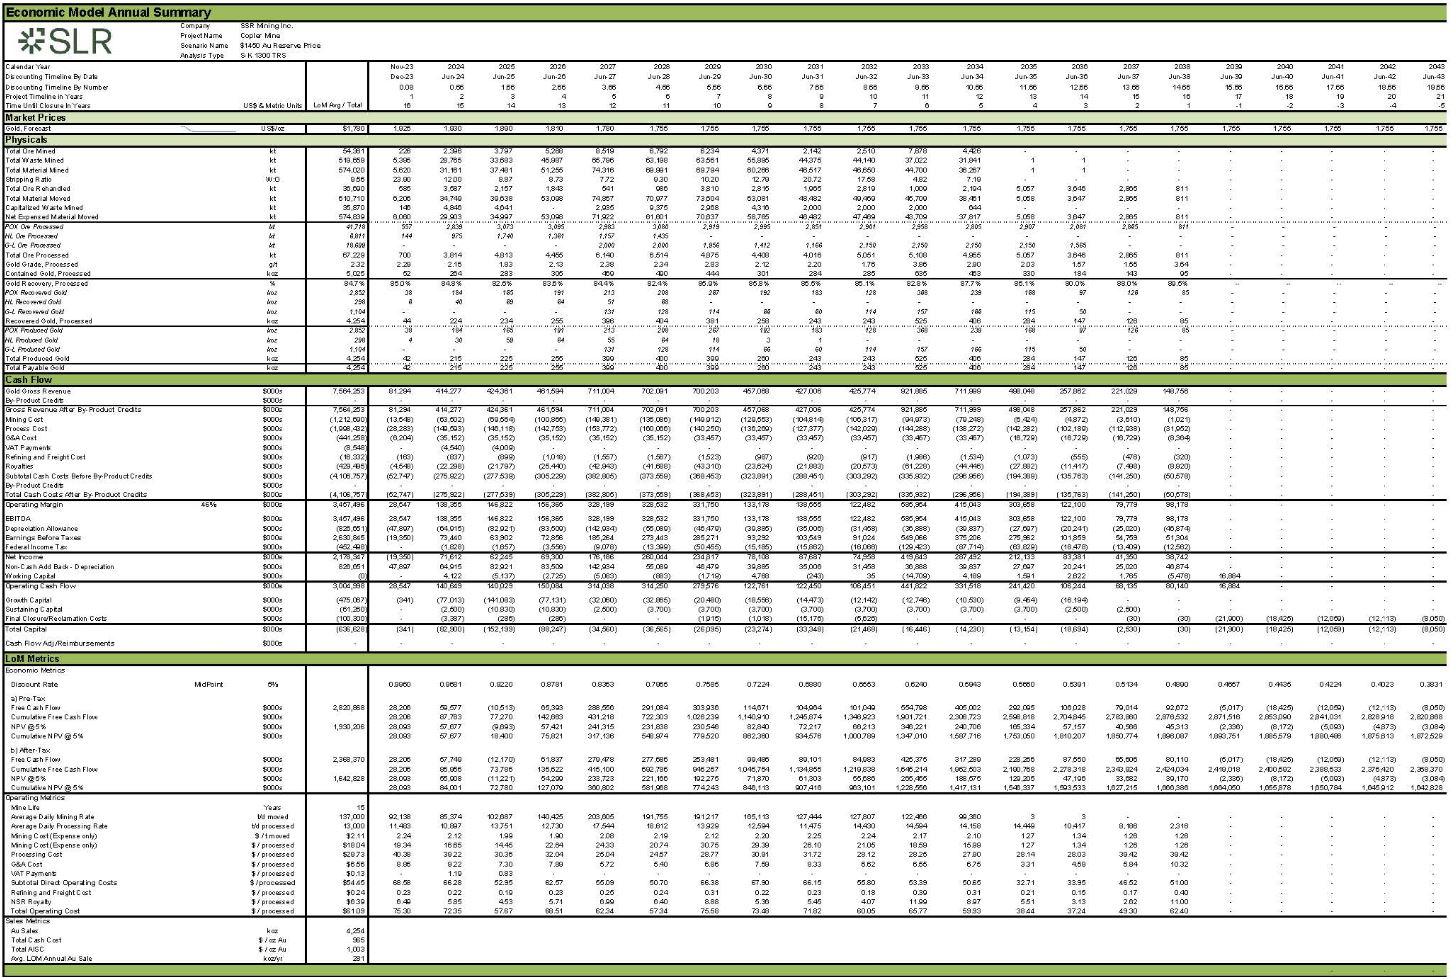
-
- -SSR Mining Inc. | Çöpler Property February 12, 2024
S-K 1300 Report SLR Project No.: 138.21581.00006
27.0 Appendix 1
Economic Model Annual Summary
SLR Company SSR Mining Inc.
Project Name Copler Mine
Scenario Name $1450 Au Reserve Price
Analysis Type S-K 1300 TRS
Calendar Year Nov 23 2024 2025 2026 2027 2028 2029 2030 2031 2032 2033 2034 2035 2036 2037 2038 2039 2040 2041 2042 2043
Discounting Timeline By Date Dec-23 Jun-24 Jun-25 Jun-26 Jun-27 Jun-28 Jun-29 Jun-30 Jun-31 Jun-32 Jun-33 Jun-34 Jun-35 Jun-36 Jun-37
Jun-38 Jun-39 Jun-40 Jun-41 Jun-42 Jun-43
Discounting Timeline By Number 0.08 0.66 1.66 2.66 3.66 4.66 5.66 6.66 7.66 8.66 9.66 10.66 11.66 12.66 13.66 14.66 15.66 16.66 17.66
18.66 19.66
Project Timeline in Years 1 2 3 4 5 6 7 8 9 10 11 12 13 14 15 16 17 18 19 20 21
Time Until Closure In Years US$ & Metric Units LoM Avg / Total 16 15 14 13 12 11 10 9 8 7 6 5 4 3 2 1 -1 -2 -3 -4 -5
Market Prices
Gold, Forecast __________ US$/oz $1,780 1,925 1,930 1,890 1,810 1,780 1,755 1,755
1,755 1,755 1,755
1,755 1,755 1,755
1,755 1,755 1,755
1,755 1,755 1,755
1,755 1,755
Physicals
Total Ore Mined kt 54,361 226 2,396 3,797 5,268 8,519 6,792 6,234 4,371 2,142 2,510 7,678 4,426 - - - - - - - - -
Total Waste Mined kt 519,659 5,395 28,765 33,683 45,987 65,796 63,198 63,561 55,895 44,375 44,140 37,022 31,841 1 1 - - - - - - -
Total Material Mined kt 574,020 5,620 31,161 37,481 51,255 74,316 69,991 69,794 60,266 46,517 46,650 44,700 36,267 1 1 - - - - - - -
Stripping Ratio W:O 9.56 23.90 12.00 8.87 8.73 7.72 9.30 10.20 12.79 20.72 17.58 4.82 7.19 - - - - - - - - -
Total Ore Rehandled kt 36,690 585 3,587 2,157 1,843 541 986 3,810 2,815 1,965 2,819 1,009 2,194 5,057 3,646 2,865 811 - - - - -
Total Material Moved kt 610,710 6,206 34,749 39,638 53,098 74,857 70,977 73,604 63,081 48,482 49,469 45,709 38,461 5,058 3,647 2,865
811 - - - - -
Capitalized Waste Mined kt 35,870 146 4,846 4,641 - 2,935 9,375 2,968 4,316 2,000 2,000 2,000 644 - - - - - - - - -
Net Expensed Material Moved kt 574,839 6,060 29,903 34,997 53,098 71,922 61,601 70,637 58,765 46,482 47,469 43,709 37,817 5,058 3,647
2,865 811 - - - - -
P OX Ore Processed kt 41,718 557 2,830 3,073 3,005
2,083 3,080 2,010
2,005 2,851 2,001 2,958
2,805 2,907 2,081 2,805 811 - - - - -
HL Ore Processed kt 6,811 144 975 1,740 1,301
1,157 1,435 - - - - - - - - - - - - - - -
G-L Ore Processed kt 18,000 - - - - 2,000 2,000 1,050
1,412 1,100 2,150 2,150 2,150 2,150 1,505 - - - - - - -
Total Ore Processed kt 67,229 700 3,814 4,813 4,455 6,140 6,514 4,875 4,408 4,016 5,051 5,108 4,955 5,057 3,646 2,865 811 - - - - -
Gold Grade, Processed g/t 2.32 2.29 2.15 1.83 2.13 2.38 2.34 2.83 2.12 2.20 1.76 3.86 2.90 2.03 1.57 1.55 3.64 - - - - -
Contained Gold, Processed k oz 5,025 52 264 283 305 469 490 444 301 284 285 635 463 330 184 143 95 - - - - -
Gold Recovery, Processed % 84.7% 85.0% 84.8% 82.6% 83.6% 84.4% 82.4% 85.9% 85.8% 85.5% 85.1% 82.8% 87.7% 86.1% 80.0% 88.0% 89.5% -- --
-- -- --
P OX Recovered Gold kt 2,852 38 184 105 101 213
208 207 102 183 128 308 230
168 97 120
85 - - - - -
HL Recovered Gold kt 298 6 40 69
64 51 68 - - - - - - - - - - - - - - -
G-L Recovered Gold kt 1,104 - - - - 131 128 114 66 60 114 157 166
115 50 - - - - - - -
Recovered Gold, Processed k oz 4,254 44 224 234 255 396 404 381 258 243 243 525 406 284 147 126 85 - - - - -
P OX Produced Gold kt 2,852 38 184 165 101 213
208 207 102 183 128 308
230 108 07
120 85 - - - - -
HL Produced Gold kt 208 4 30 50 04 55 04
18 3 1 - - - - - - - - - - - -
G-L Produced Gold kt 1,104 - - - - 131 128 114 66 60 114 157 100
115 50 - - - - - - -
Total Produced Gold k oz 4,254 42 215 225 255 399 400 399 260 243 243 525 406 284 147 126
85 - - - - -
Total Payable Gold k oz 4,254 42 215 225 255 399 400 399 260 243 243 525 406 284 147 126 85 - - - - -
Cash Flow
Gold Gross Revenue $000s 7,564,253 81,294 414,277 424,361 461,594 711,004 702,091 700,203 457,068 427,006 425,774 921,885 711,999 498,048
257,862 221,029 148,756 - - - - -
By-Product Credits $000s - - - - - - - - - - - - - - - - - - - - - -
Gross Revenue After By-Product Credits $000s 7,564,253 81,294 414,277 424,361 461,594 711,004 702,091 700,203 457,068 427,006 425,774
921,885 711,999 498,048 257,862 221,029 148,756 - - - - -
Mining Cost $000s (1,212,690) (13,548) (63,502) (69,564) (100,865) (149,381) (135,086) (149,912) (129,553) (104,814) (106,317) (94,973)
(79,248) (6,424) (4,872) (3,610) (1,021) - - - - -
Process Cost $000s (1,998,432) (28,283) (149,593) (146,118) (142,753) (153,772) (160,066) (140,250) (136,269) (127,377) (142,029) (144,288)
(138,272) (142,282) (102,189) (112,938) (31,952) - - - - -
G&A Cost $000s (441,258) (6,204) (35,152) (35,152) (35,152) (35,152) (35,152) (33,457) (33,457) (33,457) (33,457) (33,457) (33,457)
(16,729) (16,729) (16,729) (8,364) - - - - -
VAT Payments $000s (8,548) - (4,540) (4,009) - - - - - - - - - - - - - - - - - -
Refining and Freight Cost $000s (16,332) (163) (837) (899) (1,018) (1,557) (1,567) (1,523) (987) (920) (917) (1,986) (1,534) (1,073)
(555) (476) (320) - - - - -
Royalties $000s (429,495) (4,548) (22,298) (21,797) (25,440) (42,943) (41,688) (43,310) (23,624) (21,883) (20,573) (61,228) (44,446)
(27,882) (11,417) (7,498) (8,920) - - - - -
Subtotal Cash Costs Before By-Product Credits $000s (4,106,757) (52,747) (275,922) (277,539) (305,229) (382,805) (373,559) (368,453)
(323,891) (288,451) (303,292) (335,932) (296,956) (194,389) (135,763) (141,250) (50,578) - - - - -
By-Product Credits $000s - - - - - - - - - - - - - - - - - - - - - -
Total Cash Costs After By-Product Credits $000s (4,106,757) (52,747) (275,922) (277,539) (305,229) (382,805) (373,559) (368,453) (323,891)
(288,451) (303,292) (335,932) (296,956) (194,389) (135,763) (141,250) (50,578) - - - - -
Operating Margin 46% $000s 3,457,496 28,547 138,355 146,822 156,365 328,199 328,532 331,750 133,178 138,555 122,482 585,954 415,043 303,658
122,100 79,779 98,178 - - - - -
EBITDA $000s 3,457,496 28,547 138,355 146,822 156,365 328,199 328,532 331,750 133,178 138,555 122,482 585,954 415,043 303,658 122,100
79,779 98,178 - - - - -
Depreciation Allowance $000s (826,651) (47,897) (64,915) (82,921) (83,509) (142,934) (55,089) (46,479) (39,885) (35,006) (31,458) (36,888)
(39,837) (27,697) (20,241) (25,020) (46,874) - - - - -
Earnings Before Taxes $000s 2,630,845 (19,350) 73,440 63,902 72,856 185,264 273,443 285,271 93,292 103,549 91,024 549,066 375,206 275,962
101,859 54,759 51,304 - - - - -
Federal Income Tax $000s (452,498) - (1,828) (1,657) (3,556) (9,078) (13,399) (50,455) (15,185) (15,862) (16,066) (129,423) (87,714)
(63,829) (18,478) (13,409) (12,562) - - - - - Net Income $000s 2,178,347 (19,350) 71,612 62,245 69,300 176,186 260,044 234, 817 78,108
87,687 74,958 419,643 287,492 212,133 83,381 41,350 38,742 - - - - -
Non-Cash Add Back - Depreciation $000s 826,651 47,897 64,915 82,921 83,509 142,934 55,089 46,479 39,885 35,006 31,458 36,888 39,837 27,697
20,241 25,020 46,874 - - - - -
Working Capital $000s (0) - 4,122 (5,137) (2,725) (5,083) (883) (1,719) 4,768 (243) 35 (14,709) 4,189 1,591 2,622 1,765 (5,476) 16,884
- - - -
Operating Cash Flow $000s 3,004,998 28,547 140,649 140,029 150,084 314,038 314,250 279,576 122,761 122,450 106,451 441,822 331,518 241,420
106,244 68,135 80,140 16,884 - - - -
Growth Capital $000s (475,067) (341) (77,013) (141,083) (77,131) (32,060) (32,865) (20,480) (18,556) (14,473) (12,142) (12,746) (10,530)
(9,454) (16,194) - - - - - - -
Sustaining Capital $000s (61,260) - (2,500) (10,830) (10,830) (2,500) (3,700) (3,700) (3,700) (3,700) (3,700) (3,700) (3,700) (3,700)
(2,500) (2,500) - - - - - -
Final Closure/Reclamation Costs $000s (100,300) - (3,387) (286) (286) - - (1,915) (1,018) (15,176) (5,626) - - - - (30) (30) (21,900)
(18,425) (12,059) (12,113) (8,050)
Total Capital $000s (636,628) (341) (82,900) (152,199) (88,247) (34,560) (36,565) (26,095) (23,274) (33,348) (21,468) (16,446) (14,230)
(13,154) (18,694) (2,530) (30) (21,900) (18,425) (12,059) (12,113) (8,050)
Cash Flow Adj./Reimbursements $000s - - - - - - - - - - - - - - - - - - - - - -
LoM Metrics
Economic Metrics
Discount Rate Mid Point 5% 0.9960 0.9681 0.9220 0.8781 0.8363 0.7965 0.7585 0.7224 0.6880 0.6553 0.6240 0.5943 0.5660 0.5391 0.5134 0.4890
0.4657 0.4435 0.4224 0.4023 0.3831
a) Pre-Tax
Free Cash Flow $000s 2,820,868 28,206 59,577 (10,513) 65,393 288,556 291,084 303,936 114,671 104,964 101,049 554,798 405,002 292,095
106,028 79,014 92,672 (5,017) (18,425) (12,059) (12,113) (8,050)
Cumulative Free Cash Flow $000s 28,206 87,783 77,270 142,663 431,218 722,303 1,026,239 1,140,910 1,245,874 1,346,923 1,901,721 2,306,723
2,598,818 2,704,845 2,783,860 2,876,532 2,871,516 2,853,090 2,841,031 2,828,918 2,820,868
NPV @ 5% $000s 1,930,206 28,093 57,677 (9,693) 57,421 241,315 231,838 230,546 82,840 72,217 66,213 346,221 240,706 165,334 57,157 40,566
45,313 (2,336) (8,172) (5,093) (4,873) (3,084)
Cumulative NPV @ 5% $000s 28,093 57,677 18,400 75,821 317,136 548,974 779,520 862,360 934,576 1,000,789 1,347,010 1,587,716 1,753,050
1,810,207 1,850,774 1,896,087 1,893,751 1,885,579 1,880,486 1,875,613 1,872,529
b) After-Tax
Free Cash Flow $000s 2,368,370 28,206 57,749 (12,170) 61,837 279,478 277,686 253,481 99,486 89,101 84,983 425,375 317,289 228,266 87,550
65,606 80,110 (5,017) (18,425) (12,059) (12,113) (8,050)
Cumulative Free Cash Flow $000s 28,206 85,956 73,786 135,622 415,100 692,786 946,267 1,045,754 1,134,855 1,219,838 1,645,214 1,962,503
2,190,768 2,278,318 2,343,924 2,424,034 2,419,018 2,400,592 2,388,533 2,376,420 2,368,370
NPV @ 5% $000s 1,642,828 28,093 55,908 (11,221) 54,299 233,723 221,166 192,275 71,870 61,303 55,686 265,455 188,575 129,205 47,196 33,682
39,170 (2,336) (8,172) (5,093) (4,873) (3,084)
Cumulative NPV @ 5% $000s 28,093 84,001 72,780 127,079 360,802 581,968 774,243 846,113 907,416 963,101 1,228,556 1,417,131 1,546,337
1,593,533 1,627,215 1,666,386 1,664,050 1,655,878 1,650,784 1,645,912 1,642,828
Operating Metrics
Mine Life Years 15
Average Daily Mining Rate t/d moved 137,000 92,138 85,374 102,687 140,425 203,605 191,755 191,217 165,113 127,444 127,807 122,466 99,360
3 3 - - - - - - -
Average Daily Processing Rate t/d processed 13,000 11,483 10,897 13,751 12,730 17,544 18,612 13,929 12,594 11,475 14,430 14,594 14,158
14,449 10,417 8,186 2,316 - - - - -
Mining Cost (Expense only) $ / t moved $2.11 2.24 2.12 1.99 1.90 2.08 2.19 2.12 2.20 2.25 2.24 2.17 2.10 1.27 1.34 1.26 1.26 - - - -
-
Mining Cost (Expense only) $ / processed $18.04 19.34 16.65 14.45 22.64 24.33 20.74 30.75 29.39 26.10 21.05 18.59 15.99 1.27 1.34 1.26
1.26 - - - - -
Processing Cost $ / Processed $29.73 40.38 39.22 30.36 32.04 25.04 24.57 28.77 30.91 31.72 28.12 28.25 27.90 28.14 28.03 39.42 39.42
- - - - -
G&A Cost $ / processed $6.56 8.86 9.22 7.30 7.89 5.72 5.40 6.86 7.59 8.33 6.62 6.55 6.75 3.31 4.59 5.84 10.32 - - - - -
VAT Payments $ / processed $0.13 - 1.19 0.83 - - - - - - - - - - - - - - - - - -
Subtotal Direct Operating Costs $ / processed $54.45 68.58 66.28 52.95 62.57 55.09 50.70 66.38 67.90 66.15 55.80 53.39 50.65 32.71 33.95
46.52 51.00 - - - - -
Refining and Freight Cost $ / processed $0.24 0.23 0.22 0.19 0.23 0.25 0.24 0.31 0.22 0.23 0.18 0.39 0.31 0.21 0.15 0.17 0.40 - - - -
-
NSR Royalty $ / processed $6.39 6.49 5.85 4.53 5.71 6.99 6.40 8.88 5.36 5.45 4.07 11.99 8.97 5.51 3.13 2.62 11.00 - - - - -
Total Operating Cost $ / processed $61.09 75.30 72.35 57.67 68.51 62.34 57.34 75.58 73.48 71.82 60.05 65.77 59.93 38.44 37.24 49.30 62.40
- - - - -
Sales Metrics
Au Sales k oz 4,254
Total Cash Cost $ / oz Au 965
Total AISC $ / oz Au 1,003
Avg. LOM Annual Au Sale k oz/yr 281
| | 27-1 | |
| SSR Mining Inc. | Çöpler Property S-K 1300 Report | February 12, 2024 SLR Project No.: 138.21581.00006 |

| |
Making
Sustainability Happen |
| |
| |
|
Technical Report Summary on the Marigold
Complex, Nevada, USA
S-K 1300 Report
SSR Mining Inc.
SLR Project No.: 138.21581.00002
Effective Date:
September 30, 2023
Signature Date:
February 12, 2024
Prepared by:
SLR International Corporation |
| |
| |
| |
| |
Making
Sustainability Happen |
| SSR Mining Inc. | Marigold Complex S-K 1300 Report | February 12, 2024 SLR Project No.: 138.21581.00002 |
Technical Report Summary on the
Marigold Complex, Nevada, USA
SLR Project No.: 138.21581.00002
Prepared by
SLR International Corporation
1658 Cole Blvd, Suite 100
Lakewood, CO 80401
SSR Mining Inc.
6900 E. Layton Avenue, Suite 1300
Denver, CO 80237
USA
Effective Date - September 30, 2023
Signature Date - February 12, 2024
| Distribution: |
1 copy - SSR Mining Inc. |
| |
1 copy - SLR International Corporation |
| SSR Mining Inc. | Marigold Complex S-K 1300 Report | February 12, 2024 SLR Project No.: 138.21581.00002 |
Cautionary Note Regarding Forward-Looking Statements:
Certain statements contained in this report are "forward-looking
statements" within the meaning of Section 27A of the Securities Act of 1933, as amended (the “Securities Act”),
and Section 21E of the Securities Exchange Act of 1934, as amended (the “Exchange Act”), and are intended to be covered
by the safe harbor provided for under these sections. Forward looking statements can be identified with words such as “may,”
“will,” “could,” “should,” “expect,” “plan,” “anticipate,” “believe,”
“intend,” “estimate,” “projects,” “predict,” “potential,” “continue”
and similar expressions, as well as statements written in the future tense. Forward-looking statements are based on information known
at such time and/or with a good faith belief with respect to future events. Such statements are subject to risks and uncertainties that
could cause actual performance or results to differ materially from those expressed in the forward-looking statements. Many of these risks
and uncertainties cannot be controlled or predicted. Given these risks and uncertainties, readers are cautioned not to place undue reliance
on forward-looking statements. Forward-looking statements include, among things: metal price assumptions, cash flow forecasts, projected
capital and operating costs, metal recoveries, mine life and production rates, and other assumptions used in this report.
Such forward-looking information and statements are based on a number
of material factors and assumptions, including, but not limited to: the inherent speculative nature of exploration results; the ability
to explore; communications with local stakeholders; maintaining community and governmental relations; status of negotiations of joint
ventures; weather conditions at our operations; commodity prices; the ultimate determination of and realization of Mineral Reserves; existence
or realization of Mineral Resources; the development approach; availability and receipt of required approvals, titles, licenses and permits;
sufficient working capital to develop and operate the mines and implement development plans; access to adequate services and supplies;
foreign currency exchange rates; interest rates; access to capital markets and associated cost of funds; availability of a qualified work
force; ability to negotiate, finalize, and execute relevant agreements; lack of social opposition to our mines or facilities; lack of
legal challenges with respect to our properties; the timing and amount of future production; the ability to meet production, cost, and
capital expenditure targets; timing and ability to produce studies and analyses; capital and operating expenditures; economic conditions;
availability of sufficient financing; the ultimate ability to mine, process, and sell mineral products on economically favorable terms;
and any and all other timing, exploration, development, operational, financial, budgetary, economic, legal, social, geopolitical, regulatory
and political factors that may influence future events or conditions. While we consider these factors and assumptions to be reasonable
based on information currently available to us, they may prove to be incorrect.
The above list is not exhaustive list of the factors that may affect
any of the forward-looking statements and information included in this report, and such statements and information will not be updated
to reflect events or circumstances arising after the date of such statements or to reflect the occurrence of anticipated or unanticipated
events.
This technical report summary also contains financial measures which
are not recognized under U.S. generally accepted accounting principles.
| SSR Mining Inc. | Marigold Complex S-K 1300 Report | February 12, 2024 SLR Project No.: 138.21581.00002 |
Table of Contents
| 1.0 Executive Summary |
1-1 |
| 1.1 Summary |
1-1 |
| 1.2 Economic Analysis |
1-7 |
| 1.3 Technical Summary |
1-11 |
| 2.0 Introduction |
2-1 |
| 2.1 Site Visits |
2-1 |
| 2.2 Sources of Information |
2-1 |
| 2.3 List of Abbreviations |
2-3 |
| 3.0 Property Description |
3-1 |
| 3.1 Location |
3-1 |
| 3.2 Land Tenure |
3-3 |
| 3.3 Encumbrances and Royalties |
3-14 |
| 3.4 Required Permits and Status |
3-14 |
| 3.5 Other Significant Factors and Risks |
3-15 |
| 4.0 Accessibility, Climate, Local Resources, Infrastructure and Physiography |
4-1 |
| 4.1 Accessibility |
4-1 |
| 4.2 Climate |
4-1 |
| 4.3 Local Resources |
4-1 |
| 4.4 Infrastructure |
4-1 |
| 4.5 Physiography |
4-2 |
| 5.0 History |
5-1 |
| 5.1 Ownership, Exploration, and Development History |
5-1 |
| 5.2 Past Production |
5-7 |
| 6.0 Geological Setting, Mineralization, and Deposit |
6-1 |
| 6.1 Regional Geology |
6-1 |
| 6.2 Local Geology |
6-3 |
| 6.3 Property Geology |
6-8 |
| 6.4 Deposit Type |
6-29 |
| 7.0 Exploration |
7-1 |
| 7.1 Geophysical and Geochemical Surveys |
7-2 |
| 7.2 Drilling |
7-3 |
| 8.0 Sample Preparation, Analyses, and Security |
8-1 |
| | i | |
| SSR Mining Inc. | Marigold Complex S-K 1300 Report | February 12, 2024 SLR Project No.: 138.21581.00002 |
| 8.1 Sample Preparation and Analysis |
8-1 |
| 8.2 Quality Assurance and Quality Control |
8-5 |
| 8.3 Sample Security |
8-15 |
| 8.4 QP Opinion |
8-16 |
| 9.0 Data Verification |
9-1 |
| 9.1 Marigold Database Migration |
9-1 |
| 9.2 QP Opinion |
9-2 |
| 10.0 Mineral Processing and Metallurgical Testing |
10-1 |
| 10.1 Marigold Metallurgical Test Work |
10-1 |
| 10.2 Buffalo Valley Metallurgical Test Work |
10-5 |
| 10.3 QP Opinion |
10-8 |
| 11.0 Mineral Resource Estimates |
11-1 |
| 11.1 Summary |
11-1 |
| 11.2 Marigold |
11-3 |
| 11.3 Buffalo Valley |
11-30 |
| 12.0 Mineral Reserve Estimates |
12-1 |
| 12.1 Summary |
12-1 |
| 12.2 Conversion to Mineral Reserves |
12-2 |
| 12.3 Cut-Off Grade |
12-3 |
| 12.4 Royalties, Net Proceeds and Excise Tax |
12-4 |
| 12.5 Dilution |
12-4 |
| 12.6 Mining Recovery |
12-4 |
| 12.7 Comparison with Previous Estimates |
12-4 |
| 12.8 QP Opinion |
12-4 |
| 13.0 Mining Methods |
13-1 |
| 13.1 Geotechnical, Hydrological, Pit, and Other Design Parameters |
13-1 |
| 13.2 Pit Phases and Timing |
13-4 |
| 13.3 Production Rates, Mine Life, Dimensions and Dilution Factors |
13-8 |
| 13.4 Stripping Requirements |
13-8 |
| 13.5 Required Mining Fleet and Machinery |
13-9 |
| 13.6 Ore Control Drilling and Method |
13-10 |
| 13.7 Drilling and Blasting |
13-11 |
| 13.8 Loading Operations |
13-11 |
| 13.9 Hauling Operations |
13-12 |
| | ii | |
| SSR Mining Inc. | Marigold Complex S-K 1300 Report | February 12, 2024 SLR Project No.: 138.21581.00002 |
| 13.10 Mine Support |
13-22 |
| 13.11 Mine Maintenance |
13-22 |
| 13.12 Mine General and Administration |
13-23 |
| 13.13 Mine Safety |
13-23 |
| 13.14 Mine Dewatering |
13-23 |
| 13.15 Mine Workforce |
13-28 |
| 14.0 Processing and Recovery Methods |
14-29 |
| 14.1 Introduction |
14-29 |
| 14.2 Heap Leach Pad Description |
14-31 |
| 14.3 Description of Ponds |
14-32 |
| 14.4 Carbon Adsorption |
14-32 |
| 14.5 Carbon Elution and Electrowinning |
14-32 |
| 14.6 Carbon Regeneration |
14-32 |
| 14.7 Refining |
14-32 |
| 14.8 Ventilation |
14-33 |
| 14.9 Planned Processing Upgrade Projects |
14-33 |
| 14.10 Reagents |
14-33 |
| 14.11 Gold Recovery |
14-34 |
| 15.0 Infrastructure |
15-1 |
| 15.1 Site Access, Power, and Water |
15-1 |
| 15.2 Buildings and Facilities |
15-2 |
| 15.3 Explosives Magazine |
15-3 |
| 15.4 Tailings Storage Facility and Water Diversion |
15-3 |
| 15.5 Leach Pads and Solution Ponds |
15-3 |
| 15.6 Waste Rock Storage Areas |
15-3 |
| 16.0 Market Studies |
16-8 |
| 16.1 Marketing and Metal Prices |
16-8 |
| 16.2 Contracts |
16-8 |
| 17.0 Environmental Studies, Permitting, and Plans, Negotiations, or Agreements with Local Individuals or Groups |
17-1 |
| 17.1 Summary |
17-1 |
| 17.2 Environmental Studies |
17-1 |
| 17.3 Project Permitting |
17-2 |
| 17.4 Environmental Impacts |
17-4 |
| 17.5 Environmental Monitoring and Reporting |
17-4 |
| | iii | |
| SSR Mining Inc. | Marigold Complex S-K 1300 Report | February 12, 2024 SLR Project No.: 138.21581.00002 |
| 17.6 Community Relations and Social Responsibilities |
17-4 |
| 17.7 Mine Closure Requirements |
17-5 |
| 18.0 Capital and Operating Costs |
18-1 |
| 18.1 Capital Costs |
18-1 |
| 18.2 Operating Costs |
18-2 |
| 19.0 Economic Analysis |
19-1 |
| 19.1 Economic Criteria |
19-1 |
| 19.2 Cash Flow Analysis |
19-2 |
| 19.3 Sensitivity Analysis |
19-4 |
| 20.0 Adjacent Properties |
20-1 |
| 21.0 Other Relevant Data and Information |
21-1 |
| 22.0 Interpretation and Conclusions |
22-1 |
| 22.1 Geology and Mineral Resources |
22-1 |
| 22.2 Mining and Mineral Reserves |
22-2 |
| 22.3 Mineral Processing |
22-3 |
| 22.4 Infrastructure |
22-4 |
| 22.5 Environment |
22-5 |
| 22.6 Capital and Operating Costs |
22-5 |
| 23.0 Recommendations |
23-1 |
| 23.1 Geology and Mineral Resources |
23-1 |
| 23.2 Mining and Mineral Reserves |
23-1 |
| 23.3 Mineral Processing |
23-1 |
| 23.4 Infrastructure |
23-2 |
| 23.5 Environment |
23-2 |
| 23.6 Capital and Operating Costs |
23-2 |
| 24.0 References |
24-1 |
| 25.0 Reliance on Information Provided by the Registrant |
25-1 |
| 26.0 Date and Signature Page |
26-1 |
| 27.0 Appendix 1 |
27-1 |
| 27.1 Economic Model Annual Summary |
27-1 |
Tables
| Table 1-1: After-Tax Cash Flow Summary |
1-10 |
| Table 1-3: Summary of Marigold Mineral Reserves Estimate as of September 30, 2023 |
1-1 |
| | iv | |
| SSR Mining Inc. | Marigold Complex S-K 1300 Report | February 12, 2024 SLR Project No.: 138.21581.00002 |
| Table 1-4: Capital Costs Summary |
1-5 |
| Table 1-5: Operating Costs Summary |
1-5 |
| Table 3-1: List of Land Package Areas (in hectares) |
3-3 |
| Table 3-2: MMC Surface Lands |
3-5 |
| Table 3-3: MMC-Owned Unpatented Mining Claims within the Marigold Mine Project Area |
3-6 |
| Table 3-4: MMC-Owned Unpatented Mining Claims within the Sterling Project Area |
3-7 |
| Table 3-5: Decker Lease Unpatented Mining Claims |
3-10 |
| Table 3-6: Vek & Andrus Lease Unpatented Mining and Millsite Claims |
3-10 |
| Table 3-7: Euro-Nevada Lease Unpatented Mining Claims |
3-11 |
| Table 3-8: Franco-Nevada Lease Unpatented Mining Claims |
3-12 |
| Table 3-9: Nevada North Lease Unpatented Mining Claims |
3-13 |
| Table 3-10: New Nevada 2006 Unpatented Mining Claims |
3-13 |
| Table 3-11: Waseco Options Unpatented Mining Claims |
3-14 |
| Table 5-1: Summary of Historical Exploration |
5-5 |
| Table 5-2: Marigold Historical Production from August 1989 to April 1, 2014 |
5-7 |
| Table 5-3: Marigold Production from April 1, 2014 to September 30, 2023 |
5-7 |
| Table 7-1: Summary of Exploration Completed by SSR |
7-1 |
| Table 7-2: Summary of Drilling at Marigold |
7-4 |
| Table 7-3: Summary of Drilling at Buffalo Valley |
7-4 |
| Table 7-4: Summary of Drilling at Trenton Canyon |
7-5 |
| Table 8-1: Analytical Methods for Gold for the Marigold Assay Resource Database |
8-3 |
| Table 8-2: Comparison of Valmy Deposit NN Mean Gold Grades |
8-9 |
| Table 8-3: List of CRM Standards used between 2018 and June 2023 |
8-10 |
| Table 8-4: Number of Blanks and Field Duplicates |
8-13 |
| Table 10-1: Summary Metallurgical Results, Buffalo Valley Intrusive Drill Core Composites |
10-6 |
| Table 10-2: Gold Recovery by Lithology |
10-7 |
| Table 11-2: Outlier Restriction Values and Distance for Various Domains |
11-9 |
| Table 11-3: Correlogram Parameters Used to Estimate Different Domains |
11-11 |
| Table 11-4: Basic Au g/t Statistics of 7.6 m Bench Composites within the Mineralized Envelopes by Domain |
11-13 |
| Table 11-5: Block Model Parameters |
11-13 |
| Table 11-6: Model Attributes |
11-14 |
| Table 11-7: Probability Percentages for Cells Au>0.14 g/t |
11-15 |
| Table 11-8: Search Parameters for Mineralized Stockpile |
11-16 |
| Table 11-9: Summary of Density for Different Material |
11-17 |
| | v | |
| SSR Mining Inc. | Marigold Complex S-K 1300 Report | February 12, 2024 SLR Project No.: 138.21581.00002 |
| Table 11-10: Resource Classification Parameters |
11-18 |
| Table 11-11: Estimation Variance Statistics |
11-24 |
| Table 11-12: Marigold Resource Pit Parameters and Cut-off Grade |
11-27 |
| Table 11-13: Details of Marigold Mineral Resources Estimate Exclusive of Mineral Reserves as of September 30, 2023 |
11-28 |
| Table 11-14: Ore Reconciliation for the Period January 1, 2018, and June 30, 2023 |
11-29 |
| Table 11-15: Length Weighted Gold Assays (g/t) Statistics of Raw Samples by Estimation Domain |
11-33 |
| Table 11-16: AUFA and AUCN Assay Composites |
11-35 |
| Table 11-17: Capping Values for AUFE (g/t) |
11-36 |
| Table 11-18: Variogram Models (AUFE) |
11-38 |
| Table 11-19: Length Weighted Gold Assays (g/t) Statistics of Composite Samples by Domain |
11-39 |
| Table 11-20: Block Model parameters (Mine Grid X, Y, Z in feet) |
11-44 |
| Table 11-21: Estimated Variables |
11-44 |
| Table 11-22: Volumetric Models Generated for Estimation Domaining and Grade Estimation |
11-45 |
| Table 11-23: Estimation Domain Boundary Types |
11-47 |
| Table 11-24: Grade Interpolation Parameters for AUFE |
11-48 |
| Table 11-25: Fire Assay Equivalent Regression Parameters (from AUFA and AUCN) |
11-50 |
| Table 11-26: Density Data Statistics |
11-51 |
| Table 11-27: Classification Rules |
11-52 |
| Table 11-28: Statistical Summary of Gold Grade Estimates (g/t) |
11-57 |
| Table 11-29: Buffalo Valley Resource Pit Parameters and Cut-off Grades |
11-3 |
| Table 11-30: Details of Buffalo Valley Mineral Resources Estimate Exclusive of Mineral Reserves as of July 31, 2023 |
11-4 |
| Table 12-1: Summary of Marigold Mineral Reserves Estimate as of September 30, 2023 |
12-1 |
| Table 12-2: Key Economic Parameters for Mineral Reserves Estimate |
12-3 |
| Table 13-1: Overall Slope Angles by Azimuth |
13-4 |
| Table 13-2: Mining Phase Design Summary |
13-5 |
| Table 13-3: Annual Production Schedule Tonnes Mined |
13-8 |
| Table 13-4: Marigold Mining Fleet Equipment List |
13-10 |
| Table 13-5: LOM Average Maintenance KPI of the Marigold Mine Equipment Fleet |
13-22 |
| Table 13-6: RIB Design Criteria |
13-26 |
| Table 15-1: Pump Assets |
15-1 |
| Table 16-1: Economic Analysis Metal Price Assumptions |
16-8 |
| | vi | |
| SSR Mining Inc. | Marigold Complex S-K 1300 Report | February 12, 2024 SLR Project No.: 138.21581.00002 |
| Table 17-1: Baseline Studies Supporting the EA |
17-1 |
| Table 17-2: Marigold Mine Environmental Permits for Operation |
17-2 |
| Table 17-3: Marigold Mine Reclamation Cost Estimate/Bond |
17-5 |
| Table 18-1: Capital Costs Summary |
18-1 |
| Table 18-2: Operating Costs Summary |
18-2 |
| Table 18-3: Mine Operating Cost Summary |
18-2 |
| Table 18-4: Maintenance Operating Cost Summary |
18-3 |
| Table 18-5: Process Operating Cost Summary |
18-3 |
| Table 18-6: G&A Operating Cost Summary |
18-3 |
| Table 18-7: Current Workforce |
18-4 |
| Table 18-8: LOM Workforce Levels |
18-4 |
| Table 19-1: After-Tax Cash Flow Summary |
19-3 |
| Table 19-2: After-Tax Sensitivity Analyses |
19-5 |
| Table 20-1: Past Production and Mineral Resources for Adjacent Properties |
20-1 |
Figures
| Figure 3-1: Location Map |
3-2 |
| Figure 3-2: Marigold and Sterling Land Package Map |
3-4 |
| Figure 5-1: View to the East–Southeast over the Cyanide Leach Tanks from the Marigold Mine prior to World
War II |
5-1 |
| Figure 5-2: Location of Marigold Exploration Targets and Mining Areas |
5-4 |
| Figure 6-1: Location of the Marigold Mine in North-Central Nevada within the Basin and Range Physiographic Province |
6-1 |
| Figure 6-2: Location of Marigold and the Battle Mountain Mining District on the Battle Mountain-Eureka Mineral Trend |
6-4 |
| Figure 6-3: Stratigraphic Column for the Marigold Complex |
6-7 |
| Figure 6-4: Plan View Map Showing Distribution of Paleozoic Units at Marigold |
6-10 |
| Figure 6-5: Top Surface of the Valmy Formation with the Current Property Boundary |
6-12 |
| Figure 6-6: Cross Section 11,200N Highlighting Inferred Permian Growth Fault and Associated Antithetic Normal Faults
with a Steep West Dip |
6-13 |
| Figure 6-7: Normal Displacement of Alluvium and Tuff Immediately South of the Basalt Pit |
6-14 |
| Figure 6-8: Plan View of the Marigold Mine Area showing the Spatial Distribution of 1.0 g/t Au Grade Shells Over
an 8 km Northerly Trend |
6-16 |
| Figure 6-9: Geologic Map of the Buffalo Valley Mine Area |
6-19 |
| Figure 6-10: Schematic Cross Section Buffalo Valley Deposit |
6-21 |
| | vii | |
| SSR Mining Inc. | Marigold Complex S-K 1300 Report | February 12, 2024 SLR Project No.: 138.21581.00002 |
| Figure 6-11: Geologic Map of Trenton Canyon Area |
6-24 |
| Figure 6-12: Schematic Cross Section through Trenton Canyon |
6-28 |
| Figure 6-13: Model Illustrating Inferred Processes Related to Formation of Carlin-Type Gold Deposits (CTGD) and
Distal Disseminated Silver–Gold Deposits |
6-30 |
| Figure 7-1: Plan View of All Drilling to End of June 2023 |
7-6 |
| Figure 8-1: Scatter Plot Between FA Gold Values with AA Finish and Gravimetric Finish |
8-6 |
| Figure 8-2: Q-Q Plot between FA Gold Values with AA Finish and Gravimetric Finish |
8-6 |
| Figure 8-3: Cross-Section with SSR Drill Holes and Historical Drill Holes Along Section 8000N |
8-8 |
| Figure 8-4: Cumulative Normal Distribution Comparing Composites from SSR Drilling and Historical Drilling |
8-9 |
| Figure 8-5: Z-Scores of all CRM Results (2018 – June 2023) |
8-11 |
| Figure 8-6: Field Duplicate HARD Plot for Fire Assay (AuFA) and Cyanide Soluble (AUCN) Analyses. Inset QQ Plot of
Original vs. Duplicate Results. |
8-12 |
| Figure 8-7: Blank Results (January 2018 – June 2023) |
8-13 |
| Figure 8-8: Re-Assay Analytical Duplicate HARD Plot for Fire Assay (AuFA) and Cyanide Soluble (AUCN) Analyses. Inset
QQ Plot of Original vs. Umpire Results |
8-14 |
| Figure 8-9: Umpire Analytical Duplicate HARD Plot for Fire Assay (AuFA) and Cyanide Soluble (AUCN) Analyses. Inset
QQ Plot of Original vs. Umpire Results |
8-15 |
| Figure 10-1: Column Test Results – Marigold |
10-2 |
| Figure 10-2: Bottle Roll vs. Column Recovery – Marigold |
10-2 |
| Figure 10-3: Exploration Database (2017) AuCN vs AuFA – All Data |
10-4 |
| Figure 10-4: Buffalo Valley Au Recovery by Size for each Lithology |
10-8 |
| Figure 11-1: Location of the Seven Major Domains |
11-5 |
| Figure 11-2: Typical East–West Cross Section along 10,200 N |
11-6 |
| Figure 11-3: Typical Bench Plan (level=5000) |
11-8 |
| Figure 11-4: Valmy Classification Cross Section (1100 N – Grid is in Local Mine Coordinates) |
11-19 |
| Figure 11-5: Typical East–West Cross Section along 10,400 N with Estimated Cell Grades (Au g/t) |
11-22 |
| Figure 11-6: Typical Plan 4950 Elevation with Estimated Whole Cell Grades Au g/t |
11-23 |
| Figure 11-7: Swath Plot Along Eastings |
11-24 |
| Figure 11-8: Swath Plot Along Northings |
11-25 |
| Figure 11-9: Swath Plot Along Elevation |
11-26 |
| Figure 11-10: Buffalo Valley Geological Domains (Plan View Elevation 5100) |
11-31 |
| Figure 11-11: Buffalo Valley Geology (Mine Grid Section -32,000 N) |
11-32 |
| | viii | |
| SSR Mining Inc. | Marigold Complex S-K 1300 Report | February 12, 2024 SLR Project No.: 138.21581.00002 |
| Figure 11-12: Boxplot of AUFA by domain and inside probability greater than 0.3 of AUFE grade at least 0.1028 g/t
(0.003 opt) |
11-41 |
| Figure 11-13: Boxplot of AUCN by domain and inside probability greater than 0.3 of AUFE grade at least 0.1028 g/t
(0.003 opt) |
11-41 |
| Figure 11-14: Histograms of AUFA Inside Probability Greater Than 0.3 of AUFE Grade at Least 0.1028 g/t (0.003 opt).
By Main Domains. |
11-42 |
| Figure 11-15: Log Probability Plots of AuFA Inside Probability Greater than 0.3 of AUFE grade at least 0.1028 g/t
(0.003 opt). By Main Domains. |
11-43 |
| Figure 11-16: Havallah Basalt Boundary Conditions (distance in feet, grade in opt) |
11-45 |
| Figure 11-17: Main Dike Boundary Conditions (distance in feet, grade in opt) |
11-46 |
| Figure 11-18: Classification – Buffalo Valley Deposit |
11-53 |
| Figure 11-19: Cross Section Buffalo Valley Deposit |
11-55 |
| Figure 11-20: Swath Plot SW-NE for AUFE |
11-1 |
| Figure 11-21: Swath Plot NW-SE for AUFE |
11-2 |
| Figure 11-22: Swath Plot Elevation for AUFE |
11-2 |
| Figure 13-1: End of Mine Life Reserve Pits |
13-7 |
| Figure 13-2: Mine Annual Production Schedule |
13-9 |
| Figure 13-3: End of Production Year 2024 |
13-13 |
| Figure 13-4: End of Production Year 2025 |
13-14 |
| Figure 13-5: End of Production Year 2026 |
13-15 |
| Figure 13-6: End of Production Year 2027 |
13-16 |
| Figure 13-7: End of Production Year 2028 |
13-17 |
| Figure 13-8: End of Production Year 2029 |
13-18 |
| Figure 13-9: End of Production Year 2030 |
13-19 |
| Figure 13-10: End of Production Year 2031 |
13-20 |
| Figure 13-11: End of Production Year 2032 |
13-21 |
| Figure 13-12: Existing and Proposed Dewatering Wells |
13-25 |
| Figure 13-13: Conceptual Layout of RIBs and Spoil Piles |
13-27 |
| Figure 14-1: Simplified Marigold Processing Flowsheet |
14-30 |
| Figure 14-2: Average Annual Reagent Consumption |
14-33 |
| Figure 14-3: Marigold Heap Leach Pad Gold Recovery Curve from March 1990 through June 2023 |
14-34 |
| Figure 15-1: Infrastructure Site Map |
15-4 |
| Figure 15-2: Freshwater Well Sites |
15-6 |
| Figure 15-3: LOM Site Schematic Showing Final Pit Limits, WRSA, and Leach Pad |
15-7 |
| Figure 19-1: After-Tax Sensitivity Analysis |
19-4 |
| | ix | |
| SSR Mining Inc. | Marigold Complex S-K 1300 Report | February 12, 2024 SLR Project No.: 138.21581.00002 |
| Figure 20-1: Plan Map Showing Marigold Property Outline and Mineralization Relative to Adjacent or Nearby Mines
or Published Deposits |
20-2 |
| | x | |
| SSR Mining Inc. | Marigold Complex S-K 1300 Report | February 12, 2024 SLR Project No.: 138.21581.00002 |
SLR International Corporation (SLR) was retained by SSR Mining Incorporated
(SSR) to prepare an independent Technical Report Summary (TRS) on the Marigold Complex (Marigold or the Property), located in Humboldt
and Lander counties, Nevada, USA. The Marigold Complex includes the Marigold Mine (including Mackay, Valmy, and New Millennium) and the
Buffalo Valley and Trenton Canyon deposits. SSR holds a 100% interest in the Property through its wholly owned subsidiary, Marigold Mining
Company (MMC).
The purpose of this TRS is to disclose the results of the Mineral Resource
and Mineral Reserve estimates for the Property with an effective date of September 30, 2023. This TRS conforms to United States Securities
and Exchange Commission’s (SEC) Modernized Property Disclosure Requirements for Mining Registrants as described in Subpart 229.1300
of Regulation S-K, Disclosure by Registrants Engaged in Mining Operations (S-K 1300) and Item 601 (b)(96) Technical Report Summary. SLR
visited the Property on June 13 to 14, 2023.
SSR is a gold mining company with four producing assets located in the
USA, Türkiye, Canada, and Argentina, and with development and exploration assets in the USA, Türkiye, and Canada. SSR is listed
on the NASDAQ (NASDAQ: SSRM), the Toronto Stock Exchange (TSX: SSRM), and on the Australian Stock Exchange (ASX: SSR).
SSR’s Marigold Complex is located approximately five kilometres
south–southwest of the town of Valmy, and approximately 24 km northwest of Battle Mountain. The open pit heap leach gold mine has
been in production since 1989 and has produced over four million ounces of gold. The operation consists of several open pits, waste rock
stockpiles, leach pads, a carbon adsorption facility, and a carbon processing and gold refining facility.
SLR offers the following conclusions by area.
| 1.1.1.1 | Geology and Mineral Resources |
| · | The gold deposits at Marigold and Trenton Canyon are best classified as Carlin-type gold deposits. Gold mineralizing fluids were primarily
controlled by fault structure and lithology, with tertiary influence by fold geometry. Buffalo Valley is considered a distal disseminated
silver-gold deposit with strong controls along the margins of felsic porphyry dikes and by favorable lithologies. |
| · | The Property has been the site of considerable mining and exploration, including the drilling and logging of 12,636 drill holes totaling
over 2.4 million meters drilled. |
| · | The estimates of Mineral Resources were prepared using a domain-controlled, ordinary kriging technique with verified drill hole sample
data derived from exploration activities conducted by various companies from 1968 to 2023. |
| · | The SLR QP is of the opinion that the drilling and sampling procedures adopted at Marigold are consistent with generally recognized
industry best practices. The resultant drilling pattern is sufficiently dense to interpret the geometry and the boundaries of gold mineralization
with confidence. The reverse circulation (RC) samples were collected by competent personnel using procedures meeting generally accepted
industry best practices. The process was conducted or supervised by qualified geologists. |
| | 1-1 | |
| SSR Mining Inc. | Marigold Complex S-K 1300 Report | February 12, 2024 SLR Project No.: 138.21581.00002 |
| · | The SLR QP is of the opinion that the samples are representative of the source materials, and there is no evidence that the sampling
process introduced a bias. Accordingly, there are no known sampling or recovery factors that could materially impact the accuracy and
reliability of drilling results. |
| · | In the SLR QP’s opinion, the sample preparation, security, and analytical procedures meet industry standards, and the QA/QC
program, as designed and implemented at Marigold are adequate; consequently, the assay results within the drill hole database are suitable
for mineral resource estimation purposes. Neither the SSR in-house quality control nor SSR predecessor’s quality control yielded
any indication of quality concerns. |
| · | The SLR QP was provided unlimited access for data verification purposes by SSR during this Mineral Resource estimate audit. The SLR
QP is of the opinion that database verification procedures for Marigold comply with industry standards and are adequate for the purposes
of Mineral Resource estimation. |
| · | Based on the data validation and the results of the standard, blank, and duplicate analyses, the SLR QP is of the opinion that the
sampling methods, chain of custody procedures, and analytical techniques are appropriate and meet acceptable industry standards. The assay
and bulk density databases are of sufficient quality for Mineral Resource estimation at the Marigold Complex deposits (Marigold Mine and
Buffalo Valley). |
| · | The SLR QP reviewed the assumptions, parameters, and methods used to prepare the Mineral Resources Statement and is of the opinion
that the Mineral Resources are estimated and prepared in accordance with the U.S. Securities and Exchange Commission (US SEC) Regulation
S-K subpart 1300 rules for Property Disclosures for Mining Registrants (S-K 1300). |
| · | The SLR QP considers that the knowledge of the deposit setting, lithologies, structural controls on mineralization, and the mineralization
style and setting, is sufficient to support the MRE to the level of classification assigned. |
| · | The estimate of Mineral Resources presented were prepared for Marigold, with an effective date of September 30, 2023, and for Buffalo
Valley with an effective date of July 31, 2023. |
| · | The conversion of Mineral Resources to Mineral Reserves used industry best practices to determine operating costs, capital costs,
and recovery performance. Therefore, the estimates are considered to be representative of actual and future operational conditions. |
| · | The SLR QP considers the resource cut-off grade and Whittle pit shapes guide to identify those portions of the MRE that meet the requirement
for the prospects for economic extraction to be appropriate for this style of gold deposit and mineralization. |
| · | The Mineral Resources estimates at the Property include the following by deposit area: |
| o | Marigold: 103.72 million tonnes (Mt) Indicated Resources at an average gold (Au) grade of 0.44 g/t containing 1.47 million ounces
(Moz) Au and an additional 19.09 Mt at an average grade of 0.36 g/t Au containing 0.22 Moz of Inferred Resources. |
| o | Buffalo Valley: 14.89 Mt Indicated Resources at an average grade of 0.57 g/t Au containing 0.27 Moz Au and 8.77 Mt at an average grade
of 0.51 g/t Au containing 0.15 Moz in the Inferred category. |
| | 1-2 | |
| SSR Mining Inc. | Marigold Complex S-K 1300 Report | February 12, 2024 SLR Project No.: 138.21581.00002 |
| · | There are no Measured Resources at the Property. |
| · | The level of uncertainty has been adequately reflected in the classification of Mineral Resources for the Property. The MRE presented
may be materially impacted by any future changes in the break-even cut-off grade, which may result from changes in mining method selection,
mining costs, processing recoveries and costs, metal price fluctuations, or significant changes in geological knowledge. |
| · | The SLR QP is of the opinion that with consideration of the recommendations summarized in Sections 1 and 23 of this TRS, any issues
relating to all relevant technical and economic factors likely to influence the prospect of economic extraction can be resolved with further
work. |
| 1.1.1.2 | Mining and Mineral Reserves |
| · | SSR Mining has extensive experience with open pit mining at Marigold and a strong understanding of the work requirements and costs
based on its current operations. |
| · | Open Pit operations at Marigold are carried out using standard open pit mining methods including drilling, blasting, loading, hauling,
and dumping to the designated leach pads or waste rock storage areas (WRSA) at the mine. |
| · | Mineral Reserves estimation practices follow industry standards. |
| · | Total Probable Mineral Reserves at the Marigold mine are estimated to be 174.8 Mt grading 0.47 g/t Au containing 2.98 Moz Au, including
the 0.346 Moz Au contained within the leach pad inventory. |
| · | The Marigold Mine Mineral Reserves support a LOM over 16 years of operational life, including ten years of active mining followed
by six years of processing the heap leach pad inventory. |
| · | The LOM production schedule is reasonable but will require robust short-term planning and sequencing to be successful. |
| · | The geotechnical parameters used for pit designs are reasonable and supported by previous operations. |
| · | An appropriate mining equipment fleet, maintenance facilities, and workforce are in place, with various options for additions and
replacements estimated, to meet the LOM production schedule requirements. |
| · | Sufficient storage capacity for waste rock and leach pads have been identified to support the production of the Mineral Reserve. |
| · | The SLR QP reviewed the assumptions, parameters, and methods used to prepare the Mineral Reserves Statement and is of the opinion
that the Mineral Reserves are estimated and prepared in accordance with S-K 1300. |
| 1.1.1.3 | Mineral Processing |
| · | The Marigold processing facilities comprise conventional run-of-mine (ROM) cyanide heap leaching, carbon adsorption, electrowinning,
and refining circuits (ADR) to produce a final precious metal product. The heap leach pad was originally constructed in 1990 and with
ongoing expansions has operated very consistently throughout the years providing an excellent library of operating data. |
| | 1-3 | |
| SSR Mining Inc. | Marigold Complex S-K 1300 Report | February 12, 2024 SLR Project No.: 138.21581.00002 |
| · | The mineralogy of the ore and deportment of the gold along fracture surfaces of the rock rather than in the rock matrix, provides
rapid access of leach solutions to the gold particles and relatively fast gold extraction independent of rock size. The SLR QP agrees
that the ore is uniquely favorable to run of mine heap leaching, which has been employed for the life of mine. |
| · | Gold recovery is determined from both historical operating performance and from laboratory column and bottle roll leach testing. Gold
recovery is consistent and is predicted using a relationship between fire assay and cyanide soluble gold analyses. It is the SLR QP’s
opinion that the Marigold operating practices are consistent with industry standards, and the ROM method of operation and the methods
of determining gold recovery and reagent consumptions are appropriate for this deposit. |
| · | Cumulative gold production from the Marigold leach pad (through September 2023) is equivalent to 70.6% recovery, and total gold recovery,
including recoverable gold inventory in the pad, is estimated at 74%. |
| · | Gold production data from the leach pad provide the best indicator for future processing recoveries because the ore from 1999 to present
has been very consistent metallurgically and mineralogically. Gold recovery from future ore is estimated to be 74.5% based on a review
of historical assay and recovery data as well as metallurgical test work on future ore. |
| · | Test work has been conducted on a variety of Marigold ore samples, including representative pit samples taken by ore-control geologists,
leach pad grab samples from mine production, and various pit blasthole drill cuttings. Bottle roll test work has also been conducted on
exploration reverse circulation (RC) drill samples to determine expected gold recovery from deposits that will be mined in the future. |
| · | A large number of column leach tests and bottle roll tests have been performed on the same samples to determine the relationship between
their results. Column leach test work continues; however, bottle roll tests can be performed to generate metallurgical data in days rather
than months that are required for column leach tests. |
| · | Permeability testing has been performed on ore samples with varying fines content. The testing simulated compaction under multiple
lifts of ore stacked up to 200 m, the current maximum height of the heap leach pads above the liner elevation is 122 m. Overall, the tested
blends demonstrated relatively consistent permeability on increasing loads after 50 m and acceptable permeabilities with material blended
to a 40% fines to 60% durable ratio. Flow rates for the blends ranged from 178 L/h/m2 to 284 L/h/m2 under no load.
Under 122 m effective height loading, flow rates ranged from 34 L/h/m2 up to 188 L/h/m2. All tests resulted in low,
but acceptable permeabilities. |
| · | Gold recovery at Marigold is predicted using a relationship developed between the fire assay, which determines total gold in a sample,
and the cyanide soluble gold assay, which determines the amount of cyanide soluble gold in a sample. |
| · | Average LOM Au recovery at Marigold is 74% based on production records. The ratio of cyanide soluble gold to total gold (AuCN/AuFA)
using the 2017 database of assay pairs was approximately 0.8 (80%). Using the ratio to determine the actual LOM recovery of 74% results
in a factor of 0.92. |
| | 1-4 | |
| SSR Mining Inc. | Marigold Complex S-K 1300 Report | February 12, 2024 SLR Project No.: 138.21581.00002 |
| · | The Current Model to predict Marigold heap leach recovery is Heap Leach Recovery = (AuCN/AuFA) x 0.92. |
| · | Gold recovery in each of the four lithologies at Buffalo Valley are dependent on particle size. Gold recovery by particle size distribution
was compiled using the current and historical Buffalo Valley metallurgical test results. The results were used to determine the gold recovery
for each material type for resource calculations. |
| · | Marigold is readily accessible via Interstate Highway 80 in northern Nevada and is approximately 5 km south–south-west
of Valmy in Humboldt County. The site access road supports two lanes of traffic and consists of hard packed clay and gravel. |
| · | The infrastructure facilities at Marigold include ancillary buildings, offices and support buildings, access roads into the plant
site, power distribution, source of fresh water and water distribution, fuel supply, storage and distribution, waste management and communications.
The infrastructure facilities are sufficient for supporting the current Marigold operations. |
| · | The power supply for Marigold is provided by NV Energy Inc. via a 120 kV transmission line to site. Site power draw is 5 MW.
After exiting the main substation, power is distributed through a 25 kV distribution grid. Power supply is consistent and dependable
and is not a limiting factor for current operations. |
| · | Marigold has sufficient groundwater rights and water well capacity to support the ongoing process operations. The water is primarily
consumed by retention in the heap leach pad, evaporation, processing operations and dust suppression. |
| · | It is the SLR QP’s opinion that it is reasonable to rely on the information provided by SSR as outlined above for use in the
TRS because the Property has been in operation for a number of years, and SSR employs professionals and other personnel with responsibility
in these areas that have a good understanding of the operating requirements for the Property. |
| · | Specific federal, state, and local (Humboldt County, Nevada) regulatory and permitting requirements apply to MMC, including the following: |
| o | The Plan of Operations (PoO) permitted via the United States (U.S.) Bureau of Land Management (BLM) |
| o | The Water Pollution Control Permit (WPCP) issued by the Nevada Department of Environmental Protection (NDEP) |
| o | The temporary discharge permit allowing for the discharge of dewatering water to rapid infiltration basins (RIBs) issued by NDEP |
| o | The reclamation permit issued by the Nevada Bureau of Mining Regulation and Reclamation (BMRR) |
| · | MMC currently holds and is in compliance with active, valid permits for all current facets of the mining operation. |
| · | At present, there are no known environmental issues that impact the ability to extract Mineral Resources at the Property. |
| | 1-5 | |
| SSR Mining Inc. | Marigold Complex S-K 1300 Report | February 12, 2024 SLR Project No.: 138.21581.00002 |
| · | All activities associated with MMC require an approved reclamation plan that includes a Reclamation Cost Estimate (RCE) for all permitted
facilities and activities. This was updated and approved by federal and state agencies in 2022. |
| · | MMC is actively engaged with the local communities and stakeholders and there are no outstanding negotiations or social commitments
for the operation of the mine. |
| · | The SLR QP’s opinion is that it is reasonable to rely on the information provided by SSR as outlined above for use in the TRS
because significant environmental and social analyses have been conducted for the Property over an extended period, the Property has been
in operation for a number of years, and SSR employs professionals and other personnel with responsibility in these areas that have a good
understanding of the permitting, regulatory, and environmental requirements for the Property. |
| 1.1.1.6 | Capital and Operating Costs |
SSR’s forecasted capital and operating costs estimates related
to the development of Mineral Reserves are derived from annual budgets and historical actuals over the long life of the current operation.
According to the American Association of Cost Engineers (AACE) classifications, these estimates would be Class 1 with an accuracy range
of -3% to -10% to +3% to +15%.
SLR offers the following recommendations by area.
| 1.1.2.1 | Geology and Mineral Resources |
The SLR QP offers the following recommendations regarding advancement
of the Property.
| 1 | SSR has proposed a two-year exploration drilling (2024 and 2025) program with a total budget of US$10,000,000 to advance development
of the Buffalo Valley deposit and exploration target areas. The objective of the exploration program will be to target potential gold-bearing
structures to expand the mineralization footprint and as well as to convert the current Resource to Reserve. The SLR QP agrees with the
objectives and overall scope of this exploration program. |
| 2 | Conduct an additional 30,000 m drilling at the Marigold mine where there are opportunities to increase orebody knowledge and confidence
of mineral estimates. |
| 1.1.2.2 | Mining and Mineral Reserves |
| 1 | Continue optimizing haulage profiles over the LOM including exploring opportunities for ore material from the New Millennium area
to be sent to alternate destinations. |
| 2 | Maintain and improve the grade control procedures on site as situation demands, including infill drilling in areas as required and
resourcing workforce to execute the same on time, enabling improved quality of ore delivered to leach pads. |
| 3 | With existing stockpiles currently being mined, closely monitor grade control procedures in these areas for accurate ore reconciliation. |
| 4 | Focus on equipment maintenance and reliability given the age of existing assets and extended lifetime planned for excavators to achieve
planned utilization. |
| | 1-6 | |
| SSR Mining Inc. | Marigold Complex S-K 1300 Report | February 12, 2024 SLR Project No.: 138.21581.00002 |
| 5 | Ensure dewatering is done on time and does not hamper progress of mine operations. Code projections of dewatering progress to the
mining model. |
| 6 | Ensure the planned laboratory audit is completed and that the transition from Atomic Absorption (AA) assays to Inductively Coupled
Plasma (ICP) assays occurs in early 2024, which will assist mining operations to better control the grade of ore delivered to the leach
pads. |
| 1.1.2.3 | Mineral Processing |
| 1 | Conduct regular assessments of the AuCN/AuFA ratio using updated exploration and blast hole data. |
| 2 | Continue to conduct column and bottle roll metallurgical testing on heap leach feed composites to determine maximum possible gold
recovery. |
| 3 | Conduct metallurgical test work on any future ore sources to develop geometallurgical properties and parameters. |
| 4 | Complete further studies and assessment of heap leach recoverable gold inventory. |
| 1 | Continue to maintain the infrastructure facilities in good working order to ensure that critical services such as power and water
management, pumping and storage facilities are fully available for potential upset conditions. |
There are no recommendations related to the environment.
| 1.1.2.6 | Capital and Operating Costs |
SLR has no recommendations related to capital and operating costs.
An after-tax Cash Flow Projection has been generated from the Life of
Mine production schedule and capital and operating cost estimates and is summarized in Table 1-1. A summary of the key criteria is
provided below. The complete cash flow is presented in Section 27.0 Appendix.
| · | 52,000 tonnes ore per day stacked (approximately 20 Mt per year) average stacked grade of 0.47 g/t Au (ROM and stockpile mine plan). |
| · | LOM average 212,000 ounces per year gold recovered from mine plan with LOM stacked ore recovery averaging 74.3%. Total 1.96 Moz recovered
over LOM operation (including Q4 2023 through 2032). |
| | 1-7 | |
| SSR Mining Inc. | Marigold Complex S-K 1300 Report | February 12, 2024 SLR Project No.: 138.21581.00002 |
| · | Estimated 12% additional ounces (243,000 ounces produced) included in work in progress: 25,000 additional ounces produced during the
ten year heap pad operations and 218,000 additional ounces produced during six year rinsing operations after mining ceases. |
| · | Metal price: US$1,790 per ounce gold (LOM realized), US$1,755 per ounce gold long term price (2028+), US$23.00 per ounce silver (LOM
realized), US$22.75 per ounce silver long term price (2028+). |
| · | Gold at refinery 99.95% payable, 100% silver payable. |
| · | Net Smelter Return includes doré refining, transport, and insurance costs. |
| · | Revenue is recognized at the time of gold production. |
| · | Mine life: 15 years, excluding Q4 2023 (nine years of mining and six years of heap pad rinsing). |
| · | Life of Mine production plan as summarized in Table 13-3. |
| · | Mine life sustaining capital totals $257.6 million. |
| · | Final reclamation costs total $69.2 million. |
| · | Average operating cost over the mine life is $11.56 per tonne stacked. |
| 1.2.1.3 | Taxation and Royalties |
Marigold is subject to Nevada Net Proceeds of Minerals Tax, Nevada property
and sales taxes, and U.S. federal income tax. The economic analysis calculates these taxes in accordance with legislation enacted as of
January 1, 2022. Property and sales taxes are accounted for in the operating costs of the mine.
| 1.2.1.3.1 | Nevada Gross Proceeds Tax |
In 2021, the State of Nevada enacted Assembly Bill 495, effective July
1, 2021, which is an annual excise tax on gold and silver revenue. Under the bill, the tax rates vary based on the taxpayer’s Nevada
gross revenue. A 0.75% rate is imposed on Nevada gross revenue of more than $20 million but not more than $150 million in a taxable year
(defined as the calendar year). A rate of 1.10% applies to Nevada gross revenue exceeding $150 million in any tax year. The LOM average
rate for Marigold is approximately 0.9% and average $3.5 million per year during the remaining nine full years of mine operations.
| 1.2.1.3.2 | Nevada Net Proceeds Tax |
The State of Nevada imposes a 5% net proceeds tax on the value of all
minerals extracted in the State. This tax is calculated and paid based on a prescribed net income formula applied only to income and expenses
from mining, disallowing deductions for exploration and related-party financing costs. This tax is normally assessed at 5% of net income
for major mine operations like Marigold. It is a deductible expense for U.S. federal income tax and averages $6.3 million per year over
the remaining nine full years of mine operations.
| | 1-8 | |
| SSR Mining Inc. | Marigold Complex S-K 1300 Report | February 12, 2024 SLR Project No.: 138.21581.00002 |
| 1.2.1.3.3 | US Federal Income Tax |
Federal income tax is determined under regulations that came into effect
on January 1, 2022. Under these regulations, which removed alternative minimum tax, the mine is subject to a federal income tax rate of
21%. SLR utilized Unit of Production depreciation, depletion allowances, and Net Operating Losses (NOL) as deductions. Total U.S. federal
tax payable averages $11.6 million per year over the remaining nine year mine operations.
Marigold is subject to a variety of NSR royalty payments, payable to
various parties under the terms of the leases, as described in Section 3. The annual average NSR royalty payments range from 3.7% to 10.0%
and averages $27.4 million per year over the remaining nine year mine operations.
Considering the Property on a stand-alone basis, the undiscounted pre-tax
cash flow totals $1,274 million over the mine life. The after-tax Net Present Value (NPV) at a 5% discount rate (midpoint with November
1, 2023, as time zero) is $800 million, as shown in Table 1-1.
| | 1-9 | |
| SSR Mining Inc. | Marigold Complex S-K 1300 Report | February 12, 2024 SLR Project No.: 138.21581.00002 |
Table 1-1: After-Tax Cash Flow
Summary
| Description |
LOM |
|
| Realized Market Prices |
|
|
| Au ($/oz) – Average |
$1,790 |
|
| Ag ($/oz) – Average |
$23.00 |
|
| Payable Metal |
|
|
| Au (koz) |
2,198 |
|
| Ag (koz) |
46 |
|
| Cash Flow Summary |
US$ million |
|
| Total Gross Revenue |
3,942 |
|
| Mining Cost |
(974) |
|
| Maintenance Cost |
(432) |
|
| Process Cost |
(415) |
|
| G & A Cost |
(199) |
|
| Exploration |
(6) |
|
| Refining/Freight |
(4) |
|
| Mining Royalties |
(277) |
|
| NGPT1 |
(34) |
|
| Total Operating Costs |
(2,342) |
|
| Operating Margin (EBITDA) |
1,600 |
|
| Cash Taxes Payable |
(202) |
|
| Working Capital2 |
0 |
|
| Operating Cash Flow |
1,399 |
|
| Sustaining Capital |
(258) |
|
| Total Closure/Reclamation Capital |
(69) |
|
| |
|
|
| Pre-tax Free Cash Flow |
1,274 |
|
| Pre-tax NPV @ 5% |
953 |
|
| After-tax Free Cash Flow |
1,072 |
|
| After-tax NPV @ 5% |
800 |
|
Notes:
| 1. | Nevada Gross Proceeds Tax |
| 2. | All working capital adjustments net to zero at end of mine life |
| | 1-10 | |
| SSR Mining Inc. | Marigold Complex S-K 1300 Report | February 12, 2024 SLR Project No.: 138.21581.00002 |
The World Gold Council Adjusted Operating Cost (AOC) is $1,065/oz Au.
The mine life capital unit cost, including sustaining and closure/reclamation, is $148/oz, for an All in Sustaining Cost (AISC) of $1,213/oz
Au. The average annual gold production during operation, excluding rinsing phase, is 212,000 ounces per year over the ten year mine life
and 36,000 ounces per year during the six year rinsing phase.
| 1.2.3 | Sensitivity Analysis |
After-tax IRR sensitivity over the base case has been calculated for
-20% to +20% variations for head grade, recovery, and gold price and -15% to +15% for variations for operating and capital costs. The
Project is most sensitive to changes in head grade, metallurgical recovery, and metal price (usually with same magnitude of impact) followed
by operating cost and finally capital costs.
| 1.3.1 | Property Description |
Marigold is located in southeastern Humboldt County along the Interstate
Highway 80 corridor in the northern foothills of the Battle Mountain Range, Nevada, U.S. Activities at the Property are centred at approximately
40°45′ N Latitude and 117°8′ W Longitude.
The Property is situated approximately five kilometres south–southwest
of the town of Valmy, Nevada, at Exit 216 off Interstate Highway 80. Other nearby municipalities include Winnemucca and Battle Mountain,
Nevada, which lie approximately 58 km to the northwest and 24 km to the southeast of the Property, respectively.
The Marigold Complex includes two main land packages, the Marigold Land
Package and the Sterling Land Package, collectively, the Property or project areas.
The Marigold Land Package encompasses approximately 10,477 hectares
(ha), including the approximately 3,296 ha within the Marigold Mine Plan of Operations (PoO). The Sterling Land Package (9,383 ha) includes
properties associated with the Trenton Canyon Mine and Buffalo Valley Mine.
Land and mineral ownership within the project areas are within the corridor
initially governed by the Pacific Railroad Act of 1862, and, as such, these areas generally have a “checkerboard” ownership
pattern. Mineral claims in Nevada are managed federally by the BLM. SSR holds a 100% interest in the Property through its wholly-owned
subsidiary, MMC. Surface and mineral rights at the Property comprise the following: real property owned by MMC; unpatented mining claims
owned by MMC; and leasehold rights held by MMC with respect to unpatented mining claims, mill site claims, and certain surface lands.
Some of the leases require MMC to make certain net smelter return (NSR)
royalty payments to the lessors and comply with other obligations, including completing certain work commitments or paying taxes levied
on the underlying properties. The NSR royalty payments are based on the specific gold-extraction areas and are payable when the corresponding
gold ounces are extracted, produced, and sold. The NSR royalty payments vary between 0% and 10.0% of the value of gold production, net
of off-site refining costs, which equates to an annual average ranging from 3.7% to 10.0% and a weighted average of 7.8% over the life-of-mine
(LOM).
| | 1-11 | |
| SSR Mining Inc. | Marigold Complex S-K 1300 Report | February 12, 2024 SLR Project No.: 138.21581.00002 |
The first recorded gold production from the Property near Valmy, Nevada,
occurred in 1938 when the Marigold Mining Company, owned by Frank Horton, operated an underground mine which came to be known as Marigold.
The Horton family processed approximately 9,000 t of ore averaging about 6.85 g/t Au before World War II halted production. In 1943, Mr.
Horton’s estate sold its interest in the Property and claims. Several unsuccessful attempts were made to open and operate the mine
before exploration activities began again in 1968.
From 1968 through 1985, several companies conducted exploration programs
in the Marigold area and completed a total of 126 exploratory drill holes. Records document the activities of Homestake (1968), St. Joe
(1979), Decker Exploration (1979), Placer Amex (1979–1980), True North, Marigold Development Company (MDC) (1981–1983), Welcome
North (1984), and Nevada North Resources (USA) Inc. (1985–1986). Other groups that conducted work in the area include Newmont, Kerr-McGee,
SFP Minerals Corporation, Cordex/Rayrock Mines, and Vek/Andrus Associates (partnership between Vic Kral, Ralph Roberts, Bob Reeve, and
Bill Andrus composed of Vek Associates and Andrus Resources Corporation).
The operating partner Cordex, an exploration syndicate composed of Dome
Exploration (U.S.) Ltd., Lacana Gold Inc. (Lacana) and Rayrock Mines, leased the Vek/Andrus Associates claim block in September 1985 and
began a drilling program in November 1985. Drill holes NM-3 and NM-4 intersected 21.3 m of 2.40 g/t Au and 25.9 m of 7.54 g/t Au, respectively.
These were the discovery holes for the 8 South (8S) ore body.
Following further drilling in the 8S deposit in the spring of 1986,
a joint venture was formed between SFP Minerals and the Cordex group, which consolidated some of the land holdings over the Marigold area.
In late-1986, the Cordex group leased other claims, including the historical
Marigold mine, Mackay (Top Zone, East Hill, and Red Rock) area from various claim holders.
In March 1988, Rayrock Mines (operating company for Cordex) made a production
decision on the 8S deposit, and, by September 1988, it began stripping on the 8S pit (McGibbon, 2004).
In August 1989, the first gold doré bar was poured at the Marigold
mill.
In March 1992, Rayrock Mines purchased a two thirds ownership interest
in the Property, and Homestake Mining Company (Homestake), which had taken Lacana’s interest through previous corporate mergers,
held the remaining one third ownership interest in the Property.
In 1994, mining of the 8S deposit was completed, and the Marigold mill
was no longer used to process ore. At this point, Marigold became a run-of-mine (ROM) heap leach operation.
In March 1999, Glamis Gold Ltd. (Glamis Gold) purchased all the assets
of Rayrock Mines, resulting in Glamis Gold holding a two thirds ownership interest in Marigold, and Homestake continuing to hold a one
third ownership interest. By January 2001, a total of one million ounces of gold had been recovered from the Property.
In 2006, Glamis Gold merged with Goldcorp Inc. (Goldcorp), resulting
in a Goldcorp subsidiary holding a two thirds ownership interest in Marigold and being the operator. Homestake, which had been acquired
by Barrick Gold Corporation (Barrick) in 2001, continued to hold the remaining one third ownership interest. In 2007, discovery holes
were drilled in the Red Dot deposit.
By mid-2009, two million ounces of gold had been recovered from Marigold.
| | 1-12 | |
| SSR Mining Inc. | Marigold Complex S-K 1300 Report | February 12, 2024 SLR Project No.: 138.21581.00002 |
On April 4, 2014, SSR (formerly Silver Standard Resources Inc.) completed
the acquisition of Marigold from subsidiaries of Goldcorp and Barrick.
In August 2015, Marigold mine acquired 2,844 ha of adjacent land from
Newmont. This land included previously mined areas known as the Mud pit, NW pit, and the Valmy pits. Exploration drilling in the area
had been completed by a combination of companies including Hecla Mining Company (Hecla), SFP Minerals, and Newmont.
In June 2019, SSR acquired the Trenton Canyon and Buffalo Valley properties
from Newmont Goldcorp Corporation (Newmont). The Trenton Canyon target is located approximately four kilometres south of New Millennium
and the Buffalo Valley target is located approximately 10 km southwest of New Millennium. Both properties are included in an 8,900 ha
parcel that is contiguous to the south boundary of the Marigold property.
| 1.3.4 | Geological Setting, Mineralization, and Deposit |
Marigold is located in the Battle Mountain district of north-central
Nevada within the Basin and Range physiographic province bounded by Sierra Nevada to the west and the Colorado Plateau to the east. Paleozoic
basement rocks of north-central to north-eastern Nevada generally comprise four distinct tectonostratigraphic assemblages: the eastern
carbonate assemblage; the slope or transitional assemblage; the western siliceous and volcanic assemblage; and the overlap assemblage
(Roberts, 1964). These rocks record a complex history of compressional and extensional tectonics and magmatism affecting the western margin
of North America from the early Paleozoic through present. The Battle Mountain district hosts numerous mineral occurrences, including
porphyry copper–gold, porphyry copper–molybdenum, skarn, placer gold, distal disseminated silver-gold, and Carlin-type gold
systems.
The gold deposits at Marigold are best characterized as Carlin-type
deposits and cumulatively define a north-trending alignment of gold mineralized rock more than eight kilometres long. Gold mineralizing
fluids were primarily controlled by fault structure and lithology, with tertiary influence by fold geometry. Within the Valmy Formation,
higher gold grades are observed in the hinge zones of open folds that trend west-northwest and plunge gently. When viewed down plunge,
the undulation of these folds is mimicked by gold mineralized horizons. The deposition of gold was restricted to fault zones and quartzite
dominant horizons within the Valmy Formation and high permeability units within the Antler sequence.
The Buffalo Valley gold deposit is a distal disseminated silver-gold
deposit and formed along a southeast trending zone of felsic porphyry dikes and faults. Gold occurs in arsenian iron sulfide overgrowths
on pyrite in sheeted quartz+sericite+pyrite (QSP) veinlets within the central granodiorite and dacite porphyry dikes, subparallel to dike
margins in the country rock, and within faults (e.g., the Front fault). Outboard of the intrusions, gold mineralization is stratiform
in receptive horizons of Havallah sequence metasedimentary rocks.
Gold mineralization at Trenton Canyon is best described as a Carlin-type
deposit and primarily hosted in a network of transtensional faults locally intruded by Eocene dikes and sills. Hydrothermal and/or phreatomagmatic
breccias within these structures typically contain increased concentrations of gold. Gold mineralization is well confined to structures,
although a small (several meter) halo of lower grade, more disseminated mineralization may be present. Quartz veining, illite, iron oxides,
and iron hydroxides (goethite) are the primary indicators of gold mineralization where oxidized.
| | 1-13 | |
| SSR Mining Inc. | Marigold Complex S-K 1300 Report | February 12, 2024 SLR Project No.: 138.21581.00002 |
Since acquiring the Property in April 2014, SSR has conducted several
surface exploration programs including soil sampling, geophysics, and in-fill/delineation drilling.
Reverse Circulation (RC) and Core (Diamond Drilling-DD) drilling on
the Property is the principal method of exploration and delineation of gold mineralization after initial targeting using soil sampling
and geophysical surveys. Drilling can generally be conducted year-round on the Property.
As of the effective date of this TRS, SSR and its predecessor companies
have completed over 2.4 million metres of drilling in 12,636 drill holes across the Marigold, Buffalo Valley, and Trenton Canyon areas.
Since 2022, exploration at the Property has focused on the following:
| · | Exploration drilling to expand Mineral Resources and Mineral Reserves through systematic step out drilling. |
| · | Infill drilling to increase the confidence of Mineral Resource estimates, specifically targeting areas with widely spaced drilling
(approximately 35m to 50 m) and around drill holes drilled prior to 2006 with missing assays. |
| · | Drilling to confirm the final position of the pit highwall. |
| · | Defining mineralization at Trenton Canyon and Buffalo Valley. |
From December 1, 2021, through to the end of June 2023, a total of 491
holes have been drilled (456 RC holes and 35 diamond core holes), totalling 139,839 m.
| 1.3.6 | Mineral Resource Estimates |
Mineral Resources have been classified in accordance with the definitions
for Mineral Resources in S-K 1300. SLR has reviewed, audited, and accepted the Mineral Resource estimates prepared by SSR and Red Pennant
Geoscience Consulting (Red Pennant) for Marigold and Buffalo Valley, respectively. The Mineral Resource estimates are based on block model
values developed from assays on the mineralized properties. The Marigold Mine and Buffalo Valley Mineral Resources as of September 30,
2023 are summarized in Table 1-2.
The Mineral Resource estimates were completed using conventional block
modeling approach in Hexagon(MineSight) and Seequent’s Leapfrog Geo (Leapfrog Geo) software.
Estimates were validated using standard industry techniques including
statistical comparisons with composite samples and parallel inverse distance squared (ID2) and nearest neighbor (NN) estimates, swath
plots, and visual reviews in cross-section and plan. A visual review comparing blocks to drill holes was completed after the block modeling
work was performed to ensure general lithologic and analytical conformance and was peer reviewed prior to finalization.
| | 1-14 | |
| SSR Mining Inc. | Marigold Complex S-K 1300 Report | February 12, 2024 SLR Project No.: 138.21581.00002 |
Table 1-2: Summary of
Marigold Mine and Buffalo Valley Mineral Resources
| Deposit |
Measured Mineral Resources |
Indicated Mineral Resources |
Measured + Indicated Mineral Resources |
Inferred Mineral Resources |
Cut-off Grade
(g/t Au) |
Amount
(Mt) |
Grade
(g/t Au) |
Rec.
(%) |
Amount
(Mt) |
Grade
(g/t Au) |
Rec.
(%) |
Amount
(Mt) |
Grade
(g/t Au) |
Rec.
(%) |
Amount
(Mt) |
Grade
(g/t Au) |
Rec.
(%) |
| Marigold |
0 |
0 |
0 |
103.72 |
0.44 |
75.5% |
103.72 |
0.44 |
75.5% |
19.09 |
0.36 |
75.9% |
0.069 |
| Buffalo Valley |
0 |
0 |
0 |
14.89 |
0.57 |
62.7% |
14.89 |
0.57 |
62.7% |
8.77 |
0.51 |
64.6% |
0.134 to 0.279 |
| Total |
0 |
0 |
0 |
118.61 |
0.46 |
73.5% |
118.61 |
0.46 |
73.5% |
27.86 |
0.46 |
71.2% |
|
Notes:
| 1. | The Mineral Resource estimate was prepared in accordance with S-K 1300. |
| 2. | The effective date of Mineral Resources at Marigold is September 30, 2023, and the effective date of Mineral Resources at Buffalo
Valley is July 31, 2023. |
| 3. | The Mineral Resource estimate is based on optimized pit shells using a cut-off grade of 0.069 g/t payable gold (gold assay for
recovery, royalty, and net proceeds), with a gold price assumption of $1,750/oz, for Marigold, and using cut-off grades based on lithology
type (calc-silicate hornfels=0.279 g/t gold, greenstone = 0.184 g/t gold, intrusive = 0.134 g/t gold, and siliceous hornfels = 0.158 g/t
Au, payable gold factored for recovery, royalty, and net proceeds), with a gold price assumption of $1,750/oz, for Buffalo Valley. |
| 4. | For Marigold, bulk densities (in t/m3) were assigned by lithologies: alluvium = 2.10, Havallah = 2.48, Valmy/Antler = 2.4076+(0.0001*DEPTH),
and Valmy = 2.64. For Buffalo Valley, bulk densities (in t/m3) were assigned by lithology ranging from a low of 2.426 (Overburden)
to a high of 2.737 (Basalt) with a weighted average of 2.63. |
| 5. | The Mineral Resources estimate is reported below the as-mined surface as of September 30, 2023, for Marigold, and below the as-mined
surface as of July 31, 2023, for Buffalo Valley. |
| 6. | The point of reference for Mineral Resources is the entry to the carbon columns in the processing facility. |
| 7. | Mineral Resources are reported exclusive of Mineral Reserves. |
| 8. | The Property is 100% owned by SSR through its subsidiary MMC. |
| 9. | All ounces reported represent troy ounces, and g/t represents grams per metric tonne. |
| 10. | Totals may vary due to rounding. |
| | 1-15 | |
| SSR Mining Inc. | Marigold Complex S-K 1300 Report | February 12, 2024 SLR Project No.: 138.21581.00002 |
| 1.3.7 | Mineral Reserve Estimates |
Mineral Reserves in this TRS are derived from the current Mineral Resources.
The Mineral Reserves are reported as contained gold and are based on open pit mining from the Marigold Mine. The Proven and Probable Mineral
Reserves for Marigold are estimated as of September 30, 2023, and summarized in Table 1-3.
Table 1-3: Summary of Marigold
Mineral Reserves Estimate as of September 30, 2023
| |
Proven |
Probable |
Total |
Cut-off Grade (g/t) |
Metallurgical Recovery
(%) |
Tonnage
(Mt) |
Au Grade
(g/t) |
Tonnage
(Mt) |
Au Grade
(g/t) |
Tonnage
(Mt) |
Au Grade
(g/t) |
Contained Gold
(Moz) |
| In Situ |
– |
– |
154.7 |
0.51 |
154.7 |
0.51 |
2.54 |
0.069 |
74.2 |
| Stockpile |
|
|
20.1 |
0.14 |
20.1 |
0.14 |
0.09 |
0.069 |
76.8 |
| Leach Pad Inventory |
|
|
|
|
|
|
0.35 |
|
70.6 |
| Total |
– |
– |
174.8 |
0.47 |
174.8 |
0.47 |
2.98 |
0.069 |
73.8 |
Notes:
| 1. | The Mineral Reserve estimate was prepared in accordance with S-K 1300 definitions. |
| 2. | The Mineral Reserve estimate is based on a metal price assumption of $1,450/oz gold and is reported at a cut-off grade of 0.069 g/t payable
Au (Au assay factored for recovery, royalty, and net proceeds). |
| 3. | No mining dilution is applied to the grade of the Mineral Reserves. Dilution intrinsic to the Mineral Reserves estimate is considered
sufficient to represent the mining selectivity considered. |
| 4. | The Property is 100% owned by SSR through its subsidiary MMC. |
| 5. | Metals shown in this table are the contained metals in ore mined and processed. |
| 6. | All ounces reported represent troy ounces, and g/t represents grams per metric tonne. |
| 7. | Stockpiles, included in previous disclosures as In situ, have been reported as a separate line item to clearly differentiate the ore
source. |
| 8. | Totals may vary due to rounding. |
SLR is not aware of any risk factors associated with, or changes to,
any aspects of the modifying factors such as mining, metallurgical, infrastructure, permitting, or other relevant factors that could materially
affect the Mineral Reserve estimate.
Marigold Mine is mined using conventional surface mining methods. The
Mine uses large 280-t mining trucks, and some areas of the pit require long hauls to the leach pads. The surface operations include:
| | 1-16 | |
| SSR Mining Inc. | Marigold Complex S-K 1300 Report | February 12, 2024 SLR Project No.: 138.21581.00002 |
The Mineral Reserve is based on the ongoing annual average ore production
of 18.9 Mt from the Mackay (includes the Red Dot area), Valmy, North Mackay and New Millenium areas, delivering an average of 287 koz
of contained gold per year over the nine years of full production and tapering off in the final year as the mine reaches the end of LOM.
Mining and processing operations are scheduled 24 hours per day, and
the mine production is scheduled to directly feed the leach pads.
The current LOM plan provides 16 years of operational life, including
ten years of active mining followed by an additional six years of processing the heap leach pad inventory. The average stripping ratio
from the pits excluding the stockpile ore is 4.5 waste units to 1 unit of ore (4.5 stripping ratio).
There are 33 mining pits/phases in the four mining areas with varying
dimensions, with a maximum depth of approximately 430 m attained in the Red Dot pit area.
Primary production for all mine pits includes drilling 22.2 cm diameter
blast holes. A production blast hole of 16.7 m depth is drilled. Burden and spacing varies depending on the material being drilled. The
holes are filled with explosives and blasted. A combination of hydraulic excavators and electric shovels load the broken material into
280-t-payload mining trucks for transport from the pit to the Waste Rock Storage areas (WRSAs) and Leach Pads.
The major pieces of pit equipment include electric shovels, hydraulic
excavators, haul trucks, drills, bulldozers, and graders. Extensive maintenance facilities are available at the mine site to service mine
equipment.
Marigold headcount is 478 persons, which includes personnel in mine
operations, mine maintenance, geology, process and laboratory, and general and administration.
| 1.3.9 | Processing and Recovery Methods |
The Marigold processing facilities combine industry standard run-of-mine
(ROM) cyanide heap leaching, recovery of gold from the leach solution using carbon adsorption, desorption, electrowinning, and refining
circuits (ADR) to produce a final precious metal product.
The heap leach pad was originally constructed in 1990 and has since
expanded as required, with ongoing expansion of solution processing facilities to match production rate and leach area. Approximately
427 ha of heap leach pads are divided into 25 cells, along with six pregnant (gold bearing) solution ponds and two barren solution ponds.
There are 15 cells currently active.
ROM ore is delivered from the mine at a rate of approximately 20 Mt
per year to the leach pad by mine haul trucks and stacked in 6 m to 12 m lifts.
Barren leach solution is pumped to the leach pad by two independent
barren solution distribution systems. Combined barren solution flow capacity from the two pumping systems is 3,400 m3/h.
Drip tubing is used to distribute the barren solution from the main barren solution pipelines to each cell. Solution is applied to the
ore at a rate of 4.6 L/h/m2 to 8.6 L/h/m2 using drip emitters. Impact sprinklers, wobblers, or drip emitters
are used to irrigate the side slopes of the heap.
Pregnant solution from the leach pad is collected in the pregnant solution
ponds and pumped to the carbon-in-column (CIC) adsorption plant located on the north side of Barren Pond No. 1 to recover the gold by
adsorption. The carbon adsorption circuit consists of seven parallel carbon column trains, each with five columns.
| | 1-17 | |
| SSR Mining Inc. | Marigold Complex S-K 1300 Report | February 12, 2024 SLR Project No.: 138.21581.00002 |
Loaded carbon from carbon adsorption is transported by a dedicated
truck to the nearby carbon processing facility where gold is eluted (re-dissolved) from the carbon in two 2.7 t capacity carbon elution
vessels. Gold is eluted from the carbon using the Pressure Zadra process where a hot caustic solution at approximately 140°C is circulated
under pressure through the elution column, from bottom to top. The resulting rich gold eluant flows through two parallel 2.8 m3
electrowinning cells to recover the gold. The barren eluant discharging the electrowinning cells is recirculated through heat exchangers
to the bottom of the elution vessel to strip more gold. The process continues until the majority of the gold is recovered from the carbon.
The stripped carbon is acid washed with hydrochloric acid. The acidified
carbon is then neutralized with water in the same column. The carbon is discharged from the column and transferred to the reactivation
kiln. The carbon is reactivated by heating in a rotary kiln at 750°C. The reactivated carbon is quenched and screened before being
returned to the carbon adsorption circuit to be reloaded with gold.
The plated material (sludge) resulting from electrowinning is collected
in a filter press and then retorted for drying and mercury removal. After retorting, the sludge is mixed with flux and smelted in a propane
fired furnace for final precious metal recovery.
Marigold is accessible via Interstate Highway 80 in northern Nevada
and is approximately 5 km south-southwest of Valmy in Humboldt County. The site access road supports two lanes of traffic and consists
of hard packed clay and gravel.
The infrastructure facilities at Marigold include ancillary buildings,
offices and support buildings, access roads into the plant site, power distribution, source of fresh water and water distribution, fuel
supply, storage and distribution, waste management and communications.
The power supply for Marigold is provided by NV Energy Inc. via a 120 kV
transmission line to site. Site power draw is 5 MW. After exiting the main substation, power is distributed through a 25 kV
distribution grid.
Water for Marigold is supplied from three existing groundwater wells
located near the access road to the Property. Marigold owns groundwater rights and collectively allows up to 3.134 million m3
of water consumption annually, the majority of which is used as makeup water for process operations. On average, total freshwater makeup
is 2.4 m3/min. Approximately 5.3 m3 /min of fresh water is required during peak periods in the summer months.
The water is primarily consumed by retention in the heap leach pad, evaporation, processing operations and dust suppression.
The following buildings and facilities are in the main plant and offices
area:
| · | Truck shop and mobile maintenance warehouse |
| · | Carbon elution and regeneration / refinery building |
| · | Heap leach carbon columns |
| · | Administration building and light vehicle (old) shop |
| · | Metallurgical laboratory |
| · | Health & Safety Building |
| | 1-18 | |
| SSR Mining Inc. | Marigold Complex S-K 1300 Report | February 12, 2024 SLR Project No.: 138.21581.00002 |
| · | Motor control center (MCC) |
Additional buildings and facilities on site include:
| · | Leach pads and solution ponds |
| · | Waste rock storage areas |
| · | Potable water treatment building |
| · | Process line-out building |
| · | Welding and fabrication shop |
| · | Section 20 line-out building |
| · | Dispatch/MineCare office and Mine Operations building |
| · | Diesel tanks and fueling station |
The Marigold Mine produces gold and silver contained in doré.
Marigold is an active producer and has been for over three decades.
Gold is the principal commodity at the Marigold Mine and is freely traded
at prices that are widely known, so that prospects for sale of any production are virtually assured. A gold price of $1,450/oz Au was
used for estimation of Mineral Reserves and a long-term price of $1,755/oz Au was used for the economic analysis.
| 1.3.12 | Environmental Studies, Permitting and Plans, Negotiations, or Agreements with Local Individuals or Groups |
Specific federal, state, and local (Humboldt County, Nevada) regulatory
and permitting requirements apply to MMC, including the Plan of Operations (PoO) permitted via the United States (U.S.) Bureau of Land
Management (BLM); the Water Pollution Control Permit (WPCP) issued by the Nevada Department of Environmental Protection (NDEP); the temporary
discharge permit allowing for the discharge of dewatering water to rapid infiltration basins (RIBs) issued by NDEP; and the reclamation
permit issued by the Nevada Bureau of Mining Regulation and Reclamation (BMRR).
| | 1-19 | |
| SSR Mining Inc. | Marigold Complex S-K 1300 Report | February 12, 2024 SLR Project No.: 138.21581.00002 |
MMC currently holds active, valid permits for all current facets of
the mining operation. MMC is currently in compliance with all permits. At present, there are no known environmental issues that impact
the ability to extract Mineral Resources at the Property. All activities associated with MMC require an approved reclamation plan that
includes a Reclamation Cost Estimate (RCE) for all permitted facilities and activities. This was updated and approved by federal and
state agencies in 2022. MMC is actively engaged with the local communities and stakeholders and there are no outstanding negotiations
or social commitments for the operation of the mine.
| 1.3.13 | Capital and Operating Cost Estimates |
SSR’s forecasted capital and operating cost estimates related
to the development of Mineral Reserves are derived from annual budgets and historical actuals over the life of the current operation.
According to the American Association of Cost Engineers (AACE) classifications, these estimates would be Class 1 with an accuracy range
of -3% to -10% to +3% to +15%.
LOM project capital costs, which considers all costs incurred before
October 1, 2023, as sunk, are summarized in Table 1-4.
Table 1-4: Capital Costs Summary
| Capital Costs |
Total
($ million) |
|
| Mining Equipment Replacement |
32.1 |
|
| Equipment/Building Maintenance |
151.9 |
|
| Administration |
1.0 |
|
| Processing/Pads/Ponds |
33.6 |
|
| Permitting |
27.9 |
|
| Exploration/Mine Development |
11.0 |
|
| Subtotal Sustaining Capital |
257.6 |
|
| Reclamation |
69.2 |
|
| Total Capital Costs |
326.8 |
|
The LOM (from October 1, 2023) operating costs estimate is $11.56/t
of stacked ore, as shown in Table 1-5.
Table 1-5: Operating Costs Summary
| Description |
Total LOM
($ million) |
$/t stacked* |
| Mining |
974 |
5.43 (1.11/t moved) |
| Maintenance |
432 |
2.52 (0.49/t moved) |
| Processing |
415 |
2.37 |
| Site Support |
205 |
1.14 |
| Total |
2,027 |
11.56 |
| | 1-20 | |
| SSR Mining Inc. | Marigold Complex S-K 1300 Report | February 12, 2024 SLR Project No.: 138.21581.00002 |
SLR International Corporation (SLR) was retained by SSR Mining Inc.
(SSR) to prepare an independent Technical Report Summary (TRS) on the Marigold Complex (Marigold or the Property), located in Humboldt
and Lander counties, Nevada, USA. The Marigold Complex includes the Marigold Mine (including Mackay, Valmy, and New Millennium) and the
Buffalo Valley and Trenton Canyon deposits. SSR holds a 100% interest in the Property through its wholly owned subsidiary, Marigold Mining
Company (MMC).
This TRS conforms to United States Securities and Exchange Commission’s
(SEC) Modernized Property Disclosure Requirements for Mining Registrants as described in Subpart 229.1300 of Regulation S-K, Disclosure
by Registrants Engaged in Mining Operations (S-K 1300) and Item 601 (b)(96) Technical Report Summary.
SSR is a gold mining company with four producing assets located in the
USA, Türkiye, Canada, and Argentina, and with development and exploration assets in the USA, Türkiye, and Canada. SSR is listed
on the NASDAQ (NASDAQ:SSRM), the Toronto Stock Exchange (TSX:SSRM), and the Australian Stock Exchange (ASX:SSR).
SSR’s 100% owned Marigold Complex is located in Humboldt County,
Nevada, approximately five kilometers south–southwest of the town of Valmy, and approximately 24 km northwest of Battle Mountain.
The Marigold Complex is owned directly by SSR’s wholly-owned subsidiary, Marigold Mining Company (MMC). The open pit heap leach
gold mine has been in production since 1989 and has produced over four million ounces of gold. The operation consists of several open
pits, waste rock stockpiles, leach pads, a carbon adsorption facility, and a carbon processing and gold refining facility.
SLR visited the site on June 13 to 14, 2023. During the site visit,
the SLR Qualified Persons (QP) received a project overview by site management with specific activities as follows:
The SLR geology QP toured operational areas and project offices, inspected
various parts of the property and infrastructure, inspected the core handling facility, sampling procedures, and interviewed key personnel
involved in the collection, interpretation, and processing of geological data and preparation of the Mineral Resource estimates.
The SLR mining QP toured operational areas and project offices, inspected
various parts of the mining operations and infrastructure, interviewed key personnel involved with the operations and technical services
involved with the preparation of the Mineral Reserve estimates and Life of Mine (LOM) plan.
| 2.2 | Sources of Information |
During the preparation of this TRS, discussions were held with personnel
from SSR:
| · | Rex Brommecker, SVP Exploration and Geology, SSR |
| · | Jonathan Holden, VP Innovation and Technical Services, SSR |
| · | Bill Patterson, Studies Contractor, SSR |
| · | Christa Zaharias, P.E., Study Manager, SSR |
| · | Karthik Rathnam, Director Resources, SSR |
| | 2-1 | |
| SSR Mining Inc. | Marigold Complex S-K 1300 Report | February 12, 2024 SLR Project No.: 138.21581.00002 |
| · | Matt Fithian, Principal Geologist, SSR |
| · | Brandon Heser, P.E., Director, Mine Technical Services, SSR |
| · | Erik Veinberg, Finance Director, (formerly SSR) |
| · | Jered Kullos, Principal Mine Engineer, SSR |
| · | James Harrold, P.E., Senior Process Engineer, SSR |
| · | Osman Uludağ, Director Resource Development, SSR |
| · | Andrew Smith, Interim Geology Manager, SSR |
| · | Jerry Johnson, Technical Services Manager, SSR |
| · | James Madson, Mine Engineer, SSR |
| · | Chris Nelson, Chief Metallurgist, SSR |
| · | Richard Zaggle, Study Manager, SSR |
This report is an update of a Technical Report Summary with a report
date of September 29, 2022 (OreWin, 2022).
This TRS was prepared by SLR QPs. The TRS is based on information and
data supplied to the QPs by SSR and other parties where necessary. The documentation reviewed, and other sources of information, are listed
at the end of this TRS in Section 24.0 References.
| | 2-2 | |
| SSR Mining Inc. | Marigold Complex S-K 1300 Report | February 12, 2024 SLR Project No.: 138.21581.00002 |
Units of measurement used in this TRS conform to the metric system.
All currency in this TRS is US dollars (US$) unless otherwise noted.
| μ |
micron |
kVA |
kilovolt-amperes |
| μg |
microgram |
kW |
kilowatt |
| a |
annum |
kWh |
kilowatt-hour |
| A |
ampere |
L |
litre |
| bbl |
barrels |
lb |
pound |
| Btu |
British thermal units |
L/s |
litres per second |
| °C |
degree Celsius |
L/h/m2 |
liters per hour per square meter |
| C$ |
Canadian dollars |
m |
metre |
| cal |
calorie |
M |
mega (million); molar |
| cfm |
cubic feet per minute |
m2 |
square metre |
| cm |
centimetre |
m3 |
cubic metre |
| cm2 |
square centimetre |
MASL |
metres above sea level |
| d |
day |
m3/h |
cubic metres per hour |
| dia |
diameter |
mi |
mile |
| dmt |
dry metric tonne |
min |
minute |
| dwt |
dead-weight ton |
μm |
micrometre |
| °F |
degree Fahrenheit |
mm |
millimetre |
| ft |
foot |
mph |
miles per hour |
| ft2 |
square foot |
MVA |
megavolt-amperes |
| ft3 |
cubic foot |
MW |
megawatt |
| ft/s |
foot per second |
MWh |
megawatt-hour |
| g |
gram |
oz |
troy ounce (31.1035 g) |
| G |
giga (billion) |
oz/st, opt |
ounce per short ton |
| gal |
US gallon |
ppb |
part per billion |
| g/L |
gram per litre |
ppm |
part per million |
| gpm |
US gallons per minute |
psia |
pound per square inch absolute |
| g/t |
gram per tonne |
psig |
pound per square inch gauge |
| gr/ft3 |
grain per cubic foot |
RL |
relative elevation |
| gr/m3 |
grain per cubic meter |
s |
second |
| ha |
hectare |
st |
short ton |
| hp |
horsepower |
stpa |
short ton per year |
| h |
hour |
stpd |
short ton per day |
| Hz |
hertz |
t |
metric tonne |
| in. |
inch |
tpa |
metric tonne per year |
| in2 |
square inch |
tpd |
metric tonne per day |
| J |
joule |
US$ |
United States dollar |
| k |
kilo (thousand) |
V |
volt |
| kcal |
kilocalorie |
W |
watt |
| kg |
kilogram |
wmt |
wet metric tonne |
| km |
kilometer |
wt% |
weight percent |
| km2 |
square kilometer |
yd3 |
cubic yard |
| km/h |
kilometer per hour |
yr |
year |
| kPa |
kilopascal |
|
|
| | 2-3 | |
| SSR Mining Inc. | Marigold Complex S-K 1300 Report | February 12, 2024 SLR Project No.: 138.21581.00002 |
This section has been modified from OreWin (2022).
Marigold is located in southeastern Humboldt County along the Interstate
Highway 80 corridor in the northern foothills of the Battle Mountain Range, Nevada, U.S. Activities at the Property are centred at approximately
40°45′ N Latitude and 117°8′ W Longitude.
The Property (Figure 3-1) is situated approximately five kilometres
south–southwest of the town of Valmy, Nevada, at Exit 216 off Interstate Highway 80. Other nearby municipalities include Winnemucca
and Battle Mountain, Nevada, which lie approximately 58 km to the northwest and 24 km to the southeast of the Property, respectively.
| | 3-1 | |
| SSR Mining Inc. | Marigold Complex S-K 1300 Report | February 12, 2024 SLR Project No.: 138.21581.00002 |
Figure 3-1: Location Map
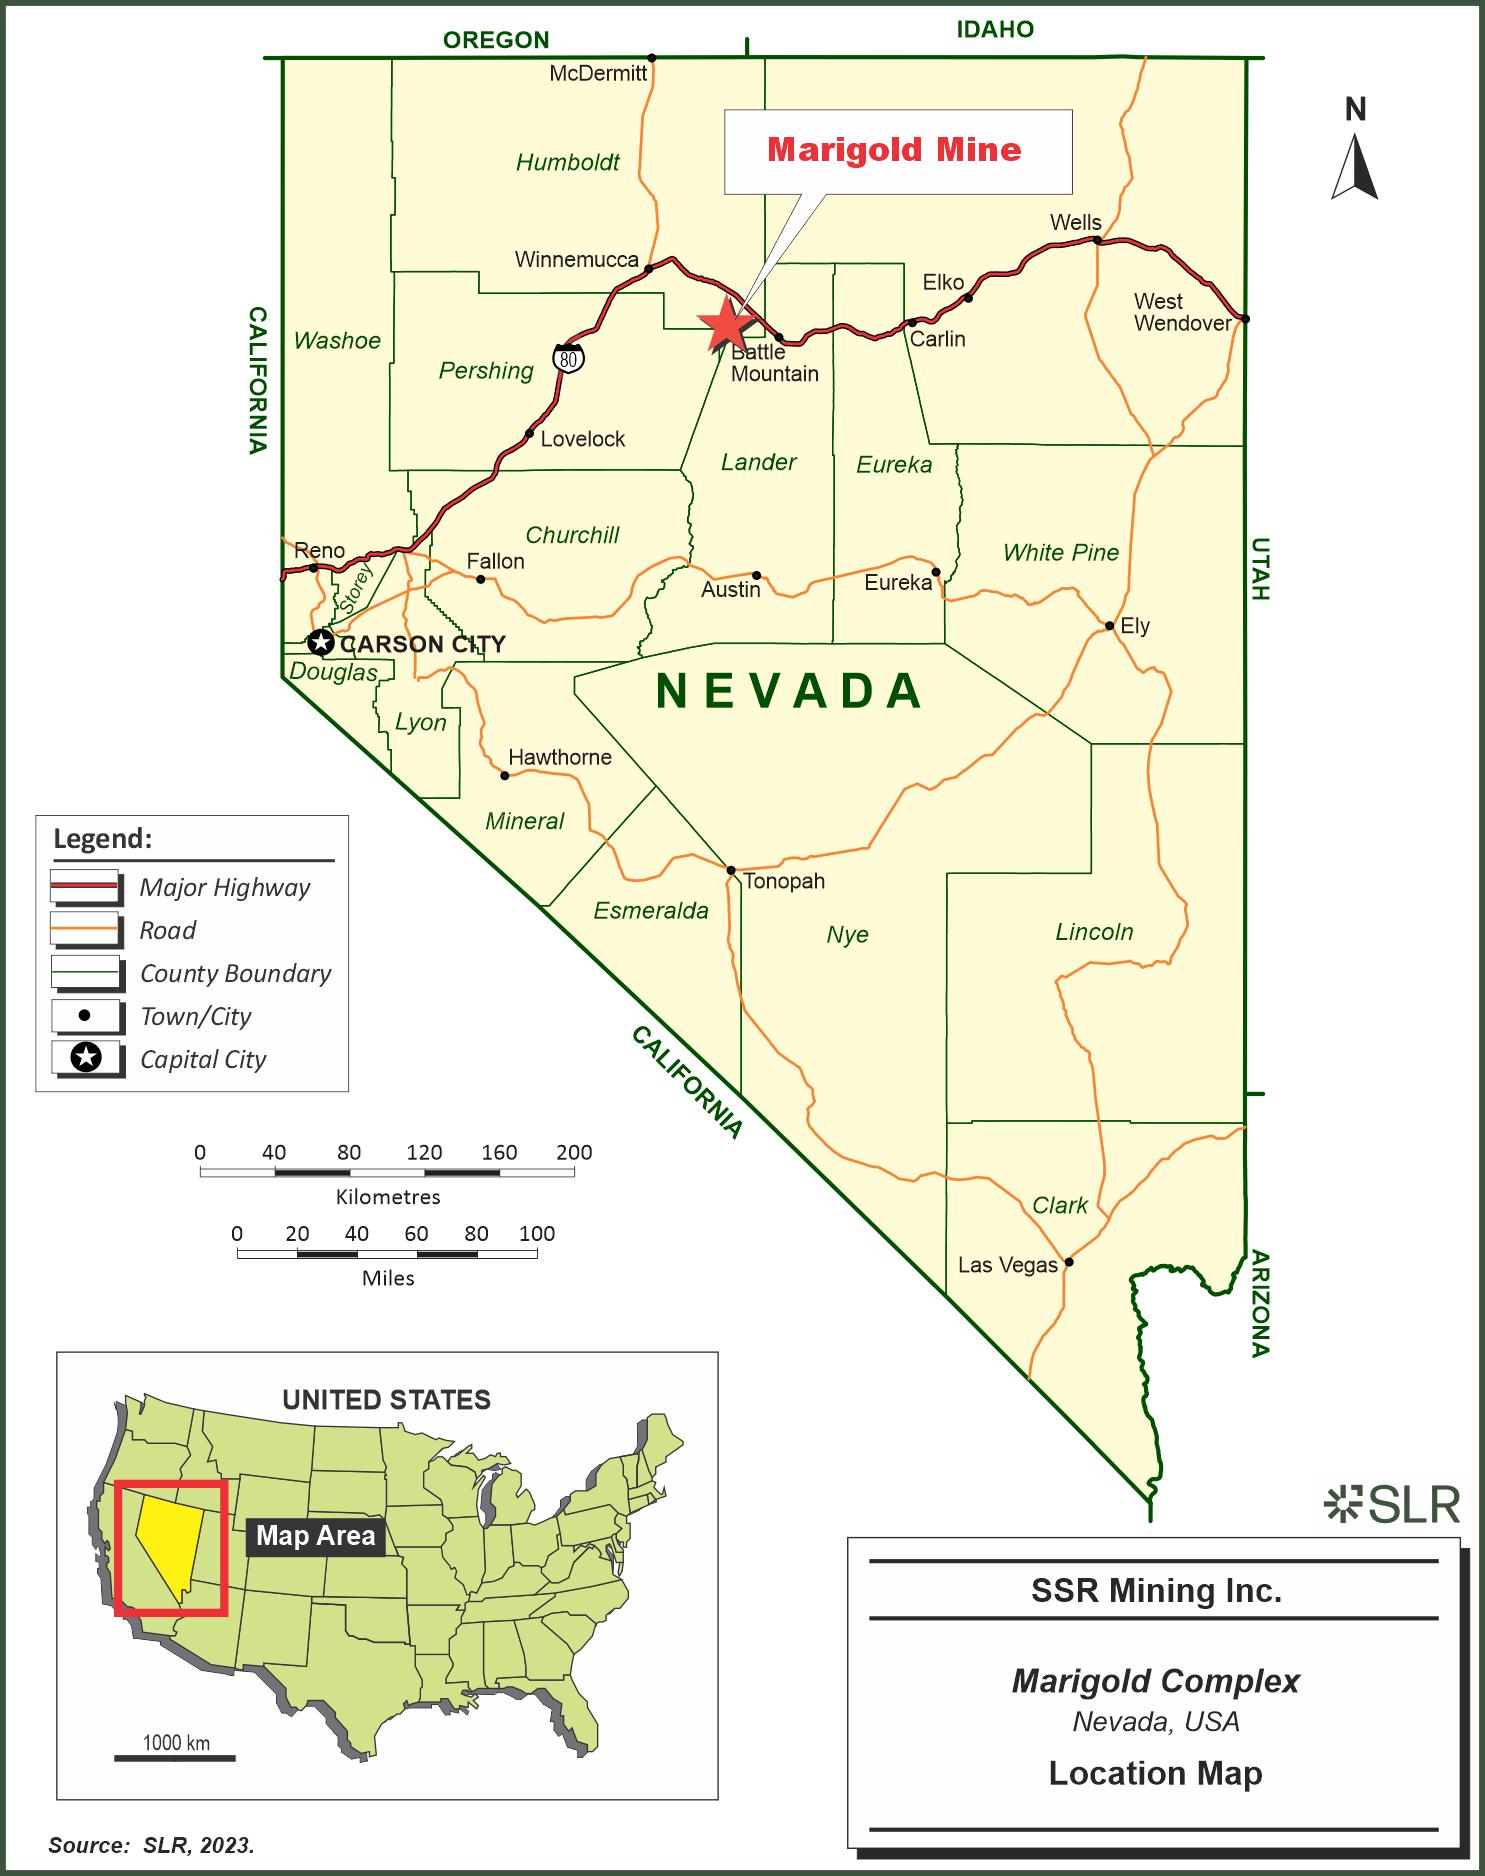
SSR Mining Inc.
Marigold Complex
Nevada, USA
Location Map
| | 3-2 | |
| SSR Mining Inc. | Marigold Complex S-K 1300 Report | February 12, 2024 SLR Project No.: 138.21581.00002 |
SSR holds 100% interest in the Property through its wholly owned subsidiary,
Marigold Mining Company (MMC). Surface and mineral rights at the Property comprise real property owned by MMC; unpatented mining claims
owned by MMC; and leasehold rights held by MMC with respect to unpatented mining claims and mill site claims and surface lands.
The properties described herein are associated with one of two main
land packages, the Marigold Land Package and the Sterling Land Package (both also referred to as project areas) totalling approximately
19,860 ha (Table 3-1, Figure 3-2). The Marigold Land Package (10,477 ha) includes the properties within the Marigold Mine PoO
(3,296 ha). The Sterling Land Package (9,383 ha) includes properties associated with the Trenton Canyon Mine or Buffalo Valley Mine.
Table 3-1: List of Land Package
Areas (in hectares)
| Property Name |
Total
(ha) |
Public
(ha) |
Private
(ha) |
| Sterling Land Package Total |
9,383 |
4,936 |
4,446 |
| Buffalo Valley Mine and Exploration |
2,415 |
1,471 |
945 |
| Trenton Canyon Mine |
2,001 |
935 |
1,066 |
| Trenton Canyon Exploration |
1,433 |
780 |
653 |
| Sterling Boundary |
3,534 |
1,750 |
1,783 |
| Marigold |
10,477 |
5,101 |
5,375 |
| Total Land Package (Sterling + Marigold) |
19,860 |
10,038 |
9,822 |
Land and mineral ownership within the PoO are within the corridor initially
governed by the Railroad Act, and, as such, these areas generally have a “checkerboard” ownership pattern. Mineral claims
in Nevada are managed federally by the Bureau of Land Management (BLM).
| | 3-3 | |
| SSR Mining Inc. | Marigold Complex S-K 1300 Report | February 12, 2024 SLR Project No.: 138.21581.00002 |
Figure 3-2: Marigold and Sterling
Land Package Map
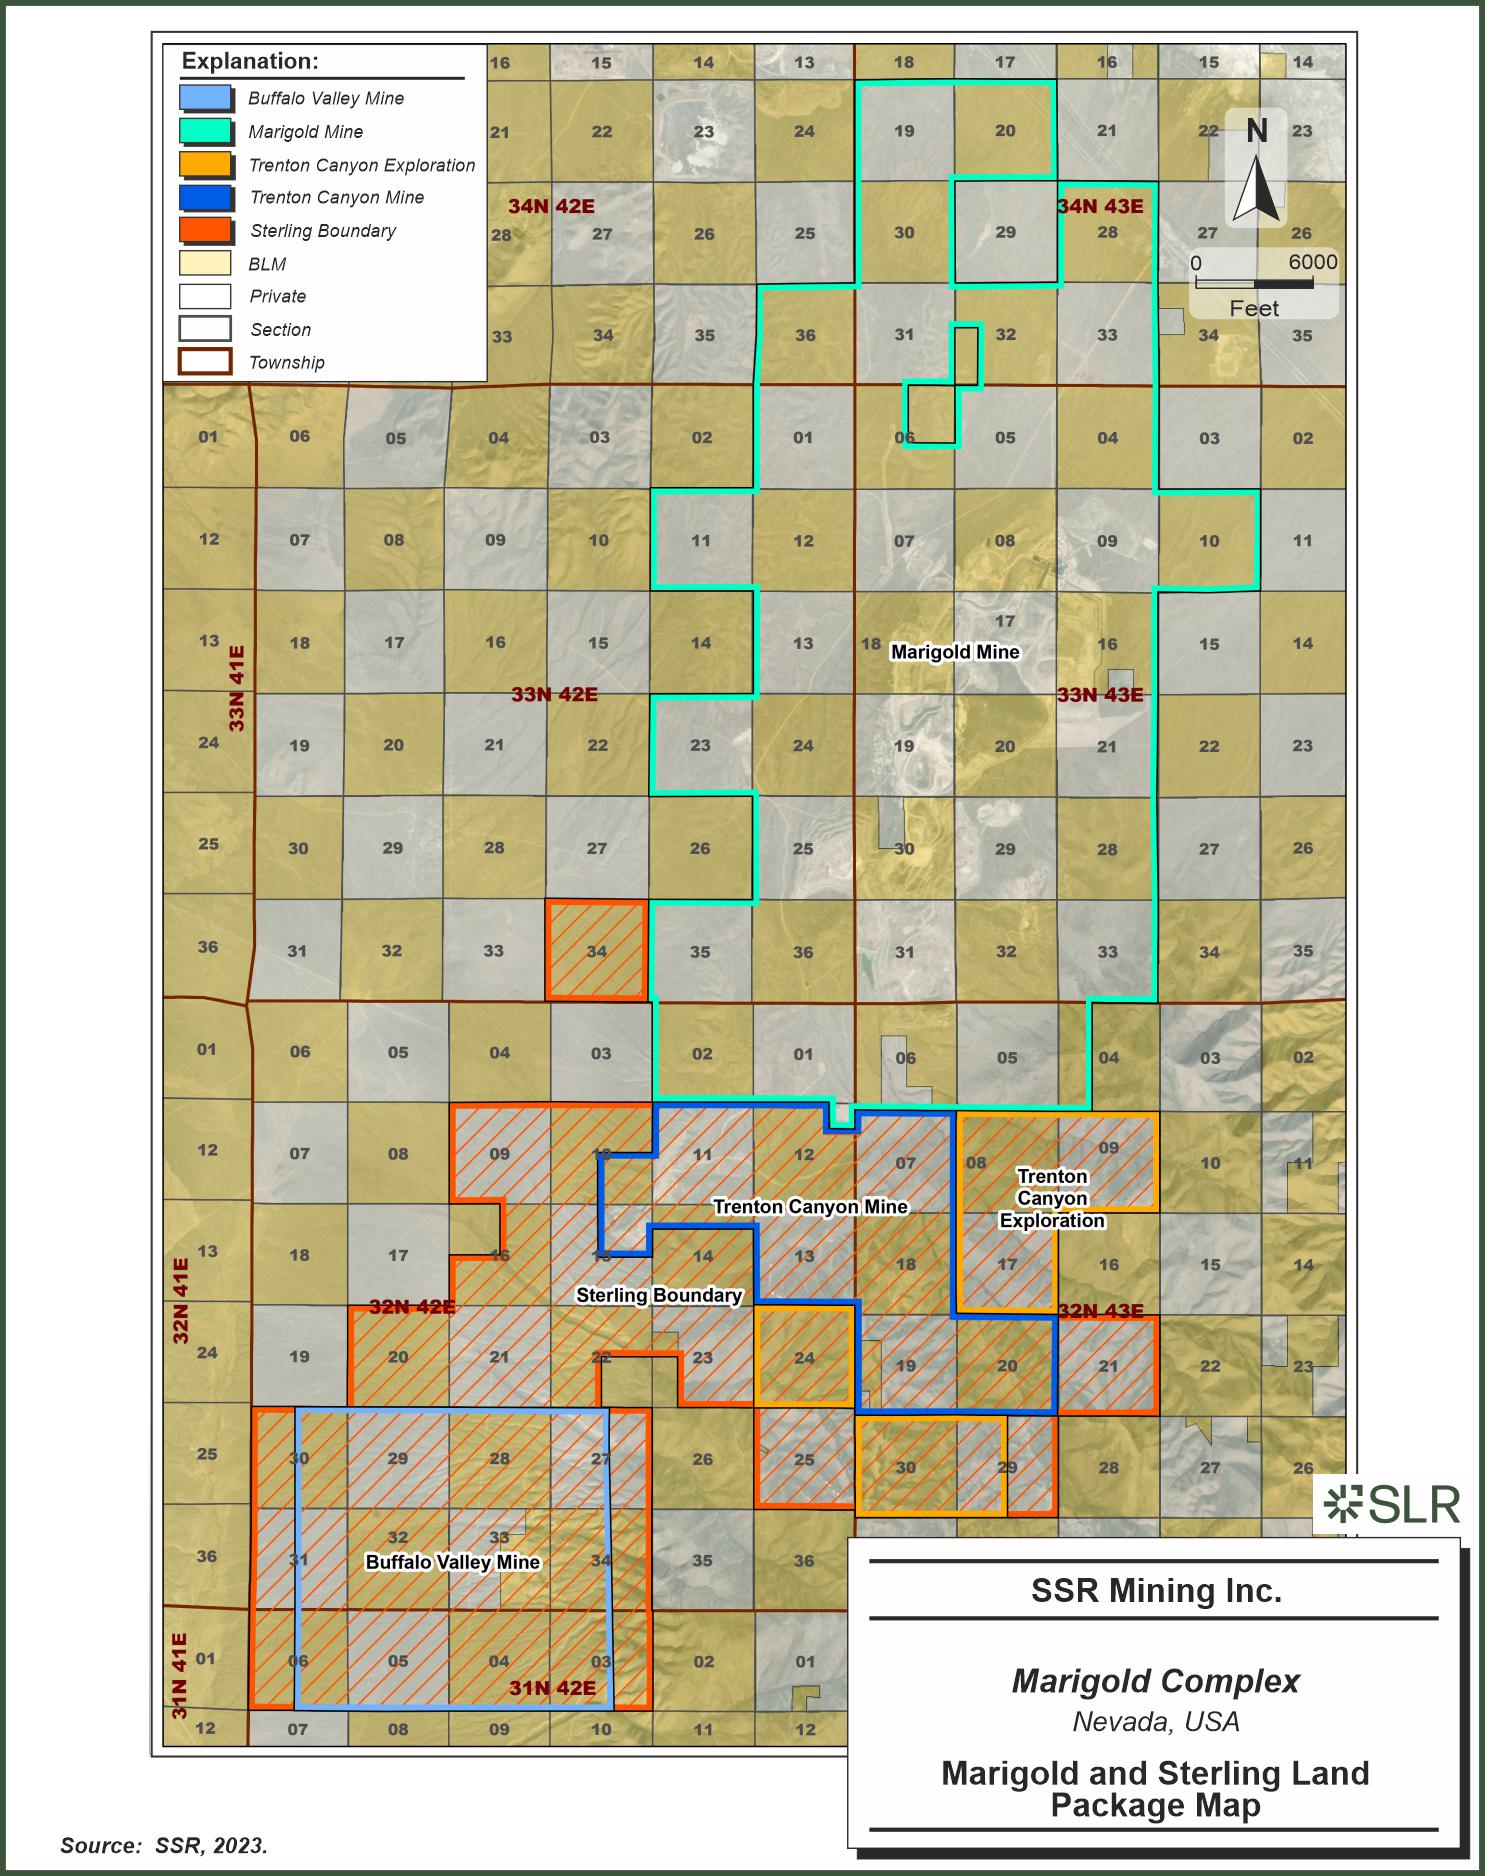
SSR Mining Inc. Marigold
Complex Nevada, USA Marigold and Sterling Land Package Map
| | 3-4 | |
| SSR Mining Inc. | Marigold Complex S-K 1300 Report | February 12, 2024 SLR Project No.: 138.21581.00002 |
Surface lands at Marigold owned by MMC are listed in Table 3-2.
Table 3-2: MMC Surface Lands
| Parcel Number |
Hectares |
Location |
Ownership Type |
Project Area |
| 010-400-03 |
259.0 |
Section 03, T.31N, R.42E |
Minerals Only |
Sterling |
| 07-0491-14 |
194.3 |
Section 17, T.32N, R.43E |
Fee Simple |
Sterling |
| 07-0401-25 |
65.3 |
SE1/4 Section 22, T.34N, R.43E |
Surface Only |
Marigold |
| 07-0404-10, 07-0404-11, 007-0404-12, 07-0404-13 (Lot 8, Parcel 1-4), 07-0404-05 (Lot 11), 07-0404-06 (Lot 12), 07-0404-09 (Lot 15) |
65.7 |
Section 33, T.34N, R.43E |
Surface Only |
Marigold |
| 07-0403-03 (Lot 3) |
18.7 |
Section 33, T.34N, R.43E |
Surface Only |
Marigold |
| 07-0461-09 |
259.0 |
Section 9, T.33N, R.43E |
Surface Only |
Marigold |
| 07-0461-14 |
259.0 |
Section 17, T.33N, R.43E |
Surface Only |
Marigold |
| 07-0461-42 (Parcel A) and 07-0461-43 (Parcel B) |
259.0 |
Section 21, T.33N, R.43E |
Fee Simple |
Marigold |
| 07-0461-44 (Parcel C) and 07-0461-45 (Parcel D) |
259.0 |
Section 29, T.33N, R.43E |
Fee Simple |
Marigold |
| 07-0461-39 |
16.2 |
Section 16, T.33N, R.43E |
Fee Simple |
Marigold |
| 07-0461-41 |
32.4 |
Section 30, T.33N, R.43E |
Fee Simple |
Marigold |
| 07-0481-06 |
254.4 |
Section 1, T.32N, R.42E |
Fee Simple |
Marigold |
| 07-0481-11 |
259.0 |
Section 11, T.32N, R.42E |
Fee Simple |
Sterling |
| 07-0481-13 |
16.2 |
Section 12, T.32N, R.42E |
Fee Simple |
Marigold |
| 07-0481-17 |
194.3 |
Section 15, T.32N, R.42E |
Fee Simple |
Sterling |
| 07-0481-19 |
194.3 |
Section 13, T.32N, R.42E |
Fee Simple |
Sterling |
| 07-0491-02 |
64.8 |
Section 6, T.32N, R.43E |
Fee Simple |
Marigold |
| 07-0491-03 |
277.9 |
Section 5, T.32N, R.43E |
Fee Simple |
Marigold |
| 07-0491-07 |
259.0 |
Section 7, T.32N, R.43E |
Fee Simple |
Sterling |
| 07-0491-09 |
259.0 |
Section 9, T.32N, R.43E |
Fee Simple |
Sterling |
| 010-200-02 |
64.8 |
Section 15, T.32N, R.42E |
Fee Simple |
Sterling |
| 010-200-04 |
64.8 |
Section 13, T.32N, R.42E |
Fee Simple |
Sterling |
| 010-200-10 |
257.5 |
Section 25, T.32N, R.42E |
Fee Simple |
Sterling |
| 010-200-12 |
145.7 |
Section 33, T.32N, R.42E |
Fee Simple |
Sterling |
| 010-210-02 |
64.8 |
Section 17, T.32N, R.43E |
Fee Simple |
Sterling |
| 010-210-06 |
259.0 |
Section 21, T.32N, R.43E |
Fee Simple |
Sterling |
| 010-210-12 |
259.0 |
Section 29, T.32N, R.43E |
Fee Simple |
Sterling |
| 010-230-01 |
8.1 |
Section 19, T.32N, R.43E |
Fee Simple |
Sterling |
| 010-230-03 |
210.1 |
Section 19, T.32N, R.43E |
Fee Simple |
Sterling |
| | 3-5 | |
| SSR Mining Inc. | Marigold Complex S-K 1300 Report | February 12, 2024 SLR Project No.: 138.21581.00002 |
| 3.2.2 | Owned Unpatented Mining Claims |
MMC owns a total of 347 unpatented mining claims within the Marigold
project area, as shown in Table 3-3, and 499 unpatented mining claims within the Sterling (Trenton Canyon and Buffalo Valley) project
area, as shown in Table 3-4.
All claims, which are renewed annually in September of each year, are
in good standing until September 1, 2024 (at which time they will be renewed for the following year as a matter of course). All unpatented
mining claims are subject to an annual federal mining claim maintenance fee of $165 per claim plus approximately $10 per claim for county
filing fees to the BLM.
Table 3-3: MMC-Owned Unpatented
Mining Claims within the Marigold Mine Project Area
| BLM Serial Numbers |
Claims |
Total Number of Claims |
| NMC371561 to NMC371573 |
APRI # 1 to APRI # 13 |
13 |
| NMC519580 |
APRI # 14 |
1 |
| NMC552229 |
APRI # 15 |
1 |
| NMC361136 to NMC361161 |
VAL #237 to VAL #262 |
26 |
| NMC600391 to NMC600402 |
VAL #1013 to VAL #1024 |
12 |
| NMC371574 to NMC371609 |
TYLER # 1 to TYLER # 36 |
36 |
| NMC454876 to NMC454911 |
REMARY #237 to REMARY #272 |
36 |
| NMC552228 |
REMARY FRACTION |
1 |
| NMC359040 to NMC359057 |
MARY # 73 to MARY # 90 |
18 |
| NMC400277 to NMC400288 |
HS #123 to HS #134 |
12 |
| NMC400289 |
HS #134A |
1 |
| NMC358968 to NMC359003 |
MARY# 1 to MARY # 36 |
36 |
| NMC371610 |
BONZ # 1 |
1 |
| NMC371612 |
BONZ # 3 |
1 |
| NMC371614 |
BONZ # 5 |
1 |
| NMC371616 |
BONZ # 7 |
1 |
| NMC371618 to NMC371627 |
BONZ # 9 to BONZ # 18 |
10 |
| NMC371630 to NMC371639 |
BONZ # 21 to BONZ # 30 |
10 |
| NMC451485 to NMC451488 |
BONZ # 33 to BONZ # 36 |
4 |
| NMC487422 |
REBONZ # 2 |
1 |
| NMC487423 |
REBONZ # 4 |
1 |
| NMC487424 |
REBONZ # 6 |
1 |
| NMC487425 |
REBONZ # 8 |
1 |
| NMC487426 to NMC487427 |
REBONZ # 19 to REBONZ # 20 |
2 |
| NMC487428 |
REBONZ # 31 |
1 |
| | 3-6 | |
| SSR Mining Inc. | Marigold Complex S-K 1300 Report | February 12, 2024 SLR Project No.: 138.21581.00002 |
| BLM
Serial Numbers |
Claims
|
Total
Number of Claims |
| NMC524363 |
REBONZ # 32 |
1 |
| NMC1112641 to NMC1112686 |
GINGER #1 to GINGER #46 |
46 |
| NMC362237 to NMC362272 |
LCL #1 to LCL #36 |
36 |
| NMC684371 to NMC674382 |
EJM #1 to EJM #12 |
12 |
| NV106305030 to NV106305053 |
CB 1 to CB 24 |
24 |
| Total Number of Claims |
|
347 |
Notes:
| 1. | Claims require an annual maintenance fee / renewal notification in September each year. |
| 2. | All claims expire on August 31, 2024 at 11:59:59 A.M. |
Table 3-4: MMC-Owned Unpatented
Mining Claims within the Sterling Project Area
BLM Serial Numbers
(NMC prefix are Legacy Serial Numbers) |
Claims |
Total Number of Claims |
| NMC408889 to NMC408906 |
AP # 1 to AP # 18 |
18 |
| NMC408907 to NMC408924 |
AP # 37 to AP # 54 |
18 |
| NMC670367 to NMC670368 |
AP #9A to AP #10A |
2 |
| NMC689220 and NMC689221 |
AP 1R and AP 3R |
2 |
| NMC632168 to NMC632170 |
AP 200 to AP 202 |
3 |
| NMC632172 to NMC632173 |
AP 204 to AP 205 |
2 |
| NMC689222 to NMC689224 |
AP 202R, AP 204R to AP 205R |
3 |
| NMC663238 |
AP 207 |
1 |
| NMC454061 to NMC454096 |
APTC # 1 to APTC # 36 |
36 |
| NMC643209 to NMC643212 |
Barb # 1 to Barb # 4 |
4 |
| NMC1192488 to NMC1192495 |
BERNAL 1 to BERNAL 8 |
8 |
| NMC933184 to NMC933201 |
Calf 1 to Calf 18 |
18 |
| NMC952352 to NMC952369 |
CALF 19 to CALF 36 |
18 |
| NMC639207 to NMC639265 |
CAPE #1 to CAPE #59 |
59 |
| MC639266 to NMC639268 |
CAPE #78 to CAPE #80 |
3 |
| NMC639271 to NMC639277 |
CAPE #83 to CAPE #89 |
7 |
| NV105732218 to NV105762251 |
CB 25 to CB 58 |
34 |
| NMC976967 to NMC976968 |
FAIR 1 to FAIR 2 |
2 |
| NMC728801 to NMC728812 |
FM 97 to FM 108 |
12 |
| NMC398105 to NMC398112 |
FOR # 1 to FOR # 8 |
8 |
| NMC479569 to NMC479572 |
FOR # 9 to FOR # 12 |
4 |
| NMC663239 to NMC663245 |
FORTOO 1 to FORTOO 7 |
7 |
| NMC663248 to NMC663253 |
FORTOO 10 to FORTOO 15 |
6 |
| | 3-7 | |
| SSR Mining Inc. | Marigold Complex S-K 1300 Report | February 12, 2024 SLR Project No.: 138.21581.00002 |
BLM Serial Numbers
(NMC prefix are Legacy Serial Numbers) |
Claims |
Total Number of Claims |
| NMC672352 to NMC672353 |
FORTOO NO 16 to FORTOO NO 17 |
2 |
| NMC812860 to NMC812861 |
FORTOO 18 to FORTOO 19 |
2 |
| NMC1192496 to NMC1192498 |
Hatcher 1 to Hatcher 3 |
3 |
| NMC639282 to NMC639301 |
HGS #37 to HGS #56 |
20 |
| NMC639318 to NMC639320 |
HGS #284 to HGS #286 |
3 |
| NMC639321 to NMC639323 |
HGS #288 to HGS #290 |
3 |
| NMC639324 to NMC639326 |
HGS #292 to HGS #294 |
3 |
| NMC639327, NMC415697, NMC415698 |
HGS #296, HGS #305, HGS #306 |
3 |
| NMC415702 to NMC415703 |
HGS #310 to HGS #311 |
2 |
| NMC479550, NMC479551, NMC409749 |
Karen # 1, Karen # 3, Karen # 4 |
3 |
| NMC479552, NMC409750, NMC479553 |
Karen # 5, Karen # 6, Karen # 7 |
3 |
| NMC409751, NMC409752 |
Karen # 8, Karen # 10 |
2 |
| NMC1192499 to NMC1192516 |
KUHN 1 to KUHN 18 |
18 |
| NMC639365 to NMC639382 |
MAG #47 to MAG #64 |
18 |
| NMC1001050 to NMC1001066 |
NP 1 to NP 17 |
17 |
| NMC479554 to NMC409748 |
Peg #1 to Peg #10 |
10 |
| NMC918807 to NMC918826 |
PEG 1 to PEG 20 |
20 |
| NMC541209 to NMC541255 |
PF # 1 to PF # 47 |
47 |
| NMC556959 to NMC556963 |
RCL #173 to RCL #177 |
5 |
| NMC1192517 to NMC1192518 |
TBJ 8A to TBJ 9A |
2 |
| NMC216402 to NMC216435 |
TCL # 1 to TCL # 34 |
34 |
| NMC639278 to NMC639281 |
WP 1 to WP 4 |
4 |
| Total Number of Claims |
|
499 |
Notes:
| 1. | Claims require an annual maintenance fee / renewal notification in September each year. |
| 2. | All claims expire on August 31, 2024 at 11:59:59 A.M. |
MMC holds leasehold rights in each of the
following leases:
| · | Mineral Lease Agreement made and entered into as of June 20, 1986, by and between Donald J. Decker and Suzanne R. Decker, as lessors,
Nevada North Resources (USA) Inc., as lessee, and Nevada North Resources Inc. (as amended, the “Decker Lease”). |
| · | Lease Agreement made and entered into as of September 15, 1985, by and between Vek Associates, as lessor, and Rayrock Mines, doing
business as Cordex, as lessee (as amended, the “Vek & Andrus Lease”). |
| | 3-8 | |
| SSR Mining Inc. | Marigold Complex S-K 1300 Report | February 12, 2024 SLR Project No.: 138.21581.00002 |
| · | Lease Agreement made and entered into as of August 1, 1988, by and between Euro-Nevada Mining Corp., Inc., as lessor, and Rayrock
Mines, doing business as Cordex, as lessee (as amended, the “Euro-Nevada Lease”). |
| · | Lease Agreement made and entered into as of August 1, 2018, by and between the Board of Regents of the Nevada System of Higher Education
on behalf of the University of Nevada, Reno, as lessor, and Marigold Mining Company, as lessee (the “University of Nevada Lease”). |
| · | Minerals Lease dated and effective June 17, 1988, by and between SFP Minerals Corporation, as lessor, and Santa Fe Pacific Mining,
Inc., as lessee (the “SFP Lease”). |
| · | Minerals Lease dated and effective as of February 19, 1986, by and between Southern Pacific Land Company, as lessor, and SFP Minerals
Corporation, as lessee (the “Southern Pacific Land Company Lease”). |
| · | Minerals Sublease dated and effective April 30, 1986, by and between SFP Minerals Corporation, as sublessor, and Santa Fe Pacific
Mining, Inc., as sublessee (as amended, the “Southern Pacific Land Company Sublease” and, together with the Decker Lease,
the Vek & Andrus Lease, the Euro-Nevada Lease, the University of Nevada Lease, the SFP Lease and the Southern Pacific Land Company
Lease, collectively, the “Leases”). |
| · | Minerals Lease Agreement made and entered into as of June 5, 1987, by and between Donald J. Decker and Suzanne R. Decker, as lessors,
Nevada North Resources (USA) Inc. and Welcome North Mines (U.S.) Inc., as lessees (the “Franco-Nevada Lease”). |
| · | Minerals Lease Agreement made and entered into as of December 20, 1994, by and between Nevada North Resources (USA), Inc. by and between
Nevada North Resources (USA), Inc., as lessors, and Santa Fe Pacific Gold Corporation, as lessee (the “Nevada North Lease”). |
| · | Minerals Lease Agreement made and entered into as of June 1, 2006, by and between Nevada North Resources (USA), Inc., as lessor, and
Newmont USA Limited, d/b/a Newmont Mining Corporation, as lessee (as amended, the “New Nevada 2006 Lease”). |
| · | Minerals Lease Agreement made and entered into as of October 16, 2012, by and between New Nevada Resources, LLC and Lease Agreement
made and entered into as of October 16, 2012, by and between New Nevada Resources, LLC and New Nevada Lands, LLC, as lessors, and Newmont
Mining Company, as lessee (the “New Nevada 2012 Lease”). |
| · | Minerals Lease Agreement made and entered into as of December 3, 2014, by and between New Nevada Resources, LLC and Lease Agreement
made and entered into as of December 3, 2014, by and between New Nevada Resources, LLC and New Nevada Lands, LLC, as lessors, and Newmont
Mining Company, as lessee (the “New Nevada 2014 Lease”). |
| | 3-9 | |
| SSR Mining Inc. | Marigold Complex S-K 1300 Report | February 12, 2024 SLR Project No.: 138.21581.00002 |
| 3.2.3.1 | Decker Lease Claims |
Pursuant to the Decker Lease, MMC has leasehold rights to 170 unpatented
mining claims, as shown in Table 3-5. The initial term for the Decker Lease was through May 25, 1991, and thereafter, as long as operations
continue.
Table 3-5: Decker Lease Unpatented
Mining Claims
| BLM Serial Numbers (1), (2), (3) |
Claims |
Total Number of Claims |
| NMC48409 to NMC48412 |
RED # 21 to RED #24 |
4 |
| NMC48415 to NMC48426 |
RED # 27 to RED # 38 |
12 |
| NMC56187 to NMC56198 |
RED # 39 to RED # 50 |
12 |
| NMC56199 to NMC56216 |
RED # 52 to RED # 69 |
18 |
| NMC271665 to NMC271688 |
RED #201 to RED #224 |
24 |
| NMC271689 to NMC271716 |
RED #601 to RED #628 |
28 |
| NMC365642 to NMC365677 |
KIT # 1 to KIT # 36 |
36 |
| NMC678030 to NMC678047 |
RED 1801A to RED 1818A |
18 |
| NMC678055 to NMC678063 |
RED 1826A to RED 1834A |
9 |
| NMC552226 to NMC552227 |
RED # 23A to RED # 24A |
2 |
| NMC871541 to NMC871547 |
NURED 1819 to NURED 1825 |
7 |
| Total Number of Claims |
|
170 |
Notes:
| 1. | Claims require an annual maintenance fee / renewal notification in September each year. |
| 2. | All claims expire on August 31, 2024 at 11:59:59 A.M. |
| 3.2.3.2 | Vek & Andrus Lease Claims |
Pursuant to the Vek & Andrus Lease, MMC has leasehold rights to
205 unpatented mining and millsite claims, as shown in Table 3-6. The initial term for the Vek & Andrus Lease was through September
15, 1995, and runs for terms of ten years and, at the lessee’s sole option, may be renewed for up to eight successive ten-year periods,
upon prior written notice. A notification of intent to extend the lease was provided to VEK & Andrus on August 13, 2015.
Table 3-6: Vek & Andrus
Lease Unpatented Mining and Millsite Claims
| BLM Serial Numbers (1), (2), (3) |
Claims |
Total Number of Claims |
| NMC271972 to NMC272007 |
COT # 1 to COT # 36 |
36 |
| NMC275733 |
COT # 38 |
1 |
| NMC275750 to NMC275753 |
COT # 55 to COT # 58 |
4 |
| NMC275755 |
COT # 60 |
1 |
| NMC275757 |
COT # 62 |
1 |
| NMC275759 to NMC275767 |
COT # 64 to COT # 72 |
9 |
| NMC342068 to NMC342071 |
COT # 73 to COT # 76 |
4 |
| | 3-10 | |
| SSR Mining Inc. | Marigold Complex S-K 1300 Report | February 12, 2024 SLR Project No.: 138.21581.00002 |
| BLM Serial Numbers (1), (2), (3) |
Claims |
Total Number of Claims |
| NMC297554 to NMC297571 |
VAL # 1 to VAL # 18 |
18 |
| NMC347463 to NMC347475 |
VAL # 19 to VAL # 31 |
13 |
| NMC297572 to NMC297607 |
VAL # 37 to VAL # 72 |
36 |
| NMC361164 to NMC361172 |
COT FRAC # 1 to COT FRAC # 9 |
9 |
| NMC371559 to NMC371560 |
COT # 75A to COT # 76A |
2 |
| NMC822614 |
RECOT 37 |
1 |
| NMC822615 to NMC822619 |
RECOT 39 to RECOT 43 |
5 |
| NMC822620 |
RECOT 45 |
1 |
| NMC822621 |
RECOT 47 |
1 |
| NMC822622 to NMC822626 |
RECOT 50 to RECOT 54 |
5 |
| NMC822627 |
RECOT 59 |
1 |
| NMC822628 |
RECOT 61 |
1 |
| NMC822629 |
RECOT 63 |
1 |
| NMC822630 |
RECOT 63B |
1 |
| NMC822560 to NMC822613 (2) |
GMMCMS 1 to GMMCMS 54 |
54 |
| Total Number of Claims |
|
205 |
Notes:
| 1. | NMC822560 to NMC822613 are Mill Site Claims and require an annual maintenance fee / renewal notification in September each year. |
| 2. | Claims require an annual maintenance fee / renewal notification in September each year. |
| 3. | All claims expire on August 31, 2024 at 11:59:59 A.M. |
| 3.2.3.3 | Euro-Nevada Lease Claims |
Pursuant to the Euro-Nevada Lease, MMC has leasehold rights to 36 unpatented
mining claims, as shown in Table 3-7. The original term for the Euro-Nevada Lease was five years, and, at the lessee’s option,
the Euro-Nevada Lease may be renewed for up to 10 additional and successive five-year periods, upon giving the lessor prior written notice.
The Euro-Nevada Lease was extended for one additional five-year term commencing May 24, 2023.
Table 3-7: Euro-Nevada Lease
Unpatented Mining Claims
| BLM Serial Numbers (1), (2) |
Claims |
Total Number |
| NMC373649 to NMC373684 |
SAR# 37 to SAR# 72 |
36 |
| |
Total Number of Claims |
36 |
Notes:
| 1. | Claims require an annual maintenance fee / renewal notification in September each year. |
| 2. | All claims expire on August 31, 2024 at 11:59:59 A.M. |
| | 3-11 | |
| SSR Mining Inc. | Marigold Complex S-K 1300 Report | February 12, 2024 SLR Project No.: 138.21581.00002 |
| 3.2.3.4 | University of Nevada Lease Claims |
Pursuant to the University of Nevada Lease, MMC has leasehold rights
to property in Section 19, T.33N., R.43E., Humboldt County, Nevada, identified as Humboldt County Assessor’s parcel number 007 461
19. The initial term of the University of Nevada Lease was ten years, and the lessee may renew the lease for successive ten-year periods
upon providing the lessor with prior written notice. A new agreement was executed on August 1, 2018, and extends through July 31, 2038.
Pursuant to the SFP Lease, MMC has leasehold rights to property in Sections
5, 9, 17, and 31, T.33N., R.43E., Humboldt County, Nevada. The initial term of the SFP Lease was for 20 years or for so long, thereafter,
as mining is conducted on a continuous basis.
| 3.2.3.6 | Southern Pacific Land Company Sublease Claims |
Pursuant to the Southern Pacific Land Company Sublease, MMC has leasehold
rights to certain property in Sections 19 and 31, T.34N., R.43E.; Section 7, T.33N., R.43E.; and Sections 1, 13, and 25, T.33N., R.42E.,
Humboldt County, Nevada. The initial term of the Southern Pacific Land Company Sublease was for 25 years beginning on April 30, 1986,
and for so long, thereafter, as the lessee exercises any rights granted by such sublease.
| 3.2.3.7 | Franco-Nevada Lease Claims |
Pursuant to the Franco-Nevada Lease, MMC has leasehold rights to 82
unpatented mining claims, as set out in Table 3-8. The initial term for the Franco-Nevada Lease was from June 5, 1987, for a period
of 50 years and for so long, thereafter, as the lessee exercises any rights granted by such lease.
Table 3-8: Franco-Nevada Lease
Unpatented Mining Claims
| BLM Serial Numbers (1), (2) |
Claims |
Total Number of Claims |
| NMC379514 to NMC379585 |
N-1 to N-72 |
72 |
| NMC623992 to NMC623995 |
N-109 to N-112 |
4 |
| NMC676435 |
N-20A |
1 |
| NMC676436 |
N-22A |
1 |
| NMC676437 to NMC676440 |
N-28A to N-31A |
4 |
| Total Number of Claims |
82 |
Notes:
| 1. | Claims require an annual maintenance fee / renewal notification in September each year. |
| 2. | All claims expire on August 31, 2024 at 11:59:59 A.M. |
| | 3-12 | |
| SSR Mining Inc. | Marigold Complex S-K 1300 Report | February 12, 2024 SLR Project No.: 138.21581.00002 |
| 3.2.3.8 | Nevada North Lease |
Pursuant to the Nevada North Lease, MMC has leasehold rights to 48 unpatented
mining claims, as set out in Table 3-9. The initial term for the Nevada North Lease was from December 20, 1994, for a period of 10
years and for so long, thereafter, as long as the lessee exercises any rights granted by such lease.
Table 3-9: Nevada North Lease
Unpatented Mining Claims
| BLM Serial Numbers (1), (2) |
Claims |
Total Number of Claims |
| NMC409224 to NMC409235 |
BC-1 to BC-12 |
12 |
| NMC409236 to NMC409271 |
BC-13 to BC-48 (Sterling) |
36 |
| Total Number of Claims |
48 |
Notes:
| 1. | Claims require an annual maintenance fee / renewal notification in September each year. |
| 2. | All claims expire on August 31, 2024 at 11:59:59 A.M. |
| 3.2.3.9 | New Nevada 2006 Lease Claims |
Pursuant to the New Nevada 2006 Lease, MMC has leasehold rights to 112
unpatented mining claims in Sections 33, T.33N, R.43E, Humboldt County, Nevada, as set out in Table 3-10. The initial term for the
New Nevada 2006 Lease was from June 1, 2006, for a period of 20 years and for so long, thereafter, as long as the lessee exercises any
rights granted by such lease.
Table 3-10: New Nevada 2006
Unpatented Mining Claims
| BLM Serial Numbers (1), (2) |
Claims |
Total Number of Claims |
| NMC750721 to NMC750736 |
CHU 17 to CHU 32 |
16 |
| NMC752847 to NMC752882 |
MB 82 to MB 117 |
36 |
| NMC780924 to 780959 |
LOU 1 to LOU 36 |
36 |
| NMC821539 to NMC821562 |
BISON # 1 to BISON # 24 |
24 |
| Total Number of Claims |
112 |
Notes:
| 1. | Claims require an annual maintenance fee / renewal notification in September each year. |
| 2. | All claims expire on August 31, 2024 at 11:59:59 A.M. |
| 3.2.3.10 | New Nevada 2012 Lease |
Pursuant to the New Nevada 2012 Lease, MMC has leasehold rights to property
in Sections 33, T.33N, R.43E, Humboldt County, Nevada. The initial term for the New Nevada 2012 Lease was from October 16, 2012, for a
period of 20 years and for so long, thereafter, as long as the lessee exercises any rights granted by such lease.
| | 3-13 | |
| SSR Mining Inc. | Marigold Complex S-K 1300 Report | February 12, 2024 SLR Project No.: 138.21581.00002 |
| 3.2.3.11 | New Nevada 2014 Lease |
Pursuant to the New Nevada 2014 Lease, MMC has leasehold rights to property
in Section 5 T.31N., R.42E.; Sections 9, 21, 27, 29, 31, and a portion of Section 23 T.32N., R42E; Sections 11, 23, and 35 T.33N, R.42E,
Humboldt County, Nevada. The initial term for the New Nevada 2014 Lease was from December 3, 2014, for a period of 20 years and for so
long, thereafter, as long as the lessee exercises any rights granted by such lease.
| 3.2.3.12 | Waseco Options Agreement |
The Option Agreement between Waseco Resources US Inc. and Marigold Mining
Company, dated effective July 1, 2020, recorded October 1, 2020 (at Document No. 294819 in Lander County, Nevada), provides an option
to acquire the Amended and Restated Mining Lease, among Waseco Resources US Inc., Aquarian Mining Exploration Inc. and William Fyvie Holdings
Ltd, dated July 1, 2020, recorded October 1, 2020 (at Document No. 294817 in Lander County, Nevada), covering the following unpatented
mining claims (Table 3-11) located in Section 20, T. 32N, R. 43E, MDBM, Lander County, Nevada:
Table 3-11: Waseco Options Unpatented
Mining Claims
| BLM Serial Numbers (1), (2) |
Claims |
Total Number of Claims |
| NMC937844 to NMC937852 |
SBD 1 to SBD 9 |
9 |
| NMC937853 to NMC937872 |
SBD 11 to SBD 30 |
20 |
| Total Number of Claims |
29 |
Notes:
| 1. | Claims require an annual maintenance fee / renewal notification in September each year. |
| 2. | All claims expire on August 31, 2024 at 11:59:59 A.M. |
| 3.3 | Encumbrances and Royalties |
Some of the leases require MMC to make certain net smelter return (NSR)
royalty payments to the lessors and comply with certain other obligations, including completing certain work commitments or paying taxes
levied on the underlying properties. These NSR royalty payments are based on the specific gold-extraction areas and are payable when the
corresponding gold ounces are extracted, produced, and sold. The NSR royalty payments vary between 0% and 10.0% of the value of gold production
net of off-site refining costs, which equates to an annual average ranging from 3.7% to 10.0% and a weighted average of 7.8% over the
life-of-mine (LOM).
| 3.4 | Required Permits and Status |
Mining activities at Marigold are authorized by and conducted under
both federal and state regulatory requirements, notably the General Mining Law of 1872, the National Environmental Policy Act of 1970,
and the Federal Land Policy and Management Act of 1976. All requirements are administered by the BLM, along with applicable statutes and
regulations within the Nevada Revised Statutes and Nevada Administrative Code, administered by the Nevada Division of Environmental Protection.
| | 3-14 | |
| SSR Mining Inc. | Marigold Complex S-K 1300 Report | February 12, 2024 SLR Project No.: 138.21581.00002 |
Further discussion regarding the Property’s mineral and surface
rights, including leasehold rights under the Leases, is provided in Section 3.2. Further discussion regarding permitting requirements
with respect to the Property is provided in Section 17.0. MMC holds active, valid permits for all facets of the current mining operation
as required by county, state, and federal regulations. MMC performs duties on leased lands pursuant to all federal and state requirements,
and all the Leases are maintained in good standing. As part of the Nevada permitting process, MMC engages in concurrent reclamation practices
and is bonded for all permitted features.
| 3.5 | Other Significant Factors and Risks |
SLR is not aware of any environmental liabilities on the property. SSR
Mining Inc. has all required permits to conduct the proposed work on the property. SLR is not aware of any other significant factors and
risks that may affect access, title, or the right or ability to perform the proposed work program on the property.
| | 3-15 | |
| SSR Mining Inc. | Marigold Complex S-K 1300 Report | February 12, 2024 SLR Project No.: 138.21581.00002 |
| 4.0 | Accessibility, Climate, Local Resources, Infrastructure and Physiography |
This section has been modified from OreWin (2022).
Access to the Property is via a five kilometre public road (hard-packed
clay and gravel) off the Valmy exit (Exit 216) on Interstate Highway 80. The area around the Property is a well-developed mining area
close to necessary all-season infrastructure and resources.
The climate is typical of the Great Basin region of the western U.S.,
with temperatures ranging from highs of 40°C in summer to lows of –7°C in winter. Annual precipitation is relatively low,
ranging from 15 cm to 20 cm per year, with approximately 50% of precipitation occurring as snowfall during the months of December through
March.
The climate presents no restrictions on the operating season, and Marigold
operates year-round.
The nearby towns of Winnemucca and Battle Mountain host the majority
of the skilled labor workforce. Contractor support, transportation, accommodation, meals, bulk fuel, heavy equipment rental, and general
suppliers are all readily available in these communities as well as in Elko, which is located approximately 142 km east of Marigold and
serves as a major hub for mining operations in northern Nevada. Employees are transported to the Property primarily by contract buses
and light-duty vehicles owned by MMC.
Marigold has been in continuous operation since 1989. There is significant
existing infrastructure on site for delivering power and water to the various mine shops, leach pad, and process and ancillary facilities.
The Property is located in a favorable area for natural resource development with significant resources in place to support the mining
industry.
Water for Marigold is supplied from three existing groundwater production
wells located near the access road to the Property and dewatering wells located around the pits. Marigold owns groundwater rights that
collectively allow up to 3.134 million m3 of water consumption annually, the majority of which is used as makeup water for
process operations. On average, total freshwater makeup is 2.4 m3/min.
Dewatering water is used for makeup water for process operations and
dust suppression however the majority is sent to the rapid infiltration basins (RIBs) for infiltration back into the aquifer. A pipeline
has been constructed to connect the dewatering circuit to the process circuit so the dewatering water can be used as make-up supply water
to the process. This connection minimizes the need for the three production wells, and they will only be used for back-up as needed.
| | 4-1 | |
| SSR Mining Inc. | Marigold Complex S-K 1300 Report | February 12, 2024 SLR Project No.: 138.21581.00002 |
Approximately 5.3 m3/min of fresh water is required during
peak periods in the summer months. The water is primarily consumed by retention in the heap leach pad, evaporation, processing operations,
and dust suppression. Marigold also owns 0.893 Mm3 annually of surface water storage rights associated with the Trout Creek
Dam (J-666). In addition, in October 2019, Marigold was issued water right permits associated with the activities described in the Plan
of Operations – Mackay Optimization Project Amendment, including permits for the dewatering during mine operations and evaporative
losses from a future pit lake that will develop in closure.
The power supply for Marigold is provided by NV Energy Inc. via a 120
kV transmission line to site. Site power draw is 5 MW. After exiting the main substation, power is distributed through a 25 kV distribution
grid.
The tailings storage facility (TSF) has been decommissioned and reclaimed.
The only remaining activity concerning the TSF is ongoing monitoring.
Details regarding completed, in progress, and future waste rock storage
areas (WRSA) at Marigold can be found in Section 13. The leach pad is discussed in detail in Section 14. Further discussion on the Property’s
infrastructure is provided in Section 15.
Elevations at Marigold range from approximately 1,372 metres above mean
sea level (MASL) to 1,890 MASL. Terrain varies from a relatively flat alluvial plain to sloped foothills at the base of the Battle Mountain
Range. Vegetation mainly comprises sagebrush, rabbit brush, and a variety of grasses and forbs. Fauna is not abundant on the Property
primarily due to the lack of surface water and limited forage. No threatened or endangered plant or animal species have been noted within
the Property’s operating area.
| | 4-2 | |
| SSR Mining Inc. | Marigold Complex S-K 1300 Report | February 12, 2024 SLR Project No.: 138.21581.00002 |
This section has been modified from OreWin (2022).
| 5.1 | Ownership, Exploration, and Development History |
The first recorded gold production from the Property near Valmy, Nevada,
occurred in 1938 when the Marigold Mining Company, owned by Frank Horton, operated an underground mine which came to be known as Marigold.
Figure 5-1 shows the Marigold mine prior to World War II.
Figure 5-1: View to the East–Southeast
over the Cyanide Leach Tanks from the Marigold Mine prior to World War II
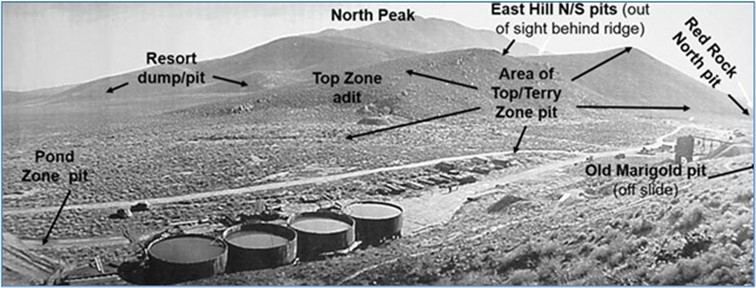
Source: SSR, 2017
The Horton family processed approximately 9,000 t of ore averaging about
6.85 g/t Au before World War II halted production. In 1943, Mr. Horton’s estate sold its interest in the Property and claims. Several
unsuccessful attempts were made to open and operate the mine before exploration activities began again in 1968.
From 1968 through 1985, several companies conducted exploration programs
in the Marigold area and completed a total of 126 exploratory drill holes. Records document the activities of Homestake (1968), St. Joe
(1979), Decker Exploration (1979), Placer Amex (1979–1980), True North, Marigold Development Company (MDC) (1981–1983), Welcome
North (1984), and Nevada North Resources (USA) Inc. (1985–1986). Other groups that conducted work in the area include Newmont, Kerr-McGee,
SFP Minerals Corporation, Cordex/Rayrock Mines, and Vek/Andrus Associates (partnership between Vic Kral, Ralph Roberts, Bob Reeve, and
Bill Andrus composed of Vek Associates and Andrus Resources Corporation).
From 1983 through 1984, MDC excavated a small open pit over the historical
Marigold underground workings, producing 2,812 t containing 271 oz gold (McGibbon, 2004).
In 1985, Vek/Andrus Associates drilled three holes under the supervision
of Ralph Roberts in the Section 8 area of the Property, just northeast of the old underground mine. Roberts invited Andy Wallace of Cordex
to view the drilling results, and Wallace was encouraged by the deep level of oxidation, presence of favorable rock units, anomalous indicator
elements, and anomalous gold values. The operating partner Cordex, an exploration syndicate composed of Dome Exploration (U.S.) Ltd.,
Lacana Gold Inc. (Lacana) and Rayrock Mines, leased the Vek/Andrus Associates claim block in September 1985 and began a drilling program
in November 1985. Drill holes NM-3 and NM-4 intersected 21.3 m of 2.40 g/t Au and 25.9 m of 7.54 g/t Au, respectively. These were the
discovery holes for the 8 South (8S) ore body (Roberts, 2002).
| | 5-1 | |
| SSR Mining Inc. | Marigold Complex S-K 1300 Report | February 12, 2024 SLR Project No.: 138.21581.00002 |
The Property is within the “checkerboard” railway lands,
where the U.S. Government originally awarded the surface, water, and mineral rights for alternate sections (2.5 km2 of land)
to the Santa Fe Pacific Railroad as an incentive to develop the transcontinental railway project in the 1860s. Santa Fe Pacific Railroad
eventually became the parent company of SFP Minerals. Following further drilling in the 8S deposit in the spring of 1986, a joint venture
was formed between SFP Minerals and the Cordex group, which consolidated some of the land holdings over the Marigold area.
In late-1986, the Cordex group leased other claims, including the historical
Marigold mine, Mackay (Top Zone, East Hill, and Red Rock) area from various claim holders.
In March 1988, Rayrock Mines (operating company for Cordex) made a production
decision on the 8S deposit, and, by September 1988, it began stripping on the 8S pit (McGibbon, 2004).
In August 1989, the first gold doré bar was poured at the Marigold
mill.
In March 1992, Rayrock Mines purchased a two thirds ownership interest
in the Property, and Homestake Mining Company (Homestake), which had taken Lacana’s interest through previous corporate mergers,
held the remaining one third ownership interest in the Property.
In 1994, mining of the 8S deposit was completed, and the Marigold mill
was no longer used to process ore. At this point, Marigold became a run-of-mine (ROM) heap leach operation.
In March 1999, Glamis Gold Ltd. (Glamis Gold) purchased all the assets
of Rayrock Mines, resulting in Glamis Gold holding a two thirds ownership interest in Marigold, and Homestake continuing to hold a one
third ownership interest. In the same year, the Basalt, Antler, and Target II deposits were discovered at the south end of the Property
in Section 31. These deposits were mined and partially backfilled with the unmined East Basalt deposit which is currently under development
as an easterly extension of the original Basalt pit.
By January 2001, a total of one million ounces of gold had been recovered
from the Property. In July 2001, Glamis Gold released a revised NI 43-101 Technical Report (Glamis Gold, 2001) to report the Mineral
Resources and Mineral Reserves for Section 31 of the Property.
In 2006, Glamis Gold merged with Goldcorp Inc. (Goldcorp), resulting
in a Goldcorp subsidiary holding a two thirds ownership interest in Marigold and being the operator. Homestake, which had been acquired
by Barrick Gold Corporation (Barrick) in 2001, continued to hold the remaining one third ownership interest.
In 2007, discovery holes were drilled in the Red Dot deposit.
By mid-2009, two million ounces of gold had been recovered from Marigold.
On April 4, 2014, SSR (formerly Silver Standard Resources Inc.) completed
the acquisition of Marigold from subsidiaries of Goldcorp and Barrick, and prepared updated Mineral Resources and Mineral Reserves estimates
(Silver Standard, 2014).
In August 2015, Marigold mine acquired 2,844 ha of adjacent land from
Newmont. This land included previously mined areas known as the Mud pit, NW pit, and the Valmy pits. Exploration drilling in the area
had been completed by a combination of companies including Hecla Mining Company (Hecla), SFP Minerals, and Newmont.
| | 5-2 | |
| SSR Mining Inc. | Marigold Complex S-K 1300 Report | February 12, 2024 SLR Project No.: 138.21581.00002 |
In June 2019, SSR acquired the Trenton Canyon and Buffalo Valley properties
from Newmont Goldcorp Corporation (Newmont). The Trenton Canyon target is located approximately four kilometres south of New Millennium
and the Buffalo Valley target is located approximately 10 km southwest of New Millennium. Both properties are included in an 8,900
ha parcel that is contiguous to the south boundary of the Marigold property.
A summary of the historical exploration work carried out on the Property
is shown in Table 5-1. Figure 5-2 presents the exploration targets and mining areas for the Property.
| | 5-3 | |
| SSR Mining Inc. | Marigold Complex S-K 1300 Report | February 12, 2024 SLR Project No.: 138.21581.00002 |
Figure 5-2: Location of Marigold
Exploration Targets and Mining Areas

SSR
Mining Inc. Marigold Complex Nevada, USA Location of Marigold Exploration Targets and Mining Areas
| | 5-4 | |
| SSR Mining Inc. | Marigold Complex S-K 1300 Report | February 12, 2024 SLR Project No.: 138.21581.00002 |
Table 5-1: Summary of Historical
Exploration
| Year |
Property |
Company |
Exploration Type |
Details |
| 1968–1985 |
Marigold |
Various exploration and mining groups |
Drilling |
7,037.2 m in 126 drillholes. |
| 1985–1999 |
Marigold |
Cordex and Rayrock Mines |
Drilling |
335,500.7 m in 2,358 drillholes. |
| Geophysics |
1989 – CSAMT survey conducted by Quantec Geoscience using Zonge CSAMT System covering 33 EW and NW-SE lines, spaced 300.3 m and 499.9 m. A total of 59.2 km covered. |
| 1997/1999 – CSAMT survey conducted by Zonge Geoscience using Zonge CSAMT System covering 33 EW and NW–SE lines, spaced 300.3 m and 499.9 m. A total of 51.8 km covered. |
| 1998 – Gravity survey conducted by Zonge Geoscience using Scintrex Gravity Meter, Trimble GPS System survey conducted on 150 m square grid and data collected from a total of 1,252 stations. |
| 1999 – Induced Polarization conducted by Zonge Geoscience using Zonge IP system, Dipole-Dipole Array, A = 182.9 m, one line N20W. A total of 3.0 km covered. |
| 1999–2006 |
Marigold |
Glamis Gold |
Drilling |
486,648.9 m in 2,506 drillholes. |
| Geophysics |
2004 – Airborne Magnetic conducted by Pearson, deRidder & Johnson, Inc. using Ultra Light System / 75.0 m EW flight lines, 300.3 m NS tie lines. A total of 323.5 km covered. |
| 2006–2013 |
Marigold |
Goldcorp |
Drilling |
528,225.7 m in 1,870 drillholes. |
| Geophysics |
2009 – Magneto-telluric/Induced Polarization survey conducted by Quantec Geoscience, using Quantec Titan System. 11 lines in various orientations. A total of 46.4 km covered. |
| 2010 – Induced Polarization conducted by Zonge Geoscience using Zonge IP system, Dipole-Dipole Array, A= 150.0 m and 200.0 m, 27 lines EW, spaced 300.3 m –1,499.9 m. A total of 117.5 km covered. |
| 2009–2010 – Review of all geophysical survey data and compilation of Marigold geophysical data by J L Wright Geophysics. |
| | 5-5 | |
| SSR Mining Inc. | Marigold Complex S-K 1300 Report | February 12, 2024 SLR Project No.: 138.21581.00002 |
| Year |
Property |
Company |
Exploration Type |
Details |
| 2006–2013 |
Marigold |
Goldcorp |
MMI Survey |
2007–2009 – Initial survey in 2007 covered Red Dot area, and, in 2008–2009, most of undisturbed land within Marigold was covered. A total of 11,493 samples were taken. Samples collected every 15.2 m along 117 EW lines separated by 30.5 m. In 2007, samples were analysed for Ag, As, Au, Ba, Cd, Co, Cu, Pb, Pd, Sm, Y, Zn, and Zr. In 2008, Pd was dropped. In 2009, Co, Sm, Y, and Zr were dropped and replaced with Mg, Sr, and Sb. |
| 1985–2006 |
Valmy property |
Newmont (including Hecla and SFP Minerals) |
Drilling |
109,363 m in 867 drillholes. Data was acquired from Newmont with the acquisition of the 2,844 ha Valmy property in 2015. |
| 1980-2012 |
Buffalo Valley and Trenton Canyon |
Newmont (including Fairmile, Hecla and others) |
Drilling |
1574 RC and Core drillholes for 183,079m at Buffalo Valley
1,149 RC and Core drillholes for 153,701m at Trenton Canyon. |
| 1980-2012 |
Buffalo Valley and Trenton Canyon
|
Newmont (including Fairmile, Hecla and others) |
Geophysics |
Multiple Geophysical survey were carried over Buffalo Valley and Trenton Canyon properties by 5 different contractors and Newmont; these include – Airborne Electromagnetic Survey (AEM), Aero magnetic survey (AMAG), Airborne Radiometric Survey (ARAD), Controlled Source Audio Magneto-telluric Survey (CSMAT), Gravity (GRAV). |
| | 5-6 | |
| SSR Mining Inc. | Marigold Complex S-K 1300 Report | February 12, 2024 SLR Project No.: 138.21581.00002 |
Gold recovery at Marigold was initially done by a milling circuit with
a carbon-in-leach (CIL) process and then a ROM heap leach process where the ore was dumped on a lined leach pad and irrigated with a diluted
cyanide solution. The tonnes, grade, and contained and recovered ounces from the start of commercial production in August 1989 to April
1, 2014, is provided in Table 5-2; operations included both milled and leach pad processing. The tonnes, grade, and contained and
recovered ounces from April 1, 2014, when SSR acquired the Complex, to September 30, 2023, is provided in Table 5-3. Processing from
April 1, 2014 to date is leach pad only.
An overall average recovery for the milling circuit was 95%, and it
was calculated to be at 70.6% with the ROM heap leach process for the period August 1989 to September 30, 2023.
Table 5-2: Marigold Historical
Production from August 1989 to April 1, 2014
| Process Type |
Tonnes
(Mt) |
Au Grade
(g/t) |
Contained Gold
(koz) |
Recovered Gold
(koz) |
| Leach Pad |
146.1 |
0.67 |
3,139 |
2,265 |
| Milled |
4.6 |
3.13 |
483 |
458 |
| Total |
150.7 |
0.75 |
3,622 |
2,723 |
Table 5-3: Marigold Production
from April 1, 2014 to September 30, 2023
| Year |
Tonnes
(Mt) |
Au Grade
(g/t) |
Contained Gold
(koz) |
Recovered Gold
(koz) |
| 2014 |
11.20 |
0.60 |
215 |
130 |
| 2015 |
20.61 |
0.44 |
294 |
207 |
| 2016 |
23.56 |
0.46 |
345 |
205 |
| 2017 |
25.59 |
0.35 |
285 |
202 |
| 2018 |
27.53 |
0.37 |
324 |
205 |
| 2019 |
25.68 |
0.40 |
327 |
220 |
| 2020 |
23.56 |
0.39 |
297 |
234 |
| 2021 |
20.00 |
0.41 |
263 |
235 |
| 2022 |
18.06 |
0.56 |
323 |
195 |
| 2023 |
18.14 |
0.46 |
268 |
196 |
| Total |
213.91 |
0.43 |
2,941 |
2,030 |
The Trenton Canyon property operated as an open pit run-of-mine heap
leach operation from 1996 to 2001 producing approximately 290,000 ounces of gold from the North Peak, West, and South pits.
| | 5-7 | |
| SSR Mining Inc. | Marigold Complex S-K 1300 Report | February 12, 2024 SLR Project No.: 138.21581.00002 |
Mining was carried out on the Buffalo Valley property from 1989 to 1991
producing approximately 50,000 ounces of gold.
| | 5-8 | |
| SSR Mining Inc. | Marigold Complex S-K 1300 Report | February 12, 2024 SLR Project No.: 138.21581.00002 |
| 6.0 | Geological Setting, Mineralization, and Deposit |
The following sections contained in this TRS have been derived, and
in some instances extracted, from documentation (OreWin, 2022) and information supplied to SLR by SSR for review and audit.
Marigold is located in north-central Nevada within the Basin and Range
physiographic province bounded by Sierra Nevada to the west and the Colorado Plateau to the east (Figure 6-1).
Figure 6-1: Location of the
Marigold Mine in North-Central Nevada within the Basin and Range Physiographic Province
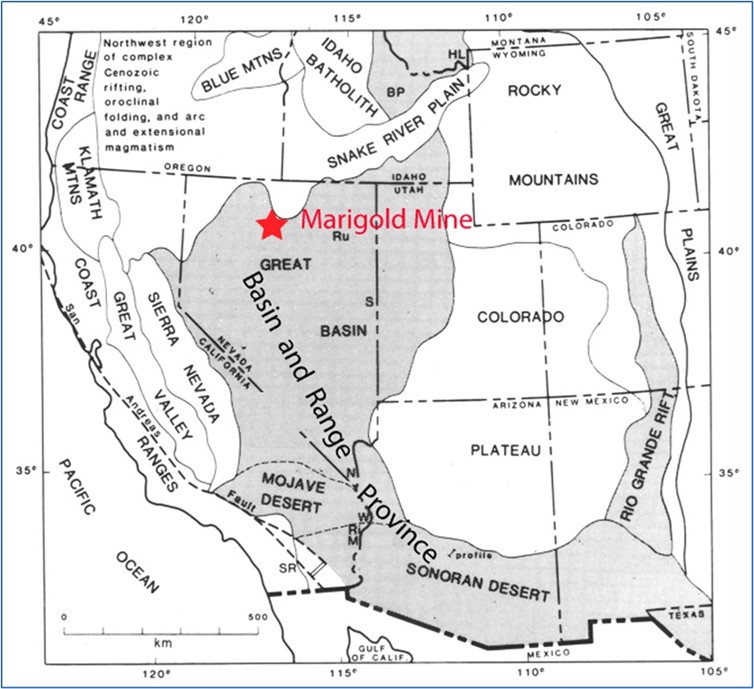
Source: Modified after Hamilton, 1987
| | 6-1 | |
| SSR Mining Inc. | Marigold Complex S-K 1300 Report | February 12, 2024 SLR Project No.: 138.21581.00002 |
Paleozoic basement rocks of north-central to north-eastern Nevada generally
comprise four distinct tectonostratigraphic assemblages: the eastern carbonate assemblage; the slope or transitional assemblage; the western
siliceous and volcanic assemblage; and the overlap assemblage (Roberts, 1964).
In north-central Nevada, western assemblage rocks are tectonically emplaced
over slope and eastern assemblage rocks along the Roberts Mountain thrust, although the legitimacy of the thrust is disputed (Ketner,
2013). Uplift and erosion of the Antler highland in the Pennsylvanian shed clasts of western assemblage rocks into a foreland basin, forming
basal units of the Pennsylvanian-Permian overlap assemblage.
Marine sedimentary rocks and submarine volcanic rocks accumulated in
a basin west of the Antler orogenic belt from the Mississippian to the Permian. These rocks were transported eastward and structurally
emplaced on top of western assemblage and overlap assemblage rocks along the Golconda thrust during the Permo-Triassic Sonoma orogeny
(Roberts, 1964). The mechanism for compression resulting in the Sonoma orogeny is controversial, and modern work by Ketner (2008) has
called into question the relationship between the Sonoma orogeny and the Golconda thrust.
Compression during the Jurassic and Early Cretaceous resulted in subduction
of oceanic plate material beneath continental crust of western North America, generating large volumes of intermediate to felsic melts
along a magmatic arc and emplacement of plutons into the Sierra Nevada batholith. Continued compression resulted in accretion of oceanic
arc terrane onto the continental margin, forming thrust belts and ophiolite sequences. Collectively, these Andean and Cordilleran style
compression events are known as the Nevadan orogeny. The Nevadan orogeny resulted in substantial back-arc shortening and formation of
the Luning-Fencemaker fold-thrust belt in Nevada (Wyld et al., 2003). A major mode of felsic plutonism also occurred in Nevada during
the late Jurassic (~155–160 Ma) (du Bray, 2007).
Late Jurassic and Cretaceous compression formed an extensive fold and
thrust belt further east in Utah and Wyoming during the Sevier orogeny. Flat-slab subduction of the Farallon plate underneath North America
from the late Cretaceous to Eocene resulted in thick-skinned deformation and uplift of the Rocky Mountains from New Mexico to British
Columbia during the Laramide orogeny. The second major mode of felsic plutonism occurred in Nevada during this time (~90–95 Ma)
(du Bray, 2007), associated with porphyry-style base metal mineralization events.
As the Laramide orogeny waned into the Eocene, there was a major transition
from compressional to extensional tectonic regimes in Nevada. Extensional tectonic stresses resulted in the development of basin and range
physiography seen throughout central Nevada. The landform is characterized by a series of horsts and grabens that created narrow north–north-east
oriented ranges separated by flat bottomed valleys. Extension and resultant crustal thinning are associated with the third major magmatic
pulse in Nevada, during which time several porphyry copper–gold systems developed. In addition, the famous Carlin-type gold deposits
(CTGD) of northern Nevada are thought to have formed during this time (~36–42 Ma) (Cline et al., 2005).
Magmatism of andesitic to rhyolitic affinity dominated from the Late
Eocene to Early Miocene with the production of voluminous ash flowsheets, plutons, hypabyssal intrusives and calderas. Volcanic arc-related
andesitic igneous activity continued in western Nevada from early to late Miocene. Further east in central and eastern Nevada, rift related
bi-modal rhyolite and tholeiitic basalt were emplaced in the Mid Miocene and are related to epithermal silver–gold deposits in the
region.
| | 6-2 | |
| SSR Mining Inc. | Marigold Complex S-K 1300 Report | February 12, 2024 SLR Project No.: 138.21581.00002 |
The Property is in the Battle Mountain mining district on the northern
end of the Battle Mountain-Eureka trend, a conspicuous lineament of sedimentary-hosted gold deposits (Figure 6-2). The Battle Mountain
district hosts numerous mineral occurrences, including porphyry copper–gold, porphyry copper–molybdenum (Cu-Mo), skarn, placer
gold, distal disseminated silver-gold, and Carlin-type gold systems.
| | 6-3 | |
| SSR Mining Inc. | Marigold Complex S-K 1300 Report | February 12, 2024 SLR Project No.: 138.21581.00002 |
Figure 6-2: Location of Marigold
and the Battle Mountain Mining District on the Battle Mountain-Eureka Mineral Trend
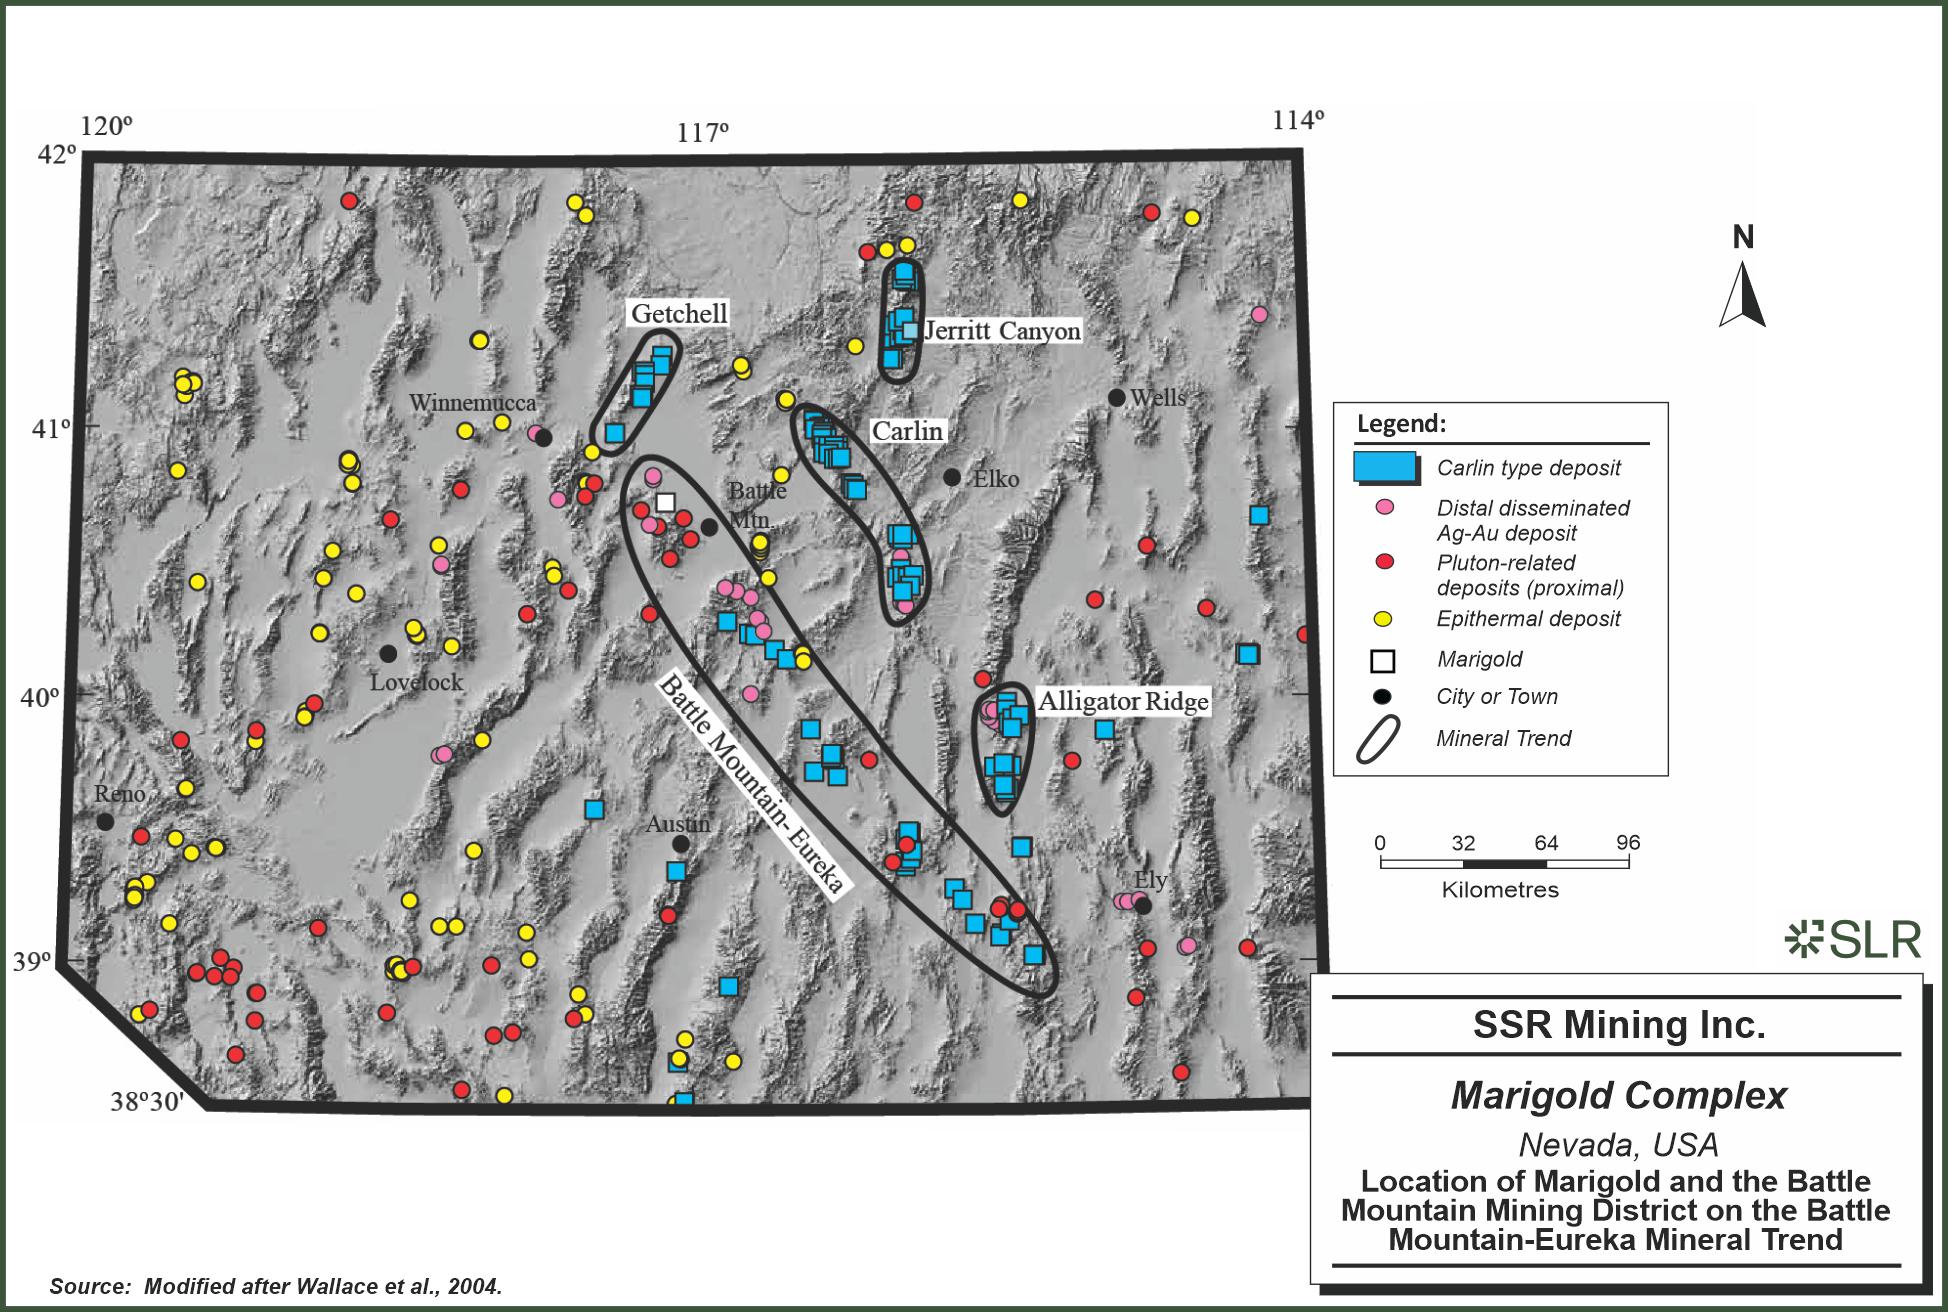
SSR Mining
Inc. Marigold Complex Nevada, USA Location of Marigold and the Battle Mountain Mining District on the Battle Mountain-Eureka Mineral
Trend
| | 6-4 | |
| SSR Mining Inc. | Marigold Complex S-K 1300 Report | February 12, 2024 SLR Project No.: 138.21581.00002 |
The Battle Mountain mining district is underlain by Paleozoic metasedimentary
and metavolcanic rocks that are cut by Jurassic, Cretaceous, and Eocene intrusions. Post-mineralization tuff, volcanic rock, and detritus
were deposited and preserved in structural and paleotopographic lows. The oldest rocks in the Battle Mountain mining district are para-autochthonous
Cambro-Ordovician carbonate, clastic, and volcanic rocks in the footwall of the Roberts Mountain allochthon; these are assigned to the
Comus-Preble Formation (Cook, 2015). The Comus-Preble Formation comprises fine-grained siliciclastic turbidite sequences, mudstone, siltstone,
limey mudstone, limestone, debris flows, and mafic volcanic flows.
Rocks of the Roberts Mountain allochthon were thrust eastward during
the Devonian-Mississippian Antler orogeny. This event resulted in intense deformation, including folding and intra-formational thrusting
of the metasedimentary units that comprise the Roberts Mountain allochthon. Rocks of the allochthonous clastic assemblage in the Battle
Mountain district were previously separated into the Cambrian Scott Canyon Formation, Cambrian Harmony Formation, and the Ordovician Valmy
Formation, complicating the understanding of Paleozoic tectonic processes affecting the district. Recent work by Ketner (2008; 2013) proposed
the abandonment of the Scott Canyon Formation and reassignment of these rocks to the Valmy and Harmony Formations. Ketner (2008) demonstrated
the Harmony Formation conformably overlies the Valmy Formation, eliminating the necessity for the Dewitt thrust mapped by Roberts (1964)
and Theodore (1991).
Unconformably overlying rocks of the clastic assemblage is the autochthonous
Antler overlap sequence; a Pennsylvanian-Permian package of conglomerate, limestone, siltstone, and debris flow. Basal Antler sequence
rocks were deposited as material eroded off the Antler highland into a foreland basin during the Antler orogeny. The base of the Antler
sequence, the Battle Formation, is a coarse conglomerate up to approximately 220 m thick (Roberts, 1964) that contains clasts derived
from the Roberts Mountain allochthon and underlying para-autochthonous rocks. The Battle Formation was deposited in a fluvial-to-shallow
marine environment, with coarse, locally derived boulders at the base and interbedded limestone and siltstone units toward the top.
Disconformably overlying the Battle Formation is the Antler Peak Limestone
Formation, a package of shallow marine carbonate rocks over 180 m thick at its type locality (Roberts, 1964). The Antler Peak Limestone
Formation contains abundant brachiopod, coral, and crinoid fossils. The type of section for the Antler Peak Limestone Formation is in
the Battle Mountain Range at Antler Peak.
The Permian Edna Mountain Formation disconformably overlies the Antler
Peak Formation and consists of locally present basal debris flow and brown weathering phosphatic siltstone (McGibbon, 2005) at least 120 m
thick. Unoxidized Edna Mountain Formation is black in color and difficult to differentiate from unoxidized siltstone of the Havallah sequence
in drill cuttings and in the field.
Allochthonous rocks of the Mississippian-Permian Havallah sequence were
tectonically emplaced over rocks of the Antler sequence, Valmy Formation, and Preble-Comus Formation during the Permo-Triassic Sonoma
orogeny (Theodore, 2000; McGibbon, 2005). The Havallah sequence includes chert, siltstone, limestone, conglomerate, sandstone, and submarine
volcanic rocks. The total thickness of the sequence is thought to exceed 2.8 km (Roberts, 1964).
| | 6-5 | |
| SSR Mining Inc. | Marigold Complex S-K 1300 Report | February 12, 2024 SLR Project No.: 138.21581.00002 |
Igneous Rocks
The oldest igneous rocks in the district are submarine pillow basalts
within the Cambro-Ordovician Preble-Comus and Ordovician Valmy Formations.
Volcanic rocks within the Preble-Comus are only known from drill core
and consist of submarine pillow basalt and volcaniclastic units derived from a continental source. These rocks are typically highly altered
due to their age, submarine emplacement, present surface to near-surface position, and exposure to hydrothermal systems.
Metabasalt belonging to the Valmy Formation outcrops in the vicinity
of Trout Creek south of the Oyarbide fault. On the east side of the district at Elder Creek, diorite dikes of Devonian age are inferred
based on cross-cutting relationships. Mesozoic igneous rocks include a relatively unaltered Jurassic lamprophyric dike (Fithian, 2015)
and an abundance of north-west striking Cretaceous granodiorite and quartz monzonite porphyry dikes and stocks.
Late Cretaceous granodiorite and quartz monzonite porphyry rocks are
associated with molybdenum mineralizing systems at Buckingham, Trenton Canyon, and Buffalo Valley (Doebrich and Theodore, 1996).
Cenozoic igneous activity coincided with the onset of extensional tectonism
throughout the Basin and Range province and normal reactivation of north and north-west striking faults in the Battle Mountain district
(Doebrich and Theodore, 1996).
Late Eocene to Early Oligocene granodiorite to monzogranite intrusive
stocks and dikes are associated with copper-gold mineralizing systems in the district, such as those at Converse and Copper Canyon. Intrusive
dikes and sills are typically low relief slope forming units with very little outcrop in part due to argillic alteration where it has
been exposed to hydrothermal fluids.
Tertiary volcanic rocks in the district are post-mineralization. Oligocene
to Miocene rhyolitic tuff and basaltic andesite flows are intercalated with Tertiary gravels and are locally ridge-forming units. The
youngest volcanic rock, Pliocene (2.8–3.3 Ma) basalt, is present south-east of Copper Canyon (Doebrich and Theodore, 1996).
The Project stratigraphy is illustrated in Figure 6-3.
| | 6-6 | |
| SSR Mining Inc. | Marigold Complex S-K 1300 Report | February 12, 2024 SLR Project No.: 138.21581.00002 |
Figure 6-3: Stratigraphic Column
for the Marigold Complex
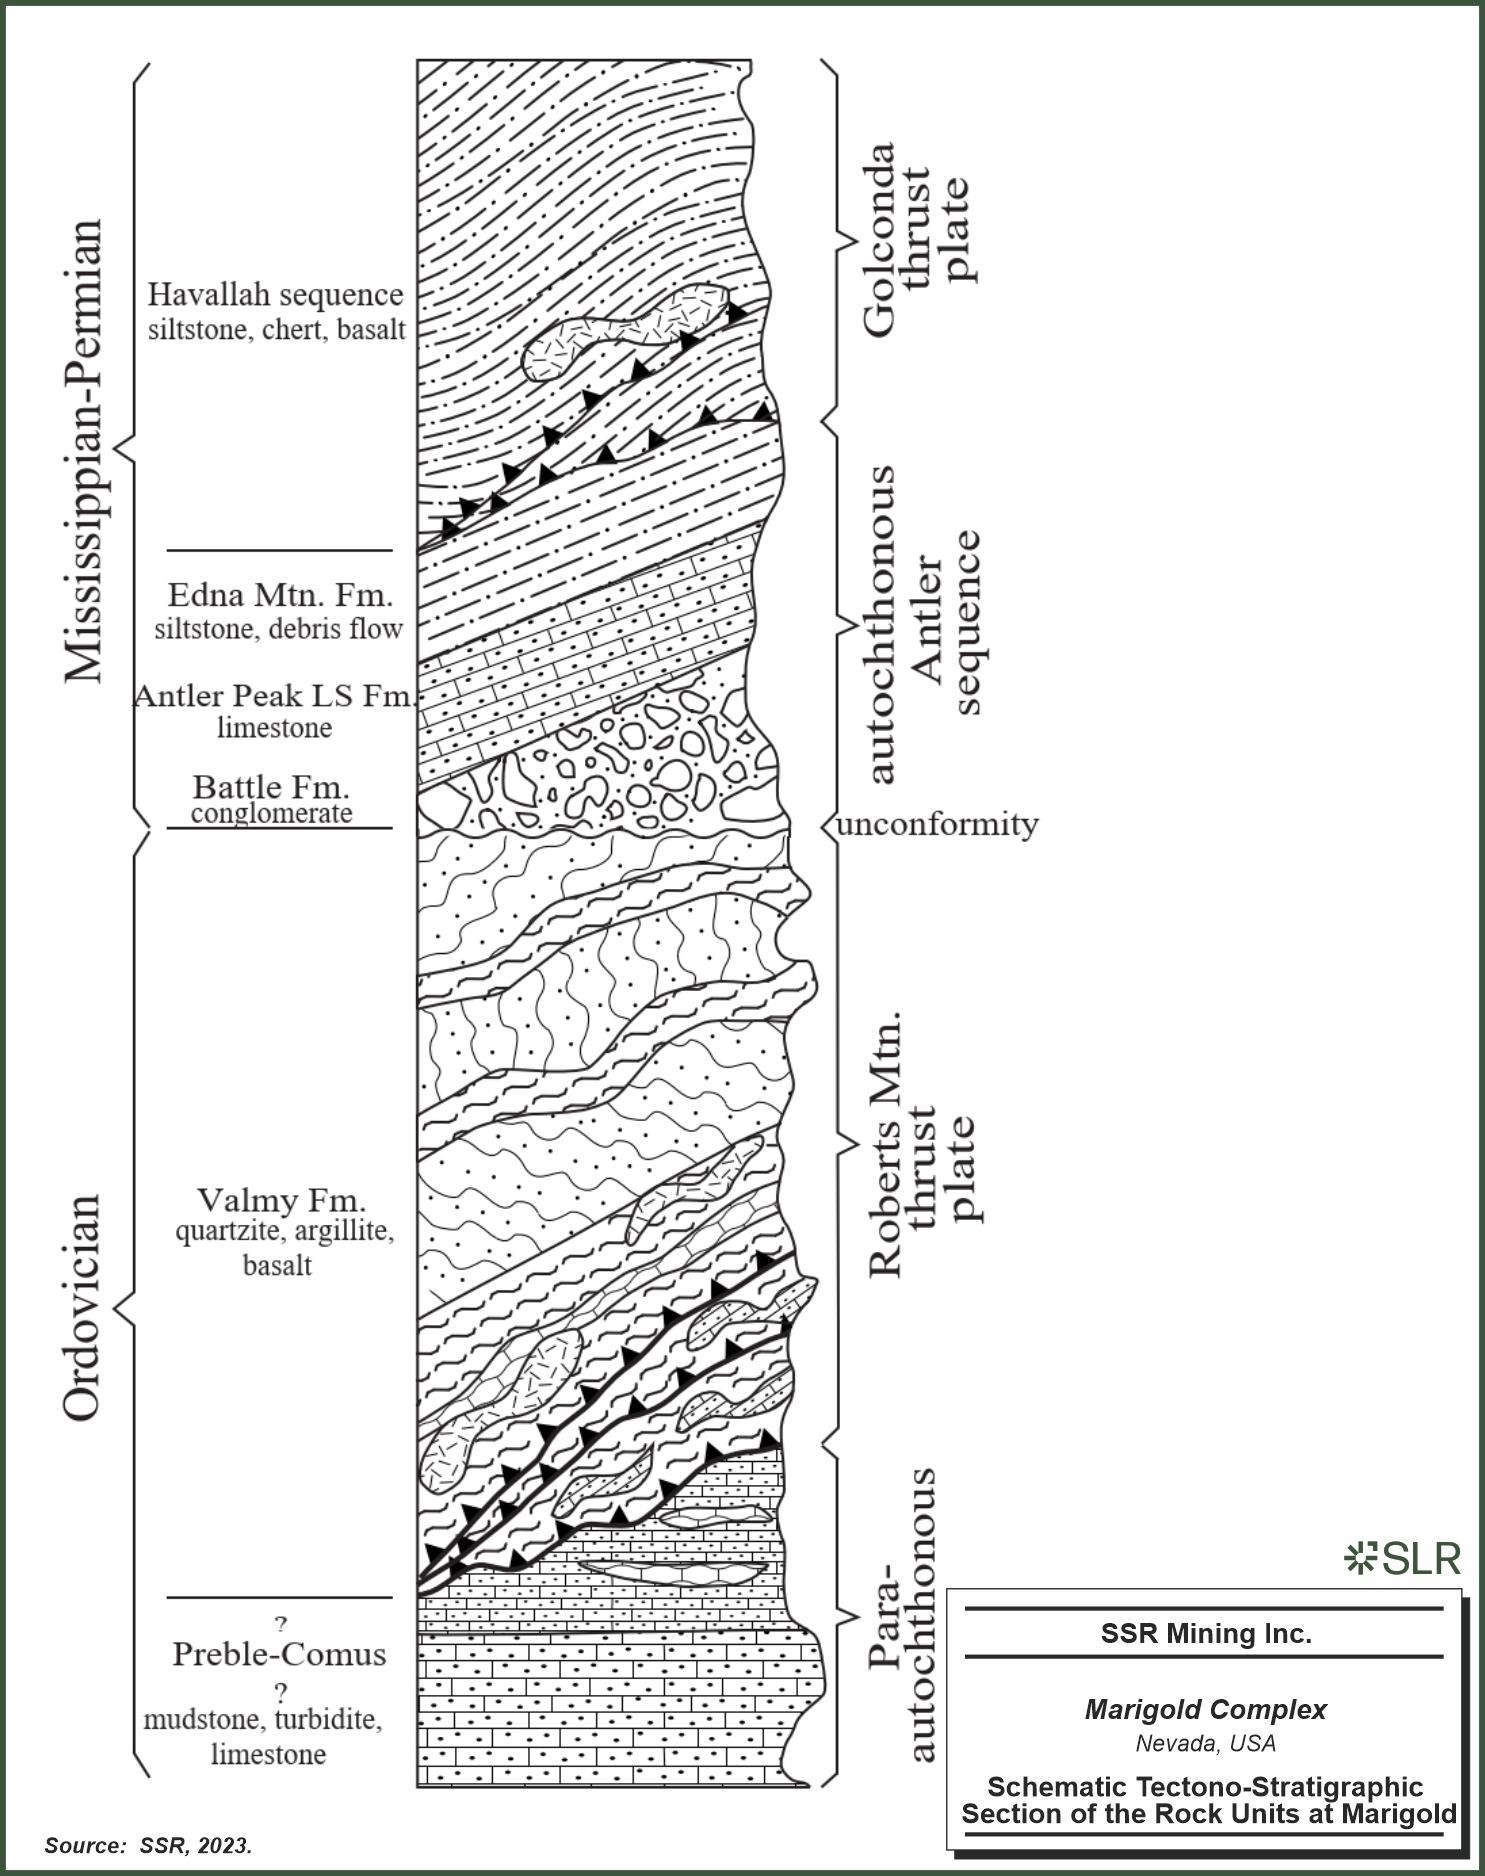
SSR Mining Inc. Marigold
Complex Nevada, USA Schematic Tectono-Stratigraphic Section of the Rock Units at Marigold
| | 6-7 | |
| SSR Mining Inc. | Marigold Complex S-K 1300 Report | February 12, 2024 SLR Project No.: 138.21581.00002 |
Geophysical and isotopic evidence indicate that broad structural zones
within the Battle Mountain-Eureka trend may be related to large-scale tectonic processes affecting the western margin of North America
from the late Proterozoic through Mesozoic (Grauch et al., 2003). These features may be associated with deep crustal faults that originated
as rift or transform faults during Proterozoic breakup of Rodinia, or as faults accommodating late Paleozoic compressional tectonic events
(Grauch et al., 2003). Within the Battle Mountain-Eureka trend, deep crustal normal faults with a north-west, north, and north-east strike
have influenced sedimentation, deformation, magmatism, extension, and mineralization (Grauch et al., 2003).
In the Battle Mountain mining district, the most prominent surface fault
expressions are thrust faults related to Paleozoic-Mesozoic compressional tectonism, and normal faults related to Cenozoic extensional
tectonic regimes. There is evidence of a more cryptic late Paleozoic transtensional fault system throughout the district, which is potentially
late to post-Antler orogeny. These structures do not display significant slip in post-Permian aged rocks, and as a result are commonly
concealed. Structures related to the transtensional fault system are responsible for preservation of thick wedges of Antler sequence rocks.
The Permo-Triassic Golconda thrust fault is traceable throughout the
entire Battle Mountain range. Onset of the latest crustal extension began in the late Eocene and has continued sporadically to present.
The most prominent extensional faults in the district are the range-bounding normal faults that define the Battle Mountain range, including
the post-mineralization, south-west striking Oyarbide fault (Doebrich and Theodore, 1996).
At least four generations of folding are recorded in Ordovician rocks
of the Roberts Mountain allochthon, including tight-to-isoclinal overturned F1 folds with north-west–south-east fold axes, open
and upright F2 folds with west–north-west fold axes, large-scale open and upright F4 folds with north–north-east fold axes,
and roll-over anticline style F5 folds that affect the entire rock package. Fold events F1 and F2 pre-date deposition of Antler sequence
rocks. The F3 fold event is restricted to the Havallah sequence. F4 folds are thought to be related to Mesozoic tectonics and affect Comus-Preble
Formation, Valmy Formation, Antler sequence, and Havallah sequence rocks, while F5 folds appear to affect the entire rock package including
Tertiary rocks.
| 6.3.1.1 | Property Stratigraphy |
Sedimentary Rocks
Four packages of Paleozoic sedimentary and metasedimentary rocks are
present at Marigold. In ascending tectono-stratigraphic order, they include: the Cambro-Ordovician Comus-Preble Formation; the Ordovician
Valmy Formation of the Roberts Mountain allochthon; the Pennsylvanian-Permian Antler overlap sequence; and the Mississippian-Permian Havallah
sequence of the Golconda allochthon. The distribution of these Paleozoic units is shown in plan view in Figure 6-4.
There are no Mesozoic sedimentary rocks in the Marigold mine area; however,
approximately two thirds of the Property is covered by Tertiary to Quaternary intercalated gravel and volcanic material.
| | 6-8 | |
| SSR Mining Inc. | Marigold Complex S-K 1300 Report | February 12, 2024 SLR Project No.: 138.21581.00002 |
Comus-Preble Formation
The assignment of rocks to the Comus-Preble Formation at Marigold is
the result of an extensive effort to explore the depths of the Marigold system. On the basis of lithology and deformation style, rocks
believed to be positioned below the Roberts Mountain Thrust were assigned to the Comus-Preble Formation.
The Comus-Preble Formation consists of fine-grained siliciclastic turbidite
sequences, mudstone, siltstone, limey mudstone, limestone, debris flows, and mafic volcanic flows. Based on data compiled from downhole
televiewer logs, abrupt lithologic change from overlying rocks correlates with a transition from tight, east-vergent, overturned folds
to open folds.
Valmy Formation
The Valmy Formation consists of quartzite, argillite, and lesser chert
and metabasalt, all of which are complexly folded and faulted in the Marigold mine area. The total thickness of the Valmy Formation is
approximately 450 m at Marigold, although true thickness of the section is likely less than 200 m.
Fold deformation in the Valmy Formation is characterized by tight, east-vergent,
and overturned folds. This fold deformation has resulted in shattering of quartzite beds and ductile deformation of argillite. Where the
contact is not eroded or structurally displaced, the top of the Valmy Formation is unconformably overlain by rocks of Pennsylvanian age.
Silurian and Devonian rocks are not present either due to nondeposition or erosion.
Antler Sequence
The Antler overlap sequence is composed of Pennsylvanian to Permian-aged
rocks assigned to three formations: the basal Battle Formation; the Antler Peak Limestone Formation; and the Edna Mountain Formation.
These Formations represent a transgressive sequence of fluvial-to-shallow marine rocks that include conglomerate, sandstone, limestone,
siltstone, and debris flows. There is evidence the Antler sequence was locally deposited into sub-basins developed by normal offset on
growth faults of likely Late Pennsylvanian to Early Permian age.
Antler sequence rocks are relatively undeformed, except for offset and
rotation along Basin and Range normal faults and potentially low-amplitude, long-wavelength (kilometres to tens of kilometres) F4 folding
likely related to Mesozoic deformation. The Antler sequence is in thrust contact with the overlying and partially contemporaneous Havallah
sequence.
Havallah Sequence
The uppermost package of Paleozoic rocks exposed at Marigold is the
Mississippian-Permian Havallah sequence. The Havallah sequence is an assemblage dominated by siltstone, metabasalt, chert, sandstone,
conglomerate, and carbonate rocks. These marine sedimentary rocks were deposited in a fault-bounded deep-water trough (Ketner, 2008) and
subsequently obducted over the Antler sequence along the Golconda thrust (Roberts, 1964). Fold deformation in the Havallah sequence is
highly variable, ranging from relatively undeformed to tight to isoclinal, overturned and recumbent F3 folds.
| | 6-9 | |
| SSR Mining Inc. | Marigold Complex S-K 1300 Report | February 12, 2024 SLR Project No.: 138.21581.00002 |
Figure 6-4: Plan View Map Showing
Distribution of Paleozoic Units at Marigold
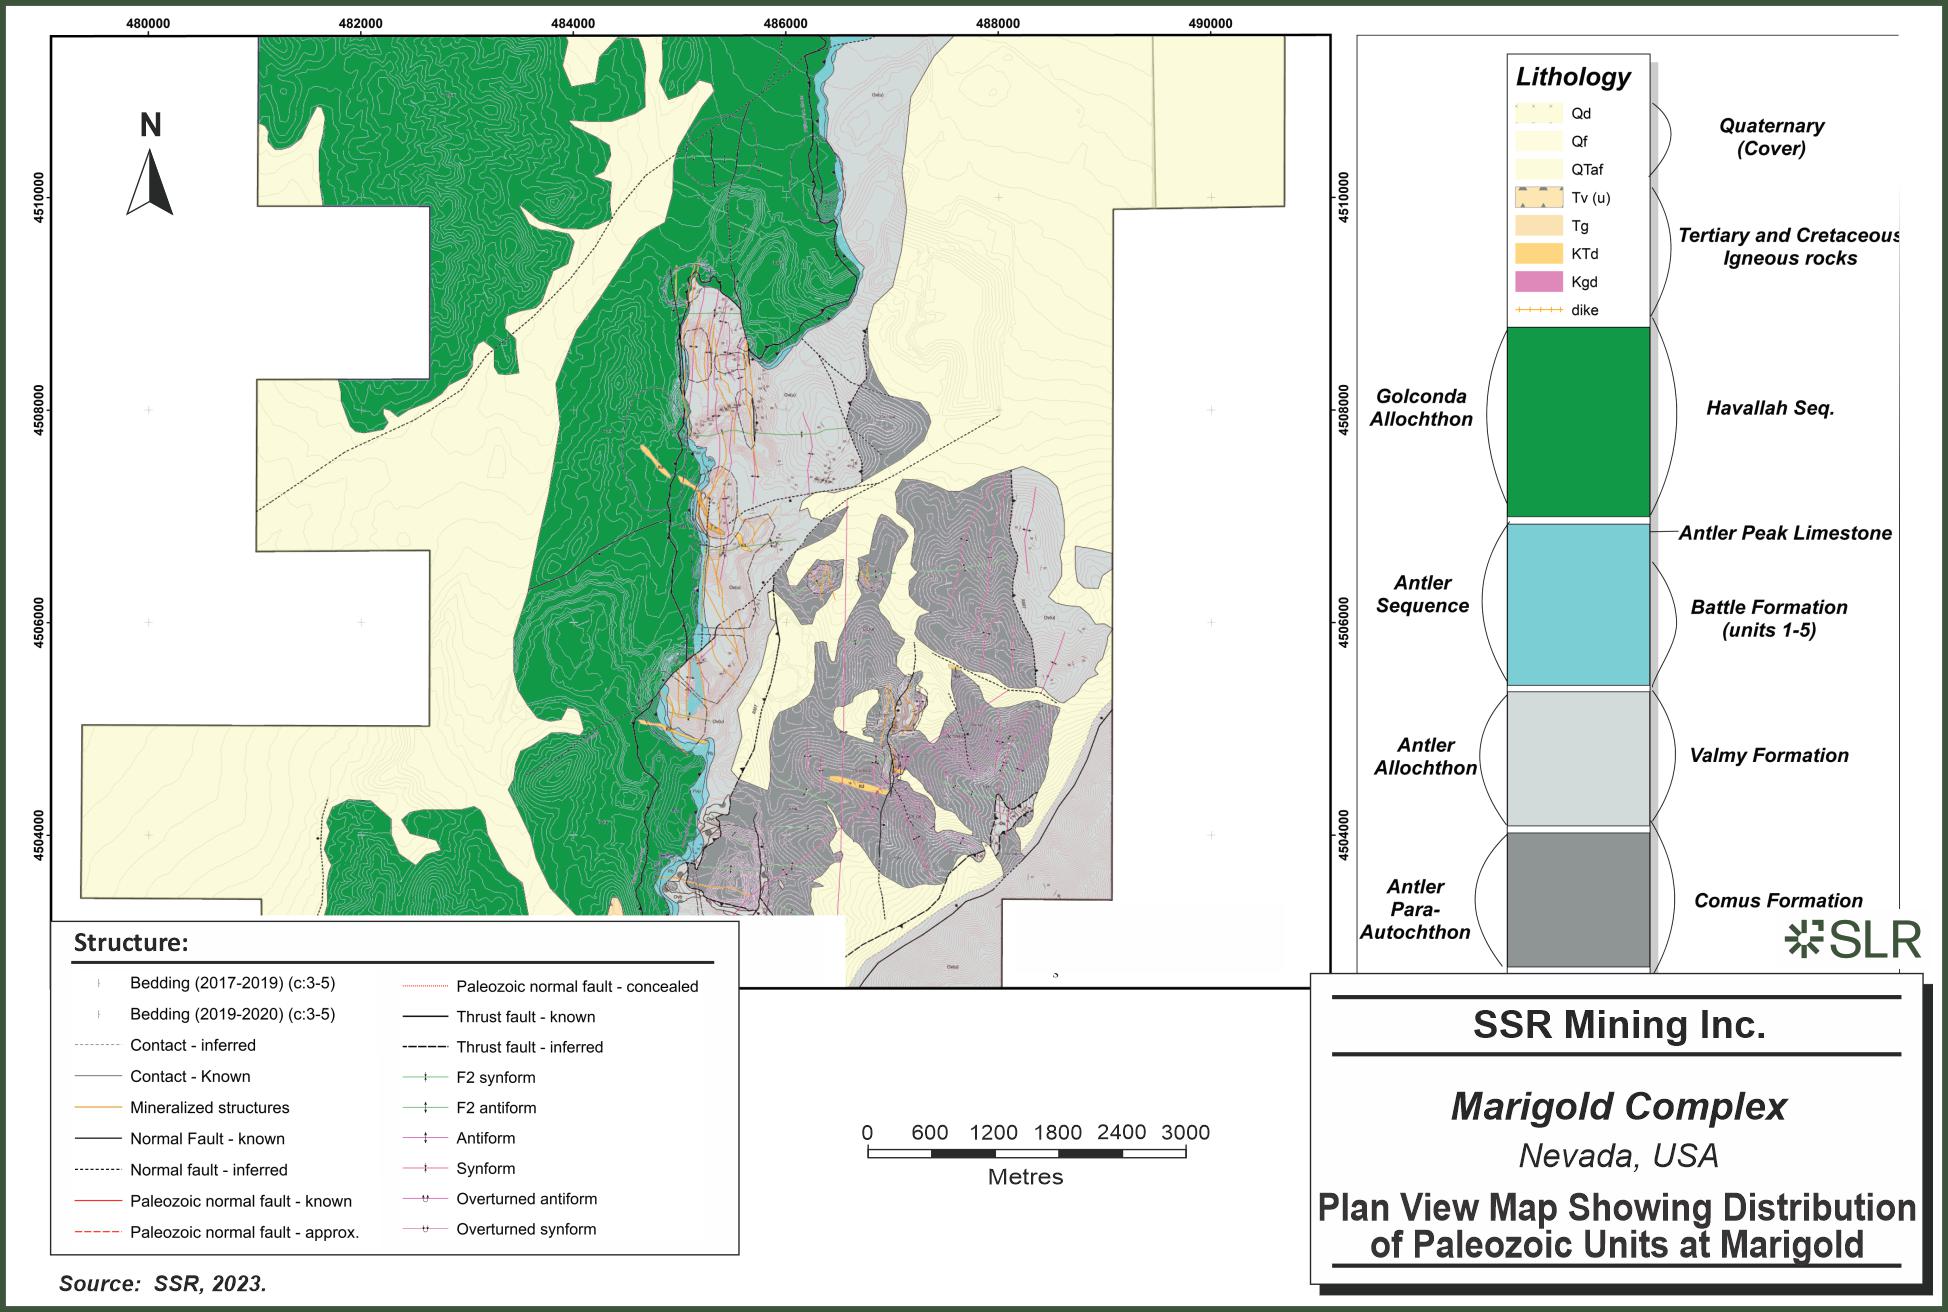
SSR Mining Inc. Marigold
Complex Nevada, USA Plan View Map Showing Distribution of Paleozoic Units at Marigold
| | 6-10 | |
| SSR Mining Inc. | Marigold Complex S-K 1300 Report | February 12, 2024 SLR Project No.: 138.21581.00002 |
Igneous Rocks
A 2 m interval of an extremely biotite-rich intrusive rock, interpreted
to be lamprophyre, was intersected in a single drill hole approximately 1,100 m below the pre-mining topography. Even though the
rock is relatively unaltered, the lamprophyre is Jurassic in age (160.7 ± 0.1 Ma Ar-Ar of biotite) (Fithian, 2018) and is age-equivalent
to lamprophyre intrusions in northern Nevada.
A series of Late Cretaceous (~92.22 ± 0.05 Ma to 97.63 ±
0.05 Ma, CA-TIMS of zircon) (Fithian, 2015) porphyritic quartz-monzonite dikes crosscut the Paleozoic rock package at Marigold. The intrusions
are up to tens of metres wide, and several can be traced along strike for hundreds of metres. The dikes strike south-east to north–south
and are typically steeply dipping. No alteration aureole related to these intrusive rocks has been identified at Marigold (Fithian, 2015).
The dikes contain phenocrysts of plagioclase feldspar, biotite, hornblende, and quartz. The mafic phenocrysts have all been altered to
secondary mineral assemblages to varying degrees.
Oligocene (~31.8 ± 0.8, 31.4 ± 1.0 Ma) (Theodore, 2000)
basaltic andesite is present on the Property, and forms a small, mesa-like landform between Trout and Cottonwood Creeks. The basaltic
andesite is crudely columnar in this location.
Late Oligocene to Early Miocene (22.9 ± 0.7 Ma) (McKee, 2000)
post-mineralization rhyolite tuff is intercalated with gravel throughout the Property. The tuff contains phenocrysts of biotite and is
typically altered to white clay. The tuff provides a minimum age of mineralization at Marigold, as it is unmineralized and immediately
overlies the orebody at the 8S deposit (Theodore, 2000; McGibbon and Wallace, 2000).
| 6.3.1.2 | Property Structure |
The main structural corridor and apparent primary controlling feature
for the localization of the deposits at Marigold is a 1.5 km wide by >10 km long half graben rotated no more than 045°
to the west and bound by east dipping early Permian growth faults and younger (post-Triassic) east dipping faults. This half graben structure
is cut by north-west to north-east striking pre-mineralization structures with relatively minor offset and a series of south-west striking
post-mineralization extensional normal faults parallel to the Oyarbide fault (Figure 6-5).
Valmy Formation rocks are highly deformed, with interpreted imbricate
low-angle intra-plate thrust faults and at least two generations of pre-Pennsylvanian folding. The first generation of deformation related
to folding of the Valmy Formation, D1, is characterized by tight, east verging folds with approximately north-west–south-east to
north–south striking fold axes. The second deformation event, D2, is defined by open folds with approximately east–west striking
fold axes. Folds of this orientation are best defined on the southernmost part of the property, including the Basalt pit area.
Although D1 and D2 folds are described individually because of their
unique character, it is possible that these fold sets are the product of the same deformation event. The areas of confluence of D1 and
D2 folds are thought to have played a role in the localization of mineralizing fluids.
Argillite beds within the Valmy Formation deformed plastically while
brittle quartzite beds shattered, creating open fracture space amenable for precipitation of auriferous iron sulfides. Antler sequence
rocks are cut by, and rotated along, Early Permian and Cenozoic normal faults. The timing of the proposed Early Permian growth faults
is based on preservation of Battle Formation, Antler Limestone Formation, and a thicker wedge of Edna Mountain Formation in the hanging
wall of east dipping normal faults, with little-to-no appreciable offset of the overlying Havallah sequence (Figure 6-6).
| | 6-11 | |
| SSR Mining Inc. | Marigold Complex S-K 1300 Report | February 12, 2024 SLR Project No.: 138.21581.00002 |
Figure 6-5: Top Surface of the
Valmy Formation with the Current Property Boundary
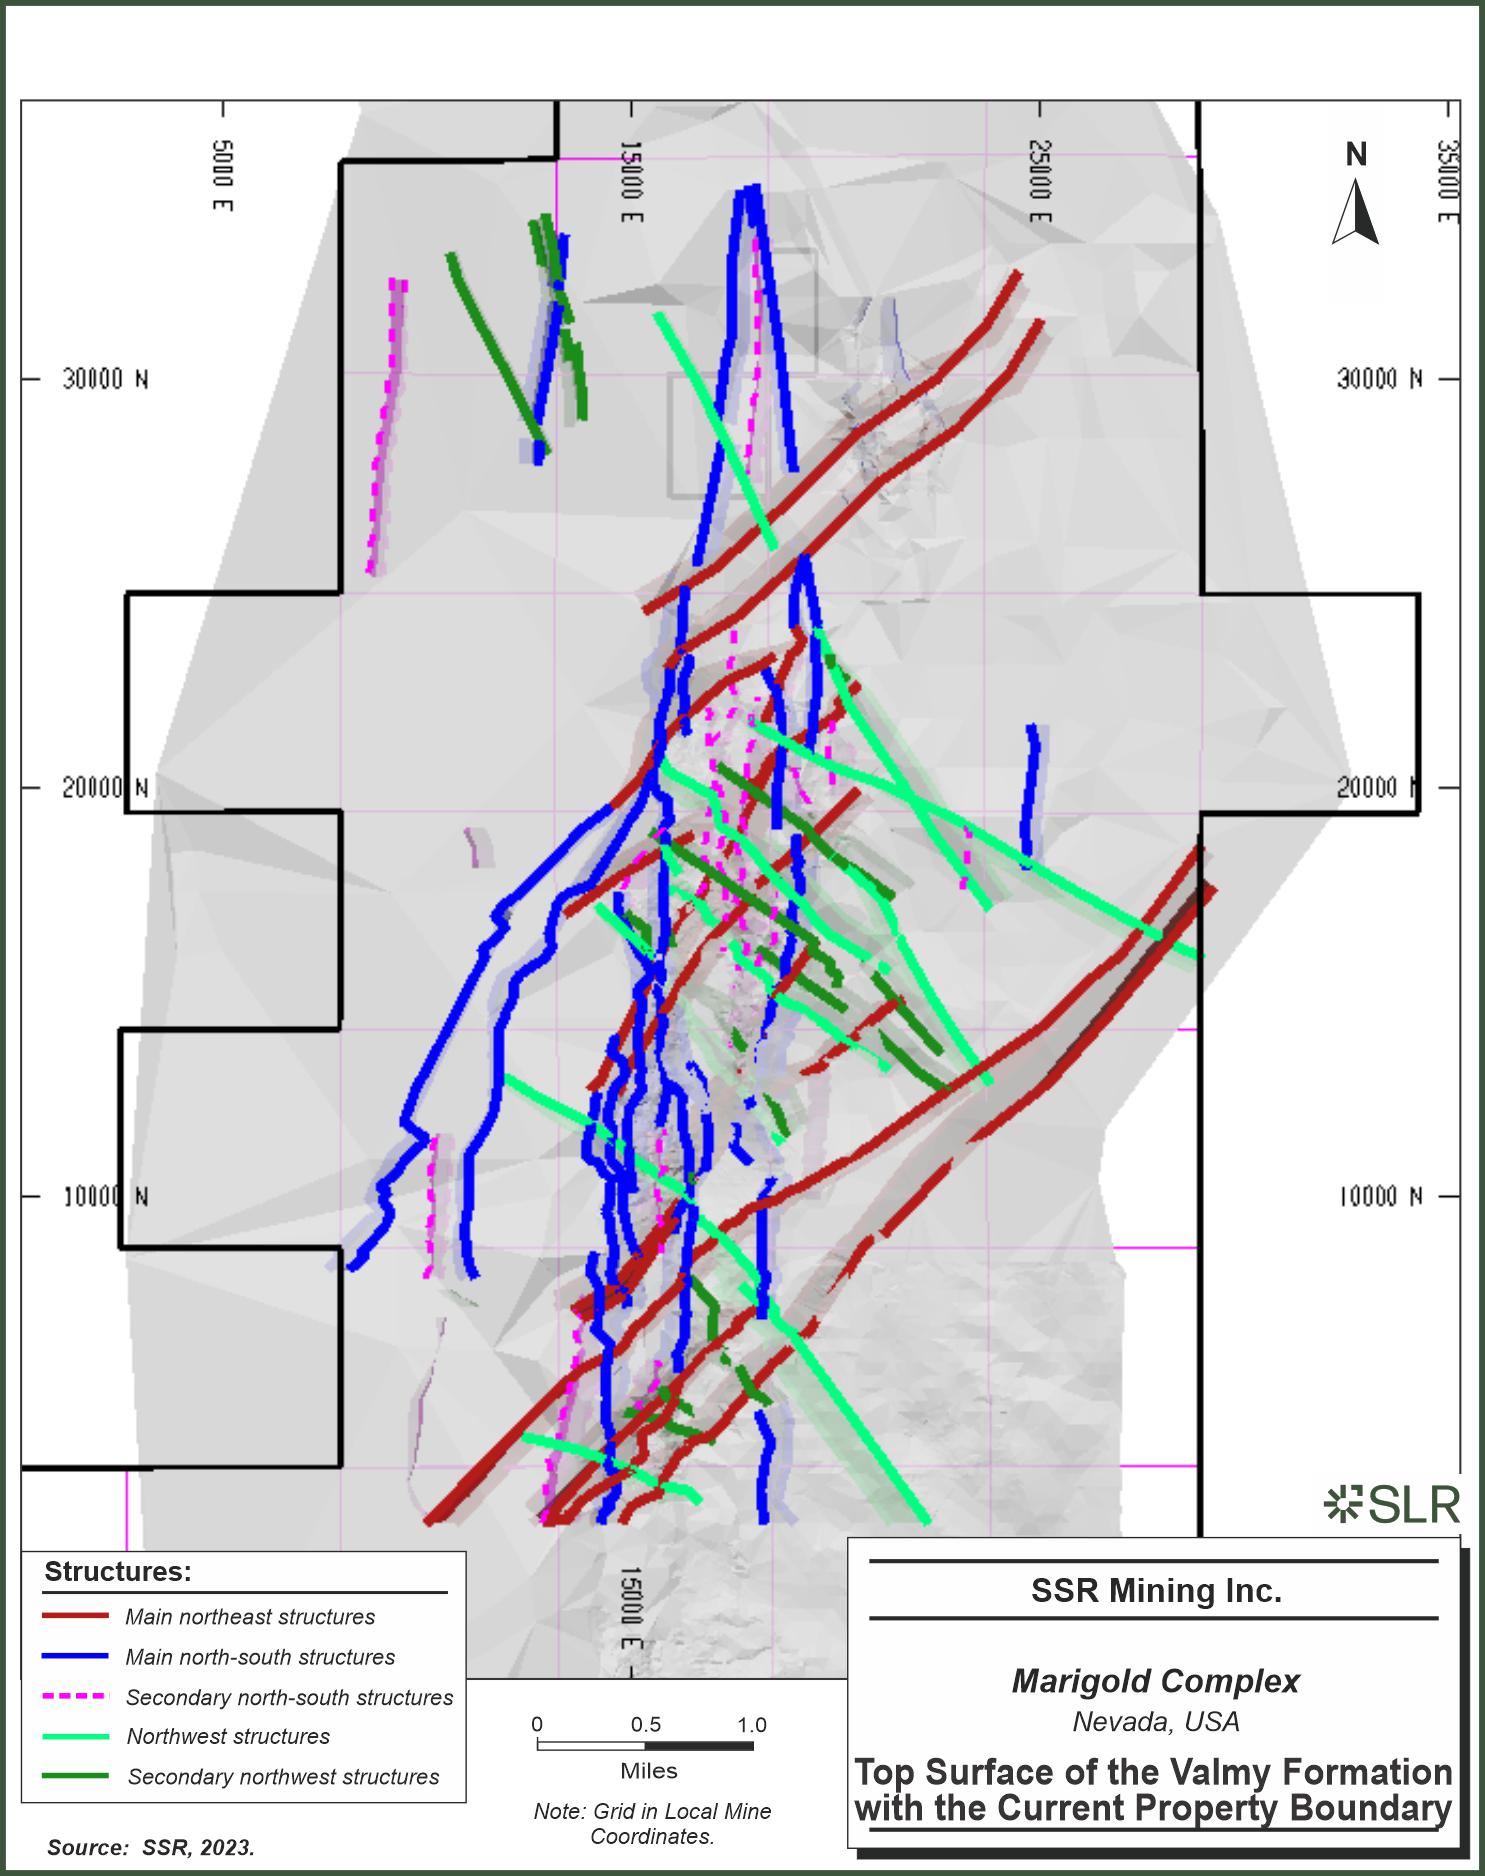
SSR Mining Inc. Marigold
Complex Nevada, USA Top Surface of the Valmy Formation with the Current Property Boundary
| | 6-12 | |
| SSR Mining Inc. | Marigold Complex S-K 1300 Report | February 12, 2024 SLR Project No.: 138.21581.00002 |
Figure 6-6: Cross Section 11,200N
Highlighting Inferred Permian Growth Fault and Associated Antithetic Normal Faults with a Steep West Dip
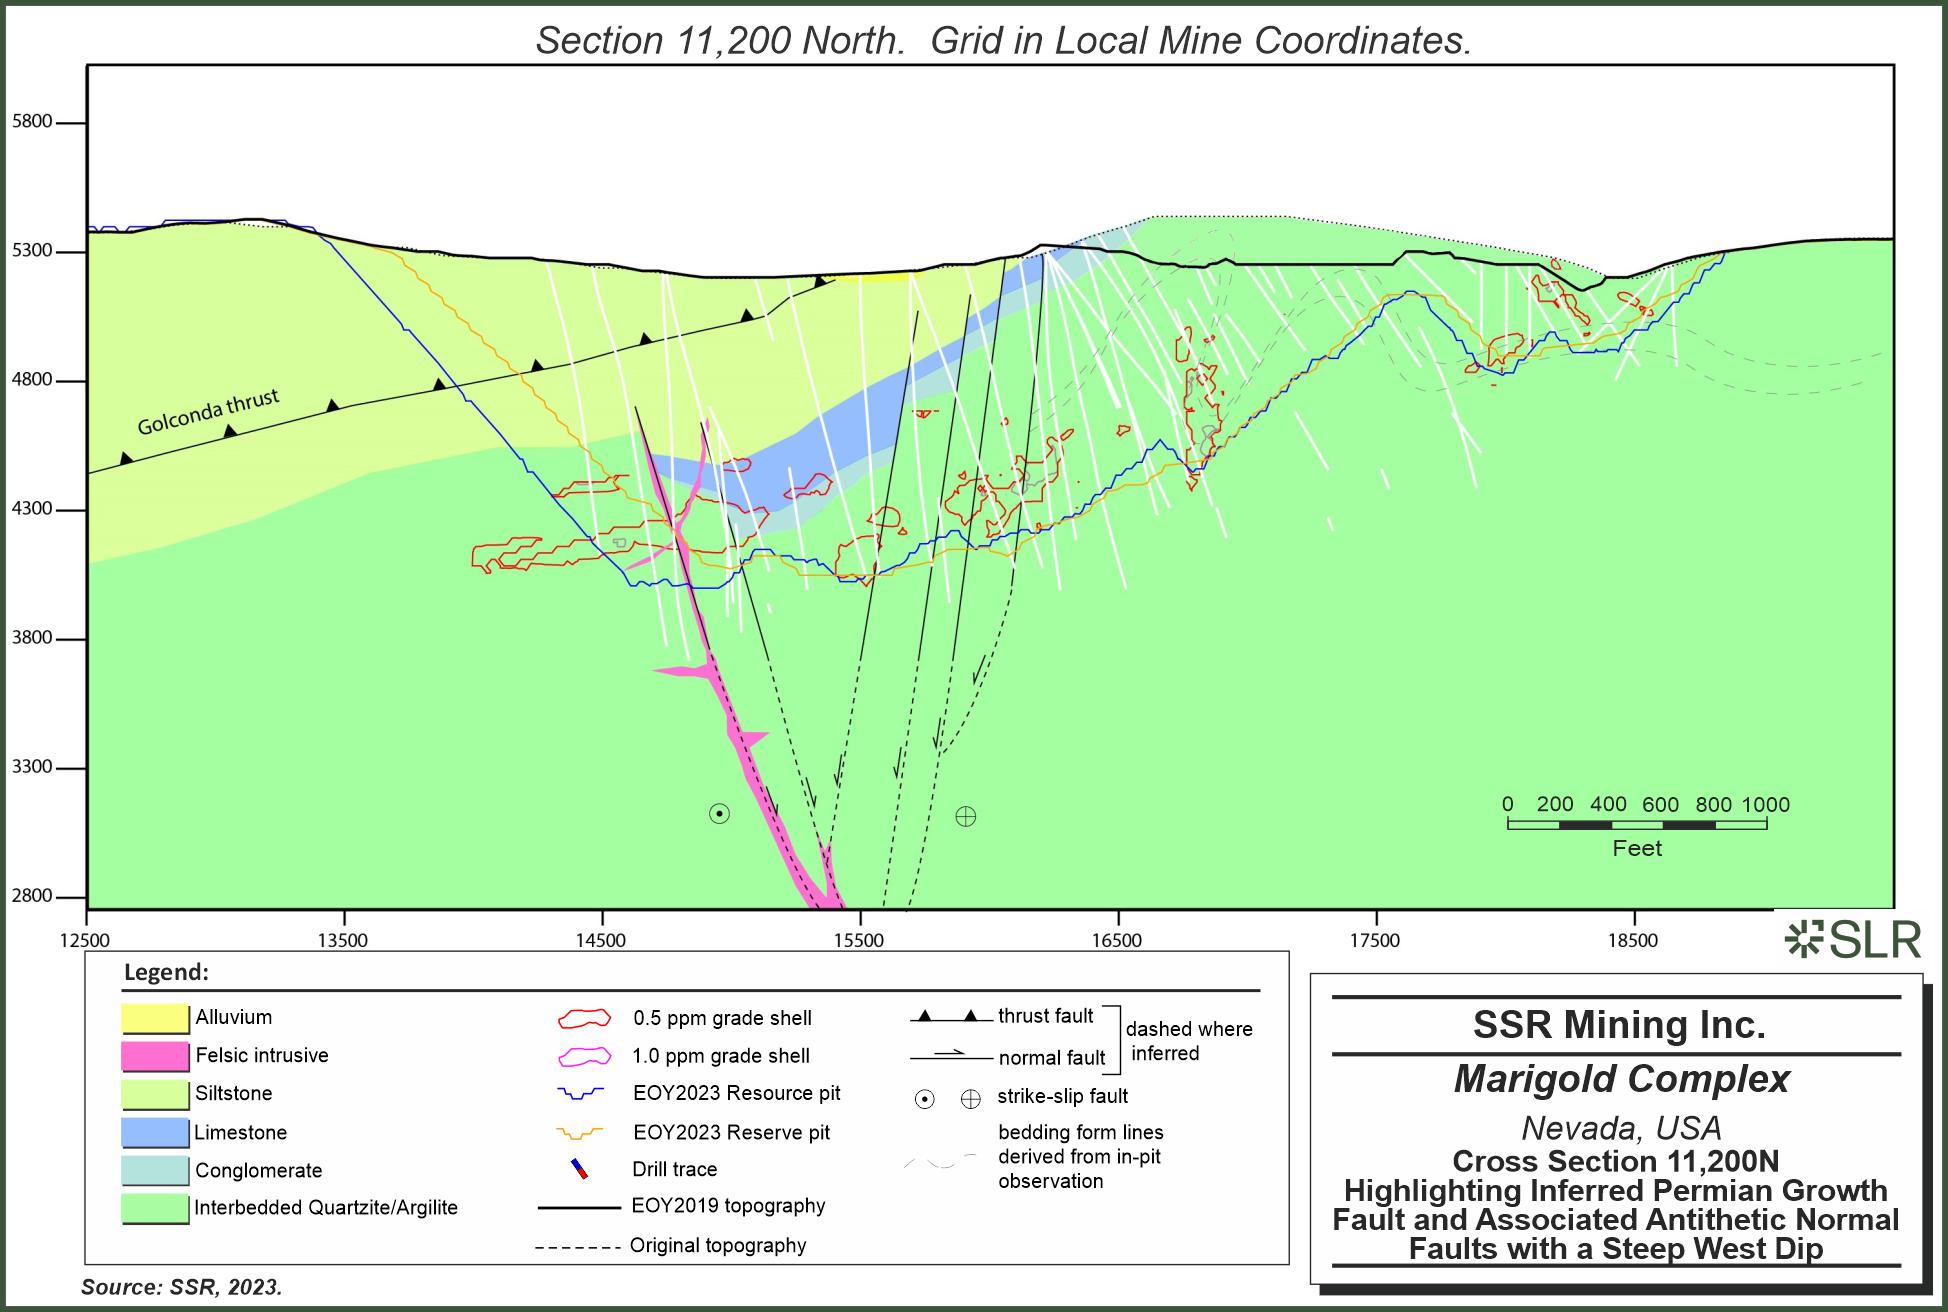
SSR Mining Inc. Marigold
Complex Nevada, USA Cross Section 11,200N Highlighting Inferred Permian Growth Fault and Associated Antithetic Normal Faults with a Steep
West Dip
| | 6-13 | |
| SSR Mining Inc. | Marigold Complex S-K 1300 Report | February 12, 2024 SLR Project No.: 138.21581.00002 |
Rocks of the Antler sequence are deformed by F4 and F5 folds, which
are not easily recognized in the field. Despite the position between two inferred major allochthonous packages, the Antler sequence does
not display more-intense fold deformation akin to F1 and F2 folds.
Havallah sequence rocks were deformed by thrusting and folding related
to compression during the Permo-Triassic Sonoma orogeny. An extensive series of thrust faults and folds are documented by Theodore (1991)
in the Valmy and North Peak quadrangles west of the Marigold mine area.
Deformation of the Havallah sequence is apparently unrelated to gold
mineralization at Marigold. Development of basin and range normal faults and reactivation of Paleozoic faults during the Cenozoic affected
the entire stratigraphic section at Marigold, including displacement of post-mineralization Oligocene tuff and Quaternary gravel (Figure
6-7).
Figure 6-7: Normal Displacement
of Alluvium and Tuff Immediately South of the Basalt Pit
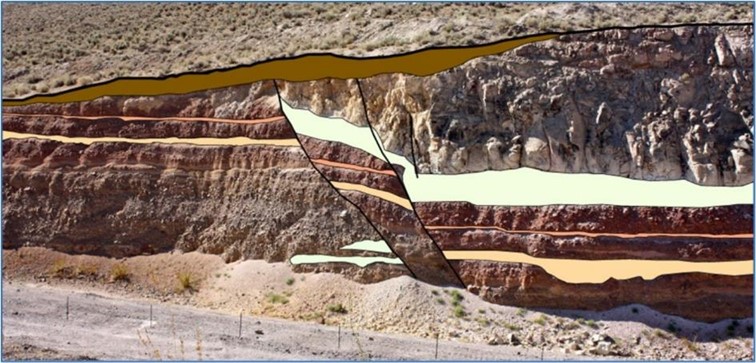
Notes: Looking south
Source: Fithian, 2015
| 6.3.1.3 | Property Mineralization |
The gold deposits at Marigold are considered Carlin-type and cumulatively
define a north-trending alignment of gold mineralized rock more than eight kilometres long (Figure 6-8).
Gold mineralizing fluids were primarily controlled by fault structure
and lithology, with tertiary influence by fold geometry. Within the Valmy Formation, higher gold grades are observed in the hinge zones
of open folds that trend west–north-west and plunge gently. When viewed down plunge, the undulation of these folds is mimicked by
gold mineralized horizons. The deposition of gold was restricted to fault zones and quartzite dominant horizons within the Valmy Formation
and high permeability units within the Antler sequence.
In unoxidized rocks, gold occurs in arsenic-enriched overgrowths on
pre-ore pyrite. Arsenopyrite is also present on pre-ore pyrite grains but is not auriferous. Geochemically, the gold mineralization event
is characterized by elevated arsenic, barium, antimony, and mercury, among others. Gangue minerals include quartz, arsenopyrite, stibnite,
calcite, clay, and barite. Hypogene sulfide minerals do not occur in ore as these gold-bearing phases are not amenable to heap leaching.
| | 6-14 | |
| SSR Mining Inc. | Marigold Complex S-K 1300 Report | February 12, 2024 SLR Project No.: 138.21581.00002 |
In oxidized rocks, gold occurs natively in fractures associated with
iron oxide. Rocks within the Marigold mine area are oxidized to a maximum depth of approximately 450 m. The redox boundary is not
consistent throughout the property and is substantially influenced by lithology. Shale, argillite, and siltstone units are frequently
unoxidized adjacent to pervasively oxidized quartzite horizons.
A silver and base metal mineralizing event at Marigold includes a mineral
association of chalcopyrite, argentiferous tennantite, galena, and sphalerite. The absolute age of this event is unclear, although it
may be related to late Cretaceous magmatism in the district.
| | 6-15 | |
| SSR Mining Inc. | Marigold Complex S-K 1300 Report | February 12, 2024 SLR Project No.: 138.21581.00002 |
Figure 6-8: Plan View of the
Marigold Mine Area showing the Spatial Distribution of 1.0 g/t Au Grade Shells Over an 8 km Northerly Trend
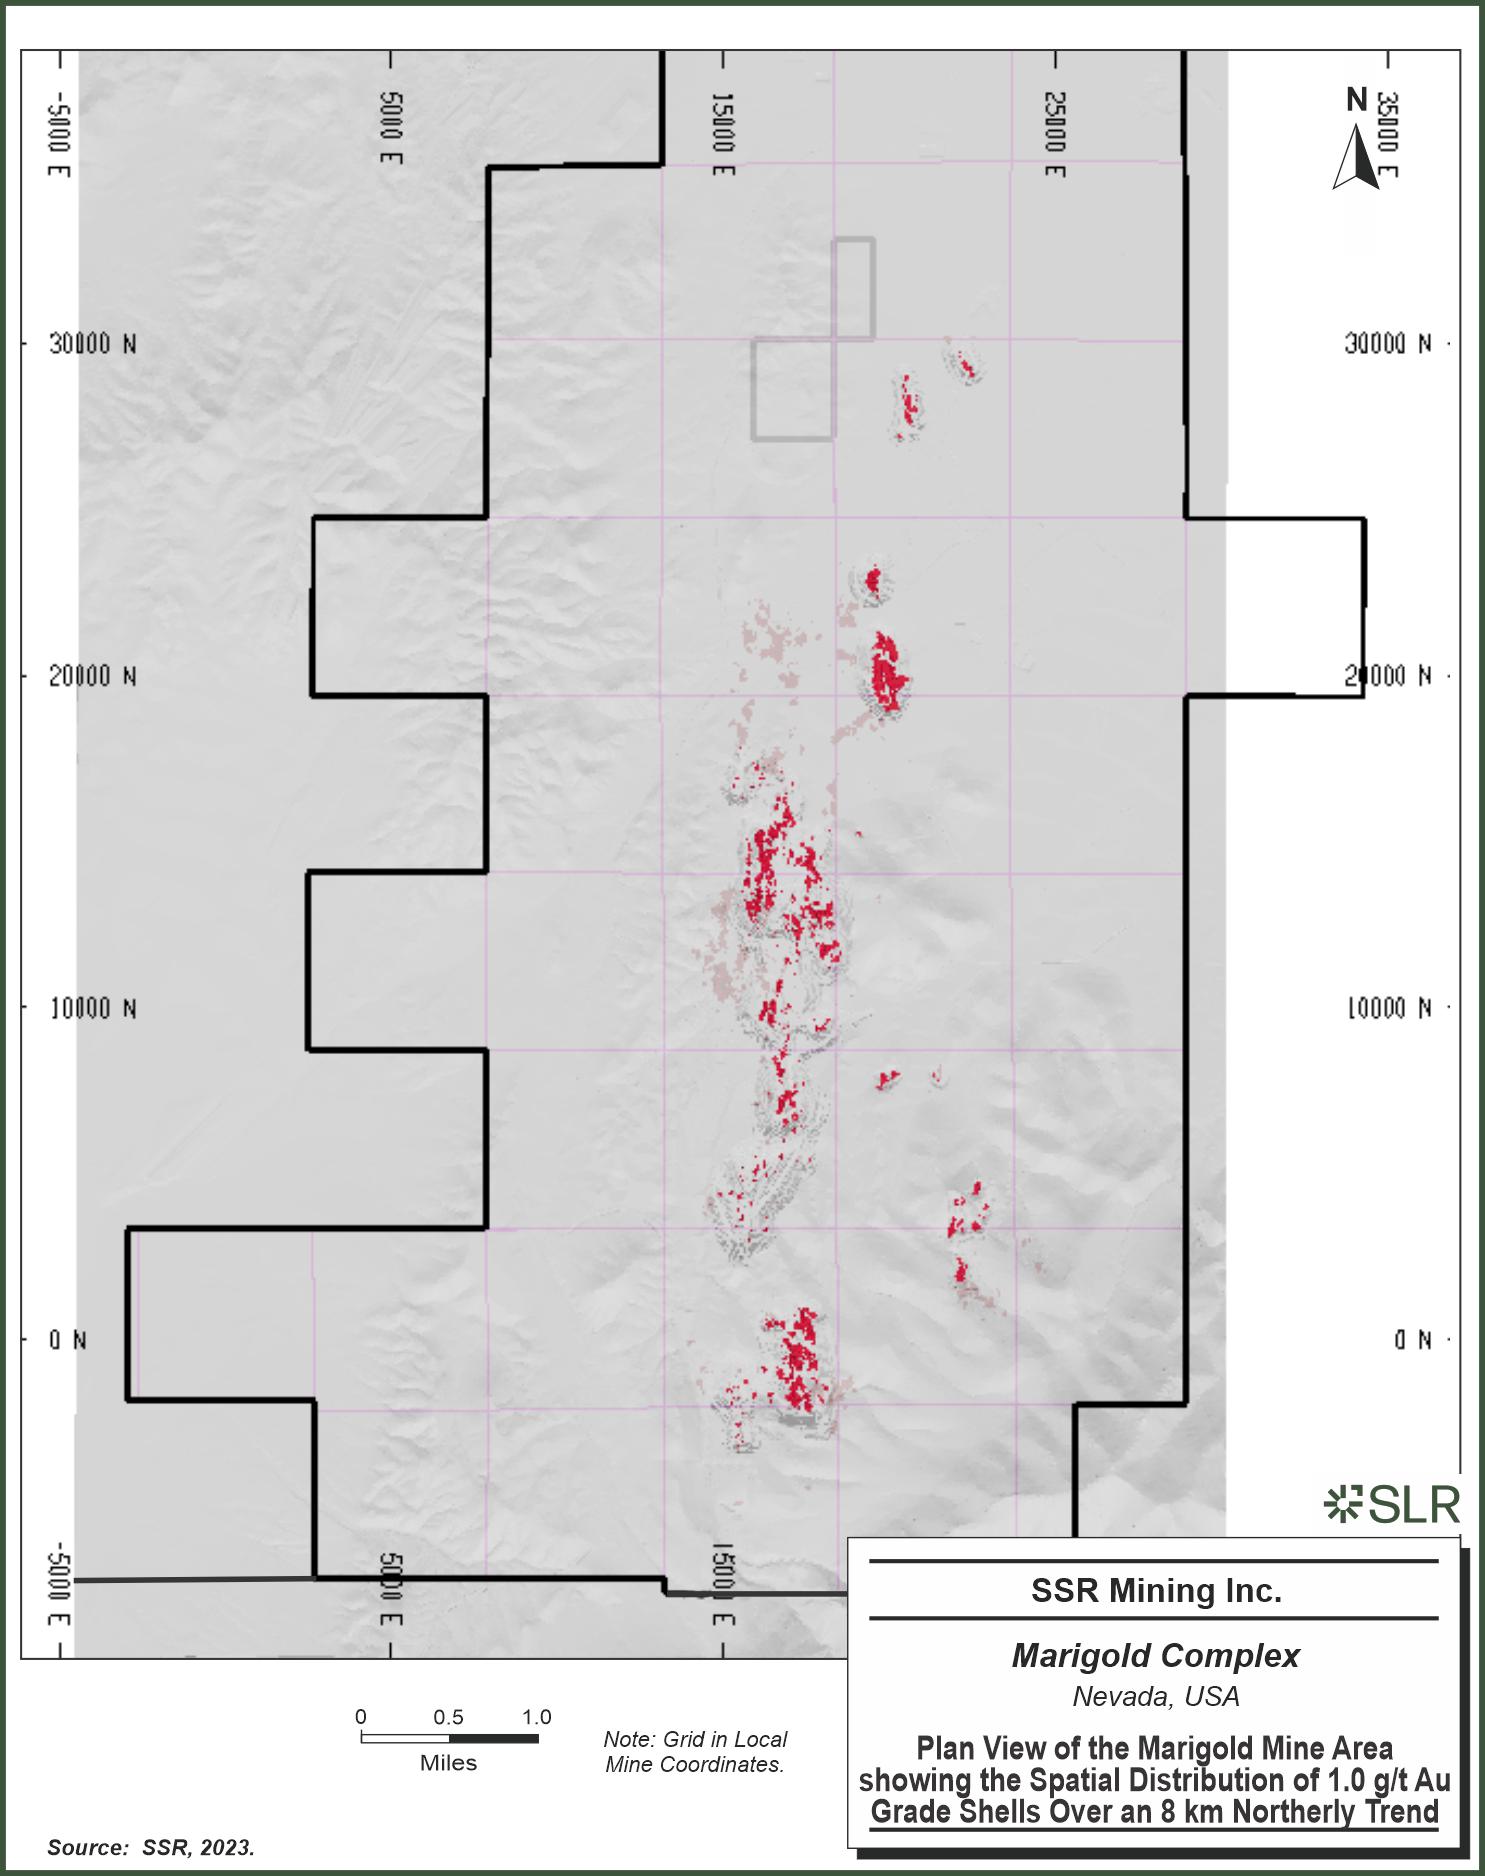
SSR Mining Inc. Marigold
Complex Nevada, USA Plan View of the Marigold Mine Area showing the Spatial Distribution of 1.0 g/t Au Grade Shells Over an 8 km Northerly
Trend
| | 6-16 | |
| SSR Mining Inc. | Marigold Complex S-K 1300 Report | February 12, 2024 SLR Project No.: 138.21581.00002 |
| 6.3.1.4 | Property Alteration |
Alteration of rocks includes silicification along mineralizing structures
and decalcification of carbonate horizons (primarily in the Antler sequence). Argillic alteration of quartz monzonite intrusive bodies
occurs in fault zones and areas of high hydrothermal fluid flow (Fithian, 2015). The intensity of alteration decreases towards the core
of the intrusions.
Studies have demonstrated a spatial correlation between gold mineralized
rock and increased white mica crystallinity index (Kester, 2015). There is evidence for large volumes of quartz precipitation within and
outboard of gold mineralized zones, including jasperoid bodies, cryptic silicification, and quartz vein breccias.
The Buffalo Valley project is located approximately 14 km southwest
of the Mackay complex at Marigold and eight kilometres southwest of Trenton Canyon on the immediate western flank of the Battle Mountains.
Early works relating to deposit genesis have variably ascribed the Buffalo Valley gold system to distal disseminated silver-gold, porphyry
copper-molybdenum, and gold skarn deposit models. Recent work tends to favor the distal disseminated silver-gold model as most of the
gold mineralization is associated with quartz+sericite+pyrite (QSP) veins and veinlets that postdate development of the various hornfels
and skarn alteration assemblages. The Buffalo Valley deposit is hosted by Eocene felsic dikes and metasedimentary rocks and basalt of
the Mississippian-Permian Havallah sequence that are pervasively altered to skarn and hornfels in the vicinity of the deposit area.
| 6.3.2.1 | Property Stratigraphy |
Sedimentary Rocks
In the Buffalo Valley mine area, there are three distinct metasedimentary
units of the Havallah sequence (Figure 6-3). The three units are extensively metasomatically altered and metamorphosed proximal to
felsic intrusive phases throughout the project area. The protolith equivalents of the three units are as follows:
| · | The lower unit consists of limestone, ribbon chert, and calcareous siltstone. This unit occurs below the base of the historical open
pit and does not crop out in the immediate mine area; however, it is well documented by deeper drilling. |
| · | The middle unit consists of interbedded sandstone, siltstone, and chert and is colloquially referred to as the “sandy”
unit by the mine geology group. |
| · | The upper unit structurally overlies the middle unit and consists of interbedded chert, siltstone, and limestone. In the mine area,
the base of the upper unit is marked by pillow-textured basalt that appears to be faulted out of the sequence at depth to the west of
the mine. The upper unit is thought to be tectonically thickened due to fold and thrust deformation. |
Bedding in the Buffalo Valley mine area generally dips to the southwest
between 40 and 60 degrees. Chemical, textural, and mineralogical data support interpretation of multi-phase emplacement of felsic intrusions.
| | 6-17 | |
| SSR Mining Inc. | Marigold Complex S-K 1300 Report | February 12, 2024 SLR Project No.: 138.21581.00002 |
Intrusive Rocks
Havallah sequence rocks were intruded and altered by a swarm of northwest
striking granodiorite and dacite porphyry dikes in the late Eocene to early Oligocene (Reid et al., 2010). Spatially related to the gold
deposit is a porphyry dike system with two primary splays that strike SE (approximately 140°) and steeply dip to the SW. The western
dike is described by previous workers as fine-grained granodiorite porphyry while the eastern dike is described as dacite porphyry. This
dike system is continuous along strike for at least one kilometre, although the west dike appears to coalesce with the east dike near
the northwestern extent of the pit. Both east and west dike splays are disrupted by a dacite porphyry plug south of the historical pit
that is chemically similar to a dacite stock east of the pit. A quartz diorite stock and associated dikes crop out west of the pit area.
Small lamprophyre and pebble dikes are also documented by previous workers (Reid et al., 2010).
Volcanic Rocks
Beds of Cenozoic airfall and ash-flow tuff are intercalated with alluvium
and exposed on surface north of the historical pit. Cenozoic strata are thickened in the immediate hanging wall of the range front fault
that defines the western flank of the Battle Mountains and in the structural block west of the deposit that is downdropped into the geographic
Buffalo Valley on the Front fault. The base of the volcanic tuff sequence is marked by a welded conglomerate that contains subrounded
clasts of quartzite and chert (Figure 6-9).
| | 6-18 | |
| SSR Mining Inc. | Marigold Complex S-K 1300 Report | February 12, 2024 SLR Project No.: 138.21581.00002 |
Figure 6-9: Geologic Map of
the Buffalo Valley Mine Area
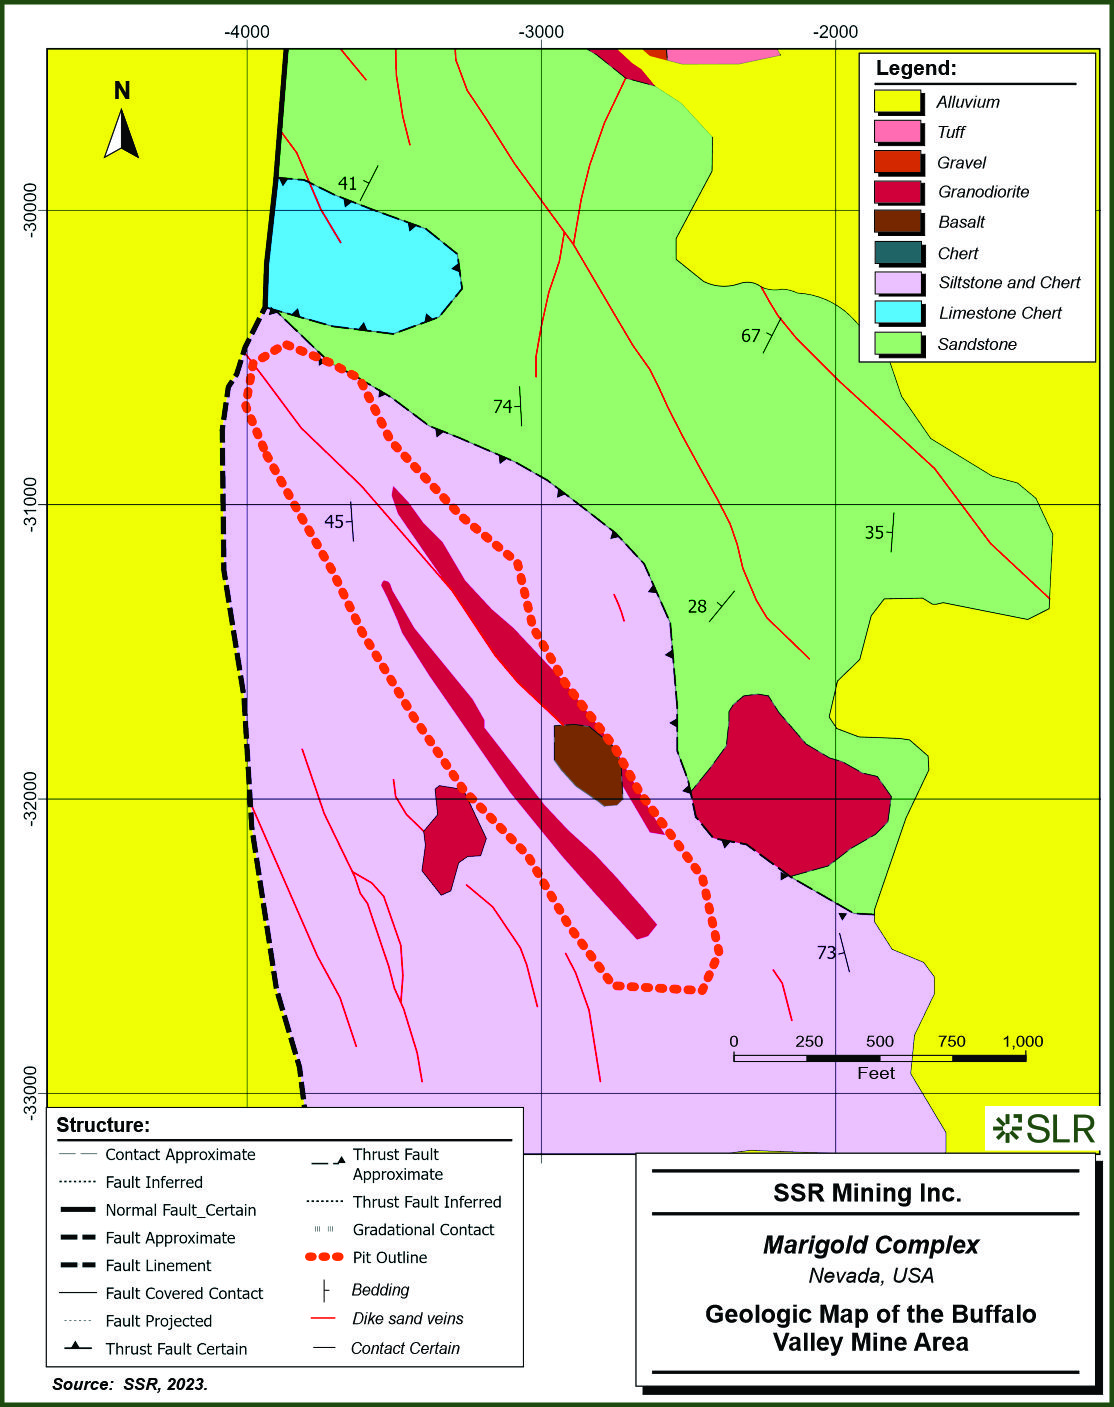
Note: Grid in Local Mine Coordinates.
SSR Mining Inc. Marigold
Complex Nevada, USA Geologic Map of the Buffalo Valley Mine Area
| | 6-19 | |
| SSR Mining Inc. | Marigold Complex S-K 1300 Report | February 12, 2024 SLR Project No.: 138.21581.00002 |
| 6.3.2.2 | Property Structure |
The
most prominent fault set in the Buffalo Valley project area are south striking structures that define the range bounding fault system.
The structural block that hosts the Buffalo Valley deposit is bound by the Range Front fault to the east and the moderately dipping (34
to 48 degrees) Front fault to the west (Seedorff et al., 1991). Bedrock in this block is exposed at surface and may indicate increased
transfer of slip to the Front fault or other subsidiary faults in the vicinity of the deposit. The Front fault is mineralized but also
offsets Quaternary alluvium, constraining the minimum age of initiation to the early Oligocene and latest slip to the Quaternary. Dikes
and hydrothermal fluids exploited dilational SE-striking relay structures related to N-S oriented master fault structures (Rhys,
2022; internal communication). This fault zone is well characterized by a large aeromagnetic anomaly that can be traced for more than
seven kilometres (Doebrich and Theodore, 1996).
| 6.3.2.3 | Property Mineralization |
The Buffalo Valley gold deposit formed along a southeast trending zone
of felsic porphyry dikes and faults. Gold occurs in arsenian iron sulfide overgrowths on pyrite in sheeted QSP veinlets within the central
granodiorite and dacite porphyry dikes, subparallel to dike margins in the country rock, and within faults (e.g., the Front fault). Outboard
of the intrusion’s gold mineralization is stratiform in receptive horizons of Havallah sequence metasedimentary rocks (Figure 6-10).
In general, gold concentration decreases with increasing distance from the granodiorite and dacite porphyry dike system. Although most
of the gold mineralization at Buffalo Valley occurs in QSP veinlets that overprint skarn alteration assemblages, a lesser amount of gold
is documented as native grains within garnet and amphibole crystals associated with prograde skarn development (Reid et al., 2010). Minerals
associated with gold mineralization in oxidized zones include scorodite, manganese and iron oxides, calcite, and clay.
| | 6-20 | |
| SSR Mining Inc. | Marigold Complex S-K 1300 Report | February 12, 2024 SLR Project No.: 138.21581.00002 |
Figure 6-10: Schematic Cross
Section Buffalo Valley Deposit
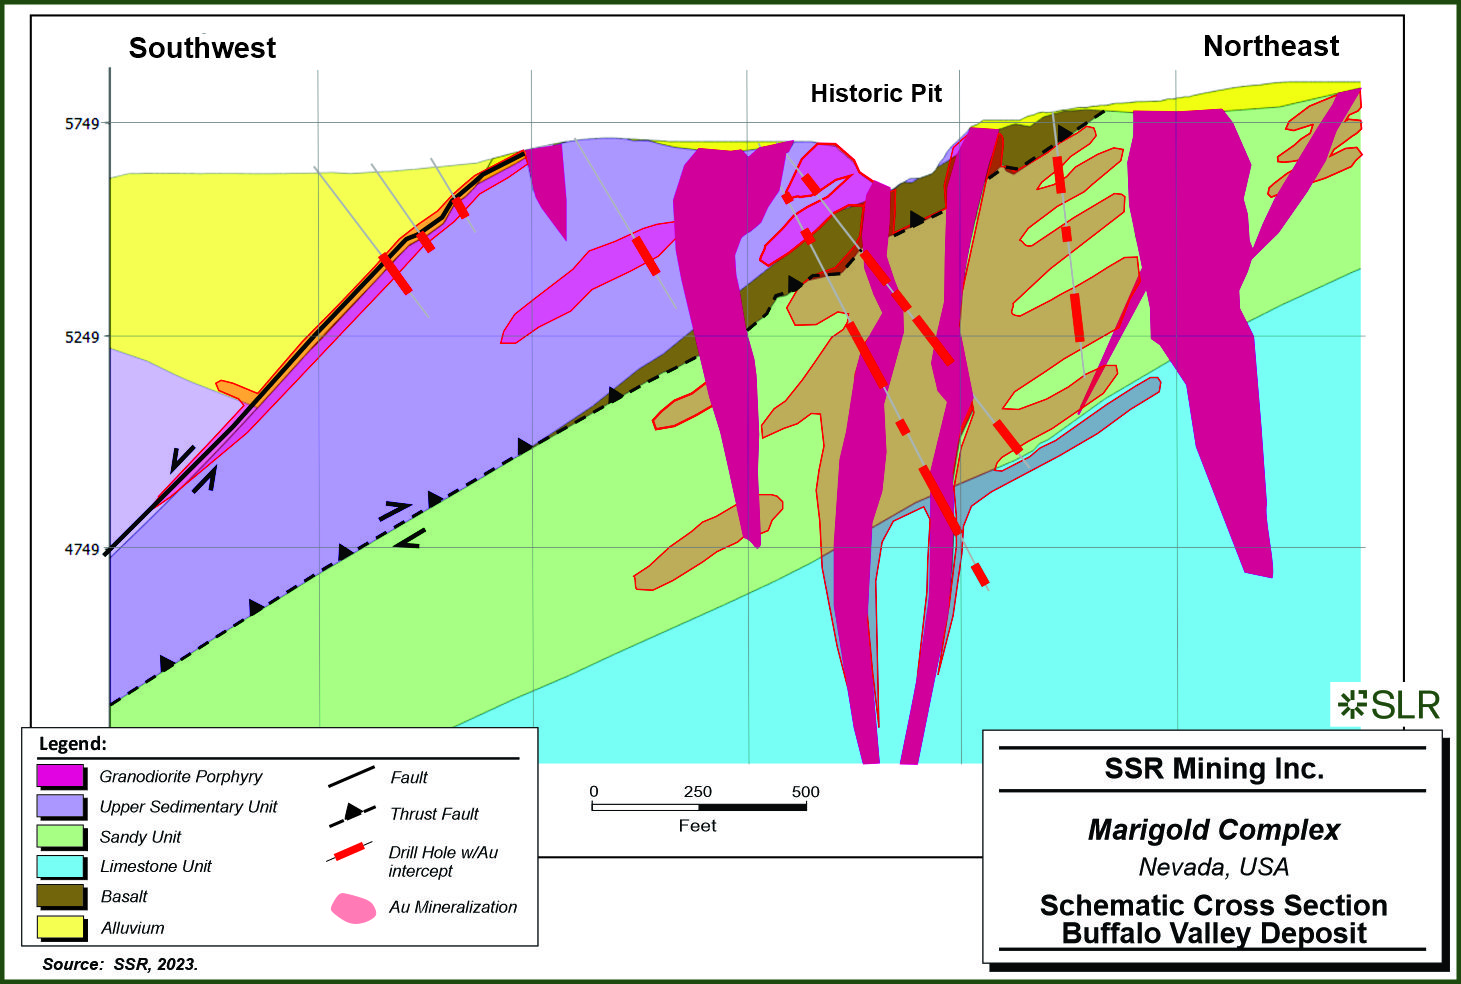
SSR Mining Inc. Marigold Complex Nevada, USA Schematic
Cross Section Buffalo Valley Deposit
| | 6-21 | |
| SSR Mining Inc. | Marigold Complex S-K 1300 Report | February 12, 2024 SLR Project No.: 138.21581.00002 |
| 6.3.2.4 | Property Alteration |
The alteration styles and assemblages at Buffalo Valley are well documented
by Reid et al., 2010 and is, in part, summarized here. The most intense alteration at Buffalo Valley is focused on the SE-striking relay
structures that, in part, controlled Eocene to Oligocene dike emplacement. Proximal to these structures’ limestone and other carbonate-bearing
protoliths were altered to prograde exoskarn assemblages including Fe-rich pyroxene, Ca and Fe-rich garnet, quartz, and calcite. Prograde
endoskarn assemblages include Mg-rich pyroxene, actinolite, biotite, quartz, and chlorite. Sulfide minerals associated with prograde skarn
include chalcopyrite, pyrrhotite, sphalerite, galena, and pyrite. Retrograde skarns are manifested in shallower levels of the deposit
and are characterized by potassic alteration assemblages that include shreddy biotite and K-feldspar. Sulfide minerals associated with
retrograde skarn include pyrrhotite, pyrite, and chalcopyrite. A late QSP event overprints skarn and hornfels and is associated with most
of the gold mineralization. Oxidation is the last alteration event to affect the rock package, extending from surface to depths of over
200 m proximal to the central Buffalo Valley fault system. Oxidation is a critically important process for liberation of gold nanoparticles
locked in arsenian iron sulfide phases.
The Trenton Canyon property is located approximately 5 km south of the
Marigold deposit and comprises an area of approximately 34 km2. Trenton Canyon is separated from Marigold by the southwest-striking
Oyarbide fault, a range-bounding fault on the northern flank of the Battle Mountains. Gold deposits at Trenton Canyon are hosted by siliciclastic
and carbonate rocks of Cambro-Ordovician and Pennsylvanian-Permian age proximal to potentially genetically related Eocene felsic dikes.
The gold deposits are on the margin of a calc-silicate and hornfels alteration aureole attributed to emplacement of the Cretaceous Trenton
Canyon stock, exposed on surface approximately one kilometer southwest of the historical South pit.
| 6.3.3.1 | Property Stratigraphy |
The general lithotectonic stratigraphy of Paleozoic sedimentary rocks
exposed at Trenton Canyon is reasonably well constrained (Figure 6-3) by decades of aggregate knowledge of the lithotectonic stratigraphy
at the adjacent Marigold mine complex. The succession is underlain by allochthonous to parautochthonous lower Paleozoic marine slope and
basin lithofacies rocks provisionally assigned to the Valmy and Comus Formations. These rocks are unconformably overlain by Pennsylvanian
to Permian, non-marine to marine conglomerate of the Battle Formation and limestone of the Antler Peak Limestone Formation, both of which
belong to the Antler overlap sequence. These two lithotectonic packages are structurally overridden by the Mississippian to Permian Havallah
sequence, which includes submarine basalt, chert, argillite, sandstone, siltstone, calcareous sandstone, gritstone, and conglomerate of
the Golconda allochthon. The paucity of coherent intraformational lithostratigraphy, due to fold and fault deformation as well as inferred
localized deposition during sedimentation, inhibits intraformational lithostratigraphic correlation on the property scale.
Early Paleozoic Rocks
Use of the term Comus Formation for rocks at Trenton Canyon is provisional
and serves as a placeholder assignment of Cambro-Ordovician rocks atypical of the Valmy Formation in the district. The formation outcrops
very poorly across the property and is best studied along road cuts and where it is present in open pits. At Trenton Canyon, the Comus
Formation is a sequence of siliciclastic and carbonate marine rocks and basalt deposited on the slope and basal slope of the passive margin.
These rocks formed distal to the Comus carbonate seamount to the north, but record influx of carbonate detritus into the basin at least
as far south as Trenton Canyon. The Comus and Valmy Formations are quasi-time equivalent rock packages and are intercalated at the base
of slope. In the district, the Comus Formation is distinguished from the Valmy Formation by the presence of carbonate and preservation
of higher energy features like debris flows, turbidites, slumps and large rip-up clasts.
| | 6-22 | |
| SSR Mining Inc. | Marigold Complex S-K 1300 Report | February 12, 2024 SLR Project No.: 138.21581.00002 |
Sedimentary units of the Valmy Formation are restricted to deep water
chert, massive quartz arenite or quartzite, and argillite units that do not display sedimentary features indicative of higher energy slope
facies. The simplistic stratigraphy of the Valmy Formation is a basal massive quartzite that is devoid of bedding and other sedimentary
features. The quartzite unit is overlain by a highly contorted thin to medium bedded green to grey chert. Above the chert unit is typically
a massive pillow basalt unit. This unit is discontinuous across the property and is best observed on Hollywood Ridge and the North Fork
of Trout Creek at Trenton Canyon. The intraformational units of the Valmy Formation are certainly more complex than described above but
broadly adhere to this succession in the vicinity of Trenton Canyon.
There are no known Silurian or Devonian rocks at Trenton Canyon.
Late Paleozoic Rocks
At the type locality approximately five kilometers south-southeast of
Trenton Canyon, the transgressive Pennsylvanian Battle Formation consists of up to 250 m of alluvial and marine conglomerate, sandstone,
mudstone, and lesser limestone (Saller and Dickinson, 1982).All these lithologies are recognized at Trenton Canyon despite the drastic
northwestward thinning of the formation from the type-locality to the footwall of the Oyarbide fault at Relay Ridge where the strata are
either absent or no more than five meters thick. Based primarily on clast composition and sedimentary structures, five informal map units
(Pb1-5) and one marker bed within the Battle Formation at Trenton Canyon are recognized. Mapped relations of Battle Formation subunits
suggest deposition was synchronous with crustal extension in the Pennsylvanian.
The Havallah Sequence is a Mississippian to Permian sedimentary succession
that includes submarine basalt, chert, argillite, sandstone, siltstone, calcareous sandstone, gritstone, and conglomerate. This succession
of clastic marine rocks makes up the Golconda allochthon emplaced during the Sonoma Orogeny. The succession is highly deformed by tight
to isoclinal overturned folds hindering the understanding of intraformational lithostratigraphy.
Igneous Rocks
The Cretaceous Trenton Canyon stock is the most prominent intrusion
on surface in the Trenton Canyon project area. The medium-grained crystalline monzonite stock has a bulbous surface exposure and weathers
recessively. The stock has altered the adjacent country rock resulting in a contact metamorphic aureole discernable in regional geophysics.
Local base metal (Cu-Mo-Ag-Zn) mineralization also occurs along the periphery of the stock (Figure 6-11).
| | 6-23 | |
| SSR Mining Inc. | Marigold Complex S-K 1300 Report | February 12, 2024 SLR Project No.: 138.21581.00002 |
Figure 6-11: Geologic Map of
Trenton Canyon Area
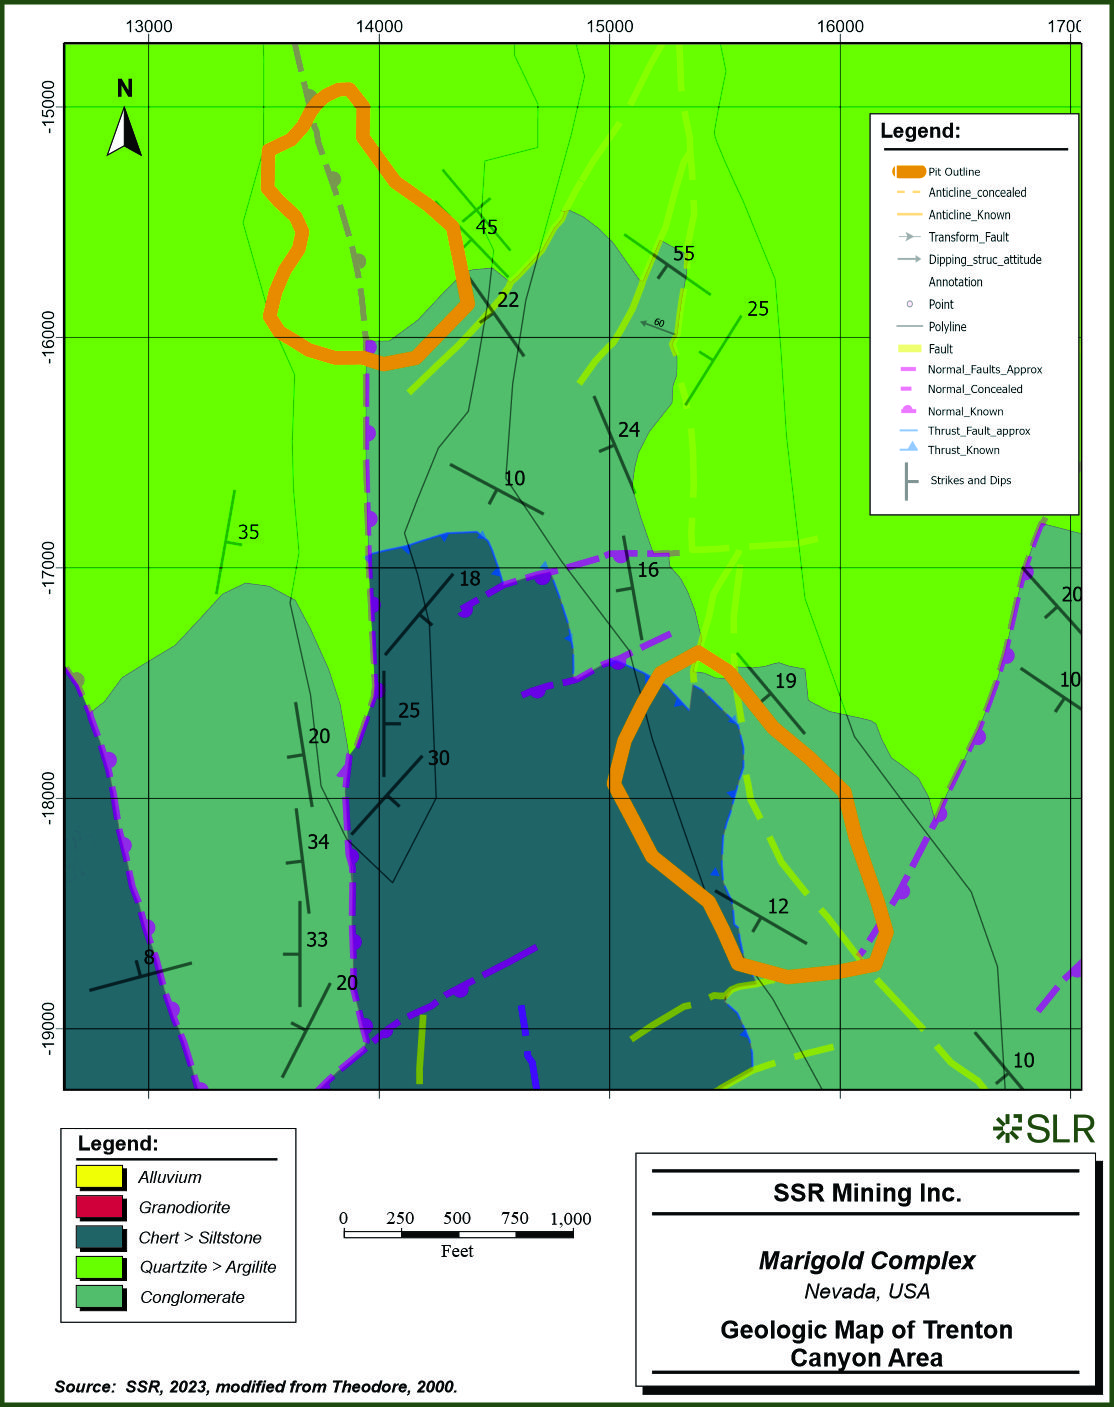
SSR Mining Inc. Marigold
Complex Nevada, USA Geologic Map of Trenton Canyon Area
| | 6-24 | |
| SSR Mining Inc. | Marigold Complex S-K 1300 Report | February 12, 2024 SLR Project No.: 138.21581.00002 |
Eocene granodiorite dikes up to several meters in width also occur within
the Trenton Canyon area. The dikes intrude a network of north to northwest striking faults and primarily dip to the east at approximately
55 degrees but locally exploit south to southeast striking structures with similar to slightly more inclined dips. Phreatomagmatic textures
are observed on dike margins on surface, in road cuts, and in drill core. The breccias primarily contain irregularly shaped clasts of
the intrusion, suggesting a degree of plasticity at the time of brecciation, and lesser quartzite and argillite clasts in a matrix of
igneous rock flour. The dike margins and phreatomagmatic breccias are locally well mineralized. In addition to phreatomagmatic brecciation,
melting and incorporation of country rock is also evident on the margins of some dikes. The dikes at Trenton Canyon may have played a
role in the localization of gold mineralizing fluids as deposit geometry typically mimics the spatial distribution pattern of the intrusions.
Lamprophyre dikes are also observed in the project area. The lamprophyres
are assumed to be Jurassic in age, based on geochronologic analysis of lamprophyre at Marigold and the temporal distribution of lamprophyre
in northern Nevada. The lamprophyres are medium-grained crystalline, often with a felted texture and chilled margins. These lamprophyres
do not seem to be associated with gold mineralization and are more often observed in deeper drill holes.
| 6.3.3.2 | Property Structure |
A generalized model of the deformation history preserved at Trenton
Canyon is described below. Sections are in chronological order and describe fault systems from oldest to youngest. It is important to
note that these fault and fold systems likely experienced a complex protracted and reactivated history making a formal chronologic breakout
challenging.
Irregularities in basement architecture are likely responsible for the
development of structural complexities, e.g., stress localization and ramp development during orogenesis. The surficial expression of
these structures is difficult to delineate, though it is interpreted that the large-scale anticlinorium and imbricated thrust sheets present
at Trenton Canyon formed in response to a basement cored irregularity where stress localized during the emplacement of the Antler allochthon.
Later, Cenozoic extension inherited the architecture of the anticlinorium forming a horst-block, i.e., sets of west and east dipping faults
along the strike length of the deposit. The anticlinorium and overprinting horst-block has an inherent control on mineralization. Understanding
the structural style and geometry of the lateral and frontal ramps is very important as the frontal ramp sections of the complex are likely
to have experienced more ground preparation for mineralizing fluids to exploit. Furthermore, the NW and NE extensional fault grain responsible
for depositional growth of Battle Formation is thought to potentially have soft and hard links to basement structures.
Expressions of deformation related to the Antler orogeny include tight
F1 folds and internal Valmy Formation thrust faults. In addition, thrust faults exposed on surface at Trenton Canyon demonstrate the imbricated
nature of Cambro-Ordovician rocks interpreted to have formed in quiescent and high energy depositional environments.
Following Antler orogenesis, deposition of the Antler overlap sequence
was occurring in extensional basins along the Antler Highlands. Understanding the internal stratigraphy of the Battle Formation was instrumental
in demonstrating syn-depositional extension along a NW and NE to EW trending fault system. These Pennsylvanian-age faults preserve proximal
growth stratigraphy of the lower Battle Formation subunits and are onlapped by the upper units. The NW and NE Paleozoic fault system documented
at Trenton Canyon displays a complex array of NE to EW transfer zones (or relay faults) connecting the long NW grain. This complexity
in the fault system lends to increased clastic sedimentation at transfer zones. Due to the fault-tip propagation style of growth stratigraphy
displayed in the lower subunits, this fault set is interpreted to be deep-seated and potentially soft-linked to older basement-cored architectures.
The NW long-grain and EW short-grain are often gold mineralized, with grade enhancement at intersections with the Eocene NNE fault set
(described below).
| | 6-25 | |
| SSR Mining Inc. | Marigold Complex S-K 1300 Report | February 12, 2024 SLR Project No.: 138.21581.00002 |
Quasi-contemporaneous with deposition of Antler sequence rocks, Havallah
sequence rocks were forming in the Havallah basin to the west of the Antler highlands. The Sonoma Orogeny structurally juxtaposed the
Havallah sequence east over the Antler overlap sequence and lower Paleozoic assemblages along the Golconda thrust. Two major Sonoma aged
thrust faults are recognized at Trenton Canyon, as well as multiple internal thrusts and folds. The structurally lowest thrust is the
Golconda thrust. The Golconda thrust juxtaposes a package of black to blueish-grey siltstones and gritstones on top of the Antler Sequence
(Battle Formation and Antler Peak LS Formation.). The Willow Creek thrust is a structurally higher plate that emplaces a deeper water
package of green-brown chert and siltstone on top of the siltstone/gritstone package. The Willow Creek thrust coalesces with the Golconda
thrust to the south where the black to bluish-grey siltstone unit is structurally removed and the green-brown chert/siltstone package
is in contact with the Antler Peak Limestone.
Cretaceous contractional deformation is interpreted to be recorded by
a set of north trending upright and open folds. Felsic dikes (NW trending) and stocks intrude the Battle Mountains at approximately 98
Ma. It is uncertain whether this igneous event is due to the advancing flat subducting Farallon slab during the Sevier-Laramide orogenies,
or if the retro-arc was undergoing extension which introduced peraluminous magmas into the middle crust.
A major north to NNE and south to SSW fault set at Trenton Canyon is
thought to be related to early Eocene extension. These faults switch polarity from west to east dipping and are inheriting their architecture
from deformation attributed to the Antler orogeny. The result of this extension is the formation of a horst block throughout the project
area. The most notable N-NNE trending fault at Trenton Canyon is the Windy Ridge fault system that hosts economic gold mineralization
in the historical West Pit. This fault set is occupied locally by Eocene intrusions.
Post mineral faulting is best demonstrated by the Oyarbide and associated
Oyarbide parallel faults. These structures trend NE-SW and very clearly display younger slip due to the development of topographic facets
and the offset of mineralization. While the latest slip is post-gold mineralization, this fault set likely has a protracted deformational
history with hard and soft links to basement structures.
Blasthole patterns indicate gold mineralization in the previously mined
South and West pits was localized where principal faults branch into antithetic and synthetic splays and relays. Enhanced permeability
related to curvature of horsetail structures promoted gold mineralization (Rhys, 2022; internal communication).
Folding
The first generation (F1) of folding observed in the Battle Mountains
is a set of tight to isoclinal overturned folds with short wavelengths and high amplitudes, that trend NW-SE to NNW-SSE. This fold set
is recording allochthonous deformation of upper-plate siliciclastic rocks along the Roberts Mountains Thrust (RMT) during the Antler orogeny.
F1 folds primarily deform Valmy Formation chert, argillite, and quartzite; but is not limited to upper-plate rocks. RMT equivalent thrust
faults in the area demonstrate a complex nature of imbricated panels that deform earlier thrust faults and lower-plate rocks.
| | 6-26 | |
| SSR Mining Inc. | Marigold Complex S-K 1300 Report | February 12, 2024 SLR Project No.: 138.21581.00002 |
The second generation (F2) of folding observed is an open and upright
set of folds that trend 250° to 300° and plunge very shallowly. F2 folds are best observed in the Basalt pit but are documented
across Marigold and Trenton Canyon. Intersections of F2 hinge lines with F1 hinge lines form type-1 fold interference patterns, or domes
and basins. This style of fold interference has led to significant ground preparation of the area and controls the distribution of mineralization.
F2 is not observed in the Antler overlap sequence rocks. Therefore, it is interpreted that F2 is time equivalent with F1 and formed in
response to the development of lateral thrust ramps during the Antler orogenesis.
The third generation (F3) of folding documented is a set of tight to
isoclinal, overturned and recumbent folds that trend approximately north-south. This set is restricted to allochthonous Havallah sequence
rocks emplaced during the Sonoma Orogeny. This deformation event had very little effect on autochthonous rocks below the Golconda Thrust.
The fourth generation (F4) of folding is observed on a much bigger scale.
This folding event formed a very open broad and upright set of folds that trend approximately north-south to NE-SW. This set deforms the
entire rock column present at Marigold and Trenton Canyon on a Mountain Range scale. This deformation event is interpreted to be related
to Mesozoic tectonics during the Sevier and Laramide orogeneses, though timing constraints are poor.
| 6.3.3.3 | Property Mineralization |
A Cretaceous base metal mineralization event, thought to be related
to emplacement of the Trenton Canyon stock, is characterized by a sulfide association of pyrrhotite, chalcopyrite, and pyrite in unoxidized
samples, and a gangue association of tremolite, calcite, muscovite, diopside, and garnet. This event pre-dates Eocene gold mineralization
at Trenton Canyon, which is characterized by a sulfide association of auriferous arsenic-bearing iron sulfides and argentiferous tennantite,
and a gangue association of quartz, carbonate, phyllosilicates, clays, carbon, and stibnite.
Gold mineralization at the South, West, and East pit areas is primarily
hosted in a network of transtensional faults locally intruded by Eocene dikes and sills. Hydrothermal and/or phreatomagmatic breccias
within these structures typically contain increased concentrations of gold. Gold mineralization is well confined to structures, although
a small (several meter) halo of lower grade, more disseminated mineralization may be present. Quartz veining, illite, iron oxides, and
iron hydroxides (goethite) are the primary indicators of gold mineralization where oxidized.
At Cottonwood Ridge there is a complex interplay of stratigraphic control,
intrusive influence, and structure that localizes mineralization. Relay Ridge mineralization is primarily strata bound but hosted close
to the intersection with the regional scale Oyarbide and Havallah West faults which possibly played a role in enhancing permeability.
Oxidation boundaries at Trenton Canyon are complex and influenced by structure-induced permeability. The inherently low permeability of
the Valmy formation results in a relatively shallow supergene phreatic oxidation/reduction boundary; however, secondary permeability created
by faulting enables oxidation to occur at depth. Figure 6-12 is a cross section through Trenton Canyon showing interplay of faulting,
intrusives, mineralization, and oxidation.
| | 6-27 | |
| SSR Mining Inc. | Marigold Complex S-K 1300 Report | February 12, 2024 SLR Project No.: 138.21581.00002 |
Figure 6-12: Schematic Cross
Section through Trenton Canyon
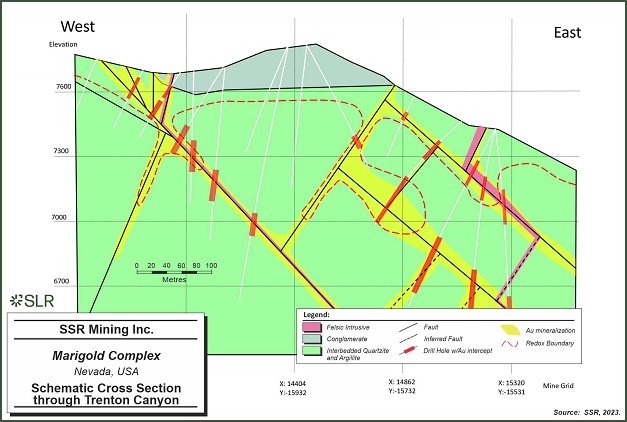
SSR Mining Inc. Marigold Complex Nevada, USA Schematic
Cross Section through Trenton Canyon
| | 6-28 | |
| SSR Mining Inc. | Marigold Complex S-K 1300 Report | February 12, 2024 SLR Project No.: 138.21581.00002 |
| 6.3.3.4 | Property Alteration |
The dominant forms of alteration observed at Trenton Canyon represent
both metasomatic (calc-silicate) and isochemical (hornfels) processes associated with the contact aureole of the Cretaceous Trenton Canyon
stock. Alteration related to the Eocene hydrothermal system locally overprinted the calc-silicate and hornfels assemblages.
Alteration associated with gold mineralization is well constrained to
fault zones, intrusions, and intrusion margins. Silicification in the form of drusy quartz, quartz stockwork veins and veinlets is present
within and around fault zones. Iron oxides and hydroxides, including goethite, hematite, and limonite, as well as clays (illite, kaolinite)
are associated with these veins. Eocene dikes are quartz, sericite, pyrite (QSP) altered in the deposit area and often have Liesegang
banding where oxidized.
Doebrich and Theodore (1996), Theodore (1998), and Theodore (2000) described
the deposits at Marigold as distal disseminated silver–gold deposits. These deposits are disseminated equivalents of polymetallic
vein deposits, characterized by a geochemical signature that includes silver, gold, lead, manganese, zinc, copper, antimony, arsenic,
mercury, and tellurium (Cox and Singer, 1990). Typically, they contain substantially more silver relative to gold than other types of
disseminated gold deposits and may feature supergene enrichment of silver if significantly oxidized.
In Nevada, distal disseminated silver–gold deposits are proximal
to Jurassic, Cretaceous, and mid-Tertiary granitoid intrusions (Hofstra and Cline, 2000). A fundamental requirement of the distal disseminated
silver–gold model necessitates a genetic link between silver–gold mineralization and causative intrusions (Hofstra and Cline,
2000); however, no such relationship has been conclusively demonstrated at Marigold (Fithian, 2015).
A Carlin-type gold deposit (CTGD) is a unique type of disseminated,
sedimentary rock-hosted gold deposit. The genesis of CTGDs is currently not well understood. In Nevada, CTGDs occur along several main
mineralization trends, including the Carlin trend and Battle Mountain-Eureka trend, and are primarily hosted by silty carbonate rocks.
Gold in a CTGD occurs in arsenian pyrite rims on pyrite grains and is
associated with arsenic, sulfur, antimony, mercury, and thallium (Cline et al., 2005). There is considerable debate regarding the source
of gold in CTGDs. Leading theories include a magmatic-hydrothermal origin (e.g., Sillitoe and Bonham, 1990; Johnston and Ressel, 2004;
Ressel and Henry, 2006; Muntean et al., 2011) and gold sourced from the sedimentary host package (e.g., Ilchik and Barton, 1997; Emsbo
et al., 2003; Large et al., 2011). Even though the genesis of CTGDs remains enigmatic, there is consensus that all CTGDs in Nevada formed
during the Eocene period (42 to 36 Ma) (Cline et al., 2005).
Distal disseminated silver–gold deposits may share similarities
with CTGDs, including orebody morphology, structural setting, and alteration styles, but drastically differ with respect to alteration
zonation, geochemical signature, hypogene mineralogy, and endowment. Distal disseminated silver–gold deposits show a more definitive
magmatic signature than CTGDs that includes zoning of alteration relative to felsic hypabyssal intrusions, base metal enrichment, significantly
higher Ag/Au ratios, and distinctive hypogene ore mineralogy (e.g., base metal sulfides, native gold and silver, electrum, silver
sulfides, and silver sulfosalts) (Cox and Singer, 1990; Cox, 1992; Hofstra and Cline, 2000), and are typically much smaller in terms of
gold endowment.
| | 6-29 | |
| SSR Mining Inc. | Marigold Complex S-K 1300 Report | February 12, 2024 SLR Project No.: 138.21581.00002 |
There is increasing support for a model that proposes a continuum between
CTGDs, distal disseminated silver–gold deposits, and epithermal deposits. This model implies a magmatic source for heat and metal.
Marigold and Trenton Canyon show characteristics closer to the CTGD endmember and Buffalo Valley shows characteristics closer to the distal
disseminated silver-gold endmember.
Figure 6-13 is a diagrammatic representation of the deposit model.
Figure 6-13: Model Illustrating
Inferred Processes Related to Formation of Carlin-Type Gold Deposits (CTGD) and Distal Disseminated Silver–Gold Deposits
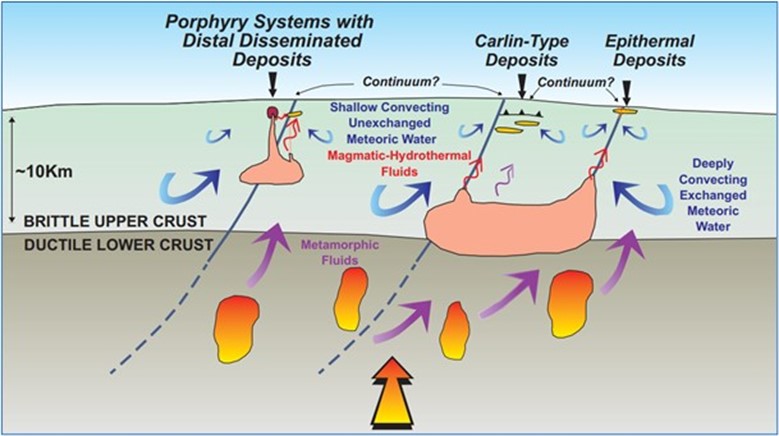
Source: Muntean and Cline, 2018
| | 6-30 | |
| SSR Mining Inc. | Marigold Complex S-K 1300 Report | February 12, 2024 SLR Project No.: 138.21581.00002 |
Since acquiring the Property in April 2014, SSR has conducted several
surface exploration programs including soil sampling, and geophysics, as summarized in Table 7-1.
Table 7-1: Summary of Exploration
Completed by SSR
| Year |
Property |
Company |
Exploration Type |
Details |
| 2014 |
Marigold |
SSR |
Geophysics |
Magee Geophysical Services LLC conducted the field data collection. The gravity measurements were collected from 1,358 stations using two LaCoste and Romberg Model-G gravity meters at a grid spacing of 150 m x 150 m. (Magee, 2014). J L Wright Geophysics processed and interpreted the data. |
| 2016 |
Marigold |
SSR |
Geophysics |
Gravity survey conducted by Magee Geophysical Services LLC. A total of 1,806 stations were acquired on a 150 m square grid and 150 m x 300 m staggered grid. Relative gravity measurements were made with LaCoste and Romberg Model-G gravity meters. Topographic surveys were performed with Trimble Real-Time Kinematic (RTK) and Fast-Static GPS. (Magee, 2016). J L Wright Geophysics processed and interpreted the data. |
| 2020 |
Marigold and Trenton Canyon |
SSR |
Geophysics |
Two reflection seismic lines covering 16.9 km. The lines were surveyed by Riolada Surveying LLC and Xtreme Drilling completed the shot holes. Bird Seismic acquired the data, and processing was completed by SubTerraSeis and Wright Geophysics. |
| 2021 |
Trenton Canyon |
SSR |
Geophysics / Soil Samples |
In 2021 a proprietary airborne hyperspectral dataset was acquired with district-scale coverage. This dataset includes mineral maps generated from short and long wave infrared sources. A soil sampling program was completed by North American Exploration on behalf of SSR Mining consisting of 3,284 soil samples covering 14.5 km2 of mountainous terrain predominantly east the previously mined pits at Trenton Canyon. |
| 2023 |
Buffalo Valley, Trenton Canyon, and Marigold |
SSR |
Geophysics |
EarthEx completed a UAV-borne magnetic survey of the Buffalo Valley, North Peak, and New Millennium areas. The project encompassed 3,324.7 line-km at 25 m line spacing and 250 m tie line spacing with mean terrain clearance of 20 m |
| | 7-1 | |
| SSR Mining Inc. | Marigold Complex S-K 1300 Report | February 12, 2024 SLR Project No.: 138.21581.00002 |
| 7.1 | Geophysical and Geochemical Surveys |
After finalizing the purchase of Valmy in 2015 (additional Newmont owned
land to the east and west of the previous land boundary), SSR in 2016 expanded the geophysical gravity survey to include this new ground,
resulting in a total of 1,806 new gravity stations collected on variable station spacing on a 150 m square grid and a 150 m x 300 m staggered
grid. The purpose of the survey was to assist in delineation of structures in the area in conjunction with geologic mapping and exploration
drilling.
The acquisition of Buffalo Valley and Trenton Canyon from Newmont in
2019 resulted in the addition of 952 gravity stations to the Marigold database.
In 2020, 766 gravity stations were acquired by Magee Geophysical Services
on a 122 m x 244 m grid at Trenton Canyon. Relative gravity measurements were made with LaCoste & Romberg Model-G gravity
meters. Topographic surveying was performed with Trimble (RTK) and Fast-Static GPS. The gravity survey is tied to the US Department of
Defense gravity base Battle Mountain (DoD reference number 2344-2) via an intermediate base established on the property.
The Marigold gravity database now contains a total of 6,665 stations.
In August 2020, two reflection seismic lines were completed to assess
the utility of reflection seismic for imaging structural and lithological domains in a challenging geological setting. The test program
included two lines totaling approximately 16.9 line kilometers (line-km). The survey was conducted by Bird Seismic of Globe, Arizona,
and processed by SubTerraSeis of Reno, Nevada. Results were finalized and interpreted by Wright Geophysics of Elko, Nevada.
In 2020, North American Exploration of Layton Utah was contracted to
collect 3,284 soil samples covering approximately 14.5 km2 at Trenton Canyon.
| 7.1.4 | Drone-based Magnetic |
In 2022 and 2023, EarthEx Geophysical Solutions of Selkirk, Manitoba,
was contracted to complete a drone-based magnetic survey over portions of Buffalo Valley, Trenton Canyon, and Marigold. Approximately
3,325 line-km were flown at a spacing of 25 m with a mean terrain clearance of 20 m. The purpose of the survey was to help delineate structure
and intrusions in the area.
| | 7-2 | |
| SSR Mining Inc. | Marigold Complex S-K 1300 Report | February 12, 2024 SLR Project No.: 138.21581.00002 |
Reverse Circulation (RC) and Core (Diamond Drilling-DD) drilling on
the Property is the principal method of exploration and delineation of gold mineralization after initial targeting using soil sampling
and geophysical surveys. Drilling can generally be conducted year-round on the Property.
As of the effective date of this TRS, SSR and its predecessor companies
have completed over 2.4 million metres of drilling in 12,636 drill holes across the Marigold, Buffalo Valley, and Trenton Canyon areas,
as summarized in Table 7-2, Table 7-3, and Table 7-4.
Since the previous TRS (OreWin, 2022), exploration at the Property has
focused on the following:
| · | Exploration drilling to expand Mineral Resources and Mineral Reserves through systematic step out drilling. |
| · | Infill drilling to increase the confidence of Mineral Resource estimates, specifically targeting areas with widely spaced drilling
(approximately 35 m to 50 m) and around drill holes drilled prior to 2006 with missing assays. |
| · | Drilling to confirm the final position of the pit highwall. |
| · | Defining mineralization at Trenton Canyon and Buffalo Valley. |
From December 1, 2021, through to the end of June 2023, a total of 491
holes have been drilled (456 RC holes and 35 diamond core holes), totalling 139,839 m.
Figure 7-1 illustrates all drilling completed by year on the Property
as of the effective date of this TRS.
| | 7-3 | |
| SSR Mining Inc. | Marigold Complex S-K 1300 Report | February 12, 2024 SLR Project No.: 138.21581.00002 |
Table 7-2: Summary of Drilling
at Marigold
| Drilling Program |
Company |
No. of RC Holes |
RC Drilling
(m) |
No. of Diamond Holes |
Diamond Drilling
(m) |
Total Holes |
Total Drilling
(m) |
| 1968–1985 |
Various exploration and mining groups |
126 |
7,037 |
|
|
126 |
7,037 |
| 1985–1999 |
Cordex and Rayrock Mines |
2,350 |
333,325 |
8 |
2,176 |
2,358 |
335,501 |
| 1999–2006 |
Glamis Gold |
2,498 |
484,619 |
8 |
2,030 |
2,506 |
486,649 |
| 2006–2013 |
Goldcorp |
1,856 |
520,163 |
14 |
8,063 |
1,870 |
528,226 |
| 1968–2006 |
Newmont and other mining groups (Valmy property) |
852 |
108,326 |
15 |
1,037 |
867 |
109,363 |
| 2014 |
SSR |
116 |
21,653 |
1 |
1,235 |
117 |
22,888 |
| 2015 |
SSR |
171 |
39,070 |
4 |
4,270 |
175 |
43,340 |
| 2016 |
SSR |
231 |
55,147 |
1 |
955 |
232 |
56,102 |
| 2017 |
SSR |
188 |
54,814 |
1 |
1,128 |
189 |
55,942 |
| 2018 |
SSR |
259 |
93,276 |
0 |
0 |
259 |
93,276 |
| 2019 |
SSR |
183 |
63,629 |
25 |
10,265 |
208 |
73,893 |
| 2020 |
SSR |
109 |
37,955 |
0 |
0 |
109 |
37,955 |
| 2021 |
SSR |
150 |
52,579 |
6 |
1,636 |
156 |
52,214 |
| 2022 |
SSR |
200 |
55,628 |
0 |
0 |
200 |
55,628 |
| H1 2023 |
SSR |
70 |
15,993 |
7 |
1,832 |
77 |
17,825 |
| Total Drilling |
9,359 |
1,943,214 |
90 |
34,627 |
9,449 |
1,975,839 |
Table 7-3: Summary of Drilling
at Buffalo Valley
| Drilling Program |
Company |
No. of RC Holes |
RC Drilling
(m) |
No. of Diamond Holes |
Diamond Drilling
(m) |
Total Holes |
Total Drilling
(m)) |
| 1980–2011 |
Newmont and other mining groups |
1,550 |
178,892 |
24 |
4,187 |
1,574 |
183,079 |
| 2019 |
SSR |
0 |
0 |
0 |
0 |
0 |
0 |
| 2020 |
SSR |
0 |
0 |
0 |
0 |
0 |
0 |
| 2021 |
SSR |
0 |
0 |
3 |
837 |
3 |
837 |
| 2022 |
SSR |
36 |
14,426 |
7 |
3,315 |
43 |
17,741 |
| H1 2023 |
SSR |
39 |
11,636 |
9 |
2,900 |
48 |
14,536 |
| Total Drilling |
1,625 |
204,954 |
43 |
11,239 |
1,668 |
216,193 |
| | 7-4 | |
| SSR Mining Inc. | Marigold Complex S-K 1300 Report | February 12, 2024 SLR Project No.: 138.21581.00002 |
Table 7-4: Summary of Drilling
at Trenton Canyon
| Drilling Program |
Company |
No. of RC Holes |
RC Drilling
(m) |
No. of Diamond Holes |
Diamond Drilling
(m) |
Total Holes |
Total Drilling
(m) |
| 1991–2011 |
Newmont and other mining groups |
1,143 |
152,792 |
6 |
909 |
1,149 |
153,701 |
| 2019 |
SSR |
64 |
19,112 |
0 |
0 |
64 |
19,112 |
| 2020 |
SSR |
97 |
28,840 |
7 |
5,902 |
104 |
34,742 |
| 2021 |
SSR |
86 |
24,844 |
3 |
1,518 |
89 |
26,362 |
| 2022 |
SSR |
64 |
18,983 |
10 |
3,984 |
74 |
22,967 |
| H1 2023 |
SSR |
37 |
8,232 |
2 |
434 |
39 |
8,667 |
| Total Drilling |
1,491 |
252,804 |
28 |
12,746 |
1,519 |
265,550 |
| | 7-5 | |
| SSR Mining Inc. | Marigold Complex S-K 1300 Report | February 12, 2024 SLR Project No.: 138.21581.00002 |
Figure 7-1: Plan View of All
Drilling to End of June 2023
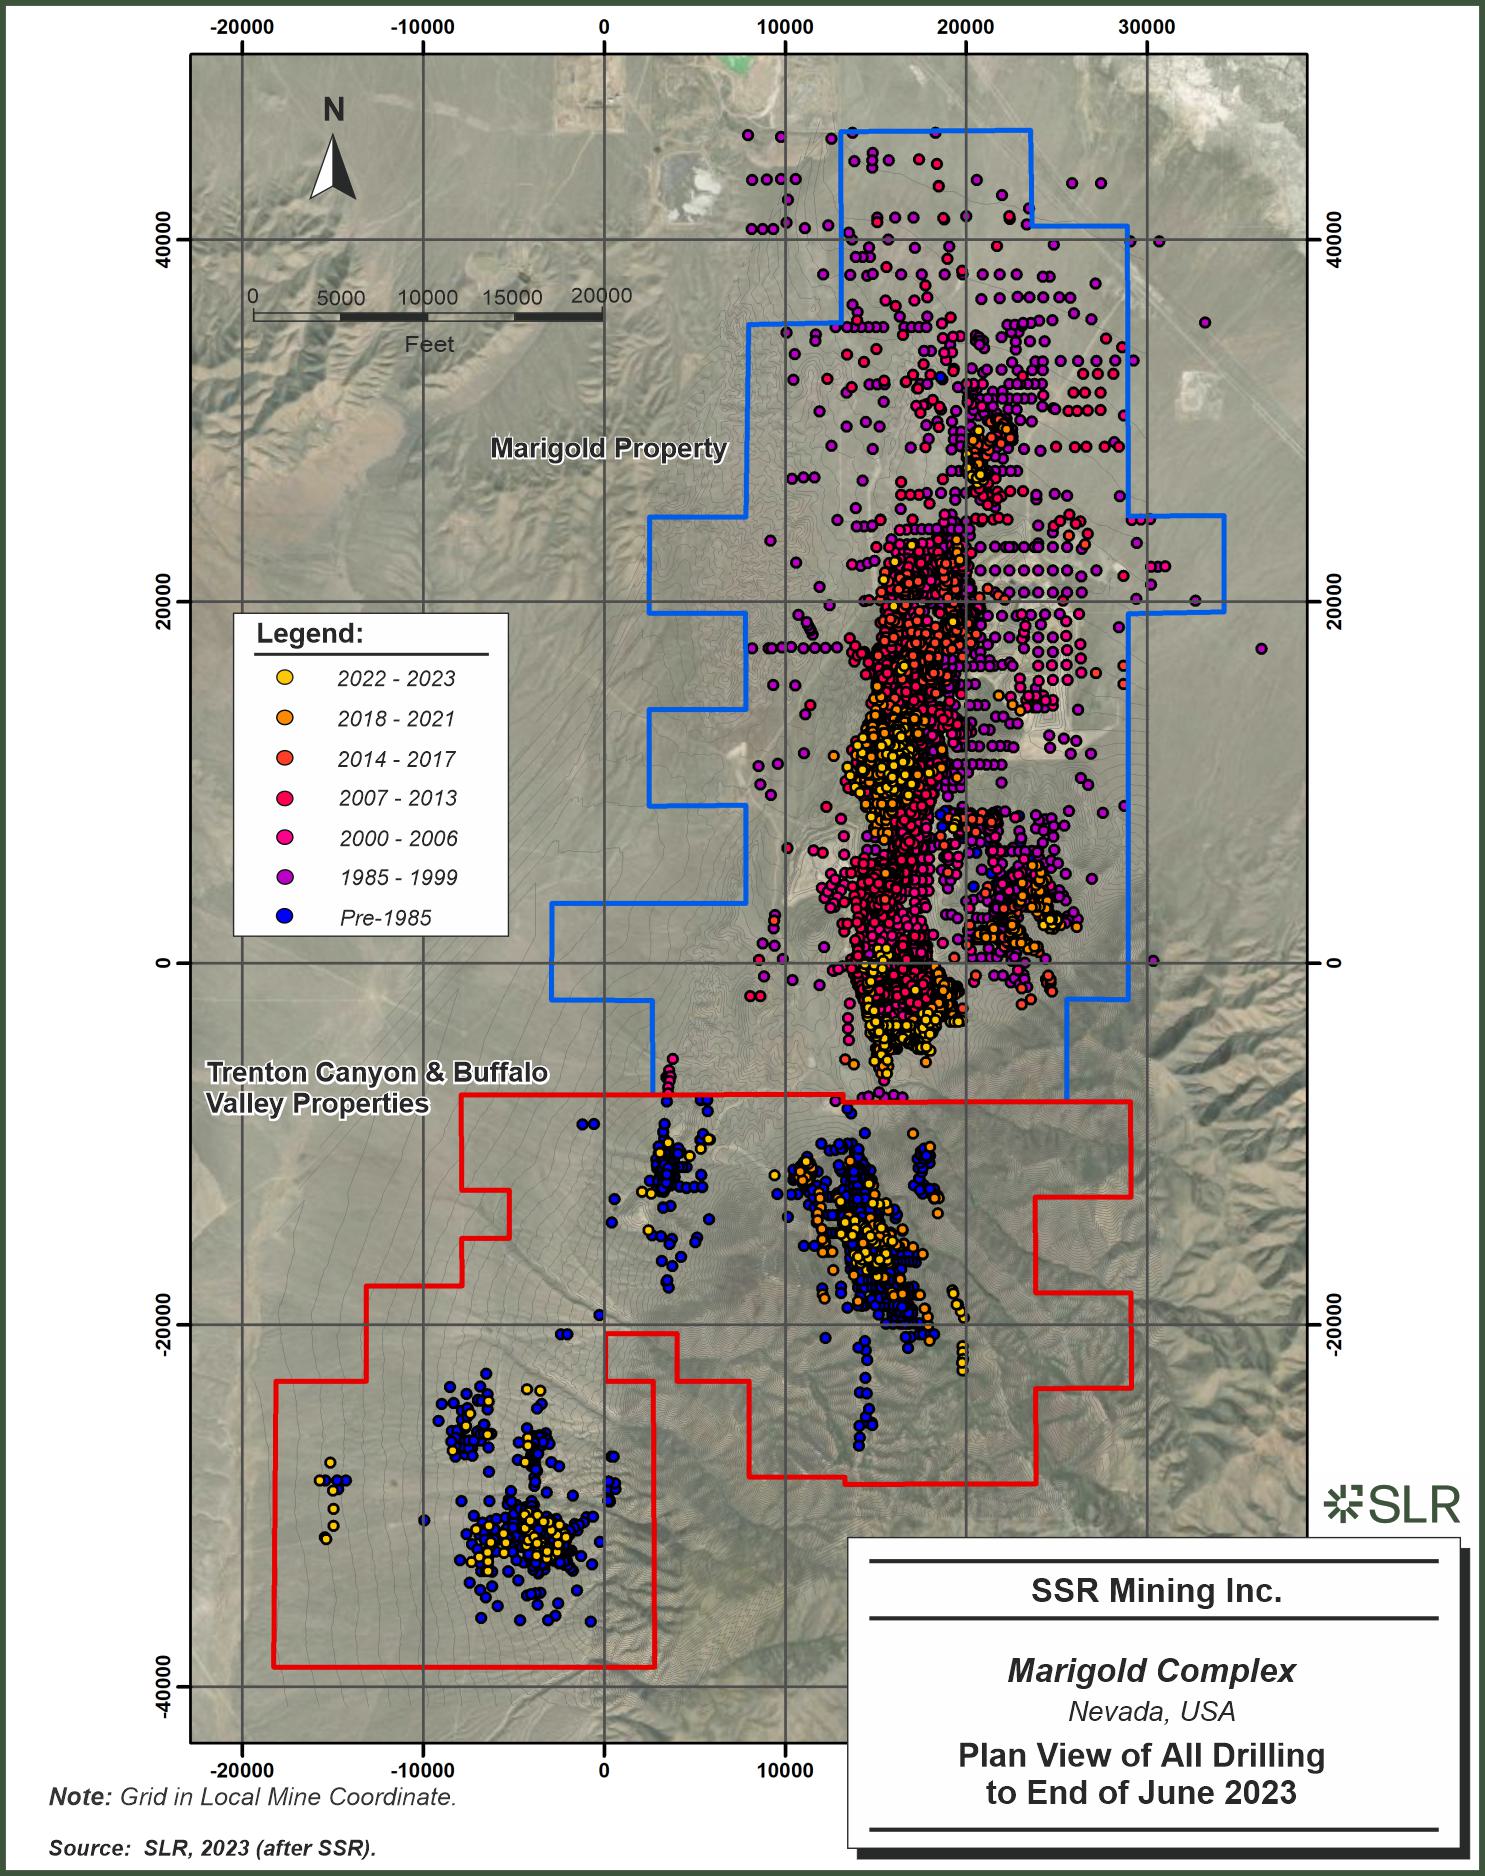
SSR Mining Inc. Marigold
Complex Nevada, USA Plan View of All Drilling to End of June 2023
| | 7-6 | |
| SSR Mining Inc. | Marigold Complex S-K 1300 Report | February 12, 2024 SLR Project No.: 138.21581.00002 |
The SLR QP is of the opinion that the drilling and sampling procedures
adopted at Marigold are consistent with generally recognized industry best practices. The resultant drilling pattern is sufficiently dense
to interpret the geometry and the boundaries of gold mineralization with confidence. The reverse circulation (RC) samples were collected
by trained personnel using procedures meeting generally accepted industry best practices. The process was conducted or supervised by suitably
qualified geologists.
The SLR QP is of the opinion that the samples are representative of
the source materials, and there is no evidence that the sampling process introduced a bias. Accordingly, there are no known sampling or
recovery factors that could materially impact the accuracy and reliability of drilling results.
| | 7-7 | |
| SSR Mining Inc. | Marigold Complex S-K 1300 Report | February 12, 2024 SLR Project No.: 138.21581.00002 |
| 8.0 | Sample Preparation, Analyses, and Security |
Exploration activities conducted by three companies between 1985 and
2013 have contributed to most of the assays in the Marigold database. Sampling and analytical procedures for this period are known and
documented, and it can be assumed that analytical information acquired prior to 1985 will not impact the current Mineral Resources because
sampled volumes collected prior to 1985 have been mined out.
Most of the samples that inform the resource database were generated
from RC drill cuttings. In general, the process for collecting RC samples has changed very little since 1985; however, over time, there
have been numerous improvements in sample preparation, security, and analysis. As an operating mine, Marigold generally followed and continues
to follow industry best practice standards.
At the Property, there is an extensive sample storage facility that
preserves the raw sample material that supports the resource database. Most of the laboratory pulp reject (since 1987), coarse reject
(since 2006), and split diamond drill core are catalogued and stored securely in shipping containers on the Property.
A detailed account of the pre-2014 sampling and analytical protocols
is described in SSR (2014). The following sections contained in this TRS have been derived, updated, and in some instances extracted from
documentation from OreWin (2022) and standard operating procedures (SOP) supplied to SLR by SSR for review and audit.
| 8.1 | Sample Preparation and Analysis |
A summary of historical analytical methods and assay results that comprise
the Marigold database is presented in Table 8-1. Except for the Marigold, Pinson, and Dee Mine site laboratories, all laboratories
listed in Table 8-1 are commercial laboratories that were independent from SSR.
Until the end of 1999, fire assay (FA) with gravimetric finish was the
preferred analytical method for determining gold in samples. Since then, all samples have been subjected to first-pass gold cyanide solution
(CN) assay; if results were greater than 0.17 g/t Au, samples were also subjected to either FA determination with gravimetric finish at
the on-site Marigold mine laboratory or FA with atomic absorption (AA) finish and FA with gravimetric finish for over-limits at commercial
laboratories.
All the Newmont-provided samples that inform the resource database for
the Valmy area were assayed at various commercial laboratories. The preferred assay method was FA with AA spectroscopy finish, followed
by gold cyanide solution assay on select samples within the mineralized zone.
Since 2014, all exploration samples from Marigold are analysed at American
Assay Laboratories (AAL), an ISO 17025 certified facility in Sparks, Nevada. AAL is independent from SSR. All samples are subjected to
first pass FA determination with an AA finish and FA with gravimetric finish for over-limits. This is followed by a gold cyanide solution
assay with an AA finish on samples that have FA values greater than or equal to 0.03 g/t Au. In 2019 and 2020 Marigold Mine submitted
drill samples to Paragon Geochemical Laboratories, a privately held corporation located in Sparks, Nevada. Analytical procedures utilized
are ISO/IEC 17025:2017 accredited and ISO 9001:2015 certified. Samples were prepared under strictly controlled processes, and 30g aliquots
fire assayed with lead collection. The analytical determinations were with aqua regia digestion and inductively coupled plasma (ICP) –
optical emission spectroscopy (OES) analysis (Au-OES30). Results greater than 8 g/t were fire assayed with gravimetric finish (Au-GR30).
Quality control utilizes layers of embedded indicators that are monitored during operations and used for final certification. Paragon
is independent of SSR.
| | 8-1 | |
| SSR Mining Inc. | Marigold Complex S-K 1300 Report | February 12, 2024 SLR Project No.: 138.21581.00002 |
Table 8-1: Analytical Methods
for Gold for the Marigold Assay Resource Database
| Period |
Laboratory |
Preparation |
Analytical Method |
Reported DL1 (Au g/t) |
| 1985–1989 |
Pinson or Dee Mine site labs |
Undocumented |
30 g FA, gravimetric finish |
0.17 |
| 1990–1999 |
Pinson or Dee Mine site labs or Inspectorate Labs |
Undocumented |
30 g FA, gravimetric finish |
0.17 |
| 1980-2010 (Buffalo Valley Historic) |
Multiple Laboratories |
Undocumented |
30 g FA, AA finish and/or 15 g CN assay on select samples |
Unknown |
| 1987–1998 (Valmy + Trenton Canyon) |
Barringer Laboratories |
Undocumented |
30 g FA, AA finish 15 g cyanide gold (CN) assay on select samples |
FA: 0.17
CN assay: 0.17 |
| X-Ray Assay Laboratories |
Undocumented |
30 g FA, gravimetric finish 15 g CN assay on select samples |
FA: 0.03
CN assay: 0.03 |
| Rocky Mountain Geochemical Nevada |
Undocumented |
30 g FA, gravimetric finish 15 g CN assay on select samples |
FA (AA): 0.03–0.003 CN assay: 0.03 |
| Chemex Labs Ltd. |
Undocumented |
15 g FA, AA finish 30 g FA, gravimetric finish 15 g CN assay on select samples |
FA (AA): 0.06–0.003 CN assay: 0.03 |
| 2000–2004 (Valmy + Trenton Canyon) |
Chemex Labs Ltd. |
Dry, crush and riffle split for pulverizing; pulverize to 100µ |
All samples 30 g FA, AA finish 15 g CN assay on select samples |
FA (AA): 0.01
CN assay: 0.03 |
| 2000–2006 |
Marigold Mine laboratory |
Dry 6–12 hrs at 310°F; crush >95% –2 mm; riffle split to collect 250 g – 400 g for pulverizing; pulverize to >90% –75µ |
All samples 10 g CN assay, AA finish If CN assay >0.17 g/t, the 2nd pulp split at 30 g FA, gravimetric finish |
0.03 |
| American Assay or Inspectorate Labs |
Dry 6–12 hrs at 310°F; crush (using jaw and roll) >90% –2 mm; riffle split to collect 500–1,000 g for pulverizing; pulverize to >90% –100µ |
All samples 15 g CN assay, AA finish If CN assay >0.17 g/t, the 2nd pulp split at 30 g FA, AA finish over-limits by 30 g FA, gravimetric finish |
0.03 |
| | 8-2 | |
| SSR Mining Inc. | Marigold Complex S-K 1300 Report | February 12, 2024 SLR Project No.: 138.21581.00002 |
| Period |
Laboratory |
Preparation |
Analytical Method |
Reported DL1 (Au g/t) |
| 2006–2013 |
Marigold Mine laboratory |
Dry 6–12 hrs at 310°F; crush >95% –2 mm; riffle split to collect 250 g – 400 g for pulverizing; pulverize to >90% –75µ |
All samples 10 g CN assay, AA finish If CN assay >0.17 g/t, the 2nd pulp split at 30 g FA, gravimetric finish |
0.03 |
| American Assay or Inspectorate Labs |
Dry 6–12 hrs at 310°F; crush (using jaw and roll) >90% –2 mm; riffle split to collect 500 g –1,000 g for pulverizing; pulverize to >90% –100µ |
All samples 15 g CN assay, AA finish If CN assay >0.17 g/t the 2nd pulp split at 30 g FA, AA finish over-limits by 30 g FA, gravimetric finish |
0.03 |
| 2014–2023 |
American Assay Laboratories |
Dry 6–12 hrs at 310°F; crush (using jaw and roll) >90% –2 mm; riffle split to collect 500 g – 1,000 g for pulverizing; pulverize to >90% –100µ |
All samples 30 g FA, AA finish over-limits by 30 g FA, gravimetric finish If FA >0.03 g/t, the 2nd pulp split at 15 g CN assay, AA finish |
FA: 0.003
CN assay: 0.03 |
| Marigold Mine laboratory |
Dry 6–12 hrs at 310°F; crush >95% to –2 mm; riffle split to collect 250 g to 400 g for pulverizing; pulverize to >80% –74µm |
All samples 10 g CN assay, AA finish If CN assay >0.17 g/t, the 2nd pulp split at 30 g FA, gravimetric finish |
0.03 |
| 2019-2020 |
Paragon Laboratories |
Dry – 6 to 12 hrs at 310°F; crush (using jaw and roll) >90% minus 2 mm; riffle split to collect 500 g to 1,000 g for pulverizing; pulverize to >85% minus 75µ |
All samples 30 g FA, AA finish Over-limits by 30 g FA, gravimetric finish If FA >0.03 g/t, the 2nd pulp split at 15 g CN assay, AA finish |
FA, 0.003 CN assay, 0.03 |
Notes:
| | 8-3 | |
| SSR Mining Inc. | Marigold Complex S-K 1300 Report | February 12, 2024 SLR Project No.: 138.21581.00002 |
| 8.2 | Quality Assurance and Quality Control |
Quality assurance (QA) consists of evidence to demonstrate that the
assay data has precision and accuracy within generally accepted limits for the sampling and analytical method(s) used in order to have
confidence in a resource estimate. Quality control (QC) consists of procedures used to ensure that an adequate level of quality is maintained
in the process of collecting, preparing, and assaying the exploration drilling samples. In general, QA/QC programs are designed to prevent
or detect contamination and allow assaying (analytical), precision (repeatability), and accuracy to be quantified. In addition, a QA/QC
program can disclose the overall sampling-assaying variability of the sampling method itself.
| 8.2.1 | QA/QC Procedures Pre-2014 |
| 8.2.1.1 | Historical Marigold Assay – Analysis of Low Detection Limit |
The oldest hole in the Marigold exploration database is from 1968. Over
time, QA procedures for the drill hole database have been inconsistent with current industry standards and best practices.
There have been changes in the lower detection limit for cyanide soluble
gold assays over time as the ROM cut-off grade has been reduced. Prior to 2009, assay values below detection were entered into the database
as 0.0 oz/t. This data artefact was under-representing the mineralized volume of the Mineral Resources estimate at the low-grade range
of the analytical distribution and contributing to the positive reconciliation experienced at Marigold.
Because the historical QA/QC procedures at Marigold did not meet current-day
best practices, the issue of below-detection-limit analyses in the database was addressed through a systematic assay program implemented
by SSR in 2015 and 2016 (the Assay Program). SSR selected a spatial and temporal representation of samples from the well-preserved drill
hole sample pulps (from the years 1987 to 2013) stored at Marigold. A total of 1,974 samples collected between 1987 and 2003 were re-assayed
for FA with AA finish and gravimetric finish analysis at the ISO 17025 certified AAL facility in Sparks, Nevada. Drill hole sample pulp
material was not available for the period 1968 to 1987.
Of these 1,974 assay pairs, 1,029 samples were below the as-mined topography
and within the mineralized envelopes. This represents 12% of samples that are within the mineralized envelope and below the mined-out
topography that had been previously estimated as 0.0 opt or deemed as waste. The assay results for both the finishes were compared, and
results are presented in Figure 8-1 and Figure 8-2. The scatter shown in the data is acceptable (R2 = 0.9982), and the reduced
major axis (RMA) regression indicates a bias of 3.7% for all the assay pairs that are below the mined-out topography.
| | 8-4 | |
| SSR Mining Inc. | Marigold Complex S-K 1300 Report | February 12, 2024 SLR Project No.: 138.21581.00002 |
Figure 8-1: Scatter Plot Between
FA Gold Values with AA Finish and Gravimetric Finish
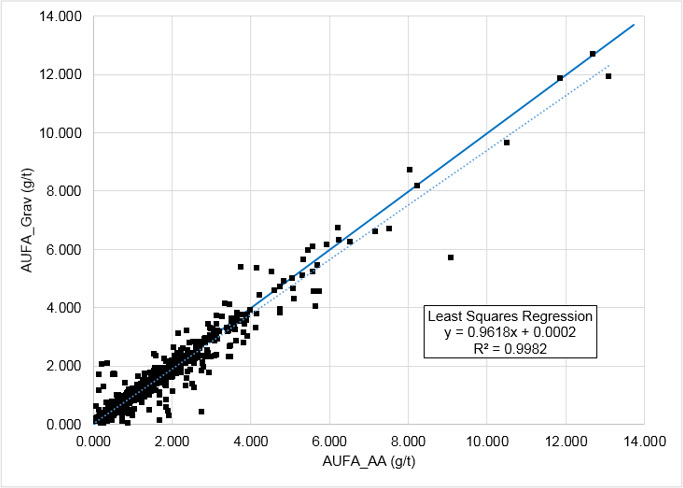
Source: SSR, 2023
Figure 8-2: Q-Q Plot between
FA Gold Values with AA Finish and Gravimetric Finish
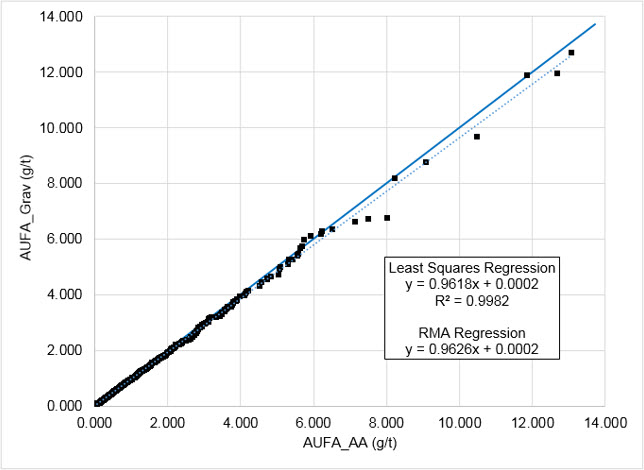
Source: SSR, 2023
| | 8-5 | |
| SSR Mining Inc. | Marigold Complex S-K 1300 Report | February 12, 2024 SLR Project No.: 138.21581.00002 |
Between 2015 and 2016, an Assay Program was carried out in which a total
of 153,023 pulp samples from pre-2009 drill holes reporting a 0.0 opt gold cyanide soluble result and located within the reserve pits
were recovered from storage and analysed for gold at AAL. Certified standards and blanks were inserted into the pulp sample list at a
rate of one standard in 20 samples and one blank in 50 samples. The samples were analysed using aone assay ton (30 g) FA with an AA finish,
followed by a gold cyanide solution assay with an AA finish for those samples that returned FA results of 0.03 g/t or greater.
As at Marigold, the QA/QC procedures followed between 1987 and 1998
at the Valmy property did not meet the current day industry standards and best practices. Newmont began inserting certified standards
in the sample stream in 2000. A total of three QC samples were used, but SSR was unable to evaluate the assay accuracy without the expected
gold values for these samples.
Because the historical QA/QC procedures for the Valmy property did not
meet current day industry standards, SSR drilled eight drill holes within a resource block of 200 m by 150 m. A total of 11 historical
drill holes were within the same block. The cross section comparing the SSR drilling to the historical drilling is presented in Figure
8-3.
The cumulative normal distribution comparing the SSR drill composites
to the composite from the historical drill holes is provided in Figure 8-4.
| | 8-6 | |
| SSR Mining Inc. | Marigold Complex S-K 1300 Report | February 12, 2024 SLR Project No.: 138.21581.00002 |
Figure 8-3: Cross-Section with
SSR Drill Holes and Historical Drill Holes Along Section 8000N
SSR
Mining Inc. Marigold Complex Nevada, USA Cross Section with SSR Drill Holes and Historical Drill Holes along Section 8000N
| | 8-7 | |
| SSR Mining Inc. | Marigold Complex S-K 1300 Report | February 12, 2024 SLR Project No.: 138.21581.00002 |
Figure 8-4: Cumulative Normal
Distribution Comparing Composites from SSR Drilling and Historical Drilling
Source: SSR, 2018
The nearest neighbour (NN) gold grade model estimates were also compared
to the assay results from historical drilling and the new drilling. To compare historical Newmont data to SSR data, two NN models were
developed: one estimate used only assay results from the historical database; and a second estimate used only the assay results from the
SSR drill holes within the same mineralized envelope. The percentage difference between historical and SSR results was approximately less
than 4% (Table 8-2).
Table 8-2: Comparison of Valmy
Deposit NN Mean Gold Grades
| Estimate |
Mean Gold Grade
(g/t) |
| Nearest Neighbour with Historical Composites |
0.624 |
| Nearest Neighbour with SSR Composites |
0.600 |
SSR concluded that there was no systematic error or bias in the accuracy
and precision of analytical assays in the historical sampling and assaying methodology when compared to current practices and the assays
are suitable for use in Mineral Resource estimation.
| 8.2.1.3 | Buffalo Valley Historical Data |
In 2011, before SSR’s acquisition of the Buffalo Valley property,
AMEC Americas Ltd. (AMEC) conducted an audit of Newmont’s Buffalo Valley drill hole database and found good agreement between the
database and the original data sources. The database was comprised of data from numerous drilling campaigns between the years of 1980
to 2011, with drill holes from multiple campaigns selected for the audit. The drill hole data from Newmont was directly imported into
SSR’s new Seequent MX Deposit (MX Deposit) database.
| | 8-8 | |
| SSR Mining Inc. | Marigold Complex S-K 1300 Report | February 12, 2024 SLR Project No.: 138.21581.00002 |
| 8.2.2 | QA/QC Procedures 2014-2023 |
SSR’s QA/QC protocol involves the insertion of a certified reference
material standards (CRM) every 20th sample, the insertion of a blank sample every 50th sample, the collection of
field duplicates every 50th sample for RC holes and the re-analysis of returned pulverized material at the original laboratory,
as well as at an umpire laboratory. SSR’s protocol targets the total number of QA/QC samples, comprised of the above-mentioned sample
types, to exceed 15% of the total number of original samples. For simplification of plotting, results from 2014-2017 have been excluded
in the following sections.
| 8.2.2.1 | Certified Standards |
Results of the regular submission of CRMs are used to identify issues
with specific sample batches, and biases associated with the laboratory.
Certified reference material (CRM) standards were used to evaluate the
analytical accuracy and precision of AAL. CRMs were inserted every 20th sample, which represents 5% of the total samples submitted.
Three different CRMs were used in any one submission. The CRMs were selected based on the cut-off grade and gold distribution at Marigold
mine:
| · | 90th percentile (2.3 g/t) |
Between 2018 and June 2023, eleven different CRMs, purchased from ROCKLABS
and Geo Chem Laboratories, were used. CRMs purchased from Ore Research & Exploration Pty Ltd. Were only used in 2014 for a short period
of time. The CRMs were assigned sample numbers in sequence with their accompanying drill samples and inserted into the drill-sample stream.
The list of CRMs used between 2018 and June 2023 is shown in Table 8-3.
Exploration personnel monitor the assay results on a real-time basis
and import the data into the Geology database. Internal validation checks in the database highlight any certified standard assay failures.
In the case of normally distributed data, 95% of the standard assay results are expected to lie within two standard-deviation limits of
the certified value. All samples outside the three standard-deviation limits were considered to be failures. Failures trigger a re-run
of five samples above and five samples below the failed standards, including the failed standard.
Table 8-3: List of CRM Standards
used between 2018 and June 2023
| CRM Standard |
Years in Use |
Expected Gold Value (g/t) |
Standard Deviation (g/t) |
No. of Samples Assayed |
| HiSilk2 |
2019-2022 |
3.474 |
0.087 |
869 |
| OxB130 |
2018-2023 |
0.123 |
0.006 |
4,256 |
| OxB146 |
2019-2023 |
0.132 |
0.006 |
943 |
| OxB186 |
2023 |
0.121 |
0.003 |
73 |
| OxD128 |
2018 |
0.425 |
0.0109 |
23 |
| OxD144 |
2018-2020 |
0.417 |
0.009 |
1,325 |
| OxD151 |
2019-2021 |
0.43 |
0.009 |
1,632 |
| | 8-9 | |
| SSR Mining Inc. | Marigold Complex S-K 1300 Report | February 12, 2024 SLR Project No.: 138.21581.00002 |
| CRM Standard |
Years in Use |
Expected Gold Value (g/t) |
Standard Deviation (g/t) |
No. of Samples Assayed |
| OxD167 |
2020-2022 |
0.462 |
0.014 |
1,138 |
| OxE166 |
2019, 2022-2023 |
0.652 |
0.016 |
516 |
| Oxi164 |
2019, 2022-2023 |
1.79 |
0.036 |
965 |
| OxJ120 |
2018-2019, 2022 |
2.365 |
0.063 |
1,446 |
| OxJ137 |
2019-2020 |
2.416 |
0.069 |
869 |
| OxJ161 |
2021-2022 |
2.501 |
0.0549 |
430 |
| SG84 |
2019-2020 |
1.026 |
0.025 |
207 |
CRM Z-score assay values received from the lab are routinely plotted
temporally to monitor potential analytical drift over time at the main laboratory (Figure 8-5).
Figure 8-5: Z-Scores of all
CRM Results (2018 – June 2023)
Source: SSR, 2023
| | 8-10 | |
| SSR Mining Inc. | Marigold Complex S-K 1300 Report | February 12, 2024 SLR Project No.: 138.21581.00002 |
Duplicate samples are used to monitor preparation, assay precision,
and grade variability as a function of sample homogeneity and laboratory error.
Field duplicate samples were collected every 50th sample,
and two sample bags marked “A” or “B” were provided to collect an original and a duplicate sample. The secondary
sample was obtained from the secondary opening in the rotary sampler. Between 2022 and June 2023, 1,425 duplicate samples were collected
and assayed. Absolute relative difference (ARD) was used to estimate precision; results are presented in Figure 8-6.
Figure 8-6: Field Duplicate
HARD Plot for Fire Assay (AuFA) and Cyanide Soluble (AUCN) Analyses. Inset QQ Plot of Original vs. Duplicate Results.
Notes:
| 1. | Fire assay gold grade (AuFA), cyanide soluble gold grade (AuCN) |
Source: SSR, 2023
Blank material is used to assess contamination or sample-cross contamination
during sample preparation and to identify sample numbering errors.
| | 8-11 | |
| SSR Mining Inc. | Marigold Complex S-K 1300 Report | February 12, 2024 SLR Project No.: 138.21581.00002 |
The size of the blanks was similar to the size of the RC samples, and
they were processed through the same crushing and pulverizing stages as the drill samples. The blank samples were placed one in every
50 samples. Blank results that were greater than 5 times the lower detection limit (LDL) were typically considered failures that required
further investigation and possible re-assaying of associated drill samples. The lower detection limit of AAL analyses is 0.0034 g/t, therefore
blank samples assaying in excess of 0.017 g/t were considered to be failures.
Between January 2018 and June 2023, 1,663 blanks were inserted into
the sample stream, with less than 1% resulting in failures. The protocol followed for failures was to re-prepare and assay five samples
above and below the failures. The new assays were entered into the database for the samples. The assay results for the blank samples between
January 2018 and June 2023, are shown in Figure 8-7.
Figure 8-7: Blank Results (January
2018 – June 2023)
Source: SSR, 2023.
The total number of field duplicates and blank samples included for
assay is provided in Table 8-4).
Table 8-4: Number of Blanks
and Field Duplicates
| Year |
Number of Blanks Sent |
Number of Field Duplicates Sent |
| 2018 |
1,103 |
1,103 |
| 2019 |
1,240 |
986 |
| 2020 |
780 |
787 |
| 2021 |
902 |
899 |
| 2022 |
1,201 |
1,062 |
| 2023 |
549 |
490 |
| | 8-12 | |
| SSR Mining Inc. | Marigold Complex S-K 1300 Report | February 12, 2024 SLR Project No.: 138.21581.00002 |
| 8.2.2.4 | Re-Assay and Umpire Samples |
After completing original assays/analysis, the primary laboratory returns
coarse rejects and pulverized material to Marigold for storage. From the pulverized material, analytical duplicates are selected to have
a re-assay (original lab), umpire assay (second lab), or both completed. Samples are selected based on their original grade, such that
the secondary assay results form a distribution representative of the grades seen at Marigold. Re-assays are sent back to the same laboratory
that conducted the original assay and are used to monitor precision attributable to the analytical process. In the period since OreWin
(2022), re-assays were completed by American Assay Laboratories whereas ALS was utilized for umpire analysis.
Figure 8-8 shows a HARD plot for the re-assay samples for the period
of October 2022 through June 2023.
Umpire samples are sent to monitor any calibration differences between
the main and umpire labs. Figure 8-9 shows are HARD plot for umpire assays for the period of October 2022 through June 2023.
Figure 8-8: Re-Assay Analytical
Duplicate HARD Plot for Fire Assay (AuFA) and Cyanide Soluble (AUCN) Analyses. Inset QQ Plot of Original vs. Umpire Results
Source: SSR, 2023.
| | 8-13 | |
| SSR Mining Inc. | Marigold Complex S-K 1300 Report | February 12, 2024 SLR Project No.: 138.21581.00002 |
Figure 8-9: Umpire Analytical
Duplicate HARD Plot for Fire Assay (AuFA) and Cyanide Soluble (AUCN) Analyses. Inset QQ Plot of Original vs. Umpire Results
Source: SSR, 2023.
| 8.3.1 | Sample Security until 2013 |
The bulk of the data in the Marigold resource assay database was for
samples analysed at the secure on-site Marigold mine laboratory. Samples shipped off site were either delivered to the commercial lab
by an MMC Exploration Department geologist or technician, or samples were collected from the mine by a laboratory employee. All samples
were sent with a manifest listing the number of samples included in the shipment. Exploration personnel were unaware of any instances
of tampering with samples either on site or in transit to a laboratory.
| 8.3.2 | Sample Security Newmont Projects |
Newmont provided scanned copies of driller’s logs, sample manifest
sheets, and signed assay sheets from commercial laboratories and geologist logging sheets for all the drill holes that inform the resource
database for the Valmy and Buffalo Valley properties. Based on the documented evidence, the likelihood of tampering with the samples either
on site or in transit were negligible.
| | 8-14 | |
| SSR Mining Inc. | Marigold Complex S-K 1300 Report | February 12, 2024 SLR Project No.: 138.21581.00002 |
| 8.3.3 | Sample Security 2014–2023 |
All exploration samples were collected from the mine site by employees
of the external laboratories (either AAL or Paragon). All sample dispatches included a manifest listing the sample identifiers and number
of samples included in the shipment. AAL/Paragon electronically acknowledged the receipt of the samples within 24 hours after physically
reconciling the samples with the manifest. SSR exploration personnel are unaware of any instances of tampering with samples either on
site or in transit to a laboratory.
After reviewing, it is the SLR QP’s opinion, the sample preparation,
security, and analytical procedures meet industry standards, and the QA/QC program, as designed and implemented at Marigold are in line
with industry best practices. Based on the data validation and the results of the standard, blank, and duplicate analyses, SLR believes
that the assay and bulk density databases are of ample quality and suitable for mineral resource estimation purposes. SLR is not aware
of any drilling, sampling, or recovery factors that could materially impact the accuracy and reliability of the results. Neither the SSR
in-house quality control nor SSR predecessor’s quality control yielded any indication of quality concerns.
| | 8-15 | |
| SSR Mining Inc. | Marigold Complex S-K 1300 Report | February 12, 2024 SLR Project No.: 138.21581.00002 |
Data verification is the process of confirming that data has been generated
with proper procedures, is transcribed accurately from its original source into the project database and is suitable for use as described
in this TRS.
SLR was not directly involved in the exploration drilling, logging,
and sampling programs that formed the basis for collecting the data used to support the geological model and MRE for the Property.
| 9.1 | Marigold Database Migration |
Since publishing the previous TRS (OreWin, 2022), all drill hole data
has been migrated to an MX Deposit database and audited by the SLR QP for completeness and validity. Migrated data were validated extensively
by SSR for any errors or missing values by comparing old tables to the new. The new database was configured to streamline the collection,
validation, and use of all data to maximize efficiency and minimize errors by limiting data handling and manual entry.
All new drill hole data collected after the migration, with the exception
of lithology logging, were imported directly into the geological database without any keyboard input. Data validation was conducted after
import, but before the locking and subsequent use of the data in any model, analysis, interpretation, etc. Geologic logging is done directly
into the database, with validation of the data being done on a weekly basis.
The verification for the exploration data collected before SSR acquired
Marigold includes the results of AMEC Americas Ltd.’s external review and data verification to identify any material issues with
the database used to generate the Mineral Resource estimate.
SSR subsequently acquired the adjacent Valmy and Buffalo Valley properties,
and the associated data was appended to the Marigold drill hole database.
The appended data for Valmy comprises collar, downhole survey, lithology,
and assay information (provided in comma delimited digital files) for 867 drill holes drilled by Newmont, Hecla, and Santa Fe Pacific
Corp. Newmont provided this information in hardcopy or scanned versions of the originals which were used to verify the database.
MMC’s exploration personnel manually checked the entire drill
hole database against the original documents for data entry errors. Less than 1% of the drill holes had any issues, and these were subsequently
corrected.
As an additional check, SSR acquired the chip trays for 687 drill holes,
pulps from 57 drill holes, and sample rejects from 66 drill holes, of which 5% were reviewed for lithology and alteration. The original
logging was deemed accurate and was used to construct the lithological models.
The collar positions of 43 Valmy drill holes were verified using differentially
corrected GPS methods. Subsequent to AMEC’s 2011 audit of the Buffalo Valley drilling database, SSR verified the collar location
of eight holes drilled by Newmont and one hole drilled by Fairmile that included a drill hole identification marker in the field. The
results showed a maximum variance of 4 m in the X/Y planes (easting and northing) and <1 m in the Z dimension (elevation). This error-shift
is less than half the size of a resource model cell and is not material to any resulting estimate. The Valmy and Buffalo Valley data,
as appended, was deemed accurate and precise, and appropriate for resource estimation purposes.
For data collected after April 2014, the following verification steps
were completed to support the estimation of Mineral Resources:
| | 9-1 | |
| SSR Mining Inc. | Marigold Complex S-K 1300 Report | February 12, 2024 SLR Project No.: 138.21581.00002 |
| · | The location of planned drill holes was compared to the location of as-built drill holes in real time. Regular field checks were completed
on drill and sampling systems. |
| · | Downhole survey intervals that encountered major deviations were reviewed and validated (AMEC, 2014). |
| · | Precision and accuracy of laboratory assay results were verified using a QA/QC program that followed an industry standard protocol
using the blind insertion of blanks and certified standards. |
| · | The elevation of all surveyed drill hole collar coordinates was checked against the original/current/depleted topographic surface
to identify any variations of more than one metre. No discrepancies were found. |
| · | Profiles of all mined-out pits, backfilled pits, and WRSA were cross checked, updated annually, and incorporated into the current
topography. |
Assay results for all drill holes are individually plotted and examined
for cyclicity and decay, which are forms of downhole contamination. Any hole that has confirmed contamination will have the contaminated
samples removed from any form of resource estimation.
| 9.1.1 | Data Verification Procedures |
SLR was provided with a digital drill hole database for the Property
in a series of Microsoft Excel comma delimited files (“CSV” format) and Seequent Leapfrog GEO digital files. The SLR QP used
the information provided to validate the Mineral Resource interpolation, tonnage, grade, and classification.
As part of the data verification procedure, drill data was spot checked
and audited by the SLR QP for completeness and validity using standard database validation tests. In addition, the SLR QP reviewed the
QA/QC methods and results, verified assay certificates against the database assay table, and completed one site visit that included a
review of drill core. No limitations were placed on SLR’s data verification process. The review of the QA/QC program and results
is presented in Section 8.0, Sample Preparation, Analyses and Security.
The SLR QP performed the following digital queries. No significant issues
were identified.
| · | Header table: searched for incorrect or duplicate collar coordinates and duplicate hole IDs. |
| · | Survey table: searched for duplicate entries, survey points past the specified maximum depth in the collar table, and abnormal dips
and azimuths. |
| · | Core recovery table: searched for core recoveries greater than 100% or less than 80%, overlapping intervals, missing collar data,
negative lengths, and data points past the specified maximum depth in the collar table. |
| · | Lithology: searched for duplicate entries, intervals past the specified maximum depth in the collar table, overlapping intervals,
negative lengths, missing collar data, missing intervals, and incorrect logging codes. |
The SLR QP was provided unlimited access for data verification purposes
by SSR during this Mineral Resource estimate audit. The SLR QP is of the opinion that database verification procedures for Marigold comply
with industry standards and are adequate for the purposes of Mineral Resource estimation.
| | 9-2 | |
| SSR Mining Inc. | Marigold Complex S-K 1300 Report | February 12, 2024 SLR Project No.: 138.21581.00002 |
| 10.0 | Mineral Processing and Metallurgical Testing |
When production began at Marigold in 1989, ore was processed primarily
with a rod-and-ball-mill grinding circuit with gold recovery by carbon-in-leach (CIL). In March 1990, heap leaching commenced at Marigold.
Since April 1999, all Marigold ore deposits have been processed via truck dump ROM heap leaching.
Cumulative gold production from the Marigold leach pad through June
2023 is equivalent to 70.6% recovery, and total gold recovery, including recoverable gold inventory in the pad, is estimated at 74%.
Gold production data from the leach pad operation provides the best
information for predicting future processing recoveries because the ore type has been consistent since 1999. Gold recovery from future
ore is estimated to be 74% based on a review of historical assay and recovery data as well as metallurgical test work on future ore.
| 10.1 | Marigold Metallurgical Test Work |
The objectives of metallurgical testing activities at Marigold are to
determine methods to improve gold recovery, to generate information to guide short and long-range production planning, to optimize reagent
additions, and to minimize processing costs. The studies comprise both small column leach (25.4 cm diameter by 1.2 m high, with
minus 51 mm ore) and standard bottle roll leach tests. Testing has been performed on a variety of Marigold ores, including representative
pit samples taken by ore-control geologists, leach pad grab samples from mine production, and various pit blasthole drill cuttings. Bottle
roll test work has also been conducted on exploration RC drill samples to determine expected gold recovery from deposits that will be
mined in the future.
Historical gold recovery versus gold grade results for all laboratory
column tests are shown in Figure 10-1. In addition to column leach tests, bottle roll tests were also completed on the same samples
to develop a correlation between column and bottle roll results. The relationship is shown in Figure 10-2. The use of bottle roll
tests in place of column leach tests enables more metallurgical tests to be undertaken in a shorter time frame (i.e., days for bottle
rolls versus months for columns).
| | 10-1 | |
| SSR Mining Inc. | Marigold Complex S-K 1300 Report | February 12, 2024 SLR Project No.: 138.21581.00002 |
Figure 10-1: Column Test Results
– Marigold
Source: SSR, 2023
Figure 10-2: Bottle Roll vs.
Column Recovery – Marigold
Source: SSR, 2023
| | 10-2 | |
| SSR Mining Inc. | Marigold Complex S-K 1300 Report | February 12, 2024 SLR Project No.: 138.21581.00002 |
| 10.1.1 | Marigold Process Optimization Metallurgical Test Work |
Additional test work, such as permeability testing, reagent dosage,
solution application rate, and carbon activity, is conducted to optimise the processing variables that are controllable on a large heap
leach pad and plant.
Permeability testing has been performed on ore samples with varying
fines content. The testing simulated compaction under multiple lifts of ore stacked up to 200 m. Overall, the blends tested demonstrated
relatively consistent permeability on increasing loads. Flow rates for the blends ranged from 178.8 L/h/m2 to 284.2 L/h/m2
under no load. Under 122 m effective height loading, flow rates ranged from 34.4 L/h/m2 up to 188 L/h/m2. All tests
resulted in low, but acceptable permeabilities.
| 10.1.2 | Marigold Gold Recovery Modeling |
Marigold uses two assay methods: fire assay that measures the total
gold in a sample and a second method known as ‘cyanide soluble gold’. The latter technique generates a value that represents
the head grade of the ore in terms of the amount of gold in a finely ground sample that can be dissolved by a strong sodium cyanide solution,
or the maximum cyanide soluble gold content.
All Marigold blasthole samples are assayed for cyanide soluble gold.
Samples from each ore polygon delineated by ore control are selected for fire assay based on the grade distribution for the polygon tonnage
and targeting a minimum of one sample per every 1,814 t (2,000 st) of ore. Therefore, some samples have two assay values: an AuCN (cyanide
soluble) value and an AuFA (fire assayed) value. The ratio of AuCN to AuFA provides the theoretical maximum gold recovery that can be
achieved.
For example, if the AuFA ore grade is 0.10 g/t, and the AuCN ore
grade is 0.08 g/t, the ratio is 0.008/0.010 = 0.80. This indicates that the maximum gold recovery using cyanide leaching from this
ore sample is 80%.
Test work has demonstrated that, generally, all ore at Marigold behaves
similarly. The ratio of AuCN/AuFA is an important characteristic determined for each ore block.
The most recent assessment of the predicted recovery for Marigold ore
was conducted in 2017. The 2017 exploration database contains approximately 155,000 pairs of fire assays (field AUFA in the database)
and cyanide soluble assays (field AUAA in the database). These assay pairs represent all the mine ore types. On an individual ore block
basis, the ratio AuCN/AuFA includes all the local geological variables for that ore block (rock type, degree of oxidation, head grade,
etc.). The result is the best estimate of maximum recovery. Figure 10-3 shows AuFA plotted against AuCN for all data pairs through
2017.
A best-fit linear regression shows the AuCN/AuFA ratio is 0.80.
The LOM actual leach pad recovery, based on ounces poured, is 74% (including
in-process gold inventory) through June 2023.
An adjustment factor can be calculated using the chemical maximum AuCN/AuFA
recovery and the actual pad recovery:
Actual: 74% / Chemical: 80% = 0.92
Therefore, the estimated recovery from the ROM heap leach can be expressed
as:
Heap Leach Recovery = AuCN / AuFA x 0.92
| | 10-3 | |
| SSR Mining Inc. | Marigold Complex S-K 1300 Report | February 12, 2024 SLR Project No.: 138.21581.00002 |
Figure 10-3: Exploration Database
(2017) AuCN vs AuFA – All Data
Source: SSR, 2018
| 10.1.3 | Marigold Preg-Rob Test Program |
Preg-robbing is the loss of leached gold cyanide complex from solution
by adsorption onto natural carbon contained in the ore. Current control measures to mitigate preg-rob material issues on the heap leach
pad include blasthole analysis and logging, training of shovel operators to identify black rock (preg-rob material), and ore control routing
for segregation of material on the pad. A study is being conducted to assist with further understanding preg-rob material in the Marigold
ore bodies with respect to evaluating current test procedures and the correlation to both time and particle size. This study includes
the standardized preg-rob procedure conducted in the Marigold Analytical Lab, coarse bottle rolls, and a column test with samples containing
preg-robbing material.
One of the objectives of this study is to assess whether the placement
of preg-robbing material on the Marigold heap leach facility is being adequately accounted for in the current AuCN/AuFA ratio and ore
control practices. If it is found that preg-robbing material is not being accounted for, then it will be necessary to assess what additional
factors may need to be applied to the metallurgical recovery equation.
The study work program includes the following test work:
| · | Standard preg-rob test with extended leaching times and increased gold spike concentrations. |
| · | Standard bottle roll procedure using a coarser particle size sample with the addition of goldspike to mirror the laboratory SOP for
preg-rob. |
| | 10-4 | |
| SSR Mining Inc. | Marigold Complex S-K 1300 Report | February 12, 2024 SLR Project No.: 138.21581.00002 |
| · | Standard column procedure with addition of gold spike in barren solution. |
| 10.1.4 | Marigold Summary and Recommendations |
Marigold ore types behave similarly based on metallurgical test work
and operating performance. To predict future gold recovery, it is recommended that the following studies and work be undertaken:
| · | Regular assessment of the AuCN/AuFA ratio using updated exploration and blast hole data. |
| · | Ongoing column and bottle roll metallurgical tests on heap leach feed composites to determine maximum possible gold recovery. |
| · | Metallurgical test work on any future ore sources to develop geometallurgical properties and parameters. |
| · | Further studies and assessment of heap leach recoverable Au inventory. |
| 10.2 | Buffalo Valley Metallurgical Test Work |
| 10.2.1 | Historical Test Work |
The Buffalo Valley deposit consists of a sequence of siltstone, limestone,
and greenstone rocks that are a part of the Havallah Formation, which has several tertiary-age, nearly vertical intrusions. Two of these
intrusives align with the historical pit. Mineralization is spread out among the various lithologies but is associated with the main intrusives
and faulting. The deposit is deeply oxidized, down to 244 m in places, and again associated with faulting and intrusives.
Significant prior metallurgical test work was performed by Newmont on
the Buffalo Valley deposit. A total of 53 composites were analyzed for gold-cyanide amenability in columns, bottle roll, and gravity processes.
Substantial free gold was seen in most tests but required fine-grinding in order to liberate the gold particles. There was also a large
correlation between crush size and gold recovery which varied between lithologies. For the main siliceous hornfels ore, the recovery is
81% at 200-mesh grind (75 micron) versus 57% in a ROM (300 mm) environment.
| 10.2.2 | McClelland Laboratories 2023 |
This section was extracted from the McClelland Test Report (McClelland,
2023).
A metallurgical testing program is currently in progress at McClelland
Laboratories, Inc. in Sparks, Nevada. A PQ core hole, DDH-7924, was drilled in late 2022 through 241 m of the intrusive lithology. Two
composites were generated: a low-sulfur (0.06% sulfide sulfur (SS)), oxide from the upper portion and a higher-sulfur (1.01% SS), transitional
ore from the lower half. Average gold grades of the two composites were 1.88 g/t Au and 5.06 g/t Au, respectively. Silver grades were
relatively low (2.8 g/t Ag or less).
Testing included bottle roll cyanide leach testing at particle size
distributions of P80 1.7 mm and P80 75 µm. Tests at the finer sizer were conducted with carbon added during
and with gravity concentration pre-treatment. Extended gravity recoverable gold tests (E-GRG) were also conducted. Column leach tests
of both composites at feed sizes of P80 38 mm and P80 19 mm were also performed. A summary of results from all testing
is presented in Table 10-1.
| | 10-5 | |
| SSR Mining Inc. | Marigold Complex S-K 1300 Report | February 12, 2024 SLR Project No.: 138.21581.00002 |
Table 10-1: Summary Metallurgical
Results, Buffalo Valley Intrusive Drill Core Composites
| Comp |
Test Type(1) |
Feed Size |
Leach / Rinse Time in Days |
Au Recovery
(%) |
Au Extracted
(g/t ore) |
Leach Tail
(g/t ore) |
Calculated Head
(g/t ore) |
Average Head
(g/t ore) |
NaCN Consumed
(kg/t ore) |
Lime Added
(kg/t ore) |
| 4906-001 |
CLT |
80%-38mm |
119 |
94.3 |
1.82 |
0.11 |
1.93 |
1.88 |
0.86 |
2.8 |
| 4906-001 |
CLT |
80%-19mm |
98 |
94.0 |
1.71 |
0.11 |
1.82 |
1.88 |
0.78 |
2.8 |
| 4906-001 |
BRT |
80%-1.7mm |
4 |
93.2 |
1.77 |
0.13 |
1.90 |
1.88 |
0.17 |
3.2 |
| 4906-001 |
BRT |
80%-75µm |
3 |
95.0 |
1.72 |
0.09 |
1.81 |
1.88 |
0.11 |
3.1 |
| 4906-001 |
CIL |
80%-75µm |
3 |
94.7 |
1.60 |
0.09 |
1.69 |
1.88 |
0.47 |
2.6 |
| 4906-001 |
Grav/BRT |
80%-75µm |
3 |
95.5 |
1.71 |
0.08 |
1.79 |
1.88 |
0.12 |
3.2 |
| |
|
|
|
|
|
|
|
|
|
|
| 4906-002 |
CLT |
80%-38mm |
140 |
88.8 |
4.46 |
0.56 |
5.02 |
5.02 |
1.17 |
3.1 |
| 4906-002 |
CLT |
80%-19mm |
148 |
88.6 |
4.13 |
0.53 |
4.66 |
5.02 |
1.54 |
3.1 |
| 4906-002 |
BRT |
80%-1.7mm |
4 |
88.8 |
4.74 |
0.60 |
5.34 |
5.02 |
0.22 |
3.4 |
| 4906-002 |
BRT |
80%-75µm |
3 |
90.1 |
4.39 |
0.48 |
4.87 |
5.02 |
0.35 |
2.8 |
| 4906-002 |
CIL |
80%-75µm |
3 |
91.8 |
4.56 |
0.41 |
4.97 |
5.02 |
0.60 |
3.3 |
| 4906-002 |
Grav/BRT |
80%-75µm |
3 |
91.7 |
4.30 |
0.39 |
4.69 |
5.02 |
0.27 |
3.7 |
Notes:
| 1. | CLT - column leach tests; BRT - bottle roll leach tests; CIL - carbon-in-leach bottle roll leach test; Grav/BRT - gravity concentration
with gravity tailings bottle roll leach test. |
Results show that both composites were readily amenable to cyanidation
during bottle roll testing at the P80 1.7 mm feed size. Gold recoveries at this size were 93.2% for the low-sulfide
sulfur composite and 88.8% for the high-sulfide sulfur composite. Column results show no difference between the P80
19 mm and 38 mm crusher sizes, with recoveries of 94.1% and 88.7% for the low-sulfide and high-sulfide composites, respectively.
Results suggest that the composites
were not significantly sensitive to feed size within the range of 38 mm to 75 µm. Bottle roll and column test recoveries
at the various feed sizes were within 2.3% of each other.
Recoveries were not significantly improved by leaching in the presence
of activated carbon. Results from 75 µm tests conducted with and without activated carbon
were within 1.7% of each other or less.
Gravity concentration pre-treatment was also ineffective for significantly
improving recoveries. Combined gold recoveries from gravity/cyanidation were within 1.6% or less of recoveries from baseline tests at
the same size (80% -75µm). Results from E-GRG testing show that neither composite was amenable to gravity concentration at sizes
ranging from P100 850 µm to P80 75 µm.
Column leach test cyanide consumption is currently low to moderate but
will increase as the tests continue. Cyanide consumption was generally low during agitated cyanidation at 1.7 mm and 75 µm feed
sizes. Lime requirements for pH control were moderate.
| | 10-6 | |
| SSR Mining Inc. | Marigold Complex S-K 1300 Report | February 12, 2024 SLR Project No.: 138.21581.00002 |
| 10.2.2.1 | Buffalo Valley Intrusive Ore Characterization |
Average gold head grades of the low-sulfide and high-sulfide Intrusive
composites were 1.88 g/t and 5.06 g/t, respectively. The head grade agreement was good and
relative standard deviation was equivalent to 6.1% of the average head grade or less. Average
silver head grades were relatively low at 1.9 g/t and 2.8 g/t, respectively. Silver head grade agreement was also good.
Cyanide solubility assay results
(AuCN/AuFA ratios) were high and indicate gold extractions of 90% or higher. These extractions are comparable to extractions from
bottle roll and column testing.
Calculated metallic screen assay gold head grades (1.86 g/t and 5.42
g/t) were consistent with the other determined head grades. Results show that gold values were not concentrated in the +106 µm
fraction (“metallic fraction”). These results suggest that the composites did not contain significant coarse metallic gold.
Carbon speciation results show
that the composites contained very little organic carbon (0.03%). Sulfide sulfur content was very low in composite 4906-001 (0.06%)
and relatively higher in composite 4906-002 (1.01%). Inorganic carbon
and sulfate sulfur content were low in both composites. Speciation was conducted with hydrochloric acid digestion (for carbon speciation)
and sodium carbonate digestion (sulfur speciation) with LECO finish.
ICP scan results show that composite copper content was low (62.5 and
79.5 mg/kg). Both composites contained significant amounts of arsenic (1,280 and 2,130 mg/kg)
and mercury (2.47 and 4.10 mg/kg).
X-ray diffraction (XRD) analysis
results show that the composites were comprised primarily of quartz, feldspar, and mica/illite. Both composites contained smectite
(around 10%); smectite is known to be a “swelling clay”. This occurrence of smectite may have a negative impact on permeability
during heap leaching of this material. Loaded permeability testing is being conducted on the tailings samples from this test program but
is incomplete at the time of this report.
| 10.2.3 | Buffalo Valley Au Recovery by Size Results |
Gold recovery by particle size distribution was compiled using the current
and historical Buffalo Valley metallurgical test results. Results of Au recovery by size for each lithology are presented in Table 10-2.
The results were used to determine the Au recovery for each material type for Mineral Resource estimations. The selected recoveries for
each lithology are presented in Figure 10-4.
Table 10-2: Gold Recovery by
Lithology
| Lithology ID |
Lithology |
ROM Material,
P80 300 mm |
Crushed Material,
P80 25 mm |
| SHF |
Siliceous Hornfels |
56.8 |
63.8 |
| INT |
Intrusive |
72.6 |
75.3 |
| CSHF |
Calc-silicate Hornfels |
16.5 |
36.2 |
| GRNST |
Greenstone |
42.1 |
54.9 |
| | 10-7 | |
| SSR Mining Inc. | Marigold Complex S-K 1300 Report | February 12, 2024 SLR Project No.: 138.21581.00002 |
Figure 10-4: Buffalo Valley
Au Recovery by Size for each Lithology
In the opinion of the QP the metallurgical test work data is adequate
for the purposes used in this TRS and the analytical procedures used in the analysis are of conventional industry practice. The Buffalo
Valley deposit differs from the Marigold deposit in that the gold recoveries of the various lithologies associated with the Buffalo Valley
deposit are dependent on crush size. The main deleterious element in the Marigold deposit is organic carbon, which must not be placed
on the heap, and in the Buffalo Valley ore, significant amounts of Hg and As are present, which are mitigated in the process. Smectite
clays are swelling clays that are present at Buffalo valley and can cause reductions in heap leach permeability.
| | 10-8 | |
| SSR Mining Inc. | Marigold Complex S-K 1300 Report | February 12, 2024 SLR Project No.: 138.21581.00002 |
| 11.0 | Mineral Resource Estimates |
Mineral Resources have been classified in accordance with the definitions
for Mineral Resources in S-K 1300. SLR has reviewed, audited, and accepted the Mineral Resource estimates for Marigold and Buffalo Valley,
prepared by SSR and Red Pennant Geoscience Consulting (Red Pennant), respectively (Table 11-1). The Mineral Resource estimates are
based on block model values developed from assays on the mineralized properties.
The Mineral Resource estimates were completed using conventional block
modeling approach in Hexagon Mining MineSight (MineSight) and Seequent’s Leapfrog Geo (Leapfrog Geo) software.
Estimates were validated using standard industry techniques including
statistical comparisons with composite samples and parallel inverse distance squared (ID2) and nearest neighbor (NN) estimates, swath
plots, and visual reviews in cross-section and plan. A visual review comparing blocks to drill holes was completed after the block modeling
work was performed to ensure general lithologic and analytical conformance and was peer reviewed prior to finalization.
In the opinion of the SLR QP, the resource evaluation reported herein
is an appropriate representation of the gold Mineral Resources found at the Marigold Complex at the current level of sampling. The SLR
QP is of the opinion that with consideration of the recommendations summarized in Sections 1 and 23 of this TRS, any issues relating to
all relevant technical and economic factors likely to influence the prospect of economic extraction can be resolved with further work.
| | 11-1 | |
| SSR Mining Inc. | Marigold Complex S-K 1300 Report | February 12, 2024 SLR Project No.: 138.21581.00002 |
Table 11-1: Summary of
Marigold Mine and Buffalo Valley Mineral Resources
| Deposit |
Measured Mineral Resources |
Indicated Mineral Resources |
Measured + Indicated Mineral Resources |
Inferred Mineral Resources |
Cut-off Grade
(g/t Au) |
Amount
(Mt) |
Grade
(g/t Au) |
Rec.
(%) |
Amount
(Mt) |
Grade
(g/t Au) |
Rec.
(%) |
Amount
(Mt) |
Grade
(g/t Au) |
Rec.
(%) |
Amount
(Mt) |
Grade
(g/t Au) |
Rec.
(%) |
| Marigold |
0 |
0 |
0 |
103.72 |
0.44 |
75.5% |
103.72 |
0.44 |
75.5% |
19.09 |
0.36 |
75.6% |
0.069 |
| Buffalo Valley |
0 |
0 |
0 |
14.89 |
0.57 |
62.7% |
14.89 |
0.57 |
62.7% |
8.77 |
0.51 |
64.6% |
0.134 to 0.279 |
| Total |
0 |
0 |
0 |
118.61 |
0.46 |
73.5% |
118.61 |
0.46 |
73.5% |
27.86 |
0.41 |
71.2% |
|
Notes:
| 1. | The Mineral Resource estimate was prepared in accordance with S-K 1300. |
| 2. | The effective date of Mineral Resources at Marigold is September 30, 2023, and the effective date of Mineral Resources at Buffalo
Valley is July 31, 2023. |
| 3. | The Mineral Resource estimate is based on optimized pit shells using a cut-off grade of 0.069 g/t payable gold (gold assay for
recovery, royalty, and net proceeds), with a gold price assumption of $1,750/oz, for Marigold, and using cut-off grades based on lithology
type (CSHF=0.279 g/t gold, GRNST = 0.184 g/t gold, INT = 0.134 g/t gold, and SHF = 0.158 g/t gold, factored for recovery, royalty, and
net proceeds), with a gold price assumption of $1,750/oz, for Buffalo Valley. |
| 4. | For Marigold, bulk densities (in t/m3) were assigned by lithologies: alluvium = 2.10, Havallah = 2.48, Valmy/Antler = 2.4076+(0.0001*DEPTH),
and Valmy = 2.64. For Buffalo Valley, bulk densities (in t/m3) were assigned by lithology ranging from a low of 2.426 (Overburden)
to a high of 2.737 (Basalt) with a weighted average of 2.63. |
| 5. | The Mineral Resources estimate is reported below the as-mined surface as of September 30, 2023, for Marigold, and below the as-mined
surface as of July 31, 2023, for Buffalo Valley. |
| 6. | The point of reference for Mineral Resources is the entry to the carbon columns in the processing facility. |
| 7. | Mineral Resources are reported exclusive of Mineral Reserves. |
| 8. | SSR has 100% ownership of the Properties. |
| 9. | All ounces reported represent troy ounces, and g/t represents grams per metric tonne. |
| 10. | Totals may vary due to rounding. |
| | 11-2 | |
| SSR Mining Inc. | Marigold Complex S-K 1300 Report | February 12, 2024 SLR Project No.: 138.21581.00002 |
The following sections contained in this TRS have been derived, and
in some instances extracted, from documentation (OreWin, 2022) and information supplied to SLR by SSR for review and audit.
SSR prepared the Mineral Resource estimate for Marigold with an
effective date of September 30, 2023. The Mineral Resource estimate is based on all available data for Marigold as of June 30, 2023.
The SLR QP has reviewed and accepted this information for use in this TRS.
Mineral Resources are reported exclusive of Mineral Reserves. Mineral
Resources that are not Mineral Reserves do not have demonstrated economic viability. Due to the uncertainty that may be attached to Inferred
Mineral Resources, it cannot be assumed that all or any part of an Inferred Mineral Resource will be upgraded to an Indicated or Measured
Mineral Resource as a result of continued exploration.
The digital drill hole database used for this estimate contains a total
of 9,449 drill holes with a total length of 1,957,839 m. SSR uses MX Deposit, a commercially available geology database management system.
The project resource database, dated July 31, 2023, includes collar
coordinates, downhole surveys, assays, rock types and oxidation details in separate tables. The database included all the gold re-assays
from the Assay Program conducted in 2015 and 2016 and all the data from the Valmy property purchased from Newmont. All relevant validation
checks were conducted while importing the data into the database. Once imported, the database was checked for errors using the validation
tools available in MineSight.
| 11.2.2 | Geological Interpretation |
The gold mineralization at Marigold is closely associated with the intersection
of high-angle fault structures and favorable horizons that intersect these structures. Favorable host rocks in the Antler Sequence are
the debris flow horizon in the Edna Mountain Formation, the interbedded limestone/sandstone/siltstone and conglomerate in the Antler Peak
Formation, and the conglomerate in the Battle Formation. Favorable host rocks in the Valmy Formation are quartzite and interbedded quartzite-argillite.
The Marigold deposit is divided into seven broad domains based on orientation
of the mineralizing structures, density of structures, orientation of the mineralized zones, and grade distribution.
Figure 11-1 shows the seven major domain areas:
| · | Domain 1 Basalt and Antler pit areas |
| · | Domain 3 Mackay (HideOut, East Hill, Herco North) |
| · | Domain 4 Mackay North 2 (8Sx, 8S, 8N) |
| | 11-3 | |
| SSR Mining Inc. | Marigold Complex S-K 1300 Report | February 12, 2024 SLR Project No.: 138.21581.00002 |
| · | Domain 6 Mackay North 1 (TZN) |
Geological mapping and drill hole data were used to identify the major
structural orientations that control the distribution of mineralization at Marigold. These structural orientations trend north–south,
north–east, and north–west and are shown on Figure 6-5 .
An envelope was developed around the interpreted high-angle structures
to represent the high-angle domains. Figure 11-2 shows a typical cross section with interpreted structures and high-angle domain envelopes.
The first drill intersection of the formational contact and the interpreted
structural data were used to generate the bottom surface for Alluvium, the bottom of Havallah Formation, the top of Antler Sequence, and
the top of the Valmy Formation. The Antler and Valmy Formations are considered two different formational domains for the exploratory data
analysis and grade estimation process.
The base of the oxidized and transition zones was interpreted with respect
to geological logging and analytical data.
| | 11-4 | |
| SSR Mining Inc. | Marigold Complex S-K 1300 Report | February 12, 2024 SLR Project No.: 138.21581.00002 |
Figure 11-1: Location of the
Seven Major Domains
SSR
Mining Inc. Marigold Complex Nevada, USA Location of the Seven Major Domains
| | 11-5 | |
| SSR Mining Inc. | Marigold Complex S-K 1300 Report | February 12, 2024 SLR Project No.: 138.21581.00002 |
Figure 11-2: Typical East–West
Cross Section along 10,200 N
SSR Mining Inc. Marigold
Complex Nevada, USA Typical East-West Cross Section along 10,200N
| | 11-6 | |
| SSR Mining Inc. | Marigold Complex S-K 1300 Report | February 12, 2024 SLR Project No.: 138.21581.00002 |
Geological interpretations of structures and rock types were initially
conducted on east–west cross sections every 30 m, with select north–south long sections and oblique sections as part of the
iterative process.
Internal waste was delineated within the mineralized envelopes wherever
possible. In the previous estimates, the internal waste envelopes were defined by connecting these intervals between drill holes on sections
and into the preceding and succeeding sections. Based on the large positive tonnage reconciliation and grade control information gathered
over the previous three-to-four-year period, no effort was made to connect these intervals unless there was a continuity on the preceding
and succeeding cross sections. The internal waste was defined as small envelopes encompassing composites that were less than 0.1 g/t Au
inside the mineralized envelope.
The complex nature of the mineralized envelopes made it impractical
to create 3D wireframes. The mineralized and waste envelopes from the cross sections were sliced at 7.6 m bench plans and were used to
define the mineralized envelopes on each bench. The mineralized envelopes from the bench plans were reviewed and verified on cross section
in an iterative process and any volume discrepancies were corrected on plans and sections. A typical bench plan is shown in Figure 11-3.
| | 11-7 | |
| SSR Mining Inc. | Marigold Complex S-K 1300 Report | February 12, 2024 SLR Project No.: 138.21581.00002 |
Figure 11-3: Typical Bench Plan
(level=5000)
SSR Mining Inc. Marigold
Complex Nevada, USA Typical Bench Plan (Level 5000)
| | 11-8 | |
| SSR Mining Inc. | Marigold Complex S-K 1300 Report | February 12, 2024 SLR Project No.: 138.21581.00002 |
| 11.2.3 | Treatment of High-Grade Assays |
The SLR QP is of the opinion that the influence of high-grade assays
must be reduced or controlled, and a number of industry best practice methods can be used to achieve this goal.
Where the assay distribution is skewed positively or approaches log-normal,
erratic high grade assay values can have a disproportionate effect on the average grade of a deposit. One method of treating these outliers
to reduce their influence on the average grade is to cut or cap them at a specific grade level.
Grade capping is a technique used to mitigate the potential effect that
a small population of high-grade sample outliers can have during grade estimation. These high-grade samples are not considered to be representative
of the general sample population and are therefore capped to a level that is more representative of the general data population. Although
subjective, grade capping is a common industry practice when performing grade estimation for deposits that have significant grade variability.
In the absence of production data to calibrate the capping level, inspection of the assay distribution can be used to estimate a “first
pass” cutting level.
The spatial distribution of the high-grade populations suggests that
these elevated grades appear to be clustered and are likely associated high-angle structures and favorable rock types are not ‘outliers’
but are key characteristics of this deposit type and geometry and are indicative of mineralization which can influence the estimates that
must be controlled/restricted in the estimate rather than being capped.
| 11.2.3.2 | High Grade Restriction |
In addition to capping thresholds, a secondary approach to reducing
the influence of high-grade composites is to restrict the search ellipse dimension (high yield restriction) during the estimation process.
The threshold grade levels, chosen from the basic statistics and from visual inspection of the apparent continuity of very high grades
within each estimation domain, may indicate the need to further limit their influence by restricting the range of their influence, which
is generally set to approximately half the distance of the main search.
Bench composites were examined for the presence of local high-grade
outliers, which are closely associated with the high-angle structures and favorable rock types. The high-grade outliers were restricted
to a certain grade and distance during the grade interpolation process instead of being capped to a specific grade value (Table 11-2).
Table 11-2: Outlier Restriction
Values and Distance for Various Domains
| Domain Location |
Formation |
Structural Domain |
Outlier Range
(m) |
Outlier Threshold
(g/t Au) |
| Basalt |
Antler |
Low Angle |
15.2 |
2.23 |
| Valmy |
22.9 |
4.11 |
| Target II |
Antler |
Low Angle |
15.2 |
1.71 |
| High Angle |
15.2 |
1.37 |
| Valmy |
Low Angle |
22.9 |
2.06 |
| High Angle |
22.9 |
2.40 |
| | 11-9 | |
| SSR Mining Inc. | Marigold Complex S-K 1300 Report | February 12, 2024 SLR Project No.: 138.21581.00002 |
| Domain Location |
Formation |
Structural Domain |
Outlier Range
(m) |
Outlier Threshold
(g/t Au) |
| Mackay |
Antler |
Low Angle |
15.2 |
2.75 |
| High Angle |
15.2 |
2.05 |
| Valmy |
Low Angle |
22.9 |
5.14 |
| High Angle |
22.9 |
6.20 |
| Mackay North 2 (8S, 8Sx, 8N) |
Antler |
Low Angle |
15.2 |
8.57 |
| Valmy |
15.2 |
2.06 |
| 5N/5NE |
Antler |
Low Angle |
15.2 |
3.60 |
| Valmy |
15.2 |
3.60 |
| Mackay North 1 (TZN) |
Antler |
Low Angle |
15.2 |
3.43 |
| Valmy |
15.2 |
3.43 |
| Valmy |
Valmy |
Low Angle |
15.2 |
2.74 |
Mineralized envelopes were delineated using the breakeven cut-off greater
than or equal to 0.1 g/t bench (7.6 m) composite gold values in cross sections (east–west) 30 m apart with a clipping of 15m on
either side. Bench composites were used to define the ore zones instead of mineralized drill hole widths because selective mining is not
considered an option. The addition of the lower grade gold values from the 2015-2016 Assay Program expanded the mineralized envelopes.
The mineralized envelopes define the ore zones within which the gold grades were estimated. All known and interpreted structures were
considered when the mineralized envelopes were generated.
Correlograms were used in this estimation of Mineral Resources as a
tool to describe the pattern of spatial continuity or strength of the spatial similarity of a variable with separation distance and direction.
A correlogram measures the correlation between data values as a function of their separation distance and direction. Correlograms were
generated using the domain coded composite data using SAGE2001 software (Isaaks & Co.). Structural information from mapping and interpreted
structures from the orientation of gold grades were used as a guide to select the along-strike, across-strike, and along-dip directions.
The correlogram was completed for different domains, and the parameters
are shown in Table 11-3.
| | 11-10 | |
| SSR Mining Inc. | Marigold Complex S-K 1300 Report | February 12, 2024 SLR Project No.: 138.21581.00002 |
Table 11-3: Correlogram Parameters
Used to Estimate Different Domains
| Domain Location |
Structural Domain |
First Structure |
Second Structure |
Direction/Dip |
Variances |
| X |
Y |
Z |
X |
Y |
Z |
X |
Y |
Z |
C0 |
C1 |
C2 |
| Basalt |
Low Angle |
77 |
22 |
8 |
90 |
71 |
265 |
261/31 |
169/3 |
74/59 |
0.269 |
0.47 |
0.26 |
| Mackay and Target II |
High Angle |
21 |
96 |
11 |
41 |
263 |
176 |
232/7 |
322/–2 |
275/20 |
0.315 |
0.44 |
0.25 |
| Low Angle |
9 |
15 |
18 |
83 |
290 |
187 |
102/–77 |
348/–5 |
77/12 |
0.246 |
0.54 |
0.22 |
| Mackay North 2 (8S, 8Sx, 8N) and 5N/5NE |
Low Angle |
15 |
112 |
33 |
54 |
235 |
274 |
81/76 |
55/–13 |
327/6 |
0.181 |
0.573 |
0.246 |
| Mackay North 1 (TZN) |
Low Angle |
47 |
24 |
11 |
93 |
235 |
56 |
292/71 |
92/18 |
4/–6 |
0.279 |
0.378 |
0.343 |
| Valmy |
Low Angle |
27 |
26 |
7 |
169 |
312 |
30 |
70/20 |
355/15 |
285/15 |
0.15 |
0.55 |
0.3 |
| | 11-11 | |
| SSR Mining Inc. | Marigold Complex S-K 1300 Report | February 12, 2024 SLR Project No.: 138.21581.00002 |
| 11.2.6 | Exploratory Data Analysis |
Exploratory data analysis (EDA) was conducted with the following objectives:
| · | Understand the gold distribution and recognize any systematic spatial variation of gold grade with respect to major structures and
rock units. |
| · | Identify distinctive geologic domains that should be evaluated independently in the resource estimation. |
| · | Identify any data and analytical errors not identified in the data verification process. |
| · | Improve the quality of the estimation by understanding the classical statistics of the dataset. |
The EDA process involved visual inspection of the raw assay data to
establish structural and mineralization trends. Bench composites (7.6 m) were created to match mining selectivity; these composites were
reviewed, and those composites within the mineralized envelopes were flagged using the following criteria:
| · | Domain – Basalt and Antler Pits, Target II, Mackay, Mackay North 1 (TZN), Mackay North 2, 5N/5NE, and Valmy pits |
| · | Formation – Antler, Valmy |
| · | Structural domain – high-angle or low-angle domain |
There are 31,971 bench composites flagged within the mineralized envelopes.
Table 11-4 provides the basic statistics for gold grades by domain.
| | 11-12 | |
| SSR Mining Inc. | Marigold Complex S-K 1300 Report | February 12, 2024 SLR Project No.: 138.21581.00002 |
Table 11-4: Basic Au g/t Statistics
of 7.6 m Bench Composites within the Mineralized Envelopes by Domain
| Domain Location |
Formation |
Structural Domain |
Statistic (Au g/t) |
| No. of Samples |
Min
(g/t). |
Max
(g/t) |
Mean
(g/t) |
SD1 |
CV2 |
| Basalt |
Antler |
Low Angle |
1,867 |
0 |
7.87 |
0.41 |
0.47 |
1.15 |
| Valmy |
5,285 |
0 |
16.72 |
0.62 |
0.96 |
1.56 |
| Target II |
Antler |
Low Angle |
543 |
0 |
3.22 |
0.27 |
0.32 |
1.18 |
| High Angle |
1,061 |
0 |
5.72 |
0.33 |
0.37 |
1.12 |
| Valmy |
Low Angle |
1,051 |
0 |
3.97 |
0.28 |
0.32 |
1.14 |
| High Angle |
1,793 |
0 |
4.03 |
0.30 |
0.35 |
1.18 |
| Mackay |
Antler |
Low Angle |
3,899 |
0 |
8.85 |
0.35 |
0.58 |
1.63 |
| High Angle |
1,134 |
0 |
9.04 |
0.47 |
0.66 |
1.41 |
| Valmy |
Low Angle |
15,165 |
0 |
21.85 |
0.40 |
0.69 |
1.74 |
| High Angle |
10,116 |
0 |
15.80 |
0.41 |
0.78 |
1.90 |
| Mackey North 1 (TZN) |
Antler |
Low Angle |
136 |
0 |
0.62 |
0.18 |
0.13 |
0.74 |
| Valmy |
1,605 |
0 |
9.74 |
0.53 |
0.80 |
1.52 |
| Mackay North 2 (8S, 8Sx, 8N) |
Antler |
Low Angle |
2,015 |
0 |
86.62 |
1.06 |
2.60 |
2.44 |
| Valmy |
284 |
0 |
4.96 |
0.39 |
0.50 |
1.27 |
| 5N/5NE |
Antler |
Low Angle |
381 |
0 |
7.51 |
0.61 |
0.94 |
1.54 |
| Valmy |
25 |
0 |
0.91 |
0.21 |
0.19 |
0.93 |
| Valmy |
Valmy |
Low Angle |
2,936 |
0 |
7.65 |
0.45 |
0.63 |
1.40 |
Notes:
| 2. | Coefficient of Variation |
| 11.2.7 | Search Strategy and Grade Interpolation Parameters |
A regularized whole block approach was used whereby the block was assigned
to the domain where its centroid was located. The Mineral Resource cell model was initially created using MineSight using imperial units
in local mine coordinate system, and converted to metric units for reporting. The models fully enclose the modeled resource wireframes
and are oriented with an azimuth of 0.0°, dip of 0.0°, and a plunge of 0.0° so as to align with the overall strike of the
mineralization with a parent cell size of 6.096 m in the X (across strike) by 7.62 m in the Y (along strike) directions and 7.62 m in
the Z (vertical or bench height) direction, honoring modeled geological surfaces. A summary of the block model extents is provided in
Table 11-5.
Table 11-5: Block Model Parameters
| Item |
Min* |
Max* |
Extent* |
Cell Size
(m) |
Number of Cells |
| Eastings |
-914.4 |
8,839.2 |
9,753.6 |
6.10 |
487.7 |
| Northings |
-2,438.4 |
10,363.2 |
12,801.6 |
7.62 |
512.1 |
| Elevation |
914.4 |
2,590.8 |
1,676.4 |
7.62 |
67.1 |
| | 11-13 | |
| SSR Mining Inc. | Marigold Complex S-K 1300 Report | February 12, 2024 SLR Project No.: 138.21581.00002 |
Cell dimensions were selected based on drill hole spacing; approximately
one-third of the drill spacing, and cell heights match the future mine bench heights. The model attributes are shown in Table 11-6.
Table 11-6: Model Attributes
| Field |
Description |
| TOPO |
Percentage of cell below the July 31, 2023, topography |
| ORE |
Ore or waste cells: Ore=1, Waste = 10 |
| ORE% |
Percentage of ore within the cell |
| AUNN |
Gold value for NN model |
| AUKR |
Gold value for kriged estimate |
| AUPAY |
Gold value for payable gold grade |
| CAT |
Resource category: Indicated=2, Inferred=3 |
| SDOM1 |
Low/high-angle structural domain: low angle=2, high angle=5 |
| SDOM2 |
Low/high-grade domain: low-grade block=2, high-grade block=1 |
| SDOm3 |
Location: Basalt & Antler =1, Target=2, Mackay =3, Mackay North =4 (8Sx,8S,8N) |
| RCODE |
Formation/rock unit: Alluvium=1, Havallah=2, Antler=3, Valmy=4, Backfill/dump=6 |
| REDOX |
Oxidation state: Oxides=1, Transitional=2, Sulfides=3 |
| TCF |
Tonnage conversion factor |
| ROYL |
Royalty |
| REC |
Recovery |
| 11.2.7.1 | Estimation Domaining |
Histograms of the composites within the mineralized envelopes for the
various domains were generated. These histograms indicated a skewed distribution, with approximately 20% of the bench composites grades
for all the domains with a gold grade below 0.1 g/t, indicating internal dilution. The limits of gold mineralization within the mineralized
envelopes are difficult to interpret manually with these lower grade ranges. A probabilistic approach is required to identify the higher
grade and lower grade cells to avoid overestimation of tonnages and smearing of higher grades into lower grade cells. The chosen method
used indicators that set a value of one to each bench composite that had a gold value greater than or equal to 0.14 g/t Au and a
value of zero to composites less than 0.14 g/t Au. The values between zero and one were then estimated into the model cells using
ordinary kriging (OK).
The distribution of the indicator estimates (values between zero and
one) was compared to the frequency distribution of the NN grade model to determine the probability (percentage) that a cell has a grade
of 0.14 g/t or higher (high-grade domain). The percentages vary by domain and show a close continuity to the composites and NN model.
The probability thresholds used for each domain are listed as percentages in Table 11-7.
| | 11-14 | |
| SSR Mining Inc. | Marigold Complex S-K 1300 Report | February 12, 2024 SLR Project No.: 138.21581.00002 |
Table 11-7: Probability Percentages
for Cells Au>0.14 g/t
| Domain |
Probability
(%) |
|
| Basalt |
65 |
|
| Target II |
58 |
|
| Mackay |
38 |
|
| Mackay North 2 (8S, 8Sx, 8N) |
64 |
|
| 5N/5NE |
60 |
|
| Mackay North 1 (TZN) |
48 |
|
| Valmy |
36 |
|
Before the cells were estimated, the cell model was tagged for the following:
| · | The depleted pre-mining topography as of July 31, 2023, was used to tag the percentage (TOPO) of in-situ material followed by June
30, 2023, surface topography to incorporate all the WRSA and backfill areas. Ore and waste envelopes developed on bench plans were used
to tag the ore material /internal waste (ORE) and percentage of ore material (ORE%) in cell. |
| · | The rock type/formation surfaces were used to tag the RCODE variable in the cell model. |
| · | The surface developed for the top of the transitional zone and fresh material was used to tag the REDOX variable in the model. |
| · | The structural domain (SDOM1) was tagged using the high-angle structural envelopes; and |
| · | The grade domain (SDOM2) was tagged using probability percentages. |
The composites were backtagged using the cell model for the different
domains and attributes described here.
The cells were then estimated for gold using ordinary kriging in 90
separate calculations.
The mineralized areas, HideOut and 8Sx, were identified in 2014 and
2015 and are located below historical waste rock storage areas (WRSA). The material in these WRSA was mined during the late 1990s and
early 2000s when cut-off grades were higher than the current cut-off grades. While drilling HideOut and 8Sx, samples from these WRSAs
were also assayed for gold. A majority of these samples returned gold values higher than the current cut-off grade. To confirm the grades,
a total of 37 sonic drill holes were drilled in 2016. These drill holes confirmed the gold grades in the historical WRSA. A total of
372 holes drilled between 2010 and 2017 in the WRSA was considered for this estimation. This mineralized material in the historical WRSA
(the mineralized stockpile) was demarcated using the original and current topography. The samples within these surfaces were selected
and bench composited to 7.6 m. The cells were then estimated for gold using inverse distance cubed (ID3) in two separate calculations.
| 11.2.7.2 | Search Neighborhood Design |
The search parameters used to estimate the cells within the mineralized
stockpile are shown in Table 11-8.
| | 11-15 | |
| SSR Mining Inc. | Marigold Complex S-K 1300 Report | February 12, 2024 SLR Project No.: 138.21581.00002 |
Table 11-8: Search Parameters for
Mineralized Stockpile
| Domain |
Min No. of Composites |
Max No. of Composites |
Outlier Range (m) |
Outlier Au (g/t) |
Search Ellipsoid Distance and Orientation |
| X Search (m) |
Y Search (m) |
Z Search (m) |
Max Search (m) |
Z Axis |
X Axis |
Y Axis |
| Mineralized Stockpile |
1 |
8 |
12.2 |
0.342 |
150 |
150 |
15 |
150 |
0 |
0 |
0 |
| 3 |
8 |
12.2 |
0.342 |
91 |
91 |
15 |
91 |
0 |
0 |
0 |
| | 11-16 | |
| SSR Mining Inc. | Marigold Complex S-K 1300 Report | February 12, 2024 SLR Project No.: 138.21581.00002 |
Bulk density or specific gravity (SG) is used globally to convert volume
to tonnage and, in some cases, to weight block grade estimates.
A total of 713 core samples were collected from diamond core drillholes
for dry bulk density determinations at the Marigold onsite laboratory. Out of the total of 713 samples, 98 samples represented Antler
sequence, 604 samples represented Valmy Formation and 11 samples were from late Cretaceous intrusives.
The following methodology was used to measure the bulk density of the
half core samples:
| 1 | A thoroughly dry core sample is weighed in air. |
| 2 | The sample is saturated with water; and |
| 3 | After saturation, the sample is weighed while suspended in water and then the saturated sample is weighed in air. |
The three weights, (dry in air, saturated in water and saturated in
air) are then used to calculate the dry bulk density of the sample (Silver Standard, 2014).
The density used in the cell model at depth (from original topographic
surface) for different material is summarized in Table 11-9.
Table 11-9: Summary of Density for
Different Material
| Material |
Depth
(m) |
Density
(t/m3) |
| Alluvium/Backfill |
>0.00 |
2.10 |
| Havallah |
>0.00 |
2.48 |
| Valmy/Antler |
0.0 to 533 |
y=2.4076+(0.0001*DEPTH) |
| Valmy |
>533 |
2.64 |
A Mineral Resource is defined as a concentration or occurrence of material
of economic interest in or on the Earth’s crust in such form, grade or quality, and quantity that there are reasonable prospects
for economic extraction. A mineral resource is a reasonable estimate of mineralization, considering relevant factors such as cut-off grade,
likely mining dimensions, location, or continuity, that with the assumed and justifiable technical and economic conditions, is likely
to, in whole or in part, become economically extractable. It is not merely an inventory of all mineralization drilled or sampled.
Based on this definition of Mineral Resources, the Mineral Resources
estimated in this TRS have been classified according to the definitions below based on geology, grade continuity, and drill hole spacing.
Measured Mineral Resource is that part of a mineral resource
for which quantity and grade or quality are estimated on the basis of conclusive geological evidence and sampling. The level of geological
certainty associated with a measured mineral resource is sufficient to allow a qualified person to apply modifying factors, as defined
in this section, in sufficient detail to support detailed mine planning and final evaluation of the economic viability of the deposit.
Because a measured mineral resource has a higher level of confidence than the level of confidence of either an indicated mineral resource
or an inferred mineral resource, a measured mineral resource may be converted to a proven mineral reserve or to a probable mineral reserve.
| | 11-17 | |
| SSR Mining Inc. | Marigold Complex S-K 1300 Report | February 12, 2024 SLR Project No.: 138.21581.00002 |
Indicated Mineral Resource is that part of a mineral resource
for which quantity and grade or quality are estimated on the basis of adequate geological evidence and sampling. The level of geological
certainty associated with an indicated mineral resource is sufficient to allow a qualified person to apply modifying factors in sufficient
detail to support mine planning and evaluation of the economic viability of the deposit. Because an indicated mineral resource has a lower
level of confidence than the level of confidence of a measured mineral resource, an indicated mineral resource may only be converted to
a probable mineral reserve.
Inferred Mineral Resource is that part of a mineral resource
for which quantity and grade or quality are estimated on the basis of limited geological evidence and sampling. The level of geological
uncertainty associated with an inferred mineral resource is too high to apply relevant technical and economic factors likely to influence
the prospects of economic extraction in a manner useful for evaluation of economic viability. Because an inferred mineral resource has
the lowest level of geological confidence of all mineral resources, which prevents the application of the modifying factors in a manner
useful for evaluation of economic viability, an inferred mineral resource may not be considered when assessing the economic viability
of a mining project and may not be converted to a mineral reserve.
The factors than can affect the uncertainty associated with each classification
of Mineral Resources include but are not limited to:
| · | reliability of sampling data |
| · | confidence in interpretation |
| · | modeling of geological and estimation domains |
| · | confidence in block grade estimates. |
Two resource classification envelopes/polygons were used to classify
the Mineral Resources within the mineralized stockpiles. One polygon was digitized based on a distance of 30 m from the exterior composite
for Indicated resources and at a distance of 50 m for Inferred Mineral Resources (Table 11-10). Figure 11-4 shows the classification within
the Valmy Pit. The sample spacing and the nature of the mineralization do not warrant classification of any resources in the Measured
category.
Table 11-10: Resource Classification
Parameters
| Category |
Min Composites |
Distance to First Composite
(m) |
Distance to Second Composite
(m) |
| Indicated (CAT=2) |
2 |
36 |
50 |
| Inferred (CAT=3) |
1 |
78 |
– |
| | 11-18 | |
| SSR Mining Inc. | Marigold Complex S-K 1300 Report | February 12, 2024 SLR Project No.: 138.21581.00002 |
Figure 11-4: Valmy Classification
Cross Section (1100 N – Grid is in Local Mine Coordinates)
SSR Mining Inc. Marigold
Complex Nevada, USA Valmy Classification Cross Section
| | 11-19 | |
| SSR Mining Inc. | Marigold Complex S-K 1300 Report | February 12, 2024 SLR Project No.: 138.21581.00002 |
As described in the 2014 Technical report (Silver Standard, 2014), SSR
used geostatistical analysis to determine classification. Geostatistics provides an assortment of tools to establish confidence levels
on Mineral Resources estimates. One of these methods, called the Large Sample Normal Theory (B. Davis, 1997), involves the evaluation
of the estimation variances for large blocks based on the annual production. This method gives an estimate of global confidence or confidence
over large areas.
The process involves calculating the kriging variance using a series
of theoretical drillholes at intervals averaging 15.25, 30.5, and 61 m spacing in blocks that represent approximately one month’s
production. The calculations are conducted over a series of drill hole grids in order to evaluate the variation in the results with respect
to the spacing of the drill data. The single block kriging procedure in MineSight has been used to calculate the kriging variances.
The correlogram used to determine the kriging variance in the large
block is derived from the actual bench composites. Because the correlogram was used, the normalized block kriging variance (a variable
which is output from the ordinary kriging computation) was standardized to the underlying data by multiplying by the square of the coefficient
of variation (CV=standard deviation/mean from the original 7.6 m composite data). To determine the 90% confidence limit, the relative
standard error is multiplied by 1.645 (95th percentile of a standard normal distribution).
The statistical criteria used for Indicated Mineral Resources is that
the annual ore production should be known to at least ±15% with 90% confidence and that at least two drillholes are used to estimate
a block. A drill grid spacing of 50 m gives a 90% confidence level of ±11% for an annual production increment. The drill spacing
of 50 m is within the suggested limits of ±15%. The drill spacing of 50 m was selected to ensure that the continuity of discontinuous
high grade gold zones, along with the extent and shape of the mineralization, is sufficiently delineated to give a reliable estimate of
tons and grade. Mineral Resources were classified as Indicated when a block was located within 36 m to the nearest composite and one additional
composite from another drill hole was within 50 m. With these criteria, the drillhole spacing for Indicated Mineral Resources broadly
corresponds to a 36 m grid.
The drill spacing of 91 m was selected for classification of Inferred
Mineral Resources to ensure that there is a high probability of continuity of discontinuous high grade gold zones, along with the extent
and shape of the mineralization. Mineral Resources were classified as Inferred when a block was located within 78 m to the nearest composite.
| 11.2.9.1 | QP Comments on Classification |
In the SLR QP’s opinion, the classification of Mineral Resources
is reasonable and appropriate for Mineral Resource disclosure and there is reasonable expectation that the majority of Inferred Mineral
Resources could be upgraded to Indicated Mineral Resources with continued exploration.
| 11.2.10 | Estimation Validation |
The Marigold block model estimates were validated using industry standard
techniques including:
| · | Local validation using visual inspections on sections and plans, viewing composites versus block estimates |
| · | Global validation by comparison of composite statistics versus block estimates |
| | 11-20 | |
| SSR Mining Inc. | Marigold Complex S-K 1300 Report | February 12, 2024 SLR Project No.: 138.21581.00002 |
| · | Local validation by comparison of average assay grades with average block estimates along different directions (swath plots) |
SLR reviewed and audited the validation steps performed by SSR resource
geologists and found grade continuity to be reasonable and confirmed that the block grades were reasonably consistent with local drill
hole composite grades.
| 11.2.10.1 | Visual Inspection |
Visual validation included comparing the composites and the estimated
model grades in both plan and section. Plans and sections were also checked for smearing of grades across stacked ore/mineralized zones,
and no smearing was identified. This validates the kriging parameters used to estimate the cells. A typical cross section and a plan view
with estimated grades are shown in Figure 11-5 and Figure 11-6, respectively.
| | 11-21 | |
| SSR Mining Inc. | Marigold Complex S-K 1300 Report | February 12, 2024 SLR Project No.: 138.21581.00002 |
Figure 11-5: Typical East–West
Cross Section along 10,400 N with Estimated Cell Grades (Au g/t)
SSR Mining Inc. Marigold
Complex Nevada, USA Typical East-West Cross-Section along 10,400 N
| | 11-22 | |
| SSR Mining Inc. | Marigold Complex S-K 1300 Report | February 12, 2024 SLR Project No.: 138.21581.00002 |
Figure 11-6: Typical Plan 4950 Elevation
with Estimated Whole Cell Grades Au g/t
SSR Mining Inc. Marigold
Complex Nevada, USA Typical Plan 4950 Elevation with Estimated Whole Cell Grades Au g/t
| | 11-23 | |
| SSR Mining Inc. | Marigold Complex S-K 1300 Report | February 12, 2024 SLR Project No.: 138.21581.00002 |
| 11.2.10.2 | Estimation Statistics |
Checks for global bias were conducted on a domain basis, and the relative
percent differences of the kriged mean gold grades were checked against the Nearest Neighbor (NN) estimates; the difference was less than
±5% (Table 11-11).
Table 11-11: Estimation Variance Statistics
| |
Kriging Au (g/t) |
NN Au (g/t) |
% Variance |
|
| Domain =1 |
0.41 |
0.43 |
5% |
|
| Domain =3 |
0.38 |
0.38 |
1% |
|
| Domain =4 |
0.55 |
0.52 |
4% |
|
| Domain =6 |
0.49 |
0.5 |
2% |
|
Swath plots were generated to compare the NN gold grades and the kriged
gold grades. These plots, presented as Figure 11-7, Figure 11-8, and Figure 11-9, demonstrate good correlation.
Figure 11-7: Swath Plot Along Eastings
Notes:
| 1. | opt = ounces per short ton |
| 2. | Au NN is nearest neighbor estimates; Au Kriged is ordinary kriged estimates |
Source: SSR, 2023.
| | 11-24 | |
| SSR Mining Inc. | Marigold Complex S-K 1300 Report | February 12, 2024 SLR Project No.: 138.21581.00002 |
Figure 11-8: Swath Plot Along Northings
Notes
| 1. | opt = ounces per short ton |
| 2. | Au NN is nearest neighbor estimates; Au Kriged is ordinary kriged estimates |
Source: SSR, 2023.
| | 11-25 | |
| SSR Mining Inc. | Marigold Complex S-K 1300 Report | February 12, 2024 SLR Project No.: 138.21581.00002 |
Figure 11-9: Swath Plot Along Elevation
Notes:
| 1. | opt = ounces per short ton |
| 2. | Au NN is nearest neighbor estimates; Au Kriged is ordinary kriged estimates. |
Source: SSR, 2023.
| 11.2.11 | Prospects of Economic Extraction for Mineral Resources |
Mineral Resources must demonstrate reasonable prospects for economic
extraction (RPEE) which generally implies that the quantity and grade estimates meet certain economic thresholds and that the mineral
resources are reported at an appropriate cut-off grade taking into account extraction scenarios.
Metal prices used for reserves are based on consensus, long term forecasts
from banks, financial institutions, and other sources. For resources, metal prices used are slightly higher than those for reserves.
A reporting cut-off grade for the Marigold Mine based on assumed costs
for open pit extraction and heap leach processing and commodity prices that provide a reasonable basis for establishing the prospects
of economic extraction for Mineral Resources was established and reviewed by the SLR QP.
| | 11-26 | |
| SSR Mining Inc. | Marigold Complex S-K 1300 Report | February 12, 2024 SLR Project No.: 138.21581.00002 |
| 11.2.11.1 | Cut-off Grade Estimation and Whittle Parameters |
Mineral Resources for Marigold were calculated based on a Whittle optimized
pit at a payable gold grade of 0.069 g/t (Au assay factored for recovery, royalty, and net proceeds per cell) using an assumed gold price
of $1,750/oz. Input parameters for the Whittle pit optimization are provided in Table 11-12.
Table 11-12: Marigold Resource Pit
Parameters and Cut-off Grade
| Marigold |
ROM Resources – Used Equipment |
| Unit |
MAC COG |
| Cut-off Method |
|
Marginal |
| Year |
|
2023 |
| Gold Price |
US$/oz |
1,750 |
| |
|
|
| Gold Sales, Insurance, Legal and Social |
US$/oz |
0.00 |
| Royalties |
US$/oz |
0.00 |
| Total Selling Cost |
US$/oz |
0.00 |
| |
|
|
| Material Type |
|
Average |
| |
|
|
| Processing Au Recovery |
% |
100.0% |
| Payable Au |
% |
100.0% |
| |
|
|
| Mining Dilution |
% |
1.00 |
| |
|
|
| Processing Cost |
US$/t |
2.25 |
| Rehandling Cost |
US$/t |
0.00 |
| Operational Support (G&A) |
US$/t |
1.23 |
| Total |
US$/t |
3.48 |
| |
|
|
| Cut-off Grade – Marginal |
g/t |
0.062 |
| Internal Cut-off Used |
g/t |
0.069 |
| |
|
|
| Mining Cost |
US$/t |
1.93 |
| |
|
|
| Cut-off Grade- Full |
g/t |
0.0961 |
| | 11-27 | |
| SSR Mining Inc. | Marigold Complex S-K 1300 Report | February 12, 2024 SLR Project No.: 138.21581.00002 |
The gold price of $1,750/oz was selected after consideration of the
pricing information described in Section 16, which includes a description of the time frame used for the selection of the price and the
reasons for selection of such a time frame. The metal price is representative of the range of price estimates publicly reported for Mineral
Resource cut-offs. The Marigold Mineral Resource is assumed to be mined by open pit.
By definition, the estimation of Mineral Resources has considered environmental,
permitting, legal, title, taxation, mining, metallurgical, infrastructure, socio-economic, marketing, and political factors and other
constraints, as discussed in various sections of the TRS.
| 11.2.12 | Mineral Resource Reporting |
SLR is unaware of any current environmental, permitting, legal, title,
taxation, socio- economic, marketing, political, or other relevant factors that could materially affect the Mineral Resources estimate
for Marigold (exclusive of Mineral Reserves) as of September 30, 2023, presented in Table 11-13.
Table 11-13: Details of Marigold Mineral
Resources Estimate Exclusive of Mineral Reserves as of September 30, 2023
| Category |
Tonnes
(Mt) |
Grade
(g/t Au) |
Contained Metal
(Au Moz) |
Cut-off Grade
(Au g/t) |
Metallurgical Recovery
(%) |
| Measured |
- |
- |
- |
- |
- |
| Indicated |
103.72 |
0.44 |
1.47 |
0.069 |
75.5% |
| Total Measured + Indicated |
103.72 |
0.44 |
1.47 |
0.069 |
75.5% |
| Inferred |
19.09 |
0.36 |
0.22 |
0.069 |
75.6% |
Notes:
| 1. | The Mineral Resource estimate was prepared in accordance with S-K 1300 definitions. |
| 2. | The Mineral Resource estimate is based on an optimized pit shell at a cut-off grade of 0.069 g/t payable gold (gold assay factored
for recovery, royalty, and net proceeds), with a gold price assumption of $1,750/oz. |
| 3. | Bulk densities (in t/m3) were assigned by lithologies: alluvium = 2.10, Havallah = 2.48, Valmy/Antler = 2.4076+(0.0001*DEPTH),
and Valmy = 2.64. |
| 4. | The Mineral Resources estimate is reported below the as-mined surface as of September 30, 2023. |
| 5. | The point of reference for Mineral Resources is the entry to the carbon columns in the processing facility. |
| 6. | Mineral Resources are reported exclusive of Mineral Reserves. |
| 7. | Inferred Mineral Resources include Inferred material contained within the Marigold Mineral Reserve optimized pit shells. |
| 8. | SSR has 100% ownership of the Property. |
| 9. | All ounces reported represent troy ounces, and g/t represents grams per metric tonne. |
| 10. | Totals may vary due to rounding. |
A total reduction of -9% (164,000 ounces) between EOY 2022 and current
Resources as of Sept 30,2023 is the result of the following attributes:
| · | Resource to Reserve conversion -14% |
| | 11-28 | |
| SSR Mining Inc. | Marigold Complex S-K 1300 Report | February 12, 2024 SLR Project No.: 138.21581.00002 |
| 11.2.12.1 | Ore Reconciliation |
Reconciliation between resource model estimates and mined production
is the most effective means of validating a cell model estimate.
Production since the acquisition of Marigold by SSR has been
mainly in Mackay Phase 1, 2, 3, 4, 5, 6, 8, and North pits, which include 5N1, 5N2, and H1. Mining is currently underway in Mackay
Phase 4 and Red Dot Phase 1. The reconciliation for mined material between January 1, 2018, and June 30, 2023, to the resource model
is presented in Table 11-14.
Table 11-14: Ore Reconciliation for
the Period January 1, 2018, and June 30, 2023
| Item |
Tonnes
(Mt) |
Gold Grade
(g/t) |
Contained Gold
(Moz) |
| Actual mined |
125.96 |
0.42 |
1.70 |
| Resource model |
125.57 |
0.44 |
1.76 |
| Difference |
0.39 |
-0.02 |
-0.06 |
| % Difference |
0% |
-5% |
-3% |
| 11.2.13 | Comparison with Previous Estimates |
The 2023 Mineral Resource exclusive of Mineral Reserves has been compared
with the previous December 31, 2022 Mineral Resource estimate as reported in SSR’s 2022 Form 10-K filing (SSR, 2023).
There has been a reduction in Indicated contained gold ounces of 137
koz and a reduction in Inferred gold ounces of 28 koz. The change can be attributed due to the following:
| · | Re-interpretation of the mineralized envelopes using the most updated drill hole and geological mapping information |
| 11.2.14 | Mineral Resource Uncertainty |
Mineral Resources are not Mineral Reserves and do not have demonstrated
economic viability, nor is there certainty that all or any part of the Mineral Resource estimated here will be converted to Mineral Reserves
through further study.
Sources of uncertainty that may affect the reporting of Mineral Resources
include sampling or drilling methods, data processing and handling, geologic modeling, and estimation. There are sources of uncertainty
in the MRE at the Marigold Mine which depend on the classification assigned. The SLR QP has not identified any relevant technical and/or
economic factors that require resolution with regards to the Mineral Resource estimate.
The SLR QP is of the opinion that with consideration of the recommendations
summarized in Sections 1 and 23 of this TRS, any issues relating to all relevant technical and economic factors likely to influence the
prospect of economic extraction can be resolved with further work.
| | 11-29 | |
| SSR Mining Inc. | Marigold Complex S-K 1300 Report | February 12, 2024 SLR Project No.: 138.21581.00002 |
In the SLR QP’s opinion reconciliation between the Mineral Resources
model and the grade control model is reasonable. The Mineral Resource model is suitable for Mineral Reserve estimation.
The SLR QP reviewed the assumptions, parameters, and methods used to
prepare the Mineral Resources Statement and is of the opinion that the Mineral Resources are estimated and prepared in accordance with
S-K 1300.
The Buffalo Valley resource estimation was conducted by Red Pennant
Corp. with an effective of July 31, 2023. The Mineral Resource estimate is based on all available data
as of April 31, 2023. The SLR QP has reviewed and accepted this information for use in this TRS.
There are no Mineral Reserves in the Buffalo Valley project. Due to
the uncertainty that may be attached to Inferred Mineral Resources, it cannot be assumed that all or any part of an Inferred Mineral Resource
will be upgraded to an Indicated or Measured Mineral Resource as a result of continued exploration.
The digital drill hole database used for this estimate contains a total
of 1,446 drill holes; 797 additional holes are located in the surrounding Buffalo Valley model but not used to build the geological model
and estimation. SSR uses MX Deposit, a commercially available database management system. The drill campaigns represented in the data
were completed over more than 42 years, from 1980 through to April 31, 2023.
| 11.3.2 | Geological Interpretation |
The Buffalo Valley project area is approximately 2.5 miles long north-south,
and 1.7 miles wide east-west.
| 11.3.2.1 | Domains and Grade Shells |
The majority of gold mineralization at Buffalo Valley is hosted along
a northwest trending dikes system and faults. Mineralization occurs both adjacent to dikes as well as bedding-parallel in receptive sedimentary
units.
A total of fourteen lithological domains were defined for gold estimations.
Figure 11-10 and Figure 11-11 show a plan map and cross-section through the Buffalo Valley pit showing the locations of these domains.
Probability envelopes (at least 30% probability of AUFE exceeding 0.003 opt) were developed and are shown in the sections to provide a
perspective of the localization of mineralization.
| | 11-30 | |
| SSR Mining Inc. | Marigold Complex S-K 1300 Report | February 12, 2024 SLR Project No.: 138.21581.00002 |
Figure 11-10: Buffalo Valley Geological
Domains (Plan View Elevation 5100)
Note: Grid in Local Mine Coordinates.
SSR Mining Inc. Marigold
Complex Nevada, USA Buffalo Valley Geological Domains (Plan View Elevation 5100)
| | 11-31 | |
| SSR Mining Inc. | Marigold Complex S-K 1300 Report | February 12, 2024 SLR Project No.: 138.21581.00002 |
Figure 11-11: Buffalo Valley Geology
(Mine Grid Section -32,000 N)
Note: Grid in Local Mine Coordinates.
SSR Mining Inc. Marigold
Complex Nevada, USA Buffalo Valley Geology (Mine Grid Section -32,000 N)
| | 11-32 | |
| SSR Mining Inc. | Marigold Complex S-K 1300 Report | February 12, 2024 SLR Project No.: 138.21581.00002 |
The length weighted gold assay (g/t) and interval length statistics
for sample intervals are summarized in Table 11-15.
Table 11-15: Length Weighted Gold
Assays (g/t) Statistics of Raw Samples by Estimation Domain
| Domain |
Element |
Count |
Mean Grade
(g/t) |
SD |
CV |
Variance |
Min
(g/t) |
Median
(g/t) |
Max
(g/t) |
| Base limestone |
AUCN |
2,319 |
0.25 |
0.0505 |
6.9982 |
0.0025 |
0.07 |
0.07 |
66.24 |
| AUFA |
2,319 |
0.20 |
0.0456 |
7.9111 |
0.0021 |
0.03 |
0.03 |
59.90 |
| AUFE |
3,015 |
0.25 |
0.0457 |
6.2794 |
0.0021 |
0.00 |
0.03 |
61.51 |
| Interval Length |
3,113 |
1.73 |
20.3366 |
3.5928 |
413.5757 |
0.02 |
1.52 |
283.80 |
| Crosscut west |
AUCN |
1,019 |
0.14 |
0.0079 |
1.9257 |
0.0001 |
0.07 |
0.07 |
5.11 |
| AUFA |
1,019 |
0.10 |
0.0071 |
2.4167 |
0.0001 |
0.03 |
0.03 |
4.59 |
| AUFE |
1,374 |
0.10 |
0.0086 |
3.0499 |
0.0001 |
0.00 |
0.03 |
5.18 |
| Interval Length |
1,726 |
1.62 |
12.6596 |
2.3848 |
160.2645 |
0.04 |
1.52 |
160.42 |
| East stock |
AUCN |
949 |
0.10 |
0.0044 |
1.5178 |
0.00002 |
0.07 |
0.07 |
2.26 |
| AUFA |
949 |
0.06 |
0.0040 |
2.1211 |
0.00002 |
0.03 |
0.03 |
2.02 |
| AUFE |
881 |
0.06 |
0.0042 |
2.4399 |
0.00002 |
0.02 |
0.03 |
2.16 |
| Interval Length |
1,049 |
1.59 |
8.0149 |
1.5329 |
64.2380 |
0.05 |
1.52 |
73.05 |
| East stock dike 1 |
AUCN |
88 |
0.23 |
0.0091 |
1.3700 |
0.0001 |
0.07 |
0.10 |
1.70 |
| AUFA |
88 |
0.18 |
0.0082 |
1.5670 |
0.0001 |
0.03 |
0.07 |
1.51 |
| AUFE |
52 |
0.12 |
0.0077 |
2.2880 |
0.0001 |
0.00 |
0.03 |
1.75 |
| Interval Length |
92 |
1.54 |
0.9828 |
0.1951 |
0.9659 |
0.37 |
1.52 |
4.12 |
| East stock dike 3 |
AUCN |
238 |
0.18 |
0.0137 |
2.6623 |
0.0002 |
0.07 |
0.07 |
8.40 |
| AUFA |
238 |
0.13 |
0.0124 |
3.1736 |
0.0002 |
0.03 |
0.03 |
7.58 |
| AUFE |
283 |
0.15 |
0.0151 |
3.3770 |
0.0002 |
0.02 |
0.03 |
9.67 |
| Interval Length |
303 |
1.28 |
3.5767 |
0.8513 |
12.7927 |
0.00 |
1.52 |
16.19 |
| Hav Basalt |
AUCN |
4,041 |
0.25 |
0.0314 |
4.3100 |
0.0010 |
0.07 |
0.10 |
44.94 |
| AUFA |
4,041 |
0.20 |
0.0284 |
4.8653 |
0.0008 |
0.03 |
0.07 |
40.63 |
| AUFE |
3,760 |
0.16 |
0.0222 |
4.8839 |
0.0005 |
0.00 |
0.04 |
24.10 |
| Interval Length |
5,482 |
1.45 |
2.5460 |
0.5334 |
6.4819 |
0.00 |
1.52 |
36.65 |
| Main dike east |
AUCN |
9,120 |
0.53 |
0.0762 |
4.8930 |
0.0058 |
0.03 |
0.10 |
131.84 |
| AUFA |
9,120 |
0.46 |
0.0689 |
5.1693 |
0.0047 |
0.00 |
0.07 |
119.25 |
| AUFE |
10,084 |
0.51 |
0.0717 |
4.8080 |
0.0051 |
0.00 |
0.07 |
125.11 |
| Interval Length |
12,858 |
1.55 |
11.3085 |
2.2173 |
127.8818 |
0.00 |
1.52 |
241.40 |
| Mike’s dike |
AUCN |
5 |
0.39 |
0.0069 |
0.6131 |
0.00005 |
0.18 |
0.26 |
0.71 |
| AUFA |
5 |
0.33 |
0.0063 |
0.6618 |
0.00004 |
0.14 |
0.21 |
0.62 |
| AUFE |
22 |
0.04 |
0.0005 |
0.4115 |
0.00000 |
0.03 |
0.03 |
0.10 |
| Interval Length |
27 |
1.51 |
0.2935 |
0.0594 |
0.0861 |
1.06 |
1.52 |
1.52 |
| | 11-33 | |
| SSR Mining Inc. | Marigold Complex S-K 1300 Report | February 12, 2024 SLR Project No.: 138.21581.00002 |
| Domain |
Element |
Count |
Mean Grade
(g/t) |
SD |
CV |
Variance |
Min
(g/t) |
Median
(g/t) |
Max
(g/t) |
| Overburden |
AUCN |
10,288 |
0.19 |
0.0313 |
5.7299 |
0.0010 |
0.03 |
0.07 |
44.75 |
| AUFA |
10,288 |
0.14 |
0.0284 |
6.7575 |
0.0008 |
0.00 |
0.03 |
40.46 |
| AUFE |
9,285 |
0.11 |
0.0254 |
8.0870 |
0.0006 |
0.00 |
0.03 |
46.77 |
| Interval Length |
13,526 |
1.89 |
20.6588 |
3.3327 |
426.7877 |
0.00 |
1.52 |
234.03 |
| Sandy unit |
AUCN |
21,127 |
0.28 |
0.0291 |
3.6112 |
0.0008 |
0.03 |
0.07 |
131.84 |
| AUFA |
21,127 |
0.22 |
0.0263 |
4.0276 |
0.0007 |
0.00 |
0.03 |
119.25 |
| AUFE |
27,478 |
0.28 |
0.0331 |
4.0742 |
0.0011 |
0.00 |
0.03 |
125.11 |
| Interval Length |
29,611 |
1.57 |
8.6215 |
1.6786 |
74.3302 |
0.00 |
1.52 |
170.63 |
| Upper sed unit |
AUCN |
23,100 |
0.30 |
0.0308 |
3.4949 |
0.0009 |
0.03 |
0.10 |
44.07 |
| AUFA |
23,100 |
0.25 |
0.0278 |
3.8598 |
0.0008 |
0.00 |
0.07 |
39.84 |
| AUFE |
25,981 |
0.24 |
0.0276 |
4.0258 |
0.0008 |
0.00 |
0.07 |
46.77 |
| Interval Length |
34,605 |
1.56 |
7.7545 |
1.5154 |
60.1319 |
0.00 |
1.52 |
222.20 |
| West dike 1 |
AUCN |
68 |
0.16 |
0.0080 |
1.7120 |
0.0001 |
0.07 |
0.07 |
1.92 |
| AUFA |
68 |
0.12 |
0.0073 |
2.0804 |
0.0001 |
0.03 |
0.03 |
1.71 |
| AUFE |
105 |
0.12 |
0.0076 |
2.1341 |
0.0001 |
0.00 |
0.03 |
1.78 |
| Interval Length |
120 |
1.36 |
2.8488 |
0.6399 |
8.1159 |
0.00 |
1.52 |
8.54 |
| West dike 2 |
AUCN |
15 |
0.07 |
0.0000 |
0.0000 |
0.000000 |
0.07 |
0.07 |
0.07 |
| AUFA |
15 |
0.03 |
0.0000 |
0.0000 |
0.000000 |
0.03 |
0.03 |
0.03 |
| AUFE |
18 |
0.04 |
0.0005 |
0.3941 |
0.000000 |
0.02 |
0.03 |
0.09 |
| Interval Length |
20 |
0.97 |
1.7519 |
0.5524 |
3.0693 |
0.10 |
1.10 |
1.52 |
| West Stock |
AUCN |
444 |
0.08 |
0.0011 |
0.4883 |
0.000001 |
0.07 |
0.07 |
0.56 |
| AUFA |
444 |
0.04 |
0.0010 |
0.7788 |
0.000001 |
0.03 |
0.03 |
0.48 |
| AUFE |
708 |
0.04 |
0.0012 |
1.0236 |
0.000001 |
0.00 |
0.03 |
0.48 |
| Interval Length |
734 |
1.48 |
0.9011 |
0.1861 |
0.8120 |
0.03 |
1.52 |
6.07 |
| | 11-34 | |
| SSR Mining Inc. | Marigold Complex S-K 1300 Report | February 12, 2024 SLR Project No.: 138.21581.00002 |
| 11.3.2.2 | Fire Assay Equivalent (AUFE) Grades |
The drill hole data included intervals fire assay (AUFA) and cyanide
soluble (AUCN) intervals (Table 11-16). Most data consisted of matched pairs (57,538) but 21,508 AUCN values have no corresponding AUFA
values.
Table 11-16: AUFA and AUCN Assay Composites
| Type |
Assay |
Count |
Average Grade
(g/t) |
| Total |
AUCN |
79,046 |
0.2366 |
| AUFA |
123,887 |
0.2040 |
| Matched Pairs |
AUCN |
57,538 |
0.1951 |
| AUFA |
57,538 |
0.2441 |
| No AUFA |
AUCN |
21,508 |
0.3408 |
| No AUCN |
AUFA |
66,349 |
0.1725 |
| FA Equivalent |
AUFE |
145,395 |
0.2342 |
The fire assay equivalent (AUFE) value for each of the informed composites
is either the AUFA value or the calculated fire assay equivalent value based on the regression, where the AUFA value is absent, but the
AUCN value is present. The AUFE data effectively increases the available fire assay-related data by 17%.
| 11.3.3 | Treatment of High Grade Assays |
Where the assay distribution is skewed positively or approaches log-normal,
erratic high grade assay values can have a disproportionate effect on the average grade of a deposit. One method of treating these outliers
to reduce their influence on the average grade is to cut or cap them at a specific grade level.
Grade capping is a technique used to mitigate the potential effect that
a small population of high-grade sample outliers can have during grade estimation. These high-grade samples are not considered to be representative
of the general sample population and are therefore capped to a level that is more representative of the general data population. Although
subjective, grade capping is a common industry practice when performing grade estimation for deposits that have significant grade variability.
In the absence of production data to calibrate the capping level, inspection of the assay distribution can be used to estimate a “first
pass” cutting level.
Grade capping values were assigned by reviewing log histograms for the
metal values for each domain. Capping values were determined to limit the upper range of estimation data to a level where the histogram
maintains a reasonable structure.
For example, the capping values for AUFE are summarized by estimation
domain in Table 11-17.
| | 11-35 | |
| SSR Mining Inc. | Marigold Complex S-K 1300 Report | February 12, 2024 SLR Project No.: 138.21581.00002 |
Table 11-17: Capping Values for AUFE
(g/t)
| Domain |
AUFE (g/t) |
|
| Base_Lst_P2 |
17.14 |
|
| Crosscut_W_P2 |
2.74 |
|
| EastStock_Dike1_P2 |
1.37 |
|
| EastStock_Dike3_P2 |
1.37 |
|
| EastStock_P2 |
27.43 |
|
| Hav_Basalt_P2 |
6.86 |
|
| Main_dike_P2 |
27.43 |
|
| MikesDike_P2 |
27.43 |
|
| Ovb_1_P2 |
13.71 |
|
| Ovb_2_P2 |
1.37 |
|
| Sandy_unit_P2 |
13.71 |
|
| Ur_Sed_1_P2 |
21.60 |
|
| Ur_Sed_2_P2 |
4.32 |
|
| W_Dike_1_P2 |
1.03 |
|
| W_Dike_2_P2 |
1.03 |
|
| WestStock_P2 |
0.21 |
|
| 11.3.3.2 | High Grade Restrictions |
In addition to capping thresholds, a secondary approach to reducing
the influence of high-grade composites is to restrict the search ellipse dimension (high yield restriction) during the estimation process.
The threshold grade levels, chosen from the basic statistics and from visual inspection of the apparent continuity of very high grades
within each estimation domain, may indicate the need to further limit their influence by restricting the range of their influence, which
is generally set to approximately half the distance of the main search.
No high-grade restriction thresholds were used for the Buffalo Valley
resource estimate.
The assay table BV_Assay_Nov was reviewed and the vast majority of the
interval lengths with assay grades greater than 0.1028 g/t are 1.524 m in length. The first and third quartiles and the median are all
1.524 m. To maintain fine resolution in the model with known subvertical and shallow grade trends and domain orientations, it was decided
to use 1.524 m as the standard composite length for gold estimation. Copper, iron, and sulfur data was obtained as 6 m long sampled intervals
and the compositing interval applied for these three elements was 6 m intervals.
Compositing was applied on the basis that if residual end intervals
for a domain intercept are shorter than 50% of the standard composite length, then the residual lengths are distributed over the entire
intercept, resulting in fractionally longer composites than the standard, but reducing the bias risk for last composites in holes.
| | 11-36 | |
| SSR Mining Inc. | Marigold Complex S-K 1300 Report | February 12, 2024 SLR Project No.: 138.21581.00002 |
Gold variograms were developed for each of the lithology domains, using
normal scores (NS) in Leapfrog EDGE. The NS variograms were back-transformed to real space for estimation purposes. Orientations were
rotated into local ‘variable orientation’ to conform to the local environment. Variogram models for AUFE are summarized in
Table 11-18. All variogram model structures are spherical model.
| | 11-37 | |
| SSR Mining Inc. | Marigold Complex S-K 1300 Report | February 12, 2024 SLR Project No.: 138.21581.00002 |
Table 11-18: Variogram Models (AUFE)
| Variogram Name |
Rotation |
Nugget |
Structure 1 |
Structure 2 |
| Dip |
Dip Azi. |
Pitch |
Sill |
Major (m) |
Semi-major (m) |
Minor (m) |
Sill |
Major (m) |
Semi-major (m) |
Minor (m) |
| AU_Base_Lst_P2: Transformed Variogram Model |
84.9 |
232.3 |
105.44 |
0.00115 |
0.0003 |
5.31 |
4.956 |
2.373 |
0.0002 |
12.69 |
12.61 |
6.96 |
| AU_Crosscut_W_P2: Transformed Variogram Model |
76.3 |
32.41 |
129.14 |
0.000016 |
0.00003 |
4.987 |
4.788 |
4.045 |
0.00001 |
20.03 |
15.58 |
7.1 |
| AU_EastStock_Dike1_P2: Transformed Variogram Model |
57.8 |
243.15 |
1.42 |
0.000016 |
0.00004 |
9.321 |
4.788 |
4.045 |
0.00002 |
27.52 |
24.09 |
11.92 |
| AU_EastStock_Dike3_P2: Transformed Variogram Model |
65 |
256.72 |
0.76 |
0.000012 |
0.00003 |
9.321 |
4.788 |
4.045 |
0.00001 |
27.52 |
24.09 |
11.92 |
| AU_EastStock_P2: Transformed Variogram Model |
88.7 |
261.51 |
115.74 |
0.000011 |
0.000004 |
10.247 |
4.788 |
4.045 |
0.000002 |
27.9 |
24.09 |
11.92 |
| AU_Hav_Basalt_P2: Transformed Variogram Model |
37.2 |
244.36 |
90.8 |
0.00009 |
0.0003 |
11.232 |
4.956 |
2.068 |
0.0001 |
53.55 |
29.89 |
18.68 |
| AU_Main_dike_P2: Transformed Variogram Model |
83.2 |
230.67 |
90.15 |
0.00127 |
0.003 |
9.321 |
4.788 |
4.045 |
0.0006 |
27.52 |
24.09 |
11.92 |
| AU_MikesDike_P2: Transformed Variogram Model |
74.4 |
251.72 |
86.53 |
0.0000026 |
0.000006 |
9.321 |
4.788 |
4.045 |
0.000003 |
27.52 |
24.09 |
11.92 |
| AU_Ovb_1_P2: Transformed Variogram Model |
3.65 |
269.62 |
149.7 |
0.00159 |
0.001 |
7.961 |
5.45 |
1.209 |
0.0004 |
37.49 |
25.79 |
5.07 |
| AU_Ovb_2_P2: Transformed Variogram Model |
3.65 |
269.62 |
149.7 |
0.000057 |
0.00004 |
7.961 |
5.45 |
1.209 |
0.00001 |
37.49 |
25.79 |
5.07 |
| AU_Sandy_unit_P2: Transformed Variogram Model |
38.8 |
239.34 |
171.61 |
0.00103 |
0.0004 |
6.544 |
5.297 |
2.166 |
0.0003 |
30.51 |
25.79 |
16.47 |
| AU_Ur_Sed_1_P2: Transformed Variogram Model |
22.6 |
247.81 |
160.47 |
0.00069 |
0.0007 |
15.712 |
5.934 |
4.773 |
0.0001 |
41.54 |
20.25 |
11.57 |
| AU_Ur_Sed_2_P2: Transformed Variogram Model |
30.2 |
286.57 |
18.82 |
0.000035 |
0.00008 |
12.439 |
4.956 |
2.166 |
0.00002 |
38.92 |
29.89 |
18.66 |
| AU_W_Dike_1_P2: Transformed Variogram Model |
71 |
225.96627 |
25.495 |
0.000012 |
0.00003 |
9.321 |
4.788 |
4.045 |
0.00001 |
27.52 |
24.09 |
11.92 |
| AU_W_Dike_2_P2: Transformed Variogram Model |
36.5 |
239.12112 |
62.452 |
0.00000003 |
0.00000006 |
9.144 |
4.572 |
3.962 |
0.00000003 |
27.43 |
27.43 |
12.19 |
| AU_WestStock_P2: Transformed Variogram Model |
88.9 |
84.41 |
77.13 |
0.00000047 |
0.0000004 |
10.366 |
4.788 |
4.045 |
0.0000004 |
27.12 |
26.99 |
9.82 |
| | 11-38 | |
| SSR Mining Inc. | Marigold Complex S-K 1300 Report | February 12, 2024 SLR Project No.: 138.21581.00002 |
| 11.3.6 | Exploratory Data Analysis |
Length weighted gold statistics are summarized in Table 11-19
Table 11-19: Length Weighted Gold
Assays (g/t) Statistics of Composite Samples by Domain
| Domain |
Element |
Count |
Mean Grade
(g/t) |
SD |
CV |
Min
(g/t) |
Median
(g/t) |
Max
(g/t) |
| Base limestone |
AUCN |
2,319 |
0.247 |
0.050 |
6.998 |
0.066 |
0.066 |
66.239 |
| AUFA |
2,319 |
0.198 |
0.046 |
7.911 |
0.034 |
0.034 |
59.897 |
| AUFE |
3,015 |
0.250 |
0.046 |
6.279 |
0.003 |
0.034 |
61.509 |
| Interval Length |
3,113 |
1.725 |
20.337 |
3.593 |
0.023 |
1.524 |
283.805 |
| Crosscut west |
AUCN |
1,019 |
0.140 |
0.008 |
1.926 |
0.066 |
0.066 |
5.107 |
| AUFA |
1,019 |
0.101 |
0.007 |
2.417 |
0.034 |
0.034 |
4.594 |
| AUFE |
1,374 |
0.097 |
0.009 |
3.050 |
0.003 |
0.034 |
5.177 |
| Interval Length |
1,726 |
1.618 |
12.660 |
2.385 |
0.035 |
1.524 |
160.418 |
| East stock |
AUCN |
949 |
0.100 |
0.004 |
1.518 |
0.066 |
0.066 |
2.265 |
| AUFA |
949 |
0.065 |
0.004 |
2.121 |
0.034 |
0.034 |
2.023 |
| AUFE |
881 |
0.059 |
0.004 |
2.440 |
0.017 |
0.034 |
2.160 |
| Interval Length |
1,049 |
1.594 |
8.015 |
1.533 |
0.050 |
1.524 |
73.052 |
| East stock dike 1 |
AUCN |
88 |
0.227 |
0.009 |
1.370 |
0.066 |
0.104 |
1.696 |
| AUFA |
88 |
0.179 |
0.008 |
1.567 |
0.034 |
0.069 |
1.509 |
| AUFE |
52 |
0.116 |
0.008 |
2.288 |
0.003 |
0.034 |
1.749 |
| Interval Length |
92 |
1.535 |
0.983 |
0.195 |
0.374 |
1.524 |
4.118 |
| East stock dike 3 |
AUCN |
238 |
0.177 |
0.014 |
2.662 |
0.066 |
0.066 |
8.404 |
| AUFA |
238 |
0.134 |
0.012 |
3.174 |
0.034 |
0.034 |
7.577 |
| AUFE |
283 |
0.154 |
0.015 |
3.377 |
0.017 |
0.034 |
9.669 |
| Interval Length |
303 |
1.281 |
3.577 |
0.851 |
0.001 |
1.524 |
16.195 |
| Hav Basalt |
AUCN |
4,041 |
0.250 |
0.031 |
4.310 |
0.066 |
0.104 |
44.939 |
| AUFA |
4,041 |
0.200 |
0.028 |
4.865 |
0.034 |
0.069 |
40.629 |
| AUFE |
3,760 |
0.156 |
0.022 |
4.884 |
0.003 |
0.041 |
24.103 |
| Interval Length |
5,482 |
1.455 |
2.546 |
0.533 |
0.003 |
1.524 |
36.655 |
| Main dike |
AUCN |
9,120 |
0.534 |
0.076 |
4.893 |
0.032 |
0.104 |
131.843 |
| AUFA |
9,120 |
0.457 |
0.069 |
5.169 |
0.003 |
0.069 |
119.246 |
| AUFE |
10,084 |
0.511 |
0.072 |
4.808 |
0.003 |
0.069 |
125.109 |
| Interval Length |
12,858 |
1.554 |
11.308 |
2.217 |
0.002 |
1.524 |
241.402 |
| | 11-39 | |
| SSR Mining Inc. | Marigold Complex S-K 1300 Report | February 12, 2024 SLR Project No.: 138.21581.00002 |
| Domain |
Element |
Count |
Mean Grade
(g/t) |
SD |
CV |
Min
(g/t) |
Median
(g/t) |
Max
(g/t) |
| Mike’s dike |
AUCN |
5 |
0.388 |
0.007 |
0.613 |
0.180 |
0.256 |
0.711 |
| AUFA |
5 |
0.325 |
0.006 |
0.662 |
0.137 |
0.206 |
0.617 |
| AUFE |
22 |
0.039 |
0.000 |
0.411 |
0.034 |
0.034 |
0.103 |
| Interval Length |
27 |
1.507 |
0.293 |
0.059 |
1.059 |
1.524 |
1.524 |
| Overburden |
AUCN |
10,288 |
0.188 |
0.031 |
5.730 |
0.032 |
0.066 |
44.750 |
| AUFA |
10,288 |
0.144 |
0.028 |
6.757 |
0.003 |
0.034 |
40.457 |
| AUFE |
9,285 |
0.108 |
0.025 |
8.087 |
0.003 |
0.034 |
46.766 |
| Interval Length |
13,526 |
1.889 |
20.659 |
3.333 |
0.000 |
1.524 |
234.028 |
| Sandy unit |
AUCN |
21,127 |
0.276 |
0.029 |
3.611 |
0.032 |
0.066 |
131.843 |
| AUFA |
21,127 |
0.224 |
0.026 |
4.028 |
0.003 |
0.034 |
119.246 |
| AUFE |
27,478 |
0.279 |
0.033 |
4.074 |
0.003 |
0.034 |
125.109 |
| Interval Length |
29,611 |
1.566 |
8.621 |
1.679 |
0.001 |
1.524 |
170.634 |
| Upper sed unit |
AUCN |
23,100 |
0.302 |
0.031 |
3.495 |
0.032 |
0.104 |
44.068 |
| AUFA |
23,100 |
0.247 |
0.028 |
3.860 |
0.003 |
0.069 |
39.840 |
| AUFE |
25,981 |
0.235 |
0.028 |
4.026 |
0.003 |
0.065 |
46.766 |
| Interval Length |
34,605 |
1.560 |
7.754 |
1.515 |
0.001 |
1.524 |
222.196 |
| West dike 1 |
AUCN |
68 |
0.161 |
0.008 |
1.712 |
0.066 |
0.066 |
1.923 |
| AUFA |
68 |
0.120 |
0.007 |
2.080 |
0.034 |
0.034 |
1.714 |
| AUFE |
105 |
0.122 |
0.008 |
2.134 |
0.003 |
0.034 |
1.783 |
| Interval Length |
120 |
1.357 |
2.849 |
0.640 |
0.004 |
1.524 |
8.535 |
| West dike 2 |
AUCN |
15 |
0.066 |
0.000 |
0.000 |
0.066 |
0.066 |
0.066 |
| AUFA |
15 |
0.034 |
0.000 |
0.000 |
0.034 |
0.034 |
0.034 |
| AUFE |
18 |
0.040 |
0.000 |
0.394 |
0.021 |
0.034 |
0.086 |
| Interval Length |
20 |
0.967 |
1.752 |
0.552 |
0.100 |
1.097 |
1.524 |
| West Stock |
AUCN |
444 |
0.076 |
0.001 |
0.488 |
0.066 |
0.066 |
0.559 |
| AUFA |
444 |
0.043 |
0.001 |
0.779 |
0.034 |
0.034 |
0.480 |
| AUFE |
708 |
0.040 |
0.001 |
1.024 |
0.003 |
0.034 |
0.480 |
| Interval Length |
734 |
1.476 |
0.901 |
0.186 |
0.030 |
1.524 |
6.074 |
Figure 11-12 and Figure 11-13 show the boxplots for fire assay and cyanide
soluble gold on fourteen domains and inside probability greater than 0.3 of AUFE grade at least 0.1028 g/t (0.003 opt).
| | 11-40 | |
| SSR Mining Inc. | Marigold Complex S-K 1300 Report | February 12, 2024 SLR Project No.: 138.21581.00002 |
Figure 11-12: Boxplot of AUFA by domain
and inside probability greater than 0.3 of AUFE grade at least 0.1028 g/t (0.003 opt)
Figure 11-13: Boxplot of AUCN by domain
and inside probability greater than 0.3 of AUFE grade at least 0.1028 g/t (0.003 opt)
| | 11-41 | |
| SSR Mining Inc. | Marigold Complex S-K 1300 Report | February 12, 2024 SLR Project No.: 138.21581.00002 |
The naïve histograms for AuFA inside probability greater than 0.3
of AUFE grade at least 0.1028 g/t (0.003 opt) for the four best grade domains, namely Main Dike East, Sandy Unit, Base Limestone, and
Upper Sed Unit, are shown in Figure 11-14. The log probability plots for AUFA are shown in Figure 11-15.
Figure 11-14: Histograms of AUFA Inside
Probability Greater Than 0.3 of AUFE Grade at Least 0.1028 g/t (0.003 opt). By Main Domains.
| | 11-42 | |
| SSR Mining Inc. | Marigold Complex S-K 1300 Report | February 12, 2024 SLR Project No.: 138.21581.00002 |
Figure 11-15: Log Probability Plots
of AuFA Inside Probability Greater than 0.3 of AUFE grade at least 0.1028 g/t (0.003 opt). By Main Domains.
| 11.3.7 | Search Strategy and Grade Interpolation Parameters |
Resource estimation was completed within an area encompassing the deposit
with block model geometry and extents as presented in Table 11-20 using Leapfrog Geo software with imperial units. A parent block size
of 7.62 m in the X (across strike) by 15.24 m in the Y (along strike) directions by 7.62 m in the Z (vertical) direction, sub-blocked
to 1.905 m (6.25 ft) by 3.81 m (12.5 ft) by 1.905 m (6.25), was chosen for the model. The ‘octree’-style of sub-blocked model
was employed to preserve volumetric resolution. The orientation of the model with a horizontal rotation (320°), dip of 0.0°, and
a plunge of 0.0° was to minimize sub-blocking along the NW-SE primary orientation of the deposit and long axis of the historical open
pit.
| | 11-43 | |
| SSR Mining Inc. | Marigold Complex S-K 1300 Report | February 12, 2024 SLR Project No.: 138.21581.00002 |
Table 11-20: Block Model parameters
(Mine Grid X, Y, Z in feet)
| BV25x25x25_rotated |
X (m) |
Y (m) |
Z (m) |
| Blocks |
Parent block |
7.62 |
15.24 |
7.62 |
| Sub-block |
1.91 |
3.81 |
1.91 |
| Extents |
Base point |
-1,036.30 |
-10,576.60 |
1,828.80 |
| Boundary size |
990.6 |
1,280.2 |
365.8 |
| Rotation |
|
Azimuth |
Dip |
Pitch |
| |
320 |
0 |
0 |
The estimate variables in the cell model are listed in Table 11-21
Table 11-21: Estimated Variables
| Element |
Variable Name |
Description |
Domains |
Remarks |
| Au |
AUFE |
Au Fire Assay Equivalent |
Lithology-based |
Estimated from composite values of AUFA with missing values replaced with fire assay equivalent values calculated using fire assay – cyanide leachable regressions |
| AUCE |
Au Cyanide Leachable Equivalent |
Lithology-based |
Calculated from AUFE estimates, using the inverse of fire assay – cyanide leachable regressions |
| AUFA |
Au Fire Assay |
Lithology-based |
Estimated directly from Au fire assay composite data |
| AUCN |
Au Cyanide Leachable |
Lithology-based |
Estimated directly from Au cyanide leachable composite data |
| Cu |
CU |
Cu grades |
Lithology-based |
Estimated from ICP composites |
| Fe |
Fe |
Fe grades |
Fe-grade shell-based |
Estimated from ICP composites |
| S |
STOT |
S grades |
S-grade shell-based |
Estimated from LECO composites |
| TCF |
TCF |
Bulk density (ft3 / st) |
Lithology-based |
Assigned from averages of relevant domain |
| 11.3.7.1 | Estimation Domaining |
Seven 3D volumetric models were constructed to serve as estimation domains,
as listed in Table 11-22
| | 11-44 | |
| SSR Mining Inc. | Marigold Complex S-K 1300 Report | February 12, 2024 SLR Project No.: 138.21581.00002 |
Table 11-22: Volumetric Models Generated
for Estimation Domaining and Grade Estimation
| Model Name |
Target |
Number of Components |
Construction Elements |
| Buffalo Valley-Warthog |
AUFA/AUFE/AUCN/AUCE |
14 |
lithologies |
| Buffalo Valley-Warthog notopo |
AUFA/AUFE/AUCN/AUCE |
14 |
lithologies |
| BV_for_Cu_Domains |
Cu ppm |
12 |
lithologies |
| GM_KM_Clusters |
geochemical groups |
4 |
10 K-Means clusters |
| Solid |
topography |
2 |
topography |
| Volume-for_DH_vg |
drill sample data |
1 |
model volume |
| Grade shells Fe |
Fe ppm (ICP) |
3 |
grade isoshells |
| Grade shells STOT |
STOT ppm (LECO) |
3 |
grade isoshells |
Contact analysis for exploration composites was used to investigate
the extension of the hard or soft domain boundaries.
The boundary analysis graph for the Havallah Basalt domain is interpreted
as suitable for hard boundary estimation and is shown in Figure 11-16.
Figure 11-16: Havallah Basalt Boundary
Conditions (distance in feet, grade in opt)
| | 11-45 | |
| SSR Mining Inc. | Marigold Complex S-K 1300 Report | February 12, 2024 SLR Project No.: 138.21581.00002 |
The boundary analysis graph for the Main Dike domain is interpreted
as suitable for soft 1.52 m boundary estimation and is shown in Figure 11-17.
Figure 11-17: Main Dike Boundary Conditions
(distance in feet, grade in opt)
Boundary conditions are often ambiguous due to the large size of some
of the units with limited sampling and abutment against units with different characters. Consequently, domain boundaries with ambiguous
character were assigned hard boundaries.
The types of boundaries used for estimates based on lithology domains
are summarized in Table 11-23.
| | 11-46 | |
| SSR Mining Inc. | Marigold Complex S-K 1300 Report | February 12, 2024 SLR Project No.: 138.21581.00002 |
Table 11-23: Estimation Domain Boundary
Types
| Domain |
Boundary Type |
Range
(m) |
|
| West Stock |
Hard |
0 |
|
| West dike 2 |
Hard |
0 |
|
| West dike 1 |
Hard |
0 |
|
| fault block 2: Upper sed unit |
Hard |
0 |
|
| fault block 1: Upper sed unit |
Soft |
3.05 |
|
| Sandy unit |
Soft |
1.52 |
|
| Fault block 2: Overburden |
Hard |
0 |
|
| Fault block 1: Overburden |
Hard |
0 |
|
| Mike’s dike |
Hard |
0 |
|
| Main dike |
Soft |
1.52 |
|
| Fault block 1: Hav Basalt |
Hard |
0 |
|
| East stock |
Hard |
0 |
|
| Fault block 1: East stock dike 3 |
Hard |
0 |
|
| Fault block 1: East stock dike 1 |
Hard |
0 |
|
| Crosscut west |
Soft |
3.05 |
|
| Fault block 1: Base limestone |
Hard |
|
|
| 11.3.7.3 | Search Neighborhood Design |
An initial estimation for AUFE was carried out using the relevant variogram
range as an estimation range limit. This was found to be too restrictive and subsequently estimates were made to a range limit of twice
the variogram range.
Most domains were estimated with variable search and variogram orientations
based on the local lithological and grade trends. Some domains with limited or ambiguous data were estimated using fixed orientations.
A minimum of four and maximum of 20 composites, drawn from a maximum
of three drill holes, were used for estimation. This ensured at least two holes were used for estimating each block.
Grade interpolation parameters for the kriging estimators for AUFE are
summarized in Table 11-24.
| | 11-47 | |
| SSR Mining Inc. | Marigold Complex S-K 1300 Report | February 12, 2024 SLR Project No.: 138.21581.00002 |
Table 11-24: Grade Interpolation Parameters
for AUFE
| Domain |
Ellipsoid
Ranges |
Ellipsoid
Directions |
Variable
Orientation |
Number
of Samples |
Drill
Hole Limit |
| Max |
Intermediate |
Min |
Dip |
Dip
Azi. |
Pitch |
|
Min |
Max |
Max
Samples per Hole |
| (m) |
(m) |
(m) |
| Fault
block 1: |
24.99 |
24.99 |
14.02 |
|
|
|
Variable
Orientation |
4 |
20 |
3 |
| Base
limestone |
| Crosscut
west |
40.23 |
31.09 |
14.02 |
76.32 |
32.41 |
129.1422 |
None |
4 |
20 |
3 |
| Fault
block 1: |
54.86 |
48.16 |
23.77 |
|
|
|
Variable
Orientation |
4 |
20 |
3 |
| East
stock dike 1 |
| Fault
block 1: |
54.86 |
48.16 |
23.77 |
|
|
|
Variable
Orientation |
4 |
20 |
3 |
| East
stock dike 3 |
| East
stock |
56.08 |
48.16 |
23.77 |
88.7 |
261.51 |
115.74 |
None |
4 |
20 |
3 |
| Fault
block 1: Hav Basalt |
108.51 |
59.74 |
37.19 |
|
|
|
Variable
Orientation |
4 |
20 |
3 |
| Main
dike |
54.86 |
48.16 |
23.77 |
|
|
|
Variable
Orientation |
4 |
20 |
3 |
| Mike’s
dike |
54.86 |
48.16 |
23.77 |
|
|
|
Variable
Orientation |
4 |
20 |
3 |
| Fault
block 1: Overburden |
74.98 |
51.82 |
10.06 |
|
|
|
Variable
Orientation |
4 |
20 |
3 |
| Fault
block 2: Overburden |
60.96 |
59.74 |
32.92 |
|
|
|
Variable
Orientation |
4 |
20 |
3 |
| Sandy
unit |
60.96 |
51.82 |
32.92 |
|
|
|
Variable
Orientation |
4 |
20 |
3 |
| Fault
block 1: |
82.91 |
40.23 |
23.16 |
|
|
|
Variable
Orientation |
4 |
20 |
3 |
| Upper
sed unit |
| Fault
block 2: |
78.03 |
59.74 |
37.19 |
|
|
|
Variable
Orientation |
4 |
20 |
3 |
| Upper
sed unit |
| West
dike 1 |
54.86 |
48.16 |
23.77 |
|
|
|
Variable
Orientation |
4 |
20 |
3 |
| West
dike 2 |
54.86 |
54.86 |
24.38 |
|
|
|
Variable
Orientation |
4 |
20 |
3 |
| West
Stock |
54.25 |
54.25 |
19.51 |
88.94 |
84.41 |
77.13 |
None |
4 |
20 |
3 |
| | 11-48 | |
| SSR Mining Inc. | Marigold Complex S-K 1300 Report | February 12, 2024 SLR Project No.: 138.21581.00002 |
| 11.3.7.4 | Cyanide Soluble Estimation |
The AUFE variable was used as the primary estimation variable. To account
for un-estimated blocks and dump material (assigned a value of 0.00343 g/t), a final variable AUFE was created that represents the final
fire assay equivalent gold. The final cyanide soluble equivalent gold value (AUCN) was generated using the inverse of the regressions
shown in Table 11-25 for each of the 14 lithology domains.
| | 11-49 | |
| SSR Mining Inc. | Marigold Complex S-K 1300 Report | February 12, 2024 SLR Project No.: 138.21581.00002 |
Table 11-25: Fire Assay Equivalent
Regression Parameters (from AUFA and AUCN)
| Lithology |
Variable |
Count |
Length
(m) |
Mean
(g/t) |
SD |
CV |
Variance |
Min
(g/t) |
Median
(g/t) |
Max
(g/t) |
Number of Pairs |
Valid Pairs |
a |
c |
R2 |
| Base limestone |
AUFA |
3,015 |
14,935.14 |
0.2497 |
0.0457 |
6.2794 |
0.0021 |
0.0034 |
0.0343 |
61.5085 |
2,450 |
2,433 |
1.09374 |
0.002571 |
0.91913 |
| |
AUCN |
2,319 |
11,388.95 |
0.1978 |
0.0456 |
7.9111 |
0.0021 |
0.0343 |
0.0343 |
59.8971 |
|
|
|
|
|
| Crosscut west |
AUFA |
1,374 |
6,830.928 |
0.0966 |
0.0086 |
3.0499 |
0.0001 |
0.0034 |
0.0343 |
5.1771 |
749 |
726 |
1.17277 |
0.000037 |
0.917686 |
| |
AUCN |
1,019 |
5,123.043 |
0.1012 |
0.0071 |
2.4167 |
0.0001 |
0.0343 |
0.0343 |
4.5943 |
|
|
|
|
|
| East stock |
AUCN |
949 |
4,620.179 |
0.0649 |
0.0040 |
2.1211 |
0.0000 |
0.0343 |
0.0343 |
2.0229 |
786 |
784 |
1.0672 |
-0.000016 |
0.982123 |
| |
AUFA |
881 |
4,283.836 |
0.0585 |
0.0042 |
2.4399 |
0.0000 |
0.0171 |
0.0343 |
2.1600 |
|
|
|
|
|
| East stock dike 1 |
AUCN |
88 |
436.227 |
0.1794 |
0.0082 |
1.5670 |
0.0001 |
0.0343 |
0.0686 |
1.5086 |
49 |
34 |
1.13495 |
0.000579 |
0.961487 |
| |
AUFA |
52 |
258.623 |
0.1157 |
0.0077 |
2.2880 |
0.0001 |
0.0034 |
0.0343 |
1.7486 |
|
|
|
|
|
| East stock dike 3 |
AUFA |
283 |
1,109.509 |
0.1537 |
0.0151 |
3.3770 |
0.0002 |
0.0171 |
0.0343 |
9.6686 |
226 |
226 |
1.26656 |
-0.000325 |
0.994179 |
| |
AUCN |
238 |
904.797 |
0.1344 |
0.0124 |
3.1736 |
0.0002 |
0.0343 |
0.0343 |
7.5771 |
|
|
|
|
|
| Hav Basalt |
AUCN |
4,041 |
19,159.98 |
0.2003 |
0.0284 |
4.8653 |
0.0008 |
0.0343 |
0.0686 |
40.6286 |
2,453 |
2,406 |
1.0796 |
0.000537 |
0.985003 |
| |
AUFA |
3,760 |
17,585.86 |
0.1575 |
0.0222 |
4.8336 |
0.0005 |
0.0034 |
0.0514 |
24.1028 |
|
|
|
|
|
| Main dike east |
AUFA |
10,082 |
48,258.04 |
0.5118 |
0.0717 |
4.8008 |
0.0051 |
0.0034 |
0.0686 |
125.1085 |
6,826 |
6,665 |
1.06287 |
0.002591 |
0.906366 |
| |
AUCN |
9,117 |
44,821.02 |
0.4572 |
0.0689 |
5.1686 |
0.0048 |
0.0034 |
0.0686 |
119.2457 |
|
|
|
|
|
| Mike’s dike |
AUFA |
22 |
110 |
0.0389 |
0.0005 |
0.4115 |
0.0000 |
0.0343 |
0.0343 |
0.1029 |
0 |
0 |
|
|
|
| |
AUCN |
5 |
23.475 |
0.3250 |
0.0063 |
0.6618 |
0.0000 |
0.1371 |
0.2057 |
0.6171 |
|
|
|
|
|
| Overburden |
AUCN |
10,288 |
51,055.82 |
0.1439 |
0.0284 |
6.7575 |
0.0008 |
0.0034 |
0.0343 |
40.4571 |
6,476 |
6,322 |
1.08635 |
0.000098 |
0.95513 |
| |
AUFA |
9,285 |
48,244.34 |
0.1087 |
0.0254 |
8.0106 |
0.0006 |
0.0034 |
0.0343 |
46.7657 |
|
|
|
|
|
| Sandy unit |
AUFA |
27,480 |
133,635.8 |
0.2794 |
0.0331 |
4.0637 |
0.0011 |
0.0034 |
0.0343 |
125.1085 |
19,545 |
19,213 |
1.1628 |
0.000289 |
0.93386 |
| |
AUCN |
21,128 |
104,860.1 |
0.2238 |
0.0263 |
4.0278 |
0.0007 |
0.0034 |
0.0343 |
119.2457 |
|
|
|
|
|
| Upper sed unit |
AUFA |
25,981 |
127,305.8 |
0.2357 |
0.0276 |
4.0136 |
0.0008 |
0.0034 |
0.0686 |
46.7657 |
15,078 |
14,483 |
1.20139 |
0.000452 |
0.915477 |
| |
AUCN |
23,100 |
11,4481.1 |
0.2472 |
0.0278 |
3.8598 |
0.0008 |
0.0034 |
0.0686 |
39.8400 |
|
|
|
|
|
| West dike 1 |
AUFA |
105 |
437.579 |
0.1229 |
0.0076 |
2.1258 |
0.0001 |
0.0034 |
0.0343 |
1.7829 |
57 |
55 |
1.03556 |
0.000483 |
0.93283 |
| |
AUCN |
68 |
300.097 |
0.1199 |
0.0073 |
2.0804 |
0.0001 |
0.0343 |
0.0343 |
1.7143 |
|
|
|
|
|
| West dike 2 |
AUFA |
18 |
55.066 |
0.0402 |
0.0005 |
0.3941 |
0.0000 |
0.0206 |
0.0343 |
0.0857 |
15 |
15 |
|
|
|
| |
AUCN |
15 |
48.053 |
0.0343 |
0 |
0.0000 |
0.0000 |
0.0343 |
0.0343 |
0.0343 |
|
|
|
|
|
| West Stock |
AUFA |
708 |
3,412.776 |
0.0402 |
0.0012 |
1.0260 |
0.0000 |
0.0034 |
0.0343 |
0.4800 |
444 |
410 |
1.12977 |
-0.00004 |
0.845072 |
| |
AUCN |
444 |
2,145.632 |
0.0434 |
0.0010 |
0.7788 |
0.0000 |
0.0343 |
0.0343 |
0.4800 |
|
|
|
|
|
| | 11-50 | |
| SSR Mining Inc. | Marigold Complex S-K 1300 Report | February 12, 2024 SLR Project No.: 138.21581.00002 |
Table 11-26 shows density data stats by geological formation. The average
density for each formation has been assigned for blocks. Lithologies with no data have been assigned to be 2.637 tonne/m3 and
in the absence of updates, the density for the dump material was assigned to be 1.779 t/m3.
Table 11-26: Density Data Statistics
| Name |
Count |
Mean
(t/m3) |
SD
(t/m3) |
CV
(t/m3) |
Min
(t/m3) |
Median
(t/m3) |
Max
(t/m3) |
| Base limestone |
79 |
2.722 |
0.3890 |
0.0331 |
3.088 |
2.724 |
2.495 |
| Crosscut west |
16 |
2.684 |
0.4286 |
0.0359 |
2.771 |
2.738 |
2.490 |
| Hav Basalt |
52 |
2.737 |
0.6717 |
0.0574 |
2.996 |
2.775 |
2.387 |
| Main dike east |
211 |
2.612 |
1.2500 |
0.1019 |
2.957 |
2.641 |
1.064 |
| Overburden |
7 |
2.426 |
1.1734 |
0.0889 |
2.638 |
2.443 |
2.110 |
| Sandy unit |
221 |
2.605 |
0.4138 |
0.0336 |
2.965 |
2.601 |
2.095 |
| Upper sed unit |
170 |
2.657 |
0.7354 |
0.0610 |
3.188 |
2.621 |
2.038 |
| West dike 1 |
1 |
2.655 |
|
|
2.655 |
2.655 |
2.655 |
A Mineral Resource is defined as a concentration or occurrence of material
of economic interest in or on the Earth’s crust in such form, grade or quality, and quantity that there are reasonable prospects
for economic extraction. A mineral resource is a reasonable estimate of mineralization, considering relevant factors such as cut-off grade,
likely mining dimensions, location, or continuity, that with the assumed and justifiable technical and economic conditions, is likely
to, in whole or in part, become economically extractable. It is not merely an inventory of all mineralization drilled or sampled.
Based on this definition of Mineral Resources, the Mineral Resources
estimated in this TRS have been classified according to the definitions below based on geology, grade continuity, and drill hole spacing.
Measured Mineral Resource is that part of a mineral resource
for which quantity and grade or quality are estimated on the basis of conclusive geological evidence and sampling. The level of geological
certainty associated with a measured mineral resource is sufficient to allow a qualified person to apply modifying factors, as defined
in this section, in sufficient detail to support detailed mine planning and final evaluation of the economic viability of the deposit.
Because a measured mineral resource has a higher level of confidence than the level of confidence of either an indicated mineral resource
or an inferred mineral resource, a measured mineral resource may be converted to a proven mineral reserve or to a probable mineral reserve.
Indicated Mineral Resource is that part of a mineral resource
for which quantity and grade or quality are estimated on the basis of adequate geological evidence and sampling. The level of geological
certainty associated with an indicated mineral resource is sufficient to allow a qualified person to apply modifying factors in sufficient
detail to support mine planning and evaluation of the economic viability of the deposit. Because an indicated mineral resource has a lower
level of confidence than the level of confidence of a measured mineral resource, an indicated mineral resource may only be converted to
a probable mineral reserve.
| | 11-51 | |
| SSR Mining Inc. | Marigold Complex S-K 1300 Report | February 12, 2024 SLR Project No.: 138.21581.00002 |
Inferred Mineral Resource is that part of a mineral resource
for which quantity and grade or quality are estimated on the basis of limited geological evidence and sampling. The level of geological
uncertainty associated with an inferred mineral resource is too high to apply relevant technical and economic factors likely to influence
the prospects of economic extraction in a manner useful for evaluation of economic viability. Because an inferred mineral resource has
the lowest level of geological confidence of all mineral resources, which prevents the application of the modifying factors in a manner
useful for evaluation of economic viability, an inferred mineral resource may not be considered when assessing the economic viability
of a mining project and may not be converted to a mineral reserve.
Mineral Resource material was classified using criteria based on the
distance to informing composites and kriging slope of regression (SoR), as summarized in Table 11-27.
Table 11-27: Classification Rules
| Material |
Measure |
Threshold |
Outcome |
| Mineralized Stockpile |
|
|
Not in Resources |
| In Situ |
Average distance to composites |
< 46 m |
Indicated |
| Slope of regression factor |
< (400*SoR -30) |
Indicated |
| SoR |
>= 0.1 |
Inferred |
| SoR |
<0.1 |
Not in Resources |
| | 11-52 | |
| SSR Mining Inc. | Marigold Complex S-K 1300 Report | February 12, 2024 SLR Project No.: 138.21581.00002 |
Figure 11-18: Classification –
Buffalo Valley Deposit
Note: Grid in Local Mine Coordinates.
SSR Mining Inc. Marigold
Complex Nevada, USA Classification Buffalo Valley Deposit
| | 11-53 | |
| SSR Mining Inc. | Marigold Complex S-K 1300 Report | February 12, 2024 SLR Project No.: 138.21581.00002 |
| 11.3.9.1 | QP Comments on Classification |
In the SLR QP’s opinion, the classification of Mineral Resources
is reasonable and appropriate for Mineral Resource disclosure and there is reasonable expectation that the majority of Inferred Mineral
Resources could be upgraded to Indicated Mineral Resources with continued exploration.
| 11.3.10 | Estimation Validation |
The Buffalo Valley block model estimates were validated using industry
standard techniques including:
| · | Local validation using visual inspections on sections and plans, viewing composites versus block estimates. |
| · | Global validation by comparison of composite statistics versus block estimates. |
| · | Local validation by comparison of average assay grades with average block estimates along different directions (swath plots). |
The SLR QP found grade continuity to be reasonable and confirmed that
the block grades were reasonably consistent with local drill hole composite grades.
| 11.3.10.1 | Visual Inspection |
The block model estimates were reviewed by NW-SE and NE-SW sections
and reasonably conform to the composite data. Examples for AUFE, in NE-SW sections, are shown in Figure 11-19.
| | 11-54 | |
| SSR Mining Inc. | Marigold Complex S-K 1300 Report | February 12, 2024 SLR Project No.: 138.21581.00002 |
Figure 11-19: Cross Section Buffalo
Valley Deposit
Note: Grid in Local Mine Coordinates.
SSR Mining Inc. Marigold
Complex Nevada, USA Cross Section Buffalo Valley Deposit
| | 11-55 | |
| SSR Mining Inc. | Marigold Complex S-K 1300 Report | February 12, 2024 SLR Project No.: 138.21581.00002 |
| 11.3.10.2 | Estimation Statistics |
The statistical summary of gold grade estimates is summarized in Table
11-28.
| | 11-56 | |
| SSR Mining Inc. | Marigold Complex S-K 1300 Report | February 12, 2024 SLR Project No.: 138.21581.00002 |
Table 11-28: Statistical Summary of
Gold Grade Estimates (g/t)
| Domain |
AUFE Composites |
NN Estimates |
ID2 Estimates |
OK Estimates |
| Count |
Mean |
Variance |
Min |
Max |
Mean |
Variance |
Min |
Max |
Mean |
Variance |
Min |
Max |
Mean |
Variance |
Min |
Max |
| (g/t) |
|
(g/t) |
(g/t) |
(g/t) |
|
(g/t) |
(g/t) |
(g/t) |
|
(g/t) |
(g/t) |
(g/t) |
|
(g/t) |
(g/t) |
| Base limestone |
3,804 |
0.213 |
0.002 |
0.003 |
60.528 |
0.098 |
0.001 |
0.002 |
17.143 |
0.144 |
0.001 |
0.003 |
15.488 |
0.147 |
0.001 |
0.004 |
8.274 |
| Crosscut west |
1,613 |
0.107 |
0.000 |
0.003 |
5.177 |
0.089 |
0.000 |
0.003 |
2.743 |
0.110 |
0.000 |
0.008 |
2.127 |
0.114 |
0.000 |
0.010 |
0.923 |
| East stock |
888 |
0.058 |
0.000 |
0.034 |
2.153 |
0.059 |
0.000 |
0.002 |
2.152 |
0.066 |
0.000 |
0.004 |
0.977 |
0.060 |
0.000 |
0.032 |
0.531 |
| East stock dike 1 |
58 |
0.106 |
0.000 |
0.003 |
1.749 |
0.102 |
0.000 |
0.003 |
1.371 |
0.107 |
0.000 |
0.005 |
0.903 |
0.129 |
0.000 |
0.029 |
0.370 |
| East stock dike 3 |
225 |
0.132 |
0.000 |
0.017 |
2.078 |
0.118 |
0.000 |
0.017 |
1.371 |
0.138 |
0.000 |
0.022 |
1.058 |
0.124 |
0.000 |
0.030 |
0.477 |
| Hav Basalt |
3,569 |
0.155 |
0.001 |
0.003 |
22.375 |
0.127 |
0.000 |
0.003 |
6.857 |
0.118 |
0.000 |
0.014 |
2.704 |
0.118 |
0.000 |
0.025 |
1.969 |
| Main dike east |
15,211 |
0.583 |
0.005 |
0.003 |
125.109 |
0.339 |
0.000 |
0.003 |
27.429 |
0.388 |
0.000 |
0.006 |
18.197 |
0.414 |
0.000 |
0.018 |
7.630 |
| Overburden |
10,257 |
0.104 |
0.001 |
0.003 |
39.977 |
0.086 |
0.000 |
0.002 |
13.714 |
0.101 |
0.000 |
0.003 |
7.421 |
0.107 |
0.000 |
0.003 |
4.288 |
| Sandy unit |
30,821 |
0.278 |
0.002 |
0.003 |
125.109 |
0.129 |
0.000 |
0.002 |
13.714 |
0.144 |
0.000 |
0.003 |
11.204 |
0.147 |
0.000 |
0.004 |
4.576 |
| Upper sed unit |
29,007 |
0.250 |
0.001 |
0.003 |
46.766 |
0.113 |
0.000 |
0.002 |
21.600 |
0.143 |
0.000 |
0.004 |
14.303 |
0.146 |
0.000 |
0.007 |
8.243 |
| West dike 1 |
86 |
0.124 |
0.000 |
0.003 |
1.783 |
0.085 |
0.000 |
0.003 |
1.029 |
0.087 |
0.000 |
0.015 |
0.742 |
0.080 |
0.000 |
0.031 |
0.339 |
| West dike 2 |
11 |
0.041 |
0.000 |
0.034 |
0.069 |
0.043 |
0.000 |
0.033 |
0.069 |
0.042 |
0.000 |
0.034 |
0.060 |
0.042 |
0.000 |
0.037 |
0.048 |
| West Stock |
825 |
0.038 |
0.000 |
0.003 |
0.480 |
0.030 |
0.000 |
0.002 |
0.206 |
0.035 |
0.000 |
0.005 |
0.170 |
0.036 |
0.000 |
0.009 |
0.106 |
| | 11-57 | |
| SSR Mining Inc. | Marigold Complex S-K 1300 Report | February 12, 2024 SLR Project No.: 138.21581.00002 |
Swath plots were generated for strategic domains and for the global
estimates and grade patterns they are reasonable in comparison with the composite data and alternative estimation methods (inverse distance
squared and nearest neighbor).
The black line represents composite data, red = Kriged estimates, blue
= inverse distance to the second power and green represents nearest neighbor. The pink histogram represents the volume.
Swath plots for AUFE estimates in the complete block model are shown
in Figure 11-20 to Figure 11-22, inclusive. The red line represents Kriged estimates, blue = inverse distance to the second power and
green represents nearest neighbor. The pink histogram represents the volume.
Figure 11-20: Swath Plot SW-NE for
AUFE
| | 11-58 | |
| SSR Mining Inc. | Marigold Complex S-K 1300 Report | February 12, 2024 SLR Project No.: 138.21581.00002 |
Figure 11-21: Swath Plot NW-SE for
AUFE
Figure 11-22: Swath Plot Elevation
for AUFE
| | 11-59 | |
| SSR Mining Inc. | Marigold Complex S-K 1300 Report | February 12, 2024 SLR Project No.: 138.21581.00002 |
| 11.3.11 | Prospects of Economic Extraction for Mineral Resources |
Mineral resources must demonstrate reasonable prospects for economic
extraction (RPEE) which generally implies that the quantity and grade estimates meet certain economic thresholds and that the mineral
resources are reported at an appropriate cut-off grade taking into account extraction scenarios.
Metal prices used for reserves are based on consensus, long term forecasts
from banks, financial institutions, and other sources. For resources, metal prices used are slightly higher than those for reserves.
A reporting cut-off grade for the Buffalo Valley deposit based on assumed
costs for open pit extraction and heap leach processing and commodity prices that provide a reasonable basis for establishing the prospects
of economic extraction for Mineral Resources was established and reviewed by the SLR QP.
| 11.3.11.1 | Cut-Off Grade Estimation with Whittle Parameters |
Mineral Resources for Buffalo Valley were calculated based on a Whittle
optimized pit using a regularized block model set to the parent block size of 7.62 m in the X (across strike) by 7.62 m in the Y (along
strike) by 7.62 m in the Z (vertical) at cut-off grades based on lithology type (CSHF=0.279 g/t gold, GRNST = 0.184 g/t gold, INT = 0.134
g/t gold, and SHF = 0.158 g/t gold, factored for recovery, royalty, and net proceeds l) using an assumed gold price of $1,750/oz. Input
parameters for the Whittle pit optimization are provided in Table 11-29.
Table 11-29: Buffalo Valley Resource
Pit Parameters and Cut-off Grades
| Parameters(5) |
Unit |
Material Type(6) |
| CSHF(1) |
GRNST(2) |
INT(3) |
SHF(4) |
| Gold Price |
US$/oz |
1,750 |
1,750 |
1,750 |
1,750 |
| Gold Sales, Insurance, Legal and Social |
US$/oz |
0.00 |
0.00 |
0.00 |
0.00 |
| Royalties |
US$/oz |
50.00 |
50.00 |
50.00 |
50.00 |
| Total Selling Cost |
US$/oz |
50.00 |
50.00 |
50.00 |
50.00 |
| |
|
|
|
|
|
| Processing Au Recovery |
% |
36.2% |
54.9% |
75.3% |
63.8% |
| Payable Au |
% |
100.0% |
100.0% |
100.0% |
100.0% |
| |
|
|
|
|
|
| Mining Dilution |
% |
1.00 |
1.00 |
1.00 |
1.00 |
| |
|
|
|
|
|
| Processing Cost |
US$/t ore |
4.35 |
4.35 |
4.35 |
4.35 |
| Rehandling Cost |
US$/t ore |
0.00 |
0.00 |
0.00 |
0.00 |
| Operational Support (G&A) |
US$/t ore |
1.16 |
1.16 |
1.16 |
1.16 |
| Total |
US$/t ore |
5.51 |
5.51 |
5.51 |
5.51 |
| |
|
|
|
|
|
| Cut-off Grade – Marginal |
g/t |
0.279 |
0.184 |
0.134 |
0.158 |
| |
|
|
|
|
|
| Mining Cost |
US$/t mined |
2.92 |
2.92 |
2.92 |
2.92 |
| |
|
|
|
|
|
| Cut-off Grade- Full |
g/t |
0.426 |
0.281 |
0.205 |
0.242 |
| | 11-60 | |
| SSR Mining Inc. | Marigold Complex S-K 1300 Report | February 12, 2024 SLR Project No.: 138.21581.00002 |
Note:
| 1. | CSHF – Calc-silicate hornfels |
| 4. | SHF – Siliceous hornfels |
| 5. | Cut-off grade calculated for all material types using 2023 parameters assuming new equipment. |
| 6. | All material types are assumed to be crushed. |
The gold price of $1,750/oz was selected after consideration of the
pricing information described in Section 16, which includes a description of the time frame used for the selection of the price and the
reasons for selection of such a time frame. The metal price is representative of the range of price estimates publicly reported for Mineral
Resource cut-offs. The Marigold Mineral Resource is assumed to be mined by open pit.
By definition, the estimation of Mineral Resources has considered environmental,
permitting, legal, title, taxation, mining, metallurgical, infrastructure, socio-economic, marketing, and political factors and other
constraints, as discussed in various sections of the TRS.
| 11.3.12 | Mineral Resource Reporting |
Mineral Resources are reported from Vulcan software based on the regularized
block model used in the Whittle pit optimization. SLR is unaware of any current environmental, permitting, legal, title, taxation, socio-
economic, marketing, political, or other relevant factors that could materially affect the Mineral Resources estimate for Marigold (exclusive
of Mineral Reserves) as of July 31, 2023, presented in Table 11-30.
Table 11-30: Details of Buffalo Valley
Mineral Resources Estimate Exclusive of Mineral Reserves as of July 31, 2023
| Category |
Tonnes
(Mt) |
Grade
(g/t Au) |
Contained Metal
(Moz Au) |
Cut-off Grade
(g/t Au) |
Metallurgical Recovery
(%) |
| Measured |
- |
- |
- |
- |
- |
| Indicated |
14.89 |
0.57 |
0.27 |
0.134 to 0.279 |
62.7% |
| Total Measured + Indicated |
14.89 |
0.57 |
0.27 |
0.134 to 0.279 |
62.7% |
| Inferred |
8.77 |
0.51 |
0.15 |
0.134 to 0.279 |
64.6% |
Notes:
| 1. | The Mineral Resource estimate was prepared in accordance with S-K 1300 definitions. |
| 2. | The Mineral Resource estimate is based on an optimized pit shell at cut-off grades based on lithology type (CSHF=0.279 g/t gold, GRNST
= 0.184 g/t gold, and INT = 0.134 g/t gold, factored for recovery, royalty, and net proceeds), with a gold price assumption of $1,750/oz. |
| | 11-61 | |
| SSR Mining Inc. | Marigold Complex S-K 1300 Report | February 12, 2024 SLR Project No.: 138.21581.00002 |
| 3. | Bulk densities (in t/m3) were assigned by lithology ranging from a low of 2.426 (Overburden) to a high of 2.737 (Basalt)
with a weighted average of 2.63. |
| 4. | The Mineral Resources estimate is reported below the as-mined surface as of July 31, 2023, and is exclusive of Mineral Reserves. |
| 5. | The point of reference for Mineral Resources is the entry to the carbon columns in the processing facility. |
| 6. | Mineral Resources are reported exclusive of Mineral Reserves. |
| 7. | SSR has 100% ownership of the Property. |
| 8. | All ounces reported represent troy ounces, and g/t represents grams per metric tonne. |
| 9. | Totals may vary due to rounding. |
| 11.3.13 | Comparison with Previous Estimate |
There is no comparison to previous resource estimates as this is the
initial MRE for the Buffalo Valley deposit.
| 11.3.14 | Mineral Resource Uncertainty |
Mineral Resources are not Mineral Reserves and do not have demonstrated
economic viability, nor is there certainty that all or any part of the Mineral Resource estimated here will be converted to Mineral Reserves
through further study.
Sources of uncertainty that may affect the reporting of Mineral Resources
include sampling or drilling methods, data processing and handling, geologic modeling, and estimation. There are sources of uncertainty
in the MRE at the Buffalo Valley deposit which depend on the classification assigned. The SLR QP has not identified any relevant technical
and/or economic factors that require resolution with regards to the Mineral Resource estimate.
The SLR QP reviewed the assumptions, parameters, and methods used to
prepare the Mineral Resources Statement and is of the opinion that the Mineral Resources are estimated and prepared in accordance with
S-K 1300.
The SLR QP is of the opinion that with consideration of the recommendations
summarized in Sections 1 and 23 of this TRS, any issues relating to all relevant technical and economic factors likely to influence the
prospect of economic extraction can be resolved with further work.
| | 11-62 | |
| SSR Mining Inc. | Marigold Complex S-K 1300 Report | February 12, 2024 SLR Project No.: 138.21581.00002 |
| 12.0 | Mineral Reserve Estimates |
The Mineral Reserve estimate (MRE) for Marigold, as of September 30,
2023, was completed by the site technical department, and is presented in Table 12-1.
The SLR QP reviewed the assumptions, parameters, and methods used to
prepare the Mineral Resources Statement and is of the opinion that the Mineral Resources are estimated and prepared in accordance with
the U.S. Securities and Exchange Commission (US SEC) Regulation S-K subpart 1300 rules for Property Disclosures for Mining Registrants
(S-K 1300).
The SLR QP
considers that the
knowledge of the
deposit setting, lithologies,
structural controls on mineralization,
and the mineralization
style and setting,
is sufficient to
support the MRE
to the level
of classification assigned.
The SLR QP
considers the resource cut-off grade
and Whittle pit shapes guide to identify
those portions of
the MRE that meet the requirement for the prospects
for economic extraction to be appropriate for
this style of gold deposit and mineralization.
The level
of uncertainty has
been adequately reflected
in the classification
of Mineral Resources
for the Property.
The MRE presented may
be materially impacted
by any future
changes in the
break-even cut-off grade,
which may result
from changes in
mining method selection, mining
costs, processing recoveries
and costs, metal
price fluctuations, or
significant changes in
geological knowledge.
Table 12-1: Summary of Marigold Mineral
Reserves Estimate as of September 30, 2023
| |
Proven |
Probable |
Total |
Cut-off Grade (g/t) |
Metallurgical Recovery
(%) |
Tonnage
(Mt) |
Au Grade
(g/t) |
Tonnage
(Mt) |
Au Grade
(g/t) |
Tonnage
(Mt) |
Au Grade
(g/t) |
Contained Gold (Moz) |
| In Situ |
– |
– |
154.7 |
0.51 |
154.7 |
0.51 |
2.54 |
0.069 |
74.2 |
| Stockpile |
|
|
20.1 |
0.14 |
20.1 |
0.14 |
0.09 |
0.069 |
76.8 |
| Leach Pad Inventory |
|
|
|
|
|
|
0.35 |
|
70.6 |
| Total |
– |
– |
174.8 |
0.47 |
174.8 |
0.47 |
2.98 |
0.069 |
73.8 |
Notes:
| 1. | The Mineral Reserve estimate was prepared in accordance with S-K 1300 definitions. |
| 2. | The Mineral Reserve estimate is based on a metal price assumption of $1,450/oz gold and is reported at a cut-off grade of 0.069 g/t payable
Au (Au assay factored for recovery, royalty, and net proceeds). |
| 3. | No mining dilution is applied to the grade of the Mineral Reserves. Dilution intrinsic to the Mineral Reserves estimate is considered
sufficient to represent the mining selectivity considered. |
| 4. | Bulk densities (in t/m3) were assigned by lithologies: alluvium = 2.10, Havallah = 2.48, Valmy/Antler = 2.4076+(0.0001*DEPTH),
and Valmy = 2.64. For Buffalo Valley, bulk densities (in t/m3) were assigned by lithology ranging from a low of 2.426 (Overburden)
to a high of 2.737 (Basalt) with a weighted average of 2.63. |
| 5. | The Property is 100% owned by SSR through its subsidiary MMC. |
| 6. | Metals shown in this table are the contained metals in ore mined and processed. |
| 7. | All ounces reported represent troy ounces, and g/t represents grams per metric tonne. |
| | 12-1 | |
| SSR Mining Inc. | Marigold Complex S-K 1300 Report | February 12, 2024 SLR Project No.: 138.21581.00002 |
| 8. | Stockpiles, included in previous disclosures as In situ, have been reported as a separate line item to clearly differentiate the ore
source. |
| 9. | Totals may vary due to rounding. |
The SLR QP is unaware of any current environmental, permitting, legal,
title, taxation, socio-economic, marketing, political, or other relevant factors that could materially affect the Mineral Reserves estimate
as of September 30, 2023.
This section describes the methodology and parameters used to estimate
the Mineral Reserves for Marigold. The Mineral Reserves estimate as of September 30, 2023, considers all information used in the Mineral
Resources estimate as of September 30, 2023, as presented in Section 11.
| 12.2 | Conversion to Mineral Reserves |
Mineral Reserves have been classified in accordance with the U.S. Securities
and Exchange Commission (US SEC) Regulation S-K subpart 1300 rules for Property Disclosures for Mining Registrants (S-K 1300).
The Mineral Reserves estimate is summarized in Table 12-1.
Pit optimizations were run on the Mineral Resources cell model using
Pseudoflow algorithm to generate optimal pit limits based on block value at a range of gold prices.
The ultimate pits and subsequent phase designs were developed from the
$1,450/oz optimization runs. The gold price assumption was based on an internal assessment of recent market prices, long-term forward
curve prices, and consensus among analysts regarding price estimates.
Interramp angles (IRAs) for the final pit design are 37° in mined
fill and range between 45° and 49° in rock.
Mining costs are based on historical values and budgeted costs that
include an incremental haulage component using estimated haul cycle times and pit depths. Processing and general and administrative (G&A)
costs were estimated based on historical values and budgeted costs. Estimated sustaining capital costs, royalties, severance taxes, and
reclamation costs were also included in the optimization costs.
The Mineral Reserves for Marigold were estimated using the as-mined
surface at September 30, 2023, with the following assumptions and parameters:
| · | There are no Measured Resources in the Mineral Resources model. Indicated Mineral Resources within the final pit design are converted
to Probable Mineral Reserves. Inferred Mineral Resources are not considered in the Mineral Reserves estimation. |
| · | The mining recovery is 100% within the pit design. |
| · | The Mineral Resources were not diluted (see Section 11 for reconciliation data). Internal dilution included in the Mineral Resource
estimate is considered adequate. |
| · | The Mineral Reserves estimate assumes that mining operations will continue to use the current Marigold mining methods, as described
in Section 13. |
| · | The estimated cut-off grade was 0.002 opt payable Au or 0.069 g/t payable Au (Au assay factored for recovery, royalty, and
net proceeds). |
| · | The leach pad inventory of 0.346 Moz Au is included in the Mineral Reserves, in addition to the material that is placed on top of
the leach pads. |
| | 12-2 | |
| SSR Mining Inc. | Marigold Complex S-K 1300 Report | February 12, 2024 SLR Project No.: 138.21581.00002 |
On the surface of the mining phase areas 8S Extension (8Sx), M7, and
M9 are historical WRSA from material mined during the late 1990s and early 2000s when cut-off grades were higher than the current cut-off
grades. While drilling the HideOut and 8Sx targets, samples from these WRSA were also assayed for gold, with a majority of these samples
returning gold values higher than the current cut-off grade.
To confirm the grades, 37 sonic drill holes were drilled in 2016. These
drill holes confirmed the gold grades in the historical WRSA, herein called “mineralized stockpiles” or “stockpiles”.
In the previous TRS (OreWin, 2022), this material was included in the Mineral Reserves as “In situ” material.
In this TRS, the “stockpiles” are reported separately from
the “In situ” material.
The estimated cut-off grade for Mineral Reserves was based on a $1,450/oz
gold price. The gold price of $1,450/oz was selected following current industry guidelines and corporate strategy. The metal price is
representative of the range of price estimates publicly reported for Mineral Reserve cut-offs. Factors used to estimate the cut-off grade
are outlined in Table 12-2, and include refining charges, royalties, and net proceeds tax. Operating costs were based on historical costs
and budgeted estimates.
An average recovery rate of 73.8% was used to estimate the cut-off grade
based on the average of model recoveries from the 2023 LOM Plan.
Table 12-2: Key Economic Parameters
for Mineral Reserves Estimate
| Parameters |
Unit |
Value |
| Gold Price |
US$/oz |
1,450 |
| Gold Sales, Insurance, Legal and Social |
US$/oz |
Included in AUPAY1 |
| Royalties |
US$/oz |
Included in AUPAY1 |
| Total Selling Cost |
US$/oz |
Included in AUPAY1 |
| Processing Au Recovery |
% |
Included in AUPAY1 |
| Payable Au |
% |
100.0% |
| Mining Dilution |
% |
1.00 |
| Processing Cost |
US$/t |
2.25 |
| Rehandling Cost |
US$/t |
0.00 |
| Operational Support (G&A) |
US$/t |
1.23 |
| Total |
US$/t |
3.48 |
| Marginal Cut-off Grade |
g/t |
0.075 |
| Rounded Cut-Off Grade2 |
g/t |
0.069 |
Notes:
| 1. | The cut-off grade is calculated based on the AUPAY variable from the Mineral Resource Block Model. The processing recovery is considered
to be 100% since the AUPAY variable has already accounted for the Process Recovery, Refining Charges, Royalties and Net Proceeds Tax. |
| | 12-3 | |
| SSR Mining Inc. | Marigold Complex S-K 1300 Report | February 12, 2024 SLR Project No.: 138.21581.00002 |
| 2. | The currently used Assay Equipment (Agilent 240FS AA) has a three decimal precision, rounding the last number where relevant. This
results in the cut-off being rounded down to 0.002 opt (0.069 g/t). |
| 3. | The Processing Cost includes sustaining capital and full site reclamation costs. |
| 4. | The Mining Costs are based on historical values, coded into a script using a Python library to calculate costs |
| 12.4 | Royalties, Net Proceeds and Excise Tax |
NSR royalty payments vary between 0% and 10% of the value of production
net of off-site refining costs, which is equal to an annual average range of 3.7% to 10% and a weighted average of 7.8% over the LOM.
The State of Nevada imposes a yearly tax on the net proceeds of all
mining operations conducted within the state, plus a yearly property tax on all fixed and mobile equipment used by the mining operation.
The net proceeds tax is based on the income from the sale of all products from the mine minus: the royalties; mine, plant, and administration
expenses sourced in the State of Nevada; development expenses paid during the year; prescribed depreciation of tangible assets according
to set, pre-defined classifications contained in state regulations; and reclamation expenditures incurred during the year of the tax.
A net proceeds tax of 5% was applied to the Mineral Reserves estimation.
In 2021, the State of Nevada enacted Assembly Bill 495, effective July
1, 2021, which is an annual excise tax on gold and silver revenue. Under the bill, the tax rates vary based on the taxpayer’s Nevada
gross revenue. A 0.75% rate is imposed on Nevada gross revenue of more than $20 million, however, not more than $150 million in a taxable
year (defined as the calendar year). A rate of 1.10% applies to Nevada gross revenue exceeding $150 million in any tax year. The LOM average
rate for Marigold is approximately 0.9%.
No mining dilution was applied to the grade of the cells. Dilution intrinsic
to the Mineral Resources model is considered sufficient to represent the stated mining selectivity.
Mining recovery was assumed to be 100% of the Indicated Mineral Resources.
Inferred Mineral Resources were assigned as waste.
| 12.7 | Comparison with Previous Estimates |
The Mineral Reserve estimate has been compared to the previous December
31, 2022 Mineral Reserve estimate as reported in SSR’s 2022 Form 10-K filing (SSR, 2023), which was based on the EOY 2022 pit surface.
Comparison of the current Mineral Reserve with the 2022 Mineral Reserve shows a net decrease in contained gold of 0.176 Moz (-6%) in the
Proven and Probable categories. Changes have occurred from mine depletion, infill drilling results, Resource model updates, and design
changes.
The SLR QP reviewed the assumptions, parameters, and methods used to
prepare the Mineral Reserves Statement and is of the opinion that the Mineral Reserves are estimated and prepared in accordance with the
U.S. Securities and Exchange Commission (US SEC) Regulation S-K subpart 1300 rules for Property Disclosures for Mining Registrants (S-K
1300).
| | 12-4 | |
| SSR Mining Inc. | Marigold Complex S-K 1300 Report | February 12, 2024 SLR Project No.: 138.21581.00002 |
The total Probable Mineral Reserves at the Marigold mine are estimated
to be 174.8 million tonnes grading 0.47 g/t Au containing 2.98 Moz Au. The Marigold Mine Mineral Reserves support a LOM over 16 years
of operational life, including ten years of active mining followed by an additional six years of processing the heap leach pad inventory
which contains 346 koz of gold.
| | 12-5 | |
| SSR Mining Inc. | Marigold Complex S-K 1300 Report | February 12, 2024 SLR Project No.: 138.21581.00002 |
Marigold uses standard open pit mining methods with a LOM sustained
mining rate of approximately 260,000 tpd.
Loading operations are currently performed using one electric shovel
and three hydraulic shovels. Waste and ore haulage is performed with a fleet of 280 t payload primary haul trucks.
The mine conducts conventional drilling and blasting activities with
a free face trim row blast to ensure stable wall rock conditions. Electronic detonators are used to control the timing of the blasthole
detonation.
Drilling and blasting occur on benches with a height of 15.2 m. One
grade control sample is taken from each blasthole with the sub-drilling excluded. Mining occurs on the full bench height (15.2 m) when
pre-stripping waste or mining ore areas with the electric shovel. When using the smaller hydraulic shovels, mining is done on a bench
height of 7.6 m to minimise the dilution that would otherwise occur from dozing a 15.2 m high face to these smaller shovels. Blasting
is done with an ammonium nitrate and fuel oil (ANFO) blend and a sensitized ANFO emulsion. The ore control mark-out procedure includes
blast movement analysis for 90% of ore production blasts.
The Marigold geotechnical management plan (GMP) includes highwall monitoring
using three radar systems which provide full coverage for the Mackay pit, which is the largest pit, or which can be deployed in the smaller
pits, if required. Routine monitoring of WRSA, leach pads, and inactive pits using INSAR (interferometric synthetic-aperture radar) data
is performed by a third party on a monthly basis.
Equipment maintenance is performed on site for all equipment. There
are no contract mining operations on site, other than for blasting as detailed in Section 13.7.
| 13.1 | Geotechnical, Hydrological, Pit, and Other Design Parameters |
Historically, Marigold pits have been designed with IRAs at 48°
to 50°. The primary rock, a quartzite in the Valmy Formation, dips in a westerly direction at 40° to 70°. The east highwall,
which has rock dipping out of the face, is designed at 45° to 47°. The west highwall, which has rock dipping favorably into the
face, is designed at 50°. Achieved IRAs range between 48° and 50°. Because many of the interim and final pit walls are within
the Valmy Formation, the steeper 50° angle is thought to be achievable for pit designs within the same rock unit (Knight Piésold,
2014). Call & Nicholas, Inc. (CNI) consultants perform an annual audit of activities and provide guidance if any issues arise with
slope stability. A 2019 CNI Slope Stability Study of the Red Dot design based on the results of a 2018 geotechnical core drilling program
recommended flattening the slope of the west wall of Red Dot to 47° to 49° and the east wall to 45°. The results of this study
were used to inform the ultimate pit design for the Mackay / Red Dot pit.
The Marigold GMP was implemented in 2011. The GMP is continually updated
with information as mining progresses.
In 2012, a robotic highwall monitoring station was installed at a primary
mining location to survey prisms placed strategically on highwall catch benches. The survey instrument was replaced with a highwall radar
monitoring system in 2015, a second system was added in 2017, and a third system in 2019. These allow for 360° monitoring of highwalls
in the Mackay pit or multiple areas within other pits. These three radar systems provide coverage 24 hours per day. Threshold values
with respect to movement are programmed into the system. If these values are exceeded, notifications are sent across the wireless network
to the dispatch control center and to the geotechnical team. If the movement is significant, the notifications are sent to senior management.
| | 13-1 | |
| SSR Mining Inc. | Marigold Complex S-K 1300 Report | February 12, 2024 SLR Project No.: 138.21581.00002 |
Mining below the regional water table commenced in 2020 using a combination
of in-pit sumps and emulsion blasting as short-term solutions, pending the completion of permitting and construction of primary dewatering
facilities. The Plan of Operations Amendment approved in 2019 permitted dewatering to allow mining below the water table. The mine dewatering
plan is discussed in Section 13.10.
Haul road and ramp widths are designed for two-way traffic that accommodates
280 t class haul trucks. The total road width, including berms and ditches, is 36.4 m. The roads follow topography external
to the pit and do not exceed a 10% grade. Ramps inside the pits are also designed at a 10% maximum grade.
Waste rock is placed in lifts of 15.2 m to 45.5 m high, with benches
left on the outside edges to accommodate the final WRSA 3:1 slope design. There have been no WRSA stability issues on the Property. Sufficient
storage capacity for waste rock material have been identified to support the mining production and LOM.
The leach pad is built with lifts of 6.1 m to 12.2 m high, with
benches left on the outside edges for a final 3:1 slope pushdown. The leach pad is permitted to a 121.2 m height above the plastic
liner at the base. As each new leach pad cell is designed and permitted, a geotechnical analysis is completed. There have been no leach
pad stability issues on the Property.
| 13.1.1 | Open Pit Geotechnical Reports Review |
A review of previous geotechnical studies was conducted in 2021 to confirm
that studies completed to that point were appropriate and to identify any gaps or areas of residual concern, (PSM, 2021).
The following reports for Marigold were provided and form the basis
of the review:
| · | 2018 – NI 43-101 Technical Report on the Marigold Mine (July 31, 2018) |
| · | 2019 – CNI Slope Stability Study of the Red Dot design |
| · | 2021 – CNI site visit recommendations |
| · | 2021 – CNI analysis of soil slopes |
| · | 2021 – Piteau Associates (Piteau) Mackay pit dewatering system design |
The reports listed above do not represent all the data that may be available,
particularly in view that mining has been ongoing since 1988. Moreover, the 2018 NI 43-101 Technical Report on the Marigold Mine
indicates Knight Piésold involvement in 2014 and with CNI involvement since 2015.
| 13.1.1.1 | Overview of Geotechnical Report Review |
PSM (2021) offered the following comments regarding perceived gaps in
the geotechnical reporting for the Marigold open pit:
| · | The CNI stability analyses of the overall slopes are considered to have an element of conservatism owing to the approach in assigning
rock mass strengths and utilizing a linear Mohr-Coulomb strength envelope. With use of Hoek & Brown strengths, higher factors of safety
(FOS) for overall slopes could be anticipated in some areas. |
| | 13-2 | |
| SSR Mining Inc. | Marigold Complex S-K 1300 Report | February 12, 2024 SLR Project No.: 138.21581.00002 |
| · | Further consideration of the potential impact of faults on large scale pit wall stability was recommended. The stability assessments
did not address the potential impact of the following: |
| o | Thrust faults dipping moderately to the east on western pit walls. |
| o | Potential wedges between faults parallel to the primary bedding fabric. |
| o | Faults dipping steeply to the east which can form shallow wedges plunging to the south and which may impact the north wall once below
the water table, where pore pressures may influence wedge stability. |
| · | The CNI batter face angle and berm width designs, without appropriate consideration of blasting, were not considered sound. Such designs,
with proposed batter face angles (BFA) nominally 10° steeper than typically achieved, would potentially allow loose material to fall
whilst faces are being dug and also result in berms being filled with rill. It may be more effective to either dig batters to nominally
63° and have berm widths closer to design or presplitting to achieve BFA above 70° where steeper IRA can be considered (south
and west walls) and which could also consider double benching. |
| · | There were limited concerns regarding WRSA and leach pads as these are developed with 3H:1V (approximately 18°) overall angles
and neither have presented stability issues on the property. |
The current operations at Marigold Mine mostly focus on the interim
pit phases. Little final highwall has been created in the Mackay Pit area over the last few years with notable exception of the east wall,
which has a lower IRA due to expected west dipping bedding conditions. The vast majority of the west interim walls are designed shallower
than the 47 to 48 degree overall slope angle (OSA), and blasting typically uses a production presplit pattern. However, in mining the
first few benches, trim shots are used to protect the integrity of the ramp.
The batter compliance data is skewed by delay in the compliance measurements,
which occur later after mining has advanced through the area. However, in practice much of the rill is mined out by shovel mining with
dozer support as required. Also, trim blasting is reserved for final highwalls.
| 13.1.2 | Pit Optimizations and Designs |
Pit optimizations and subsequent pit designs were completed by Marigold
personnel in September 2023 using the current Mineral Resources estimate.
Optimizations used the Pseudoflow algorithm. Marigold personnel developed
operating mining costs for the existing mining fleet during the pit optimization process. Ore and waste haulage costs were incorporated
into the cell model. The mining cost for the pit shells was based on the total mining cost net of haulage mining costs, which are presented
in Table 12-2.
The ROM leach recovery model, as developed by SSR, was also incorporated
into the Mineral Resources cell model. To facilitate the calculations and the Mineral Resources tabulations, variables were incorporated
into the model for recovered gold [gold x recovery] and payable gold [gold x recovery x (1–royalty)]. Payable
gold cut-off grades were established at 0.069 g/t Au and 0.104 g/t Au, respectively, for incremental cut-off and breakeven
cut-off. Incremental cut-off is based on pit rim routing, so the only mining cost change is the increment between the ore and waste mining
costs. Breakeven cut-off includes the ore mining cost.
| | 13-3 | |
| SSR Mining Inc. | Marigold Complex S-K 1300 Report | February 12, 2024 SLR Project No.: 138.21581.00002 |
The mining costs for the evaluation include sustaining capital costs
as well as costs associated with the Marigold analytical laboratory as most of the on-site laboratory work involves assaying production
blastholes for ore control. The processing costs also include sustaining capital and the full site reclamation costs.
Overall slope angles used in the optimization are presented in Table
13-1.
Table 13-1: Overall Slope Angles by
Azimuth
| Pit |
Slope Angle
(Degrees) |
|
| Area 1: Red Dot / Mackay / Terry Zone (TZ) / 8Sx |
|
|
| Area 1 – All Pits in Reserves |
47.0–49.0 |
|
| East Wall Mackay |
45 |
|
| Fill Material |
35 |
|
| Area 2: Valmy N / Valmy S / Mud |
|
|
| Area 2 – All Pits in Reserves |
47.0–49.0 |
|
| West Wall |
45.0 |
|
| Fill Material |
35.0 |
|
| Area 3: East Basalt / Battle Cry |
|
|
| Area 3 – All Pits in Reserves |
47.0–49.0 |
|
| East Wall |
45.0 |
|
| Fill Material |
35.0–38.0 |
|
Notes:
| 1. | Area 1: Created a 90 degree envelope at 45 degree IRA to account for the shear zone. |
| 2. | Area 2: Created a 30-degree envelope North and South at 45 degree IRA for the shear zone running through Valmy North and Valmy South. |
| 3. | Area 3: Exploration encountered Tuff in the region, leading to a flatter 38 degree slope in certain areas. |
Several pit optimizations were run at different gold prices. The $1,450/oz
gold price pit shell was selected as a guide to develop the ultimate pit and subsequent pit phase designs.
Geotechnical review recommendations provided by Knight Piésold
(2014) and confirmed by CNI on pit slope geometry were incorporated into the pit designs. Berm/catch bench widths range from 7.2 m to
8.2 m in rock and from 7.2 m to 15.4 m in fill and are designed for every 15.2 m bench height.
| 13.2 | Pit Phases and Timing |
The pit optimization for the LOM plan used a Pseudoflow algorithm with
an internal recoverable gold value of 0.069 g/t. The optimized pit was built into an ultimate pit design that includes access and
takes into account geotechnical considerations for designed highwall angles.
The overall design has three distinct areas: the main Mackay pit (includes
the Red Dot area), the North Mackay pits, and the Valmy area pits. Figure 13-1 shows the end of mine life reserve pits.
The Mackay ultimate pit is an expansion, consolidation, and deepening
below the water table of four existing pits into a single pit of approximately 4.6 km long, 1.8 km wide, and 430 m deep.
It contains more than 60% of the mineral reserve tonnage. For sequencing purposes, the ultimate pits are designed into 15 logical development
stages.
| | 13-4 | |
| SSR Mining Inc. | Marigold Complex S-K 1300 Report | February 12, 2024 SLR Project No.: 138.21581.00002 |
Tonnages for each mining phase are shown in Table 13-2.
Table 13-2: Mining Phase Design Summary
| Phase Name |
Ore
(kt) |
Waste
(kt) |
Strip Ratio |
| 8Sx¹ |
16,813 |
61,890 |
3.7 |
| TZ |
18,026 |
99,901 |
5.5 |
| M4P2a |
3,041 |
5,437 |
1.8 |
| M4P2b |
760 |
1,000 |
1.3 |
| M7¹ |
6,288 |
12,687 |
2.0 |
| M9¹ |
11,552 |
28,114 |
2.4 |
| RDP1a |
8,547 |
60,497 |
7.1 |
| RDP1b |
8,625 |
20,223 |
2.3 |
| RDP2a |
2,197 |
39,922 |
18.2 |
| RDP2b |
14,165 |
23,989 |
1.7 |
| RDP3a |
- |
15,128 |
- |
| RDP3b |
- |
12,383 |
- |
| RDP3c |
32 |
15,571 |
485.1 |
| RDP3d |
47 |
15,556 |
334.4 |
| RDP3e |
597 |
16,293 |
27.3 |
| RDP3f |
1,420 |
11,826 |
8.3 |
| RDP3g |
5,749 |
6,427 |
1.1 |
| RDP3h |
4,008 |
4,714 |
1.2 |
| RDP3i |
8,428 |
2,540 |
0.3 |
| RDP3j |
10,253 |
5,011 |
0.5 |
| RDP4c |
7,052 |
7,497 |
1.1 |
| RDP4f |
2,737 |
794 |
0.3 |
| RDP4e |
3,905 |
977 |
0.3 |
| RDP4d |
5,987 |
1,506 |
0.3 |
| RDP4a |
403 |
44,308 |
110.0 |
| RDP4b |
1,932 |
19,872 |
10.3 |
| EB1 |
4,471 |
52,205 |
11.7 |
| EBP2 |
6,286 |
14,553 |
2.3 |
| Battle Cry (BC) |
3,569 |
20,971 |
5.9 |
| | 13-5 | |
| SSR Mining Inc. | Marigold Complex S-K 1300 Report | February 12, 2024 SLR Project No.: 138.21581.00002 |
| Phase Name |
Ore
(kt) |
Waste
(kt) |
Strip Ratio |
| Mud1 |
1,311 |
6,403 |
4.9 |
| Mud2 |
958 |
4,856 |
5.1 |
| VN |
5,138 |
11,395 |
2.2 |
| VS |
10,502 |
54,806 |
5.2 |
| Total |
174,798 |
699,269 |
4.0 |
Notes:
| 4. | Includes Stockpile Ore Material mined from the different Pit Phases
|
| | 13-6 | |
| SSR Mining Inc. | Marigold Complex S-K 1300 Report | February 12, 2024 SLR Project No.: 138.21581.00002 |
Figure 13-1: End of Mine Life Reserve
Pits
Note: Grid in Local Mine Coordinates.
SSR Mining Inc. Marigold
Complex Nevada, USA End of Mine Life Reserve Pits
| | 13-7 | |
| SSR Mining Inc. | Marigold Complex S-K 1300 Report | February 12, 2024 SLR Project No.: 138.21581.00002 |
| 13.3 | Production Rates, Mine Life, Dimensions and Dilution Factors |
Mining is scheduled 24 hours per day, 363 days per year on a rotation
of two 12-hour shifts. The current mine plan provides 16 years of operational life, including ten years of active mining followed by an
additional six years of processing the heap leach pad.
In order to meet near-term LOM production rates, the existing shovel
fleet of four units will be maintained by deferring retirement of the smaller EX5500 hydraulic shovel to 2028. The haul fleet averages
25 x 280 t class units and will peak at 28 trucks. Short term variations in mine fleet requirements are managed by delaying retirement
of older units when they are scheduled to be replaced. The average sustained total material mining rate is 103.5 Mtpa over the first eight
years of the remaining ten year mining life while ore delivery to the ROM leach pad is at an average annual rate of 19.6 Mt. Average
payable gold production over the nine years of full production is approximately 212,000 ounces per year. In general, ore will be mined
on 15.2 m benches.
The mineralized zones are structurally controlled and strike in a generally
northern direction. They vary in width throughout the Property from one meter or less up to 40 m long and 49 m wide. In the
LOM model, there is no dilution or mining loss added to the Mineral Reserves for planning and scheduling. Based on the chosen mining method
and size of equipment used, dilution intrinsic to the Mineral Resource model is considered sufficient and mining recovery of 100% is considered
achievable in this kind of deposit.
| 13.4 | Stripping Requirements |
The LOM strip ratio is 4.0:1. Stripping requirements are consistent
over the life of the main Mackay pit area at an average strip ratio of 3.5:1. The stripping ratio for Valmy is 4.3:1, while the stripping
requirements for the other two areas, Mackay North and New Millennium, are planned to be above the LOM average at 4.6:1 and 6.1:1, respectively.
Table 13-3 and Figure 13-2 show the annual production schedule for the LOM, including ore tonnes mined, waste tonnes mined, and strip
ratio.
The pit areas mentioned above comprise of the following pits:
| · | Mackay Area: Red Dot phases (RD4/RD3/RD2/RD1), Mackay M4P2, M7 and M9 |
| · | Valmy Area: Valmy North (VN), Valmy South (VS), Mud1 and Mud 2 |
| · | Mackay North Area: 8S Extension (8Sx) and Terry Zone (TZ) |
| · | New Millennium Area: Battle Cry (BC) and East Basalt (EB1 & EB2) |
Table 13-3: Annual Production Schedule
Tonnes Mined
| Year |
Ore
(kt) |
Waste
(kt) |
Strip Ratio |
| 2023¹ |
4,730 |
22,297 |
4.7 |
| 2024 |
21,955 |
81,996 |
3.7 |
| 2025 |
20,081 |
88,860 |
4.4 |
| 2026 |
15,807 |
93,282 |
5.9 |
| 2027 |
21,113 |
78,970 |
3.7 |
| 2028 |
18,623 |
92,494 |
5.0 |
| | 13-8 | |
| SSR Mining Inc. | Marigold Complex S-K 1300 Report | February 12, 2024 SLR Project No.: 138.21581.00002 |
| Year |
Ore
(kt) |
Waste
(kt) |
Strip Ratio |
| 2029 |
29,197 |
64,327 |
2.2 |
| 2030 |
11,369 |
81,720 |
7.2 |
| 2031 |
20,216 |
56,390 |
2.8 |
| 2032 |
11,706 |
38,933 |
3.3 |
| Total |
174,798 |
699,269 |
4.0 |
Notes:
| 1. | 2023 totals are for the period between October and December 2023. |
| 2. | Ore mined from Stockpiles is included in the above table, resulting in a strip ratio of 4.0:1 |
| 3. | Excluding the ore from stockpiles, the strip ratio will be 4.5:1 |
| 4. | Totals may not match due to rounding |
Figure 13-2: Mine Annual Production
Schedule
Source: SSR, 2023
Notes:
| 1. | 2023 totals are for the period between October and December 2023. |
| 13.5 | Required Mining Fleet and Machinery |
The equipment list for the Marigold mining fleet is presented in Table
13-4. Capital replacement of mining equipment is scheduled throughout the LOM plan as sustaining capital when a piece of equipment reaches
the end of its useful life and cannot be repaired or rebuilt economically. Sustaining capital is not planned within the last five years
of the LOM plan because it is assumed that equipment life can be stretched out and replacements are difficult to justify near the end
of the Property life. The sustaining capital replacement costs are included in the reserve optimization calculation costs. Capital costs
are discussed in Section 18. As of the date of this TRS, MMC does not employ contract mining services, except with respect to blasting,
as discussed in Section 13.7.
| | 13-9 | |
| SSR Mining Inc. | Marigold Complex S-K 1300 Report | February 12, 2024 SLR Project No.: 138.21581.00002 |
Table 13-4: Marigold Mining Fleet
Equipment List
| Number of Items |
Equipment Name and Class |
| 1 |
P&H 4100 XPC electric shovel |
| 2 |
Komatsu PC7000 hydraulic shovels |
| 1 |
Hitachi EX5500 hydraulic shovel |
| 1 |
Caterpillar 992-wheel loader |
| 7 |
Hitachi EH5000 300 st haul trucks |
| 21 |
Komatsu 930E 300 st haul trucks |
| 1 |
Caterpillar 789B haul truck |
| 3 |
Caterpillar 789B water trucks |
| 2 |
Ingersoll Rand DML drills |
| 3 |
Atlas Copco PV271 drills |
| 4 |
Caterpillar 834- and 854-wheel dozers |
| 6 |
Caterpillar D10 and D11 track dozers |
| 3 |
Caterpillar 16H and 18M motor graders |
| 3 |
Lube / fuel trucks |
| 1 |
Caterpillar 637 scraper |
| 1 |
Caterpillar 789 Lowboy heavy hauler |
| 13.6 | Ore Control Drilling and Method |
Blasthole sampling is used to define ore zones. A grade control sample
is taken every 15.2 m of drilling. The sample is manually collected from a cross-section of the cone of drill cuttings. The procedure
includes removal of the sub drill material. Ore Control personnel periodically audit the performance of the blast hole samplers and provide
feedback on compliance to standard.
Benches are mined at a height of 15.2 m with an electric or hydraulic
shovel in stripping and bulk ore mining areas. If ore is encountered in the stripping areas on the 15.2 m benches, it is mined at
that bench height to maintain pit productivity.
| | 13-10 | |
| SSR Mining Inc. | Marigold Complex S-K 1300 Report | February 12, 2024 SLR Project No.: 138.21581.00002 |
Each blasthole sample is analysed for gold at the on-site laboratory
facility. A cyanide digestion is performed on each sample to determine the quantity of cyanide soluble gold contained in the sample. The
cyanide digestion only provides a measure of cyanide soluble gold within a sample, not total gold. At Marigold, about one in every five
blasthole samples containing 0.10 g/t (historically, 0.003 opt) cyanide soluble gold is assayed for total gold content using
fire assay (FA) with an AA finish. Samples from each ore polygon delineated by ore control are selected for fire assay based on the grade
distribution for the polygon tonnage and targeting one sample per every 2,000 st of ore. The FA results (Au g/t) from the blastholes in
the pit area, and cyanide soluble assay results (Au g/t) are used to determine a fire-assay-to-cyanide-soluble regression for the pit
area. This regression is applied to all remaining cyanide soluble assays in the blast to calculate a total gold value contained in each
blasthole.
Fire assay grades associated with each blasthole are entered into the
grade control (blasthole) model. The blast pattern is then converted to a blasthole cell model with cell sizes of 3.05 m x 3.05 m x 7.6 m.
The blasthole data is kriged using ordinary kriging (OK) in two dimensions on the bench. If there is sufficient volume above the cut-off
grade to make a mineable shape of ore, this shape is blocked out and surveyed in the pit (indicated by ore flags for mining) to be sent
to the leach pad for processing.
| 13.7 | Drilling and Blasting |
Blasthole drilling is performed with three Atlas Copco PV271 rigs that
drill with both rotary and hammer drill bits as well as two Ingersoll Rand DML rigs that drill with hammer bits. The rigs drill 22.2 cm
diameter blastholes. The PV271 rigs can drill to 16.8 m in a single pass. The DML rigs can drill to 10.4 m in a single
pass.
The normal explosive is a heavy ANFO (blend of ANFO and emulsion) which
is placed by a combination of both contractor and Marigold employees. An emulsion product is also used for wet holes to manage groundwater
in the winter and fall and help break up the rock in areas of the pit that are more difficult to dig.
The blast patterns are adjusted for rock conditions. Typically, the
patterns are 6.7 m x 7.8 m for the 15.2 m benches. To help break the toe of the bench, 1.5 m of sub drilling
is added to each hole. The ore host rock generally breaks easily with blasting, and this provides a good ROM leach feed to the pad. Electronic
detonators are used to control the timing of the blasthole detonation. The typical fragmentation is P80 20.3 cm.
A trim blast is performed around the limits of the mining on final highwall
configurations. This configuration is a four-row pattern that is shot to a free face to minimise blast damage and vibration into the highwalls.
Historically, a presplit blasting pattern had been used on final highwalls to ensure good wall conditions and minimise the potential for
a wall failure. A new crest and catch bench, ranging in width from 6.7 m to 9.1 m depending on the highwall angle, are formed every 15.2
vertical metres of mining.
Loading operations are performed with one electric P&H 4100 XPC
rope shovel with a 52.8 m3 dipper, two diesel hydraulic Komatsu PC7000 hydraulic shovels, and one diesel hydraulic Hitachi
EX5500 shovel. Double-sided loading is typically used where there is adequate working room. Digging faces are defined by ore control and
are marked in the field with flags and on maps that are provided to the operators. All loading units are equipped with a high-precision
digging screen that is a component of the Modular Dispatch system. The screen, located in the operator’s cab, updates in real time
to show the location and grade of the ore material being mined. Dig boundaries are typically adjusted to allow for movement associated
with blasting.
| | 13-11 | |
| SSR Mining Inc. | Marigold Complex S-K 1300 Report | February 12, 2024 SLR Project No.: 138.21581.00002 |
Excavated rock is loaded into haul trucks and sent to either a WRSA
or a leach heap, based on the average gold grade of the material. Waste rock is hauled to the multiple waste stockpile locations or to
previously mined-out areas for backfilling pits. Pit backfilling, where not mandated by permit to eliminate pit lakes in certain satellite
pits, has positive impacts at Marigold: it reduces costs associated with haulage distance and helps address the lack of areas for waste
rock storage space due to permitting restrictions and current land position. Backfilling plans are reviewed and adjusted to minimise the
potential for sterilizing future mineralization. Minimizing the waste haulage distance to the nearest facility improves mining productivity
and minimises haulage costs. Ore is hauled to the leach pad facility and stacked in lifts for processing. The year-end positions for mining
and WRSA for each year of the LOM plan are presented in Figure 13-3 to Figure 13-11.
Marigold has a mixed fleet of Hitachi and Komatsu 280 t class haulage
trucks for ore and waste haulage.
A Modular Dispatch system is used to optimise fleet management. Trucks
are sent haulage assignments according to priorities set for the loading units and which loading unit requires a truck at that time.
Annually, from December to February, there is snow, fog, and freezing
temperatures at the Property. However, there is a minimal amount of haulage downtime due to the weather in most years.
| | 13-12 | |
| SSR Mining Inc. | Marigold Complex S-K 1300 Report | February 12, 2024 SLR Project No.: 138.21581.00002 |
Figure 13-3: End of Production Year
2024
Note: Grid in Local Mine Coordinates.
SSR Mining Inc. Marigold
Complex Nevada, USA End of Production Year 2024
| | 13-13 | |
| SSR Mining Inc. | Marigold Complex S-K 1300 Report | February 12, 2024 SLR Project No.: 138.21581.00002 |
Figure 13-4: End of Production Year
2025
Note: Grid in Local Mine Coordinates.
SSR Mining Inc. Marigold
Complex Nevada, USA End of Production Year 2025
| | 13-14 | |
| SSR Mining Inc. | Marigold Complex S-K 1300 Report | February 12, 2024 SLR Project No.: 138.21581.00002 |
Figure 13-5: End of Production Year
2026
Note: Grid in Local Mine Coordinates.
SSR Mining Inc. Marigold
Complex Nevada, USA End of Production Year 2026
| | 13-15 | |
| SSR Mining Inc. | Marigold Complex S-K 1300 Report | February 12, 2024 SLR Project No.: 138.21581.00002 |
Figure 13-6: End of Production Year
2027
Note: Grid in Local Mine Coordinates.
SSR Mining Inc. Marigold
Complex Nevada, USA End of Production Year 2027
| | 13-16 | |
| SSR Mining Inc. | Marigold Complex S-K 1300 Report | February 12, 2024 SLR Project No.: 138.21581.00002 |
Figure 13-7: End of Production Year
2028
Note: Grid in Local Mine Coordinates.
SSR Mining Inc. Marigold
Complex Nevada, USA End of Production Year 2028
| | 13-17 | |
| SSR Mining Inc. | Marigold Complex S-K 1300 Report | February 12, 2024 SLR Project No.: 138.21581.00002 |
Figure 13-8: End of Production Year
2029
Note: Grid in Local Mine Coordinates.
SSR Mining Inc. Marigold
Complex Nevada, USA End of Production Year 2029
| | 13-18 | |
| SSR Mining Inc. | Marigold Complex S-K 1300 Report | February 12, 2024 SLR Project No.: 138.21581.00002 |
Figure 13-9: End of Production Year
2030
Note: Grid in Local Mine Coordinates.
SSR Mining Inc. Marigold
Complex Nevada, USA End of Production Year 2030
| | 13-19 | |
| SSR Mining Inc. | Marigold Complex S-K 1300 Report | February 12, 2024 SLR Project No.: 138.21581.00002 |
Figure 13-10: End of Production Year
2031
Note: Grid in Local Mine Coordinates.
SSR Mining Inc. Marigold
Complex Nevada, USA End of Production Year 2031
| | 13-20 | |
| SSR Mining Inc. | Marigold Complex S-K 1300 Report | February 12, 2024 SLR Project No.: 138.21581.00002 |
Figure 13-11: End of Production Year
2032
Note: Grid in Local Mine Coordinates.
SSR Mining Inc. Marigold
Complex Nevada, USA End of Production Year 2032
| | 13-21 | |
| SSR Mining Inc. | Marigold Complex S-K 1300 Report | February 12, 2024 SLR Project No.: 138.21581.00002 |
Mine support functions are performed using different quantities and
types of equipment. These include water trucks, dozers, and graders as well as other non-operated ancillary equipment such as the radar
highwall monitoring units. Mine support functions include ripping leach pads after a panel is completed, monitoring slope stability, maintaining
roads and access points, and developing exploration drill pads. This work is completed with a fleet of Caterpillar D8, D10, and D11 class
track dozers and Caterpillar 18, 16H, and 18M motor graders.
Current mine support fleet numbers are included in Table 13-4.
Mine maintenance is an integral function of the mining operations and
relates to the day-to-day upkeep of the mining equipment. Activities such as preventive maintenance, equipment rebuilds and fixing equipment
on breakdowns are all included in the mine maintenance function. The objective is to provide efficient maintenance of the mining fleet,
thereby increasing reliability and availability of the equipment through effective strategies, planning, and continuous improvement. High
levels of equipment availability and reliability facilitate operational and delivery performance, resulting in asset intensity reduction,
and reduced direct operational and maintenance costs.
Equipment maintenance is performed onsite for all mining equipment.
The Marigold mine has all the infrastructure required for maintaining the fleet described in Table 13-4 and has an adequate maintenance
workforce to ensure the equipment are able to meet the requirements of the operations.
Table 13-5 shows the life of mine (LOM) Average key performance indicators
(KPI) of the fleet used at Marigold Mine.
Table 13-5: LOM Average Maintenance
KPI of the Marigold Mine Equipment Fleet
| Mine Equipment |
Availability
(%) |
Use of Availability
(%) |
| Drills |
81.84% |
69.63% |
| Loading Equipment |
| Hitachi 5500 |
76.47% |
77.70% |
| Komatsu PC7000 |
76.77% |
87.34% |
| Electric Shovel |
85.75% |
88.74% |
| Hauling Equipment |
| EH5000 ACI |
74.25% |
62.37% |
| EH5000 ACII |
73.25% |
56.56% |
| 930E |
85.87% |
81.55% |
| CAT 789 |
68.60% |
25.08% |
| | 13-22 | |
| SSR Mining Inc. | Marigold Complex S-K 1300 Report | February 12, 2024 SLR Project No.: 138.21581.00002 |
| Mine Equipment |
Availability
(%) |
Use of Availability
(%) |
| Support Equipment |
| Dozers |
79.63% |
74.67% |
| Graders |
79.48% |
75.49% |
| RTD |
83.50% |
76.31% |
| Water Truck |
84.33% |
55.63% |
| Loader (992) |
72.30% |
40.94% |
| Scraper |
72.76% |
3.35% |
The current fleet is to be maintained with replacement units (930E Haul
Trucks and Drills being the major equipment to be replaced) as the current equipment reaches its maximum operating hours. In general,
the major mining equipment requirement scales down with production, towards the end of the LOM plan.
SSR is also considering using the balance useful life of the equipment,
beyond 2032, in some of their projects nearby which might come into production by that time.
| 13.12 | Mine General and Administration |
Mine G&A refers to all day-to-day supervision and engineering support
of mining operation activity. Expenses included in the mine G&A are mine salary labor charges and fringe benefits, mine office supplies,
safety supplies, equipment rentals and leases, light-vehicle tires, miscellaneous contract services, travel expenses, training, and tax
and freight charges.
Marigold has one mine rescue and emergency response team which is trained
to competently assess accident conditions and fight fires. There is one ambulance and one small fire truck available on site and a rescue
trailer that is used in emergencies. The Property is set up with hydrants and appropriate connectors, hoses, and wrenches at strategic
locations. For mobile equipment fires, the Property is set up with large water trucks equipped with water cannons.
Marigold also has access to and can call either the Valmy Fire Department
(5 km away) or Battle Mountain Fire Department (24 km away), when required. There is a monthly training session for the Marigold
rescue team to ensure effective participation in any recovery operations in the event of a mine incident.
The Marigold Mine Plan of Operations (PoO) – Mackay Optimization
Project Amendment Record of Decision (RoD) in October 2019 allowed mining to be carried out below the water table in the expanded Mackay
pit. The approved dewatering system incorporated a pit dewatering design by Piteau Associates that consisted of a series of dewatering
wells to be located around the periphery of the ultimate pit to extract water for mine operations use and infiltration. Infiltration is
by means of a series of rapid infiltration basins (RIBs) located in an area of deep alluvium cover approximately five kilometres north
of the operations area. The dewatering system and RIBs are authorized under Water Pollution Control Permit (WPCP) NEV2022118. A total
of 14 RIBs have been authorized and eight have been constructed. More RIBs may be constructed based on dewatering needs.
| | 13-23 | |
| SSR Mining Inc. | Marigold Complex S-K 1300 Report | February 12, 2024 SLR Project No.: 138.21581.00002 |
The dewatering system will continue to be developed in stages with the
initial design incorporating 14 dewatering wells, each with a nominal sustainable pumping rate of 1.89 m3/min.
Figure 13-12 shows existing and planned well sites. New wells are developed
in advance of the mining elevations required to support the LOM plan. Recent monitoring and modeling of pumping and drawdown rates indicate
that the current number of wells included in the design is conservative and potentially not all will be required to achieve the required
drawdown.
Some dewatering water is diverted for mine use with the majority delivered
by pipeline to the RIB field north of the mine for infiltration. The RIBs are located in areas of thick alluvium which facilitates rapid
infiltration back into the aquifer and also provides the benefit of attenuation of naturally occurring arsenic in the groundwater before
it reaches the existing water table. An attenuation study was conducted and approved showing that water treatment will not be necessary
prior to infiltration.
Trial RIBs permitted and constructed in mid-2022 allowed infiltration
performance to be verified and the RIB cell design and configuration to be finalized. Initial RIB design criteria are summarized in Table
13-6.
Figure 13-13 shows the conceptual layout of the RIBs and spoil piles
with the majority located on (BLM) Section 30.
| | 13-24 | |
| SSR Mining Inc. | Marigold Complex S-K 1300 Report | February 12, 2024 SLR Project No.: 138.21581.00002 |
Figure 13-12: Existing and Proposed
Dewatering Wells
Note: Grid in Local Mine Coordinates.
SSR Mining Inc. Marigold
Complex Nevada, USA Existing and Proposed Dewatering Wells
| | 13-25 | |
| SSR Mining Inc. | Marigold Complex S-K 1300 Report | February 12, 2024 SLR Project No.: 138.21581.00002 |
Table 13-6: RIB Design Criteria
| RIB Cell Design Attribute |
Unit |
Dimensions |
|
| Basin floor length |
m |
210 |
|
| Basin floor width |
m |
59 |
|
| Basin crest length |
m |
247 |
|
| Basin crest width |
m |
106 |
|
| Minimum basin depth |
m |
6.1 |
|
| Excavation/dump slope |
H:V |
3:1 |
|
| Minimum spacing between cells |
m |
122 |
|
| Access road width |
m |
7.3 |
|
| Infiltration capacity |
m/day |
0.43 |
|
| Infiltration capacity per cell |
m3/min |
3.8 |
|
| Cell availability |
% |
50 |
|
| | 13-26 | |
| SSR Mining Inc. | Marigold Complex S-K 1300 Report | February 12, 2024 SLR Project No.: 138.21581.00002 |
Figure 13-13: Conceptual Layout of
RIBs and Spoil Piles
.SSR Mining Inc. Marigold
Complex Nevada, USA Conceptual Layout of RIBs and Spoil Piles
| | 13-27 | |
| SSR Mining Inc. | Marigold Complex S-K 1300 Report | February 12, 2024 SLR Project No.: 138.21581.00002 |
The current mining workforce totals 478, and is summarized as follows:
| · | Process & Laboratory – 52 |
| · | General & Administration – 47 |
| | 13-28 | |
| SSR Mining Inc. | Marigold Complex S-K 1300 Report | February 12, 2024 SLR Project No.: 138.21581.00002 |
| 14.0 | Processing and Recovery Methods |
This section has been modified from OreWin (2022).
The Marigold processing facilities combine industry standard run-of-mine
(ROM) cyanide heap leaching and recovery of gold from the leach solution using carbon adsorption, desorption, electrowinning, and refining
to produce a final precious metal (doré) product.
A simplified process flow diagram of the Marigold heap leaching facilities
is provided in Figure 14-1.
| | 14-1 | |
| SSR Mining Inc. | Marigold Complex S-K 1300 Report | February 12, 2024 SLR Project No.: 138.21581.00002 |
Figure 14-1: Simplified Marigold Processing
Flowsheet
Source: SSR, 2023.
| | 14-2 | |
| SSR Mining Inc. | Marigold Complex S-K 1300 Report | February 12, 2024 SLR Project No.: 138.21581.00002 |
| 14.2 | Heap Leach Pad Description |
The heap leach pad was originally constructed in 1990 and has since
expanded as required, with ongoing expansion of solution processing facilities to match production rate and leach area. The leach pad
area is divided into cells of specific sizes for inventory and irrigation control. Approximately 427 ha of heap leach pads, divided into
25 cells, six pregnant solution holding ponds, one storm water event pond, and two barren solution ponds have been constructed at Marigold.
There are 15 cells currently active. Permitted stacking heights for heap leach cells 3 to 10 are 106 m and cells 11 to 25 are 122 m high.
The existing and authorized heap leach cells and ancillary facilities
include Cells 1 through 25.
Associated process ponds, stormwater ponds, conveyance ditches, carbon
column trains, storage tanks, and plant facilities.
| 14.2.1 | Ore Stacking on Leach Pad |
ROM ore is delivered from the mine at a rate of approximately 20 Mt
per year to the leach pad by mine haul trucks and stacked in lifts of approximately 6 m to 12 m in height. Dry quicklime (CaO)
is added to the ore in the haul trucks from a lime storage silo and delivery chute located on the side of the haul road to the heap leach
pad to control pH prior to dumping. Mixing is accomplished by end dumping and spreading of the material with a dozer. The fresh ore is
ripped and cross-ripped to a depth of at least 1.3 m using a dozer with a long shank to break up compacted pad surface material to enhance
percolation prior to placement of leach solution distribution piping.
The available leach pad area is divided into cells of specific sizes
for inventory and irrigation control. The heap leach operating parameters include quantity and lift height of ore placed, barren solution
(a very low gold grade cyanide leach solution) irrigation rate per unit area, duration of irrigation (leach cycle), and time between lifts
to manage future ore placement. Barren solution is applied selectively to each cell. At any given time, approximately 0.5 Mm2
of pad area is being leached, with other areas draining or being made ready to accept ore for the next lift.
Barren leach solution is pumped to the leach pad by two independent
barren solution distribution systems. Combined barren solution flow capacity from the two pumping systems is 3,400 m3/h. A
series of header and sub-header pipelines suppling irrigation drip tubing are used to distribute the barren solution from the main barren
solution pipelines to each cell. Solution is applied to the ore at a rate of 4.6 L/h/m2 to 8.6 L/h/m2 using
drip emitters. Impact sprinklers, wobblers, or drip emitters are used to irrigate the side slopes of the heap.
The barren solution percolates through the ore, collecting precious
metals, and exits the heap material at one of several collection areas as pregnant solution.
Upon exiting the heap, the pregnant solution can be routed to either
the recirculation system or the pregnant solution ponds depending on the gold grade of the solution. If the precious metal content is
low, the solution is routed through the leach solution recirculation system to the top of the heap for extraction of additional precious
metals. If the pregnant solution precious metal content is high enough, the solution is routed to the pregnant ponds.
Leaching is conducted concurrently with ore stacking to allow progressive
lifts to be constructed and operated in a similar manner. The pH and cyanide concentrations are adjusted in either the barren solution
pond or by injection into the barren solution line at the toe of the heap.
| | 14-3 | |
| SSR Mining Inc. | Marigold Complex S-K 1300 Report | February 12, 2024 SLR Project No.: 138.21581.00002 |
Solution management consists of six authorized pregnant solution ponds
(Pregnant Ponds No. 1 to 6) and one storm water event pond, which are interconnected with synthetic-lined channels. Pregnant Pond No.
1 is only used during significant events. There are also two barren solution ponds (Barren Pond No. 1 and 2), which are interconnected
with a synthetic-lined channel. The process solution ponds have been designed to hold the working volume of solution while maintaining
a two-foot freeboard after a 100-year storm event and 24-hour power outage.
Ancillary facilities include solution pumps and piping, two separate
sodium cyanide addition facilities, two sodium hydroxide addition systems (barren solution pH adjustment), and four locations for antiscalant
addition.
Pregnant solution from the leach pad is collected in the pregnant solution
ponds and pumped to the carbon-in-column (CIC) adsorption plant located on the north side of Barren Pond No. 1 to recover the gold. The
carbon adsorption plant consists of seven parallel trains of carbon columns, each with five columns. Each train is designed to process
450 m3/h of pregnant solution. Column discharge solution reports to the barren ponds, where fresh and reclaim water is added
to maintain the appropriate water balance, before the solution is recycled back to the leach pad. The plant also contains carbon storage
tanks, a liquid cyanide storage tank, and a liquid caustic soda storage tank.
| 14.5 | Carbon Elution and Electrowinning |
Loaded carbon from carbon adsorption is transported by a dedicated truck
to the carbon processing facility where gold is eluted (re-dissolved) from the carbon in two 2.7 t capacity carbon elution vessels. Gold
is eluted from the carbon using the Pressure Zadra process, where a hot caustic solution at approximately 140°C and with a pH of 13
or greater is circulated through the elution column, from bottom to top, under pressure. The resulting rich gold eluant flows from the
top of the column to a rich electrolyte tank, from which it is pumped through two parallel 2.8 m3 electrowinning cells to recover
the gold. The barren eluant discharging the electrowinning cells is recirculated through heat exchangers to the bottom of the elution
vessel to strip more gold. The process continues until most of the gold is recovered from the carbon.
The stripped carbon is acid washed in an acid wash column with hydrochloric
acid to remove carbonate scale and inorganics. The acidified carbon is then neutralized with water in the same column. The carbon is discharged
from the column and transferred to the reactivation kiln. The carbon is reactivated by heating in a rotary kiln at 750°C. The reactivated
carbon is quenched and screened before being returned to the carbon adsorption circuit to be reloaded with gold.
The plated material (sludge) resulting from electrowinning is collected
in a filter press and then retorted for drying and mercury removal. After retorting, the sludge is mixed with flux and smelted in a propane
fired furnace for final precious metal doré recovery.
Ventilation from the strip circuit pregnant and barren solution tanks,
electrowinning cells, retort, and smelting furnace is directed to a deep bed scrubber (sulfur-impregnated activated carbon) where any
vaporized mercury is recovered prior to exhaust.
| | 14-4 | |
| SSR Mining Inc. | Marigold Complex S-K 1300 Report | February 12, 2024 SLR Project No.: 138.21581.00002 |
The kiln discharge is vented to a wet scrubber that uses water mist
to condense mercury and recover it as elemental mercury. After demisting, the air is also passed through sulfur-impregnated carbon to
recover any remaining vaporized mercury prior to exhaust.
| 14.9 | Planned Processing Upgrade Projects |
A number of ongoing improvement projects are planned, including:
| · | With the increasing height of the heap leach pads and distance from the primary pump locations, barren booster pumps are planned to
be installed to maintain solution flow rates at 3,180 m3/hr. |
| · | Installation of mobile telemetry and instrumentation to be able to remotely monitor individual area barren application rates. In addition,
telemetry on primary pregnant and barren flowmeters. |
| · | Modification of CIC bubble plates to assist with equalizing solution distribution across the column and increasing flow rate of solution
through the CICs while maintaining the carbon inventory in the columns and adsorption efficiencies. |
Reagent consumption rates are within industry norms for the types of
ores processed.
Average annual unit consumption rates of the reagents for the period
2010 to June 2023 are shown in Figure 14-2.
Figure 14-2: Average Annual Reagent
Consumption
Source: SSR, 2023
| | 14-5 | |
| SSR Mining Inc. | Marigold Complex S-K 1300 Report | February 12, 2024 SLR Project No.: 138.21581.00002 |
| 14.11.1 | Recovery from Heap Leaching |
From March 1990 through September 2023, gold recovery from the heap
leach pad is 70.6%. This recovery was achieved with 90 to 120-day primary leach cycles and an overall mass-of-solution to mass-of-ore
ratio of 1.29:1.
The Marigold heap leach gold recovery trend from March 1990 through
June 2023 from the Marigold heap leach is shown in Figure 14-3.
Figure 14-3: Marigold Heap Leach Pad
Gold Recovery Curve from March 1990 through June 2023
Source: SSR, 2023
| | 14-6 | |
| SSR Mining Inc. | Marigold Complex S-K 1300 Report | February 12, 2024 SLR Project No.: 138.21581.00002 |
| 15.1 | Site Access, Power, and Water |
Marigold is accessible via Interstate Highway 80 in northern Nevada
and is approximately five kilometres south–southwest of Valmy in Humboldt County. The site access road supports two lanes of traffic
and consists of hard-packed clay and gravel.
The power supply for Marigold is provided by NV Energy Inc. via a 120 kV
transmission line to site. Site power draw is 5 MW. After exiting the main substation, power is distributed through a 25 kV
distribution grid. The main electrical substation is shown in Figure 15-1.
| 15.1.3 | Operations Water Supply |
Water for Marigold is supplied from three existing groundwater wells
located near the access road to the Property. Marigold owns groundwater rights and collectively allows up to 3.134 million m3
of water consumption annually, the majority of which is used as makeup water for process operations. Dewatering water is used for process
make-up water and dust suppression, however, the majority is sent to the rapid infiltration basins (RIBs) for infiltration back into the
aquifer. A pipeline has been constructed to connect the dewatering circuit to the process circuit so the dewatering water can be used
as make-up supply water to the process. This connection minimizes the need for the three production wells and they will only be used for
back-up as needed.
On average, total freshwater makeup is 2.4 m3/min. The
well pump parameters are listed in Table 15-1, and the locations of the pumps are shown in Figure 15-2.
Table 15-1: Pump Assets
| Pump Asset |
Pump Capacity
(hp) |
Power Consumption
(kW) |
| 793-PMP-001 |
75 |
56 |
| 793-PMP-002 |
150 |
112 |
| 793-PMP-003 |
150 |
112 |
Discussion of the extraction and infiltration of pit water is included
in Section 13.14.
| | 15-1 | |
| SSR Mining Inc. | Marigold Complex S-K 1300 Report | February 12, 2024 SLR Project No.: 138.21581.00002 |
| 15.2 | Buildings and Facilities |
| 15.2.1 | Buildings and Facilities in Main Plant and Offices Area |
The buildings and facilities described below are located in the main
plant and offices area as shown in Figure 15-1:
| · | Truck shop and mobile maintenance warehouse: The Marigold truck shop complex is located near the mine entrance. It is a four-bay shop
sized for 300 t class haul trucks. The shop contains a tool crib, oil and lubricant bulk storage, ten offices, locker rooms, training
room, and warehouse. A covered warehouse storage yard is located adjacent to the admin building complex. |
| · | Mill building: The mill building consists of facilities supporting the metal recovery operations, including the refinery and metallurgical
laboratory. Adjacent to the mill building is the thickener water storage tank and remaining CIL tanks from the 1989 flowsheet. |
| · | Crushing plant: The crushing plant is used to produce stemming for blastholes, road material and over liner for heap leach pad. The
crusher is a remnant from the 1989 flowsheet. |
| · | Heap leach carbon columns: The heap leach carbon columns are an integral part of the gold recovery process, which is detailed in Section
14. |
| · | Wash bay: The wash bay is located next to the truck shop and consists of one covered bay. The wash bay building also contains a settling
pond for water recycling. |
| · | Administration building and light vehicle (old) shop: The main administration building encompasses most site-support departments and
includes a small warehouse facility, core shed, the shovel and drill shop (former truck shop), light-vehicle maintenance bay and the assay
laboratory. Adjacent to this building are trailers which provide additional office space. |
| · | Assay laboratory: The assay laboratory supports ongoing mine operations, including grade control and gold solution analysis. |
| · | Motor control center (MCC): The MCC houses controls for the pumps and boosters for the barren and pregnant solution ponds. |
| 15.2.2 | Additional Buildings and Facilities on Site |
Additional buildings and facilities on site include:
| · | Potable water treatment building |
| · | Process line-out building |
| | 15-2 | |
| SSR Mining Inc. | Marigold Complex S-K 1300 Report | February 12, 2024 SLR Project No.: 138.21581.00002 |
| 15.2.3 | Additional Facilities on Section 20 |
Additional facilities are located on Section 20, which is identified
in Figure 15-3 as the Mine Ops area. These facilities include:
| · | Welding and fabrication shop |
| · | Dispatch/MineCare office and mine operations line-out building |
| · | Diesel tanks and fueling station |
The explosives magazine is located a safe distance from the plant and
offices area.
| 15.4 | Tailings Storage Facility and Water Diversion |
The TSF was decommissioned and reclaimed. The only remaining activity
concerning the TSF is ongoing monitoring.
The Trout Creek water diversion structure and flood control dam is located
west of the former Basalt Pit. It is designed for a 100-year storm event.
| 15.5 | Leach Pads and Solution Ponds |
The leach pad is discussed in detail in Sections 14 and its location
is shown in Figure 15-3.
Details on the barren and pregnant solution ponds can be found in Section
14.
| 15.6 | Waste Rock Storage Areas |
Details on completed, in progress, and future WRSA can be found in Section
13. The general location of planned and current WRSA is shown in Figure 15-3.
| | 15-3 | |
| SSR Mining Inc. | Marigold Complex S-K 1300 Report | February 12, 2024 SLR Project No.: 138.21581.00002 |
Figure 15-1: Infrastructure Site
Map
| | 15-4 | |
| SSR Mining Inc. | Marigold Complex S-K 1300 Report | February 12, 2024 SLR Project No.: 138.21581.00002 |
SSR
Mining Inc. Marigold Complex Nevada, USA Infrastructure Site Map
| | 15-5 | |
| SSR Mining Inc. | Marigold Complex S-K 1300 Report | February 12, 2024 SLR Project No.: 138.21581.00002 |
Figure 15-2: Freshwater Well Sites
SSR Mining Inc. Marigold
Complex Nevada, USA Freshwater Well Sites
| | 15-6 | |
| SSR Mining Inc. | Marigold Complex S-K 1300 Report | February 12, 2024 SLR Project No.: 138.21581.00002 |
Figure 15-3: LOM Site Schematic Showing
Final Pit Limits, WRSA, and Leach Pad
SSR Mining Inc. Marigold
Complex Nevada, USA LOM Site Schematic Showing Final Pit Limits, WRSA, and Leach Pad
| | 15-7 | |
| SSR Mining Inc. | Marigold Complex S-K 1300 Report | February 12, 2024 SLR Project No.: 138.21581.00002 |
The Marigold Mine produces gold and silver contained in doré.
Marigold is an active producer and has been for over three decades years.
| 16.1 | Marketing and Metal Prices |
Gold is the principal commodity at the Marigold Mine and is freely traded
at prices that are widely known, so that prospects for sale of any production are virtually assured. Metal prices for the economic analysis
were estimated after analysis of consensus industry metal price forecasts and compared to those used in other published studies. The metal
prices selected have taken into account the current Project life. The metal prices used for the economic analysis, shown in Table 16-1,
are considered to be representative of industry forecasts.
Table 16-1: Economic Analysis Metal
Price Assumptions
| Metal Price |
Units |
2023 |
2024 |
2025 |
2026 |
2027 |
Long-Term |
| Gold |
$/oz |
1,925 |
1,930 |
1,890 |
1,810 |
1,780 |
1,755 |
| Silver |
$/oz |
23.50 |
24.00 |
23.95 |
23.70 |
23.35 |
22.75 |
The doré is securely transported by road freight to a refinery
where it is refined into gold bullion. The bullion is sold by SSR to banks that specialise in the purchase and sale of gold bullion.
No external consultants or market studies were directly relied on to
assist with the sales terms and commodity price projections used in this TRS.
There are a number of acceptable refineries with the capacity to refine
doré. Currently, SSR has entered into a non-exclusive refining agreement with Asahi Refining USA, Inc., and the terms and conditions
of this contract are within industry norms. The transportation and refining costs for the doré and other operating costs are also
in accordance with industry standards.
| | 16-1 | |
| SSR Mining Inc. | Marigold Complex S-K 1300 Report | February 12, 2024 SLR Project No.: 138.21581.00002 |
| 17.0 | Environmental Studies, Permitting, and Plans, Negotiations, or Agreements with Local Individuals or Groups |
Specific federal, state, and local (Humboldt County, Nevada) regulatory
and permitting requirements apply to MMC. MMC currently holds active, valid permits for all current facets of the mining operation. MMC
is currently in compliance with all permits. At present, there are no known environmental issues that impact the ability to extract Mineral
Resources at the Property. All activities associated with MMC require an approved reclamation plan that includes a Reclamation Cost Estimate
(RCE) for all permitted facilities and activities. This was updated and approved by federal and state agencies in 2022. MMC is actively
engaged with the local communities and stakeholders and there are no outstanding negotiations or social commitments for the operation
of the mine.
| 17.2 | Environmental Studies |
Significant portions of MMC exist on public lands administered by the
BLM. As a result, the majority of environmental studies related to mining activities were conducted under the BLM authority as part of
the National Environmental Policy Act (NEPA) regulations, which require various degrees of environmental impact analyses dictated by the
scope of the proposed action. Marigold has undergone several significant NEPA actions in the normal course of operational planning; the
most recent was the PoO – Valmy Development Project (the PoO Amendment), approved in 2023, to permit the future mining in the Valmy
and New Millennium pits.
The environmental baseline studies to support the Environmental Assessment
(EA) process for the PoO Amendment were initiated in 2021. These baseline studies included, but were not limited to, socioeconomics, air
quality impacts, cultural and archaeological resources, groundwater model, waste rock/material characterization, water characterization,
sage grouse habitat evaluation, evaluations for flora and fauna. A list of the baseline studies and reports is shown in Table 17-1.
Table 17-1: Baseline Studies Supporting
the EA
| Study Media |
Documents/Reports Included Baseline Studies and Data Compiled for Marigold Mine Valmy Development EA |
| Hydrology/Water Quality/Geochemistry |
Hydrogeologic Assessment, Geochemical Testing Workplan |
| Air Quality |
Air Quality Assessment |
| Flora/Fauna |
Golden Eagles Surveys, Sage Grouse Surveys |
| Socio-Economic |
Social Baseline Assessment |
| Cultural Resources |
Cultural Resource Survey |
Following the approval of the PoO, MMC has submitted modifications for
State permits to incorporate the Valmy Development Project. The Environmental Assessment conducted resulted in a Finding of No Significant
Impact (FONSI).
| | 17-1 | |
| SSR Mining Inc. | Marigold Complex S-K 1300 Report | February 12, 2024 SLR Project No.: 138.21581.00002 |
Specific federal, state, and local (Humboldt County, Nevada) regulatory
and permitting requirements apply to MMC. The primary permits for MMC operations include the Plan of Operations (PoO) permitted via the
BLM; the Water Pollution Control Permits (WPCP) issued by the Nevada Division of Environmental Protection-Bureau of Mining Regulation
& Reclamation (NDEP-BMRR); and the reclamation permit issued by the NDEP-BMRR. MMC currently holds active, valid permits for all current
facets of the mining operation, including, but not limited to, those permits listed in Table 17-2.
Table 17-2: Marigold Mine Environmental
Permits for Operation
| Agency |
Permit Name |
Permit Number |
Status |
| Bureau of Land Management (BLM) |
Plan of Operations |
NVN065034 |
Active |
Nevada Division of Environmental Protection –Bureau of Mining Regulation and Reclamation
(NDEP-BMRR) |
Water Pollution Control Permit (including Petroleum Contaminated Soils Permit) |
NEV0088040
NEV2022118 |
Active |
| NDEP-BMRR |
Reclamation Permit |
#0108 |
Active |
| Nevada Division of Environmental Protection –Bureau of Water Pollution Control (NDEP-BWPC) |
Stormwater General Discharge Permit |
NVR300000 |
Active |
Nevada Division of Environmental Protection –Bureau of Air Pollution Control
(NDEP-BAPC) |
Title V Air Quality Operating Permit |
AP1041-2967.01 |
Active |
| NDEP-BAPC |
Class II Air Quality Operating Permit |
AP1041-3666 |
In Renewal Process (Application Administratively complete as of January 18, 2023) |
| NDEP-BAPC |
Mercury Operating Permit to Construct: Phase II air) |
AP1041-2254 |
Active |
| Nevada Department of Wildlife (NDOW) |
Industrial Artificial Pond Permit |
39502 |
In Renewal Process (Received by NDOW on July 27, 2023) |
| United States Environmental Protection Agency (EPA) |
EPA/RCRA ID |
NVD986766954 |
Active |
| United States Army Corps of Engineers |
Not Required |
No jurisdictional waters delineated (August 2019) |
NA |
| | 17-2 | |
| SSR Mining Inc. | Marigold Complex S-K 1300 Report | February 12, 2024 SLR Project No.: 138.21581.00002 |
| Agency |
Permit Name |
Permit Number |
Status |
Nevada Division of Environmental Protection –Bureau of Sustainable Materials Management
(NDEP-BSMM) |
Class III Landfill Waiver |
SW1764 |
Active |
| SW1824 |
Active |
| Nevada State Fire Marshal |
Hazardous Materials Permit (State of Nevada) |
109791 |
Active |
Nevada Division of Environmental Protection –Bureau of Safe Drinking Water
(NDEP-BSDW) |
Potable Water Permit |
HU-1103-NTNC |
Active |
| NDEP-BWPC |
Septic Permit |
GNEVOSDS09-0016 |
Active |
| GNEVOSDS09-0252 |
Active |
| United States Department of Transportation |
Hazardous Materials Storage and Transportation Registration |
061521550469DF |
Active |
| Nevada Board of Regulation of Liquefied Petroleum Gas |
Liquefied Petroleum Gas – Class 5 License |
5-3482-01 |
Active |
| Nevada Division of Water Resources (NDWR) |
Trout Creek Dam Permit |
J-666 |
Active |
| NDWR |
Water Rights |
83256 (Certificate 583) |
Active |
| 2324 (Certificate 584) |
Active |
| 86582 |
Active |
| 86583 |
Active |
| 86584 |
Active |
| 86585 |
Active |
| 87235-87242 |
Active |
| 76425S01 |
Active |
| 76425S02 |
Active |
| 76425S03 |
Active |
| 88986 |
Active |
| 90787 |
Active |
| 91141 – Central Permit |
Active |
| 90788 |
Active |
| 80849 |
Active |
| Humbolt County Board of Commissioners |
County Conditional Use Permit |
UH-15-07 |
Active |
| | 17-3 | |
| SSR Mining Inc. | Marigold Complex S-K 1300 Report | February 12, 2024 SLR Project No.: 138.21581.00002 |
Given the number of active permits at Marigold, some degree of permit
modification or renewal effort is typically underway at all times. As an example, the Class II Air Quality permit is currently in the
renewal process.
| 17.4 | Environmental Impacts |
MCC is currently in compliance with all permits presented in Table 17-2.
At present, there are no known environmental issues that impact the ability to extract Mineral Resources at the Property. Specifically,
no threatened or endangered species are known to exist at the site; there are no year-round watercourses on the Property; groundwater
impact of mining has been addressed and all environmental regulations and permit conditions are continuously being met. Cultural resource
surveys have been conducted across the Property, and an approved program of avoidance, distance buffer and mitigation measures are in
place as part of the existing PoO.
Waste rock is managed in several designated surface storage areas within
the Property boundary, which are concurrently reclaimed to 3:1 slopes, when the sequence of mining operations allows, and then re-vegetated
with native seed mixes. When possible, older pits are backfilled with waste rock. To date, all waste rock encountered at Marigold has
been oxide in nature and is typically non-acid-generating, as confirmed by quarterly sampling. There are no waste rock areas with observed
runoff or stability concerns.
The only tailings area at Marigold operated during a limited period
from 1989 to 1999; this area has been reclaimed and revegetated, the State Engineer’s office no longer lists it as a permitted dam,
and the bond has been released by the BLM with the exception of a small bond related to vegetation. MMC anticipates a full release of
the bond in the near future.
| 17.5 | Environmental Monitoring and Reporting |
Environmental monitoring and reporting are conducted in accordance with
various permits listed in Table 17-2. This monitoring includes groundwater quantity and quality, surface water quality and presence, stormwater
quality, air quality such as fugitive dust, geochemistry, vegetation, and wildlife. Data collected is routinely reported to federal and
state agencies to demonstrate compliance. Agency representatives from the BLM, NDEP, and the Nevada Department of Wildlife (NDOW) also
conduct routine compliance inspections.
The use of cyanide is a critical part of the gold mining process. However,
if not handled correctly, cyanide can have significant impacts on both environmental and human health. The use of cyanide at the Project
is governed both by the requirements of Turkish national laws and regulations and aligned with industrial best practice. SSR became a
signatory to the International Cyanide Management Code on January 23, 2023, which will require certification within three years of signing.
All employees and contractors who handle, transport, or dispose of cyanide are required to undertake specialized training in cyanide handling.
| 17.6 | Community Relations and Social Responsibilities |
There are currently no outstanding negotiations or social requirements
regarding operations at MMC. The nature of NEPA and large-scale state permits involve public comment periods as well as public meetings.
Recently held meetings generated minimal concern from the community, and local county government has been consistently supportive of continued
mine operations at MMC. There are no formal discussions required with local stakeholders or Native American tribal representatives, but
mine management does meet informally to provide general updates and to discuss proposed requests from the community and local stakeholders
for donations and support.
| | 17-4 | |
| SSR Mining Inc. | Marigold Complex S-K 1300 Report | February 12, 2024 SLR Project No.: 138.21581.00002 |
Community support and engagement is well established between MCC and
local communities including but not limited to Battle Mountain, Elko, and Winnemucca. Community engagement includes education programs
on and off site and frequent communication and mine operations updates with the local communities.
| 17.7 | Mine Closure Requirements |
All activities associated with MMC require an approved reclamation plan
that includes a Reclamation Cost Estimate (RCE) for all permitted facilities and activities. MMC engages in concurrent reclamation practices
during operations in an effort to reduce bonding requirements.
State regulatory requirements mandate a formal closure plan be filed
two years before the facility initiates closure. Both the BLM and State require a tentative closure plan as part of normal NEPA and operating
permit requirements. Marigold has filed and maintained these closure plans, which, in conjunction with standard reclamation and re-vegetation
of all disturbed areas, include discussions on removal of most infrastructure, monitoring, and notably long-term heap leach drain down
solution management. The currently approved closure plan describes a series of evaporation cells to manage long-term solution drain down
following an approximate two-year period of active solution volume reduction through evaporation for the MMC.
The reclamation plan and associated RCE for MMC were updated in 2022
to include the RIBs and was approved by all permitting agencies. Current bonding requirements are based on third-party cost estimates
to reclaim all permitted features at the Property. The BLM, NDEP, and Nevada Bureau of Mining Regulation and Reclamation (BMRR) review
and approve the bond estimate, and the BLM holds the financial instruments providing the bond backing. The reclamation bond was updated
in 2022 and approved by all parties resulting in a total bond amount of US$81,300,000. Current bonds are presented in Table 17-3.
Table 17-3: Marigold Mine Reclamation
Cost Estimate/Bond
| Agency |
Bond Reference |
Financial Assurance Mechanism |
Amount (US$) |
| BLM |
NVB001804 |
Surety Bond |
$47,900,000 |
| BLM |
NVB001805 |
Surety Bond |
$28,400,000 |
| BLM |
NVB002261 |
Surety Bond |
$5,000,000 |
| |
Total |
$81,300,000 |
| | 17-5 | |
| SSR Mining Inc. | Marigold Complex S-K 1300 Report | February 12, 2024 SLR Project No.: 138.21581.00002 |
| 18.0 | Capital and Operating Costs |
SSR’s forecasted capital and operating costs estimates related
to the development of Mineral Reserves are derived from annual budgets and historical actuals over the long life of the current operation.
According to the American Association of Cost Engineers (AACE) classifications, these estimates would be Class 1 with an accuracy range
of -3% to -10% to +3% to +15%.
LOM project capital costs, which considers all costs incurred before
October 1, 2023, as sunk, are summarized in Table 18-1 and covers related activities from mining to placing ore on the heap pad at an
average LOM mining rate of approximately 260,000 tpd moved over the ten year mining phase and final reclamation.
Table 18-1: Capital Costs Summary
| Capital Costs |
Total
($ million) |
|
| Mining Equipment Replacement |
32.1 |
|
| Equipment/Building Maintenance |
151.9 |
|
| Administration |
1.0 |
|
| Processing/Pads/Ponds |
33.6 |
|
| Permitting |
27.9 |
|
| Exploration/Mine Development |
11.0 |
|
| Subtotal Sustaining Capital |
257.6 |
|
| Reclamation |
69.2 |
|
| Total Capital Costs |
326.8 |
|
Sustaining capital costs include the following:
| · | Replacement of mining equipment as it reaches its economic life during the remaining nine years of mining. The majority of the mining
equipment replacement costs relates to replacing haul trucks and excavators, but it also covers drills and mine support equipment. |
| · | Major equipment rebuilds and component replacement. In order to maintain equipment availability for the extended equipment lives,
major equipment is programmed for rebuilds at set points during its economic life. |
| · | Administration costs such as light vehicle purchases and various site infrastructure improvements. |
| · | Ongoing expansion of the leach pad and associated process infrastructure. |
| · | Permitting costs mainly associated with dewatering infrastructure (wells, pipelines, rapid infiltration basins) that are required
to lower the water table in advance of planned mine development. |
| | 18-1 | |
| SSR Mining Inc. | Marigold Complex S-K 1300 Report | February 12, 2024 SLR Project No.: 138.21581.00002 |
| · | Exploration/Mine Development costs are mainly capitalized drilling to better refine the grade estimates in the ore body that will
be mined during the LOM. |
The costs associated with reclamation and closure activities at Marigold
were estimated to be $69.2 million (real Q4 2023 dollars) with the majority of the costs incurred from 2030 through to 2046.
As the Property has been in operation for a number of years, the level
of project definition for the operating cost estimates is very high. Given the available project performance data and the high project
definition, no contingency was included in the cost estimate. The QP considers the operating cost estimate to be in the accuracy range
of +/-15%.
The LOM operating costs estimate is $11.60/t of stacked ore, as shown
in Table 18-2.
Table 18-2: Operating Costs Summary
| Description |
Total LOM
($ million)* |
$/t stacked* |
| Mining |
974 |
5.57 (1.11/t moved) |
| Maintenance |
432 |
2.47 (0.49/t moved) |
| Processing |
415 |
2.37 |
| Site Support |
205 |
1.14 |
| Total |
2,027 |
11.56 |
*From October 1, 2023
The LOM mine operating cost estimate is shown in Table 18-3 and covers
activities from mining to placing ore on the heap pad at an average LOM mining rate of approximately 260,000 tpd moved over the ten year
mining phase.
Table 18-3: Mine Operating Cost Summary
| Description |
$/t moved |
|
| Labor |
0.36 |
|
| Fuel |
0.28 |
|
| GET(1) |
0.06 |
|
| Tires |
0.09 |
|
| Explosives |
0.13 |
|
| All Others |
0.19 |
|
| Total |
1.11 |
|
Notes: 1Ground engaging tools
| | 18-2 | |
| SSR Mining Inc. | Marigold Complex S-K 1300 Report | February 12, 2024 SLR Project No.: 138.21581.00002 |
The LOM maintenance operating cost estimate is shown in Table 18-4.
Table 18-4: Maintenance Operating
Cost Summary
| Description |
$/t moved |
|
| Labour |
0.18 |
|
| Supplies |
0.11 |
|
| Parts & Services |
0.21 |
|
| Total |
0.49 |
|
Processing costs over the LOM include all costs required to recover
the gold from the rock after it is mined and placed on the leach pad. This includes the cost of chemicals to process the ore, pumping
costs to get the barren solution to the leach pad, pumping costs to get the pregnant solution to the carbon columns for gold recovery
after it returns from the leach pad, and the costs associated with the extraction of the gold from the carbon to produce the final doré
product shipped from Marigold. The processing cost estimate is shown in Table 18-5 for an average stacking rate of 52,000 tpd and includes
costs for the LOM, including the ten year mine life and the final six year rinsing phase of the heap leach pad which starts in 2032 after
mining operations has ceased.
Table 18-5: Process Operating Cost
Summary
| Description |
$/t ore stacked |
|
| Labor |
0.47 |
|
| Operating Supplies |
1.58 |
|
| Maintenance Expense |
0.13 |
|
| Total Services & Misc |
0.19 |
|
| Total |
2.37 |
|
G&A costs for the LOM include accounting and site administration,
warehousing, safety, human resources, and environmental. These costs, presented in Table 18-6, are related to supporting the operations
groups in the mine, maintenance, and processing departments.
Table 18-6: G&A Operating Cost
Summary
| Description |
$/t stacked |
|
| Labor |
0.43 |
|
| Supplies/Services |
0.71 |
|
| Total |
1.14 |
|
| | 18-3 | |
| SSR Mining Inc. | Marigold Complex S-K 1300 Report | February 12, 2024 SLR Project No.: 138.21581.00002 |
The current Marigold workforce totals 478 persons, consisting of 70
salaried and 408 hourly employees (who are not unionized) as of the effective date of this report. The breakdown by department is shown
in Table 18-7.
Table 18-7: Current Workforce
| |
Hourly FTE |
Salary FTE |
Total |
| Mine |
234 |
13 |
247 |
| Plant |
41 |
11 |
52 |
| Maintenance |
95 |
14 |
109 |
| G&A |
30 |
17 |
47 |
| Tech Services |
8 |
15 |
23 |
| Total |
408 |
70 |
478 |
The LOM workforce is expected to be similar throughout the remaining
nine years of mine life with a reduction of workforce during the six year pad drain down.
The Marigold full time equivalent (FTE) workforce for the years 2020
to 2023 (actuals) and the LOM plan (projected) is summarized in Table 18-8.
Table 18-8: LOM Workforce Levels
| |
Hourly FTE |
Salary FTE |
Total |
| 2020 Actual |
367 |
73 |
440 |
| 2021 Actual |
358 |
79 |
437 |
| 2022 Actual |
375 |
86 |
461 |
| 2023 Actual |
395 |
83 |
478 |
| 2024 to 2035 Projected |
405 |
90 |
495 |
| | 18-4 | |
| SSR Mining Inc. | Marigold Complex S-K 1300 Report | February 12, 2024 SLR Project No.: 138.21581.00002 |
An after-tax Cash Flow Projection has been generated from the Life of
Mine production schedule and capital and operating cost estimates and is summarized in Table 19-1. A summary of the key criteria is provided
below. The complete cash flow is presented in Section 27.0 Appendix.
| · | 52,000 tonnes ore per day stacked (approximately 20 Mt per year) average stacked grade of 0.47 g/t Au (ROM and stockpile mine plan). |
| · | LOM average 212,000 ounces per year gold recovered from mine plan with LOM stacked ore recovery averaging 74.3%. Total 1.96 Moz recovered
over LOM operation (including Q4 2023 through 2032). |
| · | Estimated 12% additional ounces (243,000 ounces produced) included in work in progress: 25,000 additional ounces produced during the
ten year heap pad operations and 218,000 additional ounces produced during six year rinsing operations after mining ceases. |
| · | Metal price: US$1,790 per ounce gold (LOM realized), US$1,755 per ounce gold long term price (2028+), US$23.00 per ounce silver (LOM
realized), US$22.75 per ounce silver long term price (2028+). |
| · | Gold at refinery 99.95% payable, 100% silver payable. |
| · | Net Smelter Return includes doré refining, transport, and insurance costs. |
| · | Revenue is recognized at the time of gold production. |
| · | Mine life: 15 years, excluding Q4 2023 (nine years of mining and six years of heap pad rinsing). |
| · | Life of Mine production plan as summarized in Table 13-3. |
| · | Mine life sustaining capital totals $257.6 million. |
| · | Final reclamation costs total $69.2 million. |
| · | Average operating cost over the mine life is $11.56 per tonne stacked. |
| 19.1.3 | Taxation and Royalties |
Marigold is subject to Nevada Net Proceeds of Minerals Tax, Nevada property
and sales taxes, and U.S. federal income tax. The economic analysis calculates these taxes in accordance with legislation enacted as of
January 1, 2022. Property and sales taxes are accounted for in the operating costs of the mine.
| | 19-1 | |
| SSR Mining Inc. | Marigold Complex S-K 1300 Report | February 12, 2024 SLR Project No.: 138.21581.00002 |
| 19.1.3.1 | Nevada Gross Proceeds Tax |
In 2021, the State of Nevada enacted Assembly Bill 495, effective July
1, 2021, which is an annual excise tax on gold and silver revenue. Under the bill, the tax rates vary based on the taxpayer’s Nevada
gross revenue. A 0.75% rate is imposed on Nevada gross revenue of more than $20 million but not more than $150 million in a taxable year
(defined as the calendar year). A rate of 1.10% applies to Nevada gross revenue exceeding $150 million in any tax year. The LOM average
rate for Marigold is approximately 0.9% and average $3.5 million per year during the remaining nine year mine operations.
| 19.1.3.2 | Nevada Net Proceeds Tax |
The State of Nevada imposes a 5% net proceeds tax on the value of all
minerals extracted in the State. This tax is calculated and paid based on a prescribed net income formula applied only to income and expenses
from mining, disallowing deductions for exploration and related-party financing costs. This tax is normally assessed at 5% of net income
for major mine operations like Marigold. It is a deductible expense for U.S. federal income tax and averages $6.3 million per year over
the remaining nine year mine operations.
| 19.1.3.3 | US Federal Income Tax |
Federal income tax is determined under regulations that came into effect
on January 1, 2022. Under these regulations, which removed alternative minimum tax, the mine is subject to a federal income tax rate of
21%. SLR utilized Unit of Production depreciation, depletion allowances, and Net Operating Losses (NOL) as deductions. Total U.S. federal
tax payable averages $11.6 million per year over the remaining nine year mine operations.
Marigold is subject to a variety of NSR royalty payments, payable to
various parties under the terms of the leases, as described in Section 3. The annual average NSR royalty payments range from 3.7% to 10.0%
and averages $27.4 million per year over the remaining nine year mine operations.
Considering the Property on a stand-alone basis, the undiscounted pre-tax
cash flow totals $1,274 million over the mine life. The after-tax Net Present Value (NPV) at a 5% discount rate (midpoint with November
1, 2023, as time zero) is $800 million, as shown in Table 19-1.
| | 19-2 | |
| SSR Mining Inc. | Marigold Complex S-K 1300 Report | February 12, 2024 SLR Project No.: 138.21581.00002 |
Table 19-1: After-Tax Cash Flow Summary
| Description |
LOM |
|
| Realized Market Prices |
|
|
| Au ($/oz) – Average |
$1,790 |
|
| Ag ($/oz) – Average |
$23.00 |
|
| Payable Metal |
|
|
| Au (koz) |
2,198 |
|
| Ag (koz) |
46 |
|
| Cash Flow Summary |
US$ million |
|
| Total Gross Revenue |
3,942 |
|
| Mining Cost |
(974) |
|
| Maintenance Cost |
(432) |
|
| Process Cost |
(415) |
|
| G & A Cost |
(199) |
|
| Exploration |
(6) |
|
| Refining/Freight |
(4) |
|
| Mining Royalties |
(277) |
|
| NGPT1 |
(34) |
|
| Total Operating Costs |
(2,342) |
|
| Operating Margin (EBITDA) |
1,600 |
|
| Cash Taxes Payable |
(202) |
|
| Working Capital2 |
0 |
|
| Operating Cash Flow |
1,399 |
|
| Sustaining Capital |
(258) |
|
| Total Closure/Reclamation Capital |
(69) |
|
| |
|
|
| Pre-tax Free Cash Flow |
1,274 |
|
| Pre-tax NPV @ 5% |
953 |
|
| After-tax Free Cash Flow |
1,072 |
|
| After-tax NPV @ 5% |
800 |
|
Notes:
| 2. | Nevada Gross Proceeds Tax |
| 3. | All working capital adjustments net to zero at end of mine life |
| | 19-3 | |
| SSR Mining Inc. | Marigold Complex S-K 1300 Report | February 12, 2024 SLR Project No.: 138.21581.00002 |
The World Gold Council Adjusted Operating Cost (AOC) is $1,065/oz Au.
The mine life capital unit cost, including sustaining and closure/reclamation, is $148/oz, for an All in Sustaining Cost (AISC) of $1,213/oz
Au. The average annual gold production during operation, excluding rinsing phase, is 212,000 ounces per year over the ten year mine life
and 36,000 ounces per year during the six year rinsing phase.
Project risks can be identified in both economic and non-economic terms.
Key economic risks were examined by running cash flow sensitivities:
After-tax IRR sensitivity over the base case has been calculated for
-20% to +20% variations for head grade, recovery, and gold price and -15% to +15% for variations for operating and capital costs. The
sensitivities are shown in Figure 19-1 and Table 19-2. The Project is most sensitive to changes in head grade, metallurgical recovery,
and metal price (usually with same magnitude of impact) followed by operating cost and finally capital costs.
Figure 19-1: After-Tax Sensitivity
Analysis
| | 19-4 | |
| SSR Mining Inc. | Marigold Complex S-K 1300 Report | February 12, 2024 SLR Project No.: 138.21581.00002 |
Table 19-2: After-Tax Sensitivity
Analyses
| Variance |
Head Grade
(g/t Au) |
NPV at 5%
($ millions) |
| -20% |
0.37 |
329 |
| -10% |
0.42 |
566 |
| 0% |
0.47 |
800 |
| +10% |
0.52 |
1,033 |
| +20% |
0.56 |
1,266 |
| Variance |
Gold Recovery
(%) |
NPV at 5%
($ millions) |
| -20% |
59.4 |
329 |
| -10% |
66.8 |
566 |
| 0% |
74.3 |
800 |
| +10% |
81.7 |
1,033 |
| +20% |
89.1 |
1,266 |
| Variance |
Long Term Metal Prices
($/oz Au) |
NPV at 5%
($ millions) |
| -20% |
1,404 |
329 |
| -10% |
1,580 |
566 |
| 0% |
1,755 |
800 |
| +10% |
1,931 |
1,033 |
| +20% |
2,106 |
1,266 |
| Variance |
Operating Costs
($/t) |
NPV at 5%
($ millions) |
| -15% |
9.86 |
998 |
| -7.5% |
10.73 |
899 |
| 0% |
11.60 |
800 |
| +7.5% |
12.47 |
701 |
| +15% |
13.34 |
601 |
| Variance |
Capital Costs
($ millions) |
NPV at 5%
($ millions) |
| -15% |
288 |
833 |
| -7.5% |
307 |
817 |
| 0% |
327 |
800 |
| +7.5% |
346 |
784 |
| +15% |
365 |
767 |
| | 19-5 | |
| SSR Mining Inc. | Marigold Complex S-K 1300 Report | February 12, 2024 SLR Project No.: 138.21581.00002 |
The SLR QP has not independently verified this information and this
information is not necessarily indicative of the mineralization at the Marigold Complex.
Marigold is located near the northern limits of a regional belt of ore
deposits commonly referred to as the Battle Mountain-Eureka trend. This north–northwest striking alignment of mines and prospects.
It is the second most prolific gold belt in Nevada after the Carlin trend, and it includes variants of Carlin-Type Gold Deposits (CTGD),
distal type sediment hosted deposits as well as skarn and copper–gold porphyry systems.
Three major gold deposits lie adjacent to the SSR property. Nevada Gold
Mines’ Phoenix mine is approximately 22 km south of the Buffalo Valley deposit, i-80 Gold Corp’s Lone Tree mine is approximately
7 km northwest of Marigold, and Waterton Global Resource Management’s Converse project is approximately 6 km west of Marigold. There
are also several inactive mines and exploration and/or development projects that can be found within a 19 km radius of the property.
Reported production and Mineral Resources for these adjacent properties
are presented in Table 20-1.
Table 20-1: Past Production and Mineral
Resources for Adjacent Properties
| Property |
Owner |
Years of Production |
Gold Produced (Moz) |
Stated Mineral Resources and Mineral Reserves |
| Mineral Reserves |
Measured and Indicated Mineral Resources |
Inferred Mineral Resources |
| Phoenix1 |
Nevada Gold Mines |
2006–Present |
unknown |
2.9 Moz gold (0.58 g/t)
840 Mlb copper (0.18%) |
5.28 Moz |
0.34 Moz |
| Lone Tree Complex2 |
i-80 Gold Corp. |
1991–2012 |
4.53 |
n/a |
610 koz @ 1.51g/t |
2.76 Moz @ 1.6 g/t |
| Converse3 |
Waterton |
– |
– |
n/a |
6.12 Moz |
0.59 Moz |
Notes:
| 1. | Nevada Gold Mines, May 2021; Investor Day Presentation |
| 2. | i-80 Gold Corp., 2021; Technical Report, filed October 21, 2021 |
| 3. | Chaparral Gold, October 21, 2014; website, deposit sold to Waterton Global Resource Management in 2014 |
Phoenix mine is currently operated by Nevada Gold Mines and is a polymetallic
Au-Cu-Ag porphyry system that has been in production since 2006. The mine includes various deposit types, all structurally controlled
by northwest trending faults.
Lone Tree is considered a distal-disseminated deposit that may be genetically
related to a porphyry-type system; mineralization was structurally controlled by north–northwest trending faults.
At Converse, gold mineralization is hosted within a skarn that developed
within the Havallah Formation. No production has occurred at Converse to date.
A plan map of mine properties adjacent to Marigold is presented in Figure
20-1.
| | 20-1 | |
| SSR Mining Inc. | Marigold Complex S-K 1300 Report | February 12, 2024 SLR Project No.: 138.21581.00002 |
Figure 20-1: Plan Map Showing Marigold
Property Outline and Mineralization Relative to Adjacent or Nearby Mines or Published Deposits
SSR Mining Inc. Marigold
Complex Nevada, USA Adjacent Properties
| | 20-2 | |
| SSR Mining Inc. | Marigold Complex S-K 1300 Report | February 12, 2024 SLR Project No.: 138.21581.00002 |
| 21.0 | Other Relevant Data and Information |
No additional information or explanation is necessary to make this TRS
understandable and not misleading.
| | 21-1 | |
| SSR Mining Inc. | Marigold Complex S-K 1300 Report | February 12, 2024 SLR Project No.: 138.21581.00002 |
| 22.0 | Interpretation and Conclusions |
SLR offers the following conclusions by area.
| 22.1 | Geology and Mineral Resources |
| · | The gold deposits at Marigold and Trenton Canyon are best classified as Carlin-type gold deposits. Gold mineralizing fluids were primarily
controlled by fault structure and lithology, with tertiary influence by fold geometry. Buffalo Valley is considered a distal disseminated
silver-gold deposit with strong controls along the margins of felsic porphyry dikes and by favorable lithologies. |
| · | The Property has been the site of considerable mining and exploration, including the drilling and logging of 12,636 drill holes totaling
over 2.4 million meters drilled. |
| · | The estimates of Mineral Resources were prepared using a domain-controlled, ordinary kriging technique with verified drill hole sample
data derived from exploration activities conducted by various companies from 1968 to 2023. |
| · | The SLR QP is of the opinion that the drilling and sampling procedures adopted at Marigold are consistent with generally recognized
industry best practices. The resultant drilling pattern is sufficiently dense to interpret the geometry and the boundaries of gold mineralization
with confidence. The reverse circulation (RC) samples were collected by competent personnel using procedures meeting generally accepted
industry best practices. The process was conducted or supervised by qualified geologists. |
| · | The SLR QP is of the opinion that the samples are representative of the source materials, and there is no evidence that the sampling
process introduced a bias. Accordingly, there are no known sampling or recovery factors that could materially impact the accuracy and
reliability of drilling results. |
| · | In the SLR QP’s opinion, the sample preparation, security, and analytical procedures meet industry standards, and the QA/QC
program, as designed and implemented at Marigold are adequate; consequently, the assay results within the drill hole database are suitable
for mineral resource estimation purposes. Neither the SSR in-house quality control nor SSR predecessor’s quality control yielded
any indication of quality concerns. |
| · | The SLR QP was provided unlimited access for data verification purposes by SSR during this Mineral Resource estimate audit. The SLR
QP is of the opinion that database verification procedures for Marigold comply with industry standards and are adequate for the purposes
of Mineral Resource estimation. |
| · | Based on the data validation and the results of the standard, blank, and duplicate analyses, the SLR QP is of the opinion that the
sampling methods, chain of custody procedures, and analytical techniques are appropriate and meet acceptable industry standards. The assay
and bulk density databases are of sufficient quality for Mineral Resource estimation at the Marigold Complex deposits (Marigold Mine and
Buffalo Valley). |
| · | The SLR QP reviewed the assumptions, parameters, and methods used to prepare the Mineral Resources Statement and is of the opinion
that the Mineral Resources are estimated and prepared in accordance with the U.S. Securities and Exchange Commission (US SEC) Regulation
S-K subpart 1300 rules for Property Disclosures for Mining Registrants (S-K 1300). |
| | 22-1 | |
| SSR Mining Inc. | Marigold Complex S-K 1300 Report | February 12, 2024 SLR Project No.: 138.21581.00002 |
| · | The SLR QP considers that the knowledge of the deposit setting, lithologies, structural controls on mineralization, and the mineralization
style and setting, is sufficient to support the MRE to the level of classification assigned. |
| · | The estimate of Mineral Resources presented were prepared for Marigold, with an effective date of September 30, 2023, and for Buffalo
Valley with an effective date of July 31, 2023. |
| · | The conversion of Mineral Resources to Mineral Reserves used industry best practices to determine operating costs, capital costs,
and recovery performance. Therefore, the estimates are considered to be representative of actual and future operational conditions. |
| · | The SLR QP considers the resource cut-off grade and Whittle pit shapes guide to identify those portions of the MRE that meet the requirement
for the prospects for economic extraction to be appropriate for this style of gold deposit and mineralization. |
| · | The Mineral Resources estimates at the Property include the following by deposit area: |
| o | Marigold: 103.72 million tonnes (Mt) Indicated Resources at an average gold (Au) grade of 0.44 g/t containing 1.47 million ounces
(Moz) Au and an additional 19.09 Mt at an average grade of 0.36 g/t Au containing 0.22 Moz of Inferred Resources. |
| o | Buffalo Valley: 14.89 Mt Indicated Resources at an average grade of 0.57 g/t Au containing 0.27 Moz Au and 8.77 Mt at an average grade
of 0.51 g/t Au containing 0.15 Moz in the Inferred category. |
| · | There are no Measured Resources at the Property. |
| · | The level of uncertainty has been adequately reflected in the classification of Mineral Resources for the Property. The MRE presented
may be materially impacted by any future changes in the break-even cut-off grade, which may result from changes in mining method selection,
mining costs, processing recoveries and costs, metal price fluctuations, or significant changes in geological knowledge. |
| · | The SLR QP is of the opinion that with consideration of the recommendations summarized in Sections 1 and 23 of this TRS, any issues
relating to all relevant technical and economic factors likely to influence the prospect of economic extraction can be resolved with further
work. |
| 22.2 | Mining and Mineral Reserves |
| · | SSR Mining has extensive experience with open pit mining at Marigold and a strong understanding of the work requirements and costs
based on its current operations. |
| · | Open Pit operations at Marigold are carried out using standard open pit mining methods including drilling, blasting, loading, hauling,
and dumping to the designated leach pads or waste rock storage areas (WRSA) at the mine. |
| · | Mineral Reserves estimation practices follow industry standards. |
| · | Total Probable Mineral Reserves at the Marigold mine are estimated to be 174.8 Mt grading 0.47 g/t Au containing 2.98 Moz Au, including
the 0.346 Moz Au contained within the leach pad inventory. |
| · | The Marigold Mine Mineral Reserves support a LOM over 16 years of operational life, including ten years of active mining followed
by six years of processing the heap leach pad inventory. |
| | 22-2 | |
| SSR Mining Inc. | Marigold Complex S-K 1300 Report | February 12, 2024 SLR Project No.: 138.21581.00002 |
| · | The LOM production schedule is reasonable, but will require robust short-term planning and sequencing to be successful. |
| · | The geotechnical parameters used for pit designs are reasonable and supported by previous operations. |
| · | An appropriate mining equipment fleet, maintenance facilities, and workforce are in place, with various options for additions and
replacements estimated, to meet the LOM production schedule requirements. |
| · | Sufficient storage capacity for waste rock and leach pads have been identified to support the production of the Mineral Reserve. |
| · | The SLR QP reviewed the assumptions, parameters, and methods used to prepare the Mineral Reserves Statement and is of the opinion
that the Mineral Reserves are estimated and prepared in accordance with S-K 1300. |
| · | The Marigold processing facilities comprise conventional run-of-mine (ROM) cyanide heap leaching, carbon adsorption, electrowinning,
and refining circuits (ADR) to produce a final precious metal product. The heap leach pad was originally constructed in 1990 and with
ongoing expansions has operated very consistently throughout the years providing an excellent library of operating data. |
| · | The mineralogy of the ore and deportment of the gold along fracture surfaces of the rock rather than in the rock matrix, provides
rapid access of leach solutions to the gold particles and relatively fast gold extraction independent of rock size. The SLR QP agrees
that the ore is uniquely favorable to run of mine heap leaching, which has been employed for the life of mine. |
| · | Gold recovery is determined from both historical operating performance and from laboratory column and bottle roll leach testing. Gold
recovery is consistent and is predicted using a relationship between fire assay and cyanide soluble gold analyses. It is the SLR QP’s
opinion that the Marigold operating practices are consistent with industry standards, and the ROM method of operation and the methods
of determining gold recovery and reagent consumptions are appropriate for this deposit. |
| · | Cumulative gold production from the Marigold leach pad (through September 2023) is equivalent to 70.6% recovery, and total gold recovery,
including recoverable gold inventory in the pad, is estimated at 74%. |
| · | Gold production data from the leach pad provide the best indicator for future processing recoveries because the ore from 1999 to present
has been very consistent metallurgically and mineralogically. Gold recovery from future ore is estimated to be 74% based on a review of
historical assay and recovery data as well as metallurgical test work on future ore. |
| · | Test work has been conducted on a variety of Marigold ore samples, including representative pit samples taken by ore-control geologists,
leach pad grab samples from mine production, and various pit blasthole drill cuttings. Bottle roll test work has also been conducted on
exploration reverse circulation (RC) drill samples to determine expected gold recovery from deposits that will be mined in the future. |
| · | A large number of column leach tests and bottle roll tests have been performed on the same samples to determine the relationship between
their results. Column leach test work continues; however, bottle roll tests can be performed to generate metallurgical data in days rather
than months that are required for column leach tests. |
| | 22-3 | |
| SSR Mining Inc. | Marigold Complex S-K 1300 Report | February 12, 2024 SLR Project No.: 138.21581.00002 |
| · | Permeability testing has been performed on ore samples with varying fines content. The testing simulated compaction under multiple
lifts of ore stacked up to 200 m, the current maximum height of the heap leach pads above the liner elevation is 122 m. Overall, the tested
blends demonstrated relatively consistent permeability on increasing loads after 50 m and acceptable permeabilities with material blended
to a 40% fines to 60% durable ratio. Flow rates for the blends ranged from 178 L/h/m2 to 284 L/h/m2 under no load.
Under 122 m effective height loading, flow rates ranged from 34 L/h/m2 up to 188 L/h/m2. All tests resulted in low,
but acceptable permeabilities. |
| · | Gold recovery at Marigold is predicted using a relationship developed between the fire assay, which determines total gold in a sample,
and the cyanide soluble gold assay, which determines the amount of cyanide soluble gold in a sample. |
| · | Average LOM Au recovery at Marigold is 74% based on production records. The ratio of cyanide soluble gold to total gold (AuCN/AuFA)
using the 2017 database of assay pairs was approximately 0.8 (80%). Using the ratio to determine the actual LOM recovery of 74% results
in a factor of 0.92. |
| · | The Current Model to predict Marigold heap leach recovery is Heap Leach Recovery = (AuCN/AuFA) x 0.92. |
| · | Gold recovery in each of the four lithologies at Buffalo Valley are dependent on particle size. Gold recovery by particle size distribution
was compiled using the current and historical Buffalo Valley metallurgical test results. The results were used to determine the gold recovery
for each material type for resource calculations. |
| · | Marigold is readily accessible via Interstate Highway 80 in northern Nevada and is approximately 5 km south–south-west
of Valmy in Humboldt County. The site access road supports two lanes of traffic and consists of hard packed clay and gravel. |
| · | The infrastructure facilities at Marigold include ancillary buildings, offices and support buildings, access roads into the plant
site, power distribution, source of fresh water and water distribution, fuel supply, storage and distribution, waste management and communications.
The infrastructure facilities are sufficient for supporting the current Marigold operations. |
| · | The power supply for Marigold is provided by NV Energy Inc. via a 120 kV transmission line to site. Site power draw is 5 MW.
After exiting the main substation, power is distributed through a 25 kV distribution grid. Power supply is consistent and dependable
and is not a limiting factor for current operations. |
| · | Marigold has sufficient groundwater rights and water well capacity to support the ongoing process operations. The water is primarily
consumed by retention in the heap leach pad, evaporation, processing operations and dust suppression. |
| · | It is the SLR QP’s opinion that it is reasonable to rely on the information provided by SSR as outlined above for use in the
TRS because the Property has been in operation for a number of years, and SSR employs professionals and other personnel with responsibility
in these areas that have a good understanding of the operating requirements for the Property. |
| | 22-4 | |
| SSR Mining Inc. | Marigold Complex S-K 1300 Report | February 12, 2024 SLR Project No.: 138.21581.00002 |
| · | Specific federal, state, and local (Humboldt County, Nevada) regulatory and permitting requirements apply to MMC, including the following: |
| o | The Plan of Operations (PoO) permitted via the United States (U.S.) Bureau of Land Management (BLM) |
| o | The Water Pollution Control Permit (WPCP) issued by the Nevada Department of Environmental Protection (NDEP) |
| o | The temporary discharge permit allowing for the discharge of dewatering water to rapid infiltration basins (RIBs) issued by NDEP |
| o | The reclamation permit issued by the Nevada Bureau of Mining Regulation and Reclamation (BMRR) |
| · | MMC currently holds and is in compliance with active, valid permits for all current facets of the mining operation. |
| · | At present, there are no known environmental issues that impact the ability to extract Mineral Resources at the Property. |
| · | All activities associated with MMC require an approved reclamation plan that includes a Reclamation Cost Estimate (RCE) for all permitted
facilities and activities. This was updated and approved by federal and state agencies in 2022. |
| · | MMC is actively engaged with the local communities and stakeholders and there are no outstanding negotiations or social commitments
for the operation of the mine. |
| · | The SLR QP’s opinion is that it is reasonable to rely on the information provided by SSR as outlined above for use in the TRS
because significant environmental and social analyses have been conducted for the Property over an extended period, the Property has been
in operation for a number of years, and SSR employs professionals and other personnel with responsibility in these areas that have a good
understanding of the permitting, regulatory, and environmental requirements for the Property. |
| 22.6 | Capital and Operating Costs |
SSR’s forecasted capital and operating costs estimates related
to the development of Mineral Reserves are derived from annual budgets and historical actuals over the long life of the current operation.
According to the American Association of Cost Engineers (AACE) classifications, these estimates would be Class 1 with an accuracy range
of -3% to -10% to +3% to +15%.
| | 22-5 | |
| SSR Mining Inc. | Marigold Complex S-K 1300 Report | February 12, 2024 SLR Project No.: 138.21581.00002 |
SLR offers the following recommendations by area.
| 23.1 | Geology and Mineral Resources |
The SLR QP offers the following recommendations regarding advancement
of the Property.
| 1 | SSR has proposed a two-year exploration drilling (2024 and 2025) program with a total budget of US$10,000,000 to advance development
of the Buffalo Valley deposit and exploration target areas. The objective of the exploration program will be to target potential gold-bearing
structures to expand the mineralization footprint and as well as to convert the current Resource to Reserve. The SLR QP agrees with the
objectives and overall scope of this exploration program. |
| 2 | Conduct an additional 30,000 m drilling at Marigold mine where there are opportunities to increase orebody knowledge and confidence
of mineral estimates. |
| 23.2 | Mining and Mineral Reserves |
| 1 | Continue optimizing haulage profiles over the LOM including exploring opportunities for ore material from the New Millennium area
to be sent to alternate destinations. |
| 2 | Maintain and improve the grade control procedures on site as situation demands, including infill drilling in areas as required and
resourcing workforce to execute the same on time, enabling improved quality of ore delivered to leach pads. |
| 3 | With existing stockpiles currently being mined, closely monitor grade control procedures in these areas for accurate ore reconciliation. |
| 4 | Focus on equipment maintenance and reliability given the age of existing assets and extended lifetime planned for excavators to achieve
planned utilization. |
| 5 | Ensure dewatering is done on time and does not hamper progress of mine operations. Code projections of dewatering progress to the
mining model. |
| 6 | Ensure the planned laboratory audit is completed and that the transition from Atomic Absorption (AA) assays to Inductively Coupled
Plasma (ICP) assays occurs in early 2024, which will assist mining operations to better control the grade of ore delivered to the leach
pads. |
| 1 | Conduct regular assessments of the AuCN/AuFA ratio using updated exploration and blast hole data. |
| 2 | Continue to conduct column and bottle roll metallurgical testing on heap leach feed composites to determine maximum possible gold
recovery. |
| 3 | Conduct metallurgical test work on any future ore sources to develop geometallurgical properties and parameters. |
| 4 | Complete further studies and assessment of heap leach recoverable gold inventory. |
| | 23-1 | |
| SSR Mining Inc. | Marigold Complex S-K 1300 Report | February 12, 2024 SLR Project No.: 138.21581.00002 |
| 1 | Continue to maintain the infrastructure facilities in good working order to ensure that critical services such as power and water
management, pumping and storage facilities are fully available for potential upset conditions. |
There are no recommendations related to the environment.
| 23.6 | Capital and Operating Costs |
SLR has no recommendations related to capital and operating costs.
| | 23-2 | |
| SSR Mining Inc. | Marigold Complex S-K 1300 Report | February 12, 2024 SLR Project No.: 138.21581.00002 |
AACE International, 2012, Cost Estimate
Classification System – As applied in the Mining and Mineral Processing Industries, AACE International Recommended Practice No.
47R-11, 17 p.
AMEC Americas Ltd., 2014. Marigold Drill
Hole Deviation Study. Memorandum, Prepared for Silver Standard Resources Inc., Dated 21 May 2014.
Call & Nicholas Inc (CNI), 2019a.
Slope Stability Study of the Red Dot Design, Marigold Mine, July 2019.
Carver, J.N., Rathnam, K., Rice, T.,
and Yeomans, T.J., 2018. NI 43-101 Technical Report on the Marigold Mine, Humboldt County, Nevada, USA, 31 July 2018.
Cline, J.S., Hofstra, A.H., Muntean,
J.L., Tosdal, R.M., and Hickey, K.A., 2005. Carlin-type gold deposits in Nevada: Critical geologic characteristics and viable models,
Economic Geology 100th Anniversary Volume, p. 451–484.
CNI, 2021a. Marigold Mine Site Visit
Recommendations 6–7 July 2021. August 5, 2019.
CNI, 2021b. Analysis of Soil Slopes –
H1, 5N1 and 5N2, October 2021.
Cook, H. E. and Taylor, M. E., 1977.
Comparison of continental slope and shelf environments in the Upper Cambrian and lowest Ordovician of Nevada, in The Society of Economic
Paleontologists and Mineralogists, Special Publication No. 25 pp. 51 – 81.
Cook, H.E. and Corboy, J.J., 2004. Great
Basin Paleozoic carbonate platform; facies, facies transitions, depositional models, platform architecture, sequence stratigraphy, and
predictive mineral host models; field trip guidebook; metallogeny of the Great Basin Project, 17–22 August 2003, 135 p.
Cook, H.E., 2015. The Evolution and Relationship
of the Western North American Paleozoic Carbonate Platform and Basin Depositional Environments to Carlin-type Gold Deposits in the Context
of Carbonate Sequence Stratigraphy, in Pennel, W.M., and Garside, L.J., eds., New Concepts and Discoveries, Geological Society of Nevada
Symposium Proceedings, Reno/Sparks, Nevada, May 2015, v. 1, p. 1-80.
Cox, D.P. and Singer, D.A., 1990. Descriptive
and grade-tonnage models for distal-disseminated Ag-Au deposits: A supplement to U.S. Geological Survey Bulletin 1693, U.S. Geological
Survey Open-File Report 90-282, 7 p.
Cox, D.P., 1992. Descriptive model of
distal-disseminated Ag-Au, U.S. Geological Survey Bulletin 2004, 19 p.
Davis, B.M., 1997, Some Methods of Producing
Interval Estimates for Global and Local Resources: SME Preprint 97-5, 4p
Doebrich, J.L. and Theodore, T.G., 1996.
Geologic History of the Battle Mountain Mining District, Nevada, and Regional Controls on the Distribution of Mineral Systems in Coyner,
A.R., and Faney, P.L., eds., Geology and Ore Deposits of the American Cordillera, Geological Society of Nevada, Symposium Proceedings,
Reno/Sparks, Nevada, April 1995, pp. 453-483.
du Bray, E.A., 2007. Time, space, and
composition relations among northern Nevada intrusive rocks and their metallogenic implications, Geosphere, v.3, p. 381–405.
| | 24-1 | |
| SSR Mining Inc. | Marigold Complex S-K 1300 Report | February 12, 2024 SLR Project No.: 138.21581.00002 |
Emsbo, P., Hofstra, A.H., Lauha, E.A.,
Griffin, G.L., and Hutchinson, R.W., 2003. Origin of high-grade gold ore, source of ore fluid components, and genesis of the Meikle and
neighboring Carlin-type deposits, northern Carlin trend, Nevada, Economic Geology, v. 98, p. 1069– 1100.
Fithian, 2015. Geology, Geochemistry,
and Geochronology of the Marigold Mine, Battle Mountain-Eureka Trend, Nevada, M.Sc. Thesis, Golden, Colorado, Colorado School of Mines,
120 p.
Fithian, M.T., Holley, E.A., and Kelly,
N.M., 2018, Geology of gold deposits at the Marigold mine, Battle Mountain district, Nevada: Reviews in Economic Geology, v. 20, p. 121–155.
Glamis Gold Ltd. 2001. Glamis Marigold
Mine Millennium Project Section 31 Technical Report and Reserve Summary for the Glamis Marigold Mine July 2001. (Revised).
Grauch V.J.S., Rodriguez B. D., and Wooden
J.L., 2003. Geophysical and Isotopic Constraints on Crustal Structure Related to Mineral Trends in North-Central Nevada and Implications
for Tectonic History Economic Geology, April 2003, v. 98, pp. 269-286.
Hamilton, W., 1987. Crustal extension
in the Basin and Range Province, southwestern United States, in Coward, M.P., Dewey, J.F., and Handcock, P.L., eds., Continental Extensional
Tectonics, Geological Society Special Publication No. 28, pp. 155-176.
Harrold, J., 2023, Trenton Canyon Historic
Met Recovery, Memorandum, July 14, 2023.
Hofstra, A.H. and Cline, J.S., 2000.
Characteristics and models for Carlin-type gold deposits, Reviews in Economic Geology, v. 13, p. 163–220.
Ilchik, R.P. and Barton, M.D., 1997.
An amagmatic origin of Carlin-type gold deposits, Economic Geology, v. 92, p. 269-288.
Johnston, M.K. and Ressel, M.W., 2004.
Carlin-type and distal disseminated Au-Ag deposits: Related distal expressions of Eocene intrusive centers in north-central Nevada in
Controversies on the origin of World-class gold deposits, Part 1: Carlin-type gold deposits in Nevada, by J.L. Muntean, J. Cline, M.K.
Johnston, M.W. Ressel, E. Seedorff, and M.D. Barton: Society of Economic Geologists Newsletter, v. 59, p. 12-14.
Kester, M., 2015. On infrared absorption
band position variation as a result of gold mineralization in a distal disseminated gold deposit at the Marigold Mine, Humboldt Co., Nevada,
Senior Thesis, South Dakota School of Mines and Technology, 29 p.
Ketner, K.B, 2008. The Inskip Formation,
the Harmony Formation, and the Havallah Sequence of Northwestern Nevada—An Interrelated Paleozoic Assemblage in the Home of the
Sonoma Orogeny. US Department of the Interior U.S. Geological Survey. Professional Paper 1757.
Ketner, K.B, 2013. Stratigraphy of Lower
to Middle Paleozoic Rocks of Northern Nevada and the Antler Orogeny US Department of the Interior U.S. Geological Survey. Professional
Paper 1799.
Knight Piésold Ltd. (KPL), 2014.
Marigold Mine – Review of Rock Mechanic Considerations, dated 24 July 2014. REF. NO. NB101-201/24. Vancouver, British Columbia,
Canada.
Large, R.R., Bull, S.W., and Maslennikov,
V.V., 2011. A carbonaceous sedimentary source-rock model for Carlin-type and orogenic gold deposits, Economic Geology, v. 106, p. 331–358.
| | 24-2 | |
| SSR Mining Inc. | Marigold Complex S-K 1300 Report | February 12, 2024 SLR Project No.: 138.21581.00002 |
Magee Geophysical Services LLC, 2014.
Gravity Survey over the Marigold Mine Property, Humboldt County, Nevada. August 2014.
Magee Geophysical Services LLC, 2016.
Gravity Survey over the Marigold Mine Property, Humboldt County, Nevada. September 2016.
McClelland Laboratories, Inc., 2023,
Preliminary Report on Buffalo Valley Drill Core Composites – Metallurgical Testing, MLI Job No. 4906, for SSR Mining, July 19, 2023.)
McGibbon, D H., 2005, Geology of the
Antler and Basalt Gold Deposits, Glamis-Marigold mine, Humboldt County, Nevada, in Rhoden, H.N., Steininger, R.C., and Vikre, P.G., eds.,
Geological Society of Nevada Symposium 2005: Window to the World, Reno, Nevada, May 2005, pp. 399–409.
McGibbon, D.H., 2004. Marigold Summary
and Tour Guide (Internal report), pp. 1-3.
McGibbon, D.H., and Wallace, A.B., 2000.
Geology of the Marigold Mine area: in Theodore, T.G., 2000, Geology of pluton-related gold mineralization at Battle Mountain, Nevada;
Monographs in Mineral Resource Science No. 2: Center for Mineral Resources, Tucson, Arizona, pp. 222–240.
McKee, E.H., 2000. Potassium-argon chronology
of Cretaceous and Cenozoic igneous activity, hydrothermal alteration, and mineralization, in Theodore, T.G., Geology of pluton-related
gold Mineralization at Battle Mountain, Nevada, Monographs in Mineral Resource Science, no. 2, p. 121–143.
Muntean, J.L. and Cline, J.S., 2018,
Diversity of Carlin-Style Gold Deposits: Reviews in Economic Geology, v. 20, p. 1-5
Muntean, J.L., Cline, J.S., Simon, A.C.,
and Longo, A.A., 2011. Magmatic-hydrothermal origin of Nevada’s Carlin-type gold deposits, Nature Geoscience, v. 4, p. 122–127.
(
OreWin, 2022. Marigold 2021 Technical
Report Summary, September 2022. Filed on EDGAR/available at https://www.sec.gov/edgar.
Pells Sullivan Meynink (PSM), 2021. Geotechnical
Review: Marigold Gold Project. Internal memo by PSM Consult Pty Limited.
Piteau Associates (Piteau), 2021. Marigold
Mine Mackay Pit Dewatering System Design 4180-R03, January 2021.
Reid, R.F., Nicholes, J., Kofoed, R.,
McComb, J. and Sechrist, K.J., Buffalo Valley Gold Mine: Porphyry copper, gold skarn or distal disseminated precious-metal deposit, in
Steininger, Roger, and Pennell, Bill, eds., Great Basin evolution and metallogeny: Geological Society of Nevada Symposium, May 14-22,
2010 [Proceedings], p. 637-656.
Ressel, M.W., and Henry, C.D., 2006.
Igneous Geology of the Carlin Trend, Nevada: Development of the Eocene Plutonic Complex and Significance for Carlin-Type Gold Deposits,
Economic Geology, v. 101, p. 347-383.
Roberts, R.J. 2002. A Passion for Gold,
an Autobiography. University of Nevada press 1st Edition. Reid, R.F. (Roberts, 2002)
Roberts, R.J., 1964. Stratigraphy and
Structure of the Antler Peak Quadrangle, Humboldt and Lander Counties, Nevada: U.S. Geological Survey Professional Paper 459-A, 93 pp.
Saller, A., and Dickinson, W., 1982.
Alluvial to marine facies transition in the Antler overlap sequence, Pennsylvanian and Permian of North-central Nevada: Journal of Sedimentary
Research , v. 52, p. 925-940.
| | 24-3 | |
| SSR Mining Inc. | Marigold Complex S-K 1300 Report | February 12, 2024 SLR Project No.: 138.21581.00002 |
Sillitoe, R.H., and Bonham, H.F., 1990.
Sediment-hosted gold deposits: Distal products of magmatic-hydrothermal systems, Geology, v. 18, p. 157–161.
Sliver Standard, 2014. NI 43-101 Technical
Report on the Marigold Mine, Humboldt County, Nevada, Marigold Mining Company, November 19, 2014, p. 233
SSR Mining Inc., 2023. Form 10-K. Annual
Report for the Fiscal Year Ended December 31, 2022. Filed on EDGAR on February 22, 2023.
Theodore, T. G., 1991a. Preliminary geologic
map of the North Peak Quadrangle, Humboldt and Lander counties, Nevada. USGS Open-File Report. 91-429.
Theodore, T. G., 1991b. Preliminary geologic
map of the Valmy Quadrangle, Humboldt and Lander counties, Nevada. USGS Open-File Report. 91-430.
Theodore, T.G. 2000. Geology of Pluton-related
Gold Mineralization at Battle Mountain, Nevada. Tucson, Arizona: centre for Mineral Resources, the University of Arizona.
US Securities and Exchange Commission.
2018. Regulation S-K, Subpart 229.1300, Item 1300 Disclosure by Registrants Engaged in Mining Operations and Item 601 (b)(96) Technical
Report Summary.
Wallace, A.R., Ludington, S., Mihalasky,
M.J., Peters, S.G., Theodore, T.G., Ponce, D.A., John, D.A., and Berger, B.R., 2004. Assessment of metallic mineral resources in
the Humboldt River Basin, northern Nevada, U.S. Geological Survey Bulletin 2218, 309 p. (Wallace, 2004)
Waterton Global Resource Management website,
2018. www.watertonglobal.com
Wright, James L., 2016. Marigold Property
Gravity Survey.
Wright, James L., 2020 Marigold Property
Gravity Survey – 2020 GIS Database, prepared for Silver Standard, April 18, 2020, p. 18
Wyld, S.J., Rogers, J.W., and Copeland,
P., 2003. Metamorphic Evolution of the Luning-Fencemaker Fold-Thrust Belt, Nevada: Illite Crystallinity, Metamorphic Petrology, and 40Ar/39Ar
Geochronology, The Journal of Geology, v. 111, p. 17-38. (Wyld et al., 2003)
Zoback, M.L., McKee, E.H., Blakely, R.J.,
and Thompson, G.A., 1994. The Northern Nevada rift: Regional tectonomagmatic relations and middle Miocene stress direction, Geological
Society of America Bulletin, v. 106, p. 371-38.
| | 24-4 | |
| SSR Mining Inc. | Marigold Complex S-K 1300 Report | February 12, 2024 SLR Project No.: 138.21581.00002 |
| 25.0 | Reliance on Information Provided by the Registrant |
This TRS has been prepared by SLR for SSR. The information, conclusions,
opinions, and estimates contained herein are based on:
| · | Information available to SLR at the time of preparation of this TRS. |
| · | Assumptions, conditions, and qualifications as set forth in this TRS. |
| · | Data, reports, and other information supplied by SSR and other third party sources. |
For the purpose of this TRS, SLR has relied on ownership information
provided by SSR Mining, Inc.’s Land Manager and Permit Compliance Advisor in a report entitled Mining Claim & Land Tenure
Status Report dated December 15, 2023. SLR has not researched property title or mineral rights for the Property as we consider it
reasonable to rely on SSR’s legal counsel who is responsible for maintaining this information.
SLR has relied on SSR for guidance on applicable taxes, royalties, and
other government levies or interests, applicable to revenue or income from the Property in the Executive Summary and Section 19. As the
Property has been in operation for over ten years, SSR has considerable experience in this area.
The Qualified Persons have taken all appropriate steps, in their professional
opinion, to ensure that the above information from SSR is sound.
Except as provided by applicable laws, any use of this TRS by any third
party is at that party’s sole risk.
| | 25-1 | |
| SSR Mining Inc. | Marigold Complex S-K 1300 Report | February 12, 2024 SLR Project No.: 138.21581.00002 |
| 26.0 | Date and Signature Page |
This report titled “Technical Report Summary on the Marigold Complex,
Nevada, USA” with an effective date of September 30, 2023 was prepared and signed by:
|
(Signed) SLR International Corporation |
Dated at Lakewood, CO
| February 12, 2024 |
SLR International Corporation |
| | 26-1 | |
| SSR Mining Inc. | Marigold Complex S-K 1300 Report | February 12, 2024 SLR Project No.: 138.21581.00002 |
| 27.1 | Economic Model Annual Summary |
SSR Mining Inc. | Marigold Complex February 12, 2024
S-K 1300 Report SLR Project No.: 138.21581.00002
27.0 Appendix 1
27.1 Economic Model Annual Summary
Economic Model Annual Summary
SLR Company SSR Mining Corp.
Project Name Marigold Mine
Scenario Name $1450 AU Reserve Price
Analysis Type S-K 1300 TRS Update
Calendar Year Oct 2023 2024 2025 2026 2027 2028 2029 2030 2031 2032 2033 2034 2035 2036 2037 2038
Discounting Timeline By Date Dec-23 Jun-24 Jun-25 Jun-26 Jun-27 Jun-28 Jun-29 Jun-30 Jun-31 Jun-32 Jun-33 Jun-34 Jun-35 Jun-36 Jun-37 Jun-38
Discounting Timeline By Number 0.12 0.75 1.75 2.75 3.75 4.75 5.75 6.75 7.75 8.75 9.75 10.75 11.75 12.75 13.75 14.75
Project Timeline In Years 0 1 2 3 4 5 6 7 8 9 10 11 12 13 14 15
Project Stage Ops Ops Ops Ops Ops Ops Ops Ops Ops Ops Rinse Rinse Rinse Rinse Rinse Rinse
Time Until Closure In Years US$ & Metric Units LoM Avg/Total 16 15 14 13 12 11 10 9 8 7 6 5 4 3 2 1
Market Prices
Gold, Forecast US$/oz $1,790 1,925 1,930 1,890 1,810 1,780 1,755 1,755 1,755 1,755 1,755 1,755 1,755 1,755 1,755 1,755 1,755
Silver, Forecast US$/oz 23.00 23.50 24.00 23.95 23.70 23.35 22.75 22.75 22.75 22.75 22.75 22.75 22.75 22.75 22.75 22.75 22.75
Physicals
Total Ore Mined kt 154,658 3,880 15,537 19,846 15,807 21,113 18,623 19,205 8,725 20,216 11,706 - - - - - -
Total Waste Mined kt 699,269 22,297 81,996 88,860 93,282 78,970 92,494 64,327 81,720 56,390 38,933 - - - - - -
Total Material Mined kt 853,928 26,177 97,534 108,706 109,089 100,083 111,117 83,531 90,444 76,606 50,639 - - - - - -
Stripping Ratio W:O 4.52 5.75 5.28 4.48 5.90 3.74 4.97 3.35 9.37 2.79 3.33 - - - - - -
Total Ore Rehandled kt 20,140 850 6,418 235 - - - 9,992 2,645 - - - - - - - -
Total Material Moved kt 874,067 27,027 103,951 108,941 109,089 100,083 111,117 93,524 93,089 76,606 50,539 - - - - - -
Total Ore Processed kt 174,798 4,730 21,955 20,081 15,807 21,113 18,623 29,197 11,369 20,216 11,706 - - - - - -
Gold Grade, Stacked g/t 0.47 0.32 0.32 0.39 0.44 0.63 0.48 0.46 0.53 0.46 0.63 - - - - - -
Contained Gold, Stacked koz 2,634 49 227 253 223 425 290 434 193 300 238 - - - - - -
Average Recovery, Gold % 74.3% 76.8% 77.2% 75.0% 74.9% 74.0% 71.2% 72.4% 77.4% 73.3% 75.9% -- -- -- -- -- --
Recovered Gold, Stacked koz 1,956 38 176 190 167 315 207 314 150 220 181 - - - - - -
Produced Gold, Total koz 2,199 69 164 170 230 270 234 305 140 236 162 72 66 33 22 15 11
Produced Silver, Total koz 46 1 3 4 5 6 5 6 3 5 3 2 1 1 0 0 0
Payable Gold, Total koz 2,198 69 164 170 230 270 234 305 140 236 162 72 65 33 22 15 11
Payable Silver, Total koz 46 1 3 4 5 6 5 6 3 5 3 2 1 1 0 0 0
Cash Flow
Gold Gross Revenue 99.97% $000s 3,940,755 133,043 316,351 321,116 416,387 481,043 410,088 535,603 245,371 414,788 283,924 126,403 114,912 57,456 38,304 26,813 19,152
Silver Gross Revenue 0.03% $000s 1,070 34 83 86 115 133 112 146 67 113 77 34 31 16 10 7 5
Gross Revenue Before By-Product Credits 100.0% $000s 3,941,825 133,077 316,434 321,201 416,502 481,175 410,200 535,749 245,438 414,901 284,002 126,438 114,944 57,472 38,315 26,820 19,157
Gold Gross Revenue $000s 3,940,755 133,043 316,351 321,116 416,387 481,043 410,088 535,603 245,371 414,788 283,924 126,403 114,912 57,456 38,304 26,813 19,152
Silver Gross Revenue $000s - - - - - - - - - - - - - - - - -
Gross Revenue After By-Product Credits $000s 3,940,755 133,043 316,351 321,116 416,387 481,043 410,088 535,603 245,371 414,788 283,924 126,403 114,912 57,456 38,304 26,813 19,152
Mining Cost $000s (974,268) (30,860) (121,192) (130,302) (122,095) (109,779) (111,533) (94,972) (101,039) (89,555) (62,940) - - - - - -
Maintenance Cost $000s (432,072) (14,289) (49,576) (53,485) (52,024) (48,937) (51,548) (47,975) (47,621) (39,340) (27,278) - - - - - -
Process Cost $000s (415,084) (7,433) (38,234) (38,441) (36,928) (38,798) (38,086) (40,982) (36,129) (38,379) (31,073) (25,042) (21,454) (12,693) (3,934) (3,801) (3,678)
G&A Cost $000s (199,165) (5,348) (21,575) (21,390) (20,654) (20,952) (21,134) (20,446) (16,972) (13,739) (11,254) (7,824) (4,996) (4,739) (3,472) (3,110) (1,562)
Exploration Costs $000s (5,531) (1,318) (1,200) (2,066) (947) - - - - - - - - - - - -
Refining and Freight Cost $000s (3,673) (204) (240) (242) (265) (280) (266) (293) (230) (267) (239) (205) (202) (190) (186) (183) (181)
NSR Royalty $000s (277,297) (13,253) (31,519) (30,874) (16,563) (45,220) (28,968) (28,092) (15,111) (37,105) (13,039) (5,800) (5,272) (2,632) (1,752) (1,224) (872)
NV Gross Proceeds Tax $000s (34,426) (847) (2,806) (2,858) (3,907) (4,618) (3,837) (5,218) (2,025) (3,889) (2,449) (797) (711) (280) (136) (50) -
Subtotal Cash Costs Before By-Product Credits $000s (2,341,515) (73,551) (266,342) (279,657) (253,382) (268,585) (255,372) (237,978) (219,128) (222,273) (148,271) (39,667) (32,635) (20,533) (9,479) (8,368) (6,293)
By-Product Credits $000s 1,070 34 83 86 115 133 112 146 67 113 77 34 31 16 10 7 5
Total Cash Costs After By-Product Credits $000s (2,340,445) (73,517) (266,259) (279,571) (253,367) (268,452) (255,260) (237,832) (219,061) (222,160) (148,194) (39,633) (32,604) (20,518) (9,469) (8,361) (6,288)
Operating Margin 41% $000s 1,600,310 59,526 50,092 41,544 163,120 212,591 154,828 297,771 26,310 192,628 135,730 86,770 82,309 36,938 28,835 18,452 12,864
EBITDA $000s 1,600,310 59,526 50,092 41,544 163,120 212,591 154,828 297,771 26,310 192,628 135,730 86,770 82,309 36,938 28,835 18,452 12,864
Depreciation Allowance $000s (282,512) (3,535) (9,351) (16,552) (24,060) (29,059) (31,649) (32,457) (31,859) (29,161) (23,381) (16,706) (11,591) (7,836) (5,523) (3,446) (6,346)
Depletion Allowance $000s (489,813) (19,962) (20,371) (12,496) (62,475) (72,176) (61,530) (80,362) - (62,235) (42,600) (18,966) (17,242) (8,621) (5,747) (4,023) (1,007)
Earnings Before Taxes $000s 827,985 36,030 20,371 12,496 76,585 111,355 61,649 184,952 (5,549) 101,232 69,749 51,099 53,476 20,481 17,565 10,983 5,512
NV Net Proceeds Tax $000s (69,439) (2,616) (1,869) (1,528) (7,566) (9,986) (7,071) (14,231) (490) (8,834) (5,765) (2,922) (2,674) (1,464) (1,020) (495) (905)
Federal Income Tax $000s (132,206) (5,543) (3,069) (1,820) (12,718) (18,680) (10,057) (31,459) - (15,590) (11,766) (8,798) (7,890) (2,099) (1,853) (864) -
Net Income $000s 626,340 27,870 15,432 9,148 56,300 82,689 44,521 139,262 (6,039) 76,807 52,218 39,379 42,913 16,913 14,691 9,623 4,606
Non-Cash Add Back - Depreciation $000s 282,512 3,535 9,351 16,552 24,060 29,059 31,649 32,457 31,859 29,161 23,381 16,706 11,591 7,836 5,523 3,446 6,346
Non-Cash Add Back - Depletion $000s 489,813 19,962 20,371 12,496 62,475 72,176 61,530 80,362 - 62,235 42,600 18,966 17,242 8,621 5,747 4,023 1,007
Working Capital $000s (0) 2,501 8,321 (1,189) (4,576) (451) (860) (3,055) 1,847 (1,891) (3,028) (3,849) 207 (202) (728) 17 (168)
Operating Cash Flow $000s 1,398,665 53,868 53,474 37,007 138,259 183,474 136,839 249,026 27,667 166,313 115,171 71,202 71,952 33,173 25,234 17,109 11,791
Sustaining Capital $000s (257,602) (9,956) (29,754) (60,484) (46,160) (43,196) (24,464) (17,280) (20,382) (5,925) - - - - - - -
Closure/Reclamation Costs $000s (69,188) - - - - - - (5) (429) (425) (136) (433) (7,987) (7,626) (6,489) (5,799) (4,505)
Total Capital $000s (326,789) (9,956) (29,754) (60,484) (46,160) (43,196) (24,464) (17,285) (20,811) (6,350) (136) (433) (7,987) (7,626) (6,489) (5,799) (4,505)
Cash Flow Adj./Reimbursements $000s - - - - - - - - - - - - - - - - -
| | 27-1 | |
| SSR Mining Inc. | Marigold Complex S-K 1300 Report | February 12, 2024 SLR Project No.: 138.21581.00002 |
SSR Mining Inc. | Marigold Complex February 12, 2024
S-K 1300 Report SLR Project No.: 138.21581.00002
Economic Model Annual Summary
SLR Company SSR Mining Corp.
Project Name Marigold Mine
Scenario Name $1450 Au Reserve Price
Analysis Type S-K 1300 TRS Update
Calendar Year Oct 2023 2024 2025 2026 2027 2028 2029 2030 2031 2032 2033 2034 2035 2036 2037 2038
Discounting Timeline By Date Dec-23 Jun-24 Jun-25 Jun-26 Jun-27 Jun-28 Jun-29 Jun-30 Jun-31 Jun-32 Jun-33 Jun-34 Jun-35 Jun-36 Jun-37 Jun-38
Discounting Timeline By Number 0.12 0.75 1.75 2.75 3.75 4.75 5.75 6.75 7.75 8.75 9.75 10.75 11.75 12.75 13.75 14.75
Project Timeline In Years 0 1 2 3 4 5 6 7 8 9 10 11 12 13 14 15
Project Stage Ops Ops Ops Ops Ops Ops Ops Ops Ops Ops Rinse Rinse Rinse Rinse Rinse Rinse
Time Until Closure In Years US$ & Metric Units LoM Avg/Total 16 15 14 13 12 11 10 9 8 7 6 5 4 3 2 1
LoM Metrics
Economic Metrics
Discount Rate MidPoint 5% 0.9939 0.9641 0.9182 0.8745 0.8328 0.7932 0.7554 0.7194 0.6852 0.6525 0.6215 0.5919 0.5637 0.5368 0.5113 0.4869
a) Pre-Tax
Free Cash Flow $000s 1,273,521 52,072 28,659 (20,129) 112,384 168,944 129,503 277,431 7,346 184,388 132,567 82,488 74,529 29,111 21,619 12,669 8,192
Cumulative Free Cash Flow $000s 52,072 80,731 60,602 172,986 341,930 471,433 748,864 756,210 940,597 1,073,164 1,155,652 1,230,181 1,259,292 1,280,911 1,293,580 1,301,771
NPV @ 5% $000s 952,565 51,756 27,630 (18,482) 98,276 140,701 102,718 209,571 5,285 126,337 86,505 51,264 44,112 16,410 11,606 6,477 3,989
Cumulative NPV @ 5% $000s 51,756 27,630 33,274 131,550 272,251 374,969 584,540 589,825 716,161 802,667 853,930 898,042 914,452 926,058 932,535 936,524
b) After-Tax
Free Cash Flow $000s 1,071,876 43,912 23,720 (23,477) 92,099 140,278 112,375 231,741 6,856 159,963 115,036 70,769 63,965 25,548 18,745 11,310 7,286
Cumulative Free Cash Flow $000s 43,912 67,633 44,156 136,255 276,533 388,908 620,648 627,504 787,468 902,503 973,272 1,037,237 1,062,785 1,081,530 1,092,840 1,100,127
NPV @ 5% $000s 800,158 43,646 22,869 (21,556) 80,538 116,827 89,132 175,057 4,932 109,602 75,066 43,981 37,859 14,401 10,063 5,783 3,548
Cumulative NPV @ 5% $000s 43,646 66,515 44,959 125,497 242,324 331,456 506,512 511,445 621,046 696,112 740,093 777,952 792,353 802,416 808,199 811,747
Operating Metrics
Mine Life Years 16
Average Daily Mining Rate t/d moved 262,000 296,191 284,799 298,468 298,875 274,200 304,431 256,229 255,038 209,880 138,737 - - - - - -
Average Daily Stacking Rate t/d placed 52,000 51,837 60,151 55,016 43,307 57,844 51,022 79,991 31,149 55,388 32,072 - - - - - -
Mining Cost $ / t moved $1.11 1.14 1.17 1.20 1.12 1.10 1.00 1.02 1.09 1.17 1.24 - - - - - -
Maintenance Cost $ / t moved $0.49 0.53 0.48 0.49 0.48 0.49 0.46 0.51 0.51 0.51 0.54 - - - - - -
Mining Cost t/d stacked $5.57 6.52 5.52 6.49 7.72 5.20 5.99 3.25 8.89 4.43 5.38 - - - - - -
Maintenance Cost t/d stacked $2.47 3.02 2.26 2.66 3.29 2.32 2.77 1.64 4.19 1.95 2.33 - - - - - -
Processing Cost t/d stacked $2.37 3.02 2.26 2.66 3.29 2.32 2.77 1.64 4.19 1.95 2.33 - - - - - -
G&A Cost t/d stacked $1.14 1.13 0.98 1.07 1.31 0.99 1.13 0.70 1.49 0.68 0.96 - - - - - -
Subtotal Direct Operating Costs t/d slacked $11.56 12.25 10.50 12.13 14.66 10.35 11.94 7.00 17.75 8.95 11.32 - - - - - -
Refining and Freight Cost t/d stacked $0.02 0.04 0.01 0.01 0.02 0.01 0.01 0.01 0.02 0.01 0.02 - - - - - -
NSR Royalty t/d stacked $1.59 2.80 1.44 1.54 1.05 2.14 1.56 0.96 1.33 1.84 1.11 - - - - - -
NNPT t/d stacked $0.20 0.18 0.13 0.14 0.25 0.22 0.21 0.18 0.18 0.19 0.21 - - - - - -
Total Operating Cost t/d stacked $13.40 15.55 12.13 13.93 16.03 12.72 13.71 8.15 19.27 10.99 12.67 - - - - - -
Sales Metrics
Au Sales koz 2,198
Total Cash Cost $/ oz Au 1,065
Total AISC $ / oz Au 1,213
Avg. LOM Annual Au Sales (excl. rinsing phase) koz/yr 212
| | 27-2 | |
| SSR Mining Inc. | Marigold Complex S-K 1300 Report | February 12, 2024 SLR Project No.: 138.21581.00002 |
Economic Model Annual Summary
SLR
Company SSR Mining Corp
Project Name Marigold Mine
Scenario Nam $1450 Au Reserv
Analysis Type S-K 1300 TRS Up
Calendar Year 2039 2040 2041 2042 2043 2044 2045 2046 2047
Discounting Timeline By Date Jun-39 Jun-40 Jun-41 Jun-42 Jun-43 Jun-44 Jun-45 Jun-46 Jun-47
Discounting Timeline By Number 15.75 16.75 17.75 18.75 19.75 20.75 21.75 22.75 23.75
Project Timeline in Years 16 17 18 19 20 21 22 23 24
Project Stage Final Closure Final Closure Final Closure Final Closure Final Closure Final Closure Final Closure Final Closure Final Closure
Time Until Closure In Years US$ &Metric Units -1 -2 -3 -4 -5 -6 -7 -8 -9
Market Prices
Gold, Forecast US$/oz 1,755 1,755 1,755 1,755 1,755 1,755 1,755 1,755 1,755
Silver, Forecast US$/oz 22.75 22.75 22.75 22.75 22.75 22.75 22.75 22.75 22.75
Physicals
Total Ore Mined kt - - - - - - - - -
Total Waste Mined kt - - - - - - - - -
Total Material Mined kt - - - - - - - - -
Stripping Ratio W:O - - - - - - - - -
Total Ore Rehandled kt - - - - - - - - -
Total Material Moved kt - - - - - - - - -
Total Ore Processed kt - - - - - - - - -
Gold Grade, Stacked g/t - - - - - - - - -
Contained Gold, Stacked koz - - - - - - - - -
Average Recovery, Gold % -- -- -- -- -- -- -- -- --
Recovered Gold, Stacked koz - - - - - - - - -
Produced Gold Total koz - - - - - - - - -
Produced Silver, Total koz - - - - - - - - -
Payable Gold, Total koz - - - - - - - - -
Payable Silver, Total koz - - - - - - - - -
Cash Flow
Gold Gross Revenue 99.97% $000s - - - - - - - - -
Silver Gross Revenue 0.03% $000s - - - - - - - - -
Gross Revenue Before By-Product Credits 100.0% $000s - - - - - - - - -
Gold Gross Revenue $000s - - - - - - - - -
Silver Gross Revenue $000s - - - - - - - - -
Gross Revenue After By-Product Credits $000s - - - - - - - - -
Mining Cost $000s - - - - - - - - -
Maintenance Cost $0005 - - - - - - - - -
Process Cost $000s - - - - - - - - -
G&A Cost $000s - - - - - - - - -
Exploration Costs $000s - - - - - - - - -
Refining and Freight Cost $000s - - - - - - - - -
NSR Royalty $000s - - - - - - - - -
NV Gross Proceeds Tax $000s - - - - - - - - -
Subtotal Cash Costs Before By-Product Credits $000s - - - - - - - - -
By-Product Credits $000s - - - - - - - - -
Total Cash Costs After By-Product Credits $000s - - - - - - - - -
Operating Margin 41% $000s - - - - - - - - -
EBITDA $000s - - - - - - - - -
Depreciation Allowance $000s - - - - - - - - -
Depletion Allowance $000s - - - - - - - - -
Earnings Before Taxes $000s - - - - - - - - -
NV Net Proceeds Tax $000s - - - - - - - - -
Federal Income Tax $000s - - - - - - - - -
Net Income $000s - - - - - - - - -
Non-Cash Add Back - Depreciation $000s - - - - - - - - -
Non-Cash Add Back - Depletion $000s - - - - - - - - -
Working Capital $000s 7,767 131 (307) (160) 12 (174) (99) (10) (57)
Operating Cash Flow $000s 7,767 131 (307) (160) 12 (174) (99) (10) (57)
Sustaining Capital $000s - - - - - - - - -
Closure/Reclamation Costs $000s (8,081) (9,679) (5,941) (3,989) (4,131) (2,020) (817) (697) -
Total Capital $000s (8,081) (9,679) (5,941) (3,989) (4,131) (2,020) (817) (697) -
Cash Flow Adj./Reimbursements $000s - - - - - - - - -
| | 27-3 | |
| SSR Mining Inc. | Marigold Complex S-K 1300 Report | February 12, 2024 SLR Project No.: 138.21581.00002 |
Economic Model Annual Summary
SLR
Company SSR Mining Corp
Project Name Marigold Mine
Scenario Nam $1450 Au Reserv
Analysis Type S-K 1300 TRS Up
Calendar Year 2039 2040 2041 2042 2043 2044 2045 2046 2047
Discounting Timeline By Date Jun-39 Jun-40 Jun-41 Jun-42 Jun-43 Jun-44 Jun-45 Jun-46 Jun-47
Discounting Timeline By Number 15.75 16.75 17.75 18.75 19.75 20.75 21.75 22.75 23.75
Project Timeline in Years 16 17 18 19 20 21 22 23 24
Project Stage Final Closure Final Closure Final Closure Final Closure Final Closure Final Closure Final Closure Final Closure Final Closure
Time Until Closure In Years US$ &Metric Units -1 -2 -3 -4 -5 -6 -7 -8 -9
LoM Metrics
Economic Metrics
Discount Rate MidPoint 5% 0.4637 0.4417 0.4206 0.4006 0.3815 0.3634 0.3461 0.3296 0.3139
a) Pre-Tax
Free Cash Flow $000s (314) (9,548) (6,248) (4,149) (4,119) (2,193) (916) (707) (57)
Cumulative Free Cash Flow $000s 1,301,458 1,291,910 1,285,662 1,281,513 1,277,393 1,275,200 1,274,285 1,273,578 1,273,521
NPV @ 5% $000s (146) (4,217) (2,628) (1,662) (1,572) (797) (317) (233) (18)
Cumulative NPV @ 5% $000s 936,378 932,161 929,533 927,871 926,300 925,503 925,186 924,953 924,935
b) After-Tax
Free Cash Flow $000s (314) (9,548) (6,248) (4,149) (4,119) (2,193) (916) (707) (57)
Cumulative Free Cash Flow $000s 1,099,813 1,090,265 1,084,017 1,079,868 1,075,748 1,073,555 1,072,640 1,071,933 1,071,876
NPV @ 5% $000s (146) (4,217) (2,628) (1,662) (1,572) (797) (317) (233) (18)
Cumulative NPV @ 5% $000s 811,601 807,384 804,756 803,094 801,522 800,726 800,409 800,176 800,158
Operating Metrics
Mine Life Years
Average Daily Mining Rate t/d moved - - - - - - - - -
Average Daily Stacking Rate t/d placed - - - - - - - - -
Mining Cost $ / t moved - - - - - - - - -
Maintenance Cost $ / t moved - - - - - - - - -
Mining Cost t/d stacked - - - - - - - - -
Maintenance Cost t/d stacked - - - - - - - - -
Processing Cost t/d stacked - - - - - - - - -
G&A Cost t/d stacked - - - - - - - - -
Subtotal Direct Operating Costs t/d stacked - - - - - - - - -
Refining and Freight Cost t/d stacked - - - - - - - - -
NSR Royalty t/d stacked - - - - - - - - -
NNPT t/d stacked - - - - - - - - -
Total Operating Cost t/d stacked - - - - - - - - -
Sales Metrics
Au Sales koz
Total Cash Cost $ / oz Au
Total AISC $ / oz Au
Avg. LOM Annual Au Sales (excl. rinsing phase) koz/yr
| | 27-4 | |
| |
Making
Sustainability Happen |
| |
| |
Technical Report Summary on the Seabee
Gold Operation, Saskatchewan, Canada
S-K 1300 Report
SSR Mining Inc.
SLR Project No.: 138.21581.00005
Effective Date:
December 31, 2023
Signature Date:
February 12, 2024
Prepared by:
SLR International Corporation
|
| |
| |
| |
| |
| |
Making
Sustainability Happen |
Technical Report Summary on the
Seabee Gold Operation, Saskatchewan, Canada
SLR Project No.: 138.21581.00005
Prepared by
SLR International Corporation
1658 Cole Blvd, Suite 100
Lakewood, CO 80401
for
SSR Mining Inc.
6900 E. Layton Avenue, Suite 1300
Denver, CO 80237
Effective Date - December 31, 2023
Signature Date - February 12, 2024
Distribution: 1 copy - SSR Mining Inc.
1 copy - SLR International
Corporation
Cautionary Note Regarding Forward-Looking Statements:
Certain statements contained in this report are "forward-looking
statements" within the meaning of Section 27A of the Securities Act of 1933, as amended (the “Securities Act”),
and Section 21E of the Securities Exchange Act of 1934, as amended (the “Exchange Act”), and are intended to be covered
by the safe harbor provided for under these sections. Forward looking statements can be identified with words such as “may,”
“will,” “could,” “should,” “expect,” “plan,” “anticipate,” “believe,”
“intend,” “estimate,” “projects,” “predict,” “potential,” “continue”
and similar expressions, as well as statements written in the future tense. Forward-looking statements are based on information known
at such time and/or with a good faith belief with respect to future events. Such statements are subject to risks and uncertainties that
could cause actual performance or results to differ materially from those expressed in the forward-looking statements. Many of these risks
and uncertainties cannot be controlled or predicted. Given these risks and uncertainties, readers are cautioned not to place undue reliance
on forward-looking statements. Forward-looking statements include, among things: metal price assumptions, cash flow forecasts, projected
capital and operating costs, metal recoveries, mine life and production rates, and other assumptions used in this report.
Such forward-looking information and statements are based on a number
of material factors and assumptions, including, but not limited to: the inherent speculative nature of exploration results; the ability
to explore; communications with local stakeholders; maintaining community and governmental relations; status of negotiations of joint
ventures; weather conditions at our operations; commodity prices; the ultimate determination of and realization of Mineral Reserves; existence
or realization of Mineral Resources; the development approach; availability and receipt of required approvals, titles, licenses and permits;
sufficient working capital to develop and operate the mines and implement development plans; access to adequate services and supplies;
foreign currency exchange rates; interest rates; access to capital markets and associated cost of funds; availability of a qualified work
force; ability to negotiate, finalize, and execute relevant agreements; lack of social opposition to our mines or facilities; lack of
legal challenges with respect to our properties; the timing and amount of future production; the ability to meet production, cost, and
capital expenditure targets; timing and ability to produce studies and analyses; capital and operating expenditures; economic conditions;
availability of sufficient financing; the ultimate ability to mine, process, and sell mineral products on economically favorable terms;
and any and all other timing, exploration, development, operational, financial, budgetary, economic, legal, social, geopolitical, regulatory
and political factors that may influence future events or conditions. While we consider these factors and assumptions to be reasonable
based on information currently available to us, they may prove to be incorrect.
The above list is not exhaustive list of the factors that may affect
any of the forward-looking statements and information included in this report, and such statements and information will not be updated
to reflect events or circumstances arising after the date of such statements or to reflect the occurrence of anticipated or unanticipated
events.
This technical report summary also contains financial measures which
are not recognized under U.S. generally accepted accounting principles.
| SSR Mining Inc. | Seabee Gold Operation S-K 1300 Report | February 12, 2024 SLR Project No.: 138.21581.00005 |
Table of Contents
| 1.0 Executive Summary |
1-1 |
| 1.1 Summary |
1-1 |
| 1.2 Economic Analysis |
1-6 |
| 1.3 Technical Summary |
1-9 |
| 2.0 Introduction |
2-1 |
| 2.1 Site Visits |
2-1 |
| 2.2 Sources of Information |
2-1 |
| 2.3 List of Abbreviations |
2-3 |
| 3.0 Property Description |
3-1 |
| 3.1 Location |
3-1 |
| 3.2 Mineral Rights |
3-1 |
| 3.3 Mineral Tenure |
3-3 |
| 3.4 Underlying Agreements |
3-6 |
| 3.5 Encumbrances |
3-6 |
| 3.6 Environmental Considerations |
3-6 |
| 3.7 Permits and Authorizations |
3-7 |
| 3.8 Other Significant Factors and Risks |
3-7 |
| 4.0 Accessibility, Climate, Local Resources, Infrastructure and Physiography |
4-1 |
| 4.1 Accessibility |
4-1 |
| 4.2 Climate |
4-1 |
| 4.3 Local Resources |
4-1 |
| 4.4 Infrastructure |
4-3 |
| 4.5 Physiography |
4-3 |
| 5.0 History |
5-1 |
| 5.1 Ownership, Exploration, and Development History |
5-1 |
| 5.2 Historical Surface Exploration |
5-2 |
| 5.3 Past Production |
5-6 |
| 6.0 Geological Setting, Mineralization, and Deposit |
6-1 |
| 6.1 Regional Geology |
6-1 |
| 6.2 District Geology |
6-3 |
| 6.3 Structural Setting |
6-6 |
| 6.4 Mineralization |
6-8 |
| | i | |
| SSR Mining Inc. | Seabee Gold Operation S-K 1300 Report | February 12, 2024 SLR Project No.: 138.21581.00005 |
| 6.5 Deposit Types |
6-15 |
| 7.0 Exploration |
7-1 |
| 7.1 Surface Exploration |
7-1 |
| 7.2 Drilling |
7-2 |
| 7.3 SSR Drilling Procedures |
7-9 |
| 8.0 Sample Preparation, Analyses, and Security |
8-1 |
| 8.1 Sample Preparation and Analysis |
8-1 |
| 8.2 Quality Assurance and Quality Control |
8-2 |
| 8.3 Sample Security |
8-12 |
| 8.4 QP Opinion |
8-12 |
| 9.0 Data Verification |
9-1 |
| 9.1 Historic Data Verification |
9-1 |
| 9.2 SLR Data Verification |
9-1 |
| 9.3 QP Opinion |
9-2 |
| 10.0 Mineral Processing and Metallurgical Testing |
10-1 |
| 10.1 Style of Mineralization |
10-1 |
| 10.2 Process Plant Performance |
10-1 |
| 10.3 QP Opinion |
10-5 |
| 11.0 Mineral Resource Estimates |
11-1 |
| 11.1 Summary |
11-1 |
| 11.2 Comparison with Previous Estimate |
11-2 |
| 11.3 Mineral Resource Database |
11-3 |
| 11.4 Cut-off Grade |
11-4 |
| 11.5 Santoy Mine |
11-5 |
| 11.6 Porky West |
11-32 |
| 11.7 Mineral Resource Uncertainty |
11-47 |
| 11.8 QP Opinion |
11-47 |
| 12.0 Mineral Reserve Estimates |
12-1 |
| 12.1 Summary |
12-1 |
| 12.2 Comparison with Previous Estimates |
12-1 |
| 12.3 Conversion to Mineral Reserves |
12-2 |
| 12.4 Dilution |
12-3 |
| 12.5 Extraction |
12-3 |
| 12.6 Cut-off Grade |
12-4 |
| | ii | |
| SSR Mining Inc. | Seabee Gold Operation S-K 1300 Report | February 12, 2024 SLR Project No.: 138.21581.00005 |
| 12.7 Mineral Reserve Reconciliation |
12-5 |
| 13.0 Mining Methods |
13-1 |
| 13.1 Mine Design |
13-1 |
| 13.2 Geomechanics |
13-5 |
| 13.3 Mine Infrastructure and Services |
13-8 |
| 13.4 Mine Equipment |
13-14 |
| 13.5 Personnel |
13-15 |
| 13.6 Mine Schedule |
13-15 |
| 14.0 Processing and Recovery Methods |
14-1 |
| 14.1 Overview |
14-1 |
| 14.2 Process Description |
14-1 |
| 15.0 Infrastructure |
15-1 |
| 15.1 Major Infrastructure |
15-1 |
| 15.2 Accommodation Camp |
15-6 |
| 15.3 Access Roads |
15-6 |
| 15.4 Power |
15-6 |
| 15.5 Water |
15-6 |
| 15.6 Product Shipping |
15-7 |
| 15.7 Utilities |
15-7 |
| 15.8 Tailings Management Facilities |
15-8 |
| 15.9 Waste Rock Structures |
15-9 |
| 15.10 Rock Quarry |
15-9 |
| 16.0 Market Studies |
16-1 |
| 16.1 Marketing and Metal Prices |
16-1 |
| 16.2 Contracts |
16-1 |
17.0 Environmental Studies, Permitting, and Plans, Negotiations, or Agreements
with Local Individuals or Groups |
17-1 |
| 17.1 Environmental Aspects |
17-1 |
| 17.2 Tailings Disposal and Water Management |
17-3 |
| 17.3 Project Permitting |
17-4 |
| 17.4 Social or Community Aspects |
17-5 |
| 17.5 Mine Closure Requirements |
17-5 |
| 17.6 Safety |
17-8 |
| 17.7 QP Opinion |
17-9 |
| | iii | |
| SSR Mining Inc. | Seabee Gold Operation S-K 1300 Report | February 12, 2024 SLR Project No.: 138.21581.00005 |
| 18.0 Capital and Operating Costs |
18-1 |
| 18.1 Capital Costs |
18-1 |
| 18.2 Operating Costs |
18-1 |
| 19.0 Economic Analysis |
19-1 |
| 19.1 Economic Criteria |
19-1 |
| 19.2 Cash Flow Analysis |
19-2 |
| 19.3 Sensitivity Analysis |
19-5 |
| 20.0 Adjacent Properties |
20-1 |
| 21.0 Other Relevant Data and Information |
21-1 |
| 22.0 Interpretation and Conclusions |
22-1 |
| 22.1 Geology and Mineral Resources |
22-1 |
| 22.2 Mining and Mineral Reserves |
22-2 |
| 22.3 Mineral Processing |
22-3 |
| 22.4 Infrastructure |
22-3 |
| 22.5 Environment |
22-3 |
| 22.6 Capital and Operating Costs and Economics |
22-4 |
| 23.0 Recommendations |
23-1 |
| 23.1 Geology and Mineral Resources |
23-1 |
| 23.2 Mining and Mineral Reserves |
23-1 |
| 23.3 Mineral Processing |
23-2 |
| 23.4 Infrastructure |
23-2 |
| 23.5 Environment |
23-2 |
| 24.0 References |
24-1 |
| 25.0 Reliance on Information Provided by the Registrant |
25-1 |
| 26.0 Date and Signature Page |
26-1 |
| 27.0 Appendix 1 Cash Flow Summary |
27-1 |
Tables
| Table 1-1: After-Tax Cash Flow Summary |
1-8 |
Table 1-2: Summary of Mineral Resources, exclusive of Mineral Reserves – December 31,
2023 |
1-11 |
| Table 1-3: Summary of Mineral Reserves – December 31, 2023 |
1-12 |
| Table 1-4: Operating Costs Estimate |
1-15 |
| | iv | |
| SSR Mining Inc. | Seabee Gold Operation S-K 1300 Report | February 12, 2024 SLR Project No.: 138.21581.00005 |
| Table 3-1: Mineral Tenure Information |
3-4 |
| Table 5-1: SGO Ownership, Exploration, and Development History |
5-1 |
| Table 5-2: Historical Production from the SGO (1996–2022) |
5-6 |
Table 6-1: Key Stratigraphic and Structural Elements Controlling Mineralisation at the
Seabee, Santoy, and Porky
Deposits |
6-9 |
| Table 7-1: Surface and Underground Drilling Completed on the SGO to December 31, 2023 |
7-3 |
| Table 7-2: Surface Drilling on the Fisher, Leland and Truscott Tenements |
7-9 |
| Table 8-1: Expected Values and Ranges of CRM |
8-3 |
| Table 9-1: Historical Data Verification |
9-1 |
| Table 9-2: Assay Data Verification Summary – SGO - SLR |
9-2 |
Table 11-1: Summary of Mineral Resources exclusive of Mineral Reserves – December 31,
2023 |
11-2 |
| Table 11-2: Comparison with Previous Estimates |
11-3 |
| Table 11-3: Summary of Mineral Resource Database |
11-3 |
| Table 11-4: Mineral Resource Cut-Off Grade Inputs |
11-4 |
Table 11-5: Summary of Mineral Resources exclusive of Mineral Reserves fo Santoy Mine,
by Deposit – December 31, 2023 |
11-5 |
| Table 11-6: Gold Assay and Composite Statistics |
11-10 |
| Table 11-7: Gold Composites Statistics and Capping Levels |
11-11 |
| Table 11-8: Santoy Mine Variogram Parameters |
11-12 |
| Table 11-9: Search Strategy and Grade Interpolation Parameters |
11-18 |
| Table 11-10: Composite Selection Plan |
11-19 |
| Table 11-11: Density Values per Domain |
11-19 |
| Table 11-12: Santoy 8 - Block Model Extents and Dimensions |
11-20 |
| Table 11-13: Santoy 9 - Block Model Extents and Dimensions |
11-20 |
| Table 11-14: GHW-SHW - Block Model Extents and Dimensions |
11-21 |
| Table 11-15: Mineral Resource Classification Parameters |
11-21 |
| Table 11-16: Wireframe to Block Model Volume Confirmation |
11-31 |
| Table 11-17: Gold Statistics between Validation NN and ID2 Model and OK |
11-31 |
| Table 11-18: Summary of Mineral Resources for Porky West – December 31, 2023 |
11-32 |
| Table 11-19: Porky West Gold Assay and Composite Statistics |
11-35 |
| Table 11-20: Porky West Gold Composite Capping Statistics |
11-37 |
| Table 11-21: Porky West Search Strategy and Grade Interpolation Parameters |
11-39 |
| Table 11-22: Porky West Gold Composite Selection Plan |
11-39 |
| | v | |
| SSR Mining Inc. | Seabee Gold Operation S-K 1300 Report | February 12, 2024 SLR Project No.: 138.21581.00005 |
| Table 11-23: Porky West Block Model Parameters |
11-40 |
| Table 11-24: Porky West Block Model Volume Confirmation |
11-44 |
| Table 12-1: Summary of Mineral Reserves – December 31, 2023 |
12-1 |
| Table 12-4: Comparison to Previous Mineral Reserve Estimates |
12-2 |
| Table 12-3: Mineral Reserves Input Parameters |
12-4 |
| Table 12-5: Mineral Reserve Reconciliation Data |
12-5 |
| Table 13-1: Excavation Dimensions |
13-4 |
| Table 13-2: Summary of Intact Strength Testing at Seabee Mine |
13-6 |
| Table 13-3: Ground Support Summary in Development Headings |
13-7 |
| Table 13-4: Santoy Mine Dewatering Requirements |
13-14 |
| Table 13-5: Underground Mine Equipment Fleet |
13-15 |
| Table 13-6: Development, Waste Rock, and Backfill Summary |
13-18 |
| Table 14-1: Seabee Mill Production Statistics 2014–2023 |
14-2 |
| Table 16-1: Economic Analysis Gold Price and Exchange Rate Assumptions |
16-1 |
| Table 18-1: Capital Costs Estimate |
18-1 |
| Table 18-2: Operating Costs Estimate |
18-2 |
| Table 19-1: Economic Analysis Gold Price and Exchange Rate Assumptions |
19-1 |
| Table 19-2: After-Tax Cash Flow Summary |
19-4 |
| Table 19-3: After-Tax Sensitivity Analyses |
19-6 |
Figures
| Figure 3-1: Location of the Seabee Gold Operation |
3-2 |
| Figure 3-2: SGO Mining Land Tenure Map |
3-5 |
Figure 4-1: Average Annual Temperature and Precipitation Fluctuations in La Ronde,
Saskatchewan |
4-2 |
| Figure 5-1: Historical Rock Samples Collected at the SGO |
5-3 |
| Figure 5-2: Historical Soil Samples Collected at the SGO |
5-4 |
| Figure 6-1: Regional Geology of the Southwestern Trans-Hudson Orogen |
6-2 |
| Figure 6-2: Local Geological Setting |
6-4 |
| Figure 6-3: Simplified Stratigraphic Column of the Pine Lake Greenstone Belt |
6-5 |
Figure 6-4: Integrated Structural Analysis of the SGO by SRK (2009) Based on Goldak’s
2007 Aeromagnetic Survey |
6-7 |
| Figure 6-5: Representative Cross Section of Mineralization at Santoy 8 |
6-11 |
| Figure 6-6: Representative Cross Section of Mineralization at Santoy 9 |
6-12 |
| | vi | |
| SSR Mining Inc. | Seabee Gold Operation S-K 1300 Report | February 12, 2024 SLR Project No.: 138.21581.00005 |
| Figure 6-7: Representative Cross Section of Mineralization at Gap Hanging Wall |
6-13 |
| Figure 6-8: Representative Cross Section of Mineralization at Porky West |
6-14 |
| Figure 7-1: SGO Surface Drilling, and Other Known Gold Occurrences on the Property |
7-4 |
| Figure 8-1: Z-score Scatter Plot |
8-4 |
| Figure 8-2: Control Chart of CRM SG84 for Gold at SGO Lab: 2021 to 2022 |
8-4 |
| Figure 8-3: Control Chart of CRM SL76 for Gold at SGO Lab: 2021 to 2023 |
8-5 |
| Figure 8-4: Fine Blanks – Seabee Gold Laboratory |
8-6 |
| Figure 8-5: Fine Blanks – ALS Laboratory |
8-6 |
| Figure 8-6: Analysis of Pulp Duplicate Data for Gold by Hyperbolic Method: 2020 to 2022 |
8-8 |
| Figure 8-7: Scatter Plot of Pulp Duplicate Data for Gold: 2020 to 2022 |
8-9 |
| Figure 8-8: Relative Error Plot for Gold: 2020 to 2022 |
8-10 |
| Figure 8-9: Q-Q Plot and Scatter Plot for Gold Check Assay Pulps Analyzed by ALS: 2023 |
8-11 |
| Figure 8-10: Q-Q Plot and Scatter Plot for Gold Check Assay Pulps Analyzed by SRC: 2023 |
8-11 |
Figure 8-11: Q-Q Plot and Scatter Plot for Gold Check Assay Pulps Analyzed by TSL: 2020-
2022 |
8-12 |
| Figure 10-1: Monthly Plant Head Grade and Recovery |
10-2 |
| Figure 10-2: Plant Recovery Versus Head Grade During 2022 and 2023 |
10-3 |
| Figure 10-3: Plant Average Daily Throughput and Utilization |
10-4 |
| Figure 11-1: Santoy 8 Mineralization Wireframes |
11-7 |
| Figure 11-2: Santoy 9 Mineralization Wireframes |
11-8 |
| Figure 11-3: GHW-SHW Mineralization Wireframes |
11-9 |
| Figure 11-4: Trend Analysis for Santoy 9 – Zone 9A |
11-13 |
| Figure 11-5: Trend Analysis for GHW-SHW |
11-14 |
| Figure 11-6: Back Transformed Variogram for 8A_B Zone |
11-15 |
| Figure 11-7: Back Transformed Variogram for 9A Zone |
11-16 |
| Figure 11-8: Directional Variogram for GHW Zone |
11-17 |
| Figure 11-9: Exclusive Underground Reporting Shapes of Santoy 8 Classification |
11-23 |
| Figure 11-10: Exclusive Underground Reporting Shapes of Santoy 9 Classification |
11-24 |
| Figure 11-11: Exclusive Underground Reporting Shapes of GHW-SHW Classification |
11-25 |
| Figure 11-12: Visual Validation of 8A_B and 8A_FW Gold Composite and Block Grades |
11-27 |
| Figure 11-13: Visual Validation of Santoy 9 Gold Composite and Block Grades |
11-28 |
| | vii | |
| SSR Mining Inc. | Seabee Gold Operation S-K 1300 Report | February 12, 2024 SLR Project No.: 138.21581.00005 |
| Figure 11-14: Swath Plots Comparing OK, ID2 and NN Estimate Results within Santoy 9 |
11-29 |
| Figure 11-15: Swath Plots Comparing OK, ID2 and NN Estimate Results within GHW-SHW |
11-30 |
| Figure 11-16: Long Section and Plan Views of Porky West Mineralized Wireframes |
11-33 |
| Figure 11-17: Histogram of Interval Lengths in Porky West Mineralization |
11-36 |
| Figure 11-18: PW_6 Looking North Showing Grade Contours |
11-38 |
| Figure 11-19: Porky West Block Model and Dimensions |
11-41 |
| Figure 11-20: Porky West Block Classification |
11-43 |
| Figure 11-21: Porky West Composite - Block Grade Comparison |
11-45 |
| Figure 11-22: Porky West Y and Z Swath Plots |
11-46 |
| Figure 13-1: Santoy Mine Long Section Looking North |
13-2 |
| Figure 13-2: Santoy 8 Site |
13-10 |
| Figure 13-3: Santoy 7 Site |
13-11 |
| Figure 13-6: Life of Mine Production Tonnes and Grade |
13-16 |
| Figure 13-7: Life of Mine Gold Ounces and Grade |
13-16 |
| Figure 13-8: Production Tonnes by Area |
13-17 |
| Figure 13-9: Lateral Development by Mining Area |
13-17 |
| Figure 14-1: Seabee Process Plant Flow Sheet |
14-3 |
| Figure 15-1: Seabee Gold Operation Major Infrastructure |
15-2 |
| Figure 15-2: Seabee Gold Operation Mill Site Infrastructure |
15-3 |
| Figure 15-3: Seabee Gold Operation Infrastructure including Santoy and Porky West Deposits |
15-4 |
| Figure 15-4: Seabee Gold Operation Winter Road |
15-5 |
| Figure 15-5: Seabee Gold Operation Tailings Management Facility Infrastructure |
15-10 |
| Figure 19-1: After-Tax Sensitivity Analysis |
19-7 |
| | viii | |
| SSR Mining Inc. | Seabee Gold Operation S-K 1300 Report | February 12, 2024 SLR Project No.: 138.21581.00005 |
SLR International Corporation (SLR) was retained by SSR Mining Inc.
(SSR) to prepare an independent Technical Report Summary (TRS) on the Seabee Gold Operation (SGO or the Property), located in northern
Saskatchewan, Canada. SGO constitutes five principal deposits, Santoy 8, Santoy 9, Gap Hanging Wall (GHW), and Santoy Hanging Wall (SHW),
together, Santoy Mine, and Porky West.
The purpose of this TRS is to support the disclosure of updated Mineral
Resource and Mineral Reserve estimates. This TRS conforms to the United States Securities and Exchange Commission’s (SEC) Modernized
Property Disclosure Requirements for Mining Registrants as described in Subpart 229.1300 of Regulation S-K, Disclosure by Registrants
Engaged in Mining Operations (S-K 1300) and Item 601 (b)(96) Technical Report Summary. SLR visited SGO on two occasions, between April
11 and April 14, 2023, and October 31, 2023 to November 2, 2023 and is serving as the Qualified Person (QP) as required by S-K 1300 for
purposes of this TRS.
The Property is situated in Saskatchewan, Canada, at the northern tip
of Laonil Lake, approximately 125 km northeast of La Ronge. The Property is wholly owned by SGO Mining Inc., a subsidiary of SSR, and
includes the underground Santoy Mine, which has been in continuous commercial production since 2014, and the now-depleted Seabee Mine,
which operated from 1991 to 2018. SSR holds seven mineral leases and 130 mineral claims totaling 73,820 ha.
SSR, a gold mining company listed on the Nasdaq Stock Exchange, Toronto
Stock Exchange (TSX), and Australian Stock Exchange (ASX), acquired SGO in May 2016 through the acquisition of Claude Resources Inc. (Claude
Resources) with additional contiguous exploration claims (Fisher, Leland and Truscott tenements) added through the acquisition of Taiga
Gold Corp. in April 2022.
SSR has four producing assets located in USA, Türkiye, Canada,
and Argentina, as well as numerous development and exploration projects globally.
The Property is situated at approximately 55.7° latitude north and
103.5° longitude west, with access via a fixed-wing aircraft to a 1,275 m airstrip on-site. A 60 km winter road is constructed during
winter months to transport supplies and equipment between the mine site and Brabant Lake. Mining operations occur year-round in a borderline
subarctic climate.
This report is an update of SSR's prior Technical Report Summary for
the Property, dated as of September 29, 2022. All information presented in this
report is as of December 31, 2023, unless explicitly stated otherwise.
SLR offers the following conclusions by area.
| 1.1.1.1 | Geology and Mineral Resources |
| · | Mineral Resources at SGO are estimated for the Santoy Mine and the Porky West deposit. They have been updated with data collected
since the last Mineral Resource estimate dated as of December 31, 2021 (SSR, 2022a). |
| | 1-1 | |
| SSR Mining Inc. | Seabee Gold Operation S-K 1300 Report | February 12, 2024 SLR Project No.: 138.21581.00005 |
| · | The procedures for sample preparation, security, and analysis adhere to industry standards for ensuring data quality and integrity.
There are no factors associated with sampling or sample preparation that would significantly affect the accuracy or reliability of the
samples or assay results. The results of the quality assurance and quality control (QA/QC) procedures demonstrate that the assay results
fall within acceptable ranges of accuracy and precision, affirming the adequacy of the resulting database to underpin the estimation of
Mineral Resources. |
| · | No material sample bias was identified during the review of the drill data and assays. The data is adequate for the purposes of Mineral
Resource estimation. |
| · | All the main gold deposits at SGO are considered orogenic quartz-vein hosted lode gold deposits. The geology and characteristics of
gold mineralization at the Santoy 8 and 9 and Porky West projects are well understood while the GHW-SHW Project requires more analysis
to fully understand its complexity. Gold zones on the Santoy Mine are connected in terms of origin and location to the existence of the
large granodioritic complex. The known mineralization extends around two kilometers along strike and reaches approximately one kilometre
across strike and depth. |
| · | There is good potential to increase the Mineral Resource base for the Santoy Mine underground deposits at depth, and additional exploration
and development is warranted. |
| · | There is good potential to increase the Mineral Resource base at Porky West at depth and along strike, and additional exploration
is warranted. SLR understands that an exploration plan is in place to increase the Mineral Resource footprint as well as continue infill
drilling. |
| · | The resource cut-off grade
and underground reporting shapes used to identify
those portions of
the Mineral Resource estimation that meet the requirement of reasonable
prospects for economic extraction
and are considered to be appropriate for this style of gold deposit and mineralization. |
| · | Measured Mineral Resources at the SGO are estimated to total 0.9 million tonnes (Mt) at a grade of 5.5 g/t Au and contain 16,300 ounces
of gold (oz Au). Indicated Mineral Resources are estimated to total 1.47 Mt at a grade of 4.3 g/t Au and contain 202,000 oz Au. In addition,
Inferred Mineral Resources are estimated to total 2.75 Mt at a grade of 5.2 g/t Au and contain 462,500 oz Au. |
| 1.1.1.2 | Mining and Mineral Reserves |
| · | Mineral Reserve estimates, as prepared by SSR and reviewed and accepted by SLR, have been classified in accordance with definitions
for Mineral Reserves in S-K 1300. Mineral Reserves as of December 31, 2023 total 2.1 Mt, grading 5.17 g/t Au and containing 343,000 oz
Au. |
| · | Mineral Reserves are estimated by qualified professionals using modern mine planning software in a manner consistent with industry
practice. |
| · | Measured and Indicated Mineral Resources were converted to Proven and Probable Mineral Reserves, respectively, through the application
of modifying factors. Inferred Mineral Resources were not converted to Mineral Reserves. |
| | 1-2 | |
| SSR Mining Inc. | Seabee Gold Operation S-K 1300 Report | February 12, 2024 SLR Project No.: 138.21581.00005 |
| · | Santoy is a mature underground mine with years of operating experience and well established procedures. |
| · | The estimated Mineral Reserves support a life of mine (LOM) plan that extends 4.2 years to 2028 at a maximum production rate of 511,000
tonnes per annum (tpa) (1,400 tonnes per day (tpd)) in 2026 and 2027, corresponding to the processing capacity. |
| · | The planned increase in production rate from 2026 onwards will require robust short-term planning and sequencing. Future reserve conversion
would allow the number of active mining areas to be maintained or expanded, and would facilitate the increase in production.. |
| · | Production mining uses a combination of longitudinal and transverse open stoping depending on the width of the orebody. Over the LOM,
55% of the production tonnes are planned using a transverse stope arrangement with the remainder mined longitudinally. |
| · | An extraction factor of 89% is applied to both production stopes and ore development designs, and linear overbreak dilution of 0.7
m is applied to production designs. These factors are established and checked through the stope reconciliation process. |
| · | At Santoy Mine, most mining to date has been in the Santoy 8 and Santoy 9 principal deposits. Over the remaining LOM, the proportion
of ore mined in the GHW and SHW is expected to increase. In these hanging wall areas, the orebody is generally wider and at a shallower
dip, and thus transverse stopes constitute a higher proportion of the mine plan. There is limited operating experience in these areas
and SLR is of the opinion that meeting production targets will require ongoing efforts to optimize mine plans and stope designs in order
to maximize extraction and minimize dilution. |
| · | Mining, processing, and general and administrative (G&A) costs used for cut-off grade calculation are lower than recent actuals
due to incorporating planned cost savings initiatives. Of the three components, the mining cost is most impacted by these savings. SLR
is of the opinion that achieving the operating costs savings may be challenging while maintaining production targets, however, acknowledges
that SGO has a plan in place. |
| 1.1.1.3 | Mineral Processing |
| · | The SGO processing plant uses conventional crush, grind, gravity concentration, and cyanide leaching, followed by carbon adsorption,
elution, electrowinning, and refining to recover gold and produce doré bars. |
| · | The processing plant has been expanded and de-bottlenecked since initially entering operating in 1991 and is now capable of processing
approximately 1,200 tpd of ore. |
| · | Gold head grades, historically ranging from approximately 6 g/t to 15 g/t, and recently reaching almost 20 g/t at times during 2021
and 2022, have decreased to an average of approximately 6 g/t, ranging from approximately 4 g/t to 8 g/t since mid 2022. |
| · | Historically high recoveries of 97% to 99% have subsequently also decreased slightly to between 96% and 98%. |
| | 1-3 | |
| SSR Mining Inc. | Seabee Gold Operation S-K 1300 Report | February 12, 2024 SLR Project No.: 138.21581.00005 |
| · | SGO is a remote operation in northern Saskatchewan and is accessible by winter road and by air. |
| · | The majority of annual supplies are transported to site via the 60 km winter road, which begins at Highway 102 near the community
of Brabant Lake, Saskatchewan, and includes 12 portages and 11 lakes. The road is typically usable throughout the months of February and
March, and until mid-April depending on ice quality. A 1,275 m airstrip is also located on the Property. |
| · | A camp with a capacity of 251 people is located adjacent to the processing plant and other major surface infrastructure. |
| · | A 14 km haul road connects the Santoy Mine to the processing plant site. |
| · | Two tailings management facilities (TMF) with sufficient capacity until approximately 2030 (at the current processing rate) are used
for tailings impoundment. Most of the water used in the process is reclaimed from the TMFs. Fresh make-up water as well as domestic and
fire water is obtained from Laonil Lake near the camp and plant. |
| · | The operation is connected to the Saskatchewan power grid via an approximately 15 km long transmission line connected to the 138 kV
Island Falls transmission line. |
| · | No known environmental issues were identified from the documentation review and site visit. SGO appears to have all pertinent permit
and approvals at hand. Proper provisions have been made for safe disposal of tailings and water management. |
| · | There is a comprehensive Environmental Management System in place, which includes a comprehensive monitoring program for effluent
discharges, air quality, surface water quality, groundwater quality, terrestrial biology (vegetation and wildlife) and aquatic biology.
SGO reports the results of the monitoring program to the authorities according to the frequency stated in the approved permits and no
compliance issues have identified. |
| · | A Mine Closure Plan has been developed that considers all pertinent provincial legislation. The Mine Closure Plan is updated periodically. |
| 1.1.1.6 | Capital and Operating Costs and Economics |
| · | The economic analysis demonstrates that SGO’s Mineral Reserves are economically viable at a LOM average realized gold price
of US$1,854/oz of Au and silver price of US$23.74/oz of Ag. SGO’s Base Case pre-tax net present value (NPV) at a 5% discount rate
is approximately US$111.2 million and SGO’s Base Case after-tax NPV at a 5% discount rate is approximately US$94.9 million. |
| · | The operating costs used for calculating cut-off grade are 18% lower than the LOM average. SLR checked the impact that higher operating
costs would have on cut-off grade and Mineral Reserves and is of the opinion that the impact is not material. |
| | 1-4 | |
| SSR Mining Inc. | Seabee Gold Operation S-K 1300 Report | February 12, 2024 SLR Project No.: 138.21581.00005 |
| 1.1.2.1 | Geology and Mineral Resources |
| 1 | Complete an infill drilling program to upgrade Inferred Mineral Resources within the GHW-SHW LOM plan to at least a classification
of Indicated. A total of 41,000 m of underground drilling is planned for 2024, with a proposed budget of US$ 2.3 million.
|
| 2 | Increase the collection of density measurements at all deposits to obtain a better understanding of the behaviour of density across
lithologies and mineralized domains. |
| 3 | While the data collection, management, and verification procedures at site are considered to be adequate for this report, the development
of standard protocols and actions with respect to drilling, drill hole sampling, channel sampling, QA/QC, and drill hole database management
will improve the overall project integrity. Detailed recommendations are provided in each section. |
| 4 | Migrate from a MS Access database
to an industry standard database management system. |
| 5 | Continue exploration drilling at Porky West to prove additional resources at depth and along strike and begin infill drilling to
upgrade Inferred Mineral Resources. A total of 46,000 m of surface drilling is planned for 2024, with a proposed budget of US$ 5.36
million. |
| 1.1.2.2 | Mining and Mineral Reserves |
| 1 | It is recommended that the stope strike length and stope optimizer post-processing parameters be re-evaluated during subsequent Mineral
Reserve updates to ensure mineable shapes are generated in both longitudinal and transverse mining areas. |
| 2 | As more mining experience is gained in the GHW and SHW areas, re-evaluate the suitability of the dilution and extraction values currently
based on the Santoy 8 and 9 stope performance. |
| 3 | The appropriateness of the stated cut-off grade is dependent on the realization of operating cost savings compared to recent years.
Evaluate cut-off grades periodically as operating costs change. |
| 4 | Routinely reconcile the mine production numbers to the Resource model (F1 Factor), and milled production to Resource model (F3 factor),
to measure the accuracy of the Resource and Reserve block model. SLR understands that new Resource block models and grade control models
have recently been developed and implemented and recommends that a robust reconciliation process be put in place to allow for further
model refinement. |
| 5 | Some stopes in the GHW and SHW areas are designed using a transverse arrangement though the mining width is narrower than the stated
longitudinal/transverse demarcation measurement. Re-evaluate stope arrangements as more geological information and operating experience
is gained in these areas. |
| 6 | Consider using cemented rockfill (CRF) rather than uncemented rockfill (URF) where stopes are planned adjacent to backfill, particularly
in transverse stoping areas. |
| | 1-5 | |
| SSR Mining Inc. | Seabee Gold Operation S-K 1300 Report | February 12, 2024 SLR Project No.: 138.21581.00005 |
| 1.1.2.3 | Mineral Processing |
| 1 | SGO has an on-going program of modernization and optimization underway aimed at optimizing processing and increasing throughput. Currently,
metallurgical recovery and mine-to-mill reconciliation is based on monthly gold production, inventory changes within the process plant,
and tails grades and is compared to leach feed grades determined from manual sampling. Manual sampling of crushed ore is also carried
out, however, due to the presence of significant amounts of coarse gold in the ore, this sample is considered unreliable and is not used
for metallurgical accounting. SLR recommends that frequent automatic sampling (and sample splitting) of crushed ore feeding the grinding
circuit be included in this program of improvements to facilitate better mine-to-mill reconciliation and validation of gold recovery. |
| 1 | Assess all infrastructure requirements necessary not only for the existing life of mine, but also for the potential for additional
deposits being developed. |
| 1 | Continue to adhere to robust environmental and social standards. |
The economic analysis contained in this TRS is based on the SGO Mineral
Reserves, economic assumptions, and capital and operating costs provided by SSR corporate finance team and SGO finance and technical teams
and reviewed and accepted by SLR. All costs are expressed in Q3 2023 US dollars. Unless otherwise indicated, all costs in this section
are expressed without allowance for escalation, currency fluctuation, or interest. Costs quoted in Canadian dollars were converted to
US dollars at an exchange rate of US$1.00 = C$1.33.
A summary of the key criteria is provided below.
| • |
Mine
Life: |
|
4.2 years (between 2024 and Q1-2028) |
| • |
Underground
mining rate: |
|
Peak
mining rate of 1,400 tonnes per day. |
| • |
LOM
underground tonnes: |
|
2,043
kt at 5.12 g/t of Au |
| • |
Stockpile
feed to plant: |
|
13 kt at 5.22 g/t of Au |
| • |
Total
Ore Feed to Plant: |
|
2,056
kt at 5.12 g/t of Au |
| • |
Contained
Gold: |
|
338,624
oz of Au |
| • |
Contained
Silver: |
|
8,804
oz of Ag (at an Ag/Au ratio of 2.6%) |
| • |
Recovered
Gold: |
|
326,696
oz |
| • |
Recovered
Silver: |
|
8,494
oz |
| • |
Average
LOM Mill Recovery |
|
96.4% |
| | 1-6 | |
| SSR Mining Inc. | Seabee Gold Operation S-K 1300 Report | February 12, 2024 SLR Project No.: 138.21581.00005 |
| · | The metal prices and foreign exchange rate used in this report are based on analyst consensus prices as of November 2023. The LOM
average realized gold and silver prices assumed for SGO are US$1,854/oz Au and US$23.74 Ag. |
| · | Payable metals are estimated at 99.5% for gold and silver. These rates are based on actual SGO budget figures. |
| · | Transportation charges of US$20,000 per month |
| · | Refining charges are estimated at US$1.33/oz Au over the LOM based on actual SGO budget |
| · | A private 3% net smelter return (NSR) royalty on LOM revenues with Osisko Gold Royalties (Osisko) |
| · | LOM NSR revenue is US$602 million (after Logistic and Refining Charges), and the net revenue is US$584 million after including payable
royalties. |
| 1.2.1.3 | Capital Costs and Operating Costs |
| · | Sustaining capital costs for buildings and infrastructure, machinery and mobile equipment total US$35.8 million. |
| · | Underground capitalized development costs of US$67.6 million |
| · | Diamond drilling exploration and capital within the mine of US$22.5 million |
| · | Underground mining operating costs: US$63.86/t ore mined |
| · | Processing operating costs: US32.25/t ore milled |
| · | G&A: US$57.11/t ore milled |
| · | Total unit operating costs US$152.73/t ore milled |
| · | LOM total operating costs: US$314 million |
| · | Annual bond premium for asset retirement obligation (ARO) totals US$923 thousand over the LOM. |
| · | Closure costs of US$24 million are included in the analysis at the end of the LOM. |
| 1.2.1.4 | Taxation and Royalties |
| · | Federal and provincial income taxes were applied at a rate of 15% and 12%, respectively. |
| · | The Saskatchewan mining royalty (mineral tax) is enacted under the Crown Mineral Royalty Regulations, pursuant to the Crown Minerals
Act. For precious metals the royalty rate is 10% of net revenue after deducting production costs, transportation costs and refinery processing
charges, and applicable depreciation deductions. |
A summary of the life of mine cash flow is shown in Table 1-1.
| | 1-7 | |
| SSR Mining Inc. | Seabee Gold Operation S-K 1300 Report | February 12, 2024 SLR Project No.: 138.21581.00005 |
Table 1-1: After-Tax
Cash Flow Summary
| Description |
Units |
Value |
| LOM |
Years |
4.2 |
| Realized Market Prices |
|
|
| Au ($/oz) |
US$/oz |
1,854 |
| Ag ($/oz) |
US$/oz |
23.74 |
| Payable Metal |
|
|
| Au (koz) |
koz |
325 |
| Ag (koz) |
koz |
8 |
| Total Gross Revenue |
US$ million |
603 |
| Mining Cost |
US$ million |
(130) |
| Process Cost |
US$ million |
(66) |
| G & A Cost |
US$ million |
(117) |
| Refining/Freight |
US$ million |
(1) |
| Mining Royalties |
US$ million |
(18) |
| Total Operating Costs |
US$ million |
(333) |
| Operating Margin (EBITDA) |
US$ million |
270 |
| Working Capital |
US$ million |
0 |
| Sustaining Capital |
US$ million |
(126) |
| Total Closure/Reclamation Capital |
US$ million |
(25) |
| Total Capital |
US$ million |
(151) |
| |
|
|
| Pre-tax Free Cash Flow |
US$ million |
119 |
| Pre-tax NPV @ 5% |
US$ million |
111 |
| SK Mineral Tax |
US$ million |
(11) |
| Federal & Provincial Income Tax |
US$ million |
(5) |
| After-tax Free Cash Flow |
US$ million |
102 |
| After-tax NPV @ 5% |
US$ million |
95 |
Note: Sum of individual values may not match total due to rounding
| 1.2.3 | Sensitivity Analysis |
A sensitivity review of the after-tax NPV at a 5% discount rate was
carried out. The project is most sensitive to the gold price. A 10% reduction in gold price represents a 42% decrease in the after-tax
NPV5% value.
| | 1-8 | |
| SSR Mining Inc. | Seabee Gold Operation S-K 1300 Report | February 12, 2024 SLR Project No.: 138.21581.00005 |
| 1.3.1 | Property Description |
The SGO is located at the northern end of Laonil Lake, approximately
125 km northeast of the town of La Ronge, in Saskatchewan, Canada. The centre of the Property is located at approximately 55.7°
latitude north and 103.5° longitude west.
The mine is a remote operation with access to the mine site by fixed
wing aircraft to a 1,275 m airstrip located on the Property. Equipment and major resupply items are transported to the site via a
60 km winter ice road, which is typically in use during February and March.
The SGO is comprised of seven mineral leases and 130 mineral claims
that cover an area of approximately 73,820 ha. SSR holds a 100% interest in the Property through its wholly owned subsidiary, SGO
Mining Inc. (SGO Mining).
Between 1947 and 1950, Cominco Inc. made the initial gold discovery
at the Seabee Gold Operation (SGO), engaging in extensive prospecting and exploration activities. From 1958 to 1983, Cominco acquired
mining leases and conducted drilling, eventually selling the property to BEC International Corporation in 1983. Subsequent ownership transitions
occurred, with Claude Resources acquiring the property in 1985, conducting feasibility studies, and commencing production in 1991. Commercial
production at the Santoy Mine commenced in 2011. SSR acquired Claude Resources in 2016 and added the Fisher property through the acquisition
of Taiga Gold Corp. in 2022.
Historical exploration on the property consisted of rock and soil sampling
programs by Placer (1985-1988) and Claude Resources (1990-2013), collecting over 30,000 soil samples and 4,000 rock samples. Additionally,
aeromagnetic surveys in 2007 and a Titan-24 survey in 2010 identified geological structures related to gold mineralization.
| 1.3.4 | Geological Setting, Mineralization, and Deposit |
Northern Saskatchewan lies within the Churchill Province of the Canadian
Shield and is part of the Proterozoic Trans-Hudson Orogen. The Trans-Hudson Orogen resulted from the collision of Archean continental
fragments during the closure of the Manikewan ocean and is divided into two distinct zones: 1) the Cree Lake Zone, and 2) the Reindeer
Zone. The SGO is located within the Glennie domain of the Proterozoic Trans-Hudson Orogen.
The Glennie domain within the Reindeer Zone features arcuate belts of
Lower Proterozoic supracrustal rocks separated by granitoid gneisses. Seismic geophysical studies support the interpretation that the
Glennie domain is underlain, in part, by Archean rocks. The complex geological history involves folding, nappes, and thrust complexes,
as indicated by Archean windows within the Glennie domain.
The SGO, located in the Pine Lake greenstone belt within the Glennie
domain, hosts gold deposits in three main geological domains: Santoy Mine Complex (SMC), Laonil Lake Intrusive Complex, and Porky. The
Pine Lake greenstone belt itself comprises a variety of volcanic and intrusive rocks formed between ca. 1890 Ma and 1860 Ma.
| | 1-9 | |
| SSR Mining Inc. | Seabee Gold Operation S-K 1300 Report | February 12, 2024 SLR Project No.: 138.21581.00005 |
Four major phases of deformation (D1 to D4) occurred during the protracted
collision and amalgamation of Archean continental fragments. These phases involved gneissic foliation, thrusting, folding, and metamorphism.
The SMC's gold mineralization is found in dilatant portions of the Santoy
Shear Zone and along the margin of the Lizard Lake Pluton. Laonil Lake Intrusive Complex hosts the now closed Seabee Mine, while Porky
deposits are situated along the western margin of the Ray Lake synform within the Pine Lake Shear Zone.
The SGO deposits are orogenic, quartz-vein hosted lode gold deposits
formed in major brittle-ductile to ductile shear systems. The gold mineralization exhibits complex geometrical patterns attributed to
a combination of structural and lithological controls. Orogenic gold deposits can occur as en echelon veins, tabular veins, stockwork
veinlets, or broad areas of fracturing. The mineralization is associated with quartz veins, carbonate alteration, and magmatic activity.
Since the acquisition of the SGO, SSR has undertaken a review of historical
exploration activities, soil sampling, grab sampling, an airborne magnetic and radiometric survey (2016), and surface and underground
drilling on the original SGO property, as well as the Fisher and Truscott tenements.
Prior to SSR’s acquisition of the SGO, and as at December 31,
2015, a total of 2,037 surface drill holes totalling approximately 389,281 m and 4,818 underground holes totalling approximately 861,514
m had been completed on the property. For the year ended December 31, 2023, SSR has drilled an additional 484 surface holes totalling
approximately 185,841 m and 1,553 underground holes totalling approximately 319,847 m since acquiring the property from Claude Resources.
| 1.3.6 | Mineral Resource Estimates |
SLR conducted Mineral Resource estimations for the Santoy Mine deposits
based on drill hole data available up to April 30, 2023. The database is composed of 3,250 drill holes for a total length of 710,645.11m.
The database for the Santoy Mine Mineral Resource estimate consists of diamond drilling generally spaced from 10 m to 25 m apart, but
up to 275 m locally. It includes 108,045 assays and 10,878 domain-intersecting gold assays from 1,160, 1,098 and 479 drill holes for the
Santoy 8, 9, and GHW-SHW deposits, respectively. The creation of 3D wireframe models used a nominal 2.0 g/t Au threshold for all zones.
Assays were composited to represent either 1 m, 1.5 m, or 2 m intercepts of each domain, and then capped by zone. Block model gold grades
within the wireframe models were interpolated using the ordinary kriging (OK) method. A bulk density of 2.75 g/cm3, based on
density measurements from core, channel, and muck samples, was assigned to Santoy 8 and Santoy 9, and a bulk density of 2.65 g/cm3
was assigned for GHW-SHW.
SLR conducted Mineral Resource estimations for the Porky West deposit
based on drill hole data available up to October 15, 2023. The database is composed of 251 drill holes for a total length of 75,585 m.
The database for the Porky West Mineral Resource estimate consists of diamond drilling generally spaced between 10 m and 25 m, but up
to 75 m locally. It includes 19,642 assays and 3,728 domain intersecting gold assays. The creation of 3D wireframe models used a nominal
1.0 g/t Au threshold for all zones. Assays were composited to 1.5 m within each domain, and then capped by zone. Block model grades within
the wireframe models were interpolated using the inverse distance cubed (ID3) method. Bulk densities were based on the measurements
taken on a bulk sample and were set at 2.71 g/cm3 for mineralized zones, 1.70 g/cm3 for the overburden, and 2.80
g/cm3 for host rock.
| | 1-10 | |
| SSR Mining Inc. | Seabee Gold Operation S-K 1300 Report | February 12, 2024 SLR Project No.: 138.21581.00005 |
For both areas, blocks were categorized as Measured, Indicated, and
Inferred, taking into account the local drill hole spacing and proximity to existing development. The drill hole spacing criterion was
determined through variography conducted over the deposits and considering the observed continuity of mineralization. It was further adjusted
to align with geological insights, grade continuity and to ensure consistent classification shapes. SLR validated the estimates using
standard industry techniques.
Underground constraining shapes were created using Deswik Stope Optimizer
(DSO) software, incorporating a 2.61 g/t Au cut-off grade and a 2.0 m minimum thickness.
Mineral Resources exclusive of Mineral Reserves, as of December 31,
2023, for SGO are presented in Table 1-2.
Table 1-2: Summary of Mineral
Resources, exclusive of Mineral Reserves – December 31, 2023
| Category |
Project |
Tonnage |
Grade |
Contained Metal |
Cutt-off Grade |
Metallurgical Recovery |
| (000 t) |
(g/t Au) |
(000 oz Au) |
(g/t Au) |
% |
| Measured |
Santoy Mine |
91.9 |
5.5 |
16.3 |
2.61 |
96.4 |
| Total |
91.9 |
5.5 |
16.3 |
| Indicated |
Santoy Mine |
1,021.30 |
3.9 |
127.1 |
| Porky West |
444.3 |
5.2 |
74.9 |
| Total |
1,465.60 |
4.3 |
202 |
| Total Measured + Indicated |
Santoy Mine |
1,113.20 |
4 |
143.4 |
| Porky West |
444.3 |
5.2 |
74.9 |
| Total |
1,557.50 |
4.4 |
218.3 |
| Inferred |
Santoy Mine |
1,658.60 |
4.3 |
230.3 |
| Porky West |
1,088.60 |
6.6 |
232.2 |
| Total |
2,747.20 |
5.2 |
462.5 |
Notes:
| 1. | The definitions for Mineral Resources in S-K 1300 were followed for Mineral Resources. |
| 2. | Mineral Resources are reported based on 31 December 2023 as-mined survey data. |
| 3. | Mineral Resources are estimated at a cut-off grade of 2.61 g/t Au. |
| 4. | Mineral Resources are estimated using a long-term gold price of US$1,750 per ounce, and a US$/C$ exchange rate of 1.33. |
| 5. | Bulk density ranges by domain between 2.65 t/m3 and 2.80 t/m3 . The density assigned to the overburden at Porky
West is 1.70 t/m3. |
| 6. | Gold metallurgical recovery is 96.4%. |
| 7. | Mineral Resources at Santoy Mine are exclusive of Mineral Reserves |
| 8. | There are no Mineral Reserves at Porky West |
| 9. | Mineral Resources that are not Mineral Reserves do not have demonstrated economic viability. |
| 10. | Mineral Resources are reported within underground reporting shapes (DSO shapes). |
| 11. | The point of reference for Mineral Resources is the point of feed into the processing facility. |
| 12. | SSR has 100% ownership of the Project and Mineral Resources are shown on a 100% basis. |
| 13. | A minimum mining width of 2 m was used. |
| 14. | Totals may vary due to rounding. |
| | 1-11 | |
| SSR Mining Inc. | Seabee Gold Operation S-K 1300 Report | February 12, 2024 SLR Project No.: 138.21581.00005 |
| 1.3.7 | Mineral Reserve Estimates |
Mineral Reserves at the Santoy Mine, as estimated by SSR and reviewed
and accepted by SLR, are summarized in Table 1-3. The mine life is estimated at 4.2 years.
Table 1-3: Summary of Mineral
Reserves – December 31, 2023
| Category |
Tonnage
(000 t) |
Grade
(g/t Au) |
Contained Metal
(000 oz Au) |
Cut-off Grade4 (g/t Au) |
Metallurgical Recovery |
| Proven (In-situ) |
238 |
6.00 |
46 |
1.86 and 2.85 |
96.4% |
| Proven (Stockpile) |
13 |
11.24 |
5 |
- |
96.4% |
| Probable |
1,815 |
5.01 |
292 |
1.86 and 2.85 |
96.4% |
| Total Proven + Probable |
2,066 |
5.17 |
343 |
|
|
Notes:
| 1. | Classification of Mineral Reserves is in accordance with the S-K 1300 classification system. |
| 2. | Mineral Reserves are reported based on 31 December 2023 as-mined survey data. |
| 3. | Mineral Reserves were estimated by SSR Mining and reviewed and accepted by SLR. |
| 4. | Mineral Reserves are estimated at a cut-off grade of 2.85 g/t Au for production stopes, and 1.86 g/t for development designs. |
| 5. | A mining extraction factor of 89% was applied to mined tonnes and contained metal. |
| 6. | The point of reference for Mineral Reserves is the point of feed into the processing facility. |
| 7. | SSR has 100% ownership of the Project and Mineral Reserves are shown on a 100% basis |
| 8. | Mineral Reserves are estimated using an average long-term gold price of US$1,600 per ounce and a US$/C$ exchange rate of 1.33. |
| 9. | A minimum mining width of 2.0 m was used. |
| 10. | Bulk density is 2.75 t/m3 for Santoy 8 & 9, and 2.65 t/m3 for GHW & SHW. |
| 11. | Totals may vary due to rounding. |
Measured Mineral Resources were converted to Proven Mineral Reserves,
and Indicated Mineral Resources were converted to Probable Mineral Reserves. Inferred Mineral Resources were not converted to Mineral
Reserves and are not included in the LOM plan.
Mineral Resources are converted to Mineral Reserves through the application
of a minimum mining width of 2.0 m, a 2.85 g/t Au cut-off grade, and stope optimizer designs followed by the application of external dilution.
A cut-off grade of 1.86 g/t Au is used for ore development reflecting the marginal nature of the development. An extraction factor of
89% is applied to both production stopes and ore development designs, and linear overbreak dilution of 0.7 m is applied to production
designs. Mineral Reserves at SGO are estimated for the Santoy Mine only.
Access to the Santoy underground mine is by decline. Levels are typically
driven at 20 m vertical spacings and accessed by decline and incline ramps. The mining method used is sublevel open stoping with backfill
in either a longitudinal or transverse arrangement depending on ore width. The mining front progresses upward from the lowest level of
a mining block. The completed stopes are backfilled with waste rock.
| | 1-12 | |
| SSR Mining Inc. | Seabee Gold Operation S-K 1300 Report | February 12, 2024 SLR Project No.: 138.21581.00005 |
Ore development following the establishment of level accesses and ancillary
headings varies depending on the stoping method used. Where longitudinal retreat stoping is used, sill drifts are driven on the ore along
strike to the ore extents. One drift is driven along the bottom of the stoping block and a second along the top. Where transverse stoping
is used a haulage drift is driven on the footwall side of the ore, and perpendicular drawpoints are driven to crosscut the ore. The drawpoints
are used both for production drilling and mucking, are driven with two boom jumbos, and are bolted and screened to site standards.
Of the total production tonnes included in the mine plan, approximately
55% are planned to be mined using transverse stoping. This includes nearly all of the GHW area, and the lower portion of the SHW area.
The remainder, including Santoy 8, Santoy 9, and the upper SHW areas, are planned using longitudinal retreat.
Uncemented rockfill (URF) is the primary type of backfill at the Santoy
Mine. Ore and development waste are hauled within the mine, and to surface via 45 t haul trucks. Waste rock generated from development
is stored underground where possible for use as backfill.
The Santoy primary ventilation circuit is a push system that currently
provides 150 m3 per second (320,000 ft3 per minute (CFM)) through two fresh air raises (FAR) located at
the Gap Main and Santoy 8 sites. Air is exhausted via the main ramp and the Santoy 8 East return air raise (RAR). Drop raises or
Alimak raises are used to distribute air between levels and as secondary egress.
| 1.3.9 | Processing and Recovery Methods |
The Seabee mill has been in operation since 1991 and processed ore from
the Seabee Mine for 25 years. The initial capacity of the mill was 500 tpd, which was later expanded to 1,000 tpd with the addition
of a third grinding mill. Through de-bottlenecking and optimization actions, its capacity has been gradually increased to the current
throughput of approximately 1,200 tpd. The mill was constructed immediately adjacent to the Seabee shaft. In 2017, Seabee Mine operations
ceased, and ore from the Santoy Mine has been the sole feed to the mill since. Ore is hauled 14 km by truck from the Santoy Mine to the
mill.
The mill flow sheet is a conventional crushing and grinding circuit
employing gravity gold recovery and cyanide leaching with carbon-in-pulp (CIP) for recovery and production of doré gold on site.
Crushing is carried out in a semi-mobile circuit consisting of a primary jaw crusher and secondary cone crusher in closed circuit with
a screen to produce grinding circuit feed. The crushed ore is directed to the mill feed bin or external stockpile. The grinding circuit
consists of two stages of grinding in ball mills, both in closed circuit with classifying cyclones. A portion of the cyclone underflow
from the primary mill is directed to a gravity concentration circuit where between 50% and 70% of the gold in the mill feed is recovered.
The gravity tail is recombined with the primary mill cyclone underflow. The primary mill cyclone overflow is ground in the secondary grinding
circuit to a target 80% passing 115 µm for feed to the leaching circuit. The cyanide leaching circuit is followed by carbon adsorption
in the CIP circuit, after which the carbon is stripped, regenerated, and returned to the CIP circuit. Gold is recovered by electrowinning
and melted in a gas furnace to produce doré bars. The overall gold recovery for the mill typically ranges between 96% and 98%.
Leach tails are deposited in a conventional slurry tailings storage facility and supernatant water is recycled to the mill for use in
the process.
SGO is a remote operation supported by regular flights from Saskatoon,
stopping in Prince Albert, and a camp that accommodates up to 251 people.
| | 1-13 | |
| SSR Mining Inc. | Seabee Gold Operation S-K 1300 Report | February 12, 2024 SLR Project No.: 138.21581.00005 |
The site can be accessed by a 60 km winter road, which begins at
Highway 102 near the community of Brabant Lake, Saskatchewan, and includes 12 portages and 11 lakes. Most annual supplies are transported
to site via the winter road.
Electrical power is provided by the provincial power authority, Saskatchewan
Power Corporation, via a transmission line to the mine connected to a 138 kV transmission line from the Island Falls hydroelectric
power station.
Potable water is obtained from potable water systems at both the Seabee
and Santoy mine sites. To better meet the current and future Seabee site water needs, a new ultrafiltration potable water system was installed
and commissioned in 2022.
There are two tailings management facilities (TMF) that are being used
by the Seabee mill: the East Lake TMF and the Triangle Lake TMF. Tailings deposition alternates between the two TMFs where winter deposition
occurs in the Triangle Lake TMF and summer deposition is in the East Lake TMF. The current remaining storage capacities of both TMFs,
based on an average production rate at 1,200 tpd, will potentially be reached in late-2030. Maximum capacities also allow that 200,000 m3
of water are treated and discharged from the TMFs each year. To ensure the treatment volumes are attained, a new water treatment plant
at East Lake TMF was constructed in 2017. Work is currently underway investigating options for extending the life of the TMFs to accommodate
any further extensions of the SGO life.
The principal commodities at SGO is a doré product mainly consisting
of gold, with minor amounts of silver. This type of product is freely traded at prices that are widely known, so that prospects for sale
of any production are virtually assured.
| 1.3.12 | Environmental Studies, Permitting and Plans, Negotiations, or Agreements with Local Individuals or Groups |
SGO has been in production since 1991. As part of the initial environmental
assessment, approvals and the subsequent expansions at the operation, the existing environment was characterised in three environmental
assessments, in accordance with the applicable provincial regulations. The initial environmental assessment focused on the original Seabee
Mine and mill and was completed in 1990. The second environmental assessment was necessary to assess the potential environmental impacts
associated with the construction and operation of the Triangle Lake TMF and was completed in 2001. The third environmental assessment
was necessary to assess the potential environmental impacts associated with the development of the Santoy Mine and was completed in 2009.
For each of these assessments, baseline data was collected, and the potential environmental impacts associated with the proposed project
were assessed. In all three environmental assessments, no significant potential environmental impacts were identified that could not be
mitigated through the implementation of management plans. Subsequently, Ministerial Approvals to proceed to construction and operation
were granted for each of the three environmental assessments.
Since its inception, the SGO has operated under the terms and conditions
of an Approval to Operate, issued by the Ministry of the Environment for the Province of Saskatchewan (SMOE). The operation’s current
Approval to Operate number PO22-185, was issued in October 2022 and expires in September 2027. This approval outlines monitoring and reporting
requirements for all operations.
| | 1-14 | |
| SSR Mining Inc. | Seabee Gold Operation S-K 1300 Report | February 12, 2024 SLR Project No.: 138.21581.00005 |
SGO reports annually on the operations performance in its Annual Environment
Report. According to the 2022 Annual Environment Report, dated March 31, 2023, SGO is in compliance with the terms and conditions of this
approval.
| 1.3.13 | Capital and Operating Cost Estimates |
The estimated capital costs required to achieve the Mineral Reserve
LOM are estimated to be US$125.8 million. The capital costs were estimated by SSR and reviewed by SLR. Since SGO is an operating mine,
all capital costs, as listed below, are categorized as sustaining:
| · | Mine capital development |
| · | Diamond drilling exploration and capital within the mine |
| · | Building and civil works such as mill improvements and TMF construction costs |
| · | Mobile equipment such as new and replacement purchases and major rebuilds |
| · | Replacement or refurbishment of major machinery or equipment components |
The operating expenses estimated to validate the positive cash flow
for the Mineral Reserve LOM are summarized in Table 1-4.
Table 1-4: Operating Costs Estimate
| Cost Component |
LOM Total
(US$ millions) |
Average Annual1
(US$ millions) |
LOM Average
(US$/t milled) |
| Mining |
130.3 |
31.6 |
63.86 |
| Milling (incl. Fixed Plant) |
66.3 |
16.1 |
32.25 |
| G&A |
117.4 |
27.6 |
57.11 |
| Total Operating Cost |
314.0 |
75.3 |
153.22 |
Notes:
| 1. | For fully operational years (2024 – 2027) |
| 2. | Sum of individual values may not match total due to rounding. |
| | 1-15 | |
| SSR Mining Inc. | Seabee Gold Operation S-K 1300 Report | February 12, 2024 SLR Project No.: 138.21581.00005 |
SLR International Corporation (SLR) was retained by SSR Mining Inc.
(SSR, or the Company) to prepare an independent Technical Report Summary (TRS) on the Seabee Gold Operation (SGO), located in northern
Saskatchewan, Canada. SGO constitutes five principal deposits, Santoy 8, Santoy 9, Gap Hanging Wall (GHW), Santoy Hanging Wall (SHW),
together, Santoy Mine, and Porky West.
The purpose of this TRS is to support the disclosure of updated Mineral
Resource and Mineral Reserve estimates. This TRS conforms to the United States Securities and Exchange Commission’s (SEC) Modernized
Property Disclosure Requirements for Mining Registrants as described in Subpart 229.1300 of Regulation S-K, Disclosure by Registrants
Engaged in Mining Operations (S-K 1300) and Item 601 (b)(96) Technical Report Summary.
SSR is a mining company based in Denver, Colorado. The Company has four
producing assets located in USA, Türkiye, Canada, and Argentina, as well as numerous development and exploration projects globally.
SSR is listed under the ticker symbol SSRM on the Nasdaq Stock Exchange and Toronto Stock Exchange, and SSR on the Australian Stock Exchange.
The SLR geology QPs visited the site on April 11 to April 14, 2023.
While at site, the SLR QPs held discussions with site personnel; visited the Santoy Mine underground operations; reviewed core; reviewed
data collection and quality assurance and quality control (QA/QC) procedures; and reviewed geological interpretations, geological modelling,
and Mineral Resource estimation procedures.
The other QPs from SLR visited the property from October 31, 2023 to
November 2, 2023. During the site visit, the SLR QPs visited the underground mine, toured the surface facilities, visited the process
plant, and met with key SSR staff on site.
| 2.2 | Sources of Information |
During the preparation of this TRS, discussions were held with personnel
from SSR:
| · | Karthik Rathnam, SME Registered Member, Director Resource Geology, SSR Mining Inc. |
| · | Jeffrey Kulas, P.Geo., Resource Development Manager – Canada, SSR Mining Inc. |
| · | Kyle Maclintock, P.Geo., Senior Geologist, SSR Mining Inc. |
| · | Andrew Fetch, P.Geo., Senior Geologist-Resource Development, SSR Mining Inc. |
| · | Trent Kulbida, P.Geo., Senior Geologist-Resource Development, SSR Mining Inc. |
| · | Patricia Goncalves Guimaraes, AusIMM Member, Senior Resource Geologist, SSR Mining Inc. |
| · | Osman Uludağ, Director Resource Development, SSR Mining Inc. |
| · | Brandon Heser, PE, SME Registered Member, Director Mine Technical Services, SSR Mining Inc. |
| · | Emma Dodds, P.Eng., Senior Underground Mining Engineer, SSR Mining Inc. |
| | 2-1 | |
| SSR Mining Inc. | Seabee Gold Operation S-K 1300 Report | February 12, 2024 SLR Project No.: 138.21581.00005 |
| · | Alain Boyer, Superintendent of Mine Engineering, SSR Mining Inc. |
| · | Kevin Fitzpatrick, P.Eng., Senior Engineer, SSR Mining Inc. |
| · | Nitin Laddha, Manager Business Evaluations, SSR Mining Inc. |
| · | Graham Bussiere, P.Biol., Acting EHSS Manager, SSR Mining Inc. |
| · | Bryan Koehler, P.Eng., Superintendent, Capital Projects, SSR Mining Inc. |
| · | James Harrold, Senior Process Engineer, SSR Mining Inc. |
| · | Ashley Theriault, Mill General Foreman, SSR Mining Inc. |
| · | Roselyn Yeboah, Plant Metallurgist, SSR Mining Inc. |
This TRS was prepared by SLR QPs. The TRS is based on information and
data supplied to the SLR QPs by SSR and other parties where necessary. The documentation reviewed, and other sources of information, are
listed at the end of this TRS in Section 24.0 References.
The SLR QPs have reviewed the supplied data and information and it appears
accurate and complete and accept this information for use in the TRS. Section 25 describes any information and data supplied by SSR that
was outside the areas of expertise of the SLR QPs and was relied upon when forming the findings and conclusions of this report.
| | 2-2 | |
| SSR Mining Inc. | Seabee Gold Operation S-K 1300 Report | February 12, 2024 SLR Project No.: 138.21581.00005 |
Units of measurement used in this TRS conform to the metric system.
All currency in this TRS is US dollars (US$) unless otherwise noted.
| μ |
micron |
kVA |
kilovolt-amperes |
| μg |
microgram |
kW |
kilowatt |
| a |
annum |
kWh |
kilowatt-hour |
| A |
ampere |
L |
litre |
| bbl |
barrels |
lb |
pound |
| Btu |
British thermal units |
L/s |
litres per second |
| °C |
degree Celsius |
L/h/m2 |
liters per hour per square meter |
| C$ |
Canadian dollars |
m |
metre |
| cal |
calorie |
M |
mega (million); molar |
| cfm |
cubic feet per minute |
m2 |
square metre |
| cm |
centimetre |
m3 |
cubic metre |
| cm2 |
square centimetre |
MASL |
metres above sea level |
| d |
day |
m3/h |
cubic metres per hour |
| dia |
diameter |
mi |
mile |
| dmt |
dry metric tonne |
min |
minute |
| dwt |
dead-weight ton |
μm |
micrometre |
| °F |
degree Fahrenheit |
mm |
millimetre |
| ft |
foot |
mph |
miles per hour |
| ft2 |
square foot |
MVA |
megavolt-amperes |
| ft3 |
cubic foot |
MW |
megawatt |
| ft/s |
foot per second |
MWh |
megawatt-hour |
| g |
gram |
oz |
troy ounce (31.1035 g) |
| G |
giga (billion) |
oz/st, opt |
ounce per short ton |
| gal |
US gallon |
ppb |
part per billion |
| g/L |
gram per litre |
ppm |
part per million |
| gpm |
US gallons per minute |
psia |
pound per square inch absolute |
| g/t |
gram per tonne |
psig |
pound per square inch gauge |
| gr/ft3 |
grain per cubic foot |
RL |
relative elevation |
| gr/m3 |
grain per cubic meter |
s |
second |
| ha |
hectare |
st |
short ton |
| hp |
horsepower |
stpa |
short ton per year |
| h |
hour |
stpd |
short ton per day |
| Hz |
hertz |
t |
metric tonne |
| in. |
inch |
tpa |
metric tonne per year |
| in2 |
square inch |
tpd |
metric tonne per day |
| J |
joule |
US$ |
United States dollar |
| k |
kilo (thousand) |
V |
volt |
| kcal |
kilocalorie |
W |
watt |
| kg |
kilogram |
wmt |
wet metric tonne |
| km |
kilometer |
wt% |
weight percent |
| km2 |
square kilometer |
yd3 |
cubic yard |
| km/h |
kilometer per hour |
yr |
year |
| kPa |
kilopascal |
|
|
| | 2-3 | |
| SSR Mining Inc. | Seabee Gold Operation S-K 1300 Report | February 12, 2024 SLR Project No.: 138.21581.00005 |
The SGO is located at the northern end of Laonil Lake, approximately
125 km northeast of the town of La Ronge, in Saskatchewan, Canada (Figure 3-1). The centre of the property is located at approximately
55.7° latitude north and 103.5° longitude west.
The mine is a remote operation with access to the mine site by fixed
wing aircraft to a 1,275 m airstrip located on the property. Equipment and major resupply items are transported to the site via a
60 km winter ice road, which is typically in use from January through March.
Exploration and mining in Saskatchewan are governed by the Crown Minerals
Act, the Mineral Disposition Amendment Regulations (2012), and the Mineral Tenure Registry Regulations, which grant to the owner of a
claim the right to explore for minerals. Exploration and mining are administered by the Mines Branch of the Saskatchewan Ministry of Energy
and Resources. Mineral rights are owned by the Crown and are distinct from surface rights.
There are two key land tenure milestones that must be met for commercial
production to occur in Saskatchewan:
| 1 | Conversion of a mineral claim to mineral lease. |
| 2 | Granting of a surface lease to cover the specific surface area within a mineral lease where mining is to occur. |
Several other permits, licences, and approvals are required both for
ongoing exploration and eventual operation for the project to proceed. To carry out exploration at the Property, a Surface Exploration
Permit, Forest Product Permit, and Aquatic Habitat Protection Permit are required.
| 3.2.1 | Mineral Claim and Mineral Lease |
A mineral claim does not grant the holder the right to mine minerals
except for exploration purposes. Subject to completing necessary expenditure requirements, mineral claim credits can be accumulated for
a maximum of 21 years. To ensure that mineral claims are kept in good standing in Saskatchewan, the claim holder must undertake the minimum
exploration work on a yearly basis. The current requirements are C$15/ha per year for claims that have existed for 10 years or less, and
C$25/ha per year for claims that have existed in excess of 10 years. Excess expenditures can be accumulated as credits for future years.
A mineral claim in good standing can be converted to a mineral lease
by applying to the mining recorder and having a completed boundary survey. In contrast to a mineral claim, the acquisition of a mineral
lease grants the holder the exclusive right to explore for, mine, recover, and dispose of any minerals within the mineral lease.
Mineral leases are for a term of ten years and are renewable. A lease
grants the holder the exclusive right to explore for, mine, recover, and dispose of any minerals within the lease lands. Annual expenditures
of the lease are C$25/ha for years 1 to 10, C$50/ha for years 11 to 20, and C$75/ha annually thereafter.
| | 3-1 | |
| SSR Mining Inc. | Seabee Gold Operation S-K 1300 Report | February 12, 2024 SLR Project No.: 138.21581.00005 |
Figure 3-1: Location of the
Seabee Gold Operation
SSR Mining Corp.
Seabee Gold Operation
Saskatchewan, Canada
Location Map
| | 3-2 | |
| SSR Mining Inc. | Seabee Gold Operation S-K 1300 Report | February 12, 2024 SLR Project No.: 138.21581.00005 |
Land within the mineral lease, surface facilities, and mine workings
are considered to be located on Provincial lands and therefore owned by the Province. Hence, the right to use and occupy those lands is
acquired under a surface lease from the Province of Saskatchewan. A surface lease is issued for a maximum of 33 years and may be extended
as necessary to allow the lessee to operate a mine and/or plant and undertake reclamation of disturbed ground.
Co-ordinated between various provincial government ministries and industry,
the leases address a range of issues to which mining companies must respond, including land tenure, environmental protection measures,
occupational health and safety provisions, and socio-economic benefits for residents of northern Saskatchewan. Beyond addressing business
opportunities and other local benefits, each surface lease agreement also requires the company to negotiate a long-term Human Resource
Development Agreement with the Ministry of Advanced Education, Employment and Labour. This plan must address efforts to recruit, train,
and hire northern workers. For mining projects, the surface lease is negotiated between the proponent and the provincial government following
the completion of a successful environmental assessment.
Once the surface lease is negotiated, the Provincial approval to operate
a Pollution Control Facility is issued; it describes commitments that must be met in terms of monitoring and reporting.
The SGO is comprised of seven mineral leases and 130 mineral claims
that cover an area of approximately 73,820 ha (Table 3-1 and Figure 3-2). SSR holds a 100% interest in the property through
its wholly owned subsidiary, SGO Mining Inc. (SGO Mining).
Claude Resources initially staked or acquired the SGO mineral leases
and mineral claims prior to SSR’s acquisition of the property on May 31, 2016. In January 1999, after Claude Resources fulfilled
the conditions of an option agreement and obtained a 100% interest in the adjoining Currie Rose property, a portion of a previous claim
CBS 7057 was converted to a mineral lease (ML 5520). The original 10 quartz mineral claims covering the Seabee Mine site were consolidated
into a single mineral lease (ML 5519) granted by the Provincial Crown in November 1999. In July 2021, a formal request from the SGO to
consolidate ML 5519 and ML 5520 into a single mineral lease ML 5559, a non-producing lease expiring in 2034, was granted.
Additional mineral leases were added at the Santoy 7 deposit (ML 5535)
and Porky West deposit (ML 5536) in 2007, at the Santoy 8 deposit (ML 5543) in 2009, and at the Santoy Gap deposit (ML 5551) in 2013.
The SGO is currently producing from mineral leases ML 5558, ML 5543, and ML 5551.
In April 2022, through the acquisition on Taiga Gold Corp., SSR consolidated
a 100% interest in the Fisher property contiguous to the Seabee Mine, and eliminated a 2.5% net smelter return (NSR) royalty on the Fisher
property. The Fisher property includes the Fisher, Fisher S, Leland and Truscott tenements.
| | 3-3 | |
| SSR Mining Inc. | Seabee Gold Operation S-K 1300 Report | February 12, 2024 SLR Project No.: 138.21581.00005 |
Table 3-1: Mineral
Tenure Information
| Mineral Licence Type |
No.
Tenements |
Area
(ha) |
Expiry Date Range
(dd-mmm-yy) |
| Mineral Lease (all within Seabee Area) |
| With Active Mining |
3 |
237 |
31-Dec-24 to 24-Jan-33 |
| Without Active Mining |
4 |
470 |
1-Aug-25 to 1-Jul-43 |
| Total Mineral Leases |
7 |
707 |
31-Dec-24 to 1-Jul-43 |
| Mineral Claim (summarized by area) |
| Seabee Area |
21 |
12,950 |
5-Dec-32 to 4-Dec-33 |
| Seabee Carina |
1 |
65 |
31-Oct-33 |
| Seabee Fisher |
53 |
30,493 |
5-Aug-31 to 16-Feb-34 |
| Seabee Fisher S |
10 |
5,535 |
21-Jun-30 to 20-Nov-33 |
| Seabee New |
18 |
9,444 |
6-Aug-32 to 19-Mar-34 |
| Seabee Shane |
1 |
642 |
7-Nov-33 |
| Seabee Truscott |
1 |
3,695 |
19-Mar-33 |
| Seabee Leland |
25 |
10,289 |
24-Jan-26 to 10-Dec-33 |
| Total Mineral Claims |
130 |
73,113 |
24-Jan-26 to 19-Mar-34 |
| Total Mineral Leases and Claims |
137 |
73,820 |
31-Dec-24 to 1-Jul-43 |
Note. All Tenements 100% SGO Mining Owned
| | 3-4 | |
| SSR Mining Inc. | Seabee Gold Operation S-K 1300 Report | February 12, 2024 SLR Project No.: 138.21581.00005 |
Figure 3-2: SGO Mining Land
Tenure Map
SSR Mining Corp.
Seabee Gold Operation
Saskatchewan, Canada
SGO Mining Land Tenure
Map
| | 3-5 | |
| SSR Mining Inc. | Seabee Gold Operation S-K 1300 Report | February 12, 2024 SLR Project No.: 138.21581.00005 |
The SGO is subject to production and NSR royalties payable to third
parties.
Claude Resources entered into a royalty agreement with Orion Mine Financial
Fund (Orion) in 2014 to grant a 3% NSR royalty on gold sales from the SGO. Payments are to be made quarterly in cash or in physical gold
at the average price of gold in each calendar month. This royalty has subsequently been transferred by Orion to Osisko Gold Royalties
Ltd.
In the first quarter of 2016, Claude Resources also granted an aggregate
1% NSR royalty on gold production from certain mineral dispositions to an individual and a private company. These dispositions include
MC00003518, MC00003532, MC00003571, MC00003573, MC00003594, MC00003631, MC00003716, and MC00003717 from which the SGO is not currently
producing. SSR has an option to re-purchase one half of this NSR royalty for C$1.0 million.
The SGO is also subject to certain royalty payments to the Province
of Saskatchewan that are calculated on 10% of net operating profits and are payable once capital and exploration costs are recovered.
No royalty payments have been made to the Province of Saskatchewan to date.
SLR is not aware of any significant encumbrances to the Project including
current and future permitting requirements and associated timelines, permit conditions, and violations and fines.
| 3.6 | Environmental Considerations |
The primary environmental considerations and potential liabilities with
the SGO are related to the operation’s solid waste (mill tailings) and the treatment and release of mine and mill effluent.
The tailings produced at the mill are currently managed in permanent
management facilities (the East Lake tailings management facility (TMF) and the Triangle Lake TMF. The operation of these two facilities
is conducted in accordance with the SGO’s Tailings Operation, Maintenance, and Surveillance Manual (SRK Consulting (Canada) Inc.
(SRK), 2020) and the Canadian Dam Safety Guidelines. In addition, the current approved SGO Preliminary Decommissioning and Reclamation
Plan, 2016 Update (SRK, 2017b) addresses all potential long-term environmental and physical stability issues of the containment structures
in accordance with the Canadian Dam Association Guidelines. The SGO cost estimate for closure activities was updated in 2020 and approved
by the Ministry of Environment in July 2020 (Ministry of Environment, 2020).
With respect to water management and treatment, three discharge points
exist at the operation. Mine water from the old Seabee Mine (also referred to as the 2B mine, not currently in operation) is pumped to
surface settling ponds that discharge to Laonil Lake. Mine water collected in the Santoy Mine is pumped to surface and discharged to the
Santoy settling ponds, which is treated in a Moving Biological Bed Reactor (MBBR) water treatment plant in order to remove ammonia and
nutrients from the water prior to discharge to Lizard Lake.
In addition, mill effluent accumulating in the two TMFs that is not
recycled to the mill as make-up process water is treated in a chemical treatment plant through the addition of lime, hydrogen peroxide,
and ferric sulfate. The treated water from this plant currently discharges to the East Pond which flows through a series of wetlands and
ultimately reports to the northern arm of Laonil Lake. A new chemical treatment plant combined with an MBBR was recently constructed to
replace the existing chemical treatment plant. Both water treatment plants operate in compliance with the SGO’s Approval to Operate.
All water discharges to the environment comply with applicable provincial and federal regulations.
| | 3-6 | |
| SSR Mining Inc. | Seabee Gold Operation S-K 1300 Report | February 12, 2024 SLR Project No.: 138.21581.00005 |
| 3.7 | Permits and Authorizations |
Following a successful environmental assessment for a proposed gold
mine development in the Province of Saskatchewan, applicants must secure a Surface Lease Agreement and subsequently an Approval to Operate
a Pollutant Control Facilities (Approval to Operate) both issued by the Province of Saskatchewan’s Ministry of Environment (SMOE).
The SGO currently has a valid surface lease with the Province of Saskatchewan,
which was amended in March 2010. This surface lease provides SSR the Crown Land surface rights necessary to carry out the mining, milling,
and associated operations at the SGO. The existing surface lease is in effect from March 2010 to its expiry date of May 31, 2040
(SMOE, 2010).
The SGO also holds an Approval to Operate No. PO22-185. This approval
is issued by the SMOE pursuant to The Environmental Management and Protection Act, 2010 and its regulations. This approval was issued
in October 2022 and is valid until September 2027. Renewal of this approval is triggered through an application submitted to the SMOE
at least 90 days prior to its expiry date. Subject to the terms and conditions of this approval, SSR is authorized to operate all
pollutant control facilities associated with the SGO’s mine and mill (SMOE, 2016).
The SGO is also obligated to operate in compliance with the Canadian
Metal and Diamond Mining Effluent Regulations issued pursuant to the Canadian Fisheries Act.
| 3.8 | Other Significant Factors and Risks |
SLR is not aware of any environmental liabilities on the property. SSR
has all required permits to conduct the proposed work on the property. SLR is not aware of any other significant factors and risks that
may affect access, title, or the right or ability to perform the proposed work program on the property.
| | 3-7 | |
| SSR Mining Inc. | Seabee Gold Operation S-K 1300 Report | February 12, 2024 SLR Project No.: 138.21581.00005 |
| 4.0 | Accessibility, Climate, Local Resources, Infrastructure and Physiography |
Access to the SGO is by fixed-wing aircraft from the town of La
Ronge, Saskatchewan to a 1,275 m airstrip located on the property. During the winter months (generally February and March), a
60 km winter road is built between the mine site and Brabant Lake on Highway 102, approximately 120 km north of La Ronge,
to transport heavy supplies and equipment by truck.
The summers at the SGO operation are comfortable and partly cloudy
and the winters are frigid, snowy, and overcast. Over the course of the year, the temperature typically varies from -22 °C to 23
°C and is rarely below -35 °C or above 29 °C. The winter months can experience significant snowfall, and a mixture of
rain and snowfall is commonly experienced during the spring and fall. Average monthly temperature and precipitation are presented in
Figure 4-1. Operations are conducted year-round.
SGO is a remote site, and as such there are minimal local resources.
All resources required for site operations need to be trucked in during a limited winter road season. Personnel and some consumables are
flown into the operation on a year-round basis. SSR employs a workforce of approximately 415 employees who work on rotating schedules
at the SGO.
| | 4-1 | |
| SSR Mining Inc. | Seabee Gold Operation S-K 1300 Report | February 12, 2024 SLR Project No.: 138.21581.00005 |
Figure 4-1: Average Annual
Temperature and Precipitation Fluctuations in La Ronde, Saskatchewan
Source: WeatherSpark website, 2023
| | 4-2 | |
| SSR Mining Inc. | Seabee Gold Operation S-K 1300 Report | February 12, 2024 SLR Project No.: 138.21581.00005 |
The SGO is comprised of the following main facilities:
| · | Underground mines Seabee and Santoy. Seabee with associated shaft, headframe, and ventilation raises. Santoy with associated portal,
ramps, and ventilation raises. |
| · | Powerhouse and electrical distribution system including a 138 kV hydroelectric transmission line from Island Falls through which
the provincial power authority, the Saskatchewan Power Corporation, supplies electrical power to the site. |
| · | Roads and airstrip, and winter road portages. |
| · | Mill and administrative buildings and related services facilities including maintenance and truck shops, assay laboratory, crushing
plant, shops and storage buildings, and miscellaneous infrastructure. |
| · | Utilities including a potable water system, sewage disposal, fuel and explosives storage. |
| · | Water supply and distribution, and water management ponds. |
| · | Tailings management facility. |
A detailed description of infrastructure in provided in Section 15.
The site is relatively flat, with much of the area comprised of irregular,
hummocky, rocky exposures. Low areas between hummocks that may have 5 m to 9 m of relief is commonly filled with pockets of
glacial till, and occasionally with muskeg. Overburden soils are thin in this area, and often the rock outcrops are exposed.
The site is vegetated with a mixture of deciduous and coniferous trees
and shrubs typical of a boreal forest. The area has been glacially scoured and is comprised of rocky, ice moulded ridges separated by
lakes or muskeg filled depressions. Local relief in the surrounding area can be high, with the shoreline rising sharply to an elevation
of 15 m to 20 m above the lake surface.
| | 4-3 | |
| SSR Mining Inc. | Seabee Gold Operation S-K 1300 Report | February 12, 2024 SLR Project No.: 138.21581.00005 |
| 5.1 | Ownership, Exploration, and Development History |
Table 5-1 summarizes the ownership, exploration, and development
history for the SGO. Details of exploration programs carried out prior to SSR’s acquisition of the property in 2016 are provided
in subsection 5.2.
Table 5-1: SGO Ownership, Exploration,
and Development History
| Activity Period |
Activity |
| 1947 – 1950 |
First gold discovery by prospectors working on behalf of Cominco Inc. (Cominco), who subsequently performed extensive prospecting, geological mapping, trenching, and diamond drilling program. |
| 1958 -1983 |
1958: Cominco acquires 10 quartz mining leases covering the property
on which the SGO is located.
1974-1983: Cominco conducts detailed drilling and exploration before
selling the property to BEC International Corporation (BEC) in 1983. |
| 1985 – 1988 |
BEC sells property to Claude Resources.
Claude Resources options the property to Placer Development Limited
(subsequently Placer Dome Inc. (Placer)).
Placer conducts extensive exploration (mapping, trenching, stripping,
geophysical, environmental and metallurgical studies) before allowing their option to expire and the property is returned to Claude Resources
in 1988. |
| 1988 – 1990 |
Claude Resources reviewed work completed by Placer and completed bulk
sampling and drilling as part of a Feasibility Study for the Seabee deposit.
Mineral reserves were estimated in 1988 followed by a positive Feasibility
Study in 1989, a revised study, and a production decision in 1990. |
| 1991 |
Mill construction was completed, and mining began. |
| 1998 - 2016 |
Discovery of Porky West zone (2002); Santoy 7 deposit (2004); Santoy
8 and Santoy 8 East deposits (2005); Santoy Gap deposit (2010).
Bulk sample at Porky West deposit commenced (2005).
Commercial production at Santoy 7 (2007).
Portal construction and surface infrastructure development of the Santoy
Mine; Porky West bulk sample complete (2009).
Santoy 7 production ended (2009).
Environmental studies and permitting for commercial mining of the Santoy
8 and Santoy 8 East deposits (2010).
Commercial production at Santoy Mine (2011).
Discovery of the Santoy 9 Veins (2012). |
| 2016 |
SSR acquired Claude Resources and the SGO.
SSR entered into Option Agreement with Eagle Plains. |
| 2022 |
Addition of Fisher property through acquisition of Taiga Gold Corp. |
| | 5-1 | |
| SSR Mining Inc. | Seabee Gold Operation S-K 1300 Report | February 12, 2024 SLR Project No.: 138.21581.00005 |
| 5.2 | Historical Surface Exploration |
Historically, several rock and soil sampling programs have been executed
on the SGO property (Figure 5-1 and Figure 5-2).
Placer collected over 1,200 surface rock samples and nearly 7,000 soil
samples between 1985 and 1988. The majority of samples were collected from the western portion of the property in the vicinity of Laonil
Lake and Pine Lake, and proximal to and north of Porky Lake. Sample spacing was approximately every 20 m to 25 m on 100 m spaced
lines.
Claude Resources collected nearly 2,000 surface rock samples and over
7,000 soil samples between 1990 and 2013. Soil samples were primarily collected from the western portion of the property, with additional
samples collected in the south-central portion of the property and in the Santoy area. Sample spacing was planned every 20 m to 25 m
on 100 m spaced lines. In 1990, rock samples were largely collected around the Laonil Lake, Porky Lake, and Pine Lake areas, after
which time the focus of exploration shifted to the Santoy area and samples were collected from the southeastern portion of the SGO property.
Soil and rock sampling programs have continued at SGO to present, including tight soil grids with spacing planned every 5 m to 10 m on
25 m spaced lines over parts of the SMC. Overall, the SGO is covered by more than 30,000 soil samples and over 4,000 rock samples.
| | 5-2 | |
| SSR Mining Inc. | Seabee Gold Operation S-K 1300 Report | February 12, 2024 SLR Project No.: 138.21581.00005 |
Figure 5-1: Historical Rock
Samples Collected at the SGO
SSR Mining Corp.
Seabee Gold Operation
Saskatchewan, Canada
Historical Rock Samples
Collected at the SGO
| | 5-3 | |
| SSR Mining Inc. | Seabee Gold Operation S-K 1300 Report | February 12, 2024 SLR Project No.: 138.21581.00005 |
Figure 5-2: Historical Soil
Samples Collected at the SGO
SSR Mining Corp.
Seabee Gold Operation
Saskatchewan, Canada
Historical Soil Samples
Collected at the SGO
| | 5-4 | |
| SSR Mining Inc. | Seabee Gold Operation S-K 1300 Report | February 12, 2024 SLR Project No.: 138.21581.00005 |
| 5.2.2.1 | Fixed Wing Aeromagnetic Survey 2007 |
Goldak performed an aeromagnetic survey over the SGO property on behalf
of Claude Resources from February 25 to March 15, 2007 (Goldak, 2007). North–south traverse lines were flown with 100 m
spacing and a control line separation of 1,000 m, totalling 2,284 line kilometres of high-resolution magnetic data collected. Nominal
terrain clearance was 80 m above ground level.
In 2009, SRK reviewed the aeromagnetic survey to make an integrated
interpretation with the addition of using published literature, regional mapping data, and drilling data. The following recommendations
were made regarding regional targeting:
| · | Regional deformation corridors have high prospectivity for gold, as structural complexity in the region over time has enhanced permeability. |
| · | Key locations for gold mineralization can be identified by understanding the kinematics active during gold mineralization in combination
with the interpreted fault geometry: |
| o | Dilational jogs along D2 and D3 shear zones: shallower dipping segments of D2 and D3 reverse shear zones (similar setting to Santoy 7),
left steps along D3 sinistral shear zones, and right steps along D3 dextral shear zones. |
| o | Fault intersections (i.e., deformation corridors). |
| · | Additional parameters that enhance gold mineralization in the Seabee area include: |
| o | High competency contrast (i.e., variations in lithology). |
| o | Presence of multiple intrusions exploiting similar structural pathways as potential hydrothermal fluids. |
| o | Proximity to the Pine Lake conglomerates, a structurally bound conglomerate package similar to the Abitibi Timiskaming conglomerates. |
| 5.2.2.2 | Titan-24 DC/IP and MT Survey 2010 |
In early 2010, Quantec Geoscience Ltd. (Quantec) was commissioned to
perform a Titan-24 direct current/induced polarization (DC/IP) and audio-magnetotelluric ground geophysical survey over the Santoy area
on behalf of Claude Resources. The Titan-24 DC/IP data were inverted to produce cross sections of the resistivity and chargeability variations
along four survey lines. In its standard configuration, the Titan-24 surveys typically image DC/IP to 500 m to 750 m in sub-vertical
tabular geological settings, and up to 50% more for sub-horizontal geological settings. Audio-magnetotelluric inversion depth is generally
limited to approximately half the length of the survey line or profile.
Quantec (2013) made the following observations and interpretations based
on the 2010 survey results:
| · | Based on common features observed in the four lines, both the chargeability and resistivity showed weak to strong chargeability responses
and low to high resistivity distribution. |
| | 5-5 | |
| SSR Mining Inc. | Seabee Gold Operation S-K 1300 Report | February 12, 2024 SLR Project No.: 138.21581.00005 |
| · | Low chargeability responses were generally observed from near surface to approximately 100 m depth and associated with the conductive
cap. The northeastern part of the lines represents high chargeability from near surface to a greater depth than the rest of the grid and
may be associated with a geological contact and/or fault zone. |
| · | Below the low chargeability top layer, the central part of the grid shows moderate chargeability associated with high resistivity
potentially consisting of the mineralization of interest. Drilling data provided by Claude Resources confirmed the presence of gold traces
related to moderate chargeability. The change in chargeability between the northeast and central areas may describe the alteration zone
related to gold mineralization. |
| · | The geological setting of the region giving rise to a variety of geophysical responses for possible mineralization, and the inversion
results of the DC/IP and audio-magnetotelluric models along with drilling data, confirmed that the gold deposit in this area is structurally
controlled and dominated at gradient zones. |
The SGO has produced over 1.7 Moz of gold since production began
in 1991. A summary of the production history of the SGO since 1996 is presented in Table 5-2.
Table 5-2: Historical Production
from the SGO (1996–2022)
| Year |
Milled Ore |
Recovery
(%) |
Gold Produced
(oz) |
| ktpa |
tpd |
Grade
(Au g/t) |
| 1996 |
194 |
531 |
6.45 |
|
36,709 |
| 1997 |
211 |
579 |
9.36 |
92.2 |
58,467 |
| 1998 |
225 |
615 |
9.27 |
92.6 |
60,200 |
| 1999 |
245 |
672 |
7.30 |
92.3 |
54,100 |
| 2000 |
238 |
651 |
8.58 |
87.9 |
58,300 |
| 2001 |
275 |
753 |
6.13 |
88.8 |
46,300 |
| 2002 |
202 |
553 |
6.59 |
93.7 |
41,500 |
| 2003 |
209 |
572 |
7.95 |
94.7 |
50,800 |
| 2004 |
187 |
512 |
7.15 |
95.2 |
41,200 |
| 2005 |
236 |
648 |
6.32 |
92.9 |
42,200 |
| 2006 |
246 |
674 |
6.16 |
93.6 |
46,300 |
| 2007 |
228 |
624 |
6.35 |
95.4 |
44,323 |
| 2008 |
228 |
626 |
6.46 |
95.8 |
45,466 |
| 2009 |
248 |
678 |
6.17 |
95.3 |
46,827 |
| 2010 |
204 |
559 |
7.55 |
95.5 |
47,270 |
| 2011 |
257 |
705 |
5.68 |
95.3 |
44,750 |
| | 5-6 | |
| SSR Mining Inc. | Seabee Gold Operation S-K 1300 Report | February 12, 2024 SLR Project No.: 138.21581.00005 |
| Year |
Milled Ore |
Recovery
(%) |
Gold Produced
(oz) |
| ktpa |
tpd |
Grade
(Au g/t) |
| 2012 |
275 |
754 |
5.86 |
95.6 |
44,756 |
| 2013 |
280 |
767 |
5.11 |
95.3 |
43,850 |
| 2014 |
280 |
766 |
7.32 |
95.7 |
62,984 |
| 2015 |
277 |
760 |
8.82 |
96.3 |
75,748 |
| 2016 |
313 |
857 |
7.91 |
96.6 |
80,351 |
| 2017 |
330 |
967 |
8.25 |
97.4 |
83,998 |
| 2018 |
352 |
1,125 |
9.16 |
97.4 |
95,602 |
| 2019 |
344 |
1,087 |
9.56 |
98.2 |
112,137 |
| 2020 |
255 |
1,163 |
10.10 |
98.4 |
81,686 |
| 2021 |
382 |
1,180 |
9.92 |
98.4 |
118,888 |
| 2022 |
414 |
1,133 |
10.36 |
98.0 |
136,125 |
| 2023 |
445 |
1,220 |
6.61 |
96.7 |
90,777 |
| | 5-7 | |
| SSR Mining Inc. | Seabee Gold Operation S-K 1300 Report | February 12, 2024 SLR Project No.: 138.21581.00005 |
| 6.0 | Geological Setting, Mineralization, and Deposit |
Northern Saskatchewan forms part of the Churchill Province of the Canadian
Shield and has been subdivided into a series of litho-structural crustal units. The SGO is located within the Glennie domain of the Proterozoic
Trans-Hudson Orogen (Figure 6-1).
The Trans-Hudson Orogen marks the collisional suture zone between the
Archean Rae-Hearne, Sask, and Superior cratons formed during the closure of the Manikewan ocean (Stauffer 1984) and is divided into two
distinct zones: 1) the Cree Lake Zone, and 2) the Reindeer Zone.
The Cree Lake Zone is composed of early Proterozoic continental shelf
sedimentary rocks that overlie Archean rocks of the Hearne Province. The Reindeer Zone consists of mid-oceanic ridge basalts, oceanic
island-arc basalts, inter-arc volcanogenic sedimentary rocks, and molasse-type sedimentary rocks. Plutonic rocks of various composition
and age intrude both successions.
The Reindeer Zone is subdivided into litho-tectonic domains based on
similarities of lithology, metamorphic grade, and structure (Lewry and Sibbald 1977). The Glennie domain is characterized by arcuate belts
of Lower Proterozoic supracrustal rocks separated by granitoid gneisses and granitoid intrusions (Macdonald, 1987). It is bounded on the
west by the north–northeast trending Stanley shear zone and on the east by the north–south trending Tabbernor fault zone.
Lewry et al. (1990) interpreted the Reindeer Zone as a folded stack
of nappes and thrust complexes separated by ductile mylonitic zones, emplaced during the terminal collision of the Trans-Hudson Orogen.
The interpretation was based in part on the presence of Archean windows within the Glennie domain and neighbouring Hanson Lake block (Bell
and Macdonald, 1982; Chiarenzelli et al., 1987; Craig, 1989) suggesting that the Glennie domain is underlain in part by Archean rocks
(Lewry et al., 1990; Bickford et al., 1990). Extensive seismic geophysical studies (White et al., 1994) and samarium-neodymium systematics
(Chauvel et al., 1987) support the interpretation.
| | 6-1 | |
| SSR Mining Inc. | Seabee Gold Operation S-K 1300 Report | February 12, 2024 SLR Project No.: 138.21581.00005 |
Figure 6-1: Regional Geology
of the Southwestern Trans-Hudson Orogen
SSR Mining Corp.
Seabee Gold Operation
Saskatchewan, Canada
Regional Geology of
the South Western Trans Hudson Oregon
| | 6-2 | |
| SSR Mining Inc. | Seabee Gold Operation S-K 1300 Report | February 12, 2024 SLR Project No.: 138.21581.00005 |
The SGO is located in the northwestern portion of the Pine Lake
greenstone belt (PLGB) in the Glennie domain. The PLGB comprises a variety of geochemically distinct ca. 1890 Ma to 1860 Ma tholeiitic
mafic volcanic, intrusive, associated sedimentary rocks and felsic to intermediate intrusive rocks formed in juvenile island arc and back
arc settings assigned to Assemblage A (Figure 6-2 and Figure 6-3). Assemblage A is unconformably overlain by the Pine Lake conglomerate
which forms the base of Assemblage B. Siliciclastic rocks of Assemblage B become interlayered with felsic to intermediate volcanic rocks
up section that have been dated at ca. 1838 Ma. The Porky Lake Group (Assemblage C) occupies the core of the Ray Lake synform, located
in the northwestern portion of the PLGB, and is interpreted to unconformably overlie Assemblages A and B (Delaney, 1992), though the contact
has been strongly reworked by subsequent deformation. Metamorphic grade across the Pine Lake greenstone belt ranges from upper greenschist
to upper amphibolite facies. The belt has been complexly folded by at least four major phases of deformation.
Gold deposits in the SGO can be broadly assigned to three main geological
domains (Figure 6-2):
| · | Santoy Mine Complex (SMC): The SMC is hosted in a sequence of Assemblage A mafic volcano-sedimentary rocks variably intruded by ca.
1875 Ma granodioritic rocks along an approximately 15 km roughly north–south trending sinistral to sinistral-reverse shear zone.
The SMC occurs in an approximately 3 km long interpreted dilatant jog along this structure and is spatially associated with the ca. 1875
Ma Lizard Lake pluton. |
| · | Laonil Lake Intrusive Complex: The historical Seabee and 5-1 mines occur along a series of conjugate shear zones within a coarsely
layered ultramafic to mafic intrusion dominated by medium-grained, mesocratic gabbro. |
| · | Porky: The Porky deposit area is a mineralized trend located near the nose of the Ray Lake synform, a 12 km long tightly folded
and sheared contact separating siliciclastic rocks of the Porky Lake Group to the north from volcanic rocks to the south. |
| | 6-3 | |
| SSR Mining Inc. | Seabee Gold Operation S-K 1300 Report | February 12, 2024 SLR Project No.: 138.21581.00005 |
Figure 6-2: Local Geological
Setting
SSR Mining Corp.
Seabee Gold Operation
Saskatchewan, Canada
Local Geological Setting
| | 6-4 | |
| SSR Mining Inc. | Seabee Gold Operation S-K 1300 Report | February 12, 2024 SLR Project No.: 138.21581.00005 |
Figure 6-3: Simplified Stratigraphic
Column of the Pine Lake Greenstone Belt
SSR Mining Corp.
Seabee Gold Operation
Saskatchewan, Canada
Simplified Stratigraphic
Column of the Pine Lake Greenstone Belt
| | 6-5 | |
| SSR Mining Inc. | Seabee Gold Operation S-K 1300 Report | February 12, 2024 SLR Project No.: 138.21581.00005 |
Coeval folding and thrusting during a protracted period of progressive
deformation associated with the collision and amalgamation of several Archean continental fragments resulted in four major phases of deformation
on the SGO property that are characterized as follows (SRK 2009):
| · | D1 (approximately 1,870 Ma to 1,845 Ma): Development of gneissic foliation and intrafolial folds associated with amalgamation
of the Glennie and Flin Flon domains. |
| · | D2 (approximately 1,845 Ma to 1,830 Ma): South directed thrusting and roughly east–west folding associated with the collision
of the Reindeer Zone and Sask craton. |
| · | D3 (approximately 1,830 Ma to 1,800 Ma): West directed thrusting associated with north–northwest trending folding and transposition,
and strike-slip reactivation of D2 shear zones controlled by the collision of the Superior and Sask cratons. Peak amphibolite grade metamorphism
was reached at approximately 1,810 Ma. |
| · | D4 (approximately 1,830 Ma): Re-folding of D3 folds into regional type 1 and type 2 interference patterns associated with the
final formation of the Trans-Hudson Orogen. |
SRK (2009) generated an integrated interpretation using published literature,
regional mapping data, drilling data, and geophysical data that was collected during Goldak Airborne Surveys’ (Goldak) 2007 (Goldak
2007) aeromagnetic survey over the SGO (see Section 7.1.2.1). The following observations were made:
| · | Minor D1 faults trend north–south in the southwest corner of the interpretation area; gneissic foliation and intrafolial folds
cannot be observed on the scale of interpretation. D1 faults are present where a narrow strip of Pine Lake greenstone is interpreted to
make the boundary between the Laonil Lake intrusive complex to the east and granodiorite units to the west. Any larger scale D1 features
have been overprinted by subsequent deformation events. |
| · | Regional north–south compression during D2 focussed on main deformation corridors and lithological contacts in the Laonil Lake
intrusive complex. The Porky Lake metasedimentary belt was emplaced as late-stage southward thrust sheet(s) on the Pine Lake greenstone
belt: |
| o | Early-D2 gold mineralization in the Seabee deposit is hosted in isoclinally folded quartz veins within D2 reverse shear zones that
were reactivated as dextral shear zones during D3. Mapped veins appear offset by late-D2 structures that are sub-parallel to the Eyahpaise
Lake pluton intrusive margin (1,859 Ma), suggesting that gold emplacement commenced prior to 1,859 Ma. |
| o | Late-D2 gold mineralization in the Porky deposits are associated with the development of a south verging thrust fault which formed
late in the D2 phase when the Porky Lake metasedimentary belt was emplaced on the Pine Lake greenstone belt. The hosting fault was subsequently
folded along a north–south axis, the Ray Lake synform, during D3 deformation. |
| | 6-6 | |
| SSR Mining Inc. | Seabee Gold Operation S-K 1300 Report | February 12, 2024 SLR Project No.: 138.21581.00005 |
Figure 6-4: Integrated Structural
Analysis of the SGO by SRK (2009) Based on Goldak’s 2007 Aeromagnetic Survey
SSR Mining Corp.
Seabee Gold Operation
Saskatchewan, Canada
Integrated Structural
Analysis of the SGO by SRK (2009) Based on Goldak’s 2007 Aeromagnetic Survey
| | 6-7 | |
| SSR Mining Inc. | Seabee Gold Operation S-K 1300 Report | February 12, 2024 SLR Project No.: 138.21581.00005 |
| · | East–west compression during D3 reactivated deformation corridors and D2 structures in the Laonil Lake intrusive complex. Dextral
kinematics were observed on west–southwest components, and sinistral kinematics were observed on all other components. Sinistral
strike-slip shear zones observed in the central domain of the interpretation area, and north to northwest trending oblique-slip shear
zones and folds in the eastern and western domains of the interpretation area. D3 folding affects D2 thrust faults (i.e., Ray Lake synform): |
| o | Gold mineralization in the Santoy deposits are associated with north–northwest trending D3 reverse and sinistral-reverse shear
zones. It is possible that the deposits are controlled by fault intersections, enhancing permeability. |
Gold mineralization at the SMC is hosted within the Santoy Shear Zone
(SSZ); a kilometer scale shear zone with a roughly north-south strike that dips moderately to steeply to the east. Economic concentrations
of gold occur in two main settings within this structure. The first, and historically most significant source of ore, is within dilatant
portions of the SSZ. Mineralization in this setting is typified by diopside-albite +/- titanite altered, variably deformed, mafic volcanic
rocks with sheeted and massive quartz veining up to 30 m wide with 2% to 10% sulphides (pyrite > pyrrhotite> chalcopyrite) +/- coarse
visible gold. This style of mineralization is the dominant style of the Santoy 7, 8A/B, and 9 Veins. The second setting for gold mineralization
in the SMC is within apophyses, and along the margin, of the Lizard Lake Pluton (LLP), which is a granodiorite intrusion deformed by the
SSZ. Mineralization in this setting follows foliation parallel fracturing and, most significantly, the plunge of axial traces of secondary
folding where competency contrast during deformation allowed for the formation of larger scale (1 m to 10 m) fracture networks to trap
mineralizing fluids. Significant mineralization within the LLP is typified by highly silicified, variably albite altered and quartz veined
granodiorite with 2% to 5% sulphides (pyrrhotite > pyrite > chalcopyrite). A greenish hue, interpreted to be an alteration of albite,
tends to accompany the highest gold grades in this mineralization setting. This mineralization is typical of the GHW, SHW, and Santoy
8F mineralization.
Gold mineralization at the Porky deposits occurs along the western margin
of the Ray Lake synform within a kilometre scale shear zone, the Pine Lake Shear Zone (PLSZ), that strikes east-southeast and dips moderately
to the south. Gold mineralization at the Porky deposits is hosted in two distinct settings. The gold mineralization of greatest economic
significance is hosted in 2 m to 20 m wide sheeted quartz veins with 2% to 10% sulphides +/- coarse visible gold (arsenopyrite > pyrite
> pyrrhotite > chalcopyrite) within the metasedimentary rocks of the Porky Lake Group either immediately at the contact with the
mafic volcanics above or, more prominently, footwall to a conglomerate unit usually 20 m to 60 m from the mafic-sediment contact. The
best developed veining appears to correlate with the intersection of the axial planes of large (hundreds of metres) scale folding within
the Porky Lake Group and the PLSZ. The second setting for gold mineralization is within broad (5 m to 60 m wide) intervals of deformed,
calc-silicate altered, and locally sulphide rich (5% to 20% sulphide; pyrrhotite > pyrite > chalcopyrite +/- arsenopyrite and visible
gold) mafic volcanic rocks. This setting tends to exhibit a lower gold grade than the veining internal to the sediments.
Gold mineralization in the now-closed Seabee Mine occurs in sub-vertical,
roughly east-west striking, interconnected shear structures internal to a mixed unit of gabbro and quartz-feldspar dikes named the Laonil
Lake intrusive complex. Gold mineralization is hosted dominantly in quartz veining with 2% to 7% sulphide (pyrite > pyrrhotite >
chalcopyrite) +/- tourmaline, carbonate, and coarse visible gold. While the Seabee Mine is now closed, a number of sub-parallel structures
to the ones which hosted the former mine have indications of economic mineralization in historic sampling.
| | 6-8 | |
| SSR Mining Inc. | Seabee Gold Operation S-K 1300 Report | February 12, 2024 SLR Project No.: 138.21581.00005 |
Table 6-1 summarizes the key stratigraphic and structural elements
controlling the mineralization at each of the SGO deposits.
Table 6-1: Key Stratigraphic
and Structural Elements Controlling Mineralisation at the Seabee, Santoy, and Porky Deposits
| Area |
Zone Name |
Mineralization Setting |
Host Rock |
Strike Length
(m) |
Vertical Extent
(m) |
Thickness
(m) |
Strike |
Dip |
| Seabee |
L62 |
Quartz-tourmaline veins in shear zones |
Laonil Lake Intrusive Complex gabbro |
150 |
700 |
1–11 |
E |
Sub-Vertical |
| 2 Vein |
Quartz-tourmaline veins in shear zones |
Laonil Lake Intrusive Complex gabbro |
1,800 |
1,400 |
2–7 |
ENE |
Sub-Vertical |
| 5-1 Shear |
Quartz-tourmaline veins in shear zones |
Laonil Lake Intrusive Complex gabbro |
800 |
1,100 |
1–11 |
ENE |
Sub-Vertical |
| Santoy |
Zone 7 |
Quartz veins in diopside-albite (calc- silicate) altered shear zones |
Mafic metavolcanic rocks and lesser dioritic to granodioritic sills |
330 |
120 |
2–10 |
N |
Moderate to flat |
| Zone 8 |
Quartz veins in diopside-albite (calc-silicate) altered shear zones |
Mafic metavolcanic rocks and lesser dioritic to granodioritic sills |
600 |
500 |
2.5–7 |
NW |
Moderate |
| Zone 8 East |
Quartz veins and flooding in sheared and isoclinally folded granodiorite |
Granodiorite stock in fold nose near hanging wall contact with mafic metavolcanic rocks |
200 |
250 |
1.5–15 |
NNW |
Moderate to flat |
| Zone 9 |
Quartz veins in diopside-albite (calc-silicate) altered shear zones |
Mafic metavolcanic rocks and lesser dioritic to granodioritic sills |
650 |
650 |
2–30 |
NW |
Moderate |
| | 6-9 | |
| SSR Mining Inc. | Seabee Gold Operation S-K 1300 Report | February 12, 2024 SLR Project No.: 138.21581.00005 |
| Area |
Zone Name |
Mineralization Setting |
Host Rock |
Strike Length
(m) |
Vertical Extent
(m) |
Thickness
(m) |
Strike |
Dip |
| |
Gap Hanging Wall |
Quartz veins in folded granodiorite intrusion |
Lizard Lake Pluton |
200 |
800 |
1–20 |
EW |
Moderate to low |
| |
Santoy Hanging Wall |
Quartz veins in folded granodiorite intrusion |
Lizard Lake Pluton |
400 |
600 |
1–10 |
S |
Moderate to steep |
| Porky |
Porky Main |
Quartz veins in diopside-chlorite- actinolite (calc-silicate) altered shear zones |
Mafic metavolcanic rocks and to a lesser extent arenaceous sedimentary rocks of the Porky Lake Group. |
280 |
180 |
1–4 |
SSE |
Moderate to steep |
| Porky West |
Quartz veins in silicified calc-silicate altered shear zones |
Arenaceous sedimentary rocks of the Porky Lake Group. |
1,300 |
500 |
1.5–20 |
ESE |
Moderate |
Source: SSR, 2017b.
Figure 6-5 to Figure 6-8 show typical cross sections of the mineralization
lenses and lithologies of the Santoy Mine and Porky West deposits.
| | 6-10 | |
| SSR Mining Inc. | Seabee Gold Operation S-K 1300 Report | February 12, 2024 SLR Project No.: 138.21581.00005 |
Figure 6-5: Representative Cross
Section of Mineralization at Santoy 8
| | 6-11 | |
| SSR Mining Inc. | Seabee Gold Operation S-K 1300 Report | February 12, 2024 SLR Project No.: 138.21581.00005 |
Figure 6-6: Representative Cross
Section of Mineralization at Santoy 9
| | 6-12 | |
| SSR Mining Inc. | Seabee Gold Operation S-K 1300 Report | February 12, 2024 SLR Project No.: 138.21581.00005 |
Figure 6-7: Representative Cross
Section of Mineralization at Gap Hanging Wall
| | 6-13 | |
| SSR Mining Inc. | Seabee Gold Operation S-K 1300 Report | February 12, 2024 SLR Project No.: 138.21581.00005 |
Figure 6-8: Representative Cross
Section of Mineralization at Porky West
| | 6-14 | |
| SSR Mining Inc. | Seabee Gold Operation S-K 1300 Report | February 12, 2024 SLR Project No.: 138.21581.00005 |
The SGO hosts orogenic, quartz-vein hosted lode gold deposits developed
in major brittle-ductile to ductile shear systems. The gold mineralization throughout the SGO exhibits complex geometrical patterns attributed
to a combination of structural and/or lithological controls.
Mesothermal gold deposits typically emplaced as a system of en echelon
veins, forming tabular veins in competent host rock lithologies, or as stockwork veinlets and stringers in less competent host rock lithologies.
Lower grade bulk-tonnage style mineralization with gold associated with disseminated sulphides may develop in areas peripheral to quartz
veins. Orogenic gold deposits can also be related to broad areas of fracturing, where gold and sulphides are associated with quartz veinlet
networks. The quartz veins are typically in sharp contact with the wallrock and can display a variety of textures including massive, ribboned
or banded, and stockworks with anastomosing gashes and dilations, which may subsequently be altered or destroyed during deformation. Gold-quartz
veins are found within zones of intense and pervasive carbonate alteration along faults proximal to trans crustal breaks, and often occur
at a high angle to the primary collisional fault zone. They are commonly associated with late syn-collisional, structurally controlled
intermediate to felsic magmatism, with economic deposits generally hosted by large competent units, such as intrusions or blocks of obducted
oceanic crust (Ash and Alldrick, 1996).
Delaney (1992) suggested that lithological heterogeneities between feldspar
porphyry dikes and gabbros of the Laonil Lake intrusive complex are responsible for the localization and propagation of the shear zone.
At Seabee, the structures trend between 045° and 085°, and dip north near vertically. Three discrete subsets of structures have
been recognized trending at 070°, 085°, and 045°, with the 070° structures containing the auriferous veins. At Santoy,
the structures trend between 340° to 315°, and dip moderately to the east. Vein geometry within the shear zones is commonly a
combination of ‘S’ and ‘Z’ oblique and extensional types, and second order or Riedel shears.
High gold grades occur at the intersection of the primary ‘S’
shears with subordinate shear structures and/or where potassic altered diorite dikes have intruded the Laonil Lake gabbro prior to strain
occurrence. It is probable that secondary dikes introduced additional gold to the system, which was later remobilized under strain conditions.
Exploration at SGO is guided by applying techniques consistent with identification and discovery of other quartz-vein lode gold systems.
Airborne magnetic data is used in surface exploration to identify structural corridors and asymmetrical features, folds and target areas
that are known to host gold on the property. This geophysical data is used in conjunction with regional and detailed geological mapping
to identify major zones of shearing and alteration, of which calc-silicate alteration has proven to be the most prospective variety on
the SGO property.
Geochemical soil sampling is also used as a regional exploration technique
to identify gold and trace element vectors associated with Seabee-style gold mineralization and has successfully identified gold mineralization
at various locations across the property. Once targets have been delineated by the above exploration methods, diamond drilling at wide
spacing is used to test the structural systems to allow for SSR’s minimum threshold deposit size to be identified based on observed
local grade. The SLR QPs considers the geology and characteristics of gold mineralization at the Santoy 8 and 9 and Porky West Projects
are well understood while the GHW-SHW Project requires more analysis to fully understand its complexity.
| | 6-15 | |
| SSR Mining Inc. | Seabee Gold Operation S-K 1300 Report | February 12, 2024 SLR Project No.: 138.21581.00005 |
Upon its acquisition of SGO, SSR undertook a review of all exploration
activities conducted on the property by previous operators. An exploration program was subsequently undertaken, including detailed mapping
of the Herb West and Santoy Lake areas, as well as the collection of accompanying soil samples to be submitted for gold assay. Limited
anomalous occurrences were identified from grab and soil sample results, and no new showings or gold in soil trends were recognized. SSR
plans to map additional regions to the north and east within the Herb Lake area as additional shear zones are targeted.
In the Santoy Lake area, mapping extended from Santoy Lake to the west
end of the Santoy Mine. Soil sampling conducted over the same area resulted in the collection of 501 samples taken every 25 m on
lines spaced 200 m apart. No anomalous trends of significance were identified. However, SSR has planned further exploration in prospective
areas east and west of the 2016 exploration program area.
| 7.1.2.1 | Airborne Magnetic and Radiometric Survey 2016 |
SSR contracted Precision GeoSurveys Inc. (Precision) to complete a high
resolution airborne magnetic and radiometric survey over the most recently staked portion of the SGO land package from August 30 to September
4, 2016 (Precision 2016). The survey block covered an area of 22.9 km x 15.0 km and included 150 survey lines and
25 tie lines that totalled 1,815 line kilometres. Survey lines were spaced 100 m in an east–west orientation and tie lines
were spaced 1,000 m in a north–south orientation. Nominal terrain clearance was specified at 75 m.
Selected anomalies were re-flown for confirmation, specifically those
found on a single flight line. Lines to be re-flown were a minimum of 2,000 m long, so that survey line re-flights crossed at least
two tie lines and tie line re-flights crossed at least five survey lines.
Survey overview maps (flight lines and digital terrain model), magnetic
maps (total magnetic intensity, residual magnetic intensity, and calculated vertical gradient of the residual magnetic intensity), and
radiometric maps were produced by Precision, with the objective of identifying potential new targets for gold mineralization on the Seabee
property.
The magnetic data was collected to better observe the structural nature
of the underlying bedrock and, where possible, determine major breaks in the regional stratigraphy along which shear zones can propagate,
and the radiometric data was used to determine the relative amounts of uranium, thorium and potassium in the surficial rocks and soils
to be used for the mapping of bedrock lithology, alteration and structure. The resultant data were found to be consistent with the structure
of the bedrock and major lithological breaks previously interpreted by geological mapping, air photo interpretation and drilling. The
data was also consistent with the two-dimensional structural architecture and intensity of previously flown surveys within juxtaposed
survey blocks.
| | 7-1 | |
| SSR Mining Inc. | Seabee Gold Operation S-K 1300 Report | February 12, 2024 SLR Project No.: 138.21581.00005 |
Prior to SSR’s acquisition of the SGO, and as of December 31,
2015, a total of 2,037 surface drill holes totalling approximately 389,281 m and 4,818 underground holes totalling approximately
861,514 m had been completed on the property.
As of December 31, 2023, SSR has drilled an additional 484 surface holes
totalling approximately 185,841 m and 1,553 underground holes totalling approximately 319,847 m since acquiring the property
from Claude Resources.
Table 7-1 summarizes the drilling completed on the SGO property
(excluding the Fisher and Truscott tenements). Figure 7-1 displays the surface holes completed on the property. Details regarding
the salient drill programs are discussed in greater detail in the subsections below.
| | 7-2 | |
| SSR Mining Inc. | Seabee Gold Operation S-K 1300 Report | February 12, 2024 SLR Project No.: 138.21581.00005 |
Table 7-1: Surface and Underground
Drilling Completed on the SGO to December 31, 2023
| Drilling Program |
Company |
No. Surface Drill Holes |
Surface Metres Drilled |
No. Underground Drill Holes |
Underground Metres Drilled |
Total Number of Drill Holes |
Total Metres |
| 1947–1988 |
Various (Cominco, Claude Resources, Placer) |
278 |
35,419 |
77 |
6,491 |
355 |
41,910 |
| 1989–2012 |
Claude Resources |
1,742 |
344,415 |
4,190 |
724,858 |
5,932 |
1,069,273 |
| 2013–2015 |
Claude Resources |
17 |
9,447 |
551 |
130,165 |
568 |
139,612 |
| 2016 |
Claude Resources/SSR |
51 |
19,817 |
306 |
65,021 |
357 |
84,838 |
| 2017 |
SSR |
14 |
10,506 |
159 |
61,179 |
173 |
71,685 |
| 2018 |
SSR |
83 |
24,389 |
229 |
52,500 |
312 |
76,889 |
| 2019 |
SSR |
44 |
16,888 |
174 |
51,278 |
218 |
68,166 |
| 2020 |
SSR |
21 |
9,638 |
177 |
30,040 |
198 |
39,678 |
| 2021 |
SSR |
74 |
25,678 |
276 |
39,652 |
350 |
65,330 |
| 2022 |
SSR |
93 |
41,257 |
294 |
37,710 |
387 |
78,967 |
| 2023 |
SSR |
155 |
57,485 |
267 |
49,748 |
422 |
107,233 |
| Total |
2,572 |
594,939 |
6,700 |
1,248,642 |
9,272 |
1,843,581 |
Note:
| 1. | Does not include drilling on the Fisher and Truscott exploration tenements. |
| | 7-3 | |
| SSR Mining Inc. | Seabee Gold Operation S-K 1300 Report | February 12, 2024 SLR Project No.: 138.21581.00005 |
Figure 7-11: SGO Surface Drilling,
and Other Known Gold Occurrences on the Property
SSR Mining Corp.
Seabee Gold Operation
Saskatchewan, Canada
SGO Surface Drilling,
and Other Known Gold Occurrences on the Property
| | 7-4 | |
| SSR Mining Inc. | Seabee Gold Operation S-K 1300 Report | February 12, 2024 SLR Project No.: 138.21581.00005 |
| 7.2.1 | Drilling by Previous Operators |
| 7.2.1.1 | Drilling by Cominco, Claude Resources, and Placer 1947–1988 |
Cominco identified four gold-bearing zones on the SGO property from
1947 through 1950, after drilling 79 holes totalling 4,414 m, and in 1961 drilled two shallow holes of 41 m as part of an overall
review of the known property data. In 1974, Cominco drill tested additional vein structures with 16 holes totalling 458 m, and commenced
further exploration from 1982 through 1983 during which time 20 holes were drilled totalling 3,776 m. This drill program was not
completed because Cominco sold the property in 1983.
Upon acquisition of the property, Claude Resources drilled three holes
totalling 226 m to corroborate Cominco’s work. Pursuant to an option agreement with Claude Resources, Placer executed an extensive
surface and underground drilling program from June 1985 to June 1988, during which a total of 95 surface holes and 72 underground holes
were completed. Placer determined that the property did not meet its criteria for development and returned the property to Claude Resources
in 1988.
| 7.2.1.2 | Drilling by Claude Resources 1989–2015 |
Seabee Area
After obtaining a 100% interest in the Currie Rose property from Currie
Rose Resources Inc. in 1994, which consisted of over 4,000 ha surrounding the Seabee Mine, Claude Resources conducted a drilling
program to test gold-bearing structures identified during a prospecting program in the previous year. The drill program consisted of 27
holes totalling 3,458 m. In 1996, definition drilling was carried out over the 10 zone, identified the previous year adjacent to
the western boundary of the Seabee Mine. A total of 23 holes were drilled for 2,567 m. Diamond drilling in 1997 explored the vein
extensions of the 10 vein and 2C vein structures with seven holes totalling 1,573 m. The 1999 drill program focused on an area
southwest of the Seabee Mine trend and consisted of 7,726 m drilled in 47 holes.
As a follow-up, the majority of holes drilled in 2000 were collared
to the west of ML 5520 in the Bird Lake area, to explore for mineralized structures parallel to the Seabee 2 vein. Targets in the Porky
Lake and Pine Lake areas were also tested. Six additional remote targets, namely the Scoop, Porky, Herb, Pine, East, and West Bird Lakes
were explored in 2001, with anomalous gold values encountered within variably sheared host rocks.
In 2002, drilling focused on a laterally extensive geochemical soil
anomaly on the west shore of Porky Lake, and on a series of quartz-bearing shear structures north and east of the No. 5 ramp access. The
drill program successfully discovered the Porky West zone and produced elevated gold values over narrow widths at the No. 5 ramp access.
Drilling in 2003 in the Porky area discovered the Porky West zone, an
arenite-hosted high grade gold lens. Subsequent drilling in 2004 focused on delineation drilling at the Porky Main and Porky West zones,
and exploration drilling on the eastern limb of the Porky Lake anticline targeted the contact between the mafic metavolcanics rocks and
feldspathic arenite.
A small diamond drill program was completed in 2009, which extended
the down plunge extent of the Porky West ore shoots.
| | 7-5 | |
| SSR Mining Inc. | Seabee Gold Operation S-K 1300 Report | February 12, 2024 SLR Project No.: 138.21581.00005 |
Evaluation of the Neptune target, located approximately 6 km north
of the Seabee Mine, was the focus of exploration in 2010, where drill testing included two holes. Exploration efforts in 2011 included
a further 28 drill holes to test the 1.8 km strike length of the soil anomaly to vertical depths of up to 250 m, and in 2012,
further drilling at the Neptune target confirmed the sporadic nature of the gold-bearing system.
Santoy Area
Prospecting and geological mapping in 1998 resulted in the discovery
of numerous new veins in the Santoy area. The targets were drill tested in 2002 with encouraging results and became the focus of additional
exploration programs leading to the discovery of the Santoy 7, Santoy 8, and Santoy 8 East deposits in 2004 and 2005. In 2004,
five holes totalling 598 m were drilled at Santoy 6, 48 holes totalling 6,164 m were drilled at Santoy 7, and 21 holes
totalling 2,797 m were drilled at Santoy 8. Drilling of the Santoy 8 and Santoy 8 East zones in 2005 was aimed at testing
the north–northwest plunge and dip extensions of the mineralized shear structures outlined in previous drill programs. Sixty-eight
holes totalling 15,296 m were drilled, with an additional 20 holes totalling 6,272 m drilled in the summer of 2005. Infill drilling
continued in 2007 to collect information for proposed mine plans with 25 m infill data to a depth of 250 m completed on the
Santoy 8 and Santoy 8 East deposits. A total of 31,670 m was drilled from 147 holes.
Exploration drilling in 2010 targeted the Santoy Gap area to test the
Santoy shear system between the Santoy 7 and Santoy 8 deposits, as well as to continue to investigate the down-plunge continuity of the
Santoy 8 and Santoy 8 East deposits. Results from the program outlined continuity at depth for both the Santoy 8 and Santoy 8 East deposit.
Drilling defined the Santoy deposit in 2011. Multiple high grade intervals
were intercepted, expanding the strike length and width of the known mineralization. During 2012, exploration focused on defining the
relationship between the Santoy and Santoy 8 deposits to depths up to 750 m. Infill and exploration drilling around the Santoy
lens and Santoy Shear Zone continued to confirm and expand the Santoy system, and also identified a sub-parallel lens approximately 150 m
of the east of the Santoy deposit.
In 2013, surface drilling programs targeted the down-plunge extension
of the Santoy and Santoy 8 deposits, resulting in two out of three step-out holes returning high grade gold intercepts. The Santoy system
was extended down plunge to 650 m depth and the Santoy 8 deposit was extended 400 m down plunge.
Underground drilling in 2014 focused on defining and expanding the Mineral
Reserve and Mineral Resource at the Santoy deposit. Results identified high grade and promising widths of gold mineralization hosted within
three vein systems, named the Santoy 9A, 9B, and 9C deposits. Additional underground drilling in 2015 focused on the expansion of
Mineral Reserve and Mineral Resource at the Santoy deposit, and a 6,000 m drill program targeted the plunge continuity of the Santoy 8
deposit. Results from the Santoy up-dip drilling demonstrated the potential for expansion of the deposit, and drilling results within,
down dip, and down plunge also increased confidence in the continuity of the deposit at depth.
| | 7-6 | |
| SSR Mining Inc. | Seabee Gold Operation S-K 1300 Report | February 12, 2024 SLR Project No.: 138.21581.00005 |
| 7.2.2 | Drilling by Current Operator 2016-2023 |
Drilling in 2016 by SSR and Claude Resources on the SGO property had
the objective of increasing and converting the Mineral Resource to Mineral Reserve.
An underground diamond drilling program to upgrade the Inferred Mineral
Resource and explore the extension of the Santoy 8A and Santoy deposits was completed by SSR. From surface, drilling was conducted
to upgrade the up-plunge extension of the Santoy 9A, 9B, and 9C deposits as well as to complete deeper infill drilling on the Santoy
8A Inferred Mineral Resource.
At the Seabee Mine, five holes were drilled on the 15 Vein target, an
offset mineralized structure along the 19 Shear. At the Carr target, located 4 km along strike to the north of the Santoy Mine, SSR
drilled nine holes over a 2 km strike length, totalling approximately 2,500 m. At the Herb West target, located 2.2 km
west–northwest of the Seabee Mine, four holes totalling approximately 1,130 m were completed. Results from drilling the above
targets revealed shear-hosted quartz-veining structures with gold-bearing sulphide mineralization and warranted follow-up drilling.
Drilling in 2017 from underground continued to focus primarily on the
definition and expansion of the resources on the Santoy 8 and 9 veins. During 2017, the first underground program designed to test
the GHW target was implemented. A limited surface program focused on defining the margins of the Santoy 8 and 9 veins that could
not be tested from underground. The exploration team drilled four surface holes attempting to locate the depth continuity of a variety
of targets in and proximal to the SMC without success.
Drilling in 2018 from underground continued to focus primarily on the
definition and expansion of the resources on the Santoy 8 and 9 veins. One underground drill was dedicated to exploring the SHW target.
Surface drilling focused on the definition of near surface Santoy 9 veins. A surface based deep exploration program was completed in an
attempt to intersect the 926 zone. Additional exploration programs drill tested targets around Santoy Lake.
Drilling in 2019 from underground shifted significantly to focus on
the definition and expansion of the GHW target. Limited underground drilling was conducted on the Santoy 8 and 9 veins largely due to
a paucity of suitable drill bays. Surface drilling also focused on the definition and expansion of the GHW target, the result of which
was an initial resource for the GHW deposit at year end 2019 of 1.15 Mt at 7.5 g/t Au Indicated and 850 Mt at 7.9 g/t Au
Inferred for 496 koz gold (OreWin, 2022). The Exploration team conducted a limited program along strike of the GHW target within
the Lizard Lake Pluton following up on the previous year’s prospecting and soil sampling program with limited success.
| | 7-7 | |
| SSR Mining Inc. | Seabee Gold Operation S-K 1300 Report | February 12, 2024 SLR Project No.: 138.21581.00005 |
Underground drilling in 2020 focused almost exclusively on the definition
and expansion of the GHW deposit with limited definition drilling conducted on the Santoy 8 and 9 veins due largely to a paucity
of suitable drill bays and size of the GHW. Surface drilling shifted focus to the SHW target with several smaller programs also conducted
to test near-mine targets that could not be reached from underground platforms. Of the surface targets tested in in 2020, only the SHW
showed potential for developing into a resource. The exploration team conducted limited follow-up on their 2019 program along strike of
the GHW with mixed success.
Underground drilling in 2021 focused on near mine definition and expansion
of known resources. The majority of the underground drilling targeted the SHW zone which was successful in defining economically significant
mineralization in setting similar to the GHW resource. Modest programs were undertaken on the 8 and 9 veins with mixed results for resource
growth. Surface drilling in 2021 continued to define and explore for additional mineralization in the Lizard Lake Pluton using the GHW
and SHW mineralization controls as a model for exploration as well as at the Core target north of Santoy 7. A drill campaign was also
carried out at the historic Shane showing testing a moderately plunging mineralization model as well as to assess the prospectivity of
structures oriented obliquely to the Pine Lake Shear Zone (PLSZ). The drilling successfully encountered mineralization within four discrete
planes along the PLSZ to a depth of approximately 400 m vertical. Drilling also encountered mineralization in structures oblique to the
PLSZ which hosted visible gold bearing quartz veining over multiple meters. The oblique structure encountered appears to be laterally
discontinuous but may represent a new model to target for economic mineralization at the larger Shane target area.
Underground drilling in 2022 focused on the down plunge of the 9 veins
with mixed results. The remaining meters focused on upgrading confidence in dominantly the 8 veins but also the GHW and SHW deposits.
Surface drilling in 2022 focused equally on the Shane and Porky West target areas with a smaller program proximal to the SMC and Joker
targets. The Shane drilling aimed to define a resource on the mineralization in the PLSZ identified in the previous year. While mineralization
at Shane was continuous it was found to be subeconomic. Porky West drilling was initially undertaken to assess the viability of an open
pit resource existing, but it was quickly realized that the geometry and continuity of the veins, along with the significant portion of
the deposit under Porky Lake, made an underground mining scenario much more favourable. Significant gold mineralization was encountered
to approximately 400 m vertical depth beneath the historic workings as well as at the Petunia target located approximately 400 m to the
west of the historic workings.
Underground drilling in 2023 focused on the plunge extension of the
8 and 9 veins. A concerted effort was also made to decrease the drill spacing around mining fronts on the GHW to help improve confidence
in grade interpolation and stope planning. Surface drilling in 2023 focused on the Porky West deposit with some drilling to support near
term mine planning at the SMC. At Porky West, mineralization deemed amenable to underground mining was defined over a strike of 1,400
m and to a vertical depth of 500 m. Additional drilling at the Petunia target identified in 2022 was carried out. Based on the drilling
results, a strike length of approximately 2.8 km, from Petunia in the west to the historic Porky Main deposit in the east has been interpreted
to be hosted along the same prospective structure within the Porky Lake siliciclastic rocks.
| | 7-8 | |
| SSR Mining Inc. | Seabee Gold Operation S-K 1300 Report | February 12, 2024 SLR Project No.: 138.21581.00005 |
Surface drilling at Santoy mine complex tested deeper down-plunge extensions
of the Santoy 8 and 9 veins to a maximum vertical depth of ~1200 m with only sub-economic results encountered. Exploration drilling in
the Santoy 6 area confirmed sporadic but sub-economic Au mineralization associated with altered granodiorite dikes. SLR is of the opinion
that there is good potential to increase the Mineral Resource base for Santoy Mine underground deposits at depth as well as Porky West,
and additional drilling and development is warranted.
| 7.2.2.9 | Fisher, Leland and Truscott Drilling |
In 2016, SSR entered an Option Agreement with Eagle Plains (Taiga Gold
was a spin off of Eagle Plains) for the Fisher, Leland and Truscott properties. Since entering the Option Agreement and following the
April 2022 acquisition of Taiga Gold Corp., SSR has completed 126 surface exploration drill holes totaling 44,594.5 m on the Fisher, Leland
and Truscott tenements. A summary of drilling on performed on these exploration tenements is provided in Table 7-2.
Table 7-2: Surface Drilling
on the Fisher, Leland and Truscott Tenements
| Drilling Program |
Company |
No. Surface Drill Holes |
Surface Metres Drilled |
| 2016 - April 2022 |
SSR |
101 |
38,648 |
| April 2022 - December 2023 |
SSR |
25 |
5,946.5 |
| 7.3 | SSR Drilling Procedures |
| 7.3.1 | Underground Drilling Procedures |
The most important dataset informing the current Mineral Resource at
the SGO is derived from underground drilling. Underground drill layouts are created using Geovia GEMS software three-dimensional (3D)
software. Three dimensional lines are created between a desired pierce point and a collar location for each planned hole. The resulting
azimuths from the developed hole traces are given to the survey department as a digital plan map, which is then uploaded into the Mine
Markup tablet. All underground drill layouts are created in mine grid coordinates. The survey crew then goes underground to physically
paint the drill lines of all holes on the excavation walls by means of numbered lines, with front sight and back sight marked accordingly.
Spuds (resembling a small hook) are drilled into the lines with which the line number and azimuth are marked on flagging tape in the event
the painted lines become obscured or illegible over time.
Underground drills are equipped with laser sighting systems for accurate
alignment on the specified drill line. Dips are set using digital inclinometers magnetically attached on the drill’s feed frame.
Completed drill holes are surveyed using a Reflex multi-shot tool and wireless palm unit to measure the azimuth, dip, and total magnetic
field. Drill holes are surveyed at 10 m intervals from the bottom of the hole to the collar. For holes exceeding 500 m, it is
common practice to take single shots every 30 m to 50 m as the hole advances to ensure that deviation is within acceptable ranges.
Stored data is transferred to a memory stick from the palm unit and is then uploaded into a program called S-Process, where the data is
visually verified and then transferred into the GEMS MS Access database as a comma-delimited text file (*.csv). Upon completion of
each hole, the collar locations and azimuths are recorded by mine surveyors and the data is transferred to the drill geologist as a .csv
file for inclusion into the GEMS survey field in the MS Access database. Completed holes are checked against planned hole traces
to verify that they are spatially correct in the 3D model.
| | 7-9 | |
| SSR Mining Inc. | Seabee Gold Operation S-K 1300 Report | February 12, 2024 SLR Project No.: 138.21581.00005 |
Core logging takes place at the drill chamber underground. Logging
data is captured on paper log sheets and include header data containing the drill hole identification number, date, the logging geologist’s
name, and planned hole directional data. The main body of the log contains row and column fields for depth intervals, lithological descriptions,
sample numbers, assay results, and rock quality designation (RQD) measurements. Upon completion of logging, the information is manually
entered into the GEMS database by a mine geologist. Completed drill logs are placed in a file folder for future verification by the senior
mine geologist before inclusion into resource updates. Completed assay data is housed in an MS Excel database owned by the Seabee mine
laboratory. The geology department has read-only access to this file and can copy and paste results into the GEMS database. Implementation
of MX Deposit database software is in progress, and this will replace the GEMS database that is being currently used.
| 7.3.2 | Surface Exploration Drilling Procedures |
Upon establishing drill targets, 3D points representing surface drill
hole collar locations are created in Leapfrog or Gems software. Drill hole traces are planned to pierce the target as close to orthogonal
as possible to obtain a true thickness of the stratigraphy. After the anticipated hole deviation is accounted for and an optimal trace
is obtained, the surface location is inspected to ensure suitability.
In the field, hole collar locations and two front sights are recorded
with a handheld global positioning system (GPS) prior to data being entered into MX Deposit. Alternatively, the drill contractor may align
the drill using the DeviSight tool which uses GPS to derive an azimuth which is preferable to a compass and front sights due to the elimination
of magnetic interference and operator error when aligning two pickets.
Reflex EZ-Gyro multi-shot device tests record the hole’s azimuth
and dip. Tests are completed at 30 m intervals during downhole drilling and may also be collected at 30 m to 100 m intervals
upon completion of the hole as rods are being pulled if the desired density of measurements is insufficient with the shots taken while
drilling. The data are collected via a handheld device that syncs to the Reflex tool downhole and are recorded onto Reflex paper sheets.
The paper sheet and digital data are delivered to the supervising exploration geologist and are downloaded and input into a database to
track the hole progression, ensuring that unexpected and/or excessive deviation has not occurred.
Once a hole has been completed, an aluminum plug is placed approximately
10 m downhole from the base of the casing and the hole is cemented to the top. The SGO mine survey team then takes a differential
GPS waypoint of the collar location with the base station for final verification of its location, providing accuracy within 0.3 m
of the hole location. Drill holes where this level of accuracy is not required may be surveyed in by handheld GPS unit or using the DeviSight’s
GPS coordinates with an accuracy of approximately ±3 m. The digital data is sent to the supervising exploration geologist
and the final 3D coordinates of the hole are entered into MX Deposit and tracked in modeling software.
| | 7-10 | |
| SSR Mining Inc. | Seabee Gold Operation S-K 1300 Report | February 12, 2024 SLR Project No.: 138.21581.00005 |
Drill core is transported to the core logging facility, where it is
marked and logged. Data from individual drill programs is captured in an MX Deposit database, including drill hole collar and header
information, detailed descriptions of lithological units, structures, alteration and mineralization, core recovery and RQD data, and
sample information. Photographs of core are taken both wet and dry, and digital copies are archived. Upon receiving laboratory results
and confirming quality control results, the entire dataset is combined into a master MX Deposit database and incorporated into the tracking
software. Core boxes are stacked and stored at the SGO core storage yard with metal tags affixed by staples indicating borehole ID, box
number, and interval contained.
| 7.3.3.1 | Sampling by Previous Operators 1949–2009 |
Generally, historical drill core sampling on the SGO was conducted by
a geologist selecting mineralized intervals based on visual inspection of drill core. Selected intervals were split by hydraulic or manual
power splitter and sent for analyses at the on-site laboratory or an off-site laboratory.
Information regarding historical sample preparation and analyses is
incomplete or unavailable and is therefore not discussed in detail in this TRS. Multiple sampling methods are attributed to individual
drilling campaigns without differentiation of the method applied to each hole.
Furthermore, drilling prior to 2009 tends only to have dip surveys and
no control on azimuth, and is therefore unreliable.
Current Mineral Resource and Mineral Reserve estimates at the SGO are
informed almost entirely by drilling post-2009, excluding the Mineral Resources attributed to the Porky West deposit. The historical sample
preparation and analyses therefore does not have a significant material impact on the property.
| 7.3.3.2 | Drill Core Sampling by Claude Resources and SSR 2009 to 2023 |
Drill core is logged in detail on site by SSR geologists. Rock quality
and core recovery are documented, zones of potential mineralization are marked for sampling, and one to five samples are marked in both
the hanging wall and footwall “winging” the interval of interest.
Surface diamond drill core samples are chosen based on geology and average
1.0 m to 1.5 m in width, with 0.3 m width samples taken for geological interpretation purposes. The sampling interval was
established by minimum or maximum sampling lengths, and geological and/or structural criteria, and is not less than 0.10 m. Discrete
intervals of mineralized or prospective lithologies which measure more than 0.10 m and less than 1.0 m may be sampled as a single
sample. Mineralized or prospective lithologies which are greater than 1.0 m in width tend to be broken into one metre sample intervals
internal to the interval of interest. Intervals immediately adjacent to mineralized or prospective lithologies are sampled, at a minimum,
1.0 m from the contact with the prospective mineralogy. Sampling of less prospective, or weakly altered lithologies, may be sampled
at 1.5 m to 2.0 m intervals at the discretion of the logging geologist.
| | 7-11 | |
| SSR Mining Inc. | Seabee Gold Operation S-K 1300 Report | February 12, 2024 SLR Project No.: 138.21581.00005 |
Intervals deemed not prospective for gold mineralization by the geologist
are either un-sampled or sampled using a composite sample, not exceeding 8 m in length. The composite sample consists of not less
than one 10 cm piece of core selected per 1.5 m in the total 8 m sample interval. The composite sample is used to ensure
that mineralized zones not immediately recognized by the geologist are not missed. If a composite sample grades more than 0.10 g/t Au,
then the interval is re-logged and re-sampled at a 1.0 m sample interval to determine the source of the anomalous gold grade. Field
geologists are trained to sample additional intervals that may have associated gold mineralization, such as zones of increased sulphide
mineral content or quartz veining not previously associated with a known mineralized zone. Sample intervals are recorded in an MX Deposit
database, and photographs of each core box are taken. Certified reference material (CRM), blanks, or duplicate samples are inserted into
the sample stream at regular intervals of at least one in 20 samples.
After the drill core is logged and marked for assay, it is transferred
to the core splitting facility, where the selected intervals are sawed lengthwise. The half core to be analyzed is double-bagged, sealed,
and labelled with coded security tags, while the other half remains in the core box as a record. In the case of duplicate samples or re-sampling,
core is sawn in quarters and a quarter core is retained as a record. Some core intervals are destroyed in metallurgical testing and are
marked by survey stakes with metal labels in the core boxes from which the interval is removed. Samples to be sent for analyses are placed
in white rice bags, weighed, and closed with a uniquely coded security zip tie. Sample submittal forms are sent to the appropriate laboratory
indicating the number of samples, weight, and security tag numbers of each sample in the shipment. This data is verified by the laboratory
when the shipment is received, and any broken tags or sample bags that appear to have been tampered with are reported.
Underground drill core is logged by geologists in the underground drill
chamber. Sample intervals are selected by the logging geologist and measure no less than 0.10 m. Discrete intervals of mineralized
or prospective lithologies which measure more than 0.10 m and less than 1.0 m may be taken as a single sample. Mineralized or
prospective lithologies that are greater than 1.0 m in width are typically divided into 1.0 m sample intervals. Intervals immediately
adjacent to mineralized or prospective lithologies are sampled, at a minimum, 1.0 m from the contact with the prospective mineralogy.
Less prospective, or weakly altered lithologies may be sampled at 1.5 m to 2.0 m intervals. No samples are taken of core considered
by the geologist to be unmineralized. Sample intervals are recorded on a tablet into an MX Deposit database.
Once the intervals to be sampled are selected, the whole core is placed
in a sample bag with a uniquely numbered identification tag and delivered to the Seabee laboratory for analyses. Unsampled core is dumped
near the drill chamber and used as fill in the mine.
Unauthorized personnel are not permitted access to the drill machines
or the core logging and core splitting facilities.
| 7.3.3.3 | Underground Chip and Muck Sampling |
Chip samples are collected by a geologist at the working face; the
hanging wall to footwall is sampled, with intervals divided based on lithological boundaries and not exceeding 1.5 m in width. Wall
rock is also included in this sample type, as it is primarily used as a daily estimate of grade being delivered to the mill. Muck samples
are obtained by the geologist when they are unable to reach the working face in a heading. These samples consist of grabs of muck on
the floor of the drift, with no less than three muck samples taken at a face unless extenuating circumstances requires fewer samples.
Chip samples retain their specific width weighting, while muck samples are assigned a proxy interval based on the number of samples collected
and the width of the sill from which the samples are collected. The samples are bagged, tagged with a unique identifying number, and
transported to the Seabee laboratory for analyses following the methodology described in the previous section. Assay values are tracked
in an MS Access database.
| | 7-12 | |
| SSR Mining Inc. | Seabee Gold Operation S-K 1300 Report | February 12, 2024 SLR Project No.: 138.21581.00005 |
Density data was collected from NQ (47.6 mm) diameter drill core during
the 2011 Santoy drilling program by the SGO exploration department. Half core was weighed within mineralized zones, while whole core was
weighed within waste domains. A total of 433 density measurements were collected from 45 different holes. The results were tabulated,
sorted, and averaged by lithology. Initially, weight percent estimates of the various zones of mineralization were calculated based on
drill core and underground observations. Assigned densities are reviewed annually by comparing to collected daily density determinations
carried out on mill feed samples. Analyses were performed on site by water displacement using the following methodology:
| · | Place a dry glass vessel on a balance and zero the weight. |
| · | Collect a 20 cm to 25 cm piece of half core or whole core from the interval of interest and place into the vessel. |
| · | Record the weight of the core, and zero the balance. |
| · | Fill the vessel to marked line with cold water. |
| · | Suspend core in water and weigh the vessel with the water and core. |
The difference between the original water weight and the second reading
is equal to the volume of water displaced by the core, from which the density was calculated using the original weight of the core sample.
From this data, an average density value was calculated based on lithology.
Since mid-2014, the Seabee mill has been performing a daily density
determination from an approximately 5 kg 24-hour composite sample collected from the belt. The samples are analyzed on site by water
displacement using the following methodology:
| · | Riffle composite sample down to an approximately 1 kg representative sample. |
| · | Place a dry flask on a 200 g balance and zero the weight. |
| · | Add sample to the flask (greater than 55 g). |
| · | Record the weight of the sample, and zero the balance. |
| · | Fill the flask to marked line with cold water and ensure outside of flask is dry. |
| · | Place the flask back on the balance and record the weight. |
Two 200 mL flasks have been labelled by SSR staff with the water
weight when filled to a specified line to be used for the original water weight. The difference between the original water weight and
the second reading is equal to the volume of water displaced by the sample, from which the density is calculated using the original weight
of the dry sample.
| | 7-13 | |
| SSR Mining Inc. | Seabee Gold Operation S-K 1300 Report | February 12, 2024 SLR Project No.: 138.21581.00005 |
| 8.0 | Sample Preparation, Analyses, and Security |
| 8.1 | Sample Preparation and Analysis |
The drill hole sampling, sample preparation and analyses applied prior
to 1989 have not been documented in detail.
All underground samples are assayed at the non-accredited and non-independent
SGO laboratory (SGO Lab). Samples are dried for 30 to 60 min, crushed to 10 mesh, and riffle split using a Jones splitter until only 200 g
of material remains. The samples are then pulverized in a ring and puck pulverizer until greater than 80% passes through a 200 mesh screen.
Thirty grams of pulp material is then analyzed for gold by fire assay with gravimetric finish with a 0.01 g/t Au detection limit.
Most surface drilling samples were assayed at TSL Laboratories Inc.
(TSL) in Saskatoon, Saskatchewan. TSL is independent of SSR. The laboratory was ISO 17025 accredited until April 18, 2017, and has since
withdrawn from the Standard Council of Canada’s system.
Upon receipt of samples, TSL attaches a bar code label to the original
sample bag, and the label is scanned to record the sample weight, date, time, equipment used and operator name, allowing for complete
traceability of each sample during the laboratory process. Samples are crushed to 70% passing 10 mesh in two stages. The crushed reject
is homogenised by passing it once through a Jones riffle splitter down to 250 g and then recombining the two halves, from which 250 g
are split using the same riffle splitter. The split is then ring pulverised to 95% passing 200 mesh. Samples are analysed for gold by
30 g fire assay with gravimetric finish using a 0.03 g/t Au detection limit. Pulps and rejects are stored in containers
on the TSL laboratory property.
TSL employs comprehensive quality assurance and quality control protocol
and control charts for standards assayed at the laboratory show routine performance within two standard deviations of the certified value.
The relative precision for gold meets contract specifications and established limits.
Chip and muck samples are bagged, tagged with a unique identification
number and transported to the SGO Lab for analysis following the same methodology.
As of May 2023, SGO started to send all surface drilling samples from
Porky West to ALS laboratory in Vancouver. ALS holds accreditation with ISO/IEC 17025 for all relevant procedures. ALS prepares the samples
with a crusher and rotary splitter combination which first crushes up to 70% of the material to less than 2 mm. Afterwards, one kilogram
of the sample is split off and pulverized to greater than 85% passing 75 microns. The fire assays are analyzed with an atomic absorption
finish on a 50 g aliquot to produce gold analytical results with a 0.01 g/t Au detection limit. Fire assays with gravimetric finish are
prepared on the samples with a result greater than 10 g/t Au, with a 0.05 g/t Au detection limit.
| | 8-1 | |
| SSR Mining Inc. | Seabee Gold Operation S-K 1300 Report | February 12, 2024 SLR Project No.: 138.21581.00005 |
| 8.2 | Quality Assurance and Quality Control |
Quality assurance (QA) consists of evidence that the assay data has
been prepared to a degree of precision and accuracy within generally accepted limits for the sampling and analytical method(s) to support
its use in a Mineral Resource estimate. Quality control (QC) consists of procedures used to ensure that an adequate level of quality is
maintained in the process of collecting, preparing, and assaying the exploration drilling samples. In general, QA/QC programs are designed
to prevent or detect contamination and allow assaying (analytical), precision (repeatability), and accuracy to be quantified. In addition,
a QA/QC program can disclose the overall sampling-assaying variability of the sampling method itself.
As of 2006,
the geology department of SGO has implemented a QA/QC program to validate the precision of its in-house, non-accredited assay laboratory.
SSR has since adopted and adjusted this program. It includes the periodic insertion of controls at a rate of one per 20 samples, encompassing
blanks, certified reference materials (CRMs), and pulp duplicates. Furthermore, monthly umpire check assays are carried out, with the
outcomes submitted to an external certified laboratory.
SLR reviewed QA/QC information compiled and analyzed by OreWin in 2022
and has summarized these results alongside analysis of QA/QC samples collected from 2021 to 2023.
| 8.2.1 | Certified Reference Materials |
Results of the regular submission of CRMs (standards) are used to identify
issues with specific sample batches, and biases associated with the non-certified internal laboratory (SGO Lab) and the external check
CRMs submitted to either ALS, SRC GeoAnalytical Laboratories (SRC), or TSL.
Certified Reference Material (CRM) from Rocklabs Ltd. (Rocklabs) is
incorporated into the assay process by a mine geologist at a frequency of one per 20 samples, regardless of the sample type. Typically,
three distinct CRM samples are used in the rotation, representing low grade, average grade, and high grade materials. The mine geologist
records the identification numbers of the CRM samples introduced into the assay stream and assesses them as either a pass or fail upon
receiving laboratory results. Batches with failed CRM results undergo re-analysis. CRM results are digitally documented in a spreadsheet
provided by Rocklabs or using predefined pass fail criteria in MX Deposit, enabling the tracking of pass and fail rates for each reference
material. The compiled results are included in a monthly report, which is shared with relevant laboratories involved in the assay process.
SSR reviews the results from control samples to accept the data from
each individual batch or to reject the data and request a re-run. A batch is rejected if the result for the standard exceeds the tolerance
of the 95% confidence level stated on the standard’s certificate.
A total of seventeen different CRMs were inserted between 2021 and 2023,
totalling 1,760 individual samples. A summary of these CRMs analysis at SGO Lab is presented in Table 8-1.
SLR opted to include four CRMs in the analysis, covering the average
gold grade, a low gold grade, and a high gold grade CRM with a high sample population and a long-term period of use for additional review.
The SLR QP prepared control charts and analyzed temporal and grade trends, reviewed the data for low and high biases, and the failure
rate of each CRM.
| | 8-2 | |
| SSR Mining Inc. | Seabee Gold Operation S-K 1300 Report | February 12, 2024 SLR Project No.: 138.21581.00005 |
Table 8-1: Expected Values and
Ranges of CRM
| CRM |
Period Range |
No. Samples |
Std Dev |
Mean
(Au g/t) |
Expected Value |
No. Outliers |
Bias
(%) |
Outliers (%) |
| SQ87 |
(2021, 2023) |
64 |
2.79 |
30.4 |
30.87 |
1 |
-2 |
2 |
| SP73 |
(2021, 2023) |
114 |
0.24 |
17.77 |
18.17 |
2 |
-2 |
2 |
| SF85 |
(2021, 2023) |
764 |
0.03 |
0.86 |
0.85 |
4 |
1 |
1 |
| SL76 |
(2021, 2023) |
125 |
0.07 |
5.98 |
5.96 |
3 |
0 |
2 |
| SJ95 |
(2021, 2021) |
42 |
0.07 |
2.72 |
2.79 |
0 |
-3 |
0 |
| SG84 |
(2021, 2022) |
449 |
0.03 |
1.01 |
1.03 |
13 |
-2 |
3 |
| SH82 |
(2021, 2021) |
16 |
0.04 |
1.35 |
1.33 |
0 |
1 |
0 |
| SG113 |
(2021, 2022) |
42 |
0.06 |
1.02 |
1.02 |
1 |
0 |
2 |
| SG115 |
(2021, 2021) |
55 |
0.03 |
1.01 |
1.02 |
0 |
-1 |
0 |
| SN106 |
(2021, 2022) |
90 |
1.05 |
8.31 |
8.46 |
2 |
-2 |
2 |
| SJ111 |
(2021, 2023) |
71 |
0.06 |
2.78 |
2.81 |
0 |
-1 |
0 |
| SH98 |
(2021, 2023) |
110 |
0.03 |
1.41 |
1.4 |
0 |
1 |
0 |
| SJ121 |
(2023) |
43 |
0.04 |
2.74 |
2.72 |
0 |
1 |
0 |
| SP116 |
(2023) |
13 |
0.18 |
17.78 |
18.09 |
0 |
-2 |
0 |
| SN117 |
(2023) |
13 |
1.61 |
8.02 |
8.44 |
1 |
-5 |
8 |
| SK120 |
(2023) |
7 |
0.06 |
4.13 |
4.08 |
0 |
1 |
0 |
| SL123 |
(2023) |
64 |
0.68 |
5.82 |
5.89 |
1 |
-1 |
2 |
Over the span of 2021 to 2023, the SGO Lab conducted an evaluation of
17 CRM types. The general performance showcased satisfactory scatter and accuracy levels. However, Figure 8-1 indicates that while
most z-scores for these CRM types predominantly fit within the ±3SD threshold, the CRM SG84 had two specific occurrences exceeding
the acceptance limits.
The z-score analysis also revealed possible cases of sample mislabeling
or swapping that required further investigation. Additionally, the CRMs used within the drill hole samples from the Porky area exhibited
stable results at the Seabee Gold laboratory. Corresponding evaluations conducted at the ALS laboratory in 2023 produced comparable findings.
Results from Seabee CRM SG84 low grade gold samples presented in Figure
8-2 indicate that there were systematic failures in the first quarter of 2021, falling under 3SD. However, improvements were made
to correct the negative bias since the second quarter. In the middle of the second quarter of 2022, a second low negative bias was also
observed, triggering the presence of three outliers falling between -2SD and -3SD, along with one failure below -3SD. This issue was promptly
addressed and corrected.
Results obtained from evaluating CRM SL76 samples in the onsite laboratory
(SGO), which serve as a representation of the average gold grade (5.9 g/t Au) at the Seabee Gold deposit, are shown in Figure 8-3.
These results exhibit a low positive bias of 0.2% from the expected value. Out of six samples, two fall between the 2SD and 3SD limits,
and two samples slightly below the 3SD limit during the fourth quarter of 2022. Notwithstanding, the laboratory's performance has remained
acceptable throughout the utilization of this CRM from 2021 to 2023.
| | 8-3 | |
| SSR Mining Inc. | Seabee Gold Operation S-K 1300 Report | February 12, 2024 SLR Project No.: 138.21581.00005 |
Figure 8-1: Z-score Scatter
Plot
Figure 8-2: Control Chart of
CRM SG84 for Gold at SGO Lab: 2021 to 2022
| | 8-4 | |
| SSR Mining Inc. | Seabee Gold Operation S-K 1300 Report | February 12, 2024 SLR Project No.: 138.21581.00005 |
Figure 8-3: Control Chart of
CRM SL76 for Gold at SGO Lab: 2021 to 2023
The gold control chart for CRM SP73, representing the high grade gold
CRM (18.17 g/t Au), was also generated and reviewed. It was noted that gold values exhibit a low bias of -2.2% below the CRM expected
value, with only two out of 114 CRMs slightly exceeding three SD. SLR notes that these parameters confirm a good accuracy and precision
reached by the internal laboratory at these gold levels carried out between 2021 and 2022.
SLR recommends decreasing the variety of inserted CRM. Having three
CRMs would effectively encompass the three main ranges of gold mineralization, enabling confident conclusions about accuracy and precision
through extended timeline series charts. This adjustment would prevent the inclusion of a limited number of CRM inserted such as SK120
or SK123 which might not yield conclusive insights into analytical performance. It is also recommended to incorporate a priority category
column into the database that would help distinguish which re-run values should be retained for QA/QC assessment purposes.
The regular submission of blank material is used to assess contamination
whether during sample preparation or analyses, and to identify sample numbering errors. Blank materials were submitted as pre-prepared
pulps after visible mineralization at a rate of one in twenty samples.
Between 2020 and 2023, a total of 1,962 blanks were inserted, including
1,892 samples submitted to the SGO Lab (Figure 8-4) and 70 samples from the Porky area sent to ALS (Figure 8-5). Blank failure
samples are rejected if the results are greater than three times the detection limit. SLR is of the opinion that no systematic contamination
of samples occurred during the SGO Lab analysis stage. Some potential cases of mislabeling were detected that require further investigation.
Improvements in database management are required to better track sample details for future evaluations. SLR recommends inserting coarse
blanks as well to evaluate the presence of contamination caused by carryover during the preparation process.
| | 8-5 | |
| SSR Mining Inc. | Seabee Gold Operation S-K 1300 Report | February 12, 2024 SLR Project No.: 138.21581.00005 |
Figure 8-4: Fine Blanks –
Seabee Gold Laboratory
Figure 8-5: Fine Blanks –
ALS Laboratory
| | 8-6 | |
| SSR Mining Inc. | Seabee Gold Operation S-K 1300 Report | February 12, 2024 SLR Project No.: 138.21581.00005 |
Duplicate samples help monitor preparation, assay precision, and grade
variability as a function of sample homogeneity and laboratory error. Field duplicates test the natural variability of the original core
sample, as well as all levels of error including core splitting, sample size reduction in the preparation laboratory, sub-sampling of
the pulverized sample, and analytical error.
The failure trigger for pulp duplicates is less defined due to the lode-gold
nature of the mineralisation; however, batches are considered for re-run when duplicate assay values are greater than ±10%.
SLR analyzed a complete database of pulp duplicate data compiled by
SLR using the hyperbolic function and basic statistics, scatter, and relative error plots. SLR notes that 678 pairs have zero values (0.00
g/t Au) in the database and therefore only a total of 821 out of 1,499 sample pairs were only included in the analysis.
SLR used the Hyperbolic method for this evaluation, establishing the
failure criteria for gold at 10 times the detection limit and up to 10% relative error (ER), This analysis is shown in Figure 8-6
where it is noticeable that a rate of failures of 16.9% was obtained, exceeding the minimum rate accepted.
Furthermore, in Figure 8-7, the scatter plot provides evidence of
dispersion with a correlation coefficient of 0.922 and a difference between means of 8%. Additionally, when observing the relative error
plot shown in Figure 8-8, it is noted that most of the unmatched pairs out of the 821 are below 3 g/t Au. This observation highlights
an inherent nugget effect associated with the lode-gold nature of the Seabee Gold deposit.
| | 8-7 | |
| SSR Mining Inc. | Seabee Gold Operation S-K 1300 Report | February 12, 2024 SLR Project No.: 138.21581.00005 |
Figure 8-6: Analysis of Pulp
Duplicate Data for Gold by Hyperbolic Method: 2020 to 2022
| | 8-8 | |
| SSR Mining Inc. | Seabee Gold Operation S-K 1300 Report | February 12, 2024 SLR Project No.: 138.21581.00005 |
Figure 8-7: Scatter Plot of
Pulp Duplicate Data for Gold: 2020 to 2022
| | 8-9 | |
| SSR Mining Inc. | Seabee Gold Operation S-K 1300 Report | February 12, 2024 SLR Project No.: 138.21581.00005 |
Figure 8-8: Relative Error Plot
for Gold: 2020 to 2022
| 8.2.4 | External Laboratory Checks |
External laboratory check assays consist of submitting samples that
were assayed at the primary laboratory (SGO Lab) to a third-party laboratory (TSL, SRC, or ALS) and re-analyzing them by using the same
analytical procedures.
Every month, around 20 pulp samples undergo external analysis by TSL
in Saskatoon, Saskatchewan. Each batch of external check samples includes one Certified Reference Material (CRM), and a sieve analysis
is conducted on one of the pulps to determine percentages passing through –150 and –200 mesh. The results obtained from analyses
at ALS, SRC, or TSL are then compared to on-site results and incorporated into a comprehensive monthly report.
Figure 8-9 plots 160 sample pairs of gold assays that were submitted
for assay check in 2023 (from January to April). The results show a high variation between the pairs, and an overall bias of 12.4% reached
between the primary laboratory and ALS. It is observed that below 3.0 g/t Au, the primary laboratory grades are slightly greater than
ALS, whereas above this same gold grade cut-off, the primary laboratory tends to be lower than ALS.
Similarly, Figure 8-10 shows 40 sample pairs of gold assays that
were submitted for assay check between October and November 2023. The results reveal a high variability between the primary laboratory
and SRC, with the primary laboratory showing up to a 13.8% variation compared to SRC. This variability may be caused by the existing nugget
effect in the Seabee deposit’s nature.
| | 8-10 | |
| SSR Mining Inc. | Seabee Gold Operation S-K 1300 Report | February 12, 2024 SLR Project No.: 138.21581.00005 |
Figure 8-9: Q-Q Plot and Scatter
Plot for Gold Check Assay Pulps Analyzed by ALS: 2023
Figure 8-10: Q-Q Plot and Scatter
Plot for Gold Check Assay Pulps Analyzed by SRC: 2023
SLR noted that the pulp check assays conducted by TSL between
2020 and 2022 exhibited moderate to high variability among the 216 pairs. It is worth mentioning that TSL consistently reports lower
grades than the primary laboratory, with differences of up to 9.0%. Despite this, TSL maintained lower differences between 2020 and 2022
compared to those conducted in 2023 by ALS and SRC.
| | 8-11 | |
| SSR Mining Inc. | Seabee Gold Operation S-K 1300 Report | February 12, 2024 SLR Project No.: 138.21581.00005 |
Figure 8-11: Q-Q Plot and Scatter
Plot for Gold Check Assay Pulps Analyzed by TSL: 2020-2022
Since 1989, drill core is monitored by SSR staff from the time it is
taken out of the ground until it is split and the samples are delivered to the laboratory. Unauthorised personnel are not permitted access
to the drill sites or the core logging and splitting facility. Samples that are split for assaying are double bagged within the splitting
facility and identified with a coded security tag. Upon receipt of samples at the laboratory, any sample tags that are broken or any sample
bags that appear to have been tampered with are reported to SSR.
Samples that are sent for assaying in Saskatoon or Vancouver undergo
similar procedures. The staff prepare the samples for shipment by placing the samples in rice bags and securing them with security tags.
All the rice bags are weighed and must be under 40 lbs. The weight, sample interval and security tag number are documented and tracked.
When a sufficient number of bags are prepared, they will be placed on a pallet and prepared for shipping. Shipments are made on regular
intervals using outbound aircraft. For Porky West samples going to ALS, the samples are transported from Saskatoon to the ALS Vancouver
laboratory by Manitoulin Transport, a private courier service.
In the opinion of the SLR QP, the procedures for sample preparation,
security, and analysis are adequate and adhere to industry standards for ensuring data quality and integrity. There are no factors associated
with sampling or sample preparation that would significantly affect the accuracy or reliability of the samples or assay results. The results
of the QA/QC procedures demonstrate that the assay results fall within acceptable ranges of accuracy and precision, affirming the adequacy
of the resulting database to underpin the estimation of Mineral Resources.
SLR recommends reducing the variety of inserted CRMs to three, covering
low, average, and high gold grades. This would provide a comprehensive assessment of accuracy and precision over time. In addition, incorporating
a priority category column into the database to distinguish which re-run values should be retained will allow for effective database management
for future QA/QC assessments.
| | 8-12 | |
| SSR Mining Inc. | Seabee Gold Operation S-K 1300 Report | February 12, 2024 SLR Project No.: 138.21581.00005 |
SLR considers that the consistent high variability observed in pulp
duplicates and pulp checks is likely a result of the deposit's nugget effect. The coarse gold particles are not evenly dispersed, even
in finely crushed samples. Therefore, it is recommended to review the sampling techniques and laboratory protocols. These may not be
adequately capturing the gold distribution due to sampling size, preparation methods, or both. Comparing these with external laboratory
protocols is also essential. SLR therefore recommends exploring the homogenization procedures of the samples to improve the results of
the check assays sent to external laboratories. Moreover, implementing rigorous grade control protocols is crucial to manage the variability
stemming from the coarse gold effect.
| | 8-13 | |
| SSR Mining Inc. | Seabee Gold Operation S-K 1300 Report | February 12, 2024 SLR Project No.: 138.21581.00005 |
| 9.1 | Historic Data Verification |
Table 9-1 summarizes historical data verification performed by other
companies and QPs prior to SLR’s involvement. The SLR QP has not reviewed the historical data verification. The data verification
that SLR undertook for this Mineral Resource estimate is subsequently described in Section 9.2.
Table 9-1: Historical Data Verification
| Year |
Company |
Verification |
| 2016 |
SSR |
585 pulp duplicates from the mine database were evaluated from randomly chosen samples, representative of the Santoy deposit |
| 2016 |
SSR |
54 screen metallic assay results were chosen, based on grade, from the 585 pulp duplicates for evaluation. |
| 2016 |
SSR |
A portion of the database was compared to the source information to understand the nature and frequency of database errors. Disagreement between surveyed collar azimuths and downhole magnetic surveys of six drill holes, and significant disagreements between high grade assays and re-runs were the most notable issues identified |
| 2016 |
SSR |
A review of the sampling, preparation, and analytical quality assurance of the 2016 Seabee exploration program |
| 2016 |
SSR |
An evaluation of 240 umpire pulp duplicates provided as matched pairs of Seabee Mine data from January to November 2016 and January 2017 was performed. The matched pairs were created by taking a second random selection of pulp material from Seabee Mine pulp samples and sending them to TSL for check analysis. A total of 238 matched pairs returned results above the reported lower detection limit of 0.03 g/t Au and were therefore suitable for precision analysis |
| 2020 |
OreWin |
OreWin QPs visited the SGO on 6 February 2020, accompanied by representatives of SSR. All aspects that could materially impact the integrity of the data informing the Mineral Resource estimate (core logging, sampling, analytical results, and database management) were reviewed with SSR staff |
| 2020 |
OreWin |
Review of accuracy and precision of analytical quality control data |
SLR received a single certificate from SGO’s internal laboratory
titled "Geology Assay Database". This certificate compiles data from 149,963 samples, including drill hole samples, chips, muck,
and controls, detailing gold records from 2016 to 2023. While external laboratory certificates from ALS, TSL, and SRC were provided for
check pulps, they do not verify the integrity of the assay database used for the mineral resource estimate. No other external laboratory
certificates were included in this review.
The SGO Lab's assay certificate included both initial submissions and
re-assays, leading to some sample IDs appearing up to three times in the same file. SLR reviewed the 'Assay.csv' database, which is updated
through April 2023 and contains 98,197 assay samples. From this, 48,176 samples were cross-checked with the compiled laboratory assay
file, accounting for 49% of the total samples in the assay database. Of the compared samples, 998 exhibited discrepancies in gold values,
representing 2.1% of the samples compared. Among these mismatches, 278 resulted from an average calculation between the initial value
and the re-analysis, making up 0.6% of the total samples compared. Table 9-2 provides a summary of the entries compared and the yearly
observation rates.
| | 9-1 | |
| SSR Mining Inc. | Seabee Gold Operation S-K 1300 Report | February 12, 2024 SLR Project No.: 138.21581.00005 |
Table 9-2: Assay Data Verification
Summary – SGO - SLR
| Year |
No. Entries |
No. Samples Compared |
Mismatches |
% Mismatches |
| 1997 |
86 |
- |
- |
- |
| 2004 |
595 |
- |
- |
- |
| 2005 |
1,518 |
73 |
2 |
2.7% |
| 2006 |
1,117 |
207 |
1 |
0.5% |
| 2007 |
4,509 |
734 |
95 |
12.9% |
| 2010 |
3,163 |
- |
- |
- |
| 2011 |
7,511 |
19 |
4 |
21.1% |
| 2012 |
9,531 |
- |
- |
- |
| 2013 |
2,432 |
3 |
3 |
100% |
| 2014 |
3,451 |
1 |
1 |
100% |
| 2015 |
3,295 |
- |
- |
- |
| 2016 |
6,707 |
2,070 |
28 |
1.4% |
| 2017 |
4,305 |
3,344 |
87 |
2.6% |
| 2018 |
7,787 |
7,112 |
119 |
1.7% |
| 2019 |
10,841 |
10,581 |
174 |
1.6% |
| 2020 |
7,756 |
6,292 |
162 |
2.6% |
| 2021 |
13,026 |
7,749 |
103 |
1.3% |
| 2022 |
8,433 |
7,861 |
211 |
2.7% |
| 2023 |
2,134 |
2,130 |
8 |
0.4% |
| Grand Total |
98,197 |
48,176 |
998 |
2.1% |
In the opinion of the SLR QP, the data is adequate for the purposes
of Mineral Resource estimation. No material sample bias was identified during the review of the drill data and assays. Observation of
the drill core during the site visit and inspection and validation of the data collected indicate that the drill data is adequate for
the estimation of Mineral Resources. However, it is recommended that the SGO internal laboratory routinely incorporate the issuance of
original batch certificates into their reporting protocols. Likewise, it is recommended that the assay database should be enhanced to
encompass specific details such as analysis dates, batch identifiers, and pertinent laboratory information. SLR understands that implementation
of MxDeposit database is in progress and would resolve these issues.
| | 9-2 | |
| SSR Mining Inc. | Seabee Gold Operation S-K 1300 Report | February 12, 2024 SLR Project No.: 138.21581.00005 |
| 10.0 | Mineral Processing and Metallurgical Testing |
| 10.1 | Style of Mineralization |
The SGO was originally developed based on bench scale metallurgical
test work that characterised the Seabee deposit as a lode-style of mineralisation that was free milling and that would respond to a standard
flow sheet employing gravity recovery and cyanidation. After the successful commissioning of the Seabee mill and the operation matured,
the mill became the reference flow sheet for other mineralisation that was identified as possible mill feed sources.
In addition to the Seabee deposit, other known SGO deposits are also
classified as lode-style deposits, and the gold is present in quartz veins typically in shear zones. Some variations of the host rock
mineralisation occur, with gabbros at Seabee and mafic metavolcanics at the Santoy and Porky deposits. The Santoy deposit has been the
sole source of mill feed since 2017 after the depletion of the Seabee deposit.
With the introduction of Santoy ore to the mill, metallurgical testing
of Santoy drill composites representing the footwall, centre, and hanging wall of the stacked vein zones was completed and produced the
following results:
| · | Diagnostic leach testing of a master composite indicated that 99% of the gold was extractable by cyanide leaching, indicating that
the material is free milling |
| · | In the master composite, approximately 55% of the gold grains were >100 µm in size, indicating that this gold should
be recoverable by gravity concentration |
| · | Recovery of up to 91% of the gold to a gravity concentrate at a 0.18% mass pull |
| · | Cyanide leach gold recovery of gravity tailings of 95% |
| · | Overall gold recovery by gravity concentration and cyanide leaching ranging from 95% to 99% for the samples tested. |
While the representativeness of these samples is unknown, the results were indicative
of the metallurgical response that could be expected from Santoy ore and this has since been
confirmed by actual plant performance while processing Santoy ore since 2017.
| 10.2 | Process Plant Performance |
Monthly average head grades and gold recoveries since 2017 are presented
in Figure 10-1. Gold recovery is generally very consistent within a small range from 95% to 99%. There is a clear correlation between
head grade and recovery, demonstrated by the daily data provided by SGO for 2022 and 2023 presented in Figure 10-2. This indicates
that the lower head grades since mid to late 2022 are likely the main reason for the lower recoveries over the same period.
| | 10-1 | |
| SSR Mining Inc. | Seabee Gold Operation S-K 1300 Report | February 12, 2024 SLR Project No.: 138.21581.00005 |
Figure 10-1: Monthly Plant Head
Grade and Recovery
| | 10-2 | |
| SSR Mining Inc. | Seabee Gold Operation S-K 1300 Report | February 12, 2024 SLR Project No.: 138.21581.00005 |
Figure 10-2: Plant Recovery
Versus Head Grade During 2022 and 2023
The presence of significant amounts of coarse gold in the Santoy ore
(and previously in the Seabee ore) make gravity recovery critical to the overall gold recovery of the process plant. The installation
of a new gravity recovery circuit including Acacia intensive leach reactor (ILR) intended to replace the original Knelson-table circuit
has resulted in improved gravity recovery versus historical gravity recovery. Gravity gold recovery now typically ranges between 50% and
70% with the leach and CIP circuit accounting for the remainder. Overall gold recovery is typically 96% to 98% depending on head grade.
Future gold recovery from Santoy ore can be predicted by the correlation
between head grade and recovery evident in Figure 10-2 using the data from 2022 and 2023.
With the consistent long-term metallurgical response of the Seabee and
Santoy deposits, the focus of metallurgical investigations has been on de-bottlenecking the plant and reducing operating costs.
| | 10-3 | |
| SSR Mining Inc. | Seabee Gold Operation S-K 1300 Report | February 12, 2024 SLR Project No.: 138.21581.00005 |
The plant was originally designed to be able to process 500 tpd.
Subsequent capital projects have included the addition of a primary ball mill and an additional large leach tank. These additions as
well as process optimization combined with setting higher operational targets have resulted in throughput increasing to over 1,200 tpd.
Process improvements have included improved grind size control, improved gravity circuit utilization, improved leach feed thickener chemistry,
reduction in flocculant addition, and improved carbon and cyanide management. The new gravity recovery circuit and ILR unit have resulted
in water balance issues at higher throughput, resulting in the need to use the original gravity recovery circuit at times. SGO is working
to resolve this issue.
The average ore processed daily and plant utilization on a monthly basis
are presented in Figure 10-3. The data shows a gradual increase in daily throughput over the seven years from 2017, as well as improved
consistency in plant utilization, particularly since 2021 with 2020 significantly negatively affected by suspension of operations due
to the COVID-19 pandemic.
Figure 10-3: Plant Average Daily
Throughput and Utilization
SGO continues to work to de-bottleneck the plant targeting an average
throughput of 1,400 t/d. Capacity improvement projects being investigated include:
| · | Optimization of the Acacia gravity recovery circuit and water balance |
| · | Optimization of the grinding circuit performance |
| · | Improvements in thickener performance and flocculant usage |
| · | Improvements in carbon management, with recovery of fine carbon and carbon activity improvement |
| · | Improvements in leach agitation |
| | 10-4 | |
| SSR Mining Inc. | Seabee Gold Operation S-K 1300 Report | February 12, 2024 SLR Project No.: 138.21581.00005 |
The SLR QP is of the opinion that the data derived from the historical
information presented is adequate for predicting future plant throughput and recovery. The SLR QP is not aware of any deleterious elements
that would affect recovery or any reason why throughput should not continue at its current rate.
| | 10-5 | |
| SSR Mining Inc. | Seabee Gold Operation S-K 1300 Report | February 12, 2024 SLR Project No.: 138.21581.00005 |
| 11.0 | Mineral Resource Estimates |
The SGO Mineral Resource estimate encompass the Santoy Mine (Santoy
8, Santoy 9 and GHW-SHW deposits) as well as the Porky West project. SLR conducted all the estimations.
The Santoy Mine and Porky West estimates relied only on diamond drill
hole sample data. Leapfrog Geo was used to create wireframes, and Leapfrog Edge software facilitated grade interpolation into blocks using
Ordinary Kriging (OK) for Santoy Mine and Inverse Distance Cubed (ID3) for Porky West. Blocks were classified as Measured,
Indicated, and Inferred based on a distance-based criterion as well as proximity to development. SLR validated the estimates using industry
standard validation techniques.
Underground constraining shapes for Mineral Resource reporting were
generated with Deswik Stope Optimizer (DSO) software at a 2.61 g/t Au cut-off grade and a 2.0 m minimum thickness to ensure that the minimum
criteria for Reasonable Prospects for Economic Extraction (RPEE) were met.
Mined-out areas were excluded from the Mineral Resource statement. Mineral
Resources are reported exclusive of Mineral Reserves. A summary of underground Mineral Resources for Santoy Mine and Porky West as of
December 31, 2023, is provided in Table 11-1.
Mineral Resources have been classified in accordance with the definitions
for Mineral Resources in S-K 1300, which are similar to Canadian Institute of Mining, Metallurgy and Petroleum (CIM) Definition Standards
for Mineral Resources and Mineral Reserves dated May 10, 2014 (CIM (2014) definitions).
| | 11-1 | |
| SSR Mining Inc. | Seabee Gold Operation S-K 1300 Report | February 12, 2024 SLR Project No.: 138.21581.00005 |
Table 11-1: Summary of Mineral
Resources exclusive of Mineral Reserves – December 31, 2023
| Category |
Project |
Tonnage |
Grade |
Contained Metal |
Cutt-off Grade |
Recovery |
| (000 t) |
(g/t Au) |
(000 oz Au) |
(g/t Au) |
% |
| Measured |
Santoy Mine |
91.9 |
5.5 |
16.3 |
2.61 |
96.4 |
| Total |
91.9 |
5.5 |
16.3 |
| Indicated |
Santoy Mine |
1,021.30 |
3.9 |
127.1 |
| Porky West |
444.3 |
5.2 |
74.9 |
| Total |
1,465.60 |
4.3 |
202 |
| Total Measured + Indicated |
Santoy Mine |
1,113.20 |
4 |
143.4 |
| Porky West |
444.3 |
5.2 |
74.9 |
| Total |
1,557.50 |
4.4 |
218.3 |
| Inferred |
Santoy Mine |
1,658.60 |
4.3 |
230.3 |
| Porky West |
1,088.60 |
6.6 |
232.2 |
| Total |
2,747.20 |
5.2 |
462.5 |
Notes:
| 1. | The definitions for Mineral Resources in S-K 1300 were followed for Mineral Resources. |
| 2. | Mineral Resources are reported based on 31 December 2023 as-mined survey data. |
| 3. | Mineral Resources are estimated at a cut-off grade of 2.61 g/t Au. |
| 4. | Mineral Resources are estimated using a long-term gold price of US$1,750 per ounce, and a US$/C$ exchange rate of 1.33. |
| 5. | Bulk density ranges by domain between 2.65 t/m3 and 2.80 t/m3 . The density assigned to the overburden at Porky
West is 1.70 t/m3. |
| 6. | Gold metallurgical recovery is 96.4%. |
| 7. | Mineral Resources at Santoy Mine are exclusive of Mineral Reserves |
| 8. | There are no Mineral Reserves at Porky West |
| 9. | Mineral Resources that are not Mineral Reserves do not have demonstrated economic viability. |
| 10. | Mineral Resources are reported within underground reporting shapes (DSO shapes). |
| 11. | The point of reference for Mineral Resources is the point of feed into the processing facility. |
| 12. | SSR has 100% ownership of the Project and Mineral Resources are shown on a 100% basis. |
| 13. | A minimum mining width of 2 m was used. |
| 14. | Totals may vary due to rounding. |
The SLR QP is of the opinion that with consideration of the recommendations
summarized in Sections 1 and 23 of this TRS, any issues relating to all relevant technical and economic factors likely to influence the
prospect of economic extraction can be resolved with further work.
| 11.2 | Comparison with Previous Estimate |
Changes to Mineral Resources since the previous estimate for Santoy
Mine (effective December 31, 2022) and Porky West (effective December 31, 2021) can be attributed to the following main criteria in decreasing
order of importance:
| · | Additional drilling at Porky West resulting in a significant increase in Mineral Resources and the conversion of Inferred to Indicated |
| · | Additional drilling in the Santoy Mine resulting in the addition of Resources, conversion of categories, and conversion of Mineral
Resources to Mineral Reserves |
| · | Depletion due to mining activities at the Santoy Mine |
| | 11-2 | |
| SSR Mining Inc. | Seabee Gold Operation S-K 1300 Report | February 12, 2024 SLR Project No.: 138.21581.00005 |
| · | Use of underground reporting shapes (DSO) |
| · | Migration of the model from Geovia Gems to Leapfrog Geo and Edge Software |
| · | Modifications to the estimation approach |
A comparison between the current Mineral Resource estimate, effective
December 31, 2023, and the previous estimates, is provided in Table 11-2.
Table 11-2: Comparison with
Previous Estimates
| Category |
Project |
Previous Estimate1 |
Current Estimate |
Difference % |
| Tonnage |
Grade |
Contained Metal |
Tonnage |
Grade |
Contained Metal |
Tonnage |
Grade |
Contained Metal |
| (000 t) |
(g/t Au) |
(000 oz Au) |
(000 t) |
(g/t Au) |
(000 oz Au) |
(000 t) |
(g/t Au) |
(000 oz Au) |
| Measured |
Santoy Mine |
84 |
11.97 |
32.3 |
91.9 |
5.50 |
16.3 |
9% |
-54% |
-50% |
| Total |
84 |
11.97 |
32.3 |
91.9 |
5.50 |
16.3 |
9% |
-54% |
-50% |
| Indicated |
Santoy Mine |
781 |
11.44 |
287.3 |
1,021.3 |
3.87 |
127.1 |
31% |
-66% |
-56% |
| Porky West |
52 |
5.03 |
8.4 |
444.3 |
5.24 |
74.9 |
754% |
4% |
791% |
| Total |
833 |
11.04 |
295.7 |
1,465.6 |
4.29 |
202.0 |
76% |
-61% |
-32% |
| Total Measured + Indicated |
Santoy Mine |
865 |
11.49 |
319.5 |
1,113.2 |
4.01 |
143.4 |
29% |
-65% |
-55% |
| Porky West |
52 |
5.03 |
8.4 |
444.3 |
5.24 |
74.9 |
754% |
4% |
791% |
| Total |
917 |
11.12 |
328.0 |
1,557.5 |
4.36 |
218.3 |
70% |
-61% |
-33% |
| Inferred |
Santoy Mine |
2,754 |
6.05 |
535.7 |
1,658.6 |
4.32 |
230.3 |
-40% |
-29% |
-57% |
| Porky West |
516 |
4.42 |
73.3 |
1,088.6 |
6.63 |
232.2 |
111% |
50% |
217% |
| Total |
3,270 |
5.79 |
609.0 |
2,747.2 |
5.23 |
462.5 |
-16% |
-10% |
-24% |
Notes:
| 1. | The Santoy Mine previous Mineral Resource estimate has an effective date of December 31, 2022, while
the Porky West previous Mineral Resources estimate has an effective date of December 31, 2021. |
| 2. | Mineral Resources are exclusive of Mineral Reserves. |
| 11.3 | Mineral Resource Database |
Drill hole data used in the updated Mineral Resource database is maintained
in an MS Access database with coordinates in a mine grid projection. Drill hole data used in support of the updated Mineral Resource estimate
were completed between 1947 and 2023 with cut-off dates for each area as set out in Table 11-3. SLR recommends moving
from MS Access to an industry standard database management package.
Table 11-3: Summary of Mineral
Resource Database
| Area |
Database Cut-off
Date |
Number of
Holes |
Length
(m) |
| Santoy Mine |
April 30, 2023 |
3,250 |
710,645.11 |
| Porky West |
October 16, 2023 |
251 |
75,584.58 |
| | 11-3 | |
| SSR Mining Inc. | Seabee Gold Operation S-K 1300 Report | February 12, 2024 SLR Project No.: 138.21581.00005 |
Santoy Mine resource database includes 108,045 assays and 10,878 domain-intersecting
gold assays from 1,160, 1,098 and 479 drill holes for the Santoy 8, 9, and GHW-SHW deposits, respectively. The resource database at Porky
West includes 19,642 assays and 3,728 domain intersecting gold assays.
Metal prices used for Mineral Reserves are based on consensus, long
term forecasts from banks, financial institutions, and other sources. For Mineral Resources, metal prices used are slightly higher than
those used for Mineral Reserves.
A cut-off grade of 2.61 g/t Au was developed for the Santoy Mine deposits
and reflects assumed mining costs of sub-level open stoping (steeply dipping domains) with backfill in addition to processing costs and
gold price. The full operating cost, including mining, processing, and general and administration (G&A) costs, have been used in the
calculations. Capital costs, including sustaining capital, have been excluded. Table 11-4 lists the parameters used to calculate the
cut-off grades.
The Mineral Resource cut-off grade developed for the Santoy Mine was
used for Porky West.
Table 11-4: Mineral Resource
Cut-Off Grade Inputs
| Item |
Unit |
Sub-Level Stoping |
| Mining Rate |
dry tpd |
1,400 |
| Processing Rate |
dry tpd |
1,400 |
| Gold Metallurgical Recovery |
% |
95.6 |
| Gold Price |
US$/oz |
1,750 |
| Exchange Rate (CAD to USD) |
C$:US$ |
1.33 |
| Mining and Maintenance cost |
US$/t milled |
47.14 |
| Processing and ROM Ore Transport |
US$/t milled |
35.29 |
| G&A |
US$/t milled |
52.73 |
| Total |
US$/t milled |
135.16 |
| |
C$/t milled |
179.77 |
| Break-Even Cut-Off Grade |
g/t Au |
2.61 |
Underground constraining shapes for Mineral Resource reporting were
generated using DSO at a 2.61 g/t Au cut-off grade and a 2.0 m minimum thickness to ensure that the minimum criteria for RPEEE were met.
SLR notes that a generalised cut-off grade has been used across all
deposits. While the cut-off grade as applied to all deposits is reasonable, SLR recommends investigating separate cut-off grades for each
deposit to account for individual processing recoveries, mining methods, and particularities such as haulage distance and existing infrastructure.
| | 11-4 | |
| SSR Mining Inc. | Seabee Gold Operation S-K 1300 Report | February 12, 2024 SLR Project No.: 138.21581.00005 |
The Santoy Mineral Resource estimate, with an effective date of December
31, 2023, is summarized by deposit in Table 11-5.
Table 11-55: Summary of Mineral
Resources exclusive of Mineral Reserves for Santoy Mine, by Deposit – December 31, 2023
| Category |
Deposit |
Tonnage |
Grade |
Contained Metal |
Cutt-off Grade |
Recovery |
| (000 t) |
(g/t Au) |
(000 oz Au) |
(g/t Au) |
% |
| Measured |
Santoy 8 |
71.5 |
5 |
11.4 |
2.61 |
96.4 |
| Santoy 9 |
20.4 |
7.41 |
4.9 |
| Total |
91.9 |
5.5 |
16.3 |
| Indicated |
Santoy 8 |
181.6 |
4.3 |
25.1 |
| Santoy 9 |
167.7 |
5.42 |
29.2 |
| GHW-SHW |
672 |
3.37 |
72.7 |
| Total |
1,021.30 |
3.87 |
127.1 |
| Total Measured + Indicated |
Santoy 8 |
253.1 |
4.5 |
36.5 |
| Santoy 9 |
188.1 |
5.64 |
34.1 |
| GHW-SHW |
672 |
3.37 |
72.7 |
| Total |
1,113.20 |
4.01 |
143.4 |
| Inferred |
Santoy 8 |
437.6 |
4.9 |
68.9 |
| Santoy 9 |
327 |
5.09 |
53.5 |
| GHW-SHW |
893.9 |
3.75 |
107.9 |
| Total |
1,658.60 |
4.32 |
230.3 |
Notes:
| 1. | The definitions for Mineral Resources in S-K 1300 were followed for Mineral Resources. |
| 2. | Mineral Resources are reported based on 31 December 2023 as-mined survey data. |
| 3. | Mineral Resources are estimated at a cut-off grade of 2.61 g/t Au. |
| 4. | Mineral Resources are estimated using a long-term gold price of US$1,750 per ounce, and a US$/C$ exchange rate of 1.33. |
| 5. | Bulk density ranges by domain between 2.65 t/m3 and 2.80 t/m3. The density assigned to the overburden at Porky West is
1.70 t/m3. |
| 6. | Gold metallurgical recovery is 96.4%. |
| 7. | Mineral Resources are exclusive of Mineral Reserves. |
| 8. | Mineral Resources that are not Mineral Reserves do not have demonstrated economic viability. |
| 9. | Mineral Resources are reported within underground reporting shapes (DSO shapes). |
| 10. | The point of reference for Mineral Resources is the point of feed into the processing facility. |
| 11. | SSR has 100% ownership of the Project and Mineral Resources are shown on a 100% basis. |
| 12. | A minimum mining width of 2 m was used. |
| 13. | Totals may vary due to rounding. |
| 11.5.1 | Geological Interpretation |
The previous interpretation completed by the SSR in 2022 was completed
using explicit polyline interpretation in Geovia GEMS. The geological interpretation has been migrated to Leapfrog Geo for the 2023 Mineral
Resource estimate update adopting Leapfrog’s vein modelling approach. A total of twelve veins were modeled, in three separate projects:
| · | Santoy 8: 8A_B, 8A_FW, 8A_T, 8C, 8D, 8F and 8G. |
| · | GHW: GHW, SHW, East and West. It is noted that only GHW and SHW were used as estimation domains. |
| | 11-5 | |
| SSR Mining Inc. | Seabee Gold Operation S-K 1300 Report | February 12, 2024 SLR Project No.: 138.21581.00005 |
Wireframe domains were built using an approximate gold grade cut-off
of 2 g/t Au. Samples below this grade were included when the associated logged lithology corresponded to the mineralization zone. A minimum
thickness of one metre was targeted, but was not always possible to maintain. Domain lateral extensions were defined at a limit of 50%
of the distance to an excluded drill hole, although no consistent extension pattern was considered at depth to leave it open for exploration.
Santoy 8 and 9 veins are generally subvertical and extend from the base
of overburden to a maximum of 1,100 vertical metres. Their strike is east-west, dipping approximately 50 degrees North. The average vein
thickness ranges between 5 m for Santoy 8 and 3 m for Santoy 9, and maximum thicknesses oscillate from 14 m (Santoy 9) to 20 m (Santoy
8). Domain dimensions range along strike between 270 m and 1,150 m and down dip from 80 m to 1,500 m. There is good potential to
increase the Mineral Resource base for Santoy Mine underground deposits at depth, and additional exploration and development is warranted.
GHW and SHW also generally strike east-west, with the dip slightly shallower
than at Santoy 8 and 9, where the dip ranges between 37° and 40°
to the northwest. Domains extend vertically 1,300 m below the surface. GHW-SHW thickness varies locally between 5 m and 30 m
and domain dimensions along strike ranges between 600 m and 1,150 m (at depth) and approximately 2,000 m down dip.
The granodiorite that hosts GHW-SHW was modelled to serve as a guide
to the mineralization wireframes given the strong relationship between grade and the intrusion contact. It should be noted that while
grade occurs proximal to the contact, the angle of the veins responsible for gold mineralization ranges from parallel to perpendicular,
depending on the orientation of the granodiorite with respect to deposit scale shearing.
Final mineralization wireframes of Santoy 8, Santoy 9, and GHW-SHW are
presented in Figure 11-1 to Figure 11-3, respectively.
| | 11-6 | |
| SSR Mining Inc. | Seabee Gold Operation S-K 1300 Report | February 12, 2024 SLR Project No.: 138.21581.00005 |
Figure 11-1: Santoy 8 Mineralization
Wireframes
SSR Mining Corp.
Seabee Gold Operation
Saskatchewan, Canada
Santoy 8 Mineralization
Wireframes
| | 11-7 | |
| SSR Mining Inc. | Seabee Gold Operation S-K 1300 Report | February 12, 2024 SLR Project No.: 138.21581.00005 |
Figure 11-2: Santoy 9 Mineralization
Wireframes
SSR Mining Corp.
Seabee Gold Operation
Saskatchewan, Canada
Santoy 9 Mineralization
Wireframes
| | 11-8 | |
| SSR Mining Inc. | Seabee Gold Operation S-K 1300 Report | February 12, 2024 SLR Project No.: 138.21581.00005 |
Figure 11-3: GHW-SHW Mineralization
Wireframes
SSR Mining Corp.
Seabee Gold Operation
Saskatchewan, Canada
GHW – SHW Mineralization
Wireframes
| | 11-9 | |
| SSR Mining Inc. | Seabee Gold Operation S-K 1300 Report | February 12, 2024 SLR Project No.: 138.21581.00005 |
The compositing strategy used at the Santoy Mine is as follows:
| · | Santoy 8A_B, 8A_FW, 8A_T and 8G: 1 m |
| · | Santoy 8C, 8D, 8F: 1.5 m |
| · | Santoy 9A, 9B and 9C: 1 m |
Gold assay and composite statistics per domain are summarized in Table
11-6.
Table 11-6: Gold Assay and Composite
Statistics
| Domain |
Assay |
Composite |
| Count |
Length
(m) |
Min.
(g/t Au) |
Mean
(g/t Au) |
Max.
(g/t Au) |
CV |
Count |
Length
(m) |
Min.
(g/t Au) |
Mean
(g/t Au) |
Max.
(g/t Au) |
CV |
| |
Santoy 8 |
1 m |
| 8A_B |
4,843 |
5,034.30 |
0 |
4.00 |
322.03 |
3.79 |
5,296 |
5,035.38 |
0 |
4.00 |
245.00 |
3.25 |
| 8A_FW |
772 |
749.33 |
0 |
4.53 |
140.37 |
2.70 |
804 |
749.24 |
0 |
4.53 |
106.46 |
2.35 |
| 8A_T |
1,388 |
1,339.89 |
0 |
2.29 |
118.4 |
2.84 |
1,486 |
1,392.35 |
0 |
2.31 |
118.17 |
2.56 |
| 8G |
93 |
109.58 |
0 |
1.70 |
36.45 |
2.59 |
135 |
125.85 |
0 |
1.85 |
36.45 |
2.74 |
| |
Santoy 8 |
1.5 m |
| 8C |
808 |
848.00 |
0 |
2.28 |
144.38 |
4.06 |
628 |
868.34 |
0 |
2.35 |
144.38 |
3.58 |
| 8D |
238 |
259.24 |
0 |
2.05 |
132.87 |
4.53 |
196 |
266.38 |
0 |
2.00 |
80.38 |
3.36 |
| 8F |
807 |
891.00 |
0 |
3.29 |
157.4 |
3.46 |
675 |
923.97 |
0 |
3.24 |
95.55 |
2.55 |
| |
Santoy 9 |
1 m |
| 9A |
2,427 |
2,918.41 |
0 |
5.99 |
3,887.8 |
11.28 |
3,198 |
2,918.08 |
0 |
5.99 |
2,332.68 |
8.15 |
| 9B |
1,403 |
1,463.19 |
0 |
5.47 |
524 |
4.16 |
1,634 |
1,462.66 |
0 |
5.47 |
313.30 |
3.64 |
| 9C |
2,192 |
2,307.76 |
0 |
9.73 |
4,851.80 |
8.41 |
2,510 |
2,307.51 |
0 |
9.73 |
2,426.47 |
6.12 |
| |
GHW-SHW |
2 m |
| GHW |
5,904 |
7,027.73 |
0 |
1.55 |
292.57 |
5.00 |
3,523 |
7,029.54 |
0 |
1.55 |
148.24 |
3.75 |
| SHW |
3,324 |
4,121.53 |
0 |
1.06 |
117.60 |
4.52 |
2,072 |
4,131.13 |
0 |
1.06 |
57.99 |
3.18 |
Notes:
| 15. | Unsampled intervals assigned a null value |
| | 11-10 | |
| SSR Mining Inc. | Seabee Gold Operation S-K 1300 Report | February 12, 2024 SLR Project No.: 138.21581.00005 |
11.5.2.2
Treatment of High Grade Assays
Capping Levels
Table 11-7 summarizes the Santoy Mine capped gold composites statistics
by domain. A capping strategy was developed by SSR, then reviewed by SLR using raw assays basic statistics, composite statistics, histograms,
log probability plots, and decile analysis to determine a gold cap for each domain independently. For the most part, the capping levels
were found to be reasonable and therefore adopted by SLR with the exception of a few minor changes for zone 8A_FW, 8D, 9A, 9B and GHW.
Caps were applied to composites.
Table 11-7: Gold Composites
Statistics and Capping Levels (in g/t Au)
| Domain |
Min |
Max |
Mean |
CV |
Cap Value |
No of Cap |
Capped Mean |
Capped CV1 |
% Metal Loss |
| Santoy 8 |
| 8A_B |
0 |
245 |
4.00 |
3.25 |
110 |
14 |
3.87 |
2.97 |
3.25 |
| 8A_FW |
0 |
106.46 |
4.53 |
2.35 |
60 |
8 |
4.31 |
2.1 |
4.86 |
| 8A_T |
0 |
118.17 |
2.31 |
2.56 |
35 |
8 |
2.2 |
2.11 |
4.76 |
| 8C |
0 |
144.38 |
2.35 |
3.58 |
30 |
6 |
1.98 |
2.39 |
15.74 |
| 8D |
0 |
80.38 |
2 |
3.34 |
16 |
1 |
1.64 |
2.04 |
18.14 |
| 8F |
0 |
95.55 |
3.24 |
2.55 |
45 |
6 |
3.05 |
2.23 |
5.86 |
| 8G |
0 |
36.45 |
1.85 |
2.74 |
15 |
2 |
1.51 |
1.97 |
18.47 |
| Santoy 9 |
| 9A |
0 |
2332.68 |
5.99 |
8.15 |
120 |
19 |
4.65 |
3.04 |
22.37 |
| 9B |
0 |
313.3 |
5.47 |
3.64 |
100 |
14 |
4.83 |
2.92 |
11.7 |
| 9C |
0 |
2426.47 |
9.73 |
6.12 |
130 |
25 |
7.49 |
2.57 |
23 |
| GHW-SHW |
| GHW |
0 |
148.24 |
1.55 |
3.75 |
35 |
10 |
1.42 |
2.62 |
8.39 |
| SHW |
0 |
57.99 |
1.06 |
3.18 |
25 |
11 |
0.99 |
2.63 |
6.18 |
Note:
| 16. | Coefficient of Variation (CV) |
High Grade Restriction
To reduce the influence of high grade samples and artefacts in the GHW
zone, but also capture the trend of the mineralization at depth, a restricted fourth pass was used. The high grade gold restriction capped
the composites to 5 g/t Au at distances greater than 60 m in the x-axis and y-axis in the fourth pass of the GWH OK interpolation. High
grade restrictions were not applied to any other zones of Santoy Mine.
| | 11-11 | |
| SSR Mining Inc. | Seabee Gold Operation S-K 1300 Report | February 12, 2024 SLR Project No.: 138.21581.00005 |
The gold grade continuity for the Santoy and GHW-SHW projects was investigated
by generating a set of grade shells in Leapfrog for each zone within the mineralized envelopes. Several moderately plunging trends were
identified, generally trending from the southeast to the northwest in both the Santoy zones and GHW-SHW. Examples of the grade contouring
of zone 9A and GHW-SHW are given in Figure 11-4 and Figure 11-5. The orientation of these trends assisted in during experimental
variography and search ellipse setup.
Variogram models were fit to experimental variograms in original units
and in normal-scored. In the case of the normal-scored variograms, the back transformed variogram models were used for interpolation.
The most well supported and stable variogram for each deposit was used for interpolation purposes, namely; 9A, 8A_B, and 8A_FW, and GHW.
The variogram modes used during interpolation are provided in Table
11-8:
Table 11-8: Santoy Mine Variogram
Parameters
| Domain |
Used For |
Rotations1 |
Nugget |
Variances2 |
Structure 1
Type |
Structure 2
Type |
Structure 1 Ranges (m)3 |
Structure 2 Ranges (m) |
| 8A_B |
8A_B, 8A_T, 8D |
(52/1/46) |
0.2 |
(0.60, 0.20) |
Exponential |
Spherical |
(6,6,6) |
(160,80,6) |
| 8A_FW |
8A_FW, 8C, 8F, 8G |
(52/1/46) |
0.18 |
(0.46,0.36) |
Spherical |
Spherical |
(10,5,5) |
(80,30, 5) |
| 9A |
All of Santoy 9 |
(49/359/44) |
0.2 |
(0.58, 0.22) |
Exponential |
Spherical |
(16,10,10) |
(65,25,10) |
| GHW |
GHW |
(38/311/79) |
0.3 |
(0.40,0.30) |
Spherical |
Spherical |
(15,3,30) |
(150,3.6,36) |
| SHW |
SHW |
(60/8/44) |
0.15 |
(0.73) |
Spherical |
- |
(100,30,5) |
- |
Notes:
| 1. | Leapfrog rotation (Dip, Dip Azimuth, Pitch) |
| 2. | Variance for structures 1 and 2 (C1, C2) |
| 3. | Ranges in Major, Semi-Major and Minor directions |
Figure 11-6 to Figure 11-8 show the variograms for the 8A_B,
9A vein, and GHW.
The variograms were used to support search ellipsoid anisotropy, linear
trends observed in the data, and Mineral Resource classification decisions. In the case of the variogram used for the estimation of GHW,
the semi-major and minor values were inversed to better represent the orientation of the mineralized veins within the GHW domain.
| | 11-12 | |
| SSR Mining Inc. | Seabee Gold Operation S-K 1300 Report | February 12, 2024 SLR Project No.: 138.21581.00005 |
Figure 11-4: Trend Analysis
for Santoy 9 – Zone 9A
SSR Mining Corp.
Seabee Gold Operation
Saskatchewan, Canada
Trend Analysis for Santoy
9 – Zone 9A
| | 11-13 | |
| SSR Mining Inc. | Seabee Gold Operation S-K 1300 Report | February 12, 2024 SLR Project No.: 138.21581.00005 |
Figure 11-5: Trend Analysis
for GHW-SHW
SSR Mining Corp.
Seabee Gold Operation
Saskatchewan, Canada
Trend Analysis for GHW
- SHW
| | 11-14 | |
| SSR Mining Inc. | Seabee Gold Operation S-K 1300 Report | February 12, 2024 SLR Project No.: 138.21581.00005 |
Figure 11-6: Back Transformed
Variogram for 8A_B Zone
| | 11-15 | |
| SSR Mining Inc. | Seabee Gold Operation S-K 1300 Report | February 12, 2024 SLR Project No.: 138.21581.00005 |
Figure 11-7: Back Transformed
Variogram for 9A Zone
| | 11-16 | |
| SSR Mining Inc. | Seabee Gold Operation S-K 1300 Report | February 12, 2024 SLR Project No.: 138.21581.00005 |
Figure 11-8: Directional Variogram
for GHW Zone
| | 11-17 | |
| SSR Mining Inc. | Seabee Gold Operation S-K 1300 Report | February 12, 2024 SLR Project No.: 138.21581.00005 |
| 11.5.4 | Search Strategy and Grade Interpolation Parameters |
Grade interpolation was performed on parent blocks using ordinary kriging
(OK) interpolation approach with progressively larger interpolation passes (Table 11-9). Search ellipses for grade interpolation were
anisotropic for all zones and oriented using variable orientation (VO). Search ellipse dimensions and orientations are detailed in Table
11-9 and the composite selection plan is outlined in Table 11-10.
Table 11-9: Search Strategy
and Grade Interpolation Parameters
| Deposit |
Domain |
Method |
Orientation |
1st Pass |
2nd Pass |
3rd Pass |
4th Pass |
| X-axis |
Y-axis |
Z-axis |
X-axis |
Y-axis |
Z-axis |
X-axis |
Y-axis |
Z-axis |
X-axis |
Y-axis |
Z-axis |
| (m) |
(m) |
(m) |
(m) |
(m) |
(m) |
(m) |
(m) |
(m) |
(m) |
(m) |
(m) |
| Santoy 8 |
8A_B |
OK |
VO |
16.5 |
15 |
1.5 |
33 |
30 |
3 |
66 |
60 |
6 |
- |
- |
- |
| 8A_FW |
OK |
VO |
17.5 |
17.5 |
1.75 |
35 |
35 |
3.5 |
70 |
70 |
7 |
- |
- |
- |
| 8A_T |
OK |
VO |
17.5 |
15 |
2 |
35 |
30 |
4 |
70 |
60 |
8 |
- |
- |
- |
| 8C |
OK |
VO |
13.6 |
6.5 |
3 |
27 |
13 |
6 |
54 |
26 |
12 |
- |
- |
- |
| 8D |
OK |
VO |
16 |
16 |
1.5 |
32 |
32 |
3 |
64 |
64 |
6 |
- |
- |
- |
| 8F |
OK |
VO |
13.5 |
7.5 |
4 |
27 |
15 |
8 |
54 |
30 |
16 |
- |
- |
- |
| 8G |
OK |
VO |
18 |
18 |
1.75 |
36 |
36 |
3.5 |
72 |
72 |
7 |
- |
- |
- |
| Santoy 9 |
9A |
OK |
VO |
24 |
20.5 |
5 |
48 |
41 |
10 |
96 |
82 |
20 |
- |
- |
- |
| 9B |
OK |
VO |
12.5 |
12.5 |
1.25 |
25 |
25 |
2.5 |
50 |
50 |
5 |
- |
- |
- |
| 9C |
OK |
VO |
20 |
7 |
4 |
40 |
14 |
4 |
80 |
28 |
8 |
- |
- |
- |
| GHW |
GHW |
OK |
VO |
25 |
25 |
5 |
50 |
50 |
5 |
100 |
100 |
10 |
600 |
600 |
200 |
| SHW |
OK |
VO |
75 |
25 |
6 |
150 |
50 |
6 |
300 |
150 |
10 |
- |
- |
- |
Note:
| 1. | GHW uses the variogram presented in section 11.2.4.2 but with the semi-major and minor values inversed to better represent the narrowness
and perpendicular orientation of the mineralized veins within the GHW domain. |
| | 11-18 | |
| SSR Mining Inc. | Seabee Gold Operation S-K 1300 Report | February 12, 2024 SLR Project No.: 138.21581.00005 |
Table 11-10: Composite Selection
Plan
| Domain |
1st Pass |
2nd Pass |
3rd Pass |
4th Pass |
| Min No. |
Max No. |
DH Limit |
Min No. |
Max No. |
DH Limit |
Min No. |
Max No. |
DH Limit |
Min No. |
Max No. |
DH Limit |
HG Restriction |
| Santoy 8 and Santoy 9 (All veins) |
5 |
8 |
2 |
3 |
8 |
2 |
2 |
12 |
- |
- |
- |
- |
- |
| GHW |
6 |
15 |
5 |
6 |
15 |
5 |
6 |
15 |
5 |
1 |
10 |
|
5g/t at 10% |
| SHW |
4 |
12 |
3 |
4 |
12 |
3 |
1 |
12 |
- |
- |
- |
- |
- |
Density values for each zone were provided by SSR and ranged between
2.65 g/cm3 and 2.75 g/cm3 within mineralization domains. In SLR’s opinion, these are reasonable
densities for this type of mineralization. Density has been measured by the site laboratory as well as sporadically by ALS as part of
analysis process. The density database from drill holes contains 535 acceptable values for the Santoy 9 deposit and 97 in GHW deposit.
Approximately 47 measurements on chip and muck samples were also available for this study. A total of 649 samples were available although
only 316 measurements were able to be assigned to a particular zone.
Density values were assigned based on average density readings by domain,
by proximal vein, or by the dataset average where no samples were taken. Assigned density values by vein are presented in Table 11-11.
Measurements have been taken inconsistently through the years, and very few results are available to fully understand the density of each
domain. Another 66 sample measurements taken at the mill were available for the evaluation of the density, although it was not possible
to separate them per domain. The average of the Santoy 8 and Santoy 9 of the mill on these measurements is 2.75 g/cm3 and 2.64 g/cm3
for the bulk sample values of GHW. Although the average density for measurement in Santoy 9 zones are closer to 2.8 g/cm3,
it was decided to maintain the density assigned in the previous Mineral Resource Estimate of 2022 of 2.75 g/cm3 due to the
small population of data available and the results from the mill. SLR recommends adding density measurements as part of the drill hole
sampling protocol particularly in domains that were not previously sampled, taking more density samples in non-mineralized lithology and
continuing measurements in all mineralized zones.
Table 11-11: Density Values
per Domain
| Domain |
Source |
Count |
Mean
(g/cm3 ) |
Assigned Density
(g/cm3 ) |
| 8A_B |
Chips and Mucks |
43 |
2.76 |
2.75 |
| 8A_FW |
- |
- |
- |
2.75 |
| 8A_T |
- |
- |
- |
2.75 |
| 8C |
- |
- |
- |
2.75 |
| 8D |
- |
- |
- |
2.75 |
| 8F |
Chips and Mucks |
4 |
2.76 |
2.75 |
| | 11-19 | |
| SSR Mining Inc. | Seabee Gold Operation S-K 1300 Report | February 12, 2024 SLR Project No.: 138.21581.00005 |
| Domain |
Source |
Count |
Mean
(g/cm3 ) |
Assigned Density
(g/cm3 ) |
| 8G |
No Data |
- |
- |
2.75 |
| 9A |
DH |
92 |
2.85 |
2.75 |
| 9B |
DH |
32 |
2.83 |
2.75 |
| 9C |
DH |
63 |
2.81 |
2.75 |
| GHW |
DH |
76 |
2.65 |
2.65 |
| SHW |
DH |
6 |
2.64 |
2.65 |
Block model setup and interpolation was completed in Seequent’s
Leapfrog Edge software. Block models position and dimensions for the three deposits of Santoy Mine are presented in Table 11-12 to
Table 11-14. SLR considers the block model sizes appropriate for the deposit geometry and proposed mining methods.
Table 11-12: Santoy 8 - Block
Model Extents and Dimensions
| Type |
X |
Y |
Z |
| Base Point (m) |
3,940 |
4,560 |
30 |
| Boundary Size (m) |
1,551 |
1,098 |
1,056 |
| Parent Block Size (m) |
3 |
3 |
3 |
| Min. Sub-block Size (m) |
1.5 |
0.75 |
1.5 |
| Rotation (°) |
0 |
0 |
0 |
Table 11-13: Santoy 9 - Block
Model Extents and Dimensions
| Type |
X |
Y |
Z |
| Base Point (m) |
3,180 |
4,560 |
25 |
| Boundary Size (m) |
1,362 |
1,080 |
1,170 |
| Parent Block Size (m) |
3 |
3 |
3 |
| Min. Sub-block Size (m) |
1.5 |
0.75 |
1.5 |
| Rotation (°) |
0 |
0 |
0 |
| | 11-20 | |
| SSR Mining Inc. | Seabee Gold Operation S-K 1300 Report | February 12, 2024 SLR Project No.: 138.21581.00005 |
Table 11-14: GHW-SHW - Block
Model Extents and Dimensions
| Type |
X |
Y |
Z |
| Base Point (m) |
2,450 |
4,570 |
27 |
| Boundary Size (m) |
4,254 |
1,530 |
1,329 |
| Parent Block Size (m) |
3 |
3 |
3 |
| Min. Sub-block Size (m) |
1.5 |
0.75 |
1.5 |
| Rotation (°) |
0 |
0 |
0 |
Mineral Resources have been classified in accordance with the definitions
for Mineral Resources in S-K 1300, which are consistent with Canadian Institute of Mining, Metallurgy and Petroleum (CIM) Definition Standards
for Mineral Resources and Mineral Reserves dated May 10, 2014 (CIM (2014) definitions).
In the S-K 1300 classification, a Mineral Resource is defined as “a
concentration or occurrence of material of economic interest in or on the Earth’s crust in such form, grade or quality and quantity
that there are reasonable prospects for economic extraction”. Mineral Resources are classified into Measured, Indicated, and Inferred
categories. A Mineral Reserve is defined as the “economically mineable part of a Measured and/or Indicated Mineral Resource”
demonstrated by studies at Pre-Feasibility or Feasibility level as appropriate. Mineral Reserves are classified into Proven and Probable
categories.
The previous Santoy Mine classification strategy was used for this estimate.
Mineral Resources material represents areas defined within a certain drill hole spacing. At SGO, it consists principally of applying the
ranges in meters of the ellipsoid corresponding to pass 1 to Measured material, pass 2 to Indicated material and pass 3 to Inferred material.
Additionally, to classify material as Measured, it also requires proximity to development. Table 11-15 shows the differences and parameters
used to generate the classification of Santoy Mine. These definitions are in places modified to consider geological understanding, grade
continuity, and the creation of cohesive class boundaries. SLR notes that some lower grade material was included to preserve continuity.
| | 11-21 | |
| SSR Mining Inc. | Seabee Gold Operation S-K 1300 Report | February 12, 2024 SLR Project No.: 138.21581.00005 |
Table 11-15: Mineral Resource
Classification Parameters
| Deposit |
Zone |
Measured |
Indicated |
Inferred |
| Santoy 8 |
8A_B |
Up to ~15 m from existing development, drill spacing up to ~15m |
drill spacing up to ~30 m |
drill spacing up to ~60 m |
| 8A_FW |
Up to ~15 m from existing development, drill spacing up to ~15 m |
drill spacing up to ~30 m |
drill spacing up to ~60 m |
| 8A_T |
Up to ~20 m from existing development, drill spacing up to ~17.5 m (ellipsoid range Pass 1) |
drill spacing up to ~35 m (ellipsoid range Pass 2) |
drill spacing up to ~70 m (ellipsoid range Pass 3) |
| 8C |
No Measured Material |
No current Indicated Material - drill spacing up to ~27 m (ellipsoid range Pass 2) |
drill spacing up to ~54 m (ellipsoid range Pass 3) |
| 8D |
No Measured Material |
No current Indicated Material - drill spacing up to ~32 m (ellipsoid range Pass 2) |
drill spacing up to ~64 m (ellipsoid range Pass 3) |
| 8F |
No Measured Material |
No current Indicated Material - drill spacing up to ~27 m (ellipsoid range Pass 2) |
drill spacing up to ~54 m (ellipsoid range Pass 3) |
| 8G |
No Measured Material |
No current Indicated Material - drill spacing up to ~36 m (ellipsoid range Pass 2) |
drill spacing up to ~72 m (ellipsoid range Pass 3) |
| Santoy 9 |
9A |
Up to 25 m from existing development, drill spacing up to ~25 m |
drill spacing up to ~50 m (ellipsoid range Pass 2) |
drill spacing up to ~100 m (ellipsoid range Pass 3) |
| 9B |
Up to 12.5 m from existing development, drill spacing up to ~12.5 m |
drill spacing up to ~25m (ellipsoid range Pass 2) |
drill spacing up to ~50 m (ellipsoid range Pass 3) |
| 9C |
Up to 20 m from existing development, drill spacing up to ~20 m |
drill spacing up to ~40 m (ellipsoid range Pass 2) |
drill spacing up to ~80 m (ellipsoid range Pass 3) |
| GHW-SHW |
GHW-SHW |
No Measured Material |
drill spacing up to ~50 m |
drill spacing up to ~100 m |
Figure 11-9 to Figure 11-11 illustrates the classification of
Santoy 8, Santoy 9, and GHW-SHW, respectively.
| | 11-22 | |
| SSR Mining Inc. | Seabee Gold Operation S-K 1300 Report | February 12, 2024 SLR Project No.: 138.21581.00005 |
Figure 11-9: Exclusive Underground
Reporting Shapes of Santoy 8 Classification
SSR Mining Inc.
Seabee Gold Operations (SGO)
Saskatchewan, Canada
Exclusive Underground
Reporting Shapes of Santoy 8 Classification
| | 11-23 | |
| SSR Mining Inc. | Seabee Gold Operation S-K 1300 Report | February 12, 2024 SLR Project No.: 138.21581.00005 |
Figure 11-10: Exclusive Underground
Reporting Shapes of Santoy 9 Classification
SSR Mining Inc.
Seabee Gold Operations (SGO)
Saskatchewan, Canada
Exclusive Underground
Reporting Shapes of Santoy 9 Classification
| | 11-24 | |
| SSR Mining Inc. | Seabee Gold Operation S-K 1300 Report | February 12, 2024 SLR Project No.: 138.21581.00005 |
Figure 11-11: Exclusive Underground
Reporting Shapes of GHW-SHW Classification
SSR Mining Inc.
Seabee Gold Operations (SGO)
Saskatchewan, Canada
Exclusive Underground
Reporting Shapes of GHW-SHW Classification
| | 11-25 | |
| SSR Mining Inc. | Seabee Gold Operation S-K 1300 Report | February 12, 2024 SLR Project No.: 138.21581.00005 |
| 11.5.8 | Block Model Validation |
Blocks were validated using common validation techniques including:
| · | Visual inspection of composite versus block grades (Figure 11-12 and Figure 11-13) |
| · | Comparison between ID2, OK and nearest neighbour (NN) mean swath plots (Figure 11-14 and Figure 11-15) |
| · | Wireframe to block model volume confirmation (Table 11-16) |
| · | NN and ID2 versus OK block statistics (Table 11-17) |
Based on the validation steps performed, SLR is of the opinion that
the Santoy Mine Mineral Resource estimates are suitable for public disclosure and to support the estimation of Mineral Reserves:
| · | Visual inspection of grade, mean comparisons and swath plots show that the estimation setups are working as intended, the boundary
conditions and use of input data is appropriate, there is no significant over extrapolation of grades and the smoothing of grades as compared
to the input data is as expected. |
| · | The volume comparisons demonstrate that the block model is an appropriate volumetric representation of the in situ mineralization. |
| | 11-26 | |
| SSR Mining Inc. | Seabee Gold Operation S-K 1300 Report | February 12, 2024 SLR Project No.: 138.21581.00005 |
Figure 11-12: Visual Validation
of 8A_B and 8A_FW Gold Composite and Block Grades
SSR Mining Corp.
Seabee Gold Operation
Saskatchewan, Canada
Visual Validation of
8 A-B and 8A-FW Gold Composite and Block Grades
| | 11-27 | |
| SSR Mining Inc. | Seabee Gold Operation S-K 1300 Report | February 12, 2024 SLR Project No.: 138.21581.00005 |
Figure 11-13: Visual Validation
of Santoy 9 Gold Composite and Block Grades
SSR Mining Corp.
Seabee Gold Operation
Saskatchewan, Canada
Visual Validation of
Santoy 9 Gold Composite and Block Grades
| | 11-28 | |
| SSR Mining Inc. | Seabee Gold Operation S-K 1300 Report | February 12, 2024 SLR Project No.: 138.21581.00005 |
Figure 11-14: Swath Plots Comparing
OK, ID2 and NN Estimate Results within Santoy 9
Notes:
| 1. | Orange, black, and green lines represent NN, ID, and OK estimate results, respectively. |
| | 11-29 | |
| SSR Mining Inc. | Seabee Gold Operation S-K 1300 Report | February 12, 2024 SLR Project No.: 138.21581.00005 |
Figure 11-15: Swath Plots Comparing
OK, ID2 and NN Estimate Results within GHW-SHW
Notes:
| 1. | Orange, black, and green
lines represent NN, ID, and OK estimate results, respectively.
|
| | 11-30 | |
| SSR Mining Inc. | Seabee Gold Operation S-K 1300 Report | February 12, 2024 SLR Project No.: 138.21581.00005 |
Table 11-16: Wireframe to Block
Model Volume Confirmation
| Zones |
Wireframe Volume
(000 m³) |
Block Model Volume
(000 m³) |
Confirmation
% |
| 8A_B |
2,204,000 |
2,203,548 |
99.97 |
| 8A_FW |
164,990 |
165,107 |
100 |
| 8A_T |
586,770 |
587,228 |
100 |
| 8C |
368,940 |
369,095 |
100 |
| 8D |
174,890 |
174,874 |
99.99 |
| 8F |
474,520 |
474,641 |
100 |
| 8G |
150,130 |
150,111 |
99.98 |
| 9A |
1,861,900 |
1,862,262 |
100 |
| 9B |
294,070 |
293,942 |
99.95 |
| 9C |
1,789,000 |
1,789,529 |
100 |
| GHW |
6,232,500 |
6,227,434 |
99.91 |
| SHW |
12,025,000 |
11,748,011 |
97.69 |
| Total |
26,326,710 |
26,045,782 |
98.93 |
Table 11-17: Gold Statistics
between Validation NN and ID2 Model and OK
| Deposit |
Mean (g/t Au) |
Max (g/t Au) |
CV |
| Capped Composite |
Block Model NN |
Block Model OK |
Block Model ID2 |
Capped Composite |
Block Model NN |
Block Model OK |
Block Model ID2 |
Capped Composite |
Block Model NN |
Block Model OK |
Block Model ID2 |
| Santoy 8 |
3.32 |
2.69 |
2.65 |
2.61 |
110 |
110 |
83.37 |
107.34 |
2.84 |
3.01 |
1.64 |
1.90 |
| Santoy 9 |
5.72 |
3.59 |
3.79 |
3.87 |
130 |
130 |
125.55 |
127.55 |
2.83 |
3.50 |
1.85 |
2.08 |
| GHW-SHW |
1.02 |
1.04 |
0.97 |
0.84 |
35 |
35 |
29.17 |
30.15 |
2.96 |
3.46 |
1.38 |
1.72 |
| | 11-31 | |
| SSR Mining Inc. | Seabee Gold Operation S-K 1300 Report | February 12, 2024 SLR Project No.: 138.21581.00005 |
The Porky West Mineral Resource estimate with an effective date of December
31, 2023, is presented in Table 11-18.
Table 11-18: Summary of Mineral
Resources for Porky West – December 31, 2023
| Category |
Tonnage |
Grade |
Contained Metal |
Cutt-off Grade |
Recovery |
| (000 t) |
(g/t Au) |
(000 oz Au) |
(g/t Au) |
% |
| Indicated |
444.3 |
5.2 |
74.9 |
2.61 |
96.5 |
| Inferred |
1,088.60 |
6.6 |
232.2 |
Notes:
| 1. | The definitions for Mineral Resources in S-K 1300 were followed for Mineral Resources. |
| 2. | Mineral Resources are reported based on 31 December 2023 as-mined survey data. |
| 3. | Mineral Resources are estimated at a cut-off grade of 2.61 g/t Au. |
| 4. | Mineral Resources are estimated using a long-term gold price of US$1,750 per ounce, and a US$/C$ exchange rate of 1.33. |
| 5. | The density assigned to the overburden at Porky West is 1.70 t/m3, in-situ mineralized material is 2.71 t/m3
and host rock is 2.80 t/m3. |
| 6. | Gold metallurgical recovery 96.5%. |
| 7. | There are no Mineral Reserves at Porky West |
| 8. | Mineral Resources that are not Mineral Reserves do not have demonstrated economic viability. |
| 9. | Mineral Resources are reported within underground reporting shapes (DSO shapes). |
| 10. | The point of reference for Mineral Resources is the point of feed into the processing facility. |
| 11. | SSR has 100% ownership of the Project and Mineral Resources are shown on a 100% basis. |
| 12. | A minimum mining width of 2 m was used. |
| 13. | Numbers may not add due to rounding. |
| 11.6.1 | Geological Interpretation |
Porky West was last modelled in 2009 by SSR using explicit polyline
interpretation in Geovia GEMS software. SLR modelled Porky West using Leapfrog Geo and Leapfrog Edge.
A total of twelve veins “PW_1 to PW_12” were modelled using
Leapfrog Geo’s Vein tool, with PW_6 vein representing the “Porky West” zone.
Wireframe domains at Porky West were built using a nominal gold grade
cut-off of 0.5 g/t Au, and a minimum thickness of 1.0 m was maintained where possible. For Porky West, wireframe extension distances were
clipped at 50% of the distance to an excluded drill hole or 100 m.
Porky West veins generally trend to the southeast, dipping on average
65°, but steepen to sub-vertical in the north. Porky West veins extend along strike 1,500 m and 500 m down dip. Vein thicknesses range
between 1.0 m and 30.0 m, with PW_6 having an average thickness of 4.0 m.
SLR notes that Porky West remains open at depth and along strike and
recommends additional exploration drilling to better understand mineral resource potential.
Final mineralization wireframes for Porky West are shown in Figure 11-16.
| | 11-32 | |
| SSR Mining Inc. | Seabee Gold Operation S-K 1300 Report | February 12, 2024 SLR Project No.: 138.21581.00005 |
Figure 11-16: Long Section and
Plan Views of Porky West Mineralized Wireframes
SSR Mining Corp.
Seabee Gold Operations (SGO)
Saskatchewan, Canada
Long Section and Plan
Views of Porky West Mineralized Wireframes
| | 11-33 | |
| SSR Mining Inc. | Seabee Gold Operation S-K 1300 Report | February 12, 2024 SLR Project No.: 138.21581.00005 |
Assay samples at Porky West were composited to 1.5 m within modelled
mineralization domains. Histograms of interval lengths for Porky West were created to help define the selected assay composite length.
A histogram of interval lengths inside modelled wireframes for Porky West is shown in Figure 11-17.
Gold assay and composite statistics per domain for Porky West are summarized
in Table 11-19.
| | 11-34 | |
| SSR Mining Inc. | Seabee Gold Operation S-K 1300 Report | February 12, 2024 SLR Project No.: 138.21581.00005 |
Table 11-19: Porky West Gold
Assay and Composite Statistics
| Domain |
Assay |
Composite |
| Count |
Length |
Min. |
Mean |
Max. |
CV |
Count |
Length |
Min. |
Mean |
Max. |
CV |
| (m) |
(g/t Au) |
(g/t Au) |
(g/t Au) |
(m) |
(g/t Au) |
(g/t Au) |
(g/t Au) |
| |
Porky West |
1.5 m |
| PW_1 |
364 |
424.60 |
0.00 |
1.12 |
62.49 |
3.81 |
278 |
416.63 |
0.00 |
1.14 |
43.75 |
2.99 |
| PW_2 |
71 |
75.25 |
0.00 |
1.75 |
43.35 |
2.62 |
58 |
83.47 |
0.00 |
1.58 |
17.03 |
1.98 |
| PW_3 |
45 |
50.30 |
0.00 |
3.02 |
76.17 |
3.87 |
46 |
68.85 |
0.00 |
2.21 |
39.90 |
3.18 |
| PW_4 |
272 |
415.03 |
0.00 |
0.61 |
11.23 |
1.90 |
227 |
334.91 |
0.00 |
0.75 |
6.88 |
1.31 |
| PW_5 |
169 |
429.15 |
0.00 |
2.21 |
979.74 |
23.40 |
149 |
222.88 |
0.00 |
4.25 |
364.82 |
8.42 |
| PW_6 |
2,382 |
2,534.93 |
0.00 |
2.23 |
271.00 |
4.69 |
1,753 |
2,636.90 |
0.00 |
2.14 |
174.21 |
3.52 |
| PW_7 |
102 |
100.40 |
0.00 |
1.92 |
45.37 |
3.05 |
81 |
121.87 |
0.00 |
1.58 |
23.43 |
2.33 |
| PW_8 |
170 |
179.41 |
0.00 |
1.42 |
62.23 |
3.63 |
136 |
202.16 |
0.00 |
1.26 |
41.49 |
3.19 |
| PW_9 |
74 |
88.66 |
0.00 |
1.26 |
36.30 |
3.60 |
57 |
85.59 |
0.00 |
1.31 |
19.65 |
2.47 |
| PW_10 |
9 |
10.40 |
0.02 |
0.80 |
1.97 |
0.64 |
10 |
14.41 |
0.00 |
0.58 |
1.35 |
0.85 |
| PW_11 |
40 |
48.99 |
0.00 |
1.69 |
26.84 |
2.96 |
34 |
51.18 |
0.00 |
1.61 |
26.84 |
2.78 |
| PW_12 |
29 |
35.80 |
0.00 |
0.57 |
3.78 |
1.50 |
27 |
38.92 |
0.00 |
0.52 |
3.78 |
1.56 |
| | 11-35 | |
| SSR Mining Inc. | Seabee Gold Operation S-K 1300 Report | February 12, 2024 SLR Project No.: 138.21581.00005 |
Figure 11-17: Histogram of Interval
Lengths in Porky West Mineralization
| 11.6.2.2 | Treatment of High Grade Composites |
High grade values were capped by domain after compositing with levels
selected upon review of assayed gold values using histograms, log probability plots, basic statistics, decile analysis and visual review.
Table 11-20 summarizes the Porky West capped gold composite statistics by domain.
| | 11-36 | |
| SSR Mining Inc. | Seabee Gold Operation S-K 1300 Report | February 12, 2024 SLR Project No.: 138.21581.00005 |
Table 11-20: Porky West Gold
Composite Capping Statistics (in g/t Au)
| Domain |
Min |
Max |
Mean |
CV |
Cap Value |
No of Cap |
Capped Mean |
Capped CV |
% Metal Loss |
| Porky West |
| PW_1 |
0 |
43.75 |
1.14 |
2.99 |
25 |
1 |
1.08 |
2.48 |
5.26 |
| PW_2 |
0 |
17.03 |
1.58 |
1.98 |
25 |
0 |
1.58 |
1.95 |
0.00 |
| PW_3 |
0 |
39.90 |
2.21 |
3.18 |
10 |
1 |
1.29 |
1.83 |
41.63 |
| PW_4 |
0 |
6.88 |
0.75 |
1.31 |
10 |
0 |
0.75 |
1.31 |
0.00 |
| PW_5 |
0 |
364.82 |
4.25 |
8.42 |
25 |
1 |
0.97 |
3.55 |
77.18 |
| PW_6 |
0 |
174.21 |
2.14 |
3.52 |
60 |
4 |
2.01 |
2.65 |
6.07 |
| PW_7 |
0 |
23.43 |
1.58 |
2.33 |
25 |
0 |
1.58 |
2.31 |
0.00 |
| PW_8 |
0 |
41.49 |
1.26 |
3.19 |
25 |
1 |
1.14 |
2.51 |
9.52 |
| PW_9 |
0 |
19.65 |
1.31 |
2.47 |
25 |
0 |
1.31 |
2.43 |
0.00 |
| PW_10 |
0 |
1.35 |
0.58 |
0.85 |
25 |
0 |
0.58 |
0.78 |
0.00 |
| PW_11 |
0 |
26.84 |
1.61 |
2.78 |
25 |
1 |
1.57 |
2.63 |
2.48 |
| PW_12 |
0 |
3.78 |
0.52 |
1.56 |
25 |
0 |
0.52 |
1.52 |
0.00 |
The gold grade continuity for the Porky West deposit was investigated
by generating a set of grade shells in Leapfrog for each zone within the mineralized envelopes. Two primary trends in Porky were identified,
both generally plunging steeply to the West.
Examples of grade contouring at Porky West is presented in Figure 11-18.
| | 11-37 | |
| SSR Mining Inc. | Seabee Gold Operation S-K 1300 Report | February 12, 2024 SLR Project No.: 138.21581.00005 |
Figure 11-18: PW_6 Looking North
Showing Grade Contours
SSR Mining Corp.
Seabee Gold Operations (SGO)
Saskatchewan, Canada
PW6 Looking North Showing
Grade Contours
| | 11-38 | |
| SSR Mining Inc. | Seabee Gold Operation S-K 1300 Report | February 12, 2024 SLR Project No.: 138.21581.00005 |
While Inverse Distance Cubed (ID3) was used to interpolate
grade and does not require a variogram, SLR performed experimental variography with the intention of understanding the spatial continuity
of the deposit. SLR notes that the experimental variograms remain relatively unstable and subject to interpretation. SLR recommends revisiting
the variograms once additional drilling has been completed and refining interpolation and search parameters based on the results.
| 11.6.4 | Search Strategy and Grade Interpolation Parameters |
Grade interpolation for Porky West was performed on parent blocks using
an ID3 interpolation approach, consisting of three progressively larger interpolation passes (Table 11-21). Search ellipses
for grade interpolation were anisotropic for all zones and oriented using variable orientation (VO). The composite selection plan is outlined
in Table 11-22.
Table 11-21: Porky West Search
Strategy and Grade Interpolation Parameters
| Deposit |
Method |
Orientation |
1st Pass |
2nd Pass |
3rd Pass |
| X-axis |
Y-axis |
Z-axis |
X-axis |
Y-axis |
Z-axis |
X-axis |
Y-axis |
Z-axis |
| (m) |
(m) |
(m) |
(m) |
(m) |
(m) |
(m) |
(m) |
(m) |
| Porky West |
ID3 |
VO |
40 |
20 |
8 |
80 |
40 |
16 |
160 |
80 |
32 |
Table 11-22: Porky West Gold
Composite Selection Plan
| Deposit |
1st Pass |
2nd Pass |
3rd Pass |
| Min No. |
Max No. |
DH Limit |
Min No. |
Max No. |
DH Limit |
Min No. |
Max No. |
DH Limit |
| Porky West |
7 |
9 |
3 |
5 |
12 |
3 |
1 |
12 |
4 |
Density values at Porky West were provided by SSR and were set at 2.71
g/cm3 for in-situ mineralization, 1.70 g/cm3 for the overburden, and 2.80 g/cm3 for host rock. In SLR’s
opinion, these are reasonable densities for this type of mineralization.
Density data for Porky West is sourced primarily from a bulk sample
in the ore undertaken by Claude Resources on the deposit in 2006. 24 density measurements are available from sampling done in two locations,
range from 2.68 to 2.75 g/cm3, and average 2.71 g/cm3 across the samples. Another 28 density measurements are available
from sampling done at the mill, also averaging 2.71 g/cm3.
SLR recommends adding density measurements as part of the drill hole
sampling protocol, particularly in mineralized domains.
| | 11-39 | |
| SSR Mining Inc. | Seabee Gold Operation S-K 1300 Report | February 12, 2024 SLR Project No.: 138.21581.00005 |
Block model construction and estimation was completed in Seequent’s
Leapfrog Edge software. The Porky West block model extents are presented in Figure 11-19, and the parameters are shown in Table 11-23.
SLR considers the block model sizes appropriate for the deposit geometry and proposed mining methods.
Table 11-23: Porky West Block
Model Parameters
| Type |
X |
Y |
Z |
| Base Point (m) |
1,120 |
4,300 |
520 |
| Boundary Size (m) |
768 |
1,521 |
612 |
| Parent Block Size (m) |
3 |
3 |
3 |
| Min. Sub-block Size (m) |
0.75 |
0.75 |
0.75 |
| Rotation (°) |
0 |
0 |
0 |
| | 11-40 | |
| SSR Mining Inc. | Seabee Gold Operation S-K 1300 Report | February 12, 2024 SLR Project No.: 138.21581.00005 |
Figure 11-19: Porky West Block
Model and Dimensions
SSR Mining Corp.
Seabee Gold Operations (SGO)
Saskatchewan, Canada
Porky West Block Model
and Dimensions
| | 11-41 | |
| SSR Mining Inc. | Seabee Gold Operation S-K 1300 Report | February 12, 2024 SLR Project No.: 138.21581.00005 |
Mineral Resources have been classified in accordance with the definitions
for Mineral Resources in S-K 1300, which are similar to Canadian Institute of Mining, Metallurgy and Petroleum (CIM) Definition Standards
for Mineral Resources and Mineral Reserves dated May 10, 2014 (CIM (2014) definitions).
In the S-K 1300 classification, a Mineral Resource is defined as “a
concentration or occurrence of material of economic interest in or on the Earth’s crust in such form, grade or quality and quantity
that there are reasonable prospects for economic extraction”. Mineral Resources are classified into Measured, Indicated, and Inferred
categories. A Mineral Reserve is defined as the “economically mineable part of a Measured and/or Indicated Mineral Resource”
demonstrated by studies at Pre-Feasibility or Feasibility level as appropriate. Mineral Reserves are classified into Proven and Probable
categories.
At Porky West, blocks were classified using an approach that considered
local drill hole spacing (based on the average distance to the closest three drill holes), geological understanding, grade continuity
as well as the need to create cohesive class boundaries. Indicated blocks were primarily defined where drill hole spacings were less than
25 m (up to 30 m locally), and Inferred blocks where drill hole spacings were less than 100 m. “PW_6” and “PW_8”
are the only two zones with Indicated blocks. Porky West block classification is presented in longitudinal section in Figure 11-20.
| | 11-42 | |
| SSR Mining Inc. | Seabee Gold Operation S-K 1300 Report | February 12, 2024 SLR Project No.: 138.21581.00005 |
Figure 11-20: Porky West Block
Classification
SSR Mining Corp.
Seabee Gold Operations (SGO)
Saskatchewan, Canada
Porky West Block Classification
| | 11-43 | |
| SSR Mining Inc. | Seabee Gold Operation S-K 1300 Report | February 12, 2024 SLR Project No.: 138.21581.00005 |
| 11.6.8 | Block Model Validation |
Blocks were validated using industry standard techniques, including:
| · | Visual inspection of composite versus block grades (Figure 11-21) |
| · | Comparison between ID3 and NN mean swath plots (Figure 11-22) |
| · | Wireframe to block model volume confirmation (Table 11-24) |
Based on the validation steps performed, SLR is of the opinion that
the Porky West Mineral Resource estimate is suitable for public disclosure and to future studies on the project:
| · | Visual inspection of grade, mean comparisons and swath plots show that the estimation setups are working as intended, the boundary
conditions and use of input data is appropriate, there is no significant over extrapolation of grades and the smoothing of grades as compared
to the input data is as expected. |
| · | The volume comparisons demonstrate that the block model is an appropriate volumetric representation of the in situ mineralization. |
Table 11-24: Porky West Block
Model Volume Confirmation
| Project |
Zones |
Wireframe Volume
(000 m³) |
Block Model Volume
(000 m³) |
Confirmation |
| Porky West |
PW_1 |
197,440 |
197,483 |
100% |
| PW_2 |
31,456 |
31,428 |
100% |
| PW_3 |
59,630 |
59,599 |
100% |
| PW_4 |
266,000 |
266,045 |
100% |
| PW_5 |
119,980 |
119,964 |
100% |
| PW_6 |
2,977,500 |
2,977,422 |
100% |
| PW_7 |
579,730 |
575,687 |
99% |
| PW_8 |
98,769 |
98,755 |
100% |
| PW_9 |
95,778 |
95,729 |
100% |
| PW_10 |
10,460 |
10,465 |
100% |
| PW_11 |
32,696 |
32,687 |
100% |
| PW_12 |
18,139 |
18,177 |
100% |
| | 11-44 | |
| SSR Mining Inc. | Seabee Gold Operation S-K 1300 Report | February 12, 2024 SLR Project No.: 138.21581.00005 |
Figure 11-21: Porky West Composite
- Block Grade Comparison
SSR Mining Corp.
Seabee Gold Operations (SGO)
Saskatchewan, Canada
Porky West Composite
Block Grade Comparison
| | 11-45 | |
| SSR Mining Inc. | Seabee Gold Operation S-K 1300 Report | February 12, 2024 SLR Project No.: 138.21581.00005 |
Figure 11-22: Porky West Y and
Z Swath Plots
| | 11-46 | |
| SSR Mining Inc. | Seabee Gold Operation S-K 1300 Report | February 12, 2024 SLR Project No.: 138.21581.00005 |
| 11.7 | Mineral Resource Uncertainty |
Mineral Resources are not Mineral Reserves and do not have demonstrated
economic viability, nor is there certainty that all or any part of the Mineral Resource estimated here will be converted to Mineral Reserves
through further study.
Sources of uncertainty that may affect the reporting of Mineral Resources
include sampling or drilling methods, data processing and handling, geologic modelling, and estimation. There are sources of uncertainty
in the Mineral Resource estimate at the Property which depend on the classification assigned. The SLR QP has not identified any relevant
technical and/or economic factors that require resolution with regards to the Mineral Resource estimate.
The SLR QP is of the opinion that with consideration of the recommendations
summarized in Sections 1 and 23 of this TRS, any issues relating to all relevant technical and economic factors likely to influence the
prospect of economic extraction can be resolved with further work.
The SLR QP reviewed the assumptions, parameters, and methods used to
prepare the Mineral Resources Statement and is of the opinion that the Mineral Resources are estimated and prepared in accordance with
S-K 1300.
The SLR QP
considers that the
knowledge of the
deposit setting, lithologies,
structural controls on mineralization,
and the mineralization
style and setting,
is sufficient to
support the Mineral Resource estimate to
the level of
classification assigned.
The SLR QP
considers the resource cut-off grade
and underground reporting shapes guide to identify
those portions of
the Mineral Resource estimate that meet the requirement of the reasonable
prospects for economic extraction
to be appropriate for this style of gold deposit and mineralization.
The level
of uncertainty has
been adequately reflected
in the classification
of Mineral Resources
for the Property.
The Mineral Resource estimate presented may
be materially impacted
by any future
changes in the
break-even cut-off grade,
which may result
from changes in
mining method selection, mining
costs, processing recoveries
and costs, metal
price fluctuations, or
significant changes in
geological knowledge.
| | 11-47 | |
| SSR Mining Inc. | Seabee Gold Operation S-K 1300 Report | February 12, 2024 SLR Project No.: 138.21581.00005 |
| 12.0 | Mineral Reserve Estimates |
The current Mineral Reserve estimates, as prepared by SSR and reviewed
and accepted by SLR, reported as of December 31, 2023, are summarized in Table 12-1. Mineral Reserves at SGO are estimated for the
Santoy Mine only.
Table 12-1: Summary of Mineral
Reserves – December 31, 2023
| Category |
Tonnage
(000 t) |
Grade
(g/t Au) |
Contained Metal
(000 oz Au) |
Cut-off Grade4
(g/t Au) |
Metallurgical Recovery |
| Proven (In-situ) |
238 |
6.00 |
46 |
1.86 and 2.85 |
96.4% |
| Proven (Stockpile) |
13 |
11.24 |
5 |
- |
96.4% |
| Probable |
1,815 |
5.01 |
292 |
1.86 and 2.85 |
96.4% |
| Total Proven + Probable |
2,066 |
5.17 |
343 |
|
|
Notes:
| 1. | Classification of Mineral Reserves is in accordance with the S-K 1300 classification system. |
| 2. | Mineral Reserves are reported based on 31 December 2023 as-mined survey data. |
| 3. | Mineral Reserves were estimated by SSR Mining and reviewed and accepted by SLR. |
| 4. | Mineral Reserves are estimated at a cut-off grade of 2.85 g/t Au for production stopes, and 1.86 g/t for development designs. |
| 5. | A mining extraction factor of 89% was applied to mined tonnes and contained metal. |
| 6. | The point of reference for Mineral Reserves is the point of feed into the processing facility. |
| 7. | SSR has 100% ownership of the Project and Mineral Reserves are shown on a 100% basis |
| 8. | Mineral Reserves are estimated using an average long-term gold price of US$1,600 per ounce and a US$/C$ exchange rate of 1.33. |
| 9. | A minimum mining width of 2.0 m was used. |
| 10. | Bulk density is 2.75 t/m3 for Santoy 8 & 9, and 2.65 t/m3 for GHW & SHW. |
| 11. | Totals may vary due to rounding. |
The SLR QP is not aware of any risk factors associated with, or changes
to, any aspects of the modifying factors such as mining, metallurgical, infrastructure, permitting, or other relevant factors that could
materially affect the Mineral Reserve estimate.
| 12.2 | Comparison with Previous Estimates |
The 2023 Mineral Reserves represent a net decrease of 138 koz (-29%)
total contained gold ounces as compared with the 2022 Mineral Reserve estimate. In 2023, a total of 98 koz of contained gold was mined,
contributing to 71% of the change in the Mineral Reserve estimate from the previous estimate. Other changes compared to the 2022 Reserves
estimate are the result of updates to the block model, updates to cut-off grade calculation, and use of an incremental cut-off grade for
development.
| | 12-1 | |
| SSR Mining Inc. | Seabee Gold Operation S-K 1300 Report | February 12, 2024 SLR Project No.: 138.21581.00005 |
Table 12-2: Comparison to Previous
Mineral Reserve Estimates
| Zone |
Tonnage
(000 t) |
Au
(g/t) |
Contained Gold
(koz) |
| December 31, 2023 Proven & Probable Mineral Reserves |
| Santoy 8 |
375 |
5.63 |
68 |
| Santoy 9 |
372 |
7.26 |
87 |
| SHW / GHW |
1,305 |
4.37 |
183 |
| Stockpile |
13 |
11.24 |
5 |
| Totals |
2,066 |
5.17 |
343 |
| December 31, 2022 Proven & Probable Mineral Reserves |
| Santoy 8 |
808 |
7.14 |
185 |
| Santoy 9 |
111 |
16.87 |
60 |
| SHW / GHW |
1,410 |
5.07 |
230 |
| Stockpile |
16 |
9.76 |
5 |
| Totals |
2,346 |
6.37 |
481 |
| 12.3 | Conversion to Mineral Reserves |
The Mineral Resource block model provided by the site Geology department
to the Mine Engineering department forms the basis for estimating Mineral Reserves. Mineral Reserves estimates were defined by SGO Mine
Planning team and have been reviewed and accepted by SLR.
Stope shapes are created using a stope optimizer algorithm with appropriate
modifying factors applied. A summary of key stope optimizer inputs is presented in Table 12-3.
Table 12-3: Stope Optimizer
Inputs
| Parameter |
Santoy 8 & 9 |
GHW / SHW |
| Level Spacing (m) |
16 - 20 |
20 |
| Stope Length (m) |
5 |
5 |
| Cut-off Grade (g/t Au) |
2.85 |
2.85 |
| Minimum Mining Width (m) |
2.0 |
2.0 |
| ELOS1 |
0.7 |
0.7 |
| Minimum dip (°) |
45° |
45° |
Note:
| 1. | Equivalent linear overbreak / slough |
Stope optimizer outputs are first checked for technical viability ensuring
the geometries are minable. Examples of parameters that are checked include the minimum mining widths and cut off grades.
| | 12-2 | |
| SSR Mining Inc. | Seabee Gold Operation S-K 1300 Report | February 12, 2024 SLR Project No.: 138.21581.00005 |
A preliminary development design is created that provides access and
supporting infrastructure necessary for production in a given area. Using these preliminary designs, the economic viability of each stope
design is checked to ensure there is a positive cashflow after accounting for the development costs necessary to access the stoping area.
With the stope economics confirmed the development design is refined
and stope design solids are trimmed to the refined development design extents.
The stope and development designs are then interrogated directly against
the block model and reported as Reserves after applying the appropriate extraction factor.
SLR notes that stope optimizer shapes are created at five metre lengths
which is shorter than typical mined stopes. Some stope designs, particularly those designed in a transverse arrangement, have irregular
walls which will be challenging to mine. SLR is of the opinion that this could result in overstating the Mineral Reserve grades or difficulty
in achieving the planned extraction factor. It is recommended that the stope strike length and stope optimizer post-processing parameters
be re-evaluated during subsequent Mineral Reserve updates to ensure mineable shapes are generated in both longitudinal and transverse
mining areas.
Stope are designed to a minimum mining width of 2.0 m and may encapsulate
one or multiple ore veins and any waste material that lies between the veins. Where the ore vein package is narrower than the minimum
width the footwall and hanging walls are offset into waste material until the minimum width is met. Where the ore vein package exceeds
2.0 m in width the stopes walls are designed based on the optimum economic stope limit. In either case additional dilution is applied
as an equivalent linear overbreak / slough (ELOS) which accounts for expected hanging wall sloughage beyond the stope design extent and
mucking of URF backfill from adjacent stopes. An ELOS value of 0.7 m is applied to all stopes which is derived from the stope reconciliation
process that compares the stope design, to cavity monitoring surveys (CMS) and trucks counts, and back calculates stope underbreak and
overbreak.
Dilution for ore development headings consists only of waste captured
within the development designs. No additional overbreak is applied to ore development.
All dilution is applied in the stope design process and is assigned
grades based on block model values. SLR is of the opinion that the applied dilution parameters are suitable based on the available reconciliation
data and experience in similar orebodies.
A mining extraction factor of 89% is applied to the tonnes and metal
content of both production stopes and ore development headings. This value is derived from the stope reconciliation process and overall
production reconciliation process and represents a comparison between actual stope excavations compared to stope designs.
SLR is of the opinion that the applied extraction
parameters are suitable based on the available reconciliation data. Stoping has only recently begun in the SHW and GHW zones. It is recommended
that as more mining experience is gained in these zones stope performance and the suitability of the dilution and extraction based on
Santoy 8 and 9 stope performance should be re-evaluated.
| | 12-3 | |
| SSR Mining Inc. | Seabee Gold Operation S-K 1300 Report | February 12, 2024 SLR Project No.: 138.21581.00005 |
The estimated cut-off grade for Mineral Reserves was based on a $1,600/oz
gold price and current and forecast operating costs and metallurgical performance.
The gold price of $1,600/oz was selected after consideration of the
pricing information described in Section 16, which includes a description of the time frame used for the selection of the price and the
reasons for selection of such a time frame. The metal price is representative of the range of price estimates publicly reported for Mineral
Reserve cut-offs.
| · | Actual operating costs were used as a basis of estimate and then adjusted based on planned operational changes, cost savings initiatives,
and forecast changes to consumable costs. |
| · | A lower cut-off grade of 1.86 g/t Au was applied to development in ore. This excludes mining costs from the cut-off grade calculation
reflecting the marginal nature of the development. |
Table 12-4 details the parameters used for Mineral Reserve definition.
Table 12-4: Mineral Reserves
Input Parameters
| Item |
Unit |
Breakeven |
Marginal |
| Mining |
US$/tonne |
$47.14 |
$0.00 |
| Processing |
US$/tonne |
$35.29 |
$35.29 |
| G&A |
US$/tonne |
$52.73 |
$52.73 |
| Total Operating Cost |
US$/tonne |
$135.16 |
$88.02 |
| Gold Price |
US$/oz |
$1,600 |
$1,600 |
| Mill Process Recovery |
% |
95.6% |
95.6% |
| Royalty |
% |
3.0% |
3.0% |
| Payable Gold |
% |
99.5% |
99.5% |
| Treatment Charge |
US$/oz |
$3.09 |
$3.09 |
| Gold Price |
$/oz |
$1,600 |
$1,600 |
| Cut-off Grade |
g/t |
2.85 |
1.86 |
Mining, processing, and G&A costs used for cut-off grade calculation
are lower than recent actuals due to incorporating planned cost savings initiatives. Of the three components, the mining cost is most
impacted by these savings. SLR is of the opinion that achieving the operating costs savings may be difficult while maintaining production
targets, however, SLR acknowledges that SGO has a plan in place. SLR notes that the appropriateness of the stated cut-off grade is dependent
on the realization of these savings and recommends the cut-off grade be periodically evaluated as operating costs change.
| | 12-4 | |
| SSR Mining Inc. | Seabee Gold Operation S-K 1300 Report | February 12, 2024 SLR Project No.: 138.21581.00005 |
| 12.7 | Mineral Reserve Reconciliation |
Reconciliation is completed on a monthly basis comparing the adjusted
mill actuals to the mine claimed production tonnes. Mine claimed numbers are estimated using the Resource model, sill mapping in ore development
drives, assays of chip and muck samples, and truck counts. Reconciliation data is presented in Table 12-5.
Table 12-5: Mineral Reserve
Reconciliation Data
| Year |
Tonnes
(t) |
Au
(g/t) |
Au
(koz) |
| Reconciled Mine Production |
| 2021 |
384,122 |
10.11 |
124,909 |
| 2022 |
424,883 |
10.37 |
141,678 |
| 2023 |
442,513 |
6.91 |
98,239 |
| Unreconciled Mine Production |
| 2021 |
400,787 |
9.49 |
122,313 |
| 2022 |
414,423 |
8.40 |
111,948 |
| 2023 |
452,051 |
6.77 |
98,447 |
| Reconciliation Ratio |
| 2021 |
0.96 |
1.07 |
1.02 |
| 2022 |
1.03 |
1.23 |
1.27 |
| 2023 |
0.98 |
1.02 |
1.00 |
This reconciliation process provides a good indication of the actual
milled product to the best estimate of mine production (F2 Factor) but does not tie back to the Resource model. SLR recommends that the
dilution and extraction assumptions be reviewed as part of the reconciliation process to refine future estimates.
SLR recommends that the reconciliation also routinely be completed comparing
the mine production numbers to the Resource model (F1 Factor), and milled production to Resource model (F3 factor), to measure the accuracy
of the Resource and Reserve block model. SLR understands that new Resource block models and grade control models have recently been developed
and implemented and recommends that a robust reconciliation process be put in place to allow for further model refinement.
| | 12-5 | |
| SSR Mining Inc. | Seabee Gold Operation S-K 1300 Report | February 12, 2024 SLR Project No.: 138.21581.00005 |
Access to the Santoy underground mine is by decline. Levels are typically
driven at 20 m vertical spacings and accessed by decline and incline ramps. The mining method used is sublevel open stoping with backfill
in either a longitudinal or transverse arrangement. Stoping within a level is sequenced to retreat toward the level access point. The
mining front progresses upward from the lowest level of a mining block. The completed stopes are backfilled with waste rock.
Primary access to the Santoy Mine is via a portal and Santoy 8 Main
decline. The Gap Decline tees off from the Santoy 8 Main Decline at 16 Level and continues west to the Santoy 9 orebodies and then east
again to the lower Santoy 8 orebody. These two declines are the primary travel routes in the mine and are supplemented locally with additional
inclines and declines. Both inclines and declines are driven with a 5.0 m wide x 5.2 m high arched cross section at a 15% grade with reduced
grades at level intersections. The ramps are driven with two boom jumbos and are bolted and screened to site standards.
A long section showing the Santoy Mine is presented in Figure 13-1.
| | 13-1 | |
| SSR Mining Inc. | Seabee Gold Operation S-K 1300 Report | February 12, 2024 SLR Project No.: 138.21581.00005 |
| | 13-2 | |
| SSR Mining Inc. | Seabee Gold Operation S-K 1300 Report | February 12, 2024 SLR Project No.: 138.21581.00005 |
Level accesses are driven from the ramps to crosscut the ore every 20
vertical metres. Level accesses will typically include a truck dump, used as a remuck, and storing backfill, and a sump. In addition,
transformer cutouts, refuge stations and ventilation drifts connecting to vent raises are driven off level accesses.
In some areas drop raises are driven from one level access to the next
for ventilation and to serve as a secondary egress. These raises are drilled off with a longhole drill with a 4 m x 4 m cross section,
bolted and screened and equipped with ladders and landings as required. Where practical, Alimak raises with a 3 m x 3 m cross section
are driven as an alternative to drop raises.
Ore development following the establishment of level accesses and ancillary
headings varies depending on the stoping method used. Where longitudinal retreat stoping is used, sill drifts are driven on the ore along
strike to the ore extents. One drift is driven along the bottom of the stoping block and a second along the top.
When transverse mining methods are used. A haulage drift on the footwall
side of the ore is driven, and perpendicular drawpoints are driven to crosscut the ore. The drawpoints are used both for production drilling
and mucking and are driven with two boom jumbos, and bolted and screened to site standards.
Standard dimensions of development headings are presented in Table 13-1.
| | 13-3 | |
| SSR Mining Inc. | Seabee Gold Operation S-K 1300 Report | February 12, 2024 SLR Project No.: 138.21581.00005 |
Table 13-1: Excavation Dimensions
| Category |
Width
(m) |
Height
(m) |
| Access |
4.6 |
4.6 |
| Alimak Chamber |
5.0 |
4.6 |
| Alimak Nest |
4.2 |
6.5 |
| Alimak Sublevel |
7.0 max. |
3.0 |
| Haulage |
4.6 |
4.6 |
| Ramp |
5.0 |
5.2 |
| Refuge Station |
6.0 |
5.0 |
| Remuck |
5.0 |
5.2 |
| Safety Bay |
1.5 |
2.4 |
| Sill |
8.0 max. |
4.6 |
| Sump |
4.2 |
4.0 |
| Truck Dump |
5.0 |
6.7 |
| Ventilation Access |
4.6 |
4.6 |
| Ventilation Raise – Alimak |
3.0 |
3.0 |
| Ventilation Raise – Longhole |
4.0 |
4.0 |
Of the total production tonnes included in the mine plan, approximately
55% are planned to be mined using transverse stoping. This includes nearly all of the GHW area, and the lower portion of the SHW area.
The remainder, including Santoy 8, Santoy 9, and the upper SHW areas, are planned using longitudinal retreat. The determination of stope
orientation depends on a number of factors including ore width, orebody dip, ore zone strike length, and the position of nearby infrastructure.
Typical stope strike lengths are between 15 m and 20 m. Stopes are drilled
off, blasted, and mucked completely before being backfilled. Where a new stope is immediately adjacent to a backfilled stope, some of
the previously placed backfill is removed to create a void to blast the next stope into. This modified AVOCA method is repeated until
the stope is mined out. In this way unconsolidated rockfill rather than cemented rockfill is typically used, except above sill pillars.
Stopes are drilled with electric hydraulic longhole drills using a 3-inch
bit. The standard drill pattern is burden of 1.5 m and a maximum spacing of 2.0 m. The majority of production drilling is downhole, with
uppers used to mine up to cemented rockfill (CRF) pillars or where there is no drift above.
| | 13-4 | |
| SSR Mining Inc. | Seabee Gold Operation S-K 1300 Report | February 12, 2024 SLR Project No.: 138.21581.00005 |
Stope blasting typically uses ANFO as the primary blasting agent. I-Kons
with Pentex boosters are used to make larger blasts, reducing the total amount of time to blast the stope. Lomex is also used in the
hanging wall holes to limit hanging wall damage.
Stopes are mucked with remote equipped Cat R1600 scoops. Backfilling
with waste rock is completed promptly to reduce hanging wall failures in the stopes.
SLR notes that some stopes in the GHW and SHW areas are designed using
a transverse arrangement though the mining width is narrower than the stated longitudinal/transverse demarcation measurement. SLR recommends
that stope arrangements be re-evaluated as more geological information and operating experience is gained in these areas.
Uncemented rockfill (URF) is the primary type of backfill at the Santoy
Mine. Waste rock generated during development is stockpiled underground in available headings and re-mucks until it can be moved to mined
out stopes and used as backfill.
Cemented rockfill (CRF) use is limited to the creation of sill pillars
at the start of a mining front. The CRF consists of run-of-mine waste mixed with 5% binder that is comprised of 60% cement and 40% fly
ash. The binder is transported to site in tote bags and mixed with water underground at the work location in a portable mixing plant.
The resultant slurry is mixed with waste rock in a sump by load-haul-dump (LHD) units, before being trammed to the fill location.
The majority of backfill over the life of mine is sourced from waste
generated from future development. However, in 2027 development rates are reduced as the end of the mine life is approached. In 2027 and
2028 waste currently stockpiled on surface will need to be backhauled underground to be used as backfill. Over the remaining mine life
this represents approximately 10% of required backfill tonnage.
To reduce backfill related dilution the use of cemented rockfill (CRF)
rather than uncemented rockfill (URF) should be considered where stopes are planned adjacent to backfill, particularly in transverse stoping
areas.
Ore and development waste are hauled within the mine, and to surface
via 45 t haul trucks. Waste rock generated from development is stored underground where possible for use as backfill. It is otherwise
stockpiled on surface for later back haul as backfill. Ore is trucked to three surface stockpiles located near the Santoy portal, which
are designated as low grade, high grade, and GHW zone ore. GHW ore is stored separately because the hardness is different than the rest
of underground ore. Stockpiled ore is then transferred to 17 or 40 tonne dump trucks with a wheeled loader and hauled 14 km to stockpiles
at the Seabee mill.
| 13.2.1 | Rock and Rockmass Conditions |
The rock mass at the Santoy Mine is generally classified as ‘good’
with a rock mass rating (RMR76) (Bieniawski, 1976) of 71–79. There are some areas that are classified as ‘fair’,
with a RMR76 range of 52 to 57.
Intact rock strength testing at the Santoy Mine was performed in 2018
and 2019 for Hanging wall and Orezone material. Footwall material is considered to have similar strength characteristics to Hanging wall
material. Intact rock strength test results are presented in Table 13-2.
| | 13-5 | |
| SSR Mining Inc. | Seabee Gold Operation S-K 1300 Report | February 12, 2024 SLR Project No.: 138.21581.00005 |
Table 13-2: Summary of Intact
Strength Testing at Seabee Mine
| Zone |
Point Load
(MPa) |
UCS
(MPa) |
Tensile Strength
(MPa) |
Static E
(GPa) |
Static v |
Dynamic E
(GPa) |
Dynamic v |
| Hanging Wall |
167 ± 37 |
114 ± 45 |
14 ± 3 |
77 ± 14 |
0.32 ± 0.10 |
68 ± 22 |
0.16 ± 0.07 |
| Orezone |
152 ± 60 |
116 ± 59 |
15 ± 4 |
75 ± 8 |
0.31 ± 0.17 |
73 ± 11 |
0.17 ± 0.04 |
In situ stress measurements have not been conducted at the Santoy Mine.
It is assumed, based on typical Precambrian Canadian Shield conditions (Herget 1988), that the horizontal to vertical stress ratio is
two and that the major principal stress direction is horizontal and parallel to the strike of the orebody. Rock and rockmass strengths
are sufficiently high that stress induced failures are not a concern.
The most common mode of failure at the Santoy Mine is either structural
or rock mass driven failure. In areas where the RMR is 71%–79%, the dominant mode of failure is structurally controlled. In areas
where the RMR is 52%–57%, the dominant mode of failure is wedge failure. In either case failures are gravity controlled as the stress
environment is generally low owing to the shallow depth of mining. Based on geotechnical underground mapping, there are three primary
joint sets that contribute to potential structural failure with orientations presented below using dip/dip direction:
Water inflow is generally well understood at SGO based on actual data
and is not expected to change during the LOM. The current dewatering infrastructure system adequately manages water inflows and the system
will continue to be expanded as the footprint of the Santoy Mine expands.
Higher than usual water make, between 5 gpm and 20 gpm, was encountered
during diamond drilling in the upper Gap HW area from 16L of Santoy 8. Long term monitoring of these holes has indicated the area is now
drained. A decommissioned sump is available on 17L of Santoy 8 where excess water can be directed to should it be encountered and persist
during the mining of the upper GHW. The water makes and pressures are not expected to be significant enough to warrant changes to the
ground support regime or stope stability analyses.
| | 13-6 | |
| SSR Mining Inc. | Seabee Gold Operation S-K 1300 Report | February 12, 2024 SLR Project No.: 138.21581.00005 |
| 13.2.3 | Ground Support Regime |
| 13.2.3.1 | Lateral Development |
There are six typical ground support classes used in lateral development
headings that are applied depending on heading type. A summary of the ground support classes is presented in Table 13-3.
Table 13-3: Ground Support Summary
in Development Headings
| Class |
Applicable Headings |
Designed Dimensions |
Rockmass Rating (RMR76) |
Back Support |
Wall Support |
| 1 |
Ramp, Accesses, Remucks, Sumps |
Width: 5.0 m |
60 - 81 |
8’ #7 Threaded Rebar
5’ x 5’ pattern |
6’ Split Set
5’ x 5’ pattern |
| 2 |
Ore Sills |
Max Width: 8.0 m |
60 – 81 |
8’ #7 Threaded Rebar
5’ x 5’ dice 5 pattern |
6’ Split Set
5’ x 5’ pattern |
| 3 |
Alimak Sublevels, Safety Bays |
Max Width: 4.0 m |
60 – 81 |
6’ #7 Threaded Rebar
5’ x 5’ pattern |
6’ Split Set
5’ x 5’ pattern |
| 4 |
Intersections |
Max Span: 9.0 m |
60 – 81 |
8’ #7 Threaded Rebar
5’ x 5’ dice 5 pattern |
6’ Split Set
5’ x 5’ pattern |
| 5 |
Ventilation Raises |
Width: 3.0 m |
60 – 81 |
4’ #7 Threaded Rebar
4’ x 4’ pattern |
4’ Split Set
4’ x 4’ pattern |
| 6 |
Refuge Stations |
Max Width: 6.0 m |
60 - 81 |
6’ #7 Threaded Rebar
5’ x 5’ pattern |
6’ Split Set
5’ x 5’ pattern |
| 13.2.3.2 | Production Stopes |
The most common stope stability issues encountered at Santoy are related
to foliation that run sub-parallel to the design hanging wall contact which can result in hanging wall sloughage, particularly when cross-cutting
structures are encountered. Stope sizes are usually limited such that secondary support measures are not required.
A stope stability evaluation is completed for each stope design using
the Mathews Stability number and hydraulic radius. Stope design geometries typically have a hydraulic radius of 6 to 11, while the Modified
Stability number typically falls between 7 and 25. These values usually result in stopes falling in the ‘stable zone’ or ‘unsupported
transition zone’, or occasionally in the in the ‘stable with support’ zone of the Matthews Stability chart.
Where secondary support is deemed beneficial, cablebolts are installed
in the hanging wall to limit sloughage. Cablebolts are typically drilled from the sill drive of the stope overcut, and installed in three
to five bolt rings with bolt at toe spacings of between 1.5 m and 2.0 m.
Barrier sill pillars are established on the first stoping level of a
mining front where there are reserves immediately below. The sill pillars are made of cemented rock fill (CRF) composed of 5% binder mixed
with development waste rock. Uppers stoping is used to mine the ore immediately beneath the CRF sill pillars. Four CRF sill pillars have
been established to date. Stoping above and below these pillars is complete in three of the four pillars, while stoping using uppers remains
to be done under the sill pillar in Santoy 8 between levels 58 and 59.
| | 13-7 | |
| SSR Mining Inc. | Seabee Gold Operation S-K 1300 Report | February 12, 2024 SLR Project No.: 138.21581.00005 |
| 13.3 | Mine Infrastructure and Services |
Infrastructure at the Santoy Mine includes:
| · | Administrative, shop buildings, dry |
| · | Powerhouse and electrical distribution system |
| · | Cap and power magazines, and Amex plant |
These facilities are shown in Figure 13-2 through Figure 13-4.
Major components are described in the following subsections.
The Santoy primary ventilation circuit is a push system that currently
provides 150 m3 per second (320,000 ft3 per minute (CFM)) through two fresh air raises (FAR) located at
the Gap Main and Santoy 8 sites. Air is exhausted via the main ramp and the Santoy 8 East return air raise (RAR). The Gap Main FAR
provides fresh air via two fans in parallel with a total power of 597 kw (800 hp), while the Santoy 8 Main FAR provides fresh
air via a single fan with a total power of 149 kw (200 hp).
From the Gap Main FAR fans, 87 m3 per second (185,000 CFM)
is sent down the raise until it reaches 31L vent drift where 35 m3 per second (75,000 CFM) is split off and sent
down to the bottom of the Gap decline with the help of a 74 kw (100 hp) booster fan located in 31L vent drift. The remaining 54 m3
per second (115,000 CFM) continues down a system of raises to the bottom of the 41 decline. There is a 149 kw (200 hp) booster
fan located on 47L of the 41 decline to assist with the movement of air to this area.
The Santoy 8 Main FAR pushes 64 m3 per second (135,000 CFM)
from surface to the bottom of 48 decline through a system of raises. At the bottom of this system are two 74 kw (100 hp) booster
fans in parallel that assist with airflow. From here, 32 m3 per second (68,000 CFM) moves up the 49 incline and provides
ventilation at the face, while the remaining 32 m3 per second (68,000 CFM) is sent up the 48 decline and joins the
air upcasting from the Gap Decline.
The Gap Hanging Wall (GHW) development is currently ventilated by using
100 hp fan to draw the air from the Gap Decline, up the 46L GHW Incline to 37 Level, down an Alimak raise to 46 Level and up a short raise
to 44 Level on 45 Incline. Another 100 hp fan in a bulkhead is installed on 44L, moves the air down 45 Incline to rejoin the Gap Decline
and exhausts to surface.
| | 13-8 | |
| SSR Mining Inc. | Seabee Gold Operation S-K 1300 Report | February 12, 2024 SLR Project No.: 138.21581.00005 |
The Gap HW and Santoy HW workings from 30 to 7 Levels will be ventilated
by means of a new ventilation drift from 19 Incline to the planned 17 Level in Gap HW. This new 200 meter drift will take a split of
air from the existing Gap Main FAR at 16 Level, moving the air down 23 Incline, up 19 Incline, through the new vent drift to 17L in Gap
HW and splitting the flow to two new 150 meter Alimak raises, one upcast and one downcast. The lower raise will be collared at 31 Level
in the Gap HW going up to meet with the ventilation drift. The upper raise will be collared from the ventilation drift on the Gap HW
17 Level, going up to 7 Level in the Gap HW. The decline and incline recently started to access the Gap HW and Santoy HW in this area
will access these Alimak raises for ventilation as the ramp proceeds.
This new development makes use of the existing surface infrastructure,
including heaters and propane tank farms for heating the mine air through the colder winter months. A mine long-section showing the primary
air routing is shown in Figure 13-5.
| | 13-9 | |
| SSR Mining Inc. | Seabee Gold Operation S-K 1300 Report | February 12, 2024 SLR Project No.: 138.21581.00005 |
Figure 13-2: Santoy 8 Site
| | 13-10 | |
| SSR Mining Inc. | Seabee Gold Operation S-K 1300 Report | February 12, 2024 SLR Project No.: 138.21581.00005 |
Figure 13-3: Santoy 7 Site
| | 13-11 | |
| SSR Mining Inc. | Seabee Gold Operation S-K 1300 Report | February 12, 2024 SLR Project No.: 138.21581.00005 |
Figure 13-4: Santoy Gap
Site
| | 13-12 | |
| SSR Mining Inc. | Seabee Gold Operation S-K 1300 Report | February 12, 2024 SLR Project No.: 138.21581.00005 |
Figure 13-5: Santoy Mine
Ventilation Long-Section Looking Northwest
| | 13-13 | |
| SSR Mining Inc. | Seabee Gold Operation S-K 1300 Report | February 12, 2024 SLR Project No.: 138.21581.00005 |
Mine dewatering is accomplished via a main sump and pumping station
located on 49L of the lower Santoy 8 area. This replaces the previous pumping station located higher in Santoy which simplifies the water
handling system and increases the dewatering capacity to 1,900 m3/day. Water from the different mining areas is pumped to one
of two dirty water sumps on 49L where the water decants into a central clean sump. A transfer pump moves water from the main clean sump
to the pumping station where a 250 hp, ten stage Technosub pumps to the surface mine water management pond located near the Santoy portal.
The Santoy Mine dewatering requirements are summarised in Table 13-4
and are based on actual operating data from 2022 and 2023. Groundwater ingress to excavations accounts for approximately 60% of discharged
water, while the remaining is attributable to consumption through various mining activities.
Table 13-4: Santoy Mine Dewatering
Requirements
| Source |
Dewatering Requirement |
| m3/day |
US gallons/min |
| Ground Water |
328 |
60 |
| Mining Activities |
229 |
42 |
| Total |
557 |
102 |
| 13.3.3 | Maintenance Facilities |
A maintenance shop exists on surface at the Santoy site near the mine
portal where all major maintenance of underground equipment occurs. A small underground maintenance shop exists where minor repairs and
diagnoses can be made.
The Santoy Mine receives electrical power from the Seabee site through
a 25 kV line feeding 3 MVA and 3.75 MVA transformers stepped down to 4160 V for distribution throughout the mine. Substations are established
to step down to 600 V in active mining areas.
Two-way radios are the primary means of communication underground with
leaky-feeder cable installed in permanent and long-term ramps and level accesses.
The core underground mobile equipment fleet at Santoy Mine is summarized
in Table 13-5. Equipment will be replaced as part of sustaining capital.
| | 13-14 | |
| SSR Mining Inc. | Seabee Gold Operation S-K 1300 Report | February 12, 2024 SLR Project No.: 138.21581.00005 |
Table 13-5: Underground Mine
Equipment Fleet
| Equipment Type |
Description |
Number of Units |
| Jumbos |
1-boom |
2 |
| 2-boom |
5 |
| Mechanical Bolters |
|
2 |
| Scissor Decks |
|
9 |
| LHDs |
2.5-yard |
2 |
| 4-yard |
2 |
| 6-yard |
5 |
| 8-yard |
1 |
| Haul Truck |
30-tonne |
2 |
| 40-tonne |
1 |
| 45-tonne |
4 |
| Longhole Drill |
|
6 |
Historically primary ground support was installed manually using jackleg
and scissors decks. In 2021 ground support was mechanized with the purchase of two Epiroc Boltec mechanical bolters. With these the site
has been able to significantly reduce the manual installation of ground support resulting in improved productivity and safety. Two additional
mechanical bolters will be purchased in 2024. Some scissor decks will remain in the fleet for utility work.
The current workforce at Santoy Mine is 104 hourly and 14 salaried employees.
The majority are employed by SSR with contractor support used for drilling and special projects. Headcount is expected to remain relatively
static through the mine life.
The mine plan and schedule to support the Mineral Reserves was developed
by the SSR Technical Services Department. The mine plan commences January 1, 2024, and extends to the first quarter of 2028. Production
rates are process limited, maxing out at 511 ktpa in 2026 and 2027. A total of 2.04 Mt of ore at an average grade of 5.12 g/t
Au is mined over the four and a half year mine life. The total mined gold over this period is 336 koz. Ore grade decreases over the mine
life from a maximum of 5.76 g/t Au in 2024 to a low of 3.78 g/t Au in 2028. The production profile in ore tonnes and gold ounces is shown
respectively in Figure 13-6 and Figure 13-7.
| | 13-15 | |
| SSR Mining Inc. | Seabee Gold Operation S-K 1300 Report | February 12, 2024 SLR Project No.: 138.21581.00005 |
Figure 13-6: Life of Mine Production
Tonnes and Grade
Figure 13-7: Life of Mine Gold
Ounces and Grade
In 2024, Santoy 8 and Santoy 9 provides the majority of the ore, while
production in the newer GHW area is ramped up. The GHW and SHW provide the bulk of production in the final three and a half years of the
mine life as production decreases in Santoy 8 and 9. A breakdown of production tonnes by mine area is presented in Figure 13-8.
| | 13-16 | |
| SSR Mining Inc. | Seabee Gold Operation S-K 1300 Report | February 12, 2024 SLR Project No.: 138.21581.00005 |
Figure 13-8: Production Tonnes
by Area
Lateral development requirements are consistent through the next three
years of mining at approximately 5,800 m per year, or just under 16 m/day, before dropping off in 2027. The planned development rates
are comparable to what was achieved by the operation in 2022.
Figure 13-9: Lateral Development
by Mining Area
Key metrics related to mine development and production are presented
by year in Table 13-6.
| | 13-17 | |
| SSR Mining Inc. | Seabee Gold Operation S-K 1300 Report | February 12, 2024 SLR Project No.: 138.21581.00005 |
Table 13-6: Development, Waste
Rock, and Backfill Summary
| Item |
Unit |
2024 |
2025 |
2026 |
2027 |
2028 |
Total |
| Capital Lateral Development |
m |
3,907 |
3,433 |
3,391 |
1,038 |
0 |
11,769 |
| Operating Lateral Development |
m |
1,917 |
2,321 |
2,457 |
1,917 |
0 |
8,612 |
| Operating Ore |
m |
571 |
677 |
733 |
513 |
0 |
2,495 |
| Operating Low Grade |
m |
200 |
240 |
303 |
308 |
0 |
1,051 |
| Operating Lateral Waste |
m |
1,145 |
1,403 |
1,422 |
1,096 |
0 |
5,066 |
| Total Lateral Development |
m |
5,824 |
5,754 |
5,848 |
2,955 |
0 |
20,381 |
| Alamac Raise |
m |
109 |
0 |
0 |
0 |
0 |
109 |
| Drop Raise |
m |
96 |
143 |
129 |
23 |
0 |
390 |
| Total Raise Development |
m |
205 |
143 |
129 |
23 |
0 |
499 |
| Longhole drilling (total) |
km |
112 |
85 |
90 |
89 |
1 |
378 |
| Waste Rock Generated |
kt |
361 |
336 |
323 |
152 |
0 |
1,181 |
| Backfill Requirement |
kt |
315 |
308 |
307 |
318 |
62 |
1,310 |
Notes:
| 1. | Sum of individual values may not match total due to rounding. |
In general, mine physicals are relatively flat through the next three
years of mining and begin to decrease in 2027 as mine development is completed. Longhole drilling requirements are highest in 2024, but
in line with achieved results in recent years. Haulage capacity will be high during 2024 due to mining a greater proportion of production
in lower areas of the mine and in areas with longer haul distances. The haulage capacity requirements will be met by adding and replacing
aging haul trucks within the fleet.
A long section showing the mining areas by year is presented in Figure
13-10. Development mined prior to 2023 is shown in grey. As-built production stopes are not shown for clarity.
| | 13-18 | |
| SSR Mining Inc. | Seabee Gold Operation S-K 1300 Report | February 12, 2024 SLR Project No.: 138.21581.00005 |
Figure 13-10: Mine Plan
Long Section by Year
| | 13-19 | |
| SSR Mining Inc. | Seabee Gold Operation S-K 1300 Report | February 12, 2024 SLR Project No.: 138.21581.00005 |
| 14.0 | Processing and Recovery Methods |
The Seabee deposit was processed for 25 years in the mill constructed
immediately adjacent to the Seabee shaft. Ore from the Santoy Mine has been the sole feed to the mill since 2017.
The remote location of the mine in northern Saskatchewan is sustained
by air transport for the workforce and winter road access for supplies. The operation was initially developed and operated on diesel power
and later connected to Saskatchewan grid power in 1992. The initial capacity was 500 tpd, which was later expanded to 1,000 tpd
with the addition of a third grinding mill, and through de-bottlenecking, its throughput has been gradually increased to the current throughput
of approximately 1,200 tpd. The mill flow sheet as shown in Figure 14-1 is a conventional crushing and grinding circuit employing
gravity gold recovery and cyanide leaching with carbon-in-pulp (CIP) for recovery and production of doré bars on site.
Production figures for the last ten years are presented in Table 14-1.
ROM ore is hauled from the Santoy Mine to the mill by truck, a distance
of approximately 14 km, and delivered to the primary crusher or deposited on stockpiles arranged by grade. The crushing circuit is made
up of mobile crushing units including a primary jaw crusher and a secondary cone crusher in closed circuit with a triple deck screen.
The product from the crushing circuit at minus 7 mm is conveyed to the ore storage bin, which has a live capacity of 400 t.
Additional crushed ore storage capacity on an outside stockpile is available, which allows for crusher breakdowns or scheduled maintenance.
When the crushing circuit is not operating, ore from the stockpile is fed into the plant through the original single-stage jaw crusher
feed point.
The grinding circuit consists of a 2.9 m diameter and 3.7 m
long ball mill serving as the primary grinding mill in closed circuit with classifying cyclones, followed by two 2.7 m diameter and
2.6 m long secondary ball mills also in closed circuit with classifying cyclones. The primary cyclone overflow slurry is divided
to feed the two secondary ball mills operating in parallel. The secondary mills have separate discharge sumps, cyclone feed pumps and
cyclone clusters. The overflow from the secondary milling circuits is combined in the leach feed thickener. The secondary circuits can
be run independently. The target grind for the leach circuit is 80% passing 115 µm. The ground product is thickened to 48% solids
in a 12 m diameter thickener prior to entering the leach circuit. Lime is introduced to the grinding circuit to maintain the pH levels
for optimum leach conditions.
| | 14-1 | |
| SSR Mining Inc. | Seabee Gold Operation S-K 1300 Report | February 12, 2024 SLR Project No.: 138.21581.00005 |
Table 14-1: Seabee Mill Production
Statistics 2014–2023
| Item |
Units |
2014 |
2015 |
2016 |
2017 |
2018 |
2019 |
2020 |
2021 |
2022 |
2023 |
| Feed Total |
t |
279,597 |
277,386 |
312,679 |
330,415 |
352,000 |
344,040 |
255,172 |
382,478 |
413,574 |
445,274 |
| Feed Daily Rate |
tpd |
756 |
760 |
857 |
967 |
1,125 |
1,087 |
1,163 |
1,180 |
1,133 |
1,220 |
| Feed Grade |
g/t Au |
7.32 |
8.82 |
7.91 |
8.25 |
9.16 |
9.56 |
10.10 |
9.92 |
10.36 |
6.62 |
| Recovery |
% |
95.7 |
96.3 |
96.6 |
97.4 |
97.4 |
98.2 |
98.4 |
98.4 |
98.0 |
96.7 |
| Gold Produced |
oz |
62,984 |
75,748 |
80,351 |
85,395 |
100,953 |
110,864 |
81,540 |
120,030 |
136,125 |
90,777 |
| | 14-2 | |
| SSR Mining Inc. | Seabee Gold Operation S-K 1300 Report | February 12, 2024 SLR Project No.: 138.21581.00005 |
Figure 14-1: Seabee Process
Plant Flow Sheet
SSR Mining Corp.
Seabee Gold Operation
Saskatchewan, Canada
Seabee Process Plant
Flow Sheet
| | 14-3 | |
| SSR Mining Inc. | Seabee Gold Operation S-K 1300 Report | February 12, 2024 SLR Project No.: 138.21581.00005 |
A portion of the cyclone feed from the primary grinding mill is directed
to the gravity recovery circuit, either the original Knelson and table circuit or the new gravity circuit. The new gravity recovery circuit
consists of two Knelson concentrators and an Acacia leach reactor, which recovers the gold from the gravity concentrate in a separate
intensive cyanide leach (ILR) and electrowinning (EW) circuit. Installation of this equipment was completed in 2017. The gravity concentrate
or electrowon metal, containing between 50% and 70% of the total gold recovered, is refined along with the gold recovered in the leach-CIP
circuit.
Optimization of the Acacia circuit is being undertaken to further improve
gravity gold recovery and resolve water balance issues that occur at higher plant throughputs.
The leach circuit consists of five agitated leach tanks, one of which
is 14.6 m in diameter and 14.6 m in height, and four of which are 8.8 m in diameter and 8.8 m in height. Air injection
is maintained in all tanks and cyanide is added to the initial tank to maintain the free cyanide level. At the current mill throughput
the tanks provide approximately 48 hours of residence time.
The carbon absorption circuit consists of eight tanks that are 3.4 m
in diameter and 4.6 m in height equipped with launder screens to retain the carbon in the tanks. The carbon circuit typically contains
about 17.2 t of carbon distributed in the tanks. The CIP tanks provide approximately 3.5 hours of retention time. Loaded carbon at
between 3,000 g/t and 6,000 g/t gold is routinely advanced to the strip circuit.
| 14.2.6 | Carbon Elution and Electrowinning |
The loaded carbon is stripped at atmospheric pressure with a heated
solution (95°C) of caustic and iso-propyl alcohol over an average of three days. There are two elution vessels, each with a capacity
of 3.56 t of carbon. Current throughput and head grades require that up to four strips be carried out per week. Gold is collected on stainless
steel cathodes in a single EW cell.
The gold recovered by EW from the CIP circuit and the gold recovered
by gravity is periodically refined in a gas-fired furnace and poured in doré gold bars on site.
| 14.2.8 | Carbon Regeneration |
To maintain the activity level of the carbon inventory, the carbon is
regenerated after stripping. Following elution, the carbon is subjected to heat treatment and attrition in a rotary kiln and screened
to remove fines prior to being returned to the CIP circuit. The acid wash step in the carbon elution and regeneration process, while available,
is not in use.
Leach residues are pumped to a conventional tailings storage facility
approximately 3 km form the plant.
All tailings solutions in excess of the mill recycle water that are
released to the environment are treated with cyanide destruction to maintain the water quality within release quality standards.
| | 14-4 | |
| SSR Mining Inc. | Seabee Gold Operation S-K 1300 Report | February 12, 2024 SLR Project No.: 138.21581.00005 |
The mill operates primarily on recycled water with 96% of the mill water
requirements recycled within the grinding circuit and from reclaim water from the tailings management area. Fresh water make-up is from
Laonil Lake near the plant and averaged approximately 4,400 m3/month during 2023. Continued de-bottlenecking of the plant will
likely lead to a need for proportionally more fresh water.
Electrical power is provided by the provincial power authority, Saskatchewan
Power Corporation. The total power usage for SGO is approximately 8.9 MVA, of which approximately 3.6 MVA can be attributed to the
mill. The electricity consumption of the mill will increase as throughput increases, mainly due to increased grinding and pumping requirements,
and will require upgrading of certain on-site power supply infrastructure (the mill motor control centre) and has been planned for in
the sustaining capital cost estimate.
| 14.2.12 | Reagents and Consumables |
The main reagents and consumables are:
All reagents and consumables are transported to site by truck over the
winter road. This necessitates the maintenance of large storage facilities at the site.
SGO is a fly-in fly-out operation with on-site accommodation facilities.
Operations personnel work 12-hour shifts on a two-week-on two-week-off basis. The mill and laboratory complement is a total of 38 people
consisting of operators and technicians, supervisors, two general foremen, two metallurgists, and a superintendent.
The total maintenance complement for the mill is 26 people consisting
of nine millwrights and 12 electricians, two supervisors, two general foremen, and a superintendent. These personnel also support the
mine.
| | 14-5 | |
| SSR Mining Inc. | Seabee Gold Operation S-K 1300 Report | February 12, 2024 SLR Project No.: 138.21581.00005 |
The major infrastructure required for SGO is shown in Figure 15-1,
Figure 15-2, Figure 15-3, and Figure 15-4. Major infrastructure includes the following:
| · | Mill buildings and related services facilities including maintenance and truck shops, assay lab, crushing plant, shops and storage
buildings |
| · | 2B mine water management ponds |
| · | Administrative buildings |
| · | Water supply and distribution |
| · | Waste management facility |
| · | Supply storage facilities |
| · | Powerhouse and electrical distribution system |
| · | TMFs and return water management |
| · | East Lake water treatment plant |
| | 15-1 | |
| SSR Mining Inc. | Seabee Gold Operation S-K 1300 Report | February 12, 2024 SLR Project No.: 138.21581.00005 |
Figure 15-1: Seabee Gold Operation
Major Infrastructure
| | 15-2 | |
| SSR Mining Inc. | Seabee Gold Operation S-K 1300 Report | February 12, 2024 SLR Project No.: 138.21581.00005 |
Figure 15-2: Seabee Gold Operation
Mill Site Infrastructure
| | 15-3 | |
| SSR Mining Inc. | Seabee Gold Operation S-K 1300 Report | February 12, 2024 SLR Project No.: 138.21581.00005 |
Figure 15-3: Seabee Gold Operation
Infrastructure including Santoy and Porky West Deposits
SSR Mining Corp.
Seabee Gold Operation
Saskatchewan, Canada
Infrastructure incluiding
Santoy and Porky West Deposits
| | 15-4 | |
| SSR Mining Inc. | Seabee Gold Operation S-K 1300 Report | February 12, 2024 SLR Project No.: 138.21581.00005 |
Figure 15-4: Seabee Gold Operation
Winter Road
SSR Mining Corp.
Seabee Gold Operation
Saskatchewan, Canada
Seabee Gold Operation
Winter Road
| | 15-5 | |
| SSR Mining Inc. | Seabee Gold Operation S-K 1300 Report | February 12, 2024 SLR Project No.: 138.21581.00005 |
The current camp facilities at SGO can accommodate approximately 250
employees. SGO has begun a program of accommodation module replacement to update some of the older accommodation units currently on site.
The site can be accessed by a 60 km winter road, which begins at
Highway 102 near the community of Brabant Lake, Saskatchewan, and includes 12 portages and 11 lakes. The majority of annual supplies are
transported to site via the winter road, typically throughout the months of February and March, and until mid-April depending on ice quality.
The mill site and Santoy Mine site are connected by a 14 km haul
road called the Santoy Road. This access road is a one-way road that is operated using radio callouts every 1 km and has specific
travel convoy times throughout the day. There are also several roads throughout both the Seabee Mine and Santoy Mine areas that provide
access to infrastructure.
Electrical power is provided by a transmission line to the site by the
provincial power authority, Saskatchewan Power Corporation, connected to a 138 kV hydroelectric power line from Island Falls. A 25
kV line connects the Santoy Mine to the main SGO site.
The total power usage for SGO is approximately 8.9 MVA and the
electrical distribution system has an installed capacity of 10.0 MVA.
Potable water is obtainable locally through SSR’s potable water
system at both the Seabee and Santoy mine sites. The site currently uses a slow sand filter system. To better meet the current and future
site water needs, a new ultrafiltration potable water system has been installed and was commissioned in Spring of 2022.
| 15.5.2 | Mine Water Facilities |
The Santoy Mine has one water management structure, which is the Santoy
8 deposit water management pond. The old Seabee Mine has two water management structures: the East Lake water treatment plant and the
2B mine water settling ponds.
Mine water from the Santoy underground mine is discharged into the north-west
corner of the Santoy 8 deposit water management pond where it is then pumped to a water treatment plant. The water is treated by
a moving bed bioreactor unit to reduce ammonia concentrations. The treated water is pumped into settling Pond 1 where biomass from the
process settles out and from there water flows to settling Pond 2 via an overflow spillway. The water is discharged from settling Pond
2 through a culvert and into the north-east corner of the mine water management pond for final settling. Final discharge to the environment
is done via a pump situated at the south end of the mine water management pond. Approximately 100,000 m3 of water from
the underground mine is treated and discharged annually.
| | 15-6 | |
| SSR Mining Inc. | Seabee Gold Operation S-K 1300 Report | February 12, 2024 SLR Project No.: 138.21581.00005 |
Settling Ponds 1 and 2 have a perimeter of approximately 105 m
and 90 m, respectively, and a maximum height of approximately 3.3 m and 3.8 m, respectively. The ponds are lined with 60 mil
HDPE and have a combined total storage volume of approximately 2,250 m3.
The mine water management pond is contained by a main dike situated
at the south end of the facility and a north saddle dike located at the north-west flank. Both structures are comprised of waste rock
with slopes graded at 2.0 H:1 V. The upstream slopes are lined with 60 mil HDPE, which are keyed into a low permeable till foundation.
The main dike and north saddle dike are approximately 180 m and 120 m in length, respectively and have a maximum height of approximately
7 m and 3.5 m, respectively. The storage volume of the mine water management pond is approximately 40,000 m3.
The East Lake water treatment plant and associated settling ponds 1
and 2 are used to treat and settle the supernatant water from the East Lake TMF and Triangle Lake TMF. Supernatant is transferred from
the Back Pond at the East Lake TMF to the water treatment plant where it is initially treated with lime, ferric sulfate, and peroxide.
Subsequently, the treated water is discharged to settling pond 1, which overflows to settling pond 2. From here the treated water is pumped
to East Pond where it is monitored prior to the final discharge to the environment. Settling ponds 1 and 2 have a perimeter of approximately
190 m and 100 m, respectively, and a depth of 2.5 m and 6 m, respectively. The ponds are lined with 60 mil HDPE
and have a combined storage capacity of approximately 13,000 m3. Approximately 80,000–100,000 m3
are treated and discharged to the environment annually, which correlates to a treatment rate of approximately 835 m3 per
day, based on a four-month treatment period.
As previously stated, a water treatment plant was constructed in 2017.
The water treatment plant has capacity to treat up to 3,400 m3 per day, removing cyanide, ammonia, and copper from the
TMF supernatant. In general, the treatment process consists of a pre-treatment step for removal of copper and cyanide followed by a moving
bed bioreactor unit for removal of ammonia.
The product from the processing facility (doré bars) is transported
by air to a third-party refiner.
At the Seabee Mine, sewage is discharged with the tailings to either
the East Lake TMF or Triangle Lake TMF.
The septic system at the Santoy Mine is a mound system, which is pumped
every second day by a vacuum truck to prevent leakage from the system.
Fuel farms and propane tanks are located at both the Seabee Mine and
Santoy Mine sites.
| | 15-7 | |
| SSR Mining Inc. | Seabee Gold Operation S-K 1300 Report | February 12, 2024 SLR Project No.: 138.21581.00005 |
A magazine and an explosives storage area are located at the Santoy
7 deposit servicing the Santoy Mine, with a secondary magazine and explosive storage area used previously for the old Seabee Mine site
situated just off the Porky access road, approximately 1.3 km north-east from the Seabee mill area. Both of these areas have been
designed and prepared in accordance with the Mines Regulations (The Mines Regulations 2018, Saskatchewan Employment Act).
| 15.8 | Tailings Management Facilities |
There are currently two tailings management facilities (TMF) that are
being used by the Seabee mill: the East Lake TMF and the Triangle Lake TMF, as shown in Figure 15-5. Tailings deposition alternates
between the two TMFs where winter deposition occurs in the Triangle Lake TMF and summer deposition is in the East Lake TMF. The current
remaining storage capacities of both TMFs, based on an average production rate at 1,200 tpd, will potentially be reached in late-2030,
which extends past the current LOM.
Maximum capacities also allow that 200,000 m3 of water
are treated and discharged from the tailings management facilities each year. To ensure the treatment volumes are attained, a new water
treatment plant at East Lake TMF was constructed in 2017.
Work is currently underway investigating options for extending the life
of the TMFs to accommodate any further extensions of the SGO life.
| 15.8.1 | East Lake Tailings Management Facility |
East Lake was a natural lake that was converted to a TMF when the Seabee
Mine was initially developed in 1991. East Lake was partially dewatered prior to tailings deposition, which provided containment for the
first six years of operation. Subsequently, vertical concrete dams lined with high density polyethylene (HDPE) were constructed along
the topographic lows along the east and south flanks of the TMF to provide additional storage capacity up to mid-2004. At this time, tailings
deposition was relocated to the newly constructed Triangle Lake TMF. To accommodate an increased mine life, further expansion of the East
Lake TMF was implemented in 2015. The expansion consisted of a 6 m high expansion dike that is comprised of waste rock. Stage 1 construction
of the expansion dike (Crest elevation 463 m) was completed in 2016 and additional raises have lifted the dike to its current elevation
of 465 m.
The existing tailings line is a 6” diameter HDPE pipe that is
approximately 2 km in length and stretches from the mill to the East Lake TMF. Spigot locations at the TMF vary over time.
Supernatant water during tailings deposition in the East Lake TMF is
regulated by a pump station situated at the north-east corner of the facility. The pond level is maintained below the maximum operating
level by pumping and discharging supernatant to either the Back Pond or to the Triangle Lake TMF. There are also three freshwater diversion
pumps situated along the western flank of the East Lake TMF that capture and divert water towards Laonil Lake.
| 15.8.2 | Triangle Lake Tailings Management Facility |
Similar to the East Lake TMF, the Triangle Lake TMF was a natural lake
that was converted to a TMF. To provide initial containment, a North dam was constructed along the northern shoreline of the TMF and tailings
deposition commenced in 2004. In 2007, the north dam was raised and the south dam was constructed along the southern shoreline of the
TMF. Both dams were vertical concrete structures lined with HDPE.
| | 15-8 | |
| SSR Mining Inc. | Seabee Gold Operation S-K 1300 Report | February 12, 2024 SLR Project No.: 138.21581.00005 |
As part of the combined East Lake TMF and Triangle Lake TMF expansion
to accommodate an increased mine life, the design of the Triangle Lake TMF was modified so that both structures would be raised with
mine rock and lined with non-woven geotextile and HDPE liner. The expansion of the TMF was staged, which also included construction of
two saddle dikes: saddle dikes W2 and W2A, situated east of the North dam. The design of the saddle dikes was consistent with the raise
to the North dam (i.e., rockfill construction with non-woven geotextile and HDPE liner). In the final stage of construction, an emergency
spillway was situated at the west abutment of the South dam, accommodating the design storm event for the TMF.
Further wall lifts have been completed on the Triangle Lake TMF and
it is currently constructed to its final permitted elevation at 466 m, which will accommodate tailings until late 2030.
Construction of a seepage collection system commenced in the summer
of 2014 along the downstream toe of the North dam to collect and manage seepage.
There is a 6″ diameter HDPE pipe that connects to the tailings
line at the East Lake TMF and extends approximately 1.2 km to either the North or South dams at the Triangle Lake TMF. Spigot locations
at the TMF vary over time.
Water from the East Lake TMF is immediately discharged to the Triangle
Lake TMF and thus the water repository and overall water management is accommodated and regulated at the Triangle Lake TMF. Reclaimed
supernatant from the Triangle Lake TMF is discharged into the Back Pond, which serves as a lift station, where supernatant is either pumped
to the East Lake water treatment plant for treatment or to the Seabee mill as reclaim. Two freshwater diversion pumps are situated along
the eastern flank of the TMF that capture and divert water towards Laonil Lake.
| 15.9 | Waste Rock Structures |
Access roads, the airstrip, dams, dikes, laydown areas, and general
site areas were constructed using waste rock, which was characterised as non-acid generating.
In order to sustain waste rock requirements for construction, SSR developed
a rock quarry at SGO. The location of the quarry is adjacent to the existing Triangle Lake TMF. To date, the main consumption of the waste
rock has been for the expansions of both TMFs and for the Santoy road upgrade / maintenance.
| | 15-9 | |
| SSR Mining Inc. | Seabee Gold Operation S-K 1300 Report | February 12, 2024 SLR Project No.: 138.21581.00005 |
Figure 15-5: Seabee Gold Operation
Tailings Management Facility Infrastructure
SSR Mining Corp.
Seabee Gold Operation
Saskatchewan, Canada
Tailings Managament
Facility Infrastructure
| | 15-10 | |
| SSR Mining Inc. | Seabee Gold Operation S-K 1300 Report | February 12, 2024 SLR Project No.: 138.21581.00005 |
| 16.1 | Marketing and Metal Prices |
The principal commodity at SGO is a doré product mainly consisting
of gold, with minor amounts of silver. This type of product is freely traded at prices that are widely known, so that prospects for sale
of any production are virtually assured. The metal prices and foreign exchange rate used in this report are based on analyst consensus
prices. The metal prices selected for the SGO vary by year and are shown in Table 16-1.
Table 16-1: Economic Analysis
Gold Price and Exchange Rate Assumptions
| Commodity |
Unit |
2023 |
2024 |
2025 |
2026 |
2027 |
2028 and Long- Term |
| Gold |
$/oz |
1,925 |
1,930 |
1,890 |
1,810 |
1,780 |
1,755 |
| Silver |
$/oz |
23.50 |
24.00 |
23.95 |
23.70 |
23.35 |
22.75 |
| Exchange Rate |
US$/C$ |
1.33 |
1.33 |
1.33 |
1.33 |
1.33 |
1.33 |
SGO currently produces doré bars. The doré refining terms
are typical and consistent with standard industry practices and similar to contracts for the refining of doré elsewhere.
The doré is transported by secure freight to a refinery, refined
into gold bullion and sold by SSR to banks that specialize in the purchase and sale of gold bullion.
No external consultants or market studies were directly relied on to
assist with the sales terms and commodity price projections used in this report. The SLR QP for this Section 16 agrees with the assumptions
and projections presented.
There are a number of acceptable refineries with capacity to refine
doré. Currently, SSR is in a non-exclusive contractual relationship with Asahi Refining Canada Ltd. (Asahi). The terms of this
contract with Asahi are within industry norms. The cost for transport and refining of the doré is in accordance with industry standards.
In addition to doré sales, SGO has numerous contracts with suppliers
for consumables, reagents, maintenance, general and administrative requirements, and other services to support a remote mine operation.
In the SLR QP’s opinion, all of the contracts that SGO have entered into are based on normal commercial arrangements.
| | 16-1 | |
| SSR Mining Inc. | Seabee Gold Operation S-K 1300 Report | February 12, 2024 SLR Project No.: 138.21581.00005 |
| 17.0 | Environmental Studies, Permitting, and Plans, Negotiations, or Agreements with Local Individuals or Groups |
| 17.1 | Environmental Aspects |
As described in Section 3.1, SGO is located at the northern end of Laonil
Lake, approximately 125 km north-east of the town of La Ronge, in Saskatchewan within the traditional territories of the Lac La Ronge
Indian Band (LLRIB) and the Peter Ballantyne Cree Nation (PBCN). It has been in operation since 1991 and despite a few exceptions, it
has operated consistently throughout the last 31 years. The site is accessed via air transportation year-round and seasonally via a winter
road beginning at Highway 102 near the community of Brabant Lake, Saskatchewan. The majority of annual supplies required to run the operation
are transported to site via the winter road throughout the months of February and March and until approximately mid-April depending on
ice quality.
Laonil and Pine Lakes surround the Seabee Mine and TMFs and are the
largest lakes of the immediate area. No local residences, cottages or outfitter camps are located in the direct vicinity of SGO, although
a few hunting/fishing camps are found within the region (EIS 1990). The closest camp is located at Pointer Lake Lodge, approximately 10
km southwest of Laonil Lake. A fly-in camp is located at Glennie Lake and Josdal Camps has an outpost camp at Steephill Lake, which are
both greater than 15 km from the operation.
Environmental studies completed since the 1980’s include baseline
assessments, environmental impact assessments, and operational monitoring programs.
At the closest government station at La Ronge, the coldest months on
average were both January and February, with a daily mean temperature of -16.7 °C, while July was the warmest month with a daily mean
temperature of 17.7 °C. The mean daily maximum temperature during this period, ranged from a low of -12.1 °C in January, to a
high of 23.6 °C in July. The mean annual precipitation was 524.0 mm, of which 386.6 mm (or 74%) fell as rain. Approximately 73% of
the total precipitation fell between the months of April through September. Mean annual snowfall for this same period was 132.9 cm. On
average, snowfall occurred in every month of the year except June through August.
The prevailing wind direction for the months of July to February was
from the west, whereas prevailing winds from March to June were from the northeast. Average wind speeds typically ranged from 10.1 km/h
in December to 12.6 km/h in May, with maximum hourly wind speeds as high as 65.0 km/h in December.
Groundwater quality monitoring at the 12 monitoring stations surrounding
the East Lake TMF, the Triangle Lake TMF, and the landfill is required monthly from May to October as per the Approvals to Operate. The
purpose of this monitoring program is to detect any seepage from the TMFs and the landfill.
The Seabee Operation lies within the Churchill River drainage basin
(184,000 km2) in northern Saskatchewan. Surface water is drained from the project area by three local drainage sub-basins,
Laonil Lake, Pine Lake, and Carruthers Lake.
| | 17-1 | |
| SSR Mining Inc. | Seabee Gold Operation S-K 1300 Report | February 12, 2024 SLR Project No.: 138.21581.00005 |
Water enters Laonil Lake from the northwest and flows southeast through
Stephens Lake and the Pickerel River before entering the Churchill River system in the eastern portion of Trade Lake. Since 2004 tailings
were deposited into dewatered Triangle Lake, which naturally drains to the Pine Lake system. To avoid further increases to the inflow
of the Triangle Lake TMF, the surface inflows from the muskeg area south of Triangle Lake have been re-routed towards Laonil Lake.
Currently, during the summer months, water that is drawn from the East
Lake TMF and Triangle Lake TMF is treated at the East Lake WTP, passed through two lined settling ponds and then pumped into a final polishing
pond before being discharged to the Laonil Lake basin. Since 2019, no tailings have been deposited in the East Lake TMF. Water quality
and discharge rates are routinely monitored at this station.
Fresh surface water from Laonil Lake is used in milling circuits and
for dust suppression, emergency fire line, and other camp and kitchen needs.
A large portion of the operational monitoring for the operation is completed
in the aquatic environment. Components include effluent quality monitoring, surface water quality monitoring, sediment quality monitoring,
and fish tissue chemistry monitoring. In addition, biological monitoring of aquatic receptors including benthic invertebrate communities
and small-bodied fish populations is also conducted to meet the federal Metal and Diamond Mining Effluent Regulations (MDMER, 2002) requirements.
There are two environmental monitoring programs required for the operation:
1) the provincial Environmental Monitoring Program (EMP) regulated by the Saskatchewan Ministry of Environment (SMOE) and 2) the federal
Environmental Effects Monitoring Program (EEM) regulated by Environment and Climate Change Canada (ECCC). The EMP is required for compliance
with the provincial laws under the Approval to Operate Pollutant Control Facilities (PO 19-193). The federal EEM program is a requirement
under the Metal and Diamond Mining Effluent Regulations of the Fisheries Act.
Two types of treated mine effluents are produced as part of the Seabee
Operation: 1) treated mine water effluent and 2) treated tailings effluent. Concentrations of licensed parameters at both mine dewatering
final discharge points, as well as at the final discharge point of the East Lake TMF water treatment plant, met all applicable maximum
monthly limits and all maximum grab sample limits. The measured concentrations of licensed parameters were usually one or several orders
of magnitudes lower than the limits under license.
Other environmental monitoring includes air quality monitoring for Total
Suspended Particulate (TSP), Particulate matter (PM2.5, PM10) and Nitrogen dioxide (NO2).
Solid non-hazardous waste generated at the site is disposed of in the
approved landfill. In accordance with the SGO’s Approval to Operate, hazardous wastes are stored in approved facilities at the site
until the winter, when these materials are transported off site for disposal at approved hazardous waste disposal facilities. In addition,
recyclable materials such as scrap metal are stored in segregated piles on an approved lay down area, and later transferred off site as
backhaul material on emptied supply trucks via the winter road.
Sodium cyanide, ferric sulfate, lime, hydrogen peroxide, diesel, gasoline,
propane, and all other consumables are transported to the site via truck over the winter road, which is generally operational throughout
February and March and until mid-April depending on ice quality. All consumables are transported to the site in accordance with the Transport
Canada Transportation of Dangerous Goods Regulations and stored in approved bulk storage facilities in accordance with the SGO’s
Approval to Operate and Saskatchewan’s Hazardous Substances and Waste Dangerous Goods Regulations.
| | 17-2 | |
| SSR Mining Inc. | Seabee Gold Operation S-K 1300 Report | February 12, 2024 SLR Project No.: 138.21581.00005 |
SSR has characterised mine rock and tailings for the potential of acid
rock drainage/metal leaching at the SGO since 2012. The results of these analyses are reported to the SMOE as part of the operation’s
annual reporting commitments. Similar programmes will be refined and periodically carried out as operations continue. To date, the findings
indicate that the mine rock is non-acid generating. All ores mined at the SGO have a low sulfide content, which is consistent with most
vein hosted gold deposits. The current data set shows the Santoy ores carry a lower sulfide content than the ores of the now-ceased Seabee
Mine. From a geochemical perspective, this means the tailings with the higher sulfur content are located in the lower elevations of the
tailings facilities, which are typically saturated or partially saturated. These tailings are then covered stratigraphically by the Santoy
tailings through continued operation. The Santoy tailings display the lowest sulfur content (less than 1%) and an equivalent balance
of carbonate content, meaning that the residual sulfur content after the carbonate is consumed in the neutralisation process, would not
likely support acidic drainage from the upper-most layers of tailings in both facilities. Thus, tailings found in the unsaturated zones
of the facilities that will be more readily oxidised are the most geochemically stable tailings. Following over 30 years of operation,
the site continues to display no evidence of acid drainage.
The geochemical characterisation to date, combined with the tailings
operational plan, which ensures that at closure, the unsaturated zone consists of low sulfur bearings tailings, supports the current closure
plans for these facilities.
| 17.2 | Tailings Disposal and Water Management |
As described in Section 15.8 there are currently two TMFs that are being,
in principle, used by the Seabee mill: the East Lake TMF and the Triangle Lake TMF. Tailings deposition historically alternated between
the two TMFs where winter deposition occurs in the Triangle Lake TMF and summer deposition is in the East Lake TMF. The current remaining
storage capacities of both TMFs, based on an average production rate at 1,200 tpd, will potentially be reached in by the end of 2030.
Maximum capacities also allow that 200,000 m3 of water are
treated and discharged from the tailings management facilities each year. To ensure the treatment volumes are attained, a new water treatment
plant at East Lake TMF was constructed in 2017.
At the time of the SLR QP’s site visit the East Lake TMF was not
in use and it has not been used since 2019, while a portion of the tailings dam will be buttressed with tailings. The site is not fully
closed out as it may be raised in the future. The current dam crest elevation is 465 masl with a maximum permitted elevation of up to
466 masl.
The Triangle Lake TMF is currently in use. The site has a long-term
deposition plan and has the capacity to store the tailings of the current operation.
Seabee mill effluent from the Triangle Lake TMF is treated in the East
Lake Water Treatment Plant (WTP). After treatment it is discharged to a clarifier pond and then a holding pond before release to a polishing
pond (East Pond). The final discharge point to the environment is located upstream of a natural muskeg which drains into Currie Rose Pond
and ultimately into the northwestern arm of Laonil Lake.
Discharge is treated for Total suspended solids, copper and cyanide
and ammonia.
| | 17-3 | |
| SSR Mining Inc. | Seabee Gold Operation S-K 1300 Report | February 12, 2024 SLR Project No.: 138.21581.00005 |
Cyanide levels in the TMF are usually in the range of 20 to 50 mg/L
Total CN. Cyanide levels in the discharge to the environment values are generally near the detection limit of 0.001 mg/L Total CN,
which is several orders of magnitude below the regulated effluent limit of 1 mg/L Total CN.
Mining process water and inflowing groundwater to the Santoy 8 mine
is collected in underground sumps, which is then pumped to the surface and treated by nitrifying bacteria that convert ammonia to nitrates
at the Santoy 8 WTP. From the Santoy 8 WTP, treated mine effluent is discharged to two lined settling ponds which are gravity-drained
to the Santoy 8 Mine Water Management Pond. Treated mine effluent is discharged into a natural muskeg, approximately 300 m from the shoreline
of Inflow Bay of Lizard Lake (Inflow Bay). The treated mine effluent flows through the muskeg area and into a creek that flows into Inflow
Bay.
| 17.3.1 | SGO Environmental Assessments |
SGO has been in production since 1991. As part of the initial environmental
assessment, approvals and the subsequent expansions at the operation, the existing environment was characterised in three environmental
assessments, in accordance with the applicable provincial regulations. The initial environmental assessment focused on the original Seabee
Mine and mill and was completed in 1990. The second environmental assessment was necessary to assess the potential environmental impacts
associated with the construction and operation of the Triangle Lake TMF and was completed in 2001. The third environmental assessment
was necessary to assess the potential environmental impacts associated with the development of the Santoy Mine and was completed in 2009.
For each of these assessments, baseline data was collected, and the potential environmental impacts associated with the proposed project
were assessed. In all three environmental assessments, no significant potential environmental impacts were identified that could not be
mitigated through the implementation of management plans. Subsequently, Ministerial Approvals to proceed to construction and operation
were granted for each of the three environmental assessments.
The Triangle Lake TMF, as well as the Santoy Mine projects, were screened
by the Canadian Environmental Assessment Agency in 2001 and 2009, respectively. As previously mentioned, SGO has never required a federal
environmental assessment.
| 17.3.2 | Environmental Permits/Authorizations |
Following a successful environmental assessment, SGO is required to
obtain a number of federal and provincial permits, approvals, and licences. These permits outline the environmental operating specifications
and reporting requirements of the operation. Although all regulatory permits and approvals carry the same level of importance, the Provincial
Approval to Operate (PO) is the primary regulatory approval required to operate a gold mine in Saskatchewan. The PO is issued in accordance
with numerous provincial legislation and regulations governing Saskatchewan’s mining industry.
Since its inception, the SGO has operated under the terms and conditions
of a PO, issued by the SMOE. The operation’s current Approval to Operate number PO22-185, was issued in October 2022 and expires
in September 2027. This approval outlines monitoring and reporting requirements for all operations, including:
| · | Surface and groundwater in immediate and surrounding areas |
| · | Sediment quality of surrounding lakes |
| | 17-4 | |
| SSR Mining Inc. | Seabee Gold Operation S-K 1300 Report | February 12, 2024 SLR Project No.: 138.21581.00005 |
| · | Aquatic biota in surrounding lakes |
| · | Facilities and areas requiring daily, weekly, and monthly inspections |
| · | Regular acid rock drainage/metal leaching testing |
| · | Annual geotechnical inspection by a Professional Geotechnical Engineer |
| · | Development and regular updates to a variety of management plans |
SGO reports annually on the operations performance in its Annual Environment
Report. According to the 2022 Annual Environment Report, dated March 31, 2023, SGO is in compliance with the terms and conditions of this
approval. The report also lists the environmental permits obtained in 2022.
| 17.4 | Social or Community Aspects |
The SGO is within the Treaty 10 area and borders the Pelican Narrows
and Brabant Lake community areas of influence (SMOE 2003). These communities were consulted during the completion of previous environmental
assessments in support of the project throughout its operating history. The socio-economic study area for the Santoy Mine environmental
impact statement (the most recent environmental assessment completed in 2009) included La Ronge, Air Ronge, Kitsakie IR 156B, Lac La Ronge
IR 156, Nemeiben River IR 156C, Stanley Mission IR 157, Grandmother’s Bay IR 219, Brabant Lake, Pelican Narrows IR 184B, Pelican
Narrows, Sandy Lake, Southend IR 200, and Deschambault Lake IR 203.
In accordance with the terms and conditions of the operation’s
Surface Lease Agreement, continual effort has been made at the SGO to engage the nearby communities in order to maximise northern employment
opportunities as well as the local purchase of goods and services to support the mine. The operation continues to honour its social commitments
outlined in the project’s surface lease agreement.
Since SSR’s purchase of the SGO, a concerted effort has been made
to maintain and strengthen the relationship with the surrounding communities, including the LLRIB and the PBCN.
In addition, stakeholder engagement plans have been developed and activities
defined in these plans are currently underway. SGO reports the following:
| · | 2023 year to date (YTD) – approximately 15% employees are northern Saskatchewan residents |
| · | 2023 YTD – approximately 28% of workforce is of indigenous ancestry |
| · | 2023 YTD – 421 total employees |
| · | SGO is currently going through the final stages of Exploration agreements negotiations with LLRIB and PBCN. |
| 17.5 | Mine Closure Requirements |
In accordance with Saskatchewan’s Mineral Industry Environmental
Protection Regulations (1996), the SGO has, since 1996, submitted to the SMOE a decommissioning and reclamation plan (closure plan) and
cost estimate. In accordance with these regulations and the site’s Approval to Operate, this closure plan is required to be revised
and submitted for review and approval at least every five years or as requested by the SMOE. The most recent closure plan (SGO Preliminary
Decommissioning and Reclamation Plan, 2021 Update) was submitted in May 2022 and accepted by the Government of Saskatchewan June 2023.
| | 17-5 | |
| SSR Mining Inc. | Seabee Gold Operation S-K 1300 Report | February 12, 2024 SLR Project No.: 138.21581.00005 |
The closure plan meets the following objectives:
| · | Complies with previous environmental assessment and existing commitments as outlined in the SGO’s Approval to Operate. |
| · | Meets the SMOE’s final mine closure objectives as outlined in the Guidelines for Northern Mine Decommissioning and Reclamation
(SMOE 2008), specifically: |
| o | Leaves all disturbed areas safe for traditional land uses and in an ecological condition that is consistent with the surrounding physical
and biological environment. |
| o | Leaves the site in a state that requires minimal or no maintenance. |
| · | Eliminates potential short and long-term health, safety and environmental risks associated with any aspect of the site. |
| · | Ensures long term physical stability of all landforms and containment structures, in accordance with the Canadian Dam Association
Guidelines. |
The total estimated cost to implement the closure plan through an independent
contractor is approximately C$36.9 million. The financial assurance was accepted by regulators in September 2023.
SSR, in accordance with the Mineral Industry Environmental Protection
Regulations, is responsible to post financial assurance equalling the closure cost estimate with the Government of Saskatchewan. An update
to the closure estimate is currently underway, to cover the approved expanded TMF.
In accordance with the EAB guidance, effluent discharges from the site
during the implementation of closure activities will meet Saskatchewan Effluent Quality Limits. Final decommissioning and reclamation
water quality objectives for the site, which are determined jointly by the operator and the SMOE, will be met at the site prior to the
Ministry’s acceptance of the property into its Institutional Control Program.
The closure cost estimate allows for mine closure in three phases:
| 1. | A decommissioning and reclamation phase to complete the closure activities; |
| 2. | A transitional phase to allow for the monitoring of all decommissioning and reclamation activities,
ensuring that all closure criteria have been met; and |
| 3. | An institutional control phase. |
Saskatchewan’s Institutional Control Programme requires funds
to be set aside for maintenance and monitoring during a 100-year period and requires additional funds to manage the maintenance that may
occur as a result of unforeseen events. SSR, in accordance with the Mineral Industry Environmental Protection Regulations, is responsible
to post financial assurance equalling the closure cost estimate with the Government of Saskatchewan, covering the three phases of mine
closure.
In summary, key site infrastructure will be closed out as follows:
| · | Site infrastructure will be decontaminated, as needed, removed, where practicable, or demolished and disturbed areas will be regraded
and reclaimed. Soils will be decontaminated as needed. Roads, parking areas, lay down areas, settling ponds, winter road portages, and
footprint of the air strip will be scarified to support revegetation following the removal of all culverts, power lines, pipelines, and
other miscellaneous infrastructure. This infrastructure will be disposed of as part of the major infrastructure decommissioning and reclamation
plan. |
| | 17-6 | |
| SSR Mining Inc. | Seabee Gold Operation S-K 1300 Report | February 12, 2024 SLR Project No.: 138.21581.00005 |
| · | The site will be revegetated in accordance with SMOE’s Guidelines for Northern Mine Decommissioning and Reclamation through
a combination of natural and active revegetation. |
| · | Non-hazardous demolition waste will be disposed of in the on site landfill, hazardous waste will be hauled off site for disposal in
licensed facilities. |
| · | The TMFs will be decommissioned and reclaimed using a cover comprised of low PAG waste rock cover graded towards the closure spillway,
located at the south end of the facilities. The dams are constructed of rockfill that is resistant to erosion and the current dam slopes
will remain. Soil will not be placed on the dam slopes and the rockfill will be left exposed. A closure spillway will be constructed in
bedrock at both TMFs and will accommodate the Probable Maximum Flood (PMF). |
| · | Water treatment sludges at the mine are relatively small in volume. Following the decommissioning and reclamation of the water treatment
plant, the sludges will be covered in place with a till cover or a combination of a liner, till, sand, or mine rock cover. |
| · | No mine rock associated with the SGO is characterised as being potentially net acid generating, and therefore the closure objective
is to ensure long-term physical stability of the piles. The largest single source of mine rock in a central location forms the foundation
of the airstrip. All of this material will be used as the construction material for the tailings facility covers. A portion of the remaining
mine rock will be used as cover material for the clean demolition debris and backfill material for the existing portals and mine openings,
where appropriate. Any remaining mine rock not used as construction material in the decommissioning and reclamation activities, will be
contoured to a 3:1 slope and allowed to naturally revegetate. |
| · | In the event hydrocarbon contaminated material is identified, the material will be excavated and land farmed in a designated area.
Liquid product produced from the land farm will be transferred into drums and sent offsite for disposal in a licenced facility or used
in the waste oil burner. |
| · | The current operating procedures for the landfill call for progressive reclamation. Following placement of refuse, it is covered with
mine rock. At closure, slopes of the covered landfill will be contoured to a minimum of a 3:1 slope. |
| · | The underground mine workings will be allowed to flood naturally following operations. |
| · | The East Lake water treatment plants will remain operational throughout the decommissioning and reclamation activities until such
time as further water treatment is not required. Following the need for water treatment, the plants will be dismantled and removed from
site. |
| · | The underground workings will be inspected and all hazardous wastes and dangerous goods will be transferred to the surface and ultimately
off site for disposal at an approved facility. Following this recovery of assets and decontamination, the mines will be allowed to flood
naturally. |
| | 17-7 | |
| SSR Mining Inc. | Seabee Gold Operation S-K 1300 Report | February 12, 2024 SLR Project No.: 138.21581.00005 |
| · | There are 12 vertical to sub-vertical vent raises and one shaft associated with the SGO. Each of these openings will also be fitted
with an engineered concrete reinforced cap keyed into bedrock, in accordance with accepted industry practices. The sub-horizontal openings
(five portals) will be backfilled with approximately 15 m of waste rock. The waste rock will be extended past the portal entrance
and will be contoured to a slope of 3:1. |
| · | A final evaluation of all crown pillars will be completed as part of the engineering of the final closure plan. Crown pillars determined
to pose a higher risk of failure will be collapsed as part of the decommissioning process. |
The management of safety and health at the SGO reflects the effective
management of risk. The mine’s safety and health strategy is two-fold: to ensure full compliance with the Saskatchewan Mine Act
regulations; and to minimise residual risk in relation to regulatory compliance through a risk-centred safety and health management system.
SGO is committed to continuous improvement in all functions and especially
in Safety, Health, and Environment. In 2022, SGO recorded a Total Recordable Injury Frequency Rate (TRIFR) of 17.92 per million work hours.
SGO had set a target to reduce the TRIFR in 2023 by half. By November 2023, SGO was on target to meet this objective.
Mining-related hazards are inventoried and characterised in terms of
their risk, i.e., development of a comprehensive risk registry. Controls, in the form of appropriate engineering and mine design, fixed
and mobile equipment optimisation, work processes, training and competency verification, and others, are implemented in relation to risks
with proportional emphasis on catastrophic risk. Special emphasis is given to risks such as geotechnical, mine design and operational
risk.
In addition to the central risk management framework, the mine employs
a wide variety of policies, processes and procedures that populate the safety and health management system including, but not limited
to: safety committees, daily workplace audits, safety communication, proper use of protective equipment, job hazard analysis and standard
operating equipment, contractor management, a focus on behaviour modification and human error, and incident investigation and root cause
analysis, among others.
In instances where changes to risk management practices occur as a result
of changes to mine equipment, practices, geotechnical information as well as other change criteria, the mine undertakes a change management
review to ensure that those changes do not result in an increase in potential risk. Where change does result in additional risk, relevant
control measures are modified.
While the SGO’s approach to risk management is primarily focused
on the prevention of incidents, and has substantially reduced safety incidents, the operation also maintains a properly staffed, trained,
and provisioned mine rescue team that is prepared to address any foreseeable emergency that might occur underground or on surface. Dedication,
and diligent preparation and training have resulted in provincial recognition for the mine’s rescue team and system.
| | 17-8 | |
| SSR Mining Inc. | Seabee Gold Operation S-K 1300 Report | February 12, 2024 SLR Project No.: 138.21581.00005 |
SGO’s safety and health management system, like all effective
management systems, undergoes review of continuous improvement involving performance metrics and other training and leading key performance
indicators. However, SSR also recognises that the system is only as effective as the organisational culture and the degree to which the
system is adopted by its members as common practice. In 2023, SGO implemented the “Leadership in the Field” campaign, which
promotes and encourages proactive hazard identification through conversations in the field. The program has since seen positive results
in the reduction frequency of incidents, but more importantly, it encourages leaders to be in the field having safety focused conversations.
Accordingly, there is also recognition that the behaviour of leaders at the mine has a substantial impact on the mine’s operational
culture. As such, the mine emphasises culture assessment and enhancement through leadership development.
Following a review of the information supplied, the opinion of the SLR
QP is that significant environmental and social analysis has been conducted for the project over an extended period, the project has been
in operation for a number of years, SSR employs professionals and other personnel with responsibility in these areas.
| | 17-9 | |
| SSR Mining Inc. | Seabee Gold Operation S-K 1300 Report | February 12, 2024 SLR Project No.: 138.21581.00005 |
| 18.0 | Capital and Operating Costs |
The estimated capital costs required to achieve the Mineral Reserve
LOM are summarized in Table 18-1. The capital costs were estimated by SSR and reviewed by SLR. Since SGO is an operating mine, all
capital costs are categorized as sustaining. Sustaining capital costs have been estimated by SSR on a three-year rolling forecast, and
are based in their latest operating budget and actual costs. SLR has made reasonable allowances to estimate sustaining capital for the
balance of the mine life. The operating costs are estimated to the equivalent of an Association for the Advancement of Cost Engineering
(AACE) Class 1 estimate with an accuracy range of -10% to +15%, although it is noted that AACE does not typically apply to operating costs.
The sustaining capital is estimated to an AACE Class 3 estimate with an accuracy range of -20% to +30%. The sustaining capital costs include:
| · | Mine capital development |
| · | Diamond drilling exploration and capital within the mine |
| · | Building and civil works such as mill improvements and TMF construction costs |
| · | Mobile equipment such as new and replacement purchases and major rebuilds |
| · | Replacement or refurbishment of major machinery or equipment components |
Table 18-1: Capital Costs Estimate
| Cost Component |
Value (US$ millions) |
| Capital Development |
67.6 |
| Diamond Drilling and Exploration |
22.5 |
| Building and Civil Work |
9.4 |
| Mobile Equipment |
13.3 |
| Machinery and Automation |
13.1 |
| Total Sustaining Capital Cost |
125.8 |
The operating costs were estimated based on the actual operating expenditures
at the SGO through 2023. The costs were estimated by SSR and reviewed by SLR and include an evaluation of fixed and variable components.
The operating expenses estimated to validate the positive cash flow
for the Mineral Reserve LOM are summarized in Table 18-2. The mining expense includes all labour, supplies, consumables, and equipment
maintenance to complete mining related activities, less exploration diamond drilling and capital excavations and construction which are
capitalized. The milling expense includes all labour, supplies, consumables to complete milling related processes and activities. The
administrative expense includes all labour, supplies, consumables, and equipment maintenance to complete administrative, finance, human
resources, environmental, safety, supply chain, site services, camp and kitchen, and travel related activities.
| | 18-1 | |
| SSR Mining Inc. | Seabee Gold Operation S-K 1300 Report | February 12, 2024 SLR Project No.: 138.21581.00005 |
As the project has been in operation for a number of years, the level
of project definition for the operating cost estimates is very high. Given the available project performance data and the high level
of project definition, no contingency was included in the operating cost estimate.
Table 18-2: Operating Costs
Estimate
| Cost Component |
LOM Total
(US$ millions) |
Average Annual1
(US$ millions) |
LOM Average
(US$/t milled) |
| Mining |
130.3 |
31.6 |
63.86 |
| Milling (incl. Fixed Plant) |
66.3 |
16.1 |
32.25 |
| G&A |
117.4 |
27.6 |
57.11 |
| Total Operating Cost |
314.0 |
75.3 |
153.22 |
Notes:
| 1. | For fully operational years (2024 – 2027) |
| 2. | Sum of individual values may not match total due to rounding. |
| | 18-2 | |
| SSR Mining Inc. | Seabee Gold Operation S-K 1300 Report | February 12, 2024 SLR Project No.: 138.21581.00005 |
The economic analysis contained in this TRS is based on the SGO Mineral
Reserves, economic assumptions, and capital and operating costs provided by SSR corporate finance team and SGO finance and technical teams
and reviewed by SLR. All costs are expressed in Q3 2023 US dollars. Unless otherwise indicated, all costs in this section are expressed
without allowance for escalation, currency fluctuation, or interest. Costs quoted in Canadian dollars were converted to US dollars at
an exchange rate of US$1.00 = C$1.33. The complete cash flow is presented in Appendix 1.
A summary of the key criteria is provided below.
| 19.1.1 | Production Physicals |
| • |
Mine
Life: |
4.2
years (between 2024 and Q1-2028) |
| • |
Underground
mining rate: |
Peak mining rate of 1,400 tonnes per day. |
| • |
LOM
underground tonnes: |
2,043 kt at 5.12 g/t of Au |
| • |
Stockpile
feed to plant: |
13
kt at 5.22 g/t of Au |
| • |
Total
Ore Feed to Plant: |
2,056 kt at 5.12 g/t of Au |
| • |
Contained
Gold: |
338,624 oz of Au |
| • |
Contained
Silver: |
8,804 oz of Ag (at an Ag/Au ratio of 2.6%) |
| • |
Recovered
Gold: |
326,696 oz |
| • |
Recovered
Silver: |
8,494
oz |
| • |
Average
LOM Mill Recovery |
96.4% |
| |
|
|
|
| · | The metal prices and foreign exchange rate used in this report are based on analyst consensus prices as of November 2023, as defined
in Table 19-1. |
Table 19-1: Economic Analysis
Gold Price and Exchange Rate Assumptions
| Commodity |
Unit |
2024 |
2025 |
2026 |
2027 |
2028 and Long- Term |
| Gold |
$/oz |
1,930 |
1,890 |
1,810 |
1,780 |
1,755 |
| Silver |
$/oz |
24.00 |
23.95 |
23.70 |
23.35 |
22.75 |
| Exchange Rate |
US$/C$ |
1.33 |
1.33 |
1.33 |
1.33 |
1.33 |
| · | Payable metals are estimated at 99.5% for gold and silver. These rates are based on actual SGO Budget figures. |
| · | Transportation charges of US$20,000 per month. |
| | 19-1 | |
| SSR Mining Inc. | Seabee Gold Operation S-K 1300 Report | February 12, 2024 SLR Project No.: 138.21581.00005 |
| · | Refining charges are estimated at US$1.33/oz Au over the LOM based on actual SGO Budget. |
| · | A private 3% NSR royalty on LOM revenues with Osisko Gold Royalties (Osisko). |
| · | LOM NSR revenue is US$602 million (after Logistic and Refining Charges) and the net revenue is US$584 million after including payable
royalties. |
| 19.1.3 | Capital and Operating Costs |
| · | Sustaining capital costs for buildings and infrastructure, machinery, and mobile equipment total US$35.8 million |
| · | Underground capitalized development costs of US$67.6 million |
| · | Diamond drilling exploration and capital within the mine of US$22.5 million |
| · | Underground mining operating costs: US$63.86/t ore mined |
| · | Processing operating costs: US$32.25/t ore milled |
| · | G&A: US$57.11/t ore milled |
| · | Total unit operating costs US$152.73/t ore milled |
| · | LOM total operating costs: US$314 million |
| · | Annual bond premium for ARO total US$923 thousand over the LOM |
| · | Closure costs of US$24 million are included in the analysis at the end of the LOM |
| 19.1.4 | Taxation and Royalties |
| · | Federal and provincial income taxes were applied at a rate of 15% and 12%, respectively, after allowable depreciation deductions. |
| · | The Saskatchewan mining royalty (mineral tax) is enacted under the Crown Mineral Royalty Regulations, pursuant to the Crown Minerals
Act. For precious metals the royalty rate is 10% of net revenue after deducting production costs, transportation costs and refinery processing
charges, and applicable depreciation deductions. |
| · | SLR prepared the tax calculations and were reviewed and approved by SSR Finance and Tax teams. |
SLR prepared a LOM unlevered after-tax cash flow model to confirm the
economics of the Property over the LOM (between 2024 and 2028). Economics have been evaluated using the discounted cash flow method by
considering annual processed tonnages and gold and silver grades. The associated process recovery, metal prices, operating costs, refining
and transportation charges, royalties, sustaining capital costs, and reclamation and closure costs were also considered.
The base discount rate assumed in this TRS is 5% as per SSR corporate
guidance. Discounted present values of annual cash flows are summed to arrive at the Project’s Base Case NPV.
| | 19-2 | |
| SSR Mining Inc. | Seabee Gold Operation S-K 1300 Report | February 12, 2024 SLR Project No.: 138.21581.00005 |
To support the disclosure of Mineral Reserves, the economic analysis
demonstrates that SGO’s Mineral Reserves are economically viable at a LOM average gold price of US$1,854/oz and silver price of
US$23.74/oz.
SGO’s Base Case undiscounted pre-tax net cash flow is approximately
$119 million and the undiscounted after-tax net cash flow is approximately $102.2 million.
SGO’s Base Case pre-tax NPV at a 5% discount rate is approximately
$111.2 million and the SGO’s Base Case after-tax NPV at a 5% discount rate is approximately $94.9 million.
The World Gold Council Adjusted Operating Cost (AOC) after Silver by-product
credits is US$1,024/oz Au. The mine life sustaining capital cost is US$464/oz Au, for an AISC after Silver by-product credits of US$1,488/oz
Au. The mine average annual gold production during the LOM is approximately 79,200 oz per year between 2024 and 2027 (full production
years), silver production is 2,000 oz per year between 2024 and 2027.
The after-tax cash flow summary is presented in Table 19-2.
| | 19-3 | |
| SSR Mining Inc. | Seabee Gold Operation S-K 1300 Report | February 12, 2024 SLR Project No.: 138.21581.00005 |
Table 19-2: After-Tax Cash Flow
Summary
| Description |
Units |
Value |
| LOM |
Years |
4.2 |
| Realized Market Prices |
|
|
| Au ($/oz) |
US$/oz |
1,854 |
| Ag ($/oz) |
US$/oz |
23.74 |
| Payable Metal |
|
|
| Au (koz) |
koz |
325 |
| Ag (koz) |
koz |
8 |
| Total Gross Revenue |
US$ million |
603 |
| Mining Cost |
US$ million |
(130) |
| Process Cost |
US$ million |
(66) |
| G & A Cost |
US$ million |
(117) |
| Refining/Freight |
US$ million |
(1) |
| Mining Royalties |
US$ million |
(18) |
| Total Operating Costs |
US$ million |
(333) |
| Operating Margin (EBITDA) |
US$ million |
270 |
| Working Capital |
US$ million |
0 |
| Sustaining Capital |
US$ million |
(126) |
| Total Closure/Reclamation Capital |
US$ million |
(25) |
| Total Capital |
US$ million |
(151) |
| |
|
|
| Pre-tax Free Cash Flow |
US$ million |
119 |
| Pre-tax NPV @ 5% |
US$ million |
111 |
| SK Mineral Tax |
US$ million |
(11) |
| Federal & Provincial Income Tax |
US$ million |
(5) |
| After-tax Free Cash Flow |
US$ million |
102 |
| After-tax NPV @ 5% |
US$ million |
95 |
Note: Sum of individual values may not match total due to rounding
| | 19-4 | |
| SSR Mining Inc. | Seabee Gold Operation S-K 1300 Report | February 12, 2024 SLR Project No.: 138.21581.00005 |
Project risks can be identified in both economic and non-economic terms.
Key economic risks were examined by running cash flow sensitivities on after-tax NPV at a 5% discount rate. The following items were examined:
| · | Gold metallurgical recovery |
| · | Capital costs (sustaining and closure) |
After-tax sensitivity over the base case has been calculated for -20%
to +20% (for gold grade), -5% to +5% (for gold recovery), -20% to +20% (for gold price), and -10% to +15% (operating costs and capital
costs) variations to determine the most sensitive parameter for SGO. The sensitivities are shown in Figure 19-1 and Table 19-3.
| | 19-5 | |
| SSR Mining Inc. | Seabee Gold Operation S-K 1300 Report | February 12, 2024 SLR Project No.: 138.21581.00005 |
Table 19-3: After-Tax Sensitivity
Analyses
| Variance |
Head Grade
(g/t Au) |
NPV at 10%
(US$000) |
| 80% |
4.10 |
9,065 |
| 90% |
4.61 |
54,838 |
| 100% |
5.12 |
94,942 |
| 110% |
5.63 |
135,109 |
| 120% |
6.15 |
175,480 |
| Variance |
Recovery
(% Au) |
NPV at 10%
(US$000) |
| 95% |
91.6% |
74,898 |
| 98% |
94.0% |
84,920 |
| 100% |
96.4% |
94,942 |
| 102% |
98.4% |
102,960 |
| 104% |
100.0% |
111,229 |
| Variance |
Metal Prices
(US$/oz Au) |
NPV at 10%
(US$000) |
| 80% |
1,484 |
8,988 |
| 90% |
1,669 |
54,808 |
| 100% |
1,854 |
94,942 |
| 110% |
2,040 |
135,138 |
| 120% |
2,225 |
175,538 |
| Variance |
Operating Costs
(US$/t) |
NPV at 10%
(US$000) |
| 90% |
137.45 |
116,562 |
| 95% |
145.09 |
105,752 |
| 100% |
152.73 |
94,942 |
| 108% |
164.18 |
78,727 |
| 115% |
175.63 |
62,461 |
| Variance |
Capital Costs
(US$000) |
NPV at 10%
(US$000) |
| 90% |
135,755 |
108,533 |
| 95% |
143,297 |
101,738 |
| 100% |
150,839 |
94,942 |
| 108% |
162,152 |
84,750 |
| 115% |
173,464 |
74,557 |
| | 19-6 | |
| SSR Mining Inc. | Seabee Gold Operation S-K 1300 Report | February 12, 2024 SLR Project No.: 138.21581.00005 |
Figure 19-1: After-Tax Sensitivity
Analysis
The sensitivity analysis shows that the after-tax NPV5% at
SGO is most sensitive to gold price, head grade, and metallurgical recovery, followed by operating costs and capital costs. A 10% reduction
in gold price, represents a 42% decrease in the after-tax NPV 5% value.
| | 19-7 | |
| SSR Mining Inc. | Seabee Gold Operation S-K 1300 Report | February 12, 2024 SLR Project No.: 138.21581.00005 |
SGO is contiguous with claims held by various companies and individuals.
SLR has not relied upon any information from the adjacent properties in the preparation of this report.
| | 20-1 | |
| SSR Mining Inc. | Seabee Gold Operation S-K 1300 Report | February 12, 2024 SLR Project No.: 138.21581.00005 |
| 21.0 | Other Relevant Data and Information |
SSR is evaluating the Porky West deposit for eventual inclusion in the
life of mine. At the time of issuing this report, SSR was conducting an initial assessment of the Porky West deposit. The SLR QP understands
that the concept being put forward would involve Porky West being developed as a stand-alone mine, with mineralized material being sent
to the Seabee mill for processing. The SLR QP has not had direct involvement with this assessment.
From an environmental permitting and approval perspective, the addition
of the Porky West area would be a relatively simple addition to the current Provincial Approval to Operate (PO) and Preliminary Decommissioning
and Reclamation Plan, as Porky West is part of the existing mining lease.
The development of the Porky West area would require the recommissioning
of the existing water management ponds in order to manage the underground water, which would be settled and treated similar to the other
underground mining areas.
The understanding is that in order to manage the additional tailings
from Porky West, one or both of the existing TMFs may need to be expanded. If a new TMF in a different location were required, depending
on the location, additional environmental permitting may be required, potentially including federal permits under MDMER and, if fish-bearing
waters were to be affected, a Schedule 2 amendment under that regulation.
No additional information or explanation is necessary to make this TRS
understandable and not misleading.
| | 21-1 | |
| SSR Mining Inc. | Seabee Gold Operation S-K 1300 Report | February 12, 2024 SLR Project No.: 138.21581.00005 |
| 22.0 | Interpretation and Conclusions |
SLR offers the following conclusions by area.
| 22.1 | Geology and Mineral Resources |
| · | Mineral Resources at SGO are estimated for the Santoy Mine and the Porky West deposit. They have been updated with data collected
since the last Mineral Resource estimate dated as of December 31, 2021 (SSR, 2022a). |
| · | The procedures for sample preparation, security, and analysis adhere to industry standards for ensuring data quality and integrity.
There are no factors associated with sampling or sample preparation that would significantly affect the accuracy or reliability of the
samples or assay results. The results of the quality assurance and quality control (QA/QC) procedures demonstrate that the assay results
fall within acceptable ranges of accuracy and precision, affirming the adequacy of the resulting database to underpin the estimation of
Mineral Resources. |
| · | No material sample bias was identified during the review of the drill data and assays. The data is adequate for the purposes of Mineral
Resource estimation. |
| · | All the main gold deposits at SGO are considered orogenic quartz-vein hosted lode gold deposits. The geology and characteristics of
gold mineralization at the Santoy 8 and 9 and Porky West projects are well understood while the GHW-SHW Project requires more analysis
to fully understand its complexity. Gold zones on the Santoy Mine are connected in terms of origin and location to the existence of the
large granodioritic complex. The known mineralization extends around two kilometers along strike and reaches approximately one kilometre
across strike and depth. |
| · | There is good potential to increase the Mineral Resource base for the Santoy Mine underground deposits at depth, and additional exploration
and development is warranted. |
| · | There is good potential to increase the Mineral Resource base at Porky West at depth and along strike, and additional exploration
is warranted. SLR understands that an exploration plan is in place to increase the Mineral Resource footprint as well as continue infill
drilling. |
| · | The resource cut-off grade
and underground reporting shapes used to identify
those portions of
the Mineral Resource estimation that meet the requirement of reasonable
prospects for economic extraction
and are considered to be appropriate for this style of gold deposit and mineralization. |
| · | Measured Mineral Resources at the SGO are estimated to total 0.9 million tonnes (Mt) at a grade of 5.5 g/t Au and contain 16,300 ounces
of gold (oz Au). Indicated Mineral Resources are estimated to total 1.47 Mt at a grade of 4.3 g/t Au and contain 202,000 oz Au. In addition,
Inferred Mineral Resources are estimated to total 2.75 Mt at a grade of 5.2 g/t Au and contain 462,500 oz Au. |
| | 22-1 | |
| SSR Mining Inc. | Seabee Gold Operation S-K 1300 Report | February 12, 2024 SLR Project No.: 138.21581.00005 |
| 22.2 | Mining and Mineral Reserves |
| · | Mineral Reserve estimates, as prepared by SSR and reviewed and accepted by SLR, have been classified in accordance with definitions
for Mineral Reserves in S-K 1300. Mineral Reserves as of December 31, 2023 total 2.1 Mt, grading 5.17 g/t Au and containing 343,000 oz
Au. |
| · | Mineral Reserves are estimated by qualified professionals using modern mine planning software in a manner consistent with industry
practice. |
| · | Measured and Indicated Mineral Resources were converted to Proven and Probable Mineral Reserves, respectively, through the application
of modifying factors. Inferred Mineral Resources were not converted to Mineral Reserves. |
| · | Santoy is a mature underground mine with years of operating experience and well established procedures. |
| · | The estimated Mineral Reserves support a life of mine (LOM) plan that extends 4.2 years to 2028 at a maximum production rate of 511,000
tonnes per annum (tpa) (1,400 tonnes per day (tpd)) in 2026 and 2027, corresponding to the processing capacity. |
| · | The planned increase in production rate from 2026 onwards will require robust short-term planning and sequencing. Future reserve conversion
would allow the number of active mining areas to be maintained or expanded, and would facilitate the increase in production.. |
| · | Production mining uses a combination of longitudinal and transverse open stoping depending on the width of the orebody. Over the LOM,
55% of the production tonnes are planned using a transverse stope arrangement with the remainder mined longitudinally. |
| · | An extraction factor of 89% is applied to both production stopes and ore development designs, and linear overbreak dilution of 0.7
m is applied to production designs. These factors are established and checked through the stope reconciliation process. |
| · | At Santoy Mine, most mining to date has been in the Santoy 8 and Santoy 9 principal deposits. Over the remaining LOM, the proportion
of ore mined in the GHW and SHW is expected to increase. In these hanging wall areas, the orebody is generally wider and at a shallower
dip, and thus transverse stopes constitute a higher proportion of the mine plan. There is limited operating experience in these areas
and SLR is of the opinion that meeting production targets will require ongoing efforts to optimize mine plans and stope designs in order
to maximize extraction and minimize dilution. |
| · | Mining, processing, and general and administrative (G&A) costs used for cut-off grade calculation are lower than recent actuals
due to incorporating planned cost savings initiatives. Of the three components, the mining cost is most impacted by these savings. SLR
is of the opinion that achieving the operating costs savings may be challenging while maintaining production targets, however, acknowledges
that SGO has a plan in place. |
| | 22-2 | |
| SSR Mining Inc. | Seabee Gold Operation S-K 1300 Report | February 12, 2024 SLR Project No.: 138.21581.00005 |
| · | The SGO processing plant uses conventional crush, grind, gravity concentration, and cyanide leaching, followed by carbon adsorption,
elution, electrowinning, and refining to recover gold and produce doré bars. |
| · | The processing plant has been expanded and de-bottlenecked since initially entering operating in 1991 and is now capable of processing
approximately 1,200 tpd of ore. |
| · | Gold head grades, historically ranging from approximately 6 g/t to 15 g/t, and recently reaching almost 20 g/t at times during 2021
and 2022, have decreased to an average of approximately 6 g/t, ranging from approximately 4 g/t to 8 g/t since mid 2022. |
| · | Historically high recoveries of 97% to 99% have subsequently also decreased slightly to between 96% and 98%. |
| · | SGO is a remote operation in northern Saskatchewan and is accessible by winter road and by air. |
| · | The majority of annual supplies are transported to site via the 60 km winter road, which begins at Highway 102 near the community
of Brabant Lake, Saskatchewan, and includes 12 portages and 11 lakes. The road is typically usable throughout the months of February and
March, and until mid-April depending on ice quality. A 1,275 m airstrip is also located on the Property. |
| · | A camp with a capacity of 251 people is located adjacent to the processing plant and other major surface infrastructure. |
| · | A 14 km haul road connects the Santoy Mine to the processing plant site. |
| · | Two tailings management facilities (TMF) with sufficient capacity until approximately 2030 (at the current processing rate) are used
for tailings impoundment. Most of the water used in the process is reclaimed from the TMFs. Fresh make-up water as well as domestic and
fire water is obtained from Laonil Lake near the camp and plant. |
| · | The operation is connected to the Saskatchewan power grid via an approximately 15 km long transmission line connected to the 138 kV
Island Falls transmission line. |
| · | No known environmental issues were identified from the documentation review and site visit. SGO appears to have all pertinent permit
and approvals at hand. Proper provisions have been made for safe disposal of tailings and water management. |
| · | There is a comprehensive Environmental Management System in place, which includes a comprehensive monitoring program for effluent
discharges, air quality, surface water quality, groundwater quality, terrestrial biology (vegetation and wildlife) and aquatic biology.
SGO reports the results of the monitoring program to the authorities according to the frequency stated in the approved permits and no
compliance issues have identified. |
| · | A Mine Closure Plan has been developed that considers all pertinent provincial legislation. The Mine Closure Plan is updated periodically. |
| | 22-3 | |
| SSR Mining Inc. | Seabee Gold Operation S-K 1300 Report | February 12, 2024 SLR Project No.: 138.21581.00005 |
| 22.6 | Capital and Operating Costs and Economics |
| · | The economic analysis demonstrates that SGO’s Mineral Reserves are economically viable at a LOM average realized gold price
of US$1,854/oz of Au and silver price of US$23.74/oz of Ag. SGO’s Base Case pre-tax net present value (NPV) at a 5% discount rate
is approximately US$111.2 million and SGO’s Base Case after-tax NPV at a 5% discount rate is approximately US$94.9 million. |
| · | The operating costs used for calculating cut-off grade are 18% lower than the LOM average. SLR checked the impact that higher operating
costs would have on cut-off grade and Mineral Reserves and is of the opinion that the impact is not material. |
| | 22-4 | |
| SSR Mining Inc. | Seabee Gold Operation S-K 1300 Report | February 12, 2024 SLR Project No.: 138.21581.00005 |
| 23.1 | Geology and Mineral Resources |
| 1 | Complete an infill drilling program to upgrade Inferred Mineral Resources within the GHW-SHW LOM plan to at least a classification
of Indicated. A total of 41,000 m of
underground drilling is planned for 2024, with a proposed budget of US$ 2.3 million. |
| 2 | Increase the collection of density measurements at all deposits to obtain a better understanding of the behaviour of density across
lithologies and mineralized domains. |
| 3 | While the data collection, management, and verification procedures at site are considered to be adequate for this report, the development
of standard protocols and actions with respect to drilling, drill hole sampling, channel sampling, QA/QC, and drill hole database management
will improve the overall project integrity. Detailed recommendations are provided in each section. |
| 4 | Migrate from a MS Access database
to an industry standard database management system. |
| 5 | Continue exploration drilling at Porky West to prove additional resources at depth and along strike and begin infill drilling to
upgrade Inferred Mineral Resources. A total of 46,000 m of surface drilling is planned for 2024, with a proposed budget of US$ 5.36
million. |
| 23.2 | Mining and Mineral Reserves |
| 1 | It is recommended that the stope strike length and stope optimizer post-processing parameters be re-evaluated during subsequent Mineral
Reserve updates to ensure mineable shapes are generated in both longitudinal and transverse mining areas. |
| 2 | As more mining experience is gained in the GHW and SHW areas, re-evaluate the suitability of the dilution and extraction values currently
based on the Santoy 8 and 9 stope performance. |
| 3 | The appropriateness of the stated cut-off grade is dependent on the realization of operating cost savings compared to recent years.
Evaluate cut-off grades periodically as operating costs change. |
| 4 | Routinely reconcile the mine production numbers to the Resource model (F1 Factor), and milled production to Resource model (F3 factor),
to measure the accuracy of the Resource and Reserve block model. SLR understands that new Resource block models and grade control models
have recently been developed and implemented and recommends that a robust reconciliation process be put in place to allow for further
model refinement. |
| 5 | Some stopes in the GHW and SHW areas are designed using a transverse arrangement though the mining width is narrower than the stated
longitudinal/transverse demarcation measurement. Re-evaluate stope arrangements as more geological information and operating experience
is gained in these areas. |
| 6 | Consider using cemented rockfill (CRF) rather than uncemented rockfill (URF) where stopes are planned adjacent to backfill, particularly
in transverse stoping areas. |
| | 23-1 | |
| SSR Mining Inc. | Seabee Gold Operation S-K 1300 Report | February 12, 2024 SLR Project No.: 138.21581.00005 |
| 1 | SGO has an on-going program of modernization and optimization underway aimed at optimizing processing and increasing throughput. Currently,
metallurgical recovery and mine-to-mill reconciliation is based on monthly gold production, inventory changes within the process plant,
and tails grades and is compared to leach feed grades determined from manual sampling. Manual sampling of crushed ore is also carried
out, however, due to the presence of significant amounts of coarse gold in the ore, this sample is considered unreliable and is not used
for metallurgical accounting. SLR recommends that frequent automatic sampling (and sample splitting) of crushed ore feeding the grinding
circuit be included in this program of improvements to facilitate better mine-to-mill reconciliation and validation of gold recovery. |
| 1 | Assess all infrastructure requirements necessary not only for the existing life of mine, but also for the potential for additional
deposits being developed. |
| 1 | Continue to adhere to robust environmental and social standards. |
| | 23-2 | |
| SSR Mining Inc. | Seabee Gold Operation S-K 1300 Report | February 12, 2024 SLR Project No.: 138.21581.00005 |
AACE International, 2012, Cost Estimate
Classification System – As applied in the Mining and Mineral Processing Industries, AACE International Recommended Practice No.
47R-11, 17 p.
Ash, C., and Alldrick, D., 1996. Au-quartz
Veins; in Lefebure, D.V. and Hõy, T. (eds.) Selected British Columbia Mineral Deposit Profiles Volume 2 – Metallic Deposits,
British Columbia Ministry of Employment and Investment, Open File 1996-13, pp. 57–58.
Beak Associates Consulting Ltd., 1990.
Seabee Project: Environmental Impact Statement. Prepared for Claude Resources Inc.
Bell, K., and Macdonald, R., 1982. Geochronological
Calibration of the Precambrian Shield in Saskatchewan; in Summary of Investigations. Saskatchewan Geological Survey, Saskatchewan Energy
and mines Miscellaneous Report 82-4, pp. 17–22.
Bickford, M.E., Collerson, K.D., Lewry,
J.F., Van Schmus, W.R., and Chiarenzelli, J.R., 1990. Proterozoic Collisional Tectonism in the Trans-Hudson Orogen, Saskatchewan; Geology,
v. 18, pp. 17–22.
CanNorth Environmental Services, 2016a.
Silver Standard Resources Inc. Seabee Gold Operations Tailings Management Facility Expansion and Rock Quarry Heritage Resources Impact
Assessment.
CanNorth Environmental Services, 2016b.
Vegetation Inventory Studies for the Silver Standard Seabee Gold Operations’ Triangle Lake Tailings Management Facility Expansion.
Chauvel, C., Arndt, N.T., Kielinzcuk,
S., and Thom, A., 1987. Formation of Canadian 1.9 Gold Continental Crust. I: Nd Isotopic Data; Canadian Journal of Earth Science, v. 24,
pp. 14–18.
Chiarenzelli, J.R., Lewry, J.F., and
Landon, M., 1987. Bedrock Geology, Iskwatikan Lake Area: Evidence for Hudsonian Juxtaposition of Proterozoic and Archean Rocks along a
Ductile Detachment Surface; In Summary of Investigations 1987, Saskatchewan Geological Survey, Saskatchewan Energy and Mines, Miscellaneous
Report 87-4, pp. 46–51.
Corrigan, D., Galley, A.G., Pehrsson,
S., 2007. Tectonic evolution and metallogeny of the southwestern Trans-Hudson Orogen; in Goodfellow, W.D. (ed.), Mineral Deposits of Canada:
A Synthesis of Major Deposit-Types, District Metallogeny, the Evolution of Geological Provinces, and Exploration Methods: Geological Association
of Canada, Mineral Deposit Division, Special Publication No. 5, pp. 881–902.
Claude Resources Inc., 2013. Mineral
Resource and Mineral Reserve Estimate Seabee Gold Operation Saskatchewan, Canada; 2012 Year End NI 43-101 Technical Report.
Craig, L., 1989. Geology of the Pelican
Narrows Area of East Central Saskatchewan; Unpublished Ph.D. thesis, University of Saskatchewan.
Delaney, G.D., 1992. Gold in the Glennie
Domain; Saskatchewan Energy and Mines, Miscellaneous report 92-5, 71 pp.
Goldak Airborne Surveys., 2007. Technical
Report on a Fixed Wing Gradiometer Survey, Seabee Block Central Saskatchewan; Internal report prepared for Claude Resources Inc.
| | 24-1 | |
| SSR Mining Inc. | Seabee Gold Operation S-K 1300 Report | February 12, 2024 SLR Project No.: 138.21581.00005 |
Golder Associates Ltd., 2009. Environmental
Impact Statement for the Proposed Santoy 8 Satellite Mine at Seabee Gold Mine, Saskatchewan.
Herget, G., 1988. Stresses in rock. Rotterdam:
Balkema.
KHS Environmental Management Group Ltd.,
2001. Seabee Mine Tailings Management Facility Expansion Environmental Impact Statement.
KHS Environmental Management Group Ltd,
2001. Seabee Mine, Tailings Management Facility Expansion – EIS SGO-1700, December 2001.
Konst, R., 2016a. Project Clydesdale
Analytical Precision. Internal report prepared for Silver Standard Resources Inc.
Konst, R. 2016b. Project Clydesdale Screen
Fire Assays. Internal report prepared for Silver Standard Resources Inc.
Konst, R., 2016c. Seabee Mine Site Drilling
and Assay Audit; Internal report prepared for Silver Standard Resources Inc.
Konst, R., 2016d. Seabee Exploration
Program 2016 Sampling, Preparation, and Analytical Quality Assurance. Internal report prepared for Silver Standard Resources Inc.
Konst, R., 2017. Seabee Mine Analytical
Precision; Internal report prepared for Silver Standard Resources Inc.
Lewry, J.F., and Sibbald, T.I.I., 1977.
Variation in Lithology and Tectonometamorphic Relationships in the Precambrian Basement of Northern Saskatchewan; Canadian Journal of
Earth Sciences, v. 14, pp. 1453–1467.
Lewry, J.F., Thomas, D.J., Macdonald,
R., and Chiarenzelli, J., 1990. Structural relations in accreted terranes of the Trans-Hudson Orogen, Saskatchewan: telescoping in a collisional
regime?; in Lewry, J.F. and Stauffer, M.R. (eds.), The Early Proterozoic Trans-Hudson Orogen of North America, Geological Association
of Canada, Special Paper 37, pp. 75–94.
Macdonald, R., 1987. Update on the Precambrian
Geology and Domainal Classification of Northern Saskatchewan; in Summary of Investigations. Saskatchewan Geological Survey, Saskatchewan
Energy and Mines, Miscellaneous Report 87-4, pp. 87–104.
Ministry of Environment, 2020. Acceptance
of Decommissioning and Reclamation Plan and Update to Financial Assurance, Letter from Government of Saskatchewan Ministry of Environment,
2 July 2020.
NewFields, 2019. Independent Technical
Review Seabee Mine – Triangle Lake TMF Expansion, Northern Saskatchewan No. 680.0002.000, January 2019.
North Rock Mining Solutions, 2018. Santoy
Mine – 2018 Ramp Inspection and Related Mining Geotechnics, November 2018.
North Rock Mining Solutions, 2020. Q4
Mining-Geotechnical Site Visit Summary Notes, September 2020.
OreWin Pty Ltd. (OreWin), 2022. Seabee
2021 Technical Report Summary. Prepared for SSR Mining Inc. September 29, 2022.
Pakalnis & Associates, 2017. Report
on site visit – Santoy mine, Seabee gold operation silver standard SGM-01/17, June 2017.
| | 24-2 | |
| SSR Mining Inc. | Seabee Gold Operation S-K 1300 Report | February 12, 2024 SLR Project No.: 138.21581.00005 |
Precision GeoSurveys Inc., 2016. Airborne
Geophysical Survey Report, Seabee Block; Internal report prepared for Silver Standard Resources Inc.
Quantec Geoscience Ltd., 2013. Titan-24
DC/IP and MT Survey Geophysical Report (Santoy Gap), Seabee Gold Project, La Ronge, Saskatchewan, Canada; Internal report prepared for
Claude Resources Inc.
Silver Standard Resources Inc., 2017a.
Silver Standard Seabee Gold Operations 2017 Life of Mine Plan.
Silver Standard Resources Inc., 2017b.
Silver Standard Annual Information Form.
SGO Mining Inc., 2021. Seabee Gold Operation,
Ground Control Analysis – GHW Mining GCA-20200225, June 2021.
[SMOE] Saskatchewan Ministry of Environment,
2003. Amisk-Atik Integrated Forest Land Use Plan.
[SMOE] Saskatchewan Ministry of Environment,
2008. Guidelines for northern mine decommissioning and reclamation, version 6. Saskatchewan Ministry of Environment, Industrial, Uranium
and Hardrock Mining Unit, EPB 381.
[SMOE] Saskatchewan Ministry of Environment,
2010. Seabee Surface Lease Agreement.
[SMOE] Saskatchewan Ministry of Environment,
2016. Approval to Operate a Pollutant Control Facilities Approval No. PO16-002.
SRK Consulting (Canada) Inc., 2009. Structural
Interpretation of Aeromagnetic Data. Seabee Gold Project Saskatchewan, Canada. Internal report prepared for Claude Resources Inc.
SRK Consulting (Canada) Inc., 2016. Annual
Geotechnical, Inspection of Tailings Facilities and Water Management Ponds ICC042.013, March 2017.
SRK Consulting (Canada) Inc., 2016a.
Seabee Mine Quarry Rock ML/ARD Assessment.
SRK Consulting (Canada) Inc. 2016b. Seabee
Mine Tailings Alternatives Assessment. Claude Resources Inc.
SRK Consulting (Canada) Inc., 2017. Seabee
Mine, Tailings Alternatives Assessment (Draft) ICC042.006, March 2016.
SRK Consulting (Canada) Inc., 2017a.
NI 43-101 Technical Report for the Seabee Gold Operation, Saskatchewan, Canada, 5CS010.001, October 2017. (SGOTR17)
SRK Consulting (Canada) Inc., 2017b.
Seabee Gold Operation Preliminary Decommissioning and Reclamation Plan, 2016 Update – Final.
SRK Consulting (Canada) Inc., 2018. Triangle
Lake TMF Expansion Detailed Design ICC042.025, July 2018.
SRK Consulting (Canada) Inc., 2018 Annual
Geotechnical Inspection of Tailings Facilities and Water Management Ponds ICC042.025, July 2018.
SRK Consulting (Canada) Inc., 2018. Triangle
Lake and East Lake Tailings Management Facilities – Dam Breach Analysis – DRAFT ICC042.029.500, August 2019.
SRK Consulting (Canada) Inc., 2019. Triangle
Lake and East Lake Tailings Management Facilities – Dam Breach Analysis – DRAFT ICC042.029.500, August 2019.
| | 24-3 | |
| SSR Mining Inc. | Seabee Gold Operation S-K 1300 Report | February 12, 2024 SLR Project No.: 138.21581.00005 |
SRK Consulting (Canada) Inc., 2020.
Seabee Tailings Operation, Maintenance and Surveillance (OSM) Manual.
SSR Mining Inc. (SSR), 2021. Seabee Gold
Operation, Standards and Guidelines - Ground Control SGO-1700, May 2021.
SSR, 2021. Seabee Gold Operation,Preliminary
Decommissioning & Reclamation Plan Update
SSR, Seabee Gold Operation, Environmental
Performance Report 2016 – 2020
SSR, 2022a, Seabee 2021 Technical Report
Summary, Job No 21014, September 2022
SSR, 2022b. Form 10-K – Annual
Report Pursuant to Section 13 or 15(d) of the Securities Exchange Act of 1934, December 2022.
SSR, 2023. Operations-Exploration-Amisk,
https://www.ssrmining.com/operations/exploration/amisk/ (accessed November 28, 2023).
Stantec Mining, 2015. Geomechanical Overview
of Stope and Pillar Stability for the Santoy Gap Orebody Project no. 169514558, March 2015.
Stauffer, M.R., 1984. Manikewan: and
early Proterozoic ocean in central Canada, its igneous history and orogenic closure; Precambrian Research, v. 25, pp. 257–281.
The Mines Regulations, 2003. Chapter
0-1.1 Reg 2 (effective July 16, 2003).
US Securities and Exchange Commission.
2018. Regulation S-K, Subpart 229.1300, Item 1300 Disclosure by Registrants Engaged in Mining Operations and Item 601 (b)(96) Technical
Report Summary.
White, D.J., Lucas, S.D., Hajnal, A.,
Green, A.G., Lewry, J.F., Weber, W., Bailes, A.H., Syme, E.C., and Ashton, K., 1994. Paleo-Proterozoic Thick-Skinned Tectonics: Lithoprobe
Seismic Reflection Results from the Eastern Trans-Hudson Orogen; Canadian Journal of Earth Sciences, v. 31, pp. 458–469.
Wood, C.R., 2016. Structural study of
the auriferous Santoy shear zone, northeastern Glennie domain, Saskatchewan; Unpublished masters thesis, University of Regina, Regina,
Saskatchewan.
| | 24-4 | |
| SSR Mining Inc. | Seabee Gold Operation S-K 1300 Report | February 12, 2024 SLR Project No.: 138.21581.00005 |
| 25.0 | Reliance on Information Provided by the Registrant |
This TRS has been prepared by SLR for SSR. The information, conclusions,
opinions, and estimates contained herein are based on:
| · | Information available to SLR at the time of preparation of this TRS. |
| · | Assumptions, conditions, and qualifications as set forth in this TRS. |
| · | Data, reports, and other information supplied by SSR and other third party sources. |
For the purpose of this TRS, SLR has exclusively relied on ownership
information provided by SSR in a document dated January 3, 2024, entitled Seabee Land Tenure Status Report. SLR has not researched property
title or mineral rights for SGO as we consider it reasonable to rely on SSR and their legal counsel who is responsible for maintaining
this information.
SLR has exclusively relied on SSR for guidance on applicable taxes,
royalties, and other government levies or interests, applicable to revenue or income from SGO in the Executive Summary and Section 19.
The Qualified Persons have taken all appropriate steps, in their professional
opinion, to ensure that the above information from SSR is sound. Apart from mineral tenure information and the application of taxes and
royalties, the SLR QPs take responsibility for all other information in this report.
Except as provided by applicable laws, any use of this TRS by any third
party is at that party’s sole risk.
| | 25-1 | |
| SSR Mining Inc. | Seabee Gold Operation S-K 1300 Report | February 12, 2024 SLR Project No.: 138.21581.00005 |
| 26.0 | Date and Signature Page |
This report titled “Technical Report Summary on the Seabee Gold
Operation, Saskatchewan, Canada” with an effective date of December 31, 2023 was prepared and signed by:
| |
(Signed)
SLR International Corporation |
| |
|
| Dated
at Lakewood, CO |
|
| February
12, 2024 |
SLR
International Corporation |
| | 26-1 | |
| SSR Mining Inc. | Seabee Gold Operation S-K 1300 Report | February 12, 2024 SLR Project No.: 138.21581.00005 |
| 27.0 | Appendix 1 Cash Flow Summary |
| | 27-1 | |
| SSR Mining Inc. | Seabee Gold Operation S-K 1300 Report | February 12, 2024 SLR Project No.: 138.21581.00005 |
Economic Model Annual Summary
Company SSR Mining
Project Name Seabee Gold Operation
Scenario Name Seabee $1,600
Au Reserve Price
Analysis Type S-K 1300 TRS
Update
Calendar Year 2024 2025 2026
2027 2028 2029 2030 2031 2032 to 2042
Project Timeline in Years 1
2 3 4 5 6 7 8 9 to 19
Time Until Closure In Years
US$ & Metric Units LoM Avg / Total 5 4 3 2 1 -1 -2 -3 -4 to -14
Market Prices
Gold, Forecast US$/oz $1,850
$1,930 $1,890 $1,810 $1,780 $1,755 $1,755 $1,755 $1,755 $1,755
Silver, Forecast US$/oz $24.00
$24.00 $23.95 $23.70 $23.35 $22.75 $22.75 $22.75 $22.75 $22.75
Physicals
Total Ore Mined kt 2,043 476
493 511 511 52 - - - -
Total Waste Mined kt - - -
- - - - - - -
Total Material Mined kt 2,043
476 493 511 511 52 - - - -
Stripping Ratio W:O - - - -
- - - - - -
Total Ore Rehandled kt 13 -
0.00 0.00 - 13 - - - -
Total Material Moved kt 2,056
476 493 511 511 65 - - - -
Total Ore Processed kt 2,056
476 493 511 511 65 - - - -
Gold Grade, Stacked g/t 5.12
5.76 5.70 4.48 4.75 4.08 - - - -
Contained Gold, Stacked koz
339 88.1 90.3 73.6 78.1 8.6 - - - -
Average Recovery, Gold % 96.5%
96.8% 96.8% 96.1% 96.2% 95.2% -- -- -- --
Recovered Gold, Stacked koz
327 85.3 87.3 70.7 75.2 8.2 - - - -
Produced Gold, Total koz 327
85.3 87.3 70.7 75.2 8.2 - - - -
Produced Silver, Total koz
8 2.2 2.3 1.8 2.0 0.2 - - - -
Payable Gold, Total koz 325
84.8 86.9 70.4 74.8 8.1 - - - -
Payable Silver, Total koz 8
2.21 2.26 1.83 1.95 0.2 - - - -
Cash Flow
Gold Gross Revenue 99.97% $000s
602,804 163,754 164,233 127,389 133,160 14,269 - - - -
Silver Gross Revenue 0.03%
$000s 201 53 54 43 45 5 - - - -
Gross Revenue Before By-Product
Credits 100.0% $000s 603,005 163,807 164,287 127,432 133,205 14,274 - - - -
Gold Gross Revenue $000s 602,804
163,754 164,233 127,389 133,160 14,269 - - - -
Silver Gross Revenue $000s
- - - - - - - - - -
Gross Revenue After By-Product
Credits $000s 602,804 163,754 164,233 127,389 133,160 14,269 - - - -
Mining Cost $000s (130,275)
(30,494) (35,048) (29,123) (31,652) (3,959) - - - -
Process Cost $000s (66,315)
(18,277) (16,642) (15,274) (14,273) (1,848) - - - -
G&A Cost $000s (117,418)
(30,197) (28,288) (25,956) (25,956) (7,021) - - - -
Refining and Freight Cost $000s
(1,434) (353) (356) (334) (340) (50) - - - -
NSR Royalty $000s (17,696)
(4,808) (4,822) (3,739) (3,908) (418) - - - -
Subtotal Cash Costs Before
By-Product Credits $000s (333,138) (84,129) (85,157) (74,425) (76,129) (13,297) - - - -
By-Product Credits $000s 201
53 54 43 45 5 - - - -
Total Cash Costs After By-Product
Credits $000s (332,937) (84,076) (85,102) (74,382) (76,084) (13,292) - - - -
Operating Margin 45% $000s
269,867 79,678 79,130 53,007 57,076 977 - - - -
EBITDA $000s 269,867 79,678
79,130 53,007 57,076 977 - - - -
Depreciation Allowance $000s
(172,753) (39,980) (39,748) (36,847) (24,042) (13,190) (7,731) (4,550) (2,689) (3,976)
Earnings Before Taxes $000s
97,114 39,698 39,383 16,160 33,034 (12,213) (7,731) (4,550) (2,689) (3,976)
SK Mineral Tax $000s (11,481)
- (3,274) (2,879) (5,188) (140) - - - -
Federal and Provincial Income
Tax $000s (5,313) (6,223) (5,254) 910 (3,023) 4,459 3,818 - - -
Net Income $000s 80,320 33,475
30,855 14,191 24,823 (7,894) (3,914) (4,550) (2,689) (3,976)
Non-Cash Add Back - Depreciation
$000s 172,753 39,980 39,748 36,847 24,042 13,190 7,731 4,550 2,689 3,976
Working Capital $000s 0 (5,145)
(1,490) 269 (576) 1,960 4,982 - - -
Operating Cash Flow $000s 253,073
68,310 69,112 51,306 48,288 7,257 8,799 - - -
Sustaining Capital $000s (125,847)
(49,433) (39,357) (27,957) (9,101) - - - - -
Closure/Reclamation Costs $000s
(24,992) (185) (185) (185) (185) (185) (486) (9,856) (11,079) (2,649)
Total Capital $000s (150,839)
(49,617) (39,541) (28,141) (9,285) (185) (486) (9,856) (11,079) (2,649)
Cash Flow Adj./Reimbursements
$000s - - - - - - - - - -
LoM Metrics
Economic Metrics
Discount Rate MidPoint 5% 0.976
0.929 0.885 0.843 0.803 0.765 0.728 0.694 0.507
a) Pre-Tax
Free Cash Flow $000s 119,029
24,916 38,099 25,135 47,214 2,753 4,496 (9,856) (11,079) (2,649)
Cumulative Free Cash Flow $000s
24,916 63,015 88,150 135,364 138,116 142,612 132,756 121,677 119,029
NPV @ 5% $000s 111,220 24,315
35,410 22,248 39,802 2,210 3,438 (7,178) (7,684) (1,343)
Cumulative NPV @ 5% $000s 24,315
59,726 81,974 121,777 123,987 127,424 120,247 112,563 111,220
b) After-Tax
Free Cash Flow $000s 102,234
18,693 29,571 23,165 39,003 7,072 8,313 (9,856) (11,079) (2,649)
Cumulative Free Cash Flow $000s
18,693 48,264 71,429 110,432 117,505 125,818 115,962 104,883 102,234
NPV @ 5% $000s 94,942 18,242
27,484 20,505 32,880 5,678 6,357 (7,178) (7,684) (1,343)
Cumulative NPV @ 5% $000s 18,242
45,727 66,232 99,112 104,790 111,147 103,969 96,286 94,942
Operating Metrics
Mine Life Years 4.2
Average Daily Mining Rate t/d
moved 1,360 1,300 1,350 1,400 1,400 867 - - -
Average Daily Processing Rate
t/d processed 1,310 1,300 1,350 1,400 1,400 1,091 - - -
Mining Cost $ / t moved $63.36
64.09 71.13 56.99 61.94 60.47 - - -
Processing Cost t/d processed
32.25 38.41 33.77 29.89 27.93 28.23 - - -
G&A Cost t/d processed
$57.11 63.47 57.41 50.79 50.79 107.24 - - -
Subtotal Direct Operating Costs
t/d processed $152.73 165.97 162.31 137.68 140.67 195.94 - - -
Refining and Freight Cost t/d
processed $0.70 0.74 0.72 0.65 0.67 0.77 - - -
NSR Royalty t/d processed $8.61
10.11 9.79 7.32 7.65 6.39 - - -
Total Operating Cost t/d processed
$162.03 176.82 172.82 145.65 148.98 203.10 - - -
Sales Metrics
Au Sales koz 325
Total Cash Cost $ / oz Au 1,024
Total AISC $ / oz Au 1,488
Avg. LOM Annual Au Sales
(incl. rinsing phase) koz/yr 79.2
| | 27-2 | |
| SSR Mining Inc. | Seabee Gold Operation S-K 1300 Report | February 12, 2024 SLR Project No.: 138.21581.00005 |
| |
Making
Sustainability Happen |
|
| |
Technical Report Summary on the Puna
Operations, Argentina
S-K 1300 Report
SSR Mining Inc.
SLR Project No.: 138.21581.00003
Effective Date:
December 31, 2023
Signature Date:
February 12, 2024
Prepared by:
SLR International Corporation
|
| |
| |
| |
| |
| |
Making
Sustainability Happen |
Technical Report Summary on the
Puna Operations, Argentina
SLR Project No.: 138.21581.00003
Prepared by
SLR International Corporation
1658 Cole Blvd, Suite 100
Lakewood, CO 80401
for
SSR Mining Inc.
6900 E. Layton Avenue, Suite 1300
Denver, CO 80237
Effective Date - December 31, 2023
Signature Date - 12, 2024
| Distribution: |
1 copy - SSR Mining Inc. |
| |
1 copy - SLR International Corporation |
Cautionary Note Regarding Forward-Looking Statements:
Certain statements contained in this report are "forward-looking
statements" within the meaning of Section 27A of the Securities Act of 1933, as amended (the “Securities Act”),
and Section 21E of the Securities Exchange Act of 1934, as amended (the “Exchange Act”), and are intended to be covered
by the safe harbor provided for under these sections. Forward looking statements can be identified with words such as “may,”
“will,” “could,” “should,” “expect,” “plan,” “anticipate,” “believe,”
“intend,” “estimate,” “projects,” “predict,” “potential,” “continue”
and similar expressions, as well as statements written in the future tense. Forward-looking statements are based on information known
at such time and/or with a good faith belief with respect to future events. Such statements are subject to risks and uncertainties that
could cause actual performance or results to differ materially from those expressed in the forward-looking statements. Many of these risks
and uncertainties cannot be controlled or predicted. Given these risks and uncertainties, readers are cautioned not to place undue reliance
on forward-looking statements. Forward-looking statements include, among things: metal price assumptions, cash flow forecasts, projected
capital and operating costs, metal recoveries, mine life and production rates, and other assumptions used in this report.
Such forward-looking information and statements are based on a number
of material factors and assumptions, including, but not limited to: the inherent speculative nature of exploration results; the ability
to explore; communications with local stakeholders; maintaining community and governmental relations; status of negotiations of joint
ventures; weather conditions at our operations; commodity prices; the ultimate determination of and realization of Mineral Reserves; existence
or realization of Mineral Resources; the development approach; availability and receipt of required approvals, titles, licenses and permits;
sufficient working capital to develop and operate the mines and implement development plans; access to adequate services and supplies;
foreign currency exchange rates; interest rates; access to capital markets and associated cost of funds; availability of a qualified work
force; ability to negotiate, finalize, and execute relevant agreements; lack of social opposition to our mines or facilities; lack of
legal challenges with respect to our properties; the timing and amount of future production; the ability to meet production, cost, and
capital expenditure targets; timing and ability to produce studies and analyses; capital and operating expenditures; economic conditions;
availability of sufficient financing; the ultimate ability to mine, process, and sell mineral products on economically favorable terms;
and any and all other timing, exploration, development, operational, financial, budgetary, economic, legal, social, geopolitical, regulatory
and political factors that may influence future events or conditions. While we consider these factors and assumptions to be reasonable
based on information currently available to us, they may prove to be incorrect.
The above list is not exhaustive list of the factors that may affect
any of the forward-looking statements and information included in this report, and such statements and information will not be updated
to reflect events or circumstances arising after the date of such statements or to reflect the occurrence of anticipated or unanticipated
events.
This technical report summary also contains financial measures which
are not recognized under U.S. generally accepted accounting principles.
| SSR Mining Inc. | Puna Operations S-K 1300 Report | February 12, 2024 SLR Project No.: 138.21581.00003 |
Table of Contents
| 1.0 Executive Summary |
1-1 |
| 1.1 Summary |
1-1 |
| 1.2 Economic Analysis |
1-6 |
| 1.3 Technical Summary |
1-11 |
| 2.0 Introduction |
2-1 |
| 2.1 Site Visits |
2-1 |
| 2.2 Sources of Information |
2-2 |
| 2.3 List of Abbreviations |
2-3 |
| 3.0 Property Description |
3-1 |
| 3.1 Location |
3-1 |
| 3.2 Land Tenure |
3-3 |
| 3.3 Encumbrances and Royalties |
3-8 |
| 3.4 Required Permits and Status |
3-8 |
| 3.5 Other Significant Factors and Risks |
3-8 |
| 4.0 Accessibility, Climate, Local Resources, Infrastructure and Physiography |
4-1 |
| 4.1 Accessibility |
4-1 |
| 4.2 Climate |
4-1 |
| 4.3 Local Resources |
4-1 |
| 4.4 Infrastructure |
4-2 |
| 4.5 Physiography |
4-3 |
| 5.0 History |
5-1 |
| 5.1 Ownership, Exploration, and Development History |
5-1 |
| 5.2 Past Production |
5-2 |
| 6.0 Geological Setting, Mineralization, and Deposit |
6-1 |
| 6.1 Regional Geology |
6-1 |
| 6.2 Local Geology |
6-3 |
| 6.3 Property Geology |
6-6 |
| 6.4 Deposit Types |
6-15 |
| 7.0 Exploration |
7-1 |
| 7.1 Surface Exploration |
7-1 |
| 7.2 Drilling |
7-1 |
| 7.3 Hydrogeology Data |
7-11 |
| 7.4 Geotechnical Data |
7-12 |
| | i | |
| SSR Mining Inc. | Puna Operations S-K 1300 Report | February 12, 2024 SLR Project No.: 138.21581.00003 |
| 7.5 QP Comments |
7-13 |
| 8.0 Sample Preparation, Analyses, and Security |
8-1 |
| 8.1 Chinchillas |
8-1 |
| 8.2 Pirquitas |
8-13 |
| 8.3 QP Opinion |
8-26 |
| 9.0 Data Verification |
9-1 |
| 9.1 Database Validation |
9-1 |
| 9.2 QA/QC Protocol |
9-3 |
| 9.3 QP Opinion |
9-3 |
| 10.0 Mineral Processing and Metallurgical Testing |
10-1 |
| 10.1 Process Plant Performance |
10-1 |
| 10.2 Metallurgical Performance Estimates |
10-1 |
| 10.3 Chinchillas Test Work |
10-6 |
| 10.4 QP Opinion |
10-22 |
| 11.0 Mineral Resource Estimates |
11-1 |
| 11.1 Summary |
11-1 |
| 11.2 Chinchillas |
11-3 |
| 11.3 Pirquitas |
11-27 |
| 11.4 Comparison with Previous Mineral Resource Estimates |
11-41 |
| 12.0 Mineral Reserve Estimates |
12-1 |
| 12.1 Summary |
12-1 |
| 12.2 Conversion to Mineral Reserves |
12-1 |
| 12.3 Net Smelter Return |
12-3 |
| 12.4 Block Value Calculation |
12-6 |
| 12.5 Dilution |
12-6 |
| 12.6 Mining Recovery |
12-6 |
| 12.7 Comparison with Previous Estimates |
12-6 |
| 12.8 QP Opinion |
12-6 |
| 13.0 Mining Methods |
13-1 |
| 13.1 Geotechnical Review |
13-1 |
| 13.2 Pit Phases and Timing |
13-5 |
| 13.3 Production Rates, Mine Life, Dimensions, and Dilution Factors |
13-7 |
| 13.4 Stripping Requirements |
13-8 |
| 13.5 Required Mining Fleet and Machinery |
13-8 |
| 13.6 Ore Control Drilling and Method |
13-9 |
| | ii | |
| SSR Mining Inc. | Puna Operations S-K 1300 Report | February 12, 2024 SLR Project No.: 138.21581.00003 |
| 13.7 Drilling and Blasting |
13-10 |
| 13.8 Loading Operations |
13-10 |
| 13.9 Hauling Operations |
13-10 |
| 13.10 Mine Support |
13-11 |
| 13.11 Mine Maintenance |
13-11 |
| 13.12 Mine General and Administration |
13-12 |
| 13.13 Mine Safety |
13-12 |
| 13.14 Mine Dewatering |
13-12 |
| 13.15 Mine Workforce |
13-13 |
| 14.0 Processing and Recovery Methods |
14-1 |
| 14.1 Process Overview |
14-1 |
| 14.2 Reagents and Consumables |
14-3 |
| 14.3 Personnel |
14-3 |
| 14.4 Electricity |
14-3 |
| 14.5 Water |
14-3 |
| 15.0 Infrastructure |
15-1 |
| 15.1 Ore Haulage |
15-1 |
| 15.2 Gas Pipeline and Power Supply |
15-2 |
| 15.3 Water Supply |
15-2 |
| 15.4 Tailings |
15-2 |
| 15.5 Communications Systems |
15-4 |
| 15.6 Camp, Office, and Chinchillas Infrastructure |
15-4 |
| 15.7 Mine Short-Term/Long-Term Ore Stockpiles |
15-5 |
| 15.8 Rock Storage Facilities |
15-5 |
| 15.9 Other Pirquitas Infrastructure |
15-5 |
| 16.0 Market Studies |
16-1 |
| 16.1 Markets |
16-1 |
| 16.2 Contracts |
16-1 |
| 17.0 Environmental Studies, Permitting, and Plans, Negotiations, or Agreements with Local Individuals or Groups |
17-1 |
| 17.1 Environmental Studies |
17-1 |
| 17.2 Waste and Water Management |
17-3 |
| 17.3 Project Permitting |
17-5 |
| 17.4 Social or Community Requirements |
17-6 |
| | iii | |
| SSR Mining Inc. | Puna Operations S-K 1300 Report | February 12, 2024 SLR Project No.: 138.21581.00003 |
| 17.5 Mine Closure Requirements |
17-6 |
| 18.0 Capital and Operating Costs |
18-7 |
| 18.1 Capital Costs |
18-8 |
| 18.2 Operating Costs |
18-9 |
| 18.3 Personnel |
18-10 |
| 19.0 Economic Analysis |
19-1 |
| 19.1 Economic Assumptions |
19-1 |
| 19.2 Cash Flow Analysis |
19-2 |
| 19.3 Sensitivity Analysis |
19-3 |
| 20.0 Adjacent Properties |
20-1 |
| 21.0 Other Relevant Data and Information |
21-1 |
| 22.0 Interpretation and Conclusions |
22-1 |
| 22.1 Geology and Mineral Resources |
22-1 |
| 22.2 Mining and Mineral Reserves |
22-2 |
| 22.3 Mineral Processing |
22-3 |
| 22.4 Infrastructure |
22-3 |
| 22.5 Environmental and Social Aspects |
22-3 |
| 22.6 Capital and Operating Costs |
22-4 |
| 23.0 Recommendations |
23-1 |
| 23.1 Geology and Mineral Resources |
23-1 |
| 23.2 Mining and Mineral Reserves |
23-1 |
| 23.3 Mineral Processing |
23-1 |
| 23.4 Infrastructure |
23-1 |
| 23.5 Environmental and Social Aspects |
23-2 |
| 24.0 References |
24-1 |
| 25.0 Reliance on Information Provided by the Registrant |
25-1 |
| 26.0 Date and Signature Page |
26-1 |
| 27.0 Appendix 1 Cash Flow Summary |
27-1 |
Tables
| Table 1-1: After-Tax Cash Flow Summary |
1-8 |
| Table 1-2: After-Tax Sensitivity Analyses |
1-10 |
| Table 1-3: Summary of Puna Mineral Resource Estimates - December 31, 2023 |
1-15 |
| Table 1-4: Summary of Chinchillas Mineral Reserve Estimate as of December 31, 2023 |
1-16 |
| | iv | |
| SSR Mining Inc. | Puna Operations S-K 1300 Report | February 12, 2024 SLR Project No.: 138.21581.00003 |
| Table 1-5: Capital Cost Summary |
1-19 |
| Table 1-6: Average Operating Cost Unit Rates |
1-19 |
| Table 3-1: Chinchillas Exploitation Concessions |
3-3 |
| Table 3-2: Pirquitas Operation Surface Rights |
3-6 |
| Table 5-1: Chinchillas Production 2019 - 2023 |
5-2 |
| Table 5-2: Pirquitas Production – 2009 - 2018 |
5-3 |
| Table 7-1: Drill Programs Completed at the Chinchillas Property |
7-2 |
| Table 7-2: Drilling Programs Completed at the Pirquitas Property |
7-6 |
| Table 8-1: Certified Reference Material Used for the 2022 and 2023 SSR Drill Programs at Chinchillas |
8-8 |
| Table 8-2: CRM Parameters Used for Accuracy Monitoring for Cortaderas Drilling (2022-2023) |
8-21 |
| Table 10-1: Mill Production Summary 2018 to 2023 |
10-1 |
| Table 10-2: Lead Concentrate Regression Equations |
10-2 |
| Table 10-3: Zinc Concentrate Regression Equations |
10-2 |
| Table 10-4: Pirquitas Metallurgical Recovery Estimates |
10-6 |
| Table 10-5: Head Assays (2013 Met Testing) |
10-7 |
| Table 10-6: Rougher Flotation Recovery at 110 μm (2013 Met Testing) |
10-7 |
| Table 10-7: Cleaner Flotation Recovery at 110 μm (2013 Met Testing) |
10-7 |
| Table 10-8: Sequential Rougher Flotation Recovery (2014 Met Testing) |
10-7 |
| Table 10-9: Sequential Cleaner Flotation Recovery (2014 Met Testing) |
10-8 |
| Table 10-10: Head Assays (2014 Met Testing) |
10-8 |
| Table 10-11: Sequential Cleaner Flotation Recovery (2014 Met Testing – New Composites) |
10-8 |
| Table 10-12: Locked-Cycle Flotation Recovery (2014 Met Testing – New Composites) |
10-9 |
| Table 10-13: Head Assays (2015 Met Testing) |
10-10 |
| Table 10-14: Bond Ball Mill Work Index Results |
10-13 |
| Table 10-15: Sequential Rougher Flotation Recovery (2015 Met Testing – Master Composites) |
10-13 |
| Table 10-16: Sequential Cleaner Flotation Recovery (2015 Met Testing – Master Comps) |
10-14 |
| Table 10-17: Locked-Cycle Flotation Recovery (2015 Met Testing – Master Composites) |
10-15 |
| Table 10-18: Variability Cleaner Flotation Average Recovery (2015 Met Testing) |
10-15 |
| Table 10-19: Cleaner Flotation Recovery (2016 Met Testing) |
10-16 |
| Table 10-20: Head Assays (2018 Met Testing) |
10-17 |
| Table 10-21: Pb Concentrate for Composite "A" Blends |
10-18 |
| Table 10-22: Pb Concentrate for Composite "B" Blends |
10-18 |
| | v | |
| SSR Mining Inc. | Puna Operations S-K 1300 Report | February 12, 2024 SLR Project No.: 138.21581.00003 |
| Table 10-23: Head Assays (2023 Met Testing) |
10-18 |
| Table 10-24: Cleaner Flotation Test Matrix (2023 Met Testing) |
10-19 |
| Table 10-25: Locked-Cycle Flotation Recovery (2023 Met Testing) |
10-20 |
| Table 10-26: Mineralogy Analysis (2023 Met Testing) |
10-21 |
| Table 11-1: Summary of Puna Mineral Resource Estimates – December 31, 2023 |
11-2 |
| Table 11-2: Chinchillas Estimation Domain Statistics |
11-11 |
| Table 11-3: Chinchillas Capping Levels |
11-13 |
| Table 11-4: Chinchillas Back Transformed Variogram Models |
11-14 |
| Table 11-5: Chinchillas Block Model Extents and Dimensions |
11-15 |
| Table 11-6: Chinchillas OK Versus NN Grade Estimates |
11-18 |
| Table 11-7: Chinchillas Densities |
11-21 |
| Table 11-8: Chinchillas Classification Parameters |
11-23 |
| Table 11-9: 2023 Chinchillas Resource and Reserve Pit Input Parameters |
11-24 |
| Table 11-10: Summary of Chinchillas Mineral Resources Estimate – December 31, 2023 |
11-25 |
| Table 11-11: Statistical Summary of Raw Assay Data Used in Pirquitas 2023 Modeling |
11-32 |
| Table 11-12: Summary Statistics of Raw Assay Data Used in 2023 Modelling – Pirquitas |
11-33 |
| Table 11-13: Pirquitas Variogram Models |
11-35 |
| Table 11-14: Pirquitas Block Model Extents and Dimensions |
11-35 |
| Table 11-15: Pirquitas Classification Parameters |
11-40 |
| Table 11-16: Summary of Pirquitas Mineral Resource Estimate – December 31, 2023 |
11-41 |
| Table 11-17: 2021 and 2023 Mineral Resource Economic Parameters |
11-42 |
| Table 11-18: Pirquitas 2021 and 2023 Mineral Resource Comparison |
11-43 |
| Table 12-1: Summary of Chinchillas Mineral Reserves as of December 31, 2023 |
12-1 |
| Table 12-2: Stockpile Closing Balances –December 31, 2023 |
12-3 |
| Table 12-3: Net Smelter Return – 2023 Calculation |
12-3 |
| Table 13-1: Final Pit Design – Revised Slope Configurations |
13-4 |
| Table 13-2: Mining Phase Design Summary |
13-6 |
| Table 13-3: Annual Production Schedule Tonnes Mined |
13-8 |
| Table 13-4: Chinchillas Mining Fleet Equipment List |
13-9 |
| Table 13-5: Waste Material Classification |
13-10 |
| Table 13-6: LOM Average Maintenance KPI of the Chinchillas Primary Equipment Fleet |
13-12 |
| Table 16-1: Metal Price Assumptions |
16-1 |
| Table 18-1: Capital Cost Summary |
18-8 |
| Table 18-2: Sustaining Capital Summary |
18-8 |
| | vi | |
| SSR Mining Inc. | Puna Operations S-K 1300 Report | February 12, 2024 SLR Project No.: 138.21581.00003 |
| Table 18-3: Final Closure/Reclamation Cost Summary |
18-9 |
| Table 18-4: Average Operating Costs Unit Rates |
18-9 |
| Table 18-5: Current Workforce |
18-10 |
| Table 19-1: After-Tax Cash Flow Summary |
19-2 |
| Table 19-2: After-Tax Sensitivity Analyses |
19-4 |
Figures
| Figure 1-1: After-Tax Sensitivity Analysis |
1-11 |
| Figure 3-1: Puna Operation Location |
3-2 |
| Figure 3-2: Property Map Showing Chinchilla, Chinchilla I and Chinchilla II Concessions |
3-5 |
| Figure 3-3: Property Map Showing Pirquitas Mineral and Surface Rights |
3-7 |
| Figure 6-1: Regional Geologic Map |
6-2 |
| Figure 6-2: Stratigraphic Column |
6-5 |
| Figure 6-3: Chinchillas Local Geological Map |
6-8 |
| Figure 6-4: Silver Mantos and Basement Mantos Zones with Drill Hole Locations and Mineralized Zones |
6-9 |
| Figure 6-5: Pirquitas Geologic Map |
6-11 |
| Figure 6-6: Cortaderas and Hanging-wall Zones with Drill Hole Locations and Mineralized Zones |
6-14 |
| Figure 7-1: Location of Drill Hole Collars at the Chinchillas Deposit |
7-3 |
| Figure 7-2: Location of Drill Hole Collars at the San Miguel and Cortaderas Deposits |
7-7 |
| Figure 8-1: Ag, Pb, and Zn HARD Plots for Preparation Duplicates at Alex Stewart during Golden Arrow Drill Programs |
8-4 |
| Figure 8-2: Field Duplicate Precision Performance for Chinchillas 2022-2023 Drilling |
8-5 |
| Figure 8-5: Silver CRM Performance during the 2022 and 2023 SSR Drill Programs at Chinchillas |
8-9 |
| Figure 8-6: Lead CRM Performance during the 2022 and 2023 SSR Drill Programs at Chinchillas |
8-10 |
| Figure 8-7: Zinc CRM Performance during the 2022 and 2023 SSR Drill Programs at Chinchillas |
8-11 |
| Figure 8-8: Umpire Pulp Duplicates from Golden Arrow Phase V Drill Program |
8-12 |
| Figure 8-9: 2005-2008 Field Duplicate Precision Performance for Ag, Pb, and Zn during the Drill-off at Pirquitas |
8-17 |
| Figure 8-10: SSR 2012 Silver CRM Performance for Cortaderas Drilling |
8-18 |
| Figure 8-11: SSR 2012 Zinc CRM Performance for Cortaderas Drilling |
8-19 |
| | vii | |
| SSR Mining Inc. | Puna Operations S-K 1300 Report | February 12, 2024 SLR Project No.: 138.21581.00003 |
| Figure 8-12: 2010-2013 Field Duplicate Precision Performance for Ag and Zn during Cortaderas Exploration Programs |
8-20 |
| Figure 8-13: Silver CRM Performance for Cortaderas Drilling 2022-2023 |
8-22 |
| Figure 8-14: Zinc CRM Performance for Cortaderas 2022-2023 Drilling |
8-23 |
| Figure 8-15: Field Duplicate Precision Performance for the 2022-2023 Cortaderas Drilling |
8-24 |
| Figure 8-16: Silver Blank Performance for 2022-2023 Cortaderas Drilling |
8-25 |
| Figure 8-17: Zinc Blank Performance for 2022-2023 Cortaderas Drilling |
8-26 |
| Figure 10-1: Pb Con Mass Pull – Function of Mill Feed Grade Pb (%) |
10-3 |
| Figure 10-2: Pb Con Lead Recovery – Function of Mill Feed Grade Pb (%) |
10-3 |
| Figure 10-3: Pb Con Silver Recovery – Function of Mill Feed Grade Pb & Zn + Mass Pull |
10-4 |
| Figure 10-4: Zn Con Mass Pull – Function of Mill Feed Grade Zn (%) + Pb Con Mass Pull |
10-4 |
| Figure 10-5: Regression Equation NSR Calculation vs. Actual Ore Value |
10-5 |
| Figure 10-6: Inspectorate Locked-Cycle Test Flowsheet |
10-9 |
| Figure 10-7: Metallurgical Sample Locations (2015 Met Testing) |
10-12 |
| Figure 10-8: ALS Locked-Cycle Test Flowsheet |
10-14 |
| Figure 10-9: Cleaner Flotation Flowsheet (2016 Met Testing) |
10-16 |
| Figure 10-10: Mineral Liberation (2023 Met Testing) |
10-22 |
| Figure 11-1: Isometric View Showing the Chinchillas Drill Hole Database (collar = black, traces = blue) Used in
Mineral Resource Modeling |
11-4 |
| Figure 11-2: North-South Cross Section Showing Chinchillas Drilling, Rock Types, and Silver Grades |
11-6 |
| Figure 11-3: Isometric View of Chinchillas Simplified Lithology Model |
11-7 |
| Figure 11-4: Chinchillas Estimation Domains Based on K Means Clusters of Multi-Element Geochemistry |
11-8 |
| Figure 11-5: Raw Ag Box Plot Final Groups (Eight Cases) |
11-9 |
| Figure 11-6: Raw Pb Box Plot Final Groups (Eight Cases) |
11-10 |
| Figure 11-7: Raw Zn Box Plot Final Groups (Eight Cases) |
11-11 |
| Figure 11-8: Normal Score Ag Variogram of Breccia-Tuffs (Cluster 4) |
11-14 |
| Figure
11-9: Cross-Section Looking North-Northeast (Az. 106°) Showing Ag Block Grade Estimates |
11-17 |
| Figure
11-10: Cross-Section Looking North-Northeast (Az. 106°) Showing Zn Block Grade Estimates |
11-17 |
| Figure 11-11: Ag Swath Plots – All Domains |
11-18 |
| Figure 11-12: Pb Swath Plots – All Domains |
11-19 |
| Figure 11-13: Zn Swath Plots – All Domains |
11-20 |
| Figure 11-14: QQ Plot of Ag Resource Model Versus Ag Blasthole Model |
11-21 |
| | viii | |
| SSR Mining Inc. | Puna Operations S-K 1300 Report | February 12, 2024 SLR Project No.: 138.21581.00003 |
| Figure 11-15: Chinchillas Mineral Resource Classification |
11-23 |
| Figure 11-16 : Resource Model vs. Production Reconciliation |
11-26 |
| Figure 11-17: Isometric View Showing the Pirquitas Drill Hole Database Used in Mineral Resource Modeling |
11-28 |
| Figure 11-18: Isometric View of Cortaderas Zone Wireframe Vein Models |
11-29 |
| Figure 11-19: Pirquitas Zn Log Probability Distributions |
11-30 |
| Figure 11-20: Pirquitas Ag Log Probability Distributions |
11-31 |
| Figure 11-21: Cortaderas Ag Domain Vein Models – Cross Sections Looking Southwest-Northeast |
11-32 |
| Figure 11-22: Ag, Pb, and Zn Box Plot |
11-33 |
| Figure 11-23: Medium Grade Ag Variogram |
11-34 |
| Figure
11-24: Cross-Section Looking North-Northwest (Az. 220°) Showing Ag Block Grade Estimates |
11-37 |
| Figure
11-25: Cross-Section Looking North-Northwest (Az. 220°) Showing Zn Block Grade Estimates |
11-38 |
| Figure 11-26: Pirquitas Medium and High Grade Ag Swath Plot |
11-39 |
| Figure 13-1: Proposed Final Pit Design – Prospective View Looking West |
13-3 |
| Figure 13-2: Chinchillas Mine – Location of Topographic Prisms for Monitoring |
13-5 |
| Figure 13-3: End of Mine Life Reserve Pits |
13-7 |
| Figure 13-4: Mine Annual Production Schedule |
13-8 |
| Figure 14-1: Chinchillas Processing Flowsheet Overview |
14-1 |
| Figure 15-1: Access Road for the Project and Proposed Modifications |
15-1 |
| Figure 15-2: Alignment and Gradient of the Tailings Line for In-pit Disposal |
15-3 |
| Figure 19-1: After-Tax Sensitivity Analysis |
19-5 |
| | ix | |
| SSR Mining Inc. | Puna Operations S-K 1300 Report | February 12, 2024 SLR Project No.: 138.21581.00003 |
SLR International Corporation (SLR) was retained by SSR Mining
Inc. (SSR) to prepare an independent Technical Report Summary (TRS) on the Puna Operations (Puna or the Project), located in the
Puna region of northwestern Argentina, in the Province of Jujuy, Department of Rinconada. Puna includes three
contiguous exploitation concessions covering the Mineral Resources and Mineral Reserves on the Chinchillas property (including the
Chinchillas deposit) and several exploitation concessions covering the Pirquitas property (including the San Miguel and Cortaderas
deposits).
The purpose of this TRS is to support the disclosure of updated Mineral
Resource and Mineral Reserve estimates for the Project with an effective date of December 31, 2023. This TRS conforms to United States
Securities and Exchange Commission’s (SEC) Modernized Property Disclosure Requirements for Mining Registrants as described in Subpart
229.1300 of Regulation S-K, Disclosure by Registrants Engaged in Mining Operations (S-K 1300) and Item 601 (b)(96) Technical Report Summary.
The SLR Qualified Persons (QP) make the following conclusions by area.
| 1.1.1.1 | Geology and Mineral Resources |
| · | The SLR QP has reviewed data collection, sampling, sampling preparation, quality assurance/quality control (QA/QC), data verification,
modeling, grade estimation methods, and classification definitions for both Chinchillas and Pirquitas and has found no material issues. |
| · | SSR updated the Mineral Resource estimate for both Chinchillas and Pirquitas following standard industry practices. The updated estimate
includes new 2022-2023 drilling. Chinchillas database includes 425 holes with 53,827 assayed samples and Pirquitas database included 919
holes with 141,009 assayed samples. |
| · | The geological models and silver, lead, and zinc resource estimations of both deposits were completed using Leapfrog Edge. |
| · | Chinchillas resource estimation was developed in eight cluster domains using ordinary kriging (OK). The SLR QP validated the block
grade estimates with visual inspection of cross sections and plan views, general statistics, and swath plots to verify that the estimation
results are unbiased and found no material issues. |
| · | Pirquitas silver resource estimation was executed in three domains at cut-off grades of 25 g/t Ag and 50 g/t Ag using OK in a 2.5
m x 2.5 m x 2.5 to 5 m x 5 m x 5 m cells. SLR validated the block grade estimates with visual inspection
of cross sections and plan views, general statistics, and swath plots to verify that the estimation results are unbiased and found no
material issues. |
| · | Resource classification of Chinchillas and Pirquitas was defined based on average distances to the closest three drill holes. |
| | 1-1 | |
| SSR Mining Inc. | Puna Operations S-K 1300 Report | February 12, 2024 SLR Project No.: 138.21581.00003 |
| o | For Chinchillas, the average distances are 25 m for Measured and 50 m for Indicated. The largest estimation domain variogram ranges
at 80% of the sill vary from 60 m to 75 m. |
| o | For Pirquitas, the average distances are 18 m for Measured and 50 m for Indicated. The largest estimation domain variogram ranges
vary from 40 m to 52 m. SLR observed that the average distance of the Indicated blocks within the resource stopes is 40.8 m. |
| · | The Chinchillas Mineral Resource estimate is constrained within a pit shell generated using an NSR cut-off value of $37.91/t that
is based on metal prices of $22.00/oz for silver, $0.95/lb lead, and $1.15/lb for zinc. This cut-off calculation also considers metallurgical
recoveries and additional operating costs, estimated at $12/t, related to the handling and transportation of ore from the Chinchillas
property to the Pirquitas plant. The SLR QP has identified two technical and/or economic factors that require resolution with regard to
the Mineral Resource estimate. |
| o | An archeological site located within the area of the deposit was used to limit the reserve pit shell, but not taken into account
in generating the resource pit shell as according to SSR, there is a reasonable expectation for issuance of the permit to mine
the archeological site. |
| o | The waste dump partially covers the resource pit shell in the Melina area. Mineral Resources were stated considering the current material
in this dump. As the waste dump material is still being deposited, there may be a minor portion of the Mineral Resource which will not
meet the reasonable prospects for economic extraction (RPEE) requirement in the future due to the additional stripping that will be required.
In SLR’s opinion, this issue will not materially affect the total Mineral Resource estimate for Chinchillas. |
| · | The Pirquitas Mineral Resource estimate is contained within underground mining shapes using an NSR cut-off
value of $110/t based on metal price assumptions of $22.00/oz silver, $0.95/lb lead, and $1.15/lb zinc. Metallurgical recoveries vary
with grade and on average are: 82.7% for silver and 53.7% for zinc. |
| · | The Mineral Resource estimates exclusive of Mineral Reserves at the Project are as follows: |
| · | Total Measured and Indicated Mineral Resources of 8.83 million tonnes (Mt) at average grades of 112.1 g/t Ag, 1.01% Pb, and 0.43%
Zn containing 31.82 million ounces (Moz) of silver, 196.2 Mlb of lead, and 83.8 Mlb of zinc. This includes: |
| o | 8.47 Mt of in situ Measured and Indicated Mineral Resources at average grades of 113.8 g/t Ag, 1.03% Pb, and 0.42% Zn containing 31.0
Moz of silver, 192.1 Mlb of lead, and 79.2 Mlb of zinc. |
| o | 0.36 Mt at average grades of 70.0 g/t Ag (0.8 Moz), 0.51% Pb (4.0 Mlb), and 0.58% Zn (4.6 Mlb) in low grade stockpile. |
| · | Inferred Mineral Resources are estimated to be 1.51 Mt at average grades of 93.5 g/t Ag, 0.72% Pb, and 0.45% Zn containing 4.54 Moz
of silver, 24.0 Mlb of lead, and 15.0 Mlb of zinc. |
| | 1-2 | |
| SSR Mining Inc. | Puna Operations S-K 1300 Report | February 12, 2024 SLR Project No.: 138.21581.00003 |
| · | Total Measured and Indicated Mineral Resources of 2.48 Mt at average grades of 300.9 g/t Ag and 5.85% Zn containing 23.99 Moz of silver
and 319 Mlb of zinc. |
| · | Inferred Mineral Resources are estimated to be 1.32 Mt at an average grade of 194.9 g/t Ag and 7.28% Zn containing 8.3 Moz of silver
and 212 Mlb of zinc. |
| 1.1.1.2 | Mining and Mineral Reserves |
| · | SSR has extensive experience with open pit mining at Chinchillas and a strong understanding of the work requirements and costs based
on its current operations. |
| · | Open pit operations at Chinchillas are carried out using standard open pit mining methods including drilling, blasting, loading, hauling,
and dumping to the designated stockpiles or waste rock storage areas (WRSA) at the mine. |
| · | Mineral Reserves estimation practices follow industry standards. |
| · | Mineral Reserves are estimated for Chinchillas only. Total Proven and Probable Mineral Reserves at Chinchillas are estimated to be
4.2 Mt grading 154.4 g/t Ag, 1.23% Pb, and 0.22% Zn containing 20.7 Moz of silver, 112.8 Mlb of lead, and 20.5 Mlb of zinc. |
| · | The Chinchillas mine supports a life of mine (LOM) of 2.5 years, including one and half years of active mining followed by one year
of processing the medium grade stockpiles. |
| · | The LOM production schedule is reasonable and requires proper focus on pit wall stability and groundwater management. |
| · | The geotechnical parameters used for pit designs are reasonable and proactive action steps like installation of ground-based radar,
drilling of pumping wells, and implementation of a proper mine drainage system are required for success of the mine operations. |
| · | An appropriate mining equipment fleet, maintenance facilities, and workforce are in place, to meet the LOM production schedule requirements. |
| · | Sufficient storage capacity for waste rock and stockpiles have been identified to support the production of the Mineral Reserve. |
| 1.1.1.3 | Mineral Processing |
| · | Puna operates a conventional crush, grind, and flotation process producing lead and zinc concentrates containing high levels of
silver. The concentrates currently being produced from Chinchillas ore, which are sold on the open market, are generally clean and free
of deleterious elements, and are not subject to penalty charges. |
| · | The processing plant first started operation in 2009 processing ore from the Pirquitas pit, however, it has been processing ore
exclusively from the Chinchillas mine since 2018 after the Pirquitas pit was mined out. The plant is modern, incorporating modern
instrumentation and control systems, and has averaged between 95% and 96% utilization for the past three years. |
| · | The operation is well established and has been processing Chinchillas ore continuously for several years, therefore recovery and concentrate
grade forecasts are based on historical process performance. |
| | 1-3 | |
| SSR Mining Inc. | Puna Operations S-K 1300 Report | February 12, 2024 SLR Project No.: 138.21581.00003 |
| · | The Project includes significant infrastructure used to sustain mining and processing operations over the last 14 years, much of which
remains suitable for continued operation. These facilities include roads, a gas pipeline, power generation facilities, water diversion
systems, tailings dams, mine waste stockpiles, camp facilities, office buildings, maintenance shops, and communications systems. |
| 1.1.1.5 | Environmental and Social Aspects |
| · | The Pirquitas and Chinchillas sites operate under the authority of environmental approvals and permits granted by the Province of
Jujuy, and SSR’s corporate policies including an Environmental and Social Policy (2020), Human Rights Policy (2020), and Land Access
and Resettlement Policy (2020). SSR reports annually on its sustainability performance. The most recent (2022) ESG & Sustainability
Report is available on the company’s corporate website. |
| · | MPSA has carried out and received approval for Environmental Impact Studies (Estudios de Impacto Ambiental, EIA) at Pirquitas and
Chinchillas. The EIAs are updated every two years. Most recently, in October 2023, MPSA submitted an integrated EIA for both sites, which
is currently under review by authorities. |
| · | MPSA carries out environmental monitoring according to its environmental approvals, and reports on compliance with the conditions
of its environmental approvals in the bi-annual EIA updates. |
| · | There are 15 protected areas in the Province of Jujuy, one of which, the Laguna de Pozuelos National Natural Monument, is approximately
25 km northeast of the Chinchillas site. |
| · | Key environmental aspects at both sites include fugitive dust control and water quality. At Pirquitas, legacy issues arising from
tailings management practices between the 1930s and the 1980s result today in episodic impacts to water quality in the Rio Pircas, usually
during the months of December to March, which is the rainy season. These legacy issues will be addressed in the context of mine closure
planning. |
| · | Flotation tailings from the Pirquitas process plant are disposed of in the mined-out San Miguel pit, 7 km from the plant. MPSA is
implementing measures to manage the inventory of free water in the pit, which is permit limited. |
| · | SSR has in place an Independent Tailings Review Board (ITRB) for all of its operating mines, including Puna. The inactive Pirquitas
tailings facility, which operated from 2009 to 2019, last underwent an external expert review in September 2018. |
| · | MPSA has identified 14 communities in the Project’s area of influence (AOI), seven in the direct AOI and seven in the indirect
AOI. The closest community to Chinchillas is the village of Santo Domingo (approximately 6 km away), while the village of Nuevo Pirquitas
is nearest to Pirquitas (approximately 4.5 km away). These communities, as well as others further afield, are Indigenous communities,
with predominant Colla ethnicity. |
| · | The most recent cost estimate for closure of both sites is approximately US$66 million. SSR is currently updating its conceptual closure
plan and closure costs estimate for Puna which should cover both the current and legacy Pirquitas and Chinchillas sites. |
| | 1-4 | |
| SSR Mining Inc. | Puna Operations S-K 1300 Report | February 12, 2024 SLR Project No.: 138.21581.00003 |
| · | The SLR QP is of the opinion that it is reasonable to rely on the information provided by SSR as outlined above for use in the TRS
because significant environmental and social analysis has been conducted for the Projects over an extended period, the Projects have been
in operation for a number of years, and SSR employs professionals and other personnel with responsibility in these areas that have a good
understanding of the permitting, regulatory, and environmental requirements for the Property. |
| 1.1.1.6 | Capital and Operating Costs |
| · | SSR’s forecasted capital and operating cost estimates related to the development of Mineral Reserves are derived from annual
budgets and historical actuals over the long life of the current operation. According to the American Association of Cost Engineers (AACE)
classifications, these estimates would mainly be Class 1 with an accuracy range of -10% to -30% to +10% to +30%. |
The SLR QPs offer the following recommendations regarding advancement
of the Project.
| 1.1.2.1 | Geology and Mineral Resources |
| 1 | Continue the drilling of Pirquitas to delimit the lateral and vertical extension of the veins in Cortaderas vein. This work should
include a focus on high-grade and under drilled areas within the deposit. |
| 2 | Better define the Hanging-wall Zone resource along trend to the northwest and southeast and obtain a better understanding of the
geometry of the controlling structures. |
| 3 | Continue to upgrade the resource in the Melina area at Chinchillas. Update the Mineral Resources considering the final design of the
dump waste, which partially covers the resource pit shell. |
| 4 | Update the Chinchillas Mineral Resources resolving the overturned dynamic anisotropy angles and changing the maximum number of samples
per hole to a value that is more representative of the block height. |
| 5 | Investigate the differences in the resource model and grade control model for Chinchillas. |
| 6 | Improve core and reject sample storage. |
| 1.1.2.2 | Mining and Mineral Reserves |
| 1 | Continue with proper pre-splitting of the final walls and blasting practices, and take precautions to achieve the desired pit limits,
ensuring the LOM plan is achieved. |
| 2 | Follow the current strategy of stockpiling high grade and medium grade ore separately, prioritizing feed of high grade ore to the
plant. |
| 3 | Focus on equipment maintenance and reliability given the age of existing assets to achieve planned utilization. |
| 4 | Ensure the current dewatering strategy followed will keep the lower benches at the pit bottom dry and available for operations as
planned. Recognize the fact that drilling pumping wells and implementing a proper mine drainage system is an alternative. |
| | 1-5 | |
| SSR Mining Inc. | Puna Operations S-K 1300 Report | February 12, 2024 SLR Project No.: 138.21581.00003 |
| 5 | Combined with the dewatering system and inputs from the recently installed Slope Monitoring System, ensure the pit walls are not saturated
and the final designed pit limits are achieved. |
| 1.1.2.3 | Mineral Processing |
There are no recommendations related to processing activities.
There are no recommendations related to infrastructure.
| 1.1.2.5 | Environmental and Social Aspects |
| 1 | Assess hydrogeological modeling efforts to date at Pirquitas and, as appropriate, update the modeling in support of site water balance
development and water quality assessment for the remainder of mine operation and mine closure. |
| 2 | Continue with efforts to control the volume of free water in storage in the San Miguel pit, to ensure compliance with applicable legal
requirements. |
| 3 | Incorporate a plan to address site environmental legacy issues at Pirquitas in the updated closure plan and cost estimate. |
| 4 | Identify opportunities to implement progressive closure, especially at Pirquitas where it may be possible to address some of the legacy
site issues prior to the cessation of operations. |
| 5 | Continue to engage with local communities with a focus on planned mine closure. Ensure that the updated closure plan considers the
social aspects of closure. |
| 1.1.2.6 | Capital and Operating Costs |
There are no recommendations related to capital and operating costs.
An after-tax Cash Flow Projection has been generated from the LOM production
schedule and capital and operating cost estimates and is summarized in Table 1-1. A summary of the key criteria is provided below.
The complete cash flow is presented in Section 27.0 Appendix 1. The analysis is based on Q4 2023 real U.S. dollar basis with no escalation.
| 1.2.1 | Economic Assumptions |
| · | 5,000 tpd processing capacity |
| · | LOM head grade: 154 g/t silver, 1.23% lead, and 0.22% zinc |
| · | Mill recovery averaging: 96.5% silver, 94.4% lead, and 42.3% zinc |
| · | Realized metal price over period 2024-2026: $23.95 per ounce silver, $0.93 per pound lead, and $1.20 per pound zinc |
| · | Long term realization costs: |
| | 1-6 | |
| SSR Mining Inc. | Puna Operations S-K 1300 Report | February 12, 2024 SLR Project No.: 138.21581.00003 |
| · | Percent payable: 95% silver, 95% lead |
| · | Treatment charge: $40.39 per dry metric ton (dmt) |
| · | Refining charge: $0.34 per ounce silver |
| · | Penalties: antimony - $1.26 per dmt, silica - $0.63 per dmt |
| · | Percent payable: 75% zinc, 82% silver |
| · | Treatment charge: $234 per dmt |
| · | Penalties: silica - $3.00 per dmt |
| · | Concentrate freight charges: |
| o | Trucking: $232 per dmt (100% to Buenos Aires port) |
| o | Ocean freight: $120 per dmt (50% exported to Chinese customers with remaining exports to Latin American, European and East Asian customers) |
| · | NSR: $123 per tonne processed |
| · | LOM production plan as summarized in Table 13-3. |
| · | Sustaining capital: $19.3 million |
| · | Closure costs: $65.9 million |
| · | Average operating cost over the mine life: $60.39 per tonne ore processed |
| 1.2.1.3 | Taxation and Royalties |
Corporate Income Taxes
The Project is expected to generate $19.1 million in income tax payable
in 2024 and 2025 at a tax rate of 25% on taxable income. The depreciation methodology for property, plant, and equipment (PP&E) is
60% in the first year, with remaining 40% in equal portions in the two subsequent years. Intangible assets are depreciated on units of
production throughout the LOM. Total depreciation allowance utilized in the analysis equals $19.1 million and total income taxes payable
amount to $19.6 million.
Royalties and Export Duties
| · | Royalties: 3% Net Profit |
Considering the Puna Operation on a stand-alone basis, the undiscounted
pre-tax cash flow totals $152 million over the mine life and the after-tax Net Present Value (NPV) at an 8% discount rate (midpoint with
January 1, 2024 as time zero) is $136 million, as shown in Table 1-1. Note that due to the short mine life of the Project, the respective
NPV results are slightly higher than the undiscounted free cash flow.
| | 1-7 | |
| SSR Mining Inc. | Puna Operations S-K 1300 Report | February 12, 2024 SLR Project No.: 138.21581.00003 |
Table 1-1: After-Tax Cash Flow
Summary
| Description |
US$ million |
|
| Realized Market Prices |
|
|
| Ag ($/oz) |
23.95 |
|
| Pb ($/lb) |
0.93 |
|
| Zn ($/lb) |
1.20 |
|
| Payable Metal |
|
|
| Ag (Moz) |
18.8 |
|
| Pb (Mlb) |
100.1 |
|
| Zn (Mlb) |
6.5 |
|
| Total Gross Revenue |
554 |
|
| Mining Cost |
(52) |
|
| Ore Transportation Cost |
(47) |
|
| Rehandling Cost |
(12) |
|
| Process Cost |
(81) |
|
| G & A Cost |
(59) |
|
| Concentrate Freight Cost |
(30) |
|
| TC/RC Costs |
(12) |
|
| Mining Royalties/Export Duties |
(24) |
|
| Total Operating Costs |
(318) |
|
| Operating Margin (EBITDA) |
237 |
|
| Cash Taxes Payable |
(20) |
|
| Working Capital1 |
0 |
|
| Operating Cash Flow |
217 |
|
| Sustaining Capital |
(19) |
|
| Total Closure/Reclamation Capital |
(66) |
|
| Total Capital |
(85) |
|
| |
|
|
| Pre-tax Free Cash Flow |
152 |
|
| Pre-tax NPV @ 8% |
154 |
|
| |
|
|
| After-tax Free Cash Flow |
132 |
|
| After-tax NPV @ 8% |
136 |
|
Notes:
| 1. | All working capital adjustments net to zero at end of mine life |
| | 1-8 | |
| SSR Mining Inc. | Puna Operations S-K 1300 Report | February 12, 2024 SLR Project No.: 138.21581.00003 |
The World Gold Council Adjusted Operating Cost (AOC) is $11.43/oz Ag
net of a $5.34/oz by-product credit. The mine life capital unit cost, including sustaining and closure/reclamation, is $4.50/oz, for an
All in Sustaining Cost (AISC) of $15.93/oz Ag. The average annual silver production during operation is 6.3 Moz per year over the remaining
2.5 year operation.
| 1.2.3 | Sensitivity Analysis |
Project risks can be identified in both economic and non-economic terms.
Key economic risks were examined by running cash flow sensitivities:
After-tax NPV sensitivity over the base case has been calculated for
-20% to +20% variations for head grade, recovery, and metal price and -15% to +15% for variations for operating and capital costs. The
sensitivities are shown in Table 1-2 and Figure 1-1. The Project is most sensitive to changes in head grade, metallurgical recovery,
and metal price (usually with same magnitude of impact) followed by operating costs and finally capital costs.
| | 1-9 | |
| SSR Mining Inc. | Puna Operations S-K 1300 Report | February 12, 2024 SLR Project No.: 138.21581.00003 |
Table 1-2: After-Tax Sensitivity
Analyses
| Variance |
Head Grade
(g/t Ag) |
NPV at 8%
(US$ millions) |
| 80% |
123 |
67 |
| 90% |
139 |
102 |
| 100% |
154 |
136 |
| 110% |
170 |
170 |
| 120% |
185 |
205 |
| Variance |
Recovery
(% Ag) |
NPV at 8%
(US$ millions) |
| 80% |
77.4 |
68 |
| 90% |
86.9 |
102 |
| 100% |
96.5 |
136 |
| 103% |
98.7 |
144 |
| 104% |
99.9 |
149 |
| Variance |
Metal Prices
(US$/oz Ag) |
NPV at 8%
(US$ millions) |
| 80% |
19.14 |
62 |
| 90% |
21.54 |
99 |
| 100% |
23.93 |
136 |
| 110% |
26.32 |
173 |
| 120% |
28.72 |
210 |
| Variance |
Operating Costs
(US$/t) |
NPV at 8%
(US$ millions) |
| 90% |
54.35 |
154 |
| 95% |
57.37 |
145 |
| 100% |
60.39 |
136 |
| 108% |
64.92 |
122 |
| 115% |
69.45 |
109 |
| Variance |
Capital Costs
(US$ millions) |
NPV at 8%
(US$ millions) |
| 90% |
77 |
142 |
| 95% |
81 |
139 |
| 100% |
85 |
136 |
| 108% |
92 |
131 |
| 115% |
98 |
127 |
| | 1-10 | |
| SSR Mining Inc. | Puna Operations S-K 1300 Report | February 12, 2024 SLR Project No.: 138.21581.00003 |
Figure 1-1: After-Tax Sensitivity
Analysis
| 1.3.1 | Property Description |
The Puna comprises the Chinchillas and
Pirquitas properties, located in the Puna region of northwestern Argentina, in the Province of Jujuy, Department of Rinconada.
The Chinchillas property is approximately 290 km
(driving distance) from the provincial capital of San Salvador de Jujuy and is centered at approximately at 781,375 mE and 7,508,900 mN
(Gauss Kruger, Argentina, Posgar Zone 3; 22°30′13″ S, 66°15′39″ W) at elevations ranging from 4,000 meters
above sea level (MASL) to 4,200 MASL.
The Pirquitas property is centered at 752,620 mE
and 7,489,100 mN (latitude 22°42′ S and longitude 66°30′ W). The city of San Salvador de Jujuy is located approximately
335 km (driving distance) southeast of the property. The property is characterized by sparsely vegetated, mountainous terrain at elevations
ranging between 4,000 MASL and 4,500 MASL.
Puna is directly owned (100%) by SSR through a subsidiary company Puna
Operations Inc. (POI) which through other 100% owned subsidiaries own Mina Pirquitas S.A. (MPSA). MPSA operates the Project.
The Chinchillas property encompasses three contiguous exploitation concessions,
collectively covering an area of approximately 2,042.56 ha. The Pirquitas property comprises 54 exploitation concessions that cover an
area of approximately 9,742 ha. All the exploitation concessions are valid and in good standing.
| | 1-11 | |
| SSR Mining Inc. | Puna Operations S-K 1300 Report | February 12, 2024 SLR Project No.: 138.21581.00003 |
Concentrates produced at the Project are subject to a royalty not exceeding
3% of the “mined out” value, which is payable to the Province of Jujuy. This royalty payment is calculated based on
the net recoverable value of the metals contained in the concentrates with certain operating costs subtracted.
In the 1980s, the mine was acquired by Shell CAPSA S.A. (Shell), which
carried out exploration but dropped the property in 1989. In 1994, Aranlee Resources Ltd. (Aranlee Resources) carried out surface sampling
and reverse circulation (RC) drilling. In 2004, Silex Argentina S.A (Silex), a subsidiary of Apex Silver Mines Ltd., conducted preliminary
reconnaissance work including trenching, pitting, and surface sampling. In 2011, Golden Arrow Resources Corporation (Golden Arrow) acquired
the property, completed five phases of drilling over five years, and estimated mineral resources. In October 2015, Golden Arrow announced
that it had entered into an agreement with Silver Standard Resources Inc. (Silver Standard), a predecessor to SSR, to form a joint venture
comprising the Chinchillas property, the Pirquitas pit, and the Pirquitas Operation. The agreement included an 18-month pre-development
period to advance Chinchillas, including infill drilling, engineering, and environmental studies, and permitting. In 2017, Silver Standard
changed its name to SSR.
In 2018, the Chinchillas mine achieved commercial production.
On September 18, 2019, SSR completed the acquisition of the remaining
25% interest in Puna from Golden Arrow for a total aggregate consideration of approximately $32.4 million. The transaction allowed the
company to consolidate ownership in Puna and streamline its reporting.
Sunshine Argentina, Inc. (Sunshine Argentina),
the Argentine branch of Sunshine Mining and Refining Company, acquired the Pirquitas mining concessions in November 1995. In the years
following its acquisition of Pirquitas, Sunshine Argentina carried out comprehensive mineral exploration on the property, including underground
rock sampling and multiple programs of RC and diamond drilling. These culminated in a feasibility study in February 2000.
In May 2002, Silver Standard (now SSR) acquired
43.4% of Sunshine Argentina from Stonehill Capital Management of New York and in October 2004, Silver Standard acquired the remaining
56.6% of Sunshine Argentina from Elliott International L.P., the Liverpool Limited Partnership and Highwood Partners, L.P. Silver Standard
operated the Pirquitas mine property as Sunshine Argentina until it changed the company name to Mina Pirquitas, Inc. in May 2008 and eventually
to Mina Pirquitas S.A.(MPSA) in August 2018.
Silver Standard approved the start of the Pirquitas
mine in October 2006 and commenced construction in 2007. The Pirquitas processing plant has been in continuous operation since its start-up
date in 2009.
| | 1-12 | |
| SSR Mining Inc. | Puna Operations S-K 1300 Report | February 12, 2024 SLR Project No.: 138.21581.00003 |
| 1.3.4 | Geological Setting, Mineralization, and Deposit |
The Chinchillas and Pirquitas deposits occur within the Bolivian tin-silver-zinc
belt which occupies the back-arc portion of the central Andes and extends from southern Peru to northern Argentina.
Northwestern Argentina geology consists of three main geological belts,
or terranes, that together trend north-northeast: the Sub-Andean Range (Sierras Subandinas), the Eastern Cordillera (Cordillera Oriental),
and the Argentine Altiplano or Puna belt. The Pirquitas and Chinchillas deposits are located in the Puna belt and are hosted in the Ordovician
Acoite Formation. The Acoite Formation is an interbedded sandstone, siltstone, and mudstone turbidite sequence deposited in a back-arc
basin.
The Chinchillas deposit occurs within a 13±1 Ma dacitic volcanic
center and is the product of a phreatomagmatic diatreme. The deposit is controlled by an east-west trending regional scale fault where
dilatation accommodated magma to intrude through the Acoite Formation. Significant silver-lead-zinc mineralization occurs in four main
areas at Chinchillas: the Silver Mantos and Basement Mantos zones in the west part of the caldera and the Socavon del Diablo and Socavon
Basement/Melina zones in the east part. Mineralization is dominated by silver, with lesser amounts of lead and zinc. Mineralization occurs
as disseminated sulfides, matrix infilling within the volcanic tuffs, and as matrix and fracture filling in breccias within the metasedimentary
rocks.
The property
geology of the Pirquitas mine consists of exposures of the Acoite and Tiomayo formations. Folding plays an important role in vein formation
and geometry; at the San Miguel pit, veins are intimately related to the San Miguel anticline, occurring proximal to the fold apex and
most commonly striking perpendicular to the fold planes. West-northwest striking regional faults are also observed throughout the property.
This structural fabric is interpreted to control the geometry and location of the Cortaderas breccia body. There are two types
of mineralization at Pirquitas: (1) polymetallic veins with peripheral disseminated mineralization; and (2) mineralized hydrothermal breccia.
Vein type is the dominant mineralization style and has been the main source of extracted ore.
As of the effective date of this TRS, SSR and its predecessor companies
have completed approximately 74,000 m of drilling in 446 drill holes at Chinchillas and approximately 228,500 m of drilling in 925 drill
holes at Pirquitas.
Since acquiring the remaining 25% Chinchillas mine in 2019, SSR has
carried out two drilling campaigns, in 2022 and 2023. Drilling included both reverse circulation (RC) and diamond drilling (DD) and its
main objective was to expand the known mineralization within the Chinchillas volcanic complex.
Since acquiring the Pirquitas Operation in 2005, SSR has carried out
numerous drilling campaigns, with the most recent focusing on the Cortaderas breccia. The main objective of the drilling in 2022-2023
was to expand the known mineralization at Cortaderas. The drilling in 2022 intersected a new zone approximately 150 m south of the Cortaderas
breccia, the Hanging-wall zone. In 2023, further drilling was carried out in the Cortaderas area resulting in the updated Mineral Resource
estimate for Pirquitas.
| | 1-13 | |
| SSR Mining Inc. | Puna Operations S-K 1300 Report | February 12, 2024 SLR Project No.: 138.21581.00003 |
| 1.3.6 | Mineral Resource Estimates |
The Mineral Resource estimate was prepared by SSR’s consultant
Red Pennant Geoscience Consulting (Red Pennant) of British Columbia, Canada and audited and accepted by SLR for this TRS. The Mineral
Resources have been estimated in accordance with generally accepted industry guidelines and are reported in accordance with S-K 1300.
Mineral Resources are reported exclusive of Mineral Reserves. Mineral Resources that are not Mineral Reserves do not have demonstrated
economic viability.
The database and block models were supplied to SLR by SSR and included
geological and block models as a Leapfrog project, PowerPoint presentations summarizing the main parameters and assumptions used to estimate
Mineral Resources, previous Mineral Resource estimates, and Microsoft (MS) Excel spreadsheets with NSR parameters and resource tables.
The Chinchillas Mineral Resource estimate is contained within a pit
shell generated using an NSR cut-off value of $37.91/t. The Pirquitas Mineral Resources estimate is contained within underground mining
shapes using an NSR cut-off value of $110/t. The cut-off values are based on metal prices of $22.00/oz for silver, $0.95/lb for lead and
$1.15/lb for zinc. Because Pirquitas’ ore Pb content is low, it is not included in the NSR calculation. Table 1-3 summarize the
Chinchillas and Pirquitas exclusive MRE at effective date of December 31, 2023.
At an effective date of December 31, 2023, Chinchillas total Measured
and Indicated Mineral Resources, exclusive of Mineral Reserves, are estimated to be 8.83 Mt at average grades of 112.1 g/t Ag, 1.01% Pb,
and 0.43% Zn containing 31.82 Moz of silver, 196.2 Mlb of lead, and 83.8 Mlb of zinc, including:
| · | 8.47 Mt of in situ Measured and Indicated Mineral Resources grading 113.8 g/t Ag, 1.03% Pb, and 0.42% Zn. |
| · | 0.36 Mt at average grades of 70.0 g/t Ag (0.8 Moz), 0.51% Pb (4.0 Mlb), and 0.58% Zn (4.6 Mlb) in low grade stockpile. |
The Inferred Mineral Resources are estimated to be 1.51 Mt at average
grades of 93.5 g/t Ag, 0.72% Pb, and 0.45% Zn containing 4.54 Moz of silver, 24.0 Mlb of lead, and 15.0 Mlb of zinc.
Mineral Resources exclusive of Mineral Reserves for the Pirquitas project
have an effective date of December 31, 2023 and are estimated to total 2.48 Mt of Measured and Indicated Mineral Resources at average
grades of 300.9 g/t Ag and 5.85% Zn containing 23.99 million ounces (Moz) of silver and 320 Mlb of zinc. Additionally, Inferred Mineral
Resources are estimated to be 1.32 Mt at an average grade of 194.9 g/t Ag and 7.28% Zn containing 8.3 Moz of silver and 212 Mlb of zinc.
Table 1-2 summarizes the Pirquitas MRE.
The SLR QP is of the opinion that with consideration of the recommendations
summarized in Sections 1 and 23 of this TRS, any issues relating to all relevant technical and economic factors likely to influence the
prospect of economic extraction can be resolved with further work.
| | 1-14 | |
| SSR Mining Inc. | Puna Operations S-K 1300 Report | February 12, 2024 SLR Project No.: 138.21581.00003 |
Table 1-3: Summary of Puna Mineral
Resource Estimates - December 31, 2023
| Deposit |
Measured Mineral Resources |
Indicated Mineral Resources |
Measured + Indicated Mineral Resources |
Inferred Mineral Resources |
Rec |
NSR Cut-off Values |
| Amount |
Grade |
Amount |
Grade |
Amount |
Grade |
Amount |
Grade |
| Ag |
(kt) |
(g/t Ag) |
(kt) |
(g/t Ag) |
(kt) |
(g/t Ag) |
(kt) |
(g/t Ag) |
(%) |
($/t) |
| Chinchillas |
1,856 |
116.4 |
6,974 |
110.9 |
8,830 |
112.1 |
1,509 |
93.5 |
95.5 |
37.91 |
| Pirquitas |
1,259 |
349.9 |
1,221 |
250.4 |
2,480 |
300.9 |
1,320 |
194.9 |
82.7 |
110 |
| Total |
3,115 |
210.8 |
8,196 |
131.7 |
11,310 |
153.5 |
2,830 |
140.8 |
82.7 - 95.5 |
37.91 - 110 |
| Pb |
(kt) |
(% Pb) |
(kt) |
(% Pb) |
(kt) |
(% Pb) |
(kt) |
(% Pb) |
(%) |
($/t) |
| Chinchillas |
1,856 |
1.06 |
6,974 |
0.99 |
8,830 |
1.01 |
1,509 |
0.72 |
92.1 |
37.91 |
| Total |
1,856 |
1.06 |
6,974 |
0.99 |
8,830 |
1.01 |
1,509 |
0.72 |
92.1 |
37.91 |
| Zn |
(kt) |
(% Zn) |
(kt) |
(% Zn) |
(kt) |
(% Zn) |
(kt) |
(% Zn) |
(%) |
($/t) |
| Chinchillas |
1,856 |
0.29 |
6,974 |
0.47 |
8,830 |
0.43 |
1,509 |
0.45 |
55.0 |
37.91 |
| Pirquitas |
1,259 |
6.46 |
1,221 |
5.22 |
2,480 |
5.85 |
1,320 |
7.28 |
53.7 |
110 |
| Total |
3,115 |
2.78 |
8,196 |
1.18 |
11,310 |
1.62 |
2,830 |
3.64 |
53.7 - 55.0 |
37.91 - 110 |
Notes:
| 1. | The Chinchillas and Pirquitas Mineral Resource estimate was reported in accordance with S-K 1300. |
| 2. | Mineral Resources are reported based on December 31, 2023 topography surface. |
| 3. | The Mineral Resource estimates are based on metal price assumptions of $22.00/oz silver, $0.95/lb lead, and $1.15/lb zinc. |
| 4. | The Chinchillas Mineral Resources are contained within a pit shell generated using an NSR cut-off value of $37.91/t. The Pirquitas
Mineral Resources estimate is contained within underground mining shapes based on a $110/t NSR cut-off value. |
| 5. | The Chinchillas Mineral Resources are contained within: |
| a. | the resource pit shell generated using an NSR cut-off value of $37.91/t, |
| b. | the reserve pit shell using an NSR cut-off value between $37.91/t and $48.97/t, |
| c. | additionally, a low grade stockpile with an NSR cut-off value between $37.91 and $48.97/t. |
| 6. | Metallurgical recoveries vary with grade and average recoveries are: 82.7% - 95.5% silver, 92.1% lead, and 53.7% - 55% zinc. There
is no Pb recovery in Pirquitas. |
| 7. | The point of reference for Mineral Resources is entry to the processing facility. |
| 8. | Mineral Resources are reported exclusive of Mineral Reserves. There are no Mineral Reserves at Pirquitas. |
| 9. | SSR has 100% ownership of the Project. |
| 10. | Ounces reported represent troy ounces; g/t represents grams per metric tonne, and lb represents pounds. |
| 11. | Totals may vary due to rounding. |
| 1.3.7 | Mineral Reserve Estimates |
Mineral Reserves in this TRS were derived from the current Mineral Resources
and were estimated for Chinchillas only. The Mineral Reserve estimate for Chinchillas was completed by the site technical department.
The SLR QP has reviewed the assumptions, parameters, and methods used
to prepare the Mineral Resources Statement and is of the opinion that the Mineral Resources are estimated and prepared in accordance with
S-K 1300.
The Mineral Reserves are reported as contained silver, lead, and zinc
and are based on open pit mining from the Chinchillas mine. The Chinchillas Proven and Probable Mineral Reserves are estimated as of December
31, 2023, and summarized in Table 1-3.
| | 1-15 | |
| SSR Mining Inc. | Puna Operations S-K 1300 Report | February 12, 2024 SLR Project No.: 138.21581.00003 |
Table 1-4: Summary of Chinchillas
Mineral Reserve Estimate as of December 31, 2023
| Category |
Tonnage
(kt) |
Grades |
Contained Metal |
NSR Cut-off Values
($/t) |
Metallurgical Recovery |
| Ag |
Pb |
Zn |
Silver |
Lead |
Zinc |
Ag |
Pb |
Zn |
| (g/t) |
(%) |
(%) |
(koz) |
(klb) |
(klb) |
(%) |
(%) |
(%) |
| Proven – Ex-pit |
1,129 |
164.70 |
1.42 |
0.21 |
5,980 |
35,307 |
5,261 |
48.97 |
95.7 |
93.2 |
38.9 |
| Probable- Ex-pit |
2,417 |
160.44 |
1.23 |
0.20 |
12,469 |
65,396 |
10,850 |
48.97 |
| Probable - Stockpiles |
620 |
111.80 |
0.88 |
0.32 |
2,228 |
12,051 |
4,388 |
48.97 |
| Total |
4,166 |
154.36 |
1.23 |
0.22 |
20,677 |
112,755 |
20,499 |
48.97 |
Notes:
| 1. | The Mineral Reserve estimate was prepared in accordance with S-K 1300. |
| 2. | The Mineral Reserve estimate is based on a metal price assumption of $18.50/oz silver, $0.90/lb lead, and $1.05/lb zinc and is reported
at a net smelter return (NSR) cut-off value of $48.97/t ore processed. |
| 3. | No mining dilution is applied to the grade of the Mineral Reserves. Dilution intrinsic to the Mineral Reserve estimate is considered
sufficient to represent the mining selectivity considered. |
| 4. | The Project is 100% owned by SSR. |
| 5. | Metals shown in the table are the contained metals in ore mined and processed. |
| 6. | Ounces reported represent troy ounces; g/t represents grams per metric tonne and lb represents pounds. |
| 7. | Totals may vary due to rounding. |
SLR is not aware of any risk factors associated with, or changes to,
any aspects of the modifying factors such as mining, metallurgical, infrastructure, permitting, or other relevant factors that could materially
affect the Mineral Reserve estimate.
There are no Mineral Reserves estimated for the Pirquitas mine.
Chinchillas is mined using conventional surface mining methods. The
mine uses large 92t mining trucks in the pit. Highway tip trucks with specifically engineered tubs are used to haul the ore material over
the 42 km road from the Chinchillas staging area to the plant. The surface operations include:
The Mineral Reserve is based on the ongoing annual average production
of approximately 2,000 kt from the Chinchillas pit.
Mining and processing operations are scheduled 24 hour per day, and
mine production is scheduled to directly send ore material to the designated stockpiles in the staging area close to the pit.
The current LOM plan provides 2.5 years of operational life, including
one and half years of active mining followed by an additional one year of processing the medium grade stockpiles. The average stripping
ratio is 2.4 waste units to 1 unit of ore (2.4 stripping ratio).
| | 1-16 | |
| SSR Mining Inc. | Puna Operations S-K 1300 Report | February 12, 2024 SLR Project No.: 138.21581.00003 |
There are two mining phases in the only mining area with a maximum depth
of approximately 235.0 m attained in the Chinchillas pit.
Primary production for the mine includes drilling 17.1 cm diameter blastholes.
A production blasthole of 6.0 m depth is drilled. Burden and spacing varies depending on the material being drilled. The holes are filled
with explosives and blasted. A fleet of wheel loaders load the broken material into 92 t payload mining trucks for transport from the
pit to the WRSAs and stockpiles.
The major pieces of pit equipment include wheel loaders, hydraulic excavators,
haul trucks, drills, bulldozers, tippers, and graders. Extensive maintenance facilities are available at the mine site to service mine
equipment.
MPSA headcount is 856 persons, which includes personnel in mine operations,
mine maintenance, exploration, plant and laboratory, and general and administration.
| 1.3.9 | Processing and Recovery Methods |
The processing plant at Puna was commissioned in 2009 and has since
been in continuous operation. It uses conventional crushing, grinding, and flotation to produce lead-silver and zinc concentrates. The
plant was designed to process ore from the Pirquitas mine, since mined out, to produce lead-silver, zinc, and tin concentrates, but now
processes ore from the Chinchillas mine (since 2018). Chinchillas ore is processed at a rate of up to 1.7 Mtpa.
The plant has not been expanded since start-up and has a design capacity
of 6,000 tpd through the crushing circuit and 4,000 tpd through the grinding and flotation circuits. However, several changes to the flowsheet
have been made to optimize performance since operations began.
Ore is trucked 42 km from the Chinchillas mine to the plant at Pirquitas
and is delivered to designated stockpiles near the crushing plant for blending. Three-stage crushing reduces the run of mine (ROM) ore
to 80% passing 9 mm. The blended, crushed ore is conveyed to a covered stockpile, from which it is reclaimed and fed to the single stage
grinding mill to provide flotation feed at 80% passing 120 µm. The flotation circuit consists of lead-silver rougher and cleaner
flotation, followed by zinc rougher and cleaner flotation. The concentrates are thickened, filtered, and bagged, and shipped to ports
at Rosario and Buenos Aires for export. The flotation tailings are thickened and pumped to the mined-out Pirquitas pit for storage. Return
water from the tailings and concentrates makes up 90% of the water needs of the process. The remainder of the process water is freshwater
obtained from the nearby Collahuaima River.
The Project infrastructure includes the following:
| · | Ore transport road from Chinchillas to Pirquitas, upgraded to cope with increased traffic; |
| · | Gas supply to the Pirquitas plant via a pipeline with power for the Chinchillas mine site supplied along existing EJESA power lines
from the natural gas powered generators at Pirquitas; |
| · | Water supply for Pirquitas from the Río Ajedrez and for Chinchillas, from local wells; |
| · | A tailings reservoir using the mined out San Miguel pit at Pirquitas; |
| · | An old, inactive tailings dam at Pirquitas that is currently being used for water storage and could be used as a back-up to the in-pit
disposal; |
| · | Cellular and landline telecommunications; |
| · | A camp at Pirquitas equipped with housing sufficient for a maximum of 673 personnel; |
| | 1-17 | |
| SSR Mining Inc. | Puna Operations S-K 1300 Report | February 12, 2024 SLR Project No.: 138.21581.00003 |
| · | Office buildings at Pirquitas and Chinchillas; |
| · | Mine short term/long term ore stockpiles; |
| · | Rock storage facilities (WRSAs) classified by their geochemical attributes as Type A potentially acid generating), Type B (high metal
leaching), and Type C (non-hazardous materials). |
Concentrate shipments from Pirquitas are trucked to Susques, Province
of Jujuy, from Pirquitas via Route No. 77, and from there to Rosario or Buenos Aires via Route No. 9. On arrival at the ports, the material
is shipped directly from the port facilities to the concentrate buyers.
The Project is a polymetallic project containing three principal metals
– silver, lead, and zinc. Production is from two separate concentrates: a high silver content lead concentrate and a zinc concentrate.
The lead concentrate contains most of the recovered silver metal and is the more valuable of the two concentrates.
Silver is traded on a global basis on a number
of metals and commodity market exchanges. The price is determined by a number of factors that follow short and long term trends and is
most commonly established on the London Metal Exchange.
Realized metal prices of $23.95 per ounce silver,
$0.93 per pound lead, and $1.20 per pound zinc were used for the economic analysis.
| 1.3.12 | Environmental Studies, Permitting and Plans, Negotiations, or Agreements with Local Individuals or Groups |
The Puna Operations operates under the authority of environmental approvals
and permits granted by the Province of Jujuy, and SSR’s corporate policies including an Environmental and Social Policy (2020),
Human Rights Policy (2020), and Land Access and Resettlement Policy (2020). Several updates and amendment to the mine Environmental Impact
Assessments have been approved, and in 2023 SSR submitted an updated EIA for both the Pirquitas and Chinchilla sites, which is currently
under review by authorities.
Development of vegetation in the region is constrained by the high elevation
and semi-arid climate. The Pirquitas and Chinchillas sites are located between 4,000 MASL and 4,500 MASL within a mix of high Andean plains
and Puna landscape, characterized by grassy steppes and low-growing shrubs, interspersed with bare soil and alkaline wetlands (peladares).
The climate is cool year-round owing to the high elevation, and semi-arid with an average annual precipitation of approximately 300 mm,
most of which falls as rain during the months of December through March.
The most common native mammals are the Vicuña (Vicugna vicugna)
and the Vizcacha (Lagidium viscacia). Local communities also tend to livestock including the domesticated llama, goats, and sheep.
Saline lakes located in salt flats (salares) in internal drainage basins provide habitat for terrestrial fauna and birds including
three species of flamingos.
There are 15 protected areas in Jujuy province, one of which (the Laguna
de Pozuelos National Natural Monument) is located approximately 25 km from Chinchillas.
MPSA has identified 14 communities in the Project’s area of influence
(AOI), seven in the direct AOI and seven in the indirect AOI. The closest community to Chinchillas is the village of Santo Domingo (approximately
6 km away), while the village of Nuevo Pirquitas is nearest to Pirquitas (approximately 4.5 km away). These communities, as well as others
further afield, are Indigenous communities, with predominant Colla ethnicity.
| | 1-18 | |
| SSR Mining Inc. | Puna Operations S-K 1300 Report | February 12, 2024 SLR Project No.: 138.21581.00003 |
Key environmental aspects at Pirquitas and Chinchillas include fugitive
dust control and water quality. At Pirquitas, legacy issues arising from tailings management practices between the 1930s and the 1980s
result today in episodic impacts to water quality in the Rio Pircas, usually during the rainy season. These legacy issues will be addressed
in the context of mine closure planning.
Flotation tailings from the Pirquitas process plant are disposed of
in the mined-out San Miguel pit, 7 km from the plant. MPSA is implementing measures to manage the inventory of free water in the pit,
which is permit-limited. Managing the site water balance is a key to maintain the water level below the permitted maximum level in the
pit.
SSR is currently updating its conceptual closure plan and closure costs
estimate for Puna which should cover both the current and legacy Pirquitas and Chinchillas sites. The most recent cost estimate for closure
of both sites is approximately US$79 million including both direct and indirect costs.
| 1.3.13 | Capital and Operating Cost Estimates |
Capital costs estimates are shown in Table 1-5 and total $85.1 million
over the remaining 2.5 years of the mine life plus final closure/reclamation costs.
Table 1-5: Capital Cost Summary
| Description |
(US$ million) |
|
| Sustaining |
19.28 |
|
| Final Closure/Reclamation |
65.86 |
|
| Total |
85.14 |
|
The projected LOM unit operating cost estimate for the remaining 2.5
year operation is summarized in Table 1-6 and averages $60.39/t processed.
Table 1-6: Average Operating
Cost Unit Rates
| Activity |
Unit |
Avg LOM |
|
| Mining |
$/t mined |
4.36 |
|
| Mining |
$/t ore processed |
12.52 |
|
| Ore Transportation |
$/t ore processed |
11.24 |
|
| Rehandling |
$/t ore processed |
2.98 |
|
| Processing |
$/t ore processed |
19.52 |
|
| General and Administrative |
$/t ore processed |
14.12 |
|
| Total Operating Costs |
$/t ore processed |
60.39 |
|
| | 1-19 | |
| SSR Mining Inc. | Puna Operations S-K 1300 Report | February 12, 2024 SLR Project No.: 138.21581.00003 |
SLR International Corporation (SLR) was retained by SSR Mining
Inc. (SSR) to prepare an independent Technical Report Summary (TRS) on the Puna Operations (Puna or the Project), located in the
Puna region of northwestern Argentina, in the Province of Jujuy, Department of Rinconada. Puna includes three contiguous
exploitation concessions, covering the Mineral Resources and Mineral Reserves on the Chinchillas property (including the Chinchillas
deposit) and several exploitation concessions covering the Pirquitas property (including the San Miguel and Cortaderas
deposits).
The purpose of this TRS is to support the disclosure of updated Mineral
Resource and Mineral Reserve estimates for the Project with an effective date of December 31, 2023. This TRS conforms to United States
Securities and Exchange Commission’s (SEC) Modernized Property Disclosure Requirements for Mining Registrants as described in Subpart
229.1300 of Regulation S-K, Disclosure by Registrants Engaged in Mining Operations (S-K 1300) and Item 601 (b)(96) Technical Report Summary.
SSR is a gold mining company with four producing assets located in the
USA, Türkiye, Canada, and Argentina, and with development and exploration assets in the USA, Türkiye, and Canada. SSR is listed
on the Nasdaq Stock Exchange (NASDAQ: SSRM), the Toronto Stock Exchange (TSX: SSRM), and the Australian Stock Exchange (ASX: SSR).
Puna is directly owned (100%) by SSR through a subsidiary company Puna
Operations Inc. (POI) which through other 100% owned subsidiaries owns Mina Pirquitas S.A. (MPSA). MPSA operates the Project.
SLR visited the site on November 14 to 16, 2023. During the site visit,
the SLR Qualified Persons (QP) received a project overview by site management with specific activities as follows:
The SLR geology QP toured operational areas and project offices, inspected
various parts of the property and drilling sites to check coordinates, inspected the core handling facility, reviewed the sampling procedures,
and interviewed key personnel involved in the collection, interpretation, and processing of geological data and preparation of the Mineral
Resource estimates. Additionally, the QP checked the logs of seven drill holes and visually verified that assays from the database are
consistent with the metal content in the same intervals.
The SLR mining QP visited the mine operation, waste dumps, mine operations
office, stockpile rehandle areas, and drove the road between the Chinchillas mine and Pirquitas mill. The QP also had discussion with
site and regional office financial personnel on costs and commercial terms.
The SLR metallurgy QP toured the concentrator and visited the old Pirquitas
pit (now the tailings impoundment) and the old tailings facility. The QP also visited the Chinchillas mine as described above.
The SLR environmental and social QP toured the Chinchillas mine and
maintenance facilities, visited the mined out San Miguel pit (now being used to store tailings), participated in discussions with SSR
site personnel regarding environmental, social, and permitting issues in addition to general project matters, and toured the process plant
site and water intake structure on the Rio Ajedrez.
| | 2-1 | |
| SSR Mining Inc. | Puna Operations S-K 1300 Report | February 12, 2024 SLR Project No.: 138.21581.00003 |
| 2.2 | Sources of Information |
During the preparation of this TRS, discussions were held with personnel
from SSR:
| · | John Ebbett, EVP Growth and Innovation, SSR |
| · | Rex Brommecker, SVP Exploration and Geology, SSR |
| · | Jonathan Holden, VP Innovation and Technical Services, SSR |
| · | John Harmse, Capital Projects Contractor, SSR |
| · | Bill Patterson, Studies Contractor, SSR |
| · | Brandon Heser, Director, Mine Technical Services, SSR |
| · | Karthik Rathnam, Director, Resource Geology, SSR |
| · | David Gale, Senior Exploration Manager – USA & South America, SSR |
A previous TRS on the Project was prepared by OreWin Pty Ltd. in 2022
(OreWin, 2022b).
This current TRS was prepared by SLR QPs. The TRS is based on information
and data supplied to the QPs by SSR and other parties where necessary. The documentation reviewed, and other sources of information, are
listed at the end of this TRS in Section 24.0 References.
| | 2-2 | |
| SSR Mining Inc. | Puna Operations S-K 1300 Report | February 12, 2024 SLR Project No.: 138.21581.00003 |
Units of measurement used in this TRS conform to the metric system.
All currency in this TRS is US dollars (US$ or $) unless otherwise noted.
| m |
micron |
kVA |
kilovolt-amperes |
| μg |
microgram |
kW |
kilowatt |
| a |
annum |
kWh |
kilowatt-hour |
| A |
ampere |
L |
litre |
| bbl |
barrels |
lb |
pound |
| Btu |
British thermal units |
L/s |
litres per second |
| ºF |
degree Celsius |
m |
meter |
| C$ |
Canadian dollars |
M |
mega (million); molar |
| cal |
calorie |
m2 |
square meter |
| cfm |
cubic feet per minute |
m3 |
cubic meter |
| cm |
centimeter |
MASL |
meters above sea level |
| cm2 |
square centimeter |
m3/h |
cubic meters per hour |
| d |
day |
mi |
mile |
| dia |
diameter |
min |
minute |
| dmt |
dry metric tonne |
μm |
micrometer |
| dwt |
dead-weight ton |
mm |
millimeter |
| ºF |
degree Fahrenheit |
mph |
miles per hour |
| ft |
foot |
MVA |
megavolt-amperes |
| ft2 |
square foot |
MW |
megawatt |
| ft3 |
cubic foot |
MWh |
megawatt-hour |
| ft/s |
foot per second |
oz |
troy ounce (31.1035g) |
| g |
gram |
oz/st, opt |
ounce per short ton |
| G |
giga (billion) |
ppb |
part per billion |
| Gal |
Imperial gallon |
ppm |
part per million |
| g/L |
gram per litre |
psia |
pound per square inch absolute |
| Gpm |
Imperial gallons per minute |
psig |
pound per square inch gauge |
| g/t |
gram per tonne |
RL |
relative elevation |
| gr/ft3 |
grain per cubic foot |
s |
second |
| gr/m3 |
grain per cubic meter |
st |
short ton |
| ha |
Hectare |
stpa |
short ton per year |
| hp |
Horsepower |
stpd |
short ton per day |
| hr |
Hour |
t |
metric tonne |
| Hz |
Hertz |
tpa |
metric tonne per year |
| in. |
Inch |
tpd |
metric tonne per day |
| in2 |
square inch |
US$ |
United States dollar |
| J |
Joule |
USg |
United States gallon |
| k |
kilo (thousand) |
USgpm |
US gallon per minute |
| kcal |
Kilocalorie |
V |
volt |
| kg |
Kilogram |
W |
watt |
| km |
kilometer |
wmt |
wet metric tonne |
| km2 |
square kilometer |
wt% |
weight percent |
| km/h |
kilometer per hour |
yd3 |
cubic yard |
| kPa |
kilopascal |
yr |
year |
| | 2-3 | |
| SSR Mining Inc. | Puna Operations S-K 1300 Report | February 12, 2024 SLR Project No.: 138.21581.00003 |
The following subsections are largely based on OreWin (2022b) and SSR’s
internal legal status report by Cottrell (2023).
The Puna Operations comprises the Chinchillas property
(including the Chinchillas deposit) and Pirquitas property (including both the San Miguel and Cortaderas deposits), located in the Puna
region of northwestern Argentina, in the Province of Jujuy, Department of Rinconada.
The Chinchillas property is approximately 290 km (driving distance)
from the provincial capital of San Salvador de Jujuy (Figure 3-1) and is centered at approximately at 781,375 mE and 7,508,900 mN
(Gauss Kruger, Argentina, Posgar Zone 3; 22°30′13″ S, 66°15′39″ W) at elevations ranging from 4,000 MASL
to 4,200 MASL.
The Pirquitas property is centered at 752,620 mE
and 7,489,100 mN (latitude 22°42′ S and longitude 66°30′ W). The city of San Salvador de Jujuy is located approximately
335 km (driving distance) southeast of the property. The property is characterized by sparsely vegetated, mountainous terrain at elevations
ranging between 4,000 MASL and 4,500 MASL.
| | 3-1 | |
| SSR Mining Inc. | Puna Operations S-K 1300 Report | February 12, 2024 SLR Project No.: 138.21581.00003 |
Figure 3-1: Puna Operation Location
SSR Mining Inc. Puna Operations Province of Jujuy, Argentina Location Map
| | 3-2 | |
| SSR Mining Inc. | Puna Operations S-K 1300 Report | February 12, 2024 SLR Project No.: 138.21581.00003 |
Puna is directly owned (100%) by SSR through a subsidiary company Puna
Operations Inc. (POI) which through other 100% owned subsidiaries own Mina Pirquitas S.A. (MPSA). MPSA operates the Project.
Exploitation concessions in Argentina are referred to as “Minas”.
The Minas are categorized as follows:
| · | First Category Minas encompass substances such as gold, silver, platinum, iron, lead, copper, zinc, aluminum, lithium, potassium,
etc. |
| · | Second Category Minas include substances such as precious stones found in riverbeds, metals not covered in the first category, and
other materials. |
Each Mina comprises one or more subunits of mining properties known
as “pertenencias”, which are required to be rectangular in shape. In the case of disseminated deposits like Chinchillas, these
pertenencias can cover up to 100 ha. A mining property fee, commonly referred to as “canon”, is levied annually for each pertenencia.
Presently, this fee is ARS$2,329 per pertenencia per year (as specified in Article 215 of the Mining Code).
Individuals have the entitlement to explore, exploit, and manage Minas
as proprietors, granted through a legal license or concession provided by the competent authority in accordance with the Argentine Mining
Code. The legal concessions granted for Minas exploitation have an indefinite duration and are regarded as “real property”,
granting the concessionaire the authority to extract metals from the subsurface directly beneath the concession area. This authority,
however, is subject to the title holder’s adherence to the obligations stipulated in the Argentine Mining Code.
Mineral Tenure
The Chinchillas property encompasses three contiguous First Category
Minas, collectively covering an area of approximately 2,042.56 ha, as outlined in Table 3-1 (also refer to Figure 3-2).
Table 3-1: Chinchillas Exploitation
Concessions
| Concession |
File No. |
Area
(ha) |
| Chinchilla |
469-M-56 |
329.00 |
| Chinchilla I |
079-D-96 |
830.98 |
| Chinchilla II |
1943-V-2013 |
882.58 |
Source: Cottrell, 2023.
| | 3-3 | |
| SSR Mining Inc. | Puna Operations S-K 1300 Report | February 12, 2024 SLR Project No.: 138.21581.00003 |
The Chinchilla Mina comprises four pertenencias, whereas both the Chinchilla
I and Chinchilla II Minas consist of nine pertenencias each. All these Minas are currently valid and maintain good standing.
As of July 2015, Valle Del Cura S.A. (VDC) successfully fulfilled option
payments amounting to $1,866,000, thus securing a 100% interest in the Chinchilla and Chinchilla I properties. Subsequently, MPSA constructed
a mine on these two properties and made a payment of $1,200,000 to the vendors.
The Chinchilla II Mina was acquired directly by VDC and is not subject
to option payments.
| | 3-4 | |
| SSR Mining Inc. | Puna Operations S-K 1300 Report | February 12, 2024 SLR Project No.: 138.21581.00003 |
Figure 3-2: Property Map Showing
Chinchilla, Chinchilla I and Chinchilla II Concessions
SSR
Mining Inc. Puna Operations Province of Jujuy, Argentina Property Map Showing Chinchilla,
Chinchilla I and Chinchilla II Concessions
| | 3-5 | |
| SSR Mining Inc. | Puna Operations S-K 1300 Report | February 12, 2024 SLR Project No.: 138.21581.00003 |
Surface Rights
MPSA entered into agreements with occupants and owners of the land on
which Mina Chinchilla, Mina Chinchilla I, and Mina Chinchilla II are located to acquire the rights to carry out work on the Project.
Mineral Tenure
The Pirquitas property comprises 54 exploitation concessions that cover
an area of approximately 9,742 ha, shown in Figure 3-3. All the exploitation concessions are valid and in good standing.
Surface Rights
The Pirquitas surface rights consist of a group of nine contiguous land
parcels covering an area of approximately 7,500 ha (Table 3-2 and Figure 3-3). These parcels were used for purposes such as housing,
infrastructure, processing, and tailings facilities. MPSA is the freehold title holder of the area covered by these surface rights.
The surface rights area does not cover the entire mineral rights area.
Table 3-2: Pirquitas Operation
Surface Rights
| Parcel No. |
Registration No. |
Area
(ha) |
| 531 |
L-1111 |
1,000.1 |
| 532 |
L-1112 |
1,000.0 |
| 533 |
L-1113 |
750.0 |
| 534 |
L-1114 |
749.6 |
| 535 |
L-1115 |
1,000.0 |
| 536 |
L-1116 |
1,000.0 |
| 537 |
L-1117 |
1,005.0 |
| 538 |
L-1118 |
495.0 |
| 539 |
L-1119 |
500.1 |
Source: Cottrell, 2023.
| | 3-6 | |
| SSR Mining Inc. | Puna Operations S-K 1300 Report | February 12, 2024 SLR Project No.: 138.21581.00003 |
Figure 3-3: Property Map Showing
Pirquitas Mineral and Surface Rights
SSR Mining Inc. Puna Operations Province of Jujuy, Argentina Property Map Showing Pirquitas Mineral and Surface Rights
| | 3-7 | |
| SSR Mining Inc. | Puna Operations S-K 1300 Report | February 12, 2024 SLR Project No.: 138.21581.00003 |
| 3.3 | Encumbrances and Royalties |
Concentrates produced at the Project are subject to a royalty not exceeding
3% of the “mined out” value, which is payable to the Province of Jujuy, in concordance with the Tax Code of the Province
of Jujuy. This royalty payment is calculated based on the net recoverable value of the metals contained in the concentrates with certain
operating costs subtracted.
| 3.4 | Required Permits and Status |
| 3.4.1 | Chinchillas and Pirquitas Exploration Permits |
Exploration work at Mina Chinchillas and Mina Pirquitas were approved
in two separate files with respect to the exploitation work.
These files are 0655-53/2022 approved by Resolution N°1063/2022
DPM for Mina Chinchillas, and file 0655-62-2022, approved by Resolution 129/2022 DPM for Mina Pirquitas.
Both studies are valid until August and November 2024, respectively,
when a new update must be submitted.
| 3.4.2 | Pirquitas Operation Permitting |
The existing capacity of the tailing facility at Pirquitas has been
fully utilized, and to sustain mining and processing operations, tailings disposal has been directed into the Pirquitas pit. Mining activities
within the Pirquitas pit were concluded in January 2017. Subsequent to this, a series of enhancements were executed to facilitate the
transportation of tailings from the Chinchillas Project to a designated section of the Pirquitas pit.
These developments encompassed the establishment of an in-pit disposal
pipeline, the construction of a discharge system linked to the tailings transport pipeline, the implementation of an in-pit water reclaim
system, and the installation of a pipeline connecting the Pirquitas pit to the Pirquitas plant, enabling the reutilization of water. These
improvements have effectively augmented the tailings capacity, thus facilitating the processing of Chinchillas ore.
It is important to note that the utilization of the Pirquitas pit for
tailings deposition, as part of the Pirquitas Operation, constitutes a modification to the originally envisioned mining activities outlined
in MPSA’s Environmental and Social Impact Assessment (ESIA) for the Pirquitas mine until 2016. To address this modification, an
Addendum to the 2016 ESIA Update was submitted by MPSA to Mining Authorities in August 2017. This Addendum detailed the upgrades required
to enable tailings disposal in the Mina Pirquitas pit. The necessary permit for these modifications was granted on September 24, 2018,
through Resolution No. 056/2018.
In the subsequent timeline, MPSA submitted an ESIA Update for Mina Pirquitas
to Mining Authorities in September 2020, however, Chinchillas and Pirquitas ESIA were merged in 2022 and issued in October 2023, this
update is currently under review.
| 3.5 | Other Significant Factors and Risks |
Based on the records of the Secretariat of Mining within the Ministry
of Production, the records of the Jujuy Ministry of Mining, adherence to the Argentine Mining Code, and SSR’s internal records and
review, SSR reports that the Project is in good standing and that MPSA’s rights to the Project are valid and current (Cottrell,
2023).
| | 3-8 | |
| SSR Mining Inc. | Puna Operations S-K 1300 Report | February 12, 2024 SLR Project No.: 138.21581.00003 |
MPSA and SSR have advised that all necessary permits are in place for
the current operations. Additional permitting updates may be required but MPSA advise that these are expected to be approved.
As the mining operations are active, the Pirquitas and Chinchillas sites
are associated with significant environmental liabilities, which will be addressed in the context of mine closure following cessation
of operations. The current closure cost estimate for both sites is US$65.9 million (see Section 17.5).
SSR has all required permits to conduct the proposed work on the property.
SLR is not aware of any other significant factors and risks that may affect access, title, or the right or ability to perform the proposed
work program on the property.
| | 3-9 | |
| SSR Mining Inc. | Puna Operations S-K 1300 Report | February 12, 2024 SLR Project No.: 138.21581.00003 |
| 4.0 | Accessibility, Climate, Local Resources, Infrastructure and Physiography |
Ore from the Chinchillas mine is transported to
the Pirquitas plant for processing. The Chinchillas mine is located approximately 42 km from the Pirquitas plant.
The Chinchillas property is most conveniently reached from the provincial
capital of San Salvador de Jujuy via National Route No. 9, leading northward along the Humahuaca River to the town of Abra Pampa, then
via Provincial Route No. 7 for 66 km and Provincial Route No. 70 passing through the village of Santo Domingo. These roads are under the
maintenance of the Province of Jujuy and remain accessible throughout the year. Given the presence of intermittent rivers along the route,
it is advisable to use four-wheel drive vehicles, especially during the rainy season.
An alternate route to reach the Chinchillas property and the Pirquitas
Operation involves taking National Route No. 9 northward from San Salvador de Jujuy to Purmamarca, then turning northwest onto paved road
No. 52, which leads to the town of Susques. From Susques, National Route No. 40 proceeds to Provincial Route No. 70, which leads to Chinchillas
located at the Fundiciones mountain pass. This route is better suited for heavy transport vehicles and is commonly utilized for traffic
heading to the Pirquitas mine and plant, located approximately 42 km southwest of Chinchillas along this path.
Currently, the transportation of concentrates from
Pirquitas involves trucking them to Susques, Jujuy, using Route 77, and then onward to Buenos Aires via Route 9. Upon arrival at the terminal,
the material is promptly dispatched from the port facilities to the respective concentrate buyers.
The regional climate shares similarities between
Chinchillas and Pirquitas, characterized as arid to semi-arid, influenced by the tropical-subtropical high desert (Blasco, 2011). Precipitation
is scarce, primarily occurring during the rainy season (November to March), with an average annual precipitation of 300 mm. The mean annual
temperature stands at 18°C, although during winter, it can drop to as low as -7.7°C to 7.5°C. Dry and windy conditions often
prevail. Mining operations take place year round.
Chinchillas and Pirquitas are situated within the rural zone of the
Rinconada Department, with an estimated population of around 2,500 residents. Encompassing an area of 6,407 km2, this region
comprises over twenty small communities and provides essential public services, including a police department and a health center. The
closest community to Chinchillas is the village of Santo Domingo, while the village of Nuevo Pirquitas is nearest to Pirquitas.
In the past, the local population primarily engaged in ranching activities.
However, the operations at Pirquitas have led to the development of a substantial local mining workforce with proper training. Fundamental
necessities are sourced from Susques and Abra Pampa, while mining-related supplies are obtained through the provincial capital of San
Salvador de Jujuy, which features an airport offering daily commercial flights to Buenos Aires.
| | 4-1 | |
| SSR Mining Inc. | Puna Operations S-K 1300 Report | February 12, 2024 SLR Project No.: 138.21581.00003 |
For medical facilities, the nearest hospital is situated in Abra Pampa,
located 66 km to the east of Chinchillas.
Pirquitas has a trained workforce for the processing plant and open
pit mining operations, including local workers, operators, supervision, management, and senior staff.
The Chinchillas site comprises various facilities including offices,
workshops, a lunchroom, change room, explosives magazines, security and first aid buildings, a solid waste storage facility, an open pit,
and waste dumps. The existing exploration infrastructure includes two office containers, a core logging facility, a core cutting machine,
two storage tents, two diesel fuel cisterns (1,500 L and 10,000 L each), and six warehouses, each with a capacity of 144 m2,
designated for storing core boxes.
To generate electricity for the Pirquitas Operation, natural gas is
utilized to power three Wärtsila generator sets, each capable of producing 5 MW of power. Additionally, the same electrical plant
accommodates three diesel-powered Cummins generators, each generating 1.1 MW. There is a 6.7 km gas pipeline on the Pirquitas property,
with a diameter of 152 mm and constructed from API5L Grade B steel. The pipeline has a wall thickness of 4.8 mm in standard applications
and 7.1 mm at locations where it crosses rivers or drainage areas.
Power for the Chinchillas mine site is sourced through existing power
lines connected to the natural gas-powered generators at Pirquitas. These power lines are owned by the local power authority, EJESA. The
power line originating from Pirquitas passes by the rural EJESA line located in the town of Nuevo Pirquitas, situated approximately 5
km from Pirquitas. Subsequently, the rural power line extends from Nuevo Pirquitas to all the villages along Route No. 40 and Route No.
70, ultimately reaching Santo Domingo. This power line has the capacity to handle the 1 MW load required for Chinchillas, with an additional
short spur line (approximately 4 km long) built to provide power to the mine.
Given that ore processing activities do not take place at Chinchillas,
the power demands are minimal. In case of a power outage at Pirquitas, a back-up power supply is available from the EJESA grid, capable
of delivering 100 kVA. This back-up power is allocated for critical telecommunications systems and the first aid building.
Pirquitas has been a permitted commercial mine operated by SSR since
December 2009, with existing infrastructure that includes:
| · | An authorized tailing facility; |
| · | A fully serviced workers camp sufficient for approximately 670 personnel; |
| · | A communications system including cellular and intranet access; |
| · | Fully serviced office buildings; and |
| · | Wastewater treatment facilities, organic waste landfill and a recycling center. |
| | 4-2 | |
| SSR Mining Inc. | Puna Operations S-K 1300 Report | February 12, 2024 SLR Project No.: 138.21581.00003 |
The Pirquitas processing plant consists of primary, secondary, and tertiary
crushing operations which deliver ore to a stockpile. The crushing circuit throughput is 6,000 tpd. Ore is transferred from the crushed
ore stockpile to a ball mill and after that a differential flotation circuit to obtain lead/silver and zinc concentrates.
The Pirquitas plant uses a tailings thickener to improve water recovery.
Post thickening, tailings are deposited in the tailings storage facility and secondary water recovery is achieved using barge mounted
reclaim pumps.
MPSA has the surface rights covering the Pirquitas Operation. Electricity
is produced from natural gas and diesel generators at the Pirquitas site.
Water supply is from San Marcos, which is located within the property
a short distance downstream from where the Pirquitas River drains into the Collahuaima River. Domestic water is pumped from a diversion
upstream of the open pit for use at the camp. Potable water is supplied by MPSA from bottled water.
The terrain of the Chinchillas deposit exhibits an elliptical, caldera-like
shape, encompassed by steep, undulating hills encircling the caldera depression. Positioned near the Fundiciones mountain pass, it is
flanked by the Rinconada and Carahuasi ranges, stretching from north to south. Elevations within this area vary between approximately
4,000 MASL and 4,200 MASL. The highest point nearby is Cerro Granada (5,696 MASL), situated 28 km southwest. The Uquillayoc River flowing
through the Project area is fed by numerous small tributaries.
At Pirquitas, the elevations range from 4,000 MASL to 4,500 MASL. The
processing plant, tailings impoundment, and primary workers camp are situated in the eastern third of the Pirquitas property, occupying
relatively open terrain at an elevation of 4,100 MASL. The Pirquitas pit, which terminated mining activities in January 2017, is located
approximately 7 km west of the plant at a slightly higher elevation.
Natural vegetation presents in patches or sparse formations, consisting
of xerophilous and steppe bushes like iro (Festuca ortophylia) and coirón (Stipachrysophylla). Acantoliphia haustata
is the predominant species, accompanied by the Llareta (Azorella compacta), albeit less common. Depressions host the tola (Parastrepia
ssp.), while small trees like queñoa (Polylepis tomentella) can be found (Blasco, 2011).
The region's fauna includes diverse mammal species such as llamas, puna
foxes, vizcachas, various mice species, chinchillas, and ferrets. The area is also home to lizards and a variety of birds, including small
rheas, owls, ducks, condors, and falcons (Blasco, 2011).
| | 4-3 | |
| SSR Mining Inc. | Puna Operations S-K 1300 Report | February 12, 2024 SLR Project No.: 138.21581.00003 |
| 5.1 | Ownership, Exploration, and Development History |
The following subsections have been modified from OreWin (2022b).
Chinchillas was first prospected and mined on a small scale in the eighteenth
century by Jesuit missionaries. Relics of furnaces used to melt lead and silver can still be found at the Chinchillas property (Kulemeyer,
2011). In 1956, Mr. Antonio Mercado requested a concession based on the discovery of galena veins in the basement rock. In 1968, the mine
was sold to Ing. Pichetti, who later formed the Sociedad Pirquihuasi Company together with the Pirquitas Company, and some adits and tunnels
were opened for small scale production. In 1982, the mine license expired, and the mine was acquired by Shell CAPSA S.A. (Shell). From
December 1982 to 1989, a consulting geologist for Shell, Jorge Daroca, carried out exploration work and, after Shell dropped the property,
Mr. Daroca requested it for himself, convinced of the good potential of the area (Daroca, undated). Roads, remnants of infrastructure,
and minor underground workings remain from this activity, but no records of this work are available.
In 1994, Aranlee Resources Ltd. (Aranlee Resources) conducted surface
sampling and drilled seven reverse circulation (RC) drill holes for a total of approximately 780 m. In 2004, Silex Argentina S.A (Silex),
a subsidiary of Apex Silver Mines Ltd., conducted preliminary reconnaissance work including trenching, pitting, and surface sampling.
Between October 2007 and July 2008, 40 manual pits and nine trenches were sampled. Surface mapping was also completed at different scales
and a total of 1,036 surface samples were collected. At the beginning of 2008, Quantec Geoscience Argentina S.A. (Quantec) performed a
16 km induced polarization (IP)/resistivity survey, comprising nine sections. The pole-dipole interval was 50 m, with 300 m
depth readings. The objective of the program was to detect and delineate sulfides related to an intermediate to high-sulfidation epithermal
system, however, the mineralized zones at Chinchillas do not appear to be related to chargeability. Nevertheless, there is a strong resistivity
contrast between volcanic units and basement schists and the resistivity data have been an effective tool for imaging the volcanic diatreme
shape (Quantec, 2008). The core of Silex’s drilling program remains at Chinchillas (Silex, 2008 and Caranza and Carlson, 2012).
In 2011, Golden Arrow Resources Corporation (Golden Arrow) acquired
the property, completed five phases of drilling over five years, and outlined the mineral resources summarized in six technical reports
and preliminary economic evaluations (Davis and Howie 2013, Davis et al., 2014, Davis et al., 2015, Davis et al., 2016, Kuchling et al.,
2014, Kuchling et al., 2015). In October 2015, Golden Arrow announced that it had entered into an agreement with Silver Standard Resources
Inc. (Silver Standard), a predecessor to SSR, to form a joint venture comprising the Chinchillas property, the Pirquitas pit, and the
Pirquitas Operation. The agreement included an 18-month pre-development period to advance Chinchillas, including infill drilling, engineering,
and environmental studies, and permitting. In 2017, Silver Standard changed its name to SSR.
In 2018, the Chinchillas mine achieved commercial production.
On September 18, 2019, SSR completed the acquisition of the remaining
25% interest in Puna from Golden Arrow for a total aggregate consideration of approximately $32.4 million. The transaction allowed the
company to consolidate ownership in Puna and streamline its reporting.
| | 5-1 | |
| SSR Mining Inc. | Puna Operations S-K 1300 Report | February 12, 2024 SLR Project No.: 138.21581.00003 |
In 1930, the Pirquitas discovery was declared by the Spanish miner Rafael
Tauler in the Jujuy Mines Direction (Villafañe, p.106; petition 145-P-1932). Between the 1930s and 1995, the area of the Pirquitas
mine had multiple small mining operations to recover silver and tin from placer and vein deposits.
Sunshine Argentina, Inc. (Sunshine Argentina), the Argentine branch
of Sunshine Mining and Refining Company, acquired the Pirquitas mining concessions in November 1995. In the years following its acquisition
of Pirquitas, Sunshine Argentina carried out comprehensive mineral exploration on the property, including underground rock sampling and
multiple programs of RC and diamond drilling. These culminated in a feasibility study in February 2000.
In May 2002, Silver Standard (now SSR) acquired 43.4% of Sunshine Argentina
from Stonehill Capital Management of New York and in October 2004, Silver Standard acquired the remaining 56.6% of Sunshine Argentina
from Elliott International L.P., The Liverpool Limited Partnership and Highwood Partners, L.P. Silver Standard operated the Pirquitas
mine property as Sunshine Argentina until it changed the company name to Mina Pirquitas, Inc. in May 2008, and further changed the name
to MPLLC in December 2014. In August 2018, Mina Pirquitas LLC. changed its name to Mina Pirquitas S.A.(MPSA).
On November 24, 2015, MPSA was incorporated as 1056353 B.C. Ltd., and
changed its name to Puna Operations Inc. on May 2, 2017.
Silver Standard approved the start of the Pirquitas mine in October
2006 and commenced construction in 2007. The Pirquitas processing plant has been in continuous operation since its start-up date in 2009.
The Pirquitas plant has not been expanded since start-up; however, minor
changes in the flotation flowsheets have occurred to optimize performance. Since 2010, no tin concentrate production has occurred.
Chinchillas production over the last four years (2019 to 2022) is summarized
in Table 5-1.
Table 5-1: Chinchillas Production
2019 - 2023
| Year |
Mined Ore Tonnes
(Mt) |
Ag Feed Grade
(g/t) |
Pb Feed Grade
(%) |
Zn Feed Grade
(%) |
Ag Recovery
(%) |
Pb Recovery
(%) |
Zn Recovery
(%) |
Recovered Ag
(koz) |
Recovered Pb
(klb) |
Recovered Zn
(klb) |
| 2019 |
1,443 |
184.0 |
0.89 |
0.54 |
93.2 |
85.8 |
49.2 |
7,674 |
23,957 |
8,392 |
| 2020 |
817 |
164.0 |
0.77 |
0.51 |
94.6 |
90.2 |
55.5 |
5,581 |
17,193 |
6,988 |
| 2021 |
1,449 |
158.0 |
1.12 |
0.57 |
95.8 |
93.0 |
65.6 |
8,010 |
37,695 |
13,642 |
| 2022 |
1,851 |
166.7 |
1.23 |
0.49 |
95.7 |
92.3 |
48.7 |
8,397 |
41,004 |
8,583 |
| | 5-2 | |
| SSR Mining Inc. | Puna Operations S-K 1300 Report | February 12, 2024 SLR Project No.: 138.21581.00003 |
Historical records for metal production from the Pirquitas property
between 1933 and 1989 indicate that approximately 777,600 kg, or approximately 25 Moz, of silver along with 18,200 t of tin were
recovered by previous operators. An additional 9,100 t of tin was reportedly recovered from the placer deposits found downstream from
the lode deposits.
Pirquitas production from 2009 to 2018, when production was ended, is
summarized in Table 5-2.
Table 5-2: Pirquitas Production
– 2009 - 2018
| Year |
Tonnes Milled
(000 t) |
Feed Grade
(g/t Ag) |
Silver Produced
(koz) |
| 2009 |
410 |
185 |
1,114 |
| 2010 |
1,255 |
233 |
6,302 |
| 2011 |
1,089 |
253 |
7,056 |
| 2012 |
1,623 |
217 |
8,624 |
| 2013 |
1,575 |
217 |
8,216 |
| 2014 |
1,587 |
221 |
8,733 |
| 2015 |
1,557 |
250 |
10,339 |
| 2016 |
1,774 |
235 |
10,422 |
| 2017 |
1,798 |
152 |
6,177 |
| 2018 |
1,078 |
110 |
2,558 |
| Total |
13,746 |
210 |
69,541 |
| | 5-3 | |
| SSR Mining Inc. | Puna Operations S-K 1300 Report | February 12, 2024 SLR Project No.: 138.21581.00003 |
| 6.0 | Geological Setting, Mineralization, and Deposit |
Northwestern Argentina geology consists of three main geological belts,
or terranes, that together trend north-northeast. These are, from east to west, the Sub-Andean Range (Sierras Subandinas), the Eastern
Cordillera (Cordillera Oriental), and the Argentine Altiplano or Puna belt.
These belts are distinguished by their basement lithology complexes,
tectonic histories, magmatism type, metallogeny, and geomorphological features. The Pirquitas and Chinchillas deposits are located in
the Puna belt (Figure 6-1).
The Sub-Andean belt comprises multiple north to northwest trending,
low mountain ranges separated by broad flatlands. Elevations range from approximately 300 MASL to a maximum of 2,500 MASL. An Early Cambrian
to Middle Ordovician carbonate platform, which defines a passive continental margin, dominates this belt. Middle to Upper Ordovician clastic
marine rocks cover the carbonate platform in the eastern and central sectors. Paleozoic sedimentary successions display regional-scale
open folds. Large intrusions and volcanic complexes related to Andean tectonism are not present in this belt. Mineral deposits of economic
significance are rare, although natural gas fields are exploited in the eastern lowlands.
| 6.1.2 | The Eastern Cordillera |
The Eastern Cordillera is a 70 km to 130 km wide folded and thrusted
belt with elevations ranging from 1,300 MASL to 6,200 MASL. Proterozoic basement consisting of medium grade metamorphosed sedimentary
rocks is unconformably overlain by Paleozoic sedimentary rocks deposited in a back-arc basin. The back-arc sequence is composed of Early
Cambrian to Middle Ordovician clastic marine sedimentary rocks, which in turn are unconformably overlain by Silurian to Devonian sedimentary
rocks (Ramos, 2000). The Paleozoic successions are locally covered by Cretaceous sedimentary rocks belonging to the Salta Group.
Late Ordovician to Devonian collision of the composite Arequipa-Antofalla
metamorphic basement terrane with the Pampian terrane, which forms the crustal basement over most of northwestern Argentina, resulted
in folding and faulting of the Paleozoic rocks at Pirquitas. The faults and axial planes related to the large-scale folds formed during
this event strike north to northeast. Uplift of structural blocks has exposed elongate, Ordovician age batholithic granitoid intrusions.
| | 6-1 | |
| SSR Mining Inc. | Puna Operations S-K 1300 Report | February 12, 2024 SLR Project No.: 138.21581.00003 |
Figure 6-1: Regional Geologic
Map
SSR Mining Inc. Puna Operations
Province of Jujuy, Argentina Regional Geology Map
| | 6-2 | |
| SSR Mining Inc. | Puna Operations S-K 1300 Report | February 12, 2024 SLR Project No.: 138.21581.00003 |
The metallogeny of the Eastern Cordillera is relatively simple. The
most important mineral deposit in the belt is the Ordovician age Aguilar sedimentary exhalative (SEDEX) type lead-zinc-(silver) deposit,
located approximately 50 km south of Abra Pampa.
The Puna belt is located to the west of the Eastern Cordillera, at elevations
of 3,900 MASL to 6,700 MASL (Figure 6-1). The Puna belt consists of generally the same sedimentary sequences that occur in the Eastern
Cordillera. Late Ordovician to Early Devonian compressive tectonism also affected the Paleozoic rocks in the Puna belt, but to a lesser
degree than in the Eastern Cordillera. A Paleogene compressive event related to Andean-style tectonics resulted in minor folding and thrust-faulting.
By the Late Miocene, the tectonic regime transitioned to extension, resulting in basin and range geomorphology. Thinning of the upper
crust resulted in the upwelling of magma and the development of andesitic to dacitic stratovolcanoes as well as multiple, very large calderas.
Large volumes of regionally extensive ignimbrite sheets erupted from the calderas, with approximately 1,800 km3 to 1,200 km3
of material ejected from the Valdema caldera alone (Soler et al., 2007). Sub-aerial volcanism continued into the Pleistocene. This volcanic
activity, and associated mineral deposits, was concentrated along corridors defined by lineaments such as Coranzuli Lipez, El Toro Olacapato,
and Arizaro (Ramos, 1999, Coira et al., 2004, Gorustovich et al., 2011).
Younger rocks include basaltic lavas, continental sedimentary rocks,
and the formation of high-altitude salt flats. In terms of mineral deposit endowment, the Puna belt is by far the most important of the
three terranes in Jujuy Province. The main deposit types documented in the Puna belt are as follows:
| · | Devonian mesothermal quartz veins and saddle reefs containing native gold, minor base metals, and accessory gangue minerals of ankerite
and chlorite, with the Rinconada district being the most important for this type of mineralization. |
| · | Polymetallic quartz-sulfide veins related to eroded Neogene volcanic centers, with the veins containing variable amounts of lead,
zinc, antimony, arsenic, silver, and gold. |
| · | Bolivian-type Sn-Ag sulfide-rich veins related to Middle to Late Miocene sub-volcanic intrusive stocks. |
| · | Pleistocene to recent placer deposits of Au (Rinconada), Sn (Pirquitas), and gold-copper (Eureka). |
Local geology of the Chinchillas and Pirquitas mine areas is composed
of the Ordovician Acoite Formation (Fm.), Miocene Tiomayo Formation, and Miocene ignimbrite sheets related to Cerro Granada (Figure 6-2).
The Acoite Formation is an interbedded sandstone, siltstone, and mudstone turbidite sequence deposited in a back-arc basin. Age dating
of graptolite fauna indicates a lower Ordovician age of 478 Ma. The Acoite Formation experienced back-arc shortening during the Ocloyica
Orogeny (Upper Ordovician to Lower Silurian (444 Ma)). This compressional event led to the contemporaneous development of north-northeast
striking upright folds, strong sub-vertical penetrative axial planar cleavage, north-northeast striking faults, and quartz veining associated
with fold hinges. Miocene Andean deformation effectively reactivated structures related to the Ocloyica Orogeny and led to the widespread
associated magmatic activity and formation of Bolivian-type polymetallic, low to intermediate sulfidation epithermal deposits. Unconformably
overlaying the Acoite Formation is the Tiomayo Formation, an Early to Middle Miocene sequence of hematitically stained arkose sandstone,
mudstone, and polymictic conglomerate beds. The Tiomayo Formation post-dates mineralization in the area, though some conglomerate layers
host paleo-placer deposits. Large ignimbrite sheets related to Cerro Granada onlap both the Acoite and Tiomayo formations in the northern
part of the property. The Cerro Galan granodiorite intrudes the sedimentary section to the east of the Pirquitas property and is the only
substantial intrusive body proximal to the mine area (Passamani, 2014).
| | 6-3 | |
| SSR Mining Inc. | Puna Operations S-K 1300 Report | February 12, 2024 SLR Project No.: 138.21581.00003 |
The region around the Chinchillas mine is also underlain by the Acoite
Formation, but importantly is intruded by Miocene porphyritic dacite domes and phreatomagmatic tuff and breccia units (Figure 6-2).
The Acoite Formation demonstrates similar deformation to the Pirquitas area, where Ocloyica deformation resulted in upright regional first
order folds with fold axes trending north-northeast. Second order, smaller scale folds are also observed along the western limb of regional
first order folds. Here, second order folds are related to west dipping thrust faults and display fault propagation fold geometries. Northeast-southwest
trending, high angle faults are also observed along the western portion of the mine. These structural sets are interpreted to be lateral
ramps associated with second order folding and faulting. Moreover, a regional northwest-southeast high angle strike slip fault is observed
along the eastern and northern portion of the mine. This structural set is younger that Ocloyica structures as they offset first order
fold hinges. Offset is interpreted to be sinistral (left-lateral) with a minimum offset of 400 m, based on field relations.
The Acoite Formation is intruded by a 13±1 Ma volcanic diatreme
composed of phreatomagmatic tuff and breccia as well as porphyritic hypabyssal dacite (Caffe and Coira, 2008; Figure 6-2). Explosive diatreme
volcanism resulted in an elliptical center, or depression, that infilled with collapse breccia as well as air and water-lain tuff.
| | 6-4 | |
| SSR Mining Inc. | Puna Operations S-K 1300 Report | February 12, 2024 SLR Project No.: 138.21581.00003 |
Figure 6-2: Stratigraphic Column
SSR Mining Inc. Puna Operations Province of Jujuy, Argentina Stratigraphic Column
| | 6-5 | |
| SSR Mining Inc. | Puna Operations S-K 1300 Report | February 12, 2024 SLR Project No.: 138.21581.00003 |
The Chinchillas deposit occurs within a 13±1 Ma dacitic volcanic
center (Caffe and Coira, 2008) and is the product of a phreatomagmatic diatreme. The deposit is controlled by an east-west trending regional
scale fault where dilatation accommodated magma to intrude through the Acoite Formation. The explosive volcanic eruption resulted in an
elliptically shaped topographic depression approximately 2.0 km long by 1.6 km wide, subsequently filled with pyroclastic rocks including
breccias and tuffs (Figure 6-3). At the contact between the pyroclastic volcanic rocks and the metasedimentary basement rock, there
is a large zone of hydraulic fracturing and brecciation.
The Basement Mantos and Silver Mantos outlines are based on the end
of year (EOY) 2022 resources. The combined resource outline is also based on the EOY 2022 resource. On the southern and northern margins
of the basin, at the contact between the Acoite Formation metasedimentary rocks and pyroclastic rocks, there are dacitic lavas, flow domes,
and sub-volcanic intrusions (Kuchling et al., 2017).
Breccia and tuff units within the diatreme are mainly matrix supported.
Clasts are sub-rounded to angular and range from fine grained to large, one meter blocks. Clasts are predominantly fragments of reworked
pyroclastic tuffs, dacite, and Acoite Formation. Most of the volcanic clasts and matrix are altered by intense hydrothermal activity,
whereas the basement sedimentary clasts are generally better preserved.
Three main dacite domes outcrop along the southeast edge of the Chinchillas
basin between the pyroclastic breccias and metasedimentary contact (Figure 6-3). The domes have a medium to fine grained porphyritic
texture with phenocrysts of quartz (35% to 45%) plagioclase, biotite, and minor sanidine (Caffe and Coira, 2008). The dacite domes are
generally massive with limited flow banding and some flow brecciation along the margins. Drilling confirms that the dacite outcrops are
part of larger bodies below the Socavon del Diablo area.
| 6.3.1.1 | Chinchillas Mineralization |
Significant silver-lead-zinc mineralization occurs in four main areas
at Chinchillas: the Silver Mantos and Basement Mantos zones in the west part of the caldera and the Socavon del Diablo and Socavon Basement/Melina
zones in the east part (Figure 6-3). Previous reports also referred to Socavon Basement mineralization which was a general term used
to include multiple zones proximal to the volcanic-metasedimentary rock contact, along the northern and eastern margins of the volcanic
center. Drilling in 2022 and 2023 tested multiple areas along this contact, however, exploration was primarily focused on the more continuous
mineralization of the Melina Zone area.
Northeast trending faults within the metasedimentary rocks are
interpreted to control the location of the Basement Mantos deposit, the distribution of high grade mineralization in the Silver Mantos
deposit, and, potentially, the Socavon del Diablo deposit. Mineralization is dominated by silver, with lesser amounts of lead and zinc.
Mineralization occurs as disseminated sulfides, matrix infilling within the volcanic tuffs, and as matrix and fracture filling in breccias
within the metasedimentary rocks (Figure 6-3). Dacite volcanic rocks are rarely mineralized in shear zones, veinlets, or vein-like
structures. Within the metasedimentary lithologies, shear zones and faults are more commonly mineralized. The depth of oxidation is several
meters within the volcanic rocks and is insignificant within the metasedimentary rocks. Silver, lead, and zinc bearing minerals include
silver sulfosalts, freibergite, boulangerite, tetrahedrite, schalenblende, sphalerite, and galena. Main mineral associations include chalcopyrite,
quartz, pyrite, siderite, limonites, manganese oxides, cerussite, smithsonite, anglesite, and malachite (Marshall and Mustard, 2012 and
Coira et al., 1993).
| | 6-6 | |
| SSR Mining Inc. | Puna Operations S-K 1300 Report | February 12, 2024 SLR Project No.: 138.21581.00003 |
Silver Mantos Mineralization
Within the Silver Mantos zone, mineralization is disseminated throughout
several shallow (approximately 5°), east dipping layers hosted within clay altered pyroclastic tuffs and breccias. The mineralization
occurs between surface and 100 m depth with a north-south extension of 150 m that ranges between two meters and 60 m thick and averaging
greater than 20 m (Figure 6-3 and Figure 6-4). The mineralization is very finely disseminated in the tuff matrix, and commonly
consists of galena and sphalerite.
Basement Mantos Mineralization
Located below the Silver Mantos, the Basement Mantos comprises an area
600 m wide and up to 210 m thick, with an average thickness of 80 m, dipping at approximately 40° to the east. The zone has been traced
down dip for approximately 350 m. The Basement Mantos is hosted entirely within Acoite Formation metasedimentary rocks and is comprised
predominantly of breccias with small veinlets and fracture fill mineralization.
Socavon del Diablo Mineralization
The Socavon del Diablo zone is located in the eastern central area of
the caldera (Figure 6-3). Mineralization is dominated by mantos style disseminated sulfides within shallow, west dipping volcanic
tuff horizons.
Mineral occurrences, textures, alteration, and ore types within the
volcaniclastic lithologies are similar to those described for the Silver Mantos area, however, the mineralization is thought to be related
to a different fluid event based on compositional differences. There may have been a different vent source within the volcanic center,
as the Socavon del Diablo mineralization is generally lower in silver and higher in zinc content.
Socavon Basement and Melina Mineralization
The Socavon Basement zone is mainly hosted within the Acoite Formation
metasedimentary rocks located along the northern and eastern rim of the volcanic center. The eastern limit of the Socavon del Diablo zone
is a dacitic dome intruded in the tuff units and flowed over the tuff at surface. Immediately to the east of the dacite dome, biotitic,
sub-horizontal tuff layers up to 80 m thick cover the Socavon Basement zone. Here, the mineralization is hosted in breccias filled with
argentiferous galena and a stockwork of sphalerite-siderite-galena within a halo of low grade zinc.
The Melina target is the most continuous zone of mineralization located
in the northeast sector of the caldera at the contact between Miocene tuff units and the Acoite Formation (Figure 6-3). Here, there
is a large volume of hydraulic breccia and sulfide filling open spaces. This volume extends discontinuously west-northwest to east-southeast
with a thickness between 20 m and 70 m and a length of more than 500 m.
| | 6-7 | |
| SSR Mining Inc. | Puna Operations S-K 1300 Report | February 12, 2024 SLR Project No.: 138.21581.00003 |
Figure 6-3: Chinchillas Local
Geological Map
SSR
Mining Inc. Puna Operations Province of Jujuy, Argentina Local Chinchilla Geology Map
| | 6-8 | |
| SSR Mining Inc. | Puna Operations S-K 1300 Report | February 12, 2024 SLR Project No.: 138.21581.00003 |
Figure 6-4: Silver Mantos and
Basement Mantos Zones with Drill Hole Locations and Mineralized Zones
SSR Mining Inc. Puna Operations
Province of Jujuy, Argentina Silver Mantos and Basement Mantos Zones with Drill Hole Locations and Mineralized Zones
| | 6-9 | |
| SSR Mining Inc. | Puna Operations S-K 1300 Report | February 12, 2024 SLR Project No.: 138.21581.00003 |
| 6.3.1.2 | Chinchillas Alteration |
Typical hydrothermal alteration is described for metasedimentary sequences,
pyroclastic volcanic rocks, and dacite domes. In the Acoite Formation metasedimentary sequence, alteration of the shale or sandstone is
very weak, marked by carbonate and clay alteration in areas near sheared structures. In the fractures, there is abundant presence of clays
with lower proportion of iron oxides. Disseminated pyrite is abundant in these rocks.
Pyroclastic tuffs and breccias have undergone different types of alteration,
including argillic alteration, sericitization, silicification, and carbonate alteration mainly as siderite. The most extensive alteration
is argillaceous and corresponds to a mixture of kaolinite and illite. Biotite is commonly altered to sericite-kaolinite-quartz (Caffe,
2013). Extensive fine grained silicification is also documented in the rock package. Clay alteration, sericitization, and silicification
are observed to overlap each other, indicating that the alteration event was prolonged and the result of a range of temperature and pressure.
Carbonate alteration is locally dominant and appears late in paragenesis based on thin section analysis (Marshall and Mustard, 2012).
Plagioclase feldspar is often replaced by siderite and illite (Caffe, 2013).
Porphyritic dacite rocks were hydrothermally altered to sericite and
siderite with minor silicification. Alteration is more developed in the matrix, specially in the plagioclase crystals (Caffe, 2013).
The property
geology of the Pirquitas mine consists of exposures of the Acoite and Tiomayo formations (Figure 6-2 and
Figure 6-5). The Acoite Formation is deformed by the Ordovician Ocloyica
Orogeny. The Ocloyica Orogeny formed regional folds that trend north-northeast to northeast with steep axial planes that dip to the northwest
and southeast. Folds are dominantly upright, although the areas in the western portion of the property display an east vergent geometry
and areas in the east display a west vergent geometry. Major folds in the San Miguel and Cortaderas areas are symmetrical, suggesting
the presence of an orogen scale anticlinorium centered over major zones of mineralization. Furthermore, strong penetrative axial planar
cleavage associated with regional folding is observed throughout the property. Axial planar cleavage is dominantly observed in finer grained
portions of the Acoite Formation. Folding plays an important role in vein formation and geometry; at the San Miguel pit, veins are intimately
related to the San Miguel anticline, occurring proximal to the fold apex and most commonly striking perpendicular to the fold planes.
West-northwest striking regional faults are also observed throughout the property. This structural fabric is interpreted to control the
geometry and location of the Cortaderas breccia body. Age of these structures is largely unknown as they have no observable offset or
kinematics in the main area of mineralization. Regional east-northeast trending structures, also observed on the property, are likely
Miocene or younger in age as they cut regional folds in the Acoite Formation, and also juxtapose Tiomayo Formation against Acoite Formation.
There is no mineralization associated with this fabric. North striking normal faults are also observed in the San Miguel pit with
minor (<10 m) offset.
| | 6-10 | |
| SSR Mining Inc. | Puna Operations S-K 1300 Report | February 12, 2024 SLR Project No.: 138.21581.00003 |
Figure 6-5: Pirquitas Geologic
Map
SSR Mining Inc. Puna Operations Province of Jujuy, Argentina Pirquitas Geological Map
| | 6-11 | |
| SSR Mining Inc. | Puna Operations S-K 1300 Report | February 12, 2024 SLR Project No.: 138.21581.00003 |
| 6.3.2.1 | Pirquitas Mineralization |
There are two types of mineralization at Pirquitas: (1) polymetallic
veins with peripheral disseminated mineralization; and (2) mineralized hydrothermal breccia. Vein type is the dominant mineralization
style and has been the main source of extracted ore. This mineralization type is characterized by quartz and massive sulfides (pyrite,
sphalerite, galena, or wurtzite) in association with a wide variety of Ag-Sn-As-Sb-Pb-Cu-Bi sulfosalts (freibergite, pyrargyrite, miargyrite,
and polybasite) and rare oxides (cassiterite or wolframite). Hydrothermal breccia bodies, found in various parts of the area, were formed
concomitantly with veins. They host a similar assemblage of pyrite cassiterite, sphalerite, arsenopyrite, galena, and Ag-Sn-As-Sb-Pb-Cu-Bi
sulfosalts, except that the abundance of galena is greater (Malvicini, 1978; Paar et al., 1996).
The San Miguel open pit exploited portions of the Potosí, San
Miguel, and Chocoya vein systems. The Potosí vein is located on the northern margin of the open pit; the Chocoya vein system is
located on the southern margin, and the uppermost part of the Oploca system, known as the Oploca breccia, was exploited at the southern
edge of the open pit (Board et al., 2011). Sheeted sulfide bearing quartz veins and associated disseminated mineralization of the San
Miguel system occur in a swarm that is 160 m wide in the north-south direction and up to 400 m along strike in the east-west
direction.
Veins within the San Miguel pit have a strike of west-northwest (azimuth
285°) and are generally sub-vertical. Veins with this orientation include the Potosi, San Miguel, Chocoya, Oploca, San Pedro, Llalagua,
Chicharron, and Colquiri. The Potosi vein is the largest known single vein on the property, with a strike length of approximately 500
m and a maximum thickness of 3.0 m. This vein has an average dip of 80º to the northeast. Other veins of this orientation typically
have a strike length of 50 m to 150 m, with average widths of 30 cm to 50 cm. A set of secondary veins is represented by the Veta Blanca
and Colquechaca veins, located north of the Potosi vein; and narrow veins (50 cm to 2 m) in the Oploca zone. The secondary veins strike
southeast (130°) and dip steeply to moderately to the southwest (Board et al., 2011). The Crucero vein corresponds to a series of
fractures that follow the axial plane of the anticline (striking north-northeast) in the center of the San Miguel pit. Sulfide mineralization
within the Crucero vein develops irregularly along fractures within undeformed white crystalline quartz.
In addition to veins, zinc rich mineralization is hosted within pipe-like
breccia bodies interpreted as breccia diatremes (Board et al., 2011). North of the San Miguel open pit is the Cortaderas breccia which
trends east-southeast (110° to 120°) and dips
75° to the southwest. Its thickness varies from 0.5 m to 7.0 m and the overall strike length
is 500 m. The Cortaderas body is related to a regional west-northwest striking fault system. No appreciable offset is observed along the
structural zone. It is interpreted from field mapping that the zone is occurring in a relay/accommodation zone where all appreciable offset
is being accommodated along multiple fault strands. An alternative interpretation is that the zone is occurring along a major horse-tail
splay fault system where fault slip is decreasing. A variety of breccia types are observed at Cortaderas: fault, crackle, phreatic, and
pebble-dike types. The fault breccias are matrix to clast supported and contain rotated clasts of unmineralized angular wall rock in matrix
of sericite altered rock flour, which contains minor amounts of disseminated sulfide mineralization (e.g., sphalerite) with clay. The
crackle breccias are a fracture array cemented by hydrothermal minerals, such as sphalerite, clay, siderite, quartz, pyrite, and marcasite;
these minerals support mostly non-rotated angular clasts of wall rock. Powdered X-ray diffraction of this clay material shows it to be
dominantly dickite with one sample also containing kaolinite (Slater et al., 2020). In the central breccia vein, several episodes of mineralization
and brecciation resulted in cockade textures with mineralized clasts supported by a sulfide matrix. Phreatic breccias are pipe or vein
shaped bodies with rock-flour matrix that support rounded, heterolithic clasts of variably altered wall rock, as well as sulfide minerals.
| | 6-12 | |
| SSR Mining Inc. | Puna Operations S-K 1300 Report | February 12, 2024 SLR Project No.: 138.21581.00003 |
During the 2022-2023 drill campaign, new intercepts, combined with a
reinterpretation of historical drill holes, outlined the Hanging-wall zone which is located approximately 150 m to the south of the Cortaderas
deposit (Figure 6-6). Similar to Cortaderas, it is variably comprised of massive sulfide bearing polymetallic veins, vein stockworks,
and disseminated mineralization hosted within metasedimentary rocks of the Acoite Formation. It is interpreted to trend west-northwest
over a strike length of 450 m and dip steeply to the north-northeast, opposite to the southwest dipping Cortaderas deposit.
| | 6-13 | |
| SSR Mining Inc. | Puna Operations S-K 1300 Report | February 12, 2024 SLR Project No.: 138.21581.00003 |
Figure 6-6: Cortaderas and Hanging-wall
Zones with Drill Hole Locations and Mineralized Zones
SSR Mining Inc. Puna Operations
Province of Jujuy, Argentina Cortaderas and Hanging-wall Zones with Drill Hole Locations and Mineralized Zones
| | 6-14 | |
| SSR Mining Inc. | Puna Operations S-K 1300 Report | February 12, 2024 SLR Project No.: 138.21581.00003 |
| 6.3.2.2 | Pirquitas Alteration |
Hydrothermal alteration is not particularly well developed in the host
rocks of the Pirquitas deposit (Board et al., 2011). An assemblage of sericite+quartz+disseminated pyrite replaces original wallrock minerals
along the margins of the larger veins, thus forming thin bleached halos to the veins. This sericite-quartz-pyrite alteration is also recognized
in wallrock clasts within vein breccia. Disseminated sub-hedral pyrite is widespread in the deposit, generally constituting less than
a few percent of the wallrock by volume; it tends to be more abundant in shale and siltstone beds (Board et al., 2011).
Proximal to the Cortaderas breccia, minor wall
rock alteration occurs as selvages several millimeters to tens of centimeters wide that include clay, sericite, chlorite, and silica with
minor sulfides (sphalerite, pyrite, marcasite) (Slater et al., 2020).
The Chinchillas and Pirquitas deposits occur within the Bolivian tin-silver-zinc
belt which occupies the back-arc portion of the central Andes and extends from the San Rafael tin-copper deposit in southern Peru to northern
Argentina. The Bolivian tin-silver deposits are typically associated with felsic volcanic domes of broadly rhyodacitic composition (Cunningham
et al., 1991). Bolivian-type silver-tin deposits generally consist of sulfide and quartz-sulfide vein systems typically containing cassiterite
and a diverse suite of base and trace metals, including silver in a complex assemblage of sulfide and sulfosalt minerals. The vein systems
are generally spatially, and likely genetically, associated with epizonal (sub-volcanic) quartz bearing peraluminous intrusions one to
two kilometers in diameter, although the mineralization may be entirely hosted by the country rocks into which the intrusive stocks were
emplaced. The Chinchillas deposit is modelled as a Tertiary aged diatreme volcanic center that has intruded Paleozoic sedimentary basement
rocks. The mineralization occurs mostly as disseminations, veinlets, and matrix fill.
Most of the deposits within the Bolivian tin-silver-zinc belt are characterized
by the intrusion of dacitic dome complexes with mineralization hosted in shear zones and breccia within the dacitic domes and/or within
shear zones and breccia within the host rocks. At Pulacayo, Potosí, and San Cristóbal, where associated domes are present,
there is a significant mineralization within the domes. More rarely, as in the case of Chinchillas and San Cristóbal, the deposits
include disseminated mineralization in flat lying manto bodies within sedimentary and pyroclastic rocks. Chinchillas demonstrates phreatomagmatic
diatreme morphology associated with a dome structure.
| | 6-15 | |
| SSR Mining Inc. | Puna Operations S-K 1300 Report | February 12, 2024 SLR Project No.: 138.21581.00003 |
At Chinchillas, exploration emphasis was placed on mapping lithologies,
alteration, and structures to better understand the controls of the mineralization. A handheld X-ray fluorescence (XRF) analyzer was also
used to measure approximate silver, lead, and zinc values at all prospective outcrops.
Geophysical surveys, including induced polarization (IP)/resistivity,
controlled-source audio-frequency magnetotelluric (CSAMT), and magnetic surveys, were conducted in 2013 and, together with the reinterpretation
of the 2008 IP survey, were used to target the Chinchillas south area. The surveys detected deep structures and defined the contact between
the tuff unit and metasedimentary rocks.
The methods used to explore the Chinchillas property are in accordance
with industry standards and there are no indications of sample biases.
Sunshine Argentina completed detailed geological mapping on the Pirquitas
property and commissioned approximately 44 line-km of ground magnetics surveying and 19.2 line-km of IP surveying centered on what is
now the San Miguel open pit. Sunshine Argentina’s drilling programs ended in September 1998, after which its parent company completed
an internal pre-feasibility study (PFS) of the Project. Since acquiring the Project in 2005, SSR has carried out additional geophysical
programs, including a 14.4 line-km Quantec Titan-24 DC-IP survey, a ground gravity survey, and a differential global positioning system
(GPS) survey in 2012, and a drone airborne magnetic survey in 2014. Between 2008 and 2023 numerous prospecting and geological mapping
campaigns evaluated the mineral potential of the property. Current SSR’s exploration at Pirquitas has predominantly involved reverse
circulation (RC) and diamond drilling (DDH).
| 7.2.1 | Chinchillas Drilling |
Since 1994, SSR and its predecessors have drilled a total of 446 drill
holes (all diamond drilling) totaling 73,890 m at Chinchillas as summarized in Table 7-1 and illustrated in Figure 7-1.
| | 7-1 | |
| SSR Mining Inc. | Puna Operations S-K 1300 Report | February 12, 2024 SLR Project No.: 138.21581.00003 |
Table 7-1: Drill Programs Completed
at the Chinchillas Property
| Company |
BHIDs Sequence |
# of Drill Holes |
Year |
Metres Drilled |
| Aranlee Resources |
CH-1–7 |
7 |
1994 |
782 |
| Silex |
CHD-010–016 |
7 |
2007–2008 |
2,220 |
|
Golden Arrow
(Phase 1-V) |
CGA-017–297 |
284 |
2012–2015 |
45,803 |
|
Golden Arrow/SSR
(Phase VI – VII) |
CGA-212W + CGA-298–340 |
44 |
2016 |
8,945 |
| SSR |
CHN22-341-399 |
59 |
2022 |
10,290 |
| SSR |
CHN23-400-444 |
45 |
2023 |
5,850 |
| Total |
|
446 |
|
73,890 |
| | 7-2 | |
| SSR Mining Inc. | Puna Operations S-K 1300 Report | February 12, 2024 SLR Project No.: 138.21581.00003 |
Figure 7-1: Location of Drill
Hole Collars at the Chinchillas Deposit
SSR Mining Inc. Puna Operations Province of Jujuy, Argentina Location of Drill Hole Collars at the Chinchillas Deposit
| | 7-3 | |
| SSR Mining Inc. | Puna Operations S-K 1300 Report | February 12, 2024 SLR Project No.: 138.21581.00003 |
The following description of drilling conducted on the Chinchillas property
prior to 2022 is summarized from Kuchling, 2017 and is included in Table 7-1. Aranlee Resources (1994) did not include any quality
assurance and quality control (QA/QC) procedures; therefore those data were not used in subsequent Mineral Resource estimations. Silex
completed a basic QA/QC program including duplicate samples and the insertion of blanks and certified reference materials (CRM). Golden
Arrow resurveyed all the Silex drill collars using a differential GPS. The half core remaining from Silex’s program was relogged
and resampled (quarter core) at select intervals for additional quality control checks and therefore has been included in subsequent Mineral
Resource estimations.
Golden Arrow completed six separate phases of drilling focusing on exploration
and resource definition. Energold Argentina S.A. (Energold) was the contract diamond driller for Golden Arrow throughout Phase I and II
drilling. All drill core was HQ (63.5 mm) diameter except for 21 holes, which were drilled with the S-3 rig, producing HQ diameter core
to a depth of 150 m and then reducing to NTW (56.26 mm) diameter core to the end of the hole. Phases III, IV, V, and VI of drilling were
performed by Falcon Drilling Argentina using HQ and HQ3 (61.1 mm) diameter core except for holes CGA-127, CGA-149, CGA-170, and CGA-181,
which were reduced to NQ (47.6 mm) to reach deeper levels. Phase VI drilling included five RC holes with a diameter of 12.7 cm.
Core Sampling
The diamond drill core was extracted from the core tube and placed in
appropriate boxes marked with drill hole number and the hole depth in meters. The boxes were transported by pickup truck from the drill
site to the core shack at the end of each shift. The drill contractor used a single shot Reflex survey instrument to measure the downhole
deviation. This information was transferred to Golden Arrow in digital format for inclusion in the drilling database. Following completion
of the hole, the drill pad was cleaned and a PVC tube was cemented at the drill collar with hole number, depth, and azimuth inscribed
on a metal ticket.
Golden Arrow implemented a detailed drilling and safety protocol for
handling drill core. Once the core boxes reached the core shed, they were reviewed and organized. Measurements of core recovery and geotechnical
measurements (fracture frequencies and rock quality designation (RQD)) were recorded. The core boxes were then photographed and select
intervals were temporarily removed for specific gravity measurements. Geological descriptions were recorded and the samples for analysis,
marked at one meter intervals in mineralized zones and two meter intervals in areas with no expected mineralization. The drill core was
split using an electric diamond core saw and sampled according to the marked intervals.
The practices and procedures followed during drilling programs conducted
on the Chinchillas property adhere to accepted industry standards, and there are no factors identified that could materially impact the
reliability or accuracy of the results.
2022-2023
In 2022 and 2023, SSR completed two HQ diamond drilling campaigns at
Chinchillas, with a total of 16,139 m in 104 holes drilled (Table 7-1). The 2022 drill program focused on multiple targets within
the Chinchillas volcanic complex. The primary target was resource expansion within the Silver Mantos and Basement Mantos zones. The Socavon
del Diablo zone was drilled to improve the understanding of the deposit’s geology, potentially increase resources, and obtain samples
for a new metallurgical program. Another target around the caldera rim was Melina (Figure 6-4).
| | 7-4 | |
| SSR Mining Inc. | Puna Operations S-K 1300 Report | February 12, 2024 SLR Project No.: 138.21581.00003 |
The objective of the 2023 campaign holes was to infill and expand the
known mineralization throughout the Chinchillas volcanic complex. A total of 45 drill holes for over 5,800 m were completed at Chinchillas
in 2023, mostly HQ drilling. The final six (CHN23-439 to CHN23-444) holes were completed in September 2023 and were not included in the
current Chinchillas resource update because assays were not available at the time of the Mineral Resource estimation. Two of the six holes
succeeded in expanding the known mineralization to the south and to the east and require more detailed drill follow-up to evaluate the
resource potential.
For both the 2022 and 2023 drilling programs, initial drill hole core
size was HQ, reduced to NQ size where necessary. All drill hole collar coordinates were surveyed in the Gauss Kruger coordinate system
(Posgar 94 datum). Downhole surveys were carried out using a Gyroscope instrument, with readings taken systematically every 50 m and transferred
in digital format for inclusion in the drilling database. Diamond drilling was oriented at a wide range of azimuths of 15° to 330°
with dips generally ranging between 60° and 85°. These subvertical dips resulted in the drill holes intersecting the Basement
Mantos, Socavon del Diablo, and Silver Mantos zones at a right angle. Drilling recovery generally ranged between 95% and 100% for diamond
drill holes.
Following completion of the hole, the drill pads were cleaned and, in
areas with no active mining, a PVC tube was cemented at the drill collar with hole number, depth, and azimuth inscribed on a metal ticket.
During the SSR drilling programs at both Chinchillas and Pirquitas (2022
and 2023), the drill core was extracted from the core tube and placed in appropriate boxes marked with the drill hole number and the hole
depth in meters. The boxes were transported by pickup truck from the drill site to the Pirquitas core shack at the end of each shift by
SSR personnel. Once the core boxes had reached the core shed, they were reviewed and organized. Measurements of core recovery and geotechnical
measurements (fracture frequencies and RQD) were recorded. The logging method included the characterization of the lithology, alteration,
and mineralized zones. Structural information was collected for all oriented structures such as veins and fractures and uploaded to MX
Deposit. The core boxes were then photographed and select intervals were temporarily removed for specific gravity measurements.
The practices and procedures followed during drilling programs conducted
on the Chinchillas property adhere to accepted industry standards and there are no factors identified that could materially impact the
reliability or accuracy of the results.
Core Sampling
SSR followed a similar drill core sampling procedure
to Golden Arrow’s, as described below.
Samples for analyses were marked at one meter intervals
in mineralized zones and two meter intervals in areas with no expected mineralization. The drill core was split using an electric diamond
core saw and sampled according to the marked intervals. Half the core was returned to the box while the other half was placed in bag in
preparation for shipping. Corresponding tags were inserted, one in the plastic sample bag and the second in the core box. Quality control
samples were inserted in sample bags and allocated in order for the laboratory to have control samples in every batch.
| | 7-5 | |
| SSR Mining Inc. | Puna Operations S-K 1300 Report | February 12, 2024 SLR Project No.: 138.21581.00003 |
Ten centimeter long samples were collected to measure
the specific gravity at intervals of three meters in the mineralized zones and at 10 m intervals in zones without significant mineralization.
After measuring specific gravity, core was returned to the original core boxes.
Each sample was labeled and inserted in a PVC bag,
and the bags were grouped in sacks containing six to ten samples. The bags were stored in the core shack, protected from weather conditions,
prior to shipment to the laboratory.
Since the late 1990s, SSR and its predecessors have drilled a total
of 925 drill holes (395 = RC and 530 = DD) totaling 228,522 m at Pirquitas as summarized in Table 7-2 and illustrated in Figure 7-2.
Table 7-2: Drilling Programs
Completed at the Pirquitas Property
| Company |
Programme Description |
Count |
Year |
Metres Drilled |
| Sunshine Argentina |
San Miguel Deposit (DD) |
46 |
Pre-2004 |
12,646 |
| Underground (DD) |
25 |
Pre-2004 |
4,285 |
| San Miguel Deposit (RC) |
170 |
Pre-2004 |
34,933 |
| SSR |
Oploca (4), Llallagua (6), Colquechaca (4) (DD) |
14 |
2005 |
3,300 |
| San Miguel (24), Cortaderas (6), San Miguel (4), Potosí (1) (DD) |
35 |
2007 |
7,723 |
| San Miguel (115), Potosí (52), Oploca (32), Cortaderas (12), Pircas (4), Médanos (10) (RC) |
225 |
2008 |
41,112 |
| San Miguel (38), Oploca (17), Veta Blanca (2), Cortaderas (4) (DD) |
61 |
2010–2011 |
12,665 |
| San Miguel (69), Cortaderas (5), Other Targets (5) (DD) |
79 |
2011 |
17,550 |
| Cortaderas (126), Médanos (1), West of Pit (9), South of Pit (4), North of Pit (2) (DD) |
142 |
2012 |
52,804 |
| Pirquitas Property (DD) |
17 |
2013 |
6,923 |
| Pirquitas Surface (16) and underground (2) (DD) |
18 |
2014 |
3,553 |
| Pirquitas Underground (DD) |
44 |
2015 |
10,961 |
| Potosi – East Extension (DD) |
15 |
2018 |
2,399 |
| Deep Granada (DD) |
3 |
2019–2020 |
3,430 |
| SSR |
Cortaderas breccia (DD) |
2 |
2022 |
1,421 |
| SSR |
Cortaderas breccia (DD) |
29 |
2023 |
12,817 |
| Total |
|
925 |
|
228,522 |
| | 7-6 | |
| SSR Mining Inc. | Puna Operations S-K 1300 Report | February 12, 2024 SLR Project No.: 138.21581.00003 |
Figure 7-2: Location of Drill
Hole Collars at the San Miguel and Cortaderas Deposits
SSR Mining Inc. Puna Operations Province of Jujuy, Argentina Location of Drill Hole Collars at the San Miguel and Cortaderas Deposits
| | 7-7 | |
| SSR Mining Inc. | Puna Operations S-K 1300 Report | February 12, 2024 SLR Project No.: 138.21581.00003 |
Initial drilling on the Pirquitas property was
conducted by Sunshine Argentina and included a total of 51,863.62 m in 241 drill holes (Table 7-2).
Sunshine Argentina completed 71 diamond drill holes
(DDH) and 170 RC holes before 2004. While coarse and fine rejects, assay certificates, and QA/QC data are unavailable, geologic descriptions
and assays of those holes are in the current database and were used to support the geological model and grade estimation if there was
no conflict with surrounding newer data.
RC and Drill Core Sampling
RC drill hole cuttings were collected and split into 30 kg to 40 kg
samples at the drill rig. A three-tier Jones-style splitter was used to split these samples. A 3 kg to 5 kg sample was sent to the relevant
analytical laboratory for sample preparation and analysis.
Drill hole core (HQ and NQ) was marked for sampling and cut in half
using a diamond saw. One half of the core was geologically logged and stored on site. The other half of the core was sent to the laboratory
for sample preparation and analysis.
A total of 2,788 underground channel samples were
collected over a total distance of 1,600 m from mineralized veins and sheeted vein systems in the San Miguel zone, as well as from
the Oploca, Potosí, Blanca, San Pedro, and Llallagua vein systems. Samples of approximately 2 kg per linear meter were chiselled
from channels.
2005-2015
The SSR (then Silver Standard) 2005 drilling program
was designed to test targets in the Oploca, Llallagua, and Colquechaca areas. The subsequent 2007 and 2008 drilling programs included
exploration drilling, resource definition drilling, drilling for metallurgical testing, and condemnation drilling. All drilling was conducted
from surface, with the majority completed by RC methods (approximately 84% of the total meterage drilled). Diamond drill holes were generally
HQ size, sequentially reducing to NQ and then BQ (36.5 mm) at depth, as needed.
Diamond drilling programs in 2010 and 2011 primarily
included resource definition drilling in and around the existing open pit (approximately 89% of the drill holes), with the remainder consisting
of exploration drill holes targeting the Cortaderas breccia zone (approximately 6% of the drill holes) and other exploration targets (e.g.,
Veta Blanca).
The following description of the drilling procedures
used on the Pirquitas deposit by Silver Standard is summarized from Board et al. (2011):
| · | Drill holes were typically drilled using HQ-size core. Drill hole core size was sequentially reduced to NQ size and then BQ size at
depth, where necessary. |
| · | All drill hole collar coordinates were surveyed in the UTM Zone 19S coordinate system (WGS84 datum). |
| · | Downhole surveys were made using a combination of single shot (DDH 072-DDH 084) and Reflex EZ-AQ l surveying instrument with readings
taken every 50 m to 100 m. Diamond and RC drilling was predominantly oriented at azimuths of 15° to 195° (i.e., perpendicular
to the predominant mineralization trend), with dips generally ranging between 45° and 70° (occasionally steeper, but rarely vertical).
These dips resulted in the drill holes intersecting the main west-northwest to east-southeast trending vertical to subvertical veins and
veinlet stockwork mineralized system at an oblique angle. |
| | 7-8 | |
| SSR Mining Inc. | Puna Operations S-K 1300 Report | February 12, 2024 SLR Project No.: 138.21581.00003 |
| · | Mineralized drill hole intersections are therefore slightly longer than true mineralization thicknesses. |
| · | Core recovery generally ranged between 95% and 100% for diamond drill holes, and sample recovery generally between 80% and 100% for
RC drill holes, except where drill holes intersected old underground workings. RC drilling was generally more successful than diamond
drilling in reaching planned end-of-drill hole depths where the drill hole passed through the underground workings. |
| · | Drilling in the Cortaderas breccia zone was at a shallow angle to the inferred dip of the mineralized body. This was necessary due
to topography, drill hole deviation, and economic considerations; to drill perpendicular to the breccia body would require setting up
shallow angle drill holes on top of a hill with intersections likely only after drilling more than 500 m, assuming the drill hole did
not deviate off target. Mineralized intersections through the Cortaderas breccia zone have therefore essentially down-dip directions. |
In 2012, most of the drilling was for resource
definition in the Cortaderas breccia zone (approximately 89% of the drill holes), with the remaining drill holes being exploration drill
holes at the pit margins.
From 2013 to 2015, SSR drilled 79 holes for a total
of 21,437 m at Pirquitas. No drilling and sampling procedure records were retained for these campaigns, however, SSR has followed the
same drilling and sampling protocols since 2005.
2018-2023
In 2018, SSR completed a drill program to test
the eastward continuation of the Potosi vein and to study whether the vein crosses the proposed ramp access for the Cortaderas breccia
located 500 m to the north. While the main two to three meter wide Potosi vein does not project into the area, there are discontinuous
thin (commonly less than one meter) veins intersected in some drill holes.
In 2019–2020, the objective of the deep Granada
three hole drill program was to test the proposed intersection between the southwest dipping Cortaderas vein breccia and the steeply north
dipping Potosi vein beneath the San Miguel pit (Figure 7-2).
Drilling in 2022 included two drill holes testing
the central portion of the Cortaderas breccia at depth and along strike to the west. This drilling expanded the known mineralization and
intersected mineralization of the Hanging-wall zone approximately 150 m south of the Cortaderas deposit.
In 2023, SSR completed a diamond drilling program
which included 29 holes. Drilling focused on the Cortaderas breccia, the Hanging-wall zone, and the North Potosi breccia beneath the northwest
section of the San Miguel pit. The cut-off date for drilling data used in the 2023 resource update was October 31, 2023. As a result,
only 23 of the 29 drill holes completed in the Cortaderas area were included in the 2023 Pirquitas resource update (DDH-400 to DDH-414,
-416, -419, -421 and DDH-424 to DDH-428).
The drilling procedures utilized by SSR between
2018 and 2023 were similar to those used in the Standard Silver drilling and are summarized as follows:
| | 7-9 | |
| SSR Mining Inc. | Puna Operations S-K 1300 Report | February 12, 2024 SLR Project No.: 138.21581.00003 |
| · | Drill holes were generally drilled using HQ size core. Drill hole core size was sequentially reduced to NQ size at depth in three
opportunities during the 2023 program. |
| · | All drill hole collar coordinates were surveyed in the UTM Zone 19S coordinate system (WGS84 datum). |
| · | All drill holes were surveyed downhole using a combination of single shot and Gyroscope Trac downhole survey tools. Downhole survey
measurements were initially collected at 25 m and then continued every 50 m. This information was transferred in digital format for inclusion
in the drilling database. Almost all of the drill holes were oriented at azimuths of 15° to 50° (i.e., perpendicular to the predominant
Cortaderas mineralization trend) and 180° to 200° (i.e., perpendicular to the predominant Hanging-wall zone mineralization trend).
The dip of all drillholes was between 50° and 80°. These dips resulted in the drill holes intersecting the main west-northwest
to east-southeast trending vertical to subvertical veins and veinlet stockwork mineralized system at an oblique angle. |
| · | Core recovery generally ranged between 95% and 100% for diamond drill holes. |
| · | Following completion of the hole, the drill pad was cleaned and a PVC tube was cemented at the drill collar with hole number, depth
and azimuth inscribed on a metal ticket. |
The practices and procedures followed during drilling programs that
were conducted on the Pirquitas property adhere to accepted industry standards and there are no factors identified that could materially
impact the reliability or accuracy of the results.
RC and Drill Core Sampling
RC cuttings amounting to approximately 40 kg for a one meter sample
were collected at the drill. Cuttings were then reduced to 1/8th of the original mass using either a three-tier Jones splitter for dry
conditions or a 16-vane rotary splitter under wet conditions. The 1/8th analytical portion was split again in two equal masses if dry,
and when wet two 1/16 samples were collected. These became the original sample submitted to the laboratory and a duplicate used routinely
to monitor precision.
Diamond drill core was measured for RQD and recovery, photographed,
and then geologically logged with sample intervals tagged and marked up with cutting lines by a geologist. A core technician then cut
the core in half along the cut line indicated and placed one contiguous half in a plastic sample bag with its corresponding original tag.
The other half of the core was returned to the box, in the same place that it came from to provide a physical reference at site if needed
for future work. Duplicate core samples were collected by quartering one of the original core halves, placing one quarter in a sample
bag with its original tag, and the other quarter in another bag with the duplicate tag.
Blanks and CRMs were inserted in sample bags and allocated such that
there was a quality control sample in every batch submitted to the laboratory.
During the 2018-2022 SSR campaigns, systematic sampling was carried
out in all holes being drilled. The methodology consisted of continuous sampling using half of the core with sample lengths commonly 100
m to 150 cm. During the 2023 campaign, samples varied between 20 cm and 170 cm depending on the nature of the mineralization. The procedure
consisted of systematic sampling with 100 cm to 107 cm spacing in the broadly mineralized zones, while in the strong mineralized zones
samples ranged from 20 cm to 100 cm. The drill core was split using an electric diamond core saw and sampled according to the marked intervals.
| | 7-10 | |
| SSR Mining Inc. | Puna Operations S-K 1300 Report | February 12, 2024 SLR Project No.: 138.21581.00003 |
This section summarizes hydrogeological information contained in OreWin
(2022). SLR was not provided with new hydrogeological information as part of its review.
The Chinchillas site is located in a caldera or bowl-like feature in
the side of the mountain range, resulting in some flow towards the bowl from the north and south as well as from the east. The bowl is
somewhat like a shallow open pit.
Groundwater discharges to topographic lows, such as the local drainage
in the deposit area depression and to the regional low elevation at the base of the range to the east and west of the Project area. Elevations
are highest along the south-southwest/north-northeast divide of the Sierras and decrease towards the east and west. Groundwater gradients
are therefore steepest towards the east and west, and groundwater is expected to generally flow in these directions following topography.
Hydrogeological data were collected during a 2015 site investigation
consisting of drill hole logs, hydraulic conductivity testing (packer tests and open-hole tests), water level observations, and drilling
circulation records. Sixteen packer tests and nine open hole falling head tests were completed in three geotechnical drillholes in the
deposit area. Hydraulic conductivity values estimated from the packer tests range from less than 1 x 10⁻⁸ m/s
to 1 x 10– 5 m/s.
The metasediments outside the caldera feature are expected to have a
relatively low hydraulic conductivity. Storage values are expected to be low, provided almost entirely by joints, fractures, bedding planes
and faults. Within approximately 300 m from the contact margins with the overlying tertiary pyroclastics, the permeability of the
metasediments increases due to the strongly fractured nature of the rock.
North-west trending faults likely provide partial barriers to groundwater
flow across the faults and enhanced flow parallel to faults. The fractured zone adjacent to the metasediments has relatively high hydraulic
conductivity, likely in excess of 1 x 10⁻⁶ m/s.
Groundwater discharges occur primarily in topographic lows, often into
stream beds. The indications from the available surface flow measurements are that groundwater discharge contributes from 1.5 L/s
to upwards of 4 L/s to stream flows at the eastern extent of the Chinchillas valley. The groundwater reporting to the pit area is
estimated to be 1.8 L/s.
Arid climatic conditions result in relatively high evapotranspiration
rates that ultimately minimize the amount of precipitation available for groundwater recharge. The variation in annual precipitation impacts
the precipitation available for groundwater recharge from one year to the next.
Recharge could vary from insignificant to approximately 50 mm per
year, depending on climatic conditions and surface materials. This is expected to result in water level increases of a few meters in wet
years, which would decrease over drier years. Smaller variations can be expected on a seasonal basis.
Currently the dewatering system consists of sumps located on the base
of the pit and discharged through a pump to a contact water pool near the facility (‘A’ Pond – contact water). This
water is used for dust control.
| | 7-11 | |
| SSR Mining Inc. | Puna Operations S-K 1300 Report | February 12, 2024 SLR Project No.: 138.21581.00003 |
Groundwater quality samples from monitoring wells immediately adjacent
to the Project area were collected in 2015 and 2016. Similar water quality parameters were observed in the groundwater to those identified
in the surface water samples discussed above.
Sample results were compared to limits specified in the Environmental
Protection for Mining Activity Law. As was noted in the surface water, exceedances were noted in the baseline condition for some metals
parameters. These variably included exceedances of the drinking water, aquatic life, irrigation, and livestock watering limits. However,
these exceedances are considered natural and represent water that drains from within and around the mineralized zone and are carefully
documented as part of the baseline monitoring program.
The current monitoring program includes one well located downstream
of the Chinchillas mine. The most recent shows water quality values are between the maximum and minimum baseline parameters.
This section summarizes geotechnical information contained in OreWin
(2022). SLR was not provided with new geotechnical analysis information as part of its review.
Review of the logging and core photos in the metasediments suggest faulting
is present. The absence of understanding of orientation is considered as a significant gap in the geotechnical studies. Owing to the lack
of knowledge on faults, there is a degree of uncertainty on interramp scale stability. OreWin (2022) recommended that MPSA consider three
boreholes in the western quadrant with use of televiewer (ATV) logging. ATV, which uses scanning of the borehole wall, is far more reliable
in providing the orientation of major structures which are typically present in recovered core as rubble zones, broken core or highly
jointed zones, which invariably cannot be orientated in oriented core as used in the PFS investigations.
Bedding in the surface mapping is moderately dipping to the southwest
(set ‘A2’) and moderately dipping to the west (set ‘B1’). This is not consistent with the provided geological
overview where bedding is steeply dipping in the metasediment and shallow dipping in the pyroclastic tuffs. As bedding has the potential
to significantly control stability of the overall slopes this discrepancy needs to be resolved.
Overall pit wall stability was addressed in the PFS study through limit
equilibrium stability analyses utilising the Hoek & Brown rock mass strength criterion. It is considered the inputs as largely appropriate.
However, caution of the following three aspects is recommended.
| · | Knight Piésold (KP) has assumed a Disturbance Factor (D value) of 0.85. This value may be appropriate near created slope faces
where blast damage may be present but is not considered appropriate for the rock mass within the pit slope. |
| · | The level of depressurization in the analyses is optimistic at the PFS stage. |
| · | The Hoek & Brown criterion is poorly suited for rocks of low intact strength such as the pyroclastic tuff. As such, the interramp
angle (IRA) in the tuff is considered marginally high and an overall angle in the order of 37° is considered more appropriate. |
The KP design parameters maintain similar berm widths in all areas and
with variation in batter angle. An alternative would be to utilise 70° batter angles in all areas and utilise 10 m wide berms in the
southwest and northwest (IRA of 49° maintained), 14 m wide berms in the south (IRA of 43° maintained), and 17 m wide
berms in the east (IRA of 39°). A haul road would reduce the overall angle in the east wall but, depending on placement, may require
revision of berm widths.
| | 7-12 | |
| SSR Mining Inc. | Puna Operations S-K 1300 Report | February 12, 2024 SLR Project No.: 138.21581.00003 |
The 2021 pit designs have not been subjected to an independent geotechnical
review and it is important that this review be carried out and the revised designs confirmed to meet the slope design criteria.
The SLR QP notes that the drilling and sampling procedures adopted at
Puna are consistent with generally recognized industry best practices. The resultant drilling pattern is sufficiently dense to interpret
the geometry and the boundaries of the mineralization with confidence. The core samples were collected by trained personnel using procedures
meeting generally accepted industry best practices. The process was conducted or supervised by suitably qualified geologists.
The SLR QP notes that the samples are representative of the source materials,
and there is no evidence that the sampling process introduced a bias. Accordingly, there are no known sampling or recovery factors that
could materially impact the accuracy and reliability of drilling results.
| | 7-13 | |
| SSR Mining Inc. | Puna Operations S-K 1300 Report | February 12, 2024 SLR Project No.: 138.21581.00003 |
| 8.0 | Sample Preparation, Analyses, and Security |
| 8.1.1 | Sample Preparation, Analysis, and Security |
Details of the sample preparation, analysis, and security procedures
for drilling programs completed at Chinchillas prior to 2018 are taken from a 2017 Technical Report (Kuchling et al., 2017). No sample
preparation and analysis details are available for the Aranlee Resources and Silex drilling programs at Chinchillas.
| 8.1.1.1 | Sample Custody and Security |
Samples bags were placed in larger sacks (between six and ten samples
per sack) and sealed. Sealing numbers were recorded in the Chain of Custody database. Prior to 2022, the sacks were shipped by private
truck to the Alex Stewart (Assayers) Argentina S.A. laboratory (Alex Stewart) in Mendoza, Argentina, where the sample preparation and
analysis were performed. Samples were received by the laboratory and the receipt was acknowledged to the company. No damage or missing
samples were reported during transportation.
In 2022, samples were sent to the ALS laboratory in Mendoza, Argentina,
where the physical preparation of the samples was performed. The majority of the analyses were carried out in the ALS laboratory in Lima,
Peru with the samples being transported by ALS via intercompany transfer.
In 2023, samples were analyzed by Alex Stewart International, with physical
preparation carried out in Palpala, Jujuy, and chemical analysis performed in Mendoza. Sample shipment between Jujuy and Mendoza was managed
by Alex Stewart following arrival in Jujuy.
| 8.1.1.2 | Sample Preparation |
Prior to 2022, samples were prepared by method P-5, which included drying
the samples at 90°C, crushing the entire sample up to 80% passing 10 mesh, splitting 1,000 g with a Jones riffle splitter, and pulverizing
to 95% passing 140 mesh. The pulverized material or pulp is then split and 200 g of pulp is sent to the laboratory (Kuchling et al., 2017;
OreWin, 2021).
In 2022, samples from Chinchillas were sent for preparation to the ALS
laboratory in Mendoza and each sample was crushed to 70% passing 2 mm mesh and a 250 g split was pulverized to better than 85% passing
75 microns (approximately 200 mesh). These pulp samples were transported to ALS in Lima for analysis using intercompany transfer.
In 2023, samples were prepared at Alex Stewart, in Palpala, Jujuy, where
each sample was crushed to 80% passing 2 mm and a 200 g split was pulverized to better than 95% passing 106 microns (approximately 140
mesh).
Prior to 2022, Alex Stewart was the primary laboratory for Chinchillas
sample analysis and ALS in Peru was used as the secondary laboratory for check samples. All samples were assayed for a suite of 39 elements
including silver, lead, and zinc by a four-acid digestion method followed by inductively coupled plasma atomic emission spectroscopy (ICP-AES)
(method ICP-MA-39). Silver assays greater than 200 ppm were re-assayed by fire assay with a gravimetric finish using a 50 g sample (method
Ag4A-50). Lead and zinc assays greater than 10,000 ppm were re-assayed by an oxidative acid digestion for ore grade material with an ICP
finish (method ICP-ORE).
| | 8-1 | |
| SSR Mining Inc. | Puna Operations S-K 1300 Report | February 12, 2024 SLR Project No.: 138.21581.00003 |
The analytical method changed between SSR’s 2022 and 2023 drilling
programs.
In 2022, samples were analyzed at ALS in Lima, Peru for a suite of 48
elements including silver, lead, and zinc by a four-acid digestion method and ICP-AES finish (ICP-MA-61 method). Silver assays above 100
ppm were reanalyzed by HF-HNO3-HClO4 digestion with HCl leaching, using a 40 g sample with an ICP-AES or atomic
absorption spectrometry (AAS) finish (method AgOG-62). Samples with silver greater than 1,500 ppm were reanalyzed by Ag-GRA21 method:
fire assay and gravimetric finish using a 30 g sample. Lead and zinc assays greater than 10,000 ppm were reanalyzed by Pb-OG62 and
Zn-OG62 respectively: four-acid digestion and ICP finish using a 0.4 g sample. Gold was analyzed by fire assay using a 30 g sample
with ICP-AES or AAS finish (method AA23).
Alex Stewart analyzed all samples from the 2023 campaign. All samples
were analyzed for 39 elements, including silver, lead, and zinc, using a four-acid digestion method and ICP-AES analysis (ICP-MA-39 method).
Silver assays above 200 ppm was reanalyzed by fire assay using a 50 g sample with a gravimetric finish (gravimetric method). Lead and
zinc assays above 10,000 ppm were reanalyzed by oxidative acid digestion for mineral grade material with an ICP finish (ICP-ORE method).
Gold was analyzed by fire assay and AAS using a 30 g sample (Au4-30 method).
Both Alex Stewart and ALS are international laboratories certified under
ISO 9001:2008, ISO 17025:2008 and ISO 14001: 2004. Alex Stewart and ALS are independent of SSR.
To determine density, drill core samples averaging 10 cm in length were
collected at approximately 10 m intervals in non-mineralized zones and three meter intervals in mineralized zones. The samples were weighed
in air and reweighed submerged in water to calculate values.
| 8.1.2 | Quality Assurance and Quality Control |
Golden Arrow established a QA/QC system for its 2012-2016 drilling programs.
The system specified the procedures for handling and sampling of drill core including logging procedures, QC sample insertion rates, and
the chain of custody between the drill and the assay laboratory. QC samples, including CRMs, coarse and fine duplicates, and blanks were
inserted into each batch in the field to monitor, respectively, the analytical accuracy, sampling precision, and potential contamination
in the laboratory.
During the Golden Arrow drill programs, a total of 3,705 QC samples
(8% of the total) were inserted.
Once SSR reinitiated exploration activities in 2022, a systematic QC
program, similar to Golden Arrow’s, was established including standard procedures for handling, sampling, logging, and the storage
of diamond drill core. Industry standard procedures were followed for the insertion rates of QC samples at the site, and a secure shipping
protocol was in place to ensure that samples were not tampered on their way to the laboratory. QC samples included CRM, duplicates, and
blanks inserted at rates to ensure that every laboratory batch contained an appropriate number of QC samples.
| | 8-2 | |
| SSR Mining Inc. | Puna Operations S-K 1300 Report | February 12, 2024 SLR Project No.: 138.21581.00003 |
Blank material was inserted into the sample stream to monitor for sample
contamination that can accidentally occur during sample preparation and analysis. These types of QC samples also provide a check against
tampering or introduction of foreign metals during transportation.
The coarse blank was created from a tuff breccia, void of silver mineralization,
but with consistent low base metal contents, collected by Golden Arrow during its first work program. Several batches of this blank were
made and inserted during the drill programs.
As this internal blank had not undergone laboratory round-robin analysis,
reference and acceptance values were determined from the statistics as more analyses were received. For a given element, the deemed acceptance
value was three times the reference value or three times a statistically determined detection limit.
In addition to coarse blanks, which monitor for contamination during
the entire sample preparation and analytical process, fine blanks were submitted to check for contamination introduced solely during analysis.
Fine blanks were comprised of pulp reject from previous drill programs
and several separate fine blanks were submitted during the GAR programs. As with the coarse material, the acceptance values were based
on a statistically determined detection limit.
During SSR’s 2022 and 2023 drill programs, 170 blanks were submitted
to monitor for contamination. The blank material was comprised of post-mineral ignimbrite (BLK-ign), commercially available coarse blank
material (BL-GR), and commercially available landscape rock comprised of white quartz (BLK QTZ LOCAL LAB).
The Chinchillas blank QA/QC program results can be summarised as follows:
| · | Golden Arrow’s coarse blank results show low failure rates of 1% for silver, lead, and zinc. The failures were largely associated
with sporadic high blank results in nine holes of Phase IV. |
| · | Golden Arrow’s fine blank results show only one failure for lead during the 2012-2016 drill programs. |
| · | The results show that all the blank materials are devoid of silver mineralization, however, there are small amounts of base metal
concentrations in the BLK-ign and BL-GR blank material. |
It is the QP’s opinion that the analytical results received from
both the Golden Arrow and SSR managed drill programs are free from any significant sample cross-contamination that could materially impact
Mineral Resource estimation.
| 8.1.2.2 | Coarse and Fine Duplicates |
During the Golden Arrow drill programs, coarse and fine duplicates were
incorporated into the QA/QC process to monitor preparation and analytical precision, respectively. A total of 575 preparation duplicates
(coarse rejects) were relabelled with a new number and reassayed at Alex Stewart.
Pulp duplicates (fine rejects) have not been summarized for the Golden
Arrow drill campaigns due to limited data availability. In the 2017 PFS (Kuchling et al., 2017), 191 analytical duplicates from Phase
V drilling are reported to have been submitted to Alex Stewart. The ranked half absolute relative difference (%HARD) value for silver
shows that just over 80% of the analytical duplicate pairs repeat within 10% of each other, which meets corporate and industry targets
for analytical precision. Previous technical disclosure by Golden Arrow for the earlier drill programs show similar results for analytical
precision.
| | 8-3 | |
| SSR Mining Inc. | Puna Operations S-K 1300 Report | February 12, 2024 SLR Project No.: 138.21581.00003 |
Figure 8-1 shows a summary of the preparation duplicates for silver,
lead, and zinc comparing the HARD% to the accumulated HARD. The HARD is calculated as the percentage of Ix1-x2I / (x1+x2). Typically,
preparation duplicates are less precise than analytical duplicates since they capture the random errors associated with sample preparation,
as well as with further sample reduction and analysis.
Precision acceptance levels for preparation duplicates require that
80% of the pairs must repeat within 20% of each other. This target is met for the base metals; however, silver shows only 73% of the pairs
within the 20% margin thus marginally less precise. The lower silver precision is likely due to the nature of the silver mineralization
but can be improved with longer sample intervals or an increased pulp mass proportion.
Figure 8-1: Ag, Pb, and Zn HARD
Plots for Preparation Duplicates at Alex Stewart during Golden Arrow Drill Programs
Source: SSR, 2023.
In 2022 and 2023, SSR submitted 258 field duplicates to monitor precision
in the sample collection, preparation, and analysis of Chinchillas exploration samples.
| | 8-4 | |
| SSR Mining Inc. | Puna Operations S-K 1300 Report | February 12, 2024 SLR Project No.: 138.21581.00003 |
Field duplicate results demonstrate that there are no statistically
significant differences between the original and duplicate samples.
The ranked HARD% plot in Figure 8-2 shows the portion of the population
of paired field duplicates that repeats within a certain percentage. For field duplicate data, the requirement is that 80% of the population
of pairs report within 30% of each other.
Figure 8-2: Field Duplicate
Precision Performance for Chinchillas 2022-2023 Drilling
Source: SSR, 2023.
The precision performance meets generally accepted industry standards
for the material collected. During SSR’s program, no preparation or analytical duplicates were collected leaving a risk of analytical
and preparation imprecision. Given that the least precise field duplicate data is well within the targeted limits, the probability of
significant (>5%) analytical or preparation bias is considered to be low.
For both the SSR and Golden Arrow managed drill programs, it is the
QP’s opinion that the analytical results received from Alex Stewart meet industry standard precision requirements and are free from
statistically significant bias.
| 8.1.2.3 | Certified Reference Materials |
For the GAR program, three CRMs (standards) were used to check the accuracy
of the main analytical laboratory. These standards were originally prepared by Acme Analytical Laboratories S.A. (Acme) in Mendoza, Argentina
at the request of Golden Arrow, from rejects of previous drill core from the Chinchillas property. CRMs CH-1 and CH-2 had low (41 ppm)
and intermediate (146 ppm) silver grades and were packaged in 30 g envelopes as they did not require a fire assay. Standard CH-3 had higher
silver content (862 ppm) and, therefore, was packaged in 120 g envelopes to accommodate the larger sample requirements of the fire assay
testing.
| | 8-5 | |
| SSR Mining Inc. | Puna Operations S-K 1300 Report | February 12, 2024 SLR Project No.: 138.21581.00003 |
A total of 954 CRMs were inserted into the sample stream during Golden
Arrow’s drilling campaigns. The analytical results from these campaigns show low failure rates of 0.9%, 3.9%, and 1.6% for silver,
lead, and zinc, respectively (Figure 8-3 and Figure 8-4).
Figure 8-3: Silver CRM
Results for Golden Arrow Drill Programs
Source: SSR, 2023.
| | 8-6 | |
| SSR Mining Inc. | Puna Operations S-K 1300 Report | February 12, 2024 SLR Project No.: 138.21581.00003 |
Figure 8-4: Zn CRM Results
for Golden Arrow Drill Programs
Source: SSR, 2023.
SSR’s drill programs in 2022 and 2023 used commercially available
standards, which were inserted into sample batches submitted to the primary laboratory, ALS in 2022 and Alex Stewart in 2023. Nine CRMs
were employed with silver, lead, and zinc grades ranging from near blank to well mineralized for a total of 389 samples; these are adequate
for the grades of mineralization present at Chinchillas. For the rare sample batches where a CRM failed for silver, lead, or zinc, the
subset of samples proximal to the failed standard was reanalyzed using the same methods. After receiving an accurate CRM value from the
secondary analysis, the new sample results replaced the failed data. Table 8-1 shows the key parameters of the material used to monitor
for accuracy during SSR’s recent programs.
| | 8-7 | |
| SSR Mining Inc. | Puna Operations S-K 1300 Report | February 12, 2024 SLR Project No.: 138.21581.00003 |
Table 8-1: Certified Reference
Material Used for the 2022 and 2023 SSR Drill Programs at Chinchillas
| StandardID |
Best Value Au (g/t) |
Au SD |
Best Value Ag (g/t) |
Ag SD |
Best Value Pb (ppm) |
Pb SD |
Best Value Zn (ppm) |
Zn SD |
| OREAS 47 |
0.0443 |
0.0025 |
0.13 |
0.019 |
284 |
10 |
226 |
14 |
| OREAS 600B |
0.204 |
0.007 |
25.1 |
1 |
119 |
4 |
404 |
14 |
| OREAS 602B |
2.29 |
0.094 |
119 |
4 |
493 |
19 |
764 |
24 |
| OREAS 603C |
4.96 |
0.186 |
294 |
13 |
10428 |
461 |
8030 |
370 |
| OREAS 607 |
0.69 |
0.024 |
5.88 |
0.189 |
209 |
13 |
259 |
9 |
| OREAS 620 |
0.685 |
0.021 |
38.5 |
1.53 |
7740 |
220 |
31500 |
970 |
| OREAS 630B* |
0.368 |
0.01 |
19.4 |
0.77 |
4221 |
140 |
11197 |
320 |
| OREAS 994 |
|
|
183 |
7 |
2250 |
80 |
6020 |
290 |
| STD PR-3 |
|
|
38 |
3.6 |
1250 |
100 |
17800 |
980 |
Source: SSR, 2023.
Note. * New silver means and standard deviations were calculated for
this CRM as the batch used differed in variance more than label indicated.
The CRM performance during SSR’s 2022 and 2023 drill programs
is shown for silver, lead, and zinc assays in Figure 8-5, Figure 8-6, and Figure 8-7, respectively.
| | 8-8 | |
| SSR Mining Inc. | Puna Operations S-K 1300 Report | February 12, 2024 SLR Project No.: 138.21581.00003 |
Figure 8-5: Silver CRM Performance
during the 2022 and 2023 SSR Drill Programs at Chinchillas
Source: SSR, 2023.
| | 8-9 | |
| SSR Mining Inc. | Puna Operations S-K 1300 Report | February 12, 2024 SLR Project No.: 138.21581.00003 |
Figure 8-6: Lead CRM Performance
during the 2022 and 2023 SSR Drill Programs at Chinchillas
Source: SSR, 2023.
| | 8-10 | |
| SSR Mining Inc. | Puna Operations S-K 1300 Report | February 12, 2024 SLR Project No.: 138.21581.00003 |
Figure 8-7: Zinc CRM Performance
during the 2022 and 2023 SSR Drill Programs at Chinchillas
Source: SSR, 2023.
For both the Golden Arrow and SSR managed drill programs, it is the
QP’s opinion that the analytical results received from Alex Stewart and ALS are accurate based on the low failure rates for submitted
CRMs for lead, zinc, and silver.
ALS was used as a secondary umpire laboratory for most of the Golden
Arrow drilling. Umpire laboratories are used to monitor for any bias that may impact the analytical process not captured by other forms
of QC sampling. For example, during the Phase V drilling, a total of 293 pulps were sent to ALS to be tested by four-acid digestion and
ICP (ME-ICP61). Samples returning greater than 1% Pb or 1% Zn were reanalyzed using ore grade methods Pb-OG62 and Zn-OG62. Samples
greater than 100 ppm Ag were reassayed by fire assay with gravimetric finish (method Ag-GRA22). ALS is part of an international laboratory
system and has ISO 9001:2008 and 17025:2005 certifications. ALS is independent of Golden Arrow and SSR.
The laboratory duplicate pairs with values close to the lower limit
of detection were removed due to the poor precision of results, leaving only the greater than 3 ppm Ag values.
| | 8-11 | |
| SSR Mining Inc. | Puna Operations S-K 1300 Report | February 12, 2024 SLR Project No.: 138.21581.00003 |
Figure 8-8 shows the mean percentage difference (MPD) of the silver,
lead, and zinc values in check samples between the primary and secondary laboratory. As these samples are pulp material, the precision
target is for 80% of the pairs to repeat within 10% of each other, which was met for Golden Arrow’s Phase V drilling.
Figure 8-8: Umpire Pulp Duplicates
from Golden Arrow Phase V Drill Program
Source: SSR 2023
Based on the QC results for blanks, duplicates, and CRMs, it is the
QP’s opinion that the assays received by both Golden Arrow and SSR are accurate, precise, and free of cross sample or other contamination.
These results can be used for Mineral Resource estimation and other studies.
| | 8-12 | |
| SSR Mining Inc. | Puna Operations S-K 1300 Report | February 12, 2024 SLR Project No.: 138.21581.00003 |
| 8.2.1 | Sample Preparation, Analyses, and Security |
The sample preparation, analysis, and security procedures used by Sunshine
Argentina and SSR in their drill campaigns at Pirquitas are based on a 2011 Technical Report (Board et al., 2011) and more recent data
supplied by SSR.
| 8.2.1.1 | Sample Custody and Security |
During Sunshine Argentina’s ownership, the analytical laboratories
took possession of the samples at the Pirquitas site, and the samples were in their custody throughout the sample preparation and analysis
steps, including sample transportation from site to the respective analytical laboratory (American Assay Laboratories (AAS) and SGS Chile).
SSR’s sampling protocol included the labeling of sample bags and
closing with a security seal. The samples were then sent to Jujuy by company truck.
During the 2018, 2019, 2022, and 2023 drilling programs, once all required
drill core intervals were cut and placed into bags, sample shipments were designed on a per drill hole basis. A batch number was assigned
to each drill hole’s group of sample bags. The sacks were shipped by private transportation to the laboratory where physical preparation
and analysis of the samples was performed. The laboratory created a work order number related to SSR’s batch number. No samples
were reported damaged or lost during transportation.
The 2022 campaign samples were sent to the ALS laboratory in Mendoza,
Argentina, where the physical preparation of the samples was performed. The majority of the analyses were carried out in the ALS laboratory
in Lima, Peru with the samples being transported by intercompany transfer.
The 2023 samples were analyzed by Alex Stewart, with the physical preparation
carried out in Palpala, Jujuy, and the chemical analysis performed in Mendoza. Sample shipment between Jujuy and Mendoza was managed by
Alex Stewart following arrival in Jujuy.
| 8.2.1.2 | Sample Preparation |
Sunshine Argentina
Sunshine Argentina’s drilling program was conducted in two phases,
with the transition being marked by a change in analytical laboratories from AAL to the SGS Chile laboratory partway through the program.
RC drill holes AR 001 to AR 092 and diamond drill holes DDH 001 to DDH 042 were analyzed by AAL; RC drill holes AR 093 to AR 164 and diamond
drill holes DDH 043 to DDH 069 were analyzed by SGS Chile.
Sample preparation procedures were similar at both analytical laboratories:
| · | Samples were initially dried for two to three hours at 105°C. |
| · | Dried samples were crushed to less than 18 mm in diameter using a jaw crusher, through to less than 2 mm to less than 0.18 mm in diameter
using a roll crusher. |
| · | A Jones-style riffle splitter was used to collect subsample splits of approximately 250 g (AAL) and 400 g (SGS Chile). |
| · | Subsample splits were pulverized in ring/disk pulverizers to less than 0.10 mm in diameter, homogenized, and packaged for analysis. |
| | 8-13 | |
| SSR Mining Inc. | Puna Operations S-K 1300 Report | February 12, 2024 SLR Project No.: 138.21581.00003 |
All coarse rejects from the AAL prepared subsample splits were stored
on-site at Pirquitas; a minimum of 0.25 kg per sample was returned for on-site storage at Pirquitas by SGS Chile. A split of each sample
pulp was also returned for on-site storage at Pirquitas.
SSR
Prior to 2012, RC and diamond drill samples were shipped to the ALS
Chemex (now ALS) analytical laboratory in Mendoza, Argentina. The following sample preparation was conducted by ALS Chemex:
| · | Samples were logged into the ALS Chemex Webtrieve sample tracking system (ALS Chemex procedure LOG-21), weighed (WEI-21), and then
dried (DRY-21). |
| · | Dried samples were crushed to between 70% and 80% passing a nominal –2 mm (CRU-31 or CRU-35) and split using a riffle splitter
(SPL-21) to produce a representative 250 g subsample for pulverization. The subsample was pulverized to better than 85% passing 75 µm
(PUL-31 or PUL-32, depending on sample size). |
Information on the specific sample preparation methods for 2012, 2018,
and 2019 is unavailable but is not expected to vary significantly from the 2011 drilling program.
In 2022, Pirquitas samples were sent to the ALS in Mendoza and each
sample was crushed to 70% passing 2 mm mesh and a 250 g split was pulverized to better than 85% passing 75 microns. In 2023, samples were
sent to Alex Stewart where each sample was crushed to 80% passing 2 mm and a 200 g split was pulverized to better than 95% passing 106
microns.
Sunshine Argentina
Sixty grams of the sample pulps were digested in aqua regia and analyzed
for silver using AAS. Samples with values higher than 500 ppm Ag were reanalyzed using fire assay methods. For tin analyses, 20 g of the
sample pulps were fused with sodium peroxide and caustic pellets to ensure the tin was completely dissolved before being analyzed by AAS.
A total of six assay laboratories were used during Sunshine Argentina’s
two drilling phases:
| · | Phase I – After sample preparation, AAL sent the samples to the Laboratorio Quimíco Guayacan Ltda. analytical laboratory
in La Serena, Chile for silver analysis, and to the AAL analytical laboratory in Santiago, Chile for tin analysis. Samples were also submitted
to the Centro de Investigación Minera y Metalúrgica (CIMM) in Santiago, Chile for check assaying of silver, and to the Instituto
de Investigaciónes Minero-Metalúrgicas in Oruro, Bolivia for check assaying of tin. |
| · | Phase II – Prepared samples were sent to the SGS Chile analytical laboratory in Quilicura, Santiago, Chile for assaying, and
to the Acme analytical laboratory in Santiago, Chile for check assaying purposes. The analytical laboratories received 60 g pulps for
silver analyses and 20 g pulps for tin analyses. |
SSR
The analytical methodology changed during SSR’s
2005–2008 drilling programs. Samples were initially analyzed using the ICP mass spectrometry (ICP-MS) method, then aqua regia digestion
followed by 36 element ICP-AES (ME-ICP41). Silver grades were found to be understated by both the ICP-MS method and, to a lesser degree,
the ICP aqua regia method. As a result, SSR elected to use four-acid digestion followed by 34 element ICP-AES (ME-ICP61a, including tin).
Over-limit Pb (>10%), Zn (>10%), and Ag (>200 ppm) grades were reanalyzed using a four-acid digestion followed by an AAS finish
(Pb, Zn, or Ag-AA62 procedures). Silver grades still over limit (>1,500 ppm) were analyzed by fire assay with a gravimetric finish
(Ag-GRA21). Additional tin analyses were conducted using AAS (Sn-AA82). All ICP-MS samples were reassayed using this method by ALS Chemex.
| | 8-14 | |
| SSR Mining Inc. | Puna Operations S-K 1300 Report | February 12, 2024 SLR Project No.: 138.21581.00003 |
Four-acid digestion followed by 34 element ICP-AES
(ME-ICP61a, including tin) was the primary analytical technique used during the 2010–2011 drilling program and all subsequent SSR
programs.
The analytical method changed between SSR’s 2022 and 2023 drilling
programs.
In 2022, samples were analyzed at ALS in Lima, Peru for a suite of 48
elements including silver, lead, and zinc by four-acid digestion and an ICP-AES finish (ICP-MA-61 method). Silver assays above 100 ppm
were reanalyzed by HF-HNO3-HClO4 digestion with HCl leaching, using a 40 g sample with an ICP-AES or atomic absorption
spectrometry (AAS) finish (method AgOG-62). Silver assays greater than 1,500 ppm were reanalyzed by Ag-GRA21 method: fire assay and gravimetric
finish using a 30 g sample. Lead and zinc assays greater than 10,000 ppm were reanalyzed by Pb-OG62 and Zn-OG62 respectively: four-acid
digestion and ICP finish using a 0.4 g sample. Gold was analyzed by fire assay using a 30 g sample with ICP-AES or AAS finish (method
AA23).
All samples in 2023 were analyzed at Alex Stewart
for 39 elements, including silver, lead, and zinc, using four-acid digestion and ICP-AES analysis (ICP-MA-39 method). Silver assays above
200 ppm were reanalyzed by fire assay with a gravimetric finish using a 50 g sample (gravimetric method). Lead and zinc values above 10,000
ppm were reanalyzed by oxidative acid digestion for mineral grade material and ICP (ICP-ORE method). Gold is analyzed by fire assay and
AAS using a 30 g sample (Au4-30 method).
Both Alex Stewart and ALS are international laboratories
certified under ISO 9001:2008, ISO 17025:2008 and ISO 14001: 2004. Alex Stewart and ALS are independent of SSR.
Sunshine Argentina’s bulk density measurements using an undisclosed
method were made for overburden (1.80 g/cm3), sedimentary rock (2.67 g/cm3), and massive sulfide (3.61 g/cm3)
confined to the Potosi breccia (Hatch, 2006). This approach continued to be used by SSR until 2013 when it was updated following grade
control and reconciliation inputs together with routine density determinations (Archimedes method) from 2012 Cortaderas drill core. This
resulted in a density-silver grade relation which was considered in all subsequent resource estimates.
For density measurements in 2018, 2019, 2022, and 2023, drill core samples
averaging 10 cm in length were collected at approximately 10 m intervals in non-mineralized zones and three meter intervals in mineralized
zones. The samples were weighed in air and reweighed submerged in water to calculate values.
| 8.2.2 | Quality Assurance and Quality Control |
| 8.2.2.1 | Sunshine Argentina |
Sunshine Argentina employed a systematic quality control program during
its core and RC drill programs conducted at Pirquitas in the late 1990s. This included the insertion of:
| | 8-15 | |
| SSR Mining Inc. | Puna Operations S-K 1300 Report | February 12, 2024 SLR Project No.: 138.21581.00003 |
| · | CRMs at a rate of 12 per 200 samples submitted to laboratories (6%, or 2,770) |
| · | Analytical (pulp) duplicates at insertion rates of 1 in 10-20 depending on the drill phase for a total of 3,235 duplicates. |
| · | Blank material comprised of coarse crushed barren rock collected 12 km east of Pirquitas inserted at a rate of 5% of the total samples
submitted. |
The QC samples monitoring accuracy showed that silver results were accurate,
falling within the accepted error range of 10% (+3.3%). At the time, tin was an element of interest and tin results were initially biased
low and contaminated during analysis. Sunshine Argentina’s entire Phase 1 (likely up to RC hole AR-093 and DDH-043) dataset was
reassayed at another laboratory passing QC tests. Precision QC results for the silver analytical duplicates demonstrated that 90% of the
pairs had a relative percent difference (RPD) of 25% which meets current requirements for analytical precision. Blank results showed low
failure rates with less than 3% of samples submitted exceeding 10 g/t Ag.
There is no QC information available for lead and zinc analyses during
Sunshine Argentina’s programs.
CRM, blank, and field duplicate control samples were inserted into the
sample stream at a one-in-twenty rate for a total of 15% of all samples submitted to ALS Chemex. Approximately 5% of the total number
of submitted original samples were sent to a third-party analytical laboratory for check assaying. The insertion protocol was the same
for both RC and core samples. QC samples included six different CRMs covering a representative range of silver, tin, and zinc grades,
blanks prepared from local barren sandstone, and field duplicates.
2005-2008
The 2005-2008 QC results showed that:
| · | After recalibrating the CRM values, it was confirmed that silver, lead, zinc, and tin assay data from the 2005 through 2008 drilling
programs are accurate. |
| · | Field blank control samples indicated that sample cross-contamination was generally not an issue during the analytical work conducted
on SSR’s 2005–2008 drilling data. |
| · | Core and RC field duplicate control samples, while indicating a degree of variability in the assay data, were reported at acceptable
levels of precision for silver, tin, and zinc, given the nugget effect (inherent variability) and the variability associated with quarter
core versus half core samples. |
The detailed performance of the field duplicates is shown in Figure
8-9.
| | 8-16 | |
| SSR Mining Inc. | Puna Operations S-K 1300 Report | February 12, 2024 SLR Project No.: 138.21581.00003 |
Figure 8-9: 2005-2008 Field
Duplicate Precision Performance for Ag, Pb, and Zn during the Drill-off at Pirquitas
Source: SSR, 2023.
2010-2013
SSR completed subsequent exploration programs in 2010 through to 2013
which implemented the same QC protocols as described above, with the exception that three new CRMs were made under the supervision of
CDN Resources Laboratories Ltd. (CDN) and certified by Smee & Associates Consulting Ltd. following round robin analysis at five independent
analytical laboratories. These were PR-1, PR-2, and PR-3 corresponding to low, medium, and high grade silver, tin, and zinc values. Figure
8-10 and Figure 8-11 show the performance of the three new CRMs for silver and zinc, respectively.
| | 8-17 | |
| SSR Mining Inc. | Puna Operations S-K 1300 Report | February 12, 2024 SLR Project No.: 138.21581.00003 |
Figure 8-10: SSR 2012 Silver
CRM Performance for Cortaderas Drilling
Source: SSR, 2023.
Figure 8-11: SSR 2012 Zinc CRM
Performance for Cortaderas Drilling
Source: SSR, 2023.
The performance of 1,560 quarter core field duplicates from the 2010-2013
Cortaderas exploration programs is shown in Figure 8-12.
| | 8-18 | |
| SSR Mining Inc. | Puna Operations S-K 1300 Report | February 12, 2024 SLR Project No.: 138.21581.00003 |
Figure 8-12: 2010-2013 Field
Duplicate Precision Performance for Ag and Zn during Cortaderas Exploration Programs
Source: SSR, 2023.
The 2012 program included the insertion of 553 blanks as coarse crush
quartz material into the sample stream from the drilling at Cortaderas. There were five recorded over-limit (>5 g/t Ag) results that
equate to a 0.9% failure rate."
The 2010-2013 QC results for CRMs, duplicates, and blanks confirm that
the analytical data for silver, zinc, and tin are accurate, precise (within acceptable levels of variance), and free from contamination
introduced during sample preparation.
2022-2023
In 2022 and 2023, exploration activities resumed at Pirquitas focusing
on the Cortaderas deposit. QC sample protocols remained the same as those used in earlier programs.
SSR’s drill programs for 2022 and 2023 used commercially available
standards that were inserted in the sample batches submitted to the primary laboratory, ALS in 2022 and Alex Stewart in 2023. Seven separate
CRMs were employed with silver, lead, and zinc grades ranging from near blank to well mineralized for a total of 288 samples; these are
adequate for the grades of mineralization present at Cortaderas. Table 8-2 shows the key parameters of the material used to monitor
for accuracy during SSR’s 2022-2023 programs.
| | 8-19 | |
| SSR Mining Inc. | Puna Operations S-K 1300 Report | February 12, 2024 SLR Project No.: 138.21581.00003 |
Table 8-2: CRM Parameters Used
for Accuracy Monitoring for Cortaderas Drilling (2022-2023)
| Standard ID |
Best Value Au (g/t) |
Au SD |
Best Value Ag (g/t) |
Ag SD |
Best Value Pb (ppm) |
Pb SD |
Best Value Zn (ppm) |
Zn SD |
| OREAS47 |
0.0443 |
0.0025 |
0.13 |
0.019 |
284 |
10 |
226 |
14 |
| OREAS994 |
|
|
183 |
7 |
2,250 |
80 |
6,020 |
290 |
| OREAS630B* |
0.358 |
0.013 |
19 |
0.53 |
4,110 |
180 |
11,100 |
250 |
| OREAS603C |
4.96 |
0.186 |
294 |
13 |
10,428 |
461 |
8,030 |
370 |
| OREAS607 |
0.69 |
0.024 |
5.88 |
0.189 |
209 |
13 |
259 |
9 |
| OREAS620 |
0.685 |
0.021 |
38.5 |
1.53 |
7,740 |
220 |
31,500 |
970 |
| OREAS602B |
2.29 |
0.094 |
119 |
4 |
493 |
19 |
764 |
24 |
Source: SSR, 2023.
Note. * New silver means and standard deviations were determined for
this CRM as the batch used differed in variance more than the label indicated.
The CRM performance for SSR’s 2022 and 2023 drill programs at
Cortaderas are shown for silver and zinc assays in Figure 8-13 and Figure 8-14, respectively. Silver shows three, or 1%, failures
and zinc shows no failures.
| | 8-20 | |
| SSR Mining Inc. | Puna Operations S-K 1300 Report | February 12, 2024 SLR Project No.: 138.21581.00003 |
Figure 8-13: Silver CRM Performance
for Cortaderas Drilling 2022-2023
Source: SSR, 2023.
| | 8-21 | |
| SSR Mining Inc. | Puna Operations S-K 1300 Report | February 12, 2024 SLR Project No.: 138.21581.00003 |
Figure 8-14: Zinc CRM Performance
for Cortaderas 2022-2023 Drilling
Source: SSR, 2023.
Gold and lead CRMs performed well, with no samples returning results
outside of the lower and upper failure criteria.
Precision requirements are for 80% of the 154 field duplicate pairs
to repeat within 30% of each other. A ranked HARD plot showing field duplicate precision performance during the 2022-2023 drill programs
at Cortaderas is presented in Figure 8-15. All elements of interest met the threshold.
| | 8-22 | |
| SSR Mining Inc. | Puna Operations S-K 1300 Report | February 12, 2024 SLR Project No.: 138.21581.00003 |
Figure 8-15: Field Duplicate
Precision Performance for the 2022-2023 Cortaderas Drilling
Source: SSR, 2023.
To monitor for contamination during sample preparation, 245 blanks were
inserted into the sample stream sent to the primary laboratories. Blank material was commercially available landscaping rock comprised
of crushed quartz and was devoid of gold, silver, lead, and zinc. Figure 8-16 and Figure 8-17 show the results for silver and
zinc, respectively.
| | 8-23 | |
| SSR Mining Inc. | Puna Operations S-K 1300 Report | February 12, 2024 SLR Project No.: 138.21581.00003 |
Figure 8-16: Silver Blank Performance
for 2022-2023 Cortaderas Drilling
Source: SSR, 2023.
| | 8-24 | |
| SSR Mining Inc. | Puna Operations S-K 1300 Report | February 12, 2024 SLR Project No.: 138.21581.00003 |
Figure 8-17: Zinc Blank Performance
for 2022-2023 Cortaderas Drilling
Source: SSR, 2023.
Based on the Cortaderas QC results for CRMs, duplicates, and blanks,
it is the QP’s opinion that the assays received by SSR are accurate, precise, and free from cross sample or other contamination.
These results can be used for Mineral Resource estimation and other studies.
In the SLR QP’s opinion, the sample preparation,
security, and analytical procedures meet industry standards for data quality and integrity. There are no factors related to sampling or
sample preparation that would materially impact the accuracy or reliability of the samples or assay results of the remaining Mineral Resources.
The QA/QC indicates that the assay results are within acceptable levels of accuracy and precision and the resulting database is acceptable
to support Mineral Resource estimation and classification.
| | 8-25 | |
| SSR Mining Inc. | Puna Operations S-K 1300 Report | February 12, 2024 SLR Project No.: 138.21581.00003 |
During the site visit carried out in November 2023, SLR reviewed mine
outcrops (bench faces) with the main mineralization, stocks, and blast hole sampling. No drill rigs were on site. Core samples, and coarse
and pulp rejects are stored in the Pirquitas facility.
| 9.1.1 | Collar Coordinate Validation |
The description of collar coordinate validation is largely based on
OreWin (2021).
To validate collar elevation data at Chinchillas, elevations from differential
GPS field surveys were compared against the satellite photo digital elevation model (DEM). Precision of the differential GPS is between
15 cm and 70 cm.
SLR observed that the collar locations are very close to the original
topographic surface or are between that surface and the current mine surface.
Drill hole collar locations at Pirquitas were validated
by SSR with an independent surveyor for a 2011 resource modeling study.
During a modelling update in 2013, it became apparent
that there was a discrepancy in some pre-2009 holes in the form of displacement of mineralized vein intervals relative to the vein interpretation
and grade control data.
A thorough investigation was undertaken, and similar
issues were identified in 96 drill holes. Efforts were made to identify the possible source of the issue, however, the age of the data
and the inability to resurvey the collars due to their location in mined-out areas made this unachievable. To remedy the issue in the
modelling, the collar locations of the affected holes were adjusted to bring the vein intercept into the expected location, making it
consistent with observations in the surrounding holes.
SLR observed no such discrepancies in the Cortaderas
area. Additional drilling should be considered to double-check vein locations in the areas affected by these holes.
Using a handheld GPS, SLR checked the collar coordinates,
azimuth, and dip at the collars of the DDH-256, DDH342, DDH-399, DDH400, and DDH 406 holes. Just minor differences were observed.
| 9.1.2 | Downhole Survey Validation |
The downhole survey data were validated by searching
for large discrepancies between the dip and azimuth readings for neighboring intervals. No significant discrepancies were found.
Before the beginning of Phase III drilling at Chinchillas,
it was noted that the correction of the magnetic declination between true north and magnetic north was incorrect, and the angle had the
opposite direction. For this reason, all azimuths of Phase I and II drill holes were corrected by 13° counterclockwise. No other adjustments
were necessary for the other drilling phases (OreWin, 2021).
| | 9-1 | |
| SSR Mining Inc. | Puna Operations S-K 1300 Report | February 12, 2024 SLR Project No.: 138.21581.00003 |
SLR did not find obvious down the hole issues on
cross sections and three dimensional (3D) views.
To validate the Chinchillas data, the following
checks were performed for previous Mineral Resource estimates and confirmed by the SLR QP:
| · | The maximum depth of samples was checked against hole depth. |
| · | The highest silver values and at least one random value from each drill hole were checked against the
original assay certificate. |
| · | Checks were made to make sure that the units were all converted from ppm into percent (%) for lead and
zinc values. |
| · | Silex drill hole assay data were validated as reported in Davis et al., 2013. |
| · | The assay data from 15 randomly selected drill holes, representing approximately 5% of the Chinchillas database, was manually compared
to the original assay certificates. These holes contained a total of 1,890 individual samples, in which eight samples were found to have
a different second decimal value. In the SLR QP’s opinion, differences of this nature have no material impact on the estimation
of Mineral Resources and the database is sound and free of errors. |
| · | SLR visually reviewed the mineralized intervals of the CHN-22-366, CHN-22-374, and CHN-23-418 holes and found good correlation between
the assays in the database and the core. |
For Pirquitas, approximately 10% of the pre-2010
drilling assay data set was checked and compared to the original assay certificates, to generate additional confidence in this data. Detailed
checks of assay data from the 2010–2011 drilling program were undertaken, with iterative corrections made for any anomalies (generally
typographic errors, including mis-labelled samples and mis-labelled sample intervals) (OreWin, 2021).
| 9.1.4 | Geological Data Verification |
Geological data verification was carried out for
Chinchillas in 2017 (Kuchling et al., 2017) and is summarized below.
While several geology variables were captured during
core logging, only lithology was used to constrain the Chinchillas Mineral Resources estimation. Therefore, geology data verification
was limited to determining that the lithology designation was correct in each sample interval. This included the following checks:
| · | FROM – TO intervals for gaps, overlaps, and duplicated intervals; |
| · | Collar and SampleID mismatches; |
| · | A geological legend provided by Golden Arrow was compared to the values logged in the database. Data were examined on screen for discrepancies
in logging. |
| | 9-2 | |
| SSR Mining Inc. | Puna Operations S-K 1300 Report | February 12, 2024 SLR Project No.: 138.21581.00003 |
SLR reviewed the support documentation and found no inconsistencies
between data.
For the current Mineral Resource estimate, SLR visually reviewed the
logs of the DDH406, DDH-399, CHN-22-366, CHN-22-374, and CHN-23-418 holes and found a good correlation between the database records and
the rock type, veins/veinlets, mineralized intervals, and structures in the core.
A review of the Chinchillas QA/QC protocols was
conducted prior to drilling and formalized in a detailed QA/QC manual developed by Golden Arrow. On-site reviews were conducted during
all drilling phases by a QP. The procedures for core processing and the insertion of blanks and standards were examined and considered
appropriate.
At Pirquitas, QA/QC information for all exploration
drilling programs was analyzed. Review of real-time QA/QC data monitoring was undertaken by SSR, especially timing and effectiveness of
remedial action taken with respect to failed batches.
SLR reviewed the available control sample results
of all campaigns since 2005 and agreed with SSR’s observations.
The SLR QP is of the opinion that the Chinchillas
and Pirquitas databases are maintained to a level in line with industry standards and are adequate for the purposes of Mineral Resource
estimation and classification.
| | 9-3 | |
| SSR Mining Inc. | Puna Operations S-K 1300 Report | February 12, 2024 SLR Project No.: 138.21581.00003 |
| 10.0 | Mineral Processing and Metallurgical Testing |
| 10.1 | Process Plant Performance |
The process plant has continued to improve performance after starting
to process Chinchillas ore in 2018. These improvements have included better understanding of the flotation response of the ore, improved
operating and maintenance practices, and a change of the cyclones in the grinding circuit. These changes have seen improvement from the
nominal 4,000 tpd capacity to up to up to 5,000 tpd achieved between 2021 and 2023.
Table 10-1 summarizes mill feed tonnage and
grade, with recovery and production for metals in concentrate. The concentrates are clean and not subject to penalties for deleterious
element contents.
Table 10-1: Mill Production
Summary 2018 to 2023
| |
Unit |
2018 |
2019 |
2020 |
2021 |
2022 |
2023 |
| Ore Milled |
kt |
1,420 |
1,393 |
1,118 |
1,643 |
1,638 |
1,728 |
| Ag Feed |
g/t |
114 |
184 |
164 |
158 |
165 |
181 |
| Zn feed |
% |
0.84 |
0.54 |
0.51 |
0.57 |
0.49 |
0.34 |
| Pb Feed |
% |
0.85 |
0.89 |
0.77 |
1.12 |
1.23 |
1.27 |
| Silver Recovery |
% |
72.1 |
93.2 |
94.6 |
95.8 |
95.4 |
96.3 |
| Zinc Recovery |
% |
39.3 |
49.2 |
55.5 |
65.6 |
45.7 |
54.6 |
| Lead Recovery |
% |
82.6 |
85.8 |
90.2 |
93.0 |
92.2 |
94.3 |
| Silver Produced |
koz |
3,747 |
7,674 |
5,581 |
8,010 |
8,397 |
9,688 |
| Zinc Produced |
klb |
8,775 |
8,392 |
6,988 |
13,641 |
8,583 |
7,127 |
| Lead Produced |
klb |
3,107 |
23,958 |
17,193 |
37,695 |
41,004 |
45,772 |
Notes:
| 1. | Silver production and recovery is inclusive of both concentrates |
| 10.2 | Metallurgical Performance Estimates |
Metallurgical performance estimates are derived
from historical processing plant data. In late 2023, regression equations were generated for metal recovery and concentrate production.
This was done to provide a way to estimate the NSR value of ore feed, modeled blocks, or drill hole intervals. The NSR value calculation
requires the mass pull and grades of the two concentrate products and is described in Section 12.4. Previous regression analyses were
typically conducted on six-month increments of mill datasets. These regression analyses typically used linear or quadratic fits to the
data. For the latest analyses, a larger dataset from June 2020 through September 2023 was used. Parameters were restricted to the feed
grades of silver, lead, and zinc, and the resulting equations could reference the modelled parameters, and all could be expressed as a
function of the feed grades (Table 10-2 and Table 10-3).
| | 10-1 | |
| SSR Mining Inc. | Puna Operations S-K 1300 Report | February 12, 2024 SLR Project No.: 138.21581.00003 |
Table 10-2: Lead Concentrate
Regression Equations
| Parameter |
Equation |
| Lead Con – Mass Pull |
|
| Lead Con – Pb Recovery |
|
| Lead Con – Ag Recovery |
|
| Lead Con – Zn Recovery |
|
Note:
| 1. | Pb, Zn, and Ag are head grades in % or g/t, and Pb_MassPull is calculated from the lead concentrate mass pull equation. |
Table 10-3: Zinc Concentrate
Regression Equations
| Parameter |
Equation |
| Zinc Con – Mass Pull |
|
| Zinc Con – Zn Recovery |
|
| Zinc Con – Ag Recovery |
|
| Zinc Con – Pb Recovery |
|
Notes:
| 1. | Pb, Zn, and Ag are head grades in % or g/t, Pb_MassPull and Zn_MassPull are calculated from the mass pull equations in these tables,
and PbTail, PbAgTail, PbZnTail are tails grades in the lead concentrate in % or g/t, and ZnZnRec,
and ZnAgRec are recoveries to the zinc concentrate in %. |
The two mass pull regression relationships have good R2 values
of 0.96 and 0.85 for lead and zinc concentrate, respectively. The lead concentrate recoveries for lead and silver, and the zinc concentrate
recoveries for zinc and silver have acceptable relationships that align with the core of the plant data over the period for which the
data was used for the analysis. Overall, the alignment of the regression-equation-calculated NSR with the actual plant data NSR is excellent,
as shown in Figure 10-5. The value drivers are mass pull, lead concentrate lead grade, and lead concentrate silver grade, all of which
have good regression equation fits with the data.
| | 10-2 | |
| SSR Mining Inc. | Puna Operations S-K 1300 Report | February 12, 2024 SLR Project No.: 138.21581.00003 |
Figure 10-1: Pb Con Mass Pull
– Function of Mill Feed Grade Pb (%)
Figure 10-2: Pb Con Lead Recovery
– Function of Mill Feed Grade Pb (%)
| | 10-3 | |
| SSR Mining Inc. | Puna Operations S-K 1300 Report | February 12, 2024 SLR Project No.: 138.21581.00003 |
Figure 10-3: Pb Con Silver Recovery
– Function of Mill Feed Grade Pb & Zn + Mass Pull
Figure 10-4: Zn Con Mass Pull
– Function of Mill Feed Grade Zn (%) + Pb Con Mass Pull
| | 10-4 | |
| SSR Mining Inc. | Puna Operations S-K 1300 Report | February 12, 2024 SLR Project No.: 138.21581.00003 |
Figure 10-5: Regression Equation
NSR Calculation vs. Actual Ore Value
The SLR QP is of the opinion that the mass pull and recovery relationships
derived from the historical processing data described above are adequate for the purposes of estimating future concentrate production
and metal recoveries from Chinchillas ore similar to that processed in the past. The QP is not aware of any deleterious elements that
would significantly affect the value of the concentrates.
The recovery of the Pirquitas resource is based on regression equations
for the plant recoveries during the time Pirquitas ore was run. The recovery equations are based on the feed grades of silver and zinc
and are non-linear, power equation models. For the average grade in the Measured + Indicated Resource, 300.9 g/t Ag and 5.85% Zn, the
predicted recoveries are 82.7% Ag and 53.7% Zn.
| | 10-5 | |
| SSR Mining Inc. | Puna Operations S-K 1300 Report | February 12, 2024 SLR Project No.: 138.21581.00003 |
Table 10-4: Pirquitas Metallurgical
Recovery Estimates
| Parameter |
Equation |
| Silver Recovery |
|
| Zinc Recovery |
|
Note:
| 2. | Zn and Ag are head grades in % or g/t |
| 10.3 | Chinchillas Test Work |
The metallurgical development of Chinchillas ore
types commenced in 2013 and continued through 2023. The first test work campaign was focused on silver recovery by both leaching and flotation
methods, with flotation proving to be superior. The second program continued process development of flotation into separate lead/silver
and zinc concentrates, demonstrating the ability to produce salable lead and zinc concentrates in locked-cycle flotation tests. The third
testwork campaign was designed to advance the flotation process and test the main Chinchillas ore type with the Pirquitas mill flowsheet.
The fourth test project generated flotation tails for a tailing thickening study; this was the first test that showed effective flotation
with the use of sodium cyanide (NaCN). The fifth test program reintroduced Socavon samples to be blended with Chinchillas. Finally, the
latest test campaign wrapped up in 2023, which further tested the Socavon and Melina targets; this test work split the flowsheets based
on the zinc to lead ratio.
| 10.3.1 | Initial Test Work – 2013 |
A scoping metallurgical test program was initiated
in January 2013 and concluded in May 2013. This test work was undertaken by Inspectorate Exploration & Mining Services Ltd –
Metallurgical Division (Inspectorate, 2013). Sample composites from Socavon (SOC), Silver Mantos (MAN), and Chinchillas Basement (CHI)
were assembled and then subjected to leaching with sodium cyanide and thiosulfate. Head assays for the 2013 test work composites are listed
in Table 10-5.
After poor results from the direct leaching, a
set of bulk rougher and cleaner flotation tests were performed on each composite. A basic four-stage bulk rougher utilized a lead collector
in the first two stages, no collector in stage three, and a zinc collector in the last stage; no depressants were used. The results of
the rougher flotation (at the mid-point grind size) are shown in Table 10-6. Grind versus recovery trials were also performed showing
grind size insensitivity between 70 μm and 130 μm.
The cleaner flotation followed a similar flowsheet,
but the concentrate from the first three stages were subjected to a two-stage cleaning without regrinding. Overall, the flotation testing
showed positive results with silver recovery between 89% and 92%, lead recovery from 90% to 97%, and zinc recovery from 43% to 72% (Table
10-7).
| | 10-6 | |
| SSR Mining Inc. | Puna Operations S-K 1300 Report | February 12, 2024 SLR Project No.: 138.21581.00003 |
Table 10-5: Head Assays (2013
Met Testing)
| Element |
Unit |
CHI |
SOC |
MAN |
| Silver |
g/t |
115.7 |
54.8 |
152.7 |
| Lead |
% |
0.82 |
1.11 |
0.50 |
| Zinc |
% |
0.91 |
2.59 |
0.36 |
Table 10-6: Rougher Flotation
Recovery at 110 μm (2013 Met Testing)
| Element |
Unit |
CHI |
SOC |
MAN |
| Silver |
% |
95.3 |
97.0 |
98.9 |
| Lead |
% |
97.7 |
98.1 |
97.1 |
| Zinc |
% |
66.0 |
85.7 |
96.1 |
Table 10-7: Cleaner Flotation
Recovery at 110 μm (2013 Met Testing)
| Element |
Unit |
CHI |
SOC |
MAN |
| Silver |
% |
90.4 |
89.3 |
92.0 |
| Lead |
% |
96.7 |
97.2 |
90.6 |
| Zinc |
% |
43.2 |
72.5 |
55.7 |
| 10.3.2 | Second Phase Testing – 2014 |
The second test program, also conducted by Inspectorate
(Inspectorate, 2014), added three further composites, and expanded on the flotation work conducted in the first phase. The goal of this
test work was to build a flowsheet that could generate separate lead and zinc concentrates for sale. Sequential flotation utilized a zinc
depressant and separate lead and zinc collectors. A single trial was conducted comparing sodium metabisulfite (SMBS) and zinc sulfate
(ZnSO4) as the zinc depressant, concluding that SMBS was superior. SMBS was used for all other tests in this program.
In the first stage of this test work, sequential
rougher flotation was performed on the samples from the 2013 program. A nominal grind size of 100 μm was used. Results can be seen
in Table 10-8. In general, good separation of the lead and zinc is achieved, with the high zinc content of the Socavon sample presenting
the largest difficulty.
Table 10-8: Sequential Rougher
Flotation Recovery (2014 Met Testing)
| Element |
Unit |
CHI |
SOC |
MAN |
| Pb Con |
Zn Con |
Pb Con |
Zn Con |
Pb Con |
Zn Con |
| Silver |
% |
80.9 |
18.5 |
62.7 |
34.3 |
96.3 |
3.2 |
| Lead |
% |
70.8 |
|
66.9 |
|
97.1 |
|
| Zinc |
% |
|
91.5 |
|
79.0 |
|
68.7 |
Notes:
| 1. | Lead is only payable in Pb Concentrate, Zinc is only payable in Zn Concentrate, Silver is payable in both concentrates. |
| | 10-7 | |
| SSR Mining Inc. | Puna Operations S-K 1300 Report | February 12, 2024 SLR Project No.: 138.21581.00003 |
The next stage was to conduct rougher-cleaner flotation,
utilizing a regrind of the rougher concentrate. The cleaner flotation was again generally successful at separating lead and zinc into
separate concentrates, as well as producing a grade suitable for sale. Recovery results can be seen in Table 10-9. The CHI composite
shows anomalous results in this stage; a repeat analysis with a higher mass pull gives similar recovery values. The regrind step for all
composites exceeded the 74 μm target, with the average result down to 25 μm.
Table 10-9: Sequential Cleaner
Flotation Recovery (2014 Met Testing)
| Element |
Unit |
CHI |
SOC |
MAN |
| Pb Con |
Zn Con |
Pb Con |
Zn Con |
Pb Con |
Zn Con |
| Silver |
% |
52.3 |
24.8 |
70.7 |
16.8 |
85.9 |
8.3 |
| Lead |
% |
12.5 |
|
78.1 |
|
89.9 |
|
| Zinc |
% |
|
87.8 |
|
87.2 |
|
74.1 |
Next, three fresh composites were introduced: Chinchillas
Basement (BAS-1), Silver Mantos (MAN-2), and Socavon (SOC-2). Head assays for the new composites are shown in Table 10-10. The first
rougher test on BAS-1 exhibited the same issues seen in CHI in the last stage. After adjusting the grind size, reducing SMBS addition,
and increasing the collector dose, the lead and silver recovery in the lead concentrates increased to acceptable levels. The BAS-1 composite
again showed issues when the testing moved to the cleaner. The causes in further testing were overgrinding the feed and too low a collector
dose. The recovery results for the best test run on each composite are shown in Table 10-11. Again, all tests showed very fine material
reporting to the concentrate.
Table 10-10: Head Assays (2014
Met Testing)
| Element |
Unit |
BAS-1 |
SOC-2 |
MAN-2 |
| Silver |
g/t |
150.6 |
94.2 |
116.5 |
| Lead |
% |
2.19 |
1.37 |
0.66 |
| Zinc |
% |
1.04 |
2.39 |
0.07 |
Table 10-11: Sequential Cleaner
Flotation Recovery (2014 Met Testing – New Composites)
| Element |
Unit |
BAS-1 |
SOC-2 |
MAN-2 |
| Pb Con |
Zn Con |
Pb Con |
Zn Con |
Pb Con |
Zn Con |
| Silver |
% |
84.5 |
2.9 |
85.8 |
3.1 |
89.3 |
1.8 |
| Lead |
% |
77.5 |
|
91.4 |
|
94.9 |
|
| Zinc |
% |
|
75.4 |
|
60.6 |
|
43.5 |
| | 10-8 | |
| SSR Mining Inc. | Puna Operations S-K 1300 Report | February 12, 2024 SLR Project No.: 138.21581.00003 |
The final stage of this test program was a locked-cycle
flotation trial on each of the fresh composites. A locked-cycle test attempts to simulate steady-state conditions by manually recycling
flotation tails in the various stages and adding fresh feed. The general sample flow is shown in Figure 10-6. Each composite used
the best reagent dosages and conditions found in the rougher and cleaner trials. All three composites achieved better than 93% silver
and 96% lead recovery in the lead concentrate. The BAS-1 and SOC-2 composites gave 85% zinc recovery in the zinc concentrate and MAN-2
had a very low zinc feed grade. All results for payable metals are shown in Table 10-12.
Figure 10-6: Inspectorate Locked-Cycle
Test Flowsheet
Table 10-12: Locked-Cycle Flotation
Recovery (2014 Met Testing – New Composites)
| Element |
Unit |
BAS-1 |
SOC-2 |
MAN-2 |
| Pb Con |
Zn Con |
Pb Con |
Zn Con |
Pb Con |
Zn Con |
| Silver |
% |
96.1 |
3.4 |
93.4 |
4.9 |
94.6 |
2.3 |
| Lead |
% |
96.3 |
|
97.0 |
|
97.5 |
|
| Zinc |
% |
|
84.7 |
|
86.0 |
|
20.3 |
To assist with future metallurgical development, mineralogical analysis
was undertaken on the three ore types (BAS, MAN, and SOC) and two flotation test work concentrates (BAS lead second cleaner concentrate
and lead scavenger concentrate generated during one of the flotation tests).
The report concluded:
“The three composites assayed 100–150 g/t
silver and 0.6% to 2.2% lead. Freibergite was the dominant silver bearing mineral, constituting over 75% of the total feed silver. The
remaining silver was contained in pyrargyrite, stephanite and tetrahedrite. The lead was mostly contained in galena.
| | 10-9 | |
| SSR Mining Inc. | Puna Operations S-K 1300 Report | February 12, 2024 SLR Project No.: 138.21581.00003 |
The three composites also assayed 70–300 g/t
copper and 130–330 g/t arsenic. The copper was predominantly carried by freibergite and chalcopyrite.
The arsenic was mostly carried by arsenopyrite and krutovite”.
The objective of this second phase flotation test work was to produce
sequential lead/silver and zinc concentrates. This was successful with high recoveries achieved of the target metals to marketable quality
concentrates. The mineralogical analysis highlighted that the lead was contained in galena, and the silver was contained in the very typical
series of silver sulfosalt minerals.
| 10.3.3 | Third Phase Testing – 2015/2016 |
The 2016 flotation testing program was developed
to determine the compatibility of Chinchillas mineralization types to the Pirquitas process plant flowsheet and capacity. Test work included
comminution and focused on producing lead/silver and zinc concentrates by sequential flotation. In addition, a comparison between the
flotation reagent scheme used in the historical test work programs and the current Pirquitas scheme was undertaken. The test work was
completed at ALS Metallurgy, Kamloops, British Columbia, Canada.
A total of 15 variability samples were blended
to create four master composites (MC), based on lithology and iron to sulfur ratios. The locations of the drill holes from which intervals
were selected are shown in Figure 10-7; the 2023 EOY topography and LOM pit shell are used in the image. A summary of the head assays
is shown in Table 10-13.
Table 10-13: Head Assays (2015
Met Testing)
| Product |
Cu
(%) |
Pb
(%) |
Zn
(%) |
Fe
(%) |
Ag
(g/t) |
S
(%) |
S(s)
(%) |
Fe:S |
| Manto High MC |
0.015 |
0.31 |
0.16 |
7.1 |
204 |
0.24 |
0.23 |
29.6 |
| Basement High MC |
0.017 |
0.61 |
0.31 |
5.2 |
164 |
0.37 |
0.33 |
14.1 |
| Basement Low MC |
0.034 |
1.77 |
0.44 |
3.8 |
241 |
0.86 |
0.81 |
4.4 |
| Manto Low MC |
0.036 |
0.81 |
1.02 |
4.0 |
253 |
0.81 |
0.77 |
4.9 |
| CGA-32 Basement-High |
0.020 |
0.18 |
0.18 |
5.4 |
202 |
0.24 |
0.21 |
22.5 |
| CGA-35 Manto-High |
0.021 |
0.43 |
0.14 |
6.6 |
374 |
0.21 |
0.19 |
31.4 |
| CGA-35 Manto Low |
0.045 |
1.98 |
0.41 |
3.6 |
1050 |
0.72 |
0.70 |
5.0 |
| CGA-40 Manto-High |
0.016 |
0.24 |
0.24 |
7.1 |
80 |
0.23 |
0.20 |
30.9 |
| CGA-40 Manto-Low |
0.004 |
0.07 |
0.38 |
7.6 |
14 |
5.26 |
5.24 |
1.4 |
| CGA-46 Basement-High |
0.009 |
0.69 |
0.26 |
5.4 |
112 |
0.35 |
0.34 |
15.4 |
| CGA-47 Manto Low |
0.068 |
0.71 |
<0.01 |
4.4 |
214 |
0.34 |
0.30 |
12.9 |
| CGA-77 Basement-High |
0.013 |
0.29 |
0.63 |
6.4 |
114 |
0.42 |
0.39 |
15.2 |
| CGA-77 Basement-Low |
0.038 |
2.21 |
0.46 |
3.0 |
212 |
0.88 |
0.84 |
3.4 |
| CGA-80 Manto-High |
0.008 |
0.17 |
0.13 |
6.7 |
136 |
0.27 |
0.25 |
24.8 |
| CGA-89 Basement Low |
0.012 |
0.54 |
1.29 |
4.8 |
114 |
0.91 |
0.85 |
5.3 |
| CGA-90 Basement Low |
0.022 |
1.77 |
0.84 |
5.0 |
240 |
1.10 |
1.07 |
4.5 |
| CGA-90 Basement High |
0.014 |
1.27 |
0.08 |
3.3 |
150 |
0.38 |
0.36 |
8.7 |
| CGA-122 Basement Low |
0.032 |
1.24 |
0.05 |
3.2 |
288 |
0.62 |
0.57 |
5.2 |
| CGA-153 Manto Low |
0.013 |
0.52 |
1.54 |
4.3 |
82 |
0.98 |
0.95 |
4.4 |
| | 10-10 | |
| SSR Mining Inc. | Puna Operations S-K 1300 Report | February 12, 2024 SLR Project No.: 138.21581.00003 |
Figure 10-7: Metallurgical Sample
Locations (2015 Met Testing)
SSR Mining Inc. Puna Operations Province of Jujuy, Argentina Metallurgical Sample Locations within Two Pit Shells
| | 10-11 | |
| SSR Mining Inc. | Puna Operations S-K 1300 Report | February 12, 2024 SLR Project No.: 138.21581.00003 |
Communition test work was performed on three samples.
Bond ball mill work indices ranged from 11.5 kWh/t to 16.2 kWh/t, which would be considered soft to medium hardness for ball milling.
Results are presented in Table 10-14. For comparison, the Pirquitas plant design was 15.2 kWh/t.
Table 10-14: Bond Ball Mill
Work Index Results
| Composite |
Work Index
(kWh/t) |
|
| Basement Low MC |
11.5 |
|
| CGA-89 Manto High |
15.5 |
|
| Manto Low MC |
16.2 |
|
| 10.3.3.2 | Master Composite Rougher Flotation |
The previous metallurgical program in 2013 utilized
a flotation reagent scheme quite different from the standard Pirquitas flotation reagent scheme. The initial series of batch sequential
rougher flotation tests were performed on the four master composites testing these two alternate reagent schemes.
Primary grind was maintained in the target P80
size range of 120 µm to 160 µm, consistent with both previous test work and Pirquitas operating experience on similar
ore types.
The Pirquitas reagent scheme recovered more silver
to the lead concentrate (Table 10-15). For Basement Low and High samples, the increase in silver recovery to the lead/silver concentrates
was 3.6% and 11.8%, respectively. For Manto Low and High, the increase in silver recovery to the lead/silver concentrates was 19.6% and
28.7%, respectively. Therefore, the Pirquitas reagent scheme was used for all subsequent flotation testing (both batch rougher/cleaner
and locked-cycle work).
Table 10-15: Sequential Rougher
Flotation Recovery (2015 Met Testing – Master Composites)
| Element |
Unit |
Basement High |
Basement Low |
Manto High |
Manto Low |
| Pb Con |
Zn Con |
Pb Con |
Zn Con |
Pb Con |
Zn Con |
Pb Con |
Zn Con |
| Silver |
% |
96.9 |
1.9 |
81.7 |
17.5 |
87.5 |
10.9 |
66.0 |
32.0 |
| Lead |
% |
92.9 |
|
97.8 |
|
92.0 |
|
95.2 |
|
| Zinc |
% |
|
76.6 |
|
84.5 |
|
79.0 |
|
87.0 |
Notes:
| 1. | Lead is only payable in Pb concentrate, zinc is only payable in Zn concentrate, silver is payable in both concentrates. |
| 10.3.3.3 | Master Composite Rougher/Cleaner Flotation |
For each of the four master composites, a rougher/regrind/cleaner
test was completed, yielding separate lead and zinc concentrates. For all master composites, a high lead grade lead concentrate was produced,
with the contained silver grade varying directly with the lead to silver proportion in the heads. Open circuit cleaning recovery was good.
For the very low zinc grade Manto High composite, no zinc flotation was attempted. The remaining three master composites produced marketable
zinc concentrates (Table 10-16).
| | 10-12 | |
| SSR Mining Inc. | Puna Operations S-K 1300 Report | February 12, 2024 SLR Project No.: 138.21581.00003 |
Table 10-16: Sequential Cleaner
Flotation Recovery (2015 Met Testing – Master Comps)
| Element |
Unit |
Basement High |
Basement Low |
Manto High |
Manto Low |
| Pb Con |
Zn Con |
Pb Con |
Zn Con |
Pb Con |
Zn Con |
Pb Con |
Zn Con |
| Silver |
% |
82.0 |
2.5 |
80.2 |
16.1 |
79.8 |
N/A |
82.9 |
5.7 |
| Lead |
% |
90.3 |
|
94.4 |
|
87.8 |
|
87.4 |
|
| Zinc |
% |
|
83.2 |
|
82.2 |
|
N/A |
|
84.7 |
Notes:
| 1. | Lead is only payable in Pb concentrate, zinc is only payable in Zn concentrate, silver is payable in both concentrates. |
| 2. | Manto High MC does not have a Zn concentrate. |
| 10.3.3.4 | Master Composite Locked-Cycle Flotation |
A locked-cycle flotation test was performed on
each master composite, employing the same conditions developed in the cleaner tests. The ALS Metallurgy flowsheet for locked-cycle tests
(Figure 10-8) differs from the Inspectorate version, mainly with regard to the path of the 1st cleaner tails and the lack
of presence of a scavenger setup. The Inspectorate flowsheet does match the Pirquitas plant setup more closely, but either flowsheet is
a valid method for bench-scale testing.
Figure 10-8: ALS Locked-Cycle
Test Flowsheet
Good performance was measured with the four master
composites (Table 10-17). On average, the lead circuit recovered approximately 92% of the lead in the flotation feed to a lead concentrate
grading approximately 67% lead. Silver was approximately 70% recovered to the lead concentrate grading approximately 1.7% silver. For
the zinc circuit, on average, an additional 26% of the silver was recovered and graded approximately 0.5% silver, and approximately 91%
of the zinc in the flotation feed was recovered to a zinc concentrate with an average grade of 47% zinc.
| | 10-13 | |
| SSR Mining Inc. | Puna Operations S-K 1300 Report | February 12, 2024 SLR Project No.: 138.21581.00003 |
Table 10-17: Locked-Cycle Flotation
Recovery (2015 Met Testing – Master Composites)
| Element |
Unit |
Basement High |
Basement Low |
Manto High |
Manto Low |
| Pb Con |
Zn Con |
Pb Con |
Zn Con |
Pb Con |
Zn Con |
Pb Con |
Zn Con |
| Silver |
% |
63.6 |
34.2 |
80.6 |
18.2 |
67.9 |
N/A |
71.6 |
25.4 |
| Lead |
% |
91.3 |
|
95.8 |
|
86.7 |
|
94.0 |
|
| Zinc |
% |
|
91.0 |
|
88.9 |
|
N/A |
|
92.3 |
Notes:
| 1. | Lead is only payable in Pb concentrate, zinc is only payable in Zn concentrate, silver is payable in both concentrates. |
| 2. | Manto High MC does not have a Zn concentrate. |
| 10.3.3.5 | Variability Composite Rougher/Cleaner Flotation |
For each of the variability composites, a rougher/cleaner
flotation test was completed to assess the effect of head grade variation on metal recoveries and cleaner concentrate grades (Table 10-18).
Pirquitas’ operating experience has demonstrated
difficulty in achieving a marketable grade zinc concentrate when zinc feed grades are below 0.4% Zn. For the Chinchillas variability test
work, no zinc flotation was completed for any composite with a head grade below 0.2% Zn.
As with lead/silver flotation, there is generally
consistent flotation performance between the master and the variability composites.
Table 10-18: Variability Cleaner
Flotation Average Recovery (2015 Met Testing)
| Element |
Unit |
Basement High |
Basement Low |
Manto High |
Manto Low |
| Pb Con |
Zn Con |
Pb Con |
Zn Con |
Pb Con |
Zn Con |
Pb Con |
Zn Con |
| Silver |
% |
59.2 |
30.1 |
79.9 |
13.0 |
66.1 |
33.9 |
67.7 |
22.4 |
| Lead |
% |
83.1 |
|
92.0 |
|
85.8 |
|
90.6 |
|
| Zinc |
% |
|
86.6 |
|
84.2 |
|
86.5 |
|
85.9 |
| 10.3.4 | Fourth Phase Testing – Thickening - 2016 |
| 10.3.4.1 | Tailings Generation |
In 2016, ALS Metallurgy, Kamloops, British Columbia,
conducted a test program to generate tailings material for disposal trials. Four samples were taken from the 2015/2016 test program: CGA-47
Manto Low, CGA-90 Basement High, Manto Low MC, and CGA-77 Basement Low. These were subjected to a lead only and sequential regrind cleaner
flotation flowsheet as determined by their optimal flowsheet in the previous testing (Figure 10-9). This test program discarded the
use of NaCN as a depressant for zinc in the lead circuit. Though the recovery data is not directly comparable to the previous testing
due to the single stage of cleaning, the analysis of the rougher tails from each circuit shows a clear improvement in this round of testing.
The recovery results are summarized in Table 10-19.
| | 10-14 | |
| SSR Mining Inc. | Puna Operations S-K 1300 Report | February 12, 2024 SLR Project No.: 138.21581.00003 |
Table 10-19: Cleaner Flotation
Recovery (2016 Met Testing)
| Element |
Unit |
CGA-47 ML |
CGA-90 BH |
Manto Low MC |
CGA-77 BL |
| Pb Con |
Pb Con |
Pb Con |
Zn Con |
Pb Con |
Zn Con |
| Silver |
% |
97.2 |
92.9 |
90.8 |
2.4 |
97.2 |
1.6 |
| Lead |
% |
98.1 |
98.4 |
95.8 |
|
99.1 |
|
| Zinc |
% |
|
|
|
53.4 |
|
52.5 |
Notes:
| 1. | Lead is only payable in Pb concentrate, zinc is only payable in Zn concentrate, silver is payable in both. |
Figure 10-9: Cleaner Flotation
Flowsheet (2016 Met Testing)
| 10.3.4.2 | Tailings Disposal Testing |
The tailings samples from the generation test work
were shipped to TAKRAF Canada Inc. (TAKRAF), in Burnaby, British Columbia, Canada for a tailings thickening study. The scope of the work
was to determine the operational parameters to produce either a paste or dry-stackable product and compare those to the existing tailings
treatment. The test program included flocculant selection, settling tests, optimum dilution tests, flocculant dose tests, compaction tests,
rheology, and rise rate or thickener loading selection. Additionally, pressure filtration tests were conducted to evaluate the possibility
of filtering the existing thickener underflow.
The report (Tenova Delkor, 2015) concluded:
“Paste Thickening
We selected a 22m Paste Thickener with 5m tank wall
and a floor slope of 30 degrees. The drive model SR160K-4 is designed to
operate a yield stress of 150 Pa. The final underflow density of 67% solids is achievable and can possibly go up to 69.8% solids. To
maintain a stable thickener operation we recommend a feed dilution of <12% solids, a flocculant dose of 25 g/t Kemira A100HMW or
its equivalent, a rise rate less than 4.9 m3/m2/h and six (6) hours retention time.
| | 10-15 | |
| SSR Mining Inc. | Puna Operations S-K 1300 Report | February 12, 2024 SLR Project No.: 138.21581.00003 |
Pressure Filtration
Dry stackable tailings is possible using two (2) units
of Fluid Actuated Screw Technology (F.A.S.T.) Filter presses model F.A.S.T. FP 2000/96/60/12/M15/A (2000mm plate, 96 chambers, 60mm chamber
depth, 12 bar feeding pressure, mixed membrane, 15 bars squeezing pressure, Opening all at once). The achievable cake moisture is 16%
if membrane squeeze is applied and 18% moisture if membrane squeeze is not applied. The estimated total cycle time is 18.4 minutes.”
| 10.3.5 | Fifth Phase Testing – Socavon and Chinchillas - 2018 |
| 10.3.5.1 | Sample Composites |
In 2018, ALS Metallurgy, Kamloops, British Columbia conducted flotation
test work on Socavon and Chinchillas composites. Two new composite samples were generated from Socavon core samples CGA-66 and CGA-326,
respectively labeled as “A” and “D”. These samples were low grade silver and generally had more zinc than lead.
The “A” sample also assayed higher PbOx than previous test programs, which could complicate flotation. Finally, a composite
of Chinchillas ores from the 2015/2016 test program was generated using the four master composite samples. Head assays are shown in Table
10-20. The purpose of this test work was to determine if ore from the Socavon deposit was amenable to treatment in the Pirquitas plant
flowsheet and if blending with Chinchillas ore was a viable way to process it.
Table 10-20: Head Assays (2018
Met Testing)
| Product |
Cu
(%) |
Pb
(%) |
PbOx
(%) |
Zn
(%) |
Fe
(%) |
Ag
(g/t) |
S
(%) |
S(s)
(%) |
Fe:S |
| Composite “A” |
<0.001 |
0.56 |
0.11 |
0.56 |
5.2 |
16 |
1.27 |
1.19 |
4.37 |
| Composite “B” |
<0.001 |
0.78 |
0.05 |
1.78 |
5.8 |
34 |
4.43 |
4.43 |
1.31 |
| Chinchillas MC |
0.029 |
0.96 |
0.02 |
0.76 |
3.9 |
190 |
0.73 |
0.56 |
6.94 |
Sequential rougher flotation was performed on the
two Socavon composites using several zinc depressant conditions to optimize the lead to zinc separation. The major constraint was the
prohibition of sodium cyanide as a reagent for environmental permits. The first set was conducted with a normal dose of ZnSO4,
the next with an elevated dose of ZnSO4, and the third with SMBS instead of ZnSO4. The increased ZnSO4
dosage reduced the mass pull to both composites, increasing the concentrate grade but at the expense of slightly lower overall recovery.
The SMBS addition performed similarly to ZnSO4 in composite “A”, but markedly worse in composite “B”.
None of the reagents were successful at depressing the zinc away from the lead concentrate.
Next, a set of cleaner flotation tests were performed
on all three composites. Composite “A” was able to produce salable concentrate grades, but at low mass pull, reducing the
value of the ore. Composite “B” had higher mass pull but did not have a sufficient lead grade to make a salable concentrate.
Both of these samples are hampered by the very low head grades, especially silver. The higher grade master composite of Chinchillas ore
is able to make satisfactory concentrates.
| | 10-16 | |
| SSR Mining Inc. | Puna Operations S-K 1300 Report | February 12, 2024 SLR Project No.: 138.21581.00003 |
Finally, a set of cleaner flotation tests were
performed by blending each Socavon composite with the Chinchillas master composite in 25%/50%/75% proportions to see the effect of blending.
For composite “A”, salable concentrate grades were produced from each blend; recovery of each metal and the mass pull increased
in line with the proportion. For composite “B”, the blends of 25% and 50% master composite were not able to make a viable
lead concentrate, while the 75% blend was successful. In all cases where two viable concentrates were made, the value of the blend was
higher than the linear addition of the two individual values. Results for the lead concentrates are presented in Table 10-21 and Table
10-22.
Table 10-21: Pb Concentrate
for Composite "A" Blends
| Blend |
Mass Pull |
Pb Rec
|
Ag Rec |
Pb Grade |
Ag Grade |
| 0% MC / 100% Comp “A” |
0.6 |
70.6 |
86.9 |
55.3 |
2,000 |
| 25% MC / 75% Comp “A” |
0.8 |
77.6 |
86.4 |
63.8 |
6,770 |
| 50% MC / 50% Comp “A” |
1.0 |
82.6 |
89.7 |
66.3 |
10,800 |
| 75% MC / 25% Comp “A” |
1.3 |
89.7 |
92.6 |
64.3 |
11,600 |
| 100% MC / 0% Comp “A” |
1.6 |
94.0 |
91.6 |
59.7 |
10,803 |
Table 10-22: Pb Concentrate
for Composite "B" Blends
| Blend |
Mass Pull |
Pb Rec
|
Ag Rec |
Pb Grade |
Ag Grade |
| 0% MC / 100% Comp “B” |
2.3 |
86.9 |
82.7 |
30.0 |
1,110
|
| 25% MC / 75% Comp “B” |
2.3 |
87.7 |
91.2 |
30.3 |
2,870 |
| 50% MC / 50% Comp “B” |
1.9 |
90.8 |
88.3 |
40.7 |
4,920 |
| 75% MC / 25% Comp “B” |
1.6 |
92.3 |
90.0 |
58.6 |
8,870 |
| 100% MC / 0% Comp “B” |
1.6 |
94.0 |
91.6 |
59.7 |
10,803 |
| 10.3.6 | Sixth Phase Testing – Socavon and Melina - 2023 |
| 10.3.6.1 | Sample Composites |
In the latest metallurgical testing program for
Chinchillas (ALS, 2023), nine composites were generated from five core holes in the Socavon and North Rim (Melina) domains. Two master
composites were created based on the lead to zinc ratio; the highest and lowest grade samples were excluded from the master composites.
This was shown to be the determining factor for reagent usage: samples with a lead to zinc ratio less than 1.0 typically required NaCN
to make salable concentrates as the zinc would report to the lead concentrate, diluting the value. The samples from this program were
of much higher grade than those from the 2018 program and are considered ore-grade. Head assays are shown in Table 10-23.
Table 10-23: Head Assays (2023
Met Testing)
| Product |
Cu
(%) |
Pb
(%) |
Zn
(%) |
Fe
(%) |
Ag
(g/t) |
S
(%) |
S(s)
(%) |
Fe:S |
Pb:Zn |
| Comp 1 |
0.010 |
1.62 |
2.67 |
5.0 |
66 |
5.43 |
5.39 |
0.92 |
0.61 |
| Comp 2 |
0.003 |
1.80 |
1.81 |
6.1 |
68 |
7.37 |
7.32 |
0.83 |
0.99 |
| Comp 3 |
0.230 |
2.53 |
4.40 |
8.5 |
195 |
8.87 |
8.79 |
0.96 |
0.58 |
| Comp 4 |
0.002 |
0.41 |
0.99 |
7.2 |
18 |
3.04 |
3.01 |
2.37 |
0.41 |
| Comp 5 |
0.013 |
3.62 |
1.28 |
3.5 |
203 |
1.59 |
1.57 |
2.20 |
2.83 |
| | 10-17 | |
| SSR Mining Inc. | Puna Operations S-K 1300 Report | February 12, 2024 SLR Project No.: 138.21581.00003 |
| Product |
Cu
(%) |
Pb
(%) |
Zn
(%) |
Fe
(%) |
Ag
(g/t) |
S
(%) |
S(s)
(%) |
Fe:S |
Pb:Zn |
| Comp 6 |
0.059 |
0.16 |
1.27 |
3.5 |
92 |
0.83 |
0.80 |
4.22 |
0.13 |
| Comp 7 |
0.300 |
1.31 |
0.11 |
4.5 |
156 |
1.10 |
1.06 |
4.09 |
11.91 |
| Comp 8 |
0.004 |
1.32 |
0.15 |
6.8 |
69 |
0.23 |
0.21 |
29.57 |
8.80 |
| Comp 9 |
0.013 |
5.75 |
6.55 |
3.5 |
335 |
7.54 |
7.51 |
0.46 |
0.88 |
| Pb-Rich MC |
0.110 |
2.03 |
0.54 |
4.9 |
140 |
0.99 |
0.95 |
4.95 |
3.76 |
| Zn-Rich MC |
0.074 |
1.33 |
2.42 |
5.4 |
96 |
5.29 |
5.21 |
1.02 |
0.55 |
The first stage of testing was a set of sequential
rougher flotations on each composite. The standard flowsheet and reagent dosage from the previous test programs was used, a three-stage
lead rougher with ZnSO4 followed by a two-stage zinc rougher with CuSO4. None of the rougher tests involved the
use of sodium cyanide. After the first round of testing, four composites with higher zinc content were rerun with a higher dose of ZnSO4.
For the two composites with the highest zinc feed grade, the higher dose was effective at improving selectivity.
For the next stage, several rounds of cleaner tests
were conducted on each composite and the two master composites. For the first round, multi-stage cleaning was performed without a regrind
step. In the next round, variations for each composite included the addition of NaCN, regrind steps, and removing the lead or zinc rougher
stages. The test matrix is presented in Table 10-24.
Table 10-24: Cleaner Flotation
Test Matrix (2023 Met Testing)
| Test # |
Comp # |
ZnSO4 |
NaCN |
Pb Circuit |
Zn Circuit |
Pb Regrind P80 |
Zn Regrind P80 |
| 14 |
Comp 1 |
60 |
0 |
Yes |
Yes |
- |
- |
| 24 |
Comp 1 |
90 |
30 |
Yes |
Yes |
25 |
39 |
| 15 |
Comp 2 |
60 |
0 |
Yes |
Yes |
- |
- |
| 26 |
Comp 2 |
60 |
20 |
Yes |
Yes |
20 |
36 |
| 16 |
Comp 3 |
200 |
0 |
Yes |
Yes |
- |
- |
| 25 |
Comp 3 |
90 |
30 |
Yes |
Yes |
31 |
51 |
| 17 |
Comp 4 |
60 |
0 |
Yes |
Yes |
- |
- |
| 18 |
Comp 5 |
60 |
0 |
Yes |
Yes |
- |
- |
| 27 |
Comp 5 |
60 |
20 |
Yes |
Yes |
13 |
17 |
| 31 |
Comp 5 |
60 |
20 |
Yes |
Yes |
- |
17 |
| 19 |
Comp 6 |
60 |
0 |
Yes |
Yes |
- |
- |
| 23 |
Comp 6 |
- |
- |
No |
Yes |
- |
- |
| 20 |
Comp 7 |
60 |
0 |
Yes |
Yes |
- |
- |
| 28 |
Comp 7 |
60 |
20 |
Yes |
No |
20 |
- |
| | 10-18 | |
| SSR Mining Inc. | Puna Operations S-K 1300 Report | February 12, 2024 SLR Project No.: 138.21581.00003 |
| Test # |
Comp # |
ZnSO4 |
NaCN |
Pb Circuit |
Zn Circuit |
Pb Regrind P80 |
Zn Regrind P80 |
| 21 |
Comp 8 |
60 |
0 |
Yes |
Yes |
- |
- |
| 22 |
Comp 9 |
200 |
0 |
Yes |
Yes |
- |
- |
| 29 |
Comp 9 |
200 |
0 |
Yes |
Yes |
45 |
47 |
| 30 |
Comp 9 |
60 |
30 |
Yes |
Yes |
38 |
54 |
| 32 |
Pb-Rich |
60 |
0 |
Yes |
No |
14 |
- |
| 33 |
Pb-Rich |
60 |
0 |
Yes |
Yes |
20 |
12 |
| 34 |
Zn-Rich |
60 |
20 |
Yes |
Yes |
24 |
39 |
The final stage of this program was a sequential
locked-cycle test on each master composite, using the best conditions from the cleaner test work. Both master composites made salable
concentrates with good recoveries (Table 10-25). Throughout this test program, the value of each product was run through the NSR
calculator to compare alternatives (see Section 12.4 for the NSR calculation). The NSR value for the Pb-Rich and Zn-Rich locked-cycle
test products were $112.04 and $106.21, respectively.
Table 10-25: Locked-Cycle Flotation
Recovery (2023 Met Testing)
| Element |
Unit |
Pb-Rich MC |
Zn-Rich Pb |
| Pb Con |
Zn Con |
Pb Con |
Zn Con |
| Silver |
% |
92.6 |
2.8 |
83.4 |
7.3 |
| Lead |
% |
85.6 |
|
84.1 |
|
| Zinc |
% |
|
53.1 |
|
87.4 |
| Mass Pull |
% |
3.1 |
0.7 |
2.0 |
4.1 |
Notes:
| 1. | Lead is only payable in Pb concentrate, zinc is only payable in Zn concentrate, silver is payable in both concentrates. |
| 10.3.6.3 | Concentrate Minor Element Analysis |
The lead and zinc concentrates produced from the
final cycle of the locked-cycle tests with the Pb-Rich composite (Test 35) and the Zn-Rich composite (Test 36) were also assayed for a
series of minor elements using four-acid digestion. Antimony, bismuth, and copper in the lead concentrate, as well as cadmium and lead
in the zinc concentrate, may incur penalties.
Mineralogy analysis was carried out on each of
the four lithologies present: Socavon Tuff, Socavon Basement, North Rim Tuff, and North Rim Basement (Table 10-26). The samples were
ground to 120 μm and assessed using QEMSCAN Bulk Mineral Analysis with Liberation estimation (BMAL), presented for galena and
sphalerite in Figure 10-10. Some conclusions from mineralogical analyses are as follows:
| | 10-19 | |
| SSR Mining Inc. | Puna Operations S-K 1300 Report | February 12, 2024 SLR Project No.: 138.21581.00003 |
| · | Tuff samples have much more pyrite. Pyrite does not carry any metal value and simply serves to dilute the concentrate grades. ZnSO4
and NaCN will both depress pyrite from the lead concentrate. However, 10% of the galena is associated with pyrite so there will be lead
losses due to this association. |
| · | North Rim Basement has a significant portion as copper sulfides. Copper sulfides recover into the lead concentrate, again diluting
the grades. Copper does have the potential as a payable metal if it can be identified and segregated in advance of processing. |
| · | Socavon Basement has the best liberation of galena, above 80%, however, it has the highest assay for mica. Mica has a tendency to
float readily in high mass pull conditions, such as the rougher cells. Efficient cleaning is necessary to minimize total mass pull. |
| · | Sphalerite liberation is typically poor, between 35% and 70%. The rest is associated primarily with non-sulfide gangue. The gangue
minerals are unlikely to float and this accounts the average zinc recovery in the 50% range. |
Table 10-26: Mineralogy Analysis
(2023 Met Testing)
| Minerals |
Socavon Basement |
North Rim Basement |
North Rim Tuff |
Socavon Tuff |
| Sizing (μm P80) |
126 |
122 |
128 |
119 |
| Silver Minerals |
<0.1 |
0.1 |
<0.1 |
<0.1 |
| Copper Sulfides |
<0.1 |
0.7 |
<0.1 |
0.1 |
| Galena |
4.2 |
1.1 |
2.9 |
2.0 |
| Lead Oxides |
0.1 |
0.1 |
<0.1 |
0.1 |
| Sphalerite |
1.7 |
0.2 |
3.9 |
4.3 |
| Pyrite |
0.5 |
0.6 |
2.0 |
8.2 |
| Iron Oxides |
3.8 |
6.8 |
7.4 |
6.1 |
| Quartz |
47.3 |
62.3 |
52.0 |
43.6 |
| Micas |
30.4 |
19.8 |
24.2 |
31.1 |
| Feldspars |
4.8 |
4.0 |
3.1 |
2.8 |
| Kandite Group |
1.4 |
0.8 |
2.2 |
0.3 |
| Chlorite |
5.0 |
2.9 |
1.3 |
0.8 |
| Others |
0.7 |
0.7 |
0.8 |
0.6 |
| | 10-20 | |
| SSR Mining Inc. | Puna Operations S-K 1300 Report | February 12, 2024 SLR Project No.: 138.21581.00003 |
Figure 10-10: Mineral Liberation
(2023 Met Testing)
The SLR QP is of the opinion that the data derived from the
historical information presented is adequate for predicting future plant throughput and recovery. Concentrates produced from Socavon
and Melina ores may incur penalties for antimony, bismuth, and copper in the lead concentrate, and cadmium and lead in the zinc
concentrate. The QP is not aware of any other deleterious elements that would affect
recovery or any reason why throughput should not continue at its current rate.
| | 10-21 | |
| SSR Mining Inc. | Puna Operations S-K 1300 Report | February 12, 2024 SLR Project No.: 138.21581.00003 |
| 11.0 | Mineral Resource Estimates |
The Mineral Resource estimate was prepared by SSR’s consultant
Red Pennant Geoscience Consulting (Red Pennant) of British Columbia, Canada and audited and accepted by SLR for this TRS. The Mineral
Resources have been estimated in accordance with generally accepted industry guidelines and are reported in accordance with S-K 1300.
Mineral Resources are reported exclusive of Mineral Reserves. Mineral Resources that are not Mineral Reserves do not have demonstrated
economic viability.
The database and block models were supplied to SLR by SSR and included
geological and block models as a Leapfrog project, PowerPoint presentations summarizing the main parameters and assumptions used to estimate
Mineral Resources, previous Mineral Resource estimates (OreWin, 2022b), and Microsoft (MS) Excel spreadsheets with NSR parameters and
resource tables.
The Chinchillas Mineral Resource estimate is contained within a pit
shell generated using an NSR cut-off value of $37.91/t. The Pirquitas Mineral Resources estimate is contained within underground mining
shapes using an NSR cut-off value of $110/t. The cut-off values are based on metal prices of $22.00/oz for silver, $0.95/lb lead, and
$1.15/lb for zinc.
Table 11-1 summarizes the Puna Mineral estimates, metallurgical recoveries
and, NSR cutoffs.
o
At an effective date of December 31, 2023, Chinchillas total Measured and Indicated Mineral Resources, exclusive of Mineral Reserves,
are estimated to be 8.83 Mt at average grades of 112.1 g/t Ag, 1.01% Pb, and 0.43% Zn containing 31.82 Moz of silver, 196.2 Mlb of lead,
and 83.8 Mlb of zinc, including:
| · | 8.47 Mt of in situ Measured and Indicated Mineral Resources grading 113.8 g/t Ag, 1.03% Pb, and 0.42% Zn. |
| · | 0.36 Mt at average grades of 70.0 g/t Ag (0.8 Moz), 0.51% Pb (4.0 Mlb), and 0.58% Zn (4.6 Mlb) in low grade stockpile. |
In addition, Chinchillas Inferred Mineral Resources are estimated to
be 1.51 Mt at average grades of 93.5 g/t Ag, 0.72% Pb, and 0.45% Zn containing 4.54 Moz of silver, 24.0 Mlb of lead, and 15.0 Mlb of zinc.
Table 11-10 summarizes the Chinchillas Mineral Resource estimate.
At an effective date of December 31, 2023, Pirquitas total Measured
and Indicated Mineral Resources, exclusive of Mineral Reserves, are estimated to be 2.48 Mt at average grades of 300.9 g/t Ag and 5.85%
Zn containing 23.99 Moz of silver and 320 Mlb of zinc. Additionally, Pirquitas Inferred Mineral Resources are estimated to be 1.32 Mt
at an average grade of 194.9 g/t Ag and 7.28% Zn containing 8.3 Moz of silver and 212 Mlb of zinc. Table 11-16 summarizes the Pirquitas
Mineral Resource estimate.
Table 11-1 summarizes the Chinchillas and Pirquitas Mineral Resource
estimate.
| | 11-1 | |
| SSR Mining Inc. | Puna Operations S-K 1300 Report | February 12, 2024 SLR Project No.: 138.21581.00003 |
Table 11-1: Summary of Puna
Mineral Resource Estimates – December 31, 2023
| Deposit |
Measured Mineral Resources |
Indicated Mineral Resources |
Measured + Indicated Mineral Resources |
Inferred Mineral Resources |
Rec |
NSR Cut-off Values |
| Amount |
Grade |
Amount |
Grade |
Amount |
Grade |
Amount |
Grade |
| Ag |
(kt) |
(g/t Ag) |
(kt) |
(g/t Ag) |
(Kt) |
(g/t Ag) |
(kt) |
(g/t Ag) |
(%) |
($/t) |
| Chinchillas |
1,856 |
116.4 |
6,974 |
110.9 |
8,830 |
112.1 |
1,509 |
93.5 |
95.5 |
37.91 |
| Pirquitas |
1,259 |
349.9 |
1,221 |
250.4 |
2,480 |
300.9 |
1,320 |
194.9 |
82.7 |
110 |
| Total |
3,115 |
210.8 |
8,196 |
131.7 |
11,310 |
153.5 |
2,830 |
140.8 |
82.7 – 95.5 |
37.91 – 110 |
| Pb |
(kt) |
(% Pb) |
(kt) |
(% Pb) |
(Kt) |
(% Pb) |
(kt) |
(% Pb) |
(%) |
($/t) |
| Chinchillas |
1,856 |
1.06 |
6,974 |
0.99 |
8,830 |
1.01 |
1,509 |
0.72 |
92.1 |
37.91 |
| Total |
1,856 |
1.06 |
6,974 |
0.99 |
8,830 |
1.01 |
1,509 |
0.72 |
92.1 |
37.91 |
| Zn |
(kt) |
(% Zn) |
(kt) |
(% Zn) |
(Kt) |
(% Zn) |
(kt) |
(% Zn) |
(%) |
($/t) |
| Chinchillas |
1,856 |
0.29 |
6,974 |
0.47 |
8,830 |
0.43 |
1,509 |
0.45 |
55.0 |
37.91 |
| Pirquitas |
1,259 |
6.46 |
1,221 |
5.22 |
2,480 |
5.85 |
1,320 |
7.28 |
53.7 |
110 |
| Total |
3,115 |
2.78 |
8,196 |
1.18 |
11,310 |
1.62 |
2,830 |
3.64 |
53.7 – 55.0 |
37.91 – 110 |
Notes:
| 1. | The Chinchillas and Pirquitas Mineral Resource estimate was reported in accordance with S-K 1300. |
| 2. | Mineral Resources are reported based on December 31, 2023 topography surface. |
| 3. | The Mineral Resource estimates are based on metal price assumptions of $22.00/oz silver, $0.95/lb lead, and $1.15/lb zinc. |
| 4. | The Chinchillas Mineral Resources are contained within a pit shell generated using an NSR cut-off value of $37.91/t. The Pirquitas
Mineral Resources estimate is contained within underground mining shapes based on a $110/t NSR cut-off value. |
| 5. | The Chinchillas Mineral Resources are contained within: |
| a. | the resource pit shell generated using an NSR cut-off value of $37.91/t, |
| b. | the reserve pit shell using an NSR cut-off value between $37.91/t and $48.97/t, |
| c. | additionally, a low grade stockpile with an NSR cut-off value between $37.91 and $48.97/t. |
| 2. | Metallurgical recoveries vary with grade and average recoveries are: 82.7% - 95.5% silver, 92.1% lead, and 53.7% - 55% zinc. There
is no Pb recovery in Pirquitas. |
| 6. | Mineral Resources are reported exclusive of Mineral Reserves. There are no Mineral Reserves at Pirquitas. |
| 7. | SSR has 100% ownership of the Project. |
| 8. | Ounces reported represent troy ounces; g/t represents grams per metric tonne, and lb represents pounds. |
| 9. | Totals may vary due to rounding. |
The SLR QP is of the opinion that with consideration of the recommendations
summarized in Sections 1 and 23 of this TRS, any issues relating to all relevant technical and economic factors likely to influence the
prospect of economic extraction can be resolved with further work.
| | 11-2 | |
| SSR Mining Inc. | Puna Operations S-K 1300 Report | February 12, 2024 SLR Project No.: 138.21581.00003 |
The Chinchillas Mineral Resource estimate was updated by independent
consultant company Red Pennant. The SLR QP has reviewed and accepted the estimate for use in this TRS. The Chinchillas Mineral Resources
have been estimated in accordance with generally accepted industry guidelines and are reported in accordance with S-K 1300. Mineral Resources
that are not Mineral Reserves do not have demonstrated economic viability.
The cut-off date of the Chinchillas drill hole database is September
30, 2023. The effective date of the Mineral Resources is December 31, 2023.
The previous Mineral Resources estimate for the Chinchillas property
had an effective date of December 31, 2021 and is described in OreWin (2022b).
The database available at the time of the resource modeling comprised
a total of 446 diamond drill holes for 73,890 m. Of this total, 433 holes were used in the Mineral Resource estimate, with 425 (68,075
m) with assay data.
The spatial distribution of the Chinchillas drilling is shown in Figure
11-1.
The database comprises collar, survey, assay, density, and logs tables
including lithology.
There are a total of 53,827 assays in the database. Assay results below
the detection limit were assigned values equal to one half of the detection limit.
Assay sample intervals ranged from 0.1 m to 10 m, with 78% being one
meter long and 19% being two meters long.
Diamond drill core recovery averages 96%. Recoveries do not vary significantly
between rock types (average recoveries: tuff 95%, dacite 98%, basement breccia 97%, and basement 97%). There was no indication of a relationship
between core recovery and grade.
| | 11-3 | |
| SSR Mining Inc. | Puna Operations S-K 1300 Report | February 12, 2024 SLR Project No.: 138.21581.00003 |
Figure 11-1: Isometric View
Showing the Chinchillas Drill Hole Database (collar = black, traces = blue) Used in Mineral Resource Modeling
SSR Mining Inc. Puna Operations
Province of Jujuy, Argentina Isometric View Showing the Chinchillas Drill Hole Database Used in Mineral Resource Modelling
| | 11-4 | |
| SSR Mining Inc. | Puna Operations S-K 1300 Report | February 12, 2024 SLR Project No.: 138.21581.00003 |
The data consistency was reviewed by Red Pennant using Leapfrog and
by SLR during the audit process. Except a duplicated entry, no errors were found.
As described in Section 6.2, the Chinchillas deposit is interpreted
to have formed as a result of a Tertiary aged diatreme intrusion into a host of Paleozoic basement schists. Heat from the intrusion resulted
in mineralization in the form of disseminations, veinlets, and matrix filling within the volcanic breccias and tuffs as well as within
the original schists.
The geological model comprises a structural model, lithology model,
and k-means cluster model.
High resolution satellite imagery, Shuttle Radar
Topography Mission (SRTM) topography data, and client-supplied topography data were combined into a 3D model. As the outcrop patterns
are not obscured by vegetation, it was possible to carry out a “virtual” field mapping exercise to measure the strike and
dip of the locality. These measurements were used to develop a structural model in the form of structural surfaces to aid interpretation
of the morphology and depth extension of the diatreme.
| 11.2.2.2 | Lithological Model |
The general spatial distribution of the main lithological units at Chinchillas
is shown in cross section in Figure 11-2. The higher grade silver-lead-zinc mineralization occurs predominantly in the tuffaceous
rocks and also within the brecciated zone in the underlying basement schists. However, relatively high grade mineralization can be found
in all rock types.
| | 11-5 | |
| SSR Mining Inc. | Puna Operations S-K 1300 Report | February 12, 2024 SLR Project No.: 138.21581.00003 |
Figure 11-2: North-South Cross
Section Showing Chinchillas Drilling, Rock Types, and Silver Grades
SSR
Mining Inc. Puna Operations Province of Jujuy, Argentina Cross Section Showing Chinchillas Drilling, Rock Types and Silver Grades
| | 11-6 | |
| SSR Mining Inc. | Puna Operations S-K 1300 Report | February 12, 2024 SLR Project No.: 138.21581.00003 |
The mineralization in the Mantos area of the deposit
exhibits two general styles or trends: (1) a more flat lying mantos-style distribution, which is more common in the tuffs, and (2) basement
mineralization, which tends to be sub-parallel to the basement/tuff contact.
The comprehensive logging of lithological types
(20) and alteration style (6) and intensity (5) results in the potential for 600 combinations. The lithological and alteration codes were
rationalized into a small number of units for practical purposes (basement and volcanic rocks, and dacite).
A simplified 3D implicit model was created of the
key lithological units (Figure 11-3).
Figure 11-3: Isometric View
of Chinchillas Simplified Lithology Model
Principal Component Analysis (PCA) and K-means
clustering was used to subdivide the assay dataset into distinct, exclusive clusters that shared similar geochemical characteristics.
Eight clusters were defined and then modeled using implicit modelling. This cluster model is shown in Figure 11-4.
| | 11-7 | |
| SSR Mining Inc. | Puna Operations S-K 1300 Report | February 12, 2024 SLR Project No.: 138.21581.00003 |
Figure 11-4: Chinchillas Estimation
Domains Based on K Means Clusters of Multi-Element Geochemistry
Source: SSR, 2023
| 11.2.3 | Exploratory Data Analysis |
Exploratory data analysis (EDA) was conducted to understand the distribution
of the metals within the different lithological units and structural domains and then define the estimation domains. The EDA included
single and multivariable statistics. For each element, histograms, log probability plots, and box plots were generated by lithology, which
includes a broad range of grades. In addition, the estimation domains were defined using the multivariable statistic method K-means clustering.
| 11.2.3.1 | Domain Statistics |
Raw assay distributions and statistics for silver, lead, and zinc are
shown in Figure 11-5, Figure 11-6, and Figure 11-7, respectively. Samples were generally analyzed by ICP for a suite of 39
elements. The silver, lead, zinc, and sulfur data were extracted from the main database for use in the development of the Mineral Resource
model.
The composited statistics for silver, lead, and zinc are provided in
Table 11-2. Compositing slightly reduced the coefficient of variation but retained the mean for all three elements.
| | 11-8 | |
| SSR Mining Inc. | Puna Operations S-K 1300 Report | February 12, 2024 SLR Project No.: 138.21581.00003 |
Figure 11-5: Raw Ag Box Plot
Final Groups (Eight Cases)
| | 11-9 | |
| SSR Mining Inc. | Puna Operations S-K 1300 Report | February 12, 2024 SLR Project No.: 138.21581.00003 |
Figure 11-6: Raw Pb Box Plot
Final Groups (Eight Cases)
| | 11-10 | |
| SSR Mining Inc. | Puna Operations S-K 1300 Report | February 12, 2024 SLR Project No.: 138.21581.00003 |
Figure 11-7: Raw Zn Box Plot
Final Groups (Eight Cases)
Table 11-2: Chinchillas Estimation
Domain Statistics
| Name |
Domain |
Count |
Mean |
Standard Deviation |
Coefficient of Variation |
Minimum |
Median |
Maximum |
| Ag (g/t) |
All |
67,709 |
27.1 |
113.3 |
4.2 |
0.005 |
3.2 |
8,194 |
| 1 |
10,795 |
19.8 |
77 |
3.9 |
0.005 |
2.4 |
2,386 |
| 2 |
20,578 |
21 |
73.3 |
3.5 |
0.005 |
4 |
5,011 |
| 3 |
10,758 |
18.2 |
60.7 |
3.3 |
0.005 |
3.8 |
1,947 |
| 4_breccias_tuffs |
5,905 |
122.9 |
302.4 |
2.5 |
0.005 |
30.1 |
8,194 |
| 5 |
12,375 |
18.1 |
62.8 |
3.5 |
0.005 |
2.6 |
1,776 |
| 6 |
6,516 |
3.7 |
13.6 |
3.7 |
0.005 |
0.3 |
309 |
| 7 |
426 |
45.8 |
96.2 |
2.1 |
0.25 |
13.3 |
930 |
| 8_dacite |
258 |
12.4 |
23.9 |
1.9 |
0.12858 |
1 |
134 |
| OVB |
98 |
14.5 |
22.9 |
1.6 |
0.23 |
3.9 |
105 |
| | 11-11 | |
| SSR Mining Inc. | Puna Operations S-K 1300 Report | February 12, 2024 SLR Project No.: 138.21581.00003 |
| Name |
Domain |
Count |
Mean |
Standard
Deviation |
Coefficient
of Variation |
Minimum |
Median |
Maximum |
| Pb (%) |
All |
67,709 |
0.253 |
0.743 |
2.9 |
0.0001 |
0.053 |
26.87 |
| 1 |
10,795 |
0.188 |
0.555 |
3.0 |
0.0002 |
0.034 |
11.25 |
| 2 |
20,578 |
0.175 |
0.411 |
2.3 |
0.0001 |
0.054 |
11.87 |
| 3 |
10,758 |
0.219 |
0.518 |
2.4 |
0.0001 |
0.069 |
12.88 |
| 4_breccias_tuffs |
5,905 |
0.982 |
1.750 |
1.8 |
0.0001 |
0.349 |
26.87 |
| 5 |
12,375 |
0.212 |
0.617 |
2.9 |
0.0001 |
0.053 |
14.33 |
| 6 |
6,516 |
0.073 |
0.214 |
2.9 |
0.0001 |
0.024 |
4.69 |
| 7 |
426 |
0.512 |
1.563 |
3.1 |
0.0015 |
0.085 |
18.42 |
| 8_dacite |
258 |
0.116 |
0.292 |
2.5 |
0.0007 |
0.016 |
2.38 |
| OVB |
98 |
0.159 |
0.206 |
1.3 |
0.0049 |
0.061 |
1.10 |
| Zn (%) |
All |
67,709 |
0.246 |
0.587 |
2.4 |
0.0001 |
0.059 |
12.91 |
| 1 |
10,795 |
0.207 |
0.545 |
2.6 |
0.0001 |
0.046 |
8.02 |
| 2 |
20,578 |
0.219 |
0.484 |
2.2 |
0.0001 |
0.063 |
10.05 |
| 3 |
10,758 |
0.200 |
0.357 |
1.8 |
0.0017 |
0.059 |
6.95 |
| 4_breccias_tuffs |
5,905 |
0.737 |
1.244 |
1.7 |
0.0013 |
0.20 |
12.91 |
| 5 |
2,375 |
0.20 |
0.41 |
2.0 |
0.0011 |
0.05795 |
6.31 |
| 6 |
6,516 |
0.07867 |
0.16 |
2.1 |
0.0011 |
0.0301 |
4.72 |
| 7 |
426 |
0.94 |
1.19 |
1.3 |
0.0012 |
0.43 |
8.99 |
| 8_dacite |
258 |
0.20 |
0.57 |
2.8 |
0.0020 |
0.0535 |
5.87 |
| OVB |
98 |
0.10 |
0.09898 |
1.0 |
0.0128 |
0.06244 |
0.59 |
Raw sample lengths were variable, but generally up to 5.0 m in waste
rock and from 0.2 m to 1.0 m in mineralized rock. A minimum sample length of 0.5 m was permitted for samples from highly mineralized structures
such as veins, stockworks, and breccias.
A composite length of one meter was considered most suitable for the
Chinchillas drill hole data. Data were composited to the selected composite length within the interpreted wireframe solid. Residual lengths
were retained.
| 11.2.5 | Treatment of High Grade Assays |
The one-meter composited data were examined for outliers using cumulative
probability plots, and metal loss due to capping of higher grades was assessed. A number of scenarios were run to understand the effect
of capping and the results were compared with the tonnes and grade within the mined-out areas. The capping levels summarized for each
element in Table 11-3 were used to reduce any undue influence of the extremely high grade values.
| | 11-12 | |
| SSR Mining Inc. | Puna Operations S-K 1300 Report | February 12, 2024 SLR Project No.: 138.21581.00003 |
SLR is of the opinion that the treatment of high grade outliers applied
by SSR is reasonable, however, SLR considers capping before compositing to be a better practice as it avoids smoothing any outliers with
low grade values.
Table 11-3: Chinchillas Capping
Levels
| Domain |
Ag (g/t) |
Pb (%) |
Zn (%) |
S (%) |
| 1 |
1,000 |
8.0 |
5.0 |
8 |
| 2 |
800 |
5.0 |
5.0 |
6.5 |
| 3 |
800 |
5.0 |
2.5 |
4 |
| 4 |
1,250 |
6.0 |
5.0 |
7.5 |
| 5 |
800 |
8.0 |
3.0 |
5 |
| 6 |
600 |
4.0 |
2.0 |
4 |
| 7 |
500 |
5.0 |
5.0 |
12 |
| 8 |
125 |
1.0 |
1.0 |
5 |
| OVB |
100 |
1.0 |
0.5 |
1.6 |
Normal score variography was used for grade continuity analysis and
a locally varying orientation was used for both the inverse distance squared (ID2) and ordinary kriging (OK) estimates. The
varying directions follow the generally centrally dipping pattern seen in the geological modeling of the flat Mantos and steep Socavon
marginal zones. Figure 11-8 illustrates the variogram model of cluster 4 and Table 11-4 summarizes the variogram models for silver,
lead, and zinc.
| | 11-13 | |
| SSR Mining Inc. | Puna Operations S-K 1300 Report | February 12, 2024 SLR Project No.: 138.21581.00003 |
Figure 11-8: Normal Score Ag
Variogram of Breccia-Tuffs (Cluster 4)
MPSA, 2023
Table 11-4: Chinchillas Back
Transformed Variogram Models
| Variable |
Domain |
Nugget |
Dip
(°) |
Dip Az.
(°) |
Pitch
(°) |
Structure 1 |
Structure 2 |
| Sill 1 |
Major (m) |
Semi (m) |
Minor (m) |
Sill 2 |
Major (m) |
Semi (m) |
Minor (m) |
| Ag |
1 |
0.799 |
37.5 |
57.0 |
104.0 |
0.130 |
30.9 |
28.8 |
10.0 |
0.071 |
60.04 |
50.3 |
28.3 |
| 2 |
0.810 |
18.0 |
57.0 |
104.0 |
0.136 |
36.4 |
36.3 |
10.0 |
0.054 |
72.95 |
74.2 |
28.3 |
| 3 |
0.751 |
37.5 |
57.0 |
104.0 |
0.152 |
30.9 |
28.8 |
10.0 |
0.097 |
60.04 |
50.3 |
28.3 |
| 4 |
0.690 |
18.0 |
57.0 |
65.0 |
0.203 |
18.8 |
21.8 |
8.7 |
0.108 |
131 |
111.4 |
18.1 |
| 5 |
0.796 |
66.7 |
77.3 |
2.7 |
0.134 |
30.9 |
25.3 |
10.5 |
0.070 |
100.2 |
73.7 |
37.8 |
| 6 |
0.696 |
18.0 |
57.0 |
65.0 |
0.255 |
30.1 |
29.9 |
10.4 |
0.049 |
86.7 |
81.6 |
28.3 |
| 7 |
0.696 |
18.0 |
57.0 |
65.0 |
0.255 |
30.1 |
29.9 |
10.4 |
0.049 |
86.7 |
81.6 |
28.3 |
| 8 |
0.167 |
18.0 |
57.0 |
65.0 |
0.513 |
20.0 |
20.0 |
20.0 |
0.322 |
40 |
40.0 |
40.0 |
| OVB |
0.684 |
0.0 |
0.0 |
90.0 |
0.159 |
20.0 |
20.0 |
5.0 |
0.157 |
50 |
50.0 |
20.0 |
| Pb |
1 |
0.799 |
37.5 |
57.0 |
104.0 |
0.130 |
30.9 |
28.8 |
10.0 |
0.071 |
60.04 |
50.3 |
28.3 |
| 2 |
0.810 |
18.0 |
57.0 |
104.0 |
0.136 |
36.4 |
36.3 |
10.0 |
0.054 |
72.95 |
74.2 |
28.3 |
| 3 |
0.751 |
37.5 |
57.0 |
104.0 |
0.152 |
30.9 |
28.8 |
10.0 |
0.097 |
60.04 |
50.3 |
28.3 |
| 4 |
0.690 |
18.0 |
57.0 |
65.0 |
0.203 |
18.8 |
21.8 |
8.7 |
0.108 |
131 |
111.4 |
18.1 |
| 5 |
0.796 |
66.7 |
77.3 |
2.7 |
0.134 |
30.9 |
25.3 |
10.5 |
0.070 |
100.2 |
73.7 |
37.8 |
| 6 |
0.696 |
18.0 |
57.0 |
65.0 |
0.255 |
30.1 |
29.9 |
10.4 |
0.049 |
86.7 |
81.6 |
28.3 |
| 7 |
0.696 |
18.0 |
57.0 |
65.0 |
0.255 |
30.1 |
29.9 |
10.4 |
0.049 |
86.7 |
81.6 |
28.3 |
| 8 |
0.140 |
18.0 |
57.0 |
65.0 |
0.231 |
8.0 |
8.0 |
8.0 |
0.487 |
30 |
30.0 |
30.0 |
| OVB |
0.684 |
0.0 |
0.0 |
90.0 |
0.159 |
20.0 |
20.0 |
5.0 |
0.157 |
50 |
50.0 |
20.0 |
| | 11-14 | |
| SSR Mining Inc. | Puna Operations S-K 1300 Report | February 12, 2024 SLR Project No.: 138.21581.00003 |
| Variable |
Domain |
Nugget |
Dip
(°) |
Dip Az.
(°) |
Pitch
(°) |
Structure 1 |
Structure 2 |
| Sill 1 |
Major (m) |
Semi (m) |
Minor (m) |
Sill 2 |
Major (m) |
Semi (m) |
Minor (m) |
| Zn |
1 |
0.799 |
37.5 |
57.0 |
104.0 |
0.130 |
30.9 |
28.8 |
10.0 |
0.071 |
60.04 |
50.3 |
28.3 |
| 2 |
0.810 |
18.0 |
57.0 |
104.0 |
0.136 |
36.4 |
36.3 |
10.0 |
0.054 |
72.95 |
74.2 |
28.3 |
| 3 |
0.751 |
37.5 |
57.0 |
104.0 |
0.152 |
30.9 |
28.8 |
10.0 |
0.097 |
60.04 |
50.3 |
28.3 |
| 4 |
0.690 |
18.0 |
57.0 |
65.0 |
0.203 |
18.8 |
21.8 |
8.7 |
0.108 |
131 |
111.4 |
18.1 |
| 5 |
0.796 |
66.7 |
77.3 |
2.7 |
0.134 |
30.9 |
25.3 |
10.5 |
0.070 |
100.2 |
73.7 |
37.8 |
| 6 |
0.696 |
18.0 |
57.0 |
65.0 |
0.255 |
30.1 |
29.9 |
10.4 |
0.049 |
86.7 |
81.6 |
28.3 |
| 7 |
0.696 |
18.0 |
57.0 |
65.0 |
0.255 |
30.1 |
29.9 |
10.4 |
0.049 |
86.7 |
81.6 |
28.3 |
| 8 |
0.200 |
18.0 |
57.0 |
65.0 |
0.389 |
13.0 |
13.0 |
13.0 |
0.410 |
31 |
31.0 |
31.0 |
| OVB |
0.684 |
0.0 |
0.0 |
90.0 |
0.159 |
20.0 |
20.0 |
5.0 |
0.157 |
50 |
50.0 |
20.0 |
| 11.2.7 | Grade Estimation Parameters |
Grade estimation was carried out within a block model with 8 m x 8 m
x 5 m cells. The block model setup is shown in Table 11-5. The model is not rotated.
Table 11-5: Chinchillas Block
Model Extents and Dimensions
| Direction |
Minimum |
Maximum |
Cell Size
(m) |
Number of Cells |
| East |
3,472,100 |
3,474,404 |
8 |
288 |
| North |
7,510,644 |
7,512,996 |
8 |
294 |
| Elevation |
3,750 |
4,300 |
5 |
110 |
Cells in the model were coded with the various
domains on a majority basis.
The proportion of cells that occur below the topographic
surface were also calculated and stored in the model as individual percentage items. These values were used as weighting factors when
determining the in situ Mineral Resources for the deposit.
Estimation was undertaken both within and outside
the eight cluster domains, with a 5 m soft boundary applied for all domains except for the overburden domain.
Three methods were used to populate silver, lead,
zinc, and sulfur estimates into the block model:
| | 11-15 | |
| SSR Mining Inc. | Puna Operations S-K 1300 Report | February 12, 2024 SLR Project No.: 138.21581.00003 |
The ID2 and NN estimates were used for validation purposes.
The block grades were estimated with a minimum
of seven and a maximum of 16 one-meter composites. Three maximum composites per drill hole were allowed and therefore blocks were estimated
with at least three drill holes. The search ellipse of 200 m x 160 m x 60 m was dynamically adjusted to follow the mineralization trend.
While SLR observed some overturning of dynamic
anisotropy angles, the grades of blocks within the resource shell were not impacted. Additionally, while SLR notes that the three one
meter composites per drill hole is inconsistent with the block height of five meters, SLR’s validation of the block grades did not
reveal any bias in the resulting estimates. Moving forward, the SLR QP recommends resolving the overturned dynamic anisotropy angles and
changing the maximum number of samples per hole to a value that is more representative of the block height.
| 11.2.8 | Estimation Validation |
SLR’s validation followed industry standard
techniques and included:
| · | Visual inspection of cross sections and plan views, viewing drill hole samples versus block estimates |
| · | Comparison of the OK and NN estimation statistics |
| · | Comparison of average assay grades with average block estimates along northing easting, and elevation directions (swath plots) |
| · | Comparison between the 2023 block model and blasthole model for the mined-out areas |
| 11.2.8.1 | Visual Inspection |
Visual validation included comparing the drill
hole samples and the estimated model grades in both plan and section. Plans and sections were also checked for smearing of grades across
stacked ore/mineralized zones, and no smearing was identified. This validates the kriging parameters used to estimate the cells.
Typical cross sections comparing exploration drill
hole data and block model estimates are shown in Figure 11-9 and Figure 11-10.
| | 11-16 | |
| SSR Mining Inc. | Puna Operations S-K 1300 Report | February 12, 2024 SLR Project No.: 138.21581.00003 |
Figure 11-9: Cross-Section Looking
North-Northeast (Az. 106°) Showing Ag Block Grade Estimates
Figure 11-10: Cross-Section
Looking North-Northeast (Az. 106°) Showing Zn Block Grade Estimates
| | 11-17 | |
| SSR Mining Inc. | Puna Operations S-K 1300 Report | February 12, 2024 SLR Project No.: 138.21581.00003 |
| 11.2.8.2 | Estimation Statistics |
Checks for global bias were conducted on a domain
basis, and the relative percent differences of the kriged mean gold grades were checked against the NN estimates. In SLR’s opinion,
the difference was acceptable, as is shown in Table 11-6.
Table 11-6: Chinchillas OK Versus
NN Grade Estimates
| Element |
OK |
NN |
Diff. |
| Ag |
12.7 |
12.3 |
-3.1% |
| Pb |
0.159 |
0.148 |
-7.4% |
| Zn |
0.203 |
0.210 |
3.3% |
Swath plots were generated to compare the NN gold grades to the OK gold
grades in elevation, east, and north directions. These plots, presented for silver, lead, and zinc in Figure 11-11, Figure 11-12,
and Figure 11-13, respectively, demonstrated acceptable correlation. No local bias and minor smoothing were observed in the estimates.
Figure 11-11: Ag Swath Plots
– All Domains
| | 11-18 | |
| SSR Mining Inc. | Puna Operations S-K 1300 Report | February 12, 2024 SLR Project No.: 138.21581.00003 |
Figure 11-12: Pb Swath Plots
– All Domains
| | 11-19 | |
| SSR Mining Inc. | Puna Operations S-K 1300 Report | February 12, 2024 SLR Project No.: 138.21581.00003 |
Figure 11-13: Zn Swath Plots
– All Domains
| 11.2.8.4 | Resource Model Versus Blasthole Model Comparison |
Figure 11-14 shows a QQ plot of the silver block
estimates versus blasthole model silver grades. No bias is observed for silver grades lower than approximately 150 g/t; above 150 g/t
Ag, blasthole model has higher grades than the resource model.
| | 11-20 | |
| SSR Mining Inc. | Puna Operations S-K 1300 Report | February 12, 2024 SLR Project No.: 138.21581.00003 |
Figure 11-14: QQ Plot of Ag
Resource Model Versus Ag Blasthole Model
MPSA, 2023
Density was assigned based on the mean value of
the density measurements within each domain. SSR based the mean calculation in 2586 measurements.
Table 11-7 summarizes the density values by
domain.
Table 11-7: Chinchillas Densities
| Domain |
# |
Sg (g/cm3) |
|
| 1 |
60 |
2.23 |
|
| 2 |
967 |
2.07 |
|
| 3 |
494 |
2.57 |
|
| 4 |
251 |
2.31 |
|
| 5 |
466 |
2.59 |
|
| 6 |
254 |
2.17 |
|
| 7 |
10 |
2.44 |
|
| 8 |
8 |
2.26 |
|
| OVB |
- |
2.00 |
|
| Outside |
- |
2.45 |
|
| | 11-21 | |
| SSR Mining Inc. | Puna Operations S-K 1300 Report | February 12, 2024 SLR Project No.: 138.21581.00003 |
Chinchillas classification follows the definitions for Mineral Resources
in S-K 1300.
A Mineral Resource is defined as a concentration or occurrence of material
of economic interest in or on the Earth’s crust in such form, grade or quality, and quantity that there are reasonable prospects
for economic extraction. A Mineral Resource is a reasonable estimate of mineralization, considering relevant factors such as cut-off grade,
likely mining dimensions, location, or continuity, that with the assumed and justifiable technical and economic conditions, is likely
to, in whole or in part, become economically extractable. It is not merely an inventory of all mineralization drilled or sampled.
Based on this definition of Mineral Resources, the Mineral Resources
estimated in this TRS have been classified according to the definitions below based on geology, grade continuity, and drill hole spacing.
Measured Mineral Resource is that part of a mineral resource
for which quantity and grade or quality are estimated on the basis of conclusive geological evidence and sampling. The level of geological
certainty associated with a measured mineral resource is sufficient to allow a qualified person to apply modifying factors, as defined
in this section, in sufficient detail to support detailed mine planning and final evaluation of the economic viability of the deposit.
Because a measured mineral resource has a higher level of confidence than the level of confidence of either an indicated mineral resource
or an inferred mineral resource, a measured mineral resource may be converted to a proven mineral reserve or to a probable mineral reserve.
Indicated Mineral Resource is that part of a mineral resource
for which quantity and grade or quality are estimated on the basis of adequate geological evidence and sampling. The level of geological
certainty associated with an indicated mineral resource is sufficient to allow a qualified person to apply modifying factors in sufficient
detail to support mine planning and evaluation of the economic viability of the deposit. Because an indicated mineral resource has a lower
level of confidence than the level of confidence of a measured mineral resource, an indicated mineral resource may only be converted to
a probable mineral reserve.
Inferred Mineral Resource is that part of a mineral resource
for which quantity and grade or quality are estimated on the basis of limited geological evidence and sampling. The level of geological
uncertainty associated with an inferred mineral resource is too high to apply relevant technical and economic factors likely to influence
the prospects of economic extraction in a manner useful for evaluation of economic viability. Because an inferred mineral resource has
the lowest level of geological confidence of all mineral resources, which prevents the application of the modifying factors in a manner
useful for evaluation of economic viability, an inferred mineral resource may not be considered when assessing the economic viability
of a mining project and may not be converted to a mineral reserve.
The Chinchillas classification was undertaken in
accordance with the same method used in the previous Mineral Resource estimates; that being the minimum and maximum distance to the closest
three drill holes. The classification criteria used are shown in Table 11-8. Blocks that fall within the economic pit shell and meet
the classification criteria are reported as Mineral Resource.
| | 11-22 | |
| SSR Mining Inc. | Puna Operations S-K 1300 Report | February 12, 2024 SLR Project No.: 138.21581.00003 |
Table 11-8: Chinchillas Classification
Parameters
| Class |
Code |
Average Distance to Drill Hole (m) |
| Minimum |
Maximum |
| Measured |
1 |
0 |
25 |
| Indicated |
2 |
25 |
50 |
| Inferred |
3 |
50 |
75 |
| |
|
|
|
|
The average distances for Measured and Indicated are equivalent to
a drilling spacing of 35 m and 70 m, respectively. The largest estimation domain variogram ranges at 80% of the sill vary from 60 m
to 75 m. In the opinion of SLR, Measured and Indicated are defined within acceptable distances; although, the reconciliation of the
2021 resources model shows some underestimation (see section 11.2.12.1), the annual projected production rate since 2017 has been
achieved. SLR recommends monitoring the reconciliation of the new updated model and identify zones (if there are) with higher
reconciliation differences that might need some infill drilling.
The resulting Chinchillas Mineral Resource classification is presented
in Figure 11-15.
Figure 11-15: Chinchillas Mineral
Resource Classification
Source: SLR, 2023.
| 11.2.11 | Reasonable Prospects for Economic Extraction |
Mineral Resources must demonstrate reasonable prospects for economic
extraction (RPEE), which generally implies that the quantity and grade estimates meet certain economic thresholds and that the Mineral
Resources are reported at an appropriate cut-off grade taking into account extraction scenarios.
Metal prices used for reserves are based on consensus, long term forecasts
from banks, financial institutions, and other sources. For resources, metal prices used are slightly higher than those for reserves and
the NSR cut-off value is lower than that used to report reserves. Table 11-7 summarizes the parameters used for Mineral Resources and
Mineral Reserves.
| | 11-23 | |
| SSR Mining Inc. | Puna Operations S-K 1300 Report | February 12, 2024 SLR Project No.: 138.21581.00003 |
The Chinchillas Mineral Resource estimate is constrained within a pit
shell generated using an NSR cut-off value of $37.91/t that is based on metal prices of $22.00/oz for silver, $0.95/lb lead, and $1.15/lb
for zinc. This cut-off calculation also considers metallurgical recoveries and additional operating costs, estimated at $12/t, related
to the handling and transportation of ore from the Chinchillas property to the Pirquitas plant. It should be noted that while considering
the site operating costs, the cut-off criteria do not include the pay factors for any concentrate generated and sold to a smelter. Table
11-9 summarizes the pit optimization input parameters used in Mineral Resource and Mineral Reserve estimation.
Table 11-9: 2023 Chinchillas
Resource and Reserve Pit Input Parameters
| Item |
Unit |
Resource |
Reserve |
| Metal Prices |
Ag ($/oz) |
22 |
18.5 |
| Pb ($/lb) |
0.95 |
0.9 |
| Zn ($/lb) |
1.15 |
1.05 |
| Mining Cost |
$/t |
3.38 |
3.38 |
| Processing Cost |
$/t |
31.58 |
31.58 |
| Sustaining Capital |
$/t |
- |
4.72 |
| General and Administrative (G&A) Cost |
$/t |
6.335 |
12.67 |
| NSR Cut-off Value |
($/t) |
37.91 |
48.97 |
The SLR QP notes that the Chinchillas reserve pit shell is constrained
by an archeological site limiting the pit extension to the northeast. This constraint was not used to define the resource pit shell as
it was assumed that permits to extend the pit shell could be obtained if necessary. SLR is assuming that there is a reasonable expectation
for issuance of the permit and is unaware of any known factors related to environmental, permitting, legal, title, taxation, socio-economic,
marketing, or political issues that could materially affect the Mineral Resources estimate.
Additionally, SLR notes that the west part of the resource pit in the
north area (Melina) is partially covered by a waste dump material which is still being deposited. There may be a minor portion of the
Mineral Resource which will not meet RPEE in the future due to the additional stripping that will be required.
| 11.2.12 | Mineral Resource Reporting |
Mineral Resources that are not Mineral Reserves do not have demonstrated
economic viability. Mineral Resources are reported exclusive of Mineral Reserves.
The Chinchillas Mineral Resources are summarized in Table 11-10.
| | 11-24 | |
| SSR Mining Inc. | Puna Operations S-K 1300 Report | February 12, 2024 SLR Project No.: 138.21581.00003 |
Table 11-10: Summary of Chinchillas
Mineral Resources Estimate – December 31, 2023
| Mineral Resources Classification |
Tonnage
(kt) |
Grades |
Contained Metal |
| Ag |
Pb |
Zn |
Silver |
Lead |
Zinc |
| (g/t) |
(%) |
(%) |
(koz) |
(klb) |
(klb) |
| Measured |
In situ |
1,856 |
116.4 |
1.06 |
0.29 |
6,948 |
43,360 |
11,776 |
| Indicated |
In situ |
6,618 |
113.1 |
1.02 |
0.46 |
24,065 |
148,779 |
67,423 |
| Low Grade Stockpile |
357 |
70.0 |
0.51 |
0.58 |
803 |
4,011 |
4,562 |
| Sub-total |
6,974 |
110.9 |
0.99 |
0.47 |
24,868 |
152,790 |
71,984 |
| Measured + Indicated |
8,830 |
112.1 |
1.01 |
0.43 |
31,815 |
196,150 |
83,760 |
| Inferred |
In situ |
1,509 |
93.5 |
0.72 |
0.45 |
4,536 |
23,982 |
14,953 |
Notes:
| 1. | The Chinchillas Mineral Resource estimate was reported in accordance with S-K 1300. |
| 2. | Mineral Resources are reported based on December 31, 2023 topography surface. |
| 3. | The Mineral Resource estimates are based on metal price assumptions of $22.00/oz silver, $0.95/lb lead, and $1.15/lb zinc. |
| 4. | The Chinchillas Mineral Resources are contained within a pit shell generated using an NSR cut-off value of $37.91/t. |
| 5. | The Mineral Resources are contained within: |
| a. | the resource pit shell generated using an NSR cut-off value of $37.91/t. |
| b. | the reserve pit shell using an NSR cut-off value between $37.91/t and $48.97/t. |
| c. | additionally, a low grade stockpile with an NSR cut-off value between $37.91 and $48.97/t. |
| 6. | Metallurgical recoveries vary with grade and average recoveries are: 95.5% silver, 92.1% lead, and 55% zinc. |
| 7. | The point of reference for Mineral Resources is entry to the processing facility. |
| 8. | Mineral Resources are reported exclusive of Mineral Reserves. |
| 9. | SSR has 100% ownership of the Project. |
| 10. | Ounces reported represent troy ounces; g/t represents grams per metric tonne, and lb represents pounds. |
| 11. | Totals may vary due to rounding. |
| 11.2.12.1Production | Reconciliation |
Reconciliation between the 2021 Mineral Resource model grade and tonnage
estimates, grade control model, and mill production is the most effective means of validating a block model estimate.
Reconciliation results over the period of 2020 to 2023, as reported
by SSR, are summarized in Figure 11-16. Mined-out tonnage and silver grades are, respectively, 12% and 25% higher than the resource
model. The plant production is 14% higher in tonnage and 19% higher in silver grade than the Mineral Resource model.
| | 11-25 | |
| SSR Mining Inc. | Puna Operations S-K 1300 Report | February 12, 2024 SLR Project No.: 138.21581.00003 |
Figure 11-16 : Resource
Model vs. Production Reconciliation
Source: SSR, 2023
In the SLR QP’s opinion, reconciliation between the Mineral Resource
model, the grade control model, and mill production shows that the 2021 resource model contains approximately 12% less tonnage than the
grade control model and milled production, and 25% and 19% less metal than the grade control model and milled production, respectively.
Since the 2021 Mineral Resource model, a number of changes (new drilling, domaining, estimation parameters, etc.) have been implemented
and SLR recommends updating the reconciliation with the new model to monitor performance.
| 11.2.13 | Mineral Resource Uncertainty |
Mineral Resources are not Mineral Reserves and do not have demonstrated
economic viability, nor is there any certainty that all or any part of the Mineral Resource estimate will be converted to Mineral Reserves
through further study.
Sources of uncertainty that may affect the reporting of Mineral Resources
include sampling or drilling methods, data processing and handling, geologic modeling, and estimation. There are sources of uncertainty
in the Chinchillas Mineral Resource estimate which depend on the classification assigned. The SLR QP has identified two technical and/or
economic factors that require resolution with regard to the Mineral Resource estimate.
| | 11-26 | |
| SSR Mining Inc. | Puna Operations S-K 1300 Report | February 12, 2024 SLR Project No.: 138.21581.00003 |
| · | An archeological site located within the area of the deposit was used to limit the reserve pit shell, but not taken into account in
generating the resource pit shell as, according to SSR, there is a reasonable expectation for issuance of the permit. |
| · | The waste dump partially covers the resource pit shell in the Melina area. Mineral Resources were stated considering the current material
in this dump. As the waste dump material is still being deposited, there may be a minor portion of the Mineral Resource which will not
meet RPEE in the future due to the additional stripping that will be required. In SLR’s opinion, this issue will not materially
affect the total Mineral Resource estimate for Chinchillas. |
The SLR QP is of the opinion that with consideration of the recommendations
summarized in Sections 1 and 23 of this TRS, any issues relating to all relevant technical and economic factors likely to influence the
prospect of economic extraction can be resolved with further work.
The SLR QP reviewed the assumptions, parameters, and methods used to
update the MRE and has concluded that they meet best industry practices. The Chinchillas Mineral Resources Statement are estimated and
prepared in accordance with S-K 1300.
The SLR QP observed some overturning of dynamic anisotropy angles, however,
the grades of blocks within the resource shell were not impacted. In addition, the maximum three, one meter composites per drill hole
is inconsistent with the block size, which has no global impact on the estimation results. SLR noted that block estimates were underestimated
by 20% with respect to blasthole data.
In the SLR QP’s opinion, the validation of the 2023 grade estimates
is acceptable, including the comparison with the blasthole model, however, because the reconciliation between the 2021 Mineral Resource
model and the grade control model shows approximately 20% difference, the SLR QP recommends updating the reconciliation with the 2023
model for the last four years (2020-2023) and monitoring its performance going forward.
The 2023 Mineral Resources database contains assay data derived from
diamond drill and RC holes, with 919 collars used for modeling.
The spatial distribution of the drilling completed to date at Pirquitas
is shown in Figure 11-17.
The Pirquitas database comprises collar, survey, assay, density, and
logging tables including lithology, alteration, mineralization, vein intervals, and structures.
The database contains 141,009 assays for silver, 97,341 for lead, and
133,580 for zinc. Assay results below the detection limit were assigned values equal to one half of the detection limit.
Assay sample intervals ranged from 0.1 m to 5.0 m, with 61.4% being
one meter long and 33.9% being two meters long.
Diamond drill core recovery is high, between 95% and 100%, and there
is no indication of a relationship between core recovery and grade.
| | 11-27 | |
| SSR Mining Inc. | Puna Operations S-K 1300 Report | February 12, 2024 SLR Project No.: 138.21581.00003 |
Figure 11-17: Isometric View
Showing the Pirquitas Drill Hole Database Used in Mineral Resource Modeling
SSR Mining Inc. Puna Operations
Province of Jujuy, Argentina Isometric View Showing the Pirquitas Drill Hole Database Used in Mineral Resource Modeling
| | 11-28 | |
| SSR Mining Inc. | Puna Operations S-K 1300 Report | February 12, 2024 SLR Project No.: 138.21581.00003 |
The Pirquitas deposit comprises the mining area and the Cortaderas area
(Figure 11-17). The mining area includes the San Miguel, Potosi, and Oploca Vein zones, while the Cortaderas area consists of the
Cortaderas breccia zone and the Cortaderas Valley zone.
Resource modeling of the Cortaderas breccia zone was carried out in
2023 (Figure 11-18).
Figure 11-18: Isometric View
of Cortaderas Zone Wireframe Vein Models
Using implicit modelling, two silver and two zinc indicator grade shells
were built to estimate silver, lead, and zinc grades. The silver grade envelopes were defined at cut-off grades of 25 g/t Ag and 50 g/t
Ag, while the zinc grade envelope was defined at cut-off grades of 6,000 ppm Zn and 12,000 ppm Zn. Figure 11-19 and Figure 11-20
illustrate the zinc and silver grade distribution, respectively, by domain. The silver and zinc lower grade indicators were generated
at a probability of 0.3 and the higher indicator wireframe at a probability of 0.4.
Trend models were incorporated in the implicit modeling to honor the
structural features of the different deposit areas where:
| · | Central San Miguel zone – characterized in the field by essentially subvertical veins and vein stockworks. |
| · | Northern Potosí zone – characterized in the field by veins and vein stockworks steeply dipping toward the north. |
| | 11-29 | |
| SSR Mining Inc. | Puna Operations S-K 1300 Report | February 12, 2024 SLR Project No.: 138.21581.00003 |
| · | Southern Oploca Vein zone – characterized in the field by veins steeply dipping toward the south. |
| · | North Cortaderas area, with the Cortaderas breccia zone steeply dipping toward south and hanging wall zone steeply dipping toward
north. |
The wireframes were limited by the topographic surface or the base of
the overburden material.
Figure 11-19: Pirquitas Zn Log
Probability Distributions
| | 11-30 | |
| SSR Mining Inc. | Puna Operations S-K 1300 Report | February 12, 2024 SLR Project No.: 138.21581.00003 |
Figure 11-20: Pirquitas Ag Log
Probability Distributions
Figure 11-21 illustrates the 25 g/t Ag and 50 g/t Ag envelopes for
the Cortaderas area.
| | 11-31 | |
| SSR Mining Inc. | Puna Operations S-K 1300 Report | February 12, 2024 SLR Project No.: 138.21581.00003 |
Figure 11-21: Cortaderas Ag
Domain Vein Models – Cross Sections Looking Southwest-Northeast
| 11.3.3 | Exploratory Data Analysis |
The 2023 modeling dataset contains 147,830 sample records, of which
141,009 have associated silver assay data (for a total meterage of 170,516.8 m of silver assays and a weighted mean value of 40.8 g/t
Ag), 133,580 have associated zinc assay data (with a weighted mean of 0.79% Zn), and 97,341 have associated lead assay data (with a weighted
mean of 0.05% Pb).
The basic statistical summary of the assay sample data used in the 2023
resource modelling at Pirquitas is provided in Table 11-11 and Figure 11-22.
Table 11-11: Statistical Summary
of Raw Assay Data Used in Pirquitas 2023 Modeling
| Element |
Count |
Length |
Min. |
Max. |
Mean |
SD |
CV |
| Ag (g/t) |
141,009 |
170,516 |
0.005 |
65,899 |
40.8 |
323 |
7.9 |
| Zn (ppm) |
133,580 |
163,080 |
4.000 |
445,600 |
7,789.4 |
18,810 |
2.4 |
| Pb (ppm) |
97,341 |
126,846 |
1.000 |
300,000 |
517.9 |
2,331 |
4.5 |
| | 11-32 | |
| SSR Mining Inc. | Puna Operations S-K 1300 Report | February 12, 2024 SLR Project No.: 138.21581.00003 |
Figure 11-22: Ag, Pb, and Zn
Box Plot
Additionally, contact profile analysis was completed to define the relationship
of the estimation domains across the contact. Most of the contact was defined as soft in a short range of 1.5 m. The breccia unit shows
hard contacts.
| 11.3.4 | Treatment of High Grade Assays |
To avoid any undue influence of high grade outliers on the grade estimate,
SSR used capping thresholds as shown in Table 11-12. Thresholds were defined based on the shape of the upper tail of silver, zinc, and
lead distributions for each domain and coefficient of variation and the metal reduction after capping.
Table 11-12: Summary Statistics
of Raw Assay Data Used in 2023 Modelling – Pirquitas
| Variable / Domain |
Threshold (ppm) |
Count |
Original |
Capped |
Metal Loss |
| Mean (ppm) |
CV |
Mean (ppm) |
CV |
| Ag / Mod grade |
2,000 |
26,526 |
61.8 |
5.1 |
54.5 |
3.1 |
-13% |
| Ag / High grade |
6,000 |
13,588 |
244.4 |
3.8 |
228.9 |
2.6 |
-7% |
| Zn / Mod grade |
125,000 |
44,269 |
8,978.7 |
1.5 |
8,866.3 |
1.4 |
-1% |
| Zn / High grade |
200,000 |
18,135 |
27,322.4 |
1.4 |
26,573.0 |
1.3 |
-3% |
| Pb / Mod grade Zn |
15,000 |
13,253 |
1,355.5 |
3.9 |
1,313.6 |
3.1 |
-3% |
| Pb / High grade Zn |
63,000 |
31,310 |
540.8 |
3.2 |
514.2 |
2.3 |
-5% |
| | 11-33 | |
| SSR Mining Inc. | Puna Operations S-K 1300 Report | February 12, 2024 SLR Project No.: 138.21581.00003 |
Sample lengths were mostly 1.0 m (61.4%) and 2.0 m (33.9%). A minimum
sample length of 0.07 m was permitted on samples from highly mineralized structures such as veins, stockworks, and breccias.
A composite length of 1.5 m was considered most suitable for the Pirquitas
drill hole data based on vein thickness and the minimum block size of 5 m x 5 m x 5 m. Data were composited to the selected composite
length within the interpreted wireframe solid. Residual lengths were retained as individual composites.
A variographic analysis was undertaken to define grade continuity within
the estimation domains.
Normal score semi-variograms were used to find continuity directions
and ranges. Three dimensional variography analysis was undertaken on 1.5 m composite intervals for silver, lead, and zinc. Downhole variograms
(omni-directional) were used to determine the nugget effect.
The general orientation and shape of the veins (wireframes) were used
to model the variogram, however, local continuity of the veins was adjusted by dynamic anisotropy. An example in Figure 11-23 illustrates
the medium grade silver variogram.
Figure 11-23: Medium Grade Ag
Variogram
Source: SSR 2023
| | 11-34 | |
| SSR Mining Inc. | Puna Operations S-K 1300 Report | February 12, 2024 SLR Project No.: 138.21581.00003 |
Table 11-13 summarizes the variogram models for silver, lead, zinc,
and specific gravity (SG).
Table 11-13: Pirquitas Variogram
Models
| Element |
Domain |
Nugget |
Orientation (°) |
First Structure |
Second Structure |
| Dip |
Dip Az. |
Pitch |
Sill |
Major (m) |
Semi (m) |
Minor (m) |
Sill |
Major (m) |
Semi (m) |
Minor (m) |
| Ag |
Ind 25 BH |
0.35 |
89 |
215 |
90 |
0.49 |
11.3 |
4.6 |
3.7 |
0.16 |
51.5 |
30.7 |
10.8 |
| Ag |
Ind 25 |
0.29 |
89 |
215 |
90 |
0.61 |
10.5 |
4.6 |
3.7 |
0.16 |
44.6 |
29.8 |
10.8 |
| Ag |
Ind 50 BH |
0.35 |
89 |
215 |
90 |
0.52 |
11.5 |
4.6 |
4.5 |
0.13 |
42.3 |
30.7 |
10.8 |
| Ag |
Ind 50 |
0.32 |
89 |
215 |
90 |
0.53 |
11.5 |
6.8 |
3.2 |
0.15 |
48.5 |
32.7 |
10.8 |
| Ag |
PotBx |
0.28 |
89 |
215 |
90 |
0.61 |
10.5 |
4.6 |
3.7 |
0.16 |
44.6 |
29.8 |
10.8 |
| Pb |
Ind 25 |
0.05 |
89 |
215 |
90 |
0.27 |
6.3 |
4.6 |
3.7 |
0.11 |
42.1 |
27.1 |
11.9 |
| Pb |
Ind 50 |
0.08 |
89 |
215 |
90 |
0.17 |
6.0 |
5.4 |
3.2 |
0.09 |
20.6 |
20.0 |
10.8 |
| Zn |
Ind 12000 |
0.32 |
89 |
215 |
90 |
0.53 |
11.5 |
6.8 |
3.2 |
0.15 |
48.5 |
32.7 |
10.8 |
| Zn |
Ind 6000 |
0.05 |
89 |
215 |
90 |
0.24 |
7.0 |
4.6 |
4.5 |
0.09 |
38.1 |
29.8 |
16.7 |
| SG |
Ind 25 |
0.29 |
89 |
215 |
90 |
0.61 |
10.5 |
4.6 |
3.7 |
0.16 |
44.6 |
29.8 |
10.8 |
| SG |
Ind 25 |
0.32 |
89 |
215 |
90 |
0.53 |
11.5 |
6.8 |
3.2 |
0.15 |
48.5 |
32.7 |
10.8 |
| 11.3.7 | Grade Estimation Parameters |
Grade estimation was carried out within a block model with 2.5 m x 2.5
m x 2.5 to 5 m x 5 m x 5 m cells. The block model setup is shown in Table 11-14. The model is not
rotated.
Table 11-14: Pirquitas Block
Model Extents and Dimensions
| Direction |
Minimum |
Maximum |
Parent Cell Size
(m) |
Number of Cells |
| East |
751,800 |
753,330 |
5 |
306 |
| North |
7,488,610 |
7,490,490 |
5 |
376 |
| Elevation |
3,110 |
4,530 |
5 |
284 |
Cells in the model were coded with the various domains on a majority
basis.
The wireframe surfaces and solids representing topography, oxide surface,
overburden, and vein interpretation were used to code each cell with the proportion of its volume relative to these features.
Silver, lead, and zinc grades were estimated by domains using OK. ID2
and NN estimates were also run for validation purposes.
For silver and zinc, the vein boundaries were mostly treated as soft
boundaries such that the composites within the domain were permitted to inform estimates in blocks that fell within 1.5 m from the contact.
Lead domains and density domains were estimated with hard boundaries.
| | 11-35 | |
| SSR Mining Inc. | Puna Operations S-K 1300 Report | February 12, 2024 SLR Project No.: 138.21581.00003 |
The blocks were estimated with a minimum and maximum of five and 20
composites, respectively. A maximum of two composites per drill hole were allowed, therefore blocks were estimated with at least three
drill holes.
| 11.3.8 | Estimation Validation |
SLR’s validation followed industry standard
techniques and included:
| · | Visual inspection of cross sections, viewing composites versus block estimates |
| · | Comparison of average assay grades with average block estimates along northing easting, and elevation directions (swath plots) |
| · | Comparison of estimation statistics by domain |
SLR observed that OK estimated mean, concerning NN mean, in mineralized
domains is 20% lower in Ag and 13% lower in Zn. However, visually Ag, Pb, and Zn estimates show good correlation with the drill hole samples
as it is shown in Figures 11-24 and 11-25.
Swath plots in azimuth direction also show high correlation between
the OK and NN for silver, lead, and zinc. Figure 11-26 illustrates correlation between the OK and NN estimates in the vertical, azimuth,
and dip direction.
| | 11-36 | |
| SSR Mining Inc. | Puna Operations S-K 1300 Report | February 12, 2024 SLR Project No.: 138.21581.00003 |
Figure 11-24: Cross-Section
Looking North-Northwest (Az. 220°) Showing Ag Block Grade Estimates
| | 11-37 | |
| SSR Mining Inc. | Puna Operations S-K 1300 Report | February 12, 2024 SLR Project No.: 138.21581.00003 |
Figure 11-25: Cross-Section
Looking North-Northwest (Az. 220°) Showing Zn Block Grade Estimates
| | 11-38 | |
| SSR Mining Inc. | Puna Operations S-K 1300 Report | February 12, 2024 SLR Project No.: 138.21581.00003 |
Figure 11-26: Pirquitas Medium
and High Grade Ag Swath Plot
Results of the model validations indicate that the 2023 grade estimates
honor the input geological and drill hole data both globally and locally.
Density database contains 140,281 measurements with an average of 2.77
g/cm3.
Simple kriging was used to estimate the density inside and outside of
the Ag 25 g/t domain. Waste blocks under the original topographic surface were assigned with a density of 2.71 g/cm3.
Visual and statistical validations were completed to ensure density
represent the sampling data.
Pirquitas Mineral Resource classification follows the definitions for
Mineral Resources in S-K 1300 (see subsection 11.2.9).
Similar to Chinchillas, Pirquitas classification was based on the minimum
and maximum distance to the closest three drill holes. Previous classification methodology had used a combination of drill hole spacing,
search volume, distance from underground workings, mineralization continuity considerations, comparisons in locations of high-grade vein
and stockwork structures between the model and open pit observations, reconciliation between the model and grade control and production
data, and discussions with mine-based geological staff.
The classification criteria used are shown in Table
11-8. Blocks that fall within underground reporting shapes and meet the classification criteria are reported as Mineral Resource.
| | 11-39 | |
| SSR Mining Inc. | Puna Operations S-K 1300 Report | February 12, 2024 SLR Project No.: 138.21581.00003 |
Table 11-15: Pirquitas Classification
Parameters
| Class |
Code |
Average Distance to Drill Hole (m) |
| Minimum |
Maximum |
| Measured |
1 |
0 |
18 |
| Indicated |
2 |
18 |
50 |
| Inferred |
3 |
50 |
150 |
The average distances for Measured and Indicated are equivalent to a
drilling spacing of 25 m and 70 m, respectively. The largest estimation domain variogram ranges vary from 40 m to 52 m. SLR observed that
the average distance of the Indicated blocks within the Resource Stopes is 40.8 m in average.
| 11.3.11 | Reasonable Prospects for Economic Extraction |
Mineral Resources must demonstrate RPEE, which generally implies that
the quantity and grade estimates meet certain economic thresholds and that the Mineral Resources are reported at an appropriate cut-off
grade taking into account extraction scenarios.
Metal prices used for reserves are based on consensus, long term forecasts
from banks, financial institutions, and other sources. For resources, metal prices used are slightly higher than those for reserves.
The Pirquitas Mineral Resource estimate is contained within underground
mining shapes using an NSR cut-off value of $110/t that is based on metal prices of $22.00/oz for silver, $0.95/lb for lead, and $1.15/lb
for zinc. The NSR cut-off grade selected for the Pirquitas Mineral Resources assumes that underground mining will be used for extraction
and the Pirquitas plant could be used for processing. It is recommended that the Mineral Resources estimate be re-evaluated and assessed
with a study to determine the development horizon available prior to the completion of the Chinchillas open pit and the impact of the
current operation on the Pirquitas Mineral Resource.
| 11.3.12 | Mineral Resource Reporting |
SSR has advised that there are no known factors related to environmental,
permitting, legal, title, taxation, socio-economic, marketing, or political issues that could materially affect the Mineral Resource estimates.
Mineral Resources that are not Mineral Reserves do not have demonstrated economic viability. The estimates of Mineral Resources may be
materially affected by environmental, permitting, legal, title, taxation, socio-political, marketing, or other relevant issues. The quantity
and grade of reported Inferred Mineral Resources are uncertain in nature and there has been insufficient exploration to classify these
Inferred Mineral Resources as Indicated or Measured Mineral Resources. It cannot be assumed that all or any part of an Inferred Mineral
Resource will be upgraded to an Indicated or Measured Mineral Resources as a result of continued exploration.
There are no Mineral Reserves estimated for Pirquitas.
The Pirquitas Mineral Resources are summarized in Table 11-16.
| | 11-40 | |
| SSR Mining Inc. | Puna Operations S-K 1300 Report | February 12, 2024 SLR Project No.: 138.21581.00003 |
Table 11-16: Summary of Pirquitas
Mineral Resource Estimate – December 31, 2023
| Mineral Resources Classification |
Tonnage
(kt) |
Grades |
Contained Metal |
| Ag |
Zn |
Silver |
Zinc |
| (g/t) |
(%) |
(koz) |
(klb) |
| Measured |
1,258.9 |
349.9 |
6.46 |
14,162 |
179,286 |
| Indicated |
1,221.1 |
250.4 |
5.22 |
9,831 |
140,530 |
| Measured + Indicated |
2,480.0 |
300.9 |
5.85 |
23,992 |
319,816 |
| Inferred |
1,320.2 |
194.9 |
7.28 |
8,273 |
211,892 |
Notes:
| 3. | The Pirquitas Mineral Resource estimate was reported in accordance with S-K 1300. |
| 1. | Mineral Resources are reported based on December 31, 2023 topography surveys. |
| 2. | The Mineral Resources estimate is based on metal price assumptions of $22.00/oz silver and $1.15/lb zinc. |
| 3. | The Mineral Resources estimate is contained within underground mining shapes based on a $110/t NSR cut-off value. |
| 4. | Metallurgical recoveries vary with grade and on average are: 82.7% silver and 53.7% for zinc. |
| 5. | The point of reference for Mineral Resources is entry to the processing facility. |
| 6. | Mineral Resources are reported exclusive of Mineral Reserves. There are no Mineral Reserves at Pirquitas. |
| 7. | SSR has 100% ownership of the Project. |
| 8. | Ounces reported represent troy ounces; g/t represents grams per metric tonne, and lb represents pounds. |
| 9. | Totals may vary due to rounding. |
| 11.3.13 | Mineral Resource Uncertainty |
Mineral Resources are not Mineral Reserves and do not have demonstrated
economic viability, nor is there certainty that all or any part of the Mineral Resource estimated here will be converted to Mineral Reserves
through further study.
Sources of uncertainty that may affect the reporting of Mineral Resources
include sampling or drilling methods, data processing and handling, geologic modeling, and estimation. There are sources of uncertainty
in the Mineral Resource estimate for the Project which depend on the classification assigned. The SLR QP has not identified any technical
and/or economic factors that require resolution with regard to the Mineral Resource estimate.
The SLR QP is of the opinion that with consideration of the recommendations
summarized in Sections 1 and 23 of this TRS, any issues relating to all relevant technical and economic factors likely to influence the
prospect of economic extraction can be resolved with further work.
The SLR QP reviewed the assumptions, parameters, and methods used to
prepare the Pirquitas Mineral Resource Statement and is of the opinion that the Mineral Resources are estimated and prepared in accordance
with S-K 1300.
| 11.4 | Comparison with Previous Mineral Resource Estimates |
| 11.4.1 | Chinchillas Comparison – 2023 vs. 2022 |
The December 31, 2023 Mineral Resource estimate, exclusive of Mineral
Reserves, has been compared The 2023 Mineral Resource exclusive of Mineral Reserves has been compared with the previous December 31, 2022
Mineral Resource estimate as reported in SSR’s 2022 Form 10-K filing (SSR, 2023).
| | 11-41 | |
| SSR Mining Inc. | Puna Operations S-K 1300 Report | February 12, 2024 SLR Project No.: 138.21581.00003 |
Chinchillas contained silver increased by 14.0 Moz in the Measured and
Indicated categories and 3.6 Moz in the Inferred category. Key changes in the Mineral Resources (contained metal) have resulted from:
| · | A decrease due to mining depletion. |
| · | An increase due to the extension of mineralization towards the northeast (Melina area), which was not previously included in the resource
pit shell. |
| · | An NSR cut-off value of $33.20/t was used for the December 31, 2022 Mineral Resource estimate. The current Mineral Resource estimate
is based on an NSR cut-off value of $37.91/t. The difference is due to an increase in cost. |
| · | An increase to the low grade (below the reserve cut-off NSR value of $48.91/t) stockpile. |
| 11.4.2 | Pirquitas Comparison – 2023 vs. 2021 |
The December 31, 2023 Mineral Resource estimate has been compared to
the previous Mineral Resource estimate reported by OreWin (2022). Key changes in the Mineral Resources (contained metal) have resulted
from:
| · | During the period 2022 to 2023, 31 drill holes (14,237 m) were incorporated into the database. The new drilling confirmed the continuity
of mineralization and extended mineralization toward the west and at depth increasing the Mineral Resources. |
| · | The Mineral Resources estimated in 2021 were based on metal prices of $20/oz silver, $1.10/lb lead, $1.30/lb zinc, and $5.00/lb
Sn, and an NSR cut-off value of $100.00/t NSR, while the current Mineral Resources are using metal prices of $22/oz silver, $0.95/lb lead,
and $1.15/lb zinc, and an NSR cut-off value of $110.00/t NSR. Table 11-17 compares the economic parameters used in 2021 and 2023.
As a result, the combined Measured and Indicated Mineral Resources decreased slightly. |
Table 11-17: 2021 and 2023 Mineral
Resource Economic Parameters
| Prices |
Units |
2021 |
2023 |
| Ag |
$/oz |
20 |
22 |
| Pb |
$/lb |
1.1 |
0.95 |
| Zn |
$/lb |
1.3 |
1.15 |
| NSR |
$/t |
100 |
110 |
Table 11-18 compares the current Pirquitas Mineral Resource estimate
to the OreWin December 31, 2021 estimate.
| | 11-42 | |
| SSR Mining Inc. | Puna Operations S-K 1300 Report | February 12, 2024 SLR Project No.: 138.21581.00003 |
Table 11-18: Pirquitas 2021
and 2023 Mineral Resource Comparison
| Category |
2023 MRE |
2021 MRE |
Contained Metal Differences (%) |
| Mineral Resource Classification |
Tonnage |
Grades |
Contained Metal |
Tonnage |
Grades |
| (kt) |
Ag |
Zn |
Silver |
Zinc |
(kt) |
Ag |
Zn |
Silver |
Zinc |
| (g/t) |
(%) |
(koz) |
(klb) |
(g/t) |
(%) |
(%) |
(%) |
| Measured |
1,259 |
350 |
6.46 |
14,162 |
179,286 |
79 |
445 |
1.17 |
92.0 |
98.9 |
| Indicated |
1,221 |
250 |
5.22 |
9,831 |
140,530 |
2,555 |
288 |
4.56 |
-140.4 |
-82.8 |
| Measured + Indicated |
2,480 |
301 |
5.85 |
23,992 |
319,816 |
2,634 |
292 |
4.46 |
-3.2 |
19.0 |
| Inferred |
1,320 |
195 |
7.28 |
8,273 |
211,892 |
1,080 |
207 |
7.45 |
13.2 |
16.3 |
| | 11-43 | |
| SSR Mining Inc. | Puna Operations S-K 1300 Report | February 12, 2024 SLR Project No.: 138.21581.00003 |
| 12.0 | Mineral Reserve Estimates |
The Mineral Reserve estimate for Chinchillas was completed by the site
technical department. The SLR QP has reviewed the assumptions, parameters, and methods used to prepare the Mineral Reserves Statement
and is of the opinion that the Mineral Reserves are estimated and prepared in accordance with S-K 1300.
The Mineral Reserve estimate with an effective date of December 31,
2023 is summarized in Table 12-1.
Table 12-1: Summary of Chinchillas
Mineral Reserves as of December 31, 2023
| Category |
Tonnage
(kt) |
Grades |
Contained Metal |
Cut-off NSR
($/t) |
Metallurgical Recovery |
| Ag |
Pb |
Zn |
Silver |
Lead |
Zinc |
Ag |
Pb |
Zn |
| (g/t) |
(%) |
(%) |
(koz) |
(klb) |
(klb) |
(%) |
(%) |
(%) |
| Proven – Ex-pit |
1,129 |
164.70 |
1.42 |
0.21 |
5,980 |
35,307 |
5,261 |
48.97 |
95.7 |
93.2 |
38.9 |
| Probable- Ex-pit |
2,417 |
160.44 |
1.23 |
0.20 |
12,469 |
65,396 |
10,850 |
48.97 |
| Probable – Stockpiles |
620 |
111.80 |
0.88 |
0.32 |
2,228 |
12,051 |
4,388 |
48.97 |
| Total |
4,166 |
154.36 |
1.23 |
0.22 |
20,677 |
112,755 |
20,499 |
48.97 |
Notes:
| 1. | The Mineral Reserve estimate was prepared in accordance with S-K 1300. |
| 2. | The Mineral Reserve estimate is based on a metal price assumption of $18.50/oz silver, $0.90/lb lead, and $1.05/lb zinc and is reported
at a net smelter return (NSR) cut-off value of $48.97/t ore processed. |
| 3. | No mining dilution is applied to the grade of the Mineral Reserves. Dilution intrinsic to the Mineral Reserve estimate is considered
sufficient to represent the mining selectivity considered. |
| 4. | The Project is 100% owned by SSR. |
| 5. | Metals shown in the table are the contained metals in ore mined and processed. |
| 6. | Ounces reported represent troy ounces; g/t represents grams per metric tonne and lb represents pounds. |
| 7. | Totals may vary due to rounding |
The SLR QP is not aware of any risk factors associated with, or changes
to, any aspects of the modifying factors such as mining, metallurgical, infrastructure, permitting, or other relevant factors that could
materially affect the Mineral Reserve estimate.
This section describes the methodology and parameters used to estimate
the Chinchillas Mineral Reserves. The Mineral Reserve estimate as of December 31, 2023, considers all information used in the Mineral
Resource estimate as of December 31, 2023, as presented in Section 11 of this TRS.
No Mineral Reserves were estimated for Pirquitas.
| 12.2 | Conversion to Mineral Reserves |
Mineral Reserves have been classified in accordance with S-K 1300.
| | 12-1 | |
| SSR Mining Inc. | Puna Operations S-K 1300 Report | February 12, 2024 SLR Project No.: 138.21581.00003 |
Pit optimizations were run on the Mineral Resource block model using
the Pseudoflow algorithm to generate optimal pit limits based on block value. The block value is based on the unit mining costs ($/t)
and an NSR value ($/t processed) calculated for each block. Two NSR values are calculated for each block based on the lead and zinc content
of the block, named Lead Rich and Zinc Rich ore respectively. The NSR values for Mineral Reserves used a price of $18.50/oz for silver,
$0.90/lb for lead, and $1.05/lb for zinc.
IRAs for the final pit design range between 40° and 51° in rock,
with a 20 m geotechnical stepout berm at 4,045 m elevation.
Mining, processing, and G&A costs, and sustaining capital costs
were estimated based on historical values and budgeted costs. Processing costs include the ore transport costs for hauling the ore to
the Pirquitas plant 42 km away. Royalties, export duties, and credits were also included in the optimization costs.
The Mineral Reserves for Chinchillas were estimated using the as-mined
surface at December 31, 2023, with the following assumptions and parameters:
| · | There are Measured and Indicated Mineral Resources within the final pit design that are converted to Proven and Probable Mineral Reserves.
Inferred Mineral Resources are not considered in the Mineral Reserve estimation. |
| · | The mining recovery is 100% within the pit design. |
| · | The Mineral Resources were not diluted (see Section 11 for reconciliation data). Internal dilution included in the Mineral Resource
estimate is considered adequate. |
| · | The Mineral Reserve estimate assumes that mining operations will continue to use the current mining methods used by MPSA, as described
in Section 13. |
| · | The estimated NSR cut-off value is $48.97/t processed ore. |
The SLR QP is unaware of any current environmental, permitting, legal,
title, taxation, socio-economic, marketing, political, or other relevant factors that could materially affect the Mineral Reserve estimate
as of December 31, 2023.
The ore from Chinchillas is hauled to the stockpiles in the staging
area close to the pit. There are three stockpiles in the stage out area based on the NSR values:
| · | High Grade (HG) stockpile with an NSR value greater than $60/t. |
| · | Medium Grade (MG) stockpile with an NSR value above the Mineral Reserve cut-off of $48.97/t and below $60/t. |
| · | Mineralized Waste (MW) stockpile with an NSR value above the Mineral Resource cut-off of $37.91/t and below the Mineral Reserve cut-off
of $48.97/t. |
The MW stockpile ore is not included in the Mineral Reserve estimate
and is stockpiled separately for potential future use.
The closing balances of the stockpiles as of December 31, 2023 are presented
in Table 12-2.
| | 12-2 | |
| SSR Mining Inc. | Puna Operations S-K 1300 Report | February 12, 2024 SLR Project No.: 138.21581.00003 |
Table 12-2: Stockpile Closing
Balances –December 31, 2023
| Details |
Units |
HG Stockpile |
MG Stockpile |
Total |
| Ore Tonnage |
kt |
307 |
313 |
620 |
| Silver Grade |
g/t Ag |
155.16 |
69.33 |
111.80 |
| Lead Grade |
% Pb |
1.13 |
0.64 |
0.88 |
| Zinc Grade |
% Zn |
0.25 |
0.39 |
0.32 |
| NSR Grade |
$/t |
83.43 |
36.81 |
59.88 |
The NSR is calculated for each cell in the block model based on the
metal price assumptions discussed in subsection 12.2. The two NSR values calculated for Lead Rich and Zinc Rich ore, respectively, incorporate
the following economic evaluation criteria:
| · | Fixed metal prices and Sales Contract Pay Factors |
| · | Mass pull factors for the silver/lead concentrate and zinc concentrate |
| · | Variable recoveries for silver, lead, and zinc for the two concentrates taking into account the respective tail grades. |
| · | Bulk treatment costs, refining costs, transportation and port costs, and royalties (5%). |
An NSR calculation example is shown in Table 12-3. The various formulae
used in the calculations are also provided for reference. The calculation is coded into a PERL script and is used to update the block
model cells with all the variables in Hexagon’s MineSight software and the higher of the two calculated NSR values based on the
ore type is stored in the variable “NSR23” of the block model.
Table 12-3: Net Smelter Return
– 2023 Calculation
| |
Unit |
Value |
| Metal Grade |
|
|
| Silver |
g/t |
245.35 |
| Lead |
% |
2.27 |
| Zinc |
% |
0.04 |
| Metal Prices |
|
|
| Silver |
US$/oz |
18.50 |
| Lead |
US$/lb |
0.90 |
| Zinc |
US$/lb |
1.05 |
| Mass Pull |
|
|
| Silver-Lead Concentrate (MPAgPb) |
% |
3.09% |
| Zinc Concentrate (MPZn) |
% |
0.09% |
| Lead/Silver Tail Grade |
|
|
| Silver (AgTG) |
g/t |
6.69 |
| Lead (PbTG) |
% |
0.10 |
| Zinc (ZnTG) |
% |
0.04 |
| |
|
|
|
| | 12-3 | |
| SSR Mining Inc. | Puna Operations S-K 1300 Report | February 12, 2024 SLR Project No.: 138.21581.00003 |
| |
|
Silver-Lead Concentrate |
Zinc Concentrate |
| Recovery |
|
|
|
| Silver |
% |
97.6
(AGRC1) |
-0.50
(AGRC2) |
| Lead |
% |
95.8
(PBRC1) |
-0.19
(PBRC2) |
| Zinc |
% |
0
(ZNRC2) |
10.89
(ZNRC1) |
| Concentrate Produced |
dmt/t feed |
0.0309 |
0.0009 |
| Concentrate Grade |
|
|
|
| Silver |
g/dmt |
7,736.4 |
(37.1)
(AGZN) |
| Lead |
% |
70.42 |
-0.21 |
| Zinc |
% |
0 |
5.0
(ZNCON) |
| Concentrate Metal |
|
|
|
| Silver (fixed) |
kg/t con |
7,736 |
-0.037 |
| Lead (fixed) |
kg/t con |
704.2 |
-2.1 |
| Zinc |
kg/t con |
0 |
49.6 |
| Sales Contract Pay Factors |
|
|
|
| Silver |
% |
95.50 |
0 |
| Lead |
% |
95.00 |
- |
| Zinc |
% |
0 |
-61 |
| Payable Metals |
|
|
0 |
| Silver |
kg/t con |
7.388 |
0 |
| Lead |
kg/t con |
669.0 |
-30.4 |
| Zinc |
kg/t con |
0 |
|
| Gross Metal Payment |
|
|
|
| Silver |
$/t con |
|
- |
| Lead |
$/t con |
|
- |
| Zinc |
$/t con |
|
(70.43) |
| Total |
$/t con |
|
(70.43) |
| Deductions |
|
|
|
| Bulk Treatment |
$/t con |
(204.82) |
(159.00) |
| Ag Refining |
$/t con |
(211.72) |
- |
| Transportation and Port |
$/t con |
(300.00) |
(300.00) |
| | 12-4 | |
| SSR Mining Inc. | Puna Operations S-K 1300 Report | February 12, 2024 SLR Project No.: 138.21581.00003 |
| |
|
Silver-Lead Concentrate |
Zinc Concentrate |
| Subtotal |
$/t con |
(716.54) |
(450.00) |
| Final Metal Payment |
$/t con |
5,005.55 |
(529.43) |
| Final Metal Payment |
$/t ore |
154.55 |
-0.48 |
| Royalties |
% |
5 |
|
| NSR Block Value Lead Rich Ore |
$/t |
146.37 |
|
| Zn Rich Ore (Zn>Pb) |
|
|
|
| Ag Payable (AGPAY) |
% |
78.91 |
|
| Zn Payable (ZNPAY) |
% |
29.54 |
|
| NSR Block Value Zinc Rich Ore |
$/t |
92.45 |
|
Notes:
| 1. | Recovery and mass pull models developed from 2022 plant performance data. |
| 2. | Payment, Treatment and Refining charges are from Sales contracts for 2022, Ocean Partners, Korea Zinc and Sumitomo |
| 3. | Freight is typical recent actuals |
| MPAgPb |
=-0.00134738+0.0166768868*Pb%^0.8034686591 |
| MPZn |
=-0.001773783+0.0703150118*MPAgPb+0.01273445*Zn% |
| AGRC1 |
=(0.8863891859-0.218499237*Pb%-0.065012621*Zn%+18.972364893*MPAgPb)*100 |
| PBRC1 |
=(0.97962259-0.05614944*Pb%^-1.155559)*100 |
| ZNRC2 |
=(IF(0.4124218663-0.00157677*Ag-0.14277212*Zn%+0.00000384382*Ag^2-0.013498334*
Pb%/Zn%<0,0,0.4124218663-0.00157677*Ag-0.14277212*Zn%+0.00000384382*Ag^2-0.013498334*
Pb%/Zn%))*100 |
| ZNRC1 |
=(0.7476240077-0.004341182*MPZn^-0.712456966)*100 |
| AGRC2 |
=(-0.107655833-0.030949572*Pb%+1.6861916742*PbTG+2.3175033022*
MPZn+0.039446559*ZNRC1/100)*100 |
| PBRC2 |
=(-0.03700409+0.406772931*PbTG+0.0003905143*AgTG+0.1296140043*ZnTG-10.44877266
*MPZn+0.7020556532*AGRC2/100)*100 |
| Zinc/Silver Con Payable |
| Silver |
=IF(AGZN<93,0,0.75-69.75/AGZN) |
| Lead |
=0 |
| Zinc |
=MIN(85%,(ZNCON*1000-80)/(ZNCON*1000)) |
| Lead Zinc Refining |
=-0.8913*AGPAY*1000/31.1035 |
| SilverSaleCost |
=0.92/(1+EXP(-0.0043725*(Ag+165.85648-770.82311*Zn/100))) |
| ZincSaleCost |
=IF(Zn<3,0.00229429*(Ag*Zn/100-0.0729412*Ag+259.707)*((Zn/100*(85*(Zn/100)^2-6.2*
(Zn/100)+1))/(1-0.00453%*Ag))^0.0807,0.589726*(1 –(5.436*10^(-6)*Ag)/(Zn/100 ))*
((Zn/100)/((1 – 0.0000453*Ag)))^0.0807) |
NSR Block Value ($/t ore Zinc Rich)=((((1000*ZnPrice*2.2046)-ZincSaleCost)*Zn*ZNPAY/100)/1+((Ag-SilverSaleCost)*Ag*AGPAY)/31.1035)*(1-0.05)
| | 12-5 | |
| SSR Mining Inc. | Puna Operations S-K 1300 Report | February 12, 2024 SLR Project No.: 138.21581.00003 |
| 12.4 | Block Value Calculation |
The “NSR23” variable calculated as described in subsection
12.3, along with a fixed mining cost of $3.38/t mined, are then used to calculate the value of each cell in the block model. The value
per ton reserve (“VTRSV” variable) and value per block reserve (“VBRSV” variable) are calculated based on the
“NSR23” variable and classification code (“CL23” variable) above the Mineral Reserve NSR cut-off value of $48.97/t
ore.
The “VBRSV” variable in the block model is used in the optimization
process described in subsection 12.2 to generate optimal pit shells at the assumed Mineral Reserve prices.
No mining dilution was applied to the grade of the cells. Dilution intrinsic
to the Mineral Resource model is considered sufficient to represent the stated mining selectivity.
Mining recovery was assumed to be 100% of the Measured and Indicated
Mineral Resources. Inferred Mineral Resources were considered waste.
| 12.7 | Comparison with Previous Estimates |
The current Mineral Reserve estimate has been compared to the previous
December 31, 2022 Mineral Reserve estimate, which was based on the EOY 2022 pit surface. Comparison of the EOY December 2023 Mineral Reserve
with the EOY 2022 Mineral Reserve, as reported in the company’s 2022 Form 10-K (SSR, 2023), shows:
| · | a net decrease in contained silver of 12.4 Moz (-37.6%), |
| · | a net decrease in contained lead of 76.9 Mlb (-40.5%), |
| · | a net decrease in contained zinc of 16.7 Mlb (-44.9%) in the Proven and Probable categories. |
Changes have occurred due to mine depletion, resource model updates,
change in the NSR cut-off value, and design changes.
The SLR QP reviewed the assumptions, parameters, and methods used to
prepare the Mineral Reserves Statement and is of the opinion that the Mineral Reserves are estimated and prepared in accordance with S-K
1300.
The total Proven and Probable Mineral Reserves at the Chinchillas mine
are estimated to be 4.2 Mt grading 154.36 g/t Ag, 1.23% Pb, and 0.22% Zn containing 20.7 Moz Ag, 112.8 Mlb Pb, and 20.5 Mlb Zn, respectively.
The Chinchillas Mineral Reserves support a LOM of 2.5 years, including 1.5 years of active mining followed by an additional year of processing
the medium grade stockpiles.
| | 12-6 | |
| SSR Mining Inc. | Puna Operations S-K 1300 Report | February 12, 2024 SLR Project No.: 138.21581.00003 |
MPSA uses standard open pit mining methods with a LOM sustained mining
rate of approximately 22,600 tpd at the Chinchillas operation.
Loading operations are currently carried out using CAT992 wheel loaders.
Waste and ore haulage is performed with a fleet of 92 t payload primary haul trucks with ore being stockpiled in a staging area close
to the pit. From the staging area, ore is transported to the crusher at the Pirquitas plant, which is 42 km away from Chinchillas, with
lower grade ore being processed at the end of mine life.
The mine conducts conventional drilling and blasting activities with
a free face trim blast to ensure stable wall rock conditions. Electronic detonators are used to control the timing of the blasthole detonation.
Drilling and blasting occur on benches with a height of 5.0 m. One grade
control sample is taken from each blasthole with the sub-drilling excluded. Mining occurs on the full bench height (5.0 m). Blasting is
done with an ammonium nitrate and fuel oil (ANFO) blend and a sensitized ANFO emulsion.
The Chinchillas operation geotechnical management plan (GMP) includes
surface displacement monitoring using a network of topographic prisms on the North, South, and West walls of the pit, and two base stations
located in front of the North and South wall. Recently, a Slope Monitoring system by interferometry, using Ibis ArcSAR Lite Radar has
been installed and operational as of the TRS date.
Equipment maintenance is performed on site for all equipment. There
are a number of contracted trucks and an excavator at site, in addition to the blasting operations as detailed in Section 13.7.
The SLR QP’s review was based on the following geotechnical reports
provided by MPSA:
| · | Knight Piésold Ltd. (KP), 2022 Geotechnical Assessment of Modified Final Pit Design (KP, 2022) |
| · | E-Mining Technology S.A. (E-Mining), 2023. Chinchillas Mine Geotechnical Inspection (E-Mining, 2023) |
MPSA has engaged Knight Piésold Ltd (KP) for ongoing support
to the operations since 2018. As a part of the ongoing support, KP has been involved in annual inspections over the last five years. MPSA
proposed a revised final pit design in early 2022 including a geotechnical stepout following KP geotechnical recommendations (KP, 2017).
KP provided preliminary recommendations for the proposed final design in 2022 as well as stability assessment of the MPSA proposed revised
final design.
The revised design has haul road and ramp widths designed for two-way
traffic that accommodates 92 t class haul trucks. The total road width, including berms and ditches, ranges from 11.5 m to 12.0 m. The
roads follow topography external to the pit and do not exceed a 10% grade. Ramps inside the pits are also designed at a 10% maximum grade.
In the waste rock storage area (WRSA), WRSA-A, waste rock is placed
in lifts of 20.0 m (four compacted passes of 5 m each) with 24.0 m wide berms and a slope angle of 35°. In WRSA- B/C, waste rock is
placed in lifts of 25.0 m with 15.0 m wide berms and a slope angle of 35°. There have been no WRSA stability issues at Chinchillas.
Sufficient storage capacity for waste rock material has been identified to support the mining production and LOM.
| | 13-1 | |
| SSR Mining Inc. | Puna Operations S-K 1300 Report | February 12, 2024 SLR Project No.: 138.21581.00003 |
| 13.1.1 | KP 2022 Geotechnical Assessment of Modified Final Pit Design |
The key change to the proposed 2022 final pit design is the geotechnical
‘stepout’ of 20.0 m at 4,045 m elevation as shown in Figure 13-1. This stepout effectively results in breaking the more
than 200.0 m high interramp slope into two stacks. Bench face angles (BFAs) and IRAs for the west wall were slightly steepened below the
stepout to accommodate the changes. The proposed revised lower pit wall configurations are summarized in Table 13-1, along with the
currently applied pit slope configurations in existing upper pit walls. KP has noted that the upper west wall and east wall slope configurations
are consistent with the FS pit slope design recommendations (KP, 2017). In addition, KP also points out to the flatter slope configurations
for the upper southwest wall after the recent slope failures in this area (KP, 2019, 2021).
| | 13-2 | |
| SSR Mining Inc. | Puna Operations S-K 1300 Report | February 12, 2024 SLR Project No.: 138.21581.00003 |
Figure 13-1: Proposed Final
Pit Design – Prospective View Looking West
Source: KP, 2022
| | 13-3 | |
| SSR Mining Inc. | Puna Operations S-K 1300 Report | February 12, 2024 SLR Project No.: 138.21581.00003 |
Table 13-1: Final Pit Design
– Revised Slope Configurations
| Pit Design Sector |
Pit Wall Geotechnical Unit |
Current Applied Pit Design for Upper Pit Walls |
Proposed
Revised Pit Design
for Lower Pit Walls |
| BenchHeight (m) |
BFA (°) |
BenchWidth (m) |
IRA (°) |
BenchHeight (m) |
BFA (°) |
BenchWidth (m) |
IRA (°) |
| West |
Metasedimentary
Basement and Breccia |
20 |
75 |
11.5 |
50 |
20 |
77 |
11.5 |
51 |
| Southwest |
Breccia / Pyroclastic
Tuff mix |
20/10 |
65/70 |
12/7 |
43 |
20 |
65 |
12 |
43 |
| East |
Pyroclastic Tuff |
20/10 |
60/65 |
12/7.5 |
40 |
20 |
60 |
12 |
40 |
| Northwest |
Breccia / Pyroclastic
Tuff Transition |
20 |
75 |
13.5 |
47 |
20 |
65 |
12 |
43 |
Source: KP, 2022
KP conducted kinematic stability analyses and rock mass stability analyses
to examine potential impacts to bench, interramp, and overall slope stability. In general, KP finds the applied slope geometries for the
revised final pit design to be appropriate, with a number of potential risks and recommendations identified. KP also emphasizes that blasting
practices and dewatering requirements are the major controlling factors for pit wall stability as the mine mostly will be operating in
the lower benches of the pit. KP summarizes the recommendations as follows:
| · | Conduct pre-shear blasting for full height benches and implement low-damage, well-controlled blasting for final pit walls. |
| · | Implement proper bench scaling and debris cleaning before advancing the lower benches. |
| · | Implement active slope depressurization, e.g., vertical pumping wells in the west wall. |
| · | Install horizontal drains along the west wall geotechnical stepout bench and in the lower benches. |
| · | Conduct regular visual inspections and set up prism monitoring for critical slopes. |
| · | Verify the geological contact zone in the southwest wall area to assign flatter IRAs to the Pyroclastic Tuff unit. |
| 13.1.2 | E-Mining 2023 Geotechnical Review |
In June 2023, E- Mining conducted a review of the geotechnical condition
of the open pit and WRSA at Chinchillas.
E-Mining notes the fact that the mine intersects Chinchillas Creek,
belonging to the Colquimayo River Basin, with an average rainfall of between 50 mm to 150 mm/month between the months of November and
April. This requires effective drainage systems to be implemented to be of sufficient capacity to ensure that the magnitude of rainfall
does not lead to the bottom of the mine being flooded and the pit becoming nonoperational. With mining being focused in the lower benches,
sufficient care needs to be taken to manage both surface and groundwater, to also ensure the pit walls are not saturated and the stability
of slopes is maintained.
| | 13-4 | |
| SSR Mining Inc. | Puna Operations S-K 1300 Report | February 12, 2024 SLR Project No.: 138.21581.00003 |
E-Mining supports the decision to implement an interferometric measurement
system through the installation of ground-based radar. Slope Monitoring system by interferometry, using Ibis ArcSAR Lite Radar is already
installed, with a range of 2,500 m and a monitoring radius of 180° with data captured every 4 minutes. The monitoring focus is on
the south wall but due to the location and angle MPSA are able to also monitor the west wall and part of the A dump. This is complementary
to the already available topographic prism monitoring shown in Figure 13-2.
Figure 13-2: Chinchillas Mine
– Location of Topographic Prisms for Monitoring
Source: E-Mining, 2023
The importance of proper blasting including pre-splitting the walls
and groundwater management is reiterated by E-Mining as well.
E-Mining classified the WRSAs based on the Dump Stability Rating (DSR)
system. DSR is a numerical index based on eleven factors, where each factor is assigned a weighted score according to its overall importance,
and the sum of the factors represent the DSR values. According to the DSR classification, WRSA-A is classified as Class II, meaning low
risk of failure. WRSA-B/C is classified as Class I, meaning negligible danger of failure.
| 13.2 | Pit Phases and Timing |
The pit optimization for the LOM plan used a block value calculation
with an internal NSR value of $48.97/t ore processed. The optimized pit was built into an ultimate pit design that included access and
took into account geotechnical considerations for designed highwall angles including the 20 m wide geotechnical stepout along the 4,045
m bench elevation, effectively breaking the more than 200 m high interramp slope into two stacks.
| | 13-5 | |
| SSR Mining Inc. | Puna Operations S-K 1300 Report | February 12, 2024 SLR Project No.: 138.21581.00003 |
Figure 13-3 shows the end of mine life reserve pit and WRSAs. Tonnages
for the Chinchillas operations are shown in Table 13-2. The final configuration of the Chinchillas pit is approximately 750 m long,
660 m wide, and 235 m deep.
Table 13-2: Mining Phase Design
Summary
| Phase Name |
Ore |
Waste |
Strip Ratio |
| (kt) |
(kt) |
| Chinchillas Pit |
3,547 |
8,413 |
2.4 |
| Chinchillas – Stockpiles |
620 |
|
|
| Total |
4,166 |
8,413 |
2.0 |
| | 13-6 | |
| SSR Mining Inc. | Puna Operations S-K 1300 Report | February 12, 2024 SLR Project No.: 138.21581.00003 |
Figure 13-3: End of Mine Life
Reserve Pits
| 13.3 | Production Rates, Mine Life, Dimensions, and Dilution Factors |
Mining is scheduled 24 hours per day, 365 days per year on a rotation
of two, 12-hour shifts. The current mine plan provides 2.5 years of operational life, including 1.5 years of active mining followed by
an additional one year of processing the LG stockpiles.
In order to meet LOM production rates, the existing loader fleet of
two units will be maintained until the end of mine operations in mid-2025.The haul fleet averages seven 92 t class units.
The mineralized zones are structurally controlled and strike in a generally
northern direction. In the LOM model, there is no dilution or mining loss added to the Mineral Reserves for planning and scheduling. Based
on the chosen mining method and size of equipment used, dilution intrinsic to the Mineral Resource model is considered sufficient and
mining recovery of 100% is considered achievable in this type of deposit.
| | 13-7 | |
| SSR Mining Inc. | Puna Operations S-K 1300 Report | February 12, 2024 SLR Project No.: 138.21581.00003 |
| 13.4 | Stripping Requirements |
The ex-pit LOM stripping ratio is 2.4:1. Table 13-3 and Figure 13-4
show the annual production schedule for the LOM, including ore tonnes mined, waste tonnes mined, and stripping ratio.
Table 13-3: Annual Production
Schedule Tonnes Mined
| Year |
Ore (kt) |
Waste (kt) |
Strip Ratio |
| (kt) |
(kt) |
| 2024 |
2,039 |
6,461 |
3.2 |
| 2025 |
1,508 |
1,952 |
1.3 |
| Total |
3,547 |
8,413 |
2.4 |
Notes:
| 1. | The overall stripping ratio including ore from stockpile (620 kt) is 2.0:1. |
| 2. | Totals may not match due to rounding. |
Figure 13-4: Mine Annual Production
Schedule
Source: SSR, 2023
| 13.5 | Required Mining Fleet and Machinery |
The equipment list for the Chinchillas open pit operations is presented
in Table 13-4. With a mine life of 1.5 years, mining sustaining capital is not planned and the existing equipment is assumed to be
in operation until the end of the Project life. . As of the date of this TRS, MPSA has a number of tippers and an excavator that are rented,
in addition to blasting, as discussed in subection 13.7.
| | 13-8 | |
| SSR Mining Inc. | Puna Operations S-K 1300 Report | February 12, 2024 SLR Project No.: 138.21581.00003 |
Table 13-4: Chinchillas Mining
Fleet Equipment List
| Number of Items |
Equipment Name and Class |
|
| 1 |
Loader CAT 992G |
|
| 1 |
Loader CAT 992K |
|
| 7 |
CAT 777 92 t haul trucks |
|
| 23 |
Scania G440 XT Tipper |
|
| 3 |
Scania XT 380 Rented¹ |
|
| 2 |
Volvos FMX 460 Rented¹ |
|
| 2 |
Epiroc DM45 drill |
|
| 1 |
Epiroc FlexiRoc D65 drill |
|
| 1 |
Hydraulic Excavator CAT 390FL |
|
| 1 |
Hydraulic Excavator Kobelco SK 500 Rented¹ |
|
| 1 |
Watering Truck CAT 775F |
|
| 2 |
Caterpillar 16H motor graders |
|
| 1 |
Excavator CAT 349DL |
|
| 2 |
Caterpillar D9 track dozers |
|
| 1 |
Caterpillar 834H wheel dozers |
|
Notes:
¹ Rented Equipment
| 13.6 | Ore Control Drilling and Method |
Blasthole sampling is used to define ore zones. A grade control sample
is taken every 5.0 m of drilling. The sample is manually collected from a cross section of the core of drill cuttings. The procedure includes
removal of the subdrill material. Ore control personnel periodically audit the performance of the blasthole samplers and provide feedback
on compliance to standard.
Benches are mined at a height of 5.0 m with a wheel loader in stripping
and ore mining areas.
Each blasthole sample is analyzed for silver, lead, and zinc at the
on-site laboratory facility located near the Pirquitas plant. These grade values are entered into the grade control (blasthole) model.
The blast pattern is then converted to a blasthole cell model with cell sizes of 4.0 m x 4.0 m x 5.0 m. The blasthole data is kriged using
OK in two dimensions on the bench. The NSR reserve script is then run to find the NSR value of each cell in the block model. If there
is sufficient volume above the NSR cut-off grade to make a mineable shape of ore, this shape is blocked out and surveyed in the pit (indicated
by ore flags for mining) to be sent to the stockpiles as described in Section 12.2.1.
| | 13-9 | |
| SSR Mining Inc. | Puna Operations S-K 1300 Report | February 12, 2024 SLR Project No.: 138.21581.00003 |
| 13.7 | Drilling and Blasting |
Blasthole drilling is performed with two Epiroc DM45 drill rigs that
drill with both rotary and hammer drill bits. The rigs drill 17.1 cm diameter blastholes. The DM45 rigs can drill up to 8.4 m
in a single pass.
The normal explosive is a heavy ANFO (blend of ANFO and emulsion), which
is placed by a combination of both contractor and MPSA employees. An emulsion product is also used for wet holes to manage groundwater
in the winter and fall, and help break up the rock in areas of the pit that are more difficult to dig.
The blast patterns are adjusted for rock conditions. Typically, the
patterns are 6.2 m x 7.0 m for the 5.0 m benches. To help break the toe of the bench, 1.0 m of subdrilling
is added to each hole. The ore host rock generally breaks easily with blasting, and this provides a good run of mine (ROM) ore for transport
by tippers to the Pirquitas plant 42 km away from the pit.
A trim blast is performed around the limits of the mining on final highwall
configurations. This configuration is a four-row pattern that is shot to a free face to minimize blast damage and vibration into the highwalls.
Historically, a presplit blasting pattern had been used on final highwalls to ensure good wall conditions and minimize the potential for
a wall failure. A new crest and catch bench, ranging in width from 12.0 m to 20.0 m depending on the highwall angle, are formed every
20.0 vertical meters of mining. The 20.0 m geotechnical stepout is used at 4,045 m elevation, effectively breaking the more than 200 m
high interramp slope of the southwest-west-northwest wall into two stacks.
Loading operations are performed with two wheel loaders (one unit each
of CAT 992H and CAT 992K) with a 12.0 m³ bucket capacity. Digging faces are defined by ore control and are marked in the field with
flags and on maps that are provided to operators. Dig boundaries are typically adjusted to allow for movement associated with blasting.
Excavated rock is loaded into haul trucks and sent to either a WRSA
or the designated stockpile in a staging area close to the pit, based on the NSR value of the material.
Some of the waste rock generated has the potential to leach metals and
is separated from the neutral waste material. Based on the geochemical characteristics, waste is classified into three groups and designated
as Types A, B, and C material as shown in Table 13-5.
Table 13-5: Waste Material Classification
| Waste Material Type |
S |
Pb |
Zn |
| A |
<0.3 |
<0.1 |
<0.1 |
| B |
0.3<=S<=0.7 |
0.1<=Pb<=0.2 |
0.1<=Zn<=0.3 |
| C |
>0.7 |
>0.2 |
>0.3 |
Notes:
| 1. | Material with the Mineral Reserve NSR value greater than $48.97/t is sent to the plant. |
| 2. | Material with the Mineral Resource NSR value greater than $37.91/t and less than Mineral Reserve NSR value is stockpiled separately
as Mineralized Waste. |
| 3. | The block model attributes ‘OW’, ‘VAR1’, ‘WCLSS’ are scripted suitably to assist in Ore/Waste
Routing. |
| | 13-10 | |
| SSR Mining Inc. | Puna Operations S-K 1300 Report | February 12, 2024 SLR Project No.: 138.21581.00003 |
Based on the above classification, two WRSAs have been designed for
Chinchillas to accommodate different rock types (see Figure 13-3).
Type A waste is stored close to the pit as it has the potential to leach
metals. This way the drainage can be collected in the pit and, if necessary, treated. Types B and C are stored together in the same location.
WRSA-A is close to the pit, on a hill side to the northeast of the Chinchillas
pit. The toe of this dump is 100 m offset from the pit rim. WRSA-B and C are located to the southeast of the active mining area on a relatively
flatter terrain. WRSAs are built with 25 m lifts and 15 m berms. The angle of repose for each lift is 35° and the overall slope angle
of dumps is 26°. Access to the dump is by 30 m wide haulage roads. The total height of the dumps
is approximately 100 m.
MPSA has a single fleet of CAT 777 92 t class haulage trucks for ore
and waste haulage. In addition, MPSA has a fleet of Scania G440 XT tippers and a fleet of five rented tippers for transporting the ore
from the stockpiles at the staging area close to the pit to the Pirquitas plant 42 km away.
WENCO mining fleet management system is used to optimize fleet management.
In addition to tracking production in real time, the system assists in managing the fleet of trucks, loaders, and drills, and in switching
assignments and responding to OEM alerts.
Mine support functions are performed using different quantities
and types of equipment. These include water trucks, dozers, and graders as well as other non-operated ancillary equipment such as the
highwall monitoring prisms. Mine support functions include monitoring slope stability, maintaining roads and access points, among others.
This includes maintaining the 42 km haul route from Chinchillas to Pirquitas plant as well. The work is completed with a fleet of Caterpillar
D9 and 834H class dozers and Caterpillar 16H motor graders.
Mine maintenance is an integral function of the mining operations and
relates to the day-to-day upkeep of the mining equipment. Activities such as preventive maintenance, equipment rebuilds and fixing equipment
on breakdowns are all included in the mine maintenance function. The objective is to provide efficient maintenance of the mining fleet,
thereby increasing reliability and availability of the equipment through effective strategies, planning, and continuous improvement. High
levels of equipment availability and reliability facilitate operational and delivery performance, resulting in asset intensity reduction,
and reduced direct operational and maintenance costs.
Equipment maintenance is performed on-site for all mining equipment.
MPSA has all the infrastructure required for maintaining the fleet and has an adequate maintenance workforce to ensure the equipment is
able to meet the requirements of the operations.
Table 13-6 shows the LOM average key performance indicators (KPI)
of the fleet used at Chinchillas.
| | 13-11 | |
| SSR Mining Inc. | Puna Operations S-K 1300 Report | February 12, 2024 SLR Project No.: 138.21581.00003 |
Table 13-6: LOM Average Maintenance
KPI of the Chinchillas Primary Equipment Fleet
| Mine Equipment |
Availability |
Use of Availability |
|
| (%) |
(%) |
|
| Drills |
|
|
| DM45 (901) |
82.00% |
38.33% |
|
| DM45 (903) |
82.00% |
55.00% |
|
| Flexi Roc D65 |
82.00% |
50.67% |
|
| Loading Equipment |
|
|
| Loader CAT 992G |
82.00% |
62.67% |
|
| Loader Cat 992K |
82.00% |
87.67% |
|
| Excavator 349DL |
83.00% |
70.00% |
|
| Hauling Equipment |
|
|
| CAT 777 |
85.00% |
88.00% |
|
| Scania G440 XT |
87.00% |
75.00% |
|
The current fleet is to be maintained until the end of the LOM. In general,
the major mining equipment requirement scales down with production, towards the end of the LOM plan.
| 13.12 | Mine General and Administration |
Mine G&A refers to all day-to-day supervision and engineering support
of mining operation activity. Expenses included in the mine G&A are mine salary labor charges and fringe benefits, mine office supplies,
safety supplies, equipment rentals and leases, light-vehicle tires, miscellaneous contract services, travel expenses, training, and tax
and freight charges.
MPSA operations has a team of ten safety brigade members per shift and
a safety brigade coordinator who leads and trains the team. There are two ambulances and a team of doctors, nurses, and emergency drivers.
The site also has vehicular rescue, height rescue, first aid, hazardous materials, and fire teams. Brigade personnel are trained to use
this equipment in case of emergencies.
The current mine drainage system consists of an active part and a preventive
part. The active part consists of the realization of pools located (according to operational needs) at the bottom of the mine or active
benches, channeling the water to them in order to evacuate it, either with direct pumping out of the pit using a network of HDPE pipes
or with the help of the watering truck, depending on the time of the year in which we are. The latter has to do with the water supply,
since in the winter period it is minimal and the evacuation with the truck for subsequent irrigation of the circuits is sufficient.
| | 13-12 | |
| SSR Mining Inc. | Puna Operations S-K 1300 Report | February 12, 2024 SLR Project No.: 138.21581.00003 |
The preventive part has to do with peripheral canals built to prevent
water from entering the pit. In some sectors, these channels have been waterproofed with membrane and shotcrete, guaranteeing proper operation.
In addition to this, there is a cleaning and maintenance program for these canals that is carried out before the start of the summer period
(rainy season).
In 2022, MPSA used the services of Piteau Associates Chile SPA (Piteau,
2022) to complete a comprehensive hydrogeological study and design a groundwater drainage plan of the Chinchillas operation. The study
was divided into nine stages and, as of the date of this TRS, the drilling of key pumping wells and implementation of the mine drainage
system along with tests needs to be undertaken by MPSA under supervision from Piteau. MPSA plans to complete this work in the immediate
future (2024).
SLR notes that the most important finding of the study is the absence
of hydrogeological monitoring at MPSA and the fact that the current water table levels are unknown making it impossible to undertake any
simulations or projections of water flow. This has a direct impact on geotechnical stability of the pit walls, with mining predominantly
happening in the lower benches until the end of the LOM. To date, dewatering has been managed by pumping from the sumps at the bottom
of the open pit towards the JUMI pool, with intermediate pools. With mining from 2024 focusing on the lower level benches, it is not possible
to continue with the current dewatering strategy and a multi-dimensional approach is required consisting of incorporating spaces for intermediate
pools, as well as construction of pumping wells to lower the water table below the bottom of the mine and sub horizontal drains to drain
and/or depressurize the southwest and west slopes.
SLR notes that MPSA has determined that the “reactive” pumping
system is the most efficient and suitable, to guarantee the mining of the lower levels; having discarded other options proposed by consultants
that suggested to make deep monitoring/extraction wells. This considers that in certain sectors of the mine, it would not be possible
to punctuate the evacuation of water with these wells, since the accumulation of water in this type of rocks is erratic. In addition,
there would be excessive interference with the sequencing of exploitation of the mine, with high possibility of loss of the wells.
The current mining workforce totals 856 and is summarized as follows:
| · | Management/Technical – 29 |
| · | General and Administration – 167 |
| | 13-13 | |
| SSR Mining Inc. | Puna Operations S-K 1300 Report | February 12, 2024 SLR Project No.: 138.21581.00003 |
| 14.0 | Processing and Recovery Methods |
The processing plant at Puna was commissioned in
2009 and has since been in continuous operation. It uses conventional crushing, grinding, and flotation to produce lead-silver and zinc
concentrates. The plant was designed to process ore from the Pirquitas mine, since mined out, to produce lead-silver, zinc, and tin concentrates,
but now processes ore from the Chinchillas mine. Chinchillas ore is processed at a rate of up to 1.7 Mtpa, or approximately 5,000
tpd.
The plant has not been expanded since start-up
and has a design capacity of 6,000 tpd through the crushing circuit and 4,000 tpd through the grinding and flotation circuits. However,
several changes to the flowsheet have been made since operations began to optimize performance. Additionally, the original flowsheet included
a coarse gravity separation step to reject some gangue mineralization before the grinding circuit, flash flotation within the grinding
circuit, and a tin recovery circuit intended to recover tin values from lead and zinc flotation tails. Neither the coarse gravity circuit,
nor the tin circuit are currently in use, and the flash flotation cell has been re-purposed for additional lead rougher flotation. While
the coarse gravity separation circuit operated for several years, the tin circuit only operated for a short time after start-up and was
then shut down permanently. Regrinding of rougher flotation concentrates, previously carried out when processing Pirquitas ore, has also
been discontinued with the introduction of Chinchillas ore.
Plant personnel continue to work on processing
and cost improvements through various initiatives, e.g., implementing a machine learning system to optimize the process, testing flocculant
make-up with process water instead of fresh water, automating control of mill product size distribution, and improving the life and design
of mill liners.
The processing plant began processing Chinchillas
ore in 2018 to produce a lead-silver concentrate and a zinc concentrate. A block-flow diagram of the Chinchillas process is shown in Figure
14-1.
Figure 14-1: Chinchillas Processing
Flowsheet Overview
Source: MPSA, 2017
| | 14-1 | |
| SSR Mining Inc. | Puna Operations S-K 1300 Report | February 12, 2024 SLR Project No.: 138.21581.00003 |
| 14.1.1 | Stockpiling and Crushing |
Ore is trucked 42 km from the Chinchillas mine
to the plant at Pirquitas and is delivered to designated stockpiles near the primary jaw crusher. From the available stockpiled ore, the
plant decides daily feed blending, looking for steady head grade according to the production plan. Material is rehandled by front-end
loader and 40 t trucks to feed the primary jaw crusher. The primary jaw crusher measures 1,168 mm by 1,321 mm with an installed power
of 160 kW.
Secondary and tertiary crushing and screening operations reduce
this material to a P80 size of approximately 9 mm. The secondary crusher is a CH660EC cone crusher with a power of 315
kW. The tertiary crushers are one H6800 short head cone crusher at 315 kW and one Symons short head cone crusher at 315 kW. This material
is discharged onto a crushed ore stockpile with four feeders located beneath the stockpile.
Blended ore is withdrawn from the crushed ore stockpile
and conveyed to the grinding circuit consisting of a single stage of grinding in a ball mill. The ball mill grinds the ore to a P80
of approximately 120 µm. The ball mill is 4.8 m in diameter by 6.25 m long with 2,400 kW of installed power. The
mill discharges through a trommel screen and the undersize is pumped to classifying cyclones. The cyclone underflow is returned to the
mill and the overflow reports to flotation. Pebbles (trommel screen oversize) have been shown to be of low grade and are stockpiled and
are occasionally returned to the grinding circuit when there is excess capacity.
Granular lime is added to the ball mill feed belt for flotation pH control.
The pyrite/sphalerite depressant and frother are added into the mill. The lead-silver flotation collector and additional frother are added
to the cyclone overflow.
| 14.1.3 | Lead-Silver Flotation |
The lead-silver flotation section consists of rougher, regrind
mill, and concentrate cleaning stage with a scavenger. Mill cyclone overflow reports to a 38 m3 conditioning tank. The rougher
stage includes seven Wemco 1+1 190 flotation cells. Rougher concentrate is pumped to the 1st stage of cleaner cells, five Wemco
1+1 144 flotation cells. The concentrate from these cells passes to the 2nd stage of cleaning, two Wemco 1+1 144 flotation
cells. Tails from 1st cleaning return to the 2nd tank of rougher flotation; tails from the 2nd cleaning
return to the 1st cleaning feed. The final concentrate from the 2nd stage cleaning is thickened in a 5 m diameter
thickener and filtered prior to being bagged.
The zinc flotation circuit consists of roughers,
regrind mill, and one stage of conventional cell concentrate cleaning followed by one stage of column cell cleaning. Rougher tails from
the lead circuit flow into at 38 m3 conditioning tank where copper sulfate and other flotation reagents are added for optimal
zinc recovery. The rougher circuit consists of four Wemco 1+1 190 flotation cells. Concentrate from the roughers is pumped to the 1st
stage cleaners, six Wemco 1+1 144 flotation cells. The concentrate from the 1st stage passes to a 2 m diameter by 11 m high
column cell for 2nd stage cleaning. Tails from 1st cleaning return to the 2nd tank of rougher flotation;
tails from the 2nd cleaning return to the 1st cleaning feed. Concentrate from the 2nd stage cleaning
is thickened in a 5 m diameter thickener and filtered prior to being bagged.
| | 14-2 | |
| SSR Mining Inc. | Puna Operations S-K 1300 Report | February 12, 2024 SLR Project No.: 138.21581.00003 |
| 14.1.5 | Concentrate Handling |
After filtering, the concentrates are bagged in
one tonne bulk bags. Sampling is by manually inserted spear samplers. Bags are assayed and sorted to be shipped to the contracted concentrate
buyers. Bags are loaded onto flatbed trucks and trucked to Rosario or Buenos Aires for export.
The processing plant tailings thickener was designed
to treat a low density, tin circuit tailings (approximately 20% solids). The plant operates successfully on zinc tailings at higher tonnages.
The thickened tailings (55% to 58% solids) are pumped six kilometers to the mined-out Pirquitas pit for storage. Water recovery is a combination
of tailings thickener overflow and supernatant from the pit, both recycled to the plant reclaim water system.
| 14.2 | Reagents and Consumables |
The key consumables used in the process are grinding balls, mill liners,
and crusher wear parts. The key reagents used in the process are summarized in Table 14-1.
Table 14-1: Reagents
| Reagent |
Purpose |
|
| Lime |
pH control |
|
| Zinc Sulfate (ZnSO4) |
Pyrite/Sphalerite Depressant |
|
| Aerophine 3418A |
Lead Promoter |
|
| Copper Sulfate (CuSO4) |
Zinc Promoter |
|
| Sodium Ethyl Xanthate (SEX) |
Flotation Collector |
|
| Methyl Isobutyl Carbinol (MIBC) |
Frother |
|
| Anti-scalant |
Pipe scale minimization |
|
The processing plant has a complement of 282 people including supervision,
operations, and maintenance personnel.
Electricity is generated on site from natural gas supplied by pipeline.
The processing plant power consumption in 2023 was approximately 55 MWh. No significant increases in plant power consumption are anticipated.
The majority, approximately 90%, of water used in the process is recycled
from tailings thickening, return water from the tailings impoundment in the Pirquitas pit, and concentrate thickening and filtration.
The remainder is made up with freshwater pumped from the Collahuaima River which lies immediately east of the property. The mine is permitted
to draw up to 32 L/s of water from the river. The make-up water consumption for the process is not anticipated to increase.
| | 14-3 | |
| SSR Mining Inc. | Puna Operations S-K 1300 Report | February 12, 2024 SLR Project No.: 138.21581.00003 |
The following subsections have been modified from OreWin (2022b).
The Project includes significant infrastructure used to sustain mining
and processing operations over the last 14 years, much of which remains suitable for continued operation. These facilities include roads,
a gas pipeline, power generation facilities, water diversion systems, tailings dams, mine waste stockpiles, camp facilities, office buildings,
maintenance shops, and communications systems.
The ore transport road from Chinchillas to Pirquitas is the National
Route No. 40 (Route 40) that leads to Provincial Route No. 70 (Route 70). The route was upgraded in order to cope with the increased traffic,
including 35 t to 42 t ore haulage trucks bypassing the local villages of Orosmayo and Liviara to minimize social impacts, to safely and
efficiently travel the route. Figure 15-1 shows the access road route.
Figure 15-1: Access Road for
the Project and Proposed Modifications
Source: Knight Piésold, 2019
| | 15-1 | |
| SSR Mining Inc. | Puna Operations S-K 1300 Report | February 12, 2024 SLR Project No.: 138.21581.00003 |
| 15.2 | Gas Pipeline and Power Supply |
For its source of electricity, the Pirquitas Operation uses natural
gas to power three Wärtsila generator sets, each with a capacity of five megawatts (MW) of power. In addition, the same electrical
plant has three diesel-powered Cummins generators, each yielding 1.1 MW. Gas is supplied via a gas pipeline.
Power for the Chinchillas mine site is supplied along existing power
lines from the natural gas powered generators at Pirquitas. EJESA is the local power authority that owns the lines and the power line
from Pirquitas goes directly past the rural EJESA line at the town of Nuevo Pirquitas (approximately 5 km from Pirquitas). The rural
power line then goes from Nuevo Pirquitas to all villages along Route 40 and Route 70 and directly to Santo Domingo. This line is able
to carry the 1 MW load for Chinchillas, with a small spur line (approximately 4 km in length) to take power into the mine.
In the event of power loss at Pirquitas, back-up power from the EJESA
grid that amounts to 100 kVA can be drawn. This back-up power is dedicated to critical telecommunications systems and the first aid building.
Water supply for Pirquitas comes from the Río Ajedrez immediately
downstream of the confluence of the Río Collahuaima and the Río San José, approximately 7 km from the process plant.
The mine is allowed to draw up to 900,000 m3 annually from the river, or approximately 30 L/s.
Water for the Chinchillas mine is supplied from local wells. There is
allowance for a water distribution system, equipment washing, road dust control, sewage and fire water facilities. Potable water for Chinchillas
is supplied in bottles and larger water totes.
MPSA is currently using the mined out San Miguel pit at Pirquitas as
a tailings reservoir.
Discharging the tailings, thickened to 55% solids, in the pit involves
transporting them from the process plant to the pit by means of a pumping system and a 6.3 km pipeline to the tailings box located on
the edge of the pit. The tailings reservoir has a water recovery system to pump the supernatant water (from the tailings, as well as water
that enters the pit by filtration, direct rain, and surface run-off) to the process plant for reuse. The water return pipe follows the
same route as the pipe that transports the tails to the pit. Disposal of the tailings in the pit began in April 2019.
The alignment and gradient of the pipe route is shown in Figure 15-2.
| | 15-2 | |
| SSR Mining Inc. | Puna Operations S-K 1300 Report | February 12, 2024 SLR Project No.: 138.21581.00003 |
Figure 15-2: Alignment and Gradient
of the Tailings Line for In-pit Disposal
Source: MPSA, 2021
| | 15-3 | |
| SSR Mining Inc. | Puna Operations S-K 1300 Report | February 12, 2024 SLR Project No.: 138.21581.00003 |
Pirquitas also has an old, inactive tailings dam that is currently being
used for water storage and could be used as a back-up to the in-pit disposal according to the Tailings Disclosure Report provided on the
SSR website (SSR, 2019). This dam was constructed using a downstream raise method. It is a high density polyethylene (HDPE) lined facility,
is 30 m in height, storing 8.8 million m3 of tailings and was operated from 2009 to 2019. This facility has a hazard rating
of High in accordance with the Canadian Dam Association (CDA) Consequence Classification Ratings for Dams. The first stage of this facility
was built on liquefiable soil, but subsequent Stages (2A, 2B, 3, 4, and 5) corrected this instability. The most recent expert technical
review was conducted in September 2018 (SSR, 2019).
| 15.5 | Communications Systems |
The Pirquitas site is equipped with both cellular and landline telecommunications.
This equipment uses cell phone towers to communicate to Abra Pampa and is connected via a land line to the Pirquitas mine offices and
buildings. On-site communication at Chinchillas is via radio communication and phone.
| 15.6 | Camp, Office, and Chinchillas Infrastructure |
The Pirquitas camp site is equipped with housing sufficient for a maximum
of 673 personnel. This housing is a mix of rehabilitated housing from prior mining operations and modular housing that was installed during
construction. Chinchillas and Pirquitas operating management and senior staff are housed at the Pirquitas camp, while local workers and
operators are transported to their local villages.
Camp food is catered by a contractor and is provided on a seven day
per week schedule. There is a kitchen and dining hall at Chinchillas providing meals for personnel working at the mine.
Office buildings at Pirquitas are a combination of rehabilitated offices
from prior mining operations and modular office space installed during mine construction.
The following facilities are located at Chinchillas:
| · | Mine and administration offices |
| · | Change room / Bathrooms / Training room |
| · | Water wells, distribution, and sewage system |
| · | Lighting and heating facilities |
| · | Explosives magazines, and transfer of emulsion silos from MPLLC |
| · | Fire and lightening protection |
| · | Security and first aid buildings |
| · | Solid waste storage facility |
| | 15-4 | |
| SSR Mining Inc. | Puna Operations S-K 1300 Report | February 12, 2024 SLR Project No.: 138.21581.00003 |
Solid waste materials will be collected at the mine site and will be
delivered to Pirquitas for recycling. The explosives facilities are located at Pirquitas in accordance with Argentine mining regulations.
The infrastructure and facilities listed above can be seen in the general
site layout (Figure 15-3 and Figure 15-4).
| 15.7 | Mine Short-Term/Long-Term Ore Stockpiles |
In the east side of the pit, adjacent to the pit rim, a pad has been
developed using Type ‘C’ waste materials for multi-purpose tasks. The size of the pad is approximately 400 m x 300 m.
This includes a staging area for loading ore onto the haulage trucks to be transported to the mill. A short-term ore stockpile of ore
is located in this area, with the amount of stockpiling varying by period. A small amount of low-grade ore is also stockpiled on this
pad. This will be milled at the end of mine life before closing the mine. Refer to Figure 15-3 for general site layout where the locations
of the short-term and long-term stockpiles are shown.
| 15.8 | Rock Storage Facilities |
The mine currently has two WRSAs. Rock storage facilities are classified
by their geochemical attributes. Potentially acid generating rock (Type A) is deposited close to the pit rim so that its drainage will
be collected in the pit and can be treated accordingly at closure. Mineralized waste is separated and stockpiled with Type A material,
but adjacent to the ore stockpiles, for potential processing opportunities at a later date. High metal leaching materials (Type B) are
stored with Type C (non-hazardous materials) with a controlled drainage system. Rock storage facilities (waste dumps A, B, and C) can
be seen in the general site layout in Figure 15-3.
| 15.9 | Other Pirquitas Infrastructure |
The Pirquitas site has a permitted wastewater treatment facility for
treatment of liquid waste from camp operations. This system is designed to allow for discharge of treated wastewater complying with national
standards.
The site has a landfill for organic waste and a recycling center for
plastics, wood, and metal products. Most wood products are donated to the local communities and are used as fuel or for construction supplies.
Scrap steel and specialty steels are recycled via local vendors.
Domestic water comes from a water diversion located in the Medano Canyon
area which is approximately 300 m upstream from the Pirquitas mine open pit. Water is pumped from that location to a site water treatment
facility for filtering and chlorination and is then used within the camp site. Potable water is currently supplied by bottles and totes
for drinking and cooking purposes.
Concentrate shipments from Pirquitas are trucked to Susques, Jujuy,
from Pirquitas via Route No. 77, and from there to Rosario or Buenos Aires via Route No. 9. On arrival at the ports, the material is shipped
directly from the port facilities to the concentrate buyers.
| | 15-5 | |
| SSR Mining Inc. | Puna Operations S-K 1300 Report | February 12, 2024 SLR Project No.: 138.21581.00003 |
Figure 15-3: Chinchillas
General Site Layout
| | 15-6 | |
| SSR Mining Inc. | Puna Operations S-K 1300 Report | February 12, 2024 SLR Project No.: 138.21581.00003 |
Figure 15-4: Pirquitas
General Site Layout
SSR Mining Inc. Puna Operations
Province of Jujuy, Argentina Pirquitas General Site Layout
| | 15-7 | |
| SSR Mining Inc. | Puna Operations S-K 1300 Report | February 12, 2024 SLR Project No.: 138.21581.00003 |
The Project is a polymetallic project containing three principal metals
– silver, lead, and zinc. Production is from two separate concentrates: a high silver content lead concentrate and a zinc concentrate.
The lead concentrate contains most of the recovered silver metal and is the more valuable of the two concentrates.
Silver is traded on a global basis on a number
of metals and commodity market exchanges. The price is determined by a number of factors that follow short and long term trends and is
most commonly established on the London Metal Exchange.
Metal prices for the economic analysis were estimated
after analysis of consensus industry forecasts and compared to metal prices used in other published studies. The metal prices selected
have taken into account the current Project life. The metal prices are representative of industry forecasts. Lead and zinc prices are
relatively low compared to the consensus prices. The prices used for the economic analysis are shown in Table 16-1.
Table 16-1: Metal Price Assumptions
| Commodity |
Unit |
2024 |
2025 |
2026 |
2027 |
Long Term |
| Silver |
$/oz |
24.00 |
23.95 |
23.70 |
23.35 |
22.75 |
| Lead |
$/lb |
0.93 |
0.92 |
0.93 |
0.94 |
0.93 |
| Zinc |
$/lb |
1.20 |
1.20 |
1.20 |
1.25 |
1.20 |
In addition to concentrate sales, the Project has numerous contracts
with suppliers for consumables, reagents, maintenance, and other services to support a remote mine operation. In the SLR QP’s opinion,
all of the contracts that the Project has entered into are based on normal commercial arrangements during the long operational life of
the Project.
| | 16-1 | |
| SSR Mining Inc. | Puna Operations S-K 1300 Report | February 12, 2024 SLR Project No.: 138.21581.00003 |
| 17.0 | Environmental Studies, Permitting, and Plans, Negotiations, or Agreements with Local Individuals or Groups |
The Pirquitas and Chinchillas sites operate under the authority of environmental
approvals and permits granted by the Province of Jujuy (Section 17.3) and under corporate requirements defined by SSR.
The SSR website indicates that the company purpose is to create value
and leave a legacy through responsible and sustainable operations. The company indicates that they are recognized by their stakeholders
as an ethical, reliable, and valued partner, they build relationships and partnership based on respect with our local communities and
are committed to honest and open disclosure and continuous improvement of our sustainability practices as we drive to be the Developer
of Choice.
SSR has an Environmental and Social Policy (2020), Human Rights Policy
(2020), Land Access and Resettlement Policy (2020) amongst others. These policies are reviewed regularly by the Board of Directors and
are available on the company website in English, Spanish and Turkish. SSR reports annually on its sustainability performance in accordance
with the Global Reporting Initiative (GRI) Core standards and in partial compliance with the standards from the Sustainability Accounting
Standards Board (SASB) for the metals and mining industry (SSR, 2022). The most recent ESG & Sustainability Report, for calendar year
2022, is available on the SSR website.
| 17.1 | Environmental Studies |
MPSA has undertaken environmental and social baseline studies and impact
assessments for the Chinchillas and Pirquitas operations, although legacy operations at Pirquitas predate these studies. The company also
carries out environmental monitoring activities at both sites, focused primarily on surface water and groundwater.
The original Environmental Impact Study (Estudio de Impacto Ambiental,
EIA) ) for Pirquitas was completed in 1998 with subsequent updates and addenda in 2008, 2014, 2016, 2017 and 2020. For Chinchillas, the
original EIA was completed in 2016 with subsequent updates in 2019 and 2021.
Key baseline, impact assessment and monitoring studies have included
(OreWin, 2022b):
| · | Surface water and groundwater: Annual average precipitation in the Puna area is approximately 300 mm (Section 4.2),
most of which falls as rain during the austral summer months of December to March. A fraction of this, up to approximately 50 mm, infiltrates
into the ground providing recharge to local aquifers. Perennial streams in the area are fed by groundwater exfiltration during the long
dry season. |
The Pirquitas site is adjacent to the perennial Río
Pircas (or Pirquitas), a tributary of the Río Ajedrez which flows northward toward Bolivia and, eventually, to the Atlantic Ocean.
Chinchillas is located in the headwaters of the interior drainage basin of the Laguna de Pozuelo, a saline lake and notable regional environmental
feature (see below).
| | 17-1 | |
| SSR Mining Inc. | Puna Operations S-K 1300 Report | February 12, 2024 SLR Project No.: 138.21581.00003 |
MPSA is currently monitoring the water quality both upstream
and downstream of Pirquitas, at 21 surface water and eight groundwater monitoring points. The site has legacy infrastructure and associated
impacts due to mining activities in the past. Remnant infrastructure includes derelict buildings, mine structures, tin-silver jig tailings
and tin placer tailings along the Río Pircas. For several decades from the 1930s to the 1980s, tailings were discharged into the
Río Pircas and piles of silver placer tailings were left above the current level of the Río Pircas on paleo-river terraces
near the mine camp. These areas comprise some 107 ha of surface disturbance, and some of this area is now associated with acid rock drainage/metals
leaching (ARD/ML) into the Río Pircas watershed, which causes changes to surface water and groundwater quality downstream of the
site, especially following significant rainfall events. Ameliorating these impacts will be addressed in the context of mine closure planning
(Section 17.5).
The watercourses in the immediate vicinity of Chinchillas
are ephemeral. Flows in the small tributaries that drain the mine site are governed primarily by rainfall, which is typically highest
between December and March. MPSA monitors surface water quality at 17 sites in the vicinity of the mine site and downstream, and groundwater
at one site downstream.
| · | Flora and fauna: Development of vegetation in the region is constrained by the high elevation and semi-arid climate.
The Pirquitas and Chinchillas sites are located within a mix of high Andean plains and Puna landscape, characterized by grassy steppes
and low-growing shrubs, interspersed with bare soil and alkaline wetlands (peladares). The most common native mammals are the Vicuña
(Vicugna vicugna) and the Vizcacha (Lagidium viscacia). Where standing water is encountered, such as at ponds and streams,
the surrounding wetland vegetation is known locally as vegas. Vegas provide habitat for birds, terrestrial wildlife and, frequently,
forage for livestock. Permanent surface water is also found in the form of saline lakes located in salt flats (salares) in internal
drainage basins. The Laguna de Pozuelo is one such waterbody. These lakes and the associated wetlands provide habitat for terrestrial
fauna and birds including three species of flamingos. |
| · | Nearest communities: MPSA has identified 14 communities within the Project’s area of influence (AOI), seven of
which are in the direct AOI and seven of which are in the indirect AOI. Santo Domingo is the community nearest to Chinchillas (6 km) and
Nuevo Pirquitas is the community nearest to Pirquitas (4.5 km). Nuevo Pirquitas was formed several decades ago when the community of Pirquitas
was relocated to facilitate mine development. |
The local communities are indigenous, with predominantly Colla
ethnicity. Colla people historically occupied the high Puna regions throughout what are now northern Argentina, northern Chile, and southern
Bolivia. The Colla traditionally speak a dialect of the Quechua language. The livelihood of the area’s population is primarily tied
to small-scale livestock management, typically goats and llamas, with some limited production of sheep. Outside of agriculture, regional
inhabitants are employed by the public sector (e.g., schoolteachers), or work in the mining industry, many at Pirquitas and Chinchillas.
| · | Geochemistry: SSR has carried out geochemical investigations to characterize mined materials
with respect to their potential to generate ARD/ML in the long term. |
·
At Pirquitas, ARD/ML is a legacy issue that will need to be addressed in the context of environmental monitoring and closure planning
(Sections 17.2 and 17.5). At Chinchillas, SSR integrated the results of the geochemical studies into the mine plan. Waste rock from the
Chinchillas pit is classified according to acid generation potential and is segregated as appropriate for storage and contact water management.
| | 17-2 | |
| SSR Mining Inc. | Puna Operations S-K 1300 Report | February 12, 2024 SLR Project No.: 138.21581.00003 |
| · | Protected areas: There are 15 protected areas in the Province of Jujuy (OreWin, 2022b), one of which is in the AOI of
the Project. Laguna de Pozuelos is a large, permanent, high-altitude lake approximately 25 km from the Project area. It is an important
migratory bird stopover and is particularly known as habitat for the Andean Flamingo and other species. It lies within a National Natural
Monument, protected by the Administración de Parques Nacionales (National Parks Administration), is designated as a Biosphere
Reserve by UNESCO and is a RAMSAR Wetland of International Importance. The National Natural Monument covers a surface of approximately
16,000 ha and in this area all economic activities, including mining, are prohibited. |
·
The National Natural Monument is surrounded by a buffer zone of approximately 380,000 ha defined as a RAMSAR Wetland of International
Importance that is administered by the multi-sector organization Corporación para el Desarrollo de la Cuenca de Pozuelos
(CODEPO: Corporation for the Development of the Pozuelos Watershed). This buffer zone is recognized by UNESCO. According to the Jujuy
Ministry of Mining GIS data, the Chinchillas property is located just inside the buffer zone, where economic activities, including mining
and exploration, are permitted.
| · | Archeology: The Puna region of Argentina has a rich history of occupation, dating from at least 10,000 years ago. Mining
occurred historically at the Chinchillas area on a small scale in the eighteenth century by Jesuit missionaries. In the late 1960s, there
was a period of small underground production by a local company using adits and tunnels. |
Baseline studies undertaken by SSR identified eleven archeological
sites in the Project area in addition to 20 others in the surrounding area. Prior to the start of mining, in February 2018, the archeological
clearance of 15 sites that were going to be affected by the mine facilities was completed. In April 2019, an additional clearance of historical
sites was completed under the authorization of Resolution No. 151/2019. The remaining sites are being protected by the company and are
subject to annual monitoring. One of these is located in the immediate vicinity of the pit and constrains the reserve pit shell (Section
11.2.13).
| 17.2 | Waste and Water Management |
This section describes mineralized waste management and water management
at Pirquitas and Chinchillas based on the information provided in OreWin (2022b) and collected during a site visit.
| 17.2.1 | Tailings and Waste Rock Disposal |
Pirquitas has operated since the 1930s and operations prior to SSR’s
acquisition of the site included the deposition of tailings in and adjacent to the Río Pircas, in addition to the accumulation
of approximately 500,000 tonnes of jig (gravity circuit) tailings, which are stockpiled beside the process plant. These wastes cause episodical
impacts to downstream water quality in the Río Pircas and Río Ajedrez, due to flushing of oxidation products after rainfall
events. This issue will be addressed in the context of mine closure planning. Waste rock production at Pirquitas ceased several years
ago when the San Miguel pit closed and mine production shifted to Chinchillas. Jig tailings are no longer produced at Pirquitas as the
Chinchillas ore is not processed in the jig circuit.
MPSA developed the Chinchillas mine plan considering the environmental
geochemistry of waste rock as a design constraint. The mine segregates and manages waste rock according to its potential for generating
ARD/ML, as described in Sections 13.9 and 15.8. There are no tailings storage facilities at Chinchillas, and none planned.
| | 17-3 | |
| SSR Mining Inc. | Puna Operations S-K 1300 Report | February 12, 2024 SLR Project No.: 138.21581.00003 |
There is an inactive tailings facility at Pirquitas, which contains
approximately 8.8 million m3 of tailings and is HDPE-lined. It operated for approximately ten years from 2009 until 2019. MPSA
has not yet decommissioned and reclaimed the Pirquitas facility as it is being used for process water storage on an as-needed basis (Section
17.2.2), and could be used to store additional tailings if needed.
Since 2019, MPSA has been using the mined-out San Miguel pit as a tailings
reservoir (Section 15.4). Thickened tailings are pumped 7 km from the process plant to a tailings box on the edge of the pit. The tailings
reservoir has a water recovery system to pump supernatant water to the process plant for reuse.
SSR has in place an Independent Tailings Review Board (ITRB) for all
of its tailings facilities including those at Pirquitas. The ITRB provides an expert, independent opinion as to whether or not the TSF
design and current and/or anticipated performance demonstrate an acceptable level of care from geotechnical, hydro-technical and environmental
perspectives and with reference to acceptable international practice (SSR, 2022).
The permit for in-pit tailings disposal includes two key approval conditions.
First, disposal of tailings containing cyanide is not permitted (the Pirquitas plant does not use sodium cyanide in processing Chinchillas
ore). Second, the water level in the pit is limited to a specific elevation that was determined based on hydrogeologic modeling, so that
it remains a hydraulic sink. Water inventory management in the pit is discussed in Section 17.2.2, below.
SLR has not conducted a technical review of these facilities and the
associated risks, and provides no conclusions or opinions regarding the stability of these facilities and impoundments.
The Pirquitas and Chinchillas sites have adopted a conventional approach
to water management planning that entails the separation and separate management of “contact” water (i.e., water that comes
into contact with disturbed areas on the mine site including mine wastes, exposed rock faces in the open pit, etc.) from “non-contact”
water (e.g., surface runoff and precipitation from upstream catchment areas). Non-contact water is diverted around the mine site and discharged
to the receiving environment down-gradient of the site. Contact water is collected and either stored, evaporated, or reused in the process
plant. The Pirquitas and Chinchillas sites are nominally “zero discharge” in that no contact water is discharged under permit
to the receiving environment, although the separation of contact and non-contact water at Pirquitas is not 100% effective due mainly to
legacy mine waste disposal practices, previously described.
Industrial water for Pirquitas is supplied by pumping water from an
intake on the Río Ajedrez, approximately 7 km from the process plant (Section 15.3). Annual water draw is limited by permit to
900,000 m3, or approximately 30 L/s.
Makeup water for the process plant is also sourced as return water from
the San Miguel pit, which is being used for tailings storage as previously described. There is currently a significant inventory of water
in the pit, arising in part from the failure of an upstream diversion channel which has since been repaired. MPSA is working to manage
the water inventory to maintain the water level in the pit below the permitted maximum level, by installing evaporators along the pit
rim and by pumping water to the Pirquitas tailings facility, where it will evaporate.
At Chinchillas, water collected within the catchments
of the open pit and each waste rock dump area are directed to two ponds constructed at the low point of each area. The water of both ponds
is used for dust suppression. Non-contact water diversion channels allow water to flow to the Río Uquillayoc downstream of the
mine.
| | 17-4 | |
| SSR Mining Inc. | Puna Operations S-K 1300 Report | February 12, 2024 SLR Project No.: 138.21581.00003 |
No significant water management issues were identified
at Chinchillas during the site visit conducted by SLR.
The following subsections have been modified from OreWin (2022b). SLR
has not conducted a review of all of the environmental authorizations and permits held by the operations and relies upon the OreWin (2022b)
report in this regard.
Mines are authorized or permitted mainly through the second section
of the Mining Code of the Nation and its supporting National Law No. 24.585. The main focus of permitting is the detailed EIA, which must
be submitted and approved prior to commencement of operations. Annex III of Law 24.585 establishes the minimum contents of the EIA, including:
| · | Description of the Environment (physical, biological, and socio-economic) (baseline) |
| · | Description of Environmental Impacts |
| · | Environmental Management Plan (which includes measures and actions to prevent and mitigate environmental impact) |
| · | Plan of Action for Environmental Contingencies |
EIAs are reviewed by the Mining Department and a multi-stakeholder group
chaired by a technical appointee from the Mining Department who recommends approval or rejection of the EIA and related work application
to the provincial mining authorities, called UGAMP. UGAMP representatives relevant to environmental reviews include:
| · | Representatives from the local Communities of Santo Domingo, Orosmayo, Liviara, Orosmayo Grande, Nuevo Pirquitas and Coyaguayma; |
| · | Provincial Department of Water Resources; |
| · | Department of Mines and Energy; |
| · | Provincial Secretary of Mining; |
| · | Provincial Collage of Geologists; |
| · | Provincial Department of Environment; |
| · | Provincial Department of Human Rights and Indigenous Communities; |
| · | National University of Jujuy; |
| · | National Parks Administration; |
| · | Corporation for the Development of the Pozuelos River; |
| | 17-5 | |
| SSR Mining Inc. | Puna Operations S-K 1300 Report | February 12, 2024 SLR Project No.: 138.21581.00003 |
| · | Provincial Secretary of Public Health; |
| · | Provincial Department of Agriculture and Livestock Control; and |
| · | Provincial Department of Industry and Commerce. |
EIAs are updated every two years. The biannual updates include compliance
reporting against the conditions of the site’s environmental approvals. As mentioned in Section 17.1, MPSA has in the past submitted
separate EIAs for Pirquitas and Chinchillas. The most recent update, submitted in October 2023 integrates the two sites under a single
environmental permit. At the time of writing of this report (January 2024), approval of the updated EIA was pending. The EIA update includes
a conceptual closure plan (Section 17.5).
Chinchillas has maintained all previous exploration
activity permits in good standing, each of which required the submission of an EIA and receipt of a positive decision (OreWin, 2022b).
| 17.4 | Social or Community Requirements |
As mentioned previously, the communities surrounding the Puna operations
are considered Indigenous communities of Colla ethnicity. Of 14 communities identified in the Project area, seven are in the direct AOI
of the Project and seven are indirectly affected.
MPSA has sought participation by members of the local communities on
biodiversity management and on closure planning. The company held a series of collaborative workshops in 2022 to plan for closure at the
Puna operations taking into consideration Corporate Sustainability Goals and good practice guidance from the International Council for
Mining and Metallurgy (ICMM), GISTM and the Mining Association of Canada’s ‘Towards Sustainable Mining Mine Closure Framework’
(SSR, 2022).
The Pirquitas and Chinchilla operations together employ approximately
900 people in addition to approximately 100 full-time contractors. Approximately 80% of workers are from Jujuy province, many of these
from the local communities. The remaining staff commute from other provinces; there are no expatriates on site. The company implements
community investment initiatives, which is headed by the Municipal Commission of Nuevo Pirquitas.
Over approximately the last year, the rapid development of lithium mining
in the Province of Jujuy has generated social conflict, with local communities claiming that they have not been duly consulted by the
provincial government and some lithium mining companies. During the site visit, SLR noted some public protests with people camped on along
the main highway leading to Abra Pampa. Internet research found a news article about protests in June 2023 which reported that the Jujuy
Provincial Police intervened when farmers, workers, and teachers blocked a highway to protest against the provincial Constitution reform
promoted by Governor Gerardo Morales, who was reported to be trying to restrict citizens' civil rights. These conflicts do not appear
to have affected the Puna Operations, which (at Pirquitas) has a long history in the region and has established positive relationships with
local communities.
| 17.5 | Mine Closure Requirements |
This section has been modified from OreWin (2022b) and supplemented
with available new information.
| | 17-6 | |
| SSR Mining Inc. | Puna Operations S-K 1300 Report | February 12, 2024 SLR Project No.: 138.21581.00003 |
There are no specific laws in Argentina that specify mine closure requirements,
and there is no requirement for a company to establish financial assurance for closure. MPSA has developed conceptual closure plans for
the Pirquitas and Chinchillas sites, most recently in October 2023, with the updated EIA (Section 17.3). The closure plan has been developed
in consideration of best industry practice with the following objectives:
| · | Consider the health and security of the public |
| · | Ensure physical and chemical stability of post-closure structures |
| · | Ensure unrestricted and unimpacted natural surface water flow |
| · | Prevent erosion of post-closure structures from wind or water |
| · | Ensure the safe removal of surface structures and buildings |
| · | Ensure safety and security for people, wildlife, and livestock |
The closure plan addresses a range of closure risks, design criteria
and costs that are anticipated in order to comply with internationally accepted practices. It considers both the physical reclamation
of the site and the social closure plan for the neighboring communities for whom the mine provides employment and community support. The
closure plan considers the short-term decommissioning and reclamation measures, as well as longer term care and maintenance activities
and related costs and risks.
MPSA’s approach to mine closure is conventional for the mining
industry and includes the removal of buildings and surface structures to ground level, with concrete slabs or other inert foundations
covered with stored topsoil. All access roads to the pit and waste rock storage areas will be blocked for safety using earthen berms accompanied
by warning signs. The water diversion systems employed during operations will be fortified for long-term use in managing water post-closure.
Open pits will be allowed to flood to the phreatic level. A large safety berm accompanied by appropriate signage will be constructed around
the pit rims to prevent access. Ongoing monitoring of the closure measures will be conducted over a period of five years to ensure successful
implementation.
At Pirquitas, where some disturbed areas have become available for closure
due to cessation of operations in the San Miguel pit, MPSA is carrying out progressive reclamation.
MPSA is currently developing an updated closure plan that will include
the Pirquitas and Chinchillas sites. The updated closure plan will include measures to address the legacy issues at Pirquitas mentioned
in previous sections of this report.
SLR reviewed a recent closure cost estimate provided by SSR. The cost
estimate is undated but evidently was prepared in 2023 in support of the EIA closure plan previously mentioned. The total closure cost
estimate for the Pirquitas and Chinchillas sites is US$65.9 million. The cost estimate considers at least some of the work that will be
required to address the known environmental legacy issues at Pirquitas, for instance removal and disposal of the jig tailings. The updated
closure plan currently in development will include an updated cost estimate for closure which may vary materially from the current cost
estimate.
| | 17-7 | |
| SSR Mining Inc. | Puna Operations S-K 1300 Report | February 12, 2024 SLR Project No.: 138.21581.00003 |
| 18.0 | Capital and Operating Costs |
SSR’s forecasted capital and operating cost estimates related
to the development of Mineral Reserves are derived from annual budgets and historical actuals over the long life of the current operation.
According to the American Association of Cost Engineers (AACE) classifications, these estimates would mainly be Class 1 with an accuracy
range of -10% to -30% to +10% to +30%.
Capital costs estimates are shown in Table 18-1 and total $85.1
million over the remaining 2.5 years of the Puna mine life plus final closure/reclamation costs.
Table 18-1: Capital Cost Summary
| Description |
(US$ million) |
|
| Sustaining |
19.28 |
|
| Final Closure/Reclamation |
65.86 |
|
| Total |
85.1 |
|
Sustaining costs total $19.3 million over the 2.5 year mine life and
are associated mainly with mobile fleet and plant maintenance as shown in Table 18-2.
Table 18-2: Sustaining Capital
Summary
| Description |
(US$ million) |
|
| Mine |
6.38 |
|
| Ore Transportation |
2.15 |
|
| Rehandle |
1.00 |
|
| Plant |
8.67 |
|
| Administration |
1.08 |
|
| Total |
19.28 |
|
| 18.1.2 | Final Closure/Reclamation |
Table 18-3 shows the costs associated with reclamation and closure
activities estimated to be $65.9 million spent starting in the last year of mining in 2025 and through 2032.
| | 18-1 | |
| SSR Mining Inc. | Puna Operations S-K 1300 Report | February 12, 2024 SLR Project No.: 138.21581.00003 |
Table 18-3: Final Closure/Reclamation
Cost Summary
| Description |
(US$ million) |
|
| Chinchillas |
|
|
| Open Pit Chinchillas |
0.30 |
|
| Waste Dump Chinchillas |
3.75 |
|
| Stockpiles Chinchillas |
1.17 |
|
| Ancillary facilities (Chinchillas) |
2.87 |
|
| Water Management system (Chinchillas) |
1.02 |
|
| Subtotal Chinchillas |
9.11 |
|
| Pirquitas |
|
|
| Open Pit - San Miguel |
0.32 |
|
| Waste Dumps Pirquitas |
2.22 |
|
| Stockpiles Pirquitas |
2.53 |
|
| Tailings Storage Facility |
3.52 |
|
| Ancillary facilities (Pirquitas) |
4.98 |
|
| Water Management system (Pirquitas) |
17.17 |
|
| Process Plant |
12.18 |
|
| Subtotal Pirquitas |
52.03 |
|
| Others |
|
|
| Studies and Monitoring |
2.18 |
|
| Indirects |
11.65 |
|
| Subtotal Others |
13.83 |
|
| Grand Total |
65.86 |
|
The projected LOM unit operating cost estimate for the remaining 2.5
year operation is summarized in Table 18-4 and averages $60.39/t processed which includes operational and maintenance costs.
Table 18-4: Average Operating
Costs Unit Rates
| Activity |
Unit |
Avg LOM |
|
| Mining |
$/t mined |
4.36 |
|
| Mining |
$/t ore processed |
12.52 |
|
| Ore Transportation |
$/t ore processed |
11.24 |
|
| Rehandling |
$/t ore processed |
2.98 |
|
| | 18-2 | |
| SSR Mining Inc. | Puna Operations S-K 1300 Report | February 12, 2024 SLR Project No.: 138.21581.00003 |
| Processing |
$/t ore processed |
19.52 |
|
| General and Administrative |
$/t ore processed |
14.12 |
|
| Total Operating Costs |
$/t ore processed |
60.39 |
|
The current Puna workforce totals 853 full time people, at site and
in the SSR regional office in Jujuy. This number does not include contractors who are involved with camp activities, security, medical
services, blasting, and maintenance of the Scania fleet. The breakdown by department is shown in Table 18-5.
Table 18-5: Current Workforce
| Area |
Total |
|
| Exploration |
13 |
|
| Mine |
221 |
|
| Ore Transportation |
156 |
|
| Plant |
282 |
|
| Tech Services |
23 |
|
| G&A/Support |
158 |
|
| Total |
853 |
|
The LOM workforce is expected to be similar throughout the remaining
2.5 years of mine life with a reduction of workforce in the last year of stockpile processing and a skeleton staff during final closure
and reclamation through 2032.
| | 18-3 | |
| SSR Mining Inc. | Puna Operations S-K 1300 Report | February 12, 2024 SLR Project No.: 138.21581.00003 |
An after-tax Cash Flow Projection has been generated from the LOM production
schedule and capital and operating cost estimates and is summarized in Table 19 1. A summary of the key criteria is provided below. The
complete cash flow is presented in Section 27.0 Appendix 1. The analysis is based on Q4 2023 real U.S. dollar basis with no escalation.
| · | 5,000 tpd processing capacity |
| · | LOM head grade: 154 g/t silver, 1.23% lead, and 0.22% zinc |
| · | Mill recovery averaging: 96.5% silver, 94.4% lead, and 42.3% zinc |
| · | Realized metal price over period 2024-2026: $23.95 per ounce silver, $0.93 per pound lead, and $1.20 per pound zinc |
| · | Long term realization costs: |
| · | Percent payable: 95% silver, 95% lead |
| · | Treatment charge: $40.39 per dry metric ton (dmt) |
| · | Refining charge: $0.34 per ounce silver |
| · | Penalties: antimony - $1.26 per dmt, silica - $0.63 per dmt |
| · | Percent payable: 75% zinc, 82% silver |
| · | Treatment charge: $234 per dmt |
| · | Penalties: silica - $3.00 per dmt |
| · | Concentrate freight charges: |
| o | Trucking: $232 per dmt (100% to Buenos Aires port) |
| o | Ocean freight: $120 per dmt (50% exported to Chinese customers with remaining exports to Latin American, European and East Asian customers) |
| · | NSR: $123 per tonne processed |
| · | LOM production plan as summarized in Table 13-3. |
| · | Sustaining capital: $19.3 million |
| · | Closure costs: $65.9 million |
| · | Average operating cost over the mine life: $60.39 per tonne ore processed |
| | 19-1 | |
| SSR Mining Inc. | Puna Operations S-K 1300 Report | February 12, 2024 SLR Project No.: 138.21581.00003 |
| 19.1.3 | Taxation and Royalties |
| 19.1.3.1 | Corporate Income Taxes |
The Project is expected to generate $19.1 million in income tax payable
in 2024 and 2025 at a tax rate of 25% on taxable income. The depreciation methodology for property, plant, and equipment (PP&E) is
60% in the first year, with remaining 40% in equal portions in the two subsequent years. Intangible assets are depreciated on units of
production throughout the LOM. Total depreciation allowance utilized in the analysis equals $19.1 million and total income taxes payable
amount to $19.6 million.
| 19.1.3.2 | Royalties and Export Duties |
| · | Royalties: 3% Net Profit |
Considering the Puna Operations on a stand-alone basis, the undiscounted
pre-tax cash flow totals $152 million over the mine life and the after-tax Net Present Value (NPV) at an 8% discount rate (midpoint with
January 1, 2024 as time zero) is $136 million, as shown in Table 19-1. Note that due to the short mine life of the Project, the respective
NPV results are slightly higher than the undiscounted free cash flow.
Table 19-1: After-Tax Cash Flow
Summary
| Description |
US$ million |
|
| Realized Market Prices |
|
|
| Ag ($/oz) |
23.95 |
|
| Pb ($/lb) |
0.93 |
|
| Zn ($/lb) |
1.20 |
|
| Payable Metal |
|
|
| Ag (Moz) |
18.8 |
|
| Pb (Mlb) |
100.1 |
|
| Zn (Mlb) |
6.5 |
|
| Total Gross Revenue |
554 |
|
| Mining Cost |
(52) |
|
| Ore Transportation Cost |
(47) |
|
| Rehandling Cost |
(12) |
|
| Process Cost |
(81) |
|
| G & A Cost |
(59) |
|
| Concentrate Freight Cost |
(30) |
|
| TC/RC Costs |
(12) |
|
| | 19-2 | |
| SSR Mining Inc. | Puna Operations S-K 1300 Report | February 12, 2024 SLR Project No.: 138.21581.00003 |
| Mining Royalties/Export Duties |
(24) |
|
| Total Operating Costs |
(318) |
|
| Operating Margin (EBITDA) |
237 |
|
| Cash Taxes Payable |
(20) |
|
| Working Capital1 |
0 |
|
| Operating Cash Flow |
217 |
|
| Sustaining Capital |
(19) |
|
| Total Closure/Reclamation Capital |
(66) |
|
| Total Capital |
(85) |
|
| |
|
|
| Pre-tax Free Cash Flow |
152 |
|
| Pre-tax NPV @ 8% |
154 |
|
| |
|
|
| After-tax Free Cash Flow |
132 |
|
| After-tax NPV @ 8% |
136 |
|
Notes:
| 1. | All working capital adjustments net to zero at end of mine life |
The World Gold Council Adjusted Operating Cost (AOC) is $11.43/oz Ag
net of a $5.34/oz by-product credit. The mine life capital unit cost, including sustaining and closure/reclamation, is $4.50/oz, for an
All in Sustaining Cost (AISC) of $15.93/oz Ag. The average annual silver production during operation is 6.3 Moz per year over the remaining
2.5 year operation.
Project risks can be identified in both economic and non-economic terms.
Key economic risks were examined by running cash flow sensitivities:
After-tax NPV sensitivity over the base case has been calculated for
-20% to +20% variations for head grade, recovery, and metal price and -15% to +15% for variations for operating and capital costs. The
sensitivities are shown in Table 19-2 and Figure 19-1. The Project is most sensitive to changes in head grade, metallurgical recovery,
and metal price (usually with same magnitude of impact) followed by operating costs and finally capital costs.
| | 19-3 | |
| SSR Mining Inc. | Puna Operations S-K 1300 Report | February 12, 2024 SLR Project No.: 138.21581.00003 |
Table 19-2: After-Tax Sensitivity
Analyses
| Variance |
Head Grade
(g/t Ag) |
NPV at 8%
(US$ millions) |
| 80% |
123 |
67 |
| 90% |
139 |
102 |
| 100% |
154 |
136 |
| 110% |
170 |
170 |
| 120% |
185 |
205 |
| Variance |
Recovery
(% Ag) |
NPV at 8%
(US$ millions) |
| 80% |
77.4 |
68 |
| 90% |
86.9 |
102 |
| 100% |
96.5 |
136 |
| 103% |
98.7 |
144 |
| 104% |
99.9 |
149 |
| Variance |
Metal Prices
(US$/oz Ag) |
NPV at 8%
(US$ millions) |
| 80% |
19.14 |
62 |
| 90% |
21.54 |
99 |
| 100% |
23.93 |
136 |
| 110% |
26.32 |
173 |
| 120% |
28.72 |
210 |
| Variance |
Operating Costs
(US$/t) |
NPV at 8%
(US$ millions) |
| 90% |
54.35 |
154 |
| 95% |
57.37 |
145 |
| 100% |
60.39 |
136 |
| 108% |
64.92 |
122 |
| 115% |
69.45 |
109 |
| Variance |
Capital Costs
(US$ millions) |
NPV at 8%
(US$ millions) |
| 90% |
77 |
142 |
| 95% |
81 |
139 |
| 100% |
85 |
136 |
| 108% |
92 |
131 |
| 115% |
98 |
127 |
| | 19-4 | |
| SSR Mining Inc. | Puna Operations S-K 1300 Report | February 12, 2024 SLR Project No.: 138.21581.00003 |
Figure 19-1: After-Tax Sensitivity
Analysis
| | 19-5 | |
| SSR Mining Inc. | Puna Operations S-K 1300 Report | February 12, 2024 SLR Project No.: 138.21581.00003 |
This section is not applicable.
| | 20-1 | |
| SSR Mining Inc. | Puna Operations S-K 1300 Report | February 12, 2024 SLR Project No.: 138.21581.00003 |
| 21.0 | Other Relevant Data and Information |
No additional information or explanation is necessary to make this TRS
understandable and not misleading.
| | 21-1 | |
| SSR Mining Inc. | Puna Operations S-K 1300 Report | February 12, 2024 SLR Project No.: 138.21581.00003 |
| 22.0 | Interpretation and Conclusions |
The SLR QPs make the following conclusions by area.
| 22.1 | Geology and Mineral Resources |
| · | The SLR QP has reviewed data collection, sampling, sampling preparation, QA/QC, data verification, modeling, grade estimation methods,
and classification definitions for both Chinchillas and Pirquitas and has found no material issues. |
| · | SSR updated the Mineral Resource estimate for both Chinchillas and Pirquitas following standard industry practices. The updated estimate
includes new 2022-2023 drilling. Chinchillas database includes 425 holes with 53,827 assayed samples and Pirquitas database included 919
holes with 141,009 assayed samples. |
| · | The geological models and silver, lead, and zinc resource estimations of both deposits were completed using Leapfrog Edge. |
| · | Chinchillas resource estimation was developed in eight cluster domains using OK. The SLR QP validated the block grade estimates with
visual inspection of cross sections and plan views, general statistics, and swath plots to verify that the estimation results are unbiased
and found no material issues. |
| · | Pirquitas silver resource estimation was executed in three domains at cut-off grades of 25 g/t Ag and 50 g/t Ag using OK in a 2.5
m x 2.5 m x 2.5 to 5 m x 5 m x 5 m cells. SLR validated the block grade estimates with visual inspection
of cross sections and plan views, general statistics, and swath plots to verify that the estimation results are unbiased and found no
material issues. |
| · | Resource classification of Chinchillas and Pirquitas was defined based on average distances to the closest three drill holes. |
| o | For Chinchillas, the average distances are 25 m for Measured and 50 m for Indicated. The largest estimation domain variogram ranges
at 80% of the sill vary from 60 m to 75 m. |
| o | For Pirquitas, the average distances are 18 m for Measured and 50 m for Indicated. The largest estimation domain variogram ranges
vary from 40 m to 52 m. SLR observed that the average distance of the Indicated blocks within the resource stopes is 40.8 m. |
| · | The Chinchillas Mineral Resource estimate is constrained within a pit shell generated using an NSR cut-off value of $37.91/t that
is based on metal prices of $22.00/oz for silver, $0.95/lb lead, and $1.15/lb for zinc. This cut-off calculation also considers metallurgical
recoveries and additional operating costs, estimated at $12/t, related to the handling and transportation of ore from the Chinchillas
property to the Pirquitas plant. The SLR QP has identified two technical and/or economic factors that require resolution with regard to
the Mineral Resource estimate. |
| o | An archeological site located within the area of the deposit was used to limit the reserve pit shell, but not taken into account
in generating the resource pit shell as according to SSR, there is a reasonable expectation for issuance of the permit to mine
the archeological site. |
| | 22-1 | |
| SSR Mining Inc. | Puna Operations S-K 1300 Report | February 12, 2024 SLR Project No.: 138.21581.00003 |
| o | The waste dump partially covers the resource pit shell in the Melina area. Mineral Resources were stated considering the current material
in this dump. As the waste dump material is still being deposited, there may be a minor portion of the Mineral Resource which will not
meet the reasonable prospects for economic extraction (RPEE) requirement in the future due to the additional stripping that will be required.
In SLR’s opinion, this issue will not materially affect the total Mineral Resource estimate for Chinchillas. |
| · | The Pirquitas Mineral Resource estimate is contained within underground mining shapes using an NSR cut-off
value of $110/t based on metal price assumptions of $22.00/oz silver, $0.95/lb lead, and $1.15/lb zinc. Metallurgical recoveries vary
with grade and on average are: 82.7% for silver and 53.7% for zinc. |
| · | The Mineral Resource estimates exclusive of Mineral Reserves at the Project are as follows: |
| · | Total Measured and Indicated Mineral Resources of 8.83 Mt at average grades of 112.1 g/t Ag, 1.01% Pb, and 0.43% Zn containing 31.82
Moz of silver, 196.2 Mlb of lead, and 83.8 Mlb of zinc. This includes: |
| o | 8.47 Mt of in situ Measured and Indicated Mineral Resources at average grades of 113.8 g/t Ag, 1.03% Pb, and 0.42% Zn containing 31.0
Moz of silver, 192.1 Mlb of lead, and 79.2 Mlb of zinc. |
| o | 0.36 Mt at average grades of 70.0 g/t Ag (0.8 Moz), 0.51% Pb (4.0 Mlb), and 0.58% Zn (4.6 Mlb) in low grade stockpile. |
| · | Inferred Mineral Resources are estimated to be 1.51 Mt at average grades of 93.5 g/t Ag, 0.72% Pb, and 0.45% Zn containing 4.54 Moz
of silver, 24.0 Mlb of lead, and 15.0 Mlb of zinc. |
| · | Total Measured and Indicated Mineral Resources of 2.48 Mt at average grades of 300.9 g/t Ag and 5.85% Zn containing 23.99 Moz of silver
and 319 Mlb of zinc. |
| · | Inferred Mineral Resources are estimated to be 1.32 Mt at an average grade of 194.9 g/t Ag and 7.28% Zn containing 8.2 Moz of silver
and 212 Mlb of zinc. |
| 22.2 | Mining and Mineral Reserves |
| · | SSR has extensive experience with open pit mining at Chinchillas and a strong understanding of the work requirements and costs based
on its current operations. |
| · | Open pit operations at Chinchillas are carried out using standard open pit mining methods including drilling, blasting, loading, hauling,
and dumping to the designated stockpiles or WRSAs at the mine. |
| · | Mineral Reserves estimation practices follow industry standards. |
| · | Mineral Reserves are estimated for Chinchillas only. Total Proven and Probable Mineral Reserves at Chinchillas are estimated to be
4.2 Mt grading 154.4 g/t Ag, 1.23% Pb, and 0.22% Zn containing 20.7 Moz of silver, 112.8 Mlb of lead, and 20.5 Mlb of zinc. |
| · | The Chinchillas mine supports a LOM of 2.5 years, including one and half years of active mining followed by one year of processing
the medium grade stockpiles. |
| | 22-2 | |
| SSR Mining Inc. | Puna Operations S-K 1300 Report | February 12, 2024 SLR Project No.: 138.21581.00003 |
| · | The LOM production schedule is reasonable and requires proper focus on pit wall stability and groundwater management. |
| · | The geotechnical parameters used for pit designs are reasonable and proactive action steps like installation of ground-based radar,
drilling of pumping wells, and implementation of a proper mine drainage system are required for success of the mine operations. |
| · | An appropriate mining equipment fleet, maintenance facilities, and workforce are in place, to meet the LOM production schedule requirements. |
| · | Sufficient storage capacity for waste rock and stockpiles have been identified to support the production of the Mineral Reserve. |
| · | Puna operates a conventional crush, grind, and flotation process producing lead and zinc concentrates containing high levels of
silver. The concentrates currently being produced from Chinchillas ore, which are sold on the open market, are generally clean and free
of deleterious elements, and are not subject to penalty charges. |
| · | The processing plant first started operation in 2009 processing ore from the Pirquitas pit, however, it has been processing ore
exclusively from the Chinchillas mine since 2018 after the Pirquitas pit was mined out. The plant is modern, incorporating modern
instrumentation and control systems, and has averaged between 95% and 96% utilization for the past three years. |
| · | The operation is well established and has been processing Chinchillas ore continuously for several years, therefore recovery and concentrate
grade forecasts are based on historical process performance. |
| · | The Project includes significant infrastructure used to sustain mining and processing operations over the last 14 years, much of which
remains suitable for continued operation. These facilities include roads, a gas pipeline, power generation facilities, water diversion
systems, tailings dams, mine waste stockpiles, camp facilities, office buildings, maintenance shops, and communications systems. |
| 22.5 | Environmental and Social Aspects |
| · | The Pirquitas and Chinchillas sites operate under the authority of environmental approvals and permits granted by the Province of
Jujuy, and SSR’s corporate policies including an Environmental and Social Policy (2020), Human Rights Policy (2020), and Land Access
and Resettlement Policy (2020). SSR reports annually on its sustainability performance. The most recent (2022) ESG & Sustainability
Report is available on the company’s corporate website. |
| · | MPSA has carried out and received approval for Environmental Impact Studies (Estudios de Impacto Ambiental, EIA) at Pirquitas and
Chinchillas. The EIAs are updated every two years. Most recently, in October 2023, MPSA submitted an integrated EIA for both sites, which
is currently under review by authorities. |
| | 22-3 | |
| SSR Mining Inc. | Puna Operations S-K 1300 Report | February 12, 2024 SLR Project No.: 138.21581.00003 |
| · | MPSA carries out environmental monitoring according to its environmental approvals, and reports on compliance with the conditions
of its environmental approvals in the bi-annual EIA updates. |
| · | There are 15 protected areas in the Province of Jujuy, one of which, the Laguna de Pozuelos National Natural Monument, is approximately
25 km northeast of the Chinchillas site. |
| · | Key environmental aspects at both sites include fugitive dust control and water quality. At Pirquitas, legacy issues arising from
tailings management practices between the 1930s and the 1980s result today in episodic impacts to water quality in the Rio Pircas, usually
during the months of December to March, which is the rainy season. These legacy issues will be addressed in the context of mine closure
planning. |
| · | Flotation tailings from the Pirquitas process plant are disposed of in the mined-out San Miguel pit, 7 km from the plant. MPSA is
implementing measures to manage the inventory of free water in the pit, which is permit limited. |
| · | SSR has in place an Independent Tailings Review Board (ITRB) for all of its operating mines, including Puna. The inactive Pirquitas
tailings facility, which operated from 2009 to 2019, last underwent an external expert review in September 2018. |
| · | MPSA has identified 14 communities in the Project’s AOI, seven in the direct AOI and seven in the indirect AOI. The closest
community to Chinchillas is the village of Santo Domingo (approximately 6 km away), while the village of Nuevo Pirquitas is nearest to
Pirquitas (approximately 4.5 km away). These communities, as well as others further afield, are Indigenous communities, with predominant
Colla ethnicity. |
| · | The most recent cost estimate for closure of both sites is approximately US$66 million. SSR is currently updating its conceptual closure
plan and closure costs estimate for Puna which should cover both the current and legacy Pirquitas and Chinchillas sites. |
| · | The SLR QP is of the opinion that it is reasonable to rely on the information provided by SSR as outlined above for use in the TRS
because significant environmental and social analysis has been conducted for the Projects over an extended period, the Projects have been
in operation for a number of years, and SSR employs professionals and other personnel with responsibility in these areas that have a good
understanding of the permitting, regulatory, and environmental requirements for the Property. |
| 22.6 | Capital and Operating Costs |
| · | SSR’s forecasted capital and operating cost estimates related to the development of Mineral Reserves are derived from annual
budgets and historical actuals over the long life of the current operation. According to the AACE classifications, these estimates would
mainly be Class 1 with an accuracy range of -10% to -30% to +10% to +30%. |
| | 22-4 | |
| SSR Mining Inc. | Puna Operations S-K 1300 Report | February 12, 2024 SLR Project No.: 138.21581.00003 |
The SLR QPs offer the following recommendations regarding advancement
of the Project.
| 23.1 | Geology and Mineral Resources |
| 1 | Continue the drilling of Pirquitas to delimit the lateral and vertical extension of the veins in Cortaderas vein. This work should
include a focus on high-grade and under drilled areas within the deposit. |
| 1 | Better define the Hanging-wall Zone resource along trend to the northwest and southeast and obtain a better understanding of the
geometry of the controlling structures. |
| 2 | Continue to upgrade the resource in the Melina area at Chinchillas. Update the Mineral Resources considering the final design of the
dump waste, which partially covers the resource pit shell. |
| 3 | Update the Chinchillas Mineral Resources resolving the overturned dynamic anisotropy angles and changing the maximum number of samples
per hole to a value that is more representative of the block height. |
| 4 | Investigate the differences in the resource model and grade control model for Chinchillas. |
| 5 | Improve core and reject sample storage. |
| 23.2 | Mining and Mineral Reserves |
| 1 | Continue with proper pre-splitting of the final walls and blasting practices, and take precautions to achieve the desired pit limits,
ensuring the LOM plan is achieved. |
| 2 | Follow the current strategy of stockpiling high grade and medium grade ore separately, prioritizing feed of high grade ore to the
plant. |
| 3 | Focus on equipment maintenance and reliability given the age of existing assets to achieve planned utilization. |
| 4 | Ensure the current dewatering strategy followed will keep the lower benches at the pit bottom dry and available for operations as
planned. Recognize the fact that drilling pumping wells and implementing a proper mine drainage system is an alternative. |
| 5 | Combined with the dewatering system and inputs from the recently installed Slope Monitoring System, ensure the pit walls are not saturated
and the final designed pit limits are achieved. |
There are no recommendations related to processing activities.
There are no recommendations related to infrastructure.
| | 23-1 | |
| SSR Mining Inc. | Puna Operations S-K 1300 Report | February 12, 2024 SLR Project No.: 138.21581.00003 |
| 23.5 | Environmental and Social Aspects |
| 1 | Assess hydrogeological modeling efforts to date at Pirquitas and, as appropriate, update the modeling in support of site water balance
development and water quality assessment for the remainder of mine operation and mine closure. |
| 2 | Continue with efforts to control the volume of free water in storage in the San Miguel pit, to ensure compliance with applicable legal
requirements. |
| 3 | Incorporate a plan to address site environmental legacy issues at Pirquitas in the updated closure plan and cost estimate. |
| 4 | Identify opportunities to implement progressive closure, especially at Pirquitas where it may be possible to address some of the legacy
site issues prior to the cessation of operations. |
| 5 | Continue to engage with local communities with a focus on planned mine closure. Ensure that the updated closure plan considers the
social aspects of closure. |
| 23.5.1.1 | Capital and Operating Costs |
There are no recommendations related to capital and operating costs.
| | 23-2 | |
| SSR Mining Inc. | Puna Operations S-K 1300 Report | February 12, 2024 SLR Project No.: 138.21581.00003 |
AACE International, 2012. Cost Estimate
Classification System – As applied in the Mining and Mineral Processing Industries, AACE International Recommended Practice No.
47R-11, 17 p.
ALS, 2023. Metallurgical Testing on Chinchillas
Composites, KM6938, prepared for Silver Standard Resources Inc., October 24, 2023.
Armstrong, R. and Spratt, J., 2016. EPMA
study of Ag-bearing Minerals from the Pb-Zn-Ag Mineralization of the Chinchillas Project. Unpublished report prepared by the Natural History
Museum for Golden Arrow Resources Corporation.
Beland, S and Redfearn, M., 2013. 2013
Project Report on Metallurgical Testing on the Chinchillas Project. Unpublished reported prepared by Bureau Veritas Commodities Canada
Ltd, Inspectorate Metallurgical Division, for Golden Arrow Resources Corporation.
Board, W., Kennedy, B., and Yeomans T.,
2011. NI 43-101 Technical Report on the Pirquitas Mine, Jujuy Province, Argentina. Effective Date: December 2011. Prepared for Silver
Standard Resources Inc.
Blasco, G. G., 2011. Actualización
bianual estudio de impacto ambiental etapa de exploración: Golden Arrow environmental impact assessment actualization report for
exploration stage, 2011, 51 p.
Caffe P., 2002. Estilos eruptivos del
complejo dómico Pan de Azucar – Puna Norte. Revista de la Asociación Geológica Argentina, 57 (3) 232-250.
Caffe P., 2013. Petrografía de
muestras de testigo y roca. Mina Chinchillas. Unpublished report prepared for Golden Arrow Resources.
Caffe P. and Coira B., 2008. Depósitos
epitermales polimetálicos asociados a complejos volcánicos domicos: Casa Colorada, Pan de Azucar, Chinchillas y Cerro Redondo,
en: Relatorio del XVII Congreso Geológico Argentino, JUJUY, 2008.
Canadian Securities Administrators (CSA),
2011. National Instrument 43-101 Standards of Disclosure for Mineral Projects. Retrieved from: https://www.bcsc.bc.ca/Securities_Law/Policies/Policy4/43-101_Standards_of_Disclosure_for_Mineral_Projects
NI 43-101
Caranza, H., and Carlson, G. G., 2012.
Final report on the phase I drill program Chinchillas Ag-Pb-Zn Project. Golden Arrow internal report, 2012, 1360 p.
CIM, 2003. Estimation of Mineral Resources
and Mineral Reserves Best Practices Guidelines Retrieved from: http://web.cim.org/
CIM Standing Committee on Reserve Definitions,
2014. CIM Definition Standards - For Mineral Resources and Mineral Reserves. Retrieved from: http://web.cim.org/
Chen, J. and Coombs, H., 2023. Metallurgical
Testing on Chinchillas’ Composites, KM6938. Unpublished report prepared by ALS Metallurgy, Kamloops, for SSR Mining Inc.
Chen, S. and Redfearn, M., 2014. 2014
Project Report on Metallurgical Testing on the Chinchillas Project. Unpublished report prepared by Bureau Veritas Commodities Canada Ltd,
Inspectorate Metallurgical Division, for Golden Arrow Resources Corporation.
| | 24-1 | |
| SSR Mining Inc. | Puna Operations S-K 1300 Report | February 12, 2024 SLR Project No.: 138.21581.00003 |
Coira, B., Caffe P., Ramirez A., Chayle
W., Diaz A., Rosas S., Perez A., Perez B., Orozco O. and Martinez M., 2004. Hoja Geológica 2366-I/ 2166/III Mina Pirquitas, Provincia
de Jujuy. Servicio Geológico Minero Argentino, Boletin 269.
Coira B., Diaz A., Chayle W., Pérez
A., and Ramírez A., 1993. Chinchillas, un modelo de complejo volcánico domico portador de depósitos de metales de
base con Ag y Sn, en Puna Jujeña. XII Congreso Geológico Argentino y II Congreso de Exploración de Hidrocarburos.
Actas Tomo IV (270-276).
Cottrell, T.A., 2023. Puna Land Tenure
Status Report, prepared by SSR Mining Inc. for SLR International Corporation, dated December 20, 2023
Cunningham, C., McNamee J., Pinto J.
and Ericksen G., 1991. A model of volcanic dome-hosted precious metal deposits. Econ Geol 86: 415-421.
Daroca, J. A., Undated. Lapacha S.R.L.
report on Aranlee work at Chinchillas Project. Prepared for Aranlee Resources.
Davis, B. and Howie, K., 2013. Mineral
Resource Estimate for the Chinchillas Silver-Lead-Zinc Project, Jujuy Province, Argentina. 20 June 2013. Retrieved from http://www.sedar.com/.
Davis, B., Howie, K., and Smith, B.,
2014. Mineral Resource Estimate for the Chinchillas Silver-Lead- Zinc Project, Jujuy Province, Argentina. 10 October 2014. Retrieved
from http://www.sedar.com/.
Davis, B., Sim, R., and Smith, B., 2015.
Mineral Resource Estimate for the Chinchillas Silver-Lead-Zinc Project, Jujuy Province, Argentina. 2 November 2015. Retrieved from
http://www.sedar.com/.
Davis, B., Sim, R., and McEwen, B., 2016.
Mineral Resource Estimate for the Chinchillas Silver-Lead- Zinc Project, Jujuy Province, Argentina. May 27, 2016. Retrieved from http://www.sedar.com/.
E-Mining Technology S.A., 2023. Nota
Técnica, Revisión Geotécnica Rajo y Botaderos Mina Chinchillas – SSR Mining, Versión 1, Julio 2023,
23 p.
Glencore, 2015. Resources and Reserves
as at 31 December 2016. Retrieved from http://www.glencore.com/assets/investors/doc/reports_and_results/2016/GLEN-2016-Resources-
Reserves-Report.pdf
Golden Arrow Resources Corporation, 2015a.
Silver Standard Plans up to US$12.6M to Advance to Feasibility Golden Arrow’s Chinchillas Project for a Business Combination with
Pirquitas Mine [News Release 1 October 2015]. Retrieved from https://goldenarrowresources.com/news/2015
Golden Arrow Resources Corporation, 2015b.
Management Information Circular. 20 November 2015. Retrieved from http://www.sedar.com/
Gorustovich, S., Monaldi C. and Salfity
J., 2011. Geology and metal ore deposits in the Argentina Puna. In Cenozoic Geology of the Central Andes of Argentina, 169-187, SCS Publisher.
Guzman, J., 2016. D1645–Chinchillas
TW_TCAN.TH.FP. Unpublished report prepared by Tenova Delkor, TAKRAF Canada, Inc, for Silver Standard Resources, Inc.
Hammerl, B. and Sloan, R., 2016. Preliminary
Metallurgical Assessment of Chinchillas Project Composites, KM4851. Unpublished report prepared by ALS Metallurgy, Kamloops, for Silver
Standard Resources, Inc.
| | 24-2 | |
| SSR Mining Inc. | Puna Operations S-K 1300 Report | February 12, 2024 SLR Project No.: 138.21581.00003 |
Hammerl, B. and Sloan, R., 2018. Preliminary
Metallurgical Assessment of Chinchillas/Socavon Samples, KM 5404. Unpublished report prepared by ALS Metallurgy, Kamloops, for Silver
Standard Resources, Inc.
Hatch Engineering and Mine Development
Associates Inc., 2006. Pirquitas Silver, Zinc and Tin Project, Jujuy Province, Argentina. Prepared for Silver Standard Resources Inc.,
May 2006.
Inspectorate Exploration & Mining
Services Ltd., 2013. 2013 Project Report on Metallurgical Testing on the Chinchillas Project, prepared for Golden Arrow Resources Corp.,
May 1, 2013
Inspectorate Exploration & Mining
Services Ltd., 2014. 2014 Project Report on Metallurgical Testing on the Chinchillas Project, prepared for Golden Arrow Resources Corp.,
August 8, 2014
Jacobs Engineering Group, 1999. Feasibility
Study Pirquitas Silver-Tin Project, Jujuy Province, Argentina. Prepared for Sunshine Argentina Inc.
Journel, A.G. and C.J. Huijbregts, 1978.
Mining Geostatistics, Academic Press London
Knight Piésold Ltd. (KP), 2017.
Chinchillas Project – Feasibility Pit Slope Design. KP Ref. No. VA201-439/7-2, Rev A. May 23, 2017.
Knight Piésold Ltd. (KP) 2019.
Chinchillas Silver Mine – March 2019 Open Pit and Waste Dump Geotechnical Inspection. KP Ref. No. VA19-00592. May 15, 2019.
Knight Piésold Ltd. (KP) 2021.
Chinchillas Silver Mine – 2021 Annual Geotechnical Inspection for Open Pit and Waste Dumps. KP Ref. No. ArM-00487-21. April 6, 2021.
Knight Piésold Ltd. (KP), 2022.
Chinchillas Silver Mine - Geotechnical Assessment of Modified Final Pit Design, a draft letter report for Puna Operations Inc., August
12, 2022. 10 p.
Kuchling, K., Davis, B., Howie, K., Embree,
K. and Fox, J., 2014. Preliminary Economic Assessment for the Chinchillas Silver-Lead-Zinc Project, Jujuy Province, Argentina. 20 January
2014. Retrieved from http://www.sedar.com/
Kuchling, K., Davis, B., Embree, K.,
Fox, J., Howie, K., and Smith, B., 2015. Preliminary Economic Assessment Update for the Chinchillas Silver-Lead-Zinc Project, Jujuy Province,
Argentina. Amended Date February 13, 2015. Retrieved from http://www.sedar.com/.
Kuchling, K., Davis, B., Sim, R., Dance,
A., Ebrahimi, A., Embree, K., 2017. NI 43-101 Technical Report Pre-feasibility Study of the Chinchillas Silver-Lead-Zinc Project, Jujuy
Province, Argentina. Prepared for Puna Operations Inc., Effective Date: December 31, 2016, Filing Date: May 15, 2017. Retrieved from http://www.sedar.com/
Kulemeyer, J. A., 2011. Anexo sobre el
patrimonio cultural, arqueológico, paleontológico e histórico de Santo Domingo, departamento de Rinconada, de la
actualización bianual del estudio de impacto ambiental - etapa de exploración. Proyecto minero Chinchillas: Golden Arrow
environmental impact assessment actualization report for exploration stage annex, 2011, 72 p.
Lorenz, V. and Kurszlaukis S., 2007.
Root zone processes in the phreatomagmatic emplacement model and consequences for the evolution of maar-diatreme volcanoes. Journal of
Volcanology and Geothermal Research, Vol 159:4-32.
| | 24-3 | |
| SSR Mining Inc. | Puna Operations S-K 1300 Report | February 12, 2024 SLR Project No.: 138.21581.00003 |
Ma, W., and Redfearn, M., 2014. Mineralogical
Assessments on Five Test Products. Unpublished report prepared by Bureau Veritas Commodities Canada Ltd, Inspectorate Metallurgical Division,
for Golden Arrow Resources Corporation.
Malvicini, L., 1978. Las Vetas de Estano
y Plata de Minas Pirquitas (Pircas) Provencia de Jujuy, Republica Argentina, Revista de la Asociación Argentina de Mineralogía,
Tomo IX, No.1-2, pp. 1-25.
Marshall, D., and Mustard, P., 2012.
Chinchillas Intermediate Sulphidation Epithermal system. Unpublished report prepared by Vancouver Petrographics Ltd for Golden Arrow Resources
Corporation.
OreWin, 2022a. Puna 2021 Project Update
Report
OreWin, 2022b. Puna 2021 Technical Report
Summary. Prepared for SSR Mining Inc. September 29, 2022.
O’Brien, M. F., 2020. Technical
Memorandum No. 2 on Geological Model and Grade Estimation for the Chinchillas Silver-Lead-Zinc Mine, San Salvador de Jujuy, Argentina,
for Mina Pirquitas SA.
Paar W.H., Brodtkorb M.K., Sureda R.J.,
Topa D., (2001). Mineralogía, yquimismo de sulfuros y sulfosales de estaño y plomo en las vetas de Mina Pirquitas, Jujuy,
Argentina (22°41’S66°28’W). Rev Geol Chile 28:259–268.
Passamani, F. M., 2014. Structural
controls and mineralization in the Mina Pirquitas Ag-Sn-Zn deposit, northwestern Argentina. Rio de Janeiro, 2014. XI, 68 p., V ap. Dissertação
(Mestrado em Geologia) – Programa de Pós-graduação em Geologia, Instituto de Geociências, Universidade
Federal do Rio de Janeiro, Rio de Janeiro.
Peacey, J., 2016. Guidance on Treatment
terms for Chinchillas Pb-Ag and Zn concentrates. Unpublished report prepared by Kingston Process Metallurgy for Silver Standard Resources
Inc.
Puritch, E., 2020. Pirquitas Mine –
Underground Mineral Resource Estimate.
Quantec Geoscience Argentina S.A., 2008.
Geophysical report on: pole-dipole array, induced polarization and resistivity survey at the Chinchilla Project, Jujuy Province, Argentina,
on behalf of Silex Argentina S.A.
Ramos, V., 2000, The Southern Central
Andes, in Tectonic Evolution of South America, edited by Cordani, U.G., Milani, E.J., Thomaz Filho, A., and Campos, D.A., 2000, pp. 561-604.
Ramos V., 1999. Rasgos estructurales
del territorio argentino, Instituto de Geologia y recursos Minerales, Anales 29 (24), Buenos Aires.
Roulston, D. and Sloan, R., 2016. Chinchillas
Tailings Generation, KM5157. Unpublished report prepared by ALS Metallurgy, Kamloops, for Silver Standard Resources, Inc.
Silex Argentina S.A., 2008. Internal
report on the Chinchillas Ag-Pb-Zn deposit.
SSR Mining, 2022. ESG and Sustainability
Report. Available at…
SSR Mining, 2019. Tailings Disclosure
Report.
SSR Mining, 2023. Puna Metallurgical
Balance Daily Report. Puna_Daily_MetBal_Calculation_December_31_2023.xlsx
| | 24-4 | |
| SSR Mining Inc. | Puna Operations S-K 1300 Report | February 12, 2024 SLR Project No.: 138.21581.00003 |
Stater, E.T., Kontak, D.J., McDonald,
A.M., Fayek, M., 2021. Origin of a multi-stage epithermal Ag-Zn-Pb-Sn deposit: the Miocene Cortaderas breccia body, Pirquitas Mine, NW
Argentina. Mineralium Deposita (2021) 56:381–406
Stanley, C.J., and Armstrong, R.N., 2016.
The Opaque Mineralogy of 28 samples from the Pb-Zn-Ag Mineralization of the Chinchillas Project. Unpublished report by the Natural History
Museum prepared for Golden Arrow Resources Corporation.
Soler M., Caffe P., Coira B., Onoe A.,
and Mahlburg Kay S., 2007. Geology of the Vilama caldera: A new interpretation of a large-scale explosive event in the Central Andean
plateau during the Upper Miocene, in Journal of Volcanology and Geothermal Research, Vol.164, 27pp.
SSR Mining Inc., 2023. Form 10-K. Annual
Report for the Fiscal Year Ended December 31, 2022. Filed on EDGAR on February 22, 2023.
Tenova Delkor, 2015. D1645 Test Report
for Test No: D1645–Chinchillas TW_TCAN.TH.FP on Tailings Thickening and Filtration, September, 2015
Telesur, June 2023: Jujuy
Police Continue to Repress Argentines | News | teleSUR English
US Securities and Exchange Commission.
2018. Regulation S-K, Subpart 229.1300, Item 1300 Disclosure by Registrants Engaged in Mining Operations and Item 601 (b)(96) Technical
Report Summary.
| | 24-5 | |
| SSR Mining Inc. | Puna Operations S-K 1300 Report | February 12, 2024 SLR Project No.: 138.21581.00003 |
| 25.0 | Reliance on Information Provided by the Registrant |
This TRS has been prepared by SLR for SSR. The information, conclusions,
opinions, and estimates contained herein are based on:
| · | Information available to SLR at the time of preparation of this TRS. |
| · | Assumptions, conditions, and qualifications as set forth in this TRS. |
| · | Data, reports, and other information supplied by SSR and other third party sources. |
For the purpose of this TRS, SLR has relied on ownership information
provided by SSR’s internal legal counsel in a document entitled “Puna Land Tenure Status Report” and dated December
20, 2023 (Cottrell, 2023). SLR has not researched property title or mineral rights for the Puna Operations as we consider it reasonable to
rely on SSR’s legal counsel who is responsible for maintaining this information.
SLR has relied on SSR for guidance on applicable taxes, royalties, and
other government levies or interests, applicable to revenue or income from the Puna Operations in the Executive Summary and Section 19. As
the Puna Operations has been in operation for over ten years, SSR has considerable experience in this area.
The Qualified Persons have taken all appropriate steps, in their professional
opinion, to ensure that the above information from SSR is sound.
Except as provided by applicable laws, any use of this TRS by any third
party is at that party’s sole risk.
| | 25-1 | |
| SSR Mining Inc. | Puna Operations S-K 1300 Report | February 12, 2024 SLR Project No.: 138.21581.00003 |
| 26.0 | Date and Signature Page |
This report titled “Technical Report Summary on the Puna Operations,
Argentina” with an effective date of December 31, 2023 was prepared and signed by:
|
(Signed) SLR International Corporation |
Dated at Lakewood, CO
| February 12, 2024 |
SLR International Corporation |
| | 26-1 | |
| SSR Mining Inc. | Puna Operations S-K 1300 Report | February 12, 2024 SLR Project No.: 138.21581.00003 |
| 27.0 | Appendix 1 Cash Flow Summary |
| | 27-1 | |
| SSR Mining Inc. | Puna Operations S-K 1300 Report | February 12, 2024 SLR Project No.: 138.21581.00003 |
Economic Model Annual Summary
SLR
Company SSR Mining Inc.
Project Name Puna Mine
Scenario Name $18.50 Ag Reserve Price
Analysis Type S-K 1300 TRS
Calendar Year 2024 2025 2026 2027 2028 2029 2030 2031 2032
Discounting Timeline By Date Jun-24 Jun-25 Jun-26 Jun-27 Jun-28 Jun-29 Jun-30 Jun-31 Jun-32
Discounting Timeline By Number 0.5 1.5 2.5 3.5 4.5 5.5 6.5 7.5 8.5
Project Timeline In Years 1 2 3 4 5 6 7 8 9
Time Until Closure In Years US$ & Metric Units LoM Avg / Total 3 2 1 -1 -2 -3 -4 -5 -6
Market Prices
Silver US$/oz $23.95 24.00 23.95 23.70 23.35 22.75 22.75 22.75 22.75 22.75
Lead US$/lb $0.93 0.93 0.92 0.93 0.94 0.93 0.93 0.93 0.93 0.93
Zinc US$/lb $1.20 1.20 1.20 1.20 1.25 1.20 1.20 1.20 1.20 1.20
Physicals
Total Ore Mined kt 3,547 2,039 1,508 - - - - - - -
Total Waste Mined kt 8,413 6,461 1,952 - - - - - - -
Total Material Mined kt 11,959 8,500 3,460 - - - - - - -
Stripping Ratio W:O 2.37 3.17 1.29 - - - - - - -
Total Ore Processed kt 4,166 1,748 1,753 666 - - - - - -
Silver Grade, Processed gpt 154 172 162 89 - - - - - -
Lead Grade, Processed % 1.23 1.44 1.16 0.83 - - - - - -
Zinc Grade, Processed % 0.22 0.21 0.23 0.24 - - - - - -
Contained Silver, Processed koz 20,677 9,647 9,124 1,906 - - - - - -
Contained Lead, Processed kt 51.1 25.2 20.4 5.5 - - - - - -
Contained Zinc, Processed kt 9.3 3.7 4.0 1.6 - - - - - -
Average Recovery, Silver % 96.5% 96.9% 96.3% 95.2% -- -- -- -- -- --
Average Recovery, Lead % 94.4% 95.1% 94.1% 91.9% -- -- -- -- -- --
Average Recovery, Zinc % 42.3% 42.7% 42.5% 40.8% -- -- -- -- -- --
Recovered Silver koz 19,945 9,347 8,784 1,814 - - - - - -
Recovered Lead kt 48.3 24.0 19.2 5.1 - - - - - -
Recovered Zinc 3.9 1.6 1.7 0.7- - - - - -
Payable Silver koz 18,929 8,871 8,341 1,718 - - - - - -
Payable Lead klb 100,147 49,801 39,793 10,553 - - - - - -
Payable Zinc klb 6,946 2,744 3,027 1,176 - - - - - -
Cash Flow
Silver Gross Revenue 82% $000s 453,374 212,904 199,757 40,713 - - - - - -
Lead Gross Revenue 17% $000s 92,739 46,315 36,610 9,814 - - - - - -
Zinc Gross Revenue 2% $000s 8,336 3,292 3,632 1,411 - - - - - -
Gross Revenue Before By-Product Credits 100.0% $000s 554,449 262,512 239,999 51,938 - - - - - -
Silver Gross Revenue $000s 453,374 212,904 199,757 40,713 - - - - - -
Lead Gross Revenue $000s - - - - - - - - - -
Zinc Gross Revenue $000s - - - - - - - - - -
Gross Revenue After By-Product Credits $000s 453,374 212,904 199,757 40,713 - - - - - -
Mining Cost $000s (52,165) (36,059) (16,106) - - - - - - -
Ore Transportation Cost $000s (46,817) (20,734) (19,543) (6,540) - - - - - -
Rehandling Cost $000s (12,434) (5,066) (5,375) (1,994) - - - - - -
Process Cost $000s (81,350) (34,039) (34,513) (12,797) - - - - - -
G&A Cost $000s (58,845) (23,911) (25,552) (9,382) - - - - - -
Concentrate Freight Cost $000s (30,159) (14,389) (12,201) (3,569) - - - - - -
TC/RC Cost $000s (11,864) (5,513) (5,065) (1,286) - - - - - -
Royalties $000s (13,634) (5,540) (6,682) (1,413) - - - - - -
Export Duties $000s (23,060) (10,918) (10,023) (2,119) - - - - - -
Export Credit $000s 12,811 6,065 5,568 1,177 - - - - - -
Subtotal Cash Costs Before By-Product Credits $000s (317,517) (150,104) (129,491) (37,921) - - - - - -
By-Product Credits $000s 101,075 49,608 40,242 11,225 - - - - - -
Total Cash Costs After By-Product Credits $000s (216,442) (100,496) (89,249) (26,696) - - - - - -
Operating Margin 43% $000s 236,932 112,408 110,507 14,017 - - - - - -
EBITDA $000s 236,932 112,408 110,507 14,017 - - - - - -
Depreciation Allowance $000s (19,281) (4,975) (9,067) (5,239) - - - - - -
Earnings Before Taxes $000s 217,652 107,433 101,441 8,778 - - - - - -
Income Tax Payable $000s (19,557) (9,459) (10,098) - - - - - - -
Net Income $000s 198,095 97,975 91,343 8,778 - - - - - -
Non-Cash Add Rack - Depreciation $000s 19,281 4,975 9,067 5,239 - - - - - -
Working Capital $000s 0 (1,046) 1,895 (4,329) 3,480 - - - - -
Operating Cash Flow $000s 217,375 101,904 102,304 9,687 3,480 - - - - -
Capital Spend $000s (19,281) (10,616) (5,293) (3,372) - - - - - -
Final Closure/Reclamation Costs $000s (65,858) - (1,729) (11,803) (10,367) (10,607) (13,996) (13.605) (1,875) (1,875)
Total Capital $000s (85,139) (10,616) (7,022) (15,175) (10,367) (10,607) (13,996) (13,605) (1,875) (1,875)
Cash Flow Adj./Reimbursements $000s - - - - - - - - - -
LoM Metrics
Economic Metrics
Discount Factors Midpoint 8% 0.9623 0.8910 0.8250 0.7639 0.7073 0.6549 0.6064 0.5615 0.5199
a) Pre-Tax
Free Cash Flow $000s 151,794 100,747 105,380 (5,488) (6,887) (10,607) (13,996) (13,605) (1,875) (1,875)
Cumulative Free Cash Flow $000s 100,747 206,127 200,640 193,753 183,146 169,149 155,544 153,669 151,794
NPV @ 8% $000s 154,101 96,944 93,891 (4,527) (5,261) (7,502) (9,166) (8,250) (1,053) (975)
Cumulative NPV $000s 96,944 190,835 186,308 181,047 173,545 164,379 156,129 155,076 154,101
b) After-Tax
Free Cash Flow $000s 132,237 91,288 95,282 (5,488) (6,887) (10,607) (13,996) (13,605) (1,875) (1,875)
Cumulative Free Cash Flow $000s 91,288 186,570 181,083 174,196 163,589 149,592 135,987 134,112 132,237
NPV @ 8% $000s 136,002 87,842 84,894 (4,527) (5,261) (7,502) (9,166) (8,250) (1,053) (975)
Cumulative NPV $000s 87,842 172,736 168,209 162,946 155,446 146,280 138,030 136,977 136,002
Operating Metrics
Mine Life Years 3
Average Daily Processing Rate t/d ore milled 5,000 4,995 5,007 1,902 - - - - - -
Mining Cost $ /t mined $4.36 4.24 4.66 - - - - - - -
Mining Cost $ /t ore milled $12.52 20.62 9.19 - - - - - - -
Ore Transportation Cost $ /t ore milled $11.24 11.86 11.15 9.83 - - - - - -
Rehandling Cost $ /t ore milled $2.98 2.90 3.07 3.00 - - - - - -
Processing Cost $ /t ore milled $19.52 19.47 19.69 19.23 - - - - - -
G&A Cost $ /t ore milled $14.12 13.68 14.58 14.10 - - - - - -
Total Site Operating Costs $ /t ore milled $60.39 68.53 57.68 46.15 - - - - - -
Concentrate Freight Cost $ /t ore milled $7.24 8.23 6.96 5.36 - - - - - -
TC/RC Cost $ /t ore milled $2.85 3.15 2.89 1.93 - - - - - -
Total Operating Costs $ /t ore milled $70.48 79.91 67.53 53.44 - - - - - -
Sales Metrics
Ag Sales koz 18,929
Total Cash Cost $ / oz Au 11.43
Total AISC $ / oz AU 15.93
Avg. LOM Annual Au Sale koz/yr 6,310
| | 27-2 | |
| |
Making
Sustainability Happen |
Exhibit
99.1
February
13, 2024
SSR
MINING issues MULTI-YEAR GUIDANCE and technical reports for ALL operating assets fEATURING pRODUCTION GROWTH APPROACHING 800,000 OUNCES
BY 2027 at aisc TRENDING TOWARDS $1,300 per ounce
MULTI-YEAR GUIDANCE (1)
| § | TOTAL
5-YEAR PRODUCTION INCREASES 4% OVER PRIOR LIFE OF MINE PLANS TO 3.1 MILLION GOLD EQUIVALENT OUNCES, AND INCREASES 9% INCLUDING CONTRIBUTIONS FROM THE HOD MADEN ACQUISITION |
| § | PRODUCTION
PLATFORM APPROACHES 800,000 GOLD EQUIVALENT OUNCES BY 2027, A 10% CAGR |
| § | AISC
EXPECTED TO MEANINGFULLY IMPROVE, TRENDING TOWARDS $1,300 PER OUNCE BY 2027 AND DRIVING SECTOR LEADING FREE CASH FLOWS |
| § | POSITIVE
FREE CASH FLOW EXPECTED IN 2024, BUILDING FURTHER ON EXISTING $1 BILLION LIQUIDITY POSITION |
| § | PEER
LEADING CAPITAL RETURNS YIELD AND OVERALL RETURNS STRATEGY EXPECTED TO REMAIN UNCHANGED |
| § | HOD
MADEN ON TRACK FOR POSITIVE CONSTRUCTION DECISION MID-2024; EXPECTED TO DELIVER A +30% PROJECT IRR |
TECHNICAL REPORT SUMMARIES
(“TRS”)
| § | CORPORATE
NET ASSET VALUE BASED ON MINERAL RESERVE ONLY TECHNICAL REPORTS OF GREATER THAN $3 BILLION, OR APPROXIMATELY US$15 PER SHARE AT CONSENSUS
COMMODITY PRICES, INCREASING TO GREATER THAN $4 BILLION, OR APPROXIMATELY US$20 PER SHARE AT SPOT COMMODITY PRICES |
| § | TOTAL
LIFE OF MINE PRODUCTION INCREASES OVER PRIOR TECHNICAL REPORTS BY 7% AND 23% RESPECTIVELY, BEFORE AND AFTER THE INCLUSION OF HOD
MADEN |
| § | MORE
THAN 85% OF CONSOLIDATED LIFE OF MINE PRODUCTION IN BOTTOM HALF OF INDUSTRY COST CURVE |
| § | ÇÖPLER
TECHNICAL REPORT NET ASSET VALUE OF $1.64 BILLION BASED ON MINERAL RESERVES ONLY |
| § | ÇÖPLER
AVERAGE ANNUAL PRODUCTION OF 281,000 OUNCES OF GOLD AT AVERAGE COST OF SALES OF $965 PER OUNCE & AISC OF $1,003 PER OUNCE OVER 15
YEARS, GENERATING OPERATING CASH FLOW OF $197 MILLION AND FREE CASH FLOW OF $160 MILLION ANNUALLY OVER LIFE OF MINE |
| § | ÇÖPLER
GOLD PRODUCTION IS EXPECTED TO INCREASE TO NEARLY 400,000 OUNCES ANNUALLY BY 2027, A 23% CAGR |
| § | ÇÖPLER
TECHNICAL REPORT INCLUDES +30% IRR GRIND-LEACH CIRCUIT INSTALLATION FOR INITIAL CAPITAL OF $194 MILLION |
| § | MARIGOLD
TECHNICAL REPORT NET ASSET VALUE OF $800 MILLION BASED ON MINERAL RESERVES ONLY |
| § | MARIGOLD
AVERAGE ANNUAL PRODUCTION OF 212,000 OUNCES OF GOLD AT AVERAGE COST OF SALES OF $1,065 PER OUNCE & AISC OF $1,213 PER OUNCE OVER 9
YEARS, GENERATING OPERATING CASH FLOW OF $124 MILLION AND FREE CASH FLOW OF $95 MILLION ANNUALLY OVER LIFE OF MINE |
| § | MARIGOLD
PRODUCTION PROFILE IS EXPECTED TO EXCEED 300,000 OUNCES IN ANNUAL PRODUCTION BY 2029, A 13% CAGR |
YEAR-END 2023 MINERAL RESERVES
& MINERAL RESOURCES
| § | 2023
CONSOLIDATED MINERAL RESERVES, ON AN ATTRIBUTABLE BASIS, OF NEARLY 8 MILLION GOLD EQUIVALENT OUNCES |
| § | MINERAL
RESERVES INCLUDING ATTRIBUTABLE 40% OF HOD MADEN TO EXCEED 9 MILLION GOLD EQUIVALENT OUNCES |
| § | PORTFOLIO
WEIGHTED AVERAGE MINE LIFE BASED ON MINERAL RESERVES OF AT LEAST 14 YEARS |
| § | C2
MINERAL RESOURCES REMOVED FOLLOWING COMPLETION OF TECHNICAL WORK RESULTING IN A $349 MILLION NON-CASH IMPACT TO ÇÖPLER MINERAL
PROPERTIES AND FIXED ASSETS VALUE FROM ~$2.80 BILLION TO ~$2.45 BILLION |
| § | ÇAKMAKTEPE
MINERAL RESERVES INCREASED 75% TO 3 MILLION OUNCES GOLD |
DENVER – SSR Mining Inc. (Nasdaq/TSX:
SSRM; ASX: SSR) (“SSR Mining” or the “Company”) announces a comprehensive and positive business update, including
updated life of mine plans and the Company’s production outlook for 2024 through 2028. In 2023, SSR Mining’s four operating
assets produced 706,894 gold equivalent ounces at full-year cost of sales of $1,141 per payable ounce and all-in sustaining costs (“AISC”)
of $1,461 per payable ounce. Fourth quarter 2023 production was 211,226 gold equivalent ounces at cost of sales of $1,064 per payable
ounce and AISC of $1,326 per payable ounce.
(1)
The Company reports non-GAAP financial measures including free cash flow and All-In Sustaining Cost (“AISC”) per ounce
sold (a common measure in the mining industry), to manage and evaluate its operating performance at its mines. See "Cautionary Note
Regarding Non-GAAP Financial Measures" for an explanation of these financial measures and a reconciliation of these financial measures
to the most comparable GAAP financial measures.
In 2024, the Company expects to deliver
total consolidated production of 540,000 to 600,000 gold equivalent ounces at consolidated cost of sales of $1,300 to $1,350 per payable
ounce and AISC of $1,575 to $1,625 per payable ounce. SSR Mining expects production and margins to remain stable at these levels through
2026 as the Company delivers the Grind-Leach Circuit and Hod Maden growth projects, each with an approximately 30% or higher expected
after-tax internal rate of return (“IRR”). First production from the two projects is expected in 2027, driving significant
production growth towards 800,000 gold equivalent ounces with AISC trending towards $1,300 per ounce by 2027.
Rod Antal, Executive Chairman of SSR Mining,
said, “We are pleased with the strong results in the fourth quarter of 2023, successfully delivering on our commitment to produce
more than 400,000 gold equivalent ounces in the second half of the year and generating more than $335 million in operating cash flow and
$235 million in free cash flow over the same period. Our business has now delivered on its production guidance targets for 11 of the last
12 years, reinforcing our reputation as strong and consistent operators.
This year, we are presenting an extended
production guidance outlook, showcasing a strong growth profile approaching 800,000 gold equivalent ounces at AISC trending towards $1,300
per ounce by 2027. This outlook is the culmination of significant technical work and asset optimization efforts across the
portfolio, including a nearly 75% increase in Mineral Reserves from Çakmaktepe. The combination of the increase in Mineral Reserves
at Çakmaktepe and the concurrent investment in a Grind-Leach Circuit to improve gold recoveries is expected to deliver a doubling
of life of mine production from Çakmaktepe, providing a more than 30% expected internal rate of return on our
investment. Overall, as we’ve optimized our mine plans across the portfolio, we have seen a 7% increase in gold equivalent production
as compared to prior life of mine totals, or more than 20% inclusive of Hod Maden.
This company-wide technical work sets a
refreshed and positive baseline for our business, with steady production in the near-term and meaningful growth and free cash flow over
the five-year period. Our anticipated growth capital expenditures over the next three years are supported by our current liquidity position
of nearly $1 billion, our ongoing operating cash flow, and our efforts to finance Hod Maden through a $200 to $300 million project finance
facility. Our strong financial position indicates that we will exit this growth cycle with a solid balance sheet while still maintaining
our commitment to capital returns. This includes our quarterly cash dividend, which underpins our baseline commitment to capital returns
and currently yields nearly 3% annually. In addition, we will continue to supplement these baseline returns through additional share buybacks.
With a weighted average mine life of at
least 14 years, a production growth trajectory driven by two of the highest returning projects in the industry, a wealth of additional
organic growth opportunities and a continued commitment to capital returns, our business begins 2024 in an enviable position. We look
forward to continuing to deliver on our track record of operational consistency, project execution and value accretive strategic initiatives
in the years to come.”
Full-Year 2024 Outlook & Multi-Year Production Guidance
SSR Mining reports its updated full-year
2024 outlook that includes production and cost guidance by asset and on a consolidated basis. In addition, the Company announces a five-year
production guidance outlook, showcasing a strong growth profile over the period.
Table 1: Full-Year 2024 Outlook
| Operating
Guidance (2) | |
| |
Çöpler
(3) | |
Marigold | |
Seabee | |
Puna | |
Hod
Maden (4) | |
Other | |
Consolidated |
| Gold Production | |
koz | |
200 — 220 | |
155 — 175 | |
75 — 85 | |
— | |
— | |
— | |
430 — 480 |
| Silver Production | |
Moz | |
— | |
— | |
— | |
8.75 — 9.50 | |
| |
| |
8.75 — 9.50 |
| Gold Equivalent Production | |
koz AuEq | |
200 — 220 | |
155 — 175 | |
75 — 85 | |
110 — 120 | |
— | |
— | |
540 — 600 |
| Cost of Sales per Ounce (5) | |
$/oz | |
1,420 — 1,460 | |
1,300 — 1,340 | |
990 — 1,030 | |
16.50 — 18.00 | |
— | |
— | |
1,300 — 1,350 |
| Cash Cost per Ounce (6) | |
$/oz | |
1,410 — 1,450 | |
1,300 — 1,340 | |
990 — 1,030 | |
11.50 — 13.00 | |
— | |
— | |
1,220 — 1,270 |
| Sustaining Capital Expenditures (7) | |
$M | |
| 29 | | |
| 37 | | |
| 40 | | |
| 17 | | |
| — | | |
| — | | |
| 123 | |
| Reclamation Cost Accretion & Amortization | |
$M | |
| 2 | | |
| 3 | | |
| 3 | | |
| 13 | | |
| — | | |
| — | | |
| 21 | |
| General & Administrative | |
$M | |
| — | | |
| — | | |
| — | | |
| — | | |
| — | | |
| 60 — 65 | | |
| 60 — 65 | |
| All-In Sustaining Cost per Ounce (5) | |
$/oz | |
| 1,550 — 1,590 | | |
| 1,535 — 1,575 | | |
| 1,495 — 1,535 | | |
| 14.75 — 16.25 | | |
| — | | |
| — | | |
| 1,575 — 1,625 | |
| Growth Capital | |
$M | |
| 77 | | |
| 1 | | |
| 2 | | |
| — | | |
| 37 | | |
| — | | |
| 117 | |
| Growth Exploration and Resource Development Expense (8) | |
$M | |
| 12 | | |
| 9 | | |
| 15 | | |
| 10 | | |
| — | | |
| 4 | | |
| 50 | |
| Total Growth Expenditures | |
$M | |
| 89 | | |
| 11 | | |
| 17 | | |
| 10 | | |
| 37 | | |
| 4 | | |
| 167 | |
| (2) | Figures may not add due to
rounding. |
| (3) | Çöpler figures
are reported on a 100% basis. Çöpler is 80% owned by SSR Mining. |
| (4) | Hod Maden figures presented
as 40% attributable. Hod Maden is currently 10% owned by SSR Mining. SSR Mining has the option to increase its ownership to 40% through
funding of 40% of the pre-production capital commitments and up to $150 million in contingent payments. |
| (5) | Excludes depreciation, depletion,
and amortization. |
| (6) | SSR Mining reports the non-GAAP
financial measures of cash costs and AISC per payable ounce of gold and silver sold to manage and evaluate operating performance at Çöpler,
Marigold, Seabee and Puna. See “Cautionary Note Regarding Non-GAAP Measures” at the end of this news release for an explanation
of these financial measures and a reconciliation of these financial measures to cost of sales, previously referred to as production costs,
which is the most comparable GAAP financial measures. AISC includes reclamation cost accretion and amortization and certain lease payments. |
| (7) | Includes sustaining exploration
and evaluation expenditures. Includes approximately $9 million in lease payments at Çöpler, $1 million of expensed sustaining
exploration at Marigold and $24 million in underground mine development at Seabee. |
| (8) | Growth exploration and resource
development expenditures are shown on a 100% basis, of which the SSR Mining attributable amount totals $48 million. All growth exploration
and resource development spend is expensed. Growth exploration includes project studies and evaluation. |
Table 2: Five-Year Production Outlook
| Operating
Guidance (9) | |
| |
| 2023 A | |
| 2024 E | |
| 2025 E | |
| 2026 E | |
| 2027 E | |
| 2028 E |
| Çöpler (10) | |
koz Au | |
| 221 | | |
| 200 — 220 | | |
| 205 — 225 | | |
| 240 — 260 | | |
| 370 — 400 | | |
| 380 — 415 | |
| Marigold | |
koz Au | |
| 278 | | |
| 155 — 175 | | |
| 155 — 175 | | |
| 220 — 240 | | |
| 240 — 270 | | |
| 220 — 250 | |
| Seabee (12) | |
koz Au | |
| 91 | | |
| 75 — 85 | | |
| 80 — 90 | | |
| 65 — 75 | | |
| 65 — 75 | | |
| 60 — 80 | |
| Puna | |
Moz Ag | |
| 9.7 | | |
| 8.75 — 9.50 | | |
| 8.00 — 8.75 | | |
| 1.20 — 1.95 | | |
| — | | |
| — | |
| Hod Maden (11) | |
koz AuEq | |
| — | | |
| — | | |
| — | | |
| — | | |
| 25 — 55 | | |
| 65 — 80 | |
| Gold
Equivalent Production | |
koz AuEq | |
| 707 | | |
| 540 — 600 | | |
| 540 — 600 | | |
| 540 — 600 | | |
| 700 — 800 | | |
| 725 — 825 | |
| (9) | Figures may not add due to
rounding. |
| (10) | Çöpler figures
reported on a 100% basis. Çöpler is 80% owned by SSR Mining. |
| (11) | Hod Maden figures presented
as 40% attributable. Hod Maden is currently 10% owned by SSR Mining. SSR Mining has the option to increase its ownership to 40% through
funding of 40% of the pre-production capital commitments and up to $150 million in contingent payments during the construction period.
|
| (12) | Seabee guidance includes potential Mineral Resource conversion in 2028. |
Figure 1. SSR Mining Production History and
Outlook (13)
| (13) | Historical production is
reported on a consolidated basis and is a combination of SSR Mining and Alacer Gold production figures; 2024 – 2028E based on the
mid-point of five-year guidance; Hod Maden reported on a 40% attributable basis. |
Guidance Overview (14)
Consolidated production in 2024 is expected
to be approximately 60% weighted to the second half of the year, with the strongest consolidated production period in the fourth quarter.
This production distribution is driven largely by higher grades and tonnes stacked at Marigold in the second half of 2024. Quarterly AISC
is expected to reflect this production profile, with AISC trending well above the full-year 2024 guidance range in the first half reflecting
increased waste stripping at Marigold and the timing of spend at Seabee associated with the winter road season. AISC in the second half
of 2024 are expected to be below the full-year guidance range. Accordingly, free cash flow generation in 2024 is expected to be strongly
weighted to the second half of the year due to aforementioned production weighting and cost profile, as well as annual tax and royalty
payments incurred in the first half of 2024. Free cash flow in 2024 is expected to be positive despite initial growth capital spending
for Hod Maden and the Grind-Leach Circuit of $117 million.
Çöpler, Türkiye
In 2023, Çöpler produced 220,999
ounces. Gold production was 57,126 ounces in the fourth quarter of 2023, at cost of sales of $1,160 per payable ounce and AISC of $1,535
per payable ounce. In the fourth quarter of 2023, Çöpler recovered approximately 10,000 ounces of gold from Çakmaktepe,
which delivered first production late in the third quarter of 2023 in line with guidance. The Çöpler sulfide plant operated
at an average throughput rate of nearly 7,500 tonnes per day in 2023 and more than 7,700 tonnes per day in the fourth quarter of 2023,
reflecting continued operational improvement efforts.
In 2024, Çöpler is expected
to produce 200,000 to 220,000 ounces of gold at mine site cost of sales of $1,420 to $1,460 per payable ounce and AISC of $1,550 to $1,590
per payable ounce. The expected production profile at Çöpler is approximately 55% weighted to the first half of 2024, reflecting
higher grades as well as planned maintenance in the fourth quarter. Heap leach production in 2024 is expected to total approximately 40,000
ounces of gold.
The 2024 sustaining capex budget at Ҫӧpler
of $29 million includes $9 million in capital leases for the Air Liquide oxygen plant.
Over the five-year period, the gold production
profile at Çöpler is expected to increase to nearly 400,000 ounces annually by 2027, a 23% compound annual growth rate (“CAGR”),
reflecting the significant gold recovery uplift enabled by the Grind-Leach Circuit that is expected to be completed by 2027 for total
growth capital of $194 million. Over the five-year period, AISC are expected to be relatively flat in 2024 and 2025, before improving
significantly in 2026 through 2028.
Marigold, USA
In 2023, gold production at Marigold was
278,488 ounces, a record for the operation over its more than 30-year operating history and in line with full-year guidance. Gold production
was 82,794 ounces in the fourth quarter of 2023, at cost of sales of $1,095 per payable ounce and AISC of $1,170 per payable ounce.
In 2024, Marigold is expected to produce
155,000 to 175,000 ounces of gold at mine site cost of sales of $1,300 to $1,340 per payable ounce and AISC of $1,535 to $1,575 per payable
ounce. For the full-year, production is expected to be 70% weighted to the second half of 2024, reflecting a second-half weighted grade
profile and increased waste stripping in the first quarter. Marigold’s AISC profile is expected to trend well above its asset-level
2024 guidance ranges in the first half, reflecting the aforementioned production profile and waste stripping. The fourth quarter of 2024
is expected to represent Marigold’s strongest production and lowest cost period of the year.
Sustaining capital spend for Marigold in
2024 is forecasted to total $37 million, a more than 50% reduction in capital spend compared to 2023 levels which included the purchase
of four new haul trucks to support waste stripping activities over the near-term. Waste stripping at Red Dot is a key focus for 2024 and
2025, enabling increased gold production over the remainder of the decade.
The gold production profile at Marigold
is expected to increase to over 270,000 ounces annually in 2027, an 18% CAGR over that four-year period, and above 300,000 ounces by 2029.
Costs are expected to improve significantly in 2026 as stacked grades increase due to increased ore contribution from Red Dot. Technical
work is ongoing to potentially expand Marigold’s Mineral Reserves and enable mine life extensions beyond the current nine-year mine
plan, including potential expansions to the Mackay, Valmy, New Millennium, and Buffalo Valley deposits.
Seabee, Canada
For 2023, gold production at Seabee was
90,777 ounces. Gold production was 38,757 ounces in the fourth quarter of 2023, at cost of sales of $666 per payable ounce and AISC of
$916 per payable ounce. Processed grades in the fourth quarter averaged 10.1 g/t.
In 2024, Seabee is expected to produce 75,000
to 85,000 ounces of gold at mine site cost of sales of $990 to $1,030 per payable ounce and AISC of $1,495 to $1,535 per payable ounce.
Seabee’s production is expected to be strongest in the first and third quarters of 2024, reflecting processed grades. Grades are
expected to average between 5.0 and 6.0 g/t in 2024, slightly above the Seabee Mineral Reserve grade. Mine and mill productivity are expected
to average approximately 1,300 tonnes per day through 2024. AISC are expected to be highest in the first half of the year, particularly
the first quarter, reflecting purchases associated with the winter road season.
Sustaining capital expenditures are planned
to total $40 million in 2024, including $24 million in capitalized underground development. Capital expenditures are expected to be concentrated
in the first half of the year, particularly the first quarter, due to the winter road season.
Over the five-year period, Seabee’s
production is expected to average approximately 75,000 ounces annually. Grades are expected to trend closer to 5.0 g/t in 2025 and beyond,
while throughputs are expected to increase to 1,350 to 1,400 tonnes per day. Near-mine exploration continues with the goal of delineating
new Mineral Reserves at Santoy 8, 9 and the Gap and Santoy Hangingwall targets. Exploration and resource development activity also continues
to aggressively advance the Porky and Porky West targets as a potential new underground mining front that could complement and extend
the existing Seabee mine life.
As a result of the updates to Mineral Reserves
and Mineral Resources as of year-end 2023, the Company evaluated goodwill and long-lived assets for impairment. Based on that analysis,
it is expected the Company will record a write-down of $50 million in goodwill at Seabee in the Company’s financial statements for
the year ended December 31, 2023, to be released on February 21, 2024.
Puna, Argentina
For 2023, silver production from Puna was
9.7 million ounces, a record for the operation over its more than 15 year operating life and exceeding the mine’s original full-year
production guidance range. Silver production was 2.8 million ounces in the fourth quarter of 2023 at cost of sales of $14.07 per payable
ounce and AISC of $15.51 per payable ounce.
In 2024, Puna is expected to produce 8.75
to 9.50 million ounces of silver at mine site cost of sales of $16.50 to $18.00 per payable ounce and AISC of $14.75 to $16.25 per payable
ounce. Production is expected to be 55% weighted to the second half of 2024, driven largely by grades that peak in the fourth quarter.
Continued delivery of operational improvement initiatives has enabled further improvement to process plant throughputs at Puna, which
are targeted to average more than 4,750 tonnes per day throughout the year. AISC are expected to be highest in the first half of 2024,
including a peak in the first quarter, reflecting the site-level capital spend profile.
Sustaining capital expenditures are planned
to total $17 million in 2024 and are primarily related to maintenance of mine and plant equipment.
Based on current Mineral Reserves, mining
from the Chinchillas open pit is expected to be completed in 2026. Technical work continues to evaluate opportunities to extend the Puna
life of mine through Mineral Reserve conversion at Chinchillas, as well as the definition of initial Mineral Reserves at the Cortaderas
target.
Growth, Exploration and Resource Development
In 2024, growth exploration and
resource development expenditures are expected to total $50 million. This growth exploration budget is a decrease of approximately
35% over 2023 budgets, reflecting the near-term focus on currently defined development projects. Growth capital expenditures are
expected to total $117 million, driven almost entirely by Çöpler and Hod Maden.
At Çöpler, 2024 consolidated
exploration and resource development expenditures are estimated to total $12 million, with a primary focus on additional Mineral Reserve
conversion and expansion of the Ҫӧpler and Çakmaktepe ore bodies. Regional exploration on the Kartaltepe licenses,
most notably Mavidere / Mavidere South, is also continuing as the Company evaluates additional potential ore sources across the greater
Çöpler district. Growth capital expenditures at Çöpler are expected to total $77 million and are associated with
expansion costs for the Çöpler tailings storage facility, along with initial development costs for the installation of Grind-Leach
Circuit to process oxide ore in 2027 and beyond.
At Marigold, 2024 consolidated exploration
and resource development expenditures are estimated at $9 million, focusing on oxide Mineral Reserve additions and conversion at Buffalo
Valley, Mackay, Valmy and New Millennium. Growth exploration expenditures also include geophysics and testing of new targets across the
greater Marigold land package.
At Hod Maden, technical work continues ahead
of a construction decision and accompanying project financing package. As per the previously disclosed transaction terms, during the earn-in
period, SSR Mining will contribute 40% of project development costs. In 2024, the attributable spend at Hod Maden for SSR Mining is expected
to total approximately $37 million. This includes continued advancement of initial earth works and site access activities, as well as
the commencement of underground portal development in the second half of the year. In addition to SSR Mining’s attributable capital
commitments, up to $30 million in earn-in structured payments are expected to be incurred in 2024. All Hod Maden development costs will
be recorded at 100% attributable in SSR Mining’s financial statements, and then credited against accordingly by non-controlling
interest inflows. Technical work completed to-date continues to affirm prior due diligence outcomes around project capital and scope,
and an initial infill drill program continues at site with the aim of de-risking the first four years of the mine. Results to date have
not shown any deviation from the existing resource model, affirming Hod Maden’s best-in-class grades.
At Seabee, 2024 consolidated exploration
and resource development expenditures are estimated at $15 million with a focus on defining initial Mineral Reserves at the Porky and
Porky West targets. Further drilling will also be completed at the Gap Hangingwall to evaluate potential extensions to the existing Mineral
Reserves and mine life at Seabee. Earlier stage exploration activity also continues across the broader Seabee property, including follow-up
sampling and potential drill testing at a number of regional targets.
At Puna, 2024 consolidated exploration and
resource development expenditures are anticipated to total $10 million, with the majority of that spend allocated to advancing Mineral
Resource definition at the Cortaderas target ahead of an initial economic evaluation of the target. Work is also underway to evaluate
potential Mineral Reserve conversion at Chinchillas in order to extend the mine life in the near-term.
Other exploration and development expenditures
total $4 million as SSR Mining advances greenfield opportunities across its portfolio, including drilling programs at the Copper Hill
target in northeastern Türkiye and at the Amisk project in Saskatchewan. Mapping and sampling work is also continuing at earlier
stage and regional opportunities in the U.S., Türkiye, and Canada.
| (14) | The Company reports non-GAAP
financial measures including free cash flow and All-In Sustaining Cost (“AISC”) per ounce sold (a common measure in the mining
industry), to manage and evaluate its operating performance at its mines. See “Cautionary Note Regarding Non-GAAP Financial Measures”
for an explanation of these financial measures and a reconciliation of these financial measures to the most comparable GAAP financial
measures. |
Technical Report Summaries (“TRS”) Highlights
SSR Mining has published updated TRS for
its four producing assets. The TRS for each asset are based exclusively on Mineral Reserves and expand upon the production profiles set
out in the 2021 Technical Report Summaries. Effective dates for the 2023 reports are September 30, 2023 for Marigold, October 31, 2023
for Çöpler and December 31, 2023 for Seabee and Puna. Updated technical work at Hod Maden is ongoing.
Table 3: Key metrics from 2023 Technical
Report Summaries
| Producing
Asset (15) | |
Mine Life | |
LOM Production | |
LOM
Free Cash Flow | |
After-Tax
NPV5% |
| Çöpler | |
15 years | |
4,254koz Au | |
$ | 2,368 | M | |
$ | 1,643 | M |
| Marigold | |
9 years active mining /
15 years incl. residual leaching | |
2,199koz Au | |
$ | 1,072 | M | |
$ | 800 | M |
| Seabee | |
4 years | |
327koz Au | |
$ | 102 | M | |
$ | 95 | M |
| Puna (16) | |
3 years | |
19.9 Moz Ag | |
$ | 132 | M | |
$ | 136 | M |
| (15) | Figures are reported on a
100% basis. Çöpler is 80% owned by SSR Mining. |
| (16) | Puna 2023 TRS NPV uses an
8% discount rate. Puna NPV exceeds life of mine free cash flow as a result of discounting factor on reclamation spend following the completion
of production. |
Figure 2. Life of Mine average AISC by asset in the 2023 TRS,
plotted against the gold industry co-product AISC curve for 2024. Industry data obtained from S&P Capital IQ.
Figure 3. SSR Mining’s current market capitalization
as compared to the Company’s consolidated Mineral Reserve-only case net asset values and net cash position.
Ҫӧpler Technical
Report Summary
The Technical Report Summary on the Ҫӧpler
Property, Türkiye (the “2023 Çöpler TRS”) represents the synthesis of extensive exploration activity, updated
geotechnical and metallurgical test work, and ongoing continual improvement initiatives. Overall, total Mineral Reserves have increased
2% from end-2022, despite 2023 depletion, reflecting successful Mineral Resource conversion at Çakmaktepe, which now hosts 3 million
ounces of gold Mineral Reserves (2.4 million ounces attributable). The resulting consolidated 5.1 million ounces of Mineral Reserves (4.1
million ounces attributable) at Ҫӧpler support a 15-year mine life, with significant potential upside across near-mine and
regional targets going forward.
Highlights of the 2023 Ҫӧpler
TRS include:
| · | 15-year mine life including |
| o | Life of mine production of 4,254
ounces gold, a ~10% increase in total production over the 2021 TRS Mineral Reserve Case; |
| o | Average annual production of
281,000 ounces of gold over the life of mine; |
| o | Average cost of sales of $965
per payable ounce and AISC of $1,003 per payable ounce over the life of mine; and |
| o | Average annual after-tax operating
cash flow of $197 million and free cash flow of approximately $160 million over the life of mine; |
| · | An initial $194 million
investment in a Grind-Leach Circuit, expected to be completed in early 2027, which adds an incremental 570 thousand ounces of life
of mine gold production from Çakmaktepe. |
| o | Grind-Leach projected IRR:
+30% |
Figure 4. Life of Mine Production Profile from
2023 Çöpler TRS as compared to 2021 TRS Reserve Case mine plan
Table 4: Key Metrics From 2023 Ҫӧpler
TRS
| | |
Unit | |
2024
– 2028 | |
Life
of Mine (18) |
| Total Production | |
Au koz | |
| 1,494 | | |
| 4,254 | |
| Avg. Annual Production | |
Au koz | |
| 299 | | |
| 281 | |
| | |
| |
| | | |
| | |
| Total Operating Cash Flow | |
$M | |
$ | 1,059 | | |
$ | 3,005 | |
Total Capital Costs (Incl. Reclamation) (17) | |
$M | |
$ | 394 | | |
$ | 637 | |
| Total Free Cash Flow | |
$M | |
$ | 665 | | |
$ | 2,368 | |
| Average Annual Free Cash Flow | |
$M | |
$ | 133 | | |
$ | 160 | |
| | |
| |
| | | |
| | |
| Cost of Sales | |
Au $/oz | |
$ | 1,081 | | |
$ | 965 | |
| Cash Costs | |
Au $/oz | |
$ | 1,081 | | |
$ | 965 | |
| AISC | |
Au $/oz | |
$ | 1,104 | | |
$ | 1,003 | |
| (17) | Total capital costs include
reclamation and working capital. |
| (18) | Life of mine average production
and free cash flow reflect the period from 2024 to 2038. |
Figure 5. Net Asset Value sensitivity for the
Ҫӧpler property as per the 2023 TRS.
Additional potential for upside at Ҫӧpler
The updated 2023 Çöpler TRS
highlights improvement to the production and free cash flow profile as compared to the Reserve Case production scenario in the 2021 Çöpler
TRS. Additionally there are multiple opportunities for possible growth beyond the 2023 TRS that are currently being investigated, including:
| · | Continued evaluation of additional
Çakmaktepe Mineral Reserve growth at depth and through additional targets along trend to the southeast; |
| · | Near-pit exploration success
at targets adjacent to the Ҫӧpler Pits that could further complement the existing Sulfide and/or Oxide production profile;
|
| · | Initial drill testing of higher-grade,
discreet mineralization targets below the Çöpler, Manganese and Marble pits that could potentially support future growth; |
| · | Optimization of the blended ore
feed to the three flowsheets (sulfide plant, grind-leach circuit and heap leach pads) to increase recoveries and value; |
| · | Evaluation of additional tailings
capacity, including dry stack tailings, to support additional Mineral Reserve conversion and mine life extension; and |
| · | Regional exploration success
at targets across the Ҫӧpler District, in particular Mavidere and Mavidere South. |
SSR Mining has budgeted more than 30,000
meters of exploration and resource development drilling across the Ҫӧpler District in 2024.
As a result of the removal of Mineral Resources
associated with C2 at Çöpler, SSR Mining performed its long lived asset and impairment evaluation. Based on the evaluation,
the Company expects to record a $349 million non-cash write down, adjusting its fixed asset and mineral property value from approximately
$2.80 billion to $2.45 billion in its full-year 2023 results to be released on February 21, 2024.
Marigold Technical Report Summary
The 2023 Technical Report Summary on the Marigold
Complex, Nevada, USA (the “2023 Marigold TRS”) is based exclusively on existing Mineral Reserves and does not yet incorporate
initial Mineral Resources at Buffalo Valley, or any potential Mineral Resource conversion at the Valmy, Mackay or New Millennium targets.
The focus of continued near-mine exploration will be to deliver additional Mineral Reserves at brownfield targets to extend the 9-year
Marigold mine life. The mine plan in the TRS expands on the production profile outlined in Marigold’s 2021 Technical Report Summary,
including a 4% increase in remaining life of mine production as compared to the remaining production profile in the 2021 Technical Report
Summary. Cost assumptions were also updated to reflect recent actual results. For the remainder of the current mine plan, there are limited
major capital projects expected, positioning the mine to deliver strong free cash flow.
Highlights of the 2023 Marigold TRS include:
| · | 9-year mine life, 15 years of
total production including residual leaching; |
| · | Life of mine production of 2.2
million ounces gold, a 4% increase in LOM production over the remaining period in the prior 2021 technical report; |
| · | Average annual production of
212,000 ounces of gold over the life of mine period from 2024 to 2032; |
| · | Average cost of sales of $1,065
per ounce and AISC of $1,213 per ounce over the life of mine; and |
| · | Average annual after-tax operating
cash flow of $124 million and free cash flow of $95 million over the nine-year period of active mining. |
Figure 6. Life of Mine Production Profile from
the 2023 Marigold TRS as compared to 2021 Marigold TRS
Table 5. Key Metrics from the Marigold TRS
| | |
| |
2024
– 2028 | |
Life
of Mine (20) |
| Total Production | |
Au koz | |
| 1,068 | | |
| 2,199 | |
| Average Annual Production | |
Au koz | |
| 214 | | |
| 212 | |
| | |
| |
| | | |
| | |
| Operating Cash Flow | |
$M | |
$ | 549 | | |
$ | 1,399 | |
| Total Capital Costs (19) | |
$M | |
$ | 204 | | |
$ | 327 | |
| Total Free Cash Flow | |
$M | |
$ | 345 | | |
$ | 1,072 | |
| Average Annual Free Cash Flow | |
$M | |
$ | 69 | | |
$ | 95 | |
| | |
| |
| | | |
| | |
| Cost of Sales | |
$ / Au oz | |
$ | 1,239 | | |
$ | 1,065 | |
| Cash Costs | |
$ / Au oz | |
$ | 1,239 | | |
$ | 1,065 | |
| AISC | |
$ / Au oz | |
$ | 1,430 | | |
$ | 1,213 | |
| (19) | Total capital costs include
working capital and reclamation. |
| (20) | Life of mine metrics are
from 2024 onwards. Average annual metrics exclude residual leaching. |
Figure 7. Net Asset Value sensitivity for the
Marigold property as per the 2023 TRS.
Additional potential for upside at Marigold
The Marigold property hosts significant potential
for mine life extension through future Mineral Reserve conversion and growth. Opportunities for possible growth beyond the TRS life of
mine plan include:
| · | M&I Mineral Resources of
1.7 million ounces gold and Inferred Resources of 0.4 million ounces gold not incorporated in the current Mineral Reserve; |
| · | Continued exploration across
the Marigold land package with a focus on definition and growth opportunities; and |
| · | New Millennium and Buffalo
Valley may host potential for longer-term stand-alone processing infrastructure, improving operating costs through shorter hauls. |
SSR Mining has planned nearly 50,000 meters of
exploration and resource development drilling at Marigold in 2024 to continue advancing these brownfield exploration targets.
Mineral Reserves and Mineral Resources (“MRMR”)
for Year-End 2023
SSR Mining reported its updated MRMR as
of December 31, 2023, reflecting depletion that occurred through mining activity, stockpile changes, new Mineral Reserves and Mineral
Resources delineated from drilling activity, Mineral Resource conversion, and changes resulting from asset acquisitions and divestitures
announced in 2023. SSR Mining continues to advance exploration and resource development activities at each of its assets, and this data
will be incorporated into MRMR statements as the accompanying technical work so dictates.
As per Subpart
1300 of Regulation S-K, the Company’s year-end 2023 MRMR are presented on an attributable basis.
| ▪ | Commodity
price assumptions aligned with peers: The gold price
used in the calculation of Mineral Reserves was increased from $1,350 per ounce in 2022 to $1,450 per ounce used in 2023. The gold price
used in Seabee’s Mineral Reserve price remained unchanged at $1,600 per ounce, All other commodity prices used in the calculation
of Mineral Reserves for both 2023 and 2022 are unchanged from $18.50 per ounce silver, $0.90 per pound of lead, $1.05 per pound of zinc,
and $3.30 per pound copper. Mineral Resource prices of $1,750 per ounce gold, $22.00 per ounce silver, $0.95 per pound lead, $1.15 per
pound zinc and $3.95 per pound copper were unchanged from 2022. |
| ▪ | Acquisition
of Hod Maden; Non-Core San Luis Project Divested:
In the second quarter of 2023, SSR Mining announced the acquisition of an up to 40% ownership interest and operatorship in the Hod Maden
gold-copper project. At a 40% basis, Hod Maden will contribute nearly one million ounces of gold and approximately 115 million pounds
of copper to SSR Mining’s Mineral Reserves. As announced on November 30, 2023, SSR Mining entered into an agreement to sell its
San Luis project. As a result, all Measured, Indicated and Inferred Mineral Resources at San Luis were removed from SSR Mining’s
consolidated Mineral Resource statement. No Mineral Reserves had been identified at San Luis. |
| ▪ | Mineral Reserves:
Gold Mineral Reserves as of December 31, 2023 were
7.3 million, excluding any contribution from Hod Maden, down 5% compared to year-end 2022, and reflecting mine depletion and Mineral Resource
conversion. Total gold equivalent Mineral Reserves as of December 31, 2023 were 7.8 million ounces. |
| ▪ | Measured and
Indicated Mineral Resources: Gold Measured and Indicated
Mineral Resources as of December 31, 2023 were 4.0 million ounces, excluding any contribution from Hod Maden, down 30% or 1.7 million
ounces as compared to year-end 2022. Total gold equivalent Measured and Indicated Mineral Resources were 5.3 million ounces, down 28%
or 2.0 million ounces from the prior year largely a result of Mineral Resource conversion, the sale of San Luis, and the removal of copper-gold
mineralization associated with the C2 Project at Çöpler from the Company’s Mineral Resources. |
| ▪ | Inferred Mineral
Resources: Gold Inferred Mineral Resources of 2.6
million ounces, excluding any contribution from Hod Maden, decreased by 44% or 2.1 million ounces as compared to year-end 2022 Inferred
Mineral Resources. Gold equivalent Inferred Mineral Resources of 3.2 million ounces decreased by 47% or 2.7 million ounces as compared
to year-end 2022. This was largely driven by the sale of San Luis and the aforementioned removal of C2 mineralization from all categories
of Mineral Resources. |
Table 6: SSR Mining Mineral Reserves and
Resources as of December 31, 2023 (21)
| SSRM Attributable |
Gold |
y/y |
Silver |
y/y |
Lead |
Zinc |
Copper |
AuEq
(22) |
| (Excluding Hod Maden) |
koz |
% |
koz |
% |
Mlb |
Mlb |
Mlb |
koz |
| Total P+P Reserves |
7,275 |
(5%) |
26,806 |
(33%) |
113 |
20 |
27 |
7,764 |
| Total M&I Resource (23) |
4,034 |
(30%) |
66,218 |
(1%) |
196 |
404 |
30 |
5,307 |
| Total Inferred Resource |
2,642 |
(43%) |
20,932 |
(46%) |
24 |
227 |
24 |
3,211 |
| (21) | MRMR
are shown as attributable to SSR Mining only. As of December 31, 2023, SSR Mining owns 80% of the Çöpler district. Hod Maden
Mineral Reserves and Mineral Resources are not included in SSR Mining’s consolidated MRMR tables as of year-end 2023. |
| (22) | All
gold equivalent ounces (GEO or AuEq) figures are based on the above-mentioned commodity prices. Metal equivalence is calculated for the
respective and applicable metals as follows: GEO = Au oz + ((Ag oz * Ag price) + (Pb lb * Pb price per pound) + (Zn lb * Zn price per
pound) + (Cu lb * Cu price per pound)) / (Au price per ounce). |
| (23) | Measured
and indicated Mineral Resources are shown exclusive of Mineral Reserves. |
| Hod
Maden |
Gold |
Copper |
AuEq
(24) |
| |
koz |
Mlb |
koz |
| Total P+P Reserves (40% Attributable) |
981 |
115 |
1,246 |
| (24) | All
gold equivalent ounces (GEO or AuEq) figures are based on a $1,300/oz gold price and $3.00/lb copper price. Metal equivalence is calculated
for Hod Maden as follows: GEO = Au oz + (Cu lb * Cu price per pound) / (Au price per ounce). See endnote on Reserve and Resource Estimates
by Mineral for Hod Maden for the assumptions on which these Mineral Reserves are reported. |
Figure 8. Reconciliation of year-over-year
changes to consolidated Mineral Reserves (shown on an attributable basis).
Conference Call Information
To accompany this news release, SSR Mining’s
senior leadership team will host a conference call this morning to provide an overview of current operations, as well as the Company’s
outlook and long-term growth strategy. Investors, media and the public are invited to listen to the conference call and accompanying webcast.
| · | Conference call and webcast:
Tuesday, February 13, 2024, at 9:00 am EST. |
| | Toll-free
in U.S. and Canada: |
+1 (800) 319-4610 |
| All
other callers: |
+1 (604) 638-5340 |
| | Webcast: http://ir.ssrmining.com/investors/events |
| · | The conference call will be archived
and available on our website. Audio replay will be available for two weeks by calling: |
| | Toll-free
in U.S. and Canada: |
+1 (855) 669-9658, replay
code 0631 |
| All
other callers: |
+1 (412) 317-0088,
replay code 0631 |
Assumptions
All figures are in U.S. dollars, unless otherwise
noted. Gold equivalent figures for operating guidance are based on a gold-to-silver ratio of 81:1 in 2024, 79:1 in 2025 and 76:1 in 2026
and beyond. Gold equivalent figures for 2023 are based on a gold-silver ratio of 83:1. Cost of sales, cash costs, AISC and capital expenditure
guidance is based on an exchange rate of 1.33 Canadian dollars to one U.S. dollar and an exchange rate of 34 Turkish Lira to one U.S.
dollar and are subject to the key assumptions, risks and uncertainties described under “Cautionary Note Regarding Forward-Looking
Information and Statements”. All figures are presented on a 100% basis, unless otherwise noted. Çöpler is 80% owned
by SSR Mining. Hod Maden is 10% owned by SSR Mining but is classified as a variable interest entity due to SSR Mining’s majority
voting rights within the entity. SSR Mining has the option to increase its ownership to 40% through contingent payments during the construction
period.
Consensus gold and silver prices were used
in the compilation of the 2023 TRS. This includes gold prices of: 2023 - $1,925/oz; 2024 - $1,930/oz; 2025 - $1,890/oz; 2026 - $1,810/oz;
2027 - $1,780/oz; long-term - $1,755/oz, and silver prices of: 2023 - $23.50/oz; 2024 - $24.00/oz; 2025 – $23.95/oz; 2026 –
$23.70/oz; 2027 - $23.35/oz; long-term - $22.75/oz.
About SSR Mining
SSR Mining Inc. is a leading, free cash flow
focused gold company with four producing operations located in the USA, Türkiye, Canada, and Argentina, combined with a global pipeline
of high-quality development and exploration assets. Over the last three years, the four operating assets combined have produced on average
more than 700,000 gold-equivalent ounces annually. SSR Mining is listed under the ticker symbol SSRM on the Nasdaq and the TSX, and SSR
on the ASX.
SSR Mining Contacts:
F. Edward Farid, Executive Vice President,
Chief Corporate Development Officer
Alex Hunchak, Vice President, Investor Relations
SSR Mining Inc.
E-Mail: [email protected]
Phone: +1 (888) 338-0046
To receive SSR Mining’s news releases
by e-mail, please register using the SSR Mining website at www.ssrmining.com.
Reserve and Resource Estimates by Mineral for Hod Maden
The Mineral Reserves and Mineral Resources for Hod
Maden as of December 31, 2023 that are presented herein are estimates that have been prepared by SSR Mining based on data available as
of July 2019 and have been approved by internal SSR Mining qualified persons, as defined under Regulation S-K 1300. Hod Maden is not considered
a material property of the Company, as it relates to Regulation S-K 1300.
The Hod Maden Resources and Hod Maden Reserves
(as defined below) are estimates made by SSR Mining and have not been prepared, reviewed or verified by an independent, third-party qualified
person and have not been prepared or presented in accordance with Regulations S-K 1300.
The Hod Maden Reserves are estimates based on information
available at the time of calculation in a manner consistent with industry practice.
Measured and Indicated Resources were converted to
Proven and Probable Mineral Reserves through application of relevant modifying factors and the appropriate mining recovery and dilution
parameters were applied. Mineral Reserves are reported based on mined ore to be delivered to the plant as mill feed. Ounces of gold or
pounds of copper in the Hod Maden Reserves presented herein are calculated without regard to any losses during metallurgical treatment.
Market price fluctuations of gold and copper, as well as increased cost of production/sales or reduced metallurgical recovery rates, could
result in the Hod Maden Reserves containing relatively lower grades of mineralization uneconomic to exploit and result in a decrease in
actual recovery as compared to the Hod Maden Reserves reported herein.
The Mineral Resources presented herein for Hod Maden
(the “Hod Maden Resources”) are presented exclusive of the Hod Maden Reserves. Due to the uncertainty that may be attached
to Inferred Mineral Resources, it cannot be assumed that all or any part of an Inferred Mineral Resource will be upgraded to an Indicated
or Measured Mineral Resource as a result of continued exploration.
Hod Maden Reserves and Hod Maden Resources are based
on $1,300/oz gold price and $3.00/lb copper and an 85% metallurgical recovery for gold, and are reported based on incremental cut-off
of NSR of $63/t and $40/t for development. Metals shown in the tables are contained metals in ore mined and processed. Tonnage is metric
tonnes, ounces represent troy ounces, and g/t represents grams per metric tonne. The point of reference for the Hod Maden Reserves is
the proposed onsite processing facility.
Cautionary Note Regarding Forward-Looking Information
and Statements:
Except for statements of historical fact relating
to us, certain statements contained in this news release constitute forward-looking information, future oriented financial information,
or financial outlooks (collectively “forward-looking information”) within the meaning of applicable securities laws. Forward-looking
information may be contained in this document and our other public filings. Forward-looking information relates to statements concerning
our outlook and anticipated events or results and in some cases, can be identified by terminology such as “may”, “will”,
“could”, “should”, “expect”, “plan”, “anticipate”, “believe”,
“intend”, “estimate”, “projects”, “predict”, “potential”, “continue”
or other similar expressions concerning matters that are not historical facts.
Forward-looking information and statements in this
news release are based on certain key expectations and assumptions made by us. Although we believe that the expectations and assumptions
on which such forward-looking information and statements are based are reasonable, undue reliance should not be placed on the forward-looking
information and statements because we can give no assurance that they will prove to be correct. Forward-looking information and statements
are subject to various risks and uncertainties which could cause actual results and experience to differ materially from the anticipated
results or expectations expressed in this news release. The key risks and uncertainties include, but are not limited to: local and global
political and economic conditions; governmental and regulatory requirements and actions by governmental authorities, including changes
in government policy, government ownership requirements, changes in environmental, tax and other laws or regulations and the interpretation
thereof; developments with respect to global pandemics, including the duration, severity and scope of a pandemic and potential impacts
on mining operations; and other risk factors detailed from time to time in our reports filed with the Securities and Exchange Commission
on EDGAR and the Canadian securities regulatory authorities on SEDAR.
Forward-looking information and statements in this
news release include any statements concerning, among other things: forecasts and outlook; preliminary cost reporting in this document;
timing, production, operating, cost, and capital expenditure guidance; our operational and development targets and catalysts and the impact
of any suspensions on operations; the results of any gold reconciliations; the ability to discover additional oxide gold ore; the generation
of free cash flow and payment of dividends; matters relating to proposed exploration; communications with local stakeholders; maintaining
community and government relations; negotiations of joint ventures; negotiation and completion of transactions; commodity prices; Mineral
Resources, Mineral Reserves, conversion of Mineral Resources, realization of Mineral Reserves, and the existence or realization of Mineral
Resource estimates; the development approach; the timing and amount of future production; the timing of studies, announcements, and analysis;
the timing of construction and development of proposed mines and process facilities; capital and operating expenditures; economic conditions;
availability of sufficient financing; exploration plans; receipt of regulatory approvals; timing and impact surrounding suspension or
interruption of operations as a result of regulatory requirements or actions by governmental authority; renewal of NCIB program; and any
and all other timing, exploration, development, operational, financial, budgetary, economic, legal, social, environmental, regulatory,
and political matters that may influence or be influenced by future events or conditions.
Such forward-looking information and statements are
based on a number of material factors and assumptions, including, but not limited in any manner to, those disclosed in any other of our
filings on EDGAR and SEDAR, and include: the inherent speculative nature of exploration results; the ability to explore; communications
with local stakeholders; maintaining community and governmental relations; status of negotiations of joint ventures; weather conditions
at our operations; commodity prices; the ultimate determination of and realization of Mineral Reserves; existence or realization of Mineral
Resources; the development approach; availability and receipt of required approvals, titles, licenses and permits; sufficient working
capital to develop and operate the mines and implement development plans; access to adequate services and supplies; foreign currency exchange
rates; interest rates; access to capital markets and associated cost of funds; availability of a qualified work force; ability to negotiate,
finalize, and execute relevant agreements; lack of social opposition to our mines or facilities; lack of legal challenges with respect
to our properties; the timing and amount of future production; the ability to meet production, cost, and capital expenditure targets;
timing and ability to produce studies and analyses; capital and operating expenditures; economic conditions; availability of sufficient
financing; the ultimate ability to mine, process, and sell mineral products on economically favorable terms; and any and all other timing,
exploration, development, operational, financial, budgetary, economic, legal, social, geopolitical, regulatory and political factors that
may influence future events or conditions. While we consider these factors and assumptions to be reasonable based on information currently
available to us, they may prove to be incorrect.
The above list is not exhaustive of the factors
that may affect any of the Company’s forward-looking information. You should not place undue reliance on forward-looking information
and statements. Forward-looking information and statements are only predictions based on our current expectations and our projections
about future events. Actual results may vary from such forward-looking information for a variety of reasons including, but not limited
to, risks and uncertainties disclosed in our filings on our website at www.ssrmining.com,
on SEDAR at www.sedarplus.ca, on EDGAR at www.sec.gov
and on the ASX at www.asx.com.au and other unforeseen events or circumstances. Other than
as required by law, we do not intend, and undertake no obligation to update any forward-looking information to reflect, among other things,
new information or future events. The information contained on, or that may be accessed through, our website is not incorporated by reference
into, and is not a part of, this document.
Cautionary Note to U.S. Investors
This news release includes terms that comply with
reporting standards in Canada under National Instrument 43-101 – Standards of Disclosure for Mineral Projects (“NI 43-101”),
including the terms “Mineral Reserves” and “Mineral Resources”. NI 43-101 is a rule developed by the Canadian
Securities Administrators that establishes standards for all public disclosure an issuer makes of scientific and technical information
concerning mineral projects. The standards of NI 43-101 differ significantly from the requirements of the SEC. Accordingly, information
concerning mineral deposits set forth herein may not be comparable with information made in accordance with U.S. standards.
Qualified Persons
All key assumptions, parameters and methods used
to estimate Mineral Reserves and Mineral Resources reported herein in respect of Çöpler, Marigold, Seabee and Puna, and the
data verification procedures followed, are set out in the Technical Report Summary on the Çöpler Property, Türkiye, the
Technical Report Summary on the Marigold Complex, Nevada, USA , the Technical Report Summary on the Seabee Gold Operation, Saskatchewan,
Canada, and the Technical Report Summary on the Puna Operations, Argentina (each a “Technical Report Summary”). Each Technical
Report Summary has been filed with the SEC as part of the Company's Current Report on Form 8-K filed on February 13, 2024, and incorporated
by reference herein, and is available for review on EDGAR at www.sec.gov. Each Technical Report Summary will also be filed with the applicable
securities regulatory authorities in Canada as a technical report in compliance with National Instrument 43-101 – Standards of Disclosure
for Mineral Projects, and will be available for review on SEDAR+ at www.sedarplus.ca.
Except as otherwise set out herein, the
scientific and technical information contained in this news release relating to Çöpler has been reviewed and verified by
SLR International Corporation, RSC Consulting Ltd., WSP USA Inc., and Ausenco Services Pty Limited, each of which is a qualified
person under Subpart 1300 of Regulation SK with respect to the sections of the 2023 Çöpler TRS for which such entity
acted as qualified person, as set forth in the 2023 Çöpler TRS. The scientific and technical information contained in
this news release relating to Marigold, Seabee and Puna TRS has been reviewed and verified by SLR International Corporation, a
qualified person under Subpart 1300 of Regulation SK.
Cautionary Note Regarding Non-GAAP Measures
We have included certain non-GAAP performance measures
throughout this document. These performance measures are employed by us to measure our operating and economic performance internally and
to assist in decision-making, as well as to provide key performance information to senior management. We believe that, in addition to
conventional measures prepared in accordance with GAAP, certain investors and other stakeholders also use this information to evaluate
our operating and financial performance; however, these non-GAAP performance measures do not have any standardized meaning. Accordingly,
these performance measures are intended to provide additional information and should not be considered in isolation or as a substitute
for measures of performance prepared in accordance with GAAP. Our definitions of our non-GAAP financial measures may not be comparable
to similarly titled measures reported by other companies. These non-GAAP measures should be read in conjunction with our condensed consolidated
interim financial statements.
Cash costs, AISC per ounce sold, and free cash flow
are Non-GAAP Measures with no standardized definition under U.S GAAP.
The Company uses cash costs per ounce of precious
metals sold, a non-GAAP financial measure, to monitor its operating performance internally, including operating cash costs, and for internal
decision making. The Company believes this measure provides investors and analysts with useful information about its underlying cash costs
of operations and the impact of by-product credits on its cost structure. The Company also believes it is a relevant metric used to understand
its operating profitability and ability to generate cash flow. When deriving the cost of sales associated with an ounce of precious metal,
the Company includes the by-product credits as it considers the cost to produce the gold or silver is reduced as a result of the by-product
sales incidental to the gold and silver production process, thereby allowing management and other stakeholders to assess the net costs
of gold and silver production. In calculating cash costs per payable ounce, the Company also excludes the impact of specific items that
are significant, but not reflective of its underlying operations. When deriving the number of ounces of precious metal sold, the Company considers the physical ounces available
for sale after the treatment and refining process, commonly referred to as payable metal, as this is what is sold to third parties. Cash
costs per payable ounce metrics, net of by-product credits, are also used in the Company's internal decision making processes.
AISC includes total cost of sales incurred at the
Company's mining operations, which forms the basis of its by-product cash costs. Additionally, the Company includes sustaining capital
expenditures, sustaining mine-site exploration and evaluation costs, reclamation cost accretion and amortization and general and administrative
expenses. This measure seeks to reflect the ongoing cost of gold and silver production from current operations; therefore, growth
expenditures are excluded. Certain other cash expenditures, including tax payments and financing costs are
also excluded. The Company believes that this measure represents the total costs of producing gold and silver from current operations
and provides the Company and other stakeholders with additional information about its operating performance and ability to generate cash
flows. It allows the Company to assess its ability to support capital expenditures and to sustain future production from the generation
of operating cash flows.
We have presented our projected 2027 AISC trend in this press release. We have not presented a projected 2027 cost
of sales amount, the most comparable GAAP measure, and a corresponding reconciliation of projected 2027 cost of sales to projected 2027
AISC in this press release because the adjustments, including inventory movements and related expenses, for example, are not calculable
at this time without unreasonable efforts. In addition, we believe projections of these adjustments would imply a degree of precision
and certainty that could be confusing to investors. It is probable that projected 2027 AISC may be materially different from projected
2027 cost of sales, the most comparable GAAP financial measure. We have, however, presented a reconciliation of our full year 2024
cost of sales guidance to our full year AISC guidance below.
The following tables provide a reconciliation of cost of sales to cash
costs and AISC:
| | |
Three Months Ended December 31, 2023 |
| (in thousands, unless otherwise noted) | |
Çöpler | |
Marigold | |
Seabee | |
Puna | |
Corporate | |
Total |
| Cost of sales (GAAP) (25) | |
$ | 69,259 | | |
$ | 88,920 | | |
$ | 21,338 | | |
$ | 39,822 | | |
$ | — | | |
$ | 219,340 | |
| By-product credits | |
$ | (849 | ) | |
$ | (55 | ) | |
$ | (13 | ) | |
$ | (15,310 | ) | |
$ | — | | |
$ | (16,227 | ) |
| Treatment and refining charges | |
$ | — | | |
$ | 157 | | |
$ | 28 | | |
$ | 4,685 | | |
$ | — | | |
$ | 4,869 | |
| Cash costs (non-GAAP) | |
$ | 68,410 | | |
$ | 89,023 | | |
$ | 21,353 | | |
$ | 29,197 | | |
$ | — | | |
$ | 207,982 | |
| Sustaining capital expenditures | |
$ | 17,979 | | |
$ | 4,453 | | |
$ | 6,774 | | |
$ | 3,293 | | |
$ | — | | |
$ | 32,499 | |
| Sustaining exploration and evaluation expense | |
$ | 3,419 | | |
$ | 872 | | |
$ | — | | |
$ | — | | |
$ | — | | |
$ | 4,291 | |
| Reclamation cost accretion and amortization (26) | |
$ | 427 | | |
$ | 609 | | |
$ | 1,239 | | |
$ | 11,302 | | |
$ | — | | |
$ | 13,578 | |
| General and administrative expense and stock-based compensation expense | |
$ | 1,384 | | |
$ | — | | |
$ | — | | |
$ | 114 | | |
$ | 13,582 | | |
$ | 15,080 | |
| Total AISC (non-GAAP) | |
$ | 91,619 | | |
$ | 94,957 | | |
$ | 29,365 | | |
$ | 43,906 | | |
$ | 13,582 | | |
$ | 273,429 | |
| | |
| | | |
| | | |
| | | |
| | | |
| | | |
| | |
| Gold sold (oz) | |
| 59,694 | | |
| 81,173 | | |
| 32,050 | | |
| — | | |
| — | | |
| 172,917 | |
| Silver sold (oz) | |
| — | | |
| — | | |
| — | | |
| 2,830,057 | | |
| — | | |
| 2,830,057 | |
| Gold equivalent sold (oz) (27, 28) | |
| 59,694 | | |
| 81,173 | | |
| 32,050 | | |
| 33,277 | | |
| — | | |
| 206,194 | |
| | |
| | | |
| | | |
| | | |
| | | |
| | | |
| | |
| Cost of sales per gold ounces sold | |
$ | 1,160 | | |
$ | 1,095 | | |
$ | 666 | | |
| N/A | | |
| N/A | | |
| N/A | |
| Cost of sales per silver ounces sold | |
| N/A | | |
| N/A | | |
| N/A | | |
$ | 14.07 | | |
| N/A | | |
| N/A | |
| Cost of sales per gold equivalent ounce sold | |
$ | 1,160 | | |
$ | 1,095 | | |
$ | 666 | | |
$ | 1,197 | | |
| N/A | | |
$ | 1,064 | |
| Cash cost per gold ounce sold | |
$ | 1,146 | | |
$ | 1,097 | | |
$ | 666 | | |
| N/A | | |
| N/A | | |
| N/A | |
| Cash cost per silver ounce sold | |
| N/A | | |
| N/A | | |
| N/A | | |
$ | 10.32 | | |
| N/A | | |
| N/A | |
| Cash cost per gold equivalent ounce sold | |
$ | 1,146 | | |
$ | 1,097 | | |
$ | 666 | | |
$ | 877 | | |
| N/A | | |
$ | 1,008 | |
| AISC per gold ounce sold | |
$ | 1,535 | | |
$ | 1,170 | | |
$ | 916 | | |
| N/A | | |
| N/A | | |
| N/A | |
| AISC per silver ounce sold | |
| N/A | | |
| N/A | | |
| N/A | | |
$ | 15.51 | | |
| N/A | | |
| N/A | |
| AISC per gold equivalent ounce sold | |
$ | 1,535 | | |
$ | 1,170 | | |
$ | 916 | | |
$ | 1,319 | | |
| N/A | | |
$ | 1,326 | |
| | |
Twelve Months Ended December 31, 2023 |
| (in thousands, unless otherwise noted) | |
Çöpler | |
Marigold | |
Seabee | |
Puna | |
Corporate | |
Total |
| Cost of sales (GAAP) (25) | |
$ | 268,628 | | |
$ | 289,063 | | |
$ | 82,898 | | |
$ | 163,558 | | |
$ | — | | |
$ | 804,147 | |
| By-product credits | |
$ | (3,523 | ) | |
$ | (154 | ) | |
$ | (54 | ) | |
$ | (56,773 | ) | |
$ | — | | |
$ | (60,504 | ) |
| Treatment and refining charges | |
$ | — | | |
$ | 666 | | |
$ | 101 | | |
$ | 18,649 | | |
$ | — | | |
$ | 19,416 | |
| Cash costs (non-GAAP) | |
$ | 265,105 | | |
$ | 289,575 | | |
$ | 82,945 | | |
$ | 125,434 | | |
$ | — | | |
$ | 763,059 | |
| Sustaining capital expenditures | |
$ | 50,982 | | |
$ | 79,151 | | |
$ | 32,994 | | |
$ | 13,193 | | |
$ | — | | |
$ | 176,320 | |
| Sustaining exploration and evaluation expense | |
$ | — | | |
$ | 983 | | |
$ | — | | |
$ | — | | |
$ | — | | |
$ | 983 | |
| Reclamation cost accretion and amortization | |
$ | 1,709 | | |
$ | 2,628 | | |
$ | 3,347 | | |
$ | 13,598 | | |
$ | — | | |
$ | 21,282 | |
| General and administrative expense and stock-based compensation expense | |
$ | 5,479 | | |
$ | — | | |
$ | — | | |
$ | 246 | | |
$ | 61,721 | | |
$ | 67,446 | |
| Total AISC (non-GAAP) | |
$ | 323,275 | | |
$ | 372,337 | | |
$ | 119,286 | | |
$ | 152,471 | | |
$ | 61,721 | | |
$ | 1,029,090 | |
| | |
| | | |
| | | |
| | | |
| | | |
| | | |
| | |
| Gold sold (oz) | |
| 225,599 | | |
| 275,962 | | |
| 83,610 | | |
| — | | |
| — | | |
| 585,171 | |
| Silver sold (oz) | |
| — | | |
| — | | |
| — | | |
| 9,920,262 | | |
| — | | |
| 9,920,262 | |
| Gold equivalent sold (oz) (27, 28) | |
| 225,599 | | |
| 275,962 | | |
| 83,610 | | |
| 119,423 | | |
| — | | |
| 704,594 | |
| | |
| | | |
| | | |
| | | |
| | | |
| | | |
| | |
| Cost of sales per gold ounces sold | |
$ | 1,191 | | |
$ | 1,047 | | |
$ | 991 | | |
| N/A | | |
| N/A | | |
| N/A | |
| Cost of sales per silver ounces sold | |
| N/A | | |
| N/A | | |
| N/A | | |
$ | 16.49 | | |
| N/A | | |
| N/A | |
| Cost of sales per gold equivalent ounce sold | |
$ | 1,191 | | |
$ | 1,047 | | |
$ | 991 | | |
$ | 1,370 | | |
| N/A | | |
$ | 1,141 | |
| Cash cost per gold ounce sold | |
$ | 1,175 | | |
$ | 1,049 | | |
$ | 992 | | |
| N/A | | |
| N/A | | |
| N/A | |
| Cash cost per silver ounce sold | |
| N/A | | |
| N/A | | |
| N/A | | |
$ | 12.64 | | |
| N/A | | |
| N/A | |
| Cash cost per gold equivalent ounce sold | |
$ | 1,175 | | |
$ | 1,049 | | |
$ | 992 | | |
$ | 1,050 | | |
| N/A | | |
$ | 1,083 | |
| AISC per gold ounce sold | |
$ | 1,433 | | |
$ | 1,349 | | |
$ | 1,427 | | |
| N/A | | |
| N/A | | |
| N/A | |
| AISC per silver ounce sold | |
| N/A | | |
| N/A | | |
| N/A | | |
$ | 15.37 | | |
| N/A | | |
| N/A | |
| AISC per gold equivalent ounce sold | |
$ | 1,433 | | |
$ | 1,349 | | |
$ | 1,427 | | |
$ | 1,277 | | |
| N/A | | |
$ | 1,461 | |
| (25) | Excludes depreciation, depletion,
and amortization. |
| (26) | During the fourth quarter
of 2023, the Company identified an adjustment of $10.5 million related to 2023 asset retirement cost depreciation, which was erroneously
excluded from Puna's AISC calculation. The Company recognized the total adjustment in the fourth quarter of 2023 and the impact to prior
periods was not material. The adjustment only impacts the AISC calculation and does not impact Exploration, evaluation and reclamation
costs or Net income (loss) attributable to SSR Mining shareholders in the Company's Consolidated Statements of Operations. |
| (27) | Gold equivalent ounces are calculated using the silver
ounces produced or sold multiplied by the ratio of the silver price to the gold price, using the average LBMA prices for the period. The
Company does not include copper, lead, or zinc as they are considered by-products. |
| (28) | Gold equivalent ounces sold may not re-calculate based
on amounts presented in this table due to rounding |
The following tables provide a reconciliation of
cost of sales to cash costs and AISC used in the calculation of 2024 cost guidance:
| (operating guidance 100% basis) (29) | |
Çöpler (30) | |
Marigold | |
Seabee | |
Puna | |
Hod Maden(31) | |
Corporate | |
Total |
| Gold Production | |
koz | |
200 - 220 | |
155 - 175 | |
75 - 85 | |
— | |
— | |
— | |
430 - 480 |
| Silver Production | |
Moz | |
— | |
— | |
— | |
8.75 - 9.50 | |
— | |
— | |
8.75 - 9.50 |
| Gold Equivalent Production | |
koz | |
200 - 220 | |
155 - 175 | |
75 - 85 | |
110 - 120 | |
— | |
— | |
540 - 600 |
| Gold Sold | |
koz | |
200 - 220 | |
155 - 175 | |
75 - 85 | |
— | |
— | |
— | |
435 - 485 |
| Silver Sold | |
Moz | |
— | |
— | |
— | |
8.75 - 9.25 | |
— | |
— | |
8.75 - 9.5 |
| Gold Equivalent Sold | |
koz | |
200 - 220 | |
155 - 175 | |
75 - 85 | |
110 - 120 | |
— | |
— | |
540 - 600 |
| | |
| |
| |
| |
| |
| |
| |
| |
|
| Cost of Sales (GAAP) (32) | |
| $M | | |
284 - 321 | |
201 – 235 | |
| 75 - 85 | | |
140 – 162 | |
| — | | |
| — | | |
700 - 803 |
By-Product Credits + Treatment
& Refining Costs | |
| $M | | |
| (2 | ) | |
| — | | |
| — | | |
| (45 | ) | |
| — | | |
| — | | |
| (46 | ) |
| Cash Cost (non-GAAP) | |
| $M | | |
282 – 319 | |
| 202 – 235 | | |
| 75 – 85 | | |
| 96 – 117 | | |
| — | | |
| — | | |
654 - 756 |
| Sustaining Capital Expenditures (33) | |
| $M | | |
| 29 | | |
| 37 | | |
| 40 | | |
| 17 | | |
| — | | |
| — | | |
| 123 | |
| Reclamation Cost Accretion & Amortization | |
| $M | | |
| 2 | | |
| 3 | | |
| 3 | | |
| 13 | | |
| — | | |
| — | | |
| 21 | |
| General & Administrative | |
| $M | | |
| — | | |
| — | | |
| — | | |
| — | | |
| — | | |
| 60 - 65 | | |
60 - 65 |
| All-In Sustaining Cost (non-GAAP) | |
| $M | | |
313 - 350 | | |
| 241 – 274 | | |
| 118 – 128 | | |
| 125 – 147 | | |
| — | | |
| 60 – 65 | | |
857 - 965 |
| | |
| | | |
| | | |
| | | |
| | | |
| | | |
| | | |
| | | |
| | |
| Cost of Sales per Ounce (GAAP) (32) | |
| $/oz | | |
1,420 - 1,460 | |
1,300 - 1,340 | |
990 - 1,030 | |
16.50 - 18.00 | |
| — | | |
| — | | |
1,300 - 1,350 |
| Cash Cost per Ounce (non-GAAP) (34) | |
| $/oz | | |
1,410 - 1,450 | |
1,300 - 1,340 | |
990 - 1,030 | |
11.50 - 13.00 | |
| — | | |
| — | | |
1,220 - 1,270 |
| All-In Sustaining Cost per Ounce (non-GAAP) (34) | |
| $/oz | | |
1,550 - 1,590 | |
1,535 - 1,575 | |
1,495 - 1,535 | |
14.75 - 16.25 | |
| — | | |
| — | | |
1,575 - 1,625 |
| | |
| | | |
| | | |
| | | |
| | | |
| | | |
| | | |
| | | |
| | |
| Growth Capital Expenditures | |
| $M | | |
| 77 | | |
| 1 | | |
| 2 | | |
| — | | |
| 37 | | |
| — | | |
117 |
Growth Exploration and Resource Development Expenditures (35) | |
| $M | | |
| 12 | | |
| 9 | | |
| 15 | | |
| 10 | | |
| — | | |
| 4 | | |
| 50 | |
| Total Growth Capital | |
| $M | | |
| 89 | | |
| 10 | | |
| 17 | | |
| 10 | | |
| 37 | | |
| 4 | | |
| 167 | |
| (29) | Figures may not add due to rounding. Figures are reported on a 100% basis. |
| (30) | Cöpleris 80% owned by SSR Mining. |
| (31) | Hod Maden figures presented as 40% attributable. Hod Maden is currently 10% owned by SSR Mining.
SSR Mining has the option to increase its ownership to 40% through funding of 40% of the pre-production capital commitments and up
to $150 million in contingent payments. |
| (32) | Excludes depreciation, depletion, and amortization. |
| (33) | Includes sustaining exploration and evaluation expenditures. Includes approximately $9 million in
lease payments at Çöpler, $1 million in expensed sustaining exploration at Marigold and $24 million in underground mine
development at Seabee. |
| (34) | SSR Mining reports the non-GAAP financial measures of cash costs and AISC per payable ounce of
gold and silver sold to manage and evaluate operating performance at Çöpler, Marigold, Seabee and Puna.
AISC includes reclamation cost accretion and amortization and certain lease payments. |
| (35) | Growth exploration and resource development expenditures are shown on a 100% basis, of which SSR
Mining attributable amount totals $48 million. All growth exploration and resource development spend is expensed. Growth exploration
includes project studies and evaluation. |