EXHIBIT 99.1

Shutterstock Reports Fourth Quarter and Full Year 2019 Financial Results
Announces Quarterly Dividend of $0.17 per share
New York, NY - February 13, 2020 - Shutterstock, Inc. (NYSE: SSTK) (the “Company”), a leading global technology company offering a creative platform for high-quality content, tools and services, today announced financial results for the fourth quarter and full year ended December 31, 2019.
Commenting on the Company’s performance, founder and CEO Jon Oringer said, “We ended 2019 with solid performance, achieving profitable revenue growth, generating significant cash flow and filling some key leadership roles. We also demonstrated the strong network effect of our platform, with our contributor base reaching a milestone of over $1 billion in earnings paid.
“We have a consistent and unique track record of profitable growth and robust cash flow generation. With our strong balance sheet and desire to return value to our shareholders, we are very pleased to announce that for the first time in our history as a public company, our board has authorized a quarterly cash dividend of $0.17 per share, effective beginning this quarter. Historically, we have maintained a significant cash balance for investment in our business and strategic opportunities and intend to continue to do so in the future, while delivering long-term value to our shareholders.”
Fourth Quarter 2019 highlights as compared to Fourth Quarter 2018:
Key Operating Metrics
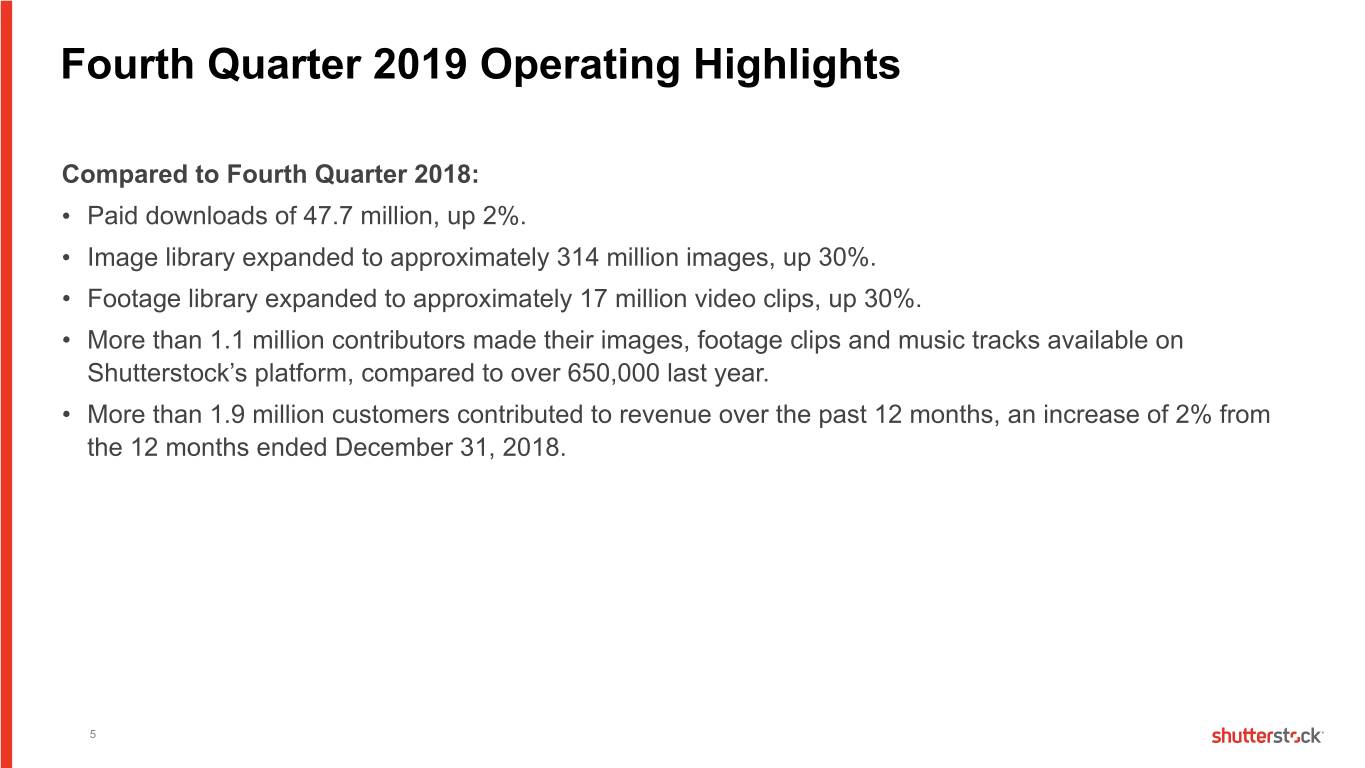
• | Paid downloads increased 2% to 47.7 million. |
• | Revenue per download increased 1% to $3.44. |
• | Image collection expanded 30% to 314 million images. |
• | Footage collection expanded 30% to 17 million footage clips. |
Financial Highlights
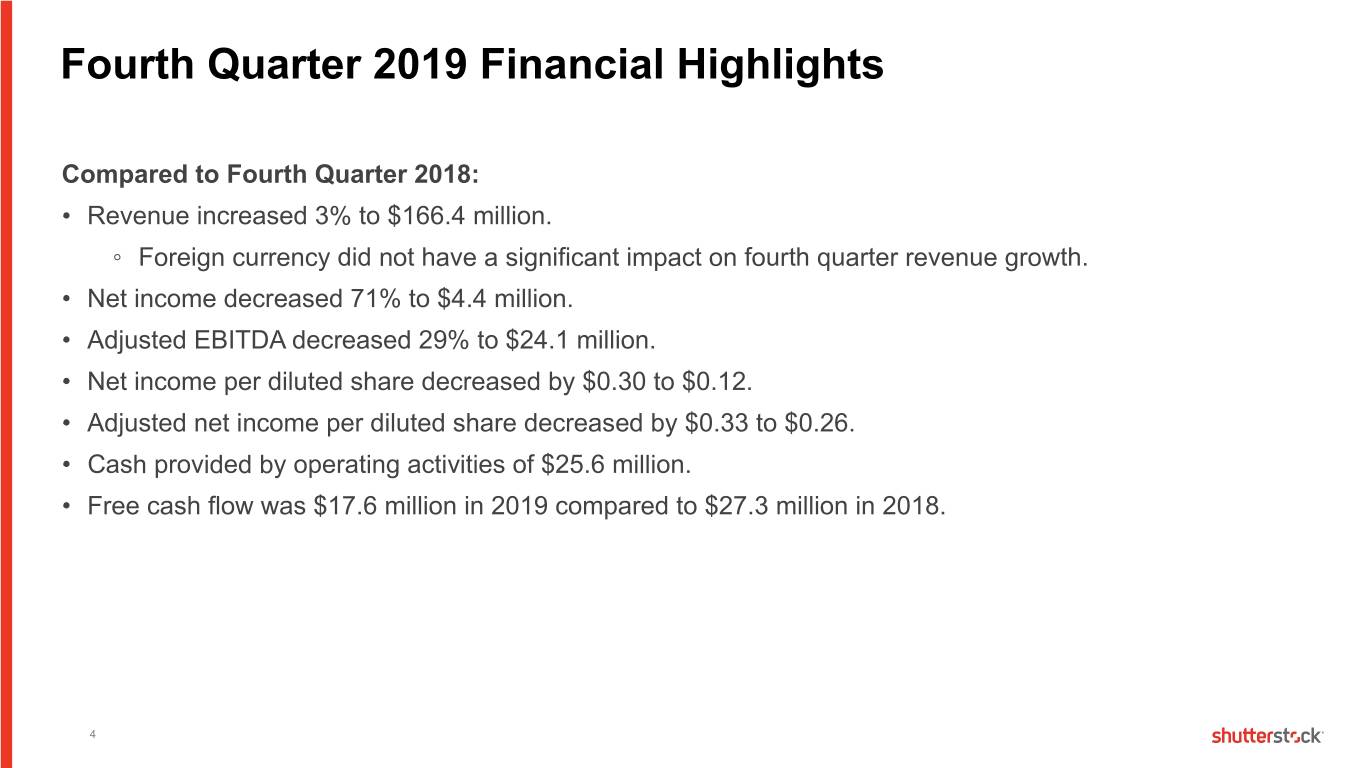
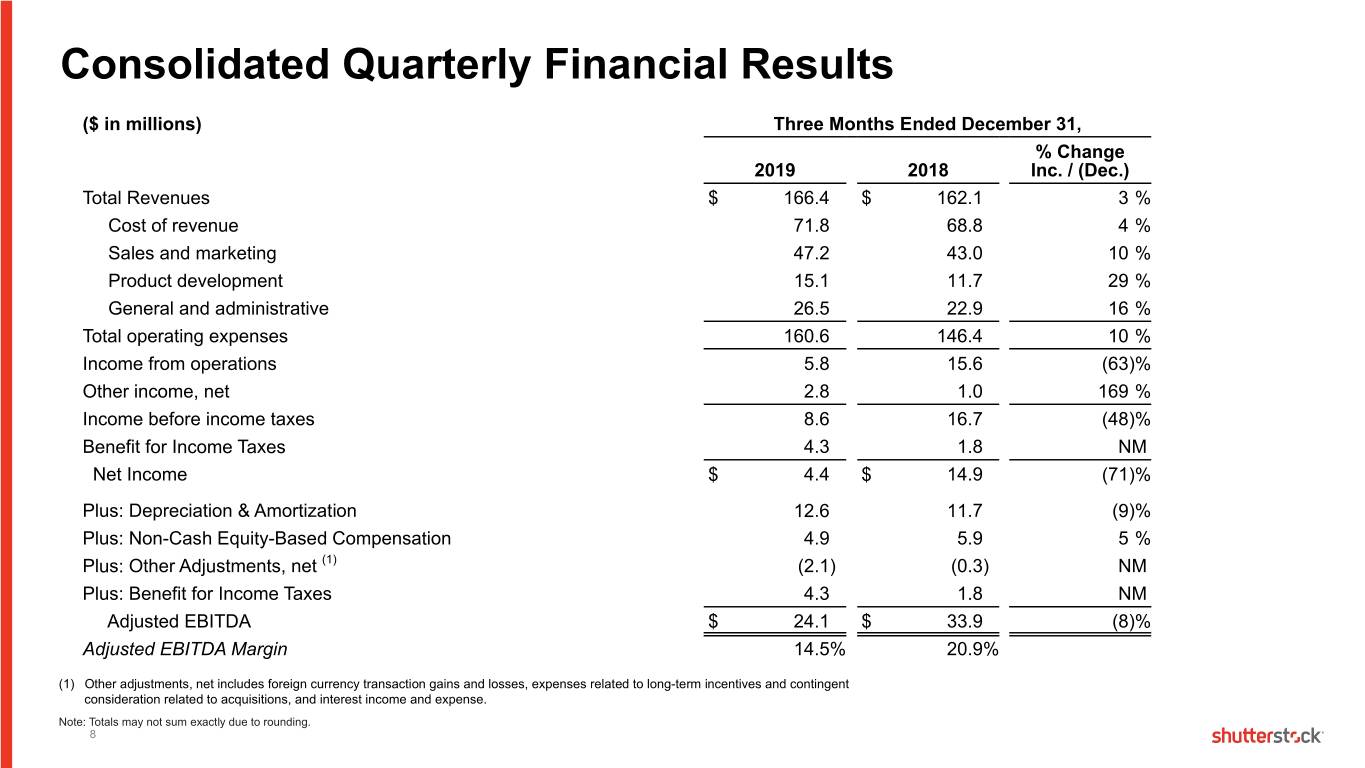
• | Revenue increased 3% to $166.4 million. On a constant currency basis, revenue increased 3%. |
• | Net income decreased 71% to $4.4 million. |
• | Adjusted EBITDA decreased 29% to $24.1 million. |
• | Net income per diluted share decreased by $0.30 to $0.12. |
• | Adjusted net income per diluted share decreased by $0.33 to $0.26. |
Full Year 2019 highlights as compared to Full Year 2018:
Key Operating Metrics
• | Paid downloads increased 5% to 187.8 million. |
• | Revenue per download increased 1% to $3.43. |
Financial Highlights
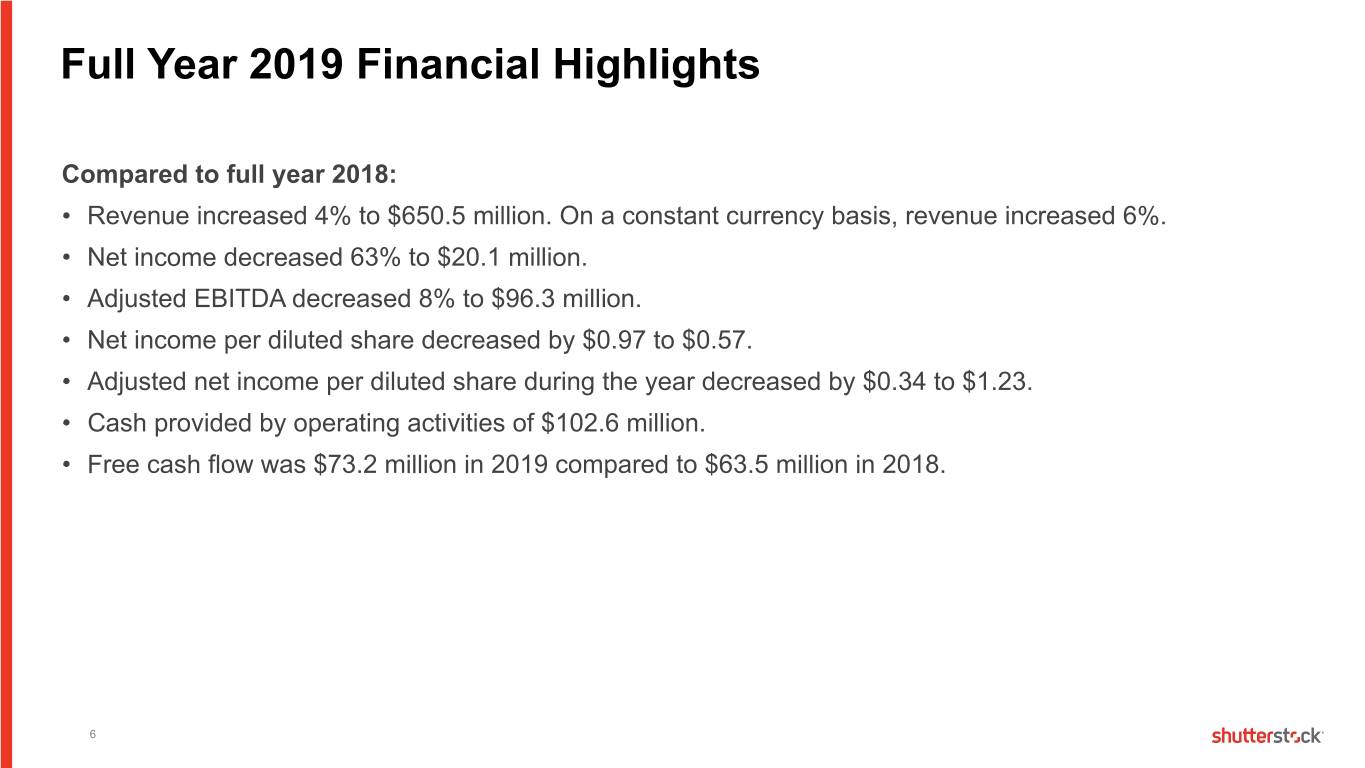
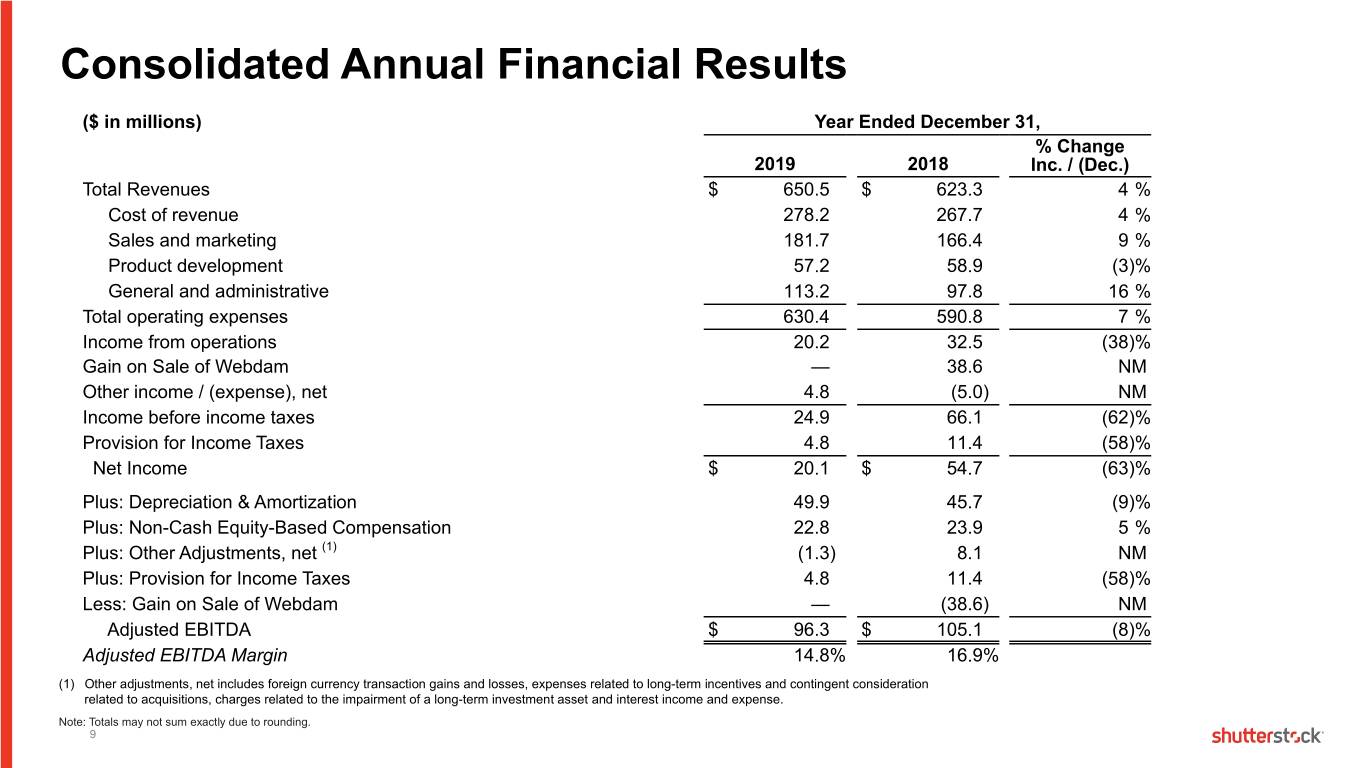
• | Revenue increased 4% to $650.5 million. On a constant currency basis, revenue increased 6%. |
• | Net income decreased 63% to $20.1 million. |
• | Adjusted EBITDA decreased 8% to $96.3 million. |
• | Net income per diluted share decreased by $0.97 to $0.57. |
• | Adjusted net income per diluted share decreased by $0.34 to $1.23. |
1
FOURTH QUARTER RESULTS
Revenue
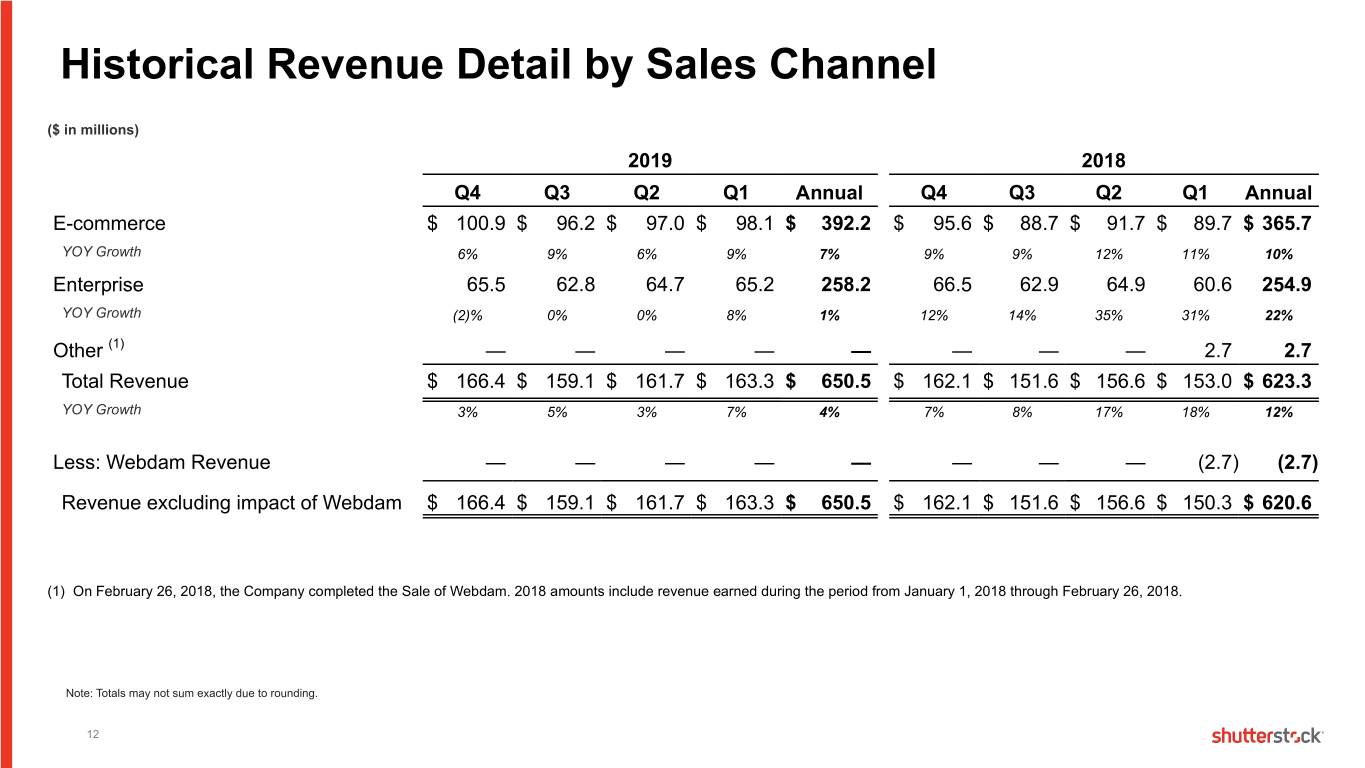
Fourth quarter revenue of $166.4 million increased $4.3 million or 3% as compared to 2018. Revenue generated through our E-commerce sales channel increased 6% as compared to the fourth quarter of 2018, to $100.9 million, and represented 61% of total revenue in the fourth quarter of 2019. Revenue from our Enterprise sales channel decreased 2% as compared to the fourth quarter of 2018, to $65.5 million, and represented 39% of fourth quarter revenue in 2019. Foreign currency fluctuations did not have a significant impact on fourth quarter revenue.
Net income and Income per diluted share
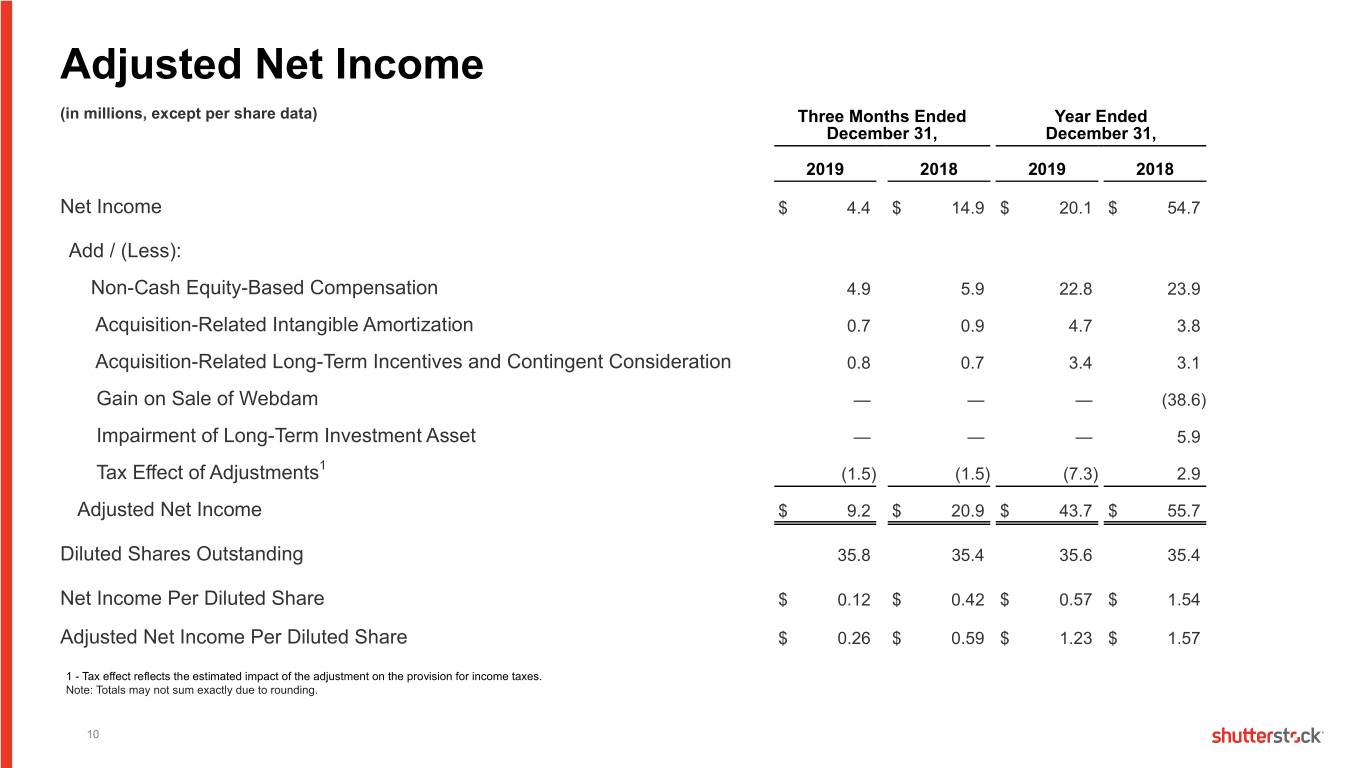
Net income of $4.4 million, decreased $10.6 million as compared to $14.9 million for the fourth quarter in 2018. Net income per diluted share was $0.12, as compared to $0.42 for the same period in 2018. This decrease is primarily due to a reduction in income from operations in the fourth quarter of 2019 caused by higher spending in performance marketing initiatives and higher general and administrative expenses, largely attributable to investments made across cyber security, data science and analytics, and technology spend.
Adjusted net income per diluted share was $0.26 as compared to $0.59 for the fourth quarter of 2018, a decrease of 56%.
Adjusted EBITDA
Adjusted EBITDA of $24.1 million for the fourth quarter of 2019 decreased $9.8 million, or 29%, as compared to the fourth quarter of 2018, driven primarily by sales and marketing expenses which increased due to higher spending in performance marketing initiatives and higher general and administrative expenses, largely attributable to investments made across cyber security, data science and analytics, and technology spend.
FULL YEAR RESULTS
Revenue
Full year revenue of $650.5 million increased $27.3 million or 4% as compared to 2018, or 6% on a constant currency basis. Revenue generated through our E-commerce sales channel increased 7% as compared to the full year 2018, to $392.2 million, or 9% on a constant currency basis, and represented 60% of total revenue in 2019. Revenue from our Enterprise sales channel increased 1% as compared to 2018, to $258.3 million, or 3% on a constant currency basis, and represented 40% of total revenue in 2019.
Net income and Income per diluted share
Net income of $20.1 million decreased $34.6 million as compared to $54.7 million for the full year 2018. Net income per diluted share was $0.57 as compared to $1.54 for the full year 2018. This decrease is primarily due to a reduction in income from operations during 2019 caused by higher spending in performance marketing initiatives and higher general and administrative expenses, largely attributable to investments made across cyber security, data science and analytics, and technology spend and a gain recognized in 2018 on the sale of Webdam of $27.6 million, or $0.78 per diluted share, net of tax, partially offset by a 2018 impairment charge of $4.9 million, or $0.14 per diluted share, net of tax, related to our long-term investment in SilverHub Media Limited.
Adjusted net income per diluted share of $1.23 decreased by $0.34, as compared to $1.57 for the full year 2018.
2
Adjusted EBITDA
Adjusted EBITDA of $96.3 million for 2019 decreased $8.8 million or 8% as compared to the full year 2018, driven primarily by sales and marketing expenses which increased due to higher spending in performance marketing initiatives and higher general and administrative expenses, largely attributable to investments made across cyber security, data science and analytics, and technology spend.
LIQUIDITY
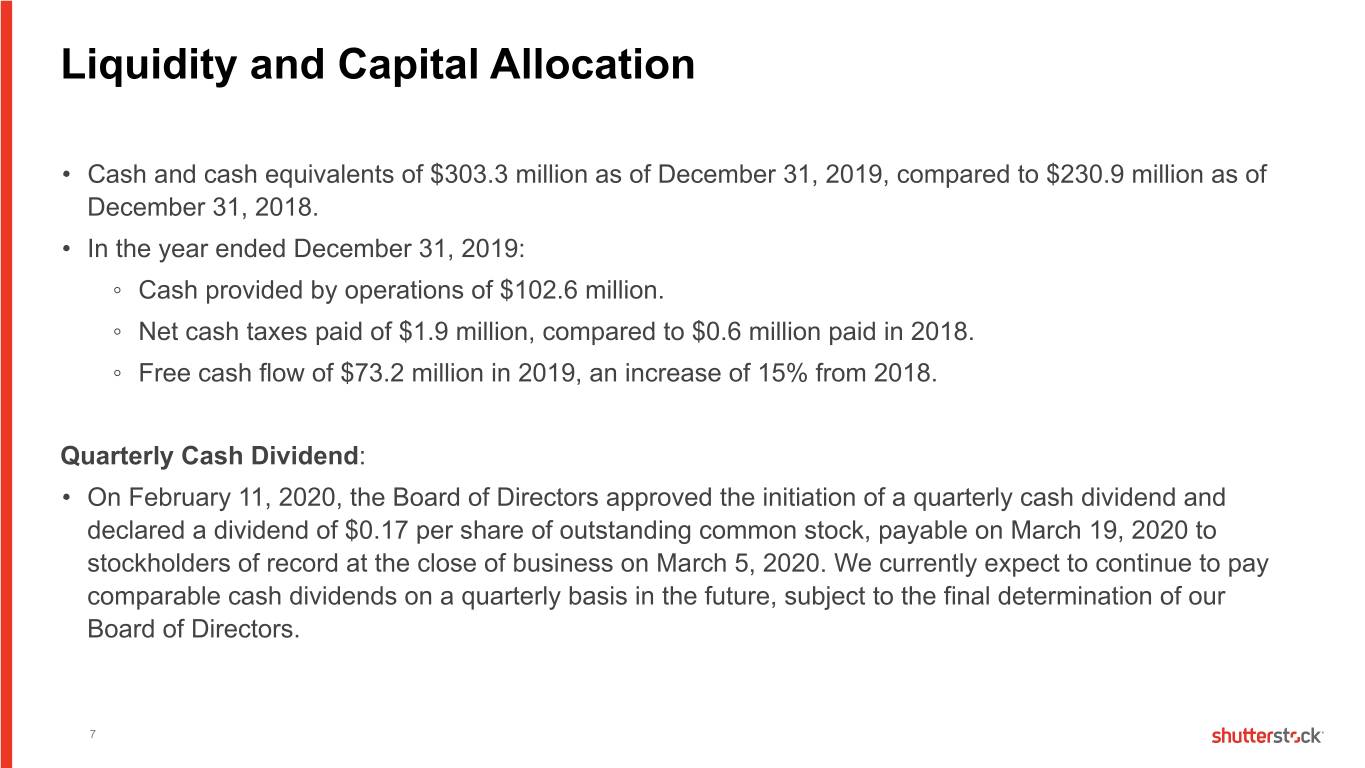
Our cash and cash equivalents increased by $72.4 million to $303.3 million at December 31, 2019, as compared with $230.9 million at December 31, 2018. This increase was driven by $102.6 million of net cash provided by our operating activities, partially offset by $27.2 million used in investing activities and $1.7 million used in financing activities.
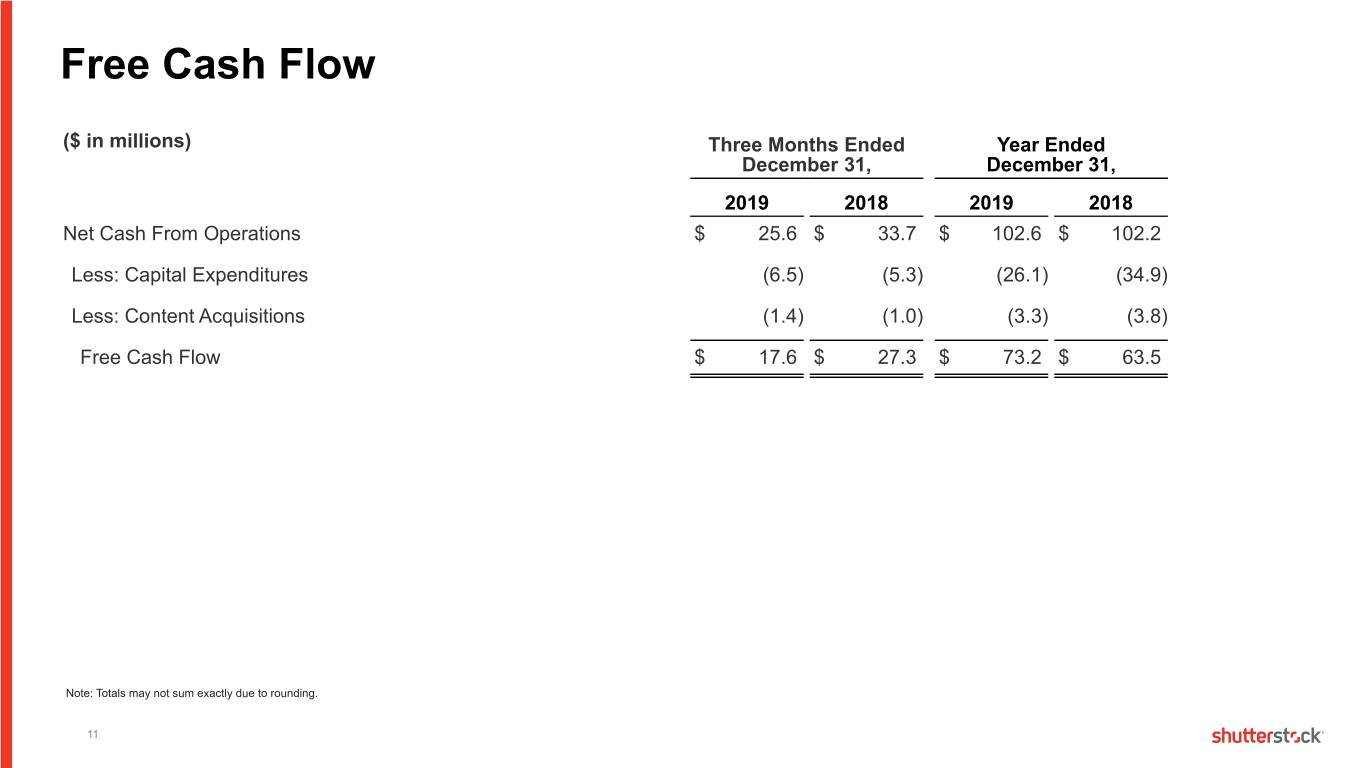
Free cash flow was $73.2 million for 2019, an increase of $9.7 million from 2018. This change was primarily driven by lower capital expenditures.
QUARTERLY CASH DIVIDEND
On February 11, 2020, the Board of Directors approved the initiation of a quarterly cash dividend and declared a dividend of $0.17 per share of outstanding common stock, payable on March 19, 2020 to stockholders of record at the close of business on March 5, 2020. We currently expect to continue to pay comparable cash dividends on a quarterly basis in the future, subject to the final determination of our Board of Directors.
OPERATING METRICS
Three Months Ended December 31, | Year Ended December 31, | |||||||||||
2019 | 2018 | 2019 | 2018 | |||||||||
(in millions, except revenue per download) | ||||||||||||
Paid downloads (during the period)(1) | 47.7 | 46.8 | 187.8 | 179.6 | ||||||||
Revenue per download (during the period) (2) | $3.44 | $3.40 | $3.43 | $3.40 | ||||||||
Content in our collection (end of period)(3): | ||||||||||||
Images | 314 | 242 | 314 | 242 | ||||||||
Footage clips | 17 | 13 | 17 | 13 | ||||||||
(1) Paid downloads is the number of downloads that our customers make in a given period of our photographs, vectors, illustrations, footage or music tracks. Paid downloads exclude custom content, re-downloads of content that a customer has downloaded in the past (which do not generate incremental revenue or contributor royalty expense) and downloads of content that are offered to customers for no charge, including our free image of the week.
(2) Revenue per download is the amount of content-related revenue recognized in a given period divided by the number of paid downloads in that period excluding revenue from custom content and the impact of revenue that is not derived from or associated with content licenses.
(3) Represents images (photographs, vectors and illustrations) and footage (in number of clips) available to customers for commercial license on shutterstock.com at the end of the period. We exclude content from this collection metric that is not uploaded directly to our site but is available for license by our customers through an application program interface, custom content and certain content that may be licensed for editorial use only.
FINANCIAL OUTLOOK
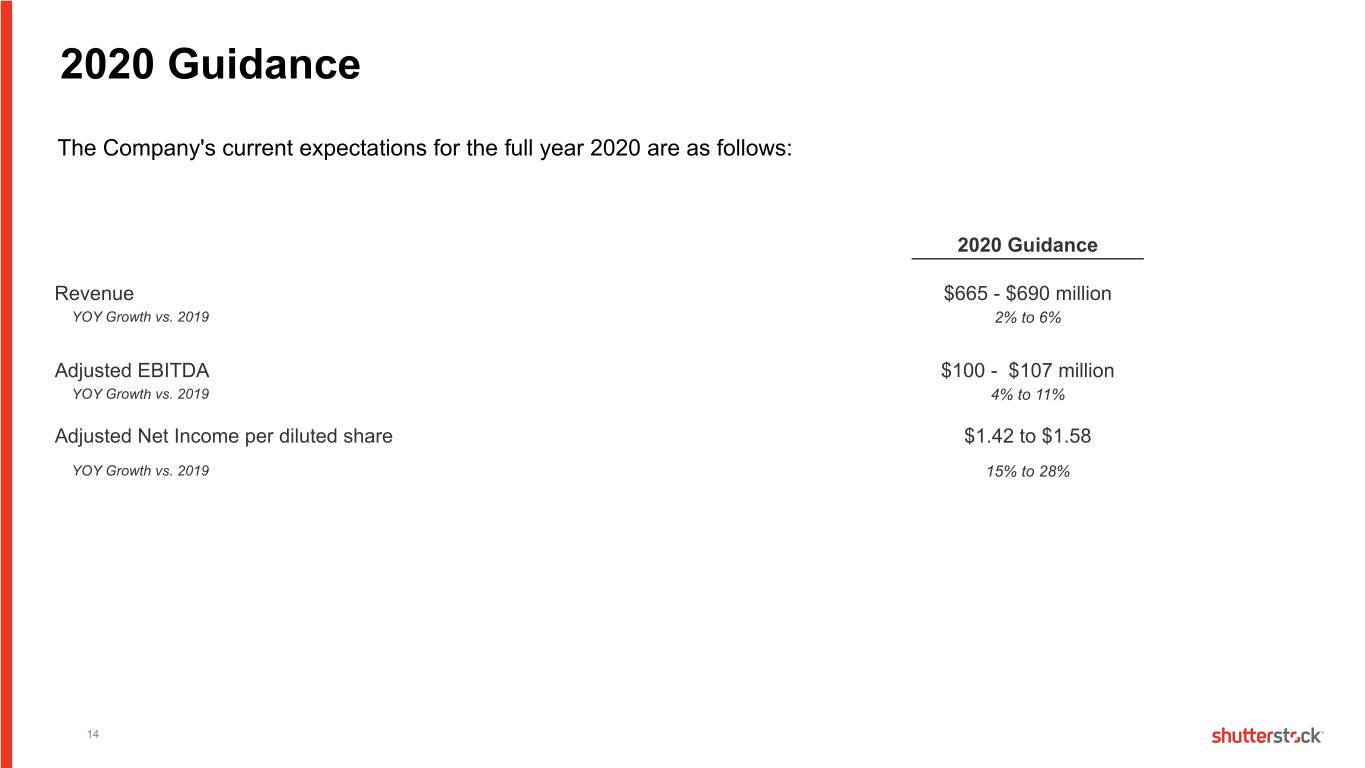
The Company's current expectations for full year 2020, are as follows:
• | Revenue of $665 million to $690 million, representing growth of 2% to 6%. |
• | Adjusted EBITDA of between $100 million to $107 million, representing growth of 4% to 11%. |
• | Adjusted net income per diluted share of between $1.42 and $1.58, representing growth of 15% to 28%. |
3
NON-GAAP FINANCIAL MEASURES
In addition to reporting results in accordance with United States generally accepted accounting principles (GAAP), Shutterstock also refers to adjusted EBITDA, adjusted net income, revenue growth (including by distribution channel) on a constant currency basis, revenue excluding the impact of Webdam (including on a constant currency basis), adjusted EBITDA margin and free cash flow.
Shutterstock defines adjusted EBITDA as net income adjusted for depreciation and amortization, non-cash equity-based compensation, foreign currency transaction gains and losses, charges related to the impairment of a long-term investment asset, expenses related to long-term incentives and contingent consideration related to acquisitions, interest income and expense, income taxes and the gain on sale of Webdam; adjusted net income as net income adjusted for the impact of non-cash equity-based compensation, the amortization of acquisition-related intangible assets, expenses related to long-term incentives and contingent consideration related to acquisitions, the gain on sale of Webdam, charges related to the impairment of a long-term investment asset and the estimated tax impact of such adjustments; revenue growth (including by distribution channel) on a constant currency basis as the increase in current period revenues over prior period revenues, utilizing fixed exchange rates for translating foreign currency revenues for all periods in the comparison; revenue excluding the impact of Webdam as total Company revenue for each period presented less the amount of revenue generated by the Webdam business during that period; revenue growth excluding the impact of Webdam on a constant currency basis as total Company revenue for each period presented, less the amount of revenue generated by the Webdam business during that period utilizing fixed exchange rates for translating foreign currency revenues for both periods; adjusted EBITDA margin as the ratio of adjusted EBITDA to revenue; and free cash flow as cash provided by operating activities, adjusted for capital expenditures and content acquisition. These figures have not been calculated in accordance with GAAP and should be considered in addition to results prepared in accordance with GAAP and should not be considered as a substitute for, or superior to, GAAP results. Shutterstock cautions investors that non-GAAP financial measures are not based on any standardized methodology prescribed by GAAP and are not necessarily comparable to similarly-titled measures presented by other companies.
Shutterstock’s management believes that adjusted EBITDA, adjusted net income, revenue growth (including by distribution channel) on a constant currency basis, revenue excluding the impact of Webdam (including on a constant currency basis), adjusted EBITDA margin and free cash flow are useful to investors to provide them with disclosures of Shutterstock’s operating results on the same basis as that used by management. Additionally, management believes that adjusted EBITDA, adjusted EBITDA margin and adjusted net income provide useful information to investors about the performance of the Company’s overall business because such measures eliminate the effects of unusual or other infrequent charges that are not directly attributable to Shutterstock’s underlying operating performance; revenue growth (including by distribution channel) on a constant currency basis provides useful information to investors by eliminating the effect of foreign currency fluctuations that are not directly attributable to Shutterstock’s operating performance; and revenue excluding the impact of Webdam (including on a constant currency basis, expressed as a percentage) provide useful information to investors by eliminating the impact of a historical revenue source that is not part of the Company’s current business and, as applicable, also provides useful information to investors by eliminating the effect of foreign currency fluctuations that are not directly attributable to Shutterstock’s ongoing business. Additionally, management believes that providing these non-GAAP financial measures enhances the comparability for investors in assessing Shutterstock’s financial reporting. Management believes that free cash flow is useful for investors because it provides them with an important perspective on the cash available for strategic measures, after making necessary capital investments in property and equipment to support the Company’s ongoing business operations and provides them with the same measures that management uses as the basis for making resource allocation decisions.
Shutterstock’s management also uses the non-GAAP financial measures adjusted EBITDA, adjusted net income, revenue growth (including by distribution channel) on a constant currency basis, revenue excluding the impact of Webdam (including on a constant currency basis), adjusted EBITDA margin and free cash flow, in conjunction with GAAP financial measures, as an integral part of managing the business and to: (i) monitor and evaluate the performance of Shutterstock’s business operations, financial performance and overall liquidity; (ii) facilitate management’s internal comparisons of the historical operating performance of its business operations; (iii) facilitate management’s external comparisons of the results of its overall business to the historical operating performance of other companies that may have different capital structures and debt levels; (iv) review and assess the operating performance of Shutterstock’s management team and, together with other operational objectives, as a measure in evaluating employee compensation and bonuses; (v) analyze and evaluate financial and strategic planning decisions regarding future operating investments; and (vi) plan for and prepare future annual operating budgets and determine appropriate levels of operating investments.
A reconciliation of the differences between adjusted EBITDA, adjusted net income, revenue excluding the impact of Webdam and free cash flow, and the most comparable financial measures calculated and presented in accordance with GAAP, is presented under the heading “Reconciliation of Non-GAAP Financial Information to GAAP” immediately following the Consolidated Balance Sheets. We do not provide a reconciliation of adjusted EBITDA guidance to net income guidance or a reconciliation of adjusted net income per diluted share guidance to net income per diluted share guidance, because we are unable to calculate with reasonable certainty the impact of potential future transactions, including, but not limited to, capital structure transactions, restructuring, acquisitions, divestitures or other events and asset impairments, without unreasonable effort. These amounts depend on various factors and could have a material impact on net
4
income and net income per diluted share, but may be excluded from adjusted EBITDA and adjusted net income per diluted share. In addition, we believe such reconciliations would imply a degree of precision that would be confusing or misleading to investors.
EARNINGS TELECONFERENCE INFORMATION
The Company will discuss its fourth quarter and full year financial results during a teleconference today, February 13, 2020, at 8:30 AM ET. The conference call can be accessed in the U.S. at (844) 634-1442 or outside the U.S. at (615) 247-0239 with the conference ID# 8793299. A live audio webcast of the call will also be available simultaneously at http://investor.shutterstock.com.
Following completion of the call, a recorded replay of the webcast will be available in the investor relations section of Shutterstock’s website. A telephone replay of the call will also be available until February 20, 2020 in the U.S. at (855) 859-2056 or outside the U.S. at (404) 537-3406 with the conference ID# 8793299.
Additional investor information can be accessed at http://investor.shutterstock.com.
ABOUT SHUTTERSTOCK
Shutterstock, Inc. (NYSE: SSTK), directly and through its group subsidiaries, is a leading global provider of high-quality licensed photographs, vectors, illustrations, videos and music to businesses, marketing agencies and media organizations around the world. Working with its growing community of over 1 million contributors, Shutterstock adds hundreds of thousands of images each week, and currently has more than 310 million images and more than 17 million video clips available.
Headquartered in New York City, Shutterstock has offices around the world and customers in more than 150 countries. The company also owns Bigstock, a value-oriented stock media offering; Shutterstock Custom, a custom content creation platform; Offset, a high-end image collection; PremiumBeat, a curated royalty-free music library; and Shutterstock Editorial, a premier source of editorial images for the world’s media.
For more information, please visit www.shutterstock.com and follow Shutterstock on Twitter and on Facebook.
5
FORWARD-LOOKING STATEMENTS
This press release contains forward-looking statements within the meaning of the Private Securities Litigation Reform Act of 1995. Examples of forward-looking statements include, but are not limited to, statements regarding management’s future business, future results of operations or financial condition, future dividends, new or planned features, products or services, management strategies and Shutterstock’s expectations regarding financial outlook, future growth and profitability. You can identify forward-looking statements by words such as “may,” “will,” “would,” “should,” “could,” “expect,” “anticipate,” “believe,” “estimate,” “intend,” “plan” and other similar expressions. However, not all forward-looking statements contain these words. Such forward-looking statements are subject to known and unknown risks, uncertainties and other factors including risks related to any changes to or the effects on liabilities, financial condition, future capital expenditures, revenue, expenses, net income or loss, synergies and future prospects; our inability to continue to attract and retain customers and contributors to our online marketplace for creative content; competitive factors; our inability to innovate technologically or develop, market and offer new products and services; costs related to litigation or infringement claims, indemnification claims and the inability to prevent misuse of our digital content; our inability to increase market awareness of Shutterstock and our products and services; our inability to effectively manage our growth; our inability to grow at historic growth rates or at all; technological interruptions that impair access to our websites; assertions by third parties of infringement of intellectual property rights by Shutterstock, our inability to effectively manage risks associated with operating internationally; our exposure to foreign exchange rate risk; our inability to address risks associated with sales to large corporate customers; government regulation of the internet; increasing regulation related to the handling of personal data; actions by governments to restrict access to our products and services; our inability to effectively expand our operations into new products, services and technologies; our inability to protect the confidential information of customers; increased tax liabilities associated with our worldwide operations, including our exposure to withholding, sales and transaction tax liabilities; the effect of the Tax Cuts and Jobs Act of 2017; general economic and political conditions worldwide; our inability to successfully integrate acquisitions and the associated technology and achieve operational efficiencies; and other factors and risks discussed under the caption “Risk Factors” in our most recent Annual Report on Form 10-K, as well as in other documents that we may file from time to time with the Securities and Exchange Commission. As a result of such risks, uncertainties and factors, Shutterstock’s actual results may differ materially from any future results, performance or achievements discussed in or implied by the forward-looking statements contained herein. The forward-looking statements contained in this press release are made only as of this date and Shutterstock assumes no obligation to update the information included in this press release or revise any forward-looking statements, whether as a result of new information, future developments or otherwise, except as required by law.
Media Contact: | Investor Contact: |
Niamh Hughes | Jarrod Yahes |
917-563-4991 | 646-713-2748 |
6
Shutterstock, Inc.
Consolidated Statements of Operations
(In thousands, except for per share data)
(unaudited)
Three Months Ended December 31, | Year Ended December 31, | |||||||||||||||
2019 | 2018 | 2019 | 2018 | |||||||||||||
Revenue | $ | 166,371 | $ | 162,072 | $ | 650,523 | $ | 623,250 | ||||||||
Operating expenses: | ||||||||||||||||
Cost of revenue | 71,797 | 68,829 | 278,176 | 267,671 | ||||||||||||
Sales and marketing | 47,182 | 43,034 | 181,730 | 166,448 | ||||||||||||
Product development | 15,103 | 11,689 | 57,216 | 58,897 | ||||||||||||
General and administrative | 26,486 | 22,881 | 113,246 | 97,782 | ||||||||||||
Total operating expenses | 160,568 | 146,433 | 630,368 | 590,798 | ||||||||||||
Income from operations | 5,803 | 15,639 | 20,155 | 32,452 | ||||||||||||
Gain on Sale of Webdam | — | — | — | 38,613 | ||||||||||||
Other income / (expense), net | 2,816 | 1,048 | 4,761 | (4,952 | ) | |||||||||||
Income before income taxes | 8,619 | 16,687 | 24,916 | 66,113 | ||||||||||||
Provision for income taxes | 4,266 | 1,774 | 4,808 | 11,426 | ||||||||||||
Net income | $ | 4,353 | $ | 14,913 | $ | 20,108 | $ | 54,687 | ||||||||
Earnings per share | ||||||||||||||||
Basic | $ | 0.12 | $ | 0.43 | $ | 0.57 | $ | 1.57 | ||||||||
Diluted | $ | 0.12 | $ | 0.42 | $ | 0.57 | $ | 1.54 | ||||||||
Weighted average common shares outstanding: | ||||||||||||||||
Basic | 35,478 | 35,047 | 35,285 | 34,935 | ||||||||||||
Diluted | 35,786 | 35,421 | 35,581 | 35,420 | ||||||||||||
7
Shutterstock, Inc.
Consolidated Balance Sheets
(In thousands, except par value amount)
(unaudited)
December 31, 2019 | December 31, 2018 | |||||||
ASSETS | ||||||||
Current assets: | ||||||||
Cash and cash equivalents | $ | 303,261 | $ | 230,852 | ||||
Accounts receivable, net | 47,016 | 41,028 | ||||||
Prepaid expenses and other current assets | 26,703 | 34,841 | ||||||
Total current assets | 376,980 | 306,721 | ||||||
Property and equipment, net | 58,834 | 76,188 | ||||||
Right-of-use assets | 45,453 | — | ||||||
Intangibles assets, net | 26,669 | 29,540 | ||||||
Goodwill | 88,974 | 88,576 | ||||||
Deferred tax assets, net | 14,387 | 12,375 | ||||||
Other assets | 19,215 | 18,088 | ||||||
Total assets | $ | 630,512 | $ | 531,488 | ||||
LIABILITIES AND STOCKHOLDERS’ EQUITY | ||||||||
Current liabilities: | ||||||||
Accounts payable | $ | 6,104 | $ | 7,212 | ||||
Accrued expenses | 53,864 | 51,385 | ||||||
Contributor royalties payable | 25,193 | 22,971 | ||||||
Deferred revenue | 141,922 | 139,604 | ||||||
Other liabilities | 18,811 | 2,131 | ||||||
Total current liabilities | 245,894 | 223,303 | ||||||
Lease liabilities | 47,313 | — | ||||||
Other non-current liabilities | 9,160 | 21,518 | ||||||
Total liabilities | 302,367 | 244,821 | ||||||
Commitment and contingencies | ||||||||
Stockholders’ equity: | ||||||||
Common stock, $0.01 par value; 200,000 shares authorized; 38,055 and 37,618 shares issued and 35,497 and 35,060 shares outstanding as of December 31, 2019 and December 31, 2018, respectively | 381 | 376 | ||||||
Treasury stock, at cost; 2,558 shares as of December 31, 2019 and December 31, 2018 | (100,027 | ) | (100,027 | ) | ||||
Additional paid-in capital | 312,824 | 291,710 | ||||||
Accumulated other comprehensive loss | (6,220 | ) | (6,471 | ) | ||||
Retained earnings | 121,187 | 101,079 | ||||||
Total stockholders’ equity | 328,145 | 286,667 | ||||||
Total liabilities and stockholders’ equity | $ | 630,512 | $ | 531,488 | ||||
8
Shutterstock, Inc.
Reconciliation of Non-GAAP Financial Information to GAAP
(In thousands, except per share information)
(unaudited)
Adjusted EBITDA, adjusted net income, revenue growth (including by distribution channel) on a constant currency basis, revenue excluding the impact of Webdam (including on a constant currency basis) and free cash flow are not financial measures prepared in accordance with United States generally accepted accounting principles (GAAP). Such non-GAAP financial measures should not be construed as alternatives to any other measures of performance determined in accordance with GAAP. We caution investors that non-GAAP financial measures are not based on any standardized methodology prescribed by GAAP and are not necessarily comparable to similarly-titled measures presented by other companies.
Three Months Ended December 31, | Year Ended December 31, | |||||||||||||||
2019 | 2018 | 2019 | 2018 | |||||||||||||
Net income | $ | 4,353 | $ | 14,913 | $ | 20,108 | $ | 54,687 | ||||||||
Add / (less) Non-GAAP adjustments: | ||||||||||||||||
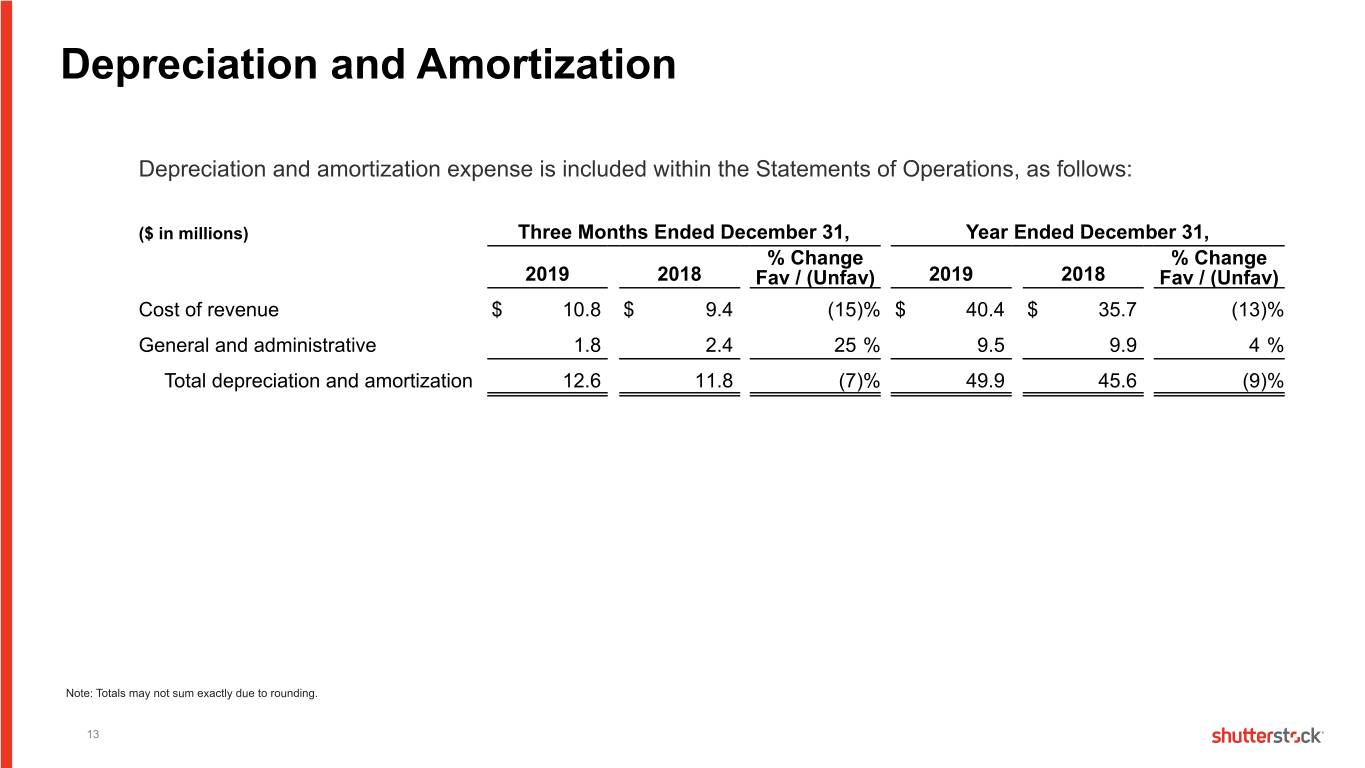
Depreciation and amortization | 12,604 | 11,718 | 49,915 | 45,652 | ||||||||||||
Non-cash equity-based compensation | 4,931 | 5,875 | 22,815 | 23,869 | ||||||||||||
Other adjustments, net (1) | (2,054 | ) | (346 | ) | (1,332 | ) | 8,093 | |||||||||
Provision for income taxes | 4,266 | 1,774 | 4,808 | 11,426 | ||||||||||||
Gain on Sale of Webdam | — | — | — | (38,613 | ) | |||||||||||
Adjusted EBITDA | $ | 24,100 | $ | 33,934 | $ | 96,314 | $ | 105,114 | ||||||||
Adjusted EBITDA margin | 14.5 | % | 20.9 | % | 14.8 | % | 16.9 | % | ||||||||
Three Months Ended December 31, | Year Ended December 31, | |||||||||||||||
2019 | 2018 | 2019 | 2018 | |||||||||||||
Net income | $ | 4,353 | $ | 14,913 | $ | 20,108 | $ | 54,687 | ||||||||
Add / (less) Non-GAAP adjustments: | ||||||||||||||||
Non-cash equity-based compensation | 4,931 | 5,875 | 22,815 | 23,869 | ||||||||||||
Tax effect of non-cash equity-based compensation (2) | (1,159 | ) | (1,337 | ) | (5,363 | ) | (5,434 | ) | ||||||||
Acquisition-related amortization expense | 704 | 906 | 4,691 | 3,841 | ||||||||||||
Tax effect of acquisition-related amortization expense (2) | (165 | ) | (206 | ) | (1,034 | ) | (874 | ) | ||||||||
Acquisition-related long-term incentives and contingent consideration | 762 | 702 | 3,430 | 3,141 | ||||||||||||
Tax effect of acquisition-related long-term incentives and contingent consideration (2) | (202 | ) | (238 | ) | (910 | ) | (832 | ) | ||||||||
Gain on Sale of Webdam | — | — | — | (38,613 | ) | |||||||||||
Tax effect of gain on Sale of Webdam (2) | — | 263 | — | 10,996 | ||||||||||||
Impairment of long-term investment asset | — | — | — | 5,881 | ||||||||||||
Tax effect of impairment of long-term investment asset (2) | — | — | — | (999 | ) | |||||||||||
Adjusted net income | $ | 9,224 | $ | 20,878 | $ | 43,737 | $ | 55,663 | ||||||||
Net income per diluted share | $ | 0.12 | $ | 0.42 | $ | 0.57 | $ | 1.54 | ||||||||
Adjusted net income per diluted share | $ | 0.26 | $ | 0.59 | $ | 1.23 | $ | 1.57 | ||||||||
Weighted average diluted shares | 35,786 | 35,421 | 35,581 | 35,420 | ||||||||||||
____________________________________________________________________________________________________________________
(1) | Other adjustments, net includes foreign currency transaction gains and losses, charges related to the impairment of a long-term investment asset, expenses related to long-term incentives and contingent consideration related to acquisitions, and interest income and expense. |
(2) | Tax effect reflects the estimated impact of the adjustment on the provision for income taxes. |
9
Three Months Ended December 31, | Year Ended December 31, | |||||||||||||||
2019 | 2018 | 2019 | 2018 | |||||||||||||
Total Revenues | $ | 166,371 | $ | 162,072 | $ | 650,523 | $ | 623,250 | ||||||||
Less: Revenue from the Webdam business(1) | — | — | — | (2,711 | ) | |||||||||||
Revenue excluding the impact of Webdam | $ | 166,371 | $ | 162,072 | $ | 650,523 | $ | 620,539 | ||||||||
Revenue growth | 3 | % | 7 | % | 4 | % | 12 | % | ||||||||
Revenue growth on a constant currency basis | 3 | % | 8 | % | 6 | % | 11 | % | ||||||||
Revenue growth excluding the impact of Webdam on a constant currency basis | 3 | % | 11 | % | 6 | % | 14 | % | ||||||||
E-commerce revenues | $ | 100,902 | $ | 95,564 | $ | 392,241 | $ | 365,730 | ||||||||
Revenue growth: E-commerce | 6 | % | 9 | % | 7 | % | 10 | % | ||||||||
Revenue growth: E-commerce on a constant currency basis | 6 | % | 10 | % | 9 | % | 9 | % | ||||||||
Enterprise revenues | $ | 65,469 | $ | 66,508 | $ | 258,282 | $ | 254,809 | ||||||||
Revenue growth: Enterprise | (2 | )% | 12 | % | 1 | % | 22 | % | ||||||||
Revenue growth: Enterprise on a constant currency basis | — | % | 13 | % | 3 | % | 21 | % | ||||||||
Three Months Ended December 31, | Year Ended December 31, | |||||||||||||||
2019 | 2018 | 2019 | 2018 | |||||||||||||
Net cash provided by operating activities | $ | 25,626 | $ | 33,685 | $ | 102,646 | $ | 102,202 | ||||||||
Capital expenditures | (6,534 | ) | (5,344 | ) | (26,081 | ) | (34,890 | ) | ||||||||
Content acquisition | (1,448 | ) | (1,016 | ) | (3,344 | ) | (3,838 | ) | ||||||||
Free cash flow | $ | 17,644 | $ | 27,325 | $ | 73,221 | $ | 63,474 | ||||||||
____________________________________________________________________________________________________________________
(1) | On February 26, 2018, the Company completed the Sale of Webdam. 2018 amounts include revenue earned during the period from January 1, 2018 through February 26, 2018. |
10
Shutterstock, Inc.
Supplemental Financial Data
(unaudited)
Historical Operating Metrics
Three Months Ended | ||||||||||||||||||||||||||||||||||||
12/31/19 | 9/30/19 | 6/30/19 | 3/31/19 | 12/31/18 | 9/30/18 | 6/30/18 | 3/31/18 | 12/31/17 | ||||||||||||||||||||||||||||
(in millions, except revenue per download) | ||||||||||||||||||||||||||||||||||||
Number of paid downloads | 47.7 | 46.3 | 46.6 | 47.2 | 46.8 | 43.9 | 45.2 | 43.7 | 43.9 | |||||||||||||||||||||||||||
Revenue per download (1)(5) | $ | 3.44 | $ | 3.40 | $ | 3.44 | $ | 3.42 | $ | 3.40 | $ | 3.40 | $ | 3.41 | $ | 3.40 | $ | 3.33 | ||||||||||||||||||
Content in our collection (end of period): (2) | ||||||||||||||||||||||||||||||||||||
Images | 314 | 297 | 280 | 260 | 242 | 221 | 204 | 187 | 170 | |||||||||||||||||||||||||||
Footage | 17 | 16 | 15 | 14 | 13 | 12 | 11 | 10 | 9 | |||||||||||||||||||||||||||
Historical Revenue by Sales Channel(3)
Three Months Ended | ||||||||||||||||||||||||||||||||||||
12/31/19 | 9/30/19 | 6/30/19 | 3/31/19 | 12/31/18 | 9/30/18 | 6/30/18 | 3/31/18 | 12/31/17 | ||||||||||||||||||||||||||||
(in millions) | ||||||||||||||||||||||||||||||||||||
E-commerce | $ | 100.9 | $ | 96.2 | $ | 97.0 | $ | 98.1 | $ | 95.6 | $ | 88.7 | $ | 91.7 | $ | 89.7 | $ | 87.8 | ||||||||||||||||||
Enterprise | 65.5 | 62.8 | 64.7 | 65.2 | 66.5 | 62.9 | 64.9 | 60.6 | 59.3 | |||||||||||||||||||||||||||
Other(4) | — | — | — | — | — | — | — | 2.7 | 4.7 | |||||||||||||||||||||||||||
Total Revenue(5) | $ | 166.4 | $ | 159.1 | $ | 161.7 | $ | 163.3 | $ | 162.1 | $ | 151.6 | $ | 156.6 | $ | 153.0 | $ | 151.8 | ||||||||||||||||||
_______________________________________________________________________________________________________________________
(1) | Revenue per download is defined as the amount of revenue recognized in a given period divided by the number of paid downloads in that period excluding revenue from custom content and the impact of revenue that is not derived from or associated with content licenses. |
(2) | Images (photographs, vectors and illustrations) and footage available on shutterstock.com at the end of the period. We exclude certain content available to customers, including custom content and content that may be licensed for editorial use only. |
(3) | Certain amounts in the table may not foot due to rounding. |
(4) | On February 26, 2018, the Company completed the Sale of Webdam. This table includes revenue earned during 2017 and for the period from January 1, 2018 through February 26, 2018. |
(5) | Effective January 1, 2018, the Company adopted new revenue recognition accounting guidance using a modified retrospective approach. Historical revenue totals reflect those previously reported and have not been restated. Historical presentation of the allocation of the revenue by sales channel for periods prior to January 1, 2018 has been adjusted to conform to current presentation. |
11