
STAAR Surgical Reports First Quarter 2025 Results
China ICL Procedure Trends Improving
Tariff Mitigation Activities Implemented
Cost Controls and Restructuring Initiated to Reduce SG&A Run Rate
Earnings Call and Webcast Today at 5:15 p.m. Eastern
LAKE FOREST, CA, May 7, 2025 --- STAAR Surgical Company (NASDAQ: STAA), the global leader in phakic IOLs with the EVO family of Implantable Collamer® Lenses (EVO ICL™) for vision correction, today reported results for the first quarter ended March 28, 2025.
First Quarter 2025 Financial Overview
•Net sales of $42.6 million down 45% Y/Y due to planned reduction of channel inventory in China
•Net Sales Excluding China of $42.2 million up 9% Y/Y reflecting growth in all key markets
•Gross margin at 65.8% vs. 78.9% year ago due to intentional reduction in U.S. production volumes and readiness for manufacturing in Switzerland
•Net loss of $(54.2) million or $(1.10) per share vs. $(3.3) million or $(0.07) per share year ago
•Adjusted EBITDA1 loss of $(26.4) million or $(0.53) per share vs. earnings of $5.3 million or $0.11 per share year ago
“STAAR’s first quarter sales were in line with expectations, but we can and will do better,” said STAAR Surgical CEO, Stephen C. Farrell. “Our results do not reflect the earnings power of our business or the strength of our brand. We are making progress working through transitory challenges in our China business, and importantly, we believe that EVO ICL procedure volumes in China are improving compared to the first quarter last year, despite the macroeconomic headwinds. As our distributors in China continue to consume channel inventory to meet this demand, we are on track to resume normalized sales in China in the third quarter. Our ability to drive growth this quarter in all key markets outside of China further demonstrates the potential and opportunity for STAAR to grow EVO ICL adoption.”
Mr. Farrell continued, “In addition, we have made excellent progress on our cost controls and restructuring activities to better align our expenses with our sales. As a result, we are confident that we will resume growth in revenue and Adjusted EBITDA for the full second half of the year. STAAR has outstanding technology, a consistent history of market share gains, a large addressable market supported by the expanding incidence of myopia, a strong balance sheet, and a demonstrated ability to drive profitability and cash flow. We are rapidly turning the corner, and our long-term prospects are excellent.”
First Quarter 2025 Highlights
•Distributor Inventory in China – The Company’s distributors in China have continued to consume channel inventory to support EVO ICL procedural demand and are on track to reduce excess distributor inventory to contracted levels by the end of the second quarter. The Company is actively working with its distributors to better forecast forward demand so that purchases by distributors more closely align
with in-market procedure volume and to maintain adequate inventory to meet patient demand without creating excess inventory in the channel.
•Tariff Mitigation – In order to mitigate the potential impact of tariffs on exports to China, the Company negotiated and implemented consignment agreements with its two distributors in China and delivered consigned inventory in advance of the implementation of tariffs. The Company believes it now has sufficient levels of product in country to meet most of its demand through the beginning of 2026, and it is taking steps to ramp up manufacturing capabilities at its Switzerland site to further mitigate potential long-term impacts of China tariffs.
•Cost Controls – The Company is meaningfully cutting costs and is undertaking restructuring activities to reduce its SG&A run rate. For fiscal 2024, the Company recorded SG&A expenses of $252.2 million, which were planned to grow in 2025 due to commitments to investments in human capital and facilities. The Company has identified spend reductions related to facilities, marketing, and staff that are expected to reduce the annualized SG&A run rate significantly below fiscal 2024 to approximately $225 million as the Company exits fiscal 2025. The majority of the restructuring activities are focused on U.S. operations. The Company is also assessing other areas of potential savings, but those incremental savings may be redeployed to fund strategic investments to drive future growth.
•Regulatory Approvals – The Company received EVO/EVO+ ICL approval from the Taiwan FDA during the first quarter. In April, the Company received approval in Brazil for the expansion of its EVO/EVO+ ICL labeling to include spherical power down to -0.5 diopters from -6.0 diopters previously. The Company is pursuing labeling changes in other key markets around the globe and believes that this approval further evidences the growing clinical support for EVO ICL at lower diopter levels. Finally, the Company continues to believe it will receive mid-year approval for its EVO+ (V5) lenses in China.
“We are proud of the great team effort to rapidly ship additional inventory into China and proactively seek ways to navigate the evolving tariff environment to support our growth plans,” said STAAR Surgical President and Chief Operating Officer, Warren Foust. “Not only did our internal teams jump into action, but our distributors in China were great partners as we worked through the logistics of the consignment. We believe this consigned inventory plus distributor-owned inventory already in country will be sufficient to meet most surgeon and patient needs for fiscal 2025 and the beginning of fiscal 2026. In parallel, we are readying our Switzerland manufacturing facility for additional production of EVO ICLs for the China market when we obtain the final validations and approvals, which we expect this summer.”
First Quarter 2025 Financial Results
Net sales were $42.6 million for the first quarter of 2025 compared to $77.4 million in the prior year quarter. The decrease was primarily due to a significant decline in China revenue, as purchases by the Company’s China distributors were minimal in the quarter as they consumed existing in-country inventory to satisfy procedural demand. The decline was partially offset by growth in other geographies. Excluding China, net sales were $42.2 million, an increase of 9% as compared to the prior year period.
Gross profit margin for the first quarter of 2025 was 65.8% of total net sales compared to the prior year quarter of 78.9% of total net sales. The decrease in gross profit margin was primarily due to higher manufacturing costs per unit due to reduced production volumes at the Company’s U.S. manufacturing site and period costs associated with the expansion of the Company’s manufacturing capabilities at its
Switzerland site, which reduced gross margin by approximately 6 points. In addition, gross margin was negatively impacted by higher excess and obsolete inventory reserves, which reduced gross margin by approximately 4 points.
Total SG&A expenses for the first quarter of 2025 were $62.7 million compared to $63.3 million in the prior year quarter. The decrease in SG&A is the result of cost savings initiatives that were implemented towards that latter half of the quarter, partially offset by a higher run rate at the beginning of the quarter. General and administrative expenses were $24.5 million compared to $23.2 million in the prior year quarter, primarily due to increased compensation related expenses and facilities costs. Selling and marketing expenses were $24.6 million compared to $26.7 million in the prior year quarter due to lower marketing, promotional and advertising activities. Research and development expenses were $13.7 million compared to $13.4 million in the prior year quarter.
In the first quarter of 2025, the Company also incurred $22.7 million for restructuring, impairment and related charges, primarily for asset write-offs, closed facility charges, and severance associated with the realignment of the Company’s leadership structure and its cost control initiatives. Including these charges, operating loss for the first quarter of 2025 was $(57.4) million as compared to $(2.3) million for the first quarter of 2024. Net loss for the first quarter of 2025 was $(54.2) million or $(1.10) per diluted share compared with a net loss of $(3.3) million or $(0.07) per diluted share for the prior year quarter. The year over year decrease in net income was primarily attributable to lower net sales and restructuring charges.
Cash, cash equivalents and investments available for sale at March 28, 2025, totaled $222.8 million, compared to $230.5 million at the end of the fourth quarter of 2024.
Mr. Foust concluded, “We believe there is a significant opportunity for STAAR to continue to drive adoption of our EVO ICLs. The global myopia epidemic is increasing, and patients are looking for safe and effective long-term vision correction solutions. Our proprietary Collamer® material provides a sustainable competitive advantage in refractive vision correction, and patients and surgeons are increasingly turning to EVO ICL as they look to get rid of their glasses and contact lenses. We also believe in the potential of Collamer for use in other therapeutic applications, especially within the eye.”
Outlook
The Company announced that it is withdrawing the financial outlook previously provided on February 11, 2025.
“Global economic uncertainty and evolving tariff policy make it more challenging to forecast. As a result, despite confidence in our recent efforts to mitigate tariff exposure and our optimism regarding both short-term and long-term business trends, we are withdrawing the Company’s previous financial outlook,” concluded Mr. Farrell.
Earnings Conference Call and Webcast
The Company will host an earnings conference call and webcast today, Wednesday, May 7 at 5:15 p.m. Eastern / 2:15 p.m. Pacific to discuss its financial results and operational progress. To access the webcast please use the following link:
https://event.choruscall.com/mediaframe/webcast.html?webcastid=VN5Skdjp
In addition to live questions, participants may submit questions by email to [email protected]
1 Adjusted EBITDA and Adjusted EBITDA per share are non-GAAP financial measures. For further information on non-GAAP financial measures, please refer to the “Use of Non-GAAP Financial Measures” section of this press release. Please also refer to the tables at the end of this press release for a reconciliation of non-GAAP financial measures to the most directly comparable GAAP measure.
Use of Non-GAAP Financial Measures
To supplement the Company’s financial measures prepared in accordance with U.S. generally accepted accounting principles (GAAP), this press release and the accompanying tables include certain non-GAAP financial measures, including Adjusted EBITDA. Management uses these non-GAAP financial measures in its evaluation of Company operating performance and believes investors will find them useful in evaluating the Company’s operating performance, including cash flow generation, and in analyzing period-to-period financial performance of core business operations and underlying business trends. Non-GAAP financial measures are in addition to, not a substitute for, or superior to, measures of financial performance prepared in accordance with GAAP.
EBITDA is a non-GAAP financial measure, which is calculated by adding interest income and expense, net; provision for income taxes; and depreciation and amortization to net income. In calculating Adjusted EBITDA and Adjusted EBITDA per diluted share, the Company further adjusts for stock-based compensation expense and for restructuring, impairment and related charges. As stock-based compensation is a non-cash expense that can vary significantly based on the timing, size and nature of awards granted, the Company believes that the exclusion of stock-based compensation expense can assist investors in comparisons of Company operating results with other peer companies because (i) the amount of such expense in any specific period may not directly correlate to the underlying performance of our business operations and (ii) such expense can vary significantly between periods as a result of the timing of grants of new stock-based awards, including inducement grants in connection with hiring. Additionally, the Company believes that excluding stock-based compensation from Adjusted EBITDA and Adjusted EBITDA per diluted share assists management and investors in making meaningful comparisons between the Company’s operating performance and the operating performance of other companies that may use different forms of employee compensation or different valuation methodologies for their stock-based compensation. Investors should note that stock-based compensation is a key incentive offered to employees whose efforts contributed to the operating results in the periods presented and are expected to contribute to operating results in future periods. Investors should also note that such expenses will recur in the future. The Company believes that restructuring, impairment and related charges are not indicative of the underlying operating expense profile for the Company. These charges, which include costs related to severance, reduction in force and consulting expenses, impairment expenses on leasehold improvements and machinery and equipment, impairment on real property right-of use assets, and impairment of internally developed software, are anticipated to be completed within a finite period of time and can vary significantly in any specific period. The Company believes that excluding restructuring, impairment and related charges from Adjusted EBITDA allows investors to more consistently analyze period-to-period financial performance of its core business operations and better assess the Company’s current and future continuing operations.
The Company also presents certain financial information on a constant currency basis, which is intended to exclude the effects of foreign currency fluctuations. The Company conducts a significant part of its
activities outside the U.S. It receives sales revenue and pays expenses principally in U.S. dollars, Swiss francs, Japanese yen and euros. The exchange rates between dollars and non-U.S. currencies can fluctuate greatly and can have a significant effect on the Company’s results when reported in U.S. dollars. In order to compare the Company's performance from period to period without the effect of currency, the Company will apply the same average exchange rate applicable in the prior period, or the “constant currency” rate to sales or expenses in the current period as well.
In the tables provided below, the Company has included a reconciliation of Adjusted EBITDA and Adjusted EBITDA per diluted share to net income (loss) and net income (loss) per diluted share, the most directly comparable GAAP financial measure, as well as supplemental financial information with net sales expressed in constant currency.
About STAAR Surgical
STAAR Surgical (NASDAQ: STAA) is the global leader in implantable phakic intraocular lenses, a vision correction solution that reduces or eliminates the need for glasses or contact lenses. Since 1982, STAAR has been dedicated solely to ophthalmic surgery, and for 30 years, STAAR has been designing, developing, manufacturing, and marketing advanced Implantable Collamer® Lenses (ICLs), using its proprietary biocompatible Collamer material. STAAR ICL’s are clinically-proven to deliver safe long-term vision correction without removing corneal tissue or the eye’s natural crystalline lens. Its EVO ICL™ product line provides visual freedom through a quick, minimally invasive procedure. STAAR has sold more than 3 million ICLs in over 75 countries. Headquartered in Lake Forest, California, the company operates research, development, manufacturing, and packaging facilities in California and Switzerland. For more information about ICL, visit www.EVOICL.com. To learn more about STAAR, visit www.staar.com.
We intend to use our website as a means of disclosing material non-public information about the Company and for complying with our disclosure obligations under Regulation FD. Such disclosures will be included on our website in the ‘Investor Relations’ sections at investors.staar.com. Accordingly, investors should monitor such portion of our website, in addition to following our press releases, SEC filings and public conference calls and webcasts. In addition, you may automatically receive email alerts and other information about the Company when you enroll your email address by visiting the Email Alerts section at investors.staar.com.
Forward-Looking Statements
This press release contains forward-looking statements within the meaning of the Private Securities Litigation Reform Act of 1995. We intend such forward-looking statements to be covered by the safe harbor provisions for forward-looking statements contained in Section 27A of the Securities Act of 1933, as amended, and Section 21E of the Securities Exchange Act of 1934, as amended. All statements in this press release that are not statements of historical fact are forward-looking statements, including statements about any of the following: financial projections and forecasts; plans, strategies, and objectives of management for 2025 and beyond or prospects for achieving such plans; expectations for sales, revenue, margin, earnings, expenses, and cost controls; estimates regarding procedural demand, inventory levels, and tariff impacts; expectations regarding regulatory approvals, uses of Collamer, manufacturing and production; use of cash and cash flows; and any statements of assumptions underlying any of the foregoing, including those relating to expected or future financial performance or results. These forward-looking statements are neither promises nor guarantees and involve known and unknown risks, uncertainties and other important factors
that may cause actual results, performance or achievements to be materially different from what is expressed or implied by the forward-looking statements, including, but not limited to: our ability to continue our growth and profitability trajectory; our reliance on independent distributors in international markets; a slowdown or disruption to the Chinese economy; global economic conditions; disruptions in our supply chain; fluctuations in foreign currency exchange rates; international trade disputes (including involving tariffs) and substantial dependence on demand from Asia; changes in effective tax rate or tax laws; any loss of use of our principal manufacturing facility; competition; potential losses due to product liability claims; our exposure to environmental liability; data corruption, cyber-based attacks or network security breaches and/or noncompliance with data protection and privacy regulations; acquisitions of new technologies; climate changes; the willingness of surgeons and patients to adopt a new or improved product and procedure; extensive clinical trials and resources devoted to research and development; compliance with government regulations; the discretion of regulatory agencies to approve or reject existing, new or improved products, or to require additional actions before or after approval, or to take enforcement action; laws pertaining to healthcare fraud and abuse; changes in FDA or international regulations related to product approval; product recalls or failures; and other important factors set forth in the Company’s Annual Report on Form 10-K for the year ended December 27, 2024 under the caption “Risk Factors,” which is on file with the Securities and Exchange Commission (the “SEC”) and available in the “Investor Information” section of the Company’s website under the heading “SEC Filings,” as any such factors may be updated from time to time in the Company’s other filings with the SEC. Forward-looking statements speak only as of the date they are made and, except as may be required under applicable law, the Company undertakes no obligation to update or revise any forward-looking statements, whether as a result of new information, future events or otherwise.
We intend to use our website as a means of disclosing material non-public information about the Company and for complying with our disclosure obligations under Regulation FD. Such disclosures will be included on our website in the ‘Investor Relations’ sections at investors.staar.com. Accordingly, investors should monitor such portion of our website, in addition to following our press releases, SEC filings and public conference calls and webcasts. In addition, you may automatically receive email alerts and other information about the Company when you enroll your email address by visiting the Email Alerts section at investors.staar.com.
|
|
CONTACT: |
Investors & Media |
|
Brian Moore |
|
Vice President, Investor Relations and Corporate Development |
|
(626) 303-7902, Ext. 3023 |
|
[email protected] |
|
|
|
Investors - Asia |
|
Niko Liu, CFA |
|
Director, Investor Relations and Corporate Development - Asia |
|
+852-6092-5076 |
|
[email protected] |
|
|
|
|
|
|
|
|
|
Consolidated Balance Sheets |
|
|
|
|
|
|
(in 000's) |
|
|
|
|
|
|
Unaudited |
|
|
|
|
|
|
|
|
|
|
|
|
|
|
|
|
|
|
|
|
ASSETS |
|
March 28, 2025 |
|
|
December 27, 2024 |
|
Current assets: |
|
|
|
|
|
|
Cash and cash equivalents |
|
$ |
173,114 |
|
|
$ |
144,159 |
|
Investments available for sale |
|
|
49,647 |
|
|
|
86,335 |
|
Accounts receivable trade, net |
|
|
39,949 |
|
|
|
77,897 |
|
Inventories, net |
|
|
48,143 |
|
|
|
43,305 |
|
Prepayments, deposits, and other current assets |
|
|
15,645 |
|
|
|
16,244 |
|
Total current assets |
|
|
326,498 |
|
|
|
367,940 |
|
Property, plant, and equipment, net |
|
|
74,957 |
|
|
|
84,889 |
|
Finance lease right-of-use assets, net |
|
|
- |
|
|
|
37 |
|
Operating lease right-of-use assets, net |
|
|
31,047 |
|
|
|
36,850 |
|
Goodwill |
|
|
1,786 |
|
|
|
1,786 |
|
Deferred income taxes |
|
|
4,002 |
|
|
|
788 |
|
Other assets |
|
|
19,074 |
|
|
|
17,234 |
|
Total assets |
|
$ |
457,364 |
|
|
$ |
509,524 |
|
|
|
|
|
|
|
|
LIABILITIES AND STOCKHOLDERS' EQUITY |
|
|
|
|
|
|
Current liabilities: |
|
|
|
|
|
|
Accounts payable |
|
$ |
11,465 |
|
|
$ |
16,704 |
|
Obligations under finance leases |
|
|
- |
|
|
|
42 |
|
Obligations under operating leases |
|
|
3,560 |
|
|
|
3,894 |
|
Allowance for sales returns |
|
|
5,644 |
|
|
|
6,579 |
|
Other current liabilities |
|
|
47,687 |
|
|
|
43,087 |
|
Total current liabilities |
|
|
68,356 |
|
|
|
70,306 |
|
|
|
|
|
|
|
|
Obligations under operating leases |
|
|
33,118 |
|
|
|
34,807 |
|
Deferred income taxes |
|
|
- |
|
|
|
297 |
|
Asset retirement obligations |
|
|
43 |
|
|
|
42 |
|
Pension liability |
|
|
5,875 |
|
|
|
6,737 |
|
Total liabilities |
|
|
107,392 |
|
|
|
112,189 |
|
|
|
|
|
|
|
|
Stockholders' equity: |
|
|
|
|
|
|
Common stock |
|
|
495 |
|
|
|
493 |
|
Additional paid-in capital |
|
|
476,868 |
|
|
|
471,449 |
|
Accumulated other comprehensive loss |
|
|
(5,604 |
) |
|
|
(7,031 |
) |
Accumulated deficit |
|
|
(121,787 |
) |
|
|
(67,576 |
) |
Total stockholders' equity |
|
|
349,972 |
|
|
|
397,335 |
|
Total liabilities and stockholders' equity |
|
$ |
457,364 |
|
|
$ |
509,524 |
|
|
|
|
|
|
|
|
|
|
|
|
|
|
|
|
|
|
|
|
|
|
|
|
|
|
Consolidated Statements of Operations |
|
|
|
|
|
|
|
|
|
|
|
|
|
|
|
|
|
|
(in 000's except for per share data) |
|
|
|
|
|
|
|
|
|
|
|
|
|
|
|
|
|
|
Unaudited |
|
|
|
|
|
|
|
|
|
|
|
|
|
|
|
|
|
|
|
|
|
|
|
|
|
|
|
|
|
|
|
|
|
|
|
|
|
|
|
|
|
|
|
|
|
|
|
|
|
|
|
|
|
|
|
|
|
|
|
|
|
|
|
|
|
|
|
|
|
|
|
|
|
|
|
|
|
Quarter Ended |
|
|
|
% of Sales |
|
|
March 28, 2025 |
|
|
% of Sales |
|
|
March 29, 2024 |
|
|
Fav (Unfav) Amount |
|
|
% |
|
Net sales |
|
|
100.0 |
% |
|
$ |
42,589 |
|
|
|
100.0 |
% |
|
$ |
77,356 |
|
|
$ |
(34,767 |
) |
|
|
(44.9 |
)% |
|
|
|
|
|
|
|
|
|
|
|
|
|
|
|
|
|
|
|
Cost of sales |
|
|
34.2 |
% |
|
|
14,584 |
|
|
|
21.1 |
% |
|
|
16,321 |
|
|
|
1,737 |
|
|
|
10.6 |
% |
|
|
|
|
|
|
|
|
|
|
|
|
|
|
|
|
|
|
|
Gross profit |
|
|
65.8 |
% |
|
|
28,005 |
|
|
|
78.9 |
% |
|
|
61,035 |
|
|
|
(33,030 |
) |
|
|
(54.1 |
)% |
|
|
|
|
|
|
|
|
|
|
|
|
|
|
|
|
|
|
|
Selling, general and administrative expenses: |
|
|
|
|
|
|
|
|
|
|
|
|
|
|
|
|
|
|
General and administrative |
|
|
57.4 |
% |
|
|
24,458 |
|
|
|
30.0 |
% |
|
|
23,228 |
|
|
|
(1,230 |
) |
|
|
(5.3 |
)% |
Selling and marketing |
|
|
57.8 |
% |
|
|
24,621 |
|
|
|
34.5 |
% |
|
|
26,708 |
|
|
|
2,087 |
|
|
|
7.8 |
% |
Research and development |
|
|
32.1 |
% |
|
|
13,663 |
|
|
|
17.3 |
% |
|
|
13,380 |
|
|
|
(283 |
) |
|
|
(2.1 |
)% |
Total selling, general, and administrative expenses |
|
|
147.3 |
% |
|
|
62,742 |
|
|
|
81.8 |
% |
|
|
63,316 |
|
|
|
574 |
|
|
|
0.9 |
% |
Restructuring, impairment and related charges |
|
|
53.2 |
% |
|
|
22,664 |
|
|
|
0.0 |
% |
|
|
- |
|
|
|
(22,664 |
) |
|
|
0.0 |
% |
Total operating expenses |
|
|
200.5 |
% |
|
|
85,406 |
|
|
|
81.8 |
% |
|
|
63,316 |
|
|
|
(22,090 |
) |
|
|
(34.9 |
)% |
|
|
|
|
|
|
|
|
|
|
|
|
|
|
|
|
|
|
|
Operating loss |
|
|
(134.7 |
)% |
|
|
(57,401 |
) |
|
|
(2.9 |
)% |
|
|
(2,281 |
) |
|
|
(55,120 |
) |
|
|
(2416.5 |
)% |
|
|
|
|
|
|
|
|
|
|
|
|
|
|
|
|
|
|
|
Other income (expense): |
|
|
|
|
|
|
|
|
|
|
|
|
|
|
|
|
|
|
Interest income, net |
|
|
3.2 |
% |
|
|
1,366 |
|
|
|
2.0 |
% |
|
|
1,529 |
|
|
|
(163 |
) |
|
|
(10.7 |
)% |
Gain (loss) on foreign currency transactions |
|
|
3.3 |
% |
|
|
1,418 |
|
|
|
(3.0 |
)% |
|
|
(2,297 |
) |
|
|
3,715 |
|
|
|
161.7 |
% |
Royalty income |
|
|
0.0 |
% |
|
|
- |
|
|
|
0.7 |
% |
|
|
508 |
|
|
|
(508 |
) |
|
|
(100.0 |
)% |
Other income, net |
|
|
0.3 |
% |
|
|
131 |
|
|
|
0.4 |
% |
|
|
330 |
|
|
|
(199 |
) |
|
|
(60.3 |
)% |
Total other income, net |
|
|
6.8 |
% |
|
|
2,915 |
|
|
|
0.1 |
% |
|
|
70 |
|
|
|
2,845 |
|
|
|
4064.3 |
% |
|
|
|
|
|
|
|
|
|
|
|
|
|
|
|
|
|
|
|
Loss before provision for income taxes |
|
|
(127.9 |
)% |
|
|
(54,486 |
) |
|
|
(2.8 |
)% |
|
|
(2,211 |
) |
|
|
(52,275 |
) |
|
|
(2364.3 |
)% |
|
|
|
|
|
|
|
|
|
|
|
|
|
|
|
|
|
|
|
Provision (benefit) for income taxes |
|
|
(0.6 |
)% |
|
|
(275 |
) |
|
|
1.5 |
% |
|
|
1,128 |
|
|
|
1,403 |
|
|
|
124.4 |
% |
|
|
|
|
|
|
|
|
|
|
|
|
|
|
|
|
|
|
|
Net loss |
|
|
(127.3 |
)% |
|
|
(54,211 |
) |
|
|
(4.3 |
)% |
|
|
(3,339 |
) |
|
|
(50,872 |
) |
|
|
(1523.6 |
)% |
|
|
|
|
|
|
|
|
|
|
|
|
|
|
|
|
|
|
|
|
|
|
|
|
|
|
|
|
|
|
|
|
|
|
|
|
|
|
Net loss per share - basic |
|
|
|
|
|
(1.10 |
) |
|
|
|
|
|
(0.07 |
) |
|
|
|
|
|
|
Net loss per share - diluted |
|
|
|
|
|
(1.10 |
) |
|
|
|
|
|
(0.07 |
) |
|
|
|
|
|
|
|
|
|
|
|
|
|
|
|
|
|
|
|
|
|
|
|
|
|
Weighted average shares outstanding - basic |
|
|
|
|
|
49,344 |
|
|
|
|
|
|
48,907 |
|
|
|
|
|
|
|
Weighted average shares outstanding - diluted |
|
|
|
|
|
49,344 |
|
|
|
|
|
|
48,907 |
|
|
|
|
|
|
|
|
|
|
|
|
|
|
|
|
Consolidated Statements of Cash Flows |
|
|
|
|
|
|
(in 000's) |
|
|
|
|
|
|
Unaudited |
|
|
|
|
|
|
|
|
|
|
|
|
|
|
|
Quarter Ended |
|
|
|
March 28, 2025 |
|
|
March 29, 2024 |
|
Cash flows from operating activities: |
|
|
|
|
|
|
Net loss |
|
$ |
(54,211 |
) |
|
$ |
(3,339 |
) |
Adjustments to reconcile net loss to net cash provided by (used in) operating activities: |
|
|
|
|
|
|
Depreciation of property and equipment |
|
|
2,337 |
|
|
|
1,237 |
|
Impairment of fixed assets and operating leases |
|
|
13,216 |
|
|
|
- |
|
Accretion/Amortization of investments available for sale |
|
|
(129 |
) |
|
|
(120 |
) |
Deferred income taxes |
|
|
(1,029 |
) |
|
|
61 |
|
Change in net pension liability |
|
|
(2,457 |
) |
|
|
(93 |
) |
Stock-based compensation expense |
|
|
6,015 |
|
|
|
6,339 |
|
Provision for sales returns and bad debts |
|
|
(910 |
) |
|
|
128 |
|
Inventory provision |
|
|
2,031 |
|
|
|
646 |
|
Changes in working capital: |
|
|
|
|
|
|
Accounts receivable |
|
|
38,170 |
|
|
|
29,837 |
|
Inventories |
|
|
(6,304 |
) |
|
|
(4,002 |
) |
Prepayments, deposits and other assets |
|
|
(1,809 |
) |
|
|
(5,485 |
) |
Accounts payable |
|
|
(5,961 |
) |
|
|
1,519 |
|
Other current liabilities |
|
|
5,307 |
|
|
|
(5,048 |
) |
Net cash provided by (used in) operating activities |
|
|
(5,734 |
) |
|
|
21,680 |
|
|
|
|
|
|
|
|
Cash flows from investing activities: |
|
|
|
|
|
|
Acquisition of property and equipment |
|
|
(1,468 |
) |
|
|
(5,202 |
) |
Purchase of investments available for sale |
|
|
(14,691 |
) |
|
|
- |
|
Proceeds from sale or maturity of investments available for sale |
|
|
51,510 |
|
|
|
21,389 |
|
Net provided by investing activities |
|
|
35,351 |
|
|
|
16,187 |
|
|
|
|
|
|
|
|
Cash flows from financing activities: |
|
|
|
|
|
|
Repayment of finance lease obligations |
|
|
(42 |
) |
|
|
(40 |
) |
Repurchase of employee common stock for taxes withheld |
|
|
(1,283 |
) |
|
|
(1,229 |
) |
Proceeds from vested restricted stock and exercise of stock options |
|
|
377 |
|
|
|
5,325 |
|
Net cash provided by (used in) financing activities |
|
|
(948 |
) |
|
|
4,056 |
|
|
|
|
|
|
|
|
Effect of exchange rate changes on cash and cash equivalents |
|
|
286 |
|
|
|
(937 |
) |
|
|
|
|
|
|
|
Increase in cash and cash equivalents |
|
|
28,955 |
|
|
|
40,986 |
|
Cash and cash equivalents, at beginning of the period |
|
|
144,159 |
|
|
|
183,038 |
|
Cash and cash equivalents, at end of the period |
|
$ |
173,114 |
|
|
$ |
224,024 |
|
|
|
|
|
|
|
|
|
|
|
|
|
|
|
|
|
|
|
|
|
|
|
|
|
|
|
|
|
|
|
|
|
|
|
|
|
|
|
|
|
|
|
|
|
|
|
|
|
|
Reconciliation of Non-GAAP Financial Measure |
|
|
|
|
|
|
|
|
|
|
|
|
|
|
|
|
|
|
|
|
|
|
|
|
|
|
|
|
|
|
|
|
|
|
|
|
Net Income to Adjusted EBITDA |
|
|
|
|
|
|
|
|
|
|
|
|
|
|
|
|
|
|
|
|
|
|
|
|
|
|
|
|
|
|
|
|
|
|
|
|
(in 000's except for per share data) |
|
|
|
|
|
|
|
|
|
|
|
|
|
|
|
|
|
|
|
|
|
|
|
|
|
|
|
|
|
|
|
|
|
|
|
|
Unaudited |
|
|
|
|
|
|
|
|
|
|
|
|
|
|
|
|
|
|
|
|
|
|
|
|
|
|
|
|
|
|
|
|
|
|
|
|
|
|
|
|
|
|
|
|
|
|
|
|
|
|
|
|
|
|
|
|
|
|
|
|
|
|
|
|
|
|
|
|
|
|
|
|
|
|
|
2022 |
|
|
Q1-23 |
|
|
Q2-23 |
|
|
Q3-23 |
|
|
Q4-23 |
|
|
2023 |
|
|
Q1-24 |
|
|
Q2-24 |
|
|
Q3-24 |
|
|
Q4-24 |
|
|
2024 |
|
|
Q1-25 |
|
Net income (loss) - (as reported) |
|
$ |
39,665 |
|
|
$ |
2,710 |
|
|
$ |
6,064 |
|
|
$ |
4,817 |
|
|
$ |
7,756 |
|
|
$ |
21,347 |
|
|
$ |
(3,339 |
) |
|
$ |
7,379 |
|
|
$ |
9,980 |
|
|
$ |
(34,228 |
) |
|
$ |
(20,208 |
) |
|
$ |
(54,211 |
) |
Provision (benefit) for income taxes |
|
|
5,887 |
|
|
|
2,009 |
|
|
|
2,428 |
|
|
|
1,929 |
|
|
|
5,983 |
|
|
|
12,349 |
|
|
|
1,128 |
|
|
|
2,955 |
|
|
|
3,179 |
|
|
|
3,894 |
|
|
|
11,156 |
|
|
|
(275 |
) |
Other (income) expense, net |
|
|
(1,750 |
) |
|
|
(1,919 |
) |
|
|
105 |
|
|
|
(451 |
) |
|
|
(3,334 |
) |
|
|
(5,599 |
) |
|
|
(70 |
) |
|
|
1,564 |
|
|
|
(7,477 |
) |
|
|
2,424 |
|
|
|
(3,559 |
) |
|
|
(2,915 |
) |
Depreciation |
|
|
4,481 |
|
|
|
1,113 |
|
|
|
1,285 |
|
|
|
1,345 |
|
|
|
1,368 |
|
|
|
5,111 |
|
|
|
1,237 |
|
|
|
1,522 |
|
|
|
1,757 |
|
|
|
2,375 |
|
|
|
6,891 |
|
|
|
2,337 |
|
(Gain) loss on disposal of property plant and equipment(2) |
|
|
65 |
|
|
|
- |
|
|
|
24 |
|
|
|
17 |
|
|
|
32 |
|
|
|
73 |
|
|
|
- |
|
|
|
26 |
|
|
|
1,642 |
|
|
|
26 |
|
|
|
1,694 |
|
|
|
- |
|
Restructuring, impairment and related charges(3) |
|
|
- |
|
|
|
- |
|
|
|
- |
|
|
|
- |
|
|
|
- |
|
|
|
- |
|
|
|
- |
|
|
|
- |
|
|
|
- |
|
|
|
- |
|
|
|
- |
|
|
|
22,664 |
|
Amortization of intangible assets |
|
|
28 |
|
|
|
7 |
|
|
|
10 |
|
|
|
(2 |
) |
|
|
(2 |
) |
|
|
13 |
|
|
|
- |
|
|
|
- |
|
|
|
- |
|
|
|
- |
|
|
|
- |
|
|
|
- |
|
Stock-based compensation |
|
|
20,371 |
|
|
|
6,065 |
|
|
|
8,423 |
|
|
|
8,846 |
|
|
|
182 |
|
|
|
23,516 |
|
|
|
6,339 |
|
|
|
9,042 |
|
|
|
7,160 |
|
|
|
4,669 |
|
|
|
27,210 |
|
|
|
6,015 |
|
Adjusted EBITDA |
|
$ |
68,747 |
|
|
$ |
9,985 |
|
|
$ |
18,339 |
|
|
$ |
16,501 |
|
|
$ |
11,985 |
|
|
$ |
56,810 |
|
|
$ |
5,295 |
|
|
$ |
22,488 |
|
|
$ |
16,241 |
|
|
$ |
(20,840 |
) |
|
$ |
23,184 |
|
|
$ |
(26,385 |
) |
Adjusted EBITDA as a % of Revenue |
|
|
24.2 |
% |
|
|
13.6 |
% |
|
|
19.9 |
% |
|
|
20.6 |
% |
|
|
15.7 |
% |
|
|
17.6 |
% |
|
|
6.8 |
% |
|
|
22.7 |
% |
|
|
18.3 |
% |
|
|
(42.6 |
)% |
|
|
7.4 |
% |
|
|
(62.0 |
)% |
|
|
|
|
|
|
|
|
|
|
|
|
|
|
|
|
|
|
|
|
|
|
|
|
|
|
|
|
|
|
|
|
|
|
|
|
|
Net income (loss) per share, diluted - (as reported) |
|
$ |
0.80 |
|
|
$ |
0.05 |
|
|
$ |
0.12 |
|
|
$ |
0.10 |
|
|
$ |
0.16 |
|
|
$ |
0.43 |
|
|
$ |
(0.07 |
) |
|
$ |
0.15 |
|
|
$ |
0.20 |
|
|
$ |
(0.69 |
) |
|
$ |
(0.41 |
) |
|
$ |
(1.10 |
) |
Provision (benefit) for income taxes |
|
|
0.12 |
|
|
|
0.04 |
|
|
|
0.05 |
|
|
|
0.04 |
|
|
|
0.12 |
|
|
|
0.25 |
|
|
|
0.02 |
|
|
|
0.06 |
|
|
|
0.06 |
|
|
|
0.08 |
|
|
|
0.22 |
|
|
|
(0.01 |
) |
Other (income) expense, net |
|
|
(0.04 |
) |
|
|
(0.04 |
) |
|
|
- |
|
|
|
(0.01 |
) |
|
|
(0.07 |
) |
|
|
(0.11 |
) |
|
|
- |
|
|
|
0.03 |
|
|
|
(0.15 |
) |
|
|
0.05 |
|
|
|
(0.07 |
) |
|
|
(0.06 |
) |
Depreciation |
|
|
0.09 |
|
|
|
0.02 |
|
|
|
0.03 |
|
|
|
0.03 |
|
|
|
0.03 |
|
|
|
0.10 |
|
|
|
0.03 |
|
|
|
0.03 |
|
|
|
0.04 |
|
|
|
0.05 |
|
|
|
0.14 |
|
|
|
0.05 |
|
(Gain) loss on disposal of property plant and equipment |
|
|
- |
|
|
|
- |
|
|
|
- |
|
|
|
- |
|
|
|
- |
|
|
|
- |
|
|
|
- |
|
|
|
- |
|
|
|
0.03 |
|
|
|
- |
|
|
|
0.03 |
|
|
|
- |
|
Restructuring, impairment and related
charges |
|
|
- |
|
|
|
- |
|
|
|
- |
|
|
|
- |
|
|
|
- |
|
|
|
- |
|
|
|
- |
|
|
|
- |
|
|
|
- |
|
|
|
- |
|
|
|
- |
|
|
|
0.46 |
|
Amortization of intangible assets |
|
|
- |
|
|
|
- |
|
|
|
- |
|
|
|
- |
|
|
|
- |
|
|
|
- |
|
|
|
- |
|
|
|
- |
|
|
|
- |
|
|
|
- |
|
|
|
- |
|
|
|
- |
|
Stock-based compensation |
|
|
0.41 |
|
|
|
0.12 |
|
|
|
0.17 |
|
|
|
0.18 |
|
|
|
- |
|
|
|
0.48 |
|
|
|
0.13 |
|
|
|
0.18 |
|
|
|
0.14 |
|
|
|
0.09 |
|
|
|
0.55 |
|
|
|
0.12 |
|
Adjusted EBITDA per share, diluted(1) |
|
$ |
1.39 |
|
|
$ |
0.20 |
|
|
$ |
0.37 |
|
|
$ |
0.33 |
|
|
$ |
0.24 |
|
|
$ |
1.15 |
|
|
$ |
0.11 |
|
|
$ |
0.45 |
|
|
$ |
0.33 |
|
|
$ |
(0.42 |
) |
|
$ |
0.47 |
|
|
$ |
(0.53 |
) |
|
|
|
|
|
|
|
|
|
|
|
|
|
|
|
|
|
|
|
|
|
|
|
|
|
|
|
|
|
|
|
|
|
|
|
|
|
Weighted average shares outstanding - Diluted |
|
|
49,380 |
|
|
|
49,500 |
|
|
|
49,516 |
|
|
|
49,370 |
|
|
|
49,242 |
|
|
|
49,427 |
|
|
|
48,907 |
|
|
|
49,811 |
|
|
|
49,731 |
|
|
|
49,266 |
|
|
|
49,597 |
|
|
|
49,344 |
|
|
|
|
|
|
|
|
|
|
|
|
|
|
|
|
|
|
|
|
|
|
|
|
|
|
|
|
|
|
|
|
|
|
|
|
|
|
(1) Adjusted EBITDA per diluted share may not add due to rounding |
|
|
|
|
|
|
|
|
|
|
|
|
|
|
|
|
|
|
|
(2) The Q3-2024 non cash write-off of $1.6M was related to the former EVO Experience Center |
|
|
|
|
|
|
|
|
|
|
|
|
|
|
|
|
|
|
|
(3) This was related to severance, consulting expenses and impairment on operating leases, machinery and
equipment, leasehold improvements and internally developed software |
|
|
|
|
|
|
|
|
|
|
|
|
|
|
|
|
|
|
|
|
|
|
|
|
|
|
|
|
|
|
|
|
|
|
|
|
|
|
|
|
|
|
|
|
|
|
|
|
|
|
|
|
|
|
|
|
|
|
|
|
|
|
|
|
|
|
|
|
|
|
|
|
Sales by Geography |
|
|
|
|
|
|
|
|
|
|
|
|
|
|
|
|
|
|
|
|
|
|
|
|
(in 000's) |
|
|
|
|
|
|
|
|
|
|
|
|
|
|
|
|
|
|
|
|
|
|
|
|
Unaudited |
|
|
|
|
|
|
|
|
|
|
|
|
|
|
|
|
|
|
|
|
|
|
|
|
|
|
Fiscal Year |
|
|
Three Months Ended |
|
Sales by Region |
|
2022 |
|
|
2023 |
|
|
2024 |
|
|
March 29, 2024 |
|
|
June 28, 2024 |
|
|
September 27, 2024 |
|
|
December 27, 2024 |
|
|
March 28, 2025 |
|
|
|
|
|
|
|
|
|
|
|
|
|
|
|
|
|
|
|
|
|
|
|
|
|
|
Americas(1) |
|
$ |
19,798 |
|
|
$ |
22,315 |
|
|
$ |
25,229 |
|
|
$ |
6,157 |
|
|
$ |
6,656 |
|
|
$ |
6,029 |
|
|
$ |
6,387 |
|
|
$ |
6,739 |
|
|
|
|
|
|
|
|
|
|
|
|
|
|
|
|
|
|
|
|
|
|
|
|
|
|
EMEA(2) |
|
|
40,733 |
|
|
|
39,488 |
|
|
|
44,073 |
|
|
|
11,202 |
|
|
|
10,235 |
|
|
|
9,760 |
|
|
|
12,876 |
|
|
|
12,331 |
|
|
|
|
|
|
|
|
|
|
|
|
|
|
|
|
|
|
|
|
|
|
|
|
|
|
APAC(3) |
|
|
223,860 |
|
|
|
260,612 |
|
|
|
244,599 |
|
|
|
59,997 |
|
|
|
82,114 |
|
|
|
72,801 |
|
|
|
29,687 |
|
|
|
23,519 |
|
|
|
|
|
|
|
|
|
|
|
|
|
|
|
|
|
|
|
|
|
|
|
|
|
|
Global Sales |
|
$ |
284,391 |
|
|
$ |
322,415 |
|
|
$ |
313,901 |
|
|
$ |
77,356 |
|
|
$ |
99,005 |
|
|
$ |
88,590 |
|
|
$ |
48,950 |
|
|
$ |
42,589 |
|
|
|
|
|
|
|
|
|
|
|
|
|
|
|
|
|
|
|
|
|
|
|
|
|
|
Global Sales Growth |
|
|
23 |
% |
|
|
13 |
% |
|
|
(3 |
)% |
|
|
5 |
% |
|
|
7 |
% |
|
|
10 |
% |
|
|
(36 |
)% |
|
|
(45 |
)% |
|
|
|
|
|
|
|
|
|
|
|
|
|
|
|
|
|
|
|
|
|
|
|
|
|
Americas Sales Growth |
|
|
33 |
% |
|
|
13 |
% |
|
|
13 |
% |
|
|
8 |
% |
|
|
15 |
% |
|
|
9 |
% |
|
|
20 |
% |
|
|
9 |
% |
|
|
|
|
|
|
|
|
|
|
|
|
|
|
|
|
|
|
|
|
|
|
|
|
|
EMEA Sales Growth |
|
|
(2 |
)% |
|
|
(3 |
)% |
|
|
12 |
% |
|
|
1 |
% |
|
|
13 |
% |
|
|
19 |
% |
|
|
16 |
% |
|
|
10 |
% |
|
|
|
|
|
|
|
|
|
|
|
|
|
|
|
|
|
|
|
|
|
|
|
|
|
APAC Sales Growth |
|
|
29 |
% |
|
|
16 |
% |
|
|
(6 |
)% |
|
|
6 |
% |
|
|
6 |
% |
|
|
9 |
% |
|
|
(50 |
)% |
|
|
(61 |
)% |
|
|
|
|
|
|
|
|
|
|
|
|
|
|
|
|
|
|
|
|
|
|
|
|
|
Global ICL Unit Growth |
|
|
33 |
% |
|
|
19 |
% |
|
|
(6 |
)% |
|
|
2 |
% |
|
|
3 |
% |
|
|
6 |
% |
|
|
(39 |
)% |
|
|
(48 |
)% |
|
|
|
|
|
|
|
|
|
|
|
|
|
|
|
|
|
|
|
|
|
|
|
|
|
|
|
Fiscal Year |
|
|
Three Months Ended |
|
Sales by Country(4) |
|
2022 |
|
|
2023 |
|
|
2024 |
|
|
March 29, 2024 |
|
|
June 28, 2024 |
|
|
September 27, 2024 |
|
|
December 27, 2024 |
|
|
March 28, 2025 |
|
|
|
|
|
|
|
|
|
|
|
|
|
|
|
|
|
|
|
|
|
|
|
|
|
|
China |
|
$ |
148,167 |
|
|
$ |
185,554 |
|
|
$ |
161,321 |
|
|
$ |
38,549 |
|
|
$ |
63,395 |
|
|
$ |
51,830 |
|
|
$ |
7,547 |
|
|
$ |
389 |
|
Growth |
|
|
38 |
% |
|
|
25 |
% |
|
|
(13 |
)% |
|
|
10 |
% |
|
|
3 |
% |
|
|
7 |
% |
|
|
(82 |
)% |
|
|
(99 |
)% |
|
|
|
|
|
|
|
|
|
|
|
|
|
|
|
|
|
|
|
|
|
|
|
|
|
Japan |
|
$ |
43,093 |
|
|
$ |
38,472 |
|
|
$ |
41,836 |
|
|
$ |
10,456 |
|
|
$ |
9,885 |
|
|
$ |
10,534 |
|
|
$ |
10,961 |
|
|
$ |
11,391 |
|
Growth |
|
|
5 |
% |
|
|
(11 |
)% |
|
|
9 |
% |
|
|
(4 |
)% |
|
|
17 |
% |
|
|
15 |
% |
|
|
10 |
% |
|
|
9 |
% |
|
|
|
|
|
|
|
|
|
|
|
|
|
|
|
|
|
|
|
|
|
|
|
|
|
South Korea |
|
$ |
17,948 |
|
|
$ |
19,861 |
|
|
$ |
21,853 |
|
|
$ |
6,727 |
|
|
$ |
3,976 |
|
|
$ |
5,435 |
|
|
$ |
5,715 |
|
|
$ |
7,334 |
|
Growth |
|
|
18 |
% |
|
|
11 |
% |
|
|
10 |
% |
|
|
1 |
% |
|
|
20 |
% |
|
|
11 |
% |
|
|
14 |
% |
|
|
9 |
% |
|
|
|
|
|
|
|
|
|
|
|
|
|
|
|
|
|
|
|
|
|
|
|
|
|
United States |
|
$ |
14,679 |
|
|
$ |
17,221 |
|
|
$ |
19,896 |
|
|
$ |
4,935 |
|
|
$ |
5,399 |
|
|
$ |
4,681 |
|
|
$ |
4,881 |
|
|
$ |
5,459 |
|
Growth |
|
|
45 |
% |
|
|
17 |
% |
|
|
16 |
% |
|
|
8 |
% |
|
|
24 |
% |
|
|
12 |
% |
|
|
17 |
% |
|
|
11 |
% |
|
|
|
|
|
|
|
|
|
|
|
|
|
|
|
|
|
|
|
|
|
|
|
|
|
Global Sales Ex China |
|
$ |
136,224 |
|
|
$ |
136,861 |
|
|
$ |
152,580 |
|
|
$ |
38,807 |
|
|
$ |
35,610 |
|
|
$ |
36,760 |
|
|
$ |
41,403 |
|
|
$ |
42,200 |
|
Growth |
|
|
10 |
% |
|
|
0 |
% |
|
|
11 |
% |
|
|
1 |
% |
|
|
15 |
% |
|
|
15 |
% |
|
|
17 |
% |
|
|
9 |
% |
|
|
|
|
|
|
|
|
|
|
|
|
|
|
|
|
|
|
|
|
|
|
|
|
|
Notes: |
|
|
|
|
|
|
|
|
|
|
|
|
|
|
|
|
|
|
|
|
|
|
|
|
(1) Americas includes the United States, Canada and Latin American countries |
|
(2) EMEA includes Spain, Germany, United Kingdom, European, Middle East and Africa Distributors |
|
(3) APAC includes China, Japan, South Korea, India and the rest of Asia Pacific distributors |
|
(4) Sales by country includes countries representing more than 5% of total sales in the most recently completed fiscal year |
|
|
|
|
|
|
|
|
|
|
|
|
|
|
|
|
|
|
|
|
|
|
|
|
|
|
|
|
|
|
|
|
|
|
Reconciliation of Non-GAAP Financial Measure |
|
|
|
|
|
|
|
|
|
|
|
|
|
|
|
|
|
|
|
|
|
|
|
|
Constant Currency Sales |
|
|
|
|
|
|
|
|
|
|
|
|
|
|
|
|
|
|
|
|
|
|
|
|
(in 000's) |
|
|
|
|
|
|
|
|
|
|
|
|
|
|
|
|
|
|
|
|
|
|
|
|
Unaudited |
|
|
|
|
|
|
|
|
|
|
|
|
|
|
|
|
|
|
|
|
|
|
|
|
|
|
|
|
|
|
|
|
|
|
|
|
|
|
|
|
|
|
|
|
|
|
|
|
|
|
|
|
|
|
|
|
|
|
|
|
|
|
|
|
|
|
|
|
|
|
|
|
|
|
|
|
Quarter Ended |
|
|
|
|
|
As Reported |
|
|
Constant Currency |
|
Sales |
|
March 28, 2025 |
|
|
Effect of Currency |
|
|
Constant Currency |
|
|
March 29, 2024 |
|
|
$ Change |
|
|
% Change |
|
|
$ Change |
|
|
% Change |
|
ICL |
|
$ |
41,498 |
|
|
$ |
592 |
|
|
$ |
42,090 |
|
|
$ |
77,151 |
|
|
$ |
(35,653 |
) |
|
|
(46.2 |
)% |
|
$ |
(35,061 |
) |
|
|
(45.4 |
)% |
Other |
|
|
1,091 |
|
|
|
(86 |
) |
|
|
1,005 |
|
|
|
205 |
|
|
|
886 |
|
|
|
432.2 |
% |
|
|
800 |
|
|
|
390.2 |
% |
Total Sales |
|
$ |
42,589 |
|
|
$ |
506 |
|
|
$ |
43,095 |
|
|
$ |
77,356 |
|
|
$ |
(34,767 |
) |
|
|
(44.9 |
)% |
|
$ |
(34,261 |
) |
|
|
(44.3 |
)% |
|
|
|
|
|
|
|
|
|
|
|
|
|
|
|
|
|
|
|
|
|
|
|
|
|
NASDAQ: STAA First Quarter 2025 Earnings Call and Webcast Presentation MAY 7, 2025 Addressing the myopia epidemic as the global leader in phakic IOLs for vision correction Exhibit 99.2
STAAR Surgical Earnings Call and Webcast First Quarter 2025 STEPHEN FARRELL Chief Executive Officer WARREN FOUST DEBORAH ANDREWS President and Chief Operating Officer Interim Chief Financial Officer Today’s Speakers 02 Webcast participants may also email questions for today’s Q&A Session to [email protected] HOST Brian Moore, VP, Investor Relations
This presentation contains forward-looking statements within the meaning of the Private Securities Litigation Reform Act of 1995. We intend such forward-looking statements to be covered by the safe harbor provisions for forward-looking statements contained in Section 27A of the Securities Act of 1933, as amended, and Section 21E of the Securities Exchange Act of 1934, as amended. All statements in this presentation that are not statements of historical fact are forward-looking statements, including statements about any of the following: financial projections and forecasts; plans, strategies, and objectives of management for 2025 and beyond or prospects for achieving such plans; expectations for sales, revenue, margin, earnings, expenses, and cost controls; estimates regarding procedural demand, inventory levels, and tariff impacts; expectations regarding regulatory approvals, uses of Collamer, manufacturing and production; use of cash and cash flows; and any statements of assumptions underlying any of the foregoing, including those relating to expected or future financial performance or results. These forward-looking statements are neither promises nor guarantees and involve known and unknown risks, uncertainties and other important factors that may cause actual results, performance or achievements to be materially different from what is expressed or implied by the forward-looking statements, including, but not limited to: our ability to continue our growth and profitability trajectory; our reliance on independent distributors in international markets; a slowdown or disruption to the Chinese economy; global economic conditions; disruptions in our supply chain; fluctuations in foreign currency exchange rates; international trade disputes (including involving tariffs) and substantial dependence on demand from Asia; changes in effective tax rate or tax laws; any loss of use of our principal manufacturing facility; competition; potential losses due to product liability claims; our exposure to environmental liability; data corruption, cyber-based attacks or network security breaches and/or noncompliance with data protection and privacy regulations; acquisitions of new technologies; climate changes; the willingness of surgeons and patients to adopt a new or improved product and procedure; extensive clinical trials and resources devoted to research and development; compliance with government regulations; the discretion of regulatory agencies to approve or reject existing, new or improved products, or to require additional actions before or after approval, or to take enforcement action; laws pertaining to healthcare fraud and abuse; changes in FDA or international regulations related to product approval; product recalls or failures; and other important factors set forth in the Company’s Annual Report on Form 10-K for the year ended December 27, 2024 under the caption “Risk Factors,” which is on file with the Securities and Exchange Commission (the “SEC”) and available in the “Investor Information” section of the Company’s website under the heading “SEC Filings,” as any such factors may be updated from time to time in the Company’s other filings with the SEC. Forward-looking statements speak only as of the date they are made and, except as may be required under applicable law, the Company undertakes no obligation to update or revise any forward-looking statements, whether as a result of new information, future events or otherwise. We intend to use our website as a means of disclosing material non-public information about the Company and for complying with our disclosure obligations under Regulation FD. Such disclosures will be included on our website in the ‘Investor Relations’ sections at investors.staar.com. Accordingly, investors should monitor such portion of our website, in addition to following our press releases, SEC filings and public conference calls and webcasts. In addition, you may automatically receive email alerts and other information about the Company when you enroll your email address by visiting the Email Alerts section at investors.staar.com. Forward Looking Statements 03
Non-GAAP Financial Information To supplement the Company’s financial measures prepared in accordance with U.S. generally accepted accounting principles (GAAP), this presentation and the accompanying tables include certain non-GAAP financial measures, including Adjusted EBITDA. Management uses these non-GAAP financial measures in its evaluation of Company operating performance and believes investors will find them useful in evaluating the Company’s operating performance, including cash flow generation, and in analyzing period-to-period financial performance of core business operations and underlying business trends. Non-GAAP financial measures are in addition to, not a substitute for, or superior to, measures of financial performance prepared in accordance with GAAP. EBITDA is a non-GAAP financial measure, which is calculated by adding interest income and expense, net; provision for income taxes; and depreciation and amortization to net income. In calculating Adjusted EBITDA and Adjusted EBITDA per diluted share, the Company further adjusts for stock-based compensation expense and for restructuring, impairment and related charges. As stock-based compensation is a non-cash expense that can vary significantly based on the timing, size and nature of awards granted, the Company believes that the exclusion of stock-based compensation expense can assist investors in comparisons of Company operating results with other peer companies because (i) the amount of such expense in any specific period may not directly correlate to the underlying performance of our business operations and (ii) such expense can vary significantly between periods as a result of the timing of grants of new stock-based awards, including inducement grants in connection with hiring. Additionally, the Company believes that excluding stock-based compensation from Adjusted EBITDA and Adjusted EBITDA per diluted share assists management and investors in making meaningful comparisons between the Company’s operating performance and the operating performance of other companies that may use different forms of employee compensation or different valuation methodologies for their stock-based compensation. Investors should note that stock-based compensation is a key incentive offered to employees whose efforts contributed to the operating results in the periods presented and are expected to contribute to operating results in future periods. Investors should also note that such expenses will recur in the future. The Company believes that restructuring, impairment and related charges are not indicative of the underlying operating expense profile for the Company. These charges, which include costs related to severance, reduction in force and consulting expenses, impairment expenses on leasehold improvements and machinery and equipment, impairment on real property right-of use assets, and impairment of internally developed software, are anticipated to be completed within a finite period of time and can vary significantly in any specific period. The Company believes that excluding restructuring, impairment and related charges from Adjusted EBITDA allows investors to more consistently analyze period-to-period financial performance of its core business operations and better assess the Company’s current and future continuing operations. The Company also presents certain financial information on a constant currency basis, which is intended to exclude the effects of foreign currency fluctuations. The Company conducts a significant part of its activities outside the U.S. It receives sales revenue and pays expenses principally in U.S. dollars, Swiss francs, Japanese yen and euros. The exchange rates between dollars and non-U.S. currencies can fluctuate greatly and can have a significant effect on the Company’s results when reported in U.S. dollars. In order to compare the Company's performance from period to period without the effect of currency, the Company will apply the same average exchange rate applicable in the prior period, or the “constant currency” rate to sales or expenses in the current period as well. In the appendix to this presentation, the Company has included a reconciliation of Adjusted EBITDA and Adjusted EBITDA per diluted share to net income (loss) and net income (loss) per diluted share, the most directly comparable GAAP financial measure, as well as supplemental financial information with net sales expressed in constant currency. 04
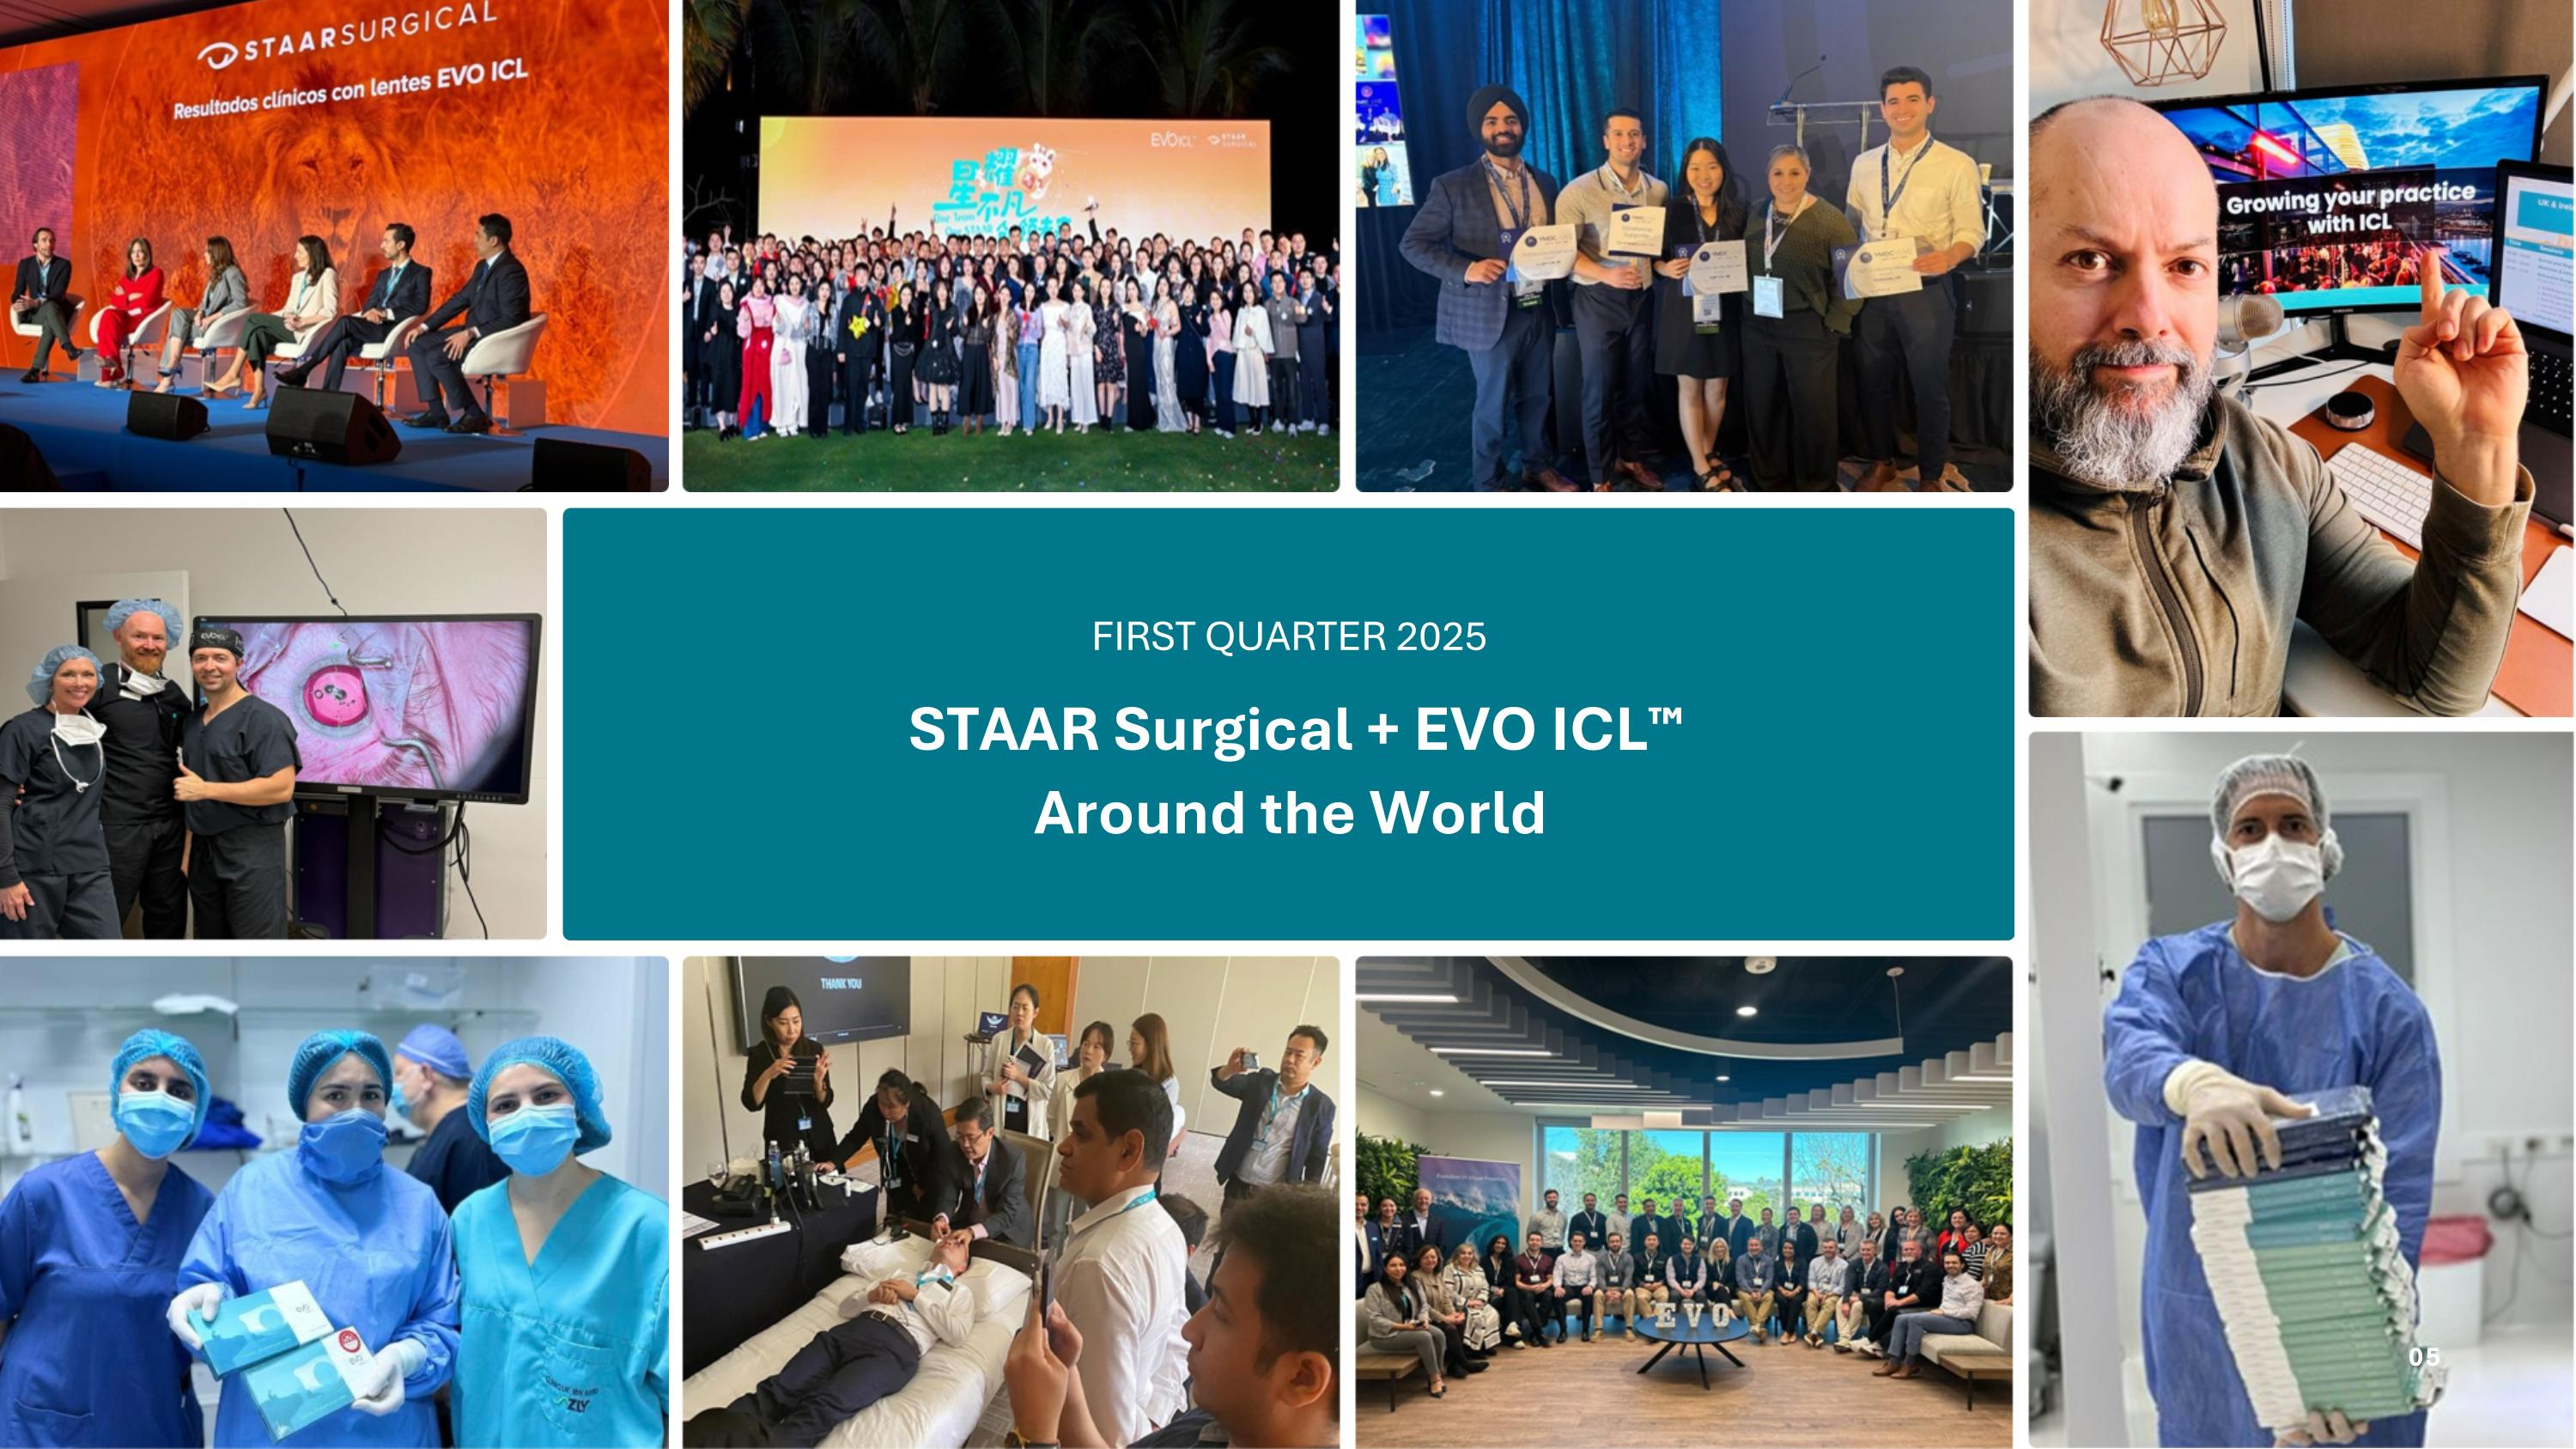
STAAR Surgical + EVO ICL™ Around the World FIRST QUARTER 2025 05
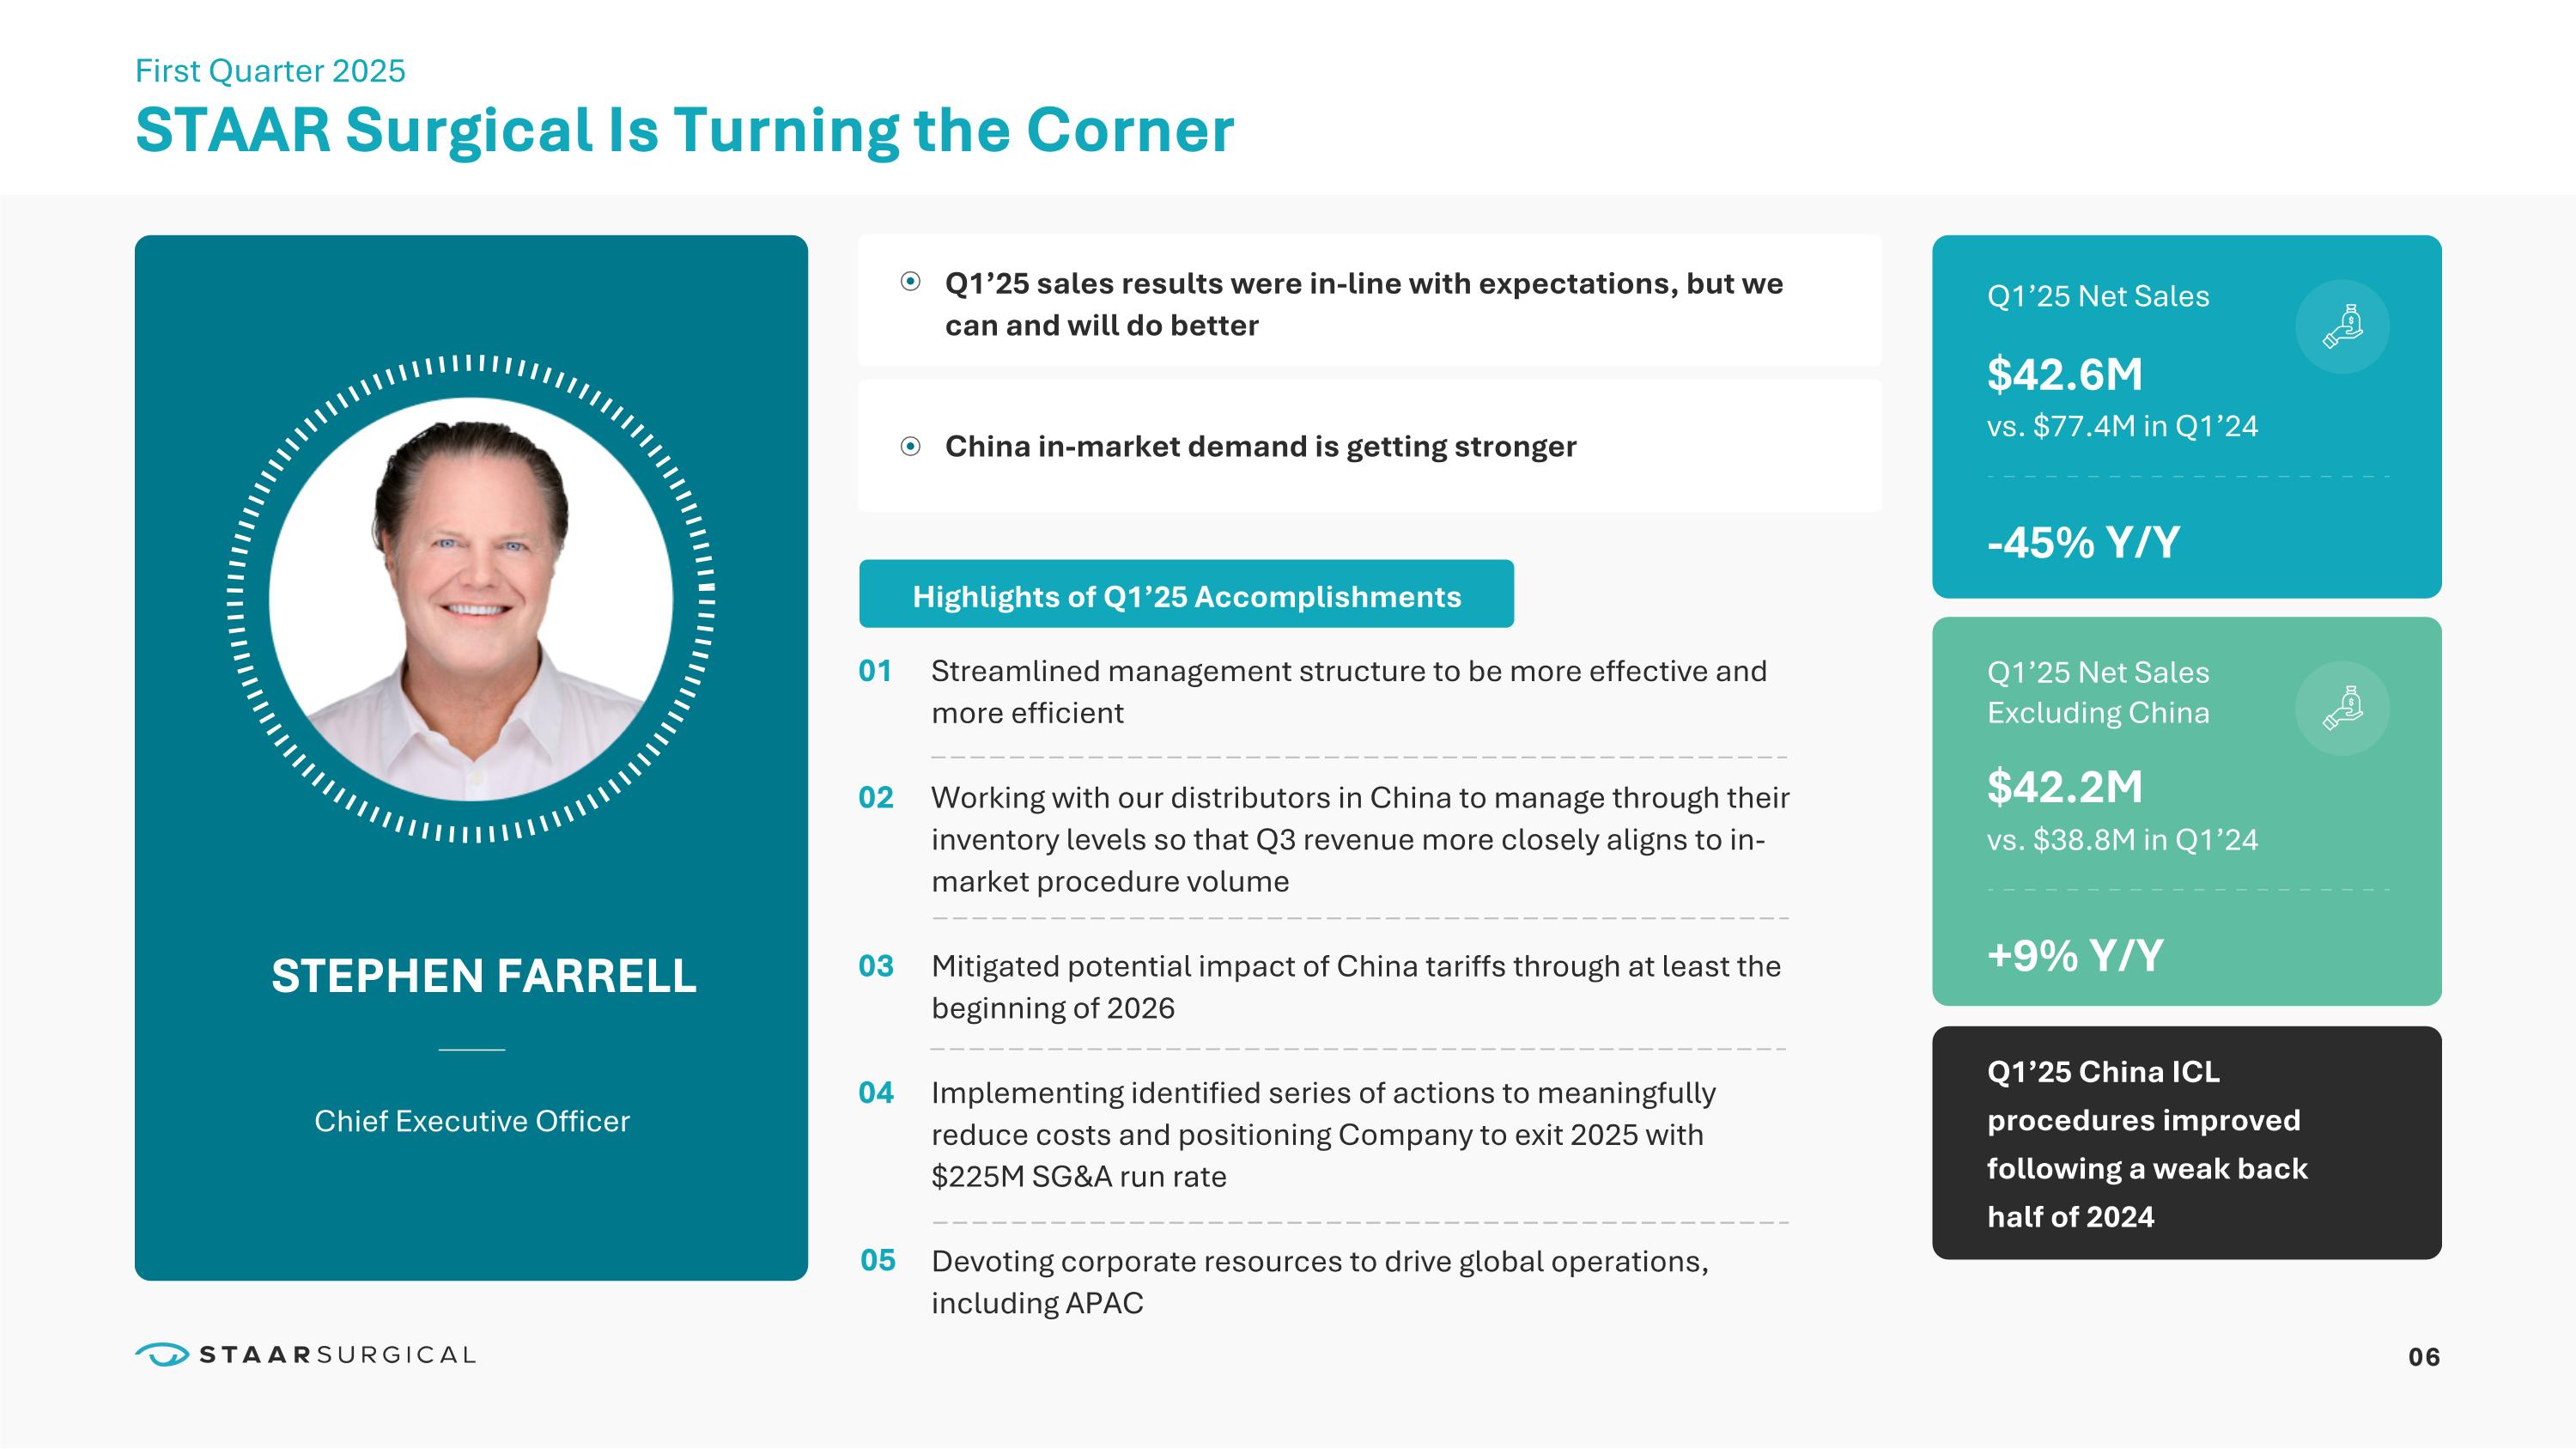
06 STAAR Surgical Is Turning the Corner STEPHEN FARRELL Chief Executive Officer First Quarter 2025 01�
02��
03�
04 Q1’25 sales results were in-line with expectations, but we can and will do better China in-market demand is getting stronger $42.6M Q1’25 Net Sales -45% Y/Y vs. $77.4M in Q1’24 Q1’25 Net Sales Excluding China Q1’25 China ICL procedures improved following a weak back half of 2024 $42.2M +9% Y/Y vs. $38.8M in Q1’24 Highlights of Q1’25 Accomplishments Streamlined management structure to be more effective and more efficient Working with our distributors in China to manage through their inventory levels so that Q3 revenue more closely aligns to in-market procedure volume Mitigated potential impact of China tariffs through at least the beginning of 2026 Implementing identified series of actions to meaningfully reduce costs and positioning Company to exit 2025 with $225M SG&A run rate Devoting corporate resources to drive global operations, including APAC 05
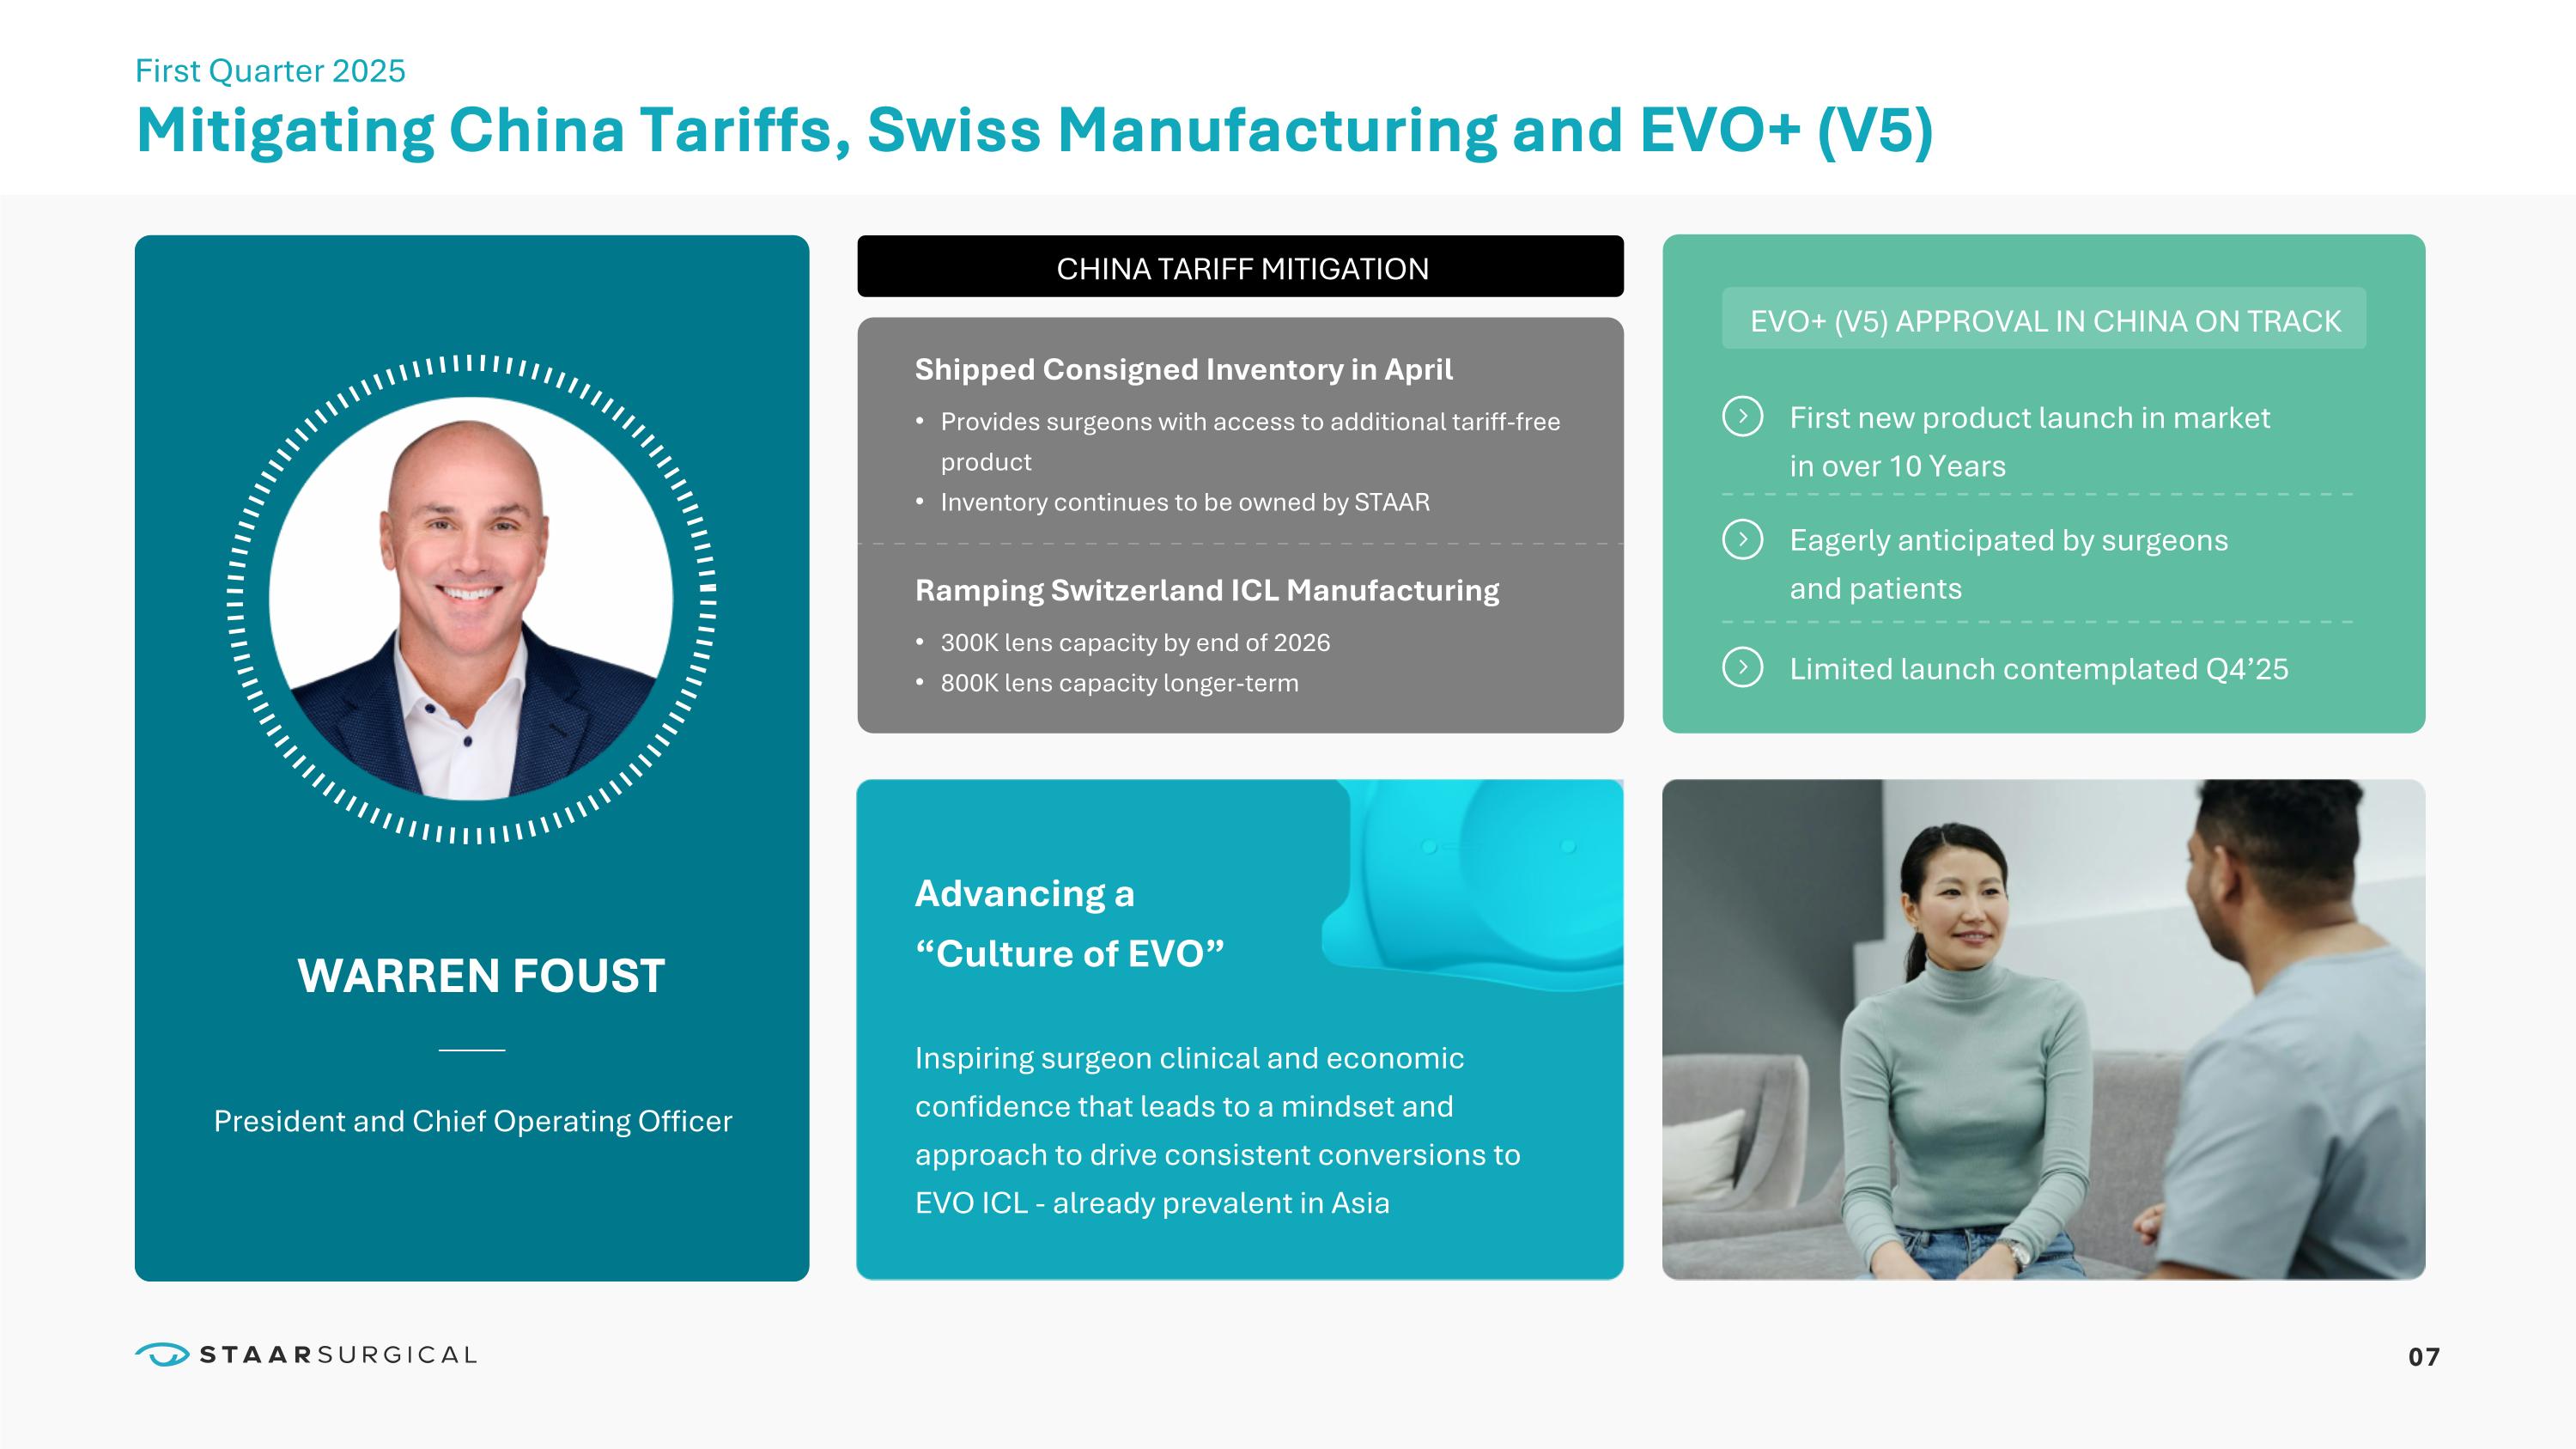
07 Mitigating China Tariffs, Swiss Manufacturing and EVO+ (V5) WARREN FOUST President and Chief Operating Officer First Quarter 2025 Inspiring surgeon clinical and economic confidence that leads to a mindset and approach to drive consistent conversions to EVO ICL - already prevalent in Asia Advancing a “Culture of EVO” EVO+ (V5) APPROVAL IN CHINA ON TRACK CHINA TARIFF MITIGATION First new product launch in market in over 10 Years Shipped Consigned Inventory in April Provides surgeons with access to additional tariff-free product
Inventory continues to be owned by STAAR Ramping Switzerland ICL Manufacturing 300K lens capacity by end of 2026
800K lens capacity longer-term Limited launch contemplated Q4’25 Eagerly anticipated by surgeons and patients
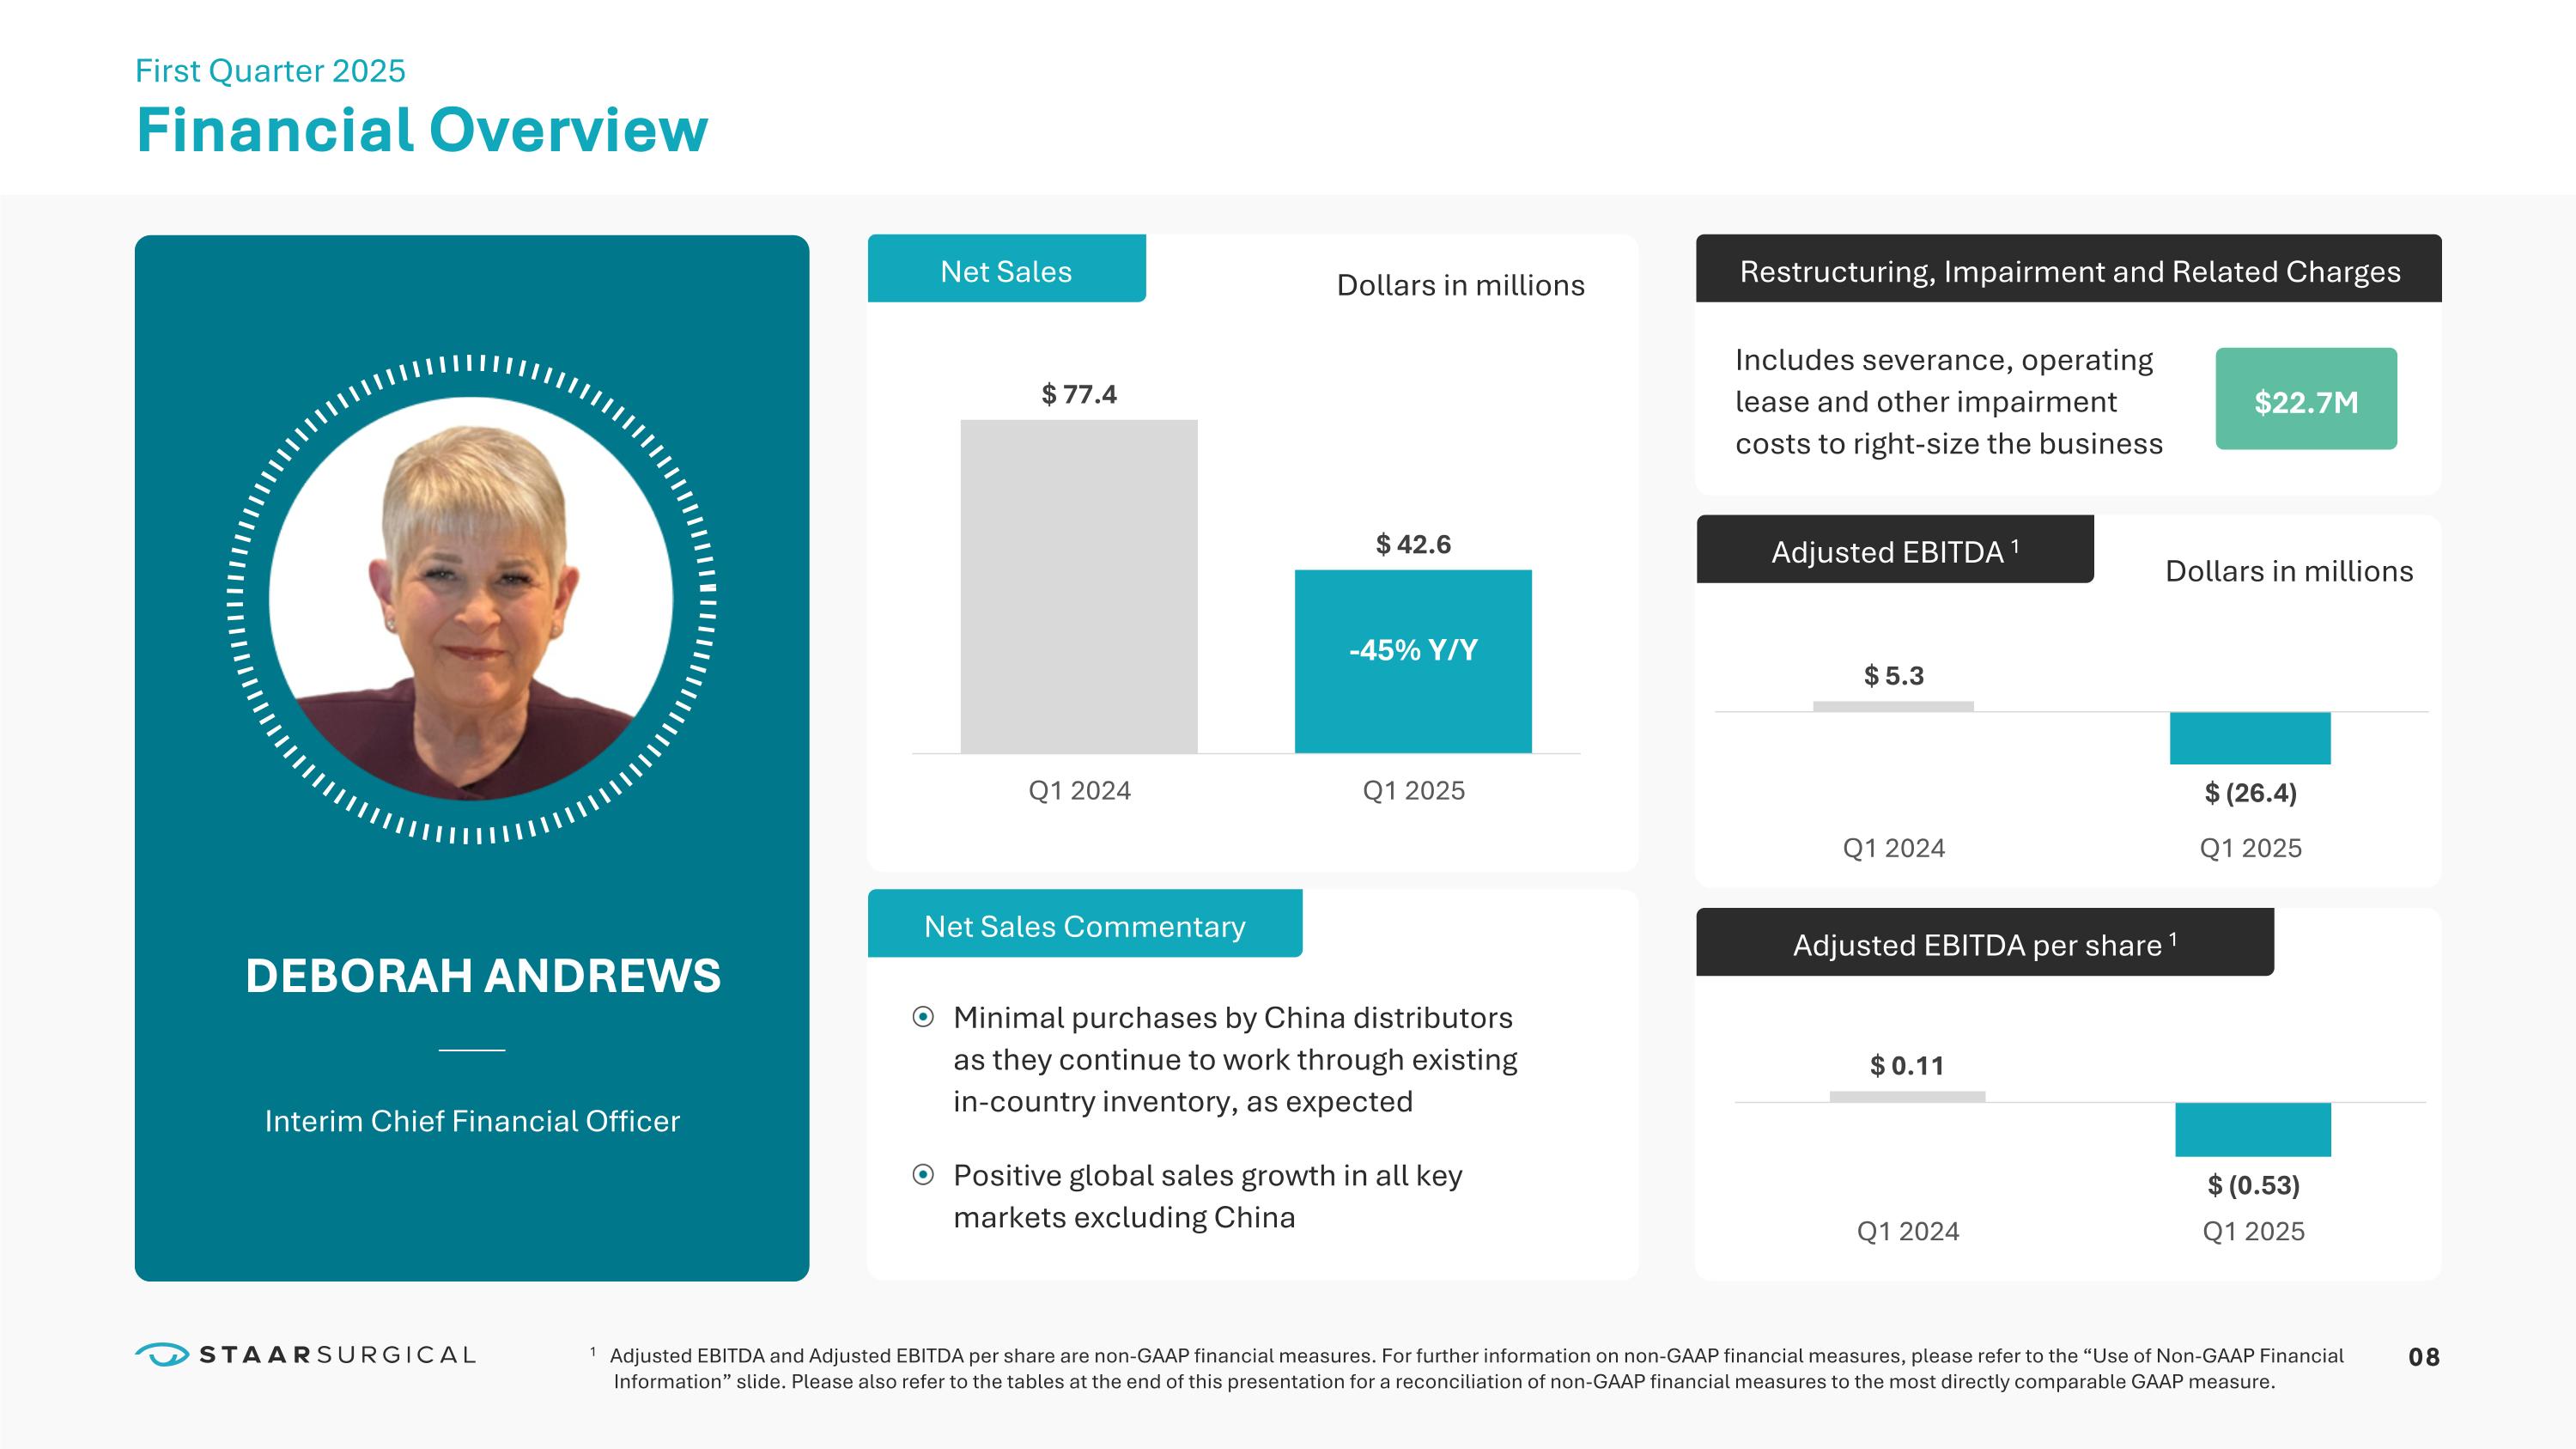
08 Financial Overview DEBORAH ANDREWS Interim Chief Financial Officer First Quarter 2025 Adjusted EBITDA 1 Restructuring, Impairment and Related Charges $22.7M Adjusted EBITDA per share 1 Dollars in millions Net Sales 1 Adjusted EBITDA and Adjusted EBITDA per share are non-GAAP financial measures. For further information on non-GAAP financial measures, please refer to the “Use of Non-GAAP Financial Information” slide. Please also refer to the tables at the end of this presentation for a reconciliation of non-GAAP financial measures to the most directly comparable GAAP measure. Net Sales Commentary Dollars in millions Minimal purchases by China distributors as they continue to work through existing in-country inventory, as expected
Positive global sales growth in all key markets excluding China Includes severance, operating lease and other impairment costs to right-size the business -45% Y/Y
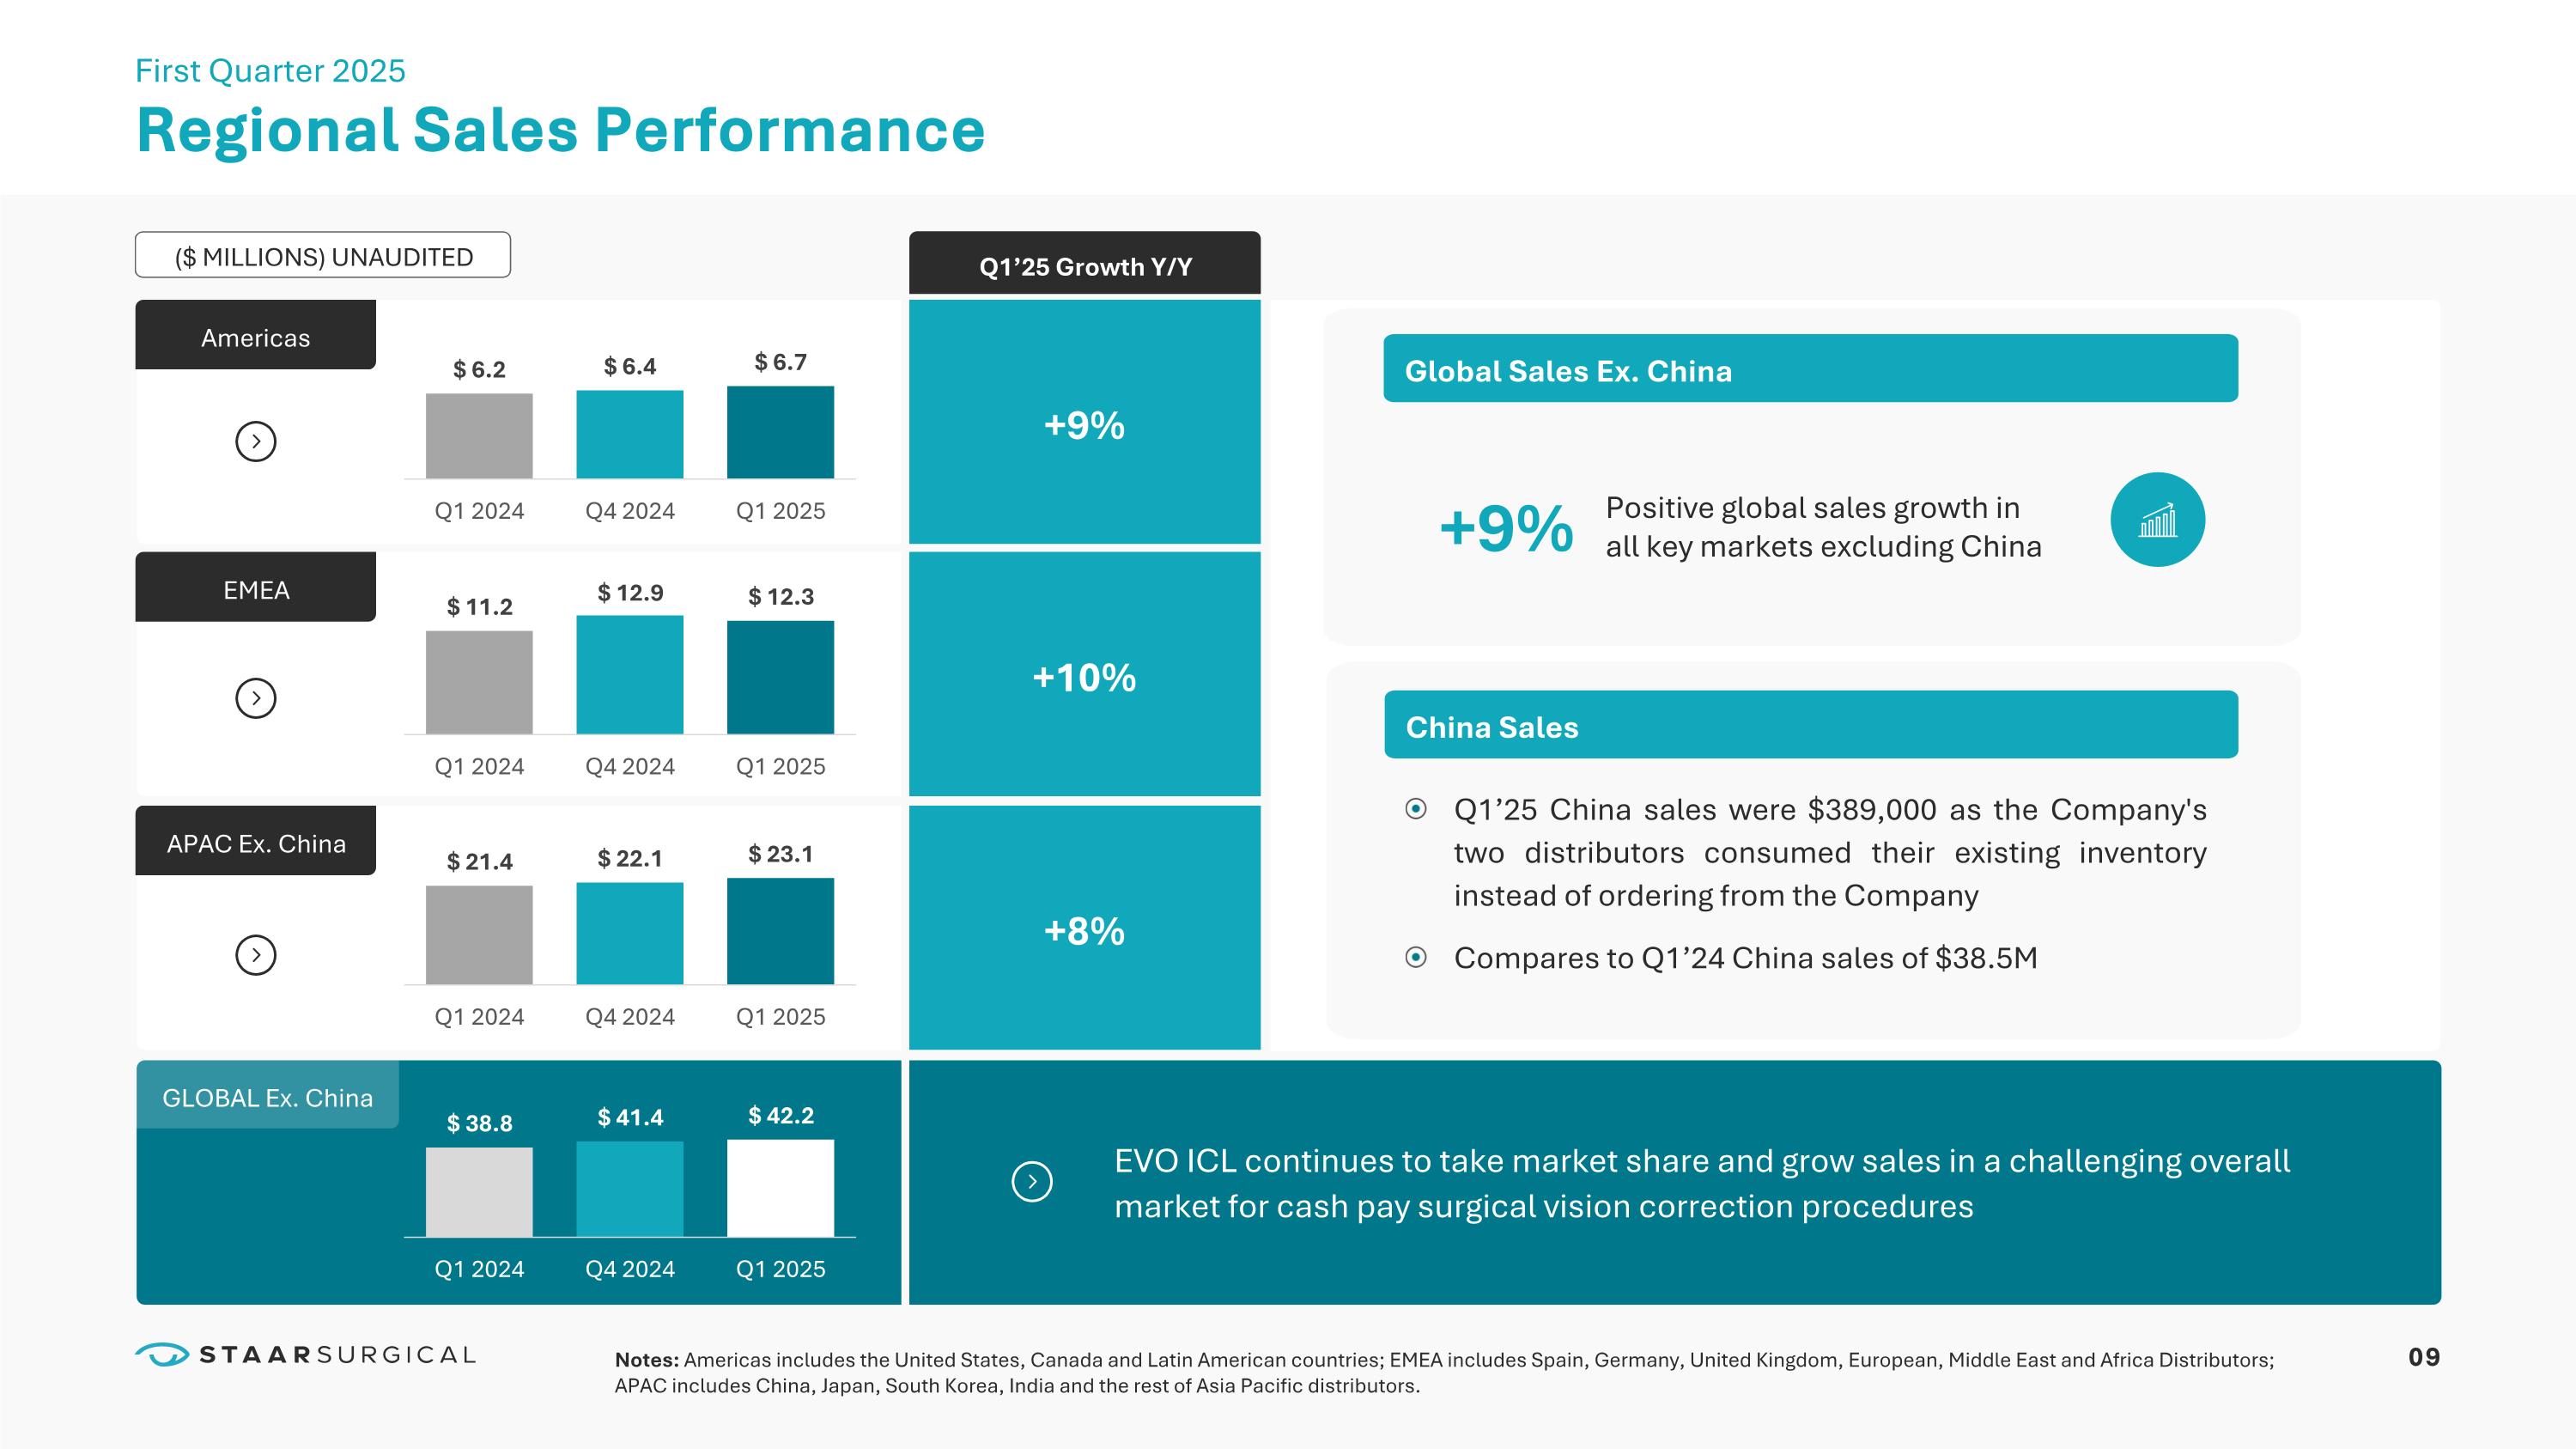
09 Notes: Americas includes the United States, Canada and Latin American countries; EMEA includes Spain, Germany, United Kingdom, European, Middle East and Africa Distributors; APAC includes China, Japan, South Korea, India and the rest of Asia Pacific distributors. Americas EMEA APAC Ex. China GLOBAL Ex. China ($ MILLIONS) UNAUDITED EVO ICL continues to take market share and grow sales in a challenging overall market for cash pay surgical vision correction procedures Q1’25 Growth Y/Y +9% +9% +10% +8% Regional Sales Performance First Quarter 2025 China Sales Global Sales Ex. China Q1’25 China sales were $389,000 as the Company's two distributors consumed their existing inventory instead of ordering from the Company
Compares to Q1’24 China sales of $38.5M Positive global sales growth in all key markets excluding China
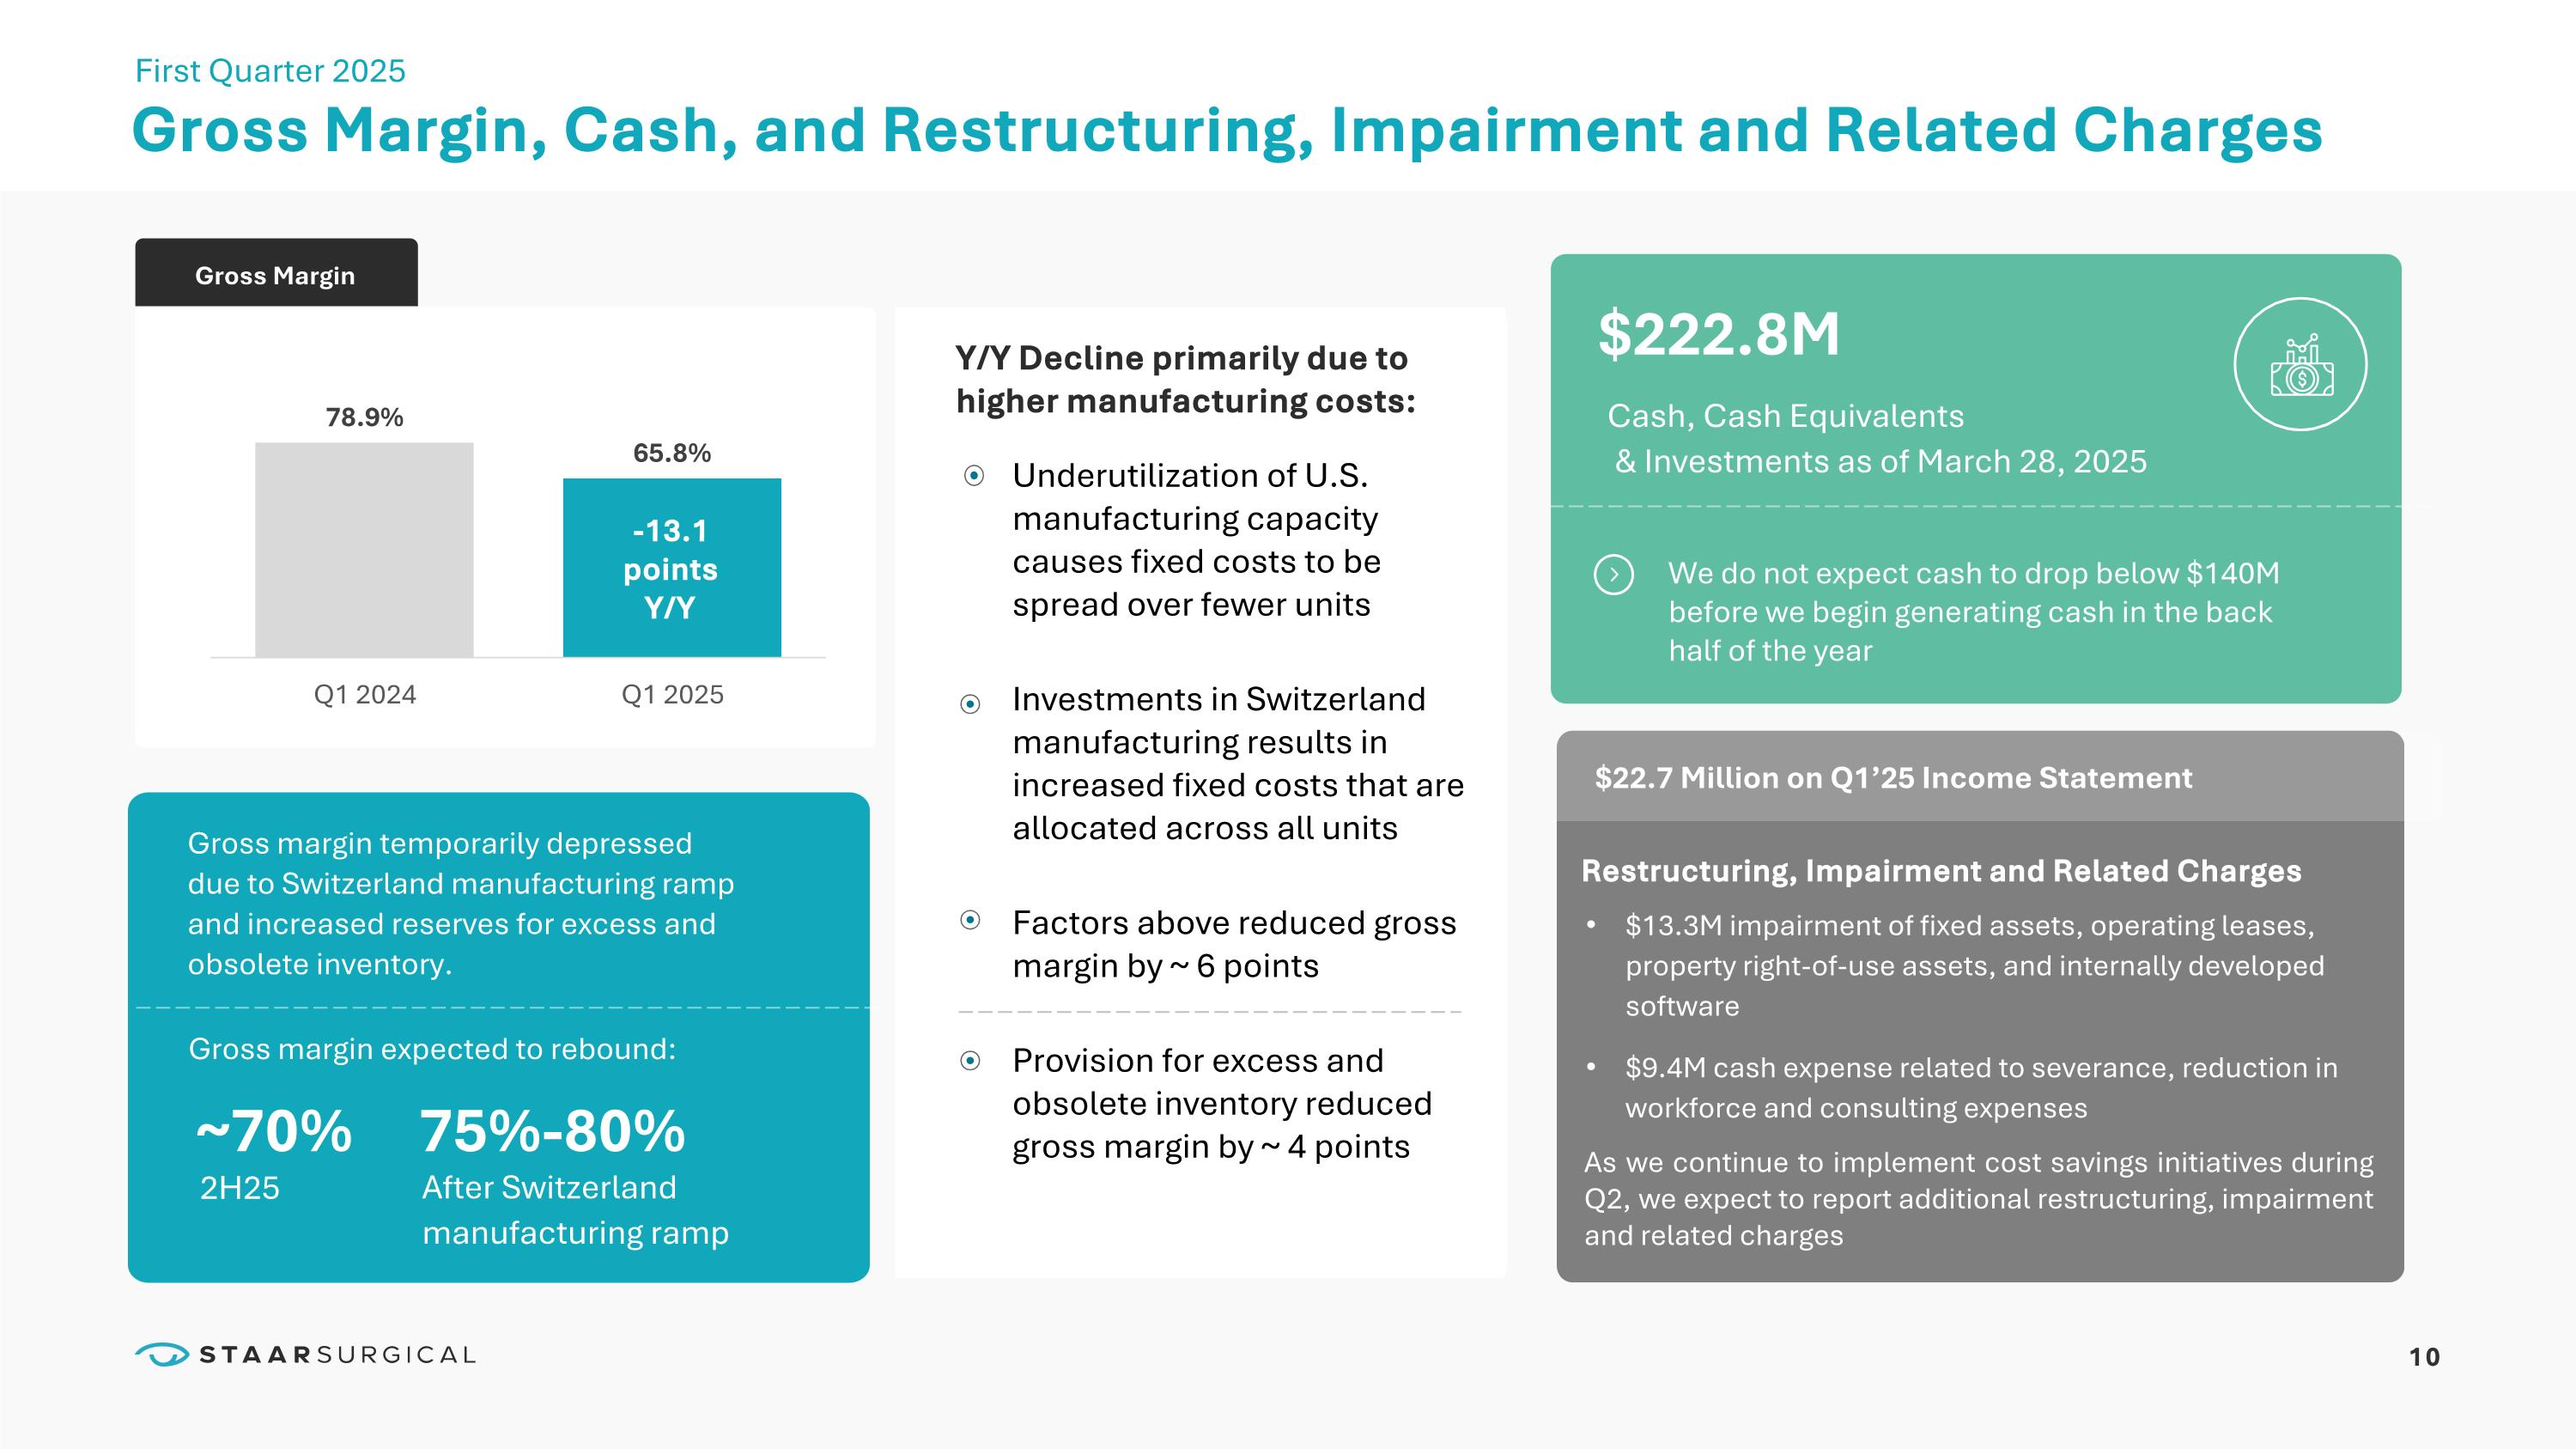
Gross Margin, Cash, and Restructuring, Impairment and Related Charges First Quarter 2025 Gross Margin ~70% 75%-80% 2H25 Gross margin temporarily depressed due to Switzerland manufacturing ramp and increased reserves for excess and obsolete inventory. $22.7 Million on Q1’25 Income Statement Restructuring, Impairment and Related Charges $13.3M impairment of fixed assets, operating leases, property right-of-use assets, and internally developed software $9.4M cash expense related to severance, reduction in workforce and consulting expenses $222.8M Cash, Cash Equivalents � & Investments as of March 28, 2025 Underutilization of U.S. manufacturing capacity causes fixed costs to be spread over fewer units Investments in Switzerland manufacturing results in increased fixed costs that are allocated across all units Factors above reduced gross margin by ~ 6 points Provision for excess and obsolete inventory reduced gross margin by ~ 4 points Y/Y Decline primarily due to higher manufacturing costs: We do not expect cash to drop below $140M before we begin generating cash in the back half of the year -13.1 points Y/Y After Switzerland manufacturing ramp As we continue to implement cost savings initiatives during Q2, we expect to report additional restructuring, impairment and related charges 10 Gross margin expected to rebound:
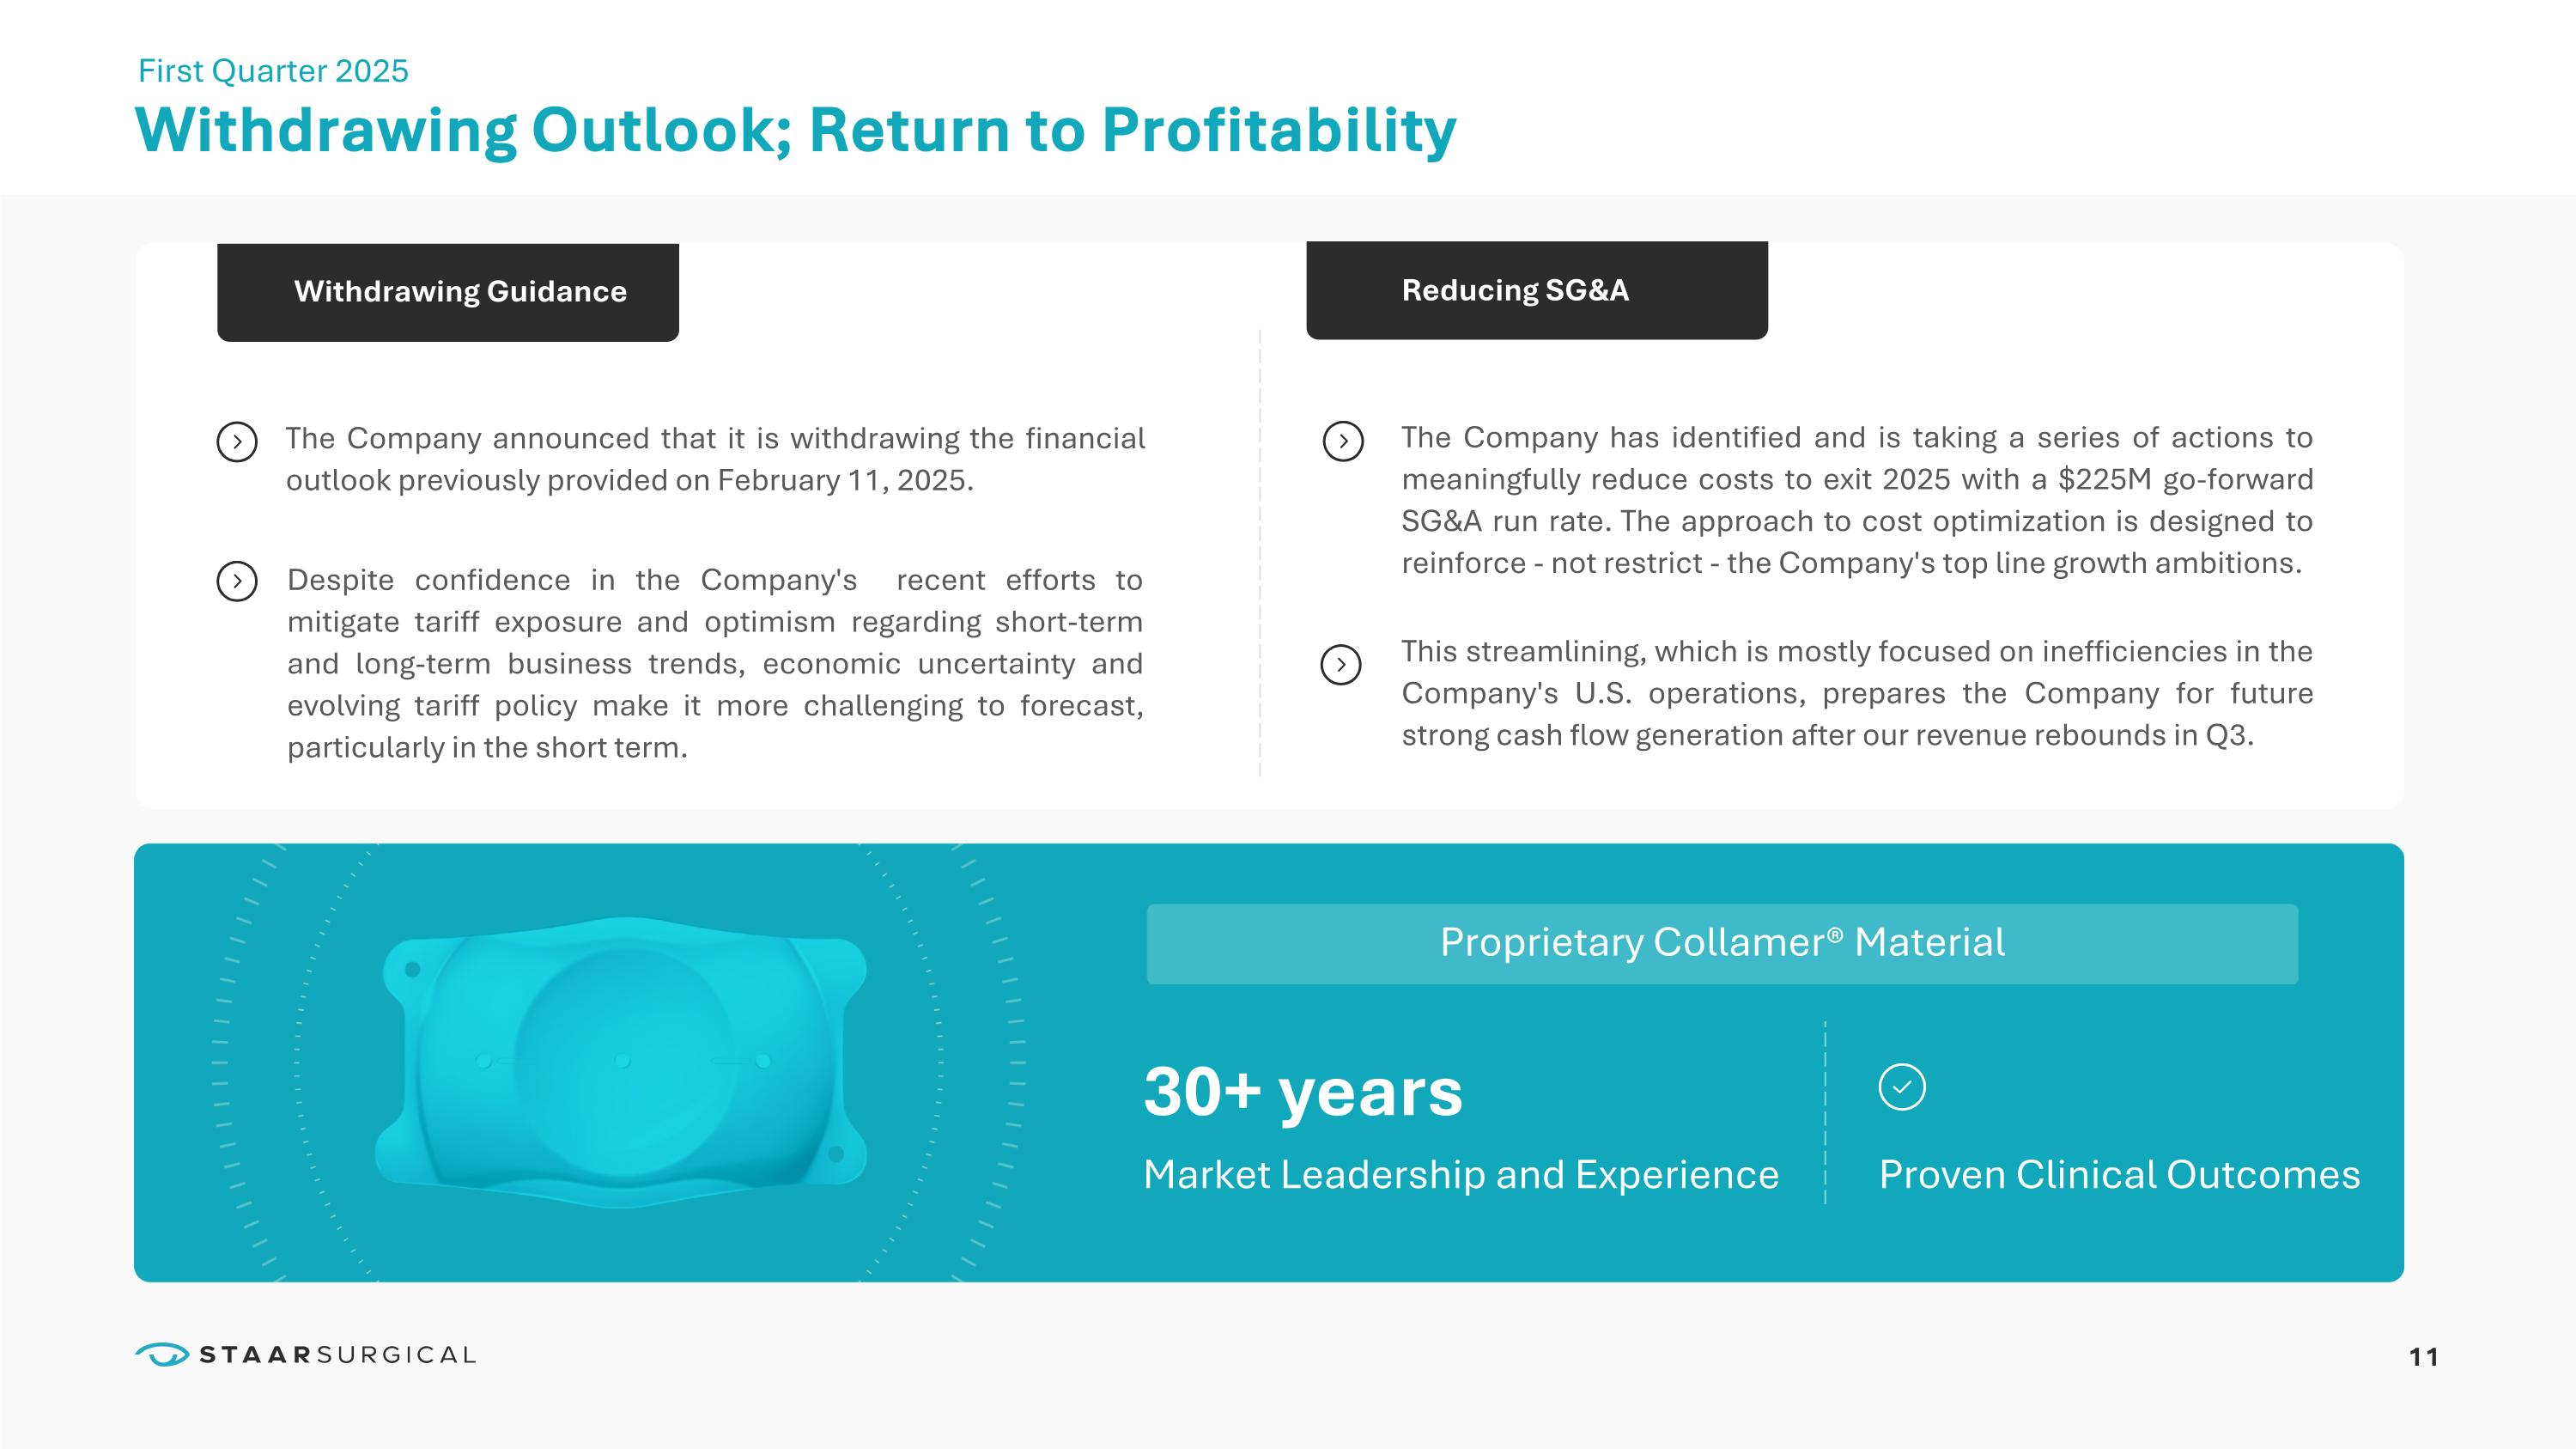
11 Withdrawing Outlook; Return to Profitability First Quarter 2025 The Company announced that it is withdrawing the financial outlook previously provided on February 11, 2025. Withdrawing Guidance Proprietary Collamer® Material 30+ years Market Leadership and Experience Proven Clinical Outcomes The Company has identified and is taking a series of actions to meaningfully reduce costs to exit 2025 with a $225M go-forward SG&A run rate. The approach to cost optimization is designed to reinforce - not restrict - the Company's top line growth ambitions. This streamlining, which is mostly focused on inefficiencies in the Company's U.S. operations, prepares the Company for future strong cash flow generation after our revenue rebounds in Q3. Despite confidence in the Company's recent efforts to mitigate tariff exposure and optimism regarding short-term and long-term business trends, economic uncertainty and evolving tariff policy make it more challenging to forecast, particularly in the short term. Reducing SG&A
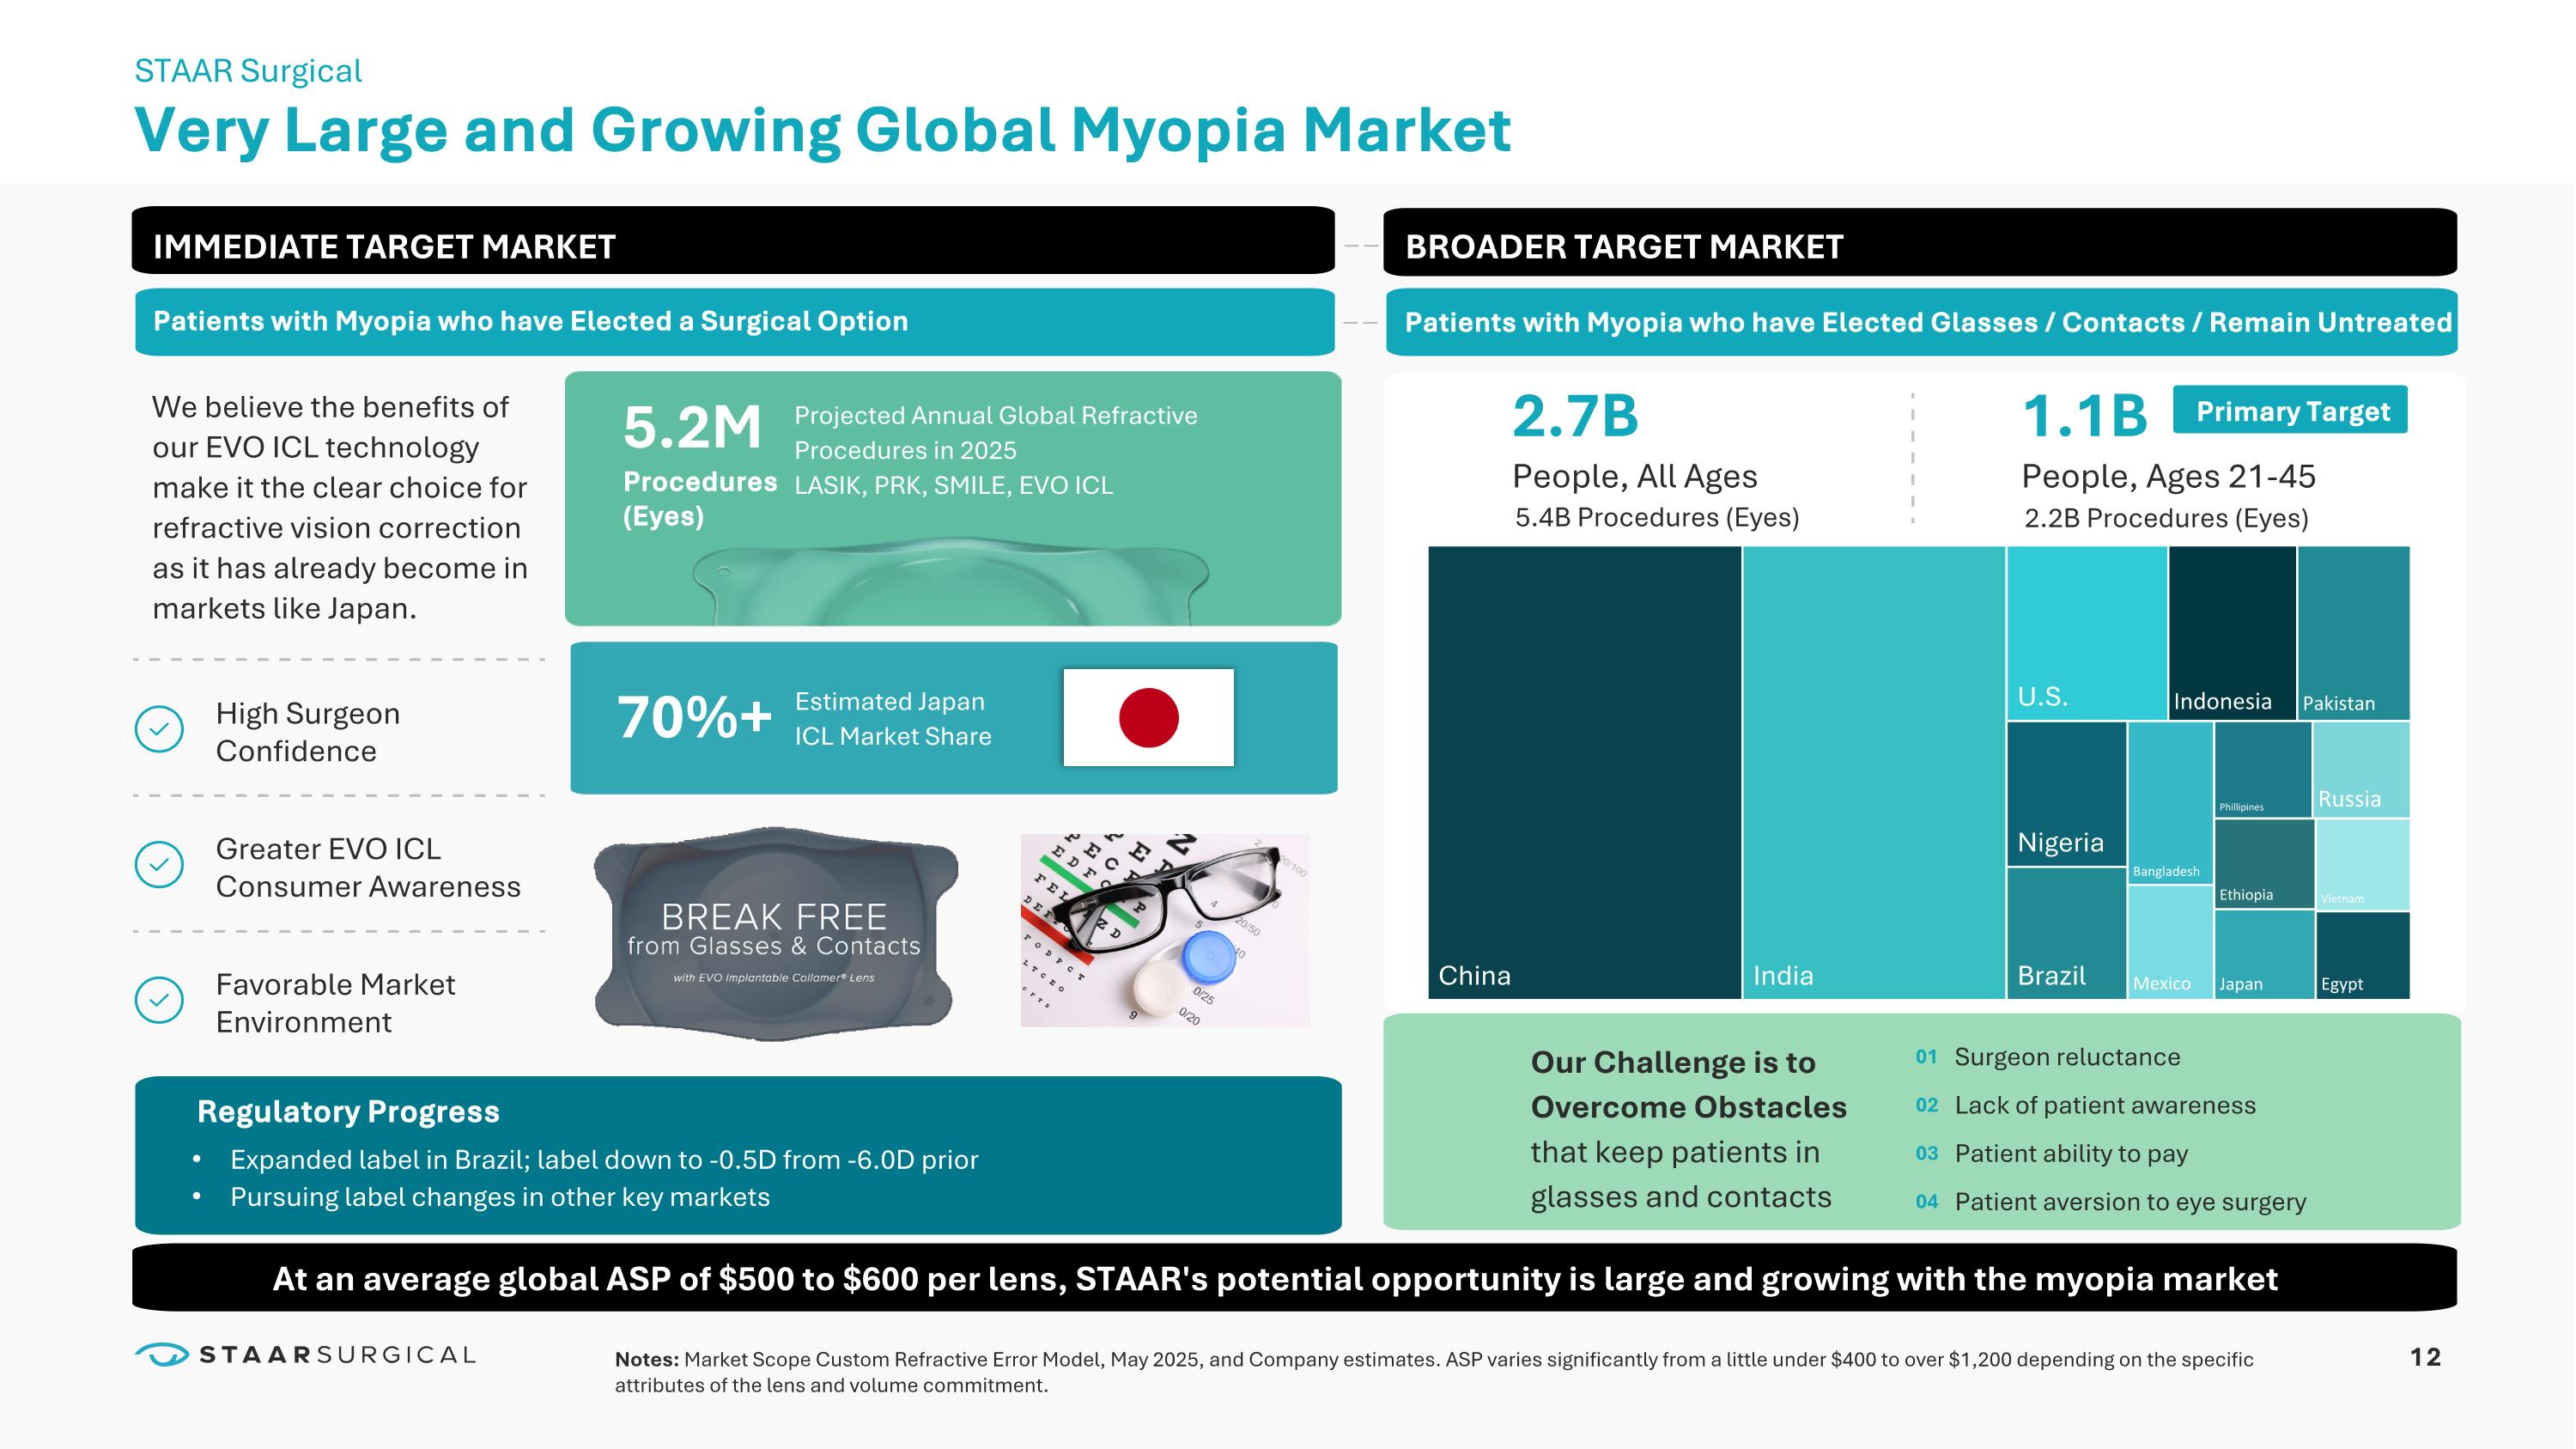
12 Very Large and Growing Global Myopia Market STAAR Surgical 2.7B People, All Ages 1.1B People, Ages 21-45 IMMEDIATE TARGET MARKET We believe the benefits of our EVO ICL technology make it the clear choice for refractive vision correction as it has already become in markets like Japan. High Surgeon Confidence Greater EVO ICL Consumer Awareness Favorable Market Environment Notes: Market Scope Custom Refractive Error Model, May 2025, and Company estimates. ASP varies significantly from a little under $400 to over $1,200 depending on the specific attributes of the lens and volume commitment. 70%+ Estimated Japan ICL Market Share 5.2M Procedures (Eyes) Projected Annual Global Refractive Procedures in 2025 Expanded label in Brazil; label down to -0.5D from -6.0D prior
Pursuing label changes in other key markets Surgeon reluctance
Lack of patient awareness
Patient ability to pay
Patient aversion to eye surgery 01
02
03
04 LASIK, PRK, SMILE, EVO ICL Patients with Myopia who have Elected a Surgical Option BROADER TARGET MARKET Patients with Myopia who have Elected Glasses / Contacts / Remain Untreated Primary Target Our Challenge is to Overcome Obstacles that keep patients in glasses and contacts Regulatory Progress 5.4B Procedures (Eyes) 2.2B Procedures (Eyes) At an average global ASP of $500 to $600 per lens, STAAR's potential opportunity is large and growing with the myopia market
13 STAAR SURGICAL FIRST QUARTER 2025 EARNINGS CALL AND WEBCAST Q&A
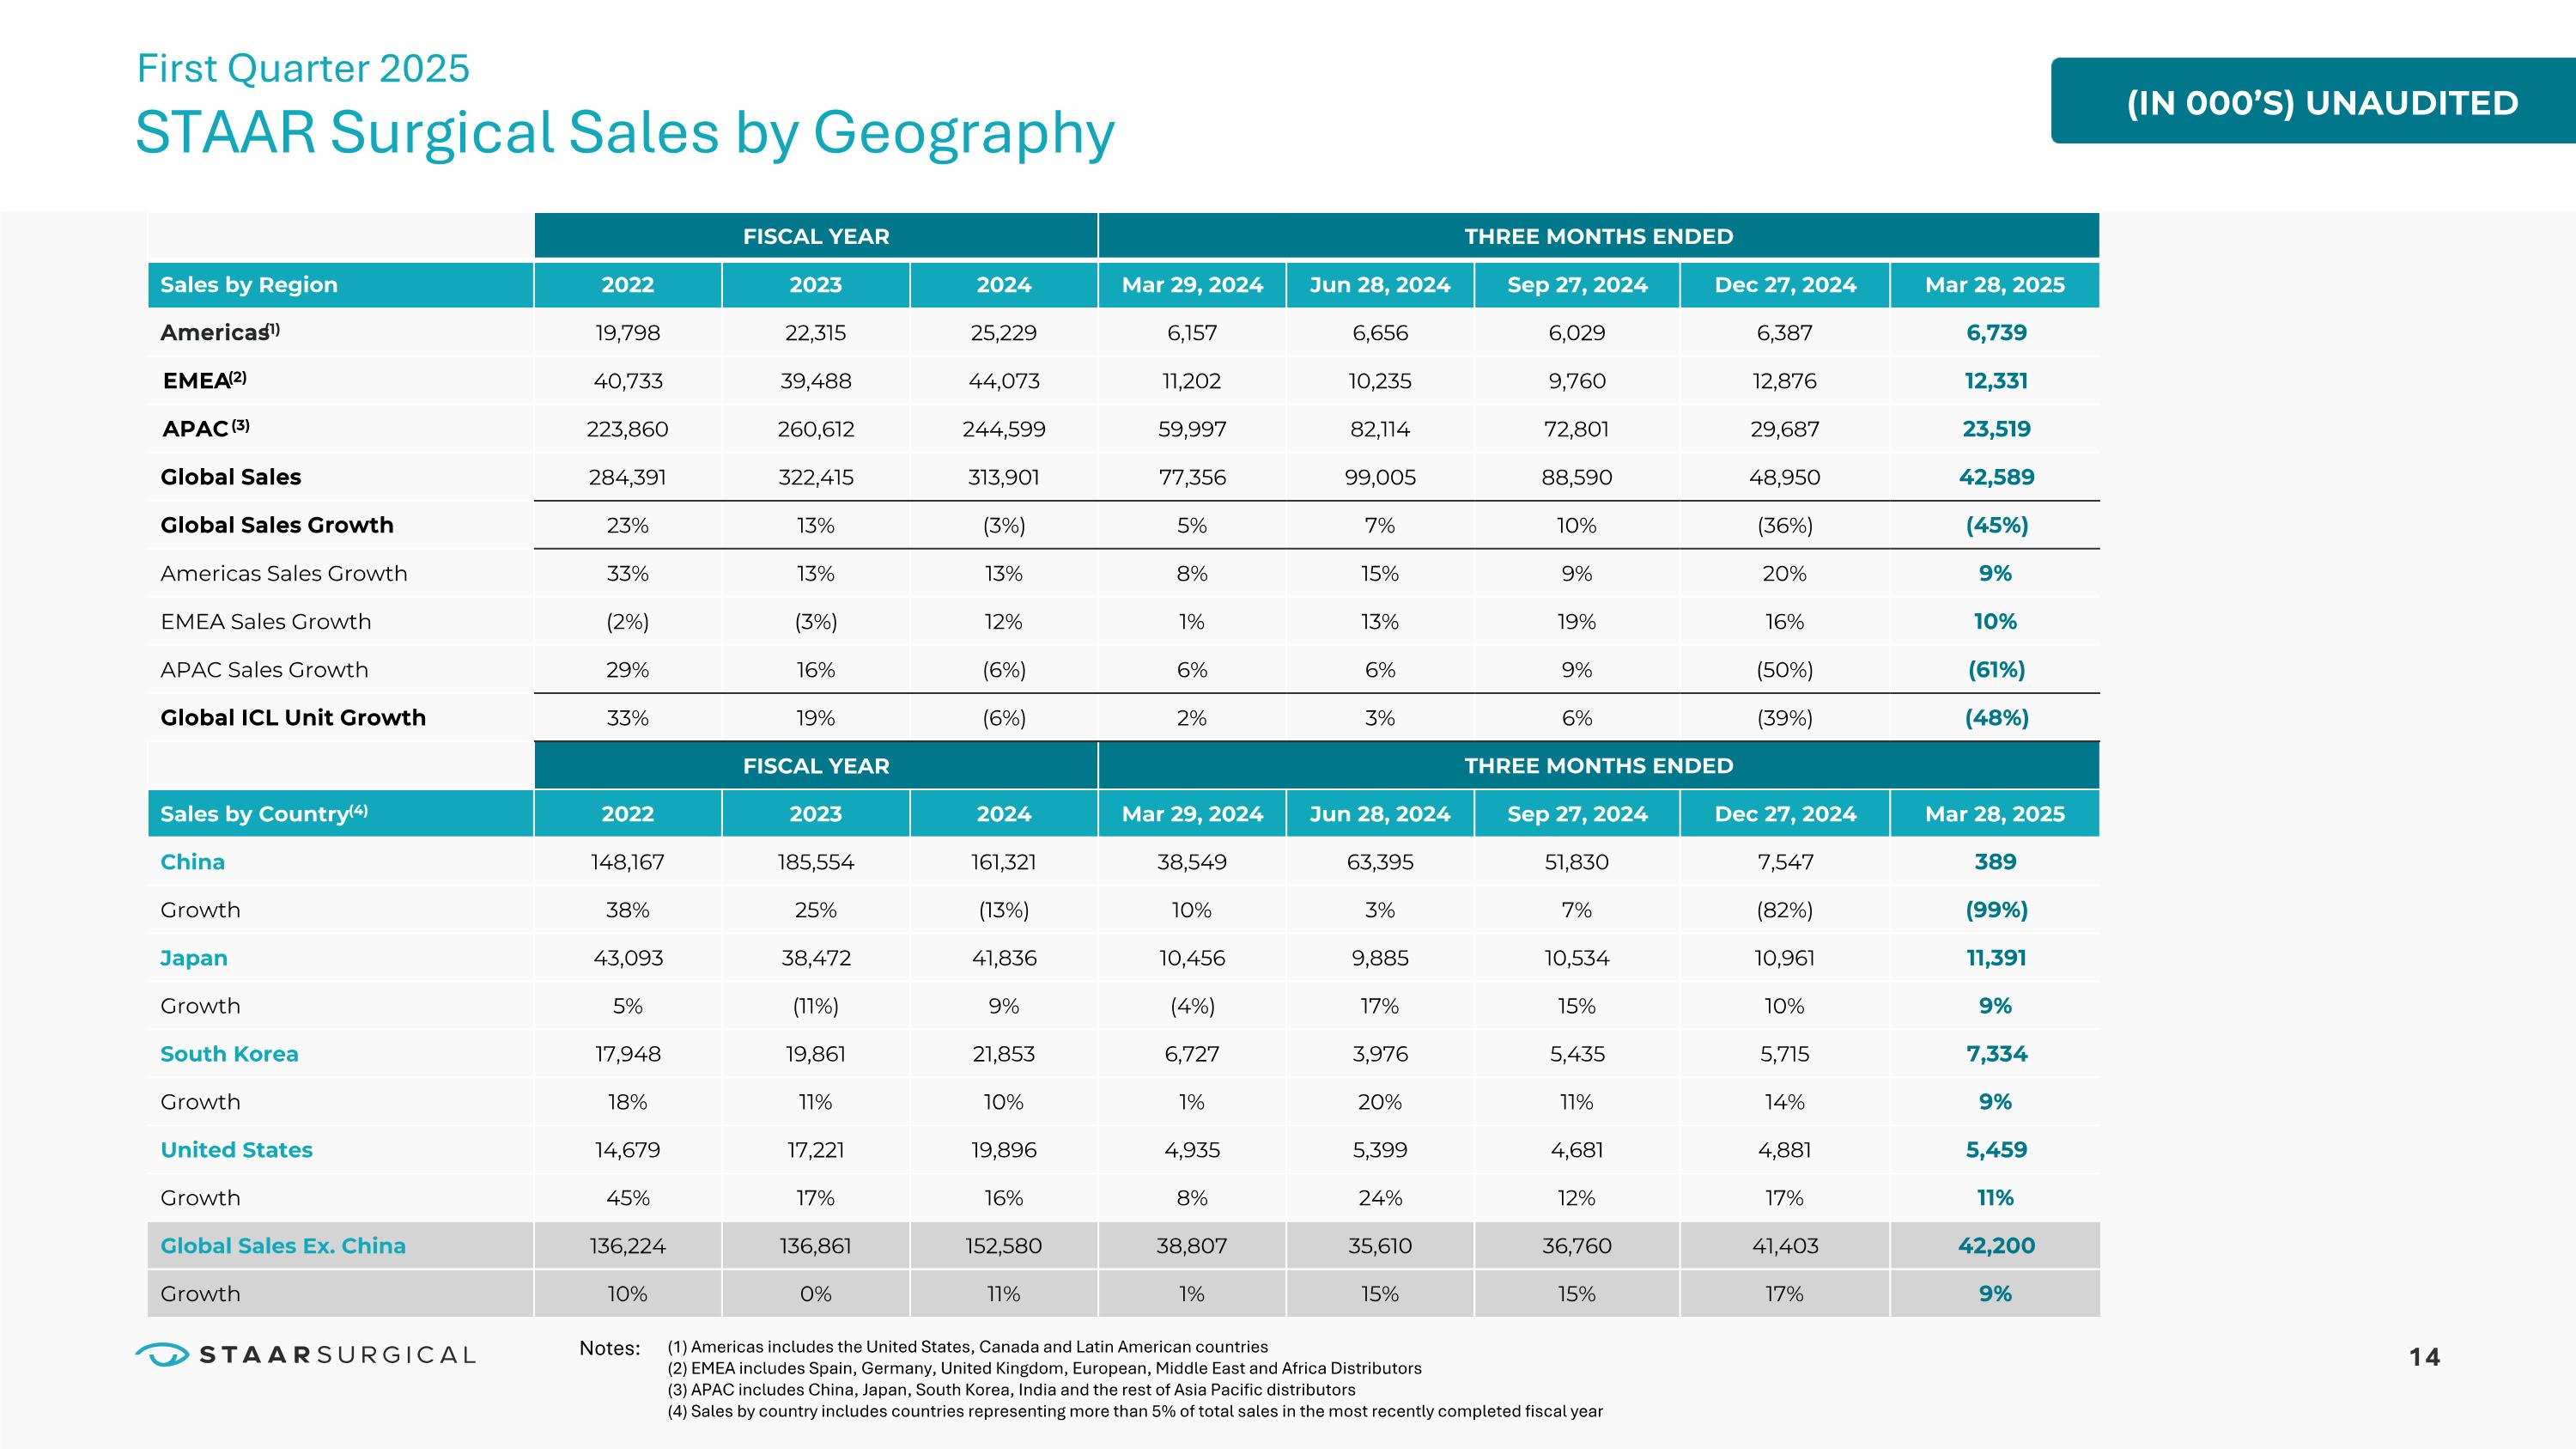
14 FISCAL YEAR THREE MONTHS ENDED Sales by Region 2022 2023 2024 Mar 29, 2024 Jun 28, 2024 Sep 27, 2024 Dec 27, 2024 Mar 28, 2025 Americas(1) 19,798 22,315 25,229 6,157 6,656 6,029 6,387 6,739 EMEA(2) 40,733 39,488 44,073 11,202 10,235 9,760 12,876 12,331 APAC (3) 223,860 260,612 244,599 59,997 82,114 72,801 29,687 23,519 Global Sales 284,391 322,415 313,901 77,356 99,005 88,590 48,950 42,589 Global Sales Growth 23% 13% (3%) 5% 7% 10% (36%) (45%) Americas Sales Growth 33% 13% 13% 8% 15% 9% 20% 9% EMEA Sales Growth (2%) (3%) 12% 1% 13% 19% 16% 10% APAC Sales Growth 29% 16% (6%) 6% 6% 9% (50%) (61%) Global ICL Unit Growth 33% 19% (6%) 2% 3% 6% (39%) (48%) FISCAL YEAR THREE MONTHS ENDED Sales by Country(4) 2022 2023 2024 Mar 29, 2024 Jun 28, 2024 Sep 27, 2024 Dec 27, 2024 Mar 28, 2025 China 148,167 185,554 161,321 38,549 63,395 51,830 7,547 389 Growth 38% 25% (13%) 10% 3% 7% (82%) (99%) Japan 43,093 38,472 41,836 10,456 9,885 10,534 10,961 11,391 Growth 5% (11%) 9% (4%) 17% 15% 10% 9% South Korea 17,948 19,861 21,853 6,727 3,976 5,435 5,715 7,334 Growth 18% 11% 10% 1% 20% 11% 14% 9% United States 14,679 17,221 19,896 4,935 5,399 4,681 4,881 5,459 Growth 45% 17% 16% 8% 24% 12% 17% 11% Global Sales Ex. China 136,224 136,861 152,580 38,807 35,610 36,760 41,403 42,200 Growth 10% 0% 11% 1% 15% 15% 17% 9% (IN 000’S) UNAUDITED STAAR Surgical Sales by Geography First Quarter 2025 (1) Americas includes the United States, Canada and Latin American countries (2) EMEA includes Spain, Germany, United Kingdom, European, Middle East and Africa Distributors (3) APAC includes China, Japan, South Korea, India and the rest of Asia Pacific distributors (4) Sales by country includes countries representing more than 5% of total sales in the most recently completed fiscal year Notes:
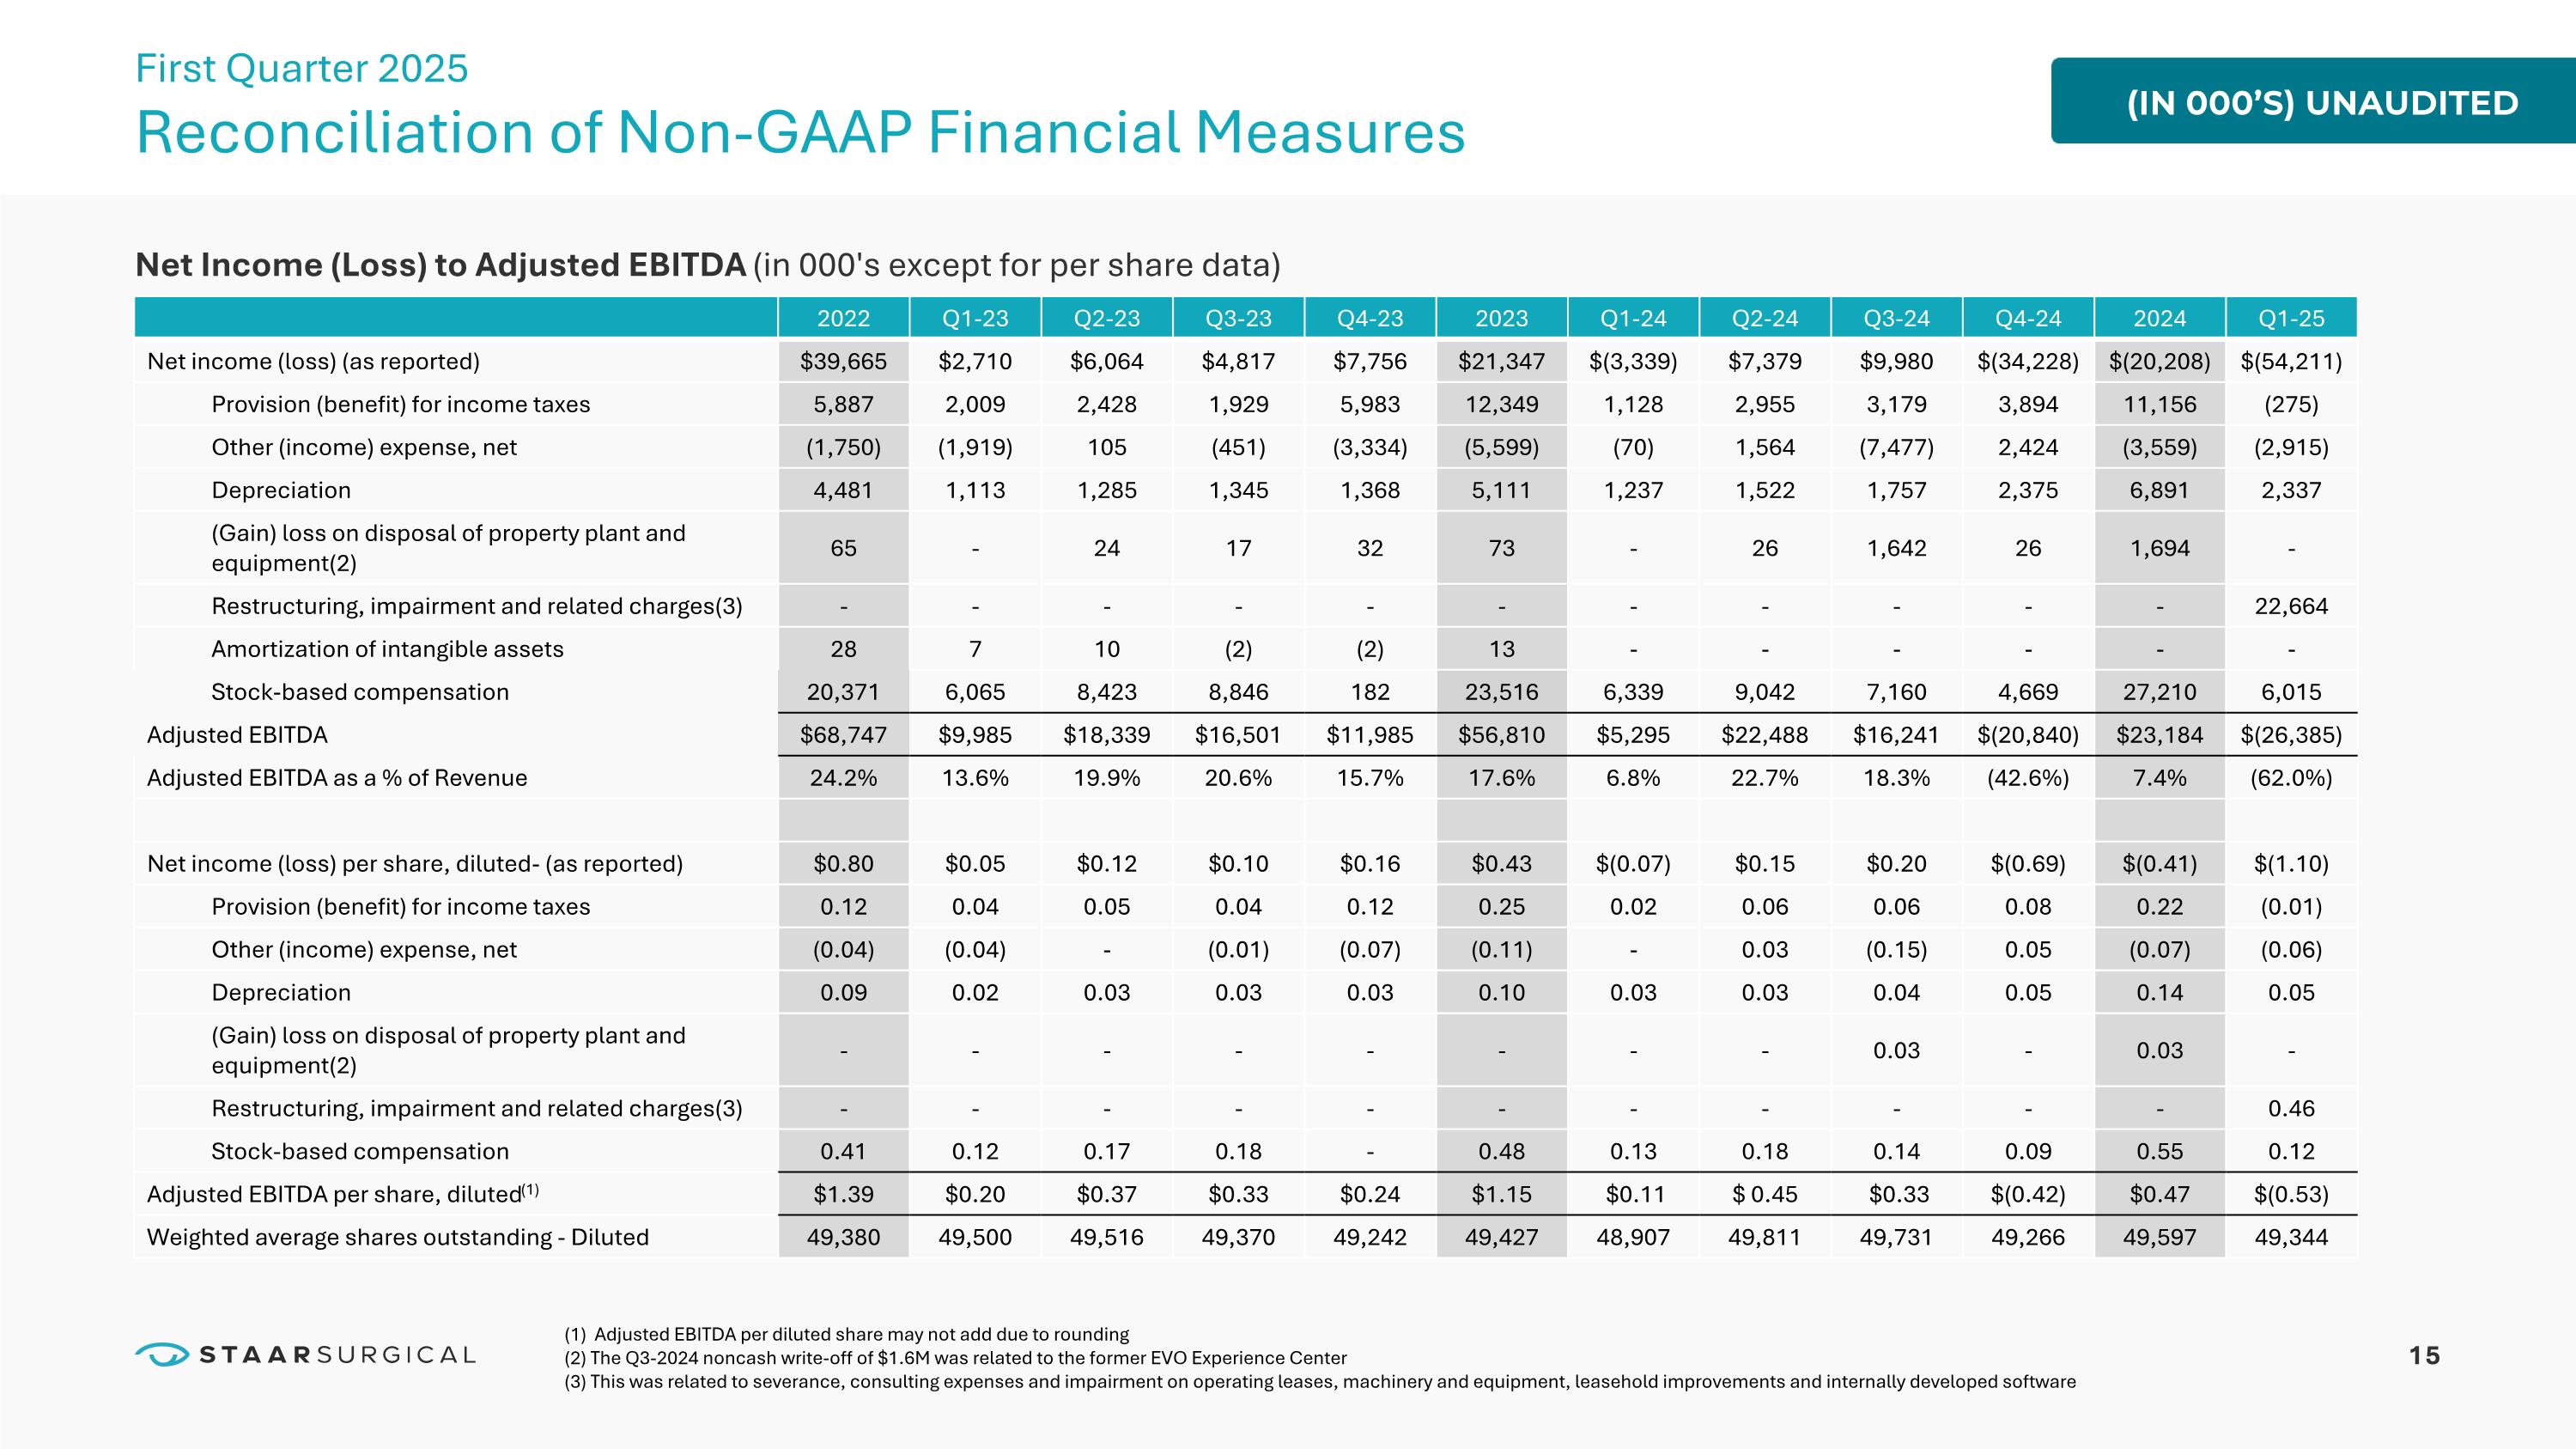
15 Net Income (Loss) to Adjusted EBITDA (in 000's except for per share data) 2022 Q1-23 Q2-23 Q3-23 Q4-23 2023 Q1-24 Q2-24 Q3-24 Q4-24 2024 Q1-25 Net income (loss) (as reported) $39,665 $2,710 $6,064 $4,817 $7,756 $21,347 $(3,339) $7,379 $9,980 $(34,228) $(20,208) $(54,211) Provision (benefit) for income taxes 5,887 2,009 2,428 1,929 5,983 12,349 1,128 2,955 3,179 3,894 11,156 (275) Other (income) expense, net (1,750) (1,919) 105 (451) (3,334) (5,599) (70) 1,564 (7,477) 2,424 (3,559) (2,915) Depreciation 4,481 1,113 1,285 1,345 1,368 5,111 1,237 1,522 1,757 2,375 6,891 2,337 (Gain) loss on disposal of property plant and equipment(2) 65 - 24 17 32 73 - 26 1,642 26 1,694 - Restructuring, impairment and related charges(3) - - - - - - - - - - - 22,664 Amortization of intangible assets 28 7 10 (2) (2) 13 - - - - - - Stock-based compensation 20,371 6,065 8,423 8,846 182 23,516 6,339 9,042 7,160 4,669 27,210 6,015 Adjusted EBITDA $68,747 $9,985 $18,339 $16,501 $11,985 $56,810 $5,295 $22,488 $16,241 $(20,840) $23,184 $(26,385) Adjusted EBITDA as a % of Revenue 24.2% 13.6% 19.9% 20.6% 15.7% 17.6% 6.8% 22.7% 18.3% (42.6%) 7.4% (62.0%) Net income (loss) per share, diluted- (as reported) $0.80 $0.05 $0.12 $0.10 $0.16 $0.43 $(0.07) $0.15 $0.20 $(0.69) $(0.41) $(1.10) Provision (benefit) for income taxes 0.12 0.04 0.05 0.04 0.12 0.25 0.02 0.06 0.06 0.08 0.22 (0.01) Other (income) expense, net (0.04) (0.04) - (0.01) (0.07) (0.11) - 0.03 (0.15) 0.05 (0.07) (0.06) Depreciation 0.09 0.02 0.03 0.03 0.03 0.10 0.03 0.03 0.04 0.05 0.14 0.05 (Gain) loss on disposal of property plant and equipment(2) - - - - - - - - 0.03 - 0.03 - Restructuring, impairment and related charges(3) - - - - - - - - - - - 0.46 Stock-based compensation 0.41 0.12 0.17 0.18 - 0.48 0.13 0.18 0.14 0.09 0.55 0.12 Adjusted EBITDA per share, diluted(1) $1.39 $0.20 $0.37 $0.33 $0.24 $1.15 $0.11 $ 0.45 $0.33 $(0.42) $0.47 $(0.53) Weighted average shares outstanding - Diluted 49,380 49,500 49,516 49,370 49,242 49,427 48,907 49,811 49,731 49,266 49,597 49,344 (IN 000’S) UNAUDITED Reconciliation of Non-GAAP Financial Measures First Quarter 2025 (1) Adjusted EBITDA per diluted share may not add due to rounding (2) The Q3-2024 noncash write-off of $1.6M was related to the former EVO Experience Center (3) This was related to severance, consulting expenses and impairment on operating leases, machinery and equipment, leasehold improvements and internally developed software