FOR IMMEDIATE ISSUE
| CONTACTS: | |||||||||||||||||||||||
| For Investors: | For Media: | ||||||||||||||||||||||
| Michaela Pewarski | Beth Sidhu | ||||||||||||||||||||||
| (646) 429-1812 | (202) 423-4414 | ||||||||||||||||||||||
STAGWELL INC. (NASDAQ: STGW) REPORTS RESULTS FOR THE
THREE MONTHS ENDED MARCH 31, 2022
Record first quarter financial results driven by high-growth digital transformation, consumer insights & strategy, and large client wins in media
•GAAP Revenue grew 254.7% in 1Q and 31.5% on a Pro Forma basis
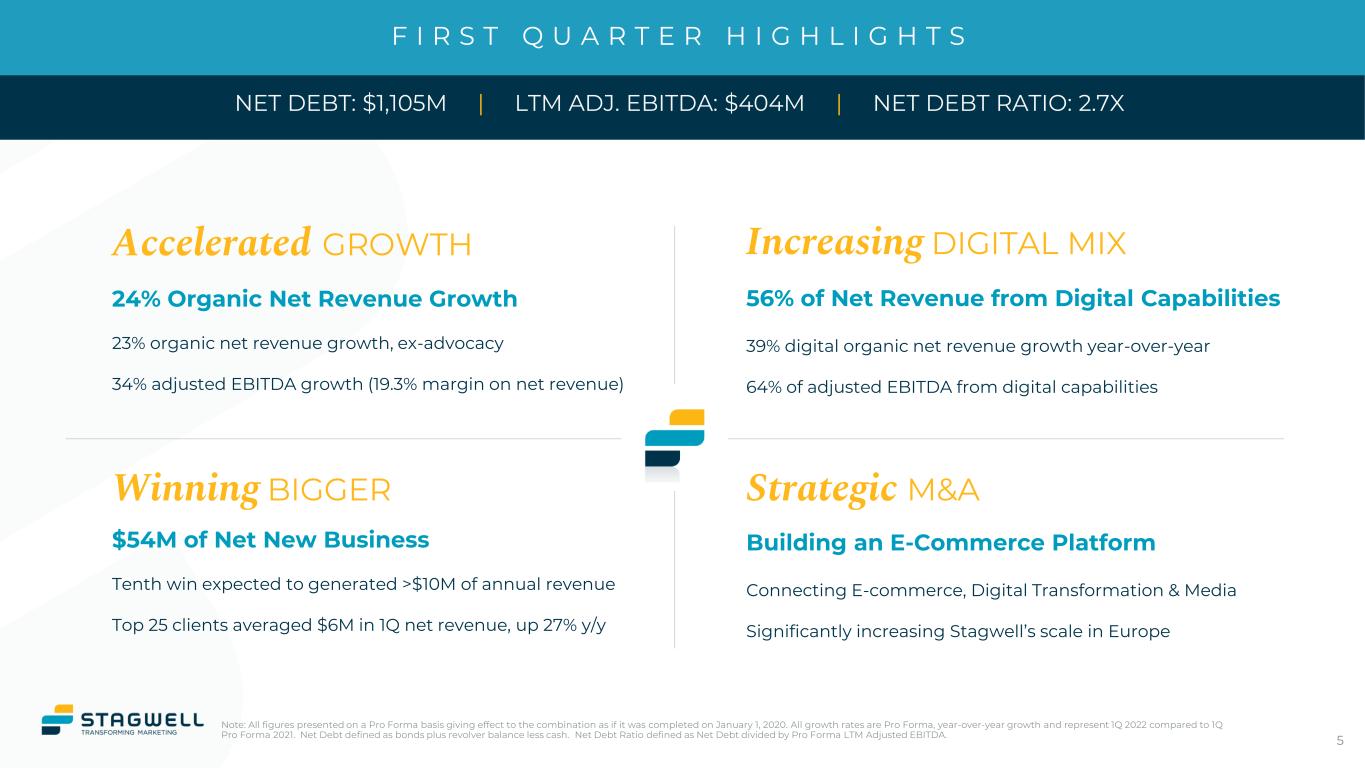
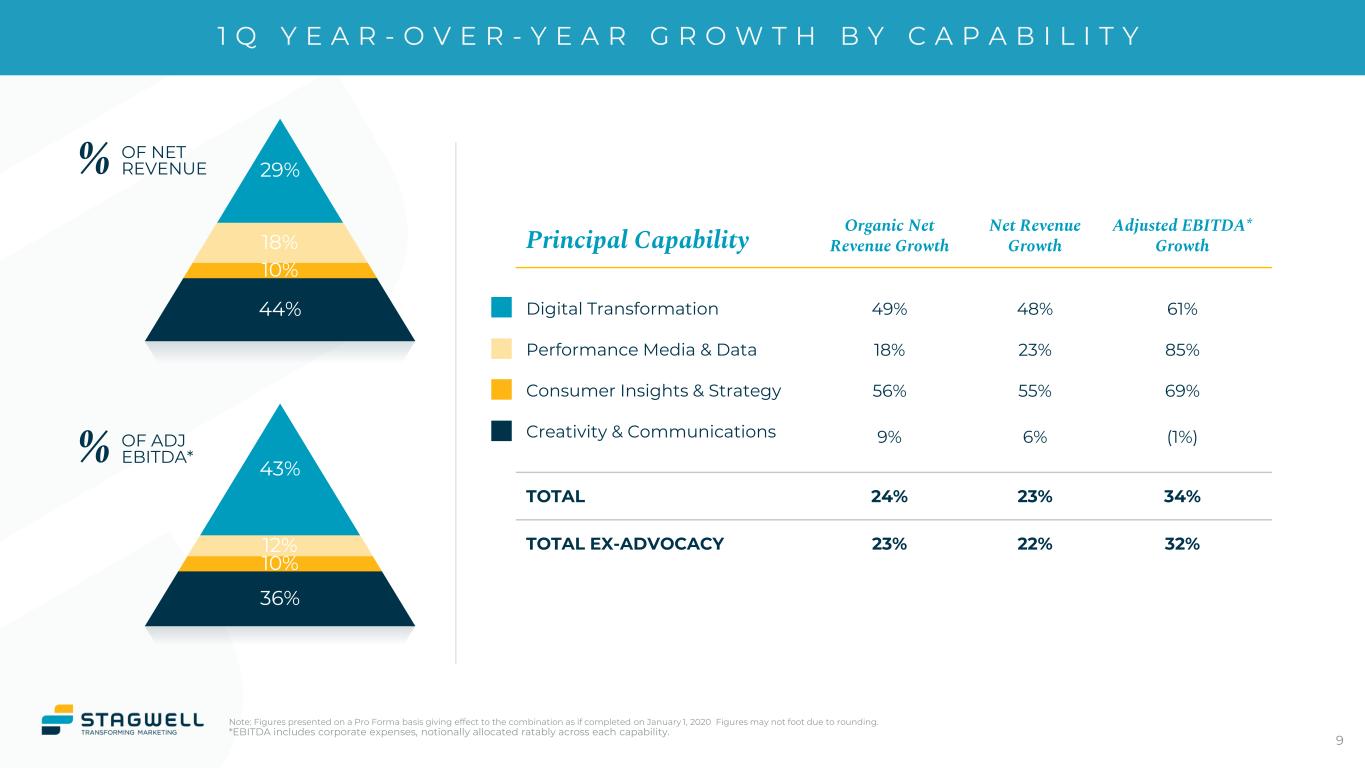
•Pro-Forma Organic Net Revenue grew 23.6% in 1Q
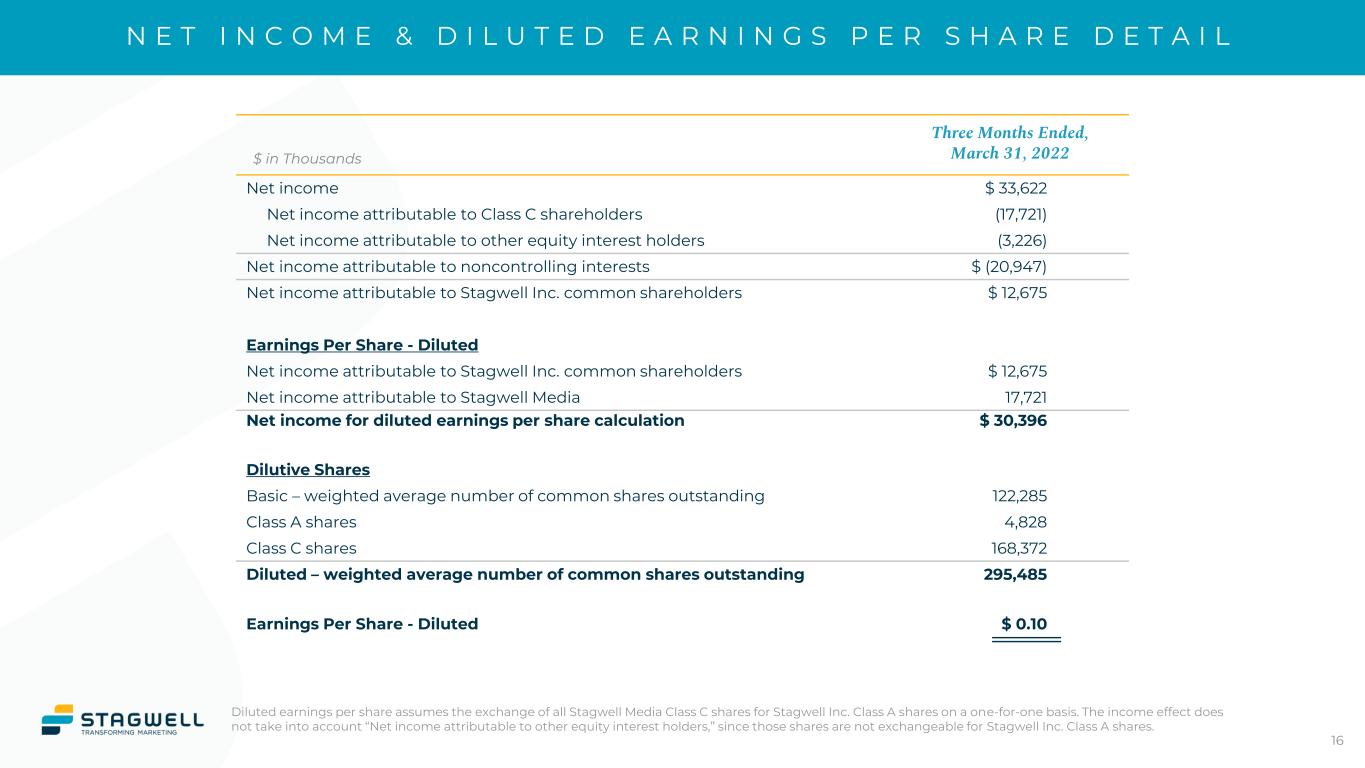
•Net Income of $33.6M in 1Q or Diluted EPS of $0.10 per share
•Net Income attributable to Stagwell of $12.7M in 1Q
•Adjusted EBITDA of $101.4M in 1Q representing a 19.3% margin on Net Revenue
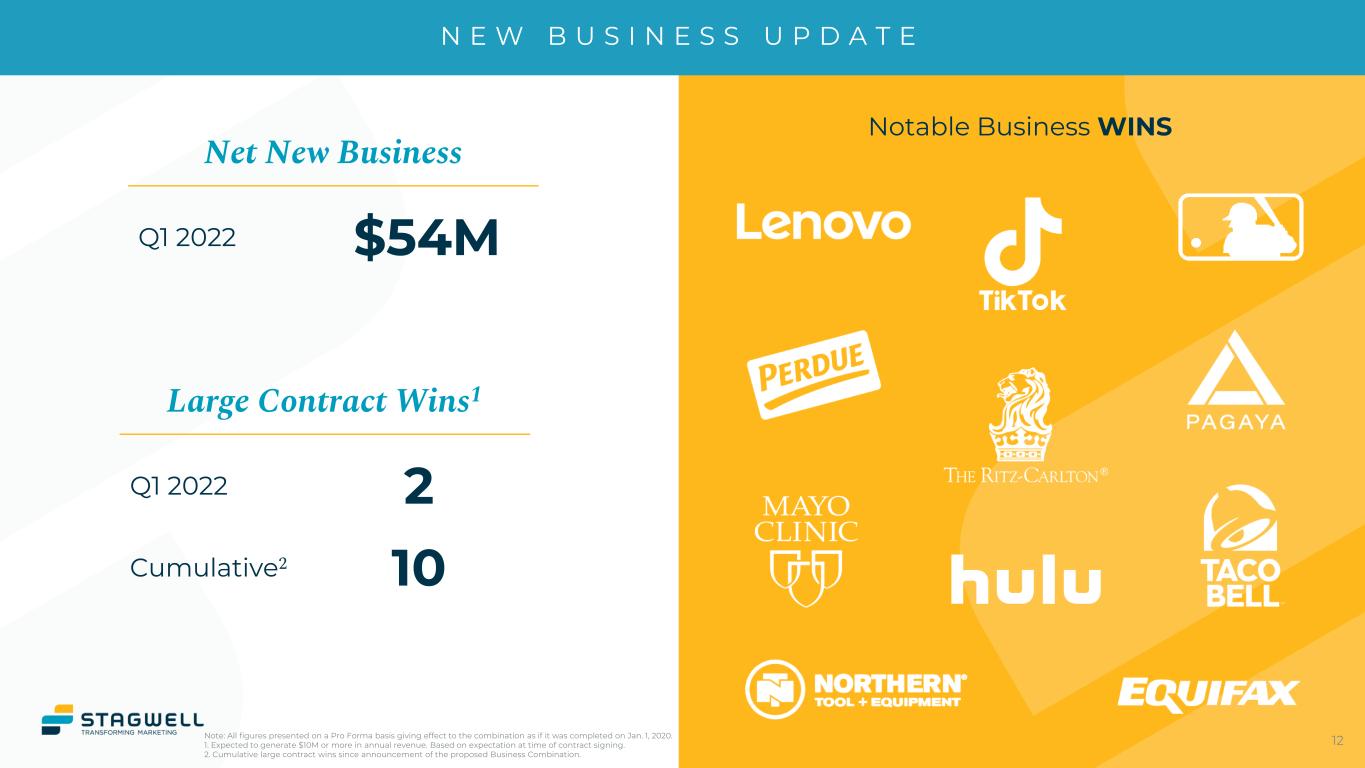
•Record first quarter Net New Business of $54M
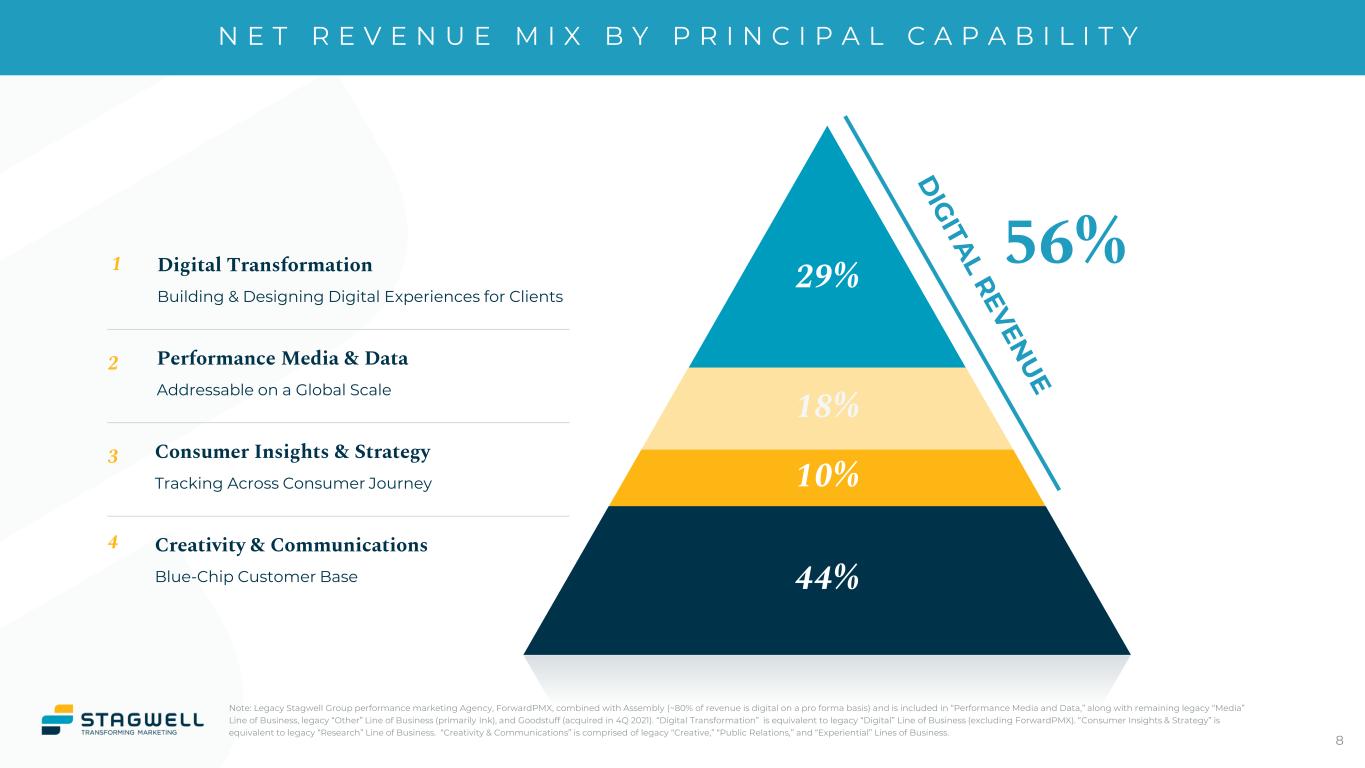
•56% of 1Q Net Revenue came from high-growth digital services
•Reaffirms 2022 full-year outlook
New York, NY, May 6, 2022 (NASDAQ: STGW) – Stagwell Inc. (“Stagwell”) today announced financial results for the three months ended March 31, 2022.
FIRST QUARTER HIGHLIGHTS:
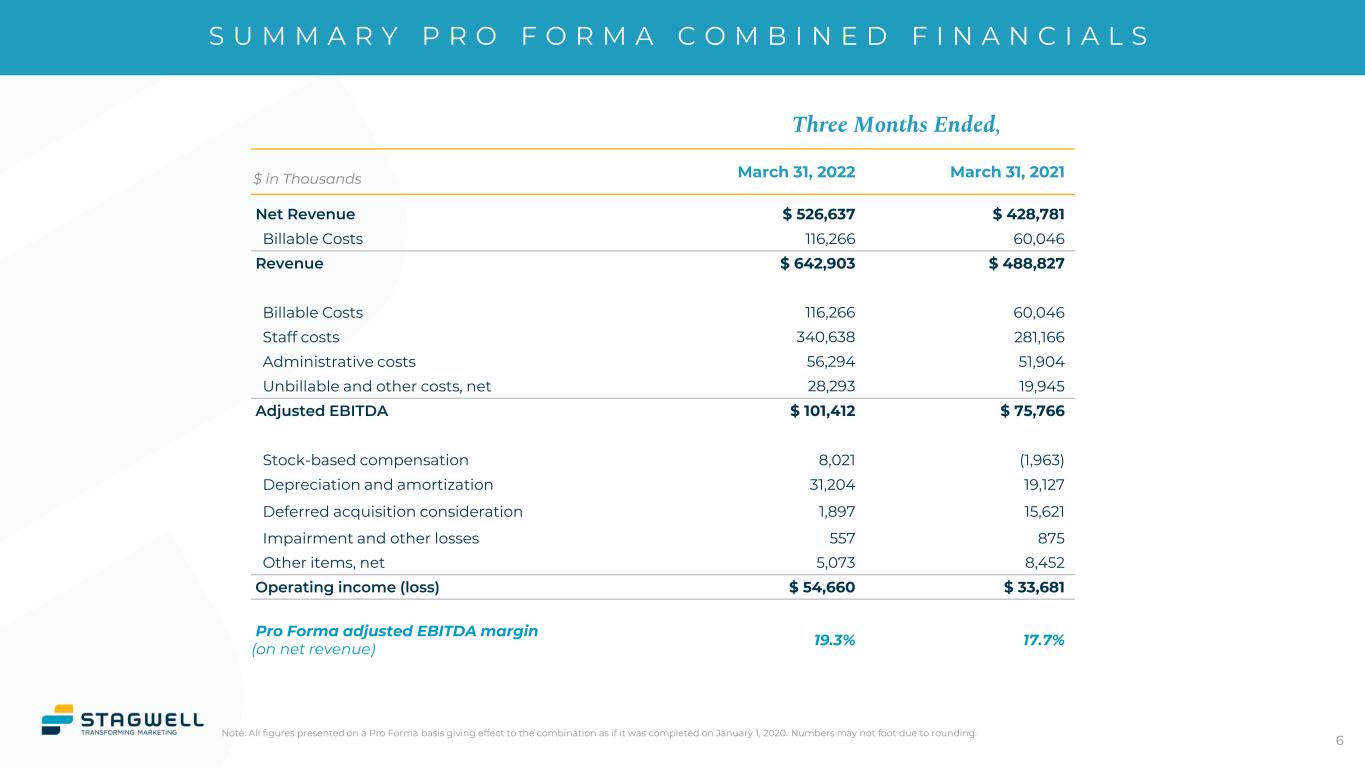
•Revenue of $642.9 million, an increase of 254.7% versus the prior year period.
•Pro Forma GAAP revenue growth of 31.5% versus the prior year period and 30.2% ex-Advocacy.
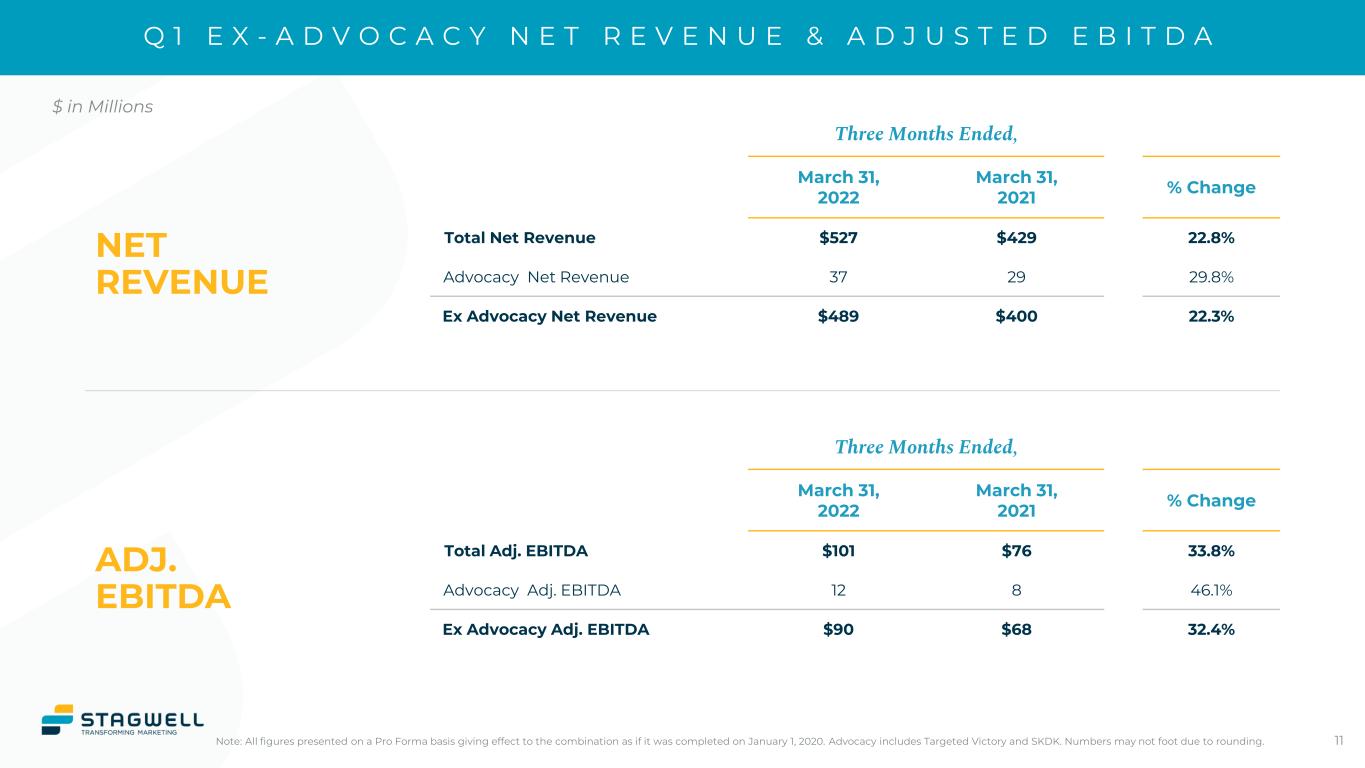
•First quarter net revenue of $526.6 million, an increase of 233.2% versus the prior period.
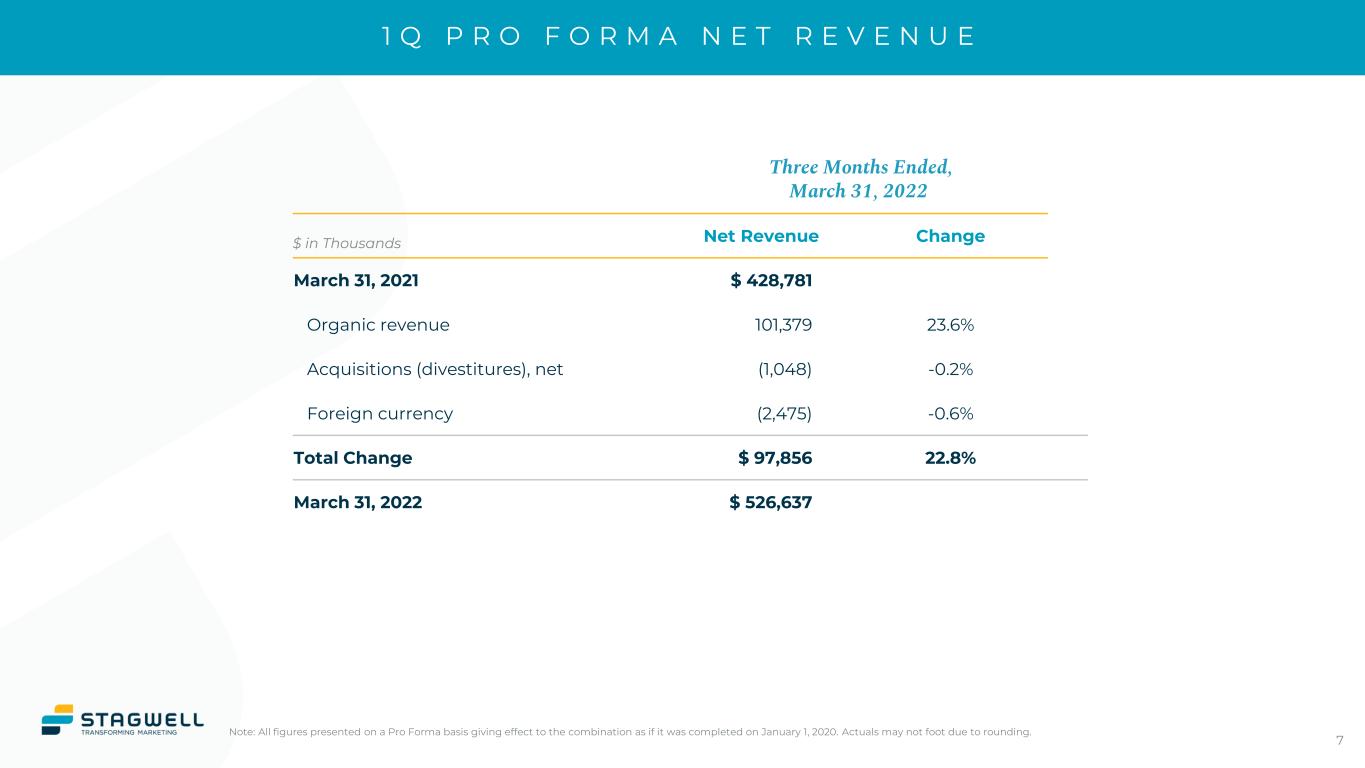
•Pro Forma net revenue growth of 22.8% versus the prior year period and 22.3% ex-Advocacy.
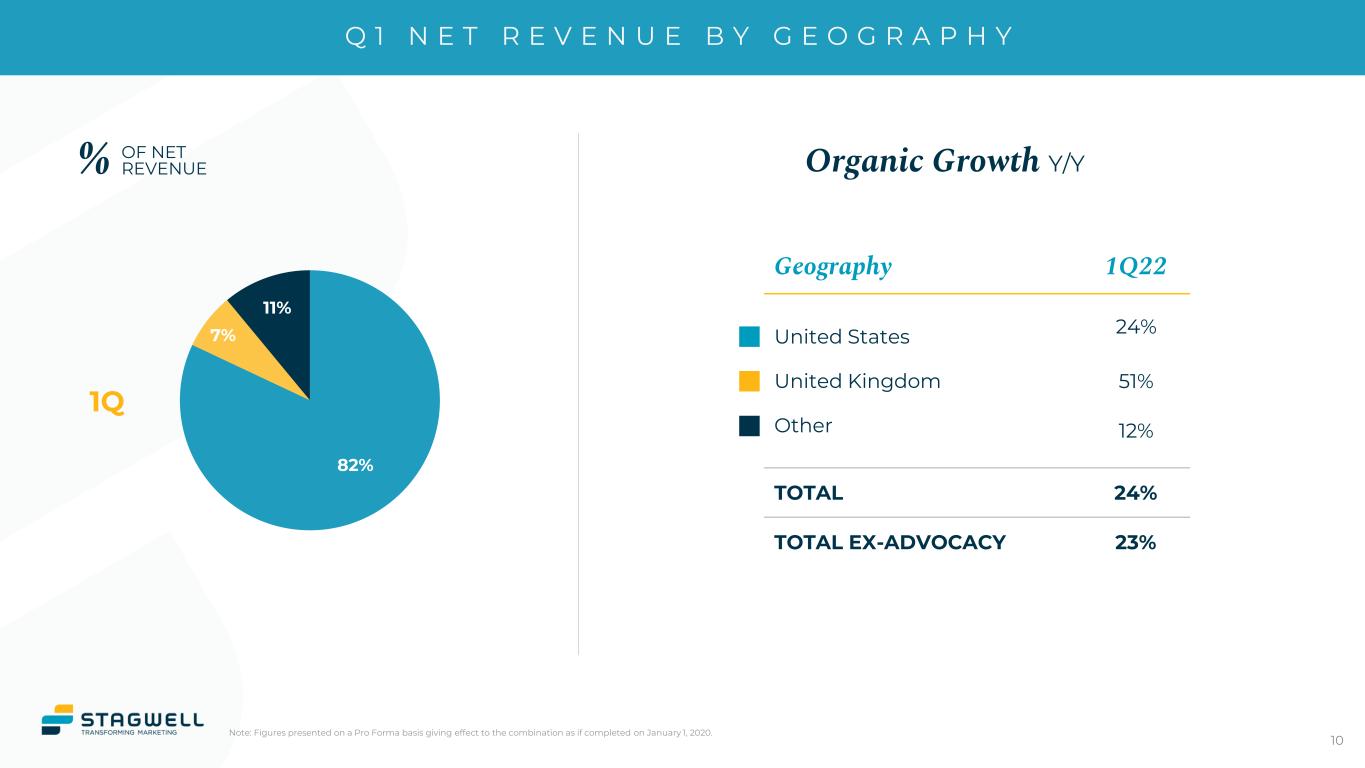
•Pro Forma organic net revenue growth of 23.6% versus the prior year period and 23.2% ex-Advocacy.
•First quarter net income of $33.6 million versus $4.6 million in the prior year period.
•First quarter net income attributable to Stagwell Inc. common shareholders of $12.7 million versus $4.4 million in the prior year period.
•First quarter adjusted EBITDA of $101.4 million, an increase of 325.4% versus the prior year period.
•Pro Forma adjusted EBITDA growth of 33.8% versus the prior period and 32.4% ex-Advocacy.
Page 1
•First quarter Adjusted EBITDA Margin of 19.3% of net revenue.
•Net New Business wins totaled $54 million in the quarter.
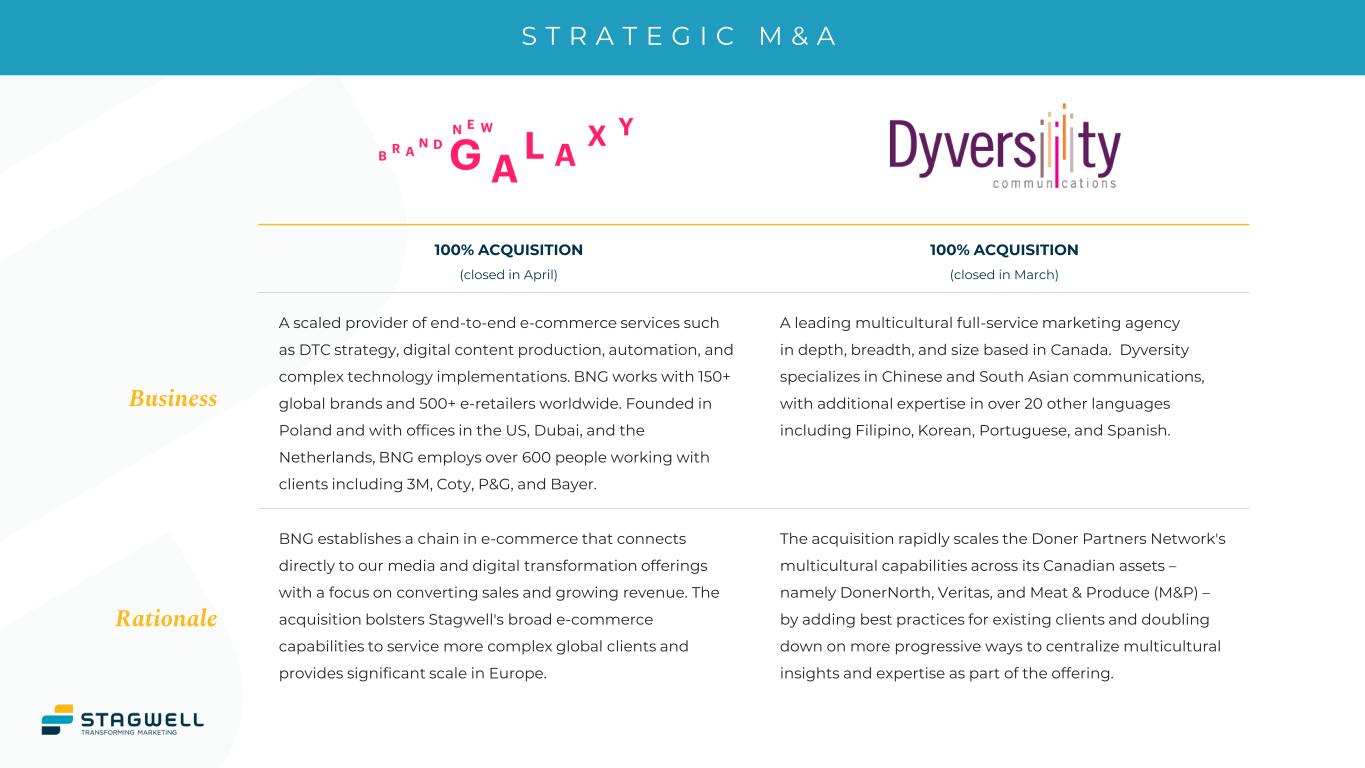
“While the GDP may be contracting, Stagwell is growing strongly. The merger has spurred revenue synergies immediately apparent in the big wins, significant industry awards, and integration of talent and technology across our network,” said Mark Penn, Chairman and Chief Executive Officer of Stagwell. “We grew first quarter net revenue 24% versus the prior year, more than double the pace of legacy holding companies, and grew Adjusted EBITDA at an even faster rate of 34% year-over-year. We also made a key e-commerce acquisition in April with Brand New Galaxy, which connects to our media and digital transformation offerings and provides increased scale in Europe. Our record quarter continues to build on our post-combination track record of delivering growth, free-cash-flow, and growing profitability.”
Frank Lanuto, Chief Financial Officer, commented: "The Company reported strong first quarter results with GAAP revenue of $643 million, net revenue of $527 million and Adjusted EBITDA of $101 million. Organic pro forma net revenue increased 24% over the prior period quarter and also increased sequentially in a typically smaller seasonal quarter. Adjusted EBITDA margin expanded 160 bps year-over-year on a Pro Forma basis to 19.3% of net revenue as the Company began to see the benefits of expected cost synergies.”
Financial Outlook
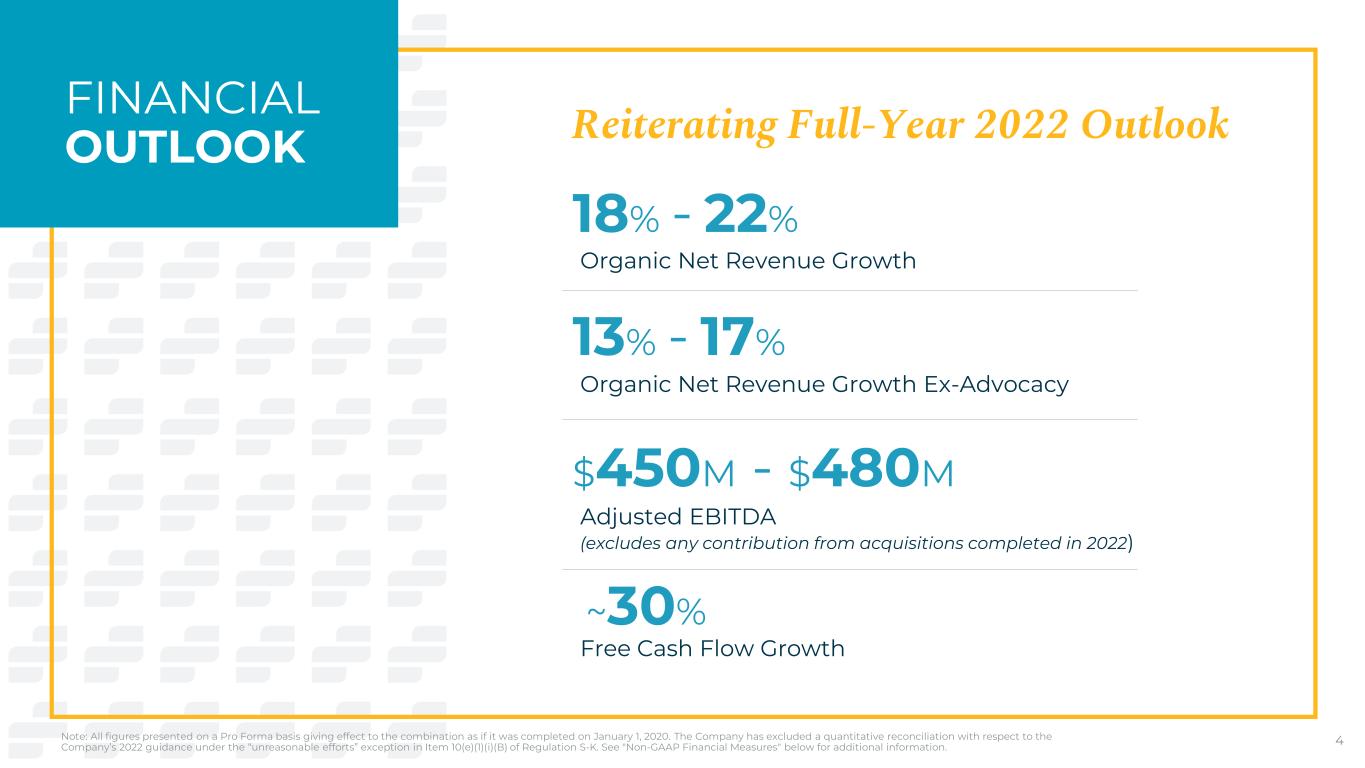
2022 financial guidance is as follows:
•Pro Forma Organic Net Revenue growth of 18% – 22%
•Pro Forma Organic Net Revenue growth ex-Advocacy of 13% – 17%
•Adjusted EBITDA of $450 million - $480 million, excluding the contribution from 2022 acquisitions
•Pro Forma Free Cash Flow growth of approximately 30%
•Guidance assumes no impact from foreign exchange, acquisitions or dispositions.
| * The Company has excluded a quantitative reconciliation with respect to the Company’s 2022 guidance under the “unreasonable efforts” exception in Item 10(e)(1)(i)(B) of Regulation S-K. See "Non-GAAP Financial Measures" below for additional information. | |||||
Conference Call
Management will host a video webcast and conference call on Friday, May 6, 2022, at 8:30 a.m. (ET) to discuss results for Stagwell Inc. for the three months ended March 31, 2022. The video webcast will be accessible at https://stagwellq12022earnings.open-exchange.net/. An investor presentation has been posted on our website at www.stagwellglobal.com and may be referred to during the conference call.
A recording of the conference call will be accessible one hour after the call and available for ninety days at www.stagwellglobal.com.
Stagwell Inc.
Stagwell is the challenger network built to transform marketing. We deliver scaled creative performance for the world's most ambitious brands, connecting culture-moving creativity with leading-edge technology to harmonize the
Page 2
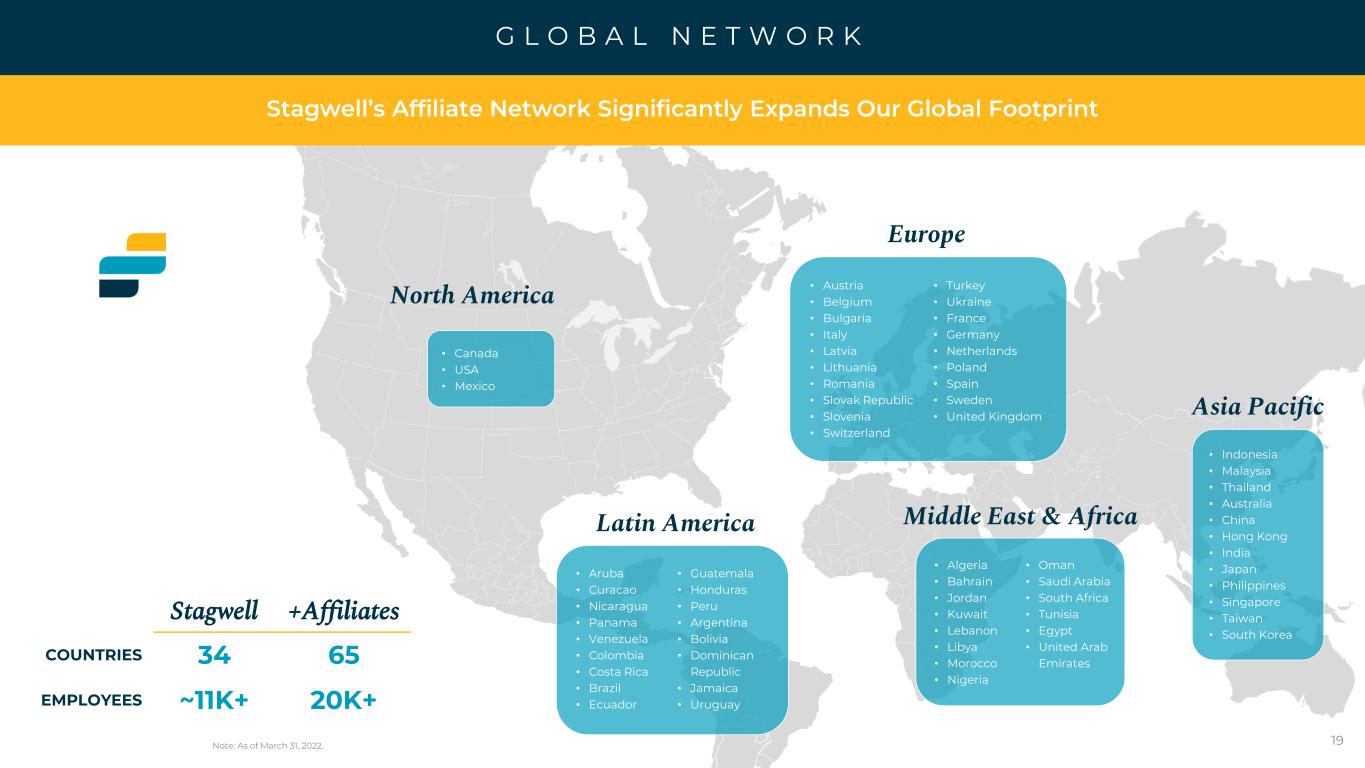
art and science of marketing. Led by entrepreneurs, our 10,000+ specialists in 34+ countries are unified under a single purpose: to drive effectiveness and improve business results for their clients. Join us at www.stagwellglobal.com.
Basis of Presentation
The acquisition of MDC Partners (MDC) by Stagwell Marketing Group (SMG) was completed on August 2, 2021. The results of MDC are included within the Statements of Operations for the period beginning on the date of the acquisition through the end of the respective period presented and the results of SMG are included for the entirety of all periods presented.
Non-GAAP Financial Measures
In addition to its reported results, Stagwell Inc. has included in this earnings release certain financial results that the Securities and Exchange Commission (SEC) defines as "non-GAAP Financial Measures." Management believes that such non-GAAP financial measures, when read in conjunction with the Company's reported results, can provide useful supplemental information for investors analyzing period to period comparisons of the Company's results. Such non-GAAP financial measures include the following:
Pro Forma Results: The Pro Forma amounts presented for each period were prepared by combining the historical standalone statements of operations for each of legacy MDC and SMG. The unaudited pro forma results are provided for illustrative purposes only and do not purport to represent what the actual consolidated results of operations or consolidated financial condition would have been had the combination actually occurred on the date indicated, nor do they purport to project the future consolidated results of operations or consolidated financial condition for any future period or as of any future date. The Company has excluded a quantitative reconciliation of adjusted Pro Forma EBITDA to net income under the “unreasonable efforts” exception in Item 10(e)(1)(i)(B) of Regulation S-K.
(1) Organic Revenue: “Organic revenue growth” and “organic revenue decline” refer to the positive or negative results, respectively, of subtracting both the foreign exchange and acquisition (disposition) components from total revenue growth. The acquisition (disposition) component is calculated by aggregating prior period revenue for any acquired businesses, less the prior period revenue of any businesses that were disposed of during the current period. The organic revenue growth (decline) component reflects the constant currency impact of (a) the change in revenue of the partner firms that the Company has held throughout each of the comparable periods presented, and (b) “non-GAAP acquisitions (dispositions), net”. Non-GAAP acquisitions (dispositions), net consists of (i) for acquisitions during the current year, the revenue effect from such acquisition as if the acquisition had been owned during the equivalent period in the prior year and (ii) for acquisitions during the previous year, the revenue effect from such acquisitions as if they had been owned during that entire year (or same period as the current reportable period), taking into account their respective pre-acquisition revenues for the applicable periods, and (iii) for dispositions, the revenue effect from such disposition as if they had been disposed of during the equivalent period in the prior year.
(2) Net New Business: Estimate of annualized revenue for new wins less annualized revenue for losses incurred in the period.
(3) Adjusted EBITDA: defined as Net income excluding non-operating income or expense to achieve operating income, plus depreciation and amortization, stock-based compensation, deferred acquisition consideration adjustments, and other items. Other items include restructuring costs, acquisition-related expenses, and non-recurring items.
Page 3
(4) Free Cash Flow: defined as Adjusted EBITDA less capital expenditures, change in net working capital, cash taxes, interest, and distributions to minority interests, but excludes contingent M&A payments.
(5) Financial Guidance: The Company provides guidance on a non-GAAP basis as it cannot predict certain elements which are included in reported GAAP results.
Included in this earnings release are tables reconciling reported Stagwell Inc. results to arrive at certain of these non-GAAP financial measures.
Page 4
This press release contains forward-looking statements. Statements in this press release that are not historical facts, including without limitation the information under the heading "Financial Outlook" and statements about the Company’s beliefs and expectations, earnings (loss) guidance, recent business and economic trends, potential acquisitions, and estimates of amounts for redeemable noncontrolling interests and deferred acquisition consideration, constitute forward-looking statements. Words such as “estimates”, “expects”, “contemplates”, “will”, “anticipates”, “projects”, “plans”, “intends”, “believes”, “forecasts”, “may”, “should”, and variations of such words or similar expressions are intended to identify forward-looking statements. These statements are based on current plans, estimates and projections, and are subject to change based on a number of factors, including those outlined in this section. Forward-looking statements speak only as of the date they are made, and the Company undertakes no obligation to update publicly any of them in light of new information or future events, if any.
Some of the factors that could materially and adversely affect our business, financial condition, results of operations and cash flows include, but are not limited to, the following:
•risks associated with international, national and regional unfavorable economic conditions that could affect the Company or its clients;
•the effects of the coronavirus pandemic ("COVID-19"), and the impact on the economy and demand for the Company's services, which may precipitate or exacerbate other risks and uncertainties;
•an inability to realize expected benefits of the combination of the Company’s business with the business of MDC (the “Business Combination” and, together with the related transactions, the “Transactions”);
•adverse tax consequences in connection with the Transactions for the Company, its operations and its shareholders, that may differ from the expectations of the Company, including that future changes in tax law, potential increases to corporate tax rates in the United States and disagreements with the tax authorities on the Company’s determination of value and computations of its attributes may result in increased tax costs;
•the occurrence of material Canadian federal income tax (including material “emigration tax”) as a result of the Transactions;
•the Company’s ability to attract new clients and retain existing clients;
•the impact of a reduction in client spending and changes in client advertising, marketing and corporate communications requirements;
•financial failure of the Company’s clients;
•the Company’s ability to retain and attract key employees;
•the Company’s ability to compete in the markets in which it operates;
•the Company's ability to achieve its cost saving initiatives;
•the Company’s implementation of strategic initiatives;
•the Company’s ability to remain in compliance with its debt agreements and the Company’s ability to finance its contingent payment obligations when due and payable, including but not limited to those relating to redeemable noncontrolling interests and deferred acquisition consideration;
•the Company's ability to manage its growth effectively, including the successful completion and integration of acquisitions which complement and expand the Company’s business capabilities;
•the Company’s material weaknesses in internal control over financial reporting and its ability to establish and maintain an effective system of internal control over financial reporting;
•the Company’s ability to protect client data from security incidents or cyberattacks;
•economic disruptions resulting from war and other geopolitical tensions (such as the ongoing military conflict between Russia and Ukraine), terrorist activities and natural disasters;
•stock price volatility; and
•foreign currency fluctuations.
Investors should carefully consider these risk factors, other risk factors described herein, and the additional risk factors outlined in more detail in our 2021 Form 10-K, filed with the Securities and Exchange Commission (the “SEC”) on March 17, 2022, and accessible on the SEC’s website at www.sec.gov, under the caption “Risk Factors,” and in the Company’s other SEC filings.
Page 5
SCHEDULE 1
STAGWELL INC.
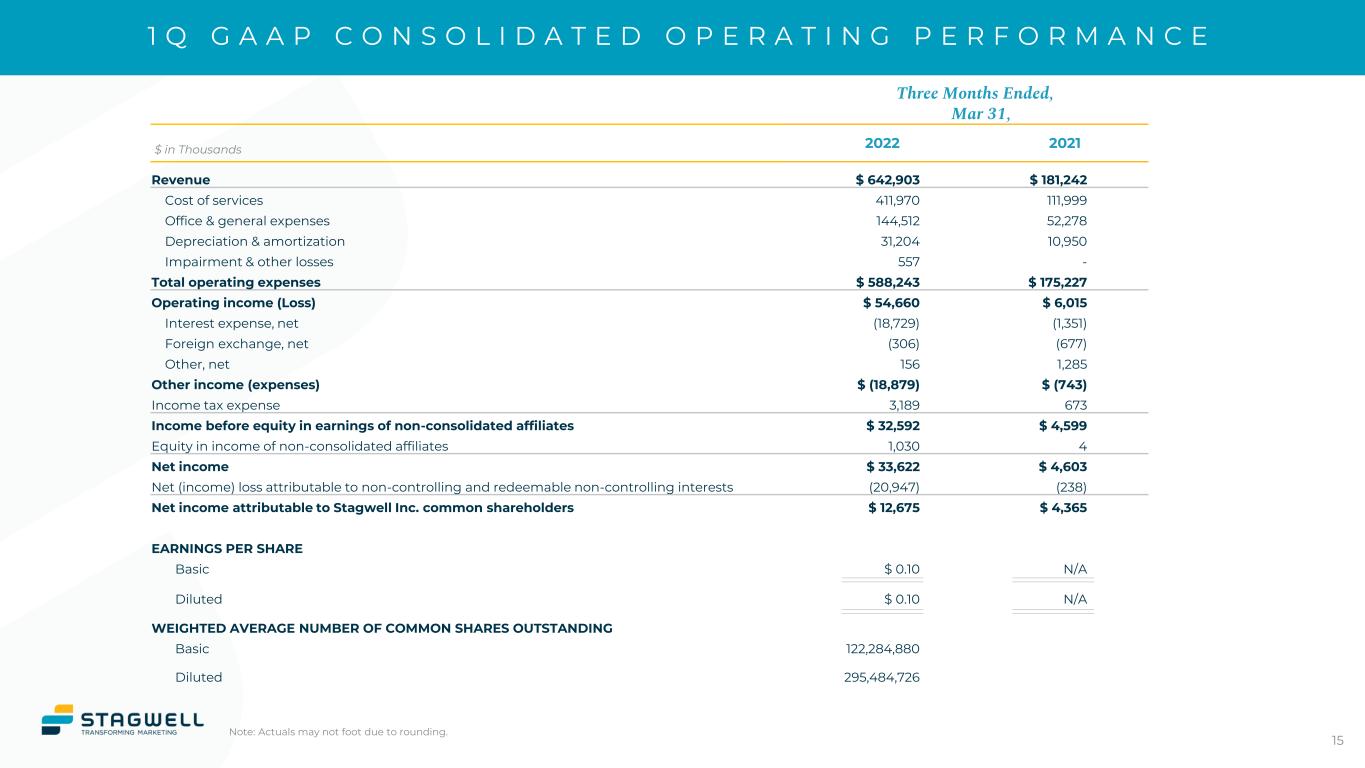
UNAUDITED CONSOLIDATED STATEMENTS OF OPERATIONS
(US$ in 000s)
| Three Months Ended March 31, | ||||||||||||||
| 2022 | 2021 | |||||||||||||
| Revenue | $ | 642,903 | $ | 181,242 | ||||||||||
| Operating Expenses | ||||||||||||||
| Cost of services | 411,970 | 111,999 | ||||||||||||
| Office and general expenses | 144,512 | 52,278 | ||||||||||||
| Depreciation and amortization | 31,204 | 10,950 | ||||||||||||
| Impairment and other losses | 557 | — | ||||||||||||
| 588,243 | 175,227 | |||||||||||||
| Operating income | 54,660 | 6,015 | ||||||||||||
| Other Income (expenses): | ||||||||||||||
| Interest expense, net | (18,729) | (1,351) | ||||||||||||
| Foreign exchange, net | (306) | (677) | ||||||||||||
| Other, net | 156 | 1,285 | ||||||||||||
| (18,879) | (743) | |||||||||||||
| Income before income taxes and equity in earnings of non-consolidated affiliates | 35,781 | 5,272 | ||||||||||||
| Income tax expense | 3,189 | 673 | ||||||||||||
| Income before equity in earnings of non-consolidated affiliates | 32,592 | 4,599 | ||||||||||||
| Equity in income of non-consolidated affiliates | 1,030 | 4 | ||||||||||||
| Net income | 33,622 | 4,603 | ||||||||||||
| Net income attributable to noncontrolling and redeemable noncontrolling interests | (20,947) | (238) | ||||||||||||
| Net income attributable to Stagwell Inc. common shareholders | $ | 12,675 | $ | 4,365 | ||||||||||
| Income Per Common Share: | ||||||||||||||
| Basic | ||||||||||||||
| Net income attributable to Stagwell Inc. common shareholders | $ | 0.10 | N/A | |||||||||||
| Diluted | ||||||||||||||
| Net income attributable to Stagwell Inc. common shareholders | $ | 0.10 | N/A | |||||||||||
| Weighted Average Number of Common Shares Outstanding: | ||||||||||||||
| Basic | 122,285 | N/A | ||||||||||||
| Diluted | 295,485 | N/A | ||||||||||||
Page 6
SCHEDULE 2
STAGWELL INC.
UNAUDITED PRO FORMA COMPONENTS OF NET REVENUE CHANGE
(US$ in 000s, except percentages)
| Components of Change | Change | ||||||||||||||||||||||||||||||||||||||||||||||
| Three Months Ended March 31, 2021 | Foreign Currency | Net Acquisitions (Divestitures) | Organic | Total Change | Three Months Ended March 31, 2022 | Organic | Total | ||||||||||||||||||||||||||||||||||||||||
| Integrated Agencies Network | $ | 286,426 | $ | (1,921) | $ | — | $ | 48,155 | $ | 46,234 | $ | 332,660 | 16.8 | % | 16.1 | % | |||||||||||||||||||||||||||||||
| Media Network | 88,962 | (448) | 4,208 | 35,693 | 39,453 | 128,415 | 40.1 | % | 44.3 | % | |||||||||||||||||||||||||||||||||||||
| Communications Network | 47,531 | (95) | — | 15,016 | 14,921 | 62,452 | 31.6 | % | 31.4 | % | |||||||||||||||||||||||||||||||||||||
| All Other | 5,862 | (11) | (5,256) | 2,515 | (2,752) | 3,110 | 42.9 | % | (46.9) | % | |||||||||||||||||||||||||||||||||||||
| $ | 428,781 | $ | (2,475) | $ | (1,048) | $ | 101,379 | $ | 97,856 | $ | 526,637 | 23.6 | % | 22.8 | % | ||||||||||||||||||||||||||||||||
Note: Actuals may not foot due to rounding.
Page 7
SCHEDULE 3
STAGWELL INC.
UNAUDITED PRO FORMA SEGMENT OPERATING RESULTS
(US$ in 000s, except percentages)
For the Three Months Ended March 31, 2022
| Integrated Agencies Network | Media Network | Communications Network | All Other | Corporate | Total | ||||||||||||||||||||||||||||||
| Net Revenue | $ | 332,660 | $ | 128,415 | $ | 62,452 | $ | 3,110 | $ | — | $ | 526,637 | |||||||||||||||||||||||
| Billable Costs | 45,712 | 41,471 | 29,083 | — | — | 116,266 | |||||||||||||||||||||||||||||
| Revenue | 378,372 | 169,886 | 91,535 | 3,110 | — | 642,903 | |||||||||||||||||||||||||||||
| Billable Costs | 45,712 | 41,471 | 29,083 | — | — | 116,266 | |||||||||||||||||||||||||||||
| Staff costs | 213,467 | 75,856 | 39,623 | 2,536 | 9,156 | 340,638 | |||||||||||||||||||||||||||||
| Administrative costs | 30,293 | 12,580 | 6,844 | 695 | 5,882 | 56,294 | |||||||||||||||||||||||||||||
| Unbillable and other costs, net | 17,427 | 10,815 | 48 | 3 | — | 28,293 | |||||||||||||||||||||||||||||
Adjusted EBITDA (1) | 71,473 | 29,164 | 15,937 | (124) | (15,038) | 101,412 | |||||||||||||||||||||||||||||
| Stock-based compensation | 5,547 | 786 | (243) | 8 | 1,923 | 8,021 | |||||||||||||||||||||||||||||
| Depreciation and amortization | 20,211 | 6,865 | 2,540 | 501 | 1,087 | 31,204 | |||||||||||||||||||||||||||||
| Deferred acquisition consideration | (1,325) | 2,132 | 1,090 | — | — | 1,897 | |||||||||||||||||||||||||||||
| Impairment and other losses | 279 | 278 | — | — | — | 557 | |||||||||||||||||||||||||||||
Other items, net (1) | 938 | 887 | 72 | — | 3,176 | 5,073 | |||||||||||||||||||||||||||||
| Operating income (loss) | $ | 45,823 | $ | 18,216 | $ | 12,478 | $ | (633) | $ | (21,224) | $ | 54,660 | |||||||||||||||||||||||
(1) See Non-GAAP Financial Measures section above for the definition of Adjusted EBITDA, Other items, net and Pro Forma adjusted EBITDA.
Note: Actuals may not foot due to rounding.
Page 8
SCHEDULE 4
STAGWELL INC.
UNAUDITED PRO FORMA SEGMENT OPERATING RESULTS
(US$ in 000s, except percentages)
For the Three Months Ended March 31, 2021
| Integrated Agencies Network | Media Network | Communications Network | All Other | Corporate | Total | ||||||||||||||||||||||||||||||
| Net Revenue | $ | 286,426 | $ | 88,962 | $ | 47,531 | $ | 5,862 | $ | — | $ | 428,781 | |||||||||||||||||||||||
| Billable Costs | 32,371 | 10,768 | 16,907 | — | — | 60,046 | |||||||||||||||||||||||||||||
| Revenue | 318,797 | 99,730 | 64,438 | 5,862 | — | 488,827 | |||||||||||||||||||||||||||||
| Billable Costs | 32,371 | 10,768 | 16,907 | — | — | 60,046 | |||||||||||||||||||||||||||||
| Staff costs | 177,836 | 58,072 | 32,711 | 5,253 | 7,294 | 281,166 | |||||||||||||||||||||||||||||
| Administrative costs | 29,245 | 12,433 | 4,838 | 3,844 | 1,544 | 51,904 | |||||||||||||||||||||||||||||
| Unbillable and other costs, net | 13,365 | 7,853 | (96) | (1,322) | 145 | 19,945 | |||||||||||||||||||||||||||||
Adjusted EBITDA (1) | 65,980 | 10,604 | 10,078 | (1,913) | (8,983) | 75,766 | |||||||||||||||||||||||||||||
| Stock-based compensation | (2,675) | 21 | 61 | — | 630 | (1,963) | |||||||||||||||||||||||||||||
| Depreciation and amortization | 8,917 | 5,660 | 1,826 | 1,022 | 1,702 | 19,127 | |||||||||||||||||||||||||||||
| Deferred acquisition consideration | 15,915 | — | (294) | — | — | 15,621 | |||||||||||||||||||||||||||||
| Impairment and other losses | 875 | (1) | — | 1 | — | 875 | |||||||||||||||||||||||||||||
Other items, net (1) | 2,042 | 1,520 | 58 | — | 4,805 | 8,425 | |||||||||||||||||||||||||||||
| Operating income (loss) | $ | 40,906 | $ | 3,404 | $ | 8,427 | $ | (2,936) | $ | (16,120) | $ | 33,681 | |||||||||||||||||||||||
(1) See Non-GAAP Financial Measures section above for the definition of Adjusted EBITDA, Other items, net and Pro Forma adjusted EBITDA.
Note: Actuals may not foot due to rounding.
Page 9
SCHEDULE 5
STAGWELL INC.
UNAUDITED CONSOLIDATED BALANCE SHEETS
(US$ in 000s)
| March 31, 2022 | December 31, 2021 | ||||||||||
| ASSETS | |||||||||||
| Current Assets | |||||||||||
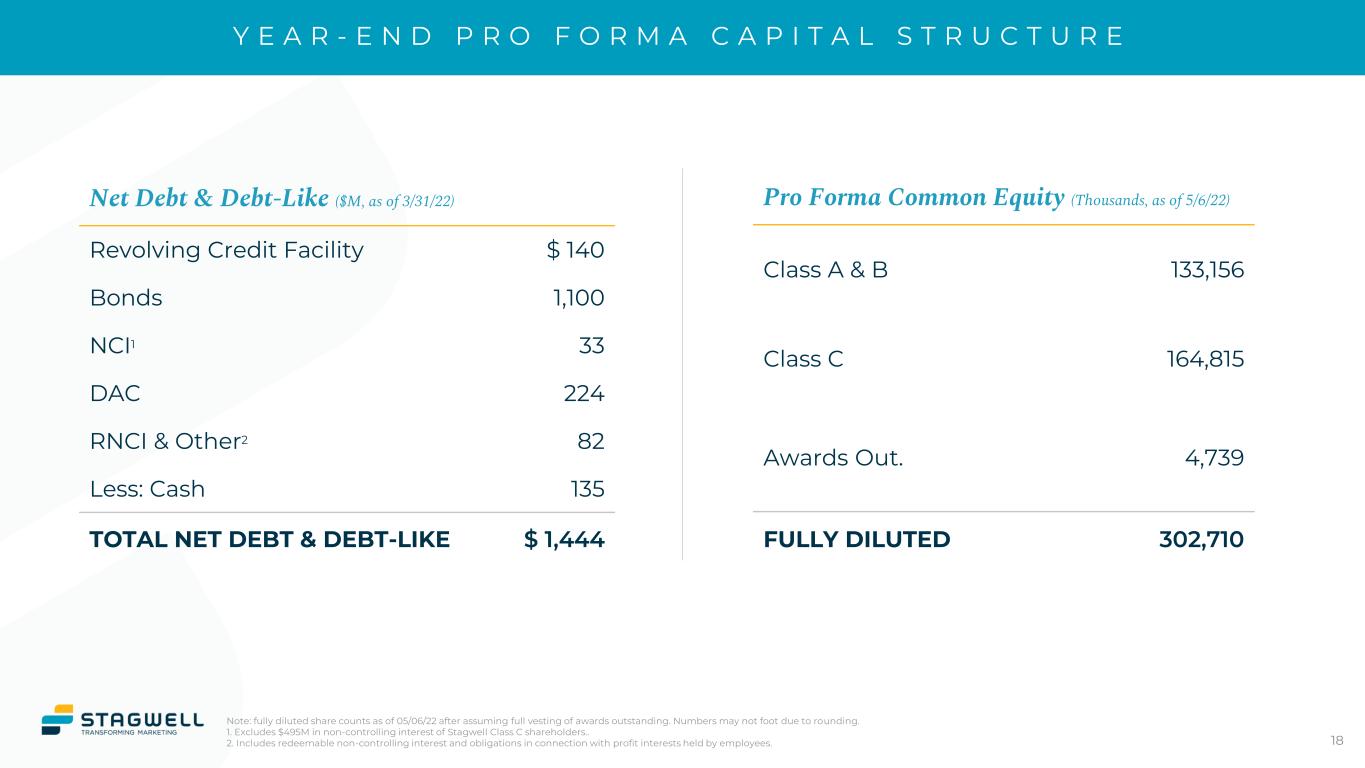
| Cash and cash equivalents | $ | 135,153 | $ | 184,009 | |||||||
| Accounts receivable, net | 767,147 | 696,937 | |||||||||
| Expenditures billable to clients | 51,069 | 63,065 | |||||||||
| Other current assets | 69,009 | 61,830 | |||||||||
| Total Current Assets | 1,022,378 | 1,005,841 | |||||||||
| Fixed assets, net | 118,542 | 118,603 | |||||||||
| Right-of-use lease assets - operating leases | 311,028 | 311,654 | |||||||||
| Goodwill | 1,651,475 | 1,652,723 | |||||||||
| Other intangible assets, net | 914,829 | 937,695 | |||||||||
| Other assets | 33,581 | 29,064 | |||||||||
| Total Assets | $ | 4,051,833 | $ | 4,055,580 | |||||||
| LIABILITIES, RNCI, AND SHAREHOLDERS’ EQUITY | |||||||||||
| Current Liabilities | |||||||||||
| Accounts payable | $ | 248,619 | $ | 271,769 | |||||||
| Accrued media | 284,735 | 237,794 | |||||||||
| Accruals and other liabilities | 224,945 | 272,533 | |||||||||
| Advance billings | 344,125 | 361,885 | |||||||||
| Current portion of lease liabilities - operating leases | 70,356 | 72,255 | |||||||||
| Current portion of deferred acquisition consideration | 75,619 | 77,946 | |||||||||
| Total Current Liabilities | 1,248,399 | 1,294,182 | |||||||||
| Long-term debt | 1,222,041 | 1,191,601 | |||||||||
| Long-term portion of deferred acquisition consideration | 148,649 | 144,423 | |||||||||
| Long-term lease liabilities - operating leases | 339,168 | 342,730 | |||||||||
| Deferred tax liabilities, net | 78,401 | 103,093 | |||||||||
| Other liabilities | 73,097 | 57,147 | |||||||||
| Total Liabilities | 3,109,755 | 3,133,176 | |||||||||
| Redeemable Noncontrolling Interests | 44,233 | 43,364 | |||||||||
| Commitments, Contingencies and Guarantees | |||||||||||
| Shareholders' Equity: | |||||||||||
| Common shares - Class A & B | 135 | 118 | |||||||||
| Common shares - Class C | 2 | 2 | |||||||||
| Paid-in capital | 373,300 | 382,893 | |||||||||
| Retained earnings | 6,668 | (6,982) | |||||||||
| Accumulated other comprehensive loss | (10,625) | (5,278) | |||||||||
| Stagwell Inc. Shareholders' Equity | 369,480 | 370,753 | |||||||||
| Noncontrolling interests | 528,365 | 508,287 | |||||||||
| Total Shareholders' Equity | 897,845 | 879,040 | |||||||||
| Total Liabilities, Redeemable Noncontrolling Interests and Shareholders' Equity | $ | 4,051,833 | $ | 4,055,580 | |||||||
Page 10
SCHEDULE 6
STAGWELL INC.
UNAUDITED SUMMARY CASH FLOW DATA
(US$ in 000s)
| Three Months Ended March 31, | |||||||||||
| 2022 | 2021 | ||||||||||
| Cash flows from operating activities: | |||||||||||
| Net income | $ | 33,622 | $ | 4,603 | |||||||
| Adjustments to reconcile net income to cash (used in) provided by operating activities: | |||||||||||
| Stock-based compensation | 8,021 | — | |||||||||
| Depreciation and amortization | 31,204 | 10,950 | |||||||||
| Impairment and other losses | 557 | — | |||||||||
| Provision for bad debt expense | 879 | 255 | |||||||||
| Deferred income taxes | (1,350) | (181) | |||||||||
| Adjustment to deferred acquisition consideration | 1,897 | 3,918 | |||||||||
| Transaction costs contributed by Stagwell Media LP | — | 3,188 | |||||||||
| Other | (11,440) | (436) | |||||||||
| Changes in working capital: | |||||||||||
| Accounts receivable | (70,039) | 59,536 | |||||||||
| Expenditures billable to clients | 11,996 | (5,387) | |||||||||
| Other assets | (6,100) | (1,134) | |||||||||
| Accounts payable | (29,684) | (69,133) | |||||||||
| Accruals and other liabilities | (380) | (1,411) | |||||||||
| Advance billings | (17,760) | 1,003 | |||||||||
| Net cash (used in) provided by operating activities | (48,577) | 5,771 | |||||||||
| Cash flows from investing activities: | |||||||||||
| Capital expenditures | (6,538) | (3,311) | |||||||||
| Acquisitions, net of cash acquired | (935) | — | |||||||||
| Other | (816) | — | |||||||||
| Net cash used in investing activities | (8,289) | (3,311) | |||||||||
| Cash flows from financing activities: | |||||||||||
| Repayment of borrowings under revolving credit facility | (209,500) | (25,248) | |||||||||
| Proceeds from borrowings under revolving credit facility | 239,000 | 10,000 | |||||||||
| Shares acquired and cancelled | (14,926) | — | |||||||||
| Distributions to noncontrolling interests and other | (6,464) | — | |||||||||
| Payment of deferred consideration | (1,581) | — | |||||||||
| Distributions | — | (25,894) | |||||||||
| Net cash provided by (used in) financing activities | 6,529 | (41,142) | |||||||||
| Effect of exchange rate changes on cash and cash equivalents | 1,481 | 9 | |||||||||
| Net decrease in cash and cash equivalents | (48,856) | (38,673) | |||||||||
| Cash and cash equivalents at beginning of period | 184,009 | 92,457 | |||||||||
| Cash and cash equivalents at end of period | $ | 135,153 | $ | 53,784 | |||||||
Note: Actuals may not foot due to rounding.
Page 11