Exhibit 99.1

NEWS RELEASE
For Immediate Release:
March 2, 2021
Sterling Reports Strong 2020 Fourth Quarter and Record Full Year Results
Record Full Year Operating Cash Flow Drives $77.7 million of Debt Payments
2021 Midpoint EPS Guidance Calling for Growth of 22%
THE WOODLANDS, TX – March 2, 2021 – Sterling Construction Company, Inc. (NasdaqGS: STRL) (“Sterling” or the “Company”) today announced financial results for the fourth quarter and full year ended 2020.
Consolidated Fourth Quarter 2020 Financial Results Compared to Fourth Quarter 2019:
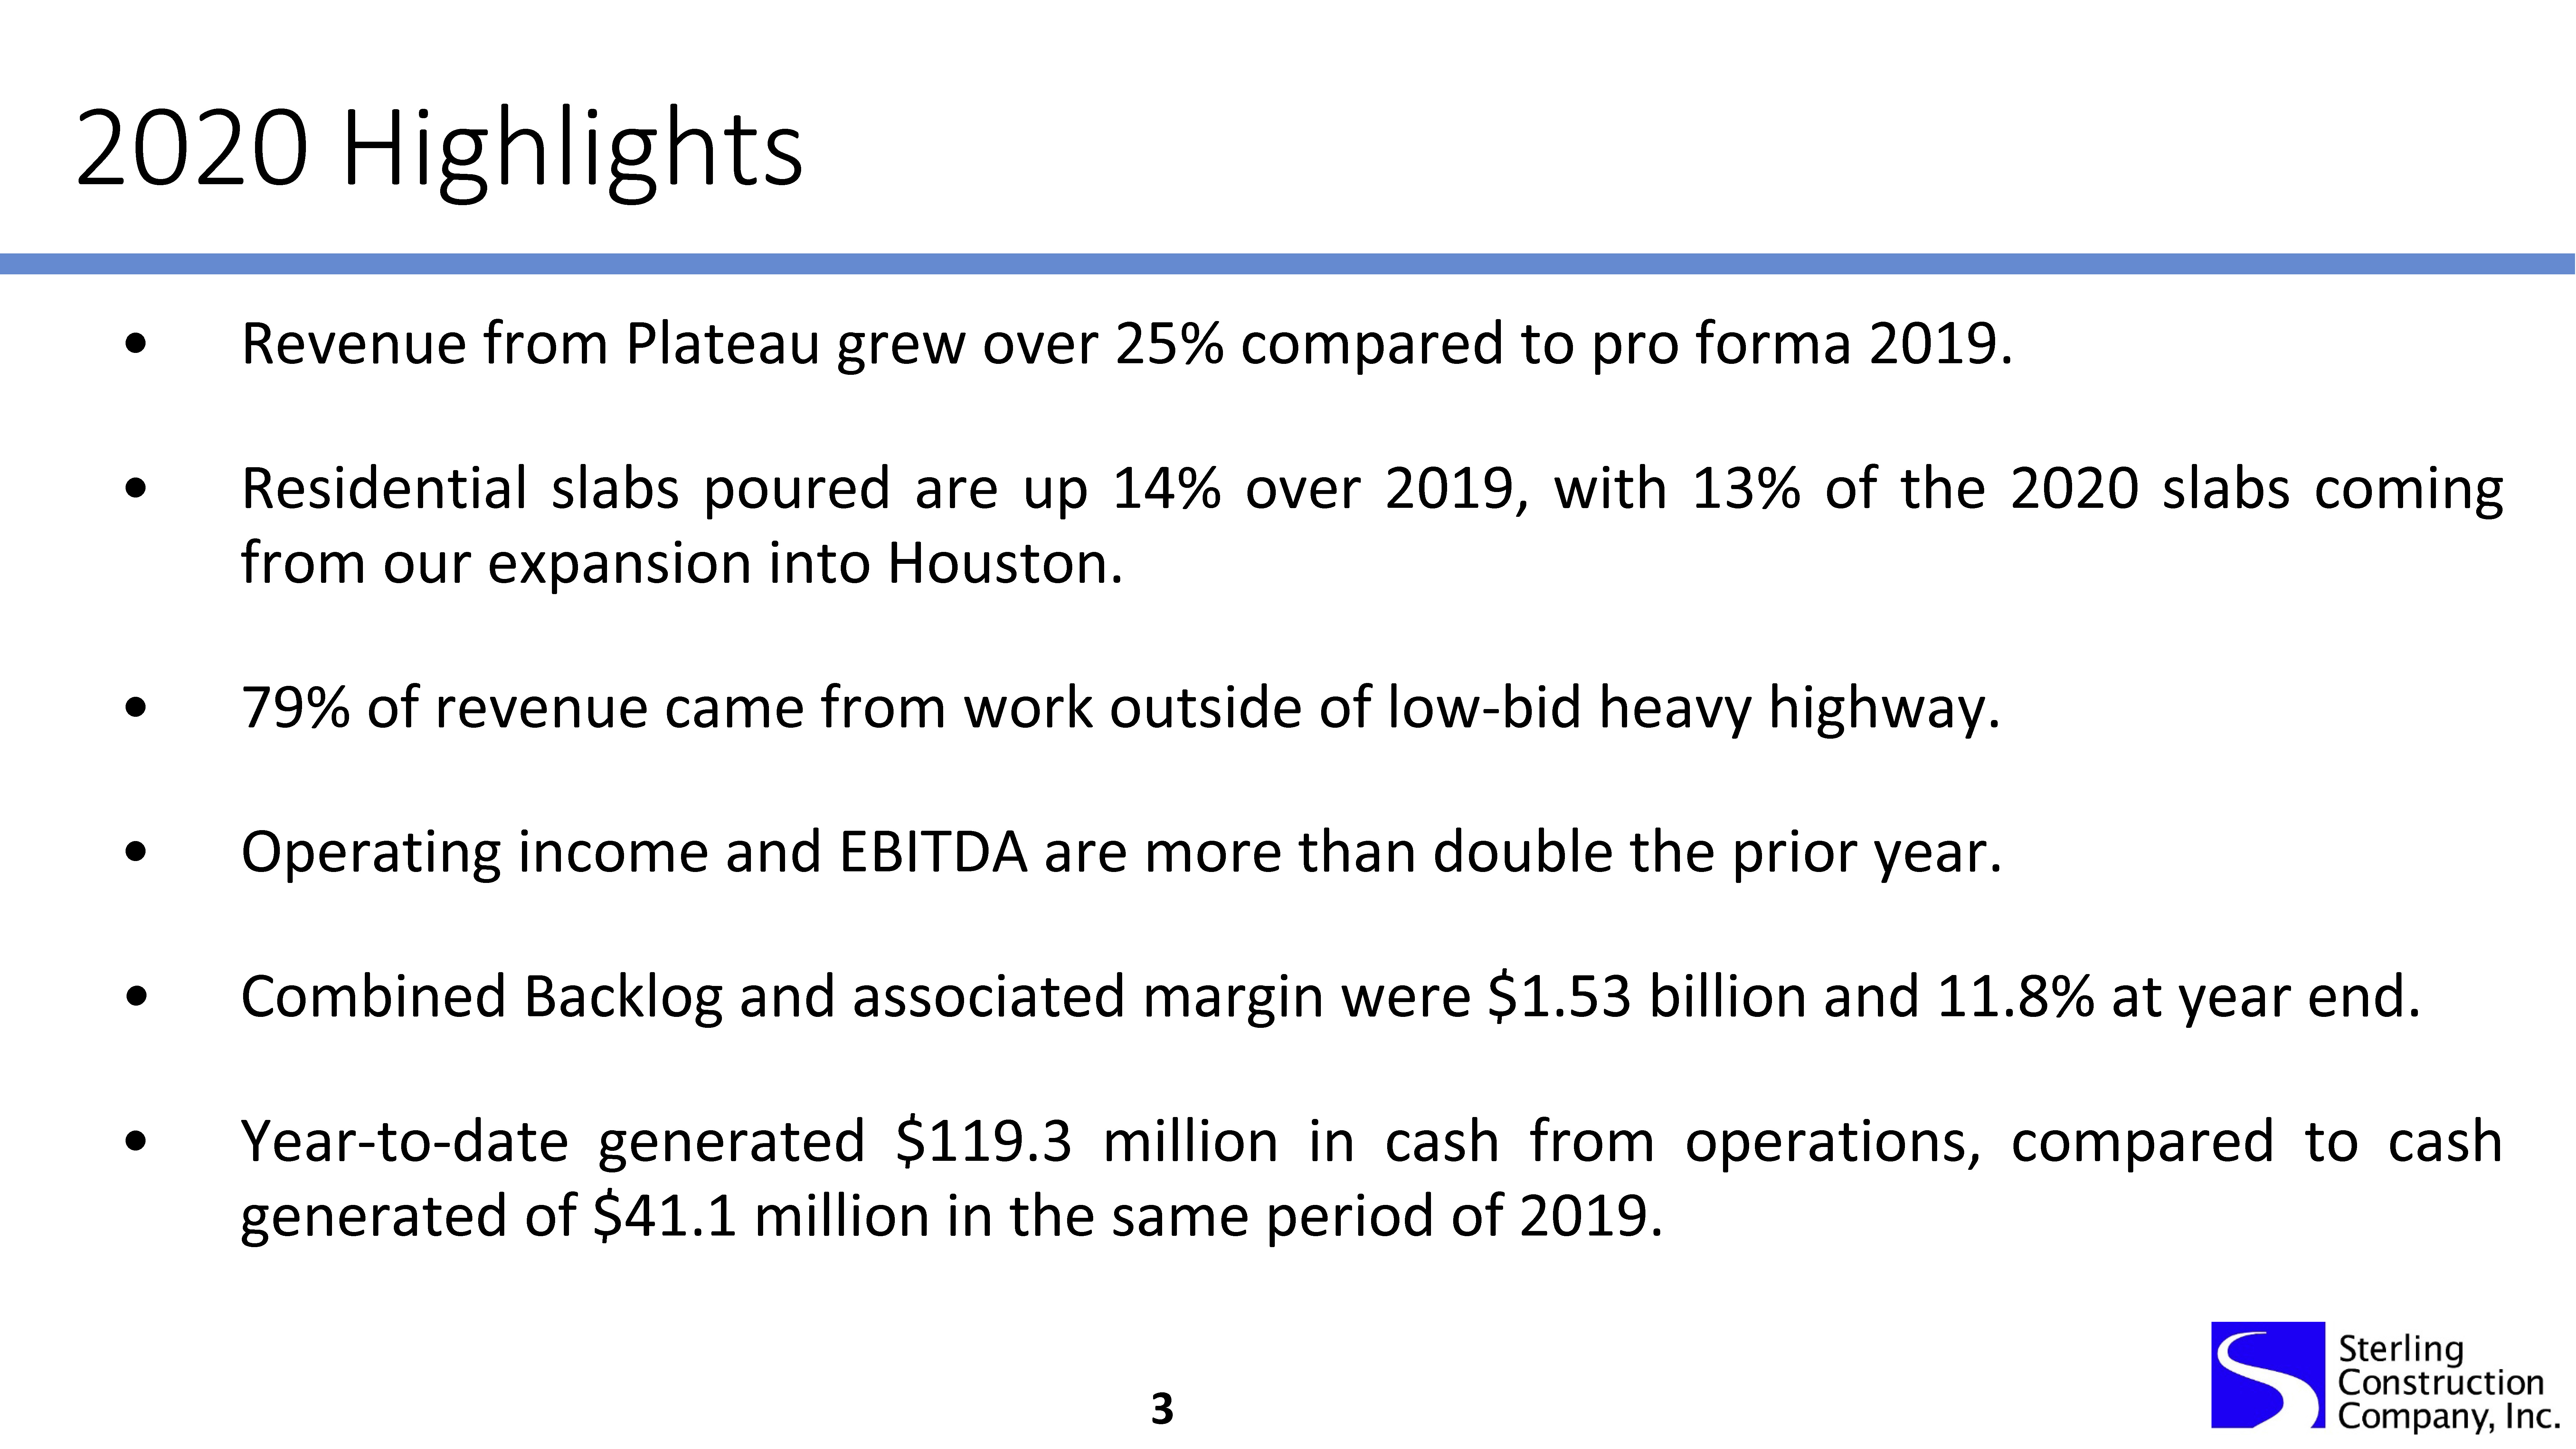
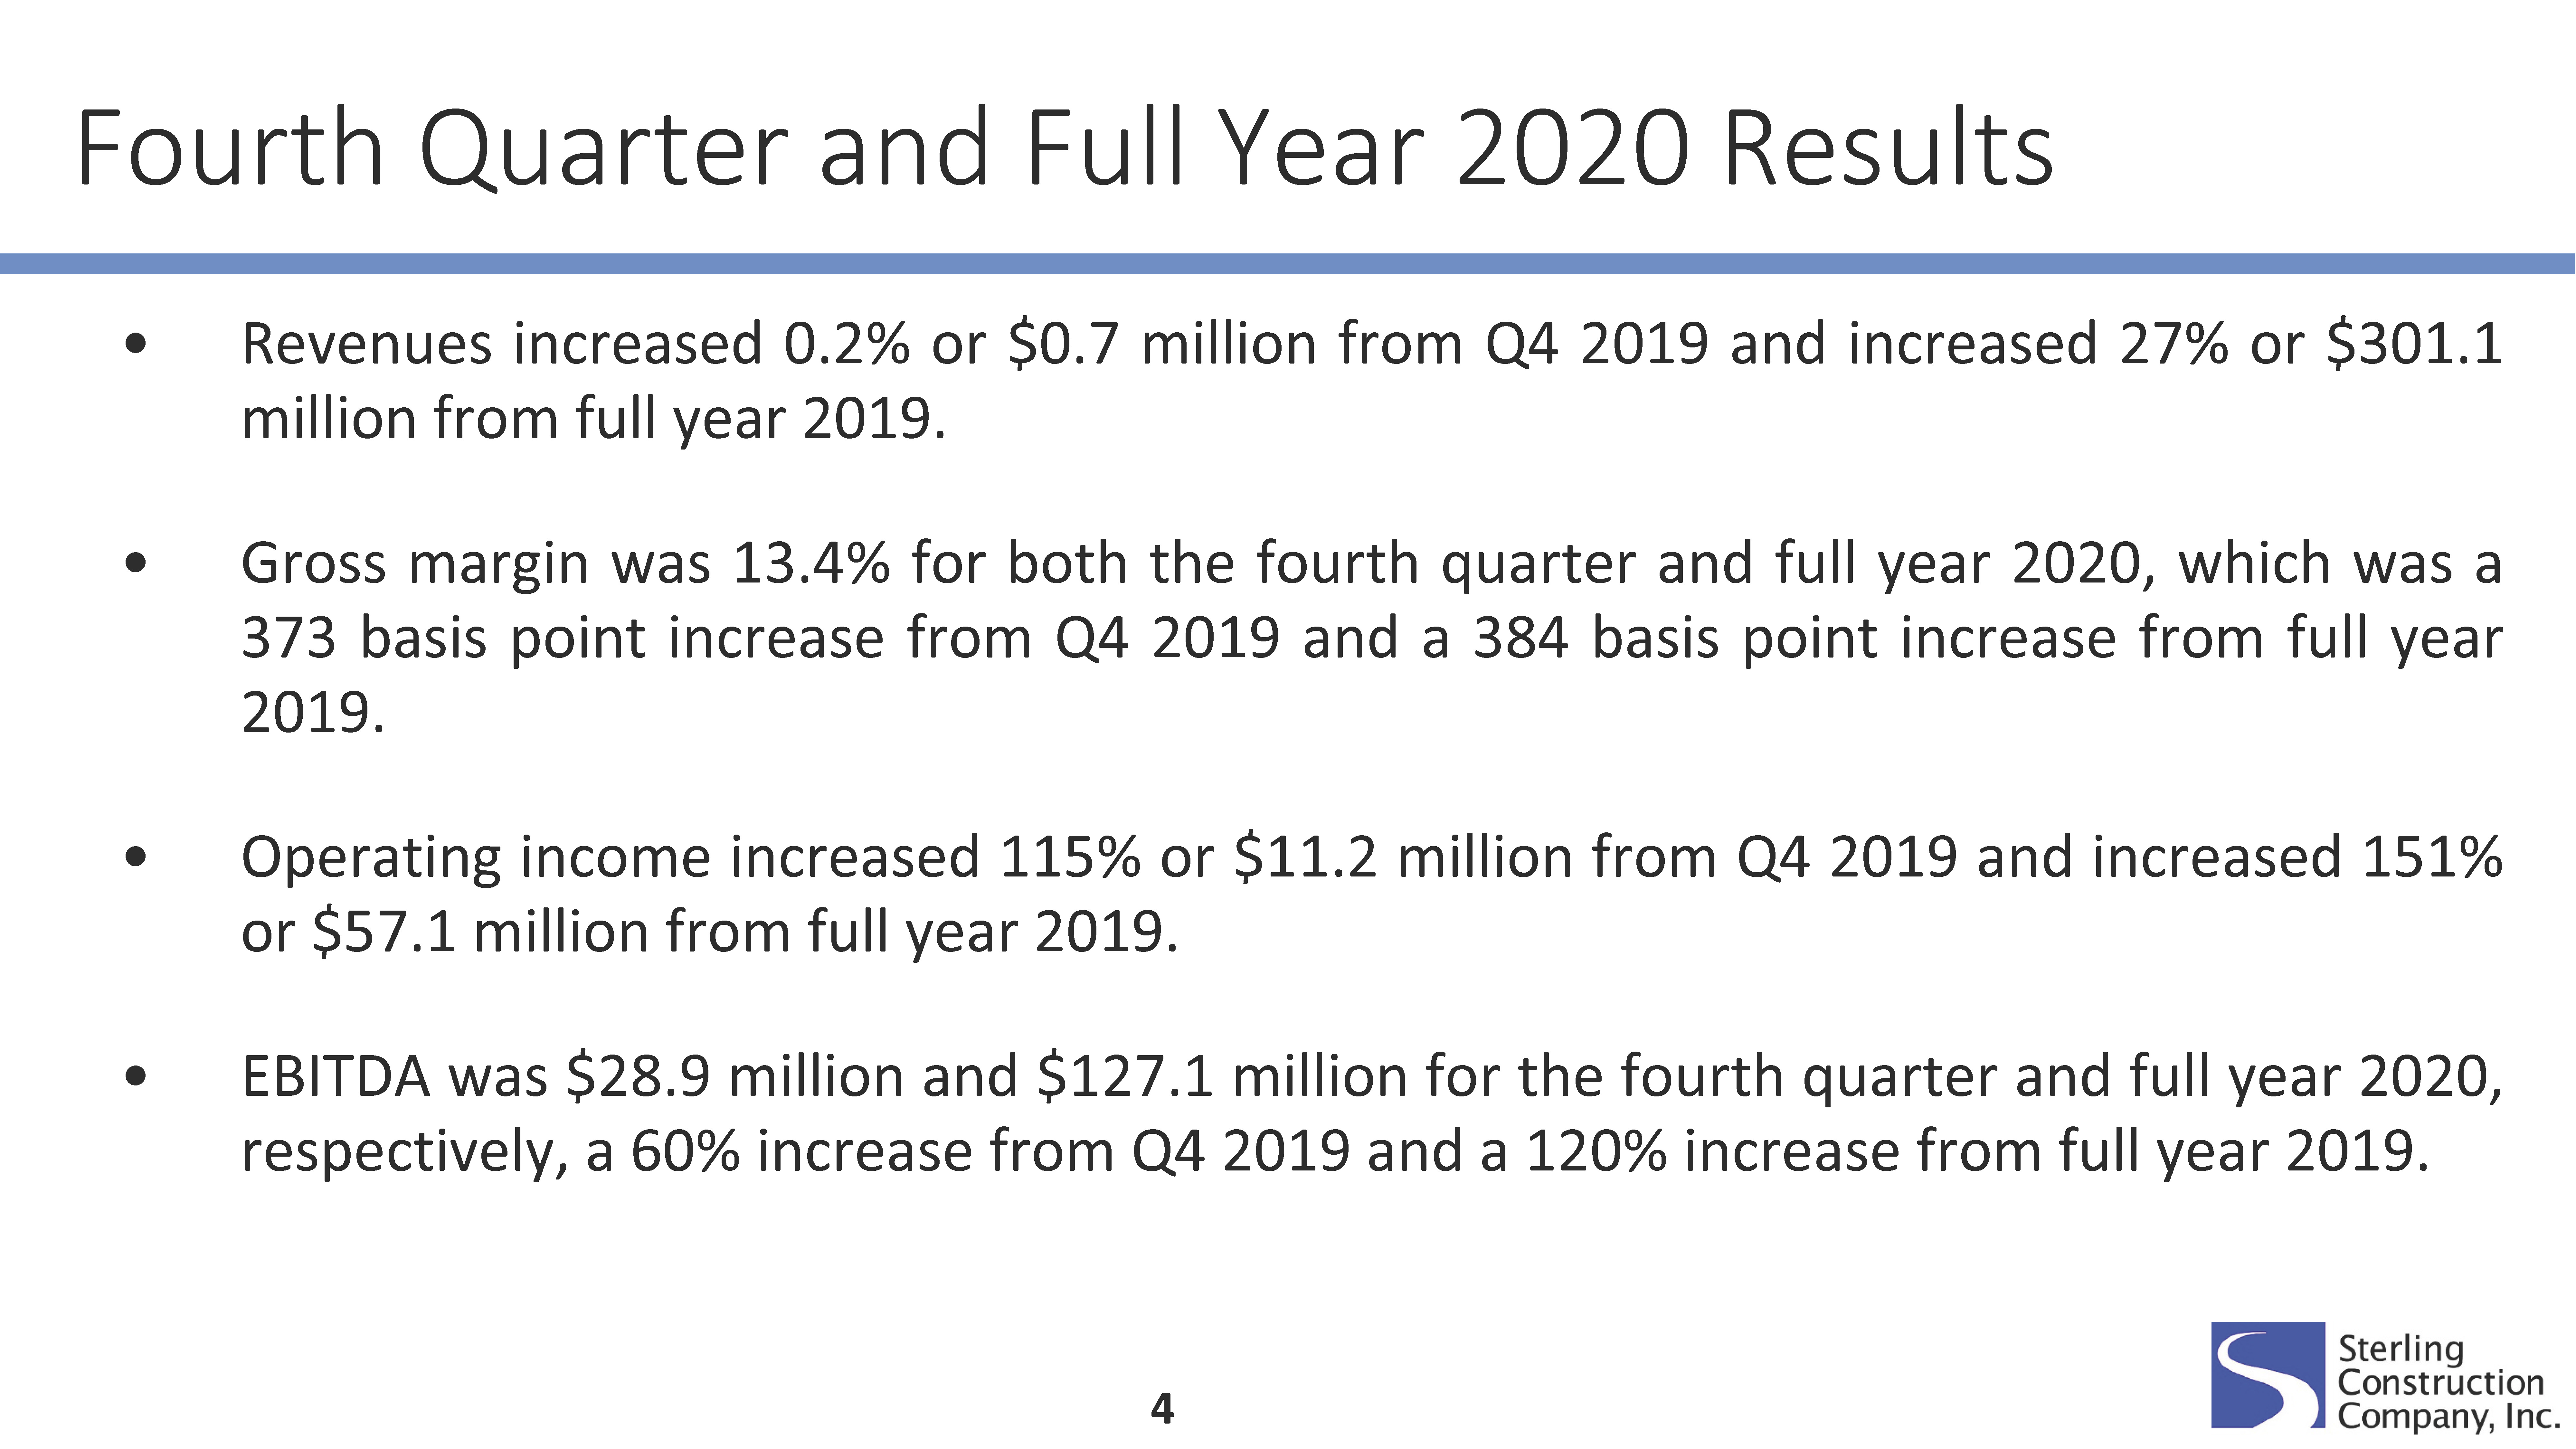
•Revenues were $347.2 million compared to $346.5 million;
•Gross margin was 13.4% of revenues compared to 9.7%;
•Operating income was $20.9 million compared to $9.7 million or $11.9 million on an adjusted basis(1);
•Net Income attributable to Sterling common stockholders was $5.8 million in 2020. The comparable 2019 amount was $22.3 million or $6.3 million on an adjusted basis(1);
•Adjusted EBITDA(2) was $28.9 million compared to $20.2 million.
Consolidated Full Year 2020 Financial Results Compared to Full Year 2019:
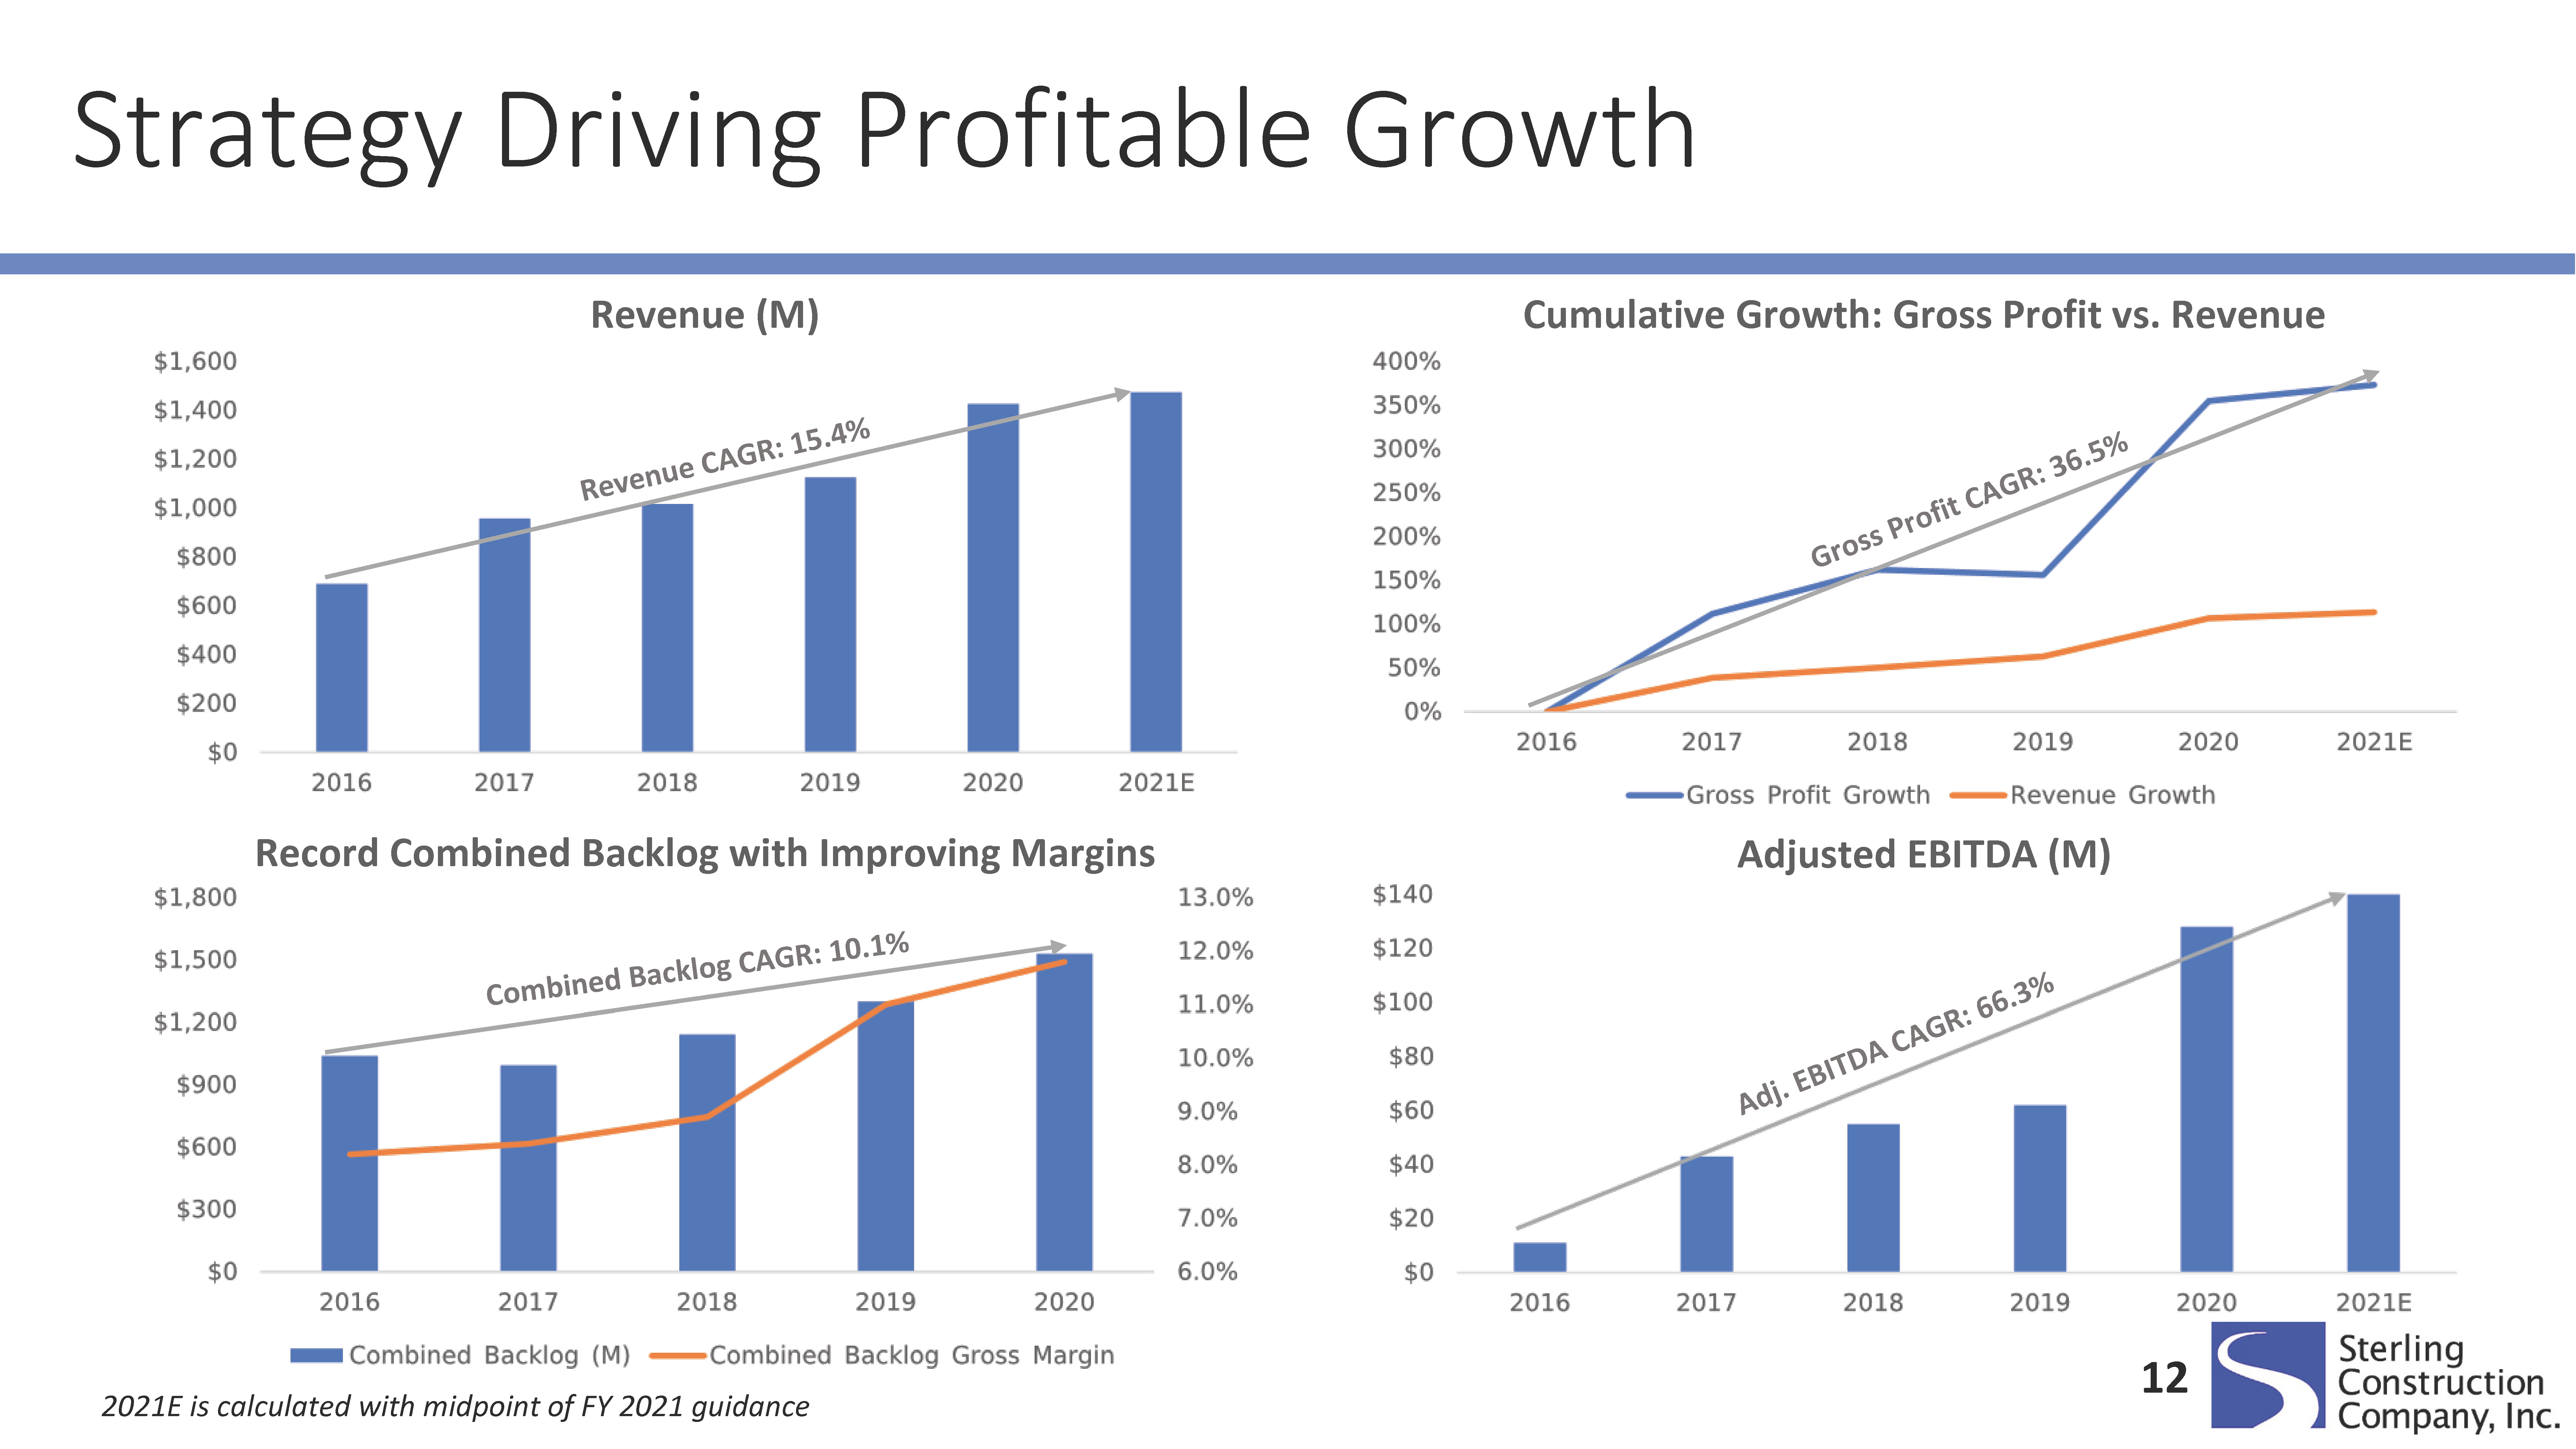
•Revenues were $1.4 billion compared to $1.1 billion;
•Gross margin was 13.4% of revenues compared to 9.6%;
•Operating income was $94.9 million compared to $37.8 million or $42.1 million on an adjusted basis(1);
•Net Income attributable to Sterling common stockholders was $42.3 million in 2020. The comparable 2019 amount was $39.9 million or $24.5 million on an adjusted basis(1);
•Adjusted EBITDA(2) was $128.1 million compared to $62.0 million.
Consolidated Financial Position and Liquidity:
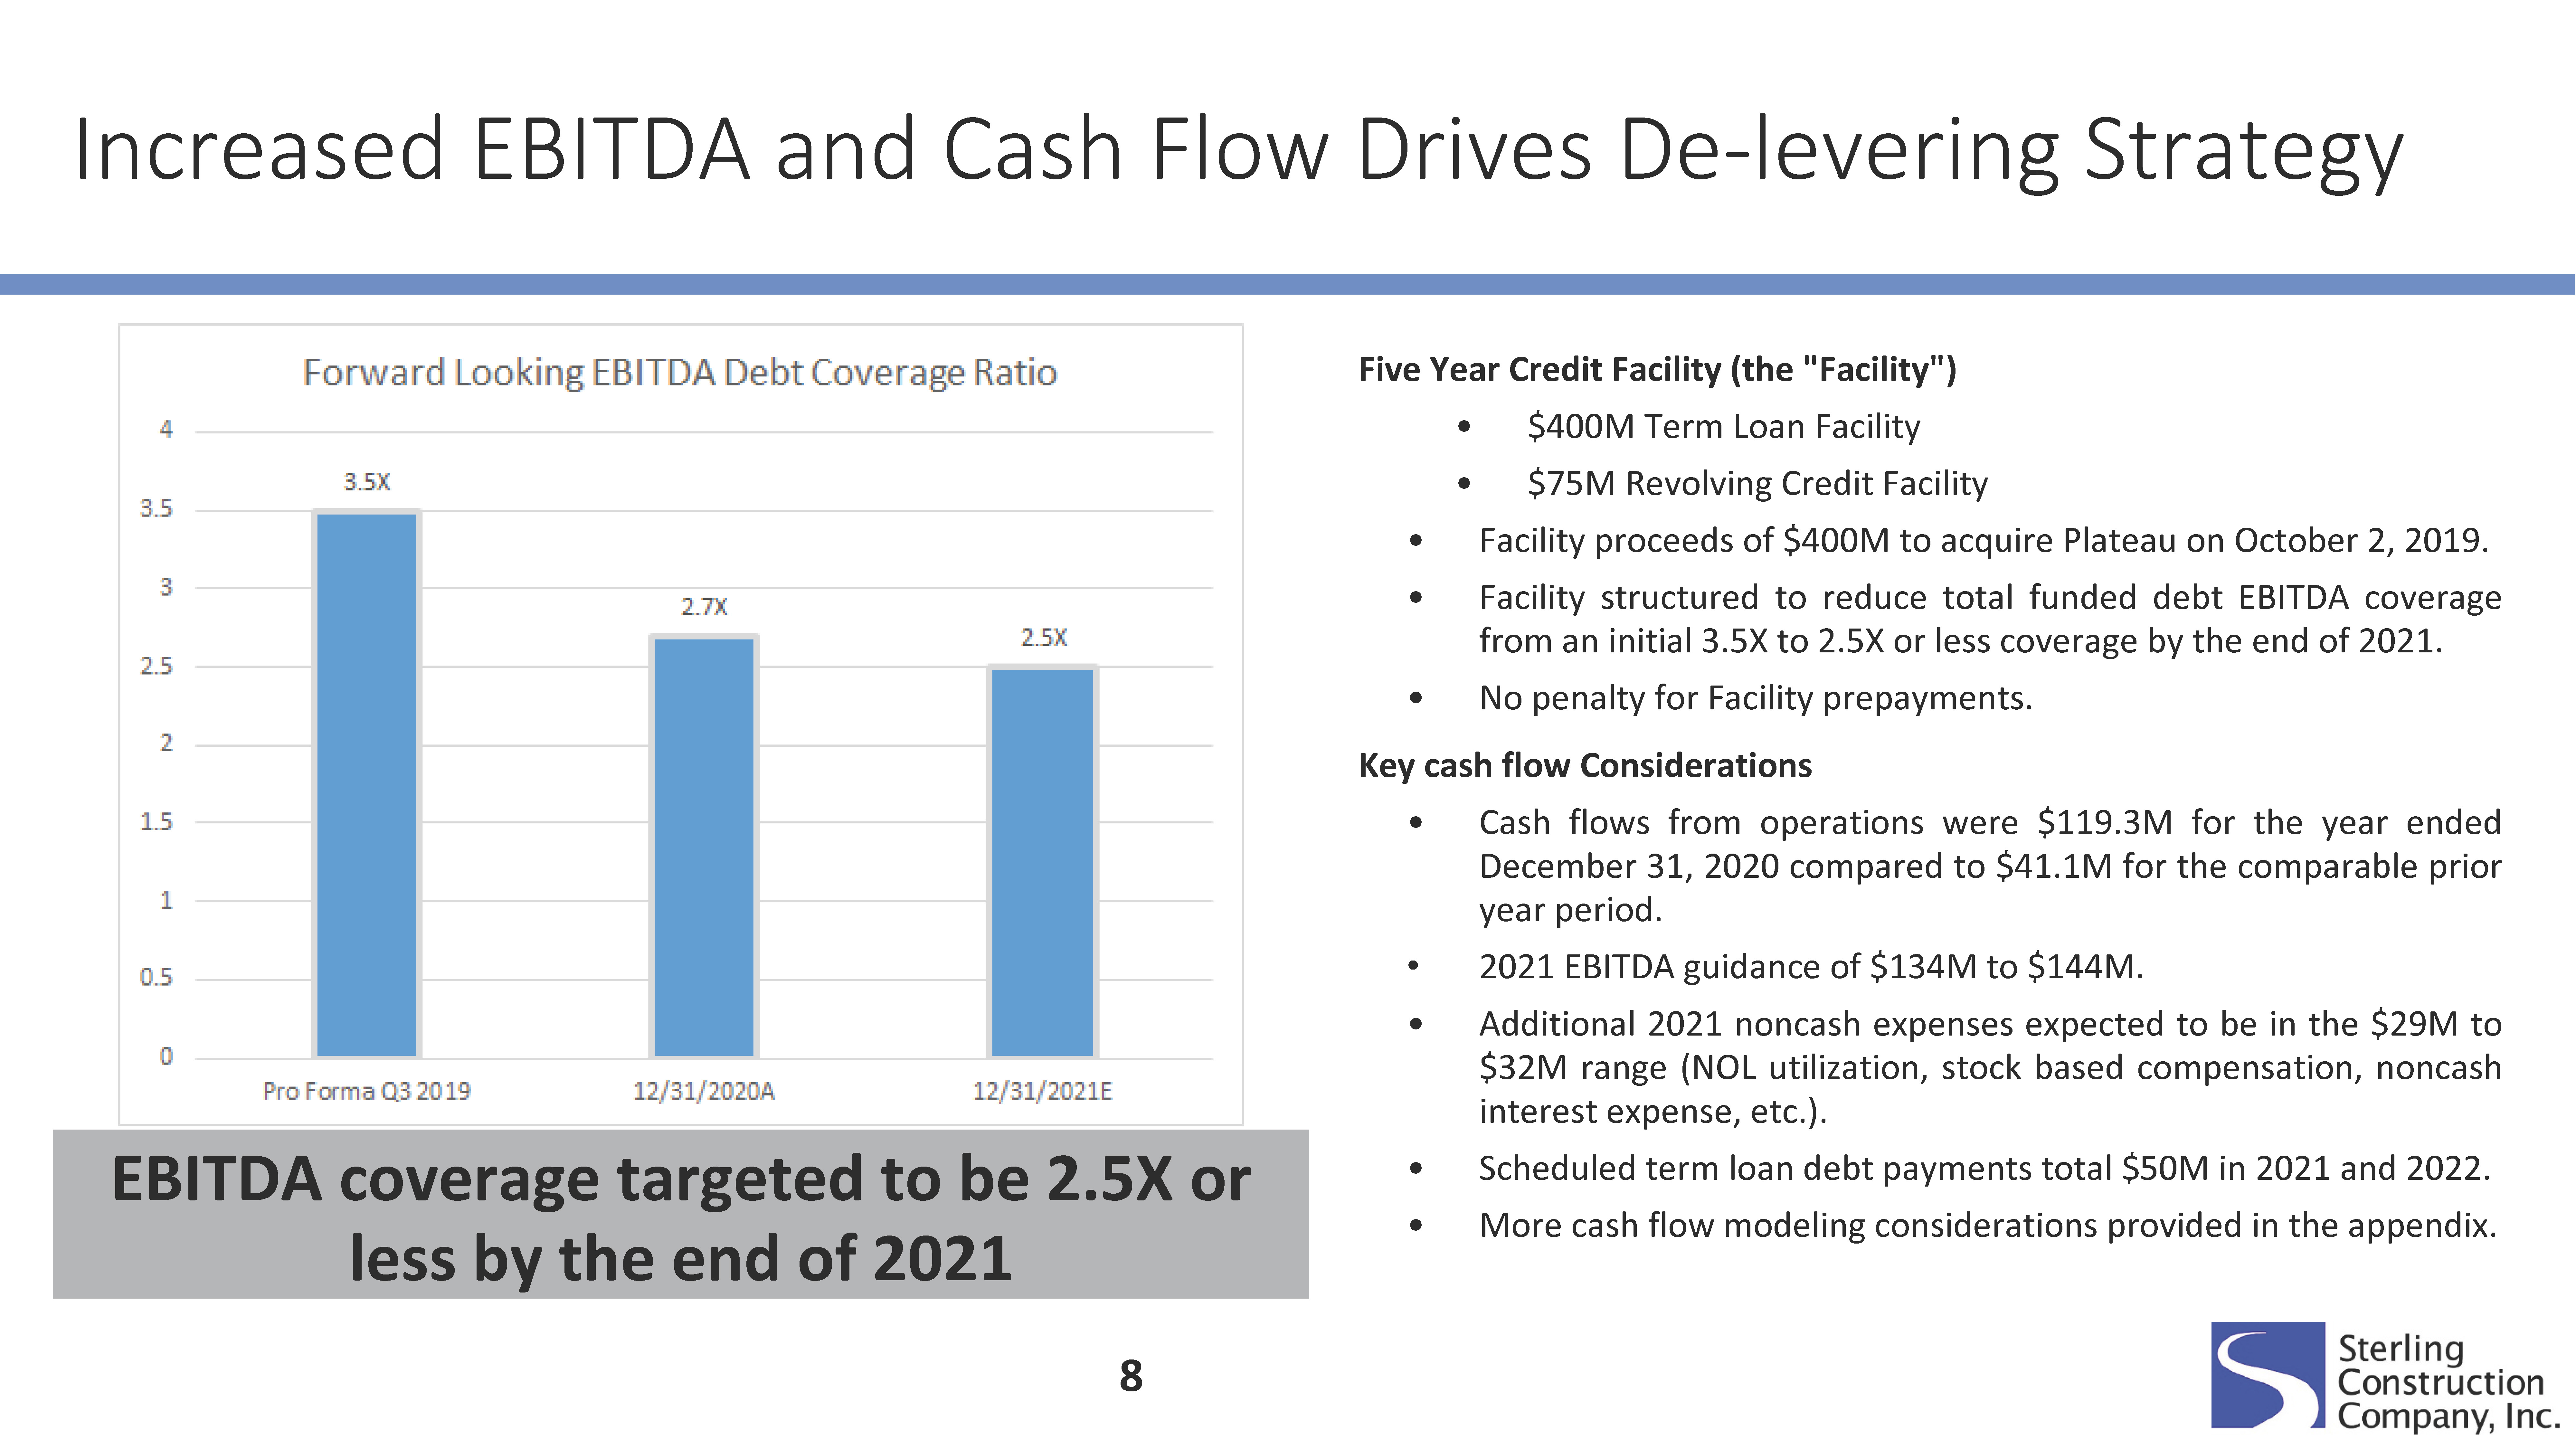
•Cash flows from operations were $119.3 million for the year ended December 31, 2020 compared to $41.1 million for the comparable prior year period;
•Debt totaled $368.7 million (or $302.5 million, net of cash) at December 31, 2020 compared to $433.1 million (or $387.4 million, net of cash) at December 31, 2019.
Heavy Civil and Specialty Services Backlog Highlights:
•Backlog at December 31, 2020 was $1.18 billion, up from $1.07 billion at December 31, 2019. Gross margin in Backlog increased approximately 50 basis points to 12.0% at December 31, 2020 from 11.5% at December 31, 2019.
•Combined Backlog at December 31, 2020 was $1.53 billion, up from $1.34 billion at December 31, 2019, and includes Unsigned Low-bid Awards of $356.9 million and $273.5 million at December 31, 2020 and December 31, 2019, respectively. Gross margin in Combined Backlog has increased approximately 80 basis points to 11.8% at December 31, 2020 from 11.0% at December 31, 2019.
2021 Full Year Revenue and Income Guidance:
•Revenues: $1.46 billion to $1.49 billion.
•Net Income: $52 million to $55 million.
•Expected dilutive average shares outstanding: 29.2 million.
(1) Adjusted basis excludes costs related to the acquisition of Plateau (including related refinancing) and non-cash taxes. See the “Reconciliation of Non-GAAP Supplemental Adjusted Financial Data” section below for more information.
(2) The Company defines Adjusted EBITDA as GAAP net income attributable to Sterling common stockholders, adjusted for depreciation and amortization, net interest expense, taxes, acquisition related costs, and loss on extinguishment of debt. See the “EBITDA Reconciliation” section below for more information.
CEO Remarks and Outlook
“We are very proud of what we, as a Company, have achieved in such a challenging year,” stated Joe Cutillo, Sterling’s Chief Executive Officer. “With our primary focus on the safety of our people during this pandemic, it is truly amazing how they all came together to deliver another record year. These results are a direct result of our people, our culture and our strategy.”
“Our Specialty Services segment continued its outstanding performance in bottom line results due in large part to consistent and highly effective project execution capabilities. Our Specialty Services backlog remains strong, as market demand for their highly specialized capabilities for large distribution centers, data centers and warehouses continues. Our Residential segment continued its healthy growth and expansion into the Houston market. Operating profit as a percentage of revenue dropped slightly year over year, as a result of second quarter temporary price concessions due to COVID and inflation and availability issues with materials. We were able to recoup the temporary price concessions in late 2020, and began passing on material increases in early 2021. The Texas home building market continues to remain strong. As a matter of fact, in the fourth quarter, we poured more slabs than any quarter in company history; something we view as indicative of continued relocation trends we have been seeing from other states to Texas. Lastly, our Heavy Civil segment operating income was up significantly from last year’s fourth quarter as we continue our shift away from low bid heavy highway projects. Going forward, we expect an improved revenue mix as we progress on the attractive alternative delivery projects we’ve booked in recent quarters,” continued Mr. Cutillo.
“We continue to demonstrate our ability to consistently generate cash. During 2020, we generated $119.3 million of cash flow from operations, and used that cash flow to make debt payments of $77.7 million and invested $30.5 million in capital expenditures, net of proceeds. We believe that we have more than adequate financial flexibility to continue our profitable growth and are in the very early stages of exploring some inorganic growth opportunities, either strategic tuck-in acquisitions, or another business unit that meets our criteria of low risk, high margin, high value add work,” added Mr. Cutillo.
Mr. Cutillo concluded, “Based on the anticipated pandemic recovery in the U.S., our strong Backlog and our view on current booking trends and market strength, we expect to generate full year 2021 revenues of between $1.46 billion and $1.49 billion, with a blended gross margin in the 13% to 14% range. Our expectation for 2021 net income attributable to Sterling common stockholders is between $52 million to $55 million. We expect our full year 2021 diluted average common shares outstanding to be approximately 29.2 million. Our 2021 net income guidance includes an effective income tax rate of approximately 30%.”
“We continue to be optimistic for a new infrastructure bill, but our 2021 outlook does not assume any major positive changes in government investment in infrastructure. We expect our 2021 EBITDA to be $134 million to $144 million. Given our strong operating performance in 2020, the continued vaccine rollout, our cash flow generation and debt reduction, we are very enthusiastic about our prospects for generating additional shareholder value during the full year of 2021.”
Conference Call
Sterling’s management will hold a conference call to discuss these results and recent corporate developments on Wednesday, March 3, 2021 at 9:00 a.m. ET/8:00 a.m. CT. Interested parties may participate in the call by dialing (201) 493-6744 or (877) 445-9755. Please call in ten minutes before the conference call is scheduled to begin and ask for the Sterling Construction call. To coincide with the conference call, Sterling will post a slide presentation at www.strlco.com on the Investor Presentations & Webcast section of the Investor Relations tab. Following management’s opening remarks, there will be a question and answer session.
To listen to a simultaneous webcast of the call, please go to the Company’s website at www.strlco.com at least fifteen minutes early to download and install any necessary audio software. If you are unable to listen live, the conference call webcast will be archived on the Company’s website for thirty days.
About Sterling
Sterling Construction Company, Inc. (“Sterling” or the “Company”) operates through a variety of subsidiaries within three segments specializing in Heavy Civil, Specialty Services and Residential projects in the United States (the “U.S.”), primarily across the southern U.S., the Rocky Mountain States, California and Hawaii, as well as other areas with strategic construction opportunities. Heavy Civil includes infrastructure and rehabilitation projects for highways, roads, bridges, airfields, ports, light rail, water, wastewater and storm drainage systems. Specialty Services projects include construction site excavation and drainage, drilling and blasting for excavation, foundations for multi-family homes, parking structures and other commercial concrete projects. Residential projects include concrete foundations for single-family homes.
Important Information for Investors and Stockholders
Non-GAAP Measures
This press release contains “Non-GAAP” financial measures as defined under Regulation G of the amended U.S. Securities Exchange Act of 1934. The Company reports financial results in accordance with U.S. generally accepted accounting principles (“GAAP”), but the Company believes that certain Non-GAAP financial measures provide useful supplemental information to investors regarding the underlying business trends and performance of the Company’s ongoing operations and are useful for period-over-period comparisons of those operations.
Non-GAAP measures include adjusted net income, adjusted EPS, EBITDA and adjusted EBITDA, in each case excluding the impacts of certain identified items. The excluded items represent items that the Company does not consider to be representative of its normal operations. The Company believes that these measures are useful for investors to review, because they provide a consistent measure of the underlying financial results of the Company’s ongoing business and, in the Company’s view, allow for a supplemental comparison against historical results and expectations for future performance. Furthermore, the Company uses each of these to measure the performance of the Company’s operations for budgeting, forecasting, as well as employee incentive compensation. However, Non-GAAP measures should not be considered as substitutes for net income, EPS, or other data prepared and reported in accordance with GAAP and should be viewed in addition to the Company’s reported results prepared in accordance with GAAP.
Reconciliations of these Non-GAAP financial measures to the most comparable GAAP measures are provided in the tables included in this press release.
Cautionary Statement Regarding Forward-Looking Statements
This press release contains statements that are considered forward-looking statements within the meaning of the federal securities laws. These forward-looking statements are subject to a number of risks and uncertainties, many of which are beyond our control, which may include statements about: the duration of the COVID-19 pandemic, additional actions that may be taken by governmental authorities to contain the COVID-19 pandemic or to address its impact, including the distribution, effectiveness and acceptance of vaccines, and the potential ongoing or further negative impact of the COVID-19 pandemic on the global economy and financial markets; our business strategy; our financial strategy; and our plans, objectives, expectations, forecasts, outlook and intentions. All of these types of statements, other than statements of historical fact included in this press release, are forward-looking statements. In some cases, forward-looking statements can be identified by terminology such as “may,” “will,” “could,” “should,” “expect,” “plan,” “project,” “intend,” “anticipate,” “believe,” “estimate,” “predict,” “potential,” “pursue,” “target,” “continue,” the negative of such terms or other comparable terminology. The forward-looking statements contained in this press release are largely based on our expectations, which reflect estimates and assumptions made by our management. These estimates and assumptions reflect our best judgment based on currently known market conditions and other factors. Although we believe such estimates and assumptions to be reasonable, they are inherently uncertain and involve a number of risks and uncertainties that are beyond our control. In addition, management’s assumptions about future events may prove to be inaccurate. Management cautions all readers that the forward-looking statements contained in this press release are not guarantees of future performance, and we cannot assure any reader that such statements will be realized or the forward-looking events and circumstances will occur. Actual results may differ materially from those anticipated or implied in the forward-looking statements due to factors listed in the “Risk Factors” section in our filings with the U.S. Securities and Exchange Commission (“SEC”) and elsewhere in those filings. The forward-looking statements speak only as of the date made, and other than as required by law, we do not intend to publicly update or revise any forward-looking statements as a result of new information, future events or otherwise. These cautionary statements qualify all forward-looking statements attributable to us or persons acting on our behalf.
Contact: Sterling Construction Company, Inc. Ron Ballschmiede, Chief Financial Officer 281-214-0800 | Investor Relations Counsel: The Equity Group Inc. Fred Buonocore, CFA 212-836-9607 Mike Gaudreau 212-836-9620 | ||||
STERLING CONSTRUCTION COMPANY, INC. & SUBSIDIARIES
CONSOLIDATED STATEMENTS OF OPERATIONS
(In thousands, except per share data)
| Three Months Ended December 31, | Twelve Months Ended December 31, | ||||||||||||||||||||||
| 2020 | 2019 | 2020 | 2019 | ||||||||||||||||||||
| Revenues | $ | 347,228 | $ | 346,544 | $ | 1,427,412 | $ | 1,126,278 | |||||||||||||||
| Cost of revenues | (300,619) | (312,965) | (1,236,043) | (1,018,484) | |||||||||||||||||||
| Gross profit | 46,609 | 33,579 | 191,369 | 107,794 | |||||||||||||||||||
| General and administrative expense | (20,206) | (16,898) | (71,415) | (49,200) | |||||||||||||||||||
| Intangible asset amortization | (2,867) | (2,895) | (11,436) | (4,695) | |||||||||||||||||||
| Acquisition related costs | (13) | (2,153) | (1,026) | (4,311) | |||||||||||||||||||
| Other operating expense, net | (2,611) | (1,901) | (12,600) | (11,837) | |||||||||||||||||||
| Operating income | 20,912 | 9,732 | 94,892 | 37,751 | |||||||||||||||||||
| Interest income | 15 | 156 | 161 | 1,142 | |||||||||||||||||||
| Interest expense | (6,840) | (7,698) | (29,377) | (16,686) | |||||||||||||||||||
| Loss on extinguishment of debt | (301) | (7,728) | (301) | (7,728) | |||||||||||||||||||
| Income before income taxes | 13,786 | (5,538) | 65,375 | 14,479 | |||||||||||||||||||
| Income tax (expense) benefit | (7,759) | 27,998 | (22,471) | 26,216 | |||||||||||||||||||
| Net income | 6,027 | 22,460 | 42,904 | 40,695 | |||||||||||||||||||
| Less: Net income attributable to noncontrolling interests | (203) | (159) | (598) | (794) | |||||||||||||||||||
| Net income attributable to Sterling common stockholders | $ | 5,824 | $ | 22,301 | $ | 42,306 | $ | 39,901 | |||||||||||||||
| Net income per share attributable to Sterling common stockholders: | |||||||||||||||||||||||
| Basic | $ | 0.21 | $ | 0.81 | $ | 1.52 | $ | 1.50 | |||||||||||||||
| Diluted | $ | 0.20 | $ | 0.79 | $ | 1.50 | $ | 1.47 | |||||||||||||||
| Weighted average common shares outstanding: | |||||||||||||||||||||||
| Basic | 28,043 | 27,612 | 27,859 | 26,671 | |||||||||||||||||||
| Diluted | 29,019 | 28,201 | 28,195 | 27,119 | |||||||||||||||||||
STERLING CONSTRUCTION COMPANY, INC. & SUBSIDIARIES
SEGMENT INFORMATION
(In thousands)
| Three Months Ended December 31, | Twelve Months Ended December 31, | ||||||||||||||||||||||||||||||||||||||||||||||
| 2020 | % of Revenues | 2019 | % of Revenues | 2020 | % of Revenues | 2019 | % of Revenues | ||||||||||||||||||||||||||||||||||||||||
| Revenues | |||||||||||||||||||||||||||||||||||||||||||||||
| Heavy Civil | $ | 176,683 | 51% | $ | 190,690 | 55% | $ | 753,824 | 52% | $ | 760,325 | 67% | |||||||||||||||||||||||||||||||||||
| Specialty Services | 128,497 | 37% | 121,388 | 35% | 508,894 | 36% | 212,824 | 19% | |||||||||||||||||||||||||||||||||||||||
| Residential | 42,048 | 12% | 34,466 | 10% | 164,694 | 12% | 153,129 | 14% | |||||||||||||||||||||||||||||||||||||||
| Total Revenues | $ | 347,228 | $ | 346,544 | $ | 1,427,412 | $ | 1,126,278 | |||||||||||||||||||||||||||||||||||||||
| Operating Income | |||||||||||||||||||||||||||||||||||||||||||||||
| Heavy Civil | $ | 1,857 | 1.1% | $ | (7,704) | NM | $ | 4,536 | 0.6% | $ | 3,316 | 0.4% | |||||||||||||||||||||||||||||||||||
| Specialty Services | 14,749 | 11.5% | 14,923 | 12.3% | 70,583 | 13.9% | 18,207 | 8.6% | |||||||||||||||||||||||||||||||||||||||
| Residential | 4,319 | 10.3% | 4,666 | 13.5% | 20,799 | 12.6% | 20,539 | 13.4% | |||||||||||||||||||||||||||||||||||||||
| Subtotal | 20,925 | 6.0% | 11,885 | 3.4% | 95,918 | 6.7% | 42,062 | 3.7% | |||||||||||||||||||||||||||||||||||||||
| Acquisition related costs | (13) | (2,153) | (1,026) | (4,311) | |||||||||||||||||||||||||||||||||||||||||||
| Total Operating Income | $ | 20,912 | 6.0% | $ | 9,732 | 2.8% | $ | 94,892 | 6.6% | $ | 37,751 | 3.4% | |||||||||||||||||||||||||||||||||||
NM - Not meaningful | |||||||||||||||||||||||||||||||||||||||||||||||
STERLING CONSTRUCTION COMPANY, INC. & SUBSIDIARIES
CONSOLIDATED BALANCE SHEETS
(In thousands, except per share data)
| December 31, 2020 | December 31, 2019 | ||||||||||
| Assets | |||||||||||
| Current assets: | |||||||||||
| Cash and cash equivalents | $ | 66,185 | $ | 45,733 | |||||||
| Accounts receivable | 177,424 | 168,872 | |||||||||
| Contract assets | 84,975 | 94,679 | |||||||||
| Receivables from and equity in construction joint ventures | 16,653 | 9,196 | |||||||||
| Other current assets | 16,306 | 11,790 | |||||||||
| Total current assets | 361,543 | 330,270 | |||||||||
| Property and equipment, net | 126,668 | 116,030 | |||||||||
| Operating lease right-of-use assets | 16,515 | 13,979 | |||||||||
| Goodwill | 192,014 | 191,892 | |||||||||
| Other intangibles, net | 244,887 | 256,323 | |||||||||
| Deferred tax asset, net | 7,817 | 26,012 | |||||||||
| Other non-current assets, net | 3,250 | 183 | |||||||||
| Total assets | $ | 952,694 | $ | 934,689 | |||||||
| Liabilities and Stockholders’ Equity | |||||||||||
| Current liabilities: | |||||||||||
| Accounts payable | $ | 95,201 | $ | 137,593 | |||||||
| Contract liabilities | 114,019 | 57,760 | |||||||||
| Current maturities of long-term debt | 77,434 | 42,473 | |||||||||
| Current portion of long-term lease obligations | 7,588 | 7,095 | |||||||||
| Income taxes payable | — | 1,212 | |||||||||
| Accrued compensation | 18,013 | 13,727 | |||||||||
| Other current liabilities | 9,629 | 6,393 | |||||||||
| Total current liabilities | 321,884 | 266,253 | |||||||||
| Long-term debt | 291,249 | 390,627 | |||||||||
| Long-term lease obligations | 8,958 | 6,976 | |||||||||
| Members’ interest subject to mandatory redemption and undistributed earnings | 51,290 | 49,003 | |||||||||
| Other long-term liabilities | 10,584 | 619 | |||||||||
| Total liabilities | 683,965 | 713,478 | |||||||||
| Stockholders’ equity: | |||||||||||
| Common stock | 283 | 283 | |||||||||
| Additional paid in capital | 256,423 | 251,019 | |||||||||
| Treasury Stock, at cost | (1,445) | (6,142) | |||||||||
| Retained earnings (deficit) | 17,273 | (25,033) | |||||||||
| Accumulated other comprehensive loss | (5,264) | (209) | |||||||||
| Total Sterling stockholders’ equity | 267,270 | 219,918 | |||||||||
| Noncontrolling interests | 1,459 | 1,293 | |||||||||
| Total stockholders’ equity | 268,729 | 221,211 | |||||||||
| Total liabilities and stockholders’ equity | $ | 952,694 | $ | 934,689 | |||||||
STERLING CONSTRUCTION COMPANY, INC. & SUBSIDIARIES
CONSOLIDATED STATEMENTS OF CASH FLOWS
(In thousands)
| Twelve Months Ended December 31, | |||||||||||
| 2020 | 2019 | ||||||||||
| Cash flows from operating activities: | |||||||||||
| Net income | $ | 42,904 | $ | 40,695 | |||||||
| Adjustments to reconcile net income to net cash provided by operating activities: | |||||||||||
| Depreciation and amortization | 32,785 | 20,740 | |||||||||
| Amortization of debt issuance costs and non-cash interest | 3,193 | 3,393 | |||||||||
| Gain on disposal of property and equipment | (1,495) | (527) | |||||||||
| Loss on debt extinguishment | 301 | 4,334 | |||||||||
| Deferred taxes | 19,439 | (27,398) | |||||||||
| Stock-based compensation expense | 11,643 | 3,788 | |||||||||
| Change in interest rate swap | 265 | (30) | |||||||||
| Changes in operating assets and liabilities | 10,248 | (3,902) | |||||||||
| Net cash provided by operating activities | 119,283 | 41,093 | |||||||||
| Cash flows from investing activities: | |||||||||||
| Plateau acquisition, net of cash acquired | — | (396,323) | |||||||||
| Capital expenditures | (32,864) | (15,397) | |||||||||
| Proceeds from sale of property and equipment | 2,373 | 1,334 | |||||||||
| Net cash used in investing activities | (30,491) | (410,386) | |||||||||
| Cash flows from financing activities: | |||||||||||
| Cash received from credit facility | — | 430,000 | |||||||||
| Repayments of debt | (77,745) | (87,621) | |||||||||
| Distributions to noncontrolling interest owners | (432) | (7,360) | |||||||||
| Purchase of treasury stock | — | (3,201) | |||||||||
| Debt issuance costs | — | (10,688) | |||||||||
| Other | 9,837 | (199) | |||||||||
| Net cash (used in) provided by financing activities | (68,340) | 320,931 | |||||||||
| Net change in cash and cash equivalents | 20,452 | (48,362) | |||||||||
| Cash and cash equivalents at beginning of period | 45,733 | 94,095 | |||||||||
| Cash and cash equivalents at end of period | $ | 66,185 | $ | 45,733 | |||||||
STERLING CONSTRUCTION COMPANY, INC. & SUBSIDIARIES
CONSOLIDATED STATEMENTS OF OPERATIONS
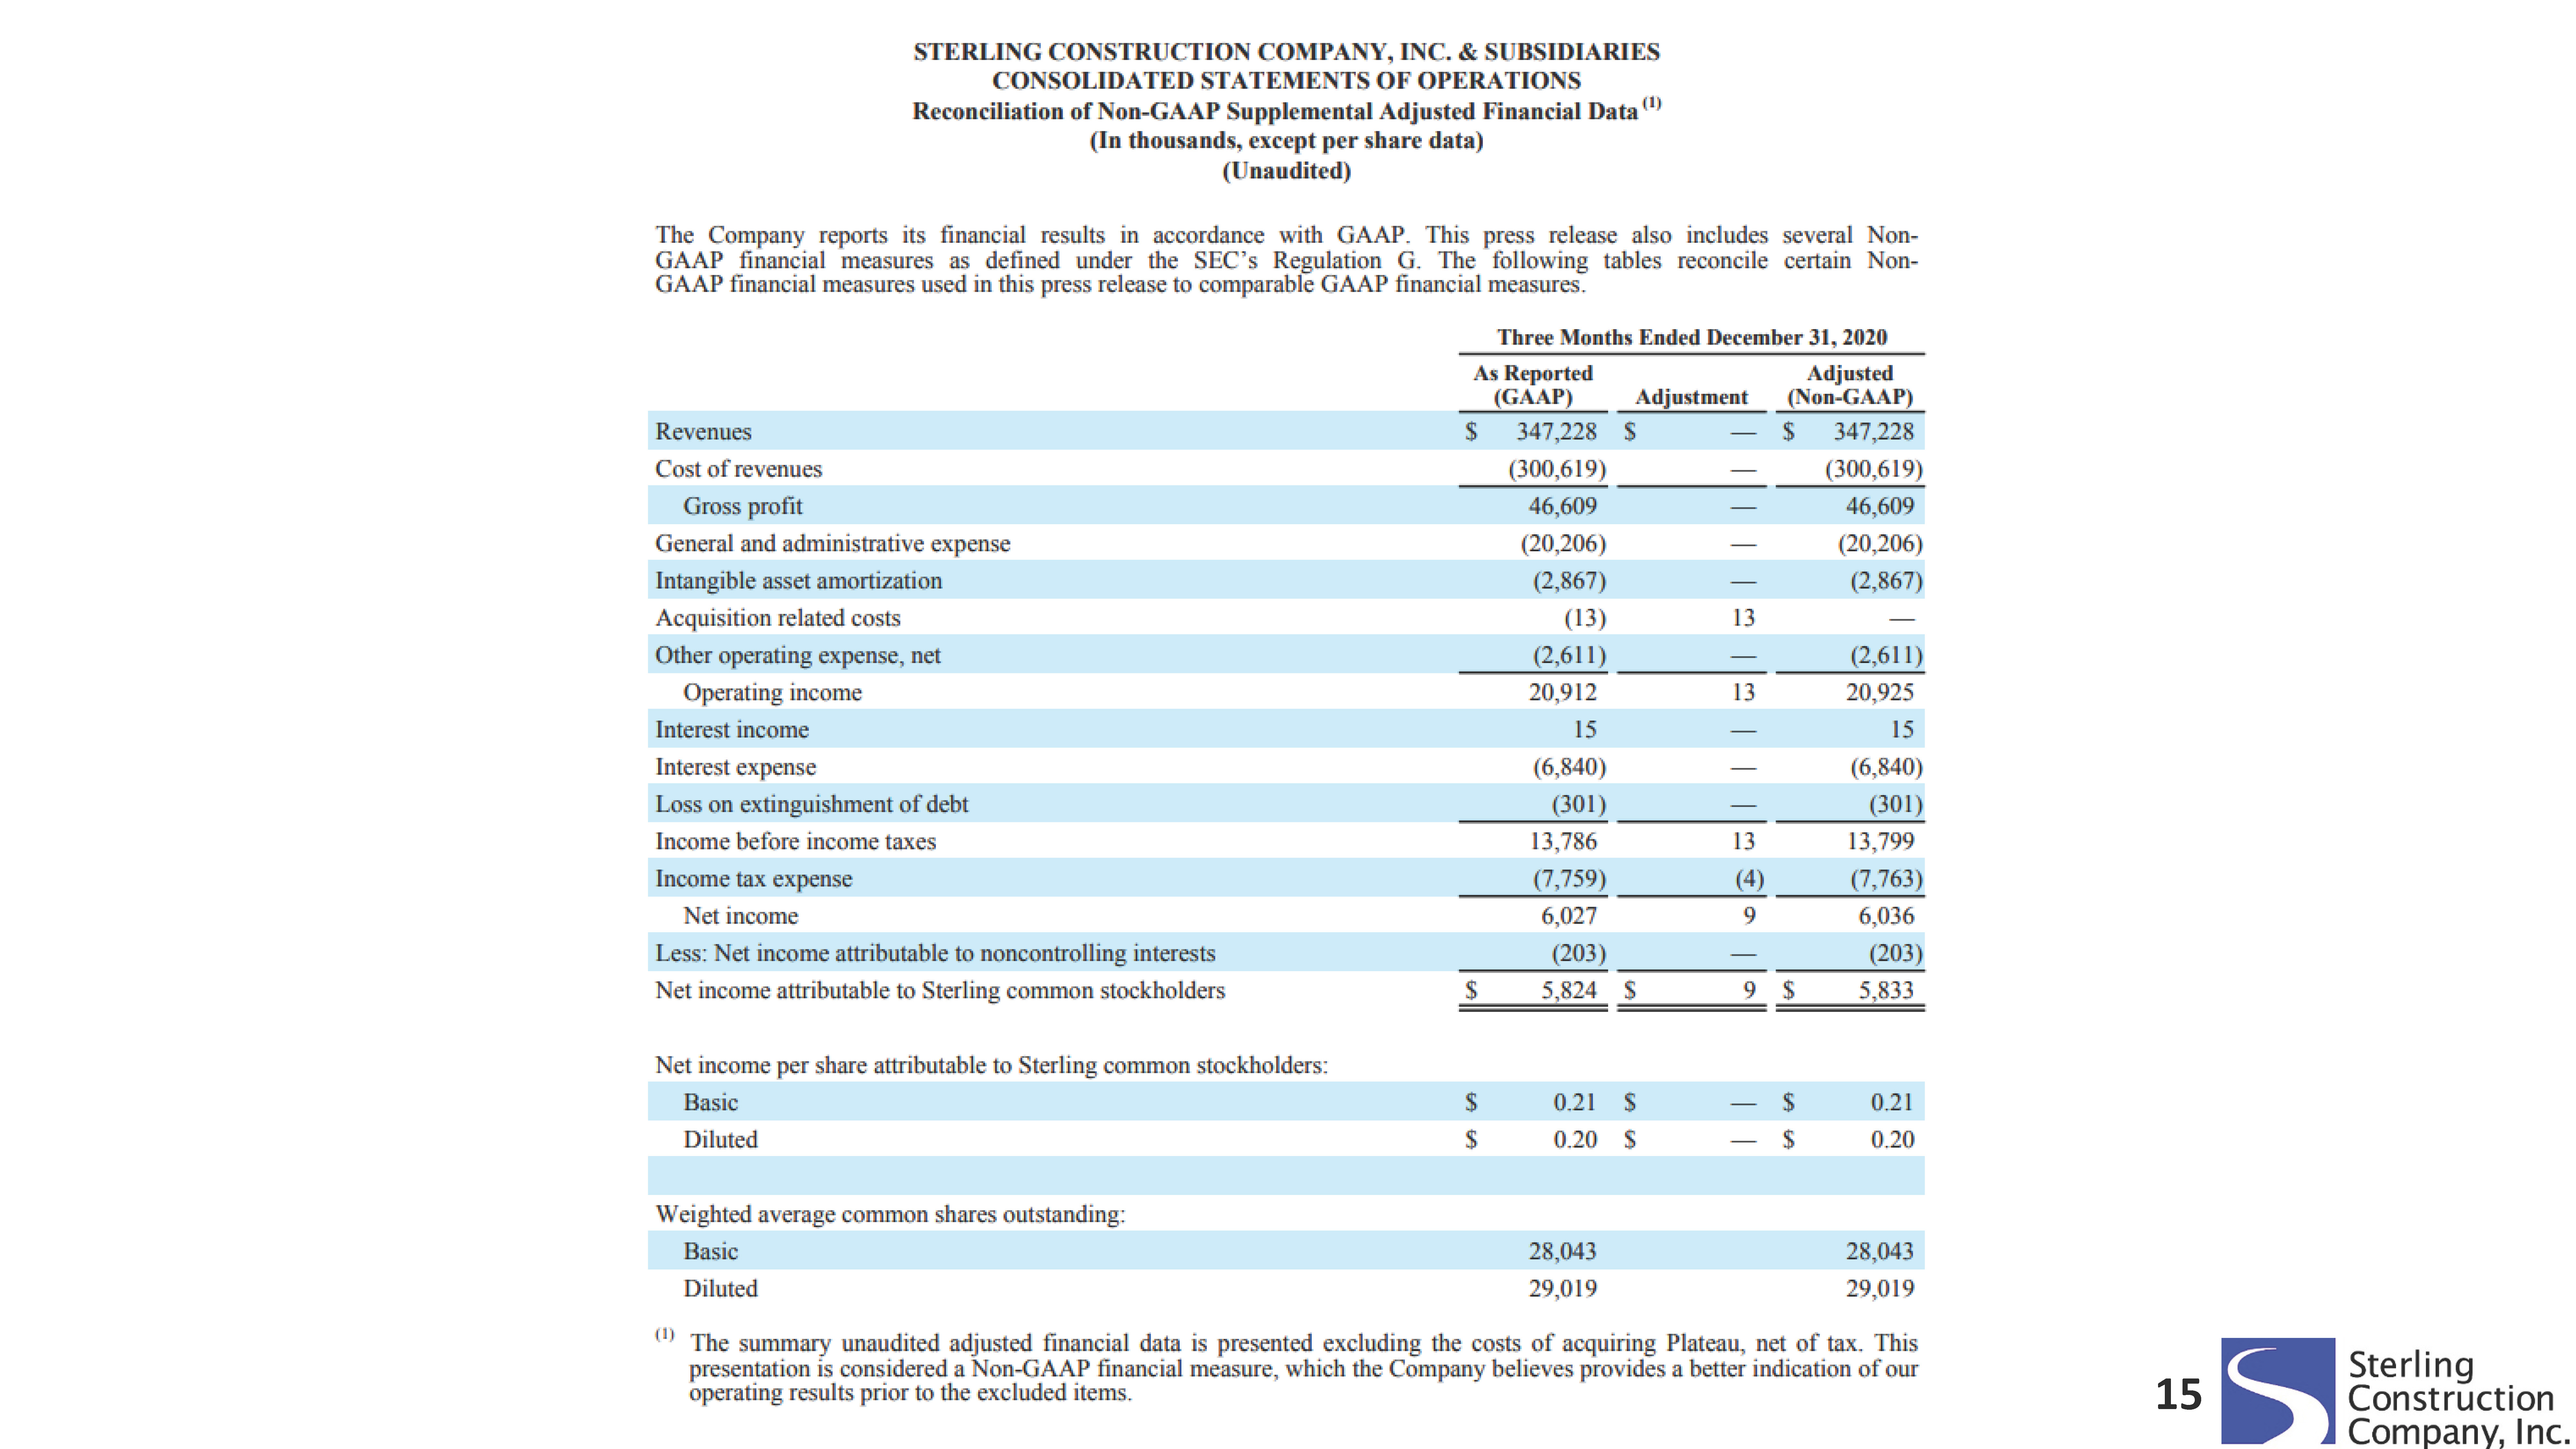
Reconciliation of Non-GAAP Supplemental Adjusted Financial Data (1)
(In thousands, except per share data)
(Unaudited)
| The Company reports its financial results in accordance with GAAP. This press release also includes several Non-GAAP financial measures as defined under the SEC’s Regulation G. The following tables reconcile certain Non-GAAP financial measures used in this press release to comparable GAAP financial measures. | |||||||||||||||||
| Three Months Ended December 31, 2020 | |||||||||||||||||
| As Reported (GAAP) | Adjustment | Adjusted (Non-GAAP) | |||||||||||||||
| Revenues | $ | 347,228 | $ | — | $ | 347,228 | |||||||||||
| Cost of revenues | (300,619) | — | (300,619) | ||||||||||||||
| Gross profit | 46,609 | — | 46,609 | ||||||||||||||
| General and administrative expense | (20,206) | — | (20,206) | ||||||||||||||
| Intangible asset amortization | (2,867) | — | (2,867) | ||||||||||||||
| Acquisition related costs | (13) | 13 | — | ||||||||||||||
| Other operating expense, net | (2,611) | — | (2,611) | ||||||||||||||
| Operating income | 20,912 | 13 | 20,925 | ||||||||||||||
| Interest income | 15 | — | 15 | ||||||||||||||
| Interest expense | (6,840) | — | (6,840) | ||||||||||||||
| Loss on extinguishment of debt | (301) | — | (301) | ||||||||||||||
| Income before income taxes | 13,786 | 13 | 13,799 | ||||||||||||||
| Income tax expense | (7,759) | (4) | (7,763) | ||||||||||||||
| Net income | 6,027 | 9 | 6,036 | ||||||||||||||
| Less: Net income attributable to noncontrolling interests | (203) | — | (203) | ||||||||||||||
| Net income attributable to Sterling common stockholders | $ | 5,824 | $ | 9 | $ | 5,833 | |||||||||||
| Net income per share attributable to Sterling common stockholders: | |||||||||||||||||
| Basic | $ | 0.21 | $ | — | $ | 0.21 | |||||||||||
| Diluted | $ | 0.20 | $ | — | $ | 0.20 | |||||||||||
| Weighted average common shares outstanding: | |||||||||||||||||
| Basic | 28,043 | 28,043 | |||||||||||||||
| Diluted | 29,019 | 29,019 | |||||||||||||||
(1) The summary unaudited adjusted financial data is presented excluding the costs of acquiring Plateau, net of tax. This presentation is considered a Non-GAAP financial measure, which the Company believes provides a better indication of our operating results prior to the excluded items. | |||||||||||||||||
STERLING CONSTRUCTION COMPANY, INC. & SUBSIDIARIES
CONSOLIDATED STATEMENTS OF OPERATIONS
Reconciliation of Non-GAAP Supplemental Adjusted Financial Data (1)
(In thousands, except per share data)
(Unaudited)
| The Company reports its financial results in accordance with GAAP. This press release also includes several Non-GAAP financial measures as defined under the SEC’s Regulation G. The following tables reconcile certain Non-GAAP financial measures used in this press release to comparable GAAP financial measures. | |||||||||||||||||
| Three Months Ended December 31, 2019 | |||||||||||||||||
| As Reported (GAAP) | Adjustment | Adjusted (Non-GAAP) | |||||||||||||||
| Revenues | $ | 346,544 | $ | — | $ | 346,544 | |||||||||||
| Cost of revenues | (312,965) | — | (312,965) | ||||||||||||||
| Gross profit | 33,579 | — | 33,579 | ||||||||||||||
| General and administrative expense | (16,898) | — | (16,898) | ||||||||||||||
| Intangible asset amortization | (2,895) | — | (2,895) | ||||||||||||||
| Acquisition related costs | (2,153) | 2,153 | — | ||||||||||||||
| Other operating expense, net | (1,901) | — | (1,901) | ||||||||||||||
| Operating income | 9,732 | 2,153 | 11,885 | ||||||||||||||
| Interest income | 156 | — | 156 | ||||||||||||||
| Interest expense | (7,698) | — | (7,698) | ||||||||||||||
| Loss on extinguishment of debt | (7,728) | 7,728 | — | ||||||||||||||
| Income before income taxes | (5,538) | 9,881 | 4,343 | ||||||||||||||
| Income tax benefit (expense) | 27,998 | (25,837) | 2,161 | ||||||||||||||
| Net income | 22,460 | (15,956) | 6,504 | ||||||||||||||
| Less: Net income attributable to noncontrolling interests | (159) | — | (159) | ||||||||||||||
| Net income attributable to Sterling common stockholders | $ | 22,301 | $ | (15,956) | $ | 6,345 | |||||||||||
| Net income per share attributable to Sterling common stockholders: | |||||||||||||||||
| Basic | $ | 0.81 | $ | (0.58) | $ | 0.23 | |||||||||||
| Diluted | $ | 0.79 | $ | (0.57) | $ | 0.22 | |||||||||||
| Weighted average common shares outstanding: | |||||||||||||||||
| Basic | 27,612 | 27,612 | |||||||||||||||
| Diluted | 28,201 | 28,201 | |||||||||||||||
(1) The summary unaudited adjusted financial data is presented excluding the costs of acquiring Plateau (including related refinancing) and non-cash taxes. This presentation is considered a Non-GAAP financial measure, which the Company believes provides a better indication of our operating results prior to the excluded items. | |||||||||||||||||
STERLING CONSTRUCTION COMPANY, INC. & SUBSIDIARIES
CONSOLIDATED STATEMENTS OF OPERATIONS
Reconciliation of Non-GAAP Supplemental Adjusted Financial Data (1)
(In thousands, except per share data)
(Unaudited)
| The Company reports its financial results in accordance with GAAP. This press release also includes several Non-GAAP financial measures as defined under the SEC’s Regulation G. The following tables reconcile certain Non-GAAP financial measures used in this press release to comparable GAAP financial measures. | |||||||||||||||||
| Twelve Months Ended December 31, 2020 | |||||||||||||||||
| As Reported (GAAP) | Adjustment | Adjusted (Non-GAAP) | |||||||||||||||
| Revenues | $ | 1,427,412 | $ | — | $ | 1,427,412 | |||||||||||
| Cost of revenues | (1,236,043) | — | (1,236,043) | ||||||||||||||
| Gross profit | 191,369 | — | 191,369 | ||||||||||||||
| General and administrative expense | (71,415) | — | (71,415) | ||||||||||||||
| Intangible asset amortization | (11,436) | — | (11,436) | ||||||||||||||
| Acquisition related costs | (1,026) | 1,026 | — | ||||||||||||||
| Other operating expense, net | (12,600) | — | (12,600) | ||||||||||||||
| Operating income | 94,892 | 1,026 | 95,918 | ||||||||||||||
| Interest income | 161 | — | 161 | ||||||||||||||
| Interest expense | (29,377) | — | (29,377) | ||||||||||||||
| Loss on extinguishment of debt | (301) | — | (301) | ||||||||||||||
| Income before income taxes | 65,375 | 1,026 | 66,401 | ||||||||||||||
| Income tax expense | (22,471) | (353) | (22,824) | ||||||||||||||
| Net income | 42,904 | 673 | 43,577 | ||||||||||||||
| Less: Net income attributable to noncontrolling interests | (598) | — | (598) | ||||||||||||||
| Net income attributable to Sterling common stockholders | $ | 42,306 | $ | 673 | $ | 42,979 | |||||||||||
| Net income per share attributable to Sterling common stockholders: | |||||||||||||||||
| Basic | $ | 1.52 | $ | 0.02 | $ | 1.54 | |||||||||||
| Diluted | $ | 1.50 | $ | 0.02 | $ | 1.52 | |||||||||||
| Weighted average common shares outstanding: | |||||||||||||||||
| Basic | 27,859 | 27,859 | |||||||||||||||
| Diluted | 28,195 | 28,195 | |||||||||||||||
(1) The summary unaudited adjusted financial data is presented excluding the costs of acquiring Plateau, net of tax. This presentation is considered a Non-GAAP financial measure, which the Company believes provides a better indication of our operating results prior to the excluded items. | |||||||||||||||||
STERLING CONSTRUCTION COMPANY, INC. & SUBSIDIARIES
CONSOLIDATED STATEMENTS OF OPERATIONS
Reconciliation of Non-GAAP Supplemental Adjusted Financial Data (1)
(In thousands, except per share data)
(Unaudited)
| The Company reports its financial results in accordance with GAAP. This press release also includes several Non-GAAP financial measures as defined under the SEC’s Regulation G. The following tables reconcile certain Non-GAAP financial measures used in this press release to comparable GAAP financial measures. | |||||||||||||||||
| Twelve Months Ended December 31, 2019 | |||||||||||||||||
| As Reported (GAAP) | Adjustment | Adjusted (Non-GAAP) | |||||||||||||||
| Revenues | $ | 1,126,278 | $ | — | $ | 1,126,278 | |||||||||||
| Cost of revenues | (1,018,484) | — | (1,018,484) | ||||||||||||||
| Gross profit | 107,794 | — | 107,794 | ||||||||||||||
| General and administrative expense | (49,200) | — | (49,200) | ||||||||||||||
| Intangible asset amortization | (4,695) | — | (4,695) | ||||||||||||||
| Acquisition related costs | (4,311) | 4,311 | — | ||||||||||||||
| Other operating expense, net | (11,837) | — | (11,837) | ||||||||||||||
| Operating income | 37,751 | 4,311 | 42,062 | ||||||||||||||
| Interest income | 1,142 | — | 1,142 | ||||||||||||||
| Interest expense | (16,686) | — | (16,686) | ||||||||||||||
| Loss on extinguishment of debt | (7,728) | 7,728 | — | ||||||||||||||
| Income before income taxes | 14,479 | 12,039 | 26,518 | ||||||||||||||
| Income tax benefit (expense) | 26,216 | (27,398) | (1,182) | ||||||||||||||
| Net income | 40,695 | (15,359) | 25,336 | ||||||||||||||
| Less: Net income attributable to noncontrolling interests | (794) | — | (794) | ||||||||||||||
| Net income attributable to Sterling common stockholders | $ | 39,901 | $ | (15,359) | $ | 24,542 | |||||||||||
| Net income per share attributable to Sterling common stockholders: | |||||||||||||||||
| Basic | $ | 1.50 | $ | (0.58) | $ | 0.92 | |||||||||||
| Diluted | $ | 1.47 | $ | (0.57) | $ | 0.90 | |||||||||||
| Weighted average common shares outstanding: | |||||||||||||||||
| Basic | 26,671 | 26,671 | |||||||||||||||
| Diluted | 27,119 | 27,119 | |||||||||||||||
(1) The summary unaudited adjusted financial data is presented excluding the costs of acquiring Plateau (including related refinancing) and non-cash taxes. This presentation is considered a Non-GAAP financial measure, which the Company believes provides a better indication of our operating results prior to the excluded items. | |||||||||||||||||
STERLING CONSTRUCTION COMPANY, INC. & SUBSIDIARIES
EBITDA Reconciliation
(In thousands)
(Unaudited)
| Three Months Ended December 31, | Twelve Months Ended December 31, | ||||||||||||||||||||||
| 2020 | 2019 | 2020 | 2019 | ||||||||||||||||||||
| Net income attributable to Sterling common stockholders | $ | 5,824 | $ | 22,301 | $ | 42,306 | $ | 39,901 | |||||||||||||||
| Depreciation and amortization | 8,146 | 8,452 | 32,785 | 20,740 | |||||||||||||||||||
| Interest expense, net of interest income | 6,825 | 7,542 | 29,216 | 15,544 | |||||||||||||||||||
| Income tax expense (benefit) | 7,759 | (27,998) | 22,471 | (26,216) | |||||||||||||||||||
| Loss on extinguishment of debt | 301 | 7,728 | 301 | 7,728 | |||||||||||||||||||
EBITDA (1) | 28,855 | 18,025 | 127,079 | 57,697 | |||||||||||||||||||
| Acquisition related costs | 13 | 2,153 | 1,026 | 4,311 | |||||||||||||||||||
Adjusted EBITDA (2) | $ | 28,868 | $ | 20,178 | $ | 128,105 | $ | 62,008 | |||||||||||||||
(1) The Company defines EBITDA as GAAP net income attributable to Sterling common stockholders, adjusted for depreciation and amortization, net interest expense, taxes, and loss on extinguishment of debt. | |||||||||||||||||||||||
(2) Adjusted EBITDA excludes the impact of acquisition related costs. | |||||||||||||||||||||||