Exhibit 99.1
NEWS RELEASE
For Immediate Release:
February 28, 2022
Sterling Reports Record Fourth Quarter and Full Year 2021 Results
EPS Continues to Outpace Expectations
Delivered Record Full Year Operating Cash Flow
Provides 2022 Full Year Revenue and Net Income Guidance
THE WOODLANDS, TX – February 28, 2022 – Sterling Construction Company, Inc. (NasdaqGS: STRL) (“Sterling” or the “Company”) today announced financial results for the fourth quarter and full year 2021.
Fourth Quarter 2021 Results (as compared to Fourth Quarter 2020)
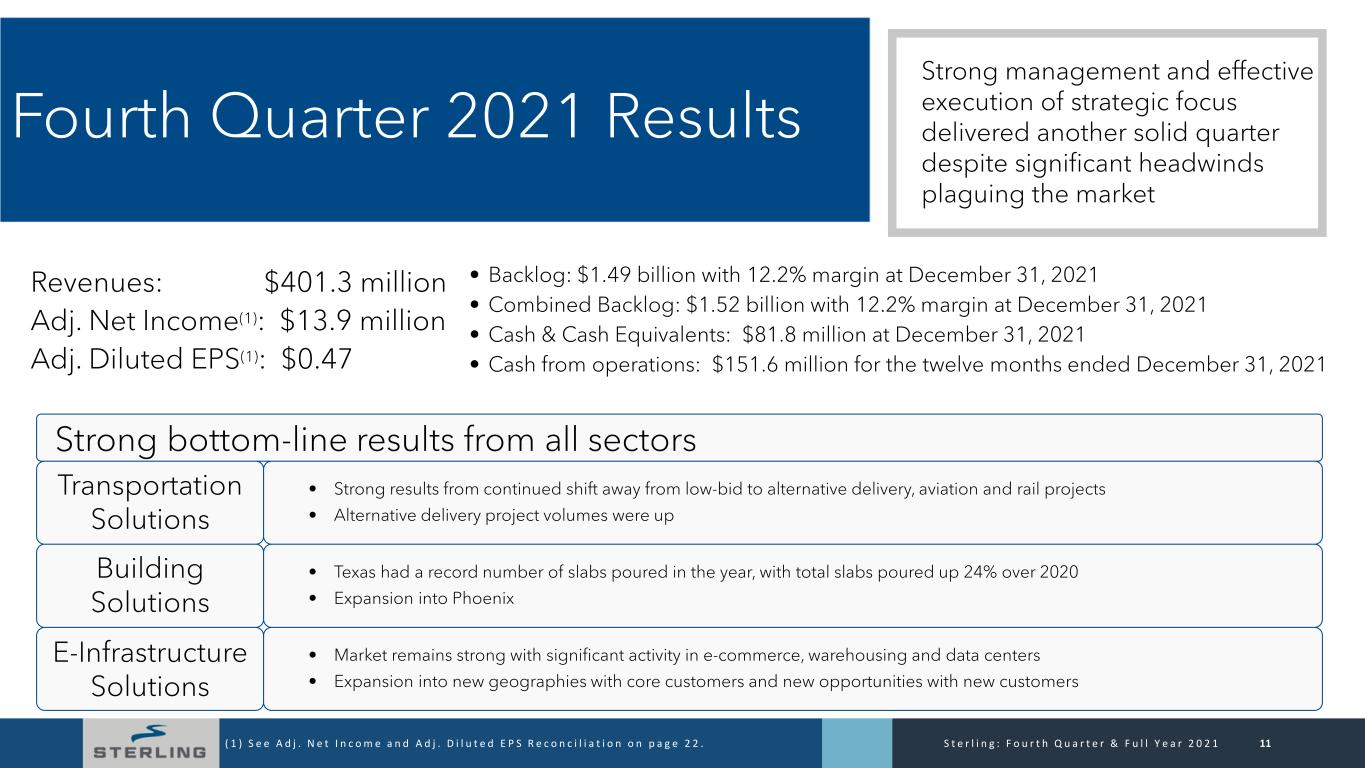
•Total Revenue of $401.3 million, an increase of 15.6%
•Net Income was $10.9 million, or $0.37 per diluted share, an increase of 87.3%; Adjusted Net Income(1) of $13.9 million or $0.47 per diluted share, an increase of 137.5%
•EBITDA(2) of $28.1 million, a decrease of 2.7%; Adjusted EBITDA(2) of $32.0 million, an increase of 10.7%
•Cash and Cash Equivalents totaled $81.8 million at December 31, 2021
•Total backlog at December 31, 2021 was $1.49 billion, an increase of 27.0%
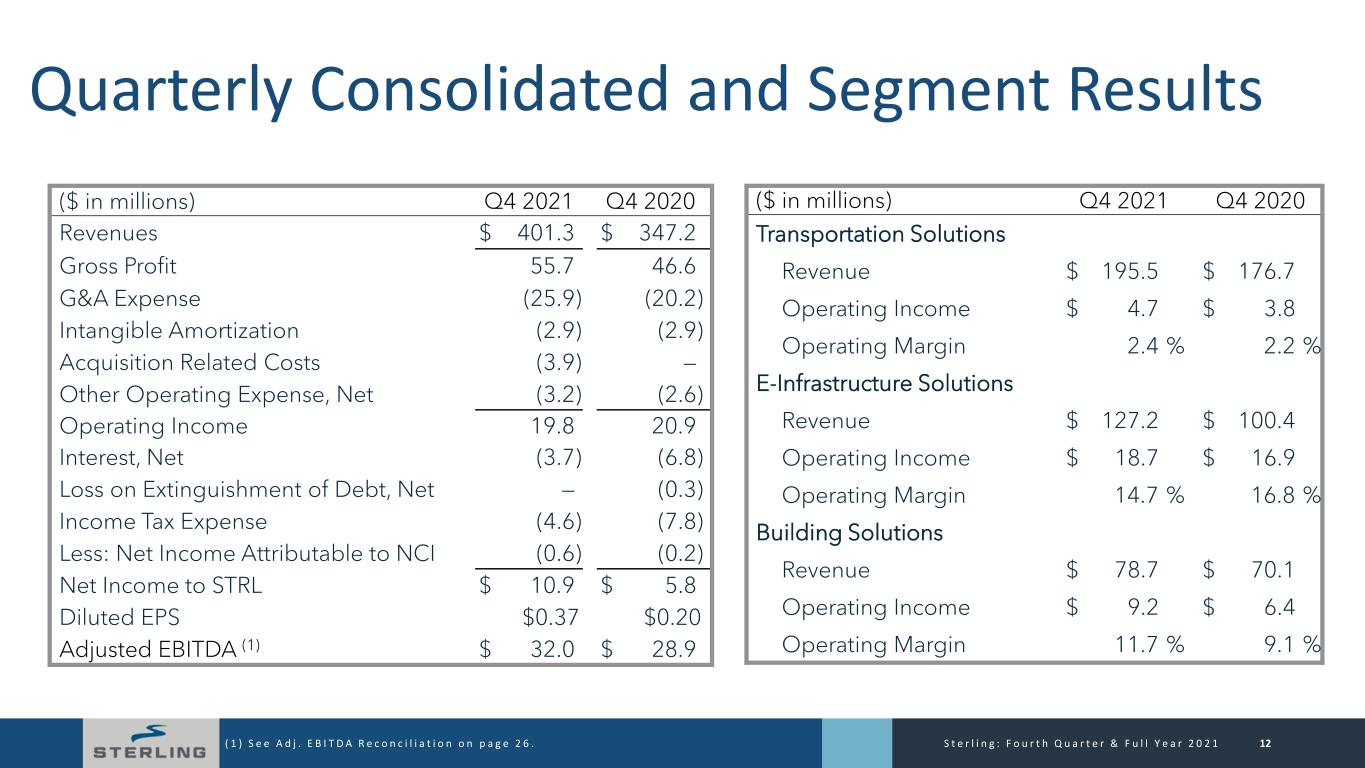
For the three months ended December 31, 2021, the Company reported net income of $10.9 million, or $0.37 per diluted share, versus $5.8 million, or $0.20 per diluted share, in the fourth quarter 2020. Revenue increased by 15.6% on a year-over-year basis in the fourth quarter of 2021, supported by broad-based growth across the E-Infrastructure, Building and Transportation solutions segments. EBITDA increased 10.7% to $32.0 million in the fourth quarter of 2021, versus $28.9 million in the prior-year period. Fourth quarter Adjusted EBITDA benefited from strong revenue growth from each segment, partially offset by ongoing supply chain and inflation challenges.
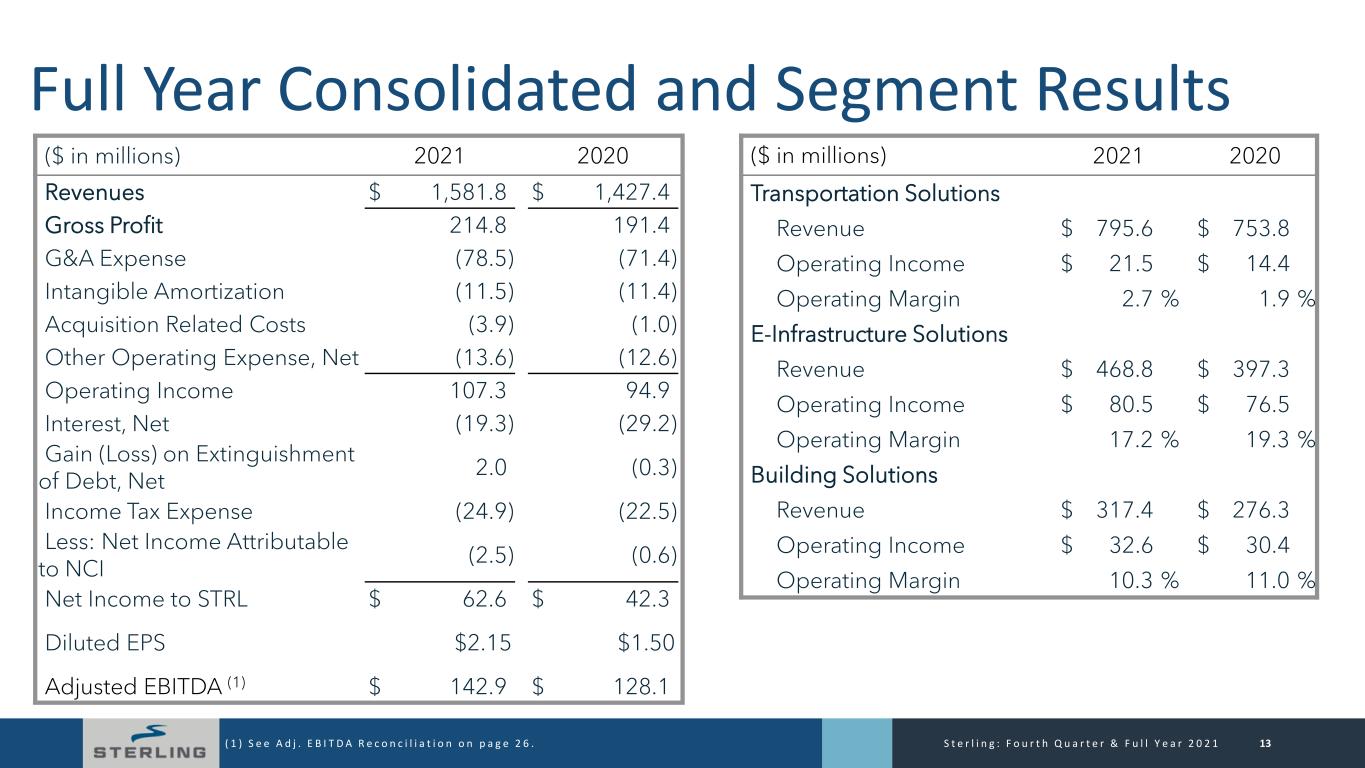
For the full-year ended December 31, 2021, the Company reported net income of $62.6 million, or $2.15 per diluted share, versus $42.3 million, or $1.50 per diluted share, for 2020. Revenue increased by 10.8% on a year-over-year basis for the full-year 2021, driven by solid growth across all segments. Adjusted EBITDA increased 11.5% to $142.9 million for the full-year 2021, versus $128.1 million in the prior-year period. Full-year Adjusted EBITDA benefited from strong revenue growth from each segment and was partially offset by ongoing supply chain and inflation challenges that impacted gross margin realization.
Backlog at December 31, 2021 increased to $1.49 billion, versus $1.18 billion at the prior year-end period. The year-end 2021 backlog includes $210.6 million related to the late December 2021 acquisition of Petillo.
BUSINESS UPDATE
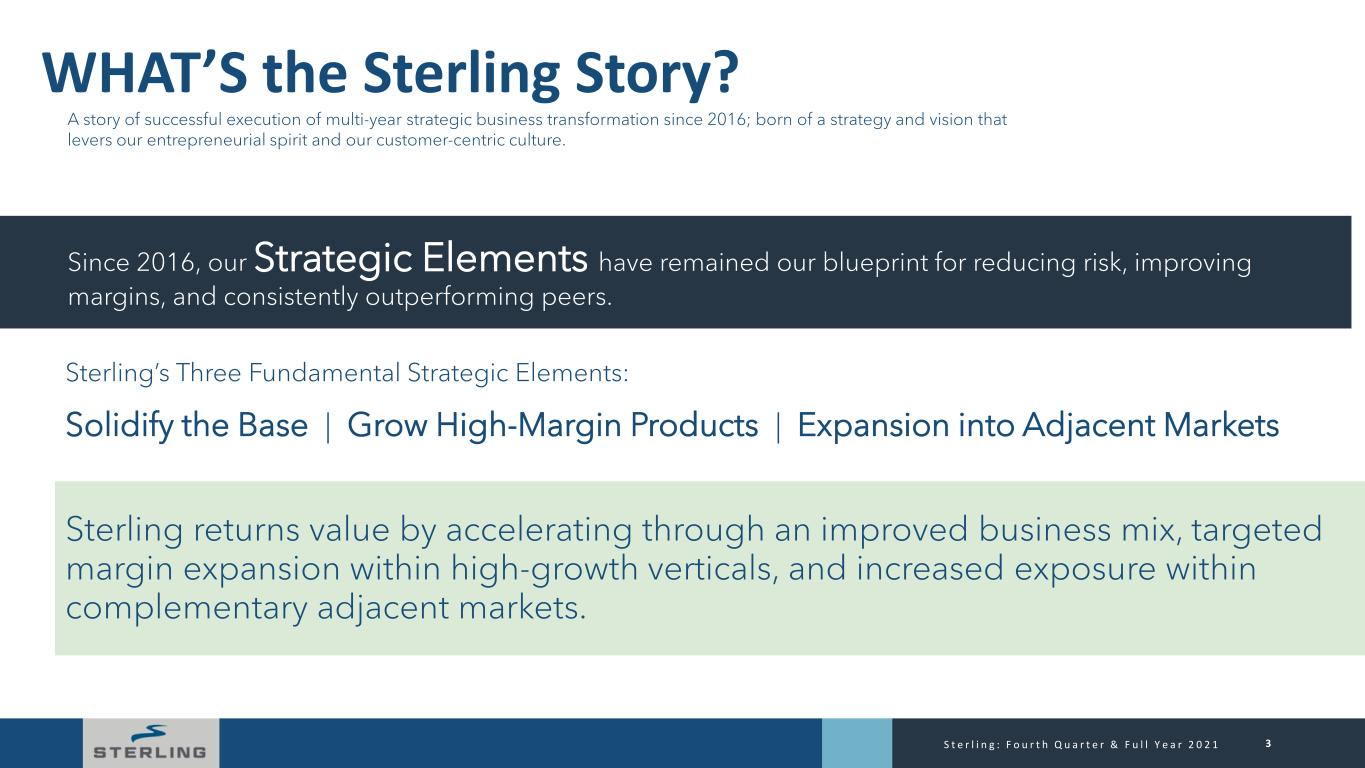
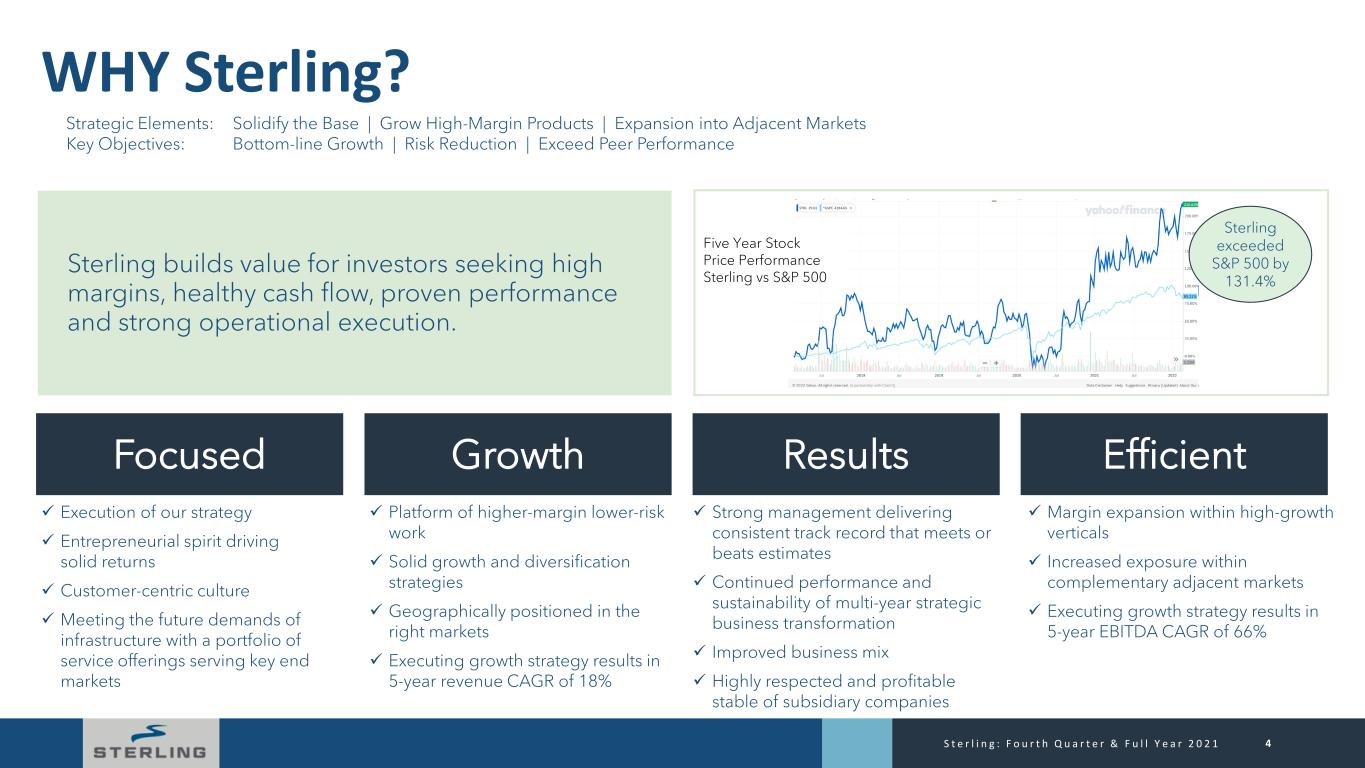
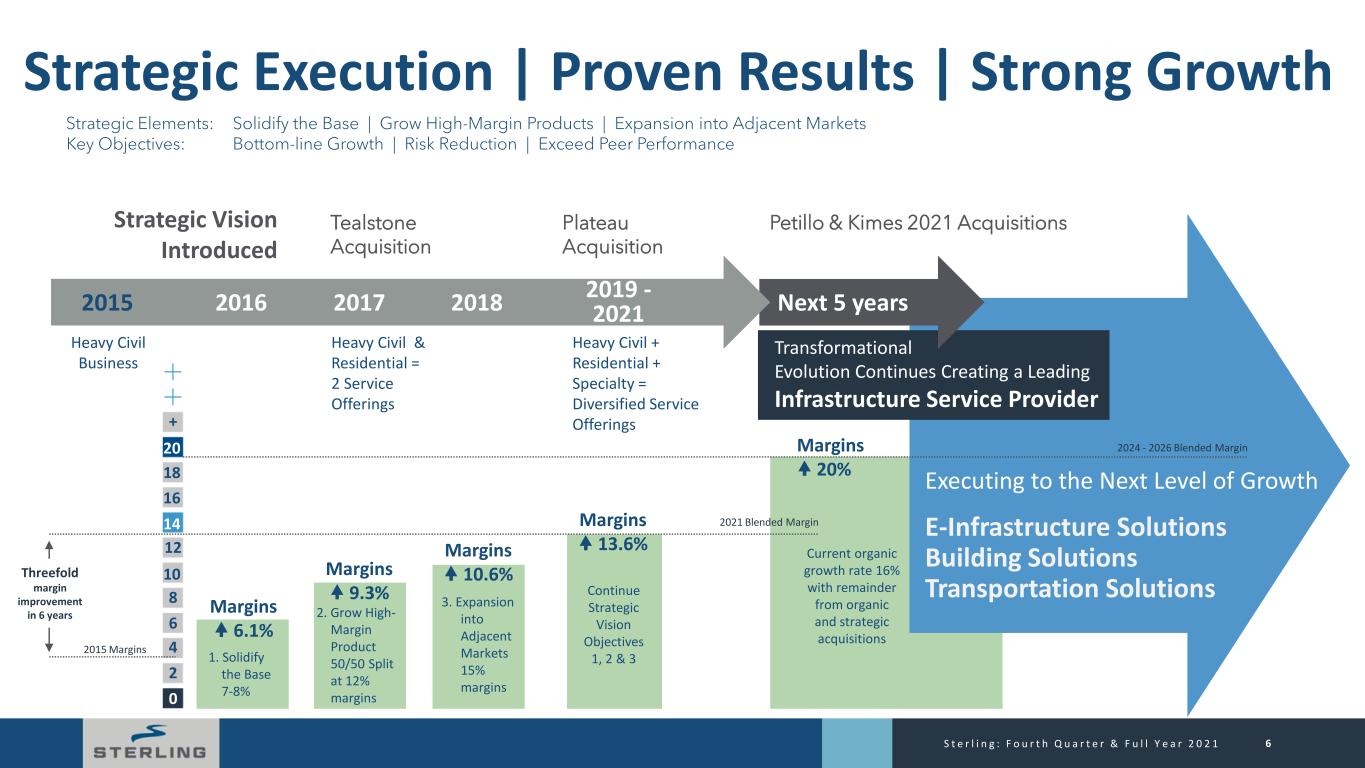
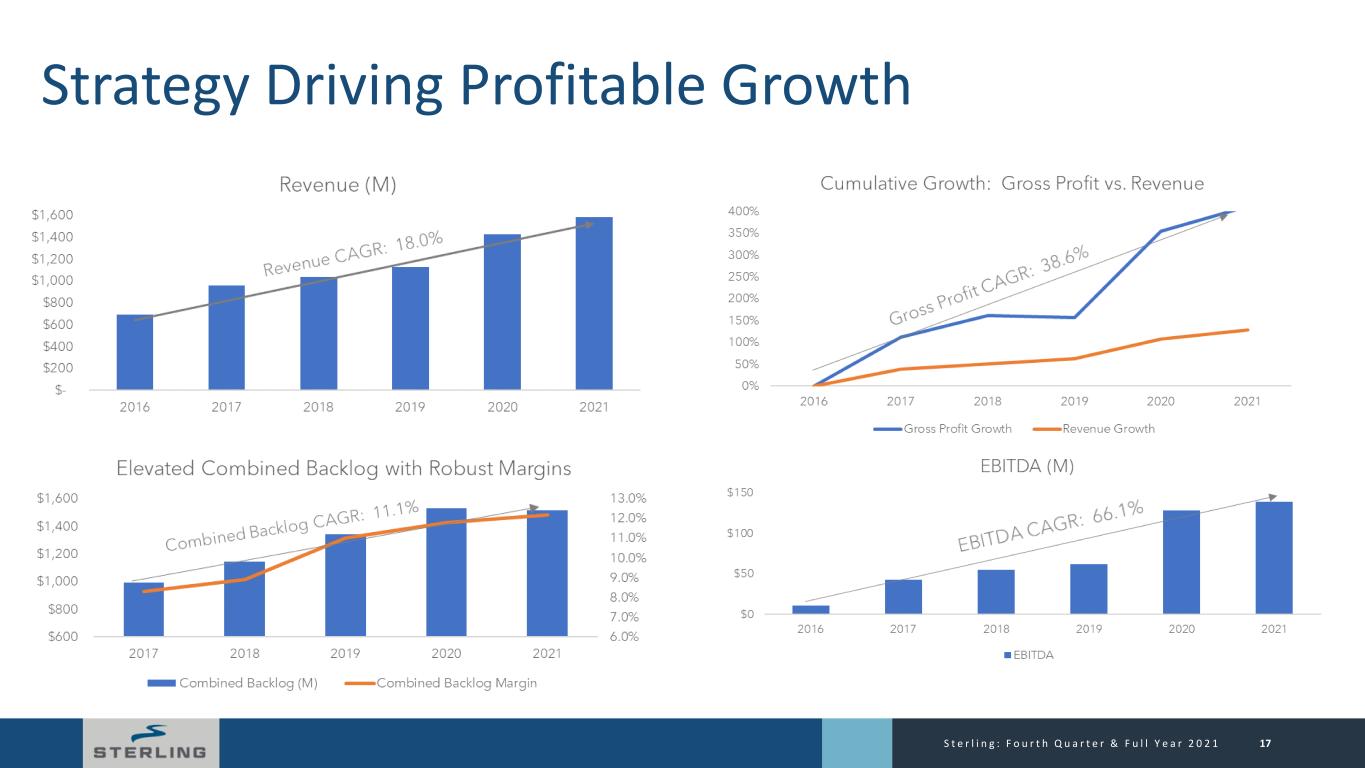
Sterling continued to successfully execute on a multi-year strategic business transformation during 2021. The management team remains focused on accelerating the business through an improved business mix, targeted margin expansion through high-growth vertical acquisitions, and through increased exposure within complementary adjacent markets, including two acquisitions in December.
(1) The Company defines Adjusted Net Income as GAAP net income attributable to Sterling’s common stockholders, excluding the Acquisition costs. See the “Non-GAAP Measures” and “Reconciliation of Non-GAAP Supplemental Adjusted Financial Data” sections below for more information.
(2) The Company defines EBITDA as GAAP net income attributable to Sterling’s common stockholders, adjusted for depreciation and amortization, net interest expense, taxes and net gain or loss on extinguishment of debt. The Company defines Adjusted EBITDA as EBITDA excluding the impact of acquisition related costs. See the “Non-GAAP Measures” and “EBITDA Reconciliation” sections below for more information.
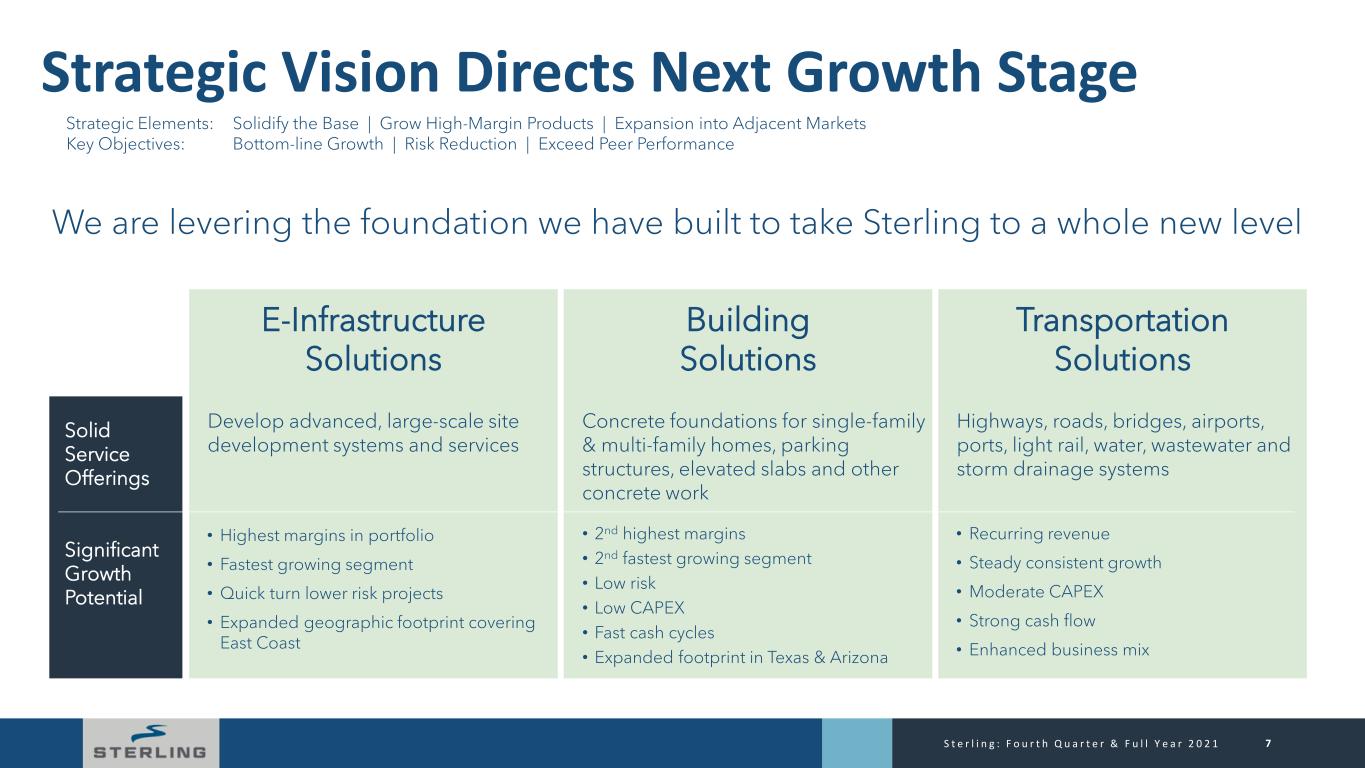
Segment realignment. With the December 30, 2021 acquisition of Petillo, Sterling realigned its operating groups to reflect management’s present oversight of operations. After realignment, Sterling’s operations consist of three reportable segments: Transportation Solutions, E-Infrastructure Solutions and Building Solutions, with the commercial business reclassified from the previously reported Specialty Services operating group into the newly formed Building Solutions operating group. We incur expenses at the corporate level that relate to our business as a whole. Certain of these amounts have been charged to our business segments by various methods, largely on the basis of usage, with the unallocated remainder reported in the “Corporate” line.
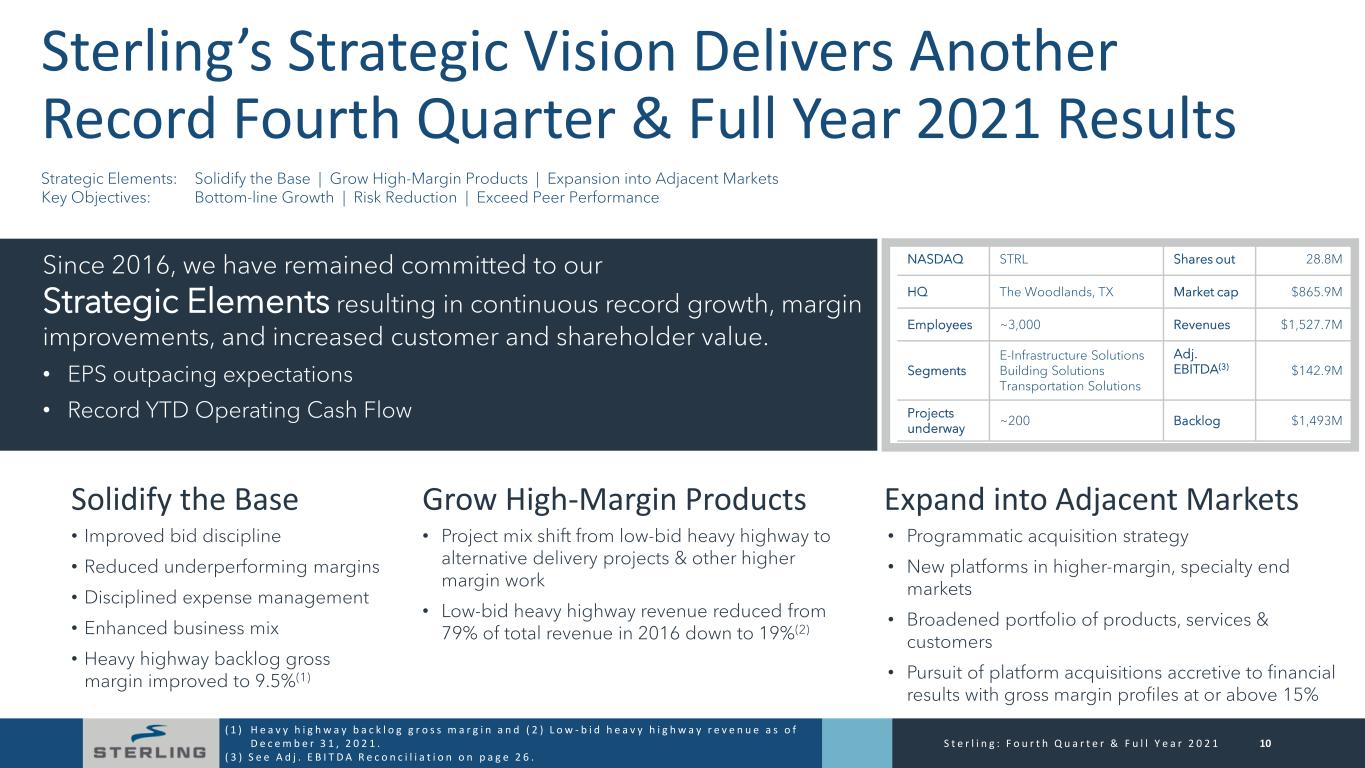
Solidify the base. Since 2016, Sterling has improved bid discipline to reduce the likelihood of underperforming project margins. As a result of this key risk reduction objective, heavy highway backlog gross margin has improved to 9.5% as of December 31, 2021, up from 4% prior to 2016. The Company expects gross margins to continue improving, reflecting the improved mix of work.
Grow high margin products. During the last five years, Sterling’s project mix shifted from low-bid heavy highway projects to alternative delivery projects and other higher margin work. This shift has resulted in low-bid heavy highway revenue reducing from 79% of total revenue in 2016 to 19% as of December 31, 2021.
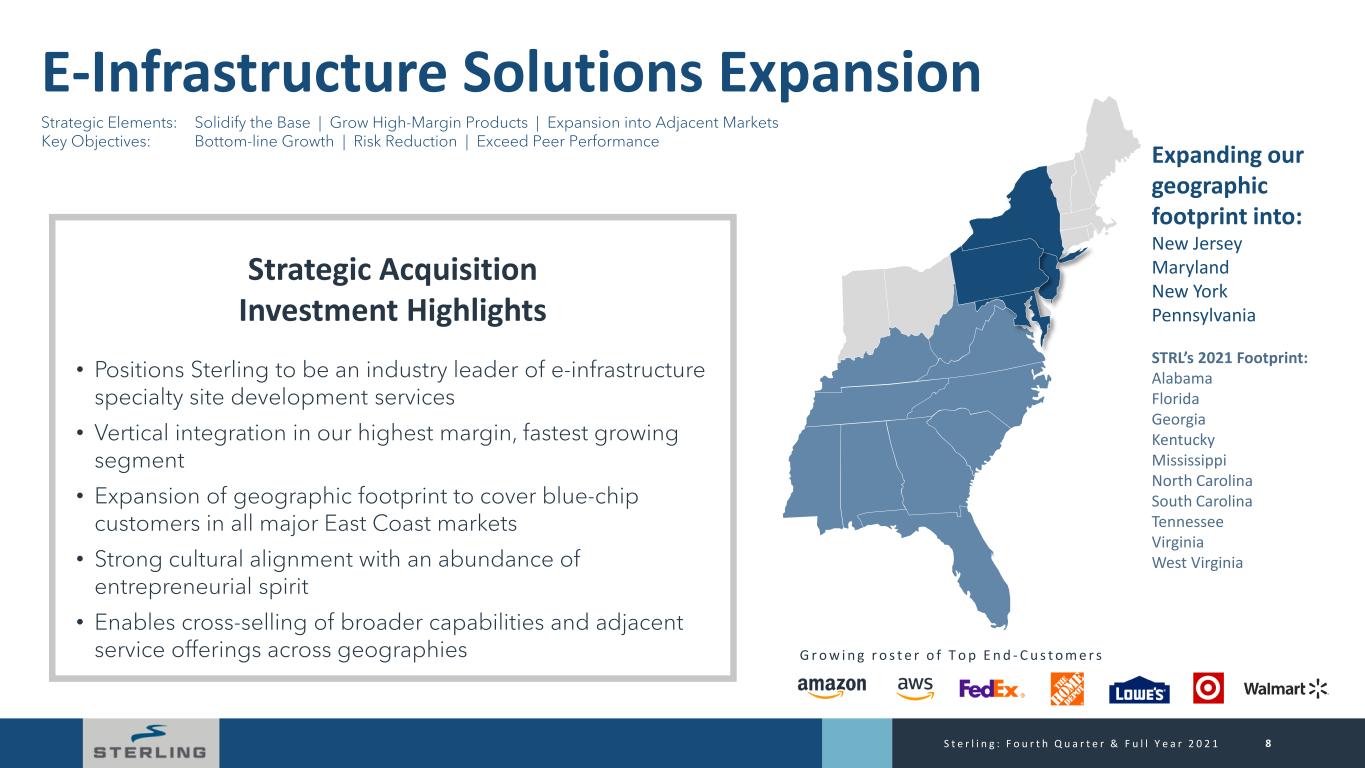
Expansion into adjacent markets. Sterling is committed to a programmatic acquisition strategy; one that creates new platforms within higher-margin, specialty end markets that serve to broaden its portfolio of products, services and customers. Sterling has pursued platform acquisitions which are accretive to our financial results and with gross margin profiles at or above 15%. Since 2017, the Company has created its E-Infrastructure Solutions and Building Solutions segments with the significant acquisitions of Plateau, Petillo and Tealstone. A higher-value business mix, together with disciplined expense management, positions Sterling as one of the largest specialty site development companies in the Northeastern and Mid-Atlantic U.S.
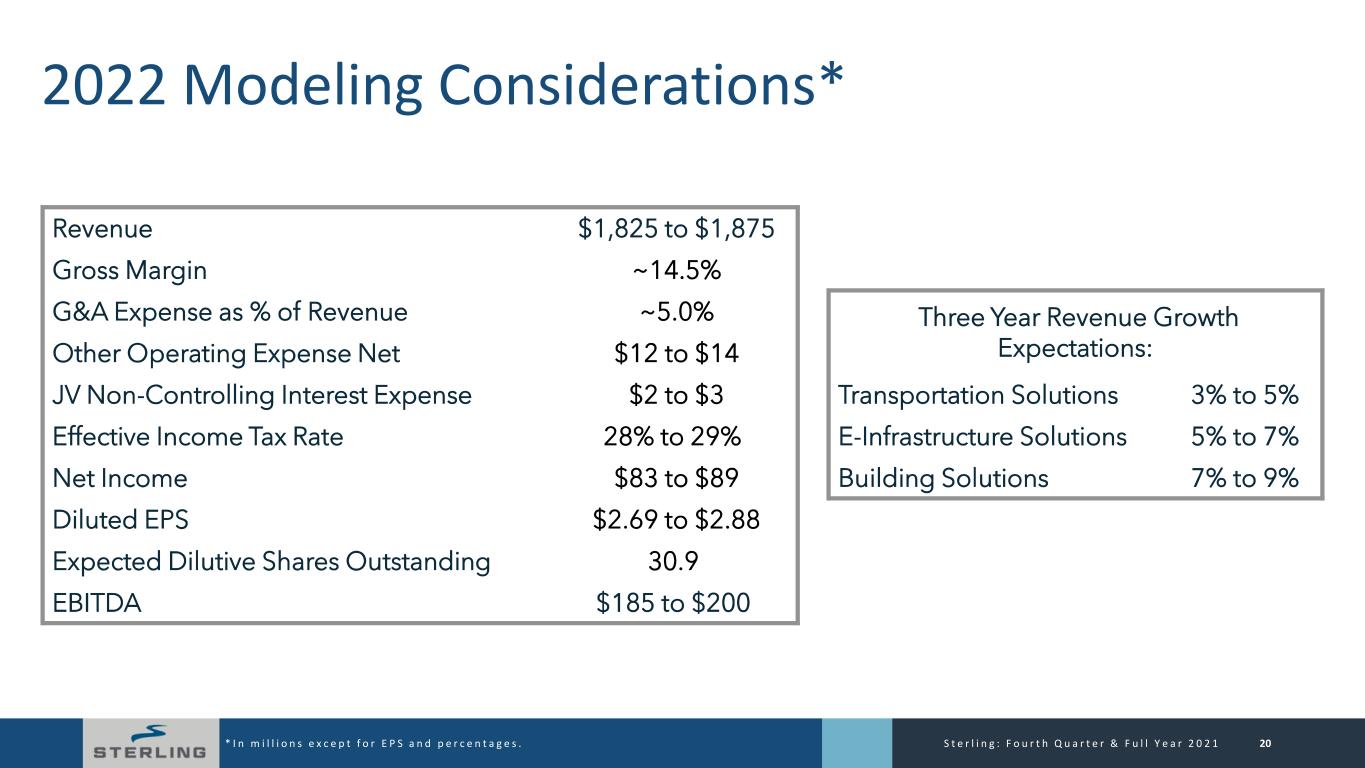
The Company Provides Full Year 2022 Revenue and Net Income Guidance:
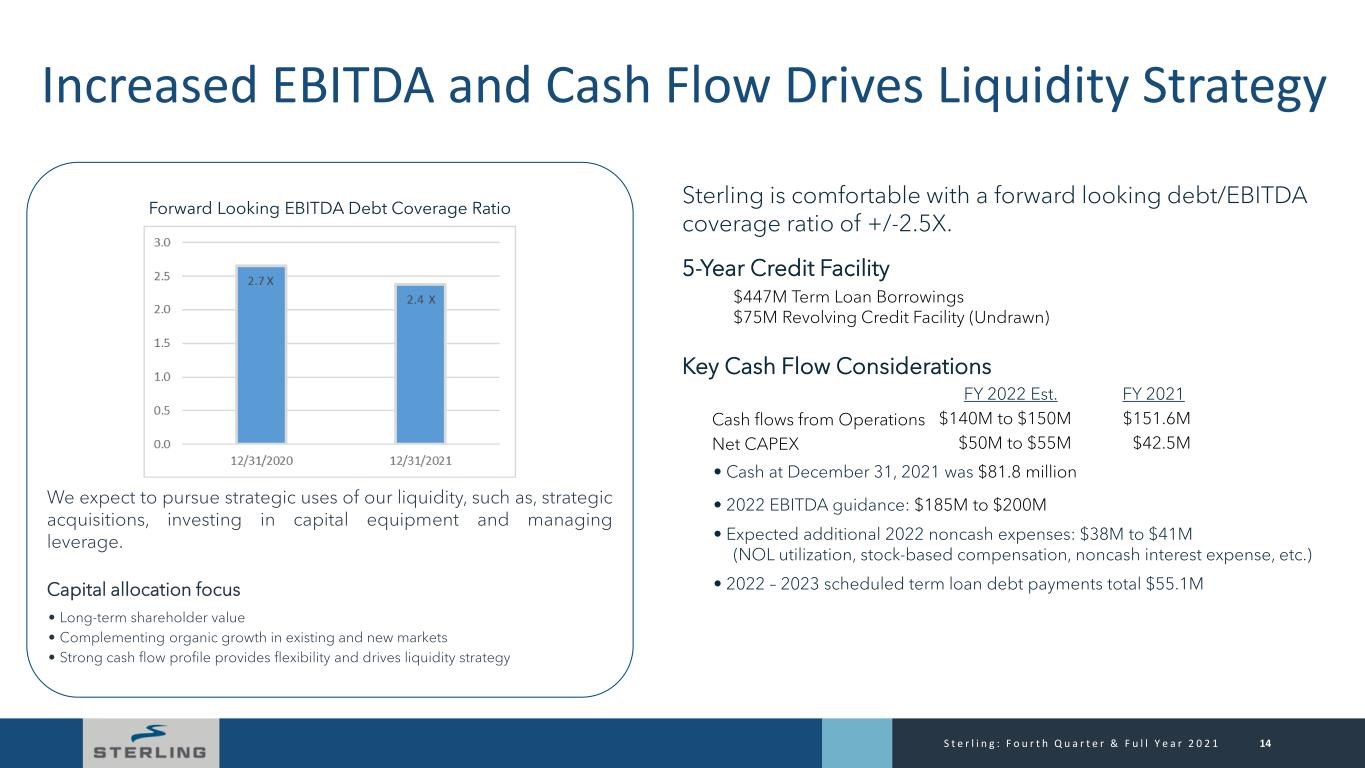
•Revenue of $1.825 billion to $1.875 billion
•Net Income of $83 million to $89 million
•EPS of $2.69 to $2.88
•EBITDA of $185 million to $200 million
CEO Remarks and Outlook
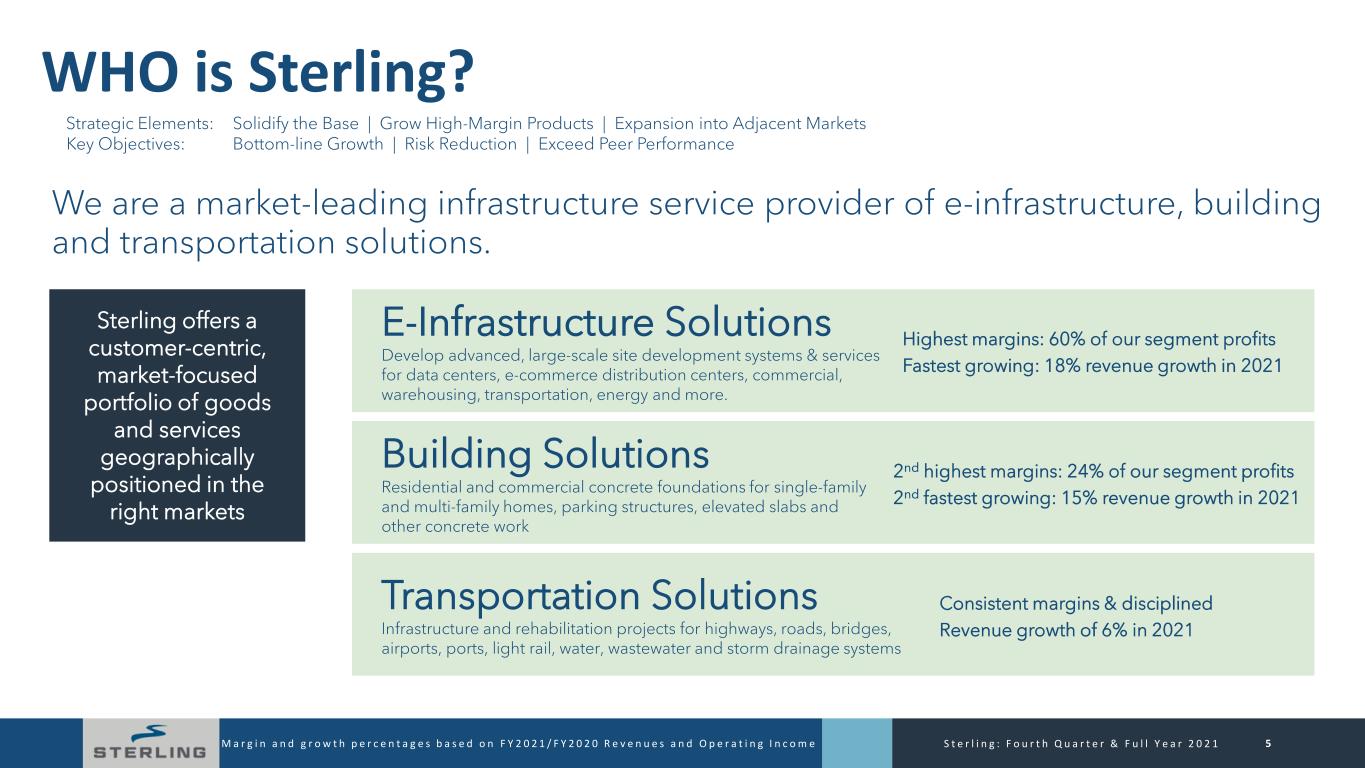
“Throughout 2021, we continued to execute our multi-year strategic business transformation that prioritizes profitable growth, higher-margins and reduced risk. We closed the year with solid fourth quarter results despite the ongoing supply-chain challenges. Our E-Infrastructure and Building Solutions represented 51% of revenue and 86% of our segment operating income in the fourth quarter, consistent with our focus on developing a higher-margin sales mix within our highest growing markets. We announced new E-Infrastructure project awards for both Plateau and Petillo, bringing our total E-Infrastructure Solutions backlog to $433 million,” stated Joe Cutillo, Sterling’s Chief Executive Officer.
“Full year revenues of $1.58 billion exceeded our initial and our third quarter updated guidance and were up 10.8% from the prior year. Our E-Infrastructure Solutions segment accounted for 30% of revenues, up from 28%, our Building Solutions segment represented 20%, up from 19% in the prior year, and our Transportation Solutions segment contributed 50% of revenues, compared with 53% in the prior year,” continued Mr. Cutillo.
“During 2021 Sterling generated $152 million in cash flows from operations, an increase of 25% versus prior year. This allowed us the flexibility to pay down $48 million of debt, invest $43 million in net capital expenditures, and fund part of the Petillo and Kimes acquisitions. Our focus on paying down our debt enabled us to significantly reduce our interest expense, which totaled $19 million for the year, compared with $29 million during the prior year.”
Mr. Cutillo concluded, “Entering 2022, we remain highly optimistic on the outlook for our business as we look out over the next year, driven by a combination of market share gains and accelerating demand across our higher margin markets. We view the continued investment in new data centers and e-commerce distribution centers as a benefit to our E-Infrastructure Solutions segment. Our Building Solutions segment’s expansion into new markets is a direct result of the demand from our customers needing our services in new markets. In our Transportation Solutions segment we remain disciplined in our shift to alternative delivery and design build heavy highway and aviation projects, and focus on margin improvement opportunities with the recently released federal infrastructure programs. Taken all together, we anticipate another year of strong financial performance in 2022 driven by the continued execution of our strategic vision.”
Conference Call
Sterling’s management will hold a conference call to discuss these results and recent corporate developments on Tuesday, March 1, 2022 at 9:00 a.m. ET/8:00 a.m. CT. Interested parties may participate in the call by dialing (201) 493-6744 or (877) 445-9755. Please call in ten minutes before the conference call is scheduled to begin and ask for the Sterling Construction call. To coincide with the conference call, Sterling will post a slide presentation at www.strlco.com on the Investor Presentations & Webcast section of the Investor Relations tab. Following management’s opening remarks, there will be a question and answer session.
To listen to a simultaneous webcast of the call, please go to the Company’s website at www.strlco.com at least fifteen minutes early to download and install any necessary audio software. If you are unable to listen live, the conference call webcast will be archived on the Company’s website for thirty days.
About Sterling
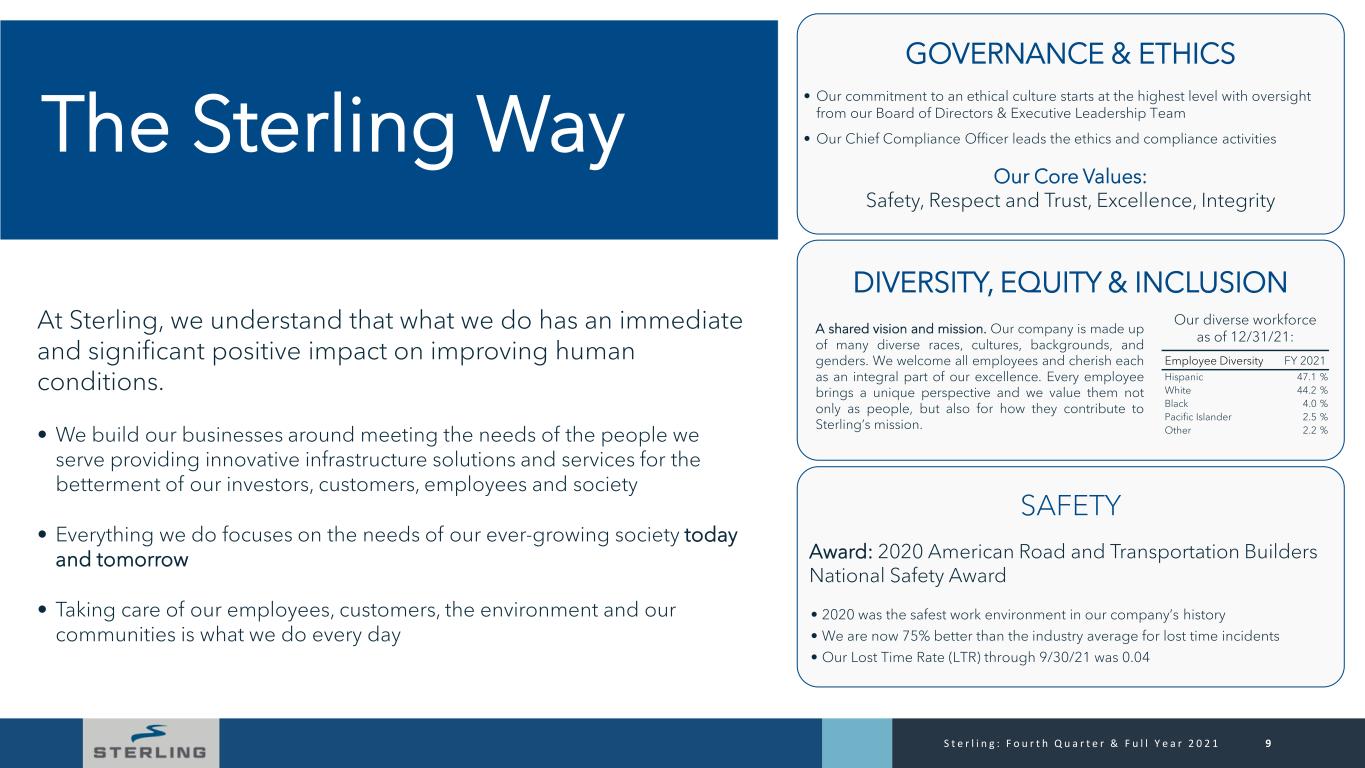
Sterling Construction Company, Inc. operates through a variety of subsidiaries within three segments specializing in Transportation, E-Infrastructure and Building Solutions in the United States (the “U.S.”), primarily across the Southern, Northeastern and Mid-Atlantic U.S., the Rocky Mountain States, California and Hawaii, as well as other areas with strategic construction opportunities. Transportation Solutions includes infrastructure and rehabilitation projects for highways, roads, bridges, airports, ports, light rail, water, wastewater and storm drainage systems. E-Infrastructure Solutions projects develop advanced, large-scale site development systems and services for data centers, e-commerce distribution centers, warehousing, transportation, energy and more. Building Solutions projects include residential and commercial concrete foundations for single-family and multi-family homes, parking structures, elevated slabs and other concrete work. From strategy to operations, we are committed to sustainability by operating responsibly to safeguard and improve society’s quality of life. Caring for our people and our communities, our customers and our investors – that is The Sterling Way.
Joe Cutillo, CEO, “We build and service the infrastructure that enables our economy to run,
our people to move and our country to grow.”
our people to move and our country to grow.”
Important Information for Investors and Stockholders
Non-GAAP Measures
This press release may contain “Non-GAAP” financial measures as defined under Regulation G of the amended U.S. Securities Exchange Act of 1934. The Company reports financial results in accordance with U.S. generally accepted accounting principles (“GAAP”), but the Company believes that certain Non-GAAP financial measures provide useful supplemental information to investors regarding the underlying business trends and performance of the Company’s ongoing operations and are useful for period-over-period comparisons of those operations.
Non-GAAP measures may include adjusted net income, adjusted EPS, EBITDA and Adjusted EBITDA, in each case excluding the impacts of certain identified items. The excluded items represent items that the Company does not consider to be representative of its normal operations. The Company believes that these measures are useful for investors to review, because they provide a consistent measure of the underlying financial results of the Company’s ongoing business and, in the Company’s view, allow for a supplemental comparison against historical results and expectations for future performance. Furthermore, the Company uses each of these to measure the performance of the Company’s operations for budgeting and forecasting, as well as employee incentive compensation. However, Non-GAAP measures should not be considered as substitutes for net income, EPS, or other data prepared and reported in accordance with GAAP and should be viewed in addition to the Company’s reported results prepared in accordance with GAAP.
Reconciliations of Non-GAAP financial measures to the most comparable GAAP measures are provided in the tables included within this press release.
Cautionary Statement Regarding Forward-Looking Statements
This press release contains statements that are considered forward-looking statements within the meaning of the federal securities laws. These forward-looking statements are subject to a number of risks and uncertainties, many of which are beyond our control, which may include statements about: our business strategy; our financial strategy; our industry outlook; and our plans, objectives, expectations, forecasts, outlook and intentions. All of these types of statements, other than statements of historical fact included in this press release, are forward-looking statements. In some cases, forward-looking statements can be identified by terminology such as “may,” “will,” “could,” “should,” “expect,” “plan,” “project,” “intend,” “anticipate,” “believe,” “estimate,” “predict,” “potential,” “pursue,” “target,” “continue,” the negative of such terms or other comparable terminology. The forward-looking statements contained in this press release are largely based on our expectations, which reflect estimates and assumptions made by our management. These estimates and assumptions reflect our best judgment based on currently known market conditions and other factors. Although we believe such estimates and assumptions to be reasonable, they are inherently uncertain and involve a number of risks and uncertainties that are beyond our control. In addition, management’s assumptions about future events may prove to be inaccurate. Management cautions all readers that the forward-looking statements contained in this press release are not guarantees of future performance, and we cannot assure any reader that such statements will be realized or the forward-looking events and circumstances will occur. Actual results may differ materially from those anticipated or implied in the forward-looking statements due to factors listed in the “Risk Factors” section in our filings with the U.S. Securities and Exchange Commission and elsewhere in those filings. Additional factors or risks that we currently deem immaterial, that are not presently known to us or that arise in the future could also cause our actual results to differ materially from our expected results. Given these uncertainties, investors are cautioned that many of the assumptions upon which our forward-looking statements are based are likely to change after the date the forward-looking statements are made. The forward-looking statements speak only as of the date made, and we undertake no obligation to publicly update or revise any forward-looking statements for any reason, whether as a result of new information, future events or developments, changed circumstances, or otherwise, notwithstanding any changes in our assumptions, changes in business plans, actual experience or other changes. These cautionary statements qualify all forward-looking statements attributable to us or persons acting on our behalf.
Company Contact: Sterling Construction Company, Inc. Ron Ballschmiede, Chief Financial Officer 281-214-0777 | Investor Relations Contact: The Equity Group Inc. Jeremy Hellman, CFA 212-836-9626 | ||||
STERLING CONSTRUCTION COMPANY, INC. & SUBSIDIARIES
CONDENSED CONSOLIDATED STATEMENTS OF OPERATIONS
(In thousands, except per share data)
(Unaudited)
| Three Months Ended December 31, | Twelve Months Ended December 31, | ||||||||||||||||||||||
| 2021 | 2020 | 2021 | 2020 | ||||||||||||||||||||
| Revenues | $ | 401,335 | $ | 347,228 | $ | 1,581,766 | $ | 1,427,412 | |||||||||||||||
| Cost of revenues | (345,661) | (300,619) | (1,367,009) | (1,236,043) | |||||||||||||||||||
| Gross profit | 55,674 | 46,609 | 214,757 | 191,369 | |||||||||||||||||||
| General and administrative expense | (25,941) | (20,206) | (78,506) | (71,415) | |||||||||||||||||||
| Intangible asset amortization | (2,866) | (2,867) | (11,464) | (11,436) | |||||||||||||||||||
| Acquisition related costs | (3,877) | (13) | (3,877) | (1,026) | |||||||||||||||||||
| Other operating expense, net | (3,209) | (2,611) | (13,623) | (12,600) | |||||||||||||||||||
| Operating income | 19,781 | 20,912 | 107,287 | 94,892 | |||||||||||||||||||
| Interest income | 13 | 15 | 52 | 161 | |||||||||||||||||||
| Interest expense | (3,688) | (6,840) | (19,348) | (29,377) | |||||||||||||||||||
| Gain (loss) on extinguishment of debt, net | — | (301) | 2,032 | (301) | |||||||||||||||||||
| Income before income taxes | 16,106 | 13,786 | 90,023 | 65,375 | |||||||||||||||||||
| Income tax expense | (4,625) | (7,759) | (24,900) | (22,471) | |||||||||||||||||||
| Net income | 11,481 | 6,027 | 65,123 | 42,904 | |||||||||||||||||||
| Less: Net income attributable to noncontrolling interests | (573) | (203) | (2,478) | (598) | |||||||||||||||||||
| Net income attributable to Sterling common stockholders | $ | 10,908 | $ | 5,824 | $ | 62,645 | $ | 42,306 | |||||||||||||||
| Net income per share attributable to Sterling common stockholders: | |||||||||||||||||||||||
| Basic | $ | 0.38 | $ | 0.21 | $ | 2.19 | $ | 1.52 | |||||||||||||||
| Diluted | $ | 0.37 | $ | 0.20 | $ | 2.15 | $ | 1.50 | |||||||||||||||
| Weighted average common shares outstanding: | |||||||||||||||||||||||
| Basic | 28,818 | 28,043 | 28,600 | 27,859 | |||||||||||||||||||
| Diluted | 29,756 | 29,019 | 29,101 | 28,195 | |||||||||||||||||||
STERLING CONSTRUCTION COMPANY, INC. & SUBSIDIARIES
SEGMENT INFORMATION
(In thousands)
(Unaudited)
| Three Months Ended December 31, | Twelve Months Ended December 31, | ||||||||||||||||||||||||||||||||||||||||||||||
| 2021 | % of Revenues | 2020 | % of Revenues | 2021 | % of Revenues | 2020 | % of Revenues | ||||||||||||||||||||||||||||||||||||||||
| Revenues | |||||||||||||||||||||||||||||||||||||||||||||||
| Transportation Solutions | $ | 195,477 | 48% | $ | 176,683 | 51% | $ | 795,582 | 50% | $ | 753,824 | 53% | |||||||||||||||||||||||||||||||||||
| E-Infrastructure Solutions | 127,183 | 32% | 100,408 | 29% | 468,784 | 30% | 397,253 | 28% | |||||||||||||||||||||||||||||||||||||||
| Building Solutions | 78,675 | 20% | 70,137 | 20% | 317,400 | 20% | 276,335 | 19% | |||||||||||||||||||||||||||||||||||||||
| Total Revenues | $ | 401,335 | $ | 347,228 | $ | 1,581,766 | $ | 1,427,412 | |||||||||||||||||||||||||||||||||||||||
| Operating Income | |||||||||||||||||||||||||||||||||||||||||||||||
| Transportation Solutions | $ | 4,718 | 2.4% | $ | 3,791 | 2.1% | $ | 21,514 | 2.7% | $ | 14,439 | 1.9% | |||||||||||||||||||||||||||||||||||
| E-Infrastructure Solutions | 18,734 | 14.7% | 16,903 | 16.8% | 80,478 | 17.2% | 76,522 | 19.3% | |||||||||||||||||||||||||||||||||||||||
| Building Solutions | 9,175 | 11.7% | 6,366 | 9.1% | 32,564 | 10.3% | 30,441 | 11.0% | |||||||||||||||||||||||||||||||||||||||
| Segment Operating Income | 32,627 | 8.1% | 27,060 | 7.8% | 134,556 | 8.5% | 121,402 | 8.5% | |||||||||||||||||||||||||||||||||||||||
| Corporate | (8,969) | (6,135) | (23,392) | (25,484) | |||||||||||||||||||||||||||||||||||||||||||
| Acquisition related costs | (3,877) | (13) | (3,877) | (1,026) | |||||||||||||||||||||||||||||||||||||||||||
| Total Operating Income | $ | 19,781 | 4.9% | $ | 20,912 | 6.0% | $ | 107,287 | 6.8% | $ | 94,892 | 6.6% | |||||||||||||||||||||||||||||||||||
STERLING CONSTRUCTION COMPANY, INC. & SUBSIDIARIES
CONDENSED CONSOLIDATED BALANCE SHEETS
(In thousands, except per share data)
(Unaudited)
| December 31, 2021 | December 31, 2020 | ||||||||||
| Assets | |||||||||||
| Current assets: | |||||||||||
| Cash and cash equivalents | $ | 81,840 | $ | 66,185 | |||||||
| Accounts receivable | 232,153 | 177,424 | |||||||||
| Contract assets | 83,310 | 84,975 | |||||||||
| Receivables from and equity in construction joint ventures | 16,896 | 16,653 | |||||||||
| Other current assets | 20,492 | 16,306 | |||||||||
| Total current assets | 434,691 | 361,543 | |||||||||
| Property and equipment, net | 204,316 | 126,668 | |||||||||
| Operating lease right-of-use assets, net | 24,520 | 16,515 | |||||||||
| Goodwill | 259,791 | 192,014 | |||||||||
| Other intangibles, net | 303,223 | 244,887 | |||||||||
| Other non-current assets, net | 4,455 | 11,067 | |||||||||
| Total assets | $ | 1,230,996 | $ | 952,694 | |||||||
| Liabilities and Stockholders’ Equity | |||||||||||
| Current liabilities: | |||||||||||
| Accounts payable | $ | 144,982 | $ | 95,201 | |||||||
| Contract liabilities | 127,932 | 114,019 | |||||||||
| Current maturities of long-term debt | 28,230 | 77,434 | |||||||||
| Current portion of long-term lease obligations | 8,841 | 7,588 | |||||||||
| Accrued compensation | 22,803 | 18,013 | |||||||||
| Other current liabilities | 18,972 | 9,629 | |||||||||
| Total current liabilities | 351,760 | 321,884 | |||||||||
| Long-term debt | 428,588 | 291,249 | |||||||||
| Long-term lease obligations | 15,831 | 8,958 | |||||||||
| Members’ interest subject to mandatory redemption and undistributed earnings | 55,115 | 51,290 | |||||||||
| Deferred tax liability, net | 14,656 | — | |||||||||
| Other long-term liabilities | 4,819 | 10,584 | |||||||||
| Total liabilities | 870,769 | 683,965 | |||||||||
| Stockholders’ equity: | |||||||||||
| Common stock | 298 | 283 | |||||||||
| Additional paid in capital | 280,274 | 256,423 | |||||||||
| Treasury stock | — | (1,445) | |||||||||
| Retained earnings | 79,918 | 17,273 | |||||||||
| Accumulated other comprehensive loss | (1,723) | (5,264) | |||||||||
| Total Sterling stockholders’ equity | 358,767 | 267,270 | |||||||||
| Noncontrolling interests | 1,460 | 1,459 | |||||||||
| Total stockholders’ equity | 360,227 | 268,729 | |||||||||
| Total liabilities and stockholders’ equity | $ | 1,230,996 | $ | 952,694 | |||||||
STERLING CONSTRUCTION COMPANY, INC. & SUBSIDIARIES
CONDENSED CONSOLIDATED STATEMENTS OF CASH FLOWS
(In thousands)
(Unaudited)
| Twelve Months Ended December 31, | |||||||||||
| 2021 | 2020 | ||||||||||
| Cash flows from operating activities: | |||||||||||
| Net income | $ | 65,123 | $ | 42,904 | |||||||
| Adjustments to reconcile net income to net cash provided by operating activities: | |||||||||||
| Depreciation and amortization | 34,201 | 32,785 | |||||||||
| Amortization of debt issuance costs and non-cash interest | 2,242 | 3,193 | |||||||||
| Gain on disposal of property and equipment | (1,396) | (1,495) | |||||||||
| (Gain) loss on debt extinguishment | (2,032) | 301 | |||||||||
| Deferred taxes | 21,428 | 19,439 | |||||||||
| Stock-based compensation expense | 11,771 | 11,643 | |||||||||
| Change in fair value of interest rate swap | (32) | 265 | |||||||||
| Changes in operating assets and liabilities | 20,289 | 11,876 | |||||||||
| Net cash provided by operating activities | 151,594 | 120,911 | |||||||||
| Cash flows from investing activities: | |||||||||||
| Acquisitions, net of cash acquired | (180,911) | — | |||||||||
| Capital expenditures | (46,651) | (32,864) | |||||||||
| Proceeds from sale of property and equipment | 4,113 | 2,373 | |||||||||
| Net cash used in investing activities | (223,449) | (30,491) | |||||||||
| Cash flows from financing activities: | |||||||||||
| Cash received from credit facility | 140,000 | — | |||||||||
| Repayments of debt | (48,273) | (77,745) | |||||||||
| Distributions to noncontrolling interest owners | (2,477) | (432) | |||||||||
| Debt issuance costs | (1,340) | — | |||||||||
| Other | (4) | 9,837 | |||||||||
| Net cash provided by (used in) financing activities | 87,906 | (68,340) | |||||||||
| Net change in cash, cash equivalents, and restricted cash | 16,051 | 22,080 | |||||||||
| Cash, cash equivalents, and restricted cash at beginning of period | 72,642 | 50,562 | |||||||||
| Cash, cash equivalents, and restricted cash at end of period | 88,693 | 72,642 | |||||||||
| Less: restricted cash (Other current assets) | (6,853) | (6,457) | |||||||||
| Cash and cash equivalents at end of period | $ | 81,840 | $ | 66,185 | |||||||
STERLING CONSTRUCTION COMPANY, INC. & SUBSIDIARIES
HISTORICAL QUARTERLY SEGMENT INFORMATION
(In thousands)
(Unaudited)
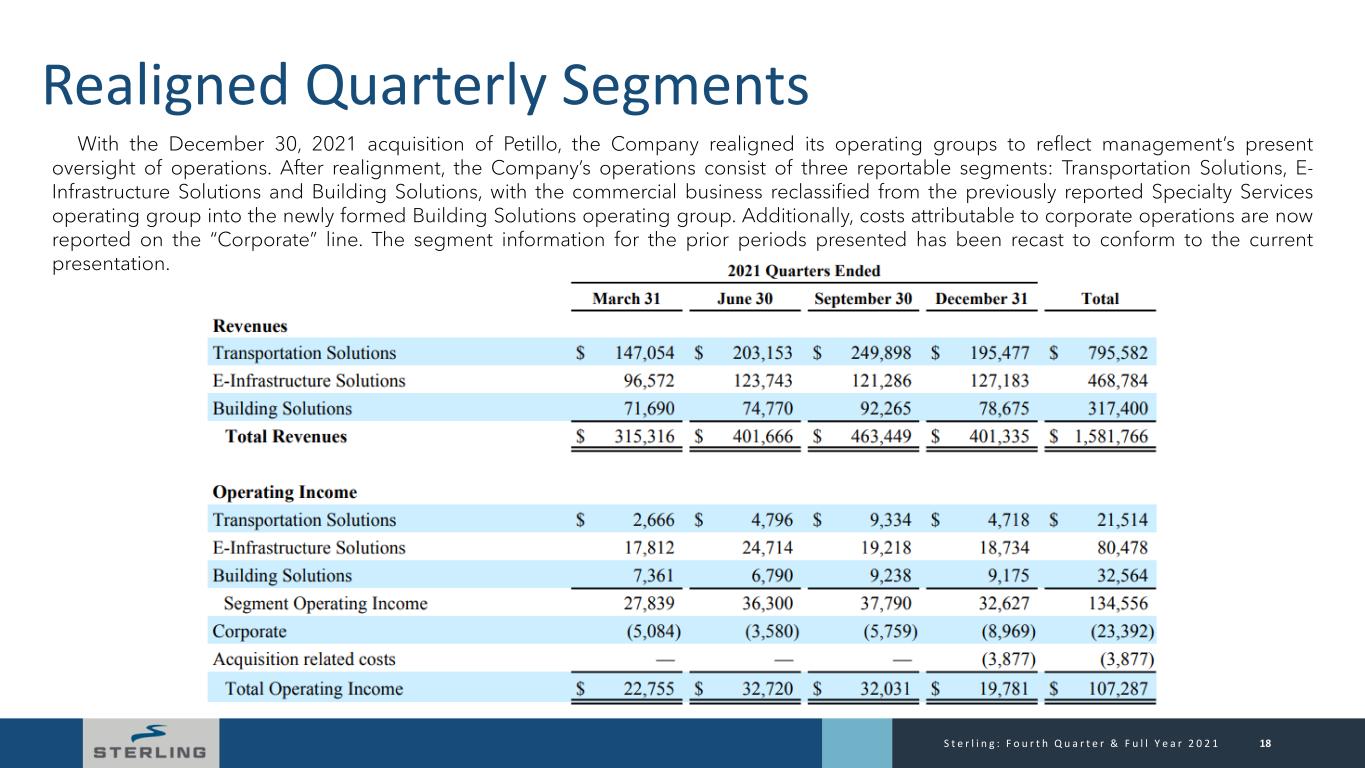
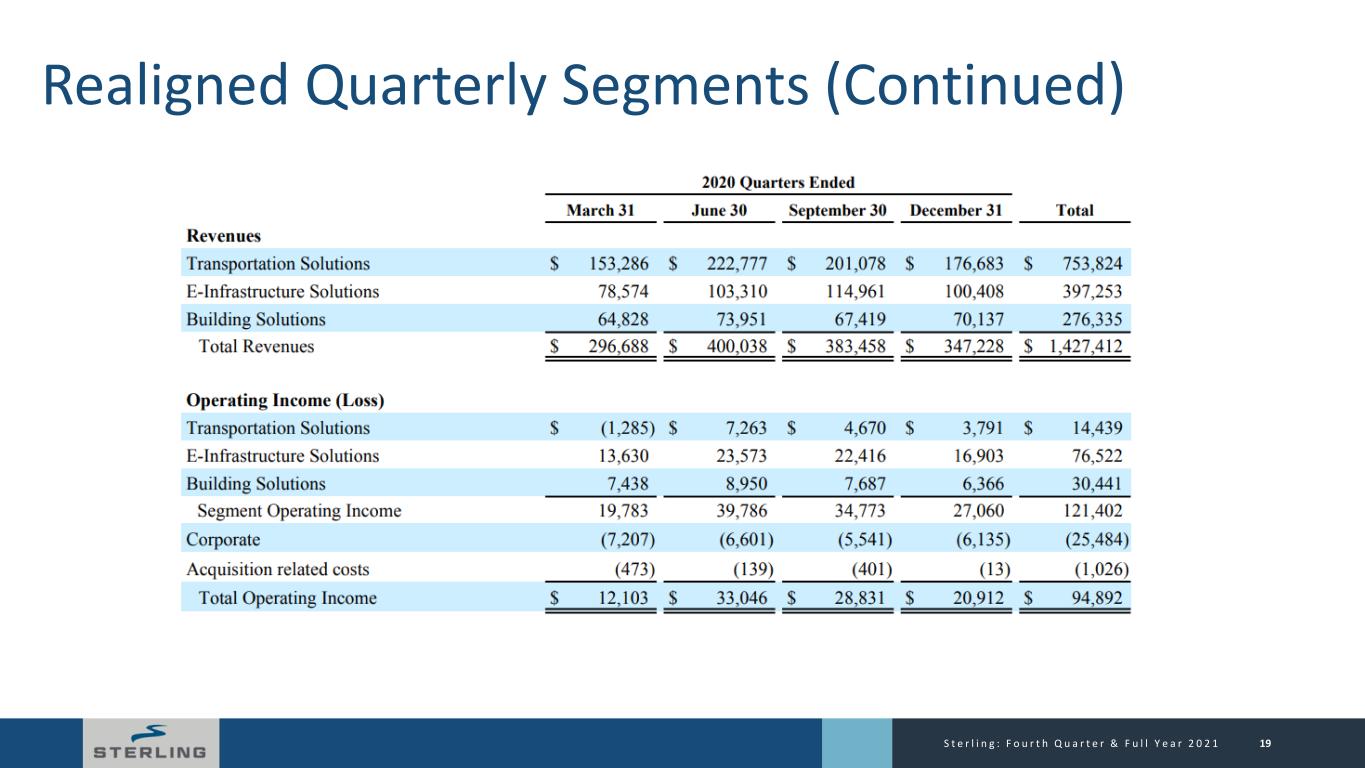
With the December 30, 2021 acquisition of Petillo, the Company realigned its operating groups to reflect management’s present oversight of operations. After realignment, the Company’s operations consist of three reportable segments: Transportation Solutions, E-Infrastructure Solutions and Building Solutions, with the commercial business reclassified from the previously reported Specialty Services operating group into the newly formed Building Solutions operating group. Additionally, costs attributable to corporate operations are now reported on the “Corporate” line. The following tables present our 2021 and 2020 quarterly revenue and income from operations adjusted to reflect our operating group realignment and to conform to our 2021 presentation: | |||||||||||||||||||||||||||||
| 2021 Quarters Ended | |||||||||||||||||||||||||||||
| March 31 | June 30 | September 30 | December 31 | Total | |||||||||||||||||||||||||
| Revenues | |||||||||||||||||||||||||||||
| Transportation Solutions | $ | 147,054 | $ | 203,153 | $ | 249,898 | $ | 195,477 | $ | 795,582 | |||||||||||||||||||
| E-Infrastructure Solutions | 96,572 | 123,743 | 121,286 | 127,183 | 468,784 | ||||||||||||||||||||||||
| Building Solutions | 71,690 | 74,770 | 92,265 | 78,675 | 317,400 | ||||||||||||||||||||||||
| Total Revenues | $ | 315,316 | $ | 401,666 | $ | 463,449 | $ | 401,335 | $ | 1,581,766 | |||||||||||||||||||
| Operating Income | |||||||||||||||||||||||||||||
| Transportation Solutions | $ | 2,666 | $ | 4,796 | $ | 9,334 | $ | 4,718 | $ | 21,514 | |||||||||||||||||||
| E-Infrastructure Solutions | 17,812 | 24,714 | 19,218 | 18,734 | 80,478 | ||||||||||||||||||||||||
| Building Solutions | 7,361 | 6,790 | 9,238 | 9,175 | 32,564 | ||||||||||||||||||||||||
| Segment Operating Income | 27,839 | 36,300 | 37,790 | 32,627 | 134,556 | ||||||||||||||||||||||||
| Corporate | (5,084) | (3,580) | (5,759) | (8,969) | (23,392) | ||||||||||||||||||||||||
| Acquisition related costs | — | — | — | (3,877) | (3,877) | ||||||||||||||||||||||||
| Total Operating Income | $ | 22,755 | $ | 32,720 | $ | 32,031 | $ | 19,781 | $ | 107,287 | |||||||||||||||||||
| 2020 Quarters Ended | |||||||||||||||||||||||||||||
| March 31 | June 30 | September 30 | December 31 | Total | |||||||||||||||||||||||||
| Revenues | |||||||||||||||||||||||||||||
| Transportation Solutions | $ | 153,286 | $ | 222,777 | $ | 201,078 | $ | 176,683 | $ | 753,824 | |||||||||||||||||||
| E-Infrastructure Solutions | 78,574 | 103,310 | 114,961 | 100,408 | 397,253 | ||||||||||||||||||||||||
| Building Solutions | 64,828 | 73,951 | 67,419 | 70,137 | 276,335 | ||||||||||||||||||||||||
| Total Revenues | $ | 296,688 | $ | 400,038 | $ | 383,458 | $ | 347,228 | $ | 1,427,412 | |||||||||||||||||||
| Operating Income (Loss) | |||||||||||||||||||||||||||||
| Transportation Solutions | $ | (1,285) | $ | 7,263 | $ | 4,670 | $ | 3,791 | $ | 14,439 | |||||||||||||||||||
| E-Infrastructure Solutions | 13,630 | 23,573 | 22,416 | 16,903 | 76,522 | ||||||||||||||||||||||||
| Building Solutions | 7,438 | 8,950 | 7,687 | 6,366 | 30,441 | ||||||||||||||||||||||||
| Segment Operating Income | 19,783 | 39,786 | 34,773 | 27,060 | 121,402 | ||||||||||||||||||||||||
| Corporate | (7,207) | (6,601) | (5,541) | (6,135) | (25,484) | ||||||||||||||||||||||||
| Acquisition related costs | (473) | (139) | (401) | (13) | (1,026) | ||||||||||||||||||||||||
| Total Operating Income | $ | 12,103 | $ | 33,046 | $ | 28,831 | $ | 20,912 | $ | 94,892 | |||||||||||||||||||
STERLING CONSTRUCTION COMPANY, INC. & SUBSIDIARIES
CONSOLIDATED STATEMENTS OF OPERATIONS
Reconciliation of Non-GAAP Supplemental Adjusted Financial Data (1)
(In thousands, except per share data)
(Unaudited)
| The Company reports its financial results in accordance with GAAP. This press release also includes several Non-GAAP financial measures as defined under the SEC’s Regulation G. The following tables reconcile certain Non-GAAP financial measures used in this press release to comparable GAAP financial measures. | |||||||||||||||||
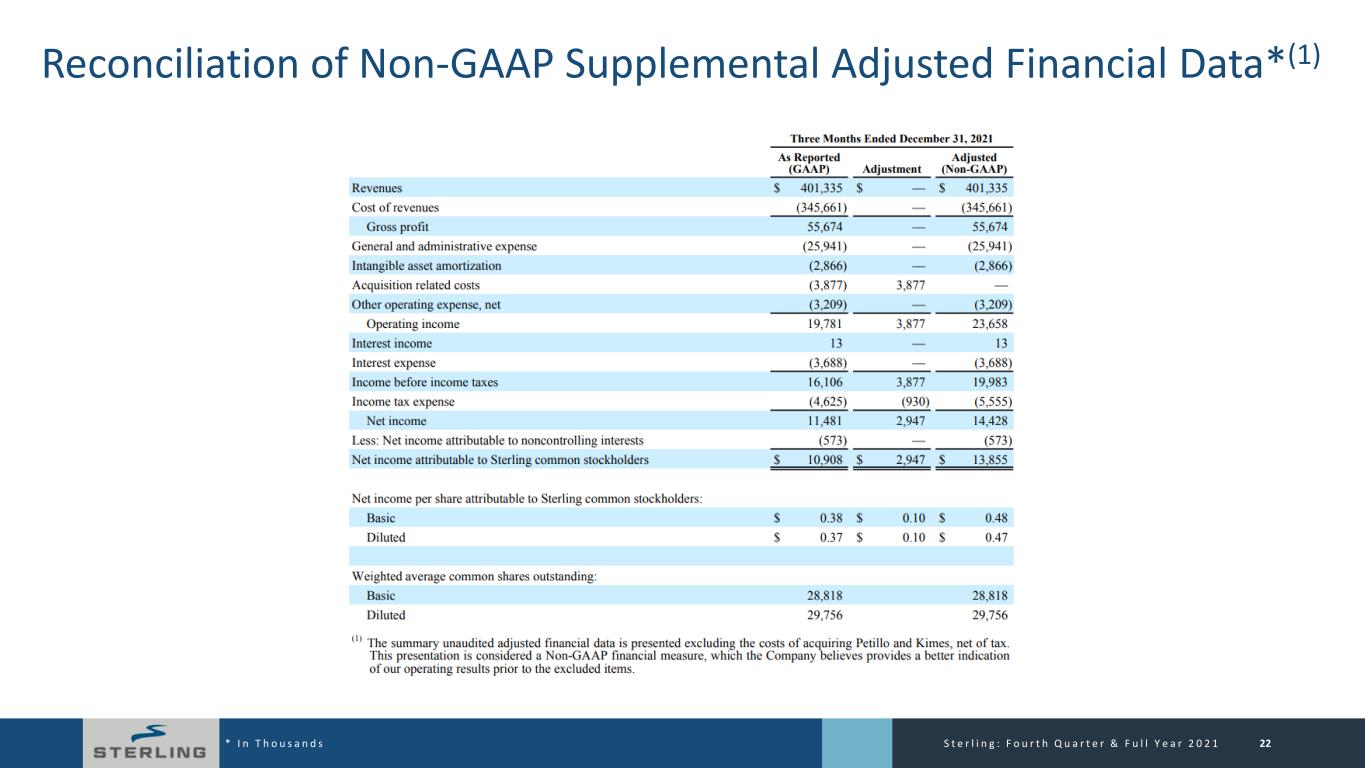
| Three Months Ended December 31, 2021 | |||||||||||||||||
| As Reported (GAAP) | Adjustment | Adjusted (Non-GAAP) | |||||||||||||||
| Revenues | $ | 401,335 | $ | — | $ | 401,335 | |||||||||||
| Cost of revenues | (345,661) | — | (345,661) | ||||||||||||||
| Gross profit | 55,674 | — | 55,674 | ||||||||||||||
| General and administrative expense | (25,941) | — | (25,941) | ||||||||||||||
| Intangible asset amortization | (2,866) | — | (2,866) | ||||||||||||||
| Acquisition related costs | (3,877) | 3,877 | — | ||||||||||||||
| Other operating expense, net | (3,209) | — | (3,209) | ||||||||||||||
| Operating income | 19,781 | 3,877 | 23,658 | ||||||||||||||
| Interest income | 13 | — | 13 | ||||||||||||||
| Interest expense | (3,688) | — | (3,688) | ||||||||||||||
| Income before income taxes | 16,106 | 3,877 | 19,983 | ||||||||||||||
| Income tax expense | (4,625) | (930) | (5,555) | ||||||||||||||
| Net income | 11,481 | 2,947 | 14,428 | ||||||||||||||
| Less: Net income attributable to noncontrolling interests | (573) | — | (573) | ||||||||||||||
| Net income attributable to Sterling common stockholders | $ | 10,908 | $ | 2,947 | $ | 13,855 | |||||||||||
| Net income per share attributable to Sterling common stockholders: | |||||||||||||||||
| Basic | $ | 0.38 | $ | 0.10 | $ | 0.48 | |||||||||||
| Diluted | $ | 0.37 | $ | 0.10 | $ | 0.47 | |||||||||||
| Weighted average common shares outstanding: | |||||||||||||||||
| Basic | 28,818 | 28,818 | |||||||||||||||
| Diluted | 29,756 | 29,756 | |||||||||||||||
(1) The summary unaudited adjusted financial data is presented excluding the costs of acquiring Petillo and Kimes, net of tax. This presentation is considered a Non-GAAP financial measure, which the Company believes provides a better indication of our operating results prior to the excluded items. | |||||||||||||||||
STERLING CONSTRUCTION COMPANY, INC. & SUBSIDIARIES
CONSOLIDATED STATEMENTS OF OPERATIONS
Reconciliation of Non-GAAP Supplemental Adjusted Financial Data (1)
(In thousands, except per share data)
(Unaudited)
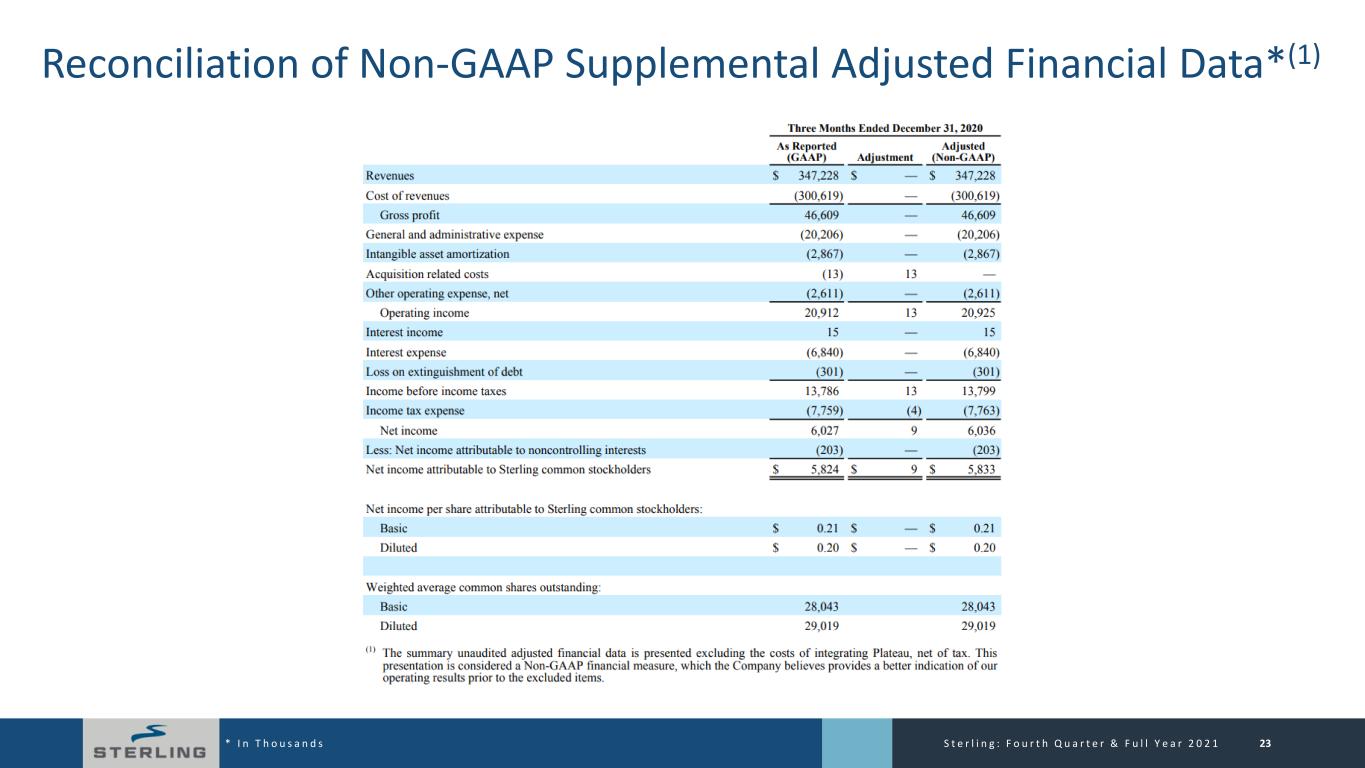
| The Company reports its financial results in accordance with GAAP. This press release also includes several Non-GAAP financial measures as defined under the SEC’s Regulation G. The following tables reconcile certain Non-GAAP financial measures used in this press release to comparable GAAP financial measures. | |||||||||||||||||
| Three Months Ended December 31, 2020 | |||||||||||||||||
| As Reported (GAAP) | Adjustment | Adjusted (Non-GAAP) | |||||||||||||||
| Revenues | $ | 347,228 | $ | — | $ | 347,228 | |||||||||||
| Cost of revenues | (300,619) | — | (300,619) | ||||||||||||||
| Gross profit | 46,609 | — | 46,609 | ||||||||||||||
| General and administrative expense | (20,206) | — | (20,206) | ||||||||||||||
| Intangible asset amortization | (2,867) | — | (2,867) | ||||||||||||||
| Acquisition related costs | (13) | 13 | — | ||||||||||||||
| Other operating expense, net | (2,611) | — | (2,611) | ||||||||||||||
| Operating income | 20,912 | 13 | 20,925 | ||||||||||||||
| Interest income | 15 | — | 15 | ||||||||||||||
| Interest expense | (6,840) | — | (6,840) | ||||||||||||||
| Loss on extinguishment of debt | (301) | — | (301) | ||||||||||||||
| Income before income taxes | 13,786 | 13 | 13,799 | ||||||||||||||
| Income tax expense | (7,759) | (4) | (7,763) | ||||||||||||||
| Net income | 6,027 | 9 | 6,036 | ||||||||||||||
| Less: Net income attributable to noncontrolling interests | (203) | — | (203) | ||||||||||||||
| Net income attributable to Sterling common stockholders | $ | 5,824 | $ | 9 | $ | 5,833 | |||||||||||
| Net income per share attributable to Sterling common stockholders: | |||||||||||||||||
| Basic | $ | 0.21 | $ | — | $ | 0.21 | |||||||||||
| Diluted | $ | 0.20 | $ | — | $ | 0.20 | |||||||||||
| Weighted average common shares outstanding: | |||||||||||||||||
| Basic | 28,043 | 28,043 | |||||||||||||||
| Diluted | 29,019 | 29,019 | |||||||||||||||
(1) The summary unaudited adjusted financial data is presented excluding the costs of integrating Plateau, net of tax. This presentation is considered a Non-GAAP financial measure, which the Company believes provides a better indication of our operating results prior to the excluded items. | |||||||||||||||||
STERLING CONSTRUCTION COMPANY, INC. & SUBSIDIARIES
CONSOLIDATED STATEMENTS OF OPERATIONS
Reconciliation of Non-GAAP Supplemental Adjusted Financial Data (1)
(In thousands, except per share data)
(Unaudited)
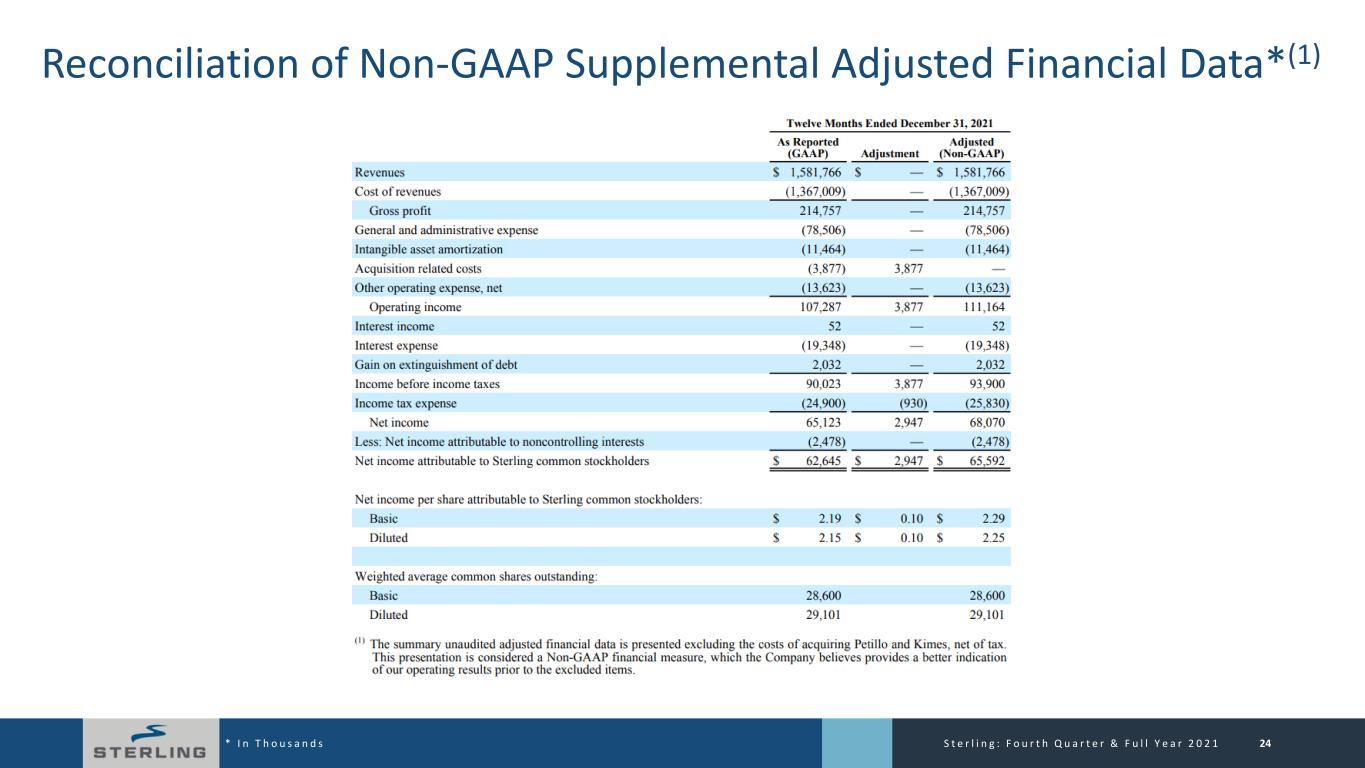
| The Company reports its financial results in accordance with GAAP. This press release also includes several Non-GAAP financial measures as defined under the SEC’s Regulation G. The following tables reconcile certain Non-GAAP financial measures used in this press release to comparable GAAP financial measures. | |||||||||||||||||
| Twelve Months Ended December 31, 2021 | |||||||||||||||||
| As Reported (GAAP) | Adjustment | Adjusted (Non-GAAP) | |||||||||||||||
| Revenues | $ | 1,581,766 | $ | — | $ | 1,581,766 | |||||||||||
| Cost of revenues | (1,367,009) | — | (1,367,009) | ||||||||||||||
| Gross profit | 214,757 | — | 214,757 | ||||||||||||||
| General and administrative expense | (78,506) | — | (78,506) | ||||||||||||||
| Intangible asset amortization | (11,464) | — | (11,464) | ||||||||||||||
| Acquisition related costs | (3,877) | 3,877 | — | ||||||||||||||
| Other operating expense, net | (13,623) | — | (13,623) | ||||||||||||||
| Operating income | 107,287 | 3,877 | 111,164 | ||||||||||||||
| Interest income | 52 | — | 52 | ||||||||||||||
| Interest expense | (19,348) | — | (19,348) | ||||||||||||||
| Gain on extinguishment of debt | 2,032 | — | 2,032 | ||||||||||||||
| Income before income taxes | 90,023 | 3,877 | 93,900 | ||||||||||||||
| Income tax expense | (24,900) | (930) | (25,830) | ||||||||||||||
| Net income | 65,123 | 2,947 | 68,070 | ||||||||||||||
| Less: Net income attributable to noncontrolling interests | (2,478) | — | (2,478) | ||||||||||||||
| Net income attributable to Sterling common stockholders | $ | 62,645 | $ | 2,947 | $ | 65,592 | |||||||||||
| Net income per share attributable to Sterling common stockholders: | |||||||||||||||||
| Basic | $ | 2.19 | $ | 0.10 | $ | 2.29 | |||||||||||
| Diluted | $ | 2.15 | $ | 0.10 | $ | 2.25 | |||||||||||
| Weighted average common shares outstanding: | |||||||||||||||||
| Basic | 28,600 | 28,600 | |||||||||||||||
| Diluted | 29,101 | 29,101 | |||||||||||||||
(1) The summary unaudited adjusted financial data is presented excluding the costs of acquiring Petillo and Kimes, net of tax. This presentation is considered a Non-GAAP financial measure, which the Company believes provides a better indication of our operating results prior to the excluded items. | |||||||||||||||||
STERLING CONSTRUCTION COMPANY, INC. & SUBSIDIARIES
CONSOLIDATED STATEMENTS OF OPERATIONS
Reconciliation of Non-GAAP Supplemental Adjusted Financial Data (1)
(In thousands, except per share data)
(Unaudited)
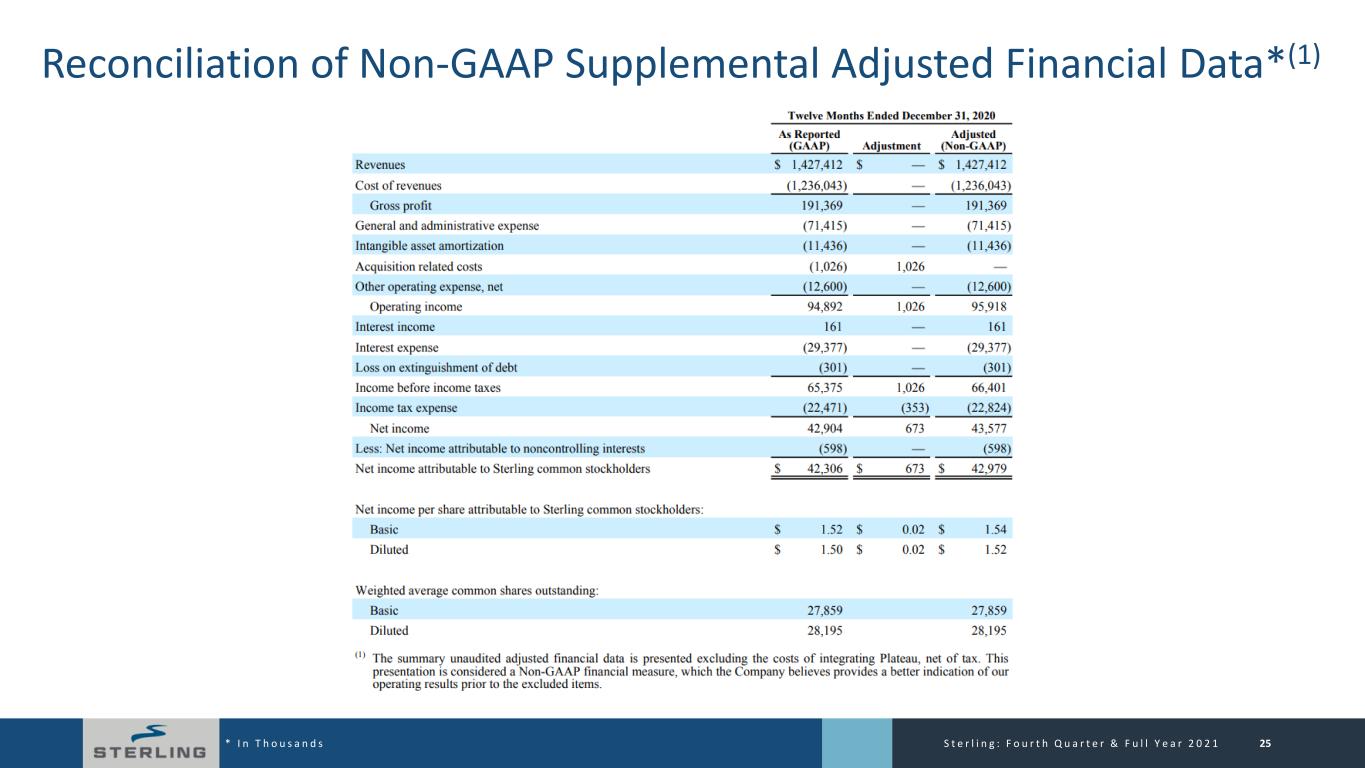
| The Company reports its financial results in accordance with GAAP. This press release also includes several Non-GAAP financial measures as defined under the SEC’s Regulation G. The following tables reconcile certain Non-GAAP financial measures used in this press release to comparable GAAP financial measures. | |||||||||||||||||
| Twelve Months Ended December 31, 2020 | |||||||||||||||||
| As Reported (GAAP) | Adjustment | Adjusted (Non-GAAP) | |||||||||||||||
| Revenues | $ | 1,427,412 | $ | — | $ | 1,427,412 | |||||||||||
| Cost of revenues | (1,236,043) | — | (1,236,043) | ||||||||||||||
| Gross profit | 191,369 | — | 191,369 | ||||||||||||||
| General and administrative expense | (71,415) | — | (71,415) | ||||||||||||||
| Intangible asset amortization | (11,436) | — | (11,436) | ||||||||||||||
| Acquisition related costs | (1,026) | 1,026 | — | ||||||||||||||
| Other operating expense, net | (12,600) | — | (12,600) | ||||||||||||||
| Operating income | 94,892 | 1,026 | 95,918 | ||||||||||||||
| Interest income | 161 | — | 161 | ||||||||||||||
| Interest expense | (29,377) | — | (29,377) | ||||||||||||||
| Loss on extinguishment of debt | (301) | — | (301) | ||||||||||||||
| Income before income taxes | 65,375 | 1,026 | 66,401 | ||||||||||||||
| Income tax expense | (22,471) | (353) | (22,824) | ||||||||||||||
| Net income | 42,904 | 673 | 43,577 | ||||||||||||||
| Less: Net income attributable to noncontrolling interests | (598) | — | (598) | ||||||||||||||
| Net income attributable to Sterling common stockholders | $ | 42,306 | $ | 673 | $ | 42,979 | |||||||||||
| Net income per share attributable to Sterling common stockholders: | |||||||||||||||||
| Basic | $ | 1.52 | $ | 0.02 | $ | 1.54 | |||||||||||
| Diluted | $ | 1.50 | $ | 0.02 | $ | 1.52 | |||||||||||
| Weighted average common shares outstanding: | |||||||||||||||||
| Basic | 27,859 | 27,859 | |||||||||||||||
| Diluted | 28,195 | 28,195 | |||||||||||||||
(1) The summary unaudited adjusted financial data is presented excluding the costs of integrating Plateau, net of tax. This presentation is considered a Non-GAAP financial measure, which the Company believes provides a better indication of our operating results prior to the excluded items. | |||||||||||||||||
STERLING CONSTRUCTION COMPANY, INC. & SUBSIDIARIES
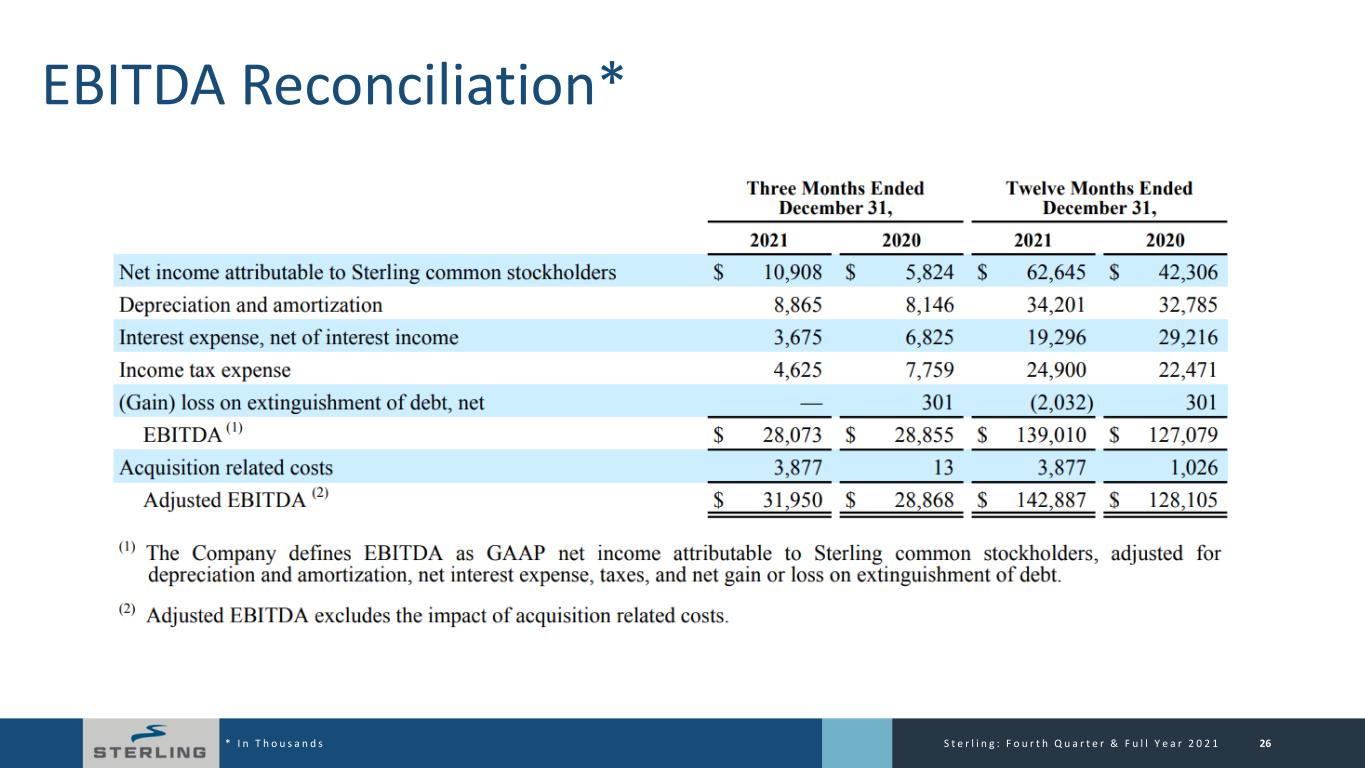
EBITDA RECONCILIATION
(In thousands)
(Unaudited)
| Three Months Ended December 31, | Twelve Months Ended December 31, | ||||||||||||||||||||||
| 2021 | 2020 | 2021 | 2020 | ||||||||||||||||||||
| Net income attributable to Sterling common stockholders | $ | 10,908 | $ | 5,824 | $ | 62,645 | $ | 42,306 | |||||||||||||||
| Depreciation and amortization | 8,865 | 8,146 | 34,201 | 32,785 | |||||||||||||||||||
| Interest expense, net of interest income | 3,675 | 6,825 | 19,296 | 29,216 | |||||||||||||||||||
| Income tax expense | 4,625 | 7,759 | 24,900 | 22,471 | |||||||||||||||||||
| (Gain) loss on extinguishment of debt, net | — | 301 | (2,032) | 301 | |||||||||||||||||||
EBITDA (1) | $ | 28,073 | $ | 28,855 | $ | 139,010 | $ | 127,079 | |||||||||||||||
| Acquisition related costs | 3,877 | 13 | 3,877 | 1,026 | |||||||||||||||||||
Adjusted EBITDA (2) | $ | 31,950 | $ | 28,868 | $ | 142,887 | $ | 128,105 | |||||||||||||||
(1) The Company defines EBITDA as GAAP net income attributable to Sterling common stockholders, adjusted for depreciation and amortization, net interest expense, taxes, and net gain or loss on extinguishment of debt. | |||||||||||||||||||||||
(2) Adjusted EBITDA excludes the impact of acquisition related costs. | |||||||||||||||||||||||