stt-20250417
false000009375100000937512025-04-172025-04-170000093751us-gaap:CommonStockMember2025-04-172025-04-170000093751stt:SeriesGPreferredStockDepositoryShareMember2025-04-172025-04-17

UNITED STATES
SECURITIES AND EXCHANGE COMMISSION
Washington, D.C. 20549
______________________
FORM 8-K
_________________
CURRENT REPORT
Pursuant to Section 13 or 15(d) of the Securities Exchange Act of 1934
Date of Report (Date of earliest event reported): April 17, 2025
______________________
State Street Corporation
(Exact name of Registrant as Specified in its Charter)
____________________
Massachusetts001-0751104-2456637
(State or other jurisdiction of incorporation)(Commission File Number)(IRS Employer Identification No.)
One Congress Street
BostonMassachusetts02114
(Address of principal executive offices, and Zip Code)
Registrant’s telephone number, including area code:
(617)
786-3000
________________
Check the appropriate box below if the Form 8-K filing is intended to simultaneously satisfy the filing obligation of the registrant under any of the following provisions:
    Written communications pursuant to Rule 425 under the Securities Act (17 CFR 230.425)
    Soliciting material pursuant to Rule 14a-12 under the Exchange Act (17 CFR 240.14a-12)
    Pre-commencement communications pursuant to Rule 14d-2(b) under the Exchange Act (17 CFR 240.14d-2(b))
    Pre-commencement communications pursuant to Rule 13e-4(c) under the Exchange Act (17 CFR 240.13e-4(c))

Securities registered pursuant to Section 12(b) of the Act:
Title of each classTrading Symbol(s)Name of each exchange on which registered
Common stock, $1 par value per shareSTTNew York Stock Exchange
Depositary Shares, each representing a 1/4,000th ownership interest in a share of STT.PRGNew York Stock Exchange
Fixed-to-Floating Rate Non-Cumulative Perpetual Preferred Stock, Series G, without par value per share
Indicate by check mark whether the registrant is an emerging growth company as defined in Rule 405 of the Securities Act of 1933 (§230.405 of this chapter) or Rule 12b-2 of the Securities Exchange Act of 1934 (§240.12b-2 of this chapter).
Emerging growth company 
If an emerging growth company, indicate by check mark if the registrant has elected not to use the extended transition period for complying with any new or revised financial accounting standards provided pursuant to Section 13(a) of the Exchange Act.  ¨


Item 2.02.    Results of Operations and Financial Condition.
On April 17, 2025, State Street Corporation ("State Street") issued a news release announcing its results of operations for the first-quarter 2025. Copies of that news release and accompanying first-quarter 2025 financial information addendum are furnished herewith as Exhibits 99.1 and 99.2, respectively, and are incorporated herein by reference.
Item 7.01.    Regulation FD Disclosure.
Investor Conference Call Slide Presentation
On April 17, 2025, State Street made available a slide presentation providing highlights of its first-quarter 2025 results of operations and related information as of March 31, 2025, which is being made available in connection with an April 17, 2025 investor conference call. A copy of that slide presentation is furnished herewith as Exhibit 99.3 and is incorporated herein by reference.
Senior Notes Redemption
On April 17, 2025, State Street notified the holders of its $1,000,000,000 aggregate principal amount of 5.104% Fixed-to-Floating Rate Senior Notes due 2026 (the “Notes”) that it will redeem all of the Notes on May 18, 2025 (the “Redemption Date”). The Notes will be redeemed at a redemption price equal to 100% of the principal amount of the Notes to be redeemed, plus accrued and unpaid interest thereon to, but excluding, the Redemption Date (the “Redemption Amount”). Since the Redemption Date is not a business day, the Redemption Amount will be paid on the next succeeding business day, with the same force and effect as if made on the Redemption Date. On and after the Redemption Date, interest will cease to accrue on the Notes.
State Street intends to fund the aggregate redemption price using cash on hand.
The information in Item 7.01 of this Current Report on Form 8-K shall not be deemed “filed” for purposes of Section 18 of the Securities Exchange Act of 1934, as amended (the “Exchange Act”), or otherwise subject to the liabilities of that section, nor shall it be deemed incorporated by reference in any filing under the Securities Act of 1933, as amended, or the Exchange Act, except as expressly set forth by specific reference in such filing.
Item 9.01.    Financial Statements and Exhibits.
(d) Exhibits.
State Street's news release dated April 17, 2025, announcing its first-quarter 2025 results of operations and accompanying first-quarter 2025 financial information addendum are furnished herewith as Exhibits 99.1 and 99.2, respectively, and are incorporated by reference in Item 2.02 hereof; and a slide presentation providing highlights of State Street's first-quarter 2025 results of operations and related information, which is being made available in connection with an April 17, 2025 investor conference call, is furnished herewith as Exhibit 99.3 and is incorporated by reference in Item 7.01 hereof.


Exhibit No.Description
*104Cover Page Interactive Data File (formatted as Inline XBRL)
 *Submitted electronically herewith


SIGNATURES
Pursuant to the requirements of the Securities Exchange Act of 1934, the registrant has duly caused this report to be signed on its behalf by the undersigned hereunto duly authorized.

STATE STREET CORPORATION
By:/s/ Elizabeth M. Schaefer
Name:Elizabeth M. Schaefer,
Title:Senior Vice President and Chief Accounting Officer
Date:April 17, 2025

imagea.jpg
Exhibit 99.1
State Street Corporation
One Congress Street
Boston, MA 02114
NYSE: STT
         www.statestreet.com
Boston, MA… April 17, 2025 News Release

STATE STREET REPORTS FIRST QUARTER 2025 EPS OF $2.04
 % changes noted below reflect year-over-year 1Q comparisons
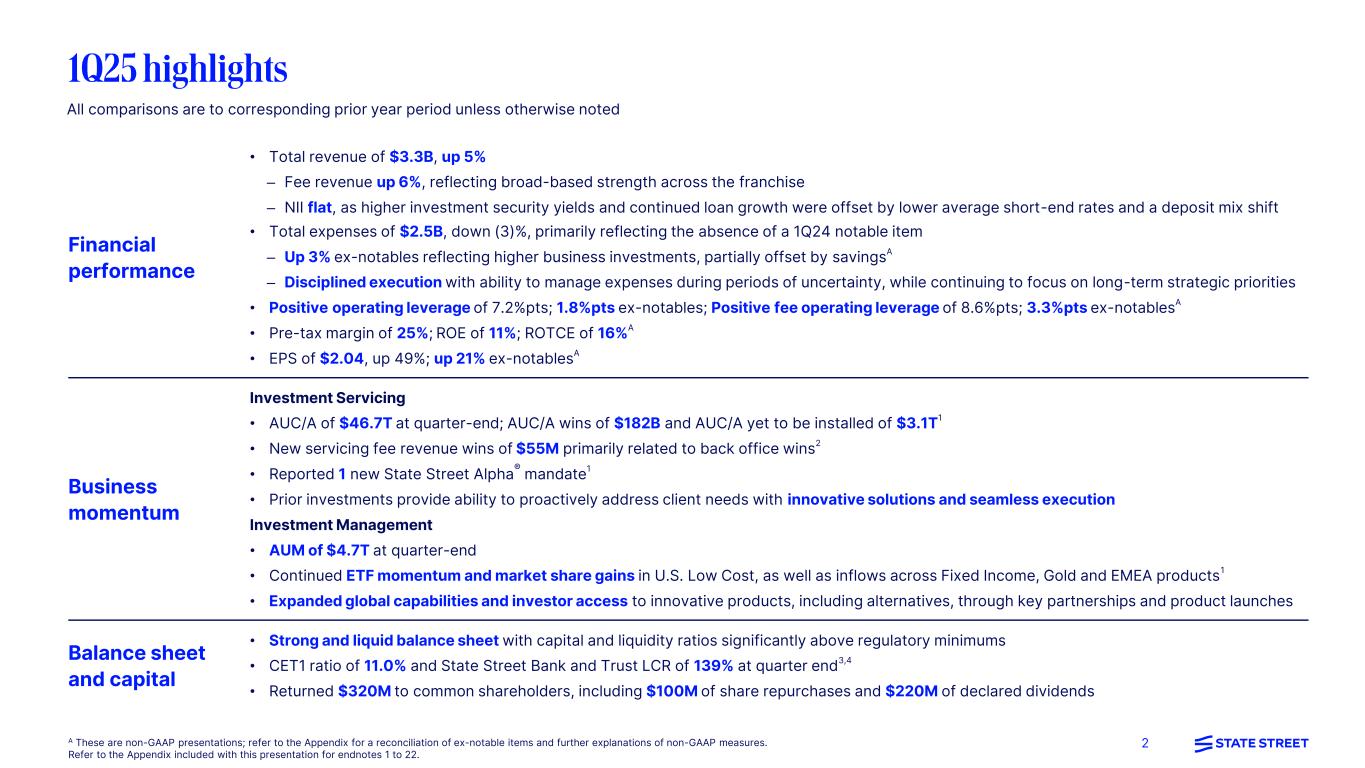
TOTAL REVENUE UP 5% WITH FEE REVENUE UP 6%
SERVICING FEES UP 4%; MANAGEMENT FEES UP 10%; FRONT OFFICE SOFTWARE AND DATA REVENUE UP 10%
EXPENSES DOWN 3%; UP 3% EX-NOTABLES(a)
POSITIVE FEE AND TOTAL OPERATING LEVERAGE
EPS OF $2.04, INCREASED 49%; UP 21% EX-NOTABLES(a)
Ron O'Hanley, Chairman and Chief Executive Officer: "Our first quarter results reflect cross-firm growth, strong financial performance and a solid start to the year. Through broad-based year-over-year fee revenue growth and continued expense discipline, we achieved positive fee and total operating leverage alongside healthy pre-tax margin expansion, all while continuing to return capital to our shareholders."

O'Hanley continued: "The world’s investors and the global economy are now navigating through a period of geopolitical and government policy uncertainty around trade, deficits, tax, and deregulation. State Street has a long-standing history of resilience and adaptability, which has seen us through many challenging operating environments and has equipped us to effectively support our clients."

O'Hanley concluded: "As we look ahead, our conviction in our strategy remains, underpinned by our financial strength and ability to support our clients. While the current operating environment requires us to be adaptable and agile, and to be prepared for a wide range of scenarios, I firmly believe that we have the correct strategy in place to continue to deliver sustained growth for our shareholders over the long term. Importantly, the current environment provides a unique opportunity for us to demonstrate the strength and effectiveness of our value proposition to clients."
FINANCIAL HIGHLIGHTS
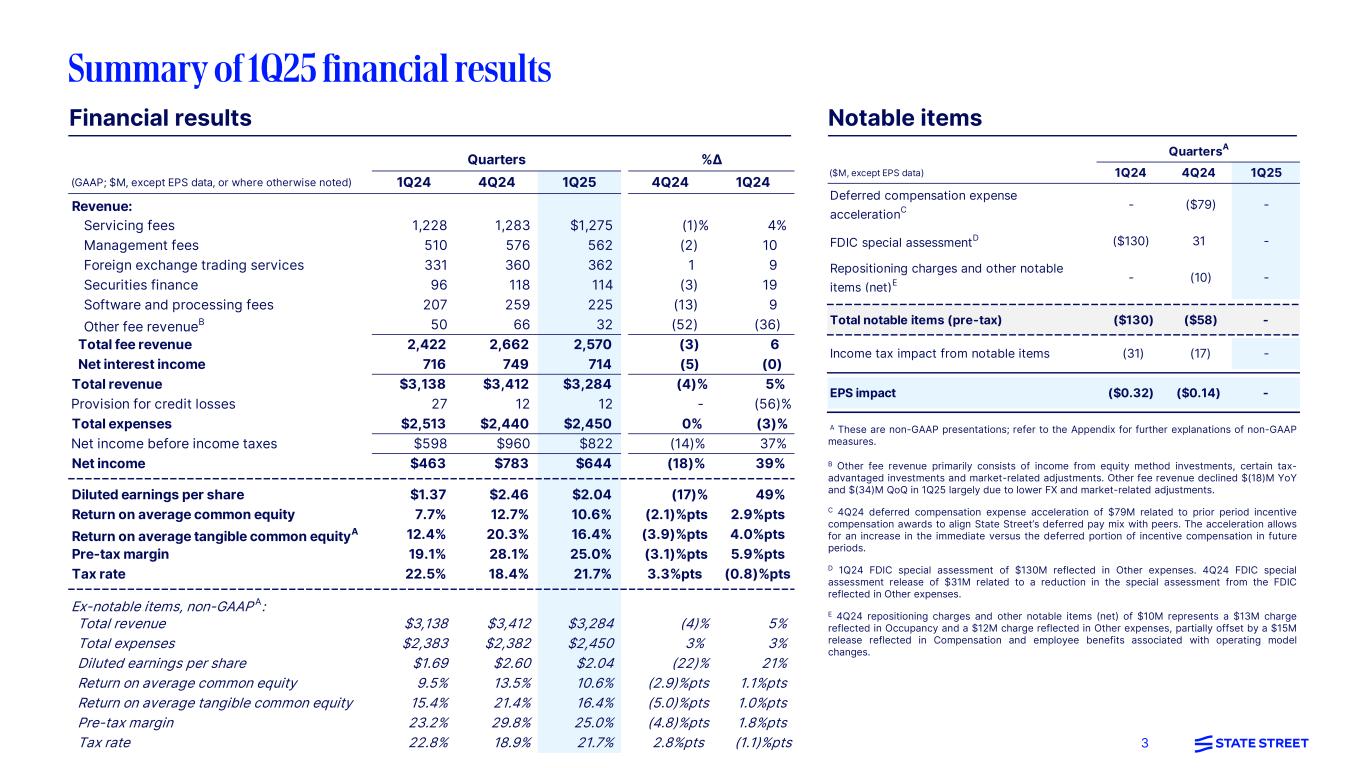
(Table presents summary results, dollars in millions, except per share amounts, or where otherwise noted)1Q254Q241Q24 % QoQ  % YoY
Income statement:
Total fee revenue$2,570 $2,662 $2,422 (3)%%
Net interest income714 749 716 (5)(0)
Other income— — nm— 
Total revenue3,284 3,412 3,138 (4)
Provision for credit losses12 12 27 — (56)
Total expenses2,450 2,440 2,513 (3)
Net income644 783 463 (18)39 
Financial ratios and other metrics:
Diluted earnings per share (EPS)$2.04 $2.46 $1.37 (17)%49 %
Return on average common equity (ROE)10.6 %12.7 %7.7 %(2.1)%pts2.9 %pts
Pre-tax margin25.0 28.1 19.1 (3.1)%pts5.9 %pts
AUC/A ($ billions)(1)
$46,733 $46,557 $43,912 — %%
AUM ($ billions)(1)
4,665 4,715 4,299 (1)
(1) As of period-end.

(a) See "1Q25 Highlights" in this news release for a listing of notable items. Results excluding notable items are non-GAAP measures. Please refer to the Addendum included with this news
release for an explanation and reconciliation of non-GAAP measures.


Investor Contact: Elizabeth Lynn +1 617-664-3477          Media Contact: Carolyn Cichon +1 617-664-8672
1

                    
1Q25 HIGHLIGHTS
(All comparisons are to 1Q24, unless otherwise noted)

AUC/A and AUM
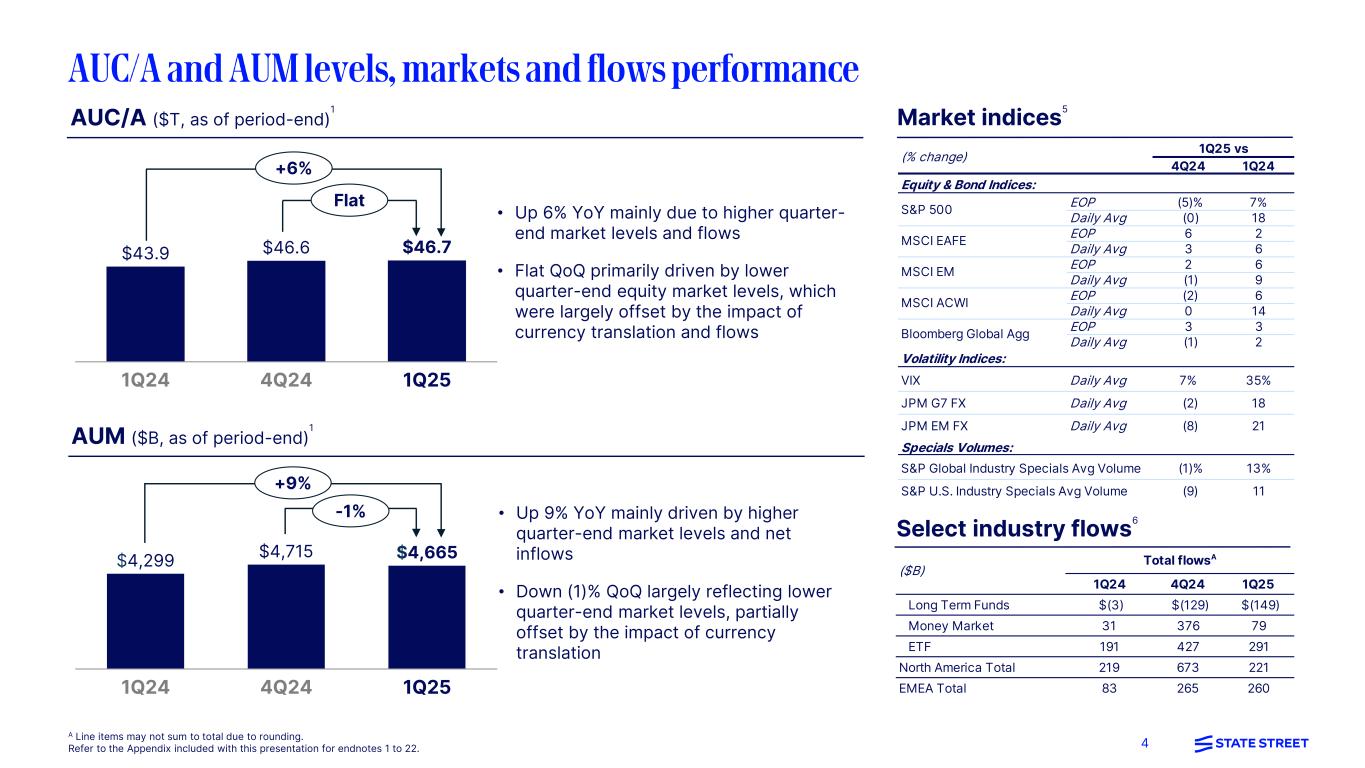
Investment Servicing AUC/A as of quarter-end increased 6% to $46.7 trillion, mainly due to higher quarter-end market levels and flows
Investment Management AUM as of quarter-end increased 9% to $4.7 trillion, mainly driven by higher quarter-end market levels and net inflows

New business and strategy execution(a)
New wins in 1Q25
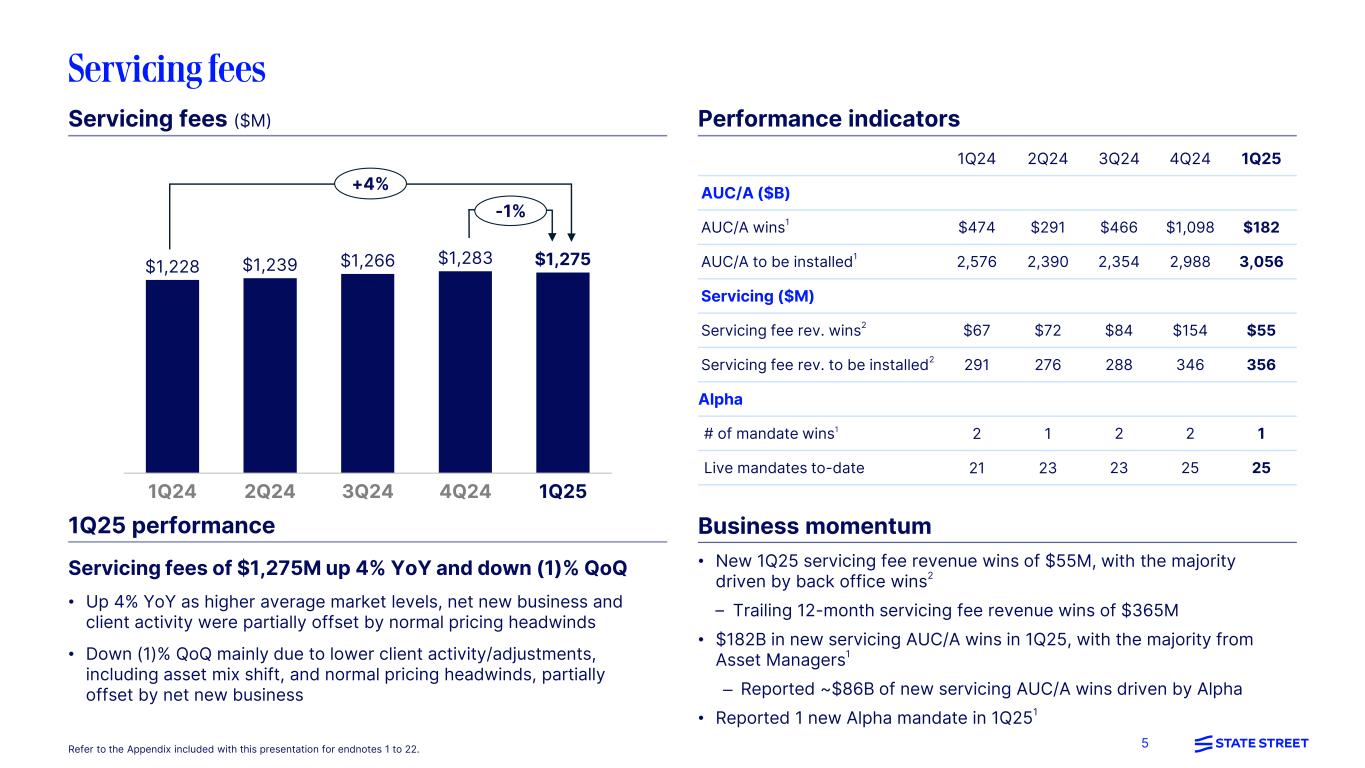
New servicing fee revenue wins: New servicing fee revenue wins of $55 million, the majority of which were driven by back office wins
AUC/A wins: New servicing AUC/A wins of $182 billion
Approximately $86 billion of new servicing AUC/A wins driven by State Street Alpha®
To be installed in future periods as of 1Q25
Servicing fee revenue to be installed: Quarter-end servicing fee revenue of $356 million to be installed in future periods
AUC/A to be installed: Quarter-end AUC/A of $3.1 trillion to be installed in future periods
State Street Alpha: Reported 1 new mandate win in 1Q25
Front Office Software and Data: Annual recurring revenue (ARR) increased approximately 15%, driven by SaaS client conversions and implementations
Investment Management: Continued ETF momentum and market share gains in U.S. Low Cost ETF suite, as well as inflows across Fixed Income, Gold and EMEA products. Global Advisors expanded its global capabilities and investor access to innovative products, including alternatives, through key partnerships and product launches
Revenue
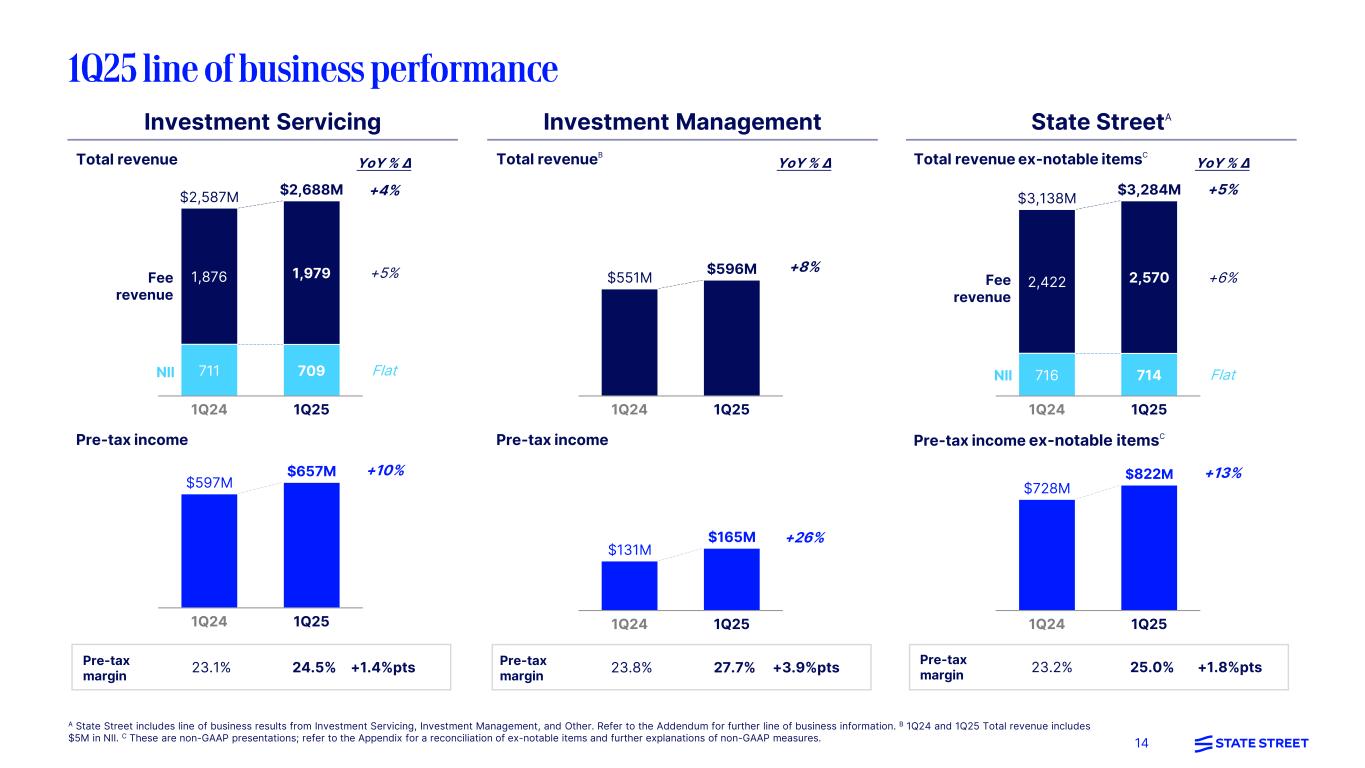
Total revenue increased 5%, driven by higher Fee revenue
Fee revenue increased 6%, reflecting broad-based strength across the franchise
Servicing fees increased 4%
Management fees increased 10%
FX trading services increased 9%
Securities finance increased 19%
Software and processing fees increased 9%
Other fee revenue decreased 36%
Net interest income (NII) was flat, as higher investment security yields and continued loan growth were offset by lower average short-end rates and a deposit mix shift


(a) See the "In This News Release" section for explanations of AUC/A, new servicing fee revenue wins and revenue to be installed, and Front office software and data ARR.
2

Expenses
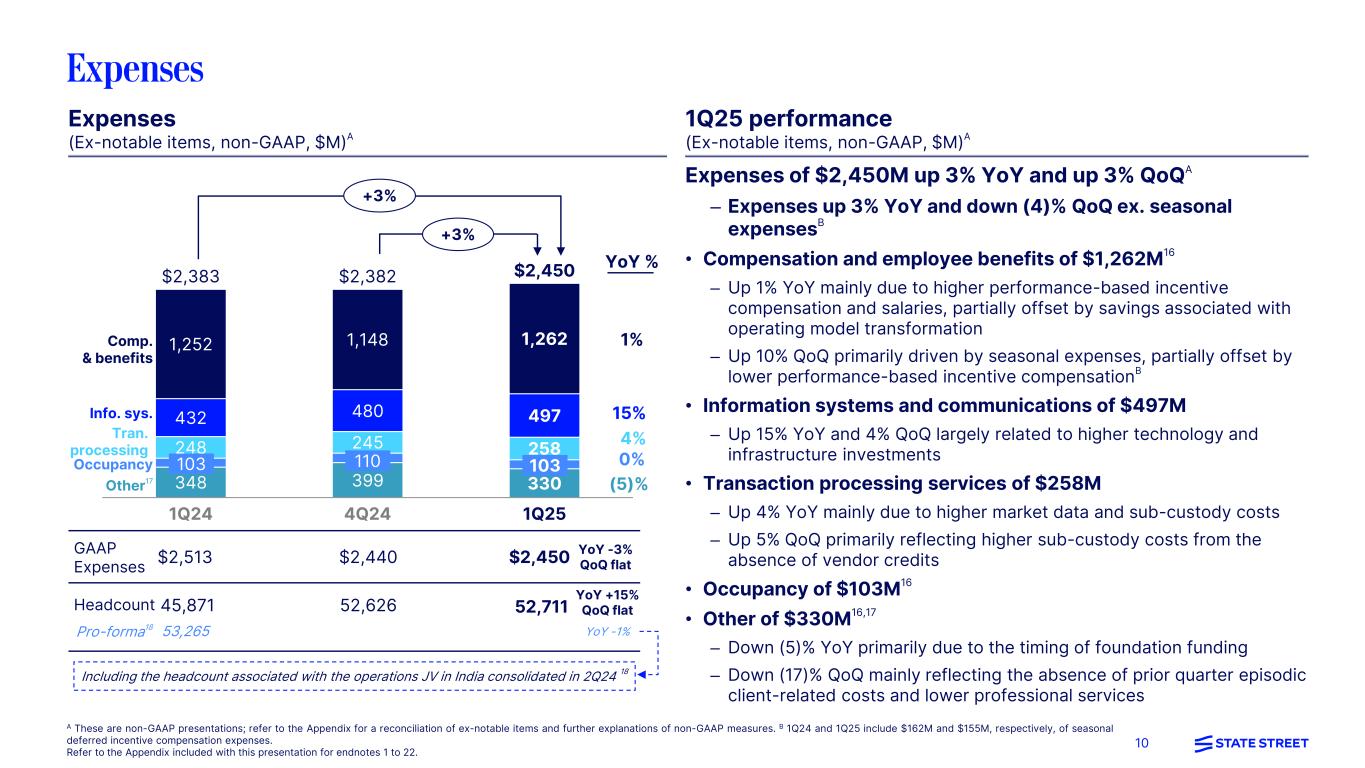
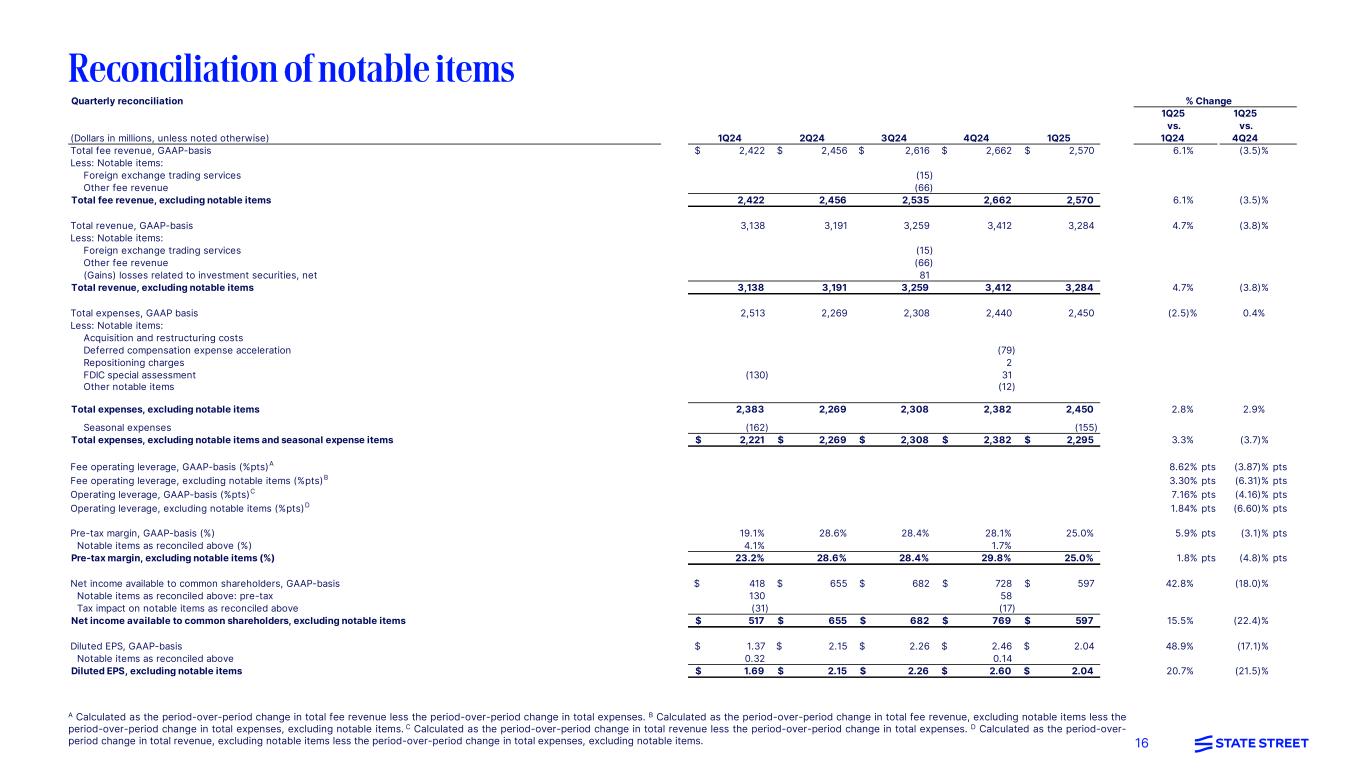
Total expenses decreased 3%, reflecting the absence of a prior-year notable item. Excluding notable items,(a) total expenses increased 3%, primarily reflecting higher business investments, partially offset by savings
Compensation and employee benefits increased 1%
Information systems and communications increased 15%
Transaction processing services increased 4%
Occupancy flat
Other expenses decreased 34%, and excluding notables,(a) decreased 4%(b)

Notable items

(Dollars in millions, except EPS amounts)1Q254Q241Q24
Deferred compensation expense acceleration(c)
$— $(79)$— 
FDIC special assessment(d)
— 31 (130)
Repositioning charges and other notable items (net)(e)
— (10)— 
Total notable items (pre-tax)$ $(58)$(130)
Income tax impact from notable items (17)(31)
EPS impact$ $(0.14)$(0.32)

Capital and liquidity
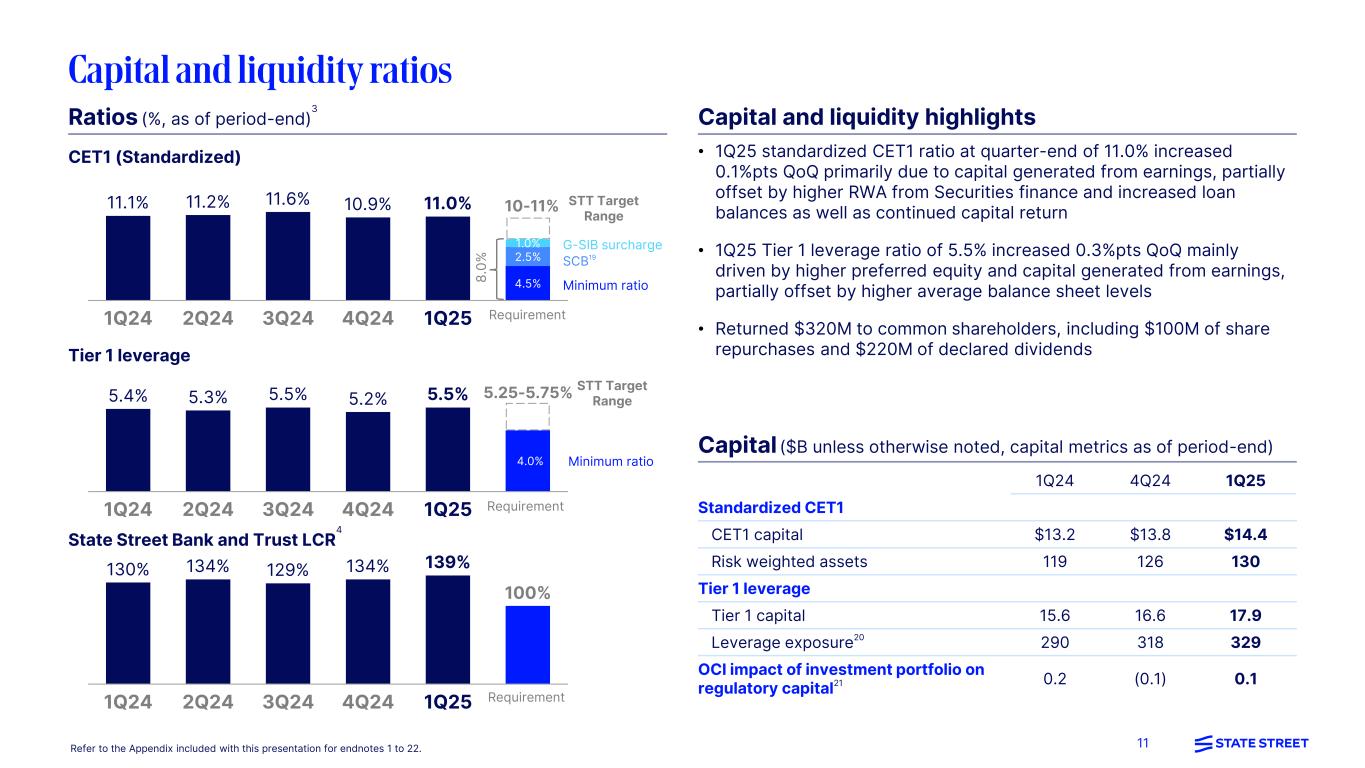
Standardized common equity tier 1 (CET1) ratio at quarter-end of 11.0% decreased 0.1% points compared to 1Q24, primarily driven by higher risk-weighted assets (RWA) and continued capital return, partially offset by capital generated from earnings and an improvement in accumulated other comprehensive income (AOCI). CET1 ratio increased 0.1% points compared to 4Q24, primarily due to capital generated from earnings, partially offset by higher RWA from Securities finance and increased loan balances as well as continued capital return
Liquidity coverage ratio (LCR) for State Street Corporation was approximately 106%, and LCR for State Street Bank and Trust was approximately 139%
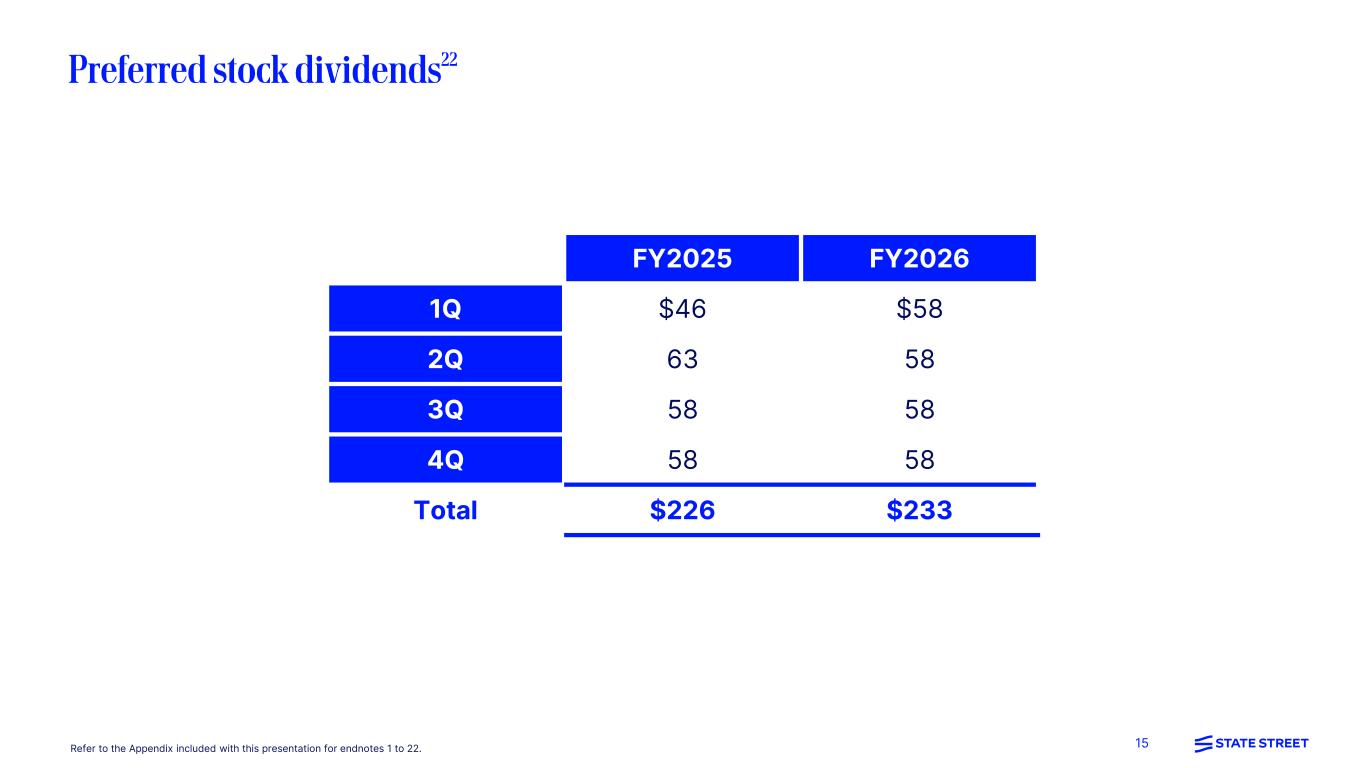
In 1Q25, State Street returned a total of $320 million of capital to common shareholders, including $100 million of common share repurchases and $220 million (or $0.76 per share) of declared dividends


(a) See "1Q25 Highlights" in this news release for a listing of notable items. Results excluding notable items are non-GAAP measures. Please refer to the Addendum included with this news
release for an explanation and reconciliation of non-GAAP measures.
(b) Other expenses in 1Q24 included a notable item related to the FDIC special assessment of $130M. Excluding this notable item, 1Q25 GAAP Other expenses of $276M was down 4% compared to 1Q24 adjusted Other expenses of $288 million.
(c) 4Q24 deferred compensation expense acceleration of $79 million related to prior period incentive compensation awards to align State Street's deferred pay mix with peers.
(d) 1Q24 FDIC special assessment of $130 million reflected in Other expenses. 4Q24 FDIC special assessment release of $31 million reflected in Other expenses.
(e) 4Q24 repositioning charges and other notable items (net) of $10 million represents $13 million reflected in Occupancy and $12 million reflected in Other expenses associated with operating model changes, partially offset by a $15 million release reflected in Compensation and employee benefits.
3

                    
MARKET DATA
The following table provides a summary of selected historical financial information, including market indices and foreign exchange rates.
(Dollars in billions, except market indices and foreign exchange rates)(1)
1Q254Q241Q24 % QoQ % YoY
Assets under Custody and/or Administration (AUC/A)(2)(3)
$46,733 $46,557 $43,912 — %%
Assets under Management (AUM)(3)
4,665 4,715 4,299 (1)
Market Indices:(4)
S&P 500 EOP5,6125,8825,254(5)
S&P 500 Daily Average5,8955,9074,993— 18 
MSCI EAFE EOP2,4012,2622,349
MSCI EAFE Daily Average2,3952,3342,263
MSCI Emerging Markets EOP1,1011,0751,043
MSCI Emerging Markets Daily Average1,1041,1171,010(1)
MSCI ACWI EOP827841784(2)
MSCI ACWI Daily Average856853749— 14 
Bloomberg Global Aggregate Bond Index EOP476463462
Bloomberg Global Aggregate Bond Index Daily Average469472461(1)
Foreign Exchange Volatility Indices:(4)
CBOE Volatility Index (VIX) Daily Average18.517.413.735 
JPM G7 Volatility Index Daily Average8.58.77.3(2)18 
JPM Emerging Market Volatility Index Daily Average8.39.16.9(8)21 
Specials Volumes:(4)
S&P Global Industry Specials Average Volume72,728 73,823 64,606 (1)13 
S&P U.S. Industry Specials Average Volume36,777 40,508 33,080 (9)11 
Average Foreign Exchange Rates:
EUR vs. USD1.053 1.066 1.086 (1)(3)
GBP vs. USD1.260 1.281 1.268 (2)(1)
(1) Historical financial information may not be indicative of future financial information.
(2) Includes quarter-end assets under custody of $33,837 billion, $33,805 billion and $32,159 billion, as of 1Q25, 4Q24, and 1Q24, respectively.
(3) As of period-end.
(4) The index names listed are service marks of their respective owners. S&P Global Specials and S&P U.S. Specials Volumes sourced from S&P Global Market Intelligence.
INDUSTRY FLOW DATA
The following table represents industry flow data.
(Dollars in billions)1Q254Q243Q242Q241Q24
North America - (U.S. Domiciled) Morningstar Direct Market Data:(1)(2)
Long-term Funds
$(149)$(129)$(117)$(111)$(3)
Money Market79 376 230 62 31 
ETF291 427 288 206 191 
Total Flows(3)
$221 $673 $401 $157 $219 
EMEA - Morningstar Direct Market Data:(1)(4)
Long-term Funds
$96 $108 $82 $52 $
Money Market70 73 107 39 29 
ETF94 85 66 57 47 
Total Flows(3)
$260 $265 $255 $148 $83 
(1) Industry data is provided for illustrative purposes only. It is not intended to reflect State Street or its clients' activity and is indicative of only segments of the entire industry. See endnotes included in the "In This News Release" section.
(2) 1Q25 data for North America includes actuals for January and February 2025 and Morningstar estimates for March 2025.
(3) Line items may not sum to total due to rounding.
(4) 1Q25 data for EMEA is on a rolling three-month basis for December 2024 through February 2025, sourced by Morningstar.
4

                    
INVESTMENT SERVICING AUC/A
The following table presents AUC/A information by product and financial instrument.
(As of period end, dollars in billions)1Q254Q241Q24 % QoQ % YoY
Assets Under Custody and/or Administration(1)
By product classification:
Collective funds, including ETFs$15,430 $15,266 $14,694 %%
Mutual funds12,143 12,301 11,552 (1)
Pension products9,377 9,386 8,800 (0)
Insurance and other products9,783 9,604 8,866 10 
Total Assets Under Custody and/or Administration$46,733 $46,557 $43,912 %%
By asset class:
Equities$27,508 $27,535 $25,909 (0)%%
Fixed-income11,900 11,933 11,368 (0)
Short-term and other investments(2)
7,325 7,089 6,635 10 
Total Assets Under Custody and/or Administration$46,733 $46,557 $43,912 %%
(1) AUC/A values for certain asset classes are based on a lag, typically one-month.
(2) Short-term and other investments includes derivatives, cash and cash equivalents and other instruments.

INVESTMENT MANAGEMENT AUM
The following tables present 1Q25 activity in AUM by product category.
(Dollars in billions) EquityFixed- Income Cash Multi-Asset Class Solutions
Alternative Investments(1)
 Total
Beginning balance as of December 31, 2024
$3,007 $616 $518 $374 $200 $4,715 
Net asset flows:
Long-term institutional(2)
(21)(7)— 13 — (15)
ETF(16)— — 
Cash fund— — — — 
Total flows, net$(37)$$$13 $$(13)
Market appreciation/(depreciation)(84)(2)(1)14 (65)
Foreign exchange impact15 28 
Total market and foreign exchange impact$(69)$15 $(1)$$15 $(37)
Ending balance as of March 31, 2025
$2,901 $633 $518 $390 $223 $4,665 
(1) Includes real estate investment trusts, currency and commodities, including SPDR® Gold Shares and SPDR® Gold MiniSharesSM Trust, for which we are not the investment manager but act as the marketing agent.
(2) Amounts represent long-term portfolios, excluding ETFs.

(Dollars in billions)1Q25
4Q24
3Q24(1)
2Q24(1)
1Q24(1)
Beginning balance$4,715 $4,732 $4,369 $4,299 $4,102 
Net asset flows:
Long-term institutional(2)
(15)26 (8)(24)
ETF65 37 
Cash fund(27)54 (4)
Total flows, net$(13)$64 $100 $(6)$(14)
Market appreciation/(depreciation)(65)208 83 243 
Foreign exchange impact28 (82)55 (7)(32)
Total market and foreign exchange impact$(37)$(81)$263 $76 $211 
Ending balance$4,665 $4,715 $4,732 $4,369 $4,299 
(1) AUM for passive alternative investments has been revised from prior presentations.
(2) Amounts represent long-term portfolios, excluding ETFs.
5

                    
REVENUE
(Dollars in millions)1Q254Q241Q24 % QoQ% YoY
Servicing fees$1,275 $1,283 $1,228 (0.6)%3.8 %
Management fees562 576 510 (2.4)10.2 
Foreign exchange trading services362 360 331 0.6 9.4 
Securities finance114 118 96 (3.4)18.8 
Front office software and data158 197 144 (19.8)9.7 
Lending related and other fees67 62 63 8.1 6.3 
Software and processing fees225 259 207 (13.1)8.7 
Other fee revenue32 66 50 (51.5)(36.0)
Total fee revenue$2,570 $2,662 $2,422 (3.5)%6.1 %
Net interest income714 749 716 (4.7)%(0.3)%
Other income— — nm— 
Total Revenue$3,284 $3,412 $3,138 (3.8)%4.7 %
Net interest margin (FTE)(1)
1.00 %1.07 %1.13 %(0.07)%(0.13)%
(1) Net interest margin (NIM) is presented on a fully taxable-equivalent (FTE) basis. Refer to the Addendum for reconciliations of our FTE-basis presentation.

Servicing fees increased 4% compared to 1Q24, as higher average market levels, net new business and client activity were partially offset by normal pricing headwinds. Servicing fees decreased 1% compared to 4Q24, mainly due to lower client activity/adjustments, including asset mix shift, and normal pricing headwinds, partially offset by net new business.

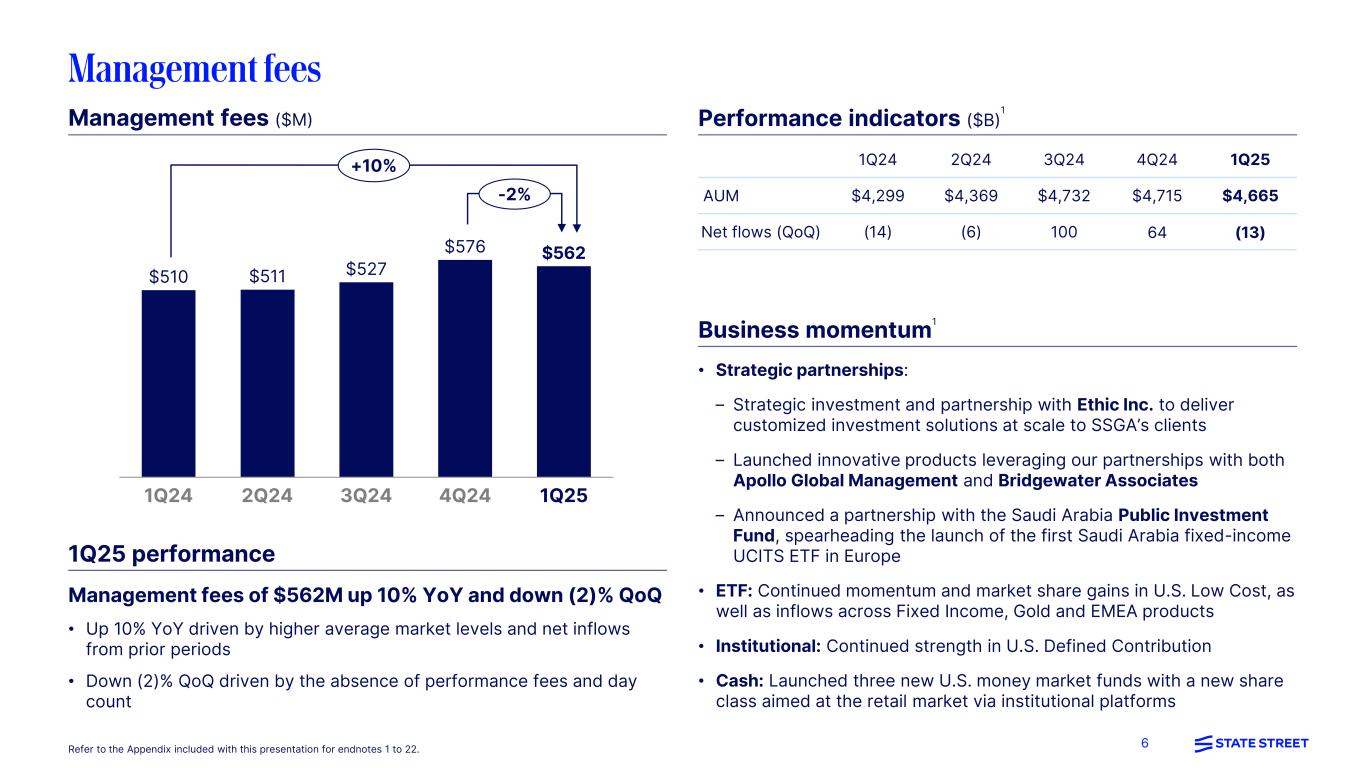
Management fees increased 10% compared to 1Q24, driven by higher average market levels and net inflows from prior periods. Management fees decreased 2% compared to 4Q24, driven by the absence of performance fees and day count.

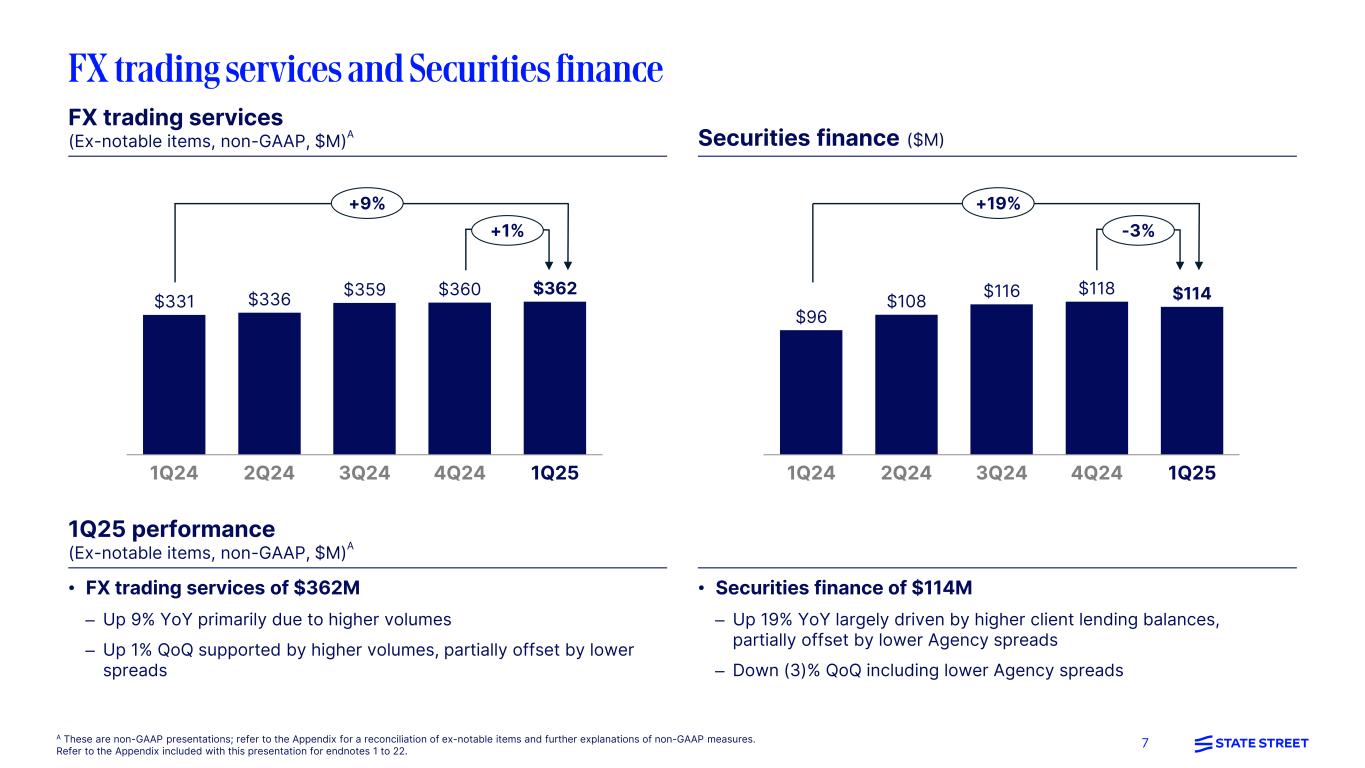
Foreign exchange trading services increased 9% compared to 1Q24, primarily due to higher volumes. Foreign exchange trading services increased 1% compared to 4Q24, supported by higher volumes, partially offset by lower spreads.

Securities finance increased 19% compared to 1Q24, largely driven by higher client lending balances, partially offset by lower Agency spreads. Securities finance decreased 3% compared to 4Q24, including lower Agency spreads.

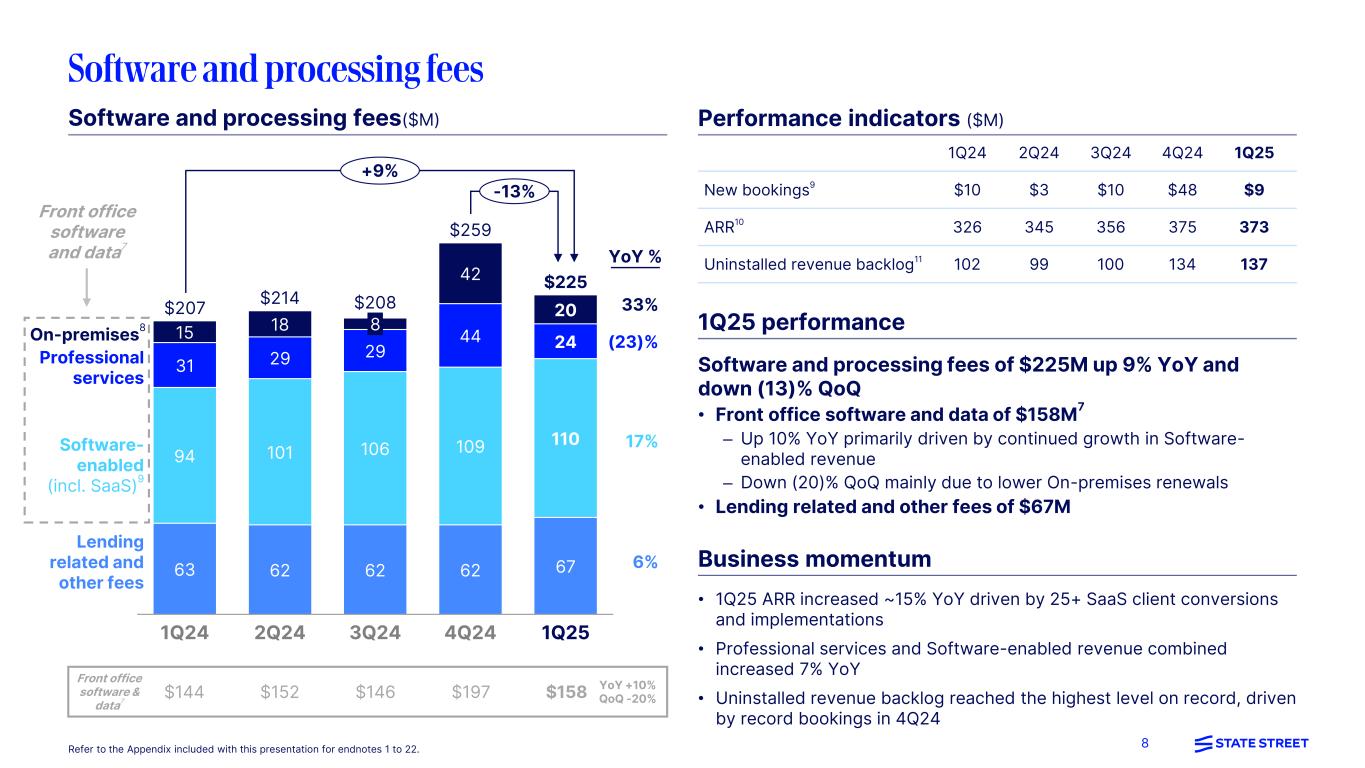
Software and processing fees increased 9% compared to 1Q24, primarily driven by higher Front office software and data revenue associated with CRD. Software and processing fees decreased 13% compared to 4Q24, largely due to lower On-premises renewals, partially offset by higher Lending related and other fee revenue.
Front office software and data increased 10% compared to 1Q24, primarily driven by continued growth in Software-enabled revenue. Front office software and data decreased 20% compared to 4Q24, mainly due to lower On-premises renewals
Lending related and other fees increased 6% compared to 1Q24 and increased 8% compared to 4Q24, driven in part by continued growth of the portfolio in support of client demand
Other fee revenue decreased $18 million compared to 1Q24 and decreased $34 million compared to 4Q24, largely due to lower FX and market-related adjustments.

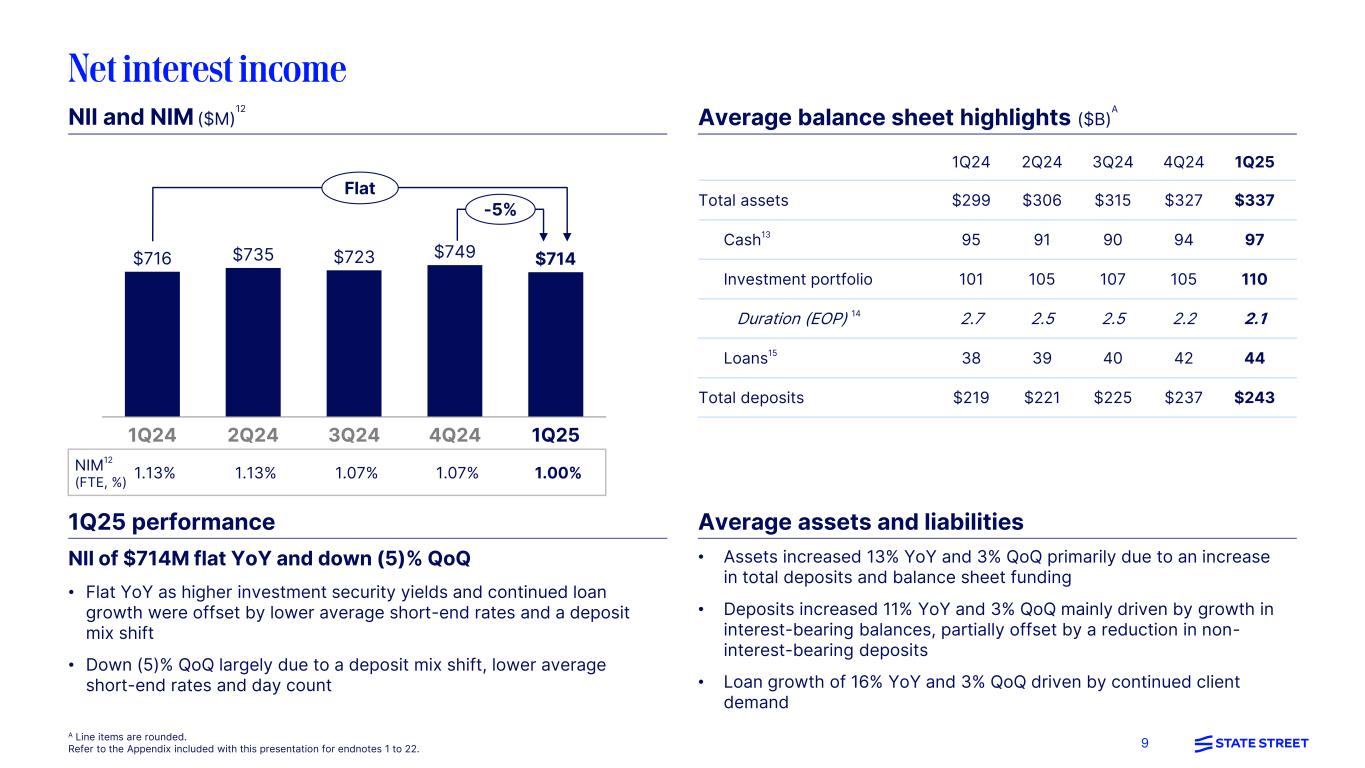
Net interest income was flat compared to 1Q24, as higher investment security yields and continued loan growth were offset by lower average short-end rates and a deposit mix shift. Compared to 4Q24, NII decreased 5%, largely due to a deposit mix shift, lower average short-end rates, and day count.

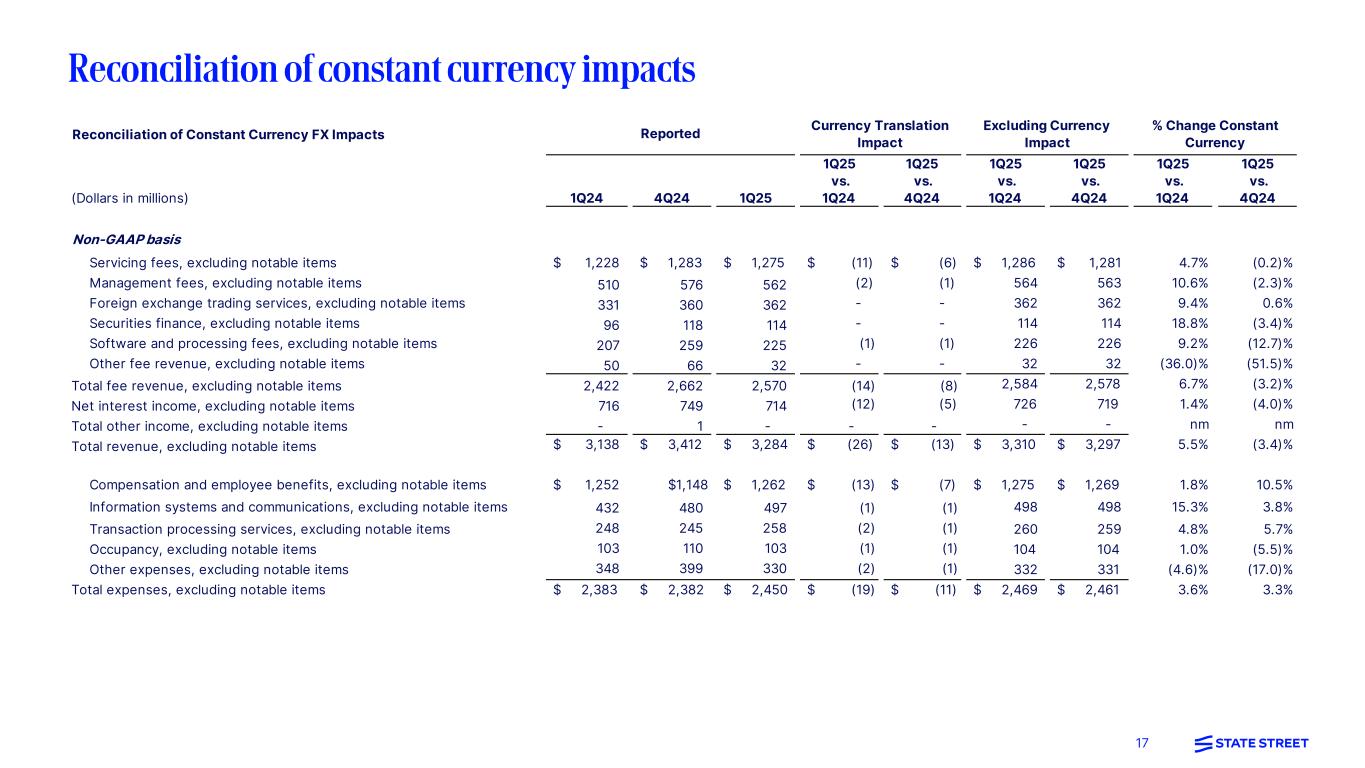
Total revenues were negatively impacted by currency translation of $26 million and $13 million compared to 1Q24 and 4Q24, respectively.
6

                    
PROVISION FOR CREDIT LOSSES
(Dollars in millions)1Q254Q241Q24 % QoQ % YoY
Allowance for credit losses:
Beginning balance$183$171$1507.0 %22.0 %
Provision for credit losses121227(55.6)
Charge-offs(9)(31)               nm(71.0)
Ending Balance$186$183$1461.6 %27.4 %
Total provision for credit losses was $12 million in 1Q25, primarily reflecting an increase in loan loss reserves associated with certain commercial real estate loans.

EXPENSES
(Dollars in millions)1Q254Q241Q24 % QoQ % YoY
Compensation and employee benefits$1,262$1,212$1,2524.1 %0.8 %
Information systems and communications4974804323.5 15.0 
Transaction processing services2582452485.3 4.0 
Occupancy103123103(16.3)— 
Amortization of other intangible assets545460— (10.0)
Other276326418(15.3)(34.0)
Total Expenses$2,450$2,440$2,5130.4 %(2.5)%
Total expenses, excluding notable items(1)
$2,450$2,382$2,3832.9 %2.8 %
Effective tax rate21.7 %18.4 %22.5 %3.3 %pts(0.8)%pts
(1) See "1Q25 Highlights" in this news release for a listing of notable items. Results excluding notable items are non-GAAP measures. Please refer to the Addendum included with this news
release for an explanation and reconciliation of non-GAAP measures.

Compensation and employee benefits increased 1% compared to 1Q24, mainly due to higher performance-based incentive compensation and salaries, partially offset by savings associated with operating model transformation. Compared to 4Q24, Compensation and employee benefits increased 4%, primarily driven by seasonal deferred incentive compensation expenses, partially offset by the absence of prior-period notable items and lower performance-based incentive compensation. Excluding notable items,(a) Compensation and employee benefits increased 10% compared to 4Q24.

Information systems and communications increased 15% compared to 1Q24 and increased 4% compared to 4Q24, largely related to higher technology and infrastructure investments.

Transaction processing services increased 4% compared to 1Q24, mainly due to higher market data and sub-custody costs. Transaction processing services increased 5% compared to 4Q24, primarily reflecting higher sub-custody costs from the absence of vendor credits.

Occupancy was flat compared to 1Q24. Compared to 4Q24, Occupancy decreased 16%, mainly driven by the absence of one-time repositioning charges. Excluding notable items,(a) Occupancy decreased 6% compared to 4Q24, driven by the absence of one-time costs in 4Q24.

Other expenses(b) decreased 34% compared to 1Q24, primarily due to the absence of a prior-period notable item. Excluding notable items,(a) Other expenses decreased 4% compared to 1Q24 mainly due to the timing of foundation funding. Other expenses decreased 15% compared to 4Q24, mainly reflecting the absence of prior quarter episodic client-related costs, lower professional services and marketing costs, partially offset by the absence of prior quarter notable items. Excluding notable items,(a) Other expenses declined 20% compared to 4Q24.

Total expenses were positively impacted by currency translation of $19 million and $11 million compared to 1Q24 and 4Q24, respectively.
(a) Results excluding notable items are non-GAAP measures. Please refer to the Addendum included with this news release for an explanation and reconciliation of non-GAAP measures.
(b) Other expenses in 1Q24 included a notable item related to the FDIC special assessment of $130M. Other expenses in 4Q24 included notable items related to a reduction in the special assessment from the FDIC of $31M, and charges related to operating model changes of $12M. Excluding this notable item, 1Q25 GAAP Other expenses of $276M was down 4% compared to 1Q24 adjusted Other expenses of $288M and down 20% compared to 4Q24 adjusted Other expenses of $345M.
7

                    
TAXES
The effective tax rate of 21.7% in 1Q25 decreased from 22.5% in 1Q24, primarily due to benefits attributable to stock-based compensation. Compared to 4Q24, the effective tax rate increased from 18.4% due to lower discrete benefits in the quarter.

CAPITAL AND LIQUIDITY
The following table presents preliminary estimates of regulatory capital and liquidity ratios for State Street Corporation.
(As of period end)1Q254Q241Q24
Basel III Standardized Approach:
Common equity tier 1 ratio (CET1)11.0 %10.9 %11.1 %
Tier 1 capital ratio13.8 13.2 13.2 
Total capital ratio15.3 14.8 14.9 
Basel III Advanced Approaches:
Common equity tier 1 ratio (CET1)12.5 12.0 11.7 
Tier 1 capital ratio15.7 14.5 13.9 
Total capital ratio17.3 16.1 15.6 
Tier 1 leverage ratio5.5 5.2 5.4 
Supplementary leverage ratio6.5 6.2 6.5 
Liquidity coverage ratio (LCR) (1)
106 %107 %107 %
LCR - State Street Bank and Trust (1)
139 %134 %130 %
(1) See the "In This News Release" section for further details on LCR and the calculation between State Street Corporation and State Street Bank and Trust.
Standardized capital ratios were binding for all periods included above.

CET1 (Standardized) ratio at quarter-end of 11.0% decreased 0.1% points compared to 1Q24, primarily driven by higher RWA and continued capital return, partially offset by capital generated from earnings and an improvement in AOCI. CET1 ratio increased 0.1% points compared to 4Q24, primarily due to capital generated from earnings, partially offset by higher RWA from Securities finance and increased loan balances as well as continued capital return.

Tier 1 leverage ratio at quarter-end of 5.5% increased 0.1% points compared to 1Q24 and increased 0.3% points compared to 4Q24, mainly driven by higher preferred equity and capital generated from earnings, partially offset by higher average balance sheet levels.

LCR for State Street Corporation was approximately 106%, down 1% point compared to 1Q24 and 4Q24. LCR for State Street Bank and Trust was approximately 139%, up 9% points compared to 1Q24 and up 5% points from 4Q24.


8

                    
INVESTOR CONFERENCE CALL AND QUARTERLY WEBSITE DISCLOSURE
State Street will webcast an investor conference call today, Thursday, April 17, 2025, at 11:00 a.m. ET, available at http://investors.statestreet.com. The conference call will also be available via telephone, at (805) 309-0220. The Participant Passcode is 5051317#.

Recorded replay of the conference call will be available on the website beginning approximately two hours after the call's completion. The replay will be available for approximately one month following the conference call.

This News Release, presentation materials referred to on the conference call, and additional financial information are available on State Street's website, at http://investors.statestreet.com under “Investor News & Events" and under the title “Events & Presentations".

State Street intends to publish updates to its public disclosure regarding regulatory capital, as required by the Basel III final rule, and the liquidity coverage and net stable funding ratios, on a quarterly basis on its website at http://investors.statestreet.com, under "Filings & Reports". Those updates will be published each quarter, during the period beginning after State Street's public announcement of its quarterly results of operations and ending on or prior to the due date under applicable bank regulatory requirements (i.e., ordinarily, ending no later than 60 days following year-end or 40 to 45 days following each other quarter-end, as applicable). For 1Q25, State Street expects to publish its updates during the period beginning today and ending on or about May 10, 2025 and on or about May 15, 2025 for the liquidity coverage ratio.

State Street Corporation (NYSE: STT) is one of the world's leading providers of financial services to institutional investors including investment servicing, investment management and investment research and trading. With $46.7 trillion in assets under custody and/or administration and $4.7 trillion* in assets under management as of March 31, 2025, State Street operates globally in more than 100 geographic markets and employs approximately 53,000 worldwide. For more information, visit State Street's website at www.statestreet.com.
* Assets under management as of March 31, 2025 includes approximately $106 billion of assets with respect to SPDR® products for which State Street Global Advisors Funds Distributors, LLC (SSGA FD) acts solely as the marketing agent. SSGA FD and State Street Global Advisors are affiliated.
9

                    
IN THIS NEWS RELEASE:
Stock purchases under our common stock repurchase programs may be made using various types of transactions, including open-market purchases, accelerated share repurchases or other transactions off the market, and may be made under Rule 10b5-1 trading programs. The timing and amount of any stock purchases and the type of transaction may not be consistent over the duration of the program, may vary from reporting period to reporting period and will depend on several factors, including our capital position and financial performance, investment opportunities, market conditions, regulatory considerations including the nature and timing of implementation of revisions to the Basel III framework, and the amount of common stock issued as part of employee compensation programs. The common share repurchase programs do not have specific price targets and may be suspended at any time. State Street’s common stock and other stock dividends, including the declaration, timing and amount, remain subject to consideration and approval by State Street’s Board of Directors at the relevant times.
Expenses and other measures are sometimes presented excluding notable items/effects of currency translation. This is a non-GAAP presentation. See the Addendum to this News Release for an explanation and reconciliations of our non-GAAP measures.
Servicing fee revenue wins/backlog (i.e., "to be installed") represents estimates of future annual revenue associated with new servicing engagements State Street determines to be won during the current reporting period, which may include anticipated servicing-related revenues associated with acquisitions or structured transactions, based upon factors assessed at the time the engagement is determined by State Street to be won, including asset volumes, number of transactions, accounts and holdings, terms and expected strategy. These and other relevant factors influencing projected servicing fees upon asset implementation/onboarding will change from time to time prior to, upon and following asset implementation/onboarding, among other reasons, due to varying market levels and factors and client and investor activity and preferences. Servicing fee/backlog estimates are not updated to reflect those changes, regardless of the magnitude or direction of, or reason for, any change. Servicing fee revenue wins in any period include estimated fees attributable to both (1) services to be provided for new estimated AUC/A reflected in new asset servicing wins for the period (with AUC/A to be onboarded in the future) and (2) additional services to be provided for AUC/A already included in our end-of period AUC/A (i.e., for which other services are currently provided); and the magnitude of one source of servicing fee revenue wins relative to the other (i.e., (1) relative to (2)) will vary from period to period. Therefore, for these and other reasons, comparisons of estimated servicing fee revenue wins to estimated new asset servicing AUC/A wins for any period will not produce reliable fee per AUC/A estimates. No servicing fees are recognized until the point in the future when we begin performing the associated services with respect to the relevant AUC/A. Both AUC/A and servicing fee revenue, when presented on a "backlog" or "to be installed" basis, are presented as of period-end. See also the succeeding two bullets in this “In This News Release” section in reference to considerations applicable to pending servicing engagements, which similarly apply to engagements for which reported servicing fee revenue wins/backlog are attributable.
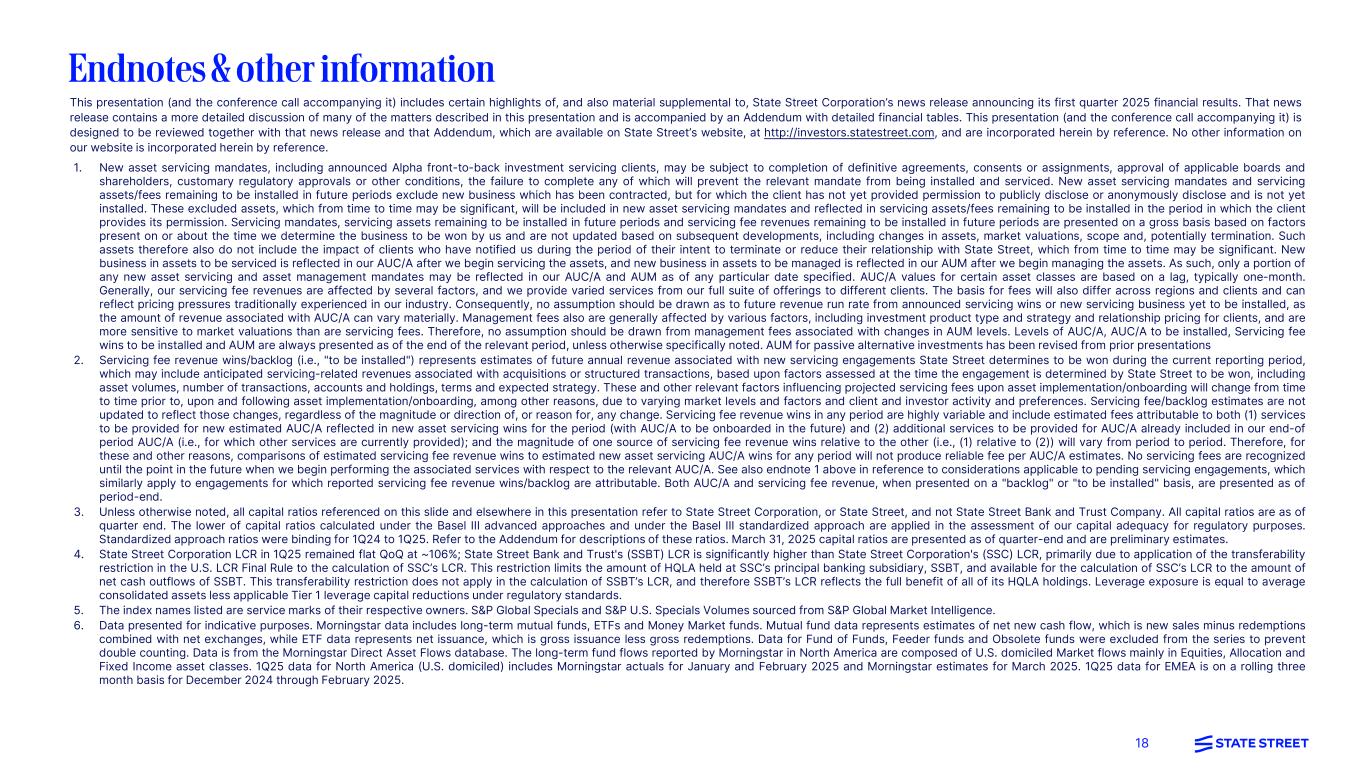
New asset servicing mandates, including announced Alpha front-to-back investment servicing clients, may be subject to completion of definitive agreements, consents or assignments, approval of applicable boards and shareholders, customary regulatory approvals or other conditions, the failure to complete any of which will prevent the relevant mandate from being installed and serviced. New asset servicing mandates and servicing assets/fees remaining to be installed in future periods exclude new business which has been contracted, but for which the client has not yet provided permission to publicly disclose or anonymously disclose and is not yet installed. These excluded assets, which from time to time may be significant, will be included in new asset servicing mandates and reflected in servicing assets/fees remaining to be installed in the period in which the client provides its permission. Servicing mandates, servicing assets remaining to be installed in future periods and servicing fee revenues remaining to be installed in future periods are presented on a gross basis based on factors present on or about the time we determine the business to be won by us and are not updated based on subsequent developments, including changes in assets, market valuations, scope and, potentially termination. Such assets therefore also do not include the impact of clients who have notified us during the period of their intent to terminate or reduce their relationship with State Street, which from time to time may be significant.
New business in assets to be serviced is reflected in our AUC/A after we begin servicing the assets, and new business in assets to be managed is reflected in our AUM after we begin managing the assets. As such, only a portion of any new asset servicing and asset management mandates may be reflected in our AUC/A and AUM as of any particular date specified. AUC/A values for certain asset classes are based on a lag, typically one-month. Generally, our servicing fee revenues are affected by several factors, and we provide varied services from our full suite of offerings to different clients. The basis for fees will also differ across regions and clients and can reflect pricing pressures traditionally experienced in our industry. Consequently, no assumption should be drawn as to future revenue run rate from announced servicing wins or new servicing business yet to be installed, as the amount of revenue associated with AUC/A can vary materially. Management fees also are generally affected by various factors, including investment product type and strategy and relationship pricing for clients, and are more sensitive to market valuations than are servicing fees. Therefore, no assumption should be drawn from management fees associated with changes in AUM levels. Levels of AUC/A, AUC/A to be installed, Servicing fee wins to be installed and AUM are always presented as of the end of the relevant period, unless otherwise specifically noted.
10

                    
Front office software and data ARR, an operating metric, is calculated by annualizing current quarter revenue for CRD and CRD for Private Markets and includes the annualized amount of most software-enabled revenue, including revenue generated from SaaS, maintenance and support revenue, FIX, and value-added services, which are all expected to be recognized ratably over the term of client contracts. ARR does not include software-enabled brokerage revenue, revenue from affiliates and licensing fees (excluding the portion allocated to maintenance and support) from On-premises software. Front office software and data ARR was $326 million, $375 million, and $373 million in 1Q24, 4Q24, and 1Q25, respectively.
Revenue and pre-tax income reflects the application of ASC 606. Revenue recognition under ASC 606 results in the acceleration of a significant portion of revenues for On-premises software agreements when a client goes live or renews their contract with us. The amount of revenue recognized in any given quarter will be driven in large part by client activity, including agreements that renew or are installed in that quarter.
Unless otherwise noted, all capital ratios referenced on this News Release and elsewhere in this presentation refer to State Street Corporation, or State Street, and not State Street Bank and Trust Company. The lower of capital ratios calculated under the Basel III advanced approaches and under the Basel III standardized approach are applied in the assessment of our capital adequacy for regulatory purposes. Standardized ratios were binding for 1Q25. Refer to the Addendum included with this News Release for additional information. All capital ratios are estimated. Liquidity Coverage Ratio (LCR) is a preliminary estimate based on a quarterly daily average.
State Street Bank and Trust's (SSBT) LCR is significantly higher than State Street Corporation's (SSC) LCR, primarily due to application of the transferability restriction in the U.S. LCR Final Rule to the calculation of SSC’s LCR. This restriction limits the amount of HQLA held at SSC’s principal banking subsidiary, SSBT and available for the calculation of SSC’s LCR to the amount of net cash outflows of SSBT. This transferability restriction does not apply in the calculation of SSBT’s LCR, and therefore SSBT’s LCR reflects the full benefit of all of its HQLA holdings.
All earnings per share amounts represent fully diluted earnings per common share.
Return on average common equity is determined by dividing annualized net income available to common shareholders by average common shareholders' equity for the period.
Quarter-over-quarter (QoQ) is a sequential quarter comparison. Year-over-year (YoY) is the current period compared to the same period a year ago.
Operating leverage is the rate of growth of total revenue less the rate of growth of total expenses, relative to the corresponding prior year period, as applicable.
Fee operating leverage is the rate of growth of total fee revenue less the rate of growth of total expenses, relative to the corresponding prior year period, as applicable.
"AUC/A" denotes Assets Under Custody and/or Administration; "AUC" denotes Assets Under Custody; "AUM" denotes Assets Under Management; "SPDR" denotes Standard and Poor's Depository Receipt; "ETF" denotes Exchange-traded fund; "nm" denotes not meaningful; "EOP" denotes end of period.
"CRD" denotes Charles River Development; "SaaS" denotes Software as a service; "FIX" denotes The Charles River Network's FIX Network Service (CRN); "On-premises" denotes On-premises revenue as recognized in the CRD business.
"RWA" denotes risk-weighted assets; "AOCI" denotes Accumulated other comprehensive income.
"FTE" denotes fully taxable-equivalent basis; NIM is presented on an FTE-basis, and is calculated by dividing FTE NII by average total interest-earning assets. Refer to the Addendum for reconciliations of our FTE-basis presentation.
Industry data is provided for illustrative purposes only. It is not intended to reflect State Street's or its clients' activity and is indicative of only selected segments of the entire industry.
Morningstar data includes long-term mutual funds, ETFs and Money Market funds. Mutual fund data represents estimates of net new cash flow, which is new sales minus redemptions combined with net exchanges, while ETF data represents net issuance, which is gross issuance less gross redemptions. Data for Fund of Funds, Feeder funds and Obsolete funds were excluded from the series to prevent double counting. Data is from the Morningstar Direct Asset Flows database.
The long-term fund flows reported by Morningstar in North America are composed of U.S. domiciled Market flows mainly in Equities, Allocation and Fixed Income asset classes. 1Q25 data for North America (U.S. domiciled) includes Morningstar actuals for January and February 2025 and Morningstar estimates for March 2025.
The long-term funds flows reported by Morningstar direct in EMEA are composed of the European market flows mainly in Equities, Allocation and Fixed Incomes asset classes. 1Q25 data for Europe is on a rolling three-month basis for December 2024 through February 2025, sourced by Morningstar.
11

                    
FORWARD LOOKING STATEMENTS
This News Release contains forward-looking statements within the meaning of United States securities laws, including statements about our goals and expectations regarding our strategy, growth and sales prospects, capital management, business, financial and capital condition, results of operations, the financial and market outlook and the business environment. Forward-looking statements are often, but not always, identified by such forward-looking terminology as “outlook,” “priority,” “will,” “expect,” “intend,” “aim,” “outcome,” “future,” “strategy,” “pipeline,” “trajectory,” “target,” “guidance,” “objective,” “plan,” “forecast,” “believe,” “anticipate,” “estimate,” “seek,” “may,” “trend,” and “goal,” or similar statements or variations of such terms. These statements are not guarantees of future performance, are inherently uncertain, are based on current assumptions that are difficult to predict and involve a number of risks and uncertainties. Therefore, actual outcomes and results may differ materially from what is expressed in those statements.
Important factors that may affect future results and outcomes include, but are not limited to:
We are subject to intense competition, which could negatively affect our profitability;
We are subject to significant pricing pressure and variability in our financial results and our AUC/A and AUM;
We could be adversely affected by political, geopolitical, economic and market conditions, including, for example, as a result of liquidity or capital deficiencies (actual or perceived) by other financial institutions and related market and government actions, changes in U.S. trade policy or the trade policy of other nations, the ongoing conflicts in Ukraine and in the Middle East, major political shifts domestically or internationally, actions taken by central banks in an attempt to address prevailing economic conditions, changes in monetary policy or periods of significant volatility in the markets for equity, fixed income and other assets classes globally or within specific markets;
Our development and completion of new products and services, including State Street Alpha® and those related to wealth servicing, alternative investment management or digital assets or incorporating artificial intelligence, may impose costs on us, involve dependencies on third parties and may expose us to increased risks;
Our business may be negatively affected by risks associated with strategic initiatives we are undertaking to enhance the effectiveness and efficiency of our operations and of our cybersecurity and technology infrastructure or by our failure to meet the related, resiliency or other expectations of our clients and regulators, or as a result of a cyber-attack or similar vulnerability in our or business partners' infrastructure;
Our risk management framework, models and processes may not be effective in identifying or mitigating risk and reducing the potential for related losses, and a failure or circumvention of our controls and procedures, or errors or delays in our operational and transaction processing, or those of third parties, could have an adverse effect on our business, financial condition, operating results and reputation;
Acquisitions, strategic alliances, joint ventures and divestitures, and the integration, retention and development of the benefits of these transactions, pose risks for our business;
Competition for qualified members of our workforce is intense, and we may not be able to attract and retain the highly skilled people we need to support our business;
We have significant global operations, and clients, that can be adversely impacted by disruptions in key economies, including local, regional and geopolitical developments affecting those economies;
Our investment securities portfolio, consolidated financial condition and consolidated results of operations could be adversely affected by changes in the financial markets, governmental action or monetary policy. For example, among other risks, changes in prevailing interest rates or market conditions have led, and were they to occur in the future could further lead, to decreases in our NII or to portfolio management decisions resulting in reductions in our capital or liquidity ratios;
Our business activities expose us to interest rate risk;
We assume significant credit risk of counterparties, who may also have substantial financial dependencies on other financial institutions, and these credit exposures and concentrations could expose us to financial loss;
Our fee revenue represents a significant portion of our revenue and is subject to decline based on, among other factors, market and currency declines, investment activities and preferences of our clients and their business mix;
If we are unable to effectively manage our capital and liquidity, our financial condition, capital ratios, results of operations and business prospects could be adversely affected;
We may need to raise additional capital or debt in the future, which may not be available to us or may only be available on unfavorable terms;
If we experience a downgrade in our credit ratings, or an actual or perceived reduction in our financial strength, our borrowing and capital costs, liquidity and reputation could be adversely affected;
Our business and capital-related activities, including common share repurchases, may be adversely affected by regulatory requirements and considerations, including capital, credit and liquidity;
We face extensive and changing government regulation and supervision in the U.S. and non-U.S. jurisdictions in which we operate, which may increase our costs and compliance risks and may affect our business activities and strategies;
Our businesses may be adversely affected by government enforcement and litigation;
Our businesses may be adversely affected by increased and conflicting political and regulatory scrutiny of asset management, stewardship and corporate sustainability or Environmental, Social and Governance (ESG) practices;
12

                    
Any misappropriation of the confidential information we possess could have an adverse impact on our business and could subject us to regulatory actions, litigation and other adverse effects;
Our calculations of risk exposures, total RWA and capital ratios depend on data inputs, formulae, models, correlations and assumptions that are subject to change, which could materially impact our risk exposures, our total RWA and our capital ratios from period to period;
Changes in accounting standards may adversely affect our consolidated results of operations and financial condition;
Changes in tax laws, rules or regulations, challenges to our tax positions and changes in the composition of our pre-tax earnings may increase our effective tax rate;
We could face liabilities for withholding and other non-income taxes, including in connection with our services to clients, as a result of tax authority examinations;
Our businesses may be negatively affected by adverse publicity or other reputational harm;
Shifting and maintaining operational activities to non-U.S. jurisdictions, changing our operating model, and outsourcing to, or insourcing from, third parties expose us to increased operational risk, geopolitical risk and reputational harm and may not result in expected cost savings or operational improvements;
Attacks or unauthorized access to our or our business partners' or clients' information technology systems or facilities, such as cyber-attacks or other disruptions to our or their operations, could result in significant costs, reputational damage and impacts on our business activities;
Long-term contracts and customizing service delivery for clients expose us to increased operational risk, pricing and performance risk;
We may not be able to protect our intellectual property or may infringe upon the rights of third parties;
The quantitative models we use to manage our business may contain errors that could adversely impact our business, financial condition, operating results and regulatory compliance, and lapses in disclosure controls and procedures or internal control over financial reporting could occur, any of which could result in material harm;
Our reputation and business prospects may be damaged if investors in the collective investment pools we sponsor or manage incur substantial losses in these investment pools or are restricted in redeeming their interests in these investment pools;
The impacts of global regulatory requirements and expectations, shifting client preferences, and disclosure requirements related to climate risks and sustainability standards could adversely affect us; and
We may incur losses or face negative impacts on our business as a result of unforeseen events, including terrorist attacks, geopolitical events, acute or chronic physical risk events, including natural disasters, pandemics, global conflicts, or a banking crisis, which may have a negative impact on our business and operations.
Other important factors that could cause actual results to differ materially from those indicated by any forward-looking statements are set forth in our 2024 Annual Report on Form 10-K and our subsequent SEC filings. We encourage investors to read these filings, particularly the sections on risk factors, for additional information with respect to any forward-looking statements and prior to making any investment decision. The forward-looking statements contained in this News Release should not be relied on as representing our expectations or beliefs as of any time subsequent to the time this News Release is first issued, and we do not undertake efforts to revise those forward-looking statements to reflect events after that time.
13

                                
Exhibit 99.2
STATE STREET CORPORATION
EARNINGS RELEASE ADDENDUM
March 31, 2025
Table of Contents
GAAP-Basis Financial Information:
4-Year Summary of Results
Consolidated Results of Operations
Consolidated Statement of Condition
Average Statement of Condition - Rates Earned and Paid - Fully Taxable-Equivalent Basis
Selected Average Balances by Currency - Rates Earned and Paid
Investment Portfolio Holdings by Asset Class8
Allowance for Credit Losses
10
Assets Under Custody and/or Administration
11
Assets Under Management
12
Line of Business Information
13
Capital:
Regulatory Capital
14
Reconciliations of Tangible Book Value per Share and Return on Tangible Common Equity
15
Non-GAAP Financial Information:
Reconciliations of Non-GAAP Financial Information
16
Reconciliation of Pre-tax Margin Excluding Notable Items
Reconciliations of Constant Currency FX Impacts
20
This financial information should be read in conjunction with State Street's news release dated April 17, 2025.


STATE STREET CORPORATION
EARNINGS RELEASE ADDENDUM
4-YEAR SUMMARY OF RESULTS
(Dollars in millions, except per share amounts, or where otherwise noted)2021202220232024
Year ended December 31:
Total fee revenue$10,012 $9,606 $9,480 $10,156 
Net interest income1,905 2,544 2,759 2,923 
Other income110 (2)(294)(79)
Total revenue12,027 12,148 11,945 13,000 
Provision for credit losses(33)20 46 75 
Total expenses8,889 8,801 9,583 9,530 
Income before income tax expense3,171 3,327 2,316 3,395 
Income tax expense478 553 372 708 
Net income2,693 2,774 1,944 2,687 
Net income available to common shareholders$2,572 $2,660 $1,821 $2,483 
Per common share:
Diluted earnings per common share$7.19 $7.19 $5.58 $8.21 
Average diluted common shares outstanding (in thousands)357,962 370,109 326,568 302,226 
Cash dividends declared per common share$2.18 $2.40 $2.64 $2.90 
Closing price per share of common stock (at year end)93.00 77.57 77.46 98.15 
Average balance sheet:
Investment securities$111,730 $111,929 $105,765 $104,784 
Total assets299,743 286,430 274,696 311,723 
Total deposits235,404 222,874 205,111 225,611 
Ratios and other metrics:
Return on average common equity10.7 %11.1 %8.2 %11.1 %
Return on average tangible common equity(1)
17.2 17.4 13.3 17.9 
Pre-tax margin26.4 27.4 19.4 26.1 
Pre-tax margin, excluding notable items(2)
27.6 28.4 26.4 27.6 
Net interest margin, fully taxable-equivalent basis0.74 1.03 1.20 1.10 
Common equity tier 1 ratio(3)(4)
14.3 13.6 11.6 10.9 
Tier 1 capital ratio(3)(4)
16.1 15.4 13.4 13.2 
Total capital ratio(3)(4)
17.5 16.8 15.2 14.8 
Tier 1 leverage ratio(3)
6.1 6.0 5.5 5.2 
Supplementary leverage ratio(3)
7.4 7.0 6.2 6.2 
Assets under custody and/or administration (in trillions)$43.68 $36.74 $41.81 $46.56 
Assets under management (in trillions)4.14 3.48 4.13 4.72 
(1) Return on average tangible common equity is calculated by dividing the net income available to common shareholders (GAAP-basis) for the relevant period by average tangible common equity (non-GAAP). Refer to the Reconciliations of Tangible Book Value per Common Share and Return on Tangible Common Equity page for details.
(2) Notable items include acquisition and restructuring costs, repositioning charges and legal and other notable items. Refer to Reconciliations of pre-tax margin excluding notable items for details.
(3) The capital ratios presented are calculated in conformity with the applicable regulatory guidance in effect as of each period end.
(4) The reportable ratios represent the lower of each of the risk-based capital ratios under both the Standardized Approach and the Advanced Approaches.
2    


STATE STREET CORPORATION
EARNINGS RELEASE ADDENDUM
CONSOLIDATED RESULTS OF OPERATIONS
Quarters% Change
(Dollars in millions, except per share amounts, or where otherwise noted)1Q242Q243Q244Q241Q251Q25
vs.
1Q24
1Q25
vs.
4Q24
Fee revenue:
Servicing fees$1,228 $1,239 $1,266 $1,283 $1,275 3.8 %(0.6)%
Management fees510 511 527 576 562 10.2 (2.4)
Foreign exchange trading services331 336 374 360 362 9.4 0.6 
Securities finance96 108 116 118 114 18.8 (3.4)
Front office software and data144 152 146 197 158 9.7 (19.8)
Lending related and other fees63 62 62 62 67 6.3 8.1 
Software and processing fees207 214 208 259 225 8.7 (13.1)
Other fee revenue50 48 125 66 32 (36.0)(51.5)
Total fee revenue2,422 2,456 2,616 2,662 2,570 6.1 (3.5)
Net interest income:
Interest income2,889 2,998 3,081 3,009 2,922 1.1 (2.9)
Interest expense2,173 2,263 2,358 2,260 2,208 1.6 (2.3)
Net interest income716 735 723 749 714 (0.3)(4.7)
Other income:
Gains (losses) related to investment securities, net— — (80) —                       nm
Total other income— — (80) —                       nm
Total revenue3,138 3,191 3,259 3,412 3,284 4.7 (3.8)
Provision for credit losses27 10 26 12 12 (55.6)— 
Expenses:
Compensation and employee benefits1,252 1,099 1,134 1,212 1,262 0.8 4.1 
Information systems and communications432 454 463 480 497 15.0 3.5 
Transaction processing services248 250 255 245 258 4.0 5.3 
Occupancy103 106 105 123 103 — (16.3)
Amortization of other intangible assets60 60 56 54 54 (10.0)— 
Other418 300 295 326 276 (34.0)(15.3)
Total expenses2,513 2,269 2,308 2,440 2,450 (2.5)0.4 
Income before income tax expense598 912 925 960 822 37.5 (14.4)
Income tax expense135 201 195 177 178 31.9 0.6 
Net income$463 $711 $730 $783 $644 39.1 (17.8)


3    

                                
STATE STREET CORPORATION
EARNINGS RELEASE ADDENDUM
CONSOLIDATED RESULTS OF OPERATIONS (Continued)
Quarters% Change
(Dollars in millions, except per share amounts, or where otherwise noted)1Q242Q243Q244Q241Q251Q25
vs.
1Q24
1Q25
vs.
4Q24
Adjustments to net income:
Dividends on preferred stock$(45)$(55)$(48)$(54)$(46)2.2 %14.8 %
Earnings allocated to participating securities— (1)— (1)(1)nm— 
Net income available to common shareholders$418 $655 $682 $728 $597 42.8 (18.0)
Per common share:
Basic earnings$1.38 $2.18 $2.29 2.50 $2.07 50.0 (17.2)
Diluted earnings1.37 2.15 2.26 2.46 2.04 48.9 (17.1)
Average common shares outstanding (in thousands):
Basic301,991300,564297,365291,686288,562(4.4)(1.1)
Diluted305,943304,765301,847296,420292,716(4.3)(1.2)
Cash dividends declared per common share $0.69$0.69$0.76$0.76$0.7610.1 — 
Closing price per share of common stock (as of quarter end) 77.3274.0088.4798.1589.5315.8 (8.8)
Book value per common share $72.85$74.50$78.22$77.95$80.1310.0 2.8 
Tangible book value per common share(1)
45.0646.1049.2249.1451.2313.7 4.3 
Balance sheet averages:
Investment securities$101,318 $105,098 $107,364 $105,322 $110,070 8.6 4.5 
Total assets298,570 306,298 314,640 327,181 337,291 13.0 3.1 
Total deposits218,892 220,881 225,482 237,066 243,036 11.0 2.5 

Ratios and other metrics:
Effective tax rate22.5 %22.1 %21.1 %18.4 %21.7 %(0.8)%pts3.3 %pts
Return on average common equity7.7 11.9 12.0 12.7 10.6 2.9 (2.1)
Return on average tangible common equity(2)
12.4 19.3 19.3 20.3 16.4 4.0 (3.9)

Pre-tax margin19.1 28.6 28.4 28.1 25.0 5.9 (3.1)
Pre-tax margin, excluding notable items(3)
23.2 28.6 28.4 29.8 25.0 1.8 (4.8)

Net interest margin, fully taxable-equivalent basis1.13 1.13 1.07 1.07 1.00 (0.1)(0.1)
Common equity tier 1 ratio(4)(5)
11.1 11.2 11.6 10.9 11.0 (0.1)0.1 
Tier 1 capital ratio(4)(5)
13.2 13.3 13.9 13.2 13.8 0.6 0.6 
Total capital ratio(4)(5)
14.9 15.0 15.6 14.8 15.3 0.4 0.5 
Tier 1 leverage ratio(4)
5.4 5.3 5.5 5.2 5.5 0.1 0.3 
Supplementary leverage ratio(4)
6.5 6.3 6.4 6.2 6.5 — 0.3 
Assets under custody and/or administration (in billions)$43,912 $44,312 $46,759 $46,557 $46,733 6.4 %0.4 %
Assets under management (in billions)4,299 4,369 4,732 4,715 4,665 8.5 (1.1)
Average securities on loan(6)
301,247 334,675 349,113 354,372 358,869 19.1 1.3 
(1) Tangible book value per common share is calculated by dividing the period end tangible common equity (non-GAAP) by the total common shares outstanding at period end. Refer to the Reconciliations of Tangible Book Value per Common Share and Return on Tangible Common Equity page for details.
(2) Return on average tangible common equity is calculated by dividing annualized net income available to common shareholders (GAAP-basis) for the relevant period by average tangible common equity (non-GAAP). Beginning in the third quarter of 2024, quarterly annualized net income available to common shareholders is utilized in the quarterly return on average tangible common equity calculation as compared to year-to-date annualized net income available to common shareholders utilized in prior quarters. Prior quarterly periods have been revised to conform to the current presentation. Refer to the Reconciliations of Tangible Book Value per Common Share and Return on Tangible Common Equity page for details.
(3) Notable items include acquisition and restructuring costs, repositioning charges and legal and other notable items. Refer to Reconciliations of non-GAAP Financial Information pages for details.
(4) The capital ratios presented are calculated in conformity with the applicable regulatory guidance in effect as of each period end. Capital ratios as of March 31, 2025 are estimates.
(5) The reportable ratios represent the lower of each of the risk-based capital ratios under both the Standardized Approach and the Advanced Approaches. Refer to Regulatory Capital for details on Standardized and Advanced Approaches ratios.
(6) End-of-period securities on loan were $339,940 million, $339,111 million, $378,713 million and $327,389 million at March 31, 2024, June 30, 2024, September 30, 2024 and December 31, 2024, respectively, and $376,269 million at March 31, 2025.
nm Denotes not meaningful
4    

                                
STATE STREET CORPORATION
EARNINGS RELEASE ADDENDUM
CONSOLIDATED STATEMENT OF CONDITION
As of% Change
(Dollars in millions, except per share amounts)March 31, 2024June 30, 2024September 30, 2024December 31, 2024March 31, 20251Q25
vs.
1Q24
1Q25
vs.
4Q24
Assets:
Cash and due from banks$3,413 $2,898 $4,067 $3,145 $4,658 36.5 %48.1 %
Interest-bearing deposits with banks, net125,486 99,876 105,121 112,957 119,464 (4.8)5.8 
Securities purchased under resale agreements7,489 6,340 8,334 6,679 7,971 6.4 19.3 
Trading account assets760 780 802 768 743 (2.2)(3.3)
Investment securities:
Investment securities available-for-sale, net48,640 56,755 56,853 58,895 67,444 38.7 14.5 
Investment securities held-to-maturity, net(1)
52,914 51,051 49,477 47,727 45,505 (14.0)(4.7)
Total investment securities101,554 107,806 106,330 106,622 112,949 11.2 5.9 
Loans38,635 39,376 41,961 43,200 44,685 15.7 3.4 
Allowance for credit losses on loans(2)
135 136 162 174 176 30.4 1.1 
Loans, net38,500 39,240 41,799 43,026 44,509 15.6 3.4 
Premises and equipment, net(3)
2,479 2,539 2,621 2,715 2,784 12.3 2.5 
Accrued interest and fees receivable4,014 4,066 4,160 4,034 4,280 6.6 6.1 
Goodwill7,582 7,751 7,833 7,691 7,763 2.4 0.9 
Other intangible assets1,258 1,209 1,166 1,089 1,046 (16.9)(3.9)
Other assets45,468 53,098 56,248 64,514 66,526 46.3 3.1 
Total assets$338,003 $325,603 $338,481 $353,240 $372,693 10.3 5.5 
Liabilities:
Deposits:
   Non-interest-bearing$37,367 $34,519 $31,448 $33,180 $32,265 (13.7)(2.8)
   Interest-bearing - U.S.148,485 140,983 145,527 166,483 168,362 13.4 1.1 
   Interest-bearing - Non-U.S.66,032 63,658 70,454 62,257 71,429 8.2 14.7 
Total deposits(4)
251,884 239,160 247,429 261,920 272,056 8.0 3.9 
Securities sold under repurchase agreements3,576 2,716 2,119 3,681 3,524 (1.5)(4.3)
Other short-term borrowings11,541 13,571 10,018 9,840 11,849 2.720.4 
Accrued expenses and other liabilities26,823 25,657 32,185 29,201 33,726 25.7 15.5 
Long-term debt19,746 19,737 20,902 23,272 24,846 25.8 6.8 
Total liabilities313,570 300,841 312,653 327,914 346,001 10.3 5.5 
Shareholders' equity:
Preferred stock, no par, 3,500,000 shares authorized:
Series G, 5,000 shares issued and outstanding493 493 493 493 493 — — 
Series H, 5,000 shares issued and outstanding494 494 — —  nm— 
Series I, 15,000 shares issued and outstanding1,481 1,481 1,481 1,481 1,481 — 
Series J, 8,500 shares issued and outstanding— — 842 842 842 nm— 
Series K, 7,500 shares issued and outstanding— — — — 743 nmnm
Common stock, $1 par, 750,000,000 shares authorized(5)(6)
504 504 504 504 504 — — 
Surplus10,724 10,721 10,723 10,722 10,693 (0.3)(0.3)
Retained earnings28,166 28,615 29,073 29,582 29,959 6.4 1.3 
Accumulated other comprehensive income (loss)(2,369)(2,314)(1,625)(2,100)(1,792)24.4 14.7 
Treasury stock, at cost(7)
(15,060)(15,232)(15,663)(16,198)(16,231)(7.8)(0.2)
Total shareholders' equity24,433 24,762 25,828 25,326 26,692 9.2 5.4 
Total liabilities and equity$338,003 $325,603 $338,481 $353,240 $372,693 10.3 5.5 
(1) Fair value of investment securities held-to-maturity
$46,823 $44,916 $44,925 $41,906 $40,424 
(2) Total allowance for credit losses including off-balance sheet commitments
146 145 171 183 186 
(3) Accumulated depreciation for premises and equipment
6,193 6,318 6,400 6,461 6,635 
(4) Average total deposits
218,892 220,881 225,482 237,066 243,036 
(5) Common stock shares issued
503,879,642 503,879,642 503,879,642 503,879,642 503,879,642 
(6) Total common shares outstanding
301,504,470 299,231,005 294,191,001 288,766,452 288,676,229 
(7) Treasury stock shares
202,375,172 204,648,637 209,688,641 215,113,190 215,203,413 
nm Denotes not meaningful
5    

                                
STATE STREET CORPORATION
EARNINGS RELEASE ADDENDUM
AVERAGE STATEMENT OF CONDITION - RATES EARNED AND PAID - FULLY TAXABLE-EQUIVALENT BASIS(1)
The following table presents average rates earned and paid, on a fully taxable-equivalent basis, on consolidated average interest-earning assets and average interest-bearing liabilities for the quarters indicated. Tax-equivalent adjustments were calculated using a federal income tax rate of 21%, adjusted for applicable state income taxes, net of related federal benefit.
Quarters% Change
1Q242Q243Q244Q241Q251Q25
vs.
1Q24
1Q25
vs.
4Q24
(Dollars in millions; fully-taxable equivalent basis)Average balanceAverage ratesAverage balanceAverage ratesAverage balanceAverage ratesAverage balanceAverage ratesAverage balanceAverage ratesAverage balanceAverage balance
Assets:
Interest-bearing deposits with banks, net$90,230 4.45 %$87,894 4.25 %$86,884 4.02 %$90,018 3.67 %$92,780 3.36 %2.8 %3.1 %
Securities purchased under resale agreements(2)
6,118 10.97 6,558 10.17 6,991 10.44 7,480 9.04 7,716 8.66 26.13.2 
Trading account assets767 — 779 — 788 — 795 — 756 0.15 (1.4)(4.9)
Investment securities:
Investment securities available-for-sale, net46,497 4.93 53,204 5.06 57,302 5.13 57,205 4.90 63,428 4.57 36.4 10.9 
Investment securities held-to-maturity, net54,821 2.14 51,894 2.14 50,062 2.12 48,117 2.11 46,642 2.07 (14.9)(3.1)
Total investment securities
101,318 3.42 105,098 3.62 107,364 3.73 105,322 3.63 110,070 3.51 8.6 4.5 
Loans(3)
37,747 5.82 38,703 5.85 39,782 5.79 42,377 5.48 43,730 5.17 15.9 3.2 
Other interest-earning assets18,153 6.92 22,708 6.92 27,697 6.35 32,534 5.76 34,464 5.49 89.9 5.9 
Total interest-earning assets254,333 4.57 261,740 4.61 269,506 4.55 278,526 4.30 289,516 4.09 13.8 3.9 
Cash and due from banks4,608 2,861 3,417 3,811 4,516 (2.0)18.5 
Other non-interest-earning assets39,629 41,697 41,717 44,844 43,259 9.2 (3.5)
Total assets$298,570 $306,298 $314,640 $327,181 $337,291 13.0 3.1 
Liabilities:
Interest-bearing deposits:
U.S.$129,846 4.22 %$132,162 4.15 %$135,440 4.16 %$146,040 3.79 %$154,462 3.54 %19.0 %5.8 %
Non-U.S.62,087 1.80 63,767 1.72 65,824 1.70 64,871 1.62 63,677 1.38 2.6 (1.8)
Total interest-bearing deposits(4)
191,933 3.44 195,929 3.36 201,264 3.35 210,911 3.12 218,139 2.91 13.7 3.4 
Securities sold under repurchase agreements3,122 5.06 3,404 5.07 2,193 4.98 3,937 4.67 4,530 4.54 45.1 15.1 
Other short-term borrowings8,314 4.85 13,073 5.15 13,639 5.16 10,656 4.96 11,848 4.64 42.511.2 
Long-term debt18,944 5.44 19,694 5.44 20,258 5.27 22,658 5.18 23,742 5.00 25.3 4.8 
Other interest-bearing liabilities4,430 12.29 4,753 12.57 5,238 14.41 4,873 10.93 5,471 11.76 23.5 12.3 
Total interest-bearing liabilities226,743 3.85 236,853 3.84 242,592 3.87 253,035 3.55 263,730 3.40 16.3 4.2 
Non-interest-bearing deposits(5)
26,959 24,952 24,218 26,155 24,897 (7.6)(4.8)
Other non-interest-bearing liabilities20,233 19,964 22,119 22,431 22,554 11.5 0.5 
Preferred shareholders' equity2,785 2,468 3,020 2,816 3,263 17.2 15.9 
Common shareholders' equity21,850 22,061 22,691 22,744 22,847 4.6 0.5 
Total liabilities and shareholders' equity$298,570 $306,298 $314,640 $327,181 $337,291 13.0 3.1 
Total deposits$218,892 $220,881 $225,482 $237,066 $243,036 11.0 2.5 
Excess of rate earned over rate paid0.72 %0.77 %0.68 %0.74 %0.70 %
Net interest margin1.13 %1.13 %1.07 %1.07 %1.00 %
Net interest income, fully taxable-equivalent basis$717 $736 $724 $749 $714 
Tax-equivalent adjustment(1)(1)(1)—  
Net interest income, GAAP-basis(4)
$716 $735 $723 $749 $714 
(1) Average rates earned and paid on interest-earning assets and interest-bearing liabilities include the impact of hedge activities associated with our asset and liability management activities where applicable.
(2) Reflects the impact of balance sheet netting under enforceable netting agreements of approximately $172 billion, $180 billion, $201 billion and $212 billion in the first, second, third and fourth quarters of 2024, respectively, and approximately $232 billion in the first quarter of 2025. Excluding the impact of netting, the average interest rates would be approximately 0.38%, 0.36%, 0.35% and 0.31% in the first, second, third and fourth quarters of 2024, respectively, and approximately 0.28% in the first quarter of 2025.
(3) Average loans are presented on a gross basis. Average loans net of expected credit losses were approximately $37,626 million, $38,573 million, $39,645 million and $42,214 million in the first, second, third and fourth quarters of 2024 and approximately $43,562 million in the first quarter of 2025.
(4) Average rates includes the impact of FX swap expense of approximately ($49) million, ($64) million, ($82) million and ($80) million in the first, second, third and fourth quarters of 2024, respectively, and approximately ($83) million in the first quarter of 2025. Average rates for total interest-bearing deposits excluding the impact of FX swap expense were approximately 3.54%, 3.49%, 3.52% and 3.27% in the first, second, third and fourth quarters of 2024, respectively, and approximately 3.07% in the first quarter of 2025.
(5) Average non-interest-bearing deposits are primarily composed of deposit balances denominated in U.S. dollars.
nm Denotes not meaningful
6    

                                
STATE STREET CORPORATION
EARNINGS RELEASE ADDENDUM
SELECTED AVERAGE BALANCES BY CURRENCY - RATES EARNED AND PAID(1)
1Q25
USDEURGBPOtherTotal
(Dollars in millions, except where otherwise noted)Average BalanceAverage RatesAverage BalanceAverage RatesAverage BalanceAverage RatesAverage BalanceAverage RatesAverage BalanceAverage Rates
Interest-bearing deposits with banks$42,137 4.52 %$25,385 2.71 %$5,709 4.68 %$19,549 1.30 %$92,780 3.36 %
Total investment securities91,215 3.47 7,339 2.51 5,487 4.52 6,029 4.42 110,070 3.51 
Loans35,740 5.27 6,085 4.54 1,349 6.00 556 3.70 43,730 5.17 
Total other interest-earning assets(2)
40,091 6.10 203 2.28 138 3.47 2,504 4.35 42,936 5.97 
Total interest-earning assets
$209,183 4.51 $39,012 2.96 $12,683 4.76 $28,638 2.28 $289,516 4.09 
Total interest-bearing deposits(3)(4)
$153,068 3.74 $33,657 1.63 $10,772 1.94 $20,642 (0.65)$218,139 2.91 
Central Bank Rate(5)
4.50 2.76 4.60 
4Q24
USDEURGBPOtherTotal
(Dollars in millions, except where otherwise noted)Average BalanceAverage RatesAverage BalanceAverage RatesAverage BalanceAverage RatesAverage BalanceAverage RatesAverage BalanceAverage Rates
Interest-bearing deposits with banks$40,424 4.73 %$26,655 3.15 %$6,409 4.80 %$16,530 1.44 %$90,018 3.67 %
Total investment securities86,269 3.57 7,763 2.64 4,813 4.72 6,477 4.69 105,322 3.63 
Loans34,448 5.49 6,126 5.17 1,272 6.59 531 5.37 42,377 5.48 
Total other interest-earning assets(2)
37,934 6.41 69 3.62 46 7.24 2,760 4.06 40,809 6.25 
Total interest-earning assets
$199,075 4.67 $40,613 3.36 $12,540 4.95 $26,298 2.59 $278,526 4.30 
Total interest-bearing deposits(3)(4)
$144,667 4.00 $33,589 1.94 $11,250 1.94 $21,405 (0.35)$210,911 3.12 
Central Bank Rate(5)
4.81 3.24 4.85 
1Q24
USDEURGBPOtherTotal
(Dollars in millions, except where otherwise noted)Average BalanceAverage RatesAverage BalanceAverage RatesAverage BalanceAverage RatesAverage BalanceAverage RatesAverage BalanceAverage Rates
Interest-bearing deposits with banks$44,424 5.54 %$25,275 3.83 %$6,941 5.11 %$13,590 1.70 %$90,230 4.45 %
Total investment securities81,305 3.45 8,901 2.55 4,161 3.87 6,951 3.94 101,318 3.42 
Loans30,599 5.86 5,450 5.45 1,105 7.02 593 4.52 37,747 5.82 
Total other interest-earning assets(2)
22,662 8.14 111 3.99 63 5.90 2,202 3.41 25,038 7.70 
Total interest-earning assets$178,990 4.98 $39,737 3.77 $12,270 4.87 $23,336 2.61 $254,333 4.57 
Total interest-bearing deposits(3)(4)
$127,920 4.45 $33,145 2.20 $11,411 1.78 $19,457 (0.15)$191,933 3.44 
Central Bank Rate(5)
5.50 4.00 5.25 
(1) Average rates earned and paid on interest-earning assets and interest-bearing liabilities include the impact of hedge activities associated with our asset and liability management activities where applicable.
(2) Average total other interest-earning assets include securities purchased under resale agreements, trading account assets and other interest-earning assets. Refer to average statement of condition - rates earned and paid - full taxable-equivalent basis for details.
(3) Average rates for interest-bearing deposit balances denominated in U.S. dollars include both client and wholesale deposits.
(4) FX swap costs for interest-bearing deposits are included in other currencies.
(5) Central Bank Rate represents the quarterly average Federal Funds Target Rate for USD, European Central Bank Deposit Facility Rate for EUR, and the Bank of England's Bank Rate for GBP.
7    

                                
STATE STREET CORPORATION
EARNINGS RELEASE ADDENDUM
INVESTMENT PORTFOLIO HOLDINGS BY ASSET CLASS
Quarters
1Q242Q243Q244Q241Q25
(Dollars in billions, except where otherwise noted)Average BalanceAverage RateAverage BalanceAverage RateAverage BalanceAverage RateAverage BalanceAverage RateAverage BalanceAverage Rate
Available-for-sale investment securities:
Government & agency securities$25.1 4.44 %$31.4 4.73 %$35.0 4.89 %$35.3 4.59 %$41.3 4.29 %
U.S. Treasury direct obligations9.6 5.11 15.6 5.27 18.7 5.12 20.4 4.95 26.5 4.48 
Non-U.S. sovereign, supranational and non-U.S. agency15.5 4.03 15.8 4.20 16.3 4.63 14.9 4.11 14.8 3.96 
Asset-backed securities6.9 5.61 7.2 5.68 7.6 5.53 8.1 5.41 7.8 5.09 
Mortgage-backed securities5.6 5.44 5.9 5.48 6.2 5.36 6.3 5.36 7.0 5.06 
CMBS5.6 5.81 5.4 5.75 5.1 5.81 4.5 5.55 4.3 4.86 
Other3.3 4.63 3.3 4.85 3.4 5.12 3.0 5.20 3.0 5.16 
Total available-for-sale portfolio$46.5 4.93 $53.2 5.06 $57.3 5.13 $57.2 4.90 $63.4 4.57 
1Q242Q243Q244Q241Q25
(Dollars in billions, except where otherwise noted)Average BalanceAverage RateAverage BalanceAverage RateAverage BalanceAverage RateAverage BalanceAverage RateAverage BalanceAverage Rate
Held-to-maturity investment securities:
Government & agency securities$12.7 0.96 %$10.8 0.88 %$10.1 0.82 %$9.3 0.76 %$8.6 0.75 %
U.S. Treasury direct obligations7.4 1.07 6.1 0.90 5.7 0.76 5.4 0.68 5.0 0.66 
Non-U.S. sovereign, supranational and non-U.S. agency5.3 0.80 4.7 0.84 4.4 0.90 3.9 0.88 3.6 0.89 
Asset-backed securities3.1 6.15 3.0 6.15 2.7 6.21 2.5 5.92 2.4 5.32 
Mortgage-backed securities33.8 2.25 32.9 2.23 32.1 2.22 31.1 2.24 30.5 2.22 
CMBS5.2 1.93 5.2 1.91 5.2 1.91 5.2 1.90 5.2 1.88 
Total held-for-maturity portfolio$54.8 2.14 $51.9 2.14 $50.1 2.12 $48.1 2.11 $46.7 2.07 
Total investment securities$101.3 3.42 $105.1 3.62 $107.4 3.73 $105.3 3.63 $110.1 3.51 


8    

                                
STATE STREET CORPORATION
EARNINGS RELEASE ADDENDUM
INVESTMENT PORTFOLIO HOLDINGS BY ASSET CLASS (continued)
Ratings
(Dollars in billions, or where otherwise noted)UST/AGYAAAAAABBB<BBBFair Value% Total
Net Unrealized Pre-tax MTM Gain/(Loss)
(In millions)(1)
Fixed Rate/
Floating Rate(2)
Available-for-sale investment securities:
Government & agency securities63 %21 %14 % %2 % %$43.4 64.4 %$28  95% / 5%
U.S. Treasury direct obligations100 — — — — — 27.4 63.1 (4)100% / 0%
Non-U.S. sovereign, supranational and non-U.S. agency— 57 38 — 16.0 36.9 32 86% / 14%
Asset-backed securities 95 5    8.0 11.9 13  0% / 100%
Mortgage-backed securities100      8.5 12.6 (62) 100% / 0%
CMBS100      4.3 6.4 (23) 5% / 95%
Other 19 21 50 10  3.2 4.7 39  62% / 38%
Total available-for-sale portfolio60 %26 %11 %2 %1 % %$67.4 100.0 %$(5) 77% / 23%
Fair Value$40.1 $17.4 $7.1 $1.6 $1.0 $0.2 
UST/AGYAAAAAABBB<BBBAmortized Cost% Total
Net Unrealized Pre-tax MTM Gain/(Loss)
(In millions)(1)
Fixed Rate/
Floating Rate(2)
Held-to-maturity investment securities:
Government & agency securities57 %28 %15 % % % %$7.7 16.9 %$(87) 100% / 0%
U.S. Treasury direct obligations100 — — — — — 4.4 57.1 (34)100% / 0%
Non-U.S. sovereign, supranational and non-U.S. agency— 65 35 — — — 3.3 42.9 (53)100% / 0%
Asset-backed securities 25 69 4  2 2.5 5.5 (22) 5% / 95%
Mortgage-backed securities100      30.2 66.4 (4,402) 100% / 0%
CMBS100      5.1 11.2 (570) 97% / 3%
Total held-for-maturity portfolio88 %6 %6 % % % %$45.5 100.0 %$(5,081) 94% / 6%
Amortized Cost$39.8 $2.8 $2.8 $0.1 $ $ 
Total Investment Securities(3)
$112.9 84%/16%
(1) At March 31, 2025, the after-tax unrealized MTM gain/(loss) includes after-tax unrealized loss on securities available-for-sale of $4 million, after-tax unrealized loss on securities held-to-maturity of $3,704 million and after-tax unrealized loss primarily related to securities previously transferred from available-for-sale to held-to-maturity of $337 million.
(2) At March 31, 2025, fixed-to-floating rate securities, which excludes the impact of hedges, had a book value of approximately $21 million or 0.02% of the total portfolio.
(3) State Street has a highly liquid balance sheet, with more than half of total assets deemed HQLA. Based upon fair value as of March 31, 2025, approximately 86% of our investment portfolio was held in HQLA.
9    

                                
STATE STREET CORPORATION
EARNINGS RELEASE ADDENDUM
ALLOWANCE FOR CREDIT LOSSES
Quarters% Change
(Dollars in millions)1Q242Q243Q244Q241Q251Q25
vs.
1Q24
1Q25
vs.
4Q24
Allowance for credit losses:
Beginning balance$150 $146 $145 $171 $183 22.0 %7.0 %
Provision for credit losses (funded commitments)
31 12 26 12 11 (64.5)(8.3)
Provision for credit losses (unfunded commitments)
(4)(2)— — 1              nm               nm
Total provision27 10 26 12 12 (55.6)— 
Charge-offs(31)(11)— — (9)(71.0)               nm
Ending balance(1)
$146 $145 $171 $183 $186 27.4 1.6 
Allowance for credit losses:
Loans$135 $136 $162 $174 $176 30.4 1.1 
Investment securities—  nm— 
Unfunded (off-balance sheet) commitments10 9 (10.0)— 
All other— — — — 1 nmnm
Ending balance(1)
$146 $145 $171 $183 $186 27.4 1.6 
(1) The allowance for credit losses on unfunded commitments is included within Other liabilities in the Consolidated Statement of Condition.
nm Denotes not meaningful

10    

                                
STATE STREET CORPORATION
EARNINGS RELEASE ADDENDUM
ASSETS UNDER CUSTODY AND/OR ADMINISTRATION
Quarters% Change
(Dollars in billions)1Q242Q243Q244Q241Q251Q25
vs.
1Q24
1Q25
vs.
4Q24
Assets Under Custody and/or Administration(1)
By Product Classification:
Collective funds, including ETFs$14,694 $14,573 $15,253 $15,266 $15,430 5.0 %1.1 %
Mutual funds11,552 11,645 12,223 12,301 12,143 5.1 (1.3)
Pension products8,800 8,916 9,339 9,386 9,377 6.6 (0.1)
Insurance and other products8,866 9,178 9,944 9,604 9,783 10.3 1.9 
Total Assets Under Custody and/or Administration$43,912 $44,312 $46,759 $46,557 $46,733 6.4 0.4 
By Asset Class:
Equities$25,909 $26,291 $27,715 $27,535 $27,508 6.2 (0.1)
Fixed-Income11,368 11,303 12,027 11,933 11,900 4.7 (0.3)
Short-term and other investments(2)
6,635 6,718 7,017 7,089 7,325 10.4 3.3 
Total Assets Under Custody and/or Administration$43,912 $44,312 $46,759 $46,557 $46,733 6.4 0.4 
By Geographic Location(3):
Americas$31,610 $31,763 $33,460 $33,284 $33,340 5.5 0.2 
Europe/Middle East/Africa9,207 9,406 10,214 10,179 10,303 11.9 1.2 
Asia/Pacific3,095 3,143 3,085 3,094 3,090 (0.2)(0.1)
Total Assets Under Custody and/or Administration$43,912 $44,312 $46,759 $46,557 $46,733 6.4 0.4 
Assets Under Custody(4)
By Product Classification:
Collective funds, including ETFs$12,717 $12,570 $13,122 $13,162 $13,335 4.9 1.3 
Mutual funds9,309 9,360 9,806 9,887 9,725 4.5 (1.6)
Pension products7,235 7,333 7,693 7,737 7,731 6.9 (0.1)
Insurance and other products2,898 2,898 3,046 3,019 3,046 5.1 0.9 
Total Assets Under Custody$32,159 $32,161 $33,667 $33,805 $33,837 5.2 0.1 
By Geographic Location(3):
Americas$24,241 $24,211 $25,386 $25,491 $25,407 4.8 (0.3)
Europe/Middle East/Africa5,380 5,361 5,715 5,740 5,861 8.9 2.1 
Asia-Pacific2,538 2,589 2,566 2,574 2,569 1.2 (0.2)
Total Assets Under Custody$32,159 $32,161 $33,667 $33,805 $33,837 5.2 0.1 
(1) Consistent with past practice, AUC/A values for certain asset classes are based on a lag, typically one-month.
(2) Short-term and other investments includes derivatives, cash and cash equivalents and other instruments.
(3) Geographic mix is generally based on the domicile of the entity servicing the funds and is not necessarily representative of the underlying asset mix.
(4) Assets under custody are a component of assets under custody and/or administration presented above.
11    

                                
STATE STREET CORPORATION
EARNINGS RELEASE ADDENDUM
ASSETS UNDER MANAGEMENT
Quarters% Change
(Dollars in billions)1Q242Q243Q244Q241Q251Q25
vs.
1Q24
1Q25
vs.
4Q24
Assets Under Management
By Asset Class and Investment Approach:
Equity:
Active$51 $51 $54 $52 $52 2.0 %— %
Passive2,661 2,708 2,923 2,955 2,849 7.1 (3.6)
Total Equity2,712 2,759 2,977 3,007 2,901 7.0 (3.5)
Fixed-Income:
Active27 28 30 31 30 11.1 (3.2)
Passive551 555 593 585 603 9.4 3.1 
Total Fixed-Income578 583 623 616 633 9.5 2.8 
Cash(1)
481 483 543 518 518 7.7 — 
Multi-Asset-Class Solutions:
Active23 22 23 23 24 4.3 4.3 
Passive312 327 352 351 366 17.3 4.3 
Total Multi-Asset-Class Solutions335 349 375 374 390 16.4 4.3 
Alternative Investments(2):
Active11 10 10 10 10 (9.1)— 
Passive(3)
182 185 204 190 213 17.0 12.1 
Total Alternative Investments193 195 214 200 223 15.5 11.5 
Total Assets Under Management$4,299 $4,369 $4,732 $4,715 $4,665 8.5 (1.1)
By Geographic Location(4):
Americas$3,154 $3,195 $3,448 $3,468 $3,431 8.8 (1.1)
Europe/Middle East/Africa635 665 728 713 690 8.7 (3.2)
Asia-Pacific510 509 556 534 544 6.7 1.9 
Total Assets Under Management$4,299 $4,369 $4,732 $4,715 $4,665 8.5 (1.1)
(1) Includes both floating- and constant-net-asset-value portfolios held in commingled structures or separate accounts.
(2) Includes real estate investment trusts, currency and commodities, including SPDR® Gold Shares and SPDR® Gold MiniSharesSM Trust. We are not the investment manager for the SPDR® Gold Shares and SPDR®Gold MiniSharesSM Trust, but act as the marketing agent.
(3) AUM for passive alternative investments has been revised from prior presentations.
(4) Geographic mix is based on client location or fund management location.
Exchange-Traded Funds(1)
By Asset Class:
Alternative Investments(2)
$74 $77 $91 $90 $114 54.1 %26.7 %
Equity1,131 1,157 1,253 1,310 1,252 10.7 (4.4)
Fixed-Income155 159 171 177 187 20.6 5.6 
Multi-Asset1 — — 
Total Exchange-Traded Funds$1,361 $1,394 $1,516 $1,578 $1,554 14.2 (1.5)
(1) Exchange-traded funds are a component of assets under management presented above.
(2) Includes real estate investment trusts, currency and commodities, including SPDR® Gold Shares and SPDR® Gold MiniSharesSM Trust. We are not the investment manager for the SPDR® Gold Shares and SPDR®Gold MiniSharesSM Trust, but act as the marketing agent.
12    

                                
STATE STREET CORPORATION
EARNINGS RELEASE ADDENDUM
LINE OF BUSINESS INFORMATION
Three Months Ended,
Investment Servicing% ChangeInvestment Management% Change
Other(1)
% ChangeTotal% Change
(Dollars in millions)1Q244Q241Q251Q25
 vs.
1Q24
1Q25
 vs.
4Q24
1Q244Q241Q251Q25
 vs.
1Q24
1Q25
 vs.
4Q24
1Q244Q241Q251Q25
 vs.
1Q24
1Q25
 vs.
4Q24
1Q244Q241Q251Q25
 vs.
1Q24
1Q25
 vs.
4Q24
Servicing fees$1,228$1,283$1,2753.8 %(0.6)%$$$— %— %$$$— %— %$1,228$1,283$1,2753.8 %(0.6)%
Management fees— — 51057656210.2 (2.4)— — 51057656210.2 (2.4)
Foreign exchange trading services3083243379.4 4.0 2336258.7 (30.6)— 3313603629.4 0.6 
Securities finance9011310820.0 (4.4)656— 20.0 — — 9611811418.8 (3.4)
Software and processing fees2072592258.7 (13.1)— — — — 2072592258.7 (13.1)
Other fee revenue436134(20.9)(44.3)75(2)nmnm— 506632(36.0)(51.5)
Total fee revenue1,8762,0401,9795.5 (3.0)5466225918.2 (5.0)— 2,4222,6622,5706.1 (3.5)
Net interest income711743709(0.3)(4.6)565— (16.7)— — 716749714(0.3)(4.7)
Total other income1— nm— — — 1— nm
Total revenue2,5872,7842,6883.9 (3.4)5516285968.2 (5.1)— — 3,1383,4123,2844.7 (3.8)
Provision for credit losses271212(55.6)— — — — — 271212(55.6)— 
Total expenses1,9631,9522,0192.9 3.4 4204304312.6 0.2 13058nmnm2,5132,4402,450(2.5)0.4 
Income before income tax expense$597$820$65710.1 (19.9)$131$198$16526.0 (16.7)$(130)$(58)$nmnm$598$960$82237.5(14.4)
Pre-tax margin23.1 %29.5 %24.5 %1.4 %(5.0)%pts23.8 %31.5 %27.7 %3.9 %(3.8)%pts19.1 %28.1 %25.0 %5.9 %(3.1)%pts
(1) Represents amounts that are not allocated to a specific line of business, including repositioning charges, employee costs, acquisition costs, revenue-related recoveries and certain legal accruals.
nm Denotes not meaningful
13    

                                
STATE STREET CORPORATION
EARNINGS RELEASE ADDENDUM
REGULATORY CAPITAL
Basel III Advanced Approaches(1)
Basel III Standardized Approach(2)
(Dollars in millions)1Q242Q243Q244Q241Q251Q242Q243Q244Q241Q25
Ratios and Supporting Calculations:
Common equity tier 1 capital$13,167 $13,346 $14,071 $13,799 $14,362$13,167 $13,346 $14,071 $13,799 $14,362
Total risk-weighted assets112,161 111,224 112,795 114,602 114,478118,613 119,244 121,137 126,281 130,208
Common equity tier 1 risk-based capital ratio11.7 %12.0 %12.5 %12.0 %12.5 %11.1 %11.2 %11.6 %10.9 %11.0 %
Tier 1 capital$15,635 $15,814 $16,887 $16,615 $17,921 $15,635 $15,814 $16,887 $16,615 $17,921 
Tier 1 risk-based capital ratio13.9 %14.2 %15.0 %14.5 %15.7 %13.2 %13.3 %13.9 %13.2 %13.8 %
Total capital$17,504 $17,682 $18,754 $18,476 $19,799 $17,650 $17,827 $18,925 $18,659 $19,978 
Total risk-based capital ratio15.6 %15.9 %16.6 %16.1 %17.3 %14.9 %15.0 %15.6 %14.8 %15.3 %
Tier 1 capital$15,635 $15,814 $16,887 $16,615 $17,921 $15,635 $15,814 $16,887 $16,615 $17,921 
Leverage exposure(3)
289,772 297,350 305,699 318,470 328,520 289,772 297,350 305,699 318,470 328,520 
Tier 1 leverage ratio5.4 %5.3 %5.5 %5.2 %5.5 %5.4 %5.3 %5.5 %5.2 %5.5 %
On-and off-balance sheet leverage exposure$249,668 $261,135 $273,809 $278,344 $286,035 $249,668 $261,135 $273,809 $278,344 $286,035 
Less: regulatory deductions(8,798)(8,948)(8,941)(8,711)(8,771)(8,798)(8,948)(8,941)(8,711)(8,771)
Total leverage exposure for SLR240,870 252,187 264,868 269,633 277,264 240,870 252,187 264,868 269,633 277,264 
Supplementary leverage ratio(4)
6.5 %6.3 %6.4 %6.2 %6.5 %6.5 %6.3 %6.4 %6.2 %6.5 %
(1) CET1, tier 1 capital, total capital and tier 1 leverage ratios for each period above were calculated in conformity with the advanced approaches provisions of the Basel III final rule. Capital ratios as of March 31, 2025 are estimates.
(2) CET1, tier 1 capital, total capital and tier 1 leverage ratios for each period above were calculated in conformity with the standardized approach provisions of the Basel III final rule. Capital ratios as of March 31, 2025 are estimates.
(3) Leverage exposure is equal to average consolidated total assets less applicable Tier 1 capital deductions.
(4) We are subject to a minimum Supplementary Leverage Ratio or SLR of 3%, and as a U.S. G-SIB, we must maintain a 2% SLR buffer in order to avoid any limitations on distributions to shareholders and discretionary bonus payments to certain executives.
14    

                                
STATE STREET CORPORATION
EARNINGS RELEASE ADDENDUM
RECONCILIATIONS OF TANGIBLE BOOK VALUE PER SHARE AND RETURN ON TANGIBLE COMMON EQUITY
The tangible book value per common share (TBVPS) and return on average tangible common equity (ROTCE) are ratios that management believes provides context about State Street's use of equity. The TBVPS ratio is calculated by dividing the period end tangible common equity by total common shares outstanding. The ROTCE ratio is calculated by dividing annualized net income available to common shareholders for the relevant period by average tangible common equity. Period end and average tangible common equity reflected in the TBVPS and ROTCE ratios, are both non-GAAP measures which reduce period end and average common shareholders' equity, by period end and average goodwill and other intangible assets, net of related deferred taxes. Since there is no authoritative requirement to calculate the TBVPS and ROTCE ratios, our TBVPS and ROTCE ratios are not necessarily comparable to similar measures disclosed or used by other companies in the financial services industry. TBVPS and ROTCE are non-GAAP financial measures and should be considered in addition to, not as a substitute for or superior to, financial measures determined in accordance with GAAP or other applicable requirements. Reconciliations with respect to the calculation of these ratios are presented below.
Quarters
(Dollars in millions, except per share amounts, or where otherwise noted)1Q242Q243Q244Q241Q25
Tangible common equity - period end:
Total shareholders' equity$24,433 $24,762 $25,828 $25,326 $26,692 
Less:
Preferred stock2,468 2,468 2,816 2,816 3,559 
Common shareholders' equity21,965 22,294 23,012 22,510 23,133 
Less:
Goodwill7,582 7,751 7,833 7,691 7,763 
Other intangible assets1,258 1,209 1,166 1,089 1,046 
Plus related deferred tax liabilities460 461 467 459 465 
Tangible common shareholders' equity - Non-GAAP$13,585 $13,795 $14,480 $14,189 $14,789 
Total common shares outstanding - period end (in thousands)301,504 299,231 294,191 288,766 288,676 
Book value per common share$72.85 $74.50 $78.22 $77.95 $80.13 
Tangible book value per common share - Non-GAAP45.06 46.10 49.22 49.14 51.23 
Quarters
(Dollars in millions, except where otherwise noted)1Q242Q243Q244Q241Q25
Tangible common equity - average:
Average common shareholders' equity$21,850 $22,061 $22,691 $22,744 $22,847 
Less:
Average goodwill7,589 7,750 7,798 7,745 7,717 
Average other intangible assets1,287 1,230 1,187 1,121 1,065 
Plus related deferred tax liabilities460 460 464 463 462 
Average tangible common shareholders' equity - Non-GAAP$13,434 $13,541 $14,170 $14,341 $14,527 
Net income available to common shareholders$418 $655 $682 $728 $597 
Net income available to common shareholders, excluding notable items(1)
517 655 682 769 597 
Return on average tangible common equity - Non-GAAP(2)
12.4 %19.3 %19.3 %20.3 %16.4 %
Return on average tangible common equity, excluding notable items - Non-GAAP(2)(3)
15.4 19.3 19.3 21.4 16.4 
(1) Refer to Reconciliations of non-GAAP Financial Information pages for a reconciliation of net income available to common shareholders, excluding notable items.
(2) Beginning in the third quarter of 2024, quarterly annualized net income available to common shareholders is utilized in the quarterly ROTCE calculation as compared to year-to-date annualized net income available to common shareholders utilized in prior quarters. Prior quarterly periods have been revised to conform to the current presentation.
(3) Return on average tangible common equity, excluding notable items - non-GAAP is calculated by dividing annualized net income available to common shareholders, excluding notable items for the relevant period by average tangible common equity.
15    

STATE STREET CORPORATION
EARNINGS RELEASE ADDENDUM
RECONCILIATIONS OF NON-GAAP FINANCIAL INFORMATION
In addition to presenting State Street's financial results in conformity with U.S. generally accepted accounting principles, or GAAP, management also presents certain financial information on a basis that excludes or adjusts one or more items from GAAP. This latter basis is a non-GAAP presentation. In general, our non-GAAP financial results adjust selected GAAP-basis financial results to exclude the impact of revenue and expenses outside of State Street’s normal course of business or other notable items, such as acquisition and restructuring charges, repositioning charges, gains/losses on sales, as well as, for selected comparisons, seasonal items. For example, we sometimes present expenses on a basis we may refer to as "expenses ex-notable items", which exclude notable items and, to provide additional perspective on both prior year quarter and sequential quarter comparisons, also exclude seasonal items. Management believes that this presentation of financial information facilitates an investor's further understanding and analysis of State Street's financial performance and trends with respect to State Street’s business operations from period-to-period, including providing additional insight into our underlying margin and profitability. In addition, Management may also provide additional non-GAAP measures. For example, we present capital ratios, calculated under regulatory standards scheduled to be effective in the future or other standards, that management uses in evaluating State Street’s business and activities and believes may similarly be useful to investors. Additionally, we may present revenue and expense measures on a constant currency basis to identify the significance of changes in foreign currency exchange rates (which often are variable) in period-to-period comparisons. This presentation represents the effects of applying prior period weighted average foreign currency exchange rates to current period results.
Non-GAAP financial measures should be considered in addition to, not as a substitute for or superior to, financial measures determined in conformity with GAAP.
Quarters% Change
(Dollars in millions)1Q242Q243Q244Q241Q251Q25
vs.
1Q24
1Q25
vs.
4Q24
Fee Revenue:
Total fee revenue, GAAP-basis$2,422 $2,456 $2,616 $2,662 $2,570 6.1 %(3.5)%
Less: Notable items:
Foreign exchange trading services(1)
— — (15)—  
Other fee revenue(2)
— — (66)—  
Total fee revenue, excluding notable items$2,422 $2,456 $2,535 $2,662 $2,570 6.1 (3.5)
Total Revenue:
Total revenue, GAAP-basis$3,138 $3,191 $3,259 $3,412 $3,284 4.7 %(3.8)%
Less: Notable items:
Foreign exchange trading services(1)
— — (15)—  
Other fee revenue(2)
— — (66)—  
(Gains) losses related to investment securities, net(3)
— — 81 —  — 
Total revenue, excluding notable items$3,138 $3,191 $3,259 $3,412 $3,284 4.7 (3.8)
Expenses:
Total expenses, GAAP-basis$2,513 $2,269 $2,308 $2,440 $2,450 (2.5)%0.4 %
Less: Notable items:
Deferred compensation expense acceleration(4)
— — — (79) nm
Repositioning charges(5)
— — —  nm
FDIC special assessment(6)
(130)— — 31  nmnm
Other notable items(7)
— — — (12) — nm
Total expenses, excluding notable items
2,383 2,269 2,308 2,382 2,450 2.8 2.9 
Seasonal expenses(162)— — — (155)(4.3)nm
Total expenses, excluding notable items and seasonal expenses$2,221 $2,269 $2,308 $2,382 $2,295 3.3 (3.7)
Fee Operating Leverage, GAAP-Basis:
Total fee revenue, GAAP-basis$2,422 

$2,456 

$2,616 

$2,662 $2,570 6.11 %(3.46)%
Total expenses, GAAP-basis2,513 2,269 2,308 

2,440 2,450 (2.51)0.41 
Fee operating leverage, GAAP-basis(8)
8.62 %pts(3.87)%pts
Fee Operating Leverage, excluding notable items:
Total fee revenue, excluding notable items (as reconciled above)$2,422 $2,456 $2,535 $2,662 $2,570 6.11 %(3.46)%
Total expenses, excluding notable items (as reconciled above)2,383 2,269 2,308 2,382 2,450 2.81 2.85 
Fee operating leverage, excluding notable items(9)
3.30 %pts(6.31)%pts
Operating Leverage, GAAP-Basis:
Total revenue, GAAP-basis$3,138 $3,191 $3,259 

$3,412 $3,284 4.65 %(3.75)%
Total expenses, GAAP-basis2,513 2,269 2,308 

2,440 2,450 (2.51)0.41 
Operating leverage, GAAP-basis(10)
7.16 %pts(4.16)%pts
Operating Leverage, excluding notable items:
Total revenue, excluding notable items (as reconciled above)$3,138 $3,191 $3,259 $3,412 $3,284 4.65 %(3.75)%
Total expenses, excluding notable items (as reconciled above)2,383 2,269 2,308 

2,382 2,450 2.81 2.85 
Operating leverage, excluding notable items(11)
1.84 %pts(6.60)%pts
16    

                                
STATE STREET CORPORATION
EARNINGS RELEASE ADDENDUM
RECONCILIATIONS OF NON-GAAP FINANCIAL INFORMATION (Continued)
Quarters% Change
(Dollars in millions, except earnings per share, or where otherwise noted)1Q242Q243Q244Q241Q251Q25
vs.
1Q24
1Q25
vs.
4Q24
Income before income tax expense:
Income before income tax expense GAAP-basis$598$912$925$960$82237.5(14.4)%
Less: Notable items
Foreign exchange trading services(1)
(15)
Other fee revenue(2)
(66)
(Gains) losses related to investment securities, net(3)
81
Deferred compensation expense acceleration(4)
79
Repositioning charges(5)
(2)
FDIC special assessment(6)
130(31)
Other notable items(7)
12
Income before income tax expense, excluding notable items$728$912$925$1,018$82212.9 (19.3)
Net Income:
Net Income GAAP-basis$463$711$730$783$64439.1(17.8)%
Less: Notable items


Foreign exchange trading services(1)
(15)
Other fee revenue(2)
(66)
(Gains) losses related to investment securities, net(3)
81
Deferred compensation expense acceleration(4)
79
Repositioning charges(5)
(2)
FDIC special assessment(6)
130(31)
Other notable items(7)
12
Tax impact of notable items(31)(17)
Net Income, excluding notable items$562$711$730

$824$64414.6 (21.8)
Net Income Available to Common Shareholders:
Net Income Available to Common Shareholders, GAAP-basis$418

$655

$682$728$59742.8(18.0)%
Less: Notable items


Foreign exchange trading services(1)
(15)
Other fee revenue(2)
(66)
(Gains) losses related to investment securities, net(3)
81
Deferred compensation expense acceleration(4)
79
Repositioning charges(5)
(2)
FDIC special assessment(6)
130(31)
Other notable items(7)
12
Tax impact of notable items(31)(17)
Net Income Available to Common Shareholders, excluding notable items$517$655$682

$769$59715.5 (22.4)
Diluted Earnings per Share:
Diluted earnings per share, GAAP-basis$1.37

$2.15

$2.26

$2.46$2.0448.9(17.1)%
Less: Notable items


Foreign exchange trading services(1)
(0.04)
Other fee revenue(2)
(0.16)
(Gains) losses related to investment securities, net(3)
0.20
Deferred compensation expense acceleration(4)
0.20
Repositioning charges(5)
(0.01)
FDIC special assessment(6)
0.32(0.08)
Other notable items(7)
0.03
Diluted earnings per share, excluding notable items$1.69

$2.15

$2.26

$2.60$2.0420.7 %(21.5)%
17    

                                
STATE STREET CORPORATION
EARNINGS RELEASE ADDENDUM
RECONCILIATIONS OF NON-GAAP FINANCIAL INFORMATION (Continued)
Quarters% Change
(Dollars in millions, except earnings per share, or where otherwise noted)1Q242Q243Q244Q241Q251Q25
vs.
1Q24
1Q25
vs.
4Q24
Pre-tax Margin:
Pre-tax margin, GAAP-basis(12)
19.1 %

28.6 %

28.4 %

28.1 %25.0 %5.9 %pts(3.1)%pts
Less: Notable items


Foreign exchange trading services(1)
— — (0.3)—  
Other fee revenue(2)
— — (1.1)—  
(Gains) losses related to investment securities, net(3)
— — 1.4 —  
Deferred compensation expense acceleration(4)
— — — 2.3  
Repositioning charges(5)
— — — (0.1) 
FDIC special assessment(6)
4.1 — — (0.9) 
Other notable items(7)
— — — 0.4  
Pre-tax margin, excluding notable items23.2 %

28.6 %

28.4 %

29.8 %25.0 %1.8 (4.8)
Return on Average Common Equity:
Return on average common equity, GAAP-basis7.7 %11.9 %12.0 %12.7 %10.6 %2.9 %pts(2.1)%pts
Less: Notable items
Foreign exchange trading services(1)
— — (0.3)—  
Other fee revenue(2)
— — (1.1)—  
(Gains) losses related to investment securities, net(3)
— — 1.4 —  
Deferred compensation expense acceleration(4)
— — — 1.5  
Repositioning charges(5)
— — — —  
FDIC special assessment(6)
2.4 — — (0.6) 
Other notable items(7)
— — — 0.2  
Tax impact of notable items(0.6)— — (0.3) 
Return on average common equity, excluding notable items9.5 %11.9 %12.0 %13.5 %10.6 %1.1 (2.9)
Effective Tax Rate:
Effective tax rate, GAAP-basis22.5 %22.1 %21.1 %18.4 %21.7 %(0.8)%pts3.3 %pts
Less: Notable items
Foreign exchange trading services(1)
— — — —  
Other fee revenue(2)
— — (0.1)—  
(Gains) losses related to investment securities, net(3)
— — 0.1 —  
Deferred compensation expense acceleration(4)
— — — 0.7  
Repositioning charges(5)
— — — —  
FDIC special assessment(6)
0.3 — — (0.3) 
Other notable items(7)
— — — 0.1  
Effective tax rate, excluding notable items22.8 %22.1 %21.1 %18.9 %21.7 %(1.1)2.8 
(1) Amount in 2024 consists of a $15 million revenue-related recovery associated with the proceeds from a 2018 foreign exchange benchmark litigation resolution, which is reflected in foreign exchange trading services revenue.
(2) Amount in 2024 consists of a $66 million gain on sale of equity investment, which is reflected in other fee revenue.
(3) Amount in 2024 consists of a $81 million loss on the sale of investment securities, which is related to the repositioning of the investment portfolio reflected in other income.
(4) Deferred compensation expense acceleration of $79 million in 2024 related to prior period incentive compensation awards to align State Street's deferred pay mix with peers.
(5) Amount in 2024 includes a $15 million release related to compensation and employee benefits, partially offset by $13 million related to occupancy costs associated with real estate footprint.
(6) Amounts in 2024 related to the FDIC special assessment and subsequent true-up reflected in other expenses.
(7) The amount in 2024 includes a $12 million charge reflected in other expenses, associated with operating model changes.
(8) Calculated as the period-over-period change in total fee revenue less the period-over-period change in total expenses.
(9) Calculated as the period-over-period change in total fee revenue, excluding notable items less the period-over-period change in total expenses, excluding notable items.
(10) Calculated as the period-over-period change in total revenue less the period-over-period change in total expenses.
(11) Calculated as the period-over-period change in total revenue, excluding notable items less the period-over-period change in total expenses, excluding notable items.
(12) GAAP- basis pre-tax margin for the first quarter of 2025 of 25.0% included seasonal expenses of $155 million as shown on page 16. Excluding seasonable expenses, pre-tax margin for the first quarter of 2025 was 29.8%.
18    

                                
STATE STREET CORPORATION
EARNINGS RELEASE ADDENDUM
RECONCILIATION OF PRE-TAX MARGIN EXCLUDING NOTABLE ITEMS
(Dollars in millions)2021202220232024
Total revenue:
Total revenue, GAAP-basis$12,027 $12,148 $11,945 $13,000 
Less: Fees revenue— (23)— (15)
Less: Total other income(111)— — (66)
Add: (Gains) losses related to investment securities, net— — 294 81 
Total revenue, excluding notable items11,916 12,125 12,239 13,000 
Provision for credit losses(33)20 46 75 
Total expenses:
Total expenses, GAAP-basis8,889 8,801 9,583 9,530 
Less: Notable expense items:
Acquisition and restructuring costs(65)(65)15 — 
Deferred compensation expense acceleration(147)— — (79)
Legal and other(18)— — — 
Repositioning (charges) / release(70)(203)
FDIC special assessment— — (387)(99)
Other notable items— — (45)(12)
Total expenses, excluding notable items8,662 8,666 8,963 9,342 
Income before income tax expense, excluding notable items$3,287 $3,439 $3,230 $3,583 
Income before income tax expense, GAAP-basis$3,171 $3,327 $2,316 $3,395 
Pre-tax margin, excluding notable items27.6 %28.4 %26.4 %27.6 %
Pre-tax margin, GAAP-basis26.4 27.4 19.4 26.1 


19    


STATE STREET CORPORATION
EARNINGS RELEASE ADDENDUM
RECONCILIATIONS OF CONSTANT CURRENCY FX IMPACTS
GAAP-Basis QTD ComparisonReportedCurrency Translation ImpactExcluding Currency Impact% Change Constant Currency
(Dollars in millions)1Q244Q241Q251Q25 vs. 1Q241Q25 vs. 4Q241Q25 vs. 1Q241Q25 vs. 4Q241Q25 vs. 1Q241Q25 vs. 4Q24
GAAP-Basis Results:
Fee revenue:
Servicing fees$1,228 $1,283 $1,275 $(11)$(6)$1,286 $1,281 4.7 %(0.2)%
Management fees510 576 562 (2)(1)564 563 10.6 (2.3)
Foreign exchange trading services331 360 362 — — 362 362 9.4 0.6 
Securities finance96 118 114 — — 114 114 18.8 (3.4)
Front office software and data144 197 158 (1)(1)159 159 10.4 (19.3)
Lending related and other fees63 62 67 — — 67 67 6.3 8.1 
Software and processing fees207 259 225 (1)(1)226 226 9.2 (12.7)
Other fee revenue50 66 32 — — 32 32 (36.0)(51.5)
Total fee revenue2,422 2,662 2,570 (14)(8)2,584 2,578 6.7 (3.2)
Net interest income716 749 714 (12)(5)726 719 1.4 (4.0)
Total other income—  — — — — nmnm
Total revenue$3,138 $3,412 $3,284 $(26)$(13)$3,310 $3,297 5.5 (3.4)
Expenses:
Compensation and employee benefits$1,252 $1,212 $1,262 $(13)$(7)$1,275 $1,269 1.8 4.7 
Information systems and communications432 480 497 (1)(1)498 498 15.3 3.8 
Transaction processing services248 245 258 (2)(1)260 259 4.8 5.7 
Occupancy103 123 103 (1)(1)104 104 1.0 (15.4)
Amortization of other intangible assets60 54 54 (1)— 55 54 (8.3)— 
Other418 326 276 (1)(1)277 277 (33.7)(15.0)
Total expenses$2,513 $2,440 $2,450 $(19)$(11)$2,469 $2,461 (1.8)0.9 
Total expenses, excluding notable items - Non-GAAP$2,383 $2,382 $2,450 $(19)$(11)$2,469 $2,461 3.6 3.3 
Total non-compensation expenses, excluding notable items - Non-GAAP(1)
1,131 1,234 1,188 (6)(4)1,194 1,192 5.6 (3.4)
(1) Total non-compensation expenses, excluding notable items is comprised of total expenses, excluding notable items - Non-GAAP, less compensation and employee benefits, excluding notable items. Compensation and benefits, excluding notable items were $1,262 million in the first quarter of 2025, $1,148 million in the fourth quarter of 2024 and $1,252 million in the first quarter of 2024.
nm Denotes not meaningful
20    
1 NYSE: STT April 17, 2025 Exhibit 99.3


2A These are non-GAAP presentations; refer to the Appendix for a reconciliation of ex-notable items and further explanations of non-GAAP measures. Refer to the Appendix included with this presentation for endnotes 1 to 22. All comparisons are to corresponding prior year period unless otherwise noted Financial performance • Total revenue of $3.3B, up 5% – Fee revenue up 6%, reflecting broad-based strength across the franchise – NII flat, as higher investment security yields and continued loan growth were offset by lower average short-end rates and a deposit mix shift • Total expenses of $2.5B, down (3)%, primarily reflecting the absence of a 1Q24 notable item – Up 3% ex-notables reflecting higher business investments, partially offset by savingsA – Disciplined execution with ability to manage expenses during periods of uncertainty, while continuing to focus on long-term strategic priorities • Positive operating leverage of 7.2%pts; 1.8%pts ex-notables; Positive fee operating leverage of 8.6%pts; 3.3%pts ex-notablesA • Pre-tax margin of 25%; ROE of 11%; ROTCE of 16%A • EPS of $2.04, up 49%; up 21% ex-notablesA Business momentum Investment Servicing • AUC/A of $46.7T at quarter-end; AUC/A wins of $182B and AUC/A yet to be installed of $3.1T1 • New servicing fee revenue wins of $55M primarily related to back office wins2 • Reported 1 new State Street Alpha® mandate1 • Prior investments provide ability to proactively address client needs with innovative solutions and seamless execution Investment Management • AUM of $4.7T at quarter-end • Continued ETF momentum and market share gains in U.S. Low Cost, as well as inflows across Fixed Income, Gold and EMEA products1 • Expanded global capabilities and investor access to innovative products, including alternatives, through key partnerships and product launches Balance sheet and capital • Strong and liquid balance sheet with capital and liquidity ratios significantly above regulatory minimums • CET1 ratio of 11.0% and State Street Bank and Trust LCR of 139% at quarter end3,4 • Returned $320M to common shareholders, including $100M of share repurchases and $220M of declared dividends


3 A These are non-GAAP presentations; refer to the Appendix for further explanations of non-GAAP measures. B Other fee revenue primarily consists of income from equity method investments, certain tax- advantaged investments and market-related adjustments. Other fee revenue declined $(18)M YoY and $(34)M QoQ in 1Q25 largely due to lower FX and market-related adjustments. C 4Q24 deferred compensation expense acceleration of $79M related to prior period incentive compensation awards to align State Street’s deferred pay mix with peers. The acceleration allows for an increase in the immediate versus the deferred portion of incentive compensation in future periods. D 1Q24 FDIC special assessment of $130M reflected in Other expenses. 4Q24 FDIC special assessment release of $31M related to a reduction in the special assessment from the FDIC reflected in Other expenses. E 4Q24 repositioning charges and other notable items (net) of $10M represents a $13M charge reflected in Occupancy and a $12M charge reflected in Other expenses, partially offset by a $15M release reflected in Compensation and employee benefits associated with operating model changes. Financial results Notable items (GAAP; $M, except EPS data, or where otherwise noted) 1Q24 4Q24 1Q25 4Q24 1Q24 Revenue: Servicing fees 1,228 1,283 $1,275 (1)% 4% Management fees 510 576 562 (2) 10 Foreign exchange trading services 331 360 362 1 9 Securities finance 96 118 114 (3) 19 Software and processing fees 207 259 225 (13) 9 Other fee revenueB 50 66 32 (52) (36) Total fee revenue 2,422 2,662 2,570 (3) 6 Net interest income 716 749 714 (5) (0) Total revenue $3,138 $3,412 $3,284 (4)% 5% Provision for credit losses 27 12 12 - (56)% Total expenses $2,513 $2,440 $2,450 0% (3)% Net income before income taxes $598 $960 $822 (14)% 37% Net income $463 $783 $644 (18)% 39% Diluted earnings per share $1.37 $2.46 $2.04 (17)% 49% Return on average common equity 7.7% 12.7% 10.6% (2.1)%pts 2.9%pts Return on average tangible common equityA 12.4% 20.3% 16.4% (3.9)%pts 4.0%pts Pre-tax margin 19.1% 28.1% 25.0% (3.1)%pts 5.9%pts Tax rate 22.5% 18.4% 21.7% 3.3%pts (0.8)%pts Ex-notable items, non-GAAP A: Total revenue $3,138 $3,412 $3,284 (4)% 5% Total expenses $2,383 $2,382 $2,450 3% 3% Diluted earnings per share $1.69 $2.60 $2.04 (22)% 21% Return on average common equity 9.5% 13.5% 10.6% (2.9)%pts 1.1%pts Return on average tangible common equity 15.4% 21.4% 16.4% (5.0)%pts 1.0%pts Pre-tax margin 23.2% 29.8% 25.0% (4.8)%pts 1.8%pts Tax rate 22.8% 18.9% 21.7% 2.8%pts (1.1)%pts Quarters %∆ ($M, except EPS data) 1Q24 4Q24 1Q25 Deferred compensation expense accelerationC - ($79) - FDIC special assessmentD ($130) 31 - Repositioning charges and other notable items (net)E - (10) - Total notable items (pre-tax) ($130) ($58) - Income tax impact from notable items (31) (17) - EPS impact ($0.32) ($0.14) - QuartersA


4 AUC/A ($T, as of period-end) 1 Market indices5 • Up 6% YoY mainly due to higher quarter- end market levels and flows • Flat QoQ primarily driven by lower quarter-end equity market levels, which were largely offset by the impact of currency translation and flows • Up 9% YoY mainly driven by higher quarter-end market levels and net inflows • Down (1)% QoQ largely reflecting lower quarter-end market levels, partially offset by the impact of currency translation AUM ($B, as of period-end) 1 -1% Flat $43.9 $46.6 $46.7 1Q24 4Q24 1Q25 1Q24 4Q24 1Q25 $4,299 $4,715 $4,665 +6% +9% A Line items may not sum to total due to rounding. Refer to the Appendix included with this presentation for endnotes 1 to 22. Select industry flows6 4Q24 1Q24 Equity & Bond Indices: EOP (5)% 7% Daily Avg (0) 18 EOP 6 2 Daily Avg 3 6 EOP 2 6 Daily Avg (1) 9 EOP (2) 6 Daily Avg 0 14 EOP 3 3 Daily Avg (1) 2 Volatility Indices: VIX Daily Avg 7% 35% JPM G7 FX Daily Avg (2) 18 JPM EM FX Daily Avg (8) 21 Specials Volumes: S&P Global Industry Specials Avg Volume (1)% 13% S&P U.S. Industry Specials Avg Volume (9) 11 (% change) 1Q25 vs S&P 500 MSCI EAFE MSCI EM MSCI ACWI Bloomberg Global Agg 1Q24 4Q24 1Q25 Long Term Funds $(3) $(129) $(149) Money Market 31 376 79 ETF 191 427 291 North America Total 219 673 221 EMEA Total 83 265 260 Total flowsA ($B)


5 Servicing fees of $1,275M up 4% YoY and down (1)% QoQ • Up 4% YoY as higher average market levels, net new business and client activity were partially offset by normal pricing headwinds • Down (1)% QoQ mainly due to lower client activity/adjustments, including asset mix shift, and normal pricing headwinds, partially offset by net new business Servicing fees ($M) 1Q25 performance 1Q24 2Q24 3Q24 4Q24 1Q25 $1,228 $1,239 $1,266 $1,283 $1,275 Business momentum • New 1Q25 servicing fee revenue wins of $55M, with the majority driven by back office wins2 – Trailing 12-month servicing fee revenue wins of $365M • $182B in new servicing AUC/A wins in 1Q25, with the majority from Asset Managers1 – Reported ~$86B of new servicing AUC/A wins driven by Alpha • Reported 1 new Alpha mandate in 1Q251 +4% -1% Refer to the Appendix included with this presentation for endnotes 1 to 22. 1Q24 2Q24 3Q24 4Q24 1Q25 AUC/A ($B) AUC/A wins1 $474 $291 $466 $1,098 $182 AUC/A to be installed1 2,576 2,390 2,354 2,988 3,056 Servicing ($M) Servicing fee rev. wins2 $67 $72 $84 $154 $55 Servicing fee rev. to be installed2 291 276 288 346 356 Alpha # of mandate wins1 2 1 2 2 1 Live mandates to-date 21 23 23 25 25 Performance indicators


6 • Strategic partnerships: – Strategic investment and partnership with Ethic Inc. to deliver customized investment solutions at scale to SSGA’s clients – Launched innovative products leveraging our partnerships with both Apollo Global Management and Bridgewater Associates – Announced a partnership with the Saudi Arabia Public Investment Fund, spearheading the launch of the first Saudi Arabia fixed-income UCITS ETF in Europe • ETF: Continued momentum and market share gains in U.S. Low Cost, as well as inflows across Fixed Income, Gold and EMEA products • Institutional: Continued strength in U.S. Defined Contribution • Cash: Launched three new U.S. money market funds with a new share class aimed at the retail market via institutional platforms Management fees ($M) Performance indicators ($B) 1 Management fees of $562M up 10% YoY and down (2)% QoQ • Up 10% YoY driven by higher average market levels and net inflows from prior periods • Down (2)% QoQ driven by the absence of performance fees and day count 1Q24 2Q24 3Q24 4Q24 1Q25 $510 $511 $527 $576 $562 Business momentum1 Refer to the Appendix included with this presentation for endnotes 1 to 22. -2% +10% 1Q25 performance 1Q24 2Q24 3Q24 4Q24 1Q25 AUM $4,299 $4,369 $4,732 $4,715 $4,665 Net flows (QoQ) (14) (6) 100 64 (13)


7 1Q24 2Q24 3Q24 4Q24 1Q25 $331 $336 $359 $360 $362 • FX trading services of $362M – Up 9% YoY primarily due to higher volumes – Up 1% QoQ supported by higher volumes, partially offset by lower spreads A These are non-GAAP presentations; refer to the Appendix for a reconciliation of ex-notable items and further explanations of non-GAAP measures. Refer to the Appendix included with this presentation for endnotes 1 to 22. +9% +1% 1Q24 2Q24 3Q24 4Q24 1Q25 $96 $108 $116 $118 $114 • Securities finance of $114M – Up 19% YoY largely driven by higher client lending balances, partially offset by lower Agency spreads – Down (3)% QoQ including lower Agency spreads FX trading services (Ex-notable items, non-GAAP, $M)A Securities finance ($M) 1Q25 performance (Ex-notable items, non-GAAP, $M)A +19% -3%


8 1Q24 2Q24 3Q24 4Q24 1Q25 New bookings9 $10 $3 $10 $48 $9 ARR10 326 345 356 375 373 Uninstalled revenue backlog11 102 99 100 134 137 Software and processing fees($M) Performance indicators ($M) Refer to the Appendix included with this presentation for endnotes 1 to 22. • 1Q25 ARR increased ~15% YoY driven by 25+ SaaS client conversions and implementations • Professional services and Software-enabled revenue combined increased 7% YoY • Uninstalled revenue backlog reached the highest level on record, driven by record bookings in 4Q24 Business momentum 1Q25 performance Software and processing fees of $225M up 9% YoY and down (13)% QoQ • Front office software and data of $158M7 – Up 10% YoY primarily driven by continued growth in Software- enabled revenue – Down (20)% QoQ mainly due to lower On-premises renewals • Lending related and other fees of $67M Professional services Software- enabled (incl. SaaS)9 On-premises8 -13% +9% Lending related and other fees Front office software and data7 63 62 62 62 67 94 101 106 109 110 31 29 29 44 2415 18 42 20 1Q24 2Q24 8 3Q24 4Q24 1Q25 $207 $214 $208 $259 $225 33% (23)% YoY % 17% 6% $144 $152 $146 $197 $158 Front office software & data7 YoY +10% QoQ -20%


9 NII and NIM ($M) 12 Average balance sheet highlights ($B) A A Line items are rounded. Refer to the Appendix included with this presentation for endnotes 1 to 22. 1Q24 2Q24 3Q24 4Q24 1Q25 Total assets $299 $306 $315 $327 $337 Cash13 95 91 90 94 97 Investment portfolio 101 105 107 105 110 Duration (EOP) 14 2.7 2.5 2.5 2.2 2.1 Loans15 38 39 40 42 44 Total deposits $219 $221 $225 $237 $243 NIM12 (FTE, %) 1.13% 1.13% 1.07% 1.07% 1.00% 1Q24 2Q24 3Q24 4Q24 1Q25 $716 $735 $723 $749 $714 • Assets increased 13% YoY and 3% QoQ primarily due to an increase in total deposits and balance sheet funding • Deposits increased 11% YoY and 3% QoQ mainly driven by growth in interest-bearing balances, partially offset by a reduction in non- interest-bearing deposits • Loan growth of 16% YoY and 3% QoQ driven by continued client demand NII of $714M flat YoY and down (5)% QoQ • Flat YoY as higher investment security yields and continued loan growth were offset by lower average short-end rates and a deposit mix shift • Down (5)% QoQ largely due to a deposit mix shift, lower average short-end rates and day count Average assets and liabilities1Q25 performance -5% Flat


10 Expenses of $2,450M up 3% YoY and up 3% QoQA – Expenses up 3% YoY and down (4)% QoQ ex. seasonal expensesB • Compensation and employee benefits of $1,262M16 – Up 1% YoY mainly due to higher performance-based incentive compensation and salaries, partially offset by savings associated with operating model transformation – Up 10% QoQ primarily driven by seasonal expenses, partially offset by lower performance-based incentive compensationB • Information systems and communications of $497M – Up 15% YoY and 4% QoQ largely related to higher technology and infrastructure investments • Transaction processing services of $258M – Up 4% YoY mainly due to higher market data and sub-custody costs – Up 5% QoQ primarily reflecting higher sub-custody costs from the absence of vendor credits • Occupancy of $103M16 • Other of $330M16,17 – Down (5)% YoY primarily due to the timing of foundation funding – Down (17)% QoQ mainly reflecting the absence of prior quarter episodic client-related costs and lower professional services 348 399 330 248 245 258 432 480 497 1,252 1,148 1,262 1Q24 4Q24 1Q25 $2,383 $2,382 $2,450 A These are non-GAAP presentations; refer to the Appendix for a reconciliation of ex-notable items and further explanations of non-GAAP measures. B 1Q24 and 1Q25 include $162M and $155M, respectively, of seasonal deferred incentive compensation expenses. Refer to the Appendix included with this presentation for endnotes 1 to 22. Comp. & benefits Info. sys. Tran. processing Other17 Occupancy 103110103 +3% Expenses (Ex-notable items, non-GAAP, $M)A 1Q25 performance (Ex-notable items, non-GAAP, $M)A +3% 1% 15% 4% YoY % 0% (5)% Including the headcount associated with the operations JV in India consolidated in 2Q24 18 $2,513 $2,440 $2,450 45,871 53,265 52,626 52,711 GAAP Expenses Headcount YoY -3% QoQ flat YoY +15% QoQ flat Pro-forma18 YoY -1%


11 • 1Q25 standardized CET1 ratio at quarter-end of 11.0% increased 0.1%pts QoQ primarily due to capital generated from earnings, partially offset by higher RWA from Securities finance and increased loan balances as well as continued capital return • 1Q25 Tier 1 leverage ratio of 5.5% increased 0.3%pts QoQ mainly driven by higher preferred equity and capital generated from earnings, partially offset by higher average balance sheet levels • Returned $320M to common shareholders, including $100M of share repurchases and $220M of declared dividends Capital and liquidity highlights Capital ($B unless otherwise noted, capital metrics as of period-end) 1Q24 4Q24 1Q25 Standardized CET1 CET1 capital $13.2 $13.8 $14.4 Risk weighted assets 119 126 130 Tier 1 leverage Tier 1 capital 15.6 16.6 17.9 Leverage exposure20 290 318 329 OCI impact of investment portfolio on regulatory capital21 0.2 (0.1) 0.1 Tier 1 leverage 5.4% 5.3% 5.5% 5.2% 5.5% 1Q24 2Q24 3Q24 4Q24 1Q25 Minimum ratio4.0% STT Target Range5.25-5.75% Refer to the Appendix included with this presentation for endnotes 1 to 22. CET1 (Standardized) 11.1% 11.2% 11.6% 10.9% 11.0% 4.5% 2.5% 1Q24 2Q24 3Q24 4Q24 1Q25 SCB19 Minimum ratio8 .0 % 10-11% G-SIB surcharge1.0% Ratios (%, as of period-end) 3 State Street Bank and Trust LCR 4 Requirement Requirement Requirement 130% 134% 129% 134% 139% 100% 1Q24 2Q24 3Q24 4Q24 1Q25 STT Target Range


12


13 1Q25 line of business performance 14 Preferred stock dividends 15 Reconciliation of notable items 16 Reconciliation of constant currency impacts 17 Endnotes & other information 18 Forward-looking statements 20 Non-GAAP measures 21 Definitions 22


14 1,979 State StreetAInvestment Servicing Total revenue 711 709 1,876 1,979 1Q24 1Q25 $2,587M $2,688M Pre-tax income Fee revenue NII Pre-tax margin 23.1% 24.5% +1.4%pts YoY % ∆ +5% Flat +4% +10% Investment Management Total revenueB 1Q24 1Q25 $551M $596M Pre-tax income Pre-tax margin 23.8% 27.7% +3.9%pts 1Q24 1Q25 $131M $165M YoY % ∆ +8% +26% Total revenue ex-notable itemsC 716 714 2,422 2,570 1Q24 1Q25 $3,138M $3,284M Pre-tax income ex-notable itemsC Fee revenue NII Pre-tax margin 23.2% 25.0% +1.8%pts YoY % ∆ +6% Flat +5% +13% A State Street includes line of business results from Investment Servicing, Investment Management, and Other. Refer to the Addendum for further line of business information. B 1Q24 and 1Q25 Total revenue includes $5M in NII. C These are non-GAAP presentations; refer to the Appendix for a reconciliation of ex-notable items and further explanations of non-GAAP measures. 1Q24 1Q25 $597M $657M 1Q24 1Q25 $728M $822M


15Refer to the Appendix included with this presentation for endnotes 1 to 22. FY2025 FY2026 1Q $46 $58 2Q 63 58 3Q 58 58 4Q 58 58 Total $226 $233


16 A Calculated as the period-over-period change in total fee revenue less the period-over-period change in total expenses. B Calculated as the period-over-period change in total fee revenue, excluding notable items less the period-over-period change in total expenses, excluding notable items. C Calculated as the period-over-period change in total revenue less the period-over-period change in total expenses. D Calculated as the period-over- period change in total revenue, excluding notable items less the period-over-period change in total expenses, excluding notable items. Quarterly reconciliation (Dollars in millions, unless noted otherwise) 1Q24 2Q24 3Q24 4Q24 1Q25 1Q25 vs. 1Q24 1Q25 vs. 4Q24 Total fee revenue, GAAP-basis 2,422$ 2,456$ 2,616$ 2,662$ 2,570$ 6.1% (3.5)% Less: Notable items: Foreign exchange trading services (15) Other fee revenue (66) Total fee revenue, excluding notable items 2,422 2,456 2,535 2,662 2,570 6.1% (3.5)% Total revenue, GAAP-basis 3,138 3,191 3,259 3,412 3,284 4.7% (3.8)% Less: Notable items: Foreign exchange trading services (15) Other fee revenue (66) (Gains) losses related to investment securities, net 81 Total revenue, excluding notable items 3,138 3,191 3,259 3,412 3,284 4.7% (3.8)% Total expenses, GAAP basis 2,513 2,269 2,308 2,440 2,450 (2.5)% 0.4% Less: Notable items: Acquisition and restructuring costs Deferred compensation expense acceleration (79) Repositioning charges 2 FDIC special assessment (130) 31 Other notable items (12) Total expenses, excluding notable items 2,383 2,269 2,308 2,382 2,450 2.8% 2.9% Seasonal expenses (162) (155) Total expenses, excluding notable items and seasonal expense items 2,221$ 2,269$ 2,308$ 2,382$ 2,295$ 3.3% (3.7)% Fee operating leverage, GAAP-basis (%pts)A 8.62% pts (3.87)% pts Fee operating leverage, excluding notable items (%pts)B 3.30% pts (6.31)% pts Operating leverage, GAAP-basis (%pts)C 7.16% pts (4.16)% pts Operating leverage, excluding notable items (%pts)D 1.84% pts (6.60)% pts Pre-tax margin, GAAP-basis (%) 19.1% 28.6% 28.4% 28.1% 25.0% 5.9% pts (3.1)% pts Notable items as reconciled above (%) 4.1% 1.7% Pre-tax margin, excluding notable items (%) 23.2% 28.6% 28.4% 29.8% 25.0% 1.8% pts (4.8)% pts Net income available to common shareholders, GAAP-basis 418$ 655$ 682$ 728$ 597$ 42.8% (18.0)% Notable items as reconciled above: pre-tax 130 58 Tax impact on notable items as reconciled above (31) (17) Net income available to common shareholders, excluding notable items 517$ 655$ 682$ 769$ 597$ 15.5% (22.4)% Diluted EPS, GAAP-basis 1.37$ 2.15$ 2.26$ 2.46$ 2.04$ 48.9% (17.1)% Notable items as reconciled above 0.32 0.14 Diluted EPS, excluding notable items 1.69$ 2.15$ 2.26$ 2.60$ 2.04$ 20.7% (21.5)% % Change


17 Reconciliation of Constant Currency FX Impacts (Dollars in millions) 1Q24 4Q24 1Q25 1Q25 vs. 1Q24 1Q25 vs. 4Q24 1Q25 vs. 1Q24 1Q25 vs. 4Q24 1Q25 vs. 1Q24 1Q25 vs. 4Q24 Non-GAAP basis Servicing fees, excluding notable items $ 1,228 $ 1,283 $ 1,275 $ (11) $ (6) $ 1,286 $ 1,281 4.7% (0.2)% Management fees, excluding notable items 510 576 562 (2) (1) 564 563 10.6% (2.3)% Foreign exchange trading services, excluding notable items 331 360 362 - - 362 362 9.4% 0.6% Securities finance, excluding notable items 96 118 114 - - 114 114 18.8% (3.4)% Software and processing fees, excluding notable items 207 259 225 (1) (1) 226 226 9.2% (12.7)% Other fee revenue, excluding notable items 50 66 32 - - 32 32 (36.0)% (51.5)% Total fee revenue, excluding notable items 2,422 2,662 2,570 (14) (8) 2,584 2,578 6.7% (3.2)% Net interest income, excluding notable items 716 749 714 (12) (5) 726 719 1.4% (4.0)% Total other income, excluding notable items - 1 - - - - - nm nm Total revenue, excluding notable items $ 3,138 $ 3,412 $ 3,284 $ (26) $ (13) $ 3,310 $ 3,297 5.5% (3.4)% Compensation and employee benefits, excluding notable items $ 1,252 $1,148 $ 1,262 $ (13) $ (7) $ 1,275 $ 1,269 1.8% 10.5% Information systems and communications, excluding notable items 432 480 497 (1) (1) 498 498 15.3% 3.8% Transaction processing services, excluding notable items 248 245 258 (2) (1) 260 259 4.8% 5.7% Occupancy, excluding notable items 103 110 103 (1) (1) 104 104 1.0% (5.5)% Other expenses, excluding notable items 348 399 330 (2) (1) 332 331 (4.6)% (17.0)% Total expenses, excluding notable items $ 2,383 $ 2,382 $ 2,450 $ (19) $ (11) $ 2,469 $ 2,461 3.6% 3.3% Reported Currency Translation Impact Excluding Currency Impact % Change Constant Currency


18 This presentation (and the conference call accompanying it) includes certain highlights of, and also material supplemental to, State Street Corporation’s news release announcing its first quarter 2025 financial results. That news release contains a more detailed discussion of many of the matters described in this presentation and is accompanied by an Addendum with detailed financial tables. This presentation (and the conference call accompanying it) is designed to be reviewed together with that news release and that Addendum, which are available on State Street’s website, at http://investors.statestreet.com, and are incorporated herein by reference. No other information on our website is incorporated herein by reference. 1. New asset servicing mandates, including announced Alpha front-to-back investment servicing clients, may be subject to completion of definitive agreements, consents or assignments, approval of applicable boards and shareholders, customary regulatory approvals or other conditions, the failure to complete any of which will prevent the relevant mandate from being installed and serviced. New asset servicing mandates and servicing assets/fees remaining to be installed in future periods exclude new business which has been contracted, but for which the client has not yet provided permission to publicly disclose or anonymously disclose and is not yet installed. These excluded assets, which from time to time may be significant, will be included in new asset servicing mandates and reflected in servicing assets/fees remaining to be installed in the period in which the client provides its permission. Servicing mandates, servicing assets remaining to be installed in future periods and servicing fee revenues remaining to be installed in future periods are presented on a gross basis based on factors present on or about the time we determine the business to be won by us and are not updated based on subsequent developments, including changes in assets, market valuations, scope and, potentially termination. Such assets therefore also do not include the impact of clients who have notified us during the period of their intent to terminate or reduce their relationship with State Street, which from time to time may be significant. New business in assets to be serviced is reflected in our AUC/A after we begin servicing the assets, and new business in assets to be managed is reflected in our AUM after we begin managing the assets. As such, only a portion of any new asset servicing and asset management mandates may be reflected in our AUC/A and AUM as of any particular date specified. AUC/A values for certain asset classes are based on a lag, typically one-month. Generally, our servicing fee revenues are affected by several factors, and we provide varied services from our full suite of offerings to different clients. The basis for fees will also differ across regions and clients and can reflect pricing pressures traditionally experienced in our industry. Consequently, no assumption should be drawn as to future revenue run rate from announced servicing wins or new servicing business yet to be installed, as the amount of revenue associated with AUC/A can vary materially. Management fees also are generally affected by various factors, including investment product type and strategy and relationship pricing for clients, and are more sensitive to market valuations than are servicing fees. Therefore, no assumption should be drawn from management fees associated with changes in AUM levels. Levels of AUC/A, AUC/A to be installed, Servicing fee wins to be installed and AUM are always presented as of the end of the relevant period, unless otherwise specifically noted. AUM for passive alternative investments has been revised from prior presentations 2. Servicing fee revenue wins/backlog (i.e., "to be installed") represents estimates of future annual revenue associated with new servicing engagements State Street determines to be won during the current reporting period, which may include anticipated servicing-related revenues associated with acquisitions or structured transactions, based upon factors assessed at the time the engagement is determined by State Street to be won, including asset volumes, number of transactions, accounts and holdings, terms and expected strategy. These and other relevant factors influencing projected servicing fees upon asset implementation/onboarding will change from time to time prior to, upon and following asset implementation/onboarding, among other reasons, due to varying market levels and factors and client and investor activity and preferences. Servicing fee/backlog estimates are not updated to reflect those changes, regardless of the magnitude or direction of, or reason for, any change. Servicing fee revenue wins in any period are highly variable and include estimated fees attributable to both (1) services to be provided for new estimated AUC/A reflected in new asset servicing wins for the period (with AUC/A to be onboarded in the future) and (2) additional services to be provided for AUC/A already included in our end-of period AUC/A (i.e., for which other services are currently provided); and the magnitude of one source of servicing fee revenue wins relative to the other (i.e., (1) relative to (2)) will vary from period to period. Therefore, for these and other reasons, comparisons of estimated servicing fee revenue wins to estimated new asset servicing AUC/A wins for any period will not produce reliable fee per AUC/A estimates. No servicing fees are recognized until the point in the future when we begin performing the associated services with respect to the relevant AUC/A. See also endnote 1 above in reference to considerations applicable to pending servicing engagements, which similarly apply to engagements for which reported servicing fee revenue wins/backlog are attributable. Both AUC/A and servicing fee revenue, when presented on a "backlog" or "to be installed" basis, are presented as of period-end. 3. Unless otherwise noted, all capital ratios referenced on this slide and elsewhere in this presentation refer to State Street Corporation, or State Street, and not State Street Bank and Trust Company. All capital ratios are as of quarter end. The lower of capital ratios calculated under the Basel III advanced approaches and under the Basel III standardized approach are applied in the assessment of our capital adequacy for regulatory purposes. Standardized approach ratios were binding for 1Q24 to 1Q25. Refer to the Addendum for descriptions of these ratios. March 31, 2025 capital ratios are presented as of quarter-end and are preliminary estimates. 4. State Street Corporation LCR in 1Q25 remained flat QoQ at ~106%; State Street Bank and Trust's (SSBT) LCR is significantly higher than State Street Corporation's (SSC) LCR, primarily due to application of the transferability restriction in the U.S. LCR Final Rule to the calculation of SSC’s LCR. This restriction limits the amount of HQLA held at SSC’s principal banking subsidiary, SSBT, and available for the calculation of SSC’s LCR to the amount of net cash outflows of SSBT. This transferability restriction does not apply in the calculation of SSBT’s LCR, and therefore SSBT’s LCR reflects the full benefit of all of its HQLA holdings. Leverage exposure is equal to average consolidated assets less applicable Tier 1 leverage capital reductions under regulatory standards. 5. The index names listed are service marks of their respective owners. S&P Global Specials and S&P U.S. Specials Volumes sourced from S&P Global Market Intelligence. 6. Data presented for indicative purposes. Morningstar data includes long-term mutual funds, ETFs and Money Market funds. Mutual fund data represents estimates of net new cash flow, which is new sales minus redemptions combined with net exchanges, while ETF data represents net issuance, which is gross issuance less gross redemptions. Data for Fund of Funds, Feeder funds and Obsolete funds were excluded from the series to prevent double counting. Data is from the Morningstar Direct Asset Flows database. The long-term fund flows reported by Morningstar in North America are composed of U.S. domiciled Market flows mainly in Equities, Allocation and Fixed Income asset classes. 1Q25 data for North America (U.S. domiciled) includes Morningstar actuals for January and February 2025 and Morningstar estimates for March 2025. 1Q25 data for EMEA is on a rolling three month basis for December 2024 through February 2025.


19 7. Front office software and data revenue primarily includes revenue from CRD, Alpha Data Platform and Alpha Data Services. Includes Other revenue of $3-4M in each of 1Q24 through 1Q25. Revenue line items may not sum to total due to rounding. 8. On-premises revenue is revenue derived from locally installed software. Software-enabled revenue includes SaaS, maintenance and support revenue, FIX, brokerage, and value-add services. The revenue recognition pattern for On-premises installations differs from software-enabled revenue. 9. Front office bookings represent signed ARR contract values for CRD, CRD for Private Markets, Alpha Data Platform, and Alpha Data Services excluding bookings with affiliates, including SSGA. Front office revenue derived from affiliate agreements is eliminated in consolidation for financial reporting purposes. 10. Front office software and data annual recurring revenue (ARR), an operating metric, is calculated by annualizing current quarter revenue for CRD and CRD for Private Markets and includes the annualized amount of most software-enabled revenue, including revenue generated from SaaS, maintenance and support revenue, FIX, and value-added services, which are all expected to be recognized ratably over the term of client contracts. Front office software and data ARR does not include software-enabled brokerage revenue, revenue from affiliates and licensing fees (excluding the portion allocated to maintenance and support) from On-premises software. 11. Represents expected ARR from signed client contracts that are scheduled to be largely installed over the next 24 months for CRD, CRD for Private Markets and Alpha Data Services. It includes SaaS revenue, as well as maintenance and support revenue, and excludes the one-time impact of On-premises license revenue, revenue generated from FIX, brokerage, value-add services, and professional services as well as revenue from affiliates. 12. NII is presented on a GAAP-basis. NIM is presented on a fully taxable-equivalent (FTE) basis, and is calculated by dividing FTE NII by average total interest-earning assets. Refer to the Addendum for reconciliations of NII FTE-basis to NII GAAP-basis on the Average Statement of Condition. 13. Includes Cash and due from banks and Interest-bearing deposits with banks. 14. Duration as of period end and based on the total investment portfolio. 15. Average loans are presented on a gross basis. Refer to the Addendum for average loans net of expected credit losses. 16. Compensation and employee benefits expenses in 4Q24 included notable items related to the acceleration of deferred compensation charges of $79M and a repositioning release of $15M. Excluding these notable items, 1Q25 GAAP Compensation and employee benefits of $1,262M was up 10% compared to 4Q24 adjusted Compensation and employee benefits of $1,148M. Occupancy expenses in 4Q24 included a notable item related to repositioning charges of $13M. Excluding the notable item, 1Q25 GAAP Occupancy of $103M was down (6)% compared to 4Q24 adjusted Occupancy of $110M. Other expenses in 1Q24 included a notable item related to the FDIC special assessment of $130M. Other expenses in 4Q24 included notable items related to a reduction in the special assessment from the FDIC of $31M, and charges related to operating model changes of $12M. Excluding these notable items, 1Q25 GAAP Other expenses of $330M was down (5)% compared to 1Q24 adjusted Other expenses of $348M and down (17)% compared to 4Q24 adjusted Other expenses of $399M. 17. Other, excluding notable items, includes Other expenses and Amortization of intangible assets. 18. Pro-forma headcount reflects estimated total headcount for 1Q24 as if the headcount of the India joint venture that was consolidated in 2Q24 had been included in the prior period and is based on headcount in that joint venture at the end of the period. 19. The SCB of 2.5% effective on October 1, 2024 is calculated based upon the results of the CCAR 2024 exam. 20. Leverage exposure is equal to average consolidated assets less applicable Tier 1 leverage capital reductions under regulatory standards. 21. OCI impact of investment portfolio on regulatory capital is a sub-component within GAAP AOCI. 22. Future dividends are estimated based on the preferred stock outstanding as of March 31, 2025, along with any public announcements of issuances and redemptions through the date hereof. These estimates do not account for any potential future issuances or redemptions, which could alter the projected preferred stock dividends. State Street’s preferred stock dividends, including the declaration, timing and amount, remain subject to consideration and approval by State Street’s Board of Directors at the relevant times. Full year dividends may not sum to total due to rounding.


20 This Presentation contains forward-looking statements within the meaning of United States securities laws, including statements about our goals and expectations regarding our strategy, growth and sales prospects, capital management, business, financial and capital condition, results of operations, the financial and market outlook and the business environment. Forward-looking statements are often, but not always, identified by such forward- looking terminology as "estimate," "will," "opportunity," "strategy," "future," "driver," “outlook,” “priority,” “expect,” “intend,” “aim,” “outcome,” “future,” “pipeline,” “trajectory,” “target," “guidance,” “objective,” “plan,” “forecast,” “believe,” “anticipate,” “seek,” “may,” “trend,” and “goal,” or similar statements or variations of such terms. These statements are not guarantees of future performance, are inherently uncertain, are based on current assumptions that are difficult to predict and involve a number of risks and uncertainties. Therefore, actual outcomes and results may differ materially from what is expressed in those statements, and those statements should not be relied upon as representing our expectations or beliefs as of any time subsequent to the time this Presentation is first issued. We are subject to intense competition, which could negatively affect our profitability; We are subject to significant pricing pressure and variability in our financial results and our AUC/A and AUM; Our development and completion of new products and services, including State Street Alpha® and those related to wealth servicing, alternative investment management or digital assets or incorporating artificial intelligence, may impose costs on us, involve dependencies on third parties and may expose us to increased risks; Acquisitions, strategic alliances, joint ventures and divestitures, and the integration, retention and development of the benefits of these transactions, pose risks for our business; and Competition for qualified members of our workforce is intense, and we may not be able to attract and retain the highly skilled people we need to support our business; We could be adversely affected by political, geopolitical, economic and market conditions including, for example, as a result of liquidity or capital deficiencies (actual or perceived) by other financial institutions and related market and government actions, changes in U.S. trade policy, or the trade policy of other nations, the ongoing conflicts in Ukraine and in the Middle East, major political shifts domestically or internationally, actions taken by central banks in an attempt to address prevailing economic conditions, changes in monetary policy or periods of significant volatility in the markets for equity, fixed income and other assets classes globally or within specific markets; We have significant global operations, and clients, that can be adversely impacted by disruptions in key economies, including local, regional and geopolitical developments affecting those economies; Our investment securities portfolio, consolidated financial condition and consolidated results of operations could be adversely affected by changes in the financial markets, governmental action or monetary policy. For example, among other risks, changes in prevailing interest rates or market conditions have led, and were they to occur in the future could further lead, to decreases in our NII or to portfolio management decisions resulting in reductions in our capital or liquidity ratios; Our business activities expose us to interest rate risk; We assume significant credit risk of counterparties, who may also have substantial financial dependencies on other financial institutions, and these credit exposures and concentrations could expose us to financial loss; Our fee revenue represents a significant portion of our revenue and is subject to decline based on, among other factors, market and currency declines, investment activities and preferences of our clients and their business mix; If we are unable to effectively manage our capital and liquidity, our financial condition, capital ratios, results of operations and business prospects could be adversely affected; Our calculations of risk exposures, total RWA and capital ratios depend on data inputs, formulae, models, correlations and assumptions that are subject to change, which could materially impact our risk exposures, our total RWA and our capital ratios from period to period; We may need to raise additional capital or debt in the future, which may not be available to us or may only be available on unfavorable terms; and If we experience a downgrade in our credit ratings, or an actual or perceived reduction in our financial strength, our borrowing and capital costs, liquidity and reputation could be adversely affected; Our business and capital-related activities, including common share repurchases, may be adversely affected by regulatory requirements and considerations, including capital, credit and liquidity; We face extensive and changing government regulation and supervision in the U.S. and non- U.S. jurisdictions in which we operate, which may increase our costs and compliance risks and may affect our business activities and strategies; Our businesses may be adversely affected by government enforcement and litigation; Our businesses may be adversely affected by increased and conflicting political and regulatory scrutiny of asset management, stewardship and corporate sustainability or ESG practices; Any misappropriation of the confidential information we possess could have an adverse impact on our business and could subject us to regulatory actions, litigation and other adverse effects; Changes in accounting standards may adversely affect our consolidated results of operations and financial condition; Changes in tax laws, rules or regulations, challenges to our tax positions and changes in the composition of our pre-tax earnings may increase our effective tax rate; We could face liabilities for withholding and other non-income taxes, including in connection with our services to clients, as a result of tax authority examinations; and Our businesses may be negatively affected by adverse publicity or other reputational harm; Attacks or unauthorized access to our or our business partners’ or clients’ information technology systems or facilities, such as cyber-attacks or other disruptions to our or their operations, could result in significant costs, reputational damage and impacts on our business activities; Our business may be negatively affected by risks associated with strategic initiatives we are undertaking to enhance the effectiveness and efficiency of our operations and of our cybersecurity and technology infrastructure or by our failure to meet the related, resiliency or other expectations of our clients and regulators, or as a result of a cyber-attack or similar vulnerability in our or business partners' infrastructure; Our risk management framework, models and processes may not be effective in identifying or mitigating risk and reducing the potential for related losses, and a failure or circumvention of our controls and procedures, or errors or delays in our operational and transaction processing, or those of third parties, could have an adverse effect on our business, financial condition, operating results and reputation; Shifting and maintaining operational activities to non-U.S. jurisdictions, changing our operating model, and outsourcing to, or insourcing from, third parties expose us to increased operational risk, geopolitical risk and reputational harm and may not result in expected cost savings or operational improvements; Long-term contracts and customizing service delivery for clients expose us to increased operational risk, pricing and performance risk; The quantitative models we use to manage our business may contain errors that could adversely impact our business, financial condition, operating results and regulatory compliance, and lapses in disclosure controls and procedures or internal control over financial reporting could occur, any of which could result in material harm; We may not be able to protect our intellectual property, and we are subject to claims of third party intellectual property rights; Our reputation and business prospects may be damaged if investors in the collective investment pools we sponsor or manage incur substantial losses in these investment pools or are restricted in redeeming their interests in these investment pools; The impacts of global regulatory requirements and expectations, shifting client preferences, and disclosure requirements related to climate risks, and sustainability standards could adversely affect us; and We may incur losses or face negative impacts on our business as a result of unforeseen events, including terrorist attacks, geopolitical events, acute or chronic physical risk events, including natural disasters, pandemics, global conflicts, or a banking crisis, which may have a negative impact on our business and operations. Other important factors that could cause actual results to differ materially from those indicated by any forward-looking statements are set forth in our 2024 Annual Report on Form 10-K and our subsequent SEC filings. We encourage investors to read these filings, particularly the sections on risk factors, for additional information with respect to any forward-looking statements and prior to making any investment decision. The forward-looking statements contained in this Presentation should not be relied on as representing our expectations or beliefs as of any time subsequent to the time this Presentation is first issued, and we do not undertake efforts to revise those forward-looking statements to reflect events after that time.


21 In addition to presenting State Street's financial results in conformity with U.S. generally accepted accounting principles, or GAAP, management also presents certain financial information on a basis that excludes or adjusts one or more items from GAAP. This latter basis is a non-GAAP presentation. In general, our non-GAAP financial results adjust selected GAAP-basis financial results to exclude the impact of revenue and expenses outside of State Street’s normal course of business or other notable items, such as acquisition and restructuring charges, repositioning charges, gains/losses on sales, as well as, for selected comparisons, seasonal items. For example, we sometimes present expenses on a basis we may refer to as “expenses ex-notable items", which exclude notable items and, to provide additional perspective on both prior year quarter and sequential quarter comparisons, may also exclude seasonal items. Management believes that this presentation of financial information facilitates an investor's further understanding and analysis of State Street's financial performance and trends with respect to State Street’s business operations from period-to-period, including providing additional insight into our underlying margin and profitability. In addition, Management may also provide additional non-GAAP measures. For example, we may present revenue and expense measures on a constant currency basis to identify the significance of changes in foreign currency exchange rates (which often are variable) in period-to-period comparisons. This presentation represents the effects of applying prior period weighted average foreign currency exchange rates to current period results. Non-GAAP financial measures should be considered in addition to, not as a substitute for or superior to, financial measures determined in conformity with GAAP. Refer to the Addendum for reconciliations of our non-GAAP financial information. To access the Addendum go to http://investors.statestreet.com and click on “Filings & Reports – Quarterly Results”.


22 ACWI All Country World Index AOCI Accumulated other comprehensive income ARR Annual recurring revenue AUC/A Assets under custody and/or administration AUM Assets under management Bloomberg Global Agg Bloomberg Global Agg represents Bloomberg Global Aggregate Bond Index CCAR Comprehensive Capital Analysis and Review CET1 ratio Common equity tier 1 ratio CRD Charles River Development Diluted earnings per share (EPS) Net income available to common shareholders divided by diluted average common shares outstanding for the noted period EAFE Europe, Australia, and Far East EM Emerging markets EMEA Europe, Middle East and Africa EOP End of period EPS Earnings per share ESG Environmental, Social, and Governance ETF Exchange-traded fund FDIC Federal Deposit Insurance Corporation Fee operating leverage Rate of growth of total fee revenue less the rate of growth of total expenses, relative to the successive prior year period, as applicable FIX The Charles River Network's FIX Network Service (CRN) is an end-to-end trade execution and support service facilitating electronic trading between Charles River's asset management and broker clients Front office uninstalled revenue backlog Represents the annualized recurring revenue from signed client contracts that are scheduled to be fully installed over the next 24 months for CRD, Charles River for Private Markets and Alpha Data Services. It includes SaaS revenue as well as maintenance and support revenue and excludes the one-time impact of on-premises license revenue, revenue generated from FIX, brokerage, value-add services, and professional services as well as revenue from affiliates FTE Fully taxable-equivalent FX Foreign exchange FY Full-year GAAP Generally accepted accounting principles in the United States G-SIB Global systemically important bank HQLA High Quality Liquid Assets JPM G7 JP Morgan G7 Volatility Index JPM EM JP Morgan Emerging Market Bond Index JV Joint venture LCR Liquidity Coverage Ratio Lending related and other Lending related and other fees primarily consist of fee revenue associated with State Street’s fund finance, leveraged loans, municipal finance, insurance and stable value wrap businesses MSCI Morgan Stanley Capital International Net interest income (NII) Income earned on interest bearing assets less interest paid on interest bearing liabilities Net interest margin (NIM) (FTE) Fully taxable-equivalent (FTE) Net interest income divided by average total interest-earning assets nm Not meaningful NYSE New York Stock Exchange OCI Other comprehensive income On-premises On-premises revenue as recognized in Front office software and data Operating leverage Rate of growth of total revenue less the rate of growth of total expenses, relative to the corresponding prior year period, as applicable %Pts Percentage points is the difference from one percentage value subtracted from another Pre-tax margin Income before income tax expense divided by total revenue Quarter-over-Quarter (QoQ) Sequential quarter comparison Return on equity (ROE) Net income available to common shareholders divided by average common equity Return on tangible common equity (ROTCE) Net income available to common shareholders divided by average tangible common equity RWA Risk weighted assets SaaS Software as a service SCB Stress capital buffer Seasonal expenses Seasonal deferred incentive compensation expenses for retirement-eligible employees and payroll taxes SEC Securities Exchange Commission SPDR Standard and Poor's Depository Receipt SSC State Street Corporation SSGA State Street Global Advisors VIX Chicago Board Options Exchange's CBOE Volatility Index Year-over-Year (YoY) Current period compared to the same period a year ago