stt-20220119
false000009375100000937512022-01-192022-01-190000093751us-gaap:CommonStockMember2022-01-192022-01-190000093751stt:SeriesDPreferredStockDepositoryShareMember2022-01-192022-01-190000093751stt:SeriesGPreferredStockDepositoryShareMember2022-01-192022-01-19

UNITED STATES
SECURITIES AND EXCHANGE COMMISSION
Washington, D.C. 20549
______________________
FORM 8-K
_________________
CURRENT REPORT
Pursuant to Section 13 or 15(d) of the Securities Exchange Act of 1934
Date of Report (Date of earliest event reported): January 19, 2022
______________________
State Street Corporation
(Exact name of registrant as specified in its charter)
____________________
Massachusetts001-0751104-2456637
(State or Other Jurisdiction of Incorporation)(Commission File Number)(IRS Employer Identification Number)
One Lincoln Street
BostonMassachusetts02111
(Address of principal executive offices, and Zip Code)
Registrant’s telephone number, including area code:
(617)
786-3000
________________
Check the appropriate box below if the Form 8-K filing is intended to simultaneously satisfy the filing obligation of the registrant under any of the following provisions:
    Written communications pursuant to Rule 425 under the Securities Act (17 CFR 230.425)
    Soliciting material pursuant to Rule 14a-12 under the Exchange Act (17 CFR 240.14a-12)
    Pre-commencement communications pursuant to Rule 14d-2(b) under the Exchange Act (17 CFR 240.14d-2(b))
    Pre-commencement communications pursuant to Rule 13e-4(c) under the Exchange Act (17 CFR 240.13e-4(c))

Securities registered pursuant to Section 12(b) of the Act:
Title of each classTrading Symbol(s)Name of each exchange on which registered
Common stock, $1 par value per shareSTTNew York Stock Exchange
Depositary Shares, each representing a 1/4,000th ownership interest in a share of STT.PRDNew York Stock Exchange
Fixed-to-Floating Rate Non-Cumulative Perpetual Preferred Stock, Series D, without par value per share
Depositary Shares, each representing a 1/4,000th ownership interest in a share of STT.PRGNew York Stock Exchange
Fixed-to-Floating Rate Non-Cumulative Perpetual Preferred Stock, Series G, without par value per share
Indicate by check mark whether the registrant is an emerging growth company as defined in Rule 405 of the Securities Act of 1933 (§230.405 of this chapter) or Rule 12b-2 of the Securities Exchange Act of 1934 (§240.12b-2 of this chapter).
Emerging growth company 
If an emerging growth company, indicate by check mark if the registrant has elected not to use the extended transition period for complying with any new or revised financial accounting standards provided pursuant to Section 13(a) of the Exchange Act.  ¨


Item 2.02.    Results of Operations and Financial Condition.
On January 19, 2022, State Street Corporation issued a news release announcing its results of operations for the fourth-quarter of 2021 and full-year 2021. Copies of that news release and accompanying fourth-quarter 2021 and full-year 2021 financial information addendum are furnished herewith as Exhibits 99.1 and 99.2, respectively, and are incorporated herein by reference.
Item 7.01.    Regulation FD Disclosure.
On January 19, 2022, State Street Corporation made available a slide presentation providing highlights of its fourth-quarter 2021 and full-year 2021 results of operations and related information as of December 31, 2021, which is being made available in connection with a January 19, 2022 investor conference call. A copy of that slide presentation is furnished herewith as Exhibit 99.3 and is incorporated herein by reference.
Item 9.01.    Financial Statements and Exhibits.
(d)    Exhibits.
State Street Corporation's news release dated January 19, 2022, announcing its fourth-quarter 2021 and full-year 2021 results of operations and accompanying fourth-quarter 2021 and full-year 2021 financial information addendum are furnished herewith as Exhibits 99.1 and 99.2, respectively, and are incorporated by reference in Item 2.02 hereof; and a slide presentation providing highlights of State Street's fourth-quarter 2021 and full-year 2021 results of operations and related information, which is being made available in connection with a January 19, 2022 investor conference call, is furnished herewith as Exhibit 99.3 and is incorporated by reference in Item 7.01 hereof.
Exhibit No.Description
*104Cover Page Interactive Data File (formatted as Inline XBRL)
 *Submitted electronically herewith


SIGNATURES
Pursuant to the requirements of the Securities Exchange Act of 1934, the registrant has duly caused this report to be signed on its behalf by the undersigned hereunto duly authorized.

STATE STREET CORPORATION
By:
/s/ IAN W. APPLEYARD
Name:Ian W. Appleyard,
Title:Executive Vice President, Global Controller and Chief Accounting Officer
Date:January 19, 2022


image2a.gif
Exhibit 99.1
State Street Corporation
One Lincoln Street
Boston, MA 02111
NYSE: STT
         www.statestreet.com

Boston, MA… January 19, 2022 News Release

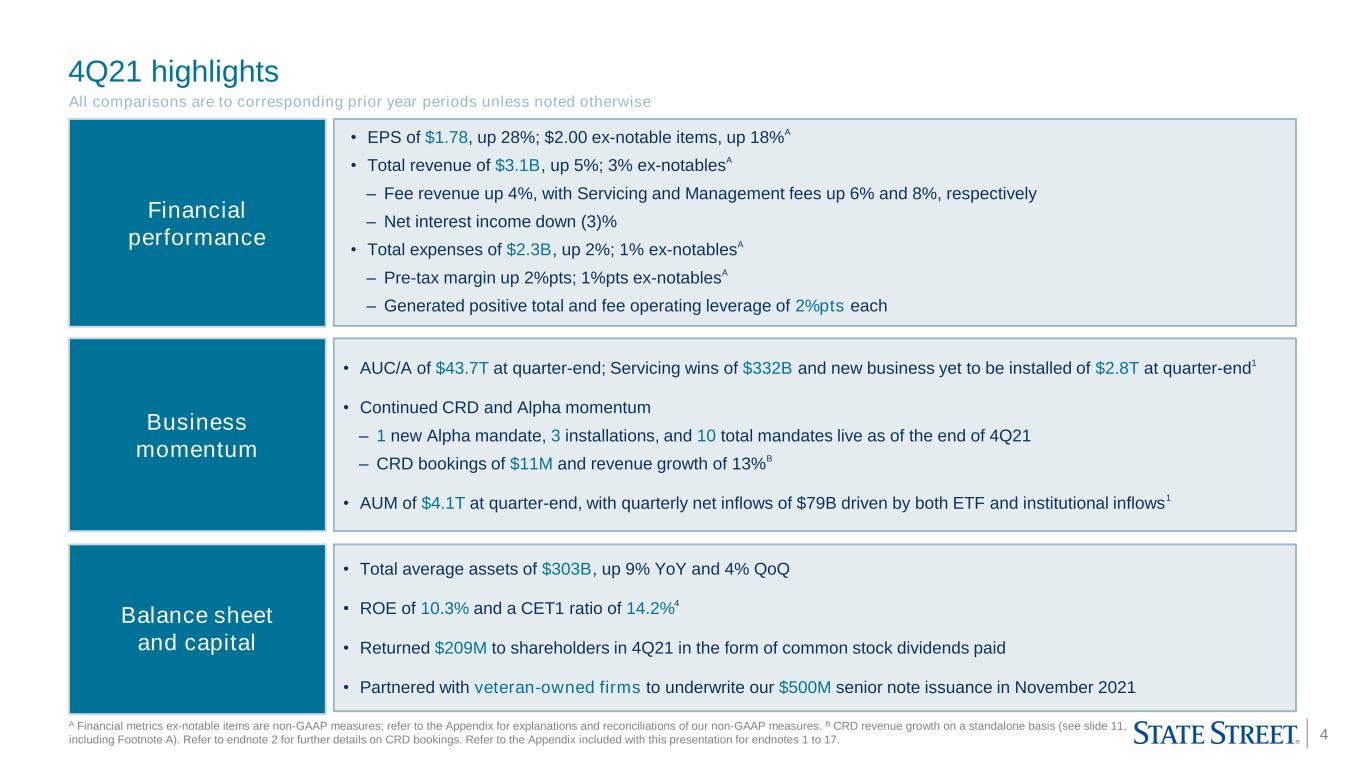
STATE STREET REPORTS FOURTH QUARTER 2021 EPS OF $1.78; $2.00 EXCLUDING NOTABLE ITEMS(a)
 % changes noted below reflect year-over-year 4Q comparisons

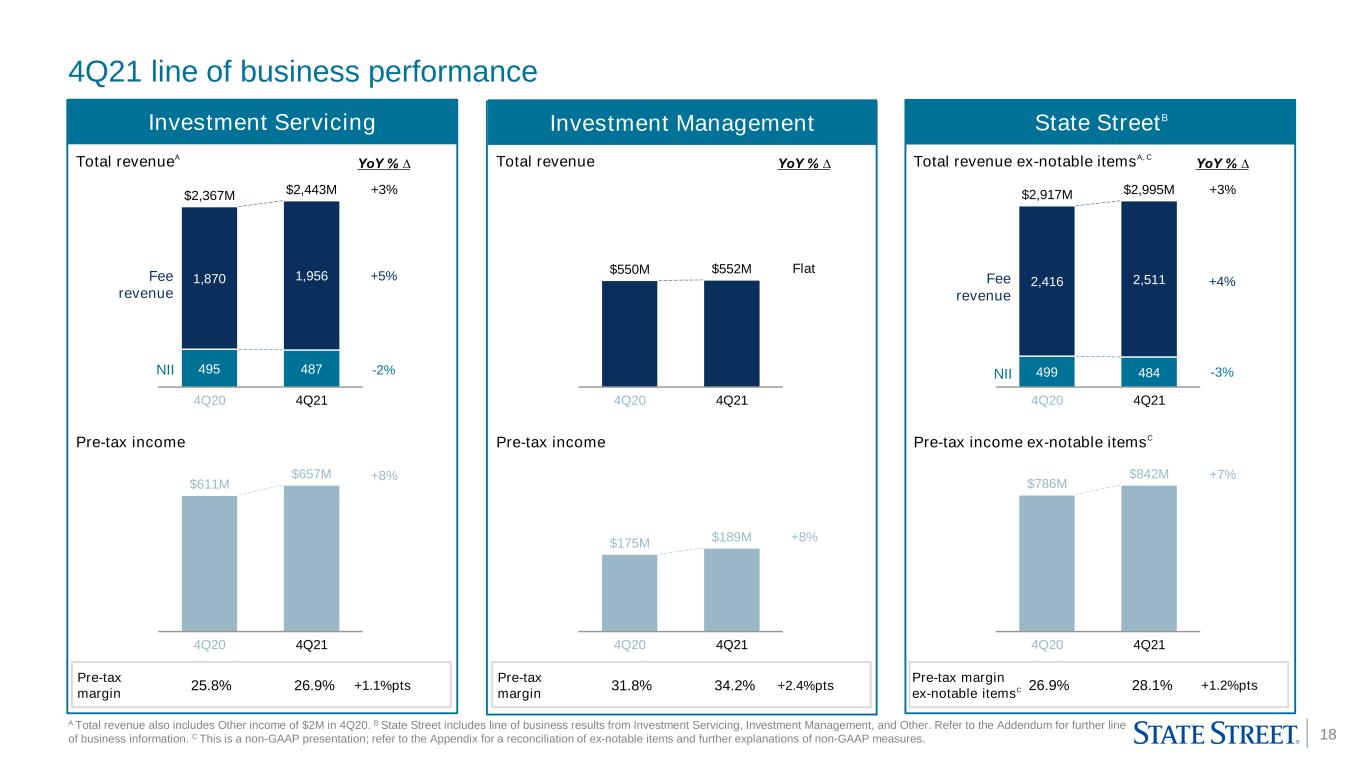
TOTAL REVENUE UP 5%, WITH FEE REVENUE UP 4%
STRONG SERVICING AND MANAGEMENT FEE GROWTH OF 6% AND 8%
NEW SERVICING WINS OF $332 BILLION AND AUM INFLOWS OF $79 BILLION
EXPENSES UP 2%; UP 1% EX-NOTABLES(a)
POSITIVE TOTAL AND FEE OPERATING LEVERAGE OF 2% POINTS EACH

Ron O'Hanley, Chairman and Chief Executive Officer: "We finished 2021 with a strong fourth quarter performance, contributing to a record year for fee revenue. We continued to successfully execute against our strategic priorities, while also delivering strong year-over-year financial results and business momentum, including positive operating leverage, meaningful pre-tax margin expansion and robust earnings growth. Amid a favorable market environment, both the Investment Services and Global Advisors franchises generated exceptional performance thanks to the dedication of our employees who effectively implemented our strategy and delivered for our clients and shareholders."

O'Hanley added: "As we look ahead in 2022, we remain focused on revenue growth, expense discipline and successfully closing and integrating our previously announced acquisition of BBH Investor Services. We will continue to innovate for our clients, transform the way we work, and build an even higher performing organization in order to drive growth and create value for our shareholders."

FINANCIAL HIGHLIGHTS
(Table presents summary results, dollars in millions, except per share amounts, or where otherwise noted)4Q213Q214Q20 % QoQ  % YoY
Income statement:
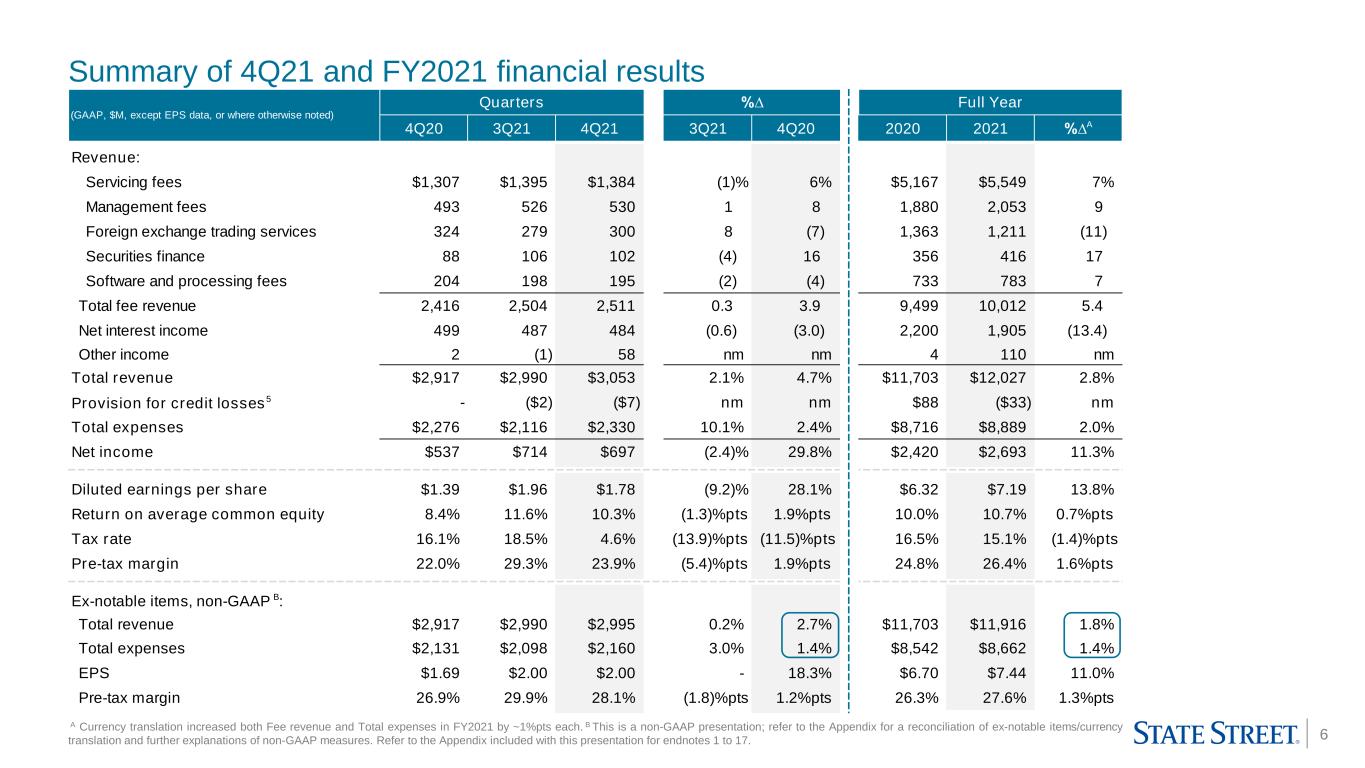
Total fee revenue$2,511 $2,504 $2,416 — %%
Net interest income484 487 499 (1)(3)
Other income58 (1)nmnm
Total revenue3,053 2,990 2,917 2
Provision for credit losses(7)(2)— nmnm
Total expenses2,330 2,116 2,276 10 
Net income697 714 537 (2)30 
Financial ratios and other metrics:
Diluted earnings per share (EPS)$1.78 $1.96 $1.39 (9)%28 %
Return on average common equity (ROE)10.3 %11.6 %8.4 %(130)bps190 bps
Pre-tax margin23.9 29.3 22.0 (540)190 
AUC/A ($ billions)(1)
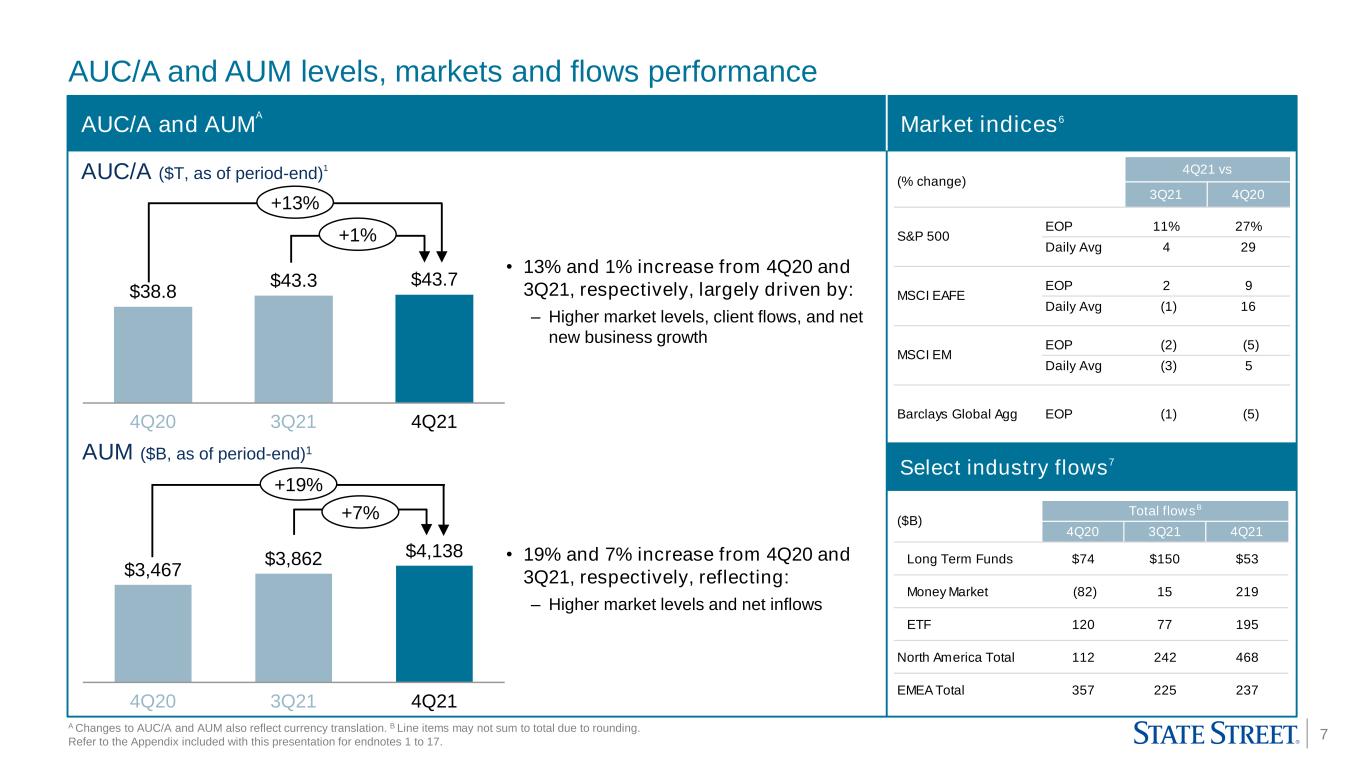
43,678 43,337 38,791 %13 %
AUM ($ billions)(1)
4,138 3,862 3,467 19 
(1) As of period-end.

(a) See "4Q21 Highlights" in this news release for a listing of notable items. Results excluding notable items and/or currency translation impact are non-GAAP measures. Please refer to the Addendum included with this news release for an explanation and reconciliation of non-GAAP measures.

Investor Contact: Ilene Fiszel Bieler +1 617-664-3477          Media Contact: Carolyn Cichon +1 617-664-8672
1

                    
4Q21 HIGHLIGHTS
(all comparisons are to 4Q20, unless otherwise noted)

AUC/A and AUM
Investment Servicing AUC/A as of quarter-end increased 13% to a record $43.7 trillion, primarily due to higher market levels, client flows and net new business growth
Investment Management AUM as of quarter-end increased 19% to a record $4.1 trillion, mainly reflecting higher market levels and net inflows

New business and strategy execution
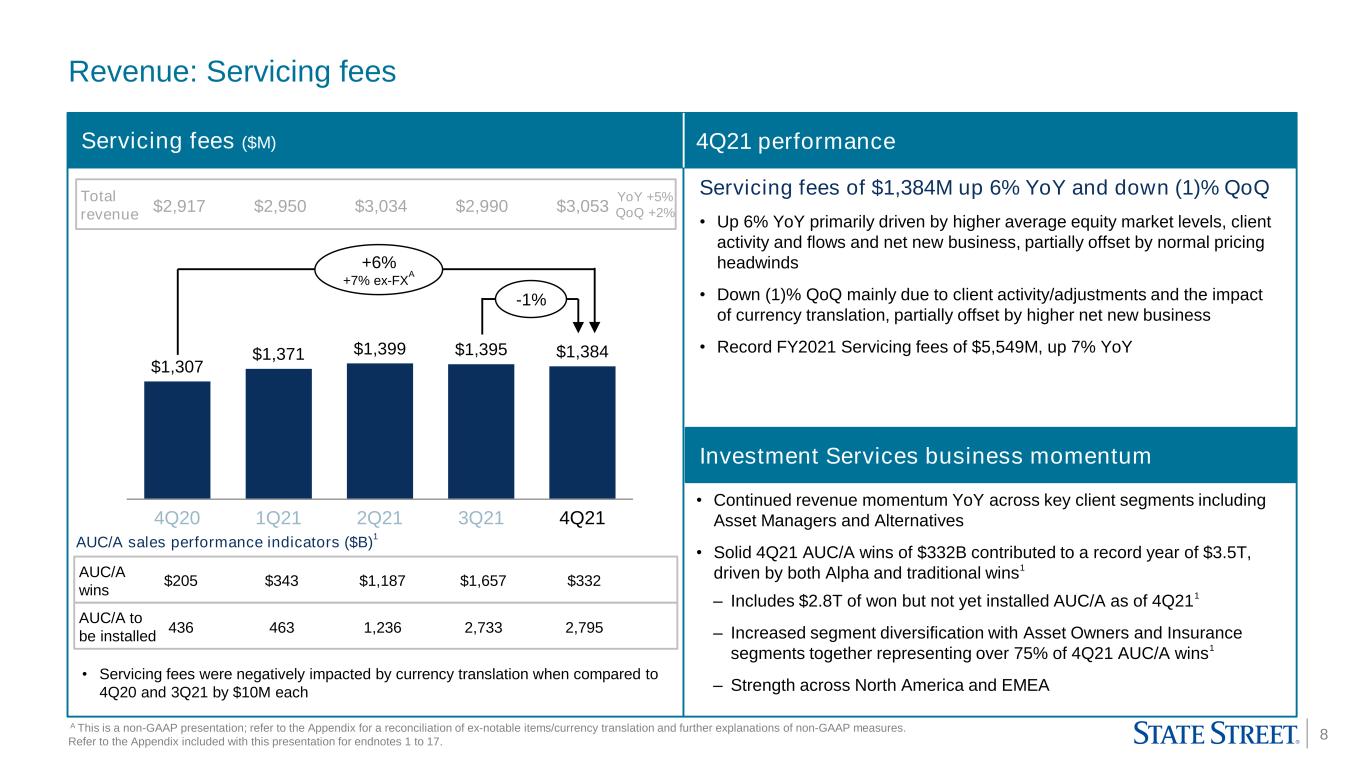
Investment Servicing mandates announced in 4Q21 totaled $332 billion, with quarter-end servicing assets to be installed in future periods of $2.8 trillion
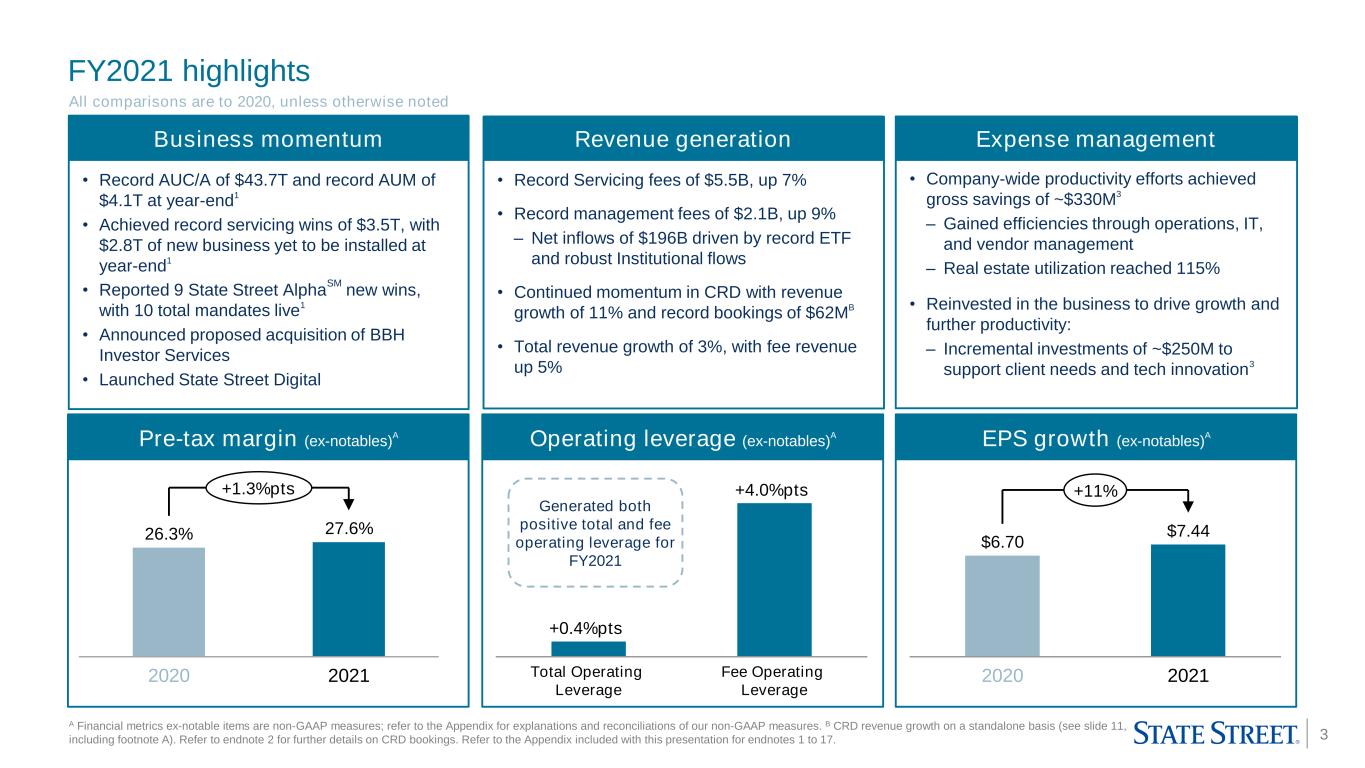
Record full-year 2021 AUC/A wins of $3.5 trillion across client segments and regions, with State Street AlphaSM representing a substantial proportion of wins
Announced 1 Alpha client mandate and 3 Alpha client mandates went live in 4Q21
19 total Alpha client mandates signed since inception(a)
10 of 19 Alpha client mandates now live as of the end of 4Q21
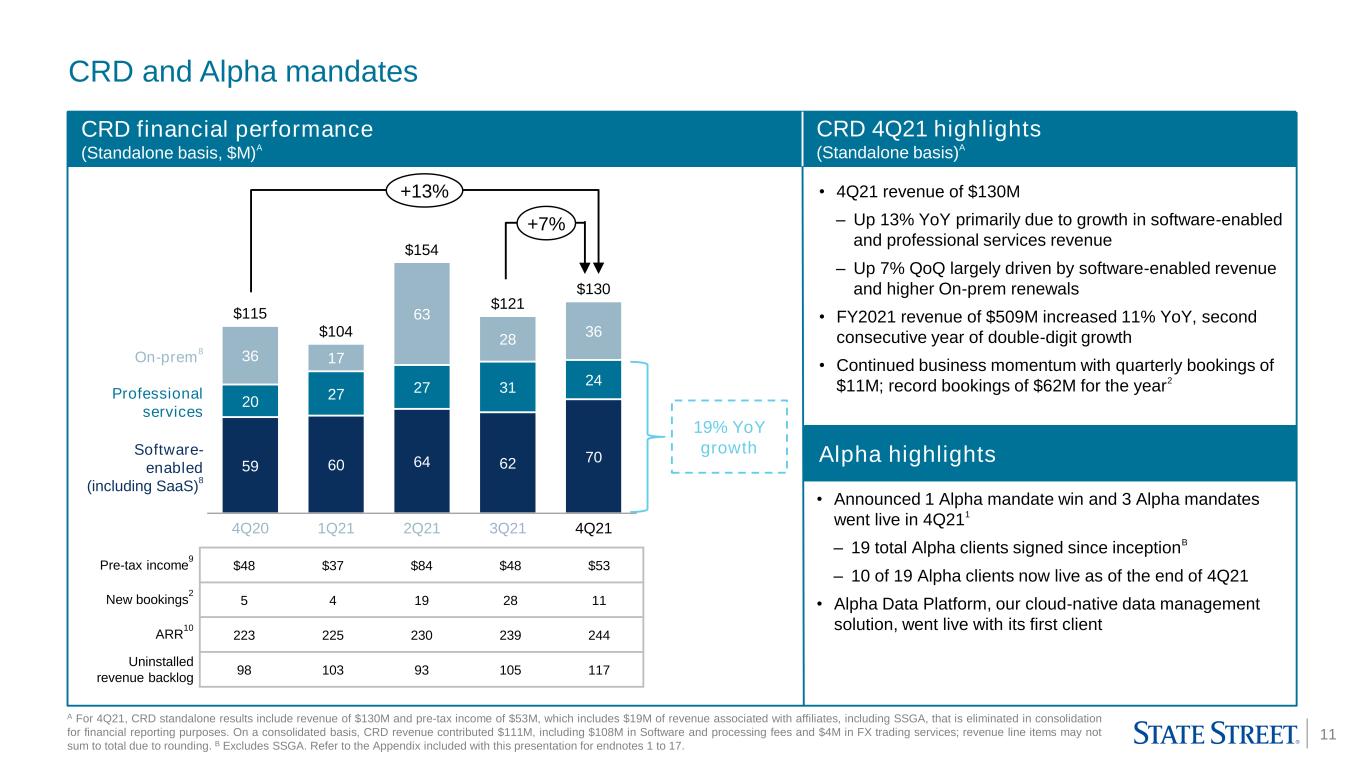
Charles River Development (CRD) achieved new bookings of $11 million and attained annual recurring revenue (ARR) of $244 million in 4Q21,(b) up 9%
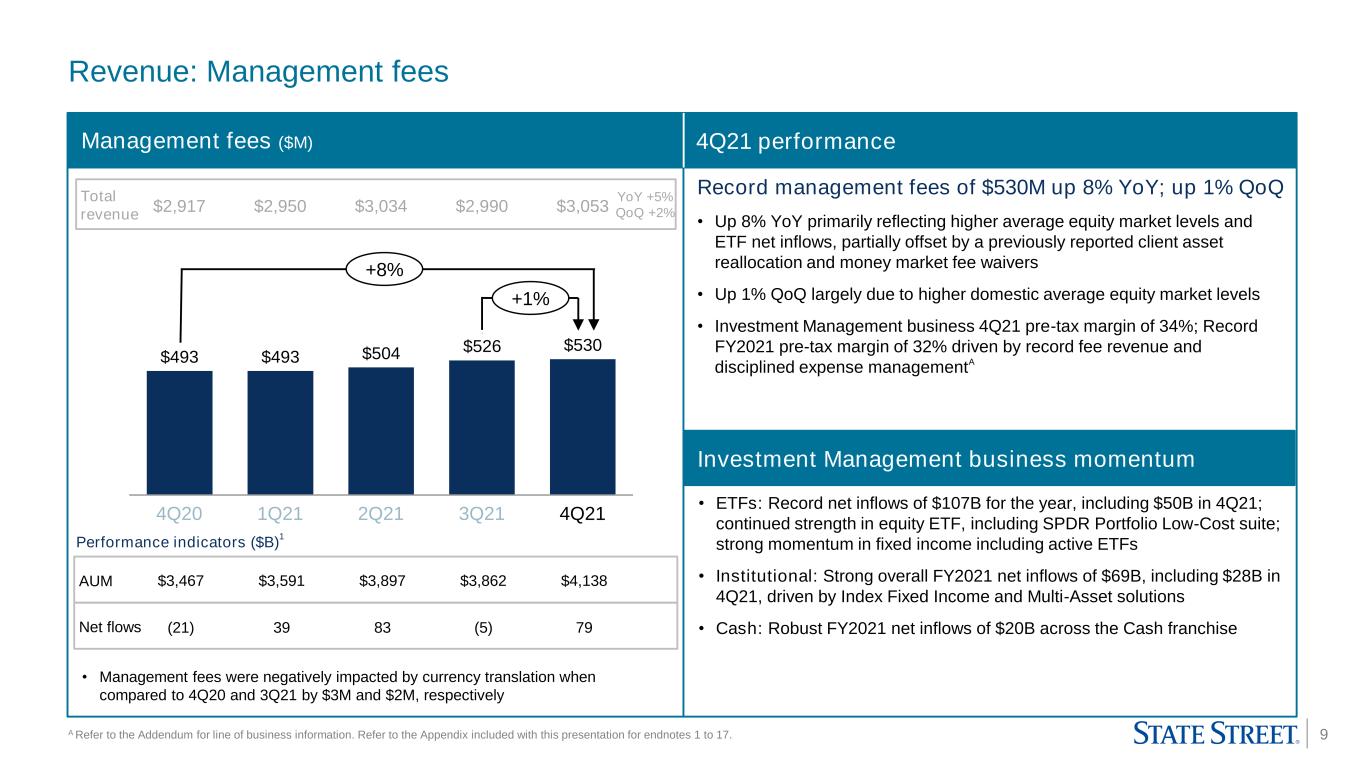
Investment Management business generated strong net inflows of $79 billion in 4Q21, reflecting record ETF inflows of $50 billion
Robust net inflows of $196 billion in full-year 2021, including record ETF inflows of $107 billion

Revenue
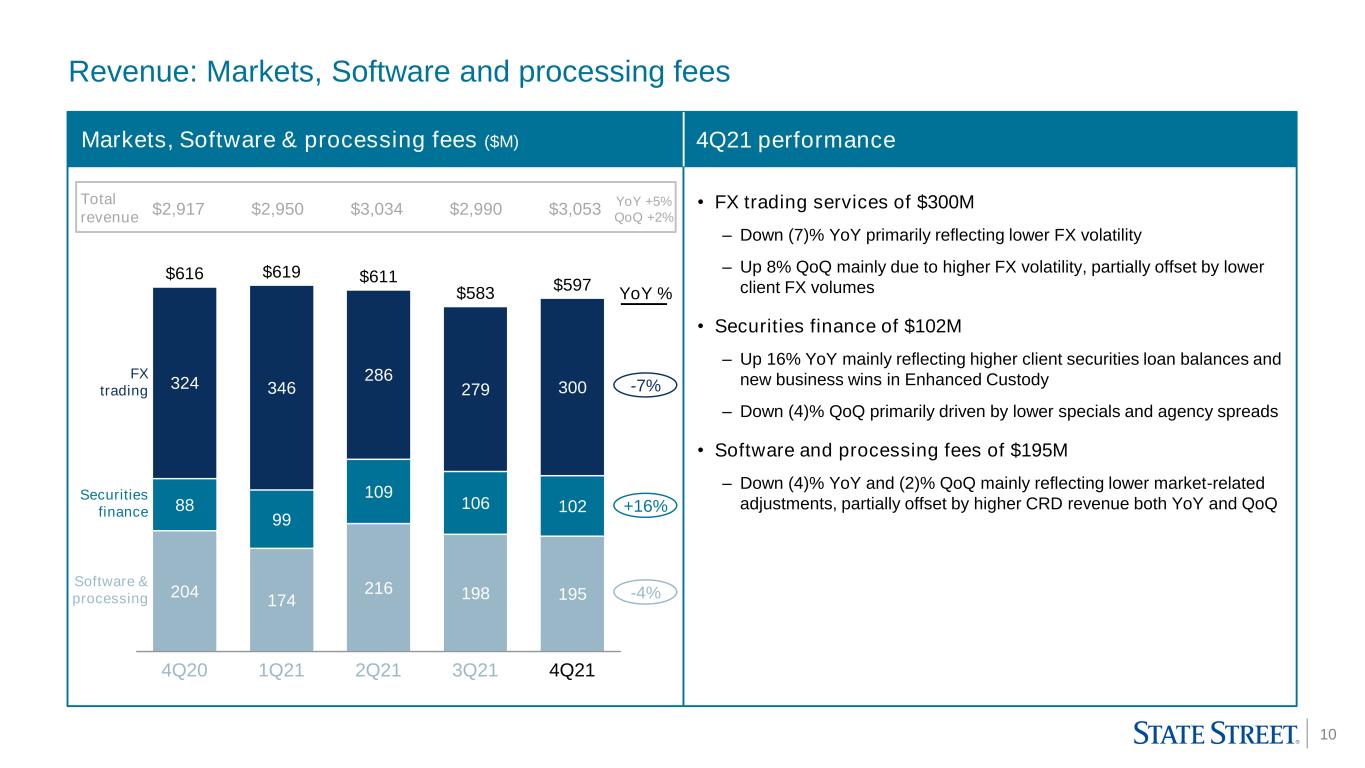
Fee revenue increased 4%, primarily reflecting strong Servicing and Management fees, partially offset by lower FX trading services and Software and processing fees:
Servicing fees increased 6%
Management fees increased 8%
FX trading services decreased (7)%
Securities finance increased 16%
Software and processing fees decreased (4)%, with CRD standalone revenue up 13%(c)
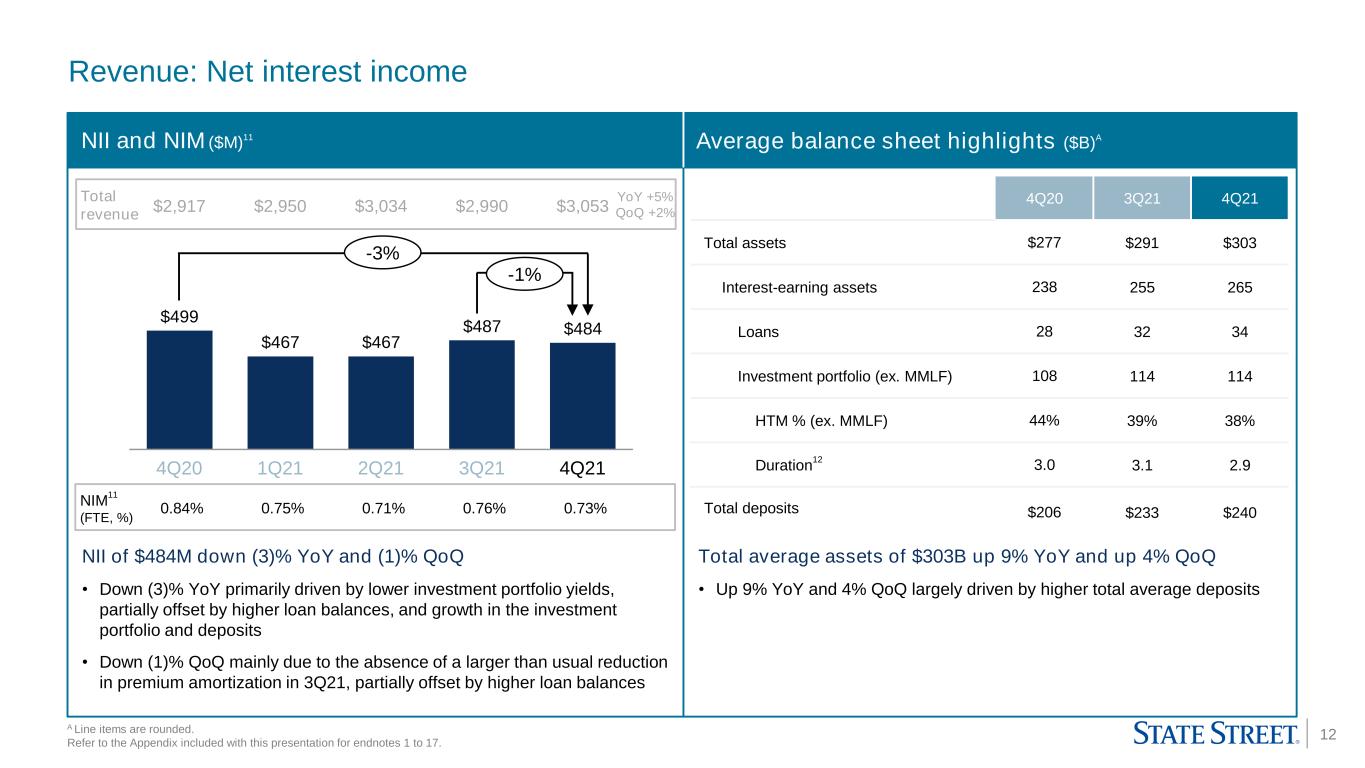
Net interest income (NII) decreased (3)%, primarily driven by lower investment portfolio yields, partially offset by higher loan balances and growth in the investment portfolio and deposits


(a) Excludes State Street Global Advisors (SSGA).
(b) See the endnotes included in the "In This News Release" section for explanations of CRD bookings and annual recurring revenue (ARR).
(c) For 4Q21, CRD standalone revenue of $130 million includes $127 million in Software and processing fees and $4 million in FX trading services. For 4Q20, CRD standalone revenue of $115 million includes $112 million in Software and processing fees and $3 million in FX trading services. CRD standalone revenues in 4Q21 and 4Q20, include $19 million and $9 million of revenues, respectively, associated with affiliates, including SSGA, that is eliminated in consolidation for financial reporting purposes. Revenue line items may not sum to total due to rounding.
2


Expenses
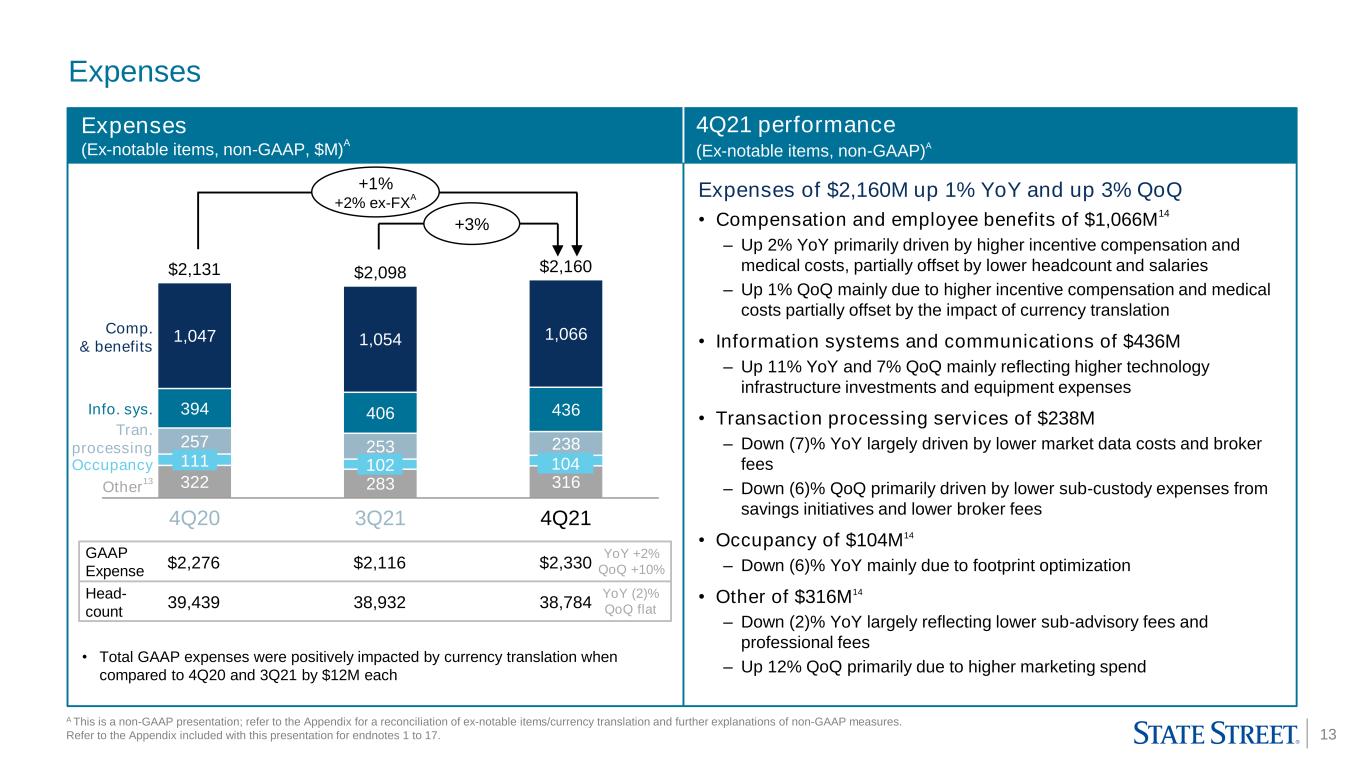
Total expenses increased 2%, primarily reflecting the impact of notable items, higher compensation and employee benefits reflecting strong year-over-year performance and targeted business investments, partially offset by continued expense management and currency translation
Total expenses increased 1%, excluding notable items(a)
Achieved meaningful productivity savings while making controlled investments to support product innovation, client onboarding, operations and technology

Notable items
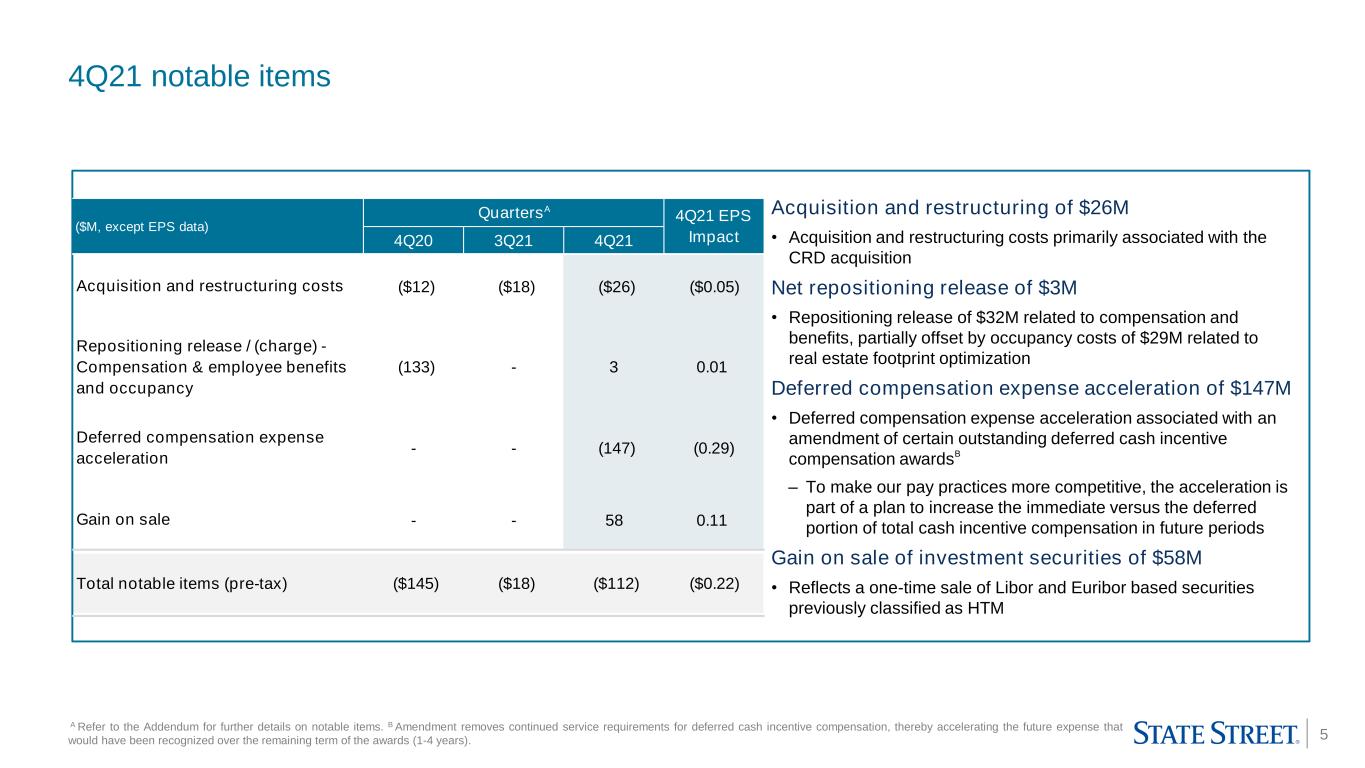
(Dollars in millions, except EPS amounts)4Q213Q214Q20
Acquisition and restructuring costs$(26)$(18)$(12)
Repositioning release / (charge):
Compensation & employee benefits32 — (82)
Occupancy(29)— (51)
Total Repositioning release / (charge)— (133)
Deferred compensation expense acceleration(b)
(147)— — 
Gain on sale of investment securities58 — — 
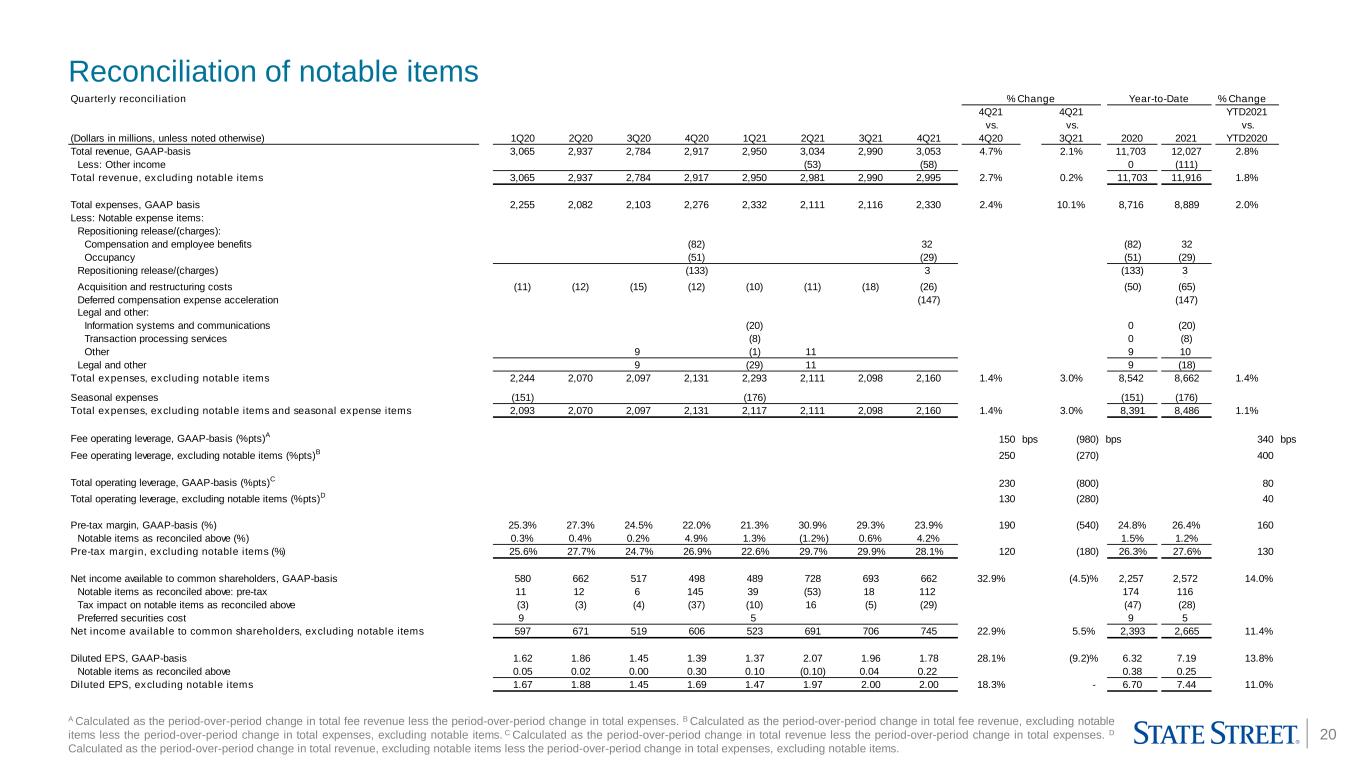
Notable items (pre-tax)$(112)$(18)$(145)
EPS impact$(0.22)$(0.04)$(0.30)
Deferred compensation expense acceleration of $147 million is associated with an amendment of certain outstanding deferred cash incentive compensation awards(b)
To make State Street's pay practices more competitive, the acceleration is part of a plan to increase the immediate cash versus the deferred portion of total cash incentive compensation in future periods
Gain on sale of $58 million reflects a one-time sale of Libor and Euribor based securities previously classified as held-to-maturity

Operating leverage and pre-tax margin
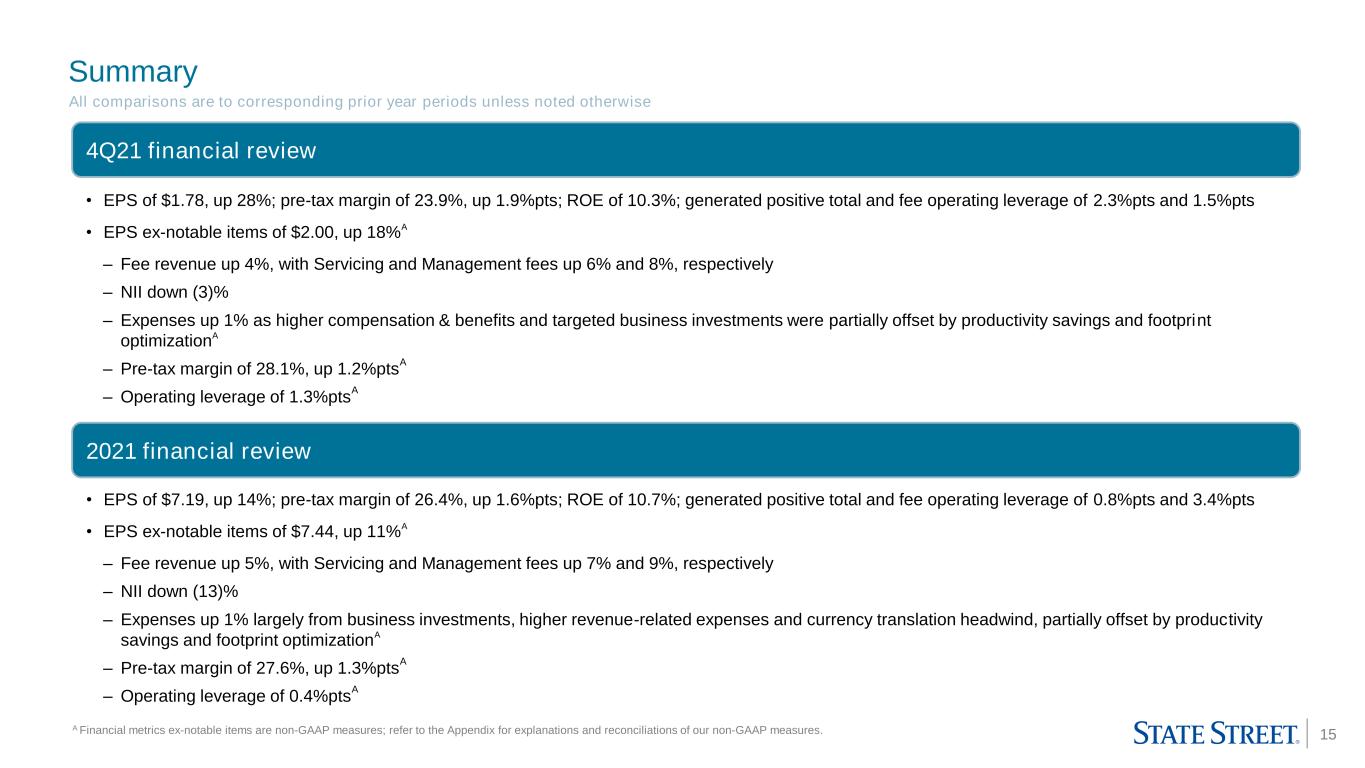
Generated positive total and fee operating leverage in 4Q21 of 2.3% points and 1.5% points, respectively
Excluding notable items, total and fee operating leverage in 4Q21 was 1.3% points and 2.5% points, respectively(a)
Pre-tax margin increased 1.9% points
Excluding notable items, pre-tax margin increased 1.2% points(a)

Capital
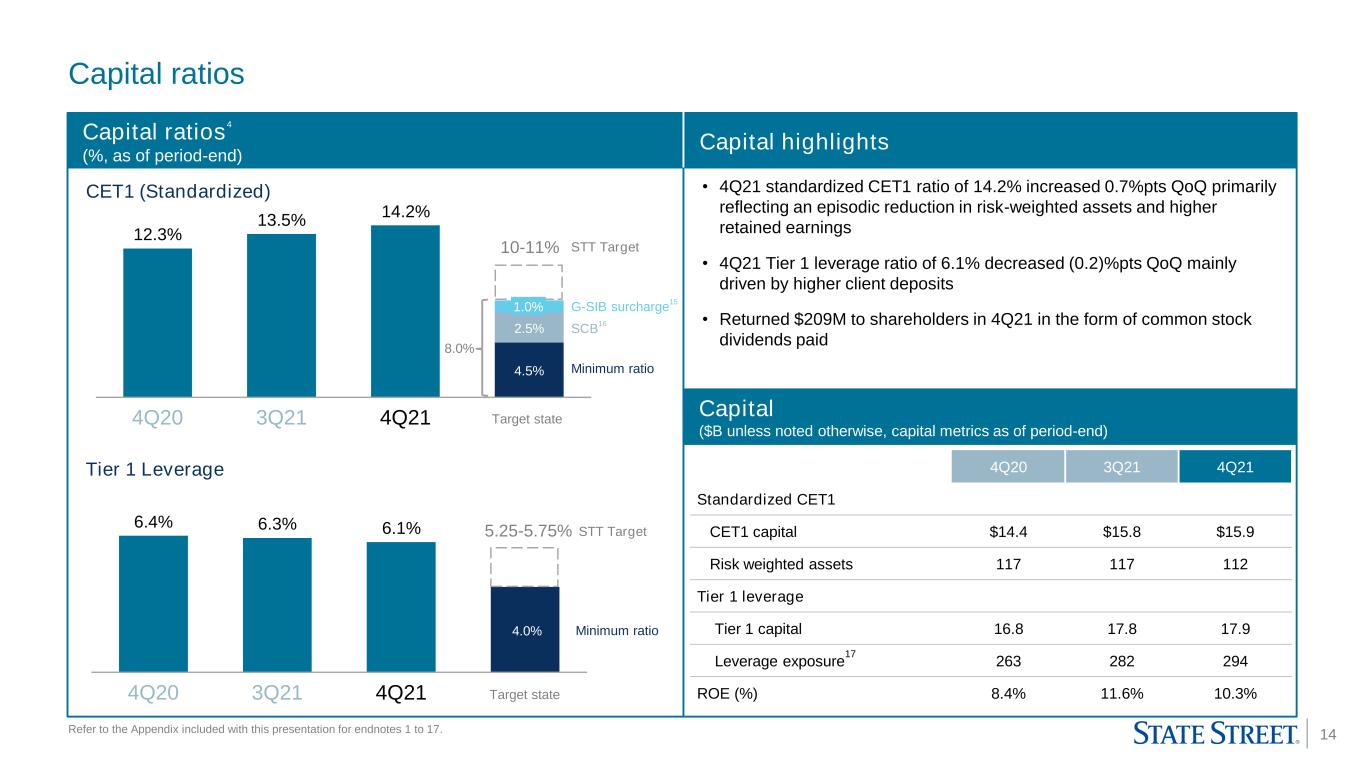
Standardized Common Equity Tier 1 (CET1) of 14.2% increased 1.9% points and 0.7% point compared to 4Q20 and 3Q21, respectively
Tier 1 leverage ratio of 6.1% decreased (0.3)% point and (0.2)% point compared to 4Q20 and 3Q21, respectively
ROE of 10.3% increased 1.9% points compared to 4Q20, but decreased (1.3)% points compared to 3Q21
In 4Q21, State Street returned a total of $209 million of capital to shareholders in the form of common stock dividends paid

(a)
Results excluding notable items and/or currency translation impact are non-GAAP measures. Please refer to the Addendum included with this news release for an explanation and reconciliation of non-GAAP measures.
(b) This amendment removes continued service requirements for deferred cash incentive awards, thereby accelerating the future expense that would have been recognized over the remaining term of the awards (1-4 years).
3

                    
MARKET DATA
The following table provides a summary of selected financial information, including market indices and foreign exchange rates.
(Dollars in billions, except market indices and foreign exchange rates)4Q213Q214Q20 % QoQ % YoY
Assets under Custody and/or Administration (AUC/A)(1)(2)
$43,678 $43,337 $38,791 0.8 %12.6 %
Assets under Management (AUM)(2)
4,138 3,862 3,467 7.1 19.4 
Market Indices:(3)
S&P 500 Daily Average4,602 4,422 3,555 4.1 29.5 
S&P 500 EOP4,766 4,308 3,756 10.6 26.9 
MSCI EAFE Daily Average2,310 2,338 1,994 (1.2)15.8 
MSCI EAFE EOP2,336 2,281 2,148 2.4 8.8 
MSCI Emerging Markets Daily Average1,252 1,295 1,189 (3.3)5.3 
MSCI Emerging Markets EOP1,232 1,253 1,291 (1.7)(4.6)
Barclays Capital Global Aggregate Bond Index EOP532 536 559 (0.7)(4.8)
Foreign Exchange Volatility Indices:(3)
JPM G7 Volatility Index Daily Average6.5 6.0 7.3 8.3 (11.0)
JPM Emerging Market Volatility Index Daily Average9.9 8.7 10.8 13.8 (8.3)
Average Foreign Exchange Rate:
EUR vs. USD1.143 1.179 1.193 (3.1)(4.2)
GBP vs. USD1.348 1.378 1.321 (2.2)2.0 
(1) Includes assets under custody of $32,845 billion, $32,364 billion, and $29,052 billion, as of EOP for 4Q21, 3Q21, and 4Q20, respectively.
(2) As of period-end.
(3) The index names listed in the table are service marks of their respective owners.


INDUSTRY FLOW DATA
The following table represents industry flow data.
(Dollars in billions)4Q213Q212Q211Q214Q20
North America - (US Domiciled) Morningstar Direct Market Data:(1)(2)
Long Term Funds$53 $150 $196 $165 $74 
Money Market219 15 33 156 (82)
ETF195 77 123 148 120 
Total Flows(3)
$468 $242 $351 $470 $112 
EMEA - Morningstar Direct Market Data:(1)(4)
Long Term Funds$146 $192 $226 $237 $250 
Money Market49 (4)(10)(91)59 
ETF42 37 51 54 48 
Total Flows(3)
$237 $225 $267 $200 $357 
(1) Industry data is provided for illustrative purposes only. It is not intended to reflect State Street or its clients' activity and is indicative of only segments of the entire industry. Industry flow data presented reflects a change in data providers from previous presentations for all periods presented. See endnotes included in the "In This News Release" section.
(2) 4Q21 data for North America includes actuals for October and November 2021 and Morningstar estimates for December 2021.
(3) Line items may not sum to total due to rounding.
(4) 4Q21 data for Europe is on a rolling three month basis for September 2021 through November 2021, sourced by Morningstar.
4

                    
INVESTMENT SERVICING AUC/A
The following table presents AUC/A information by product and financial instrument.
(Dollars in billions)4Q213Q214Q20 % QoQ % YoY
Assets Under Custody and/or Administration(1)(2)
By Product Classification(3):
Mutual funds$11,575 $11,505 $9,810 0.6 %18.0 %
Collective funds, including ETFs15,722 15,159 13,387 3.7 17.4 
Pension products8,443 8,497 7,594 (0.6)11.2 
Insurance and other products7,938 8,176 8,000 (2.9)(0.8)
Total Assets Under Custody and/or Administration$43,678 $43,337 $38,791 0.8 %12.6 %
By Financial Instrument:
Equities$25,974 $25,350 $21,626 2.5 %20.1 %
Fixed-income12,587 12,808 12,834 (1.7)(1.9)
Short-term and other investments5,117 5,179 4,331 (1.2)18.1 
Total Assets Under Custody and/or Administration$43,678 $43,337 $38,791 0.8 %12.6 %
(1) As of period-end.
(2) Consistent with past practice, AUC/A values for certain asset classes are based on a lag, typically one-month.
(3) Certain previously reported amounts presented have been reclassified to conform to current-period presentation.


INVESTMENT MANAGEMENT AUM
The following tables present 4Q21 activity in AUM by product category.
(Dollars in billions) EquityFixed- Income Cash Multi-Asset Class Solutions
Alternative Investments(1)
 Total
Beginning balance as of September 30, 2021
$2,440 $610 $367 $209 $236 $3,862 
Net asset flows:
Long-term institutional(2)
(1)11 28 
ETF46 — — (1)50 
Cash fund— — — — 
Total flows, net$53 $12 $— $$10 $79 
Market appreciation/(depreciation)189 208 
Foreign exchange impact(8)(3)— — — (11)
Total market and foreign exchange impact$181 $$$$$197 
Ending balance as of December 31, 2021
$2,674 $623 $368 $222 $251 $4,138 
(1) Includes real estate investment trusts, currency and commodities, including SPDR® Gold Shares and SPDR® Gold MiniSharesSM Trust, for which we are not the investment manager but act as the marketing agent.
(2) Amounts represent long-term portfolios, excluding ETFs.

(Dollars in billions)4Q213Q212Q211Q214Q20
Beginning balance$3,862 $3,897 $3,591 $3,467 $3,148 
Net asset flows:
Long-term institutional(1)
28 (6)55 (8)(71)
ETF50 13 21 23 20 
Cash fund(12)24 30 
Total flows, net$79 $(5)$83 $39 $(21)
Market appreciation/(depreciation)208 (12)224 116 306 
Foreign exchange impact(11)(18)(1)(31)34 
Total market and foreign exchange impact$197 $(30)$223 $85 $340 
Ending balance$4,138 $3,862 $3,897 $3,591 $3,467 
(1) Amounts represent long-term portfolios, excluding ETFs.
5

                    
REVENUE
(Dollars in millions)4Q213Q214Q20 % QoQ% YoY
Servicing fees$1,384 $1,395 $1,307 (0.8)%5.9 %
Management fees(a)
530 526 493 0.8 7.5 
Foreign exchange trading services(a)
300 279 324 7.5 (7.4)
Securities finance revenue102 106 88 (3.8)15.9 
Software and processing fees195 198 204 (1.5)(4.4)
Total fee revenue$2,511 $2,504 $2,416 0.3 %3.9 %
Net interest income484 487 499 (0.6)%(3.0)%
Other income58 (1)nmnm
Total Revenue$3,053 $2,990 $2,917 2.1 %4.7 %
Net interest margin (FTE)(b)
0.73 %0.76 %0.84 %(3)bps(11)bps

Servicing fees increased 6% compared to 4Q20, primarily driven by higher average equity market levels, client activity and flows, and net new business, partially offset by normal pricing headwinds. Servicing fees decreased (1)% compared to 3Q21, mainly due to client activity/adjustments and the impact of currency translation, partially offset by higher net new business.

Management fees(a) increased 8% compared to 4Q20, primarily reflecting higher average equity market levels and ETF net inflows, partially offset by a previously reported client asset reallocation and money market fee waivers. Management fees were up 1% compared to 3Q21, largely reflecting higher domestic average equity market levels.

Foreign exchange trading services(a) decreased (7)% compared to 4Q20, primarily reflecting lower FX volatility. Compared to 3Q21, Foreign exchange trading services increased 8%, mainly due to higher FX volatility, partially offset by lower client FX volumes.

Securities finance increased 16% compared to 4Q20, mainly reflecting higher client securities loan balances and new business wins in Enhanced Custody. Securities finance decreased (4)% compared to 3Q21, primarily driven by lower specials and agency spreads.

Software and processing fees decreased (4)% and (2)% compared to 4Q20 and 3Q21, respectively, mainly reflecting lower market-related adjustments, partially offset by higher CRD revenue.

Net interest income (NII) decreased (3)% compared to 4Q20, primarily driven by lower investment portfolio yields, partially offset by higher loan balances, growth in the investment portfolio and deposits. Compared to 3Q21, NII decreased (1)%, mainly due to the absence of a larger than usual reduction in premium amortization in 3Q21, partially offset by higher loan balances.

Other income of $58 million, reflecting a gain on sale of investment securities from a one-time sale of Libor and Euribor based securities previously classified as held-to-maturity.

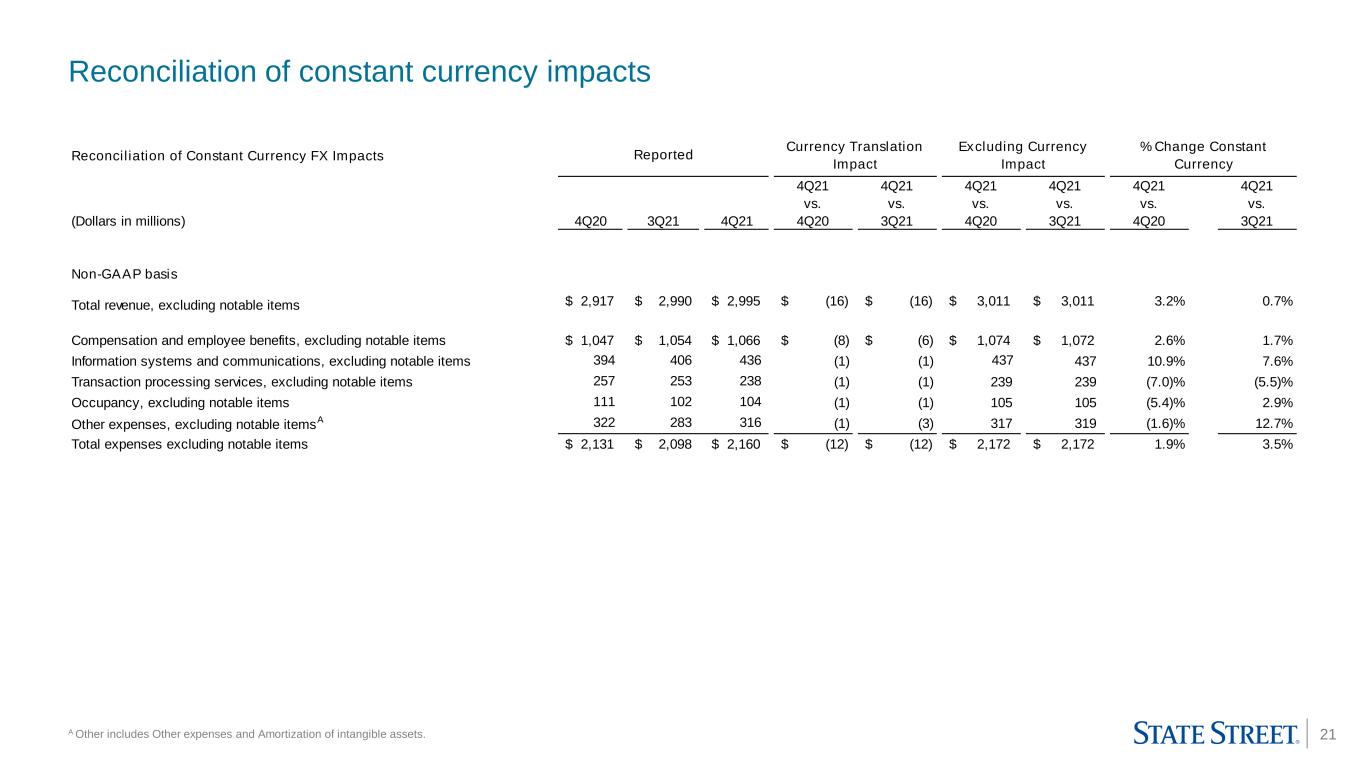
Total revenues were adversely impacted by currency translation by $16 million when compared to both 4Q20 and 3Q21.


(a)
Certain fees associated with our GLD ETFs have been reclassified from Foreign exchange trading services to Management fees to better reflect the nature of those fees. Prior periods have been reclassified to conform to current-period presentation. These fees were approximately $15 million, $19 million, $24 million, and $23 million in the first, second, third and fourth quarters of 2020, respectively.
(b) Net Interest Margin (NIM) is presented on a fully taxable-equivalent (FTE) basis. Refer to the Addendum for reconciliations of our FTE-basis presentation.
6

                    
PROVISION FOR CREDIT LOSSES
(Dollars in millions)4Q213Q214Q20 % QoQ % YoY
Allowance for credit losses:
Beginning balance$117 $121 $153 (3.3)%(23.5)%
Provision for credit losses(7)(2)— nmnm
Charge-offs— (1)(8)nmnm
Other(1)
(2)(1)100.0nm
Ending Balance$108 $117 $148 (7.7)%(27.0)%
(1) Consists primarily of currency translation

Total provision for credit losses reflects a $7 million reserve release in 4Q21.

EXPENSES
(Dollars in millions)4Q213Q214Q20 % QoQ % YoY
Compensation and employee benefits$1,181$1,054$1,12912.0 %4.6 %
Information systems and communications4364063947.4 10.7 
Transaction processing services238253257(5.9)(7.4)
Occupancy13310216230.4 (17.9)
Acquisition and restructuring costs26181244.4 116.7 
Amortization of other intangible assets626259— 5.1 
Other25422126314.9 (3.4)
Total Expenses$2,330$2,116$2,27610.1 %2.4 %
Total expenses, excluding notable items(a)
$2,160$2,098$2,1313.0 %1.4 %
Effective tax rate4.6 %18.5 %16.1 %(1,390)bps(1,150)bps

Compensation and employee benefits increased 5% compared to 4Q20, primarily driven by the impact of notable items in 4Q21(a) and higher incentive compensation and medical costs, partially offset by lower headcount and salaries. Compensation and employee benefits increased 12% compared to 3Q21, primarily reflecting the impact of notable items in 4Q21.(a)

Information systems and communications increased 11% and 7% compared to 4Q20 and 3Q21, respectively, mainly reflecting higher technology infrastructure investments and equipment expenses.

Transaction processing services decreased (7)% compared to 4Q20, largely driven by lower market data costs and broker fees. Transaction processing decreased (6)% compared to 3Q21, primarily driven by lower sub-custody expenses from savings initiatives and lower broker fees.

Occupancy decreased (18)% compared to 4Q20, primarily due to footprint optimization and lower notable items in 4Q21.(a) Occupancy increased 30% compared to 3Q21, primarily reflecting the impact of notable items in 4Q21.(a)

Acquisition and restructuring costs increased compared to both 4Q20 and 3Q21, primarily due to costs associated with the CRD acquisition.

Amortization of other intangible assets increased 5% compared to 4Q20, due to a lift-out in 1Q21.(b)


(a)
See "4Q21 Highlights" in this news release for a listing of notable items. Results excluding notable items and/or currency translation impact are non-GAAP measures. Please refer to the Addendum included with this news release for an explanation and reconciliation of non-GAAP measures.
(b) Related to a lift-out of the depository bank and fund administrator activities of Fideuram Bank Luxembourg, a subsidiary of Intesa Sanpaolo.
7

                    
Other expenses decreased (3)% compared to 4Q20, largely reflecting lower sub-advisory fees and professional fees. Other expenses increased 15% compared to 3Q21, largely reflecting higher marketing spend.

Total expenses were positively impacted by currency translation by $12 million when compared to both 4Q20 and 3Q21.

TAXES
The effective tax rate of 4.6% decreased compared to both 4Q20 and 3Q21, primarily due to discrete benefits from the completion of tax audits, foreign tax benefits, and tax return finalization.

CAPITAL AND LIQUIDITY
The following table presents preliminary estimates of regulatory capital and liquidity ratios for State Street Corporation.
(As of period end)4Q213Q214Q20
Basel III Standardized Approach:
Common Equity Tier 1 ratio14.2 %13.5 %12.3 %
Tier 1 capital ratio15.9 15.2 14.4 
Total capital ratio17.4 16.6 15.3 
Basel III Advanced Approaches:
Common Equity Tier 1 ratio14.3 13.8 13.1 
Tier 1 capital ratio16.0 15.5 15.4 
Total capital ratio17.4 16.9 16.2 
Tier 1 leverage ratio6.1 6.3 6.4 
Supplementary leverage ratio7.4 7.5 8.1 
Liquidity coverage ratio105 %105 %108 %

Standardized capital ratios were binding for all periods included above.

CET1 ratio (standardized) increased 1.9% points compared to 4Q20, largely reflecting higher retained earnings and the issuance of $1.9 billion of common stock in 3Q21 to finance the previously announced proposed acquisition of BBH Investor Services. CET1 ratio (standardized) increased 0.7% point compared to 3Q21, largely reflecting an episodic reduction in risk-weighted assets and higher retained earnings.

Tier 1 leverage ratio decreased (0.3)% point and (0.2)% point compared to 4Q20 and 3Q21, respectively.

Liquidity coverage ratio (LCR) for State Street Corporation was approximately 105%, down (3)% points from 4Q20 and flat to 3Q21. LCR for State Street Bank and Trust was approximately 129%.
8

                    
INVESTOR CONFERENCE CALL AND QUARTERLY WEBSITE DISCLOSURE
State Street will webcast an investor conference call today, Wednesday, January 19, 2022, at 10:00 a.m. ET, available at http://investors.statestreet.com/. The conference call will also be available via telephone, at (833) 380-0399 or (236) 714-2093. The Conference ID# is 6314319.

Recorded replays of the conference call will be available on the website and by telephone at (800) 585-8367 or (416) 621-4642 beginning approximately two hours after the call's completion. The Conference ID# is 6314319.

The telephone replay will be available for approximately two weeks following the conference call. This News Release, presentation materials referred to on the conference call and additional financial information are available on State Street's website, at http://investors.statestreet.com/ under “Investor Relations--Investor News & Events" and under the title “Events and Presentations".

State Street intends to publish updates to its public disclosure regarding regulatory capital, as required by the Basel III final rule, and the liquidity coverage ratio, on a quarterly basis on its website at
http:// investors.statestreet.com/, under "Filings & Reports." Those updates will be published each quarter, during the period beginning after State Street's public announcement of its quarterly results of operations and ending on or prior to the due date under applicable bank regulatory requirements (i.e., ordinarily, ending no later than 60 days following year-end or 45 days following each other quarter-end, as applicable). For 4Q21, State Street expects to publish its updates during the period beginning today and ending on or about February 28, 2022.

State Street Corporation (NYSE: STT) is one of the world's leading providers of financial services to institutional investors including investment servicing, investment management and investment research and trading. With $43.7 trillion in assets under custody and/or administration and $4.1 trillion* in assets under management as of December 31, 2021, State Street operates globally in more than 100 geographic markets and employs approximately 39,000 worldwide. For more information, visit State Street's website at www.statestreet.com.
* Assets under management as of December 31, 2021 includes approximately $61 billion of assets with respect to SPDR® products for which State Street Global Advisors Funds Distributors, LLC (SSGA FD) acts solely as the marketing agent. SSGA FD and State Street Global Advisors are affiliated.
9

                    
IN THIS NEWS RELEASE:
Expenses and other measures are sometimes presented excluding notable items/effects of currency translation. This is a non-GAAP presentation. See the Addendum to this News Release for an explanation and reconciliations of our non-GAAP measures.
New asset servicing mandates, including announced front-to-back investment servicing clients, may be subject to completion of definitive agreements, approval of applicable boards and shareholders and customary regulatory approvals. New asset servicing mandates and servicing assets remaining to be installed in future periods exclude new business which has been contracted, but for which the client has not yet provided permission to publicly disclose and is not yet installed. These excluded assets, which from time to time may be significant, will be included in new asset servicing mandates and reflected in servicing assets remaining to be installed in the period in which the client provides its permission. Servicing mandates and servicing assets remaining to be installed in future periods are presented on a gross basis and therefore also do not include the impact of clients who have notified us during the period of their intent to terminate or reduce their relationship with State Street, which from time to time may be significant.
New business in assets to be serviced is reflected in our AUC/A after we begin servicing the assets, and new business in assets to be managed is reflected in our AUM after we begin managing the assets. As such, only a portion of any new asset servicing and asset management mandates may be reflected in our AUC/A and AUM as of any particular date specified. Consistent with past practice, AUC/A values for certain asset classes are based on a lag, typically one-month. Generally, our servicing fee revenues are affected by several factors, including changes in market valuations, client activity and asset flows, net new business and the manner in which we price our services. We provide a range of services to our clients, including core custody services, accounting, reporting and administration and middle office services, and the nature and mix of services provided affects our servicing fees. The basis for fees will differ across regions and clients. The industry in which we operate has historically faced pricing pressure, and our servicing fee revenues are also affected by such pressures today. Consequently, no assumption should be drawn as to future revenue run rate from announced servicing wins or new servicing business yet to be installed, as the amount of revenue associated with AUC/A can vary materially. Management fees generally are affected by our level of AUM and differ based upon the nature, type and investment strategy of the investment product. Management fee revenue is more sensitive to market valuations than servicing fee revenue, as a higher proportion of the underlying services provided, and the associated management fees earned, are dependent on equity and fixed-income security valuations. Additional factors, such as the relative mix of assets managed, may have a significant effect on our management fee revenue. While certain management fees are directly determined by the values of AUM and the investment strategies employed, management fees may reflect other factors, including performance fee arrangements, as well as our relationship pricing for clients.
CRD bookings, as presented in this News Release, represent signed annual recurring revenue contract value excluding bookings with affiliates, including SSGA. CRD revenue derived from affiliate agreements is eliminated in consolidation for financial reporting purposes.
CRD annual recurring revenue (ARR), an operating metric, is calculated by annualizing current quarter revenue and includes annualized amount of most software-enabled revenue, including revenue generated from Software-as-a-service, maintenance and support revenue, revenue from the Charles River Network's FIX Network Service (CRN), and value-added services, which are all expected to be recognized ratably over the term of client contracts. ARR excludes software-enabled brokerage revenue. ARR of $223 million, $239 million, and $244 million in 4Q20, 3Q21, and 4Q21, respectively, includes annualized intercompany revenues of $21 million for each of the corresponding periods.
Revenue and pre-tax income reflects the application of ASC 606. Revenue recognition under ASC 606 results in the acceleration of a significant portion of revenues for on-premises software agreements when a client goes live or renews their contract with us. The amount of revenue recognized in any given quarter will be driven in large part by client activity, including agreements that renew or are installed in that quarter.
Unless otherwise noted, all capital ratios referenced on this News Release and elsewhere in this presentation refer to State Street Corporation, or State Street, and not State Street Bank and Trust Company, or State Street Bank. The lower of capital ratios calculated under the Basel III advanced approaches and under the Basel III standardized approach are applied in the assessment of our capital adequacy for regulatory purposes. Standardized ratios were binding for 4Q21. Refer to the Addendum included with this News Release for additional information. All capital ratios are estimated. Liquidity Coverage Ratio (LCR) is a preliminary estimate based on a quarterly daily average.
All earnings per share amounts represent fully diluted earnings per common share.
Return on average common shareholders' equity is determined by dividing annualized net income available to common equity by average common shareholders' equity for the period.
Quarter-over-quarter (QoQ) is a sequential quarter comparison. Year-on-year (YoY) is the current period compared to the same period a year ago.
"AUC/A" denotes Assets Under Custody and/or Administration; "AUC" denotes Assets Under Custody; "AUM" denotes Assets Under Management; "nm" denotes not meaningful; "EOP" denotes end of period.
"Libor" denotes London Inter-Bank Offered Rate; "Euribor" denotes Euro Inter-Bank Offered Rate.
10

                    
"FTE" denotes fully taxable-equivalent basis; NIM is presented on an FTE-basis. Refer to the Addendum for reconciliations of our FTE-basis presentation.
Industry data is provided for illustrative purposes only. It is not intended to reflect State Street's or its clients' activity and is indicative of only selected segments of the entire industry.
Morningstar data includes long-term mutual funds, ETF’s and Money Market funds. Mutual fund data represents estimates of net new cash flow, which is new sales minus redemptions combined with net exchanges, while ETF data represents net issuance, which is gross issuance less gross redemptions. Data for Fund of Funds, Feeder funds and Obsolete funds were excluded from the series to prevent double counting. Data is from the Morningstar Direct Asset Flows database.
The long-term fund flows reported by Morningstar in North America are composed of US domiciled Market flows mainly in Equities, Allocation and Fixed Income asset classes. 4Q21 data for North America (US domiciled) includes Morningstar actuals for October and November 2021 and Morningstar estimates for December 2021.
The long-term funds flows reported by Morningstar direct in EMEA are composed of the European market flows mainly in Equities, Allocation and Fixed Incomes asset classes. 4Q21 data for Europe is on a rolling three month basis for September 2021 through November 2021, sourced by Morningstar.
11

                    
FORWARD LOOKING STATEMENTS
This News Release (and the conference call referenced herein) contains forward-looking statements within the meaning of United States securities laws, including statements about our goals and expectations regarding our business, financial and capital condition, results of operations, strategies, the financial and market outlook, proposed acquisition of the Brown Brothers Harriman (BBH) Investor Services business, dividend and stock purchase programs, governmental and regulatory initiatives and developments, expense reduction programs, new client business, and the business environment. Forward-looking statements are often, but not always, identified by such forward-looking terminology as “outlook,” "intend," "target," “guidance,” “expect,” “priority,” “objective,” “plan,” “forecast,” “believe,” “anticipate,” “estimate,” “seek,” “may,” “will,” “trend,” “strategy” and “goal,” or similar statements or variations of such terms. These statements are not guarantees of future performance, are inherently uncertain, are based on current assumptions that are difficult to predict and involve a number of risks and uncertainties. Therefore, actual outcomes and results may differ materially from what is expressed in those statements, and those statements should not be relied upon as representing our expectations or beliefs as of any time subsequent to the time this News Release is first issued.
Important factors that may affect future results and outcomes include, but are not limited to:
The possibility that some or all of the anticipated business, financial, capital, staffing, operational or other benefits or synergies of the acquisition of the BBH Investor Services business will not be realized when expected or at all, including as a result of the impact of, additional costs or unanticipated negative synergies associated with, or problems arising from, the integration of the BBH Investor Services business (including challenges in transitioning clients, systems, technology or personnel), as a result of regulatory or operational challenges we may experience, as a result of disruptions from the transaction harming relationships (including those resulting from the announcement of the transaction) with our clients, employees or regulators, or as a result of the strength of the economy and competitive factors in the areas where we and the BBH Investor Services business do business;
The failure to obtain necessary regulatory approvals (and the risk that such approvals may result in the imposition of conditions that could adversely affect us or the expected benefits of the transaction, perhaps materially), to satisfy any of the other conditions to the acquisition or at all, in each case, on a timely basis or at all; and, if delayed, the resulting effects, including in magnitude and timing of the expected financial benefits of the acquisition of the BBH Investor Services business, of a delayed closing of the acquisition;
The occurrence of any event, change or other circumstances that could give rise to the termination of the definitive purchase agreement in respect of the acquisition of the BBH Investor Services business;
Potential adverse changes in demand for the products and services of State Street and of the BBH Investor Services business;
We are subject to intense competition, which could negatively affect our profitability;
We are subject to significant pricing pressure and variability in our financial results and our AUC/A and AUM;
Our development and completion of new products and services, including State Street Alpha and State Street Digital, and our enhancement of the capabilities of our existing products and services in light of changed client needs and competitive pressures, may involve costs and dependencies and expose us to increased risk;
Our business may be negatively affected by our failure to update and maintain our technology infrastructure;
Acquisitions, strategic alliances, joint ventures and divestitures, and the integration, retention and development of the benefits of our acquisitions, pose risks for our business;
The COVID-19 pandemic continues to create significant risks and uncertainties for our business;
Competition for qualified members of our workforce is intense, and we may not be able to attract and retain the highly skilled people we need to support our business;
We could be adversely affected by geopolitical, economic and market conditions;
We have significant International operations, and disruptions in European and Asian economies could have an adverse effect on our consolidated results of operations or financial condition;
Our investment securities portfolio, consolidated financial condition and consolidated results of operations could be adversely affected by changes in the financial markets;
Our business activities expose us to interest rate risk;
We assume significant credit risk to counterparties, who may also have substantial financial dependencies with other financial institutions, and these credit exposures and concentrations could expose us to financial loss;
Our fee revenue represents a significant portion of our consolidated revenue and is subject to decline based on, among other factors, the investment activities of our clients;
If we are unable to effectively manage our capital and liquidity, our consolidated financial condition, capital ratios, results of operations and business prospects could be adversely affected;
12

                    
We may need to raise additional capital or debt in the future, which may not be available to us or may only be available on unfavorable terms;
If we experience a downgrade in our credit ratings, or an actual or perceived reduction in our financial strength, our borrowing and capital costs, liquidity and reputation could be adversely affected;
Our business and capital-related activities, including common share repurchases, may be adversely affected by capital and liquidity standards required as a result of capital stress testing;
We face extensive and changing government regulation in the jurisdictions in which we operate, which may increase our costs and compliance risks;
We are subject to enhanced external oversight as a result of the resolution of prior regulatory or governmental matters;
Our businesses may be adversely affected by government enforcement and litigation;
Any misappropriation of the confidential information we possess could have an adverse impact on our business and could subject us to regulatory actions, litigation and other adverse effects;
Our calculations of risk exposures, total RWA and capital ratios depend on data inputs, formulae, models, correlations and assumptions that are subject to change, which could materially impact our risk exposures, our total RWA and our capital ratios from period to period;
Changes in accounting standards may adversely affect our consolidated financial statements;
Changes in tax laws, rules or regulations, challenges to our tax positions and changes in the composition of our pre-tax earnings may increase our effective tax rate;
The transition away from LIBOR may result in additional costs and increased risk exposure;
Our control environment may be inadequate, fail or be circumvented, and operational risks could adversely affect our consolidated results of operations;
Cost shifting to non-U.S. jurisdictions and outsourcing may expose us to increased operational risk and reputational harm and may not result in expected cost savings;
Attacks or unauthorized access to our information technology systems or facilities, or those of the third parties with which we do business, or disruptions to our or their continuous operations, could result in significant costs, reputational damage and impacts on our business activities;
Long-term contracts expose us to pricing and performance risk;
Our businesses may be negatively affected by adverse publicity or other reputational harm;
We may not be able to protect our intellectual property;
The quantitative models we use to manage our business may contain errors that could result in material harm;
Our reputation and business prospects may be damaged if our clients incur substantial losses or are restricted in redeeming their interests in investment pools that we sponsor or manage;
The impacts of climate change could adversely affect us; and
We may incur losses as a result of unforeseen events including terrorist attacks, natural disasters, the emergence of a new pandemic or acts of embezzlement.
Other important factors that could cause actual results to differ materially from those indicated by any forward-looking statements are set forth in our 2020 Annual Report on Form 10-K and our subsequent SEC filings. We encourage investors to read these filings, particularly the sections on risk factors, for additional information with respect to any forward-looking statements and prior to making any investment decision. The forward-looking statements contained in this News Release (and the conference call referenced herein) should not by relied on as representing our expectations or beliefs as of any time subsequent to the time this News Release is first issued, and we do not undertake efforts to revise those forward-looking statements to reflect events after that time.
13
                                
Exhibit 99.2
STATE STREET CORPORATION
EARNINGS RELEASE ADDENDUM
December 31, 2021
Table of Contents
GAAP-Basis Financial Information:
5-Year Summary of Results2
Consolidated Financial Highlights3
Consolidated Results of Operations4
Consolidated Statement of Condition6
Average Statement of Condition - Rates Earned and Paid - Fully Taxable-Equivalent Basis7
Average Statement of Condition - Rates Earned and Paid - Fully Taxable-Equivalent Basis - Year-to-Date8
Investment Portfolio Holdings by Asset Class9
Investment Portfolio Non-U.S. Investments11
Assets Under Custody and/or Administration12
Assets Under Management13
Industry Flow Data by Asset Class14
Line of Business Information15
Allowance for Credit Losses16
Non-GAAP Financial Information:
Reconciliations of Non-GAAP Financial Information17
Reconciliation of Pre-tax Margin Excluding Notable Items20
Reconciliation of Notable Items21
Reconciliations of Constant Currency FX Impacts22
Capital:
Reconciliation of Tangible Common Equity Ratio23
Regulatory Capital24
Reconciliations of Supplementary Leverage Ratios25
This financial information should be read in conjunction with State Street's news release dated January 19, 2022.


STATE STREET CORPORATION
EARNINGS RELEASE ADDENDUM
5-YEAR SUMMARY OF RESULTS
(Dollars in millions, except per share amounts, or where otherwise noted)20172018201920202021
Year ended December 31:
Total fee revenue$9,001 $9,454 $9,147 $9,499 $10,012 
Net interest income2,304 2,671 2,566 2,200 1,905 
Other income(39)43 110 
Total revenue11,266 12,131 11,756 11,703 12,027 
Provision for credit losses15 10 88 (33)
Total expenses8,269 9,015 9,034 8,716 8,889 
Income before income tax expense2,995 3,101 2,712 2,899 3,171 
Income tax expense839 508 470 479 478 
Net income2,156 2,593 2,242 2,420 2,693 
Net income available to common shareholders$1,972 $2,404 $2,009 $2,257 $2,572 
Per common share:
Diluted earnings per common share$5.19 $6.39 $5.38 $6.32 $7.19 
Average diluted common shares outstanding (in thousands)380,213 376,476 373,666 357,106 357,962 
Cash dividends declared per common share$1.60 $1.78 $1.98 $2.08 $2.18 
Closing price per share of common stock (at year end)97.61 63.07 79.10 72.78 93.00 
Average balance sheet:
Investment securities$95,779 $88,070 $91,768 $109,175 $111,730 
Total assets219,450 223,385 223,334 269,334 299,743 
Total deposits163,808 161,408 158,262 193,225 235,404 
Ratios and other metrics:
Return on average common equity10.5 %12.1 %9.4 %10.0 %10.7 %
Pre-tax margin26.6 25.6 23.1 24.8 26.4 
Pre-tax margin, excluding notable items(1)
28.7 28.8 25.8 26.3 27.6 
Net interest margin, fully taxable-equivalent basis1.29 1.47 1.42 0.97 0.74 
Common equity tier 1 ratio(2)(3)(4)
11.9 11.7 11.7 12.3 14.2 
Tier 1 capital ratio(2)(3)(4)
15.0 15.5 14.5 14.4 15.9 
Total capital ratio(2)(3)(4)
16.0 16.3 15.6 15.3 17.4 
Tier 1 leverage ratio(2)(3)
7.3 7.2 6.9 6.4 6.1 
Supplementary leverage ratio(2)(3)
6.5 6.3 6.1 8.1 7.4 
Assets under custody and/or administration (in trillions)$33.12 $31.62 $34.36 $38.79 $43.68 
Assets under management (in trillions)2.78 2.51 3.12 3.47 4.14 
(1) Notable items include acquisition and restructuring costs, repositioning charges and legal and other notable items. Refer to Reconciliations of pre-tax margin excluding notable items for details.
(2) The capital ratios presented are calculated in conformity with the applicable regulatory guidance in effect as of each period end. Effective January 1, 2018, the applicable final rules are in effect and the ratios are calculated based on fully phased-in CET1, tier 1, total capital and supplementary leverage numbers. We did not revise previously-filed reported capital metrics and ratios.
(3) Under the applicable bank regulatory rules, we are not required to and, accordingly, did not revise previously-filed reported capital metrics and ratios following the change in accounting for LIHTC.
(4) The reportable ratios represent the lower of each of the risk-based capital ratios under both the Standardized Approach and the Advanced Approaches.
2    

                                
STATE STREET CORPORATION
EARNINGS RELEASE ADDENDUM
CONSOLIDATED FINANCIAL HIGHLIGHTS
Quarters% Change
(Dollars in millions, except per share amounts, or where otherwise noted)1Q202Q203Q204Q201Q212Q213Q214Q214Q21
vs.
4Q20
4Q21
vs.
3Q21
Income statement
Fee revenue$2,399 $2,378 $2,306 $2,416 $2,483 $2,514 $2,504 $2,511 3.9 %0.3 %
Net interest income664 559 478 499 467 467 487 484 (3.0)(0.6)
Other income— — — 53 (1)58 nmnm
Total revenue3,065 2,937 2,784 2,917 2,950 3,034 2,990 3,053 4.7 2.1 
Provision for credit losses(1)
36 52 — — (9)(15)(2)(7)nmnm
Total expenses2,255 2,082 2,103 2,276 2,332 2,111 2,116 2,330 2.4 10.1 
Income before income tax expense774 803 681 641 627 938 876 730 13.9 (16.7)
Income tax expense140 109 126 104 108 175 162 33 (68.3)(79.6)
Net income634 694 555 537 519 763 714 697 29.8 (2.4)
Net income available to common shareholders$580 $662 $517 $498 $489 $728 $693 $662 32.9 (4.5)
Per common share:
Diluted earnings per common share$1.62 $1.86 $1.45 $1.39 $1.37 $2.07 $1.96 $1.78 28.1 (9.2)
Average diluted common shares outstanding (in thousands)357,993 356,413 357,168 357,719 355,690 351,582 353,494 371,685 3.9 5.1 
Cash dividends declared per common share$.52 $.52 $.52 $.52 $.52 $.52 $.57 $.57 9.6 — 
Closing price per share of common stock (as of quarter end)53.27 63.55 59.33 72.78 84.01 82.28 84.72 93.00 27.8 9.8 
Average for the quarter:
Investment securities$97,560 $116,626 $110,448 $112,018 $107,809 $111,481 $113,635 $113,906 1.7 0.2 
Total assets251,181 284,688 264,384 277,055 296,328 308,195 291,459 303,007 9.4 4.0 
Total deposits180,160 197,069 189,226 206,343 226,232 242,310 233,266 239,680 16.2 2.7 
Securities on loan:
Average securities on loan$378,200 $377,344 $375,296 $404,022 $429,991 $457,604 $418,111 $412,403 2.1 (1.4)
End-of-period securities on loan 387,580 381,232 395,075 457,985 451,913 437,094 417,142 400,940 (12.5)(3.9)
Ratios and other metrics:
Return on average common equity10.9 %12.1 %8.9 %8.4 %8.4 %12.6 %11.6 %10.3 %190 bps(130)bps
Pre-tax margin25.3 27.3 24.5 22.0 21.3 30.9 29.3 23.9 190 (540)
Pre-tax margin, excluding notable items(2)
25.6 27.7 24.7 26.9 22.6 29.7 29.9 28.1 120 (180)
Net interest margin, fully taxable-equivalent basis1.30 0.93 0.85 0.84 0.75 0.71 0.76 0.73 (11)(3)
Common equity tier 1 ratio(3)(4)
10.7 12.3 12.4 12.3 10.8 11.2 13.5 14.2 190 70 
Tier 1 capital ratio(3)(4)
12.9 14.6 14.7 14.4 12.4 12.9 15.2 15.9 150 70 
Total capital ratio(3)(4)
14.1 15.7 15.7 15.3 14.0 14.3 16.6 17.4 210 80 
Tier 1 leverage ratio(3)
6.1 6.1 6.6 6.4 5.4 5.2 6.3 6.1 (30)(20)
Supplementary leverage ratio(3)
5.4 8.3 8.2 8.1 7.2 6.7 7.5 7.4 (70)(10)
Assets under custody and/or administration (in billions)$31,864 $33,515 $36,643 $38,791 $40,263 $42,597 $43,337 $43,678 12.6 %0.8 %
Assets under management (in billions)2,689 3,054 3,148 3,467 3,591 3,897 3,862 4,138 19.4 7.1 
(1) In accordance with ASU 2016-13, the provision for credit losses includes the provision on funded and unfunded commitments as well as investment securities.
(2) Notable items include acquisition and restructuring costs, repositioning charges and legal and other notable items. Refer to Reconciliations of pre-tax margin excluding notable items for details.
(3) The capital ratios presented are calculated in conformity with the applicable regulatory guidance in effect as of each period end. Capital ratios as of December 31, 2021 are estimates.
(4) The reportable ratios represent the lower of each of the risk-based capital ratios under both the Standardized Approach and the Advanced Approaches. Refer to Regulatory Capital for details on Standardized and Advanced Approaches ratios.
nm Denotes not meaningful
3    


STATE STREET CORPORATION
EARNINGS RELEASE ADDENDUM
CONSOLIDATED RESULTS OF OPERATIONS
Quarters% ChangeYear-to-Date% Change
(Dollars in millions, except per share amounts, or where otherwise noted)1Q202Q203Q204Q201Q212Q213Q214Q214Q21
vs.
4Q20
4Q21
vs.
3Q21
20202021YTD2021
vs.
YTD2020
Fee revenue:
Servicing fees$1,287 $1,272 $1,301 $1,307 $1,371 $1,399 $1,395 $1,384 5.9 %(0.8)%$5,167 $5,549 7.4 %
Management fees(1)
464 444 479 493 493 504 526 530 7.5 0.8 1,880 2,053 9.2 
Foreign exchange trading services(1)
444 325 270 324 346 286 279 300 (7.4)7.5 1,363 1,211 (11.2)
Securities finance92 92 84 88 99 109 106 102 15.9 (3.8)356 416 16.9 
Software and processing fees112 245 172 204 174 216 198 195 (4.4)(1.5)733 783 6.8 
Total fee revenue2,399 2,378 2,306 2,416 2,483 2,514 2,504 2,511 3.9 0.3 9,499 10,012 5.4 
Net interest income:
Interest income868 674 520 513 471 467 487 483 (5.8)(0.8)2,575 1,908 (25.9)
Interest expense204 115 42 14 — — (1)(107.1)nm375 3 (99.2)
Net interest income664 559 478 499 467 467 487 484 (3.0)(0.6)2,200 1,905 (13.4)
Other income:
Gains (losses) related to investment securities, net— — — — (1)58 nmnm57 nm
Other income— — — — — 53 —  nmnm— 53 nm
Total other income— — — 53 (1)58 nmnm110 nm
Total revenue3,065 2,937 2,784 2,917 2,950 3,034 2,990 3,053 4.7 2.1 11,703 12,027 2.8 
Provision for credit losses36 52 — — (9)(15)(2)(7)nmnm88 (33)nm
Expenses:
Compensation and employee benefits1,208 1,051 1,062 1,129 1,242 1,077 1,054 1,181 4.6 12.0 4,450 4,554 2.3 
Information systems and communications385 376 395 394 421 398 406 436 10.7 7.4 1,550 1,661 7.2 
Transaction processing services254 233 234 257 270 263 253 238 (7.4)(5.9)978 1,024 4.7 
Occupancy109 109 109 162 109 100 102 133 (17.9)30.4 489 444 (9.2)
Acquisition and restructuring costs11 12 15 12 10 11 18 26 116.7 44.4 50 65 30.0 
Amortization of other intangible assets58 58 59 59 58 63 62 62 5.1 — 234 245 4.7 
Other230 243 229 263 222 199 221 254 (3.4)14.9 965 896 (7.2)
Total expenses2,255 2,082 2,103 2,276 2,332 2,111 2,116 2,330 2.4 10.1 8,716 8,889 2.0 
Income before income tax expense774 803 681 641 627 938 876 730 13.9 (16.7)2,899 3,171 9.4 
Income tax expense140 109 126 104 108 175 162 33 (68.3)(79.6)479 478 (0.2)
Net income$634 $694 $555 $537 $519 $763 $714 $697 29.8 (2.4)$2,420 $2,693 11.3 


4    


STATE STREET CORPORATION
EARNINGS RELEASE ADDENDUM
CONSOLIDATED RESULTS OF OPERATIONS (Continued)
Quarters% ChangeYear-to-Date% Change
(Dollars in millions, except per share amounts, or where otherwise noted)1Q202Q203Q204Q201Q212Q213Q214Q214Q21
vs.
4Q20
4Q21
vs.
3Q21
20202021YTD2021
vs.
YTD2020
Adjustments to net income:
Dividends on preferred stock(2)(3)
$(53)$(32)$(38)$(39)$(30)$(34)$(21)$(34)(12.8)%61.9 %$(162)$(119)(26.5)%
Earnings allocated to participating securities(1)— — — — (1)— (1)nmnm(1)(2)nm
Net income available to common shareholders$580 $662 $517 $498 $489 $728 $693 $662 32.9 (4.5)$2,257 $2,572 14.0 
Per common share:
Basic earnings$1.64 $1.88 $1.47 $1.41 $1.39 $2.11 $1.99 $1.81 28.4 (9.0)$6.40 $7.30 14.1 
Diluted earnings1.62 1.86 1.45 1.39 1.37 2.07 1.96 1.78 28.1 (9.2)6.32 7.19 13.8 
Average common shares outstanding (in thousands):
Basic353,746 352,157 352,586 352,974 350,743 345,889 347,718 365,798 3.6 5.2 352,865 352,565 (0.1)
Diluted357,993 356,413 357,168 357,719 355,690 351,582 353,494 371,685 3.9 5.1 357,106 357,962 0.2 
Cash dividends declared per common share $.52 $.52 $.52 $.52 $.52 $.52 $.57 $.57 9.6 — $2.08 $2.18 4.8 
Closing price per share of common stock (as of quarter end) 53.27 63.55 59.33 72.78 84.01 82.28 84.72 93.00 27.8 9.8 72.78 93.00 27.8 
Financial ratios:
Effective tax rate18.1 %13.6 %18.5 %16.1 %17.2 %18.6 %18.5 %4.6 %(1,150)bps(1,390)bps16.5 %15.1 %(140)bps
Return on average common equity10.9 12.1 8.9 8.4 8.4 12.6 11.6 10.3 190 (130)10.0 10.7 70 
Return on tangible common equity(4)
18.7 19.2 16.8 15.6 13.4 17.317.3 15.7 10 (160)

16.717.250 
Pre-tax margin25.3 27.3 24.5 22.0 21.3 30.9 29.3 23.9 190 (540)24.8 26.4 160 
Pre-tax margin, excluding notable items(5)

25.6

27.7

24.7

26.922.6 29.7 29.9 28.1 120 (180)

26.327.6130 
(1) Certain fees associated with our GLD ETFs have been reclassified from Foreign exchange trading services to Management fees to better reflect the nature of those fees. Prior periods have been reclassified to conform to current-period presentation. These fees were approximately $15 million, $19 million, $24 million and $23 million in the first, second, third and fourth quarters of 2020, respectively.
(2) We redeemed all outstanding Series C noncumulative perpetual preferred stock on March 15, 2020 at a redemption price of $500 million ($100,000 per share equivalent to $25.00 per depositary share) plus accrued and unpaid dividends. The difference between the redemption value and the net carrying value of approximately $9 million resulted in an EPS impact of approximately ($.03) per share in the first quarter of 2020.
(3) We redeemed an aggregate of $500 million, or 5,000 of the 7,500 outstanding shares of our non-cumulative perpetual preferred stock, Series F, for cash at a redemption price of $100,000 per share (equivalent to $1,000 per depositary share) plus all declared and unpaid dividends on March 15, 2021. The difference between the redemption value and the net carrying value of approximately $5 million resulted in an EPS impact of approximately ($.02) per share in the first quarter of 2021.
(4) Return on tangible common equity is calculated by dividing year-to-date annualized net income available to common shareholders (GAAP-basis) by average tangible common equity.
(5) Notable items include acquisition and restructuring costs, repositioning charges and legal and other notable items. Refer to Reconciliations of non-GAAP Financial Information pages for details.
nm Denotes not meaningful

5    

                                
STATE STREET CORPORATION
EARNINGS RELEASE ADDENDUM
CONSOLIDATED STATEMENT OF CONDITION
As of% Change
(Dollars in millions, except per share amounts)March 31, 2020June 30, 2020September 30, 2020December 31, 2020March 31, 2021June 30, 2021September 30, 2021December 31, 20214Q21
vs.
4Q20
4Q21
vs.
3Q21
Assets:
Cash and due from banks$4,932 $3,685 $4,848 $3,467 $4,552 $4,619 $4,606 $3,631 4.7 %(21.2)%
Interest-bearing deposits with banks147,735 90,199 75,967 116,960 107,554 113,347 107,553 106,358 (9.1)(1.1)
Securities purchased under resale agreements1,037 4,026 4,499 3,106 5,238 3,997 2,847 3,012 (3.0)5.8 
Trading account assets872 883 840 815 786 721 720 758 (7.0)5.3 
Investment securities:
Investment securities available-for-sale55,843 56,231 61,780 59,048 60,512 67,497 70,279 73,399 24.3 4.4 
Investment securities held-to-maturity purchased under money market liquidity facility(1)
26,808 11,257 4,824 3,299 201 — —  nm
Investment securities held-to-maturity(2)
41,150 41,848 45,394 48,929 46,261 45,182 43,346 42,430 (13.3)(2.1)
Total investment securities123,801 109,336 111,998 111,276 106,974 112,679 113,625 115,829 4.1 1.9 
Loans32,379 26,860 27,035 27,925 31,585 30,704 32,797 32,532 16.5 (0.8)
Allowance for loan losses(3)
97 141 134 122 118 100 95 87 (28.7)(8.4)
Loans, net32,282 26,719 26,901 27,803 31,467 30,604 32,702 32,445 16.7 (0.8)
Premises and equipment, net(4)
2,225 2,212 2,193 2,154 2,143 2,169 2,191 2,261 5.0 3.2 
Accrued interest and fees receivable3,274 3,235 3,291 3,105 3,302 3,358 3,407 3,278 5.6 (3.8)
Goodwill7,506 7,538 7,607 7,683 7,629 7,629 7,650 7,621 (0.8)(0.4)
Other intangible assets1,963 1,914 1,870 1,827 2,007 1,933 1,887 1,816 (0.6)(3.8)
Other assets36,900 30,495 32,061 36,510 45,233 45,472 45,951 37,615 3.0 (18.1)
Total assets$362,527 $280,242 $272,075 $314,706 $316,885 $326,528 $323,139 $314,624 — (2.6)
Liabilities:
Deposits:
   Non-interest-bearing$69,404 $42,132 $41,183 $49,439 $57,079 $61,742 $64,885 $56,461 14.2 (13.0)
   Interest-bearing - U.S.110,106 87,197 85,434 102,331 108,372 111,291 108,909 102,985 0.6 (5.4)
   Interest-bearing - Non-U.S.77,594 71,133 70,896 88,028 79,442 90,936 85,579 95,589 8.6 11.7 
Total deposits(5)
257,104 200,462 197,513 239,798 244,893 263,969 259,373 255,035 6.4 (1.7)
Securities sold under repurchase agreements5,373 3,513 2,430 3,413 587 658 637 1,575 (53.9)147.3 
Short-term borrowings under money market liquidity facility25,665 11,261 4,819 3,302 200 — —  nm
Other short-term borrowings4,835 912 5,838 685 642 635 549 128 (81.3)(76.7)
Accrued expenses and other liabilities30,151 23,634 22,064 27,503 31,722 23,067 22,288 17,048 (38.0)(23.5)
Long-term debt15,538 15,587 13,853 13,805 13,836 13,032 12,978 13,475 (2.4)3.8 
Total liabilities338,666 255,369 246,517 288,506 291,880 301,361 295,825 287,261 (0.4)(2.9)
Shareholders' equity:
Preferred stock, no par, 3,500,000 shares authorized:
Series D, 7,500 shares issued and outstanding742 742 742 742 742 742 742 742 — — 
Series F, 2,500 shares issued and outstanding742 742 742 742 247 247 247 247 (66.7)— 
Series G, 5,000 shares issued and outstanding493 493 493 493 493 493 493 493 — — 
Series H, 5,000 shares issued and outstanding494 494 494 494 494 494 494 494 — — 
Common stock, $1 par, 750,000,000 shares authorized(6)(7)
504 504 504 504 504 504 504 504 — — 
Surplus10,155 10,179 10,192 10,205 10,227 10,246 10,763 10,787 5.7 0.2 
Retained earnings22,315 22,794 23,128 23,442 23,751 24,300 24,785 25,238 7.7 1.8 
Accumulated other comprehensive income (loss)(920)(430)(111)187 (418)(422)(682)(1,133)(705.9)66.1
Treasury stock, at cost(8)
(10,664)(10,645)(10,626)(10,609)(11,035)(11,437)(10,032)(10,009)(5.7)(0.2)
Total shareholders' equity23,861 24,873 25,558 26,200 25,005 25,167 27,314 27,363 4.4 0.2 
Total liabilities and equity$362,527 $280,242 $272,075 $314,706 $316,885 $326,528 $323,139 $314,624 — (2.6)
(1) Fair value of Investment securities held-to-maturity purchased under money market liquidity facility
$26,808 $11,294 $4,841 $3,304 $201 $— $— $ 
(2) Fair value of investment securities held-to-maturity
42,201 43,037 46,510 50,003 46,752 45,685 43,728 42,271 
(3) Total allowance for credit losses including off-balance sheet commitments
124 163 153 148 135 121 117 108 
(4) Accumulated depreciation for premises and equipment
4,459 4,591 4,744 4,825 4,960 5,108 5,235 5,391 
(5) Average total deposits
180,160 197,069 189,226 206,343 226,232 242,310 233,266 239,680 
(6) Common stock shares issued
503,879,642 503,879,642 503,879,642 503,879,642 503,879,642 503,879,642 503,879,642 503,879,642 
(7) Total common shares outstanding
351,943,858 352,383,250 352,797,695 353,156,279 348,032,982 343,503,114 365,629,173 365,982,820 
(8) Treasury stock shares
151,935,784 151,496,392 151,081,947 150,723,363 155,846,660 160,376,528 138,250,469 137,896,822 
6    

                                
STATE STREET CORPORATION
EARNINGS RELEASE ADDENDUM
AVERAGE STATEMENT OF CONDITION - RATES EARNED AND PAID - FULLY TAXABLE-EQUIVALENT BASIS(1)
The following table presents average rates earned and paid, on a fully taxable-equivalent basis, on consolidated average interest-earning assets and average interest-bearing liabilities for the quarters indicated. Tax-equivalent adjustments were calculated using a federal income tax rate of 21%, adjusted for applicable state income taxes, net of related federal benefit.
Quarters% Change
1Q202Q203Q204Q201Q212Q213Q214Q214Q21
vs.
4Q20
4Q21
vs.
3Q21
(Dollars in millions; fully-taxable equivalent basis)Average balanceAverage ratesAverage balanceAverage ratesAverage balanceAverage ratesAverage balanceAverage ratesAverage balanceAverage ratesAverage balanceAverage ratesAverage balanceAverage ratesAverage balanceAverage ratesAverage balanceAverage balance
Assets:
Interest-bearing deposits with banks$67,120 0.49 %$86,744 0.01 %$72,717 (0.03)%$79,779 (0.02)%$95,235 (0.04)%$99,438 (0.02)%$79,375 — %$86,154 (0.01)%8.0 %8.5 %
Securities purchased under resale agreements(2)
1,805 14.38 3,342 2.95 4,181 1.91 4,459 1.47 4,568 0.88 3,958 0.28 4,061 0.65 4,191 0.69 (6.0)3.2 
Trading account assets915 — 877 — 900 — 820 — 800 — 729 — 733 0.02 747 0.01 (8.9)1.9 
Investment securities:
Investment securities available-for-sale54,242 1.72 57,462 1.31 59,593 1.13 60,799 1.00 59,191 0.95 66,225 0.88 69,621 0.86 71,134 0.83 17.0 2.2 
Investment securities held-to-maturity41,273 2.44 40,127 2.32 43,367 1.61 47,007 1.60 47,356 1.54 45,243 1.47 44,014 1.47 42,772 1.45 (9.0)(2.8)
Investment securities held-to-maturity purchased under money market liquidity facility2,045 1.57 19,037 1.49 7,488 1.32 4,212 1.35 1,262 1.35 13 1.28 — —   (100.0)— 
Total investment securities
97,560 2.03 116,626 1.69 110,448 1.33 112,018 1.27 107,809 1.21 111,481 1.12 113,635 1.10 113,906 1.06 1.7 0.2 
Loans(3)
28,468 2.62 27,369 2.30 25,974 2.13 28,298 2.05 28,025 2.05 29,471 2.14 32,035 2.08 34,425 2.00 21.7 7.5 
Other interest-earning assets10,764 1.70 9,831 0.13 11,586 0.10 12,824 0.10 18,296 0.10 20,939 0.07 24,662 0.08 25,418 0.07 98.2 3.1 
Total interest-earning assets206,632 1.70 244,789 1.12 225,806 0.92 238,198 0.86 254,733 0.76 266,016 0.71 254,501 0.76 264,841 0.73 11.2 4.1 
Cash and due from banks3,856 3,480 3,652 4,403 4,529 5,594 5,103 4,998 13.5 (2.1)
Other assets40,693 36,419 34,926 34,454 37,066 36,585 31,855 33,168 (3.7)4.1 
Total assets$251,181 $284,688 $264,384 $277,055 $296,328 $308,195 $291,459 $303,007 9.4 4.0 
Liabilities:
Interest-bearing deposits:
U.S.$80,247 0.50 %$91,097 0.03 %$85,432 0.02 %$92,962 0.01 %$100,974 0.01 %$110,269 — %$104,575 0.02 %$103,547  %11.4 (1.0)
Non-U.S.(4)
64,340 (0.20)66,977 (0.36)69,514 (0.37)74,324 (0.40)78,433 (0.37)83,248 (0.32)82,230 (0.33)84,525 (0.31)13.7 2.8 
Total interest-bearing deposits(4)
144,587 0.19 158,074 (0.13)154,946 (0.16)167,286 (0.17)179,407 (0.16)193,517 (0.14)186,805 (0.13)188,072 (0.14)12.4 0.7 
Securities sold under repurchase agreements1,773 0.55 3,394 0.03 2,891 0.08 2,402 0.07 1,017 0.05 477 (0.02)332 — 847 (0.05)(64.7)155.1 
Short-term borrowings under money market liquidity facility2,187 1.11 19,036 1.23 7,449 1.24 4,209 1.23 1,264 1.21 13 1.25 — —   (100.0)
Other short-term borrowings2,960 1.32 3,073 0.66 1,724 0.44 1,164 0.25 764 0.14 893 0.27 837 0.17 659 0.28 (43.4)(21.3)
Long-term debt13,288 2.64 15,574 2.45 14,794 1.86 13,830 1.75 13,819 1.74 13,461 1.60 13,021 1.59 13,243 1.62 (4.2)1.7 
Other interest-bearing liabilities3,434 3.55 3,461 1.07 2,764 1.28 3,050 1.20 4,848 0.73 5,682 0.80 5,461 0.78 5,943 0.71 94.9 8.8 
Total interest-bearing liabilities168,229 0.49 202,612 0.23 184,568 0.09 191,941 0.03 201,119 0.01 214,043 — 206,456 — 208,764  8.8 1.1 
Non-interest bearing deposits35,573 38,995 34,280 39,057 46,825 48,793 46,461 51,608 32.1 11.1 
Other liabilities23,052 18,678 20,050 20,087 22,423 20,131 12,775 15,266 (24.0)19.5 
Preferred shareholders' equity2,861 2,472 2,472 2,472 2,378 1,976 1,976 1,976 (20.1)— 
Common shareholders' equity21,466 21,931 23,014 23,498 23,583 23,252 23,791 25,393 8.1 6.7 
Total liabilities and shareholders' equity$251,181 $284,688 $264,384 $277,055 $296,328 $308,195 $291,459 $303,007 9.4 4.0 
Excess of rate earned over rate paid1.21 %0.89 %0.83 %0.84 %0.75 %0.71 %0.76 %0.73 %
Net interest margin1.30 %0.93 %0.85 %0.84 %0.75 %0.71 %0.76 %0.73 %
Net interest income, fully taxable-equivalent basis$668 $564 $482 $503 $471 $470 $490 $487 
Tax-equivalent adjustment(4)(5)(4)(4)(4)(3)(3)(3)
Net interest income, GAAP-basis(4)
$664 $559 $478 $499 $467 $467 $487 $484 
(1) Average rates earned and paid on interest-earning assets and interest-bearing liabilities include the impact of hedge activities associated with our asset and liability management activities where applicable.
(2) Reflects the impact of balance sheet netting under enforceable netting agreements of approximately $124 billion, $103 billion, $83 billion and $91 billion in the first, second, third and fourth quarters of 2020, respectively, and approximately $87 billion, $62 billion, $52 billion and $48 billion in the first, second, third and fourth quarters 2021, respectively. Excluding the impact of netting, the average interest rates would be approximately 0.21%, 0.09%, 0.09% and 0.07% in the first, second, third and fourth quarters of 2020, respectively, and approximately 0.04%, 0.02%, 0.05% and 0.06% in the first, second, third and fourth quarters of 2021, respectively.
(3) Average loans are presented on a gross basis. We adopted ASU 2016-13 on January 1, 2020, Allowance for Credit Losses. Average loans net of expected credit losses of approximately $28,398 million, $27,277 million, $25,839 million and $28,168 million in the first, second, third and fourth quarters of 2020, respectively, and approximately $27,904 million, $29,352 million, $31,935 million and $34,331 million in the first, second, third and fourth quarters of 2021.
(4) Average rates includes the impact of FX swap expense of approximately ($2) million, ($17) million, ($19) million and ($25) million in the first, second, third and fourth quarters of 2020, respectively, and approximately ($21) million, ($16) million, ($16) million and ($14) million in the first, second, third and fourth quarters of 2021. Average rates for total interest-bearing deposits excluding the impact of FX swap expense were approximately 0.19%, (0.09)%, (0.11)% and (0.11)% in the first, second, third and fourth quarters of 2020, respectively, and approximately (0.11)%, (0.10)%, (0.10)% and (0.11)% in the first, second, third and fourth quarters of 2021, respectively.
7    

                                
STATE STREET CORPORATION
EARNINGS RELEASE ADDENDUM
AVERAGE STATEMENT OF CONDITION - RATES EARNED AND PAID - FULLY TAXABLE-EQUIVALENT BASIS - YEAR TO DATE(1)
The following table presents consolidated average interest-earning assets, average interest-bearing liabilities and related average rates earned and paid, respectively, for the years indicated, on a fully taxable-equivalent basis, which is a non-GAAP measure. Tax-equivalent adjustments were calculated using a federal income tax rate of 21% for periods ending in 2020 and 2021, adjusted for applicable state income taxes, net of related federal benefit.
Year-to-Date% Change
20202021YTD2021 vs YTD2020
(Dollars in millions; fully-taxable equivalent basis)Average balanceAverage ratesAverage balanceAverage ratesAverage balance
Assets:
Interest-bearing deposits with banks$76,588 0.10 %$89,996 (0.02)%17.5 %
Securities purchased under resale agreements(2)
3,452 3.64 4,193 0.63 21.5 
Trading account assets878 — 752 0.01 (14.4)
Investment securities:
Investment securities available-for-sale58,036 1.31 66,584 0.88 14.7 
Investment securities held-to-maturity42,956 1.93 44,832 1.48 4.4 
Investment securities held-to-maturity purchased under money market liquidity facility8,183 1.43 314 1.35 (96.2)
Total investment securities
109,175 1.56 111,730 1.12 2.3 
Loans(3)
27,525 2.28 31,009 2.07 12.7 
Other interest-earning assets11,256 0.49 22,355 0.08 98.6 
Total interest-earning assets228,874 1.13 260,035 0.74 13.6 
Cash and due from banks3,849 5,057 31.4 
Other assets36,611 34,651 (5.4)
Total assets$269,334 $299,743 11.3 
Liabilities:
Interest-bearing deposits:
U.S.$87,444 0.13 $104,848 0.01 19.9 
Non-U.S.(4)
68,806 (0.34)82,126 (0.33)19.4 
Total interest-bearing deposits(4)
156,250 (0.07)186,974 (0.14)19.7 
Securities sold under repurchase agreements2,615 0.14 667  (74.5)
Short-term borrowings under money market liquidity facility8,207 1.22 315 1.21 (96.2)
Other short-term borrowings2,226 0.78 788 0.21 (64.6)
Long-term debt14,371 2.17 13,383 1.64 (6.9)
Other interest-bearing liabilities3,176 1.82 5,486 0.75 72.7 
Total interest-bearing liabilities186,845 0.20 207,613  11.1 
Non-interest bearing deposits36,975 48,430 31.0 
Other liabilities20,464 17,615 (13.9)
Preferred shareholders' equity2,569 2,076 (19.2)
Common shareholders' equity22,481 24,009 6.8 
Total liabilities and shareholders' equity$269,334 $299,743 11.3 
Excess of rate earned over rate paid0.93 %0.74 %
Net interest margin0.97 %0.74 %
Net interest income, fully taxable-equivalent basis$2,217 $1,918 
Tax-equivalent adjustment(17)(13)
Net interest income, GAAP-basis(4)
$2,200 $1,905 
(1) Average rates earned and paid on interest-earning assets and interest-bearing liabilities include the impact of hedge activities associated with our asset and liability management activities where applicable.
(2) Reflects the impact of balance sheet netting under enforceable netting agreements of approximately $100 billion and $62 billion as of December 31, 2020 and 2021, respectively. Excluding the impact of netting, the average interest rates would be approximately 0.12% and 0.04% for the year ended December 31, 2020 and 2021, respectively.
(3) Average loans are presented on a gross basis. Average loans net of expected credit losses as of December 31, 2020 and December 31, 2021 was approximately $27,418 million and $30,901 million, respectively.
(4) Average rates include the impact of FX swap expense of approximately ($63) million and ($68) million for the year ended December 31, 2020 and 2021, respectively. Average rates for total interest-bearing deposits excluding the impact of FX swap expense were (0.03)% and (0.10)% for the year ended December 31, 2020 and 2021, respectively.
8    

                                
STATE STREET CORPORATION
EARNINGS RELEASE ADDENDUM
INVESTMENT PORTFOLIO HOLDINGS BY ASSET CLASS
Quarters
1Q202Q203Q204Q201Q212Q213Q214Q21
(Dollars in billions, or where otherwise noted)Average BalanceAverage RateAverage BalanceAverage RateAverage BalanceAverage RateAverage BalanceAverage RateAverage BalanceAverage RateAverage BalanceAverage RateAverage BalanceAverage RateAverage BalanceAverage Rate
Available-for-sale investment securities:
Government & agency securities$21.6 0.78 %$24.9 0.57 %$27.5 0.49 %$28.7 0.46 %$28.5 0.44 %$32.5 0.53 %$36.1 0.59 %$38.8 0.63 %
Asset-backed securities6.4 1.48 5.9 1.30 6.5 0.95 7.4 0.89 7.9 0.86 9.1 0.84 9.4 0.88 7.6 0.82 
Student loans0.5 2.61 0.4 2.32 0.4 1.26 0.3 1.18 0.3 0.94 0.3 1.19 0.2 1.18 0.2 1.25 
Credit cards0.2 1.61 0.1 1.29 0.1 0.96 0.1 0.94 0.1 0.88 0.1 0.87 0.1 0.86 0.1 0.87 
Auto & equipment1.0 0.18 0.9 0.12 0.9 0.08 1.1 — 1.1 0.03 1.3 (0.01)1.3 0.03 1.2 (0.02)
Non-U.S. residential mortgage backed securities1.8 1.17 1.7 0.89 1.8 0.83 1.9 0.82 2.0 0.80 2.1 0.77 2.1 0.74 2.1 0.79 
Collateralized loan obligation2.7 1.98 2.7 1.84 3.1 1.26 3.7 1.21 4.2 1.16 5.2 1.10 5.4 1.16 3.8 1.11 
Other0.2 0.17 0.1 0.18 0.2 0.09 0.3 (0.01)0.2 (0.12)0.1 (0.09)0.3 (0.07)0.2 (0.20)
Mortgage-backed securities15.3 2.76 16.1 2.25 14.4 1.91 13.1 1.76 10.3 1.77 10.7 1.53 9.6 1.54 9.4 1.57 
Agency MBS15.3 2.76 16.1 2.25 14.4 1.91 13.1 1.76 10.3 1.77 10.7 1.53 9.6 1.54 9.4 1.57 
Non-agency MBS— — — — — — — — — — — — — —   
CMBS2.8 2.29 2.8 1.64 3.0 1.05 3.4 0.94 3.8 0.78 5.6 0.53 6.5 0.50 8.0 0.43 
Corporate bonds4.7 1.94 4.4 1.81 5.0 1.54 5.4 1.38 5.4 1.33 5.3 1.29 5.0 1.27 4.3 1.29 
Covered bonds0.6 0.48 0.5 0.32 0.5 0.25 0.5 0.23 0.5 0.22 0.3 0.30 0.2 0.40 0.1 0.57 
Municipal bonds0.8 2.67 0.8 2.65 0.9 2.56 0.8 2.59 0.8 2.59 0.8 2.61 0.8 2.62 0.8 2.65 
Clipper tax-exempt bonds0.9 3.91 0.9 3.87 0.9 3.81 0.8 3.81 0.7 3.76 0.7 3.80 0.6 3.79 0.6 3.83 
Other1.1 1.45 1.2 1.12 0.9 0.84 0.7 1.01 1.3 0.93 1.2 0.94 1.4 0.93 1.5 0.92 
Total available-for-sale portfolio$54.2 1.72 $57.5 1.31 $59.6 1.13 $60.8 1.00 $59.2 0.95 $66.2 0.88 $69.6 0.86 $71.1 0.83 
1Q202Q203Q204Q201Q212Q213Q214Q21
(Dollars in billions, or where otherwise noted)Average BalanceAverage RateAverage BalanceAverage RateAverage BalanceAverage RateAverage BalanceAverage RateAverage BalanceAverage RateAverage BalanceAverage RateAverage BalanceAverage RateAverage BalanceAverage Rate
Held-to-maturity investment securities:
Government & agency securities$10.3 1.97 %$8.9 2.01 %$8.1 2.04 %$6.5 2.15 %$6.0 2.10 %$5.8 1.97 %$5.3 1.73 %$4.1 1.56 %
Asset-backed securities4.2 2.67 4.4 1.75 4.5 1.26 5.0 1.30 5.0 1.31 5.1 1.22 5.1 1.19 5.1 1.13 
Student loans3.8 2.58 4.1 1.62 4.2 1.12 4.7 1.13 4.7 1.11 4.8 1.05 4.9 1.03 5.0 0.96 
Non-U.S. residential mortgage backed securities0.4 3.96 0.3 3.34 0.3 3.05 0.3 3.95 0.3 4.56 0.3 4.14 0.2 4.52 0.1 8.31 
Other— 2.69 — 1.51 — 1.20 — 1.17 — 1.13 — 1.11 1.11  0.65 
Mortgage-backed securities24.1 2.75 23.3 2.39 26.7 1.86 30.7 1.56 31.3 1.51 29.5 1.38 28.7 1.40 28.7 1.43 
Agency MBS24.0 2.74 23.2 2.38 26.6 1.85 30.6 1.55 31.2 1.51 29.4 1.37 28.7 1.39 28.7 1.41 
Non-agency MBS0.1 6.25 0.1 4.22 0.1 4.40 0.1 4.68 0.1 4.21 0.1 4.44 — 4.93  5.38 
CMBS2.7 2.31 3.5 1.86 4.1 1.66 4.8 1.56 5.0 1.54 4.9 1.61 4.9 1.57 4.9 1.52 
Held-to-maturity under money market liquidity facility2.0 1.57 19.0 1.49 7.5 1.32 4.2 1.35 1.3 1.35 — 1.28 — —   
Total held-for-maturity portfolio$43.3 2.40 $59.1 1.96 $50.9 1.57 $51.2 1.60 $48.6 1.54 $45.3 1.47 $44.0 1.47 $42.8 1.45 
Total investment securities$97.6 2.03 $116.6 1.69 $110.5 1.33 $112.0 1.27 $107.8 1.21 $111.5 1.12 $113.6 1.10 $113.9 1.06 
9    

                                
STATE STREET CORPORATION
EARNINGS RELEASE ADDENDUM
INVESTMENT PORTFOLIO HOLDINGS BY ASSET CLASS (continued)
Ratings
(Dollars in billions, or where otherwise noted)UST/AGYAAAAAABBB<BBBNRFair Value% Total
Net Unrealized Pre-tax MTM Gain/(Loss)
(In millions)(1)
Fixed Rate/
Floating Rate(2)
Available-for-sale investment securities:
Government & agency securities43 %24 %23 %5 %4 %1 % %$41.5 56.5 %$(158)95% / 5%
Asset-backed securities 92 8     6.5 8.9 6 0% / 100%
Student loans— 23 77 — — — — 0.2 3.2 
Credit cards— 100 — — — — — 0.1 1.4 
Auto & equipment— 77 23 — — — — 1.1 17.0 
Non-U.S. residential mortgage backed securities— 96 — — — 2.0 30.5 
Collateralized loan obligation— 100 — — — — — 3.0 45.6 (1)
Other— 75 25 — — — — 0.1 2.3 — 
Mortgage-backed securities100       9.5 12.9 50 99% / 1%
Agency MBS100 — — — — — — 9.5 100.0 50 
Non-agency MBS          
CMBS99 1      8.8 12.0 4 3% / 97%
Corporate bonds  11 40 49   4.0 5.4 17 99% / 1%
Covered bonds 100      0.1 0.2 2 42% / 58%
Municipal bonds 26 73 1    0.8 1.0 43 100% / 0%
Clipper tax-exempt bonds 11 62 18 9   0.5 0.7 12 0% / 100%
Other 1 46 33 20   1.7 2.4 (24)92% /8%
Total available-for-sale portfolio49 %23 %17 %6 %5 % % %$73.4 100.0 %$(48)75% / 25%
Fair Value$36.2 $16.6 $12.0 $4.3 $3.9 $0.2 $0.2 
UST/AGYAAAAAABBB<BBBNRAmortized Cost% Total
Net Unrealized Pre-tax MTM Gain/(Loss)
(In millions)(1)
Fixed Rate/
Floating Rate(2)
Held-to-maturity investment securities:
Government & agency securities58 %34 %8 % % % % %$3.7 8.8 %$11 99% / 1%
Asset-backed securities 27 71  2   4.9 11.6 35 5% / 95%
Student loans— 27 71 — — — 4.9 100.0 35 
Non-U.S. residential mortgage backed securities— — — — — — — — — — 
Other— — — — — — — — — — 
Mortgage-backed securities100       28.8 67.8 (84)100% / 0%
Agency MBS100 — — — — — — 28.8 99.9 (105)
Non-agency MBS— — 14 17 28 40 — 0.1 21 
CMBS94 6      5.0 11.8 (65)91% / 9%
Total held-for-maturity portfolio84 %7 %9 % % % % %$42.4 100.0 %$(103)88% / 12%
Amortized Cost$35.6 $2.9 $3.8 $ $0.1 $ $ 
Total investment securities$115.8 80% / 20%
(1) At December 31, 2021, the after-tax unrealized MTM gain/(loss) includes after-tax unrealized gain on securities available-for-sale of $30 million, after-tax unrealized gain on securities held-to-maturity of $117 million and after-tax unrealized loss primarily related to securities previously transferred from available-for-sale to held-to-maturity of $36 million.
(2) At December 31, 2021, fixed-to-floating rate securities had a book value of approximately $60 million or 0.05% of the total portfolio.
10    

                                
STATE STREET CORPORATION
EARNINGS RELEASE ADDENDUM
INVESTMENT PORTFOLIO NON-U.S. INVESTMENTS
Investment Securities
(Dollars in billions)Fair ValueAverage Rating
Gov't/Agency(1)(2)
ABS
FRMBS
ABS
All Other
Corporate BondsCovered BondsOther
Available-for-sale:
Canada$4.5 AA$3.4 $— $— $0.2 $— $0.9 
Australia3.0 AAA1.3 1.1 — 0.2 — 0.4 
France2.2 AA1.0 — 0.8 0.2 0.1 0.1 
Germany2.1 AA1.5 — 0.6 — — — 
United Kingdom2.0 AA1.0 0.5 0.2 0.3 — — 
Austria1.5 AA1.4 — 0.1 — — — 
Japan1.3 A1.3 — — — — — 
Spain1.2 BBB1.1 — 0.1 — — — 
Netherlands1.1 A0.4 0.3 0.1 0.3 — — 
Belgium1.1 AA1.0 — — 0.1 — — 
Italy0.8 A0.6 — 0.2 — — — 
Finland0.8 AA0.8 — — — — — 
Ireland0.7 A0.7 — — — — — 
Brazil0.2 BB0.2 — — — — — 
Other8.2 AAA7.8 — 0.1 0.2 0.1 — 
Total Non-U.S. Investments(3)
$30.7 $23.5 $1.9 $2.2 $1.5 $0.2 $1.4 
U.S. Investments42.7 
Total available-for-sale$73.4 
Investment Securities
(Dollars in billions)Amortized CostAverage Rating
Gov't/Agency(1)(2)
ABS
FRMBS
ABS
All Other
Corporate BondsCovered BondsOther
Held-to-maturity:
Singapore$0.2 AAA$0.2 $— $— $— $— $— 
Other1.4 AAA1.4 — — — — — 
Total Non-U.S. Investments(3)
$1.6 $1.6 $ $ $ $ $ 
U.S. Investments40.8 
Total held-for-maturity$42.4 
Total Investment Portfolio$115.8 
(1) Sovereign debt is reflected in the government / agency column.
(2) As of December 31, 2021, other non-U.S. investments include $7.4 billion supranational bonds in AFS securities and $1.3 billion supranational bonds in HTM securities.
(3) Country of collateral used except for corporates where country of issuer is used.

11    

                                
STATE STREET CORPORATION
EARNINGS RELEASE ADDENDUM
ASSETS UNDER CUSTODY AND/OR ADMINISTRATION
Quarters% Change
(Dollars in billions)1Q202Q203Q204Q201Q212Q213Q214Q214Q21
vs.
4Q20
4Q21
vs.
3Q21
Assets Under Custody and/or Administration(1)
By Product Classification(2):
Mutual funds$7,301 $8,265 $9,183 $9,810 $10,439 $10,873 $11,505 $11,575 18.0 %0.6 %
Collective funds, including ETFs10,529 11,230 12,204 13,387 14,052 15,048 15,159 15,722 17.4 3.7 
Pension products6,723 6,689 7,317 7,594 7,843 8,291 8,497 8,443 11.2 (0.6)
Insurance and other products7,311 7,331 7,939 8,000 7,929 8,385 8,176 7,938 (0.8)(2.9)
Total Assets Under Custody and/or Administration$31,864 $33,515 $36,643 $38,791 $40,263 $42,597 $43,337 $43,678 12.6 0.8 
By Financial Instrument:
Equities
$16,267 $18,190 $20,094 $21,626 $22,825 $24,792 $25,350 $25,974 20.1 2.5 
Fixed-income
11,096 11,342 12,403 12,834 13,022 13,079 12,808 12,587 (1.9)(1.7)
Short-term and other investments
4,501 3,983 4,146 4,331 4,416 4,726 5,179 5,117 18.1 (1.2)
Total Assets Under Custody and/or Administration$31,864 $33,515 $36,643 $38,791 $40,263 $42,597 $43,337 $43,678 12.6 0.8 
By Geographic Location(3):
Americas$22,787 $24,375 $26,666 $28,245 $29,530 $31,280 $31,934 $32,427 14.8 1.5 
Europe/Middle East/Africa7,112 7,155 7,675 8,101 8,256 8,716 8,748 8,599 6.1 (1.7)
Asia/Pacific1,965 1,985 2,302 2,445 2,477 2,601 2,655 2,652 8.5 (0.1)
Total Assets Under Custody and/or Administration$31,864 $33,515 $36,643 $38,791 $40,263 $42,597 $43,337 $43,678 12.6 0.8 
Assets Under Custody(4)
By Product Classification(2):
Mutual funds$6,659 $7,532 $7,838 $8,410 $8,811 $9,188 $9,369 $9,491 12.9 1.3 
Collective funds, including ETFs8,784 9,460 10,210 11,230 11,895 12,785 12,881 13,448 19.8 4.4 
Pension products5,386 5,354 5,852 6,085 6,283 6,671 6,798 6,733 10.6 (1.0)
Insurance and other products2,983 3,053 3,433 3,327 3,145 3,303 3,316 3,173 (4.6)(4.3)
Total Assets Under Custody$23,812 $25,399 $27,333 $29,052 $30,134 $31,947 $32,364 $32,845 13.1 1.5 
By Geographic Location(3):
Americas$17,701 $19,226 $20,450 $21,822 $22,715 $24,015 $24,380 $24,864 13.9 2.0 
Europe/Middle East/Africa4,666 4,714 5,212 5,465 5,564 5,957 5,994 5,988 9.6 (0.1)
Asia/Pacific1,445 1,459 1,671 1,765 1,855 1,975 1,990 1,993 12.9 0.2 
Total Assets Under Custody$23,812 $25,399 $27,333 $29,052 $30,134 $31,947 $32,364 $32,845 13.1 1.5 
(1) Consistent with past practice, AUC/A values for certain asset classes are based on a lag, typically one-month.
(2) Certain previously reported amounts presented have been reclassified to conform to current-period presentation.
(3) Geographic mix is generally based on the domicile of the entity servicing the funds and is not necessarily representative of the underlying asset mix.
(4) Assets under custody are a component of assets under custody and/or administration presented above.
12    

                                
STATE STREET CORPORATION
EARNINGS RELEASE ADDENDUM
ASSETS UNDER MANAGEMENT
Quarters% Change
(Dollars in billions)1Q202Q203Q204Q201Q212Q213Q214Q214Q21
vs.
4Q20
4Q21
vs.
3Q21
Assets Under Management
By Asset Class and Investment Approach:
Equity:
Active$69 $77 $82 $85 $84 $83 $79 $80 (5.9)%1.3 %
Passive1,492 1,768 1,876 2,086 2,198 2,378 2,361 2,594 24.4 9.9 
Total Equity(1)
1,561 1,845 1,958 2,171 2,282 2,461 2,440 2,674 23.2 9.6 
Fixed-Income:
Active86 88 85 90 91 100 101 103 14.4 2.0 
Passive392 405 424 459 463 510 509 520 13.3 2.2 
Total Fixed-Income(1)
478 493 509 549 554 610 610 623 13.5 2.1 
Cash(1)(2)
348 376 321 349 372 381 367 368 5.4 0.3 
Multi-Asset-Class Solutions:
Active39 41 40 40 34 35 35 34 (15.0)(2.9)
Passive101 116 124 146 155 172 174 188 28.8 8.0 
Total Multi-Asset-Class Solutions(1)
140 157 164 186 189 207 209 222 19.4 6.2 
Alternative Investments(3):
Active28 28 28 39 27 63 58 56 43.6 (3.4)
Passive134 155 168 173 167 175 178 195 12.7 9.6 
Total Alternative Investments(1)
162 183 196 212 194 238 236 251 18.4 6.4 
Total Assets Under Management$2,689 $3,054 $3,148 $3,467 $3,591 $3,897 $3,862 $4,138 19.4 7.1 
By Geographic Location:
North America$1,843 $2,102 $2,163 $2,411 $2,512 $2,749 $2,732 $2,931 21.6 7.3 
Europe/Middle East/Africa418 464 483 512 530 570 558 592 15.6 6.1 
Asia/Pacific428 488 502 544 549 578 572 615 13.1 7.5 
Total Assets Under Management$2,689 $3,054 $3,148 $3,467 $3,591 $3,897 $3,862 $4,138 19.4 7.1 
(1) The implementation of an improved internal data management system for product level data in the first quarter of 2021 resulted in some AUM reclassifications between the categories presented for prior periods to align with the current presentation. There was no impact to the total level of reported AUM.
(2) Includes both floating- and constant-net-asset-value portfolios held in commingled structures or separate accounts.
(3) Includes real estate investment trusts, currency and commodities, including SPDR® Gold Shares and SPDR® Gold MiniSharesSM Trust. We are not the investment manager for the SPDR® Gold Shares and SPDR®Gold MiniSharesSM Trust, but act as the marketing agent.
Exchange-Traded Funds(1)
By Asset Class:
Alternative Investments(2)(3)
$58 $77 $88 $83 $69 $73 $69 $72 (13.3)%4.3 %
Equity(3)
473 570 605 708 777 844 849 970 37.0 14.3 
Fixed-Income(3)
98 107 108 115 122 128 131 135 17.4 3.1 
Multi-Asset(3)
— — — —  1 nmnm
Total Exchange-Traded Funds$629 $754 $801 $906 $968 $1,046 $1,050 $1,178 30.0 12.2 
(1) Exchange-traded funds are a component of assets under management presented above.
(2) Includes real estate investment trusts, currency and commodities, including SPDR® Gold Shares and SPDR® Gold MiniSharesSM Trust. We are not the investment manager for the SPDR® Gold Shares and SPDR®Gold MiniSharesSM Trust, but act as the marketing agent.
(3) The implementation of an improved internal data management system for product level data in the first quarter of 2021 resulted in some AUM reclassifications between the categories presented for prior periods to align with the current presentation. There was no impact to the total level of reported AUM.
nm Denotes not meaningful
13    

                                
STATE STREET CORPORATION
EARNINGS RELEASE ADDENDUM
INDUSTRY FLOW DATA BY ASSET CLASS
(Dollars in billions)Quarters
1Q202Q203Q204Q201Q212Q213Q214Q21
North America - (US Domiciled) Morningstar Direct Market Data(1)(2)(3)
Long Term Funds(4)
$(240.1)$56.3 $21.4 $74.1 $165.2 $195.7 $149.8 $53.4 
Money Market664.8 259.4 (165.8)(82.3)156.4 33.1 15.2 219.1 
ETF22.1 69.6 60.1 119.7 148.4 122.6 77.1 195.3 
Total Flows$446.8 $385.3 $(84.3)$111.5 $470.0 $351.4 $242.1 $467.8 
EMEA-Morningstar Direct Market Data(1)(2)(5)
Long Term Funds(4)
$(137.6)$167.6 $134.4 $249.9 $237.0 $225.8 $192.1 $146.1 
Money Market11.6 152.8 60.0 58.6 (91.0)(9.8)(4.3)49.1 
ETF(2.9)36.2 32.4 48.0 54.2 51.1 36.8 41.6 
Total Flows$(128.9)$356.6 $226.8 $356.5 $200.2 $267.1 $224.6 $236.8 
(1) Data providers for North America and EMEA industry flows were changed to Morningstar from other providers in 3Q20 for consistency across regions and other efficiency considerations. Data collection and tabulation methodologies among data providers differ. All periods presented reflect data sourced from Morningstar. Prior period data therefore differs from data previously presented, which was sourced from other data providers. Industry data is provided for illustrative purposes only. It is not intended to reflect State Street’s activity or its clients’ activity and is indicative of only segments of the entire industry.
(2) Source: Morningstar Direct. The data includes long-term mutual funds, ETF’s and Money Market funds. Mutual fund data represents estimates of net new cash flow, which is new sales minus redemptions combined with net exchanges, while ETF data represents net issuance, which is gross issuance less gross redemptions. Data for Fund of Funds, Feeder funds and Obsolete funds were excluded from the series to prevent double counting. Data is from the Morningstar Direct Asset Flows database.
(3) The fourth quarter of 2021 data for North America (US domiciled) includes Morningstar actuals for October and November 2021 and Morningstar estimates for December 2021.
(4) The long-term fund flows reported by Morningstar in North America are composed of US domiciled Market flows mainly in Equities, Allocation and Fixed Income asset classes. The long-term funds flows reported by Morningstar direct in EMEA are composed of the European market flows mainly in Equities, Allocation and Fixed Incomes asset classes.
(5) The fourth quarter of 2021 data for Europe is on a rolling three month basis for September 2021 through November 2021, sourced by Morningstar.
14    

                                
STATE STREET CORPORATION
EARNINGS RELEASE ADDENDUM
LINE OF BUSINESS INFORMATION
Three Months Ended,
Investment Servicing% ChangeInvestment Management% Change
Other(1)
% ChangeTotal% Change
(Dollars in millions)4Q203Q214Q214Q21
 vs.
4Q20
4Q21
 vs.
3Q21
4Q203Q214Q214Q21
 vs.
4Q20
4Q21
 vs.
3Q21
4Q203Q214Q214Q21
 vs.
4Q20
4Q21
 vs.
3Q21
4Q203Q214Q214Q21
 vs.
4Q20
4Q21
 vs.
3Q21
Servicing fees$1,307 $1,395 $1,384 5.9 %(0.8)%$— $— $ — %— %$— $— $ — %— %$1,307 $1,395 $1,384 5.9 %(0.8)%
Management fees— —  — — 493 526 530 7.5 0.8 — —  — — 493 526 530 7.5 0.8 
Foreign exchange trading services301 266 280 (7.0)5.3 23 13 20 (13.0)53.8 — —  — — 324 279 300 (7.4)7.5 
Securities finance84 103 98 16.7 (4.9)4 — 33.3 — —  — — 88 106 102 15.9 (3.8)
Software and processing fees178 204 194 9.0 (4.9)26 (6)1 nmnm— —  — — 204 198 195 (4.4)(1.5)
Total fee revenue1,870 1,968 1,956 4.6 (0.6)546 536 555 1.6 3.5 — —  — — 2,416 2,504 2,511 3.9 0.3 
Net interest income495 491 487 (1.6)(0.8)(4)(3)(175.0)nm— —  — — 499 487 484 (3.0)(0.6)
Total other income(1) nmnm— —  — — — — 58 nmnm(1)58 nmnm
Total revenue2,367 2,458 2,443 3.2 (0.6)550 532 552 0.4 3.8 — — 58 nm2,917 2,990 3,053 4.7 2.1 
Provision for loan losses— (2)(7)250.0— —  — — — —  — — — (2)(7)250.0
Total expenses1,756 1,755 1,793 2.1 2.2 375 339 363 (3.2)7.1 145 22 174 nmnm2,276 2,116 2,330 2.4 10.1 
Income before income tax expense$611 $705 $657 7.5 (6.8)$175 $193 $189 8.0 (2.1)$(145)$(22)$(116)nmnm$641 $876 $730 13.9 (16.7)
Pre-tax margin25.8 %28.7 %26.9 %110 (180)bps31.8 %36.3 %34.2 %240 (210)bps22.0 %29.3 %23.9 %190 (540)bps
Year Ended December 31,
Investment Servicing% ChangeInvestment Management% Change
Other(1)
% ChangeTotal% Change
(Dollars in millions)20202021YTD2021
vs.
YTD2020
20202021YTD2021
vs.
YTD2020
20202021YTD2021
vs.
YTD2020
20202021YTD2021
vs.
YTD2020
Servicing fees$5,167 $5,549 7.4 %$— $ — %$— $ — %$5,167 $5,549 7.4 %
Management fees—  — 1,880 2,053 9.2 —  — 1,880 2,053 9.2 
Foreign exchange trading services1,299 1,149 (11.5)64 62 (3.1)—  — 1,363 1,211 (11.2)
Securities finance342 402 17.5 14 14 — —  — 356 416 16.9 
Software and processing fees706 779 10.3 27 4 nm—  — 733 783 6.8 
Total fee revenue7,514 7,879 4.9 1,985 2,133 7.5 —  — 9,499 10,012 5.4 
Net interest income2,211 1,919 (13.2)(11)(14)27.3 —  — 2,200 1,905 (13.4)
Total other income(1)nm—  — — 111 nm110 nm
Total revenue9,729 9,797 0.7 1,974 2,119 7.3 — 111 — 11,703 12,027 2.8 
Provision for loan losses88 (33)nm—  — —  — 88 (33)nm
Total expenses7,071 7,182 1.6 1,471 1,445 (1.8)174 262 nm8,716 8,889 2.0 
Income before income tax expense$2,570 $2,648 3.0 $503 $674 34.0 $(174)$(151)(13.2)$2,899 $3,171 9.4 
Pre-tax margin26.4 %27.0 %60 bps25.5 %31.8 %630 bps24.8 %26.4 %160 bps
(1) Represents costs incurred that are not allocated to a specific line of business, including certain severance and restructuring costs, employee costs, acquisition costs and certain provisions for legal contingencies.
nm Denotes not meaningful
15    

                                
STATE STREET CORPORATION
EARNINGS RELEASE ADDENDUM
ALLOWANCE FOR CREDIT LOSSES
Quarters% Change
(Dollars in millions)1Q202Q203Q204Q201Q212Q213Q214Q214Q21
vs.
4Q20
4Q21
vs.
3Q21
Allowance for credit losses:
Beginning balance$93 $124 $163 $153 $148 $135 $121 $117 (23.5)%(3.3)%
Provision for credit losses (funded commitments)
29 57 (6)— (19)(3)(7)16.7nm
Provision for credit losses (unfunded commitments)
(4)(2)(7) nmnm
Provision for credit losses (investment securities and all other)
(1)(1)— (2)— —  nmnm
Total provision36 52 — — (9)(15)(2)(7)nmnm
Charge-offs(5)(14)(14)(8)— (1)(1) nmnm
Other(1)
— (4)(1)(2)nm100.0
Ending balance(2)
$124 $163 $153 $148 $135 $121 $117 $108 (27.0)(7.7)
Allowance for credit losses:
Loans$97 $141 $134 $122 $118 $100 $95 $87 (28.7)(8.4)
Investment securities2 (33.3)
Unfunded (off-balance sheet) commitments22 18 15 22 15 19 20 19 (13.6)(5.0)
All other— — — —  nm
Ending balance(2)
$124 $163 $153 $148 $135 $121 $117 $108 (27.0)(7.7)
(1) Consists primarily of FX translation.
(2) The allowance for credit losses on unfunded commitments is included within Other liabilities in the Consolidated Statement of Condition.
nm Not meaningful

16    

STATE STREET CORPORATION
EARNINGS RELEASE ADDENDUM
RECONCILIATIONS OF NON-GAAP FINANCIAL INFORMATION
In addition to presenting State Street's financial results in conformity with U.S. generally accepted accounting principles, or GAAP, management also presents certain financial information on a basis that excludes or adjusts one or more items from GAAP. This latter basis is a non-GAAP presentation. In general, our non-GAAP financial results adjust selected GAAP-basis financial results to exclude the impact of revenue and expenses outside of State Street’s normal course of business or other notable items, such as acquisition and restructuring charges, repositioning charges, gains/losses on sales, as well as, for selected comparisons, seasonal items. For example, we sometimes present expenses on a basis we may refer to as "expenses ex-notable items", which exclude notable items and, to provide additional perspective on both prior year quarter and sequential quarter comparisons, also exclude seasonal items. Management believes that this presentation of financial information facilitates an investor's further understanding and analysis of State Street's financial performance and trends with respect to State Street’s business operations from period-to-period, including providing additional insight into our underlying margin and profitability. In addition, Management may also provide additional non-GAAP measures. For example, we present capital ratios, calculated under regulatory standards scheduled to be effective in the future or other standards, that management uses in evaluating State Street’s business and activities and believes may similarly be useful to investors. Additionally, we may present revenue and expense measures on a constant currency basis to identify the significance of changes in foreign currency exchange rates (which often are variable) in period-to-period comparisons. This presentation represents the effects of applying prior period weighted average foreign currency exchange rates to current period results.
Non-GAAP financial measures should be considered in addition to, not as a substitute for or superior to, financial measures determined in conformity with GAAP.
Quarters% ChangeYear-to-Date% Change
(Dollars in millions)1Q202Q203Q204Q201Q212Q213Q214Q214Q21
vs.
4Q20
4Q21
vs.
3Q21
20202021YTD2021
vs.
YTD2020
Fee Revenue:
Total fee revenue, GAAP-basis$2,399 $2,378 $2,306 $2,416 $2,483 $2,514 $2,504 $2,511 3.9 %0.3 %$9,499 $10,012 5.4 %
Total fee revenue, excluding notable items$2,399 $2,378 $2,306 $2,416 $2,483 $2,514 $2,504 $2,511 3.9 0.3 $9,499 $10,012 5.4 
Total Revenue:
Total revenue, GAAP-basis$3,065 $2,937 $2,784 $2,917 $2,950 $3,034 $2,990 $3,053 4.7 %2.1 %$11,703 $12,027 2.8 %
Less: total other income(1)
— — — — — (53)— (58)nmnm— (111)nm
Total revenue, excluding notable items$3,065 $2,937 $2,784 $2,917 $2,950 $2,981 $2,990 $2,995 2.7 0.2 $11,703 $11,916 1.8 
Expenses:
Total expenses, GAAP-basis$2,255 $2,082 $2,103 $2,276 $2,332 $2,111 $2,116 $2,330 2.4 %10.1 %$8,716 $8,889 2.0 %
Less: Notable expense items:
Acquisition and restructuring costs(2)
(11)(12)(15)(12)(10)(11)(18)(26)116.744.4 (50)(65)30.0 
Repositioning (charges) / release— — — (133)— — — 3 nmnm(133)3 nm
Deferred incentive compensation expense acceleration(3)
— — — — — — — (147)nmnm— (147)nm
Legal and other— — — (29)11 —  nmnm(18)nm
Total expenses, excluding notable items$2,244 $2,070 $2,097 $2,131 $2,293 $2,111 $2,098 $2,160 1.4 3.0 $8,542 $8,662 1.4 
Fee Operating Leverage, GAAP-Basis:
Total fee revenue, GAAP-basis$2,399$2,378$2,306$2,416$2,483$2,514$2,504$2,511 3.9 %0.3 %$9,499 $10,012 5.4 %
Total expenses, GAAP-basis2,2552,0822,1032,2762,3322,1112,1162,330 2.4 10.1 8,716 8,889 2.0 
Fee operating leverage, GAAP-basis150 bps(980)bps340 bps
Fee Operating Leverage, excluding notable items:
Total fee revenue, excluding notable items (as reconciled above)$2,399$2,378$2,306$2,416$2,483$2,514$2,504$2,511 3.9 %0.3 %$9,499 $10,012 5.4 %
Total expenses, excluding notable items (as reconciled above)2,2442,0702,0972,1312,2932,1112,0982,160 1.4 3.0 8,542 8,662 1.4 
Fee operating leverage, excluding notable items250 bps(270)bps400 bps
Operating Leverage, GAAP-Basis:
Total revenue, GAAP-basis$3,065$2,937$2,784$2,917$2,950$3,034$2,990$3,053 4.7 %2.1 %$11,703 $12,027 2.8 %
Total expenses, GAAP-basis2,2552,0822,1032,2762,3322,1112,1162,330 2.4 10.1 8,716 8,889 2.0 
Operating leverage, GAAP-basis230 bps(800)bps80 bps
Operating Leverage, excluding notable items:
Total revenue, excluding notable items (as reconciled above)$3,065$2,937$2,784$2,917$2,950$2,981$2,990$2,995 2.7 %0.2 %$11,703 $11,916 1.8 %
Total expenses, excluding notable items (as reconciled above)2,2442,0702,0972,1312,2932,1112,0982,160 1.4 3.0 8,542 8,662 1.4 
Operating leverage, excluding notable items130 bps(280)bps40 bps
17    

                                
STATE STREET CORPORATION
EARNINGS RELEASE ADDENDUM
RECONCILIATIONS OF NON-GAAP FINANCIAL INFORMATION (Continued)
Quarters% ChangeYear-to-Date% Change
(Dollars in millions, except earnings per share, or where otherwise noted)1Q202Q203Q204Q201Q212Q213Q214Q214Q21
vs.
4Q20
4Q21
vs.
3Q21
20202021YTD2021
vs.
YTD2020
Net Income :
Net Income GAAP-basis$634$694$555$537$519$763$714$69729.8 %(2.4)%$2,420$2,69311.3 
Less: Notable items


Total other income(1)
(53)(58)(111)
Acquisition and restructuring costs(2)
111215121011182650— 65
Repositioning charges / (release)133(3)133— (3)
Deferred incentive compensation expense acceleration(3)
147147
Legal and other(9)29(11)(9)— 18
Tax impact of notable items(3)(3)(4)(37)(10)16(5)(29)(47)— (28)
Net Income, excluding notable items$642$703$557

$645$548$726$727$78020.9 7.3 $2,547$2,7819.2 
Net Income Available to Common Shareholders:
Net Income Available to Common Shareholders, GAAP-basis$580$662$517$498$489$728$693$66232.9 %(4.5)%$2,257$2,57214.0 %
Less: Notable items
Total other income(1)
(53)(58)(111)
Acquisition and restructuring costs(2)
11121512101118265065
Repositioning charges / (release)133(3)133(3)
Deferred incentive compensation expense acceleration(3)
147147
Legal and other(9)29(11)(9)18
Preferred securities redemption(4)(5)
9595
Tax impact of notable items(3)(3)(4)(37)(10)16(5)(29)(47)(28)
Net Income Available to Common Shareholders, excluding notable items$597$671$519$606$523$691$706$74522.9 5.5 $2,393$2,66511.4 
Diluted Earnings per Share:
Diluted earnings per share, GAAP-basis$1.62$1.86$1.45$1.39$1.37$2.07$1.96$1.7828.1 %(9.2)%$6.32$7.1913.8 %
Less: Notable items
Total other income(1)
(0.10)(0.11)(0.23)
Acquisition and restructuring costs(2)
0.020.020.030.030.020.020.040.050.100.14
Repositioning charges / (release)0.27(0.01)0.27(0.01)
Deferred incentive compensation expense acceleration(3)
0.290.30
Legal and other(0.03)0.06(0.02)(0.02)0.04
Preferred securities redemption(4)(5)
0.030.020.030.01
Diluted earnings per share, excluding notable items$1.67$1.88$1.45$1.69$1.47$1.97$2.00$2.0018.3 — $6.70$7.4411.0 
Pre-tax Margin:
Pre-tax margin, GAAP-basis25.3 %27.3 %24.5 %22.0 %21.3%30.9%29.3 %23.9%190 bps(540)bps24.8%26.4%160 bps
Less: Notable items
Total other income(1)
— — — — (1.2)(1.4)(0.7)
Acquisition and restructuring costs(2)
0.3 0.4 0.5 0.40.3 0.40.60.80.40.5
Repositioning charges4.51.2
Deferred incentive compensation expense acceleration(3)
4.81.2
Legal and other


(0.3)

1.0(0.4)(0.1)0.2
Pre-tax margin, excluding notable items25.6%27.7%24.7%26.9%22.6%29.7%29.9%28.1%120(180)26.3%27.6%130 
18    

                                
STATE STREET CORPORATION
EARNINGS RELEASE ADDENDUM
RECONCILIATIONS OF NON-GAAP FINANCIAL INFORMATION (Continued)
Quarters% ChangeYear-to-Date% Change
(Dollars in millions, except earnings per share, or where otherwise noted)1Q202Q203Q204Q201Q212Q213Q214Q214Q21
vs.
4Q20
4Q21
vs.
3Q21
20202021YTD2021
vs.
YTD2020
Return on Average Common Equity:
Return on average common equity, GAAP-basis10.9 %12.1 %8.9 %8.4 %8.4 %12.6%11.6%10.3%190 bps(130)bps10.0%10.7%70 bps
Less: Notable items
Total other income(1)
(1.0)(0.9)(0.5)
Acquisition and restructuring costs(2)
0.20.20.20.20.20.20.30.40.20.3
Repositioning charges2.40.6
Deferred incentive compensation expense acceleration(3)
2.30.6
Legal and other(0.1)0.5(0.2)0.1
Preferred securities redemption(4)(5)
0.20.1
Tax impact of notable items(0.1)(0.7)(0.2)0.3(0.1)(0.5)(0.2)(0.1)
Return on average common equity, excluding notable items11.2%12.3%9.0%10.3%9.0%11.9%11.8%11.6%130 (20)10.6%11.1%50 
(1) Amount in 2021 consists of $58 million related to the sale of investment securities and $53 million gain on the sale of a majority share of our WMS business.
(2) Acquisition and restructuring costs of approximately $26 million in 4Q21, of which $20 million related to our acquisition of CRD and $6 million to our announced acquisition of BBH Investor Services.
(3) Amount in 2021 reflects $142 million related to the acceleration of expenses associated with certain cash settled deferred incentive compensation awards and $5 million related to employee benefits.
(4) We redeemed all outstanding Series C noncumulative perpetual preferred stock on March 15, 2020 at a redemption price of $500 million ($100,000 per share equivalent to $25.00 per depositary share) plus accrued and unpaid dividends. The difference between the redemption value and the net carrying value of approximately $9 million resulted in an EPS impact of approximately ($.03) per share in the first quarter of 2020.
(5) We redeemed an aggregate of $500 million, or 5,000 of the 7,500 outstanding shares of our non-cumulative perpetual preferred stock, Series F, for cash at a redemption price of $100,000 per share (equivalent to $1,000 per depositary share) plus all declared and unpaid dividends on March 15, 2021.The difference between the redemption value and the net carrying value of approximately $5 million resulted in an EPS impact of approximately ($.02) per share in the first quarter of 2021.
nm Denotes not meaningful
19    

                                
STATE STREET CORPORATION
EARNINGS RELEASE ADDENDUM
RECONCILIATION OF PRE-TAX MARGIN EXCLUDING NOTABLE ITEMS
(Dollars in millions)2017
2018(1)
201920202021
Total revenue:
Total revenue, GAAP-basis$11,266 $12,131 $11,756 $11,703 $12,027 
Less: Total other income(56)— (44)— (111)
Add: Impact of tax legislation20 — — —  
Add: Legal and other— — —  
Total revenue, excluding notable items11,230 12,139 11,712 11,703 11,916 
Provision for credit losses15 10 88 (33)
Total expenses:
Total expenses, GAAP-basis8,269 9,015 9,034 8,716 8,889 
Less:
Acquisition and restructuring costs(266)(24)(77)(50)(65)
Deferred incentive compensation expense acceleration — — — — (147)
Legal and other— (42)(172)(18)
Repositioning (charges) / release(1)
— (324)(110)(133)3 
Total expenses, excluding notable items8,003 8,625 8,675 8,542 8,662 
Income before income tax expense, excluding notable items$3,225 $3,499 $3,027 $3,073 $3,287 
Income before income tax expense, GAAP-basis$2,995 $3,101 $2,712 $2,899 $3,171 
Pre-tax margin, excluding notable items28.7 %28.8 %25.8 %26.3 %27.6 %
Pre-tax margin, GAAP-basis26.6 25.6 23.1 24.8 26.4 
(1) Includes charges in 2018 that were previously disclosed as "Business exit: Channel Islands".


20    

                                
STATE STREET CORPORATION
EARNINGS RELEASE ADDENDUM
RECONCILIATION OF NOTABLE ITEMS
Quarters% ChangeYear-to-Date% Change
(Dollars in millions)1Q202Q203Q204Q201Q212Q213Q214Q214Q21
vs.
4Q20
4Q21
vs.
3Q21
YTD 2020YTD 2021YTD2021
 vs.
YTD2020
Total revenue:
Total revenue, GAAP-basis$3,065 $2,937 $2,784 $2,917 $2,950 $3,034 $2,990 $3,053 4.7 %2.1 %$11,703 $12,027 2.8 %
Less: other income— — — — — (53)— (58)nmnm— (111)nm
Total revenue, excluding notable items$3,065 $2,937 $2,784 $2,917 $2,950 $2,981 $2,990 $2,995 2.7 0.2 $11,703 $11,916 1.8 
Total expenses:
Total expenses, GAAP basis$2,255 $2,082 $2,103 $2,276 $2,332 $2,111 $2,116 $2,330 2.4 10.1 $8,716 $8,889 2.0 
Less: Notable expense items:
Repositioning charges:
Compensation and employee benefits— — — (82)— — — 32 nmnm(82)32 nm
Occupancy— — — (51)— — — (29)(43.1)nm(51)(29)(43.1)
Repositioning (charges) / release— — — (133)— — — 3 nmnm(133)3 nm
Acquisition and restructuring costs(11)(12)(15)(12)(10)(11)(18)(26)nm44.4 (50)(65)30.0 
Deferred incentive compensation expense acceleration— — — — — — — (147)nmnm— (147)nm
Legal and other— — — (29)11 —  nmnm(18)nm
Total expenses, excluding notable items(1)
2,244 2,070 2,097 2,131 2,293 2,111 2,098 2,160 1.4 3.0 8,542 8,662 1.4 
Seasonal expenses(151)— — — (176)— —  nm(151)(176)16.6 
Total expenses excluding notable items and seasonal expenses(1)
2,093 2,070 2,097 2,131 2,117 2,111 2,098 2,160 1.4 3.0 8,391 8,486 1.1 
CRD expenses(58)(61)(62)(67)(67)(70)(73)(77)14.9 5.5 (248)(287)15.7 
CRD related expenses: intangible asset amortization costs(17)(16)(17)(16)(17)(16)(17)(17)6.3 — (66)(67)1.5 
Total expenses, excluding notable items, seasonal items, CRD and CRD related expenses$2,018 $1,993 $2,018 $2,048 $2,033 $2,025 $2,008 $2,066 0.9 2.9 $8,077 $8,132 0.7 
Net Income Available to Common Shareholders, GAAP-basis$580$662$517$498$489$728$693 $66232.9 (4.5)$2,257 $2,572 14.0 
Notable items as reconciled above: pre-tax11 12 145 39 (53)18 112 174 116 
Tax impact on notable items as reconciled above(3)(3)(4)(37)(10)16(5)(29)(47)(28)
Preferred security cost95— 5 
Net Income Available to Common Shareholders, excluding notable items$597 $671 $519 $606 $523 $691 $706 $745 22.9 5.5 $2,393 $2,665 11.4 
(1) Please refer to Reconciliations of Constant Currency FX Impact within this addendum for FX impact on this line item.
nm Denotes not meaningful
21    

                                
STATE STREET CORPORATION
EARNINGS RELEASE ADDENDUM
RECONCILIATIONS OF CONSTANT CURRENCY FX IMPACTS
ReportedCurrency Translation ImpactExcluding Currency Impact% Change Constant Currency
(Dollars in millions)4Q203Q214Q214Q21
vs.
4Q20
4Q21
vs.
3Q21
4Q21
vs.
4Q20
4Q21
vs.
3Q21
4Q21
vs.
4Q20
4Q21
vs.
3Q21
GAAP-Basis Results:
Fee revenue:
Servicing fees$1,307 $1,395 $1,384 $(10)$(10)$1,394 $1,394 6.7 %(0.1)%
Management fees493 526 530 (3)(2)533 532 8.1 1.1 
Foreign exchange trading services324 279 300 — — 300 300 (7.4)7.5 
Securities finance88 106 102 — — 102 102 15.9 (3.8)
Software and processing fees204 198 195 (1)(1)196 196 (3.9)(1.0)
Total fee revenue2,416 2,504 2,511 (14)(13)2,525 2,524 4.5 0.8 
Net interest income499 487 484 (2)(3)486 487 (2.6)— 
Total other income(1)58 — — 58 58 nmnm
Total revenue$2,917 $2,990 $3,053 $(16)$(16)$3,069 $3,069 5.2 2.6 
Expenses:
Compensation and employee benefits$1,129 $1,054 $1,181 $(8)$(6)$1,189 $1,187 5.3 12.6 
Information systems and communications394 406 436 (1)(1)437 437 10.9 7.6 
Transaction processing services257 253 238 (1)(1)239 239 (7.0)(5.5)
Occupancy162 102 133 (1)(1)134 134 (17.3)31.4 
Acquisition and restructuring costs12 18 26 — — 26 26 116.7 44.4 
Amortization of other intangible assets59 62 62 (1)(1)63 63 6.8 1.6 
Other263 221 254 — (2)254 256 (3.4)15.8 
Total expenses$2,276 $2,116 $2,330 $(12)$(12)$2,342 $2,342 2.9 10.7 
Total expenses, excluding notable items - Non-GAAP$2,131 $2,098 $2,160 $(12)$(12)$2,172 $2,172 1.9 3.5 
GAAP-Basis YTD ComparisonReportedCurrency Translation ImpactExcluding Currency Impact% Change Constant Currency
(Dollars in millions)20202021YTD2021
vs.
YTD2020
2021YTD2021
vs.
YTD2020
GAAP-Basis Results:
Fee revenue:
Servicing fees$5,167 $5,549 $72 $5,477 6.0 %
Management fees1,880 2,053 20 2,033 8.1 
Foreign exchange trading services1,363 1,211 1,210 (11.2)
Securities finance356 416 414 16.3 
Software and processing fees733 783 780 6.4 
Total fee revenue9,499 10,012 98 9,914 4.4 
Net interest income2,200 1,905 29 1,876 (14.7)
Total other income110 — 110 nm
Total revenue$11,703 $12,027 $127 $11,900 1.7 
Expenses:
Compensation and employee benefits$4,450 $4,554 $53 $4,501 1.1 
Information systems and communications1,550 1,661 1,655 6.8 
Transaction processing services978 1,024 13 1,011 3.4 
Occupancy489 444 437 (10.6)
Acquisition and restructuring costs50 65 — 65 30.0 
Amortization of other intangible assets234 245 243 3.8 
Other965 896 10 886 (8.2)
Total expenses$8,716 $8,889 $91 $8,798 0.9 
Total expenses, excluding notable items - Non-GAAP$8,542 $8,662 $91 $8,571 0.3 %
nm Denotes not meaningful
22    

                                
STATE STREET CORPORATION
EARNINGS RELEASE ADDENDUM
RECONCILIATION OF TANGIBLE COMMON EQUITY RATIO
The tangible common equity, or TCE, ratio is a capital ratio that management believes provides context useful in understanding and assessing State Street's capital adequacy. The TCE ratio is calculated by dividing consolidated average common shareholders’ equity by average consolidated total assets, after reducing both amounts by average goodwill and average other intangible assets net of related deferred taxes. Total assets reflected in the TCE ratio also exclude average cash balances on deposit at the Federal Reserve Bank and other central banks in excess of required reserves. The TCE ratio is not required by GAAP or by banking regulations, but is a metric used by management to evaluate the adequacy of State Street’s capital levels. Since there is no authoritative requirement to calculate the TCE ratio, our TCE ratio is not necessarily comparable to similar capital measures disclosed or used by other companies in the financial services industry. Average tangible common equity and adjusted average tangible assets are non-GAAP financial measures and should be considered in addition to, not as a substitute for or superior to, financial measures determined in accordance with GAAP or other applicable requirements. Reconciliations with respect to the calculation of the TCE ratios are provided within the Reconciliation of Tangible Common Equity Ratio within this package.
The following table presents the calculation of State Street's ratios of tangible common equity to total tangible assets.
Quarters
(Dollars in millions)1Q202Q203Q204Q201Q212Q213Q214Q21
Average consolidated total assets$251,181 $284,688 $264,383 $277,055 $296,328 $308,195 $291,459 $303,007 
Less:
   Average goodwill7,522 7,512 7,603 7,637 7,662 7,652 7,621 7,628 
   Average other intangible assets1,996 1,938 1,902 1,849 1,798 1,987 1,901 1,850 
Average cash balances held at central banks in excess of required reserves64,383 83,801 69,072 76,086 92,207 97,257 77,207 83,931 
   Plus related deferred tax liabilities476 478 483 489 489 490 495 499 
Average tangible assetsA$177,756 $191,915 $186,289 $191,972 $195,150 $201,789 $205,225 $210,097 
Consolidated average common shareholders' equity$21,466 $21,931 $23,014 $23,498 $23,583 $23,252 $23,791 $25,393 
Less:
   Average goodwill7,522 7,512 7,603 7,637 7,662 7,652 7,621 7,628 
   Average other intangible assets1,996 1,938 1,902 1,849 1,798 1,987 1,901 1,850 
Adjusted average equity11,948 12,481 13,509 14,012 14,123 13,613 14,269 15,915 
   Plus related deferred tax liabilities476 478 483 489 489 490 495 499 
Average tangible common equityB$12,424 $12,959 $13,992 $14,501 $14,612 $14,103 $14,764 $16,414 
Average tangible common equity ratioB/A7.0 %6.8 %7.5 %7.6 %7.5 %7.0 %7.2 %7.8 %
GAAP-basis:
Net income available to common shareholders$580 $662 $517 $498 $489 $728 $693 $662 
Return on tangible common equity - Non-GAAP18.7 %19.2 %16.8 %15.6 %13.4 %17.3 %17.3 %15.7 %
23    

                                
STATE STREET CORPORATION
EARNINGS RELEASE ADDENDUM
REGULATORY CAPITAL
Basel III Advanced Approaches(1)
Basel III Standardized Approach(2)
(Dollars in millions)1Q202Q203Q204Q201Q212Q213Q214Q211Q202Q203Q204Q201Q212Q213Q214Q21
RATIOS:
Common equity tier 1 capital11.1 %12.7 %12.8 %13.1 %11.9 %11.8 %13.8 %14.3 %10.7 %12.3 %12.4 %12.3 %10.8 %11.2 %13.5 %14.2 %
Tier 1 capital13.4 15.1 15.1 15.4 13.6 13.5 15.5 16.0 12.9 14.6 14.7 14.4 12.4 12.9 15.2 15.9 
Total capital14.5 16.0 16.0 16.2 15.2 14.8 16.9 17.4 14.1 15.7 15.7 15.3 14.0 14.3 16.6 17.4 
Tier 1 leverage6.1 6.1 6.6 6.4 5.4 5.2 6.3 6.1 6.1 6.1 6.6 6.4 5.4 5.2 6.3 6.1 
Supporting Calculations:
Common equity tier 1 capital$12,115$13,168$13,825$14,377$13,443$13,691$15,831$15,945$12,115$13,168$13,825$14,377$13,443$13,691$15,831$15,945
Total risk-weighted assets109,056103,763108,112109,705113,051116,458114,878111,822112,763106,839111,159117,080124,324121,922117,229112,480
Common equity tier 1 risk-based capital ratio11.1 %12.7 %12.8 %13.1 %11.9 %11.8 %13.8 %14.3 %10.7 %12.3 %12.4 %12.3 %10.8 %11.2 %13.5 %14.2 %
Tier 1 capital$14,586$15,639$16,296$16,848$15,419$15,667$17,807$17,921$14,586$15,639$16,296$16,848$15,419$15,667$17,807$17,921
Total risk-weighted assets109,056103,763108,112109,705113,051116,458114,878111,822112,763106,839111,159117,080124,324121,922117,229112,480
Tier 1 risk-based capital ratio13.4 %15.1 %15.1 %15.4 %13.6 %13.5 %15.5 %16.0 %12.9 %14.6 %14.7 %14.4 %12.4 %12.9 %15.2 %15.9 %
Total capital$15,771$16,650$17,290$17,810$17,220$17,259$19,397$19,509$15,877$16,766$17,413$17,957$17,355$17,379$19,514$19,616
Total risk-weighted assets109,056103,763108,112109,705113,051116,458114,878111,822112,763106,839111,159117,080124,324121,922117,229112,480
Total risk-based capital ratio14.5 %16.0 %16.0 %16.2 %15.2 %14.8 %16.9 %17.4 %14.1 %15.7 %15.7 %15.3 %14.0 %14.3 %16.6 %17.4 %
Tier 1 capital$14,586$15,639$16,296$16,848$15,419$15,667$17,807$17,921$14,586$15,639$16,296$16,848$15,419$15,667$17,807$17,921
Leverage exposure(3)
239,861256,418247,762263,490285,480298,682281,952293,565239,861256,418247,762263,490285,480298,682281,952293,565
Tier 1 leverage ratio6.1 %6.1 %6.6 %6.4 %5.4 %5.2 %6.3 %6.1 %6.1 %6.1 %6.6 %6.4 %5.4 %5.2 %6.3 %6.1 %
(1) CET1, tier 1 capital, total capital and tier 1 leverage ratios for each period above were calculated in conformity with the advanced approaches provisions of the Basel III final rule. Capital ratios as of December 31, 2021 are estimates.
(2) CET1, tier 1 capital, total capital and tier 1 leverage ratios for each period above were calculated in conformity with the standardized approach provisions of the Basel III final rule. Capital ratios as of December 31, 2021 are estimates.
(3) Leverage exposure is equal to average consolidated total assets less applicable Tier 1 capital deductions.
24    


STATE STREET CORPORATION
EARNINGS RELEASE ADDENDUM
RECONCILIATIONS OF SUPPLEMENTARY LEVERAGE RATIOS
We are subject to a minimum Supplementary Leverage Ratio or SLR of 3%, and as a U.S. G-SIB, we must maintain a 2% SLR buffer in order to avoid any limitations on distributions to shareholders and discretionary bonus payments to certain executives.
(Dollars in millions)As of
March 31, 2020
As of
June 30, 2020
As of
September 30, 2020
As of
December 31, 2020
As of
March 31, 2021
As of
June 30, 2021
As of
September 30, 2021
As of
December 31, 2021
Tier 1 CapitalA$14,586 $15,639 $16,296 $16,848 $15,419 $15,667 $17,807 $17,921 
On-and off-balance sheet leverage exposure279,537 198,266 206,985 216,900 223,451 241,743 246,609 251,879 
Less: regulatory deductions(9,275)(9,234)(9,261)(9,353)(9,586)(9,500)(9,507)(9,442)
Total leverage exposure for SLRB$270,262 $189,032 $197,724 $207,547 $213,865 $232,243 $237,102 $242,437 
Supplementary Leverage RatioA/B5.4 %8.3 %8.2 %8.1 %7.2 %6.7 %7.5 %7.4 %
25    
January 19, 2022 (NYSE: STT) 4Q and FY 2021 Financial Highlights


2 Preface and forward-looking statements This presentation includes certain highlights of, and also material supplemental to, State Street Corporation’s news release announcing its fourth quarter 2021 financial results. That news release contains a more detailed discussion of many of the matters described in this presentation and is accompanied by an Addendum with detailed financial tables. This presentation is designed to be reviewed together with that news release and that Addendum, which are available on State Street’s website, at http://investors.statestreet.com, and are incorporated herein by reference. This presentation (and the conference call accompanying it) contains forward-looking statements as defined by United States securities laws. These statements are not guarantees of future performance, are inherently uncertain, are based on assumptions that are difficult to predict and have a number of risks and uncertainties. The forward-looking statements in this presentation speak only as of the time this presentation is first furnished to the SEC on a Current Report on Form 8-K, and State Street does not undertake efforts to revise forward-looking statements. See “Forward-looking statements” in the Appendix for more information, including a description of certain factors that could affect future results and outcomes. Certain financial information in this presentation is presented on both a GAAP basis and on a basis that excludes or adjusts one or more items from GAAP. The latter basis is a non-GAAP presentation. Refer to the Appendix for explanations of our non-GAAP financial measures and to the Addendum for reconciliations of our non-GAAP financial information.


3 FY2021 highlights Pre-tax margin (ex-notables) A Operating leverage (ex-notables) A EPS growth (ex-notables) A 26.3% 27.6% 2020 2021 +1.3%pts $6.70 $7.44 20212020 +11%+4.0%pts +0.4%pts Fee Operating Leverage Total Operating Leverage Generated both positive total and fee operating leverage for FY2021 Business momentum • Record AUC/A of $43.7T and record AUM of $4.1T at year-end1 • Achieved record servicing wins of $3.5T, with $2.8T of new business yet to be installed at year-end1 • Reported 9 State Street Alpha SM new wins, with 10 total mandates live1 • Announced proposed acquisition of BBH Investor Services • Launched State Street Digital • Record Servicing fees of $5.5B, up 7% • Record management fees of $2.1B, up 9% ‒ Net inflows of $196B driven by record ETF and robust Institutional flows • Continued momentum in CRD with revenue growth of 11% and record bookings of $62MB • Total revenue growth of 3%, with fee revenue up 5% • Company-wide productivity efforts achieved gross savings of ~$330M3 ‒ Gained efficiencies through operations, IT, and vendor management ‒ Real estate utilization reached 115% • Reinvested in the business to drive growth and further productivity: ‒ Incremental investments of ~$250M to support client needs and tech innovation3 Revenue generation Expense management A Financial metrics ex-notable items are non-GAAP measures; refer to the Appendix for explanations and reconciliations of our non-GAAP measures. B CRD revenue growth on a standalone basis (see slide 11, including footnote A). Refer to endnote 2 for further details on CRD bookings. Refer to the Appendix included with this presentation for endnotes 1 to 17. All comparisons are to 2020, unless otherwise noted


4 4Q21 highlights All comparisons are to corresponding prior year periods unless noted otherwise • Total average assets of $303B, up 9% YoY and 4% QoQ • ROE of 10.3% and a CET1 ratio of 14.2%4 • Returned $209M to shareholders in 4Q21 in the form of common stock dividends paid • Partnered with veteran-owned firms to underwrite our $500M senior note issuance in November 2021 Balance sheet and capital • EPS of $1.78, up 28%; $2.00 ex-notable items, up 18%A • Total revenue of $3.1B, up 5%; 3% ex-notablesA ‒ Fee revenue up 4%, with Servicing and Management fees up 6% and 8%, respectively ‒ Net interest income down (3)% • Total expenses of $2.3B, up 2%; 1% ex-notablesA ‒ Pre-tax margin up 2%pts; 1%pts ex-notablesA ‒ Generated positive total and fee operating leverage of 2%pts each Financial performance • AUC/A of $43.7T at quarter-end; Servicing wins of $332B and new business yet to be installed of $2.8T at quarter-end1 • Continued CRD and Alpha momentum ‒ 1 new Alpha mandate, 3 installations, and 10 total mandates live as of the end of 4Q21 ‒ CRD bookings of $11M and revenue growth of 13%B • AUM of $4.1T at quarter-end, with quarterly net inflows of $79B driven by both ETF and institutional inflows1 Business momentum A Financial metrics ex-notable items are non-GAAP measures; refer to the Appendix for explanations and reconciliations of our non-GAAP measures. B CRD revenue growth on a standalone basis (see slide 11, including Footnote A). Refer to endnote 2 for further details on CRD bookings. Refer to the Appendix included with this presentation for endnotes 1 to 17.


5 4Q21 notable items Acquisition and restructuring of $26M • Acquisition and restructuring costs primarily associated with the CRD acquisition Net repositioning release of $3M • Repositioning release of $32M related to compensation and benefits, partially offset by occupancy costs of $29M related to real estate footprint optimization Deferred compensation expense acceleration of $147M • Deferred compensation expense acceleration associated with an amendment of certain outstanding deferred cash incentive compensation awardsB – To make our pay practices more competitive, the acceleration is part of a plan to increase the immediate versus the deferred portion of total cash incentive compensation in future periods Gain on sale of investment securities of $58M • Reflects a one-time sale of Libor and Euribor based securities previously classified as HTM A Refer to the Addendum for further details on notable items. B Amendment removes continued service requirements for deferred cash incentive compensation, thereby accelerating the future expense that would have been recognized over the remaining term of the awards (1-4 years). 4Q20 3Q21 4Q21 Acquisition and restructuring costs ($12) ($18) ($26) ($0.05) Repositioning release / (charge) - Compensation & employee benefits and occupancy (133) - 3 0.01 Deferred compensation expense acceleration - - (147) (0.29) Gain on sale - - 58 0.11 Total notable items (pre-tax) ($145) ($18) ($112) ($0.22) ($M, except EPS data) QuartersA 4Q21 EPS Impact


6 Summary of 4Q21 and FY2021 financial results A Currency translation increased both Fee revenue and Total expenses in FY2021 by ~1%pts each. B This is a non-GAAP presentation; refer to the Appendix for a reconciliation of ex-notable items/currency translation and further explanations of non-GAAP measures. Refer to the Appendix included with this presentation for endnotes 1 to 17. 4Q20 3Q21 4Q21 3Q21 4Q20 2020 2021 %∆A Revenue: Servicing fees $1,307 $1,395 $1,384 (1)% 6% $5,167 $5,549 7% Management fees 493 526 530 1 8 1,880 2,053 9 Foreign exchange trading services 324 279 300 8 (7) 1,363 1,211 (11) Securities finance 88 106 102 (4) 16 356 416 17 Software and processing fees 204 198 195 (2) (4) 733 783 7 Total fee revenue 2,416 2,504 2,511 0.3 3.9 9,499 10,012 5.4 Net interest income 499 487 484 (0.6) (3.0) 2,200 1,905 (13.4) Other income 2 (1) 58 nm nm 4 110 nm Total revenue $2,917 $2,990 $3,053 2.1% 4.7% $11,703 $12,027 2.8% Provision for credit losses5 - ($2) ($7) nm nm $88 ($33) nm Total expenses $2,276 $2,116 $2,330 10.1% 2.4% $8,716 $8,889 2.0% Net income $537 $714 $697 (2.4)% 29.8% $2,420 $2,693 11.3% nm Diluted earnings per share $1.39 $1.96 $1.78 (9.2)% 28.1% $6.32 $7.19 13.8% Return on average common equity 8.4% 11.6% 10.3% (1.3)%pts 1.9%pts 10.0% 10.7% 0.7%pts Tax rate 16.1% 18.5% 4.6% (13.9)%pts (11.5)%pts 16.5% 15.1% (1.4)%pts Pre-tax margin 22.0% 29.3% 23.9% (5.4)%pts 1.9%pts 24.8% 26.4% 1.6%pts nm Ex-notable items, non-GAAP B: Total revenue $2,917 $2,990 $2,995 0.2% 2.7% $11,703 $11,916 1.8% Total expenses $2,131 $2,098 $2,160 3.0% 1.4% $8,542 $8,662 1.4% EPS $1.69 $2.00 $2.00 - 18.3% $6.70 $7.44 11.0% Pre-tax margin 26.9% 29.9% 28.1% (1.8)%pts 1.2%pts 26.3% 27.6% 1.3%pts nm (GAAP, $M, except EPS data, or where otherwise noted) Quarters %∆ Full Year


7 AUC/A and AUM levels, markets and flows performance AUC/A and AUM A Market indices6 • 13% and 1% increase from 4Q20 and 3Q21, respectively, largely driven by: – Higher market levels, client flows, and net new business growth • 19% and 7% increase from 4Q20 and 3Q21, respectively, reflecting: – Higher market levels and net inflows AUC/A ($T, as of period-end)1 AUM ($B, as of period-end)1 Select industry flows7 +7% +1% $38.8 $43.3 $43.7 3Q214Q20 4Q21 4Q20 $4,138 3Q21 4Q21 $3,467 $3,862 +13% +19% A Changes to AUC/A and AUM also reflect currency translation. B Line items may not sum to total due to rounding. Refer to the Appendix included with this presentation for endnotes 1 to 17. 3Q21 4Q20 EOP 11% 27% Daily Avg 4 29 EOP 2 9 Daily Avg (1) 16 EOP (2) (5) Daily Avg (3) 5 (% change) 4Q21 vs S&P 500 MSCI EAFE MSCI EM Barclays Global Agg EOP (1) (5) 4Q20 3Q21 4Q21 Long Term Funds $74 $150 $53 Money Market (82) 15 219 ETF 120 77 195 North America Total 112 242 468 EMEA Total 357 225 237 ($B) Total flowsB


8 Servicing fees of $1,384M up 6% YoY and down (1)% QoQ • Up 6% YoY primarily driven by higher average equity market levels, client activity and flows and net new business, partially offset by normal pricing headwinds • Down (1)% QoQ mainly due to client activity/adjustments and the impact of currency translation, partially offset by higher net new business • Record FY2021 Servicing fees of $5,549M, up 7% YoY Revenue: Servicing fees Servicing fees ($M) 4Q21 performance $1,307 $1,371 $1,399 $1,395 $1,384 2Q214Q20 4Q211Q21 3Q21 $2,917 $2,950 $3,034 $2,990 $3,053 YoY +5% QoQ +2% Total revenue AUC/A wins $205 $343 $1,187 $1,657 $332 436 463 1,236 2,733 2,795 AUC/A to be installed AUC/A sales performance indicators ($B) 1 • Servicing fees were negatively impacted by currency translation when compared to 4Q20 and 3Q21 by $10M each Investment Services business momentum • Continued revenue momentum YoY across key client segments including Asset Managers and Alternatives • Solid 4Q21 AUC/A wins of $332B contributed to a record year of $3.5T, driven by both Alpha and traditional wins1 – Includes $2.8T of won but not yet installed AUC/A as of 4Q211 – Increased segment diversification with Asset Owners and Insurance segments together representing over 75% of 4Q21 AUC/A wins1 – Strength across North America and EMEA A This is a non-GAAP presentation; refer to the Appendix for a reconciliation of ex-notable items/currency translation and further explanations of non-GAAP measures. Refer to the Appendix included with this presentation for endnotes 1 to 17. +6% +7% ex-FX A -1%


9 Revenue: Management fees Management fees ($M) 4Q21 performance $2,917 $2,950 $3,034 $2,990 $3,053 YoY +5% QoQ +2% Total revenue Record management fees of $530M up 8% YoY; up 1% QoQ • Up 8% YoY primarily reflecting higher average equity market levels and ETF net inflows, partially offset by a previously reported client asset reallocation and money market fee waivers • Up 1% QoQ largely due to higher domestic average equity market levels • Investment Management business 4Q21 pre-tax margin of 34%; Record FY2021 pre-tax margin of 32% driven by record fee revenue and disciplined expense managementA AUM $3,467 $3,591 $3,897 $3,862 $4,138 (21) 39 83 (5) 79Net flows Performance indicators ($B) 1 • Management fees were negatively impacted by currency translation when compared to 4Q20 and 3Q21 by $3M and $2M, respectively A Refer to the Addendum for line of business information. Refer to the Appendix included with this presentation for endnotes 1 to 17. +1% 4Q21 $493 4Q20 1Q21 2Q21 3Q21 $493 $504 $526 $530 Investment Management business momentum • ETFs: Record net inflows of $107B for the year, including $50B in 4Q21; continued strength in equity ETF, including SPDR Portfolio Low-Cost suite; strong momentum in fixed income including active ETFs • Institutional: Strong overall FY2021 net inflows of $69B, including $28B in 4Q21, driven by Index Fixed Income and Multi-Asset solutions • Cash: Robust FY2021 net inflows of $20B across the Cash franchise +8%


10 Revenue: Markets, Software and processing fees Markets, Software & processing fees ($M) 4Q21 performance 204 174 216 198 195 88 99 109 106 102 324 346 286 279 300 4Q20 $619$616 2Q211Q21 3Q21 4Q21 $611 $583 $597 FX trading Securities finance Software & processing $2,917 $2,950 $3,034 $2,990 $3,053 Total revenue YoY +5% QoQ +2% -7% +16% -4% YoY % • FX trading services of $300M – Down (7)% YoY primarily reflecting lower FX volatility – Up 8% QoQ mainly due to higher FX volatility, partially offset by lower client FX volumes • Securities finance of $102M – Up 16% YoY mainly reflecting higher client securities loan balances and new business wins in Enhanced Custody – Down (4)% QoQ primarily driven by lower specials and agency spreads • Software and processing fees of $195M – Down (4)% YoY and (2)% QoQ mainly reflecting lower market-related adjustments, partially offset by higher CRD revenue both YoY and QoQ


11 59 60 64 62 70 20 27 27 31 24 36 17 63 28 36 4Q20 1Q21 3Q212Q21 4Q21 $115 $104 $154 $121 $130 Professional services Software- enabled (including SaaS) 8 On-prem 8 CRD and Alpha mandates +13% 19% YoY growth CRD financial performance (Standalone basis, $M)A • 4Q21 revenue of $130M – Up 13% YoY primarily due to growth in software-enabled and professional services revenue – Up 7% QoQ largely driven by software-enabled revenue and higher On-prem renewals • FY2021 revenue of $509M increased 11% YoY, second consecutive year of double-digit growth • Continued business momentum with quarterly bookings of $11M; record bookings of $62M for the year2 Alpha highlights • Announced 1 Alpha mandate win and 3 Alpha mandates went live in 4Q211 – 19 total Alpha clients signed since inceptionB – 10 of 19 Alpha clients now live as of the end of 4Q21 • Alpha Data Platform, our cloud-native data management solution, went live with its first client Pre-tax income 9 $48 $37 $84 $48 $53 5 4 19 28 11 223 225 230 239 244 98 103 93 105 117 New bookings 2 ARR 10 Uninstalled revenue backlog A For 4Q21, CRD standalone results include revenue of $130M and pre-tax income of $53M, which includes $19M of revenue associated with affiliates, including SSGA, that is eliminated in consolidation for financial reporting purposes. On a consolidated basis, CRD revenue contributed $111M, including $108M in Software and processing fees and $4M in FX trading services; revenue line items may not sum to total due to rounding. B Excludes SSGA. Refer to the Appendix included with this presentation for endnotes 1 to 17. +7% CRD 4Q21 highlights (Standalone basis)A


12 Revenue: Net interest income NII and NIM ($M)11 Average balance sheet highlights ($B)A Total average assets of $303B up 9% YoY and up 4% QoQ • Up 9% YoY and 4% QoQ largely driven by higher total average deposits A Line items are rounded. Refer to the Appendix included with this presentation for endnotes 1 to 17. NII of $484M down (3)% YoY and (1)% QoQ • Down (3)% YoY primarily driven by lower investment portfolio yields, partially offset by higher loan balances, and growth in the investment portfolio and deposits • Down (1)% QoQ mainly due to the absence of a larger than usual reduction in premium amortization in 3Q21, partially offset by higher loan balances 4Q20 3Q21 4Q21 Total assets $277 $291 $303 Interest-earning assets 238 255 265 Loans 28 32 34 Investment portfolio (ex. MMLF) 108 114 114 HTM % (ex. MMLF) 44% 39% 38% Duration 12 3.0 3.1 2.9 Total deposits $206 $233 $240 $2,917 $2,950 $3,034 $2,990 $3,053 YoY +5% QoQ +2% Total revenue NIM 11 (FTE, %) 0.84% 0.75% 0.71% 0.76% 0.73% 2Q21 $467 3Q214Q20 4Q211Q21 $467 $499 $487 $484 -1% -3%


13 Expenses Expenses (Ex-notable items, non-GAAP, $M) A 4Q21 performance (Ex-notable items, non-GAAP)A $2,276 $2,116 $2,330 39,439 38,932 38,784 GAAP Expense Head- count 322 283 316 257 253 238 394 406 436 1,047 1,054 1,066 4Q20 3Q21 $2,160 4Q21 $2,131 $2,098 A This is a non-GAAP presentation; refer to the Appendix for a reconciliation of ex-notable items/currency translation and further explanations of non-GAAP measures. Refer to the Appendix included with this presentation for endnotes 1 to 17. Comp. & benefits Info. sys. Tran. processing Other 13 Occupancy • Total GAAP expenses were positively impacted by currency translation when compared to 4Q20 and 3Q21 by $12M each Expenses of $2,160M up 1% YoY and up 3% QoQ • Compensation and employee benefits of $1,066M 14 – Up 2% YoY primarily driven by higher incentive compensation and medical costs, partially offset by lower headcount and salaries – Up 1% QoQ mainly due to higher incentive compensation and medical costs partially offset by the impact of currency translation • Information systems and communications of $436M – Up 11% YoY and 7% QoQ mainly reflecting higher technology infrastructure investments and equipment expenses • Transaction processing services of $238M – Down (7)% YoY largely driven by lower market data costs and broker fees – Down (6)% QoQ primarily driven by lower sub-custody expenses from savings initiatives and lower broker fees • Occupancy of $104M14 – Down (6)% YoY mainly due to footprint optimization • Other of $316M14 – Down (2)% YoY largely reflecting lower sub-advisory fees and professional fees – Up 12% QoQ primarily due to higher marketing spend 104102111 YoY +2% QoQ +10% +1% +2% ex-FX A +3% YoY (2)% QoQ flat


14 Capital ratios Capital ratios 4 (%, as of period-end) Capital highlights Capital ($B unless noted otherwise, capital metrics as of period-end) 4Q20 3Q21 4Q21 Standardized CET1 CET1 capital $14.4 $15.8 $15.9 Risk weighted assets 117 117 112 Tier 1 leverage Tier 1 capital 16.8 17.8 17.9 Leverage exposure 17 263 282 294 ROE (%) 8.4% 11.6% 10.3% CET1 (Standardized) Tier 1 Leverage SCB 16 Minimum ratio 8.0% Target state 10-11% G-SIB surcharge 15 6.4% 6.3% 6.1% 4Q214Q20 3Q21 Target state Minimum ratio4.0% STT Target5.25-5.75% STT Target • 4Q21 standardized CET1 ratio of 14.2% increased 0.7%pts QoQ primarily reflecting an episodic reduction in risk-weighted assets and higher retained earnings • 4Q21 Tier 1 leverage ratio of 6.1% decreased (0.2)%pts QoQ mainly driven by higher client deposits • Returned $209M to shareholders in 4Q21 in the form of common stock dividends paid 12.3% 13.5% 14.2% 4.5% 2.5% 4Q20 3Q21 4Q21 1.0% Refer to the Appendix included with this presentation for endnotes 1 to 17.


15 Summary 4Q21 financial review • EPS of $1.78, up 28%; pre-tax margin of 23.9%, up 1.9%pts; ROE of 10.3%; generated positive total and fee operating leverage of 2.3%pts and 1.5%pts • EPS ex-notable items of $2.00, up 18%A – Fee revenue up 4%, with Servicing and Management fees up 6% and 8%, respectively – NII down (3)% – Expenses up 1% as higher compensation & benefits and targeted business investments were partially offset by productivity savings and footprint optimizationA – Pre-tax margin of 28.1%, up 1.2%pts A – Operating leverage of 1.3%pts A A Financial metrics ex-notable items are non-GAAP measures; refer to the Appendix for explanations and reconciliations of our non-GAAP measures. All comparisons are to corresponding prior year periods unless noted otherwise 2021 financial review • EPS of $7.19, up 14%; pre-tax margin of 26.4%, up 1.6%pts; ROE of 10.7%; generated positive total and fee operating leverage of 0.8%pts and 3.4%pts • EPS ex-notable items of $7.44, up 11%A – Fee revenue up 5%, with Servicing and Management fees up 7% and 9%, respectively – NII down (13)% – Expenses up 1% largely from business investments, higher revenue-related expenses and currency translation headwind, partially offset by productivity savings and footprint optimization A – Pre-tax margin of 27.6%, up 1.3%pts A – Operating leverage of 0.4%pts A


16 FY2022 Outlook Tax rate FY2021 review Expense management (ex-notable items)C NII Fee revenue Operating environment FY2022 outlook • Equity market period-end growth, up 5% • Continued normalization of FX market volatility • Expect strengthening U.S. dollar • Up 3-4%; includes currency translation headwind of ~1% • Up 10-12%, with 3 U.S. rate hikes in 2022 • Effective tax rate of 17-19% • Equity market period-end levels: S&P 500 up 27%; MSCI EAFE up 9%; MSCI EM down (5)% • Fed Funds rate of 25bps and average 10Y U.S. Treasury rate of 1.43% • Up 5% YoYB • Down (13)% YoY • Effective tax rate of 15.1% FY2021 ~5-6% FY2019 FY2020 $8,662M Investments & variable costs ~(3-4)% Optimization savings FY2022E $8,675M $8,542M +1.5-2% • Expenses expected to be up 1.5-2% – Includes currency translation benefit of ~1% – Expect positive total and fee operating leverage +1.5-2%-1.5% +1.4% B DPre-tax margin C 25.8% 26.3% 27.6% Expenses C A The financial outlook does not include the impact of the proposed acquisition of Brown Brothers Harriman’s Investor Services business, which is subject to regulatory approvals and other customary closing conditions. We continue to target closing the acquisition by the end of 1Q22 or as soon thereafter in 2Q22 as possible following completion of the regulatory review process. B Fee revenue and expenses ex- notables increased 4% and 0.3%, respectively, excluding FX impact. C Financial metrics ex-notable items are non-GAAP measures; refer to the Appendix for a reconciliation of ex-notable items/currency translation and further explanations of non-GAAP measures. D Includes currency translation benefit of ~1%. Does not yet include the previously announced acquisition of BBH Investor ServicesA


17 Appendix 4Q21 and FY2021 line of business performance 18-19 Reconciliation of notable items 20 Reconciliation of constant currency impacts 21 Endnotes 22 Forward-looking statements 23 Non-GAAP measures 24 Definitions 25


18 1,956 State StreetB 4Q21 line of business performance Investment Servicing Total revenueA 495 487 1,870 , 4Q21 $2,367M 4Q20 $2,443M Pre-tax income Fee revenue NII Pre-tax margin 25.8% 26.9% +1.1%pts YoY % ∆ +5% -2% +3% +8% Investment Management Total revenue $552M 4Q20 4Q21 $550M Pre-tax income Pre-tax margin 31.8% 34.2% +2.4%pts 4Q20 4Q21 $189M $175M YoY % ∆ Flat +8% Total revenue ex-notable itemsA, C 499 484 2,416 2,511 $2,995M 4Q214Q20 $2,917M Pre-tax income ex-notable itemsC Fee revenue NII Pre-tax margin ex-notable itemsC 26.9% 28.1% +1.2%pts YoY % ∆ +4% -3% +3% +7% A Total revenue also includes Other income of $2M in 4Q20. B State Street includes line of business results from Investment Servicing, Investment Management, and Other. Refer to the Addendum for further line of business information. C This is a non-GAAP presentation; refer to the Appendix for a reconciliation of ex-notable items and further explanations of non-GAAP measures. $657M 4Q20 4Q21 $611M 4Q20 4Q21 $786M $842M


19 7,879 State StreetB FY2021 line of business performance Investment Servicing Total revenueA 2,211 1,919 7,514 , 2020 2021 $9,729M $9,797M Pre-tax income Fee revenue NII Pre-tax margin 26.4% 27.0% +0.6%pts 2020 2021 $2,570M $2,648M YoY % ∆ +5% -13% +1% +3% Investment Management Total revenue 20212020 $1,974M $2,119M Pre-tax income Pre-tax margin 25.5% 31.8% +6.3%pts $503M 2020 2021 $674M YoY % ∆ +7% +34% Total revenue ex-notable itemsA, C 2,200 1,905 9,499 10,012 2020 2021 $11,703M $11,916M Pre-tax income ex-notable itemsC Fee revenue NII Pre-tax margin ex-notable itemsC 26.3% 27.6% +1.3%pts 2020 2021 $3,287M $3,073M YoY % ∆ +5% -13% +2% +7% A Total revenue also includes Other income of $(1)M and $4M in FY2021 and FY2020, respectively. B State Street includes line of business results from Investment Servicing, Investment Management, and Other. Refer to the Addendum for further line of business information. C This is a non-GAAP presentation; refer to the Appendix for a reconciliation of ex-notable items and further explanations of non-GAAP measures.


20 Reconciliation of notable items A Calculated as the period-over-period change in total fee revenue less the period-over-period change in total expenses. B Calculated as the period-over-period change in total fee revenue, excluding notable items less the period-over-period change in total expenses, excluding notable items. C Calculated as the period-over-period change in total revenue less the period-over-period change in total expenses. D Calculated as the period-over-period change in total revenue, excluding notable items less the period-over-period change in total expenses, excluding notable items. Quarterly reconciliation % Change (Dollars in millions, unless noted otherwise) 1Q20 2Q20 3Q20 4Q20 1Q21 2Q21 3Q21 4Q21 4Q21 vs. 4Q20 4Q21 vs. 3Q21 2020 2021 YTD2021 vs. YTD2020 Total revenue, GAAP-basis 3,065 2,937 2,784 2,917 2,950 3,034 2,990 3,053 4.7% 2.1% 11,703 12,027 2.8% Less: Other income (53) (58) 0 (111) Total revenue, excluding notable items 3,065 2,937 2,784 2,917 2,950 2,981 2,990 2,995 2.7% 0.2% 11,703 11,916 1.8% Total expenses, GAAP basis 2,255 2,082 2,103 2,276 2,332 2,111 2,116 2,330 2.4% 10.1% 8,716 8,889 2.0% Less: Notable expense items: Repositioning release/(charges): Compensation and employee benefits (82) 32 (82) 32 Occupancy (51) (29) (51) (29) Repositioning release/(charges) (133) 3 (133) 30 Acquisition and restructuring costs (11) (12) (15) (12) (10) (11) (18) (26) (50) (65) Deferred compensation expense acceleration (147) (147) Legal and other: Information systems and communications (20) 0 (20) Transaction processing services (8) 0 (8) Other 9 (1) 11 9 10 Legal and other 9 (29) 11 9 (18) Total expenses, excluding notable items 2,244 2,070 2,097 2,131 2,293 2,111 2,098 2,160 1.4% 3.0% 8,542 8,662 1.4% Seasonal expenses (151) (176) (151) (176) Total expenses, excluding notable items and seasonal expense items 2,093 2,070 2,097 2,131 2,117 2,111 2,098 2,160 1.4% 3.0% 8,391 8,486 1.1% Fee operating leverage, GAAP-basis (%pts)A 150 bps (980) bps 340 bps Fee operating leverage, excluding notable items (%pts)B 250 (270) 400 Total operating leverage, GAAP-basis (%pts)C 230 (800) 80 Total operating leverage, excluding notable items (%pts)D 130 (280) 40 Pre-tax margin, GAAP-basis (%) 25.3% 27.3% 24.5% 22.0% 21.3% 30.9% 29.3% 23.9% 190 (540) 24.8% 26.4% 160 Notable items as reconciled above (%) 0.3% 0.4% 0.2% 4.9% 1.3% (1.2%) 0.6% 4.2% 1.5% 1.2% Pre-tax margin, excluding notable items (%) 25.6% 27.7% 24.7% 26.9% 22.6% 29.7% 29.9% 28.1% 120 (180) 26.3% 27.6% 130 Net income available to common shareholders, GAAP-basis 580 662 517 498 489 728 693 662 32.9% (4.5)% 2,257 2,572 14.0% Notable items as reconciled above: pre-tax 11 12 6 145 39 (53) 18 112 174 116 Tax impact on notable items as reconciled above (3) (3) (4) (37) (10) 16 (5) (29) (47) (28) Preferred securities cost 9 5 9 5 Net income available to common shareholders, excluding notable items 597 671 519 606 523 691 706 745 22.9% 5.5% 2,393 2,665 11.4% Diluted EPS, GAAP-basis 1.62 1.86 1.45 1.39 1.37 2.07 1.96 1.78 28.1% (9.2)% 6.32 7.19 13.8% Notable items as reconciled above 0.05 0.02 0.00 0.30 0.10 (0.10) 0.04 0.22 0.38 0.25 Diluted EPS, excluding notable items 1.67 1.88 1.45 1.69 1.47 1.97 2.00 2.00 18.3% - 6.70 7.44 11.0% % Change Year-to-Date


21 Reconciliation of constant currency impacts A Other includes Other expenses and Amortization of intangible assets. Reconciliation of Constant Currency FX Impacts (Dollars in millions) 4Q20 3Q21 4Q21 4Q21 vs. 4Q20 4Q21 vs. 3Q21 4Q21 vs. 4Q20 4Q21 vs. 3Q21 4Q21 vs. 4Q20 4Q21 vs. 3Q21 Non-GAAP basis Total revenue, excluding notable items $ 2,917 $ 2,990 $ 2,995 $ (16) $ (16) $ 3,011 $ 3,011 3.2% 0.7% Compensation and employee benefits, excluding notable items $ 1,047 $ 1,054 $ 1,066 $ (8) $ (6) $ 1,074 $ 1,072 2.6% 1.7% Information systems and communications, excluding notable items 394 406 436 (1) (1) 437 437 10.9% 7.6% Transaction processing services, excluding notable items 257 253 238 (1) (1) 239 239 (7.0)% (5.5)% Occupancy, excluding notable items 111 102 104 (1) (1) 105 105 (5.4)% 2.9% Other expenses, excluding notable itemsA 322 283 316 (1) (3) 317 319 (1.6)% 12.7% Total expenses excluding notable items $ 2,131 $ 2,098 $ 2,160 $ (12) $ (12) $ 2,172 $ 2,172 1.9% 3.5% Reported Currency Translation Impact Excluding Currency Impact % Change Constant Currency


22 Endnotes 1. New asset servicing mandates, including announced front-to-back investment servicing clients, may be subject to completion of definitive agreements, approval of applicable boards and shareholders and customary regulatory approvals. New asset servicing mandates and servicing assets remaining to be installed in future periods exclude new business which has been contracted, but for which the client has not yet provided permission to publicly disclose and is not yet installed. These excluded assets, which from time to time may be significant, will be included in new asset servicing mandates and reflected in servicing assets remaining to be installed in the period in which the client provides its permission. Servicing mandates and servicing assets remaining to be installed in future periods are presented on a gross basis and therefore also do not include the impact of clients who have notified us during the period of their intent to terminate or reduce their relationship with State Street, which from time to time may be significant. New business in assets to be serviced is reflected in our AUC/A after we begin servicing the assets, and new business in assets to be managed is reflected in our AUM after we begin managing the assets. As such, only a portion of any new asset servicing and asset management mandates may be reflected in our AUC/A and AUM as of any particular date specified. Consistent with past practice, AUC/A values for certain asset classes are based on a lag, typically one-month. Generally, our servicing fee revenues are affected by several factors including changes in market valuations, client activity and asset flows, net new business and the manner in which we price our services. We provide a range of services to our clients, including core custody services, accounting, reporting and administration and middle office services, and the nature and mix of services provided affects our servicing fees. The basis for fees will differ across regions and clients. The industry in which we operate has historically faced pricing pressure, and our servicing fee revenues are also affected by such pressures today. Consequently, no assumption should be drawn as to future revenue run rate from announced servicing wins or new servicing business yet to be installed, as the amount of revenue associated with AUC/A can vary materially. Management fees generally are affected by our level of AUM and differ based upon the nature, type and investment strategy of the investment product. Management fee revenue is more sensitive to market valuations than servicing fee revenue, as a higher proportion of the underlying services provided, and the associated management fees earned, are dependent on equity and fixed-income security valuations. Additional factors, such as the relative mix of assets managed, may have a significant effect on our management fee revenue. While certain management fees are directly determined by the values of AUM and the investment strategies employed, management fees may reflect other factors, including performance fee arrangements, as well as our relationship pricing for clients. 2. CRD bookings, as presented in this presentation, represent signed annual recurring revenue contract value excluding bookings with affiliates, including SSGA. CRD revenue derived from affiliate agreements is eliminated in consolidation for financial reporting purposes. 3. Company-wide productivity achieved gross savings of ~$330M based on an expenses ex-notable items basis for the comparison between FY2021 and FY2020. FY2021 expenses ex-notable items of $8,662M increased 1% from FY2020 expenses ex-notable items of $8,542M. The increase is primarily driven by incremental investments of ~$250M and variable costs of ~$110M, partially offset by gross savings worth ~$330M. Financial metrics ex-notable items are non-GAAP measures. For further details on explanations and reconciliations of our non-GAAP measures, refer to Reconciliation of notable items and Non-GAAP measures included in the Appendix. 4. Unless otherwise noted, all capital ratios referenced on this slide and elsewhere in this presentation refer to State Street Corporation, or State Street, and not State Street Bank and Trust Company, or State Street Bank. All capital ratios are as of quarter end. The lower of capital ratios calculated under the Basel III advanced approaches and under the Basel III standardized approach are applied in the assessment of our capital adequacy for regulatory purposes. Standardized approach ratios were binding for 4Q21, 3Q21 and 4Q20. Refer to the Addendum for descriptions of these ratios. December 31, 2021 capital ratios are presented as of quarter-end and are estimates. 5. In accordance with ASU 2016-13, the Provision for credit losses for 4Q20, 3Q21, and 4Q21 includes the provision on funded and unfunded commitments as well as HTM securities. 6. The index names listed are service marks of their respective owners. 7. Morningstar data includes long-term mutual funds, ETF’s and Money Market funds. Mutual fund data represents estimates of net new cash flow, which is new sales minus redemptions combined with net exchanges, while ETF data represents net issuance, which is gross issuance less gross redemptions. Data for Fund of Funds, Feeder funds and Obsolete funds were excluded from the series to prevent double counting. Data is from the Morningstar Direct Asset Flows database. The long-term fund flows reported by Morningstar in North America are composed of U.S. domiciled Market flows mainly in Equities, Allocation and Fixed Income asset classes. 4Q21 data for North America (U.S. domiciled) includes Morningstar actuals for October and November 2021 and Morningstar estimates for December 2021. 4Q21 data for EMEA is on a rolling three month basis for September 2021 through November 2021. 8. On-prem revenue is revenue derived from locally installed software. Software-enabled revenue includes software as a service, maintenance and support revenue, FIX, brokerage, and value-add services. Revenue recognition pattern for on-prem installations differs from software-enabled revenue. 9. Revenue and pre-tax income reflects the application of ASC 606. Revenue recognition under ASC 606 results in the acceleration of a significant portion of revenues for on-prem software agreements when a client goes live or renews their contract with us. The amount of revenue recognized in any given quarter will be driven in large part by client activity, including agreements that renew or are installed in that quarter. 10. CRD ARR, an operating metric, is calculated by annualizing current quarter revenue and includes annualized amount of most software-enabled revenue, including revenue generated from Software-as-a-service, maintenance and support revenue, revenue from the Charles River Network’s FIX Network Service (CRN), and value-added services, which are all expected to be recognized ratably over the term of client contracts. ARR excludes software-enabled brokerage revenue. ARR of $223M, $239M and $244M in 4Q20, 3Q21 and 4Q21, respectively, include annualized intercompany revenue of $21M for each of the corresponding periods. 11. NII is presented on a GAAP-basis. NIM is presented on an FTE-basis. Refer to the Addendum for reconciliations of NII FTE-basis to NII GAAP-basis on the Average Statement of Condition. 12. Duration as of period end and based on total investment portfolio, including MMLF. 13. Other includes Other expenses and Amortization of intangible assets 14. Compensation and benefits expenses in 4Q21 and 4Q20 included notable items related to repositioning benefits of $32M and charges of $82M, respectively. 4Q21 also included notable items related to a deferred compensation expense acceleration of $147M. Excluding these notable items, 4Q21 adjusted Compensation and benefits of $1,066M was up 2% compared to 4Q20 adjusted Compensation and benefits of $1,047M and up 1% compared to 3Q21 Compensation and benefits of $1,054M. Occupancy expenses in 4Q21 and 4Q20 included notable items related to repositioning charges of $29M and $51M, respectively. Excluding these notable items, 4Q21 adjusted Occupancy of $104M was down (6)% compared to 4Q20 adjusted Occupancy of $111M and up 2% compared to 3Q21 Occupancy expenses of $102M. Other expenses in 4Q21, 3Q21, and 4Q20 included notable items related to acquisition and restructuring costs of $26M, $18M, and $12M, respectively. Excluding all these notable items, 4Q21 Other expenses of $316M was down (2)% compared to 4Q20 adjusted Other expenses of $322M and up 12% compared to 3Q21 adjusted Other expenses of $283M. 15. Based on a calculation date of December 31, 2019, our G-SIB surcharge for 2021 is 1.0%. 16. The preliminary SCB of 2.5% effective on October 1, 2021 is calculated based upon the results of the CCAR 2021 exam. 17. Leverage exposure is equal to average consolidated assets less applicable Tier 1 leverage capital reductions.


23 Forward-looking statements This presentation (and the conference call referenced herein) contains forward-looking statements within the meaning of United States securities laws, including statements about our goals and expectations regarding our business, financial and capital condition, results of operations, strategies, the financial and market outlook, proposed acquisition of Brown Brothers Harriman’s Investor Services business, dividend and stock purchase programs, governmental and regulatory initiatives and developments, expense reduction programs, new client business, and the business environment. Forward-looking statements are often, but not always, identified by such forward-looking terminology as “outlook,” “intend,” “target,” “guidance,” “expect,” “priority,” “objective,” “plan,” “forecast,” “believe,” “anticipate,” “estimate,” “seek,” “may,” “will,” “trend,” “strategy” and “goal,” or similar statements or variations of such terms. These statements are not guarantees of future performance, are inherently uncertain, are based on current assumptions that are difficult to predict and involve a number of risks and uncertainties. Therefore, actual outcomes and results may differ materially from what is expressed in those statements, and those statements should not be relied upon as representing our expectations or beliefs as of any time subsequent to the time this presentation is first issued. Important factors that may affect future results and outcomes include, but are not limited to: The possibility that some or all of the anticipated business, financial, capital, staffing, operational or other benefits or synergies of the acquisition of the BBH Investor Services business will not be realized when expected or at all, including as a result of the impact of, additional costs or unanticipated negative synergies associated with, or problems arising from, the integration of the BBH Investor Services business (including challenges in transitioning clients, systems, technology or personnel), as a result of regulatory or operational challenges we may experience, as a result of disruptions from the transaction harming relationships (including those resulting from the announcement of the transaction) with our clients, employees or regulators, or as a result of the strength of the economy and competitive factors in the areas where we and the BBH Investor Services business do business; The failure to obtain necessary regulatory approvals (and the risk that such approvals may result in the imposition of conditions that could adversely affect us or the expected benefits of the transaction, perhaps materially), to satisfy any of the other conditions to the acquisition or at all, in each case, on a timely basis or at all; and, if delayed, the resulting effects, including in magnitude and timing of the expected financial benefits of the acquisition of the BBH Investor Services business, of a delayed closing of the acquisition; The occurrence of any event, change or other circumstances that could give rise to the termination of the definitive purchase agreement in respect of the acquisition of the BBH Investor Services business; Potential adverse changes in demand for the products and services of State Street and of the BBH Investor Services business; We are subject to intense competition, which could negatively affect our profitability; We are subject to significant pricing pressure and variability in our financial results and our AUC/A and AUM; Our development and completion of new products and services, including State Street Alpha and State Street Digital, and our enhancement of the capabilities of our existing products and services in light of changed client needs and competitive pressures, may involve costs and dependencies and expose us to increased risk; Our business may be negatively affected by our failure to update and maintain our technology infrastructure; Acquisitions, strategic alliances, joint ventures and divestitures, and the integration, retention and development of the benefits of our acquisitions, pose risks for our business; The COVID-19 pandemic continues to create significant risks and uncertainties for our business; Competition for qualified members of our workforce is intense, and we may not be able to attract and retain the highly skilled people we need to support our business; We could be adversely affected by geopolitical, economic and market conditions; We have significant International operations, and disruptions in European and Asian economies could have an adverse effect on our consolidated results of operations or financial condition; Our investment securities portfolio, consolidated financial condition and consolidated results of operations could be adversely affected by changes in the financial markets; Our business activities expose us to interest rate risk; We assume significant credit risk to counterparties, who may also have substantial financial dependencies with other financial institutions, and these credit exposures and concentrations could expose us to financial loss; Our fee revenue represents a significant portion of our consolidated revenue and is subject to decline based on, among other factors, the investment activities of our clients; If we are unable to effectively manage our capital and liquidity, our consolidated financial condition, capital ratios, results of operations and business prospects could be adversely affected; We may need to raise additional capital or debt in the future, which may not be available to us or may only be available on unfavorable terms; If we experience a downgrade in our credit ratings, or an actual or perceived reduction in our financial strength, our borrowing and capital costs, liquidity and reputation could be adversely affected; Our business and capital-related activities, including common share repurchases, may be adversely affected by capital and liquidity standards required as a result of capital stress testing; We face extensive and changing government regulation in the jurisdictions in which we operate, which may increase our costs and compliance risks; We are subject to enhanced external oversight as a result of the resolution of prior regulatory or governmental matters; Our businesses may be adversely affected by government enforcement and litigation; Any misappropriation of the confidential information we possess could have an adverse impact on our business and could subject us to regulatory actions, litigation and other adverse effects; Our calculations of risk exposures, total RWA and capital ratios depend on data inputs, formulae, models, correlations and assumptions that are subject to change, which could materially impact our risk exposures, our total RWA and our capital ratios from period to period; Changes in accounting standards may adversely affect our consolidated financial statements; Changes in tax laws, rules or regulations, challenges to our tax positions and changes in the composition of our pre-tax earnings may increase our effective tax rate; The transition away from LIBOR may result in additional costs and increased risk exposure; Our control environment may be inadequate, fail or be circumvented, and operational risks could adversely affect our consolidated results of operations; Cost shifting to non-U.S. jurisdictions and outsourcing may expose us to increased operational risk and reputational harm and may not result in expected cost savings; Attacks or unauthorized access to our information technology systems or facilities, or those of the third parties with which we do business, or disruptions to our or their continuous operations, could result in significant costs, reputational damage and impacts on our business activities; Long-term contracts expose us to pricing and performance risk; Our businesses may be negatively affected by adverse publicity or other reputational harm; We may not be able to protect our intellectual property; The quantitative models we use to manage our business may contain errors that could result in material harm; Our reputation and business prospects may be damaged if our clients incur substantial losses or are restricted in redeeming their interests in investment pools that we sponsor or manage; The impacts of climate change could adversely affect us; and We may incur losses as a result of unforeseen events including terrorist attacks, natural disasters, the emergence of a new pandemic or acts of embezzlement. Other important factors that could cause actual results to differ materially from those indicated by any forward-looking statements are set forth in our 2020 Annual Report on Form 10-K and our subsequent SEC filings. We encourage investors to read these filings, particularly the sections on risk factors, for additional information with respect to any forward-looking statements and prior to making any investment decision. The forward-looking statements contained in this Presentation (and the conference call referenced herein) should not by relied on as representing our expectations or beliefs as of any time subsequent to the time this Presentation is first issued, and we do not undertake efforts to revise those forward-looking statements to reflect events after that time.


24 Non-GAAP measures In addition to presenting State Street's financial results in conformity with U.S. generally accepted accounting principles, or GAAP, management also presents certain financial information on a basis that excludes or adjusts one or more items from GAAP. This latter basis is a non-GAAP presentation. In general, our non- GAAP financial results adjust selected GAAP-basis financial results to exclude the impact of revenue and expenses outside of State Street’s normal course of business or other notable items, such as acquisition and restructuring charges, repositioning charges, gains/losses on sales, as well as, for selected comparisons, seasonal items. For example, we sometimes present expenses on a basis we may refer to as “expenses ex-notable items", which exclude notable items and, to provide additional perspective on both prior year quarter and sequential quarter comparisons, may also exclude seasonal items. Management believes that this presentation of financial information facilitates an investor's further understanding and analysis of State Street's financial performance and trends with respect to State Street’s business operations from period-to-period, including providing additional insight into our underlying margin and profitability. In addition, Management may also provide additional non-GAAP measures. For example, we may present revenue and expense measures on a constant currency basis to identify the significance of changes in foreign currency exchange rates (which often are variable) in period-to-period comparisons. This presentation represents the effects of applying prior period weighted average foreign currency exchange rates to current period results. Non-GAAP financial measures should be considered in addition to, not as a substitute for or superior to, financial measures determined in conformity with GAAP. Refer to the Addendum for reconciliations of our non-GAAP financial information. To access the Addendum go to http://investors.statestreet.com and click on “Filings & Reports – Quarterly Earnings”.


25 Definitions ARR Annual recurring revenue AUC/A Assets under custody and/or administration AUM Assets under management Barclays Global Agg Barclays Global Agg represents Barclays Global Aggregate Bond Index BBH Brown Brothers Harriman Bps Basis points, with one basis point representing one hundredth of one percent CET1 ratio Common equity tier 1 ratio CRD Charles River Development CRD uninstalled revenue backlog Uninstalled revenue backlog to be recognized from signed client contracts that are scheduled to be installed on a rolling 24-month period. It reflects terms currently in effect. It includes SaaS and on-prem license revenue, as well as maintenance and support revenue, and excludes revenue generated from FIX, value-add services, brokerage, and professional services. Diluted earnings per share (EPS) Net income available to common shareholders divided by diluted average common shares outstanding for the noted period EAFE Europe, Australia, and Far East EM Emerging markets EMEA Europe, Middle East and Africa EOP End of period EPS Earnings per share EURIBOR Euro Interbank Offered Rate ETF Exchange-traded fund Fee operating leverage Rate of growth of total fee revenue less the rate of growth of total expenses, relative to the successive prior year period, as applicable FTE Fully taxable equivalent FX Foreign exchange FY Full-year GAAP Generally accepted accounting principles in the United States G-SIB Global systemically important bank HTM Held-to-maturity LIBOR London Inter-Bank Offered Rate MMLF Money Market Mutual Fund Liquidity Facility Net interest income (NII) Income earned on interest bearing assets less interest paid on interest bearing liabilities Net interest margin (NIM) Net interest income divided by average interest-earning assets nm Not meaningful On-prem On-premises revenue as recognized in the CRD business Total operating leverage Rate of growth of total revenue less the rate of growth of total expenses, relative to the successive prior year period, as applicable Pre-tax margin Income before income tax expense divided by total revenue %Pts Percentage points is the difference from one percentage value subtracted from another Quarter-over-quarter (QoQ) Sequential quarter comparison Return on equity (ROE) Net income less dividends on preferred stock divided by average common equity RWA Risk weighted assets SaaS Software as a service SCB Stress capital buffer Seasonal expenses Seasonal deferred incentive compensation expenses for retirement-eligible employees and payroll taxes SSGA State Street Global Advisors Year-over-year (YoY) Current period compared to the same period a year ago