Document
falseQ220200000945394 0000945394 2020-08-07 2020-08-07 0000945394 2020-08-06 2020-08-06


UNITED STATES
SECURITIES AND EXCHANGE COMMISSION
WASHINGTON, D.C. 20549
FORM 8-K

CURRENT REPORT PURSUANT
TO SECTION 13 OR 15(d) OF THE
SECURITIES EXCHANGE ACT OF 1934

Date of Report (Date of earliest event reported): August 7, 2020
SERVICE PROPERTIES TRUST
(Exact Name of Registrant as Specified in Its Charter)

Maryland
(State or Other Jurisdiction of Incorporation)

1-11527
 
04-3262075
(Commission File Number)
 
(IRS Employer Identification No.)
Two Newton Place, 255 Washington Street, Suite 300, Newton, Massachusetts 02458-1634
(Address of Principal Executive Offices) (Zip Code)
617-964-8389
(Registrant’s Telephone Number, Including Area Code)
Check the appropriate box below if the Form 8-K filing is intended to simultaneously satisfy the filing obligation of the registrant under any of the following provisions:

                                   Written communications pursuant to Rule 425 under the Securities Act (17 CFR 230.425)
                                    Soliciting material pursuant to Rule 14a-12 under the Exchange Act (17 CFR 240.14a-12)
                                    Pre-commencement communications pursuant to Rule 14d-2(b) under the Exchange Act (17 CFR 240.14d-2(b))
                                    Pre-commencement communications pursuant to Rule 13e-4(c) under the Exchange Act (17 CFR 240.13e-4(c))

Securities registered pursuant to Section 12(b) of the Act:
Title of Each Class
 
Trading Symbol
 
Name of each Exchange on which Registered
Common Shares of Beneficial Interest
 
SVC
 
The Nasdaq Stock Market LLC
Indicate by check mark whether the registrant is an emerging growth company as defined in Rule 405 of the Securities Act of 1933 (§230.405 of this chapter) or Rule 12b-2 of the Securities Exchange Act of 1934 (§240.12b-2 of this chapter).
Emerging growth company  
If an emerging growth company, indicate by check mark if the registrant has elected not to use the extended transition period for complying with any new or revised financial accounting standards provided pursuant to Section 13(a) of the Exchange Act.


Item 2.02. Results of Operations and Financial Condition.

On August 7, 2020, Service Properties Trust, or the Company, issued a press release regarding the Company’s results of operations and financial condition for the quarter and six months ended June 30, 2020, and also provided certain supplemental operating and financial data for the quarter ended June 30, 2020. Copies of the Company’s press release and supplemental operating and financial data are furnished as Exhibits 99.1 and 99.2 hereto, respectively.

Item 9.01. Financial Statements and Exhibits.

(d)                                 Exhibits

99.1                        Press release dated August 7, 2020
99.2                        Second Quarter 2020 Supplemental Operating and Financial Data
104                         Cover Page Interactive Data File (Embedded within the Inline XBRL document.)


SIGNATURES

Pursuant to the requirements of the Securities Exchange Act of 1934, the registrant has duly caused this report to be signed on its behalf by the undersigned hereunto duly authorized.


SERVICE PROPERTIES TRUST


By:
/s/ Brian E. Donley


Name:
Brian E. Donley


Title:
Chief Financial Officer and Treasurer


Dated:
August 7, 2020


EXHIBIT 99.1

svcletterheadheaderq22020.jpg
 
 
FOR IMMEDIATE RELEASE
Contact:
 
Kristin Brown, Director, Investor Relations
 
(617) 796-8232
Service Properties Trust Announces Second Quarter 2020 Results
Second Quarter Net Loss of $0.23 Per Common Share
Second Quarter Normalized FFO of $0.48 Per Common Share


Newton, MA (August 7, 2020). Service Properties Trust (Nasdaq: SVC) today announced its financial results for the quarter and six months ended June 30, 2020:
 
Three Months Ended June 30,
 
Six Months Ended June 30,
 
2020
 
2019
 
2020
 
2019
 
($ in thousands, except per share data)
Net income (loss)
$
(37,349
)
 
$
8,782

 
$
(70,999
)
 
$
234,569

Net income (loss) per common share
$
(0.23
)
 
$
0.05

 
$
(0.43
)
 
$
1.43

Adjusted EBITDAre (1)
$
152,166

 
$
218,972

 
$
347,303

 
$
414,873

Normalized FFO (1)
$
78,158

 
$
168,766

 
$
201,242

 
$
313,406

Normalized FFO per common share (1)
$
0.48

 
$
1.03

 
$
1.22

 
$
1.91

(1)
Additional information and reconciliations of net income (loss) determined in accordance with U.S. generally accepted accounting principles, or GAAP, to certain non-GAAP measures, including EBITDA, EBITDAre, Adjusted EBITDAre, FFO and Normalized FFO, for the three and six months ended June 30, 2020 and 2019 appear later in this press release.
John Murray, President and Chief Executive Officer of SVC, made the following statement:
“While the travel industry and certain service retail businesses continue to experience unprecedented challenges due to the COVID-19 pandemic, we have continued to take proactive steps to increase our liquidity, manage our debt maturities and preserve capital.
“By completing an $800 million note offering and a tender offer for $350 million of our $400 million of 4.25% senior notes due 2021, we believe we have largely addressed our 2021 debt maturities and secured availability under our $1 billion revolving credit facility, which we amended in May 2020 to obtain waivers from compliance with certain financial covenants through March 2021. Along with reducing our quarterly dividend and deferring non-essential capital spending, we plan to further strengthen our financial position by moving forward with certain of our previously planned hotel sales by year end.
“Our earnings during the second quarter reflect the full impact of the COVID-19 pandemic in April, followed by signs of a slow and steady recovery in May and June. Almost all of our hotels are open and occupancies have steadily increased during the quarter to 26.8% in May and 35.5% in June from a low of 21.0% in April when the impact of the COVID-19 pandemic was most acute. Rent collections from our net lease tenants also are trending upward to 80.0% for the month of


A Maryland Real Estate Investment Trust with transferable shares of beneficial interest listed on the Nasdaq.
No shareholder, Trustee or officer is personally liable for any act or obligation of the Trust.


July from a low of 45.6% for the month of April, as businesses that were temporarily closed due to government mandates or guidelines continue to reopen. We have reached rent deferral agreements with 80 of our net lease retail tenants and, as of August 6, 2020, we had agreed to defer an aggregate of $11.3 million of rent for tenants representing approximately 6% of our annual minimum returns and rents. Our travel centers have been resilient as trucking activity has remained steady throughout the quarter.
“Although significant uncertainties remain as to the timeframe and trajectory of a recovery, we believe we are currently well positioned with a diverse portfolio of assets and ample liquidity.”
Results for the Three and Six Months Ended June 30, 2020 and Recent Activities:
Net Income (loss): Net loss for the quarter ended June 30, 2020 was $37.3 million, or $0.23 per diluted common share, compared to net income of $8.8 million, or $0.05 per diluted common share, for the quarter ended June 30, 2019. Net loss for the quarter ended June 30, 2020 includes a $46.7 million, or $0.28 per diluted common share, gain on insurance settlement, net of tax, a $28.5 million, or $0.17 per diluted common share, loss on asset impairment, a $7.0 million, or $0.04 per diluted common share, loss on extinguishment of debt, $3.8 million, or $0.02 per diluted common share, of net unrealized gains on equity securities and a $2.9 million, or $0.02 per diluted common share, net loss on the sale of real estate. Net income for the quarter ended June 30, 2019 includes $60.8 million, or $0.37 per diluted common share, of net unrealized losses on equity securities. The weighted average number of diluted common shares outstanding was 164.4 million and 164.3 million for the quarters ended June 30, 2020 and 2019, respectively.
Net loss for the six months ended June 30, 2020 was $71.0 million, or $0.43 per diluted common share, compared to net income of $234.6 million, or $1.43 per diluted common share, for the six months ended June 30, 2019. Net loss for the six months ended June 30, 2020 includes a $46.7 million, or $0.28 per diluted common share, gain on insurance settlement, net of tax, a $45.3 million, or $0.28 per diluted common share, loss on asset impairment, a $9.8 million, or $0.06 per diluted common share, net loss on the sale of real estate, a $7.0 million, or $0.04 per diluted common share, loss on extinguishment of debt and $1.2 million, or $0.01 per diluted common share, of unrealized losses on equity securities. Net income for the six months ended June 30, 2019 includes $159.5 million, or $0.97 per diluted common share, gain on sale of real estate and $39.8 million, or $0.24 per diluted common share, of net unrealized losses on equity securities. The weighted average number of diluted common shares outstanding was 164.4 million and 164.3 million for the six months ended June 30, 2020 and 2019, respectively.
Adjusted EBITDAre: Adjusted EBITDAre for the quarter ended June 30, 2020 compared to the same period in 2019 decreased 30.5% to $152.2 million.
Adjusted EBITDAre for the six months ended June 30, 2020 compared to the same period in 2019 decreased 16.3% to $347.3 million.
Normalized FFO: Normalized FFO for the quarter ended June 30, 2020 were $78.2 million, or $0.48 per diluted common share, compared to Normalized FFO of $168.8 million, or $1.03 per diluted common share, for the quarter ended June 30, 2019.
Normalized FFO for the six months ended June 30, 2020 were $201.2 million, or $1.22 per diluted common share, compared to Normalized FFO of $313.4 million, or $1.91 per diluted common share, for the six months ended June 30, 2019.

2


Financing Activities:
As previously announced, on May 8, 2020, SVC amended the credit agreement governing its $1.0 billion revolving credit facility and $400.0 million term loan. The amendment provided for a waiver of certain of the financial covenants under its credit agreement through March 31, 2021, or the Waiver Period, during which, subject to certain conditions, SVC will continue to have access to undrawn amounts under the credit facility.
During the Waiver Period, and continuing thereafter until such time as SVC has demonstrated compliance with certain of its financial covenants as of June 30, 2021:
SVC is required to maintain unrestricted liquidity (unrestricted cash or undrawn availability under its $1.0 billion revolving credit facility) of not less than $125.0 million;
The interest rate premium over LIBOR under SVC’s revolving credit facility and term loan increased by 50 basis points;
SVC is required to pledge equity interests of subsidiaries owning properties with a value of approximately two times the balance of loans outstanding under the credit agreement. SVC has pledged subsidiaries owning properties with $876.7 million of unencumbered gross asset value as of June 30, 2020;
SVC’s ability to pay distributions on its common shares has been limited to amounts required to maintain its qualification for taxation as a real estate investment trust and to avoid the payment of certain income and excise taxes, and to pay a cash dividend of $0.01 per common share per quarter;
Certain additional covenants, including additional restrictions on SVC’s ability to incur indebtedness (with exceptions for borrowings under its revolving credit facility and certain other categories of secured and unsecured indebtedness), and to acquire real property or make other investments (with exceptions for, among other things, certain categories of capital expenditures and costs, and certain share purchases); and
SVC is generally required to apply the net cash proceeds from the disposition of assets, capital markets transactions, debt refinancings or COVID-19 government stimulus programs to the repayment of outstanding loans under the credit agreement.

In June 2020, SVC repurchased $350.0 million principal amount of its $400.0 million of 4.25% senior notes due 2021 for $356.0 million, excluding accrued interest, pursuant to a cash tender offer. As a result, SVC recorded a loss of approximately $7.0 million, net of unamortized discount and deferred financing costs, on extinguishment of debt in the second quarter of 2020. SVC funded this purchase using borrowings under its revolving credit facility.

In June 2020, SVC issued $800.0 million aggregate principal amount of 7.50% senior notes due 2025 guaranteed by certain of SVC’s subsidiaries in an underwritten public offering. The aggregate net proceeds from this offering of approximately $788.0 million after underwriters’ discounts and other offering expenses were used to repay amounts outstanding under its revolving credit facility.

On July 16, 2020, SVC announced a $0.01 per common share dividend to be paid to its shareholders of record on July 27, 2020 and distributed on or about August 20, 2020.
Recent Investment Activities:
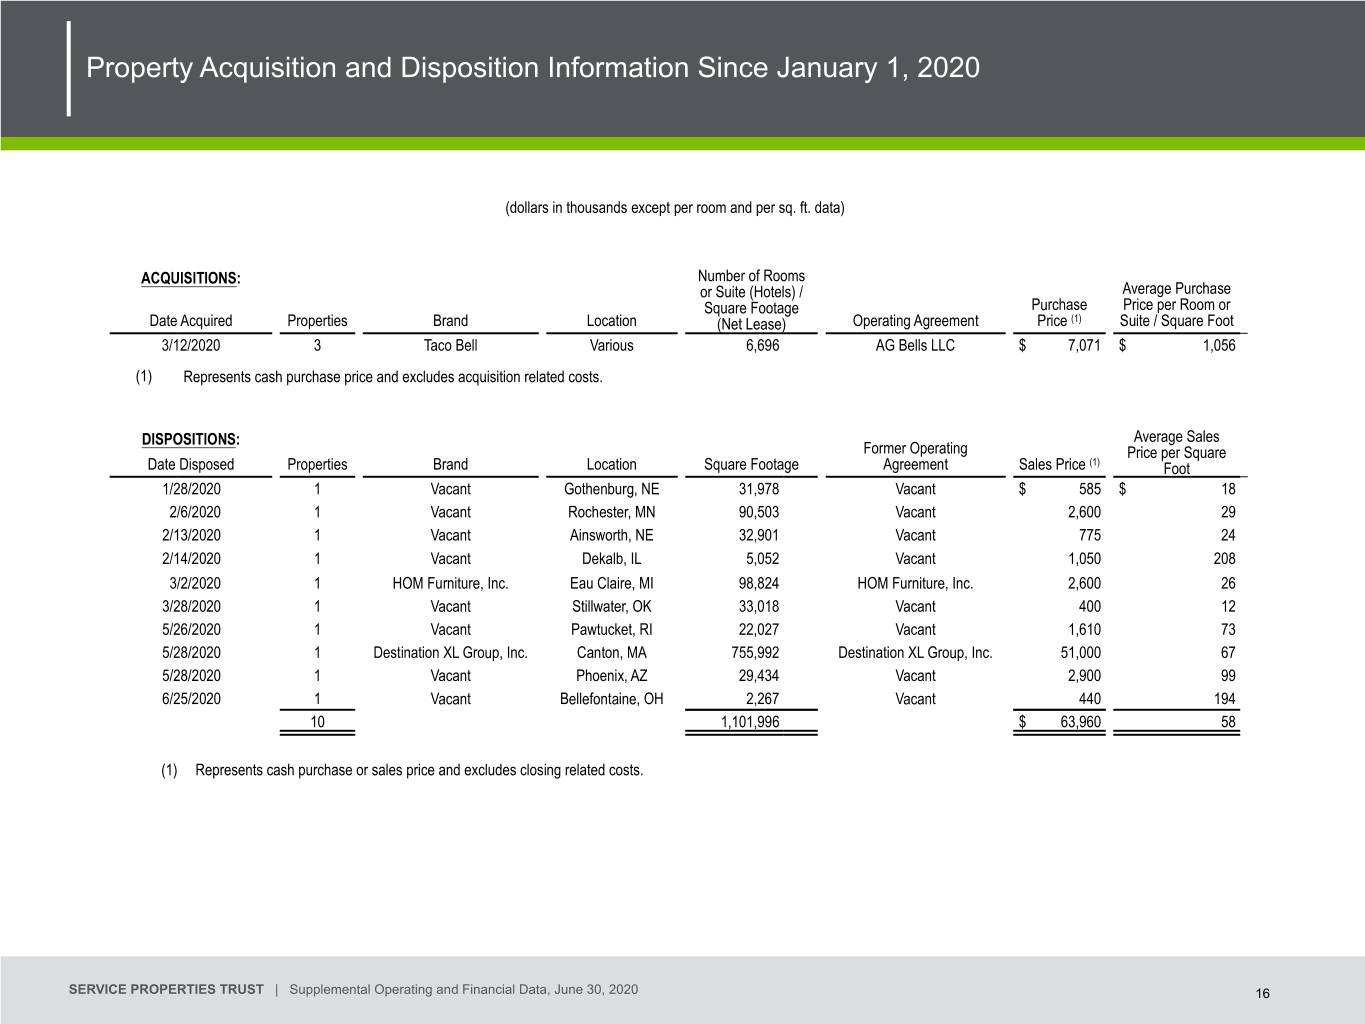
During the quarter ended June 30, 2020, SVC sold four net lease properties with an aggregate of 809,720 square feet in four states for an aggregate sales price of $56.0 million, excluding closing costs.

3


SVC has entered agreements to sell one Wyndham Hotels & Resorts, Inc (NYSE: WH), or Wyndham, branded hotel and eight Marriott International, Inc. (Nasdaq: MAR), or Marriott branded hotels with 1,178 rooms in five states with a net carrying value of $38.3 million for an aggregate sales price of $48.8 million.  SVC expects these sales to be completed in the fourth quarter of 2020. SVC expects to use the net sales proceeds from any hotels sold to repay outstanding indebtedness. The amount of annual minimum returns due from Marriott will be reduced by the amount allocated to the Marriott branded hotels sold, which was $7.9 million as of June 30, 2020.
In July 2020, SVC sold one net lease property with 2,935 square feet with a carrying value of $0.7 million requiring an annual minimum rent of $0.05 million for a sale price of $0.7 million. SVC has also entered agreements to sell seven net lease properties with 68,343 aggregate square feet in six states with a net carrying value of $6.3 million and leases requiring an aggregate of $0.3 million of annual minimum rents for an aggregate sales price of $6.9 million, excluding closing costs. SVC expects these sales to be completed by the third quarter of 2020.
The sales of these hotels and net lease properties are subject to various contingencies and may be delayed or may not occur.
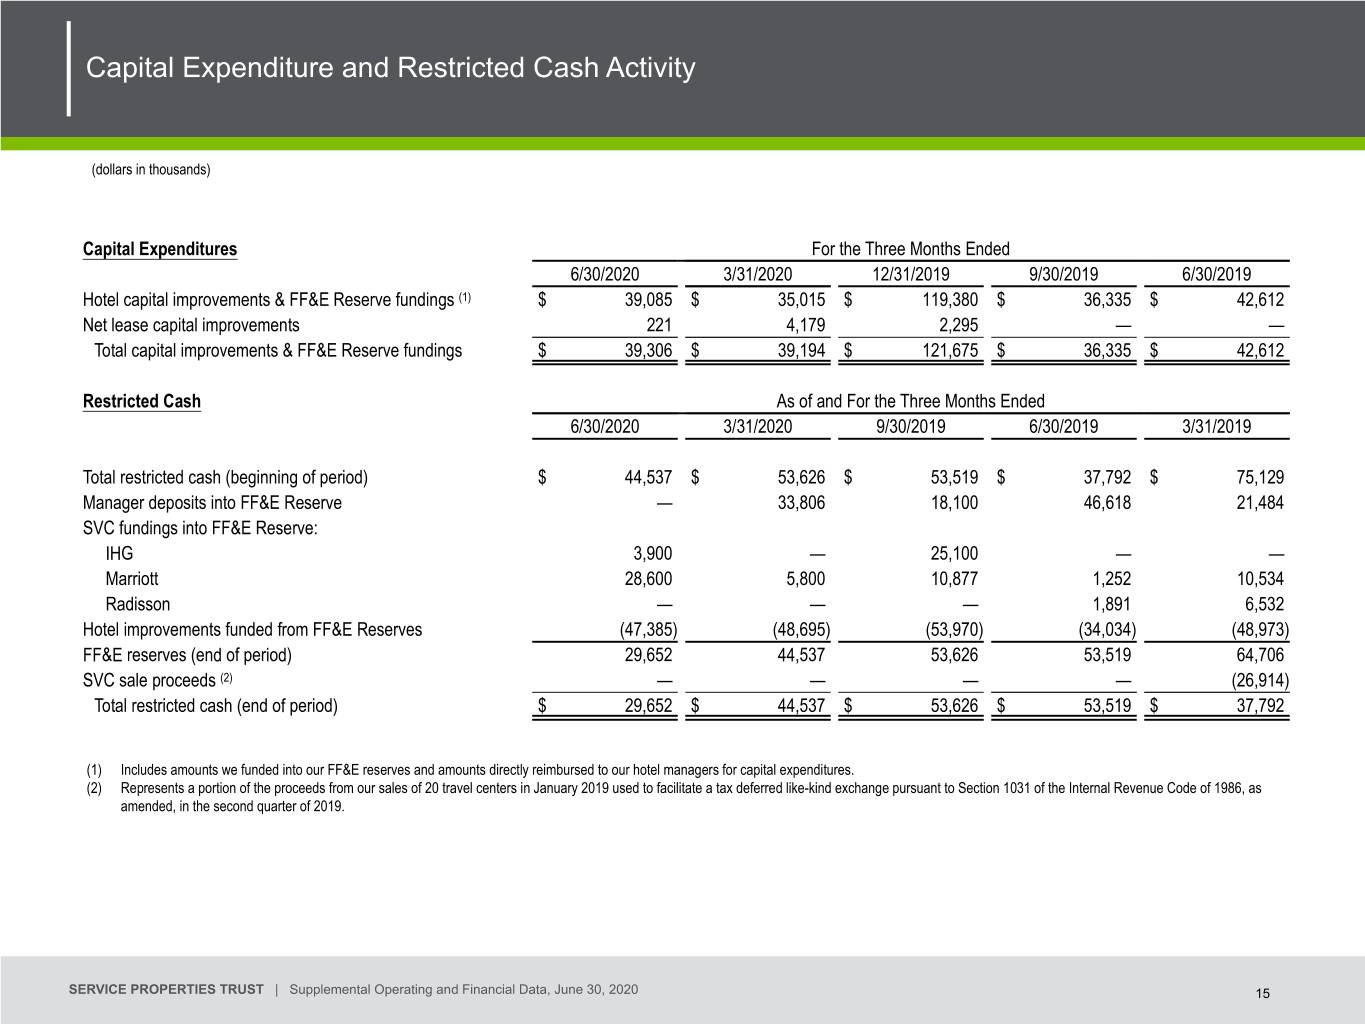
During the quarter ended June 30, 2020, SVC funded $39.3 million of capital improvements to certain of its properties. Pursuant to the terms of its management and lease agreements with its managers and tenants, some of these capital improvements resulted in increases in SVC’s contractual annual minimum returns and rents of $3.1 million.
Hotel Portfolio:
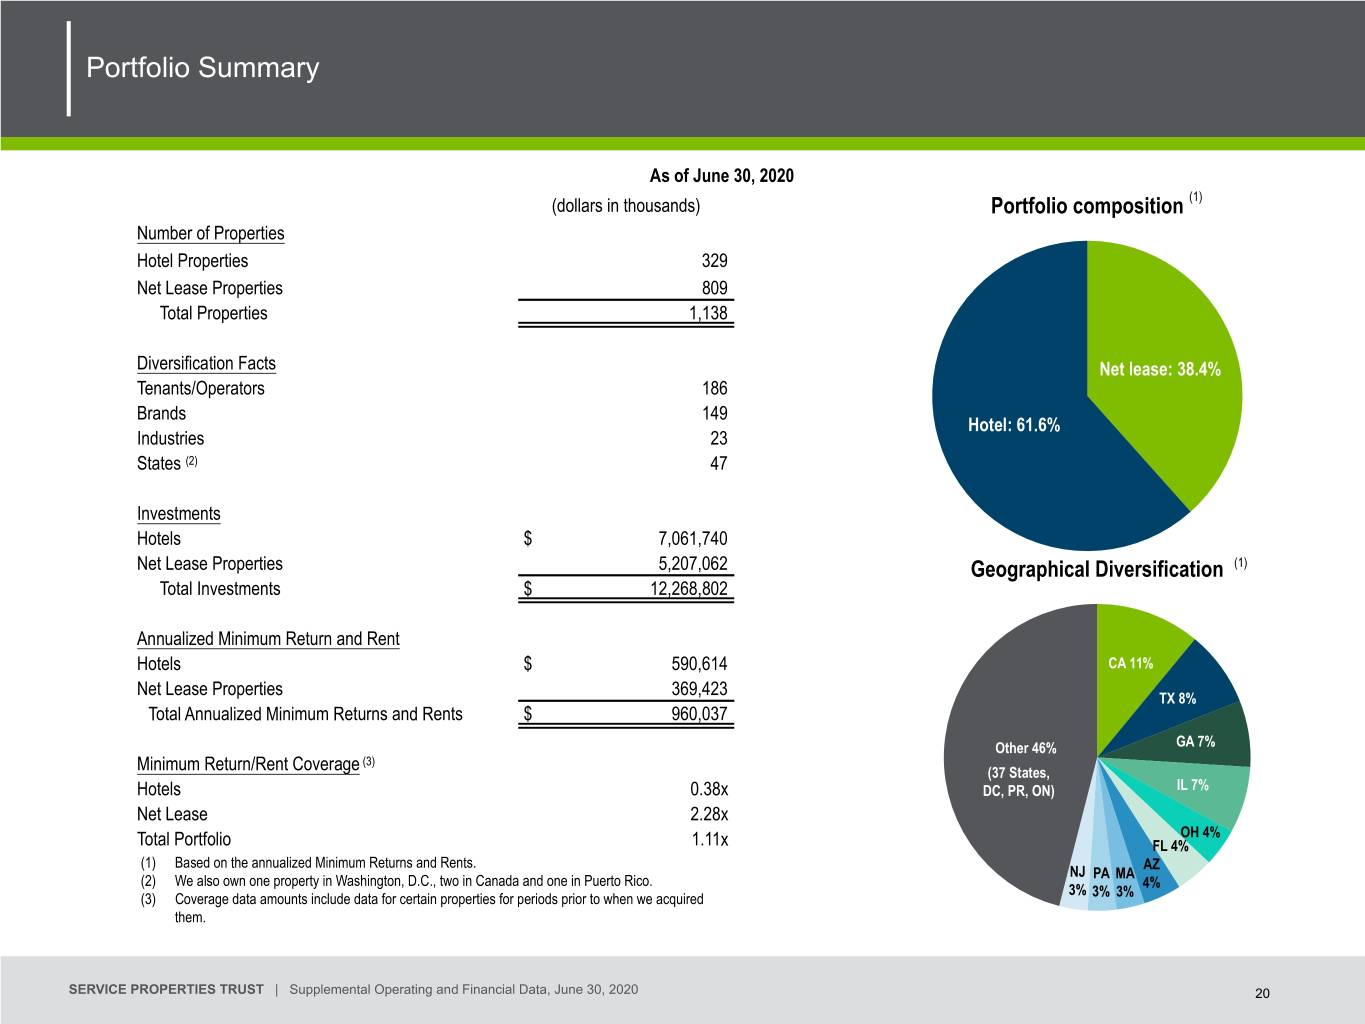
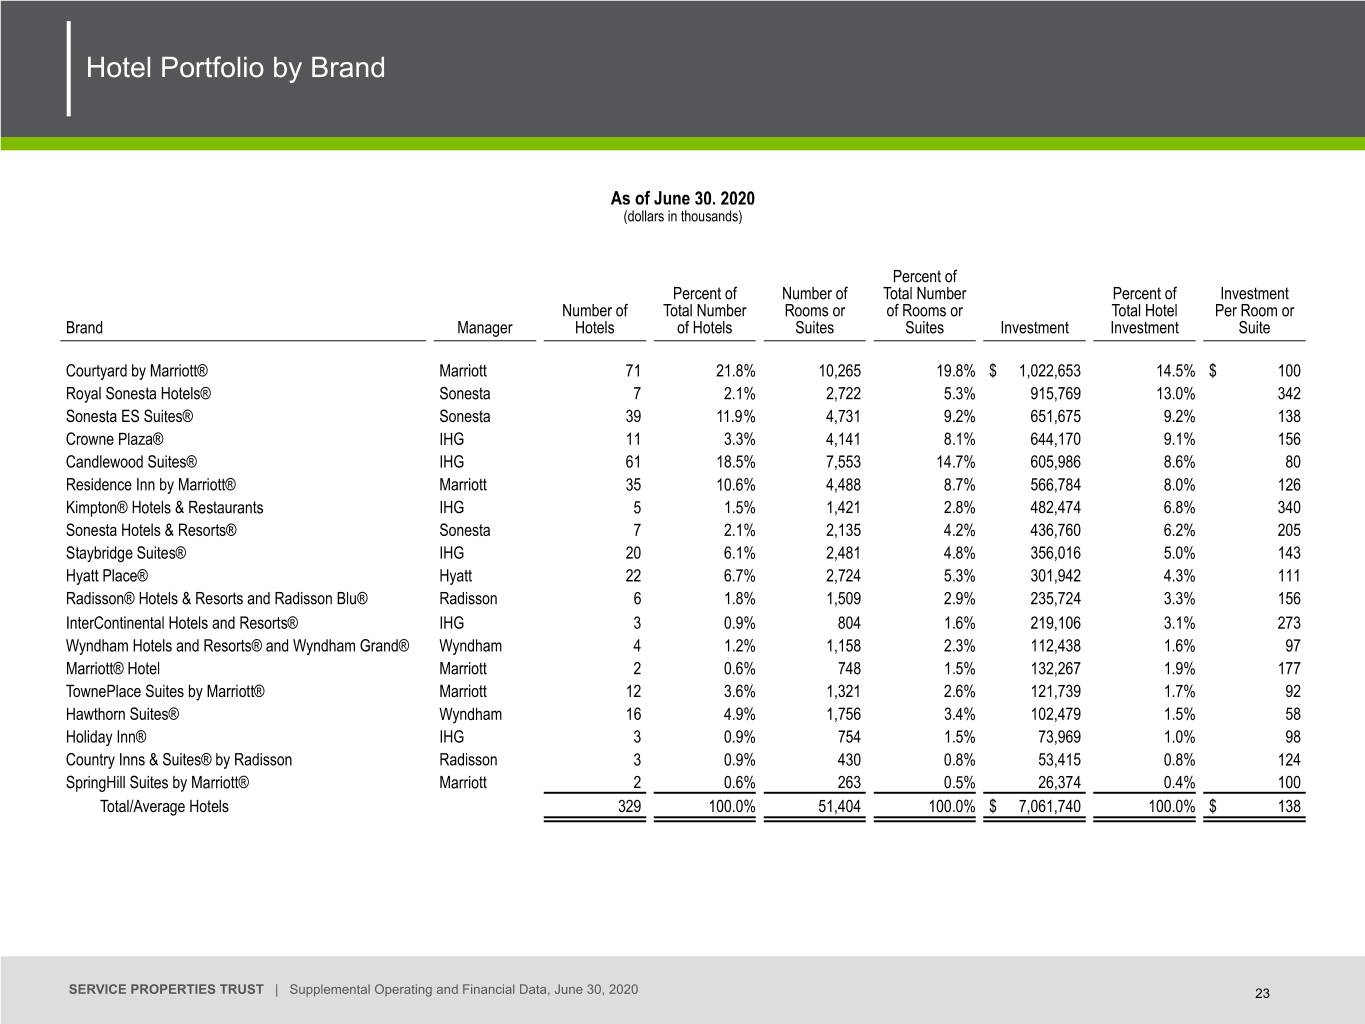
As of June 30, 2020, SVC had six operating agreements with six hotel operating companies for 329 hotels with 51,404 rooms, which represented 62% of SVC’s total annual minimum returns and rents.
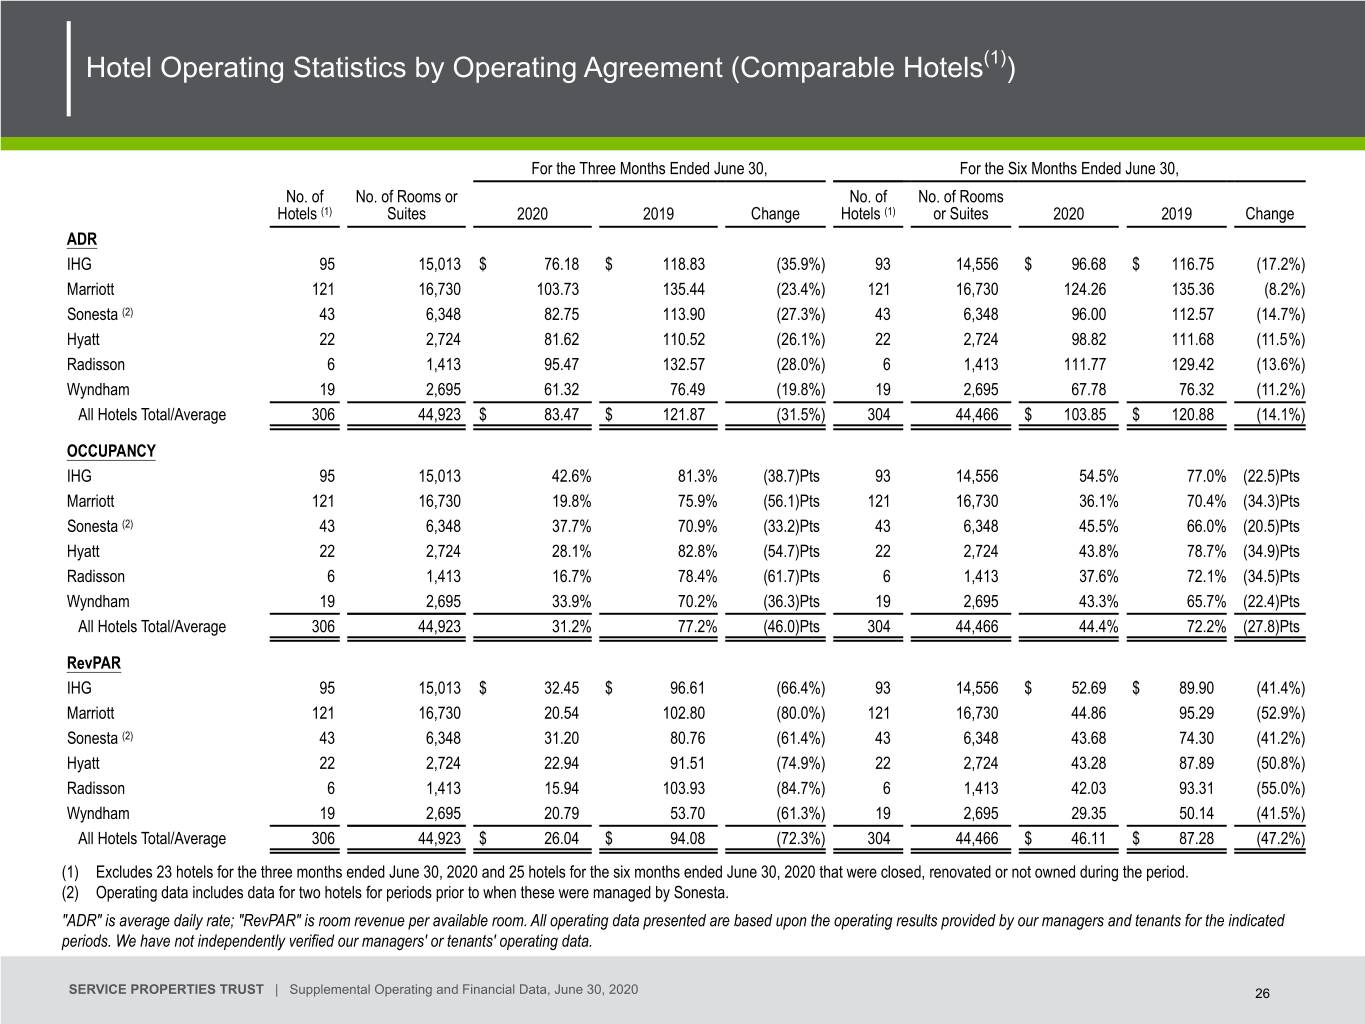
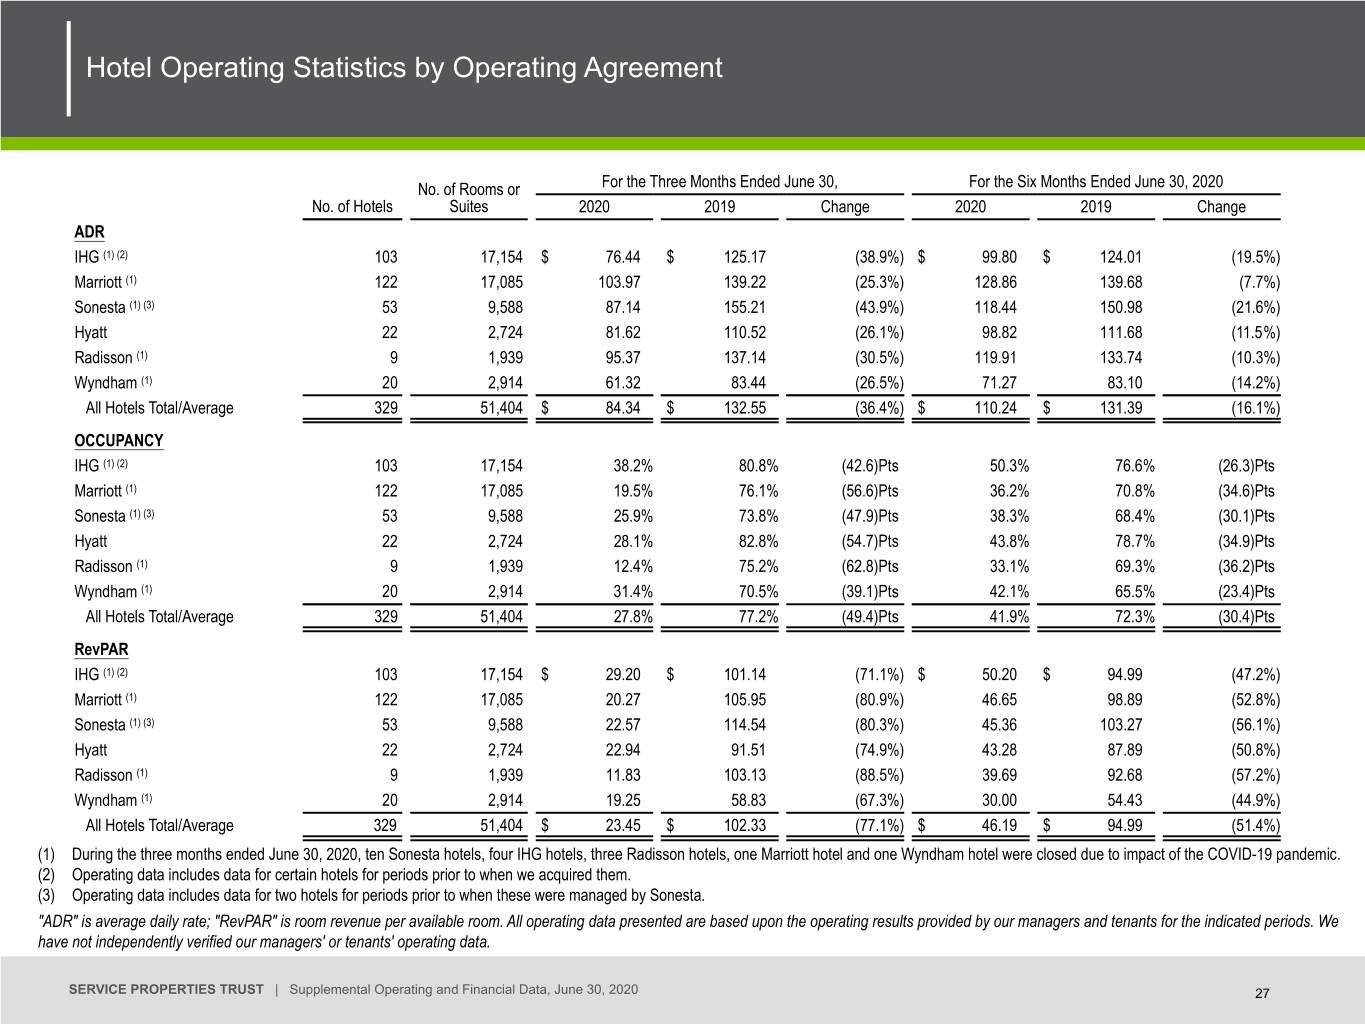
Hotel RevPAR (comparable hotels): For the quarter ended June 30, 2020 compared to the same period in 2019 for SVC’s 306 comparable hotels: average daily rate, or ADR, decreased 31.5% to $83.47; occupancy decreased 46.0 percentage points to 31.2%; and revenue per available room, or RevPAR, decreased 72.3% to $26.04.
For the six months ended June 30, 2020 compared to the same period in 2019 for SVC’s 304 comparable hotels: ADR decreased 14.1% to $103.85; occupancy decreased 27.8 percentage points to 44.4%; and RevPAR decreased 47.2% to $46.11.
Hotel RevPAR (all hotels): For the quarter ended June 30, 2020 compared to the same period in 2019 for SVC’s 329 hotels that were owned as of June 30, 2020: ADR decreased 36.4% to $84.34; occupancy decreased 49.4 percentage points to 27.8%; and RevPAR decreased 77.1% to $23.45.
For the six months ended June 30, 2020 compared to the same period in 2019 for all SVC’s 329 hotels: ADR decreased 16.1% to $110.24; occupancy decreased 30.4 percentage points to 41.9%; and RevPAR decreased 51.4% to $46.19.
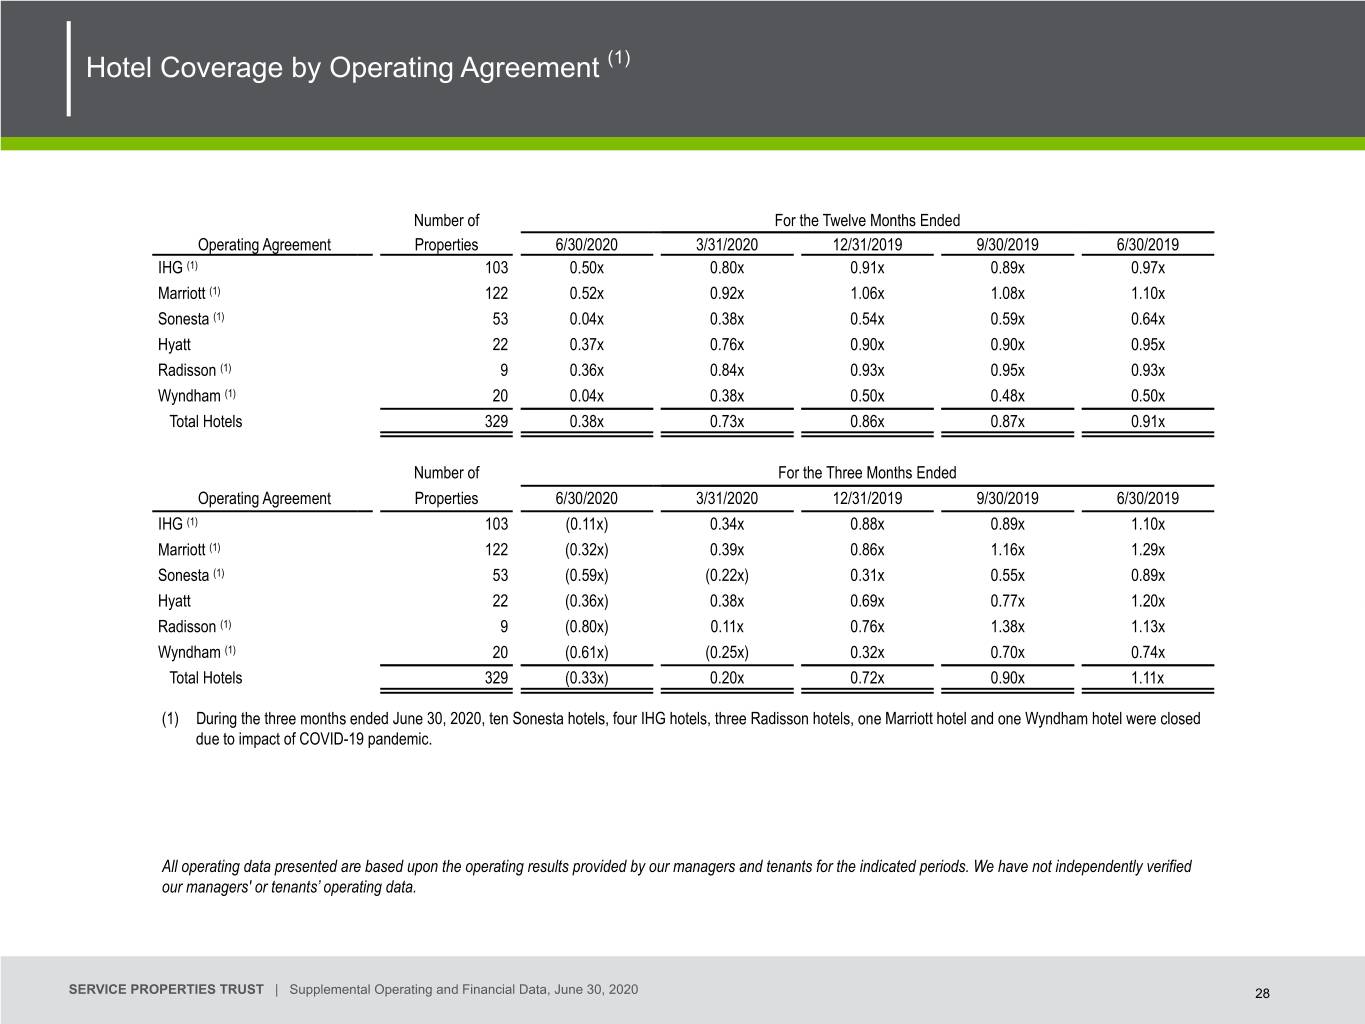
Hotel Coverage of Minimum Returns and Rents: For the quarter ended June 30, 2020, the aggregate coverage of SVC’s minimum returns or rents decreased to (0.33x) from 1.11x for the quarter ended June 30, 2019.
For the six months ended June 30, 2020, the aggregate coverage ratio of SVC’s minimum returns or rents decreased to (0.06x) from 0.90x for the six months ended June 30, 2019.

SVC’s hotel occupancies reached all-time lows during the second quarter of 2020 as a result of weak demand due to various forms of stay-at-home restrictions being enforced throughout the United States due to the COVID-19 pandemic.

4


SVC hotel occupancy was 21.0% in April 2020, 26.8% in May 2020 and 35.5% in June 2020. Hotel performance has gradually improved since the lows seen in April 2020 as travel demand slowly recovers. For the 28 days ended July 25, 2020, occupancy for SVC’s hotels was 42.4%.
As of August 6, 2020, SVC has reopened 9 of the 19 hotels that it had closed as a result of the COVID-19 pandemic. SVC’s 183 extended stay hotels performed better than its 95 limited service and 51 full-service hotels during the quarter ended June 30, 2020, with occupancies of 45.7%, 16.4% and 12.0% respectively. With the economy generally continuing to slowly reopen, SVC expects its diverse portfolio of suburban extended stay and limited service hotels to recover faster than its urban full-service hotels.
Hotel Managers:
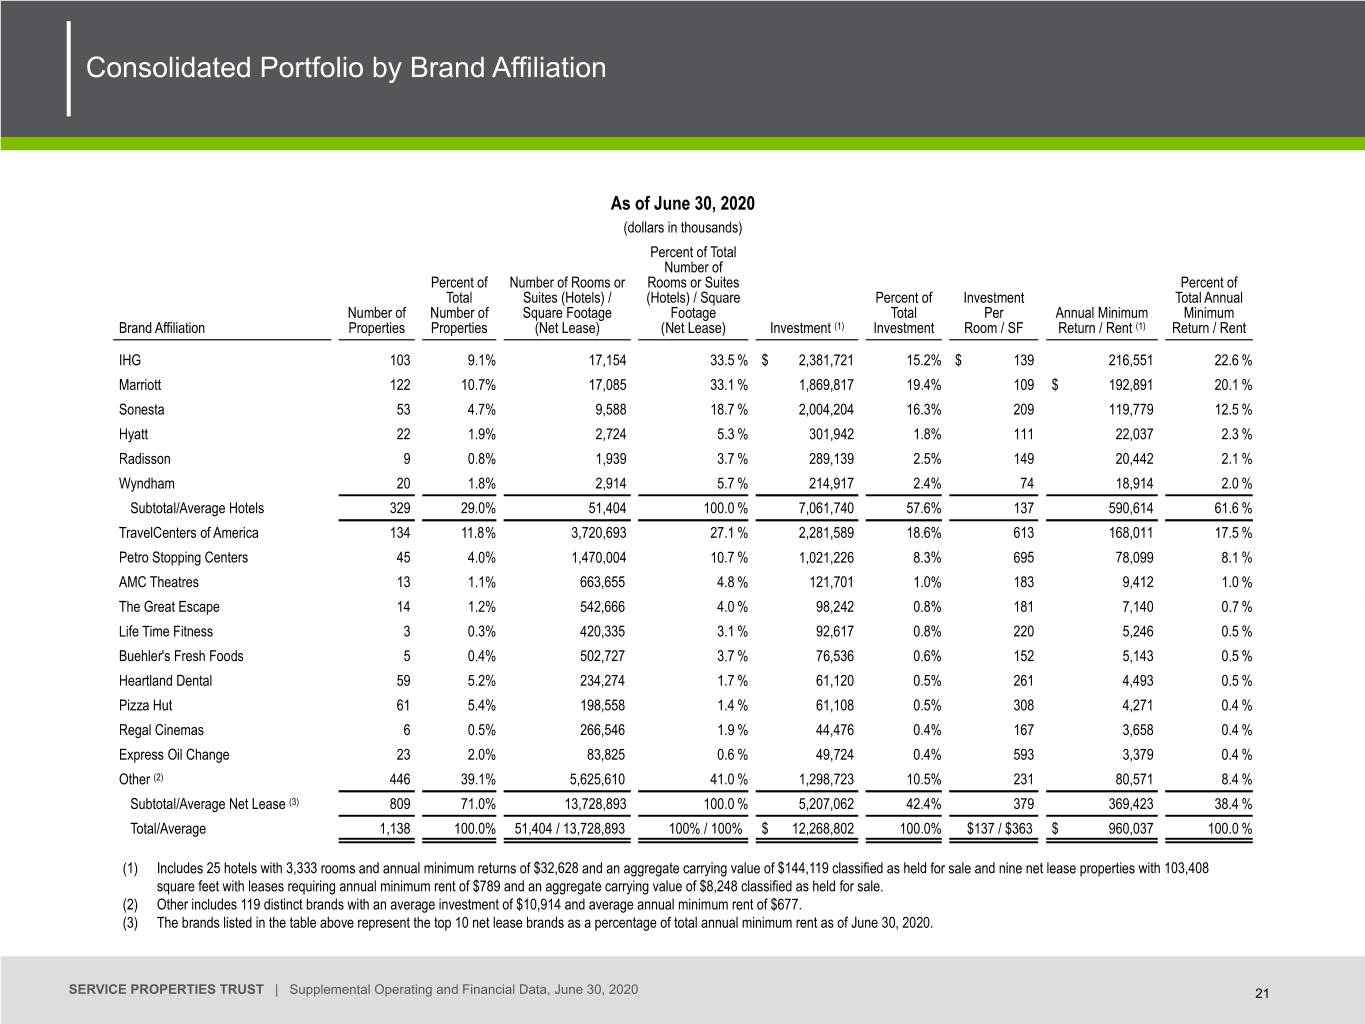
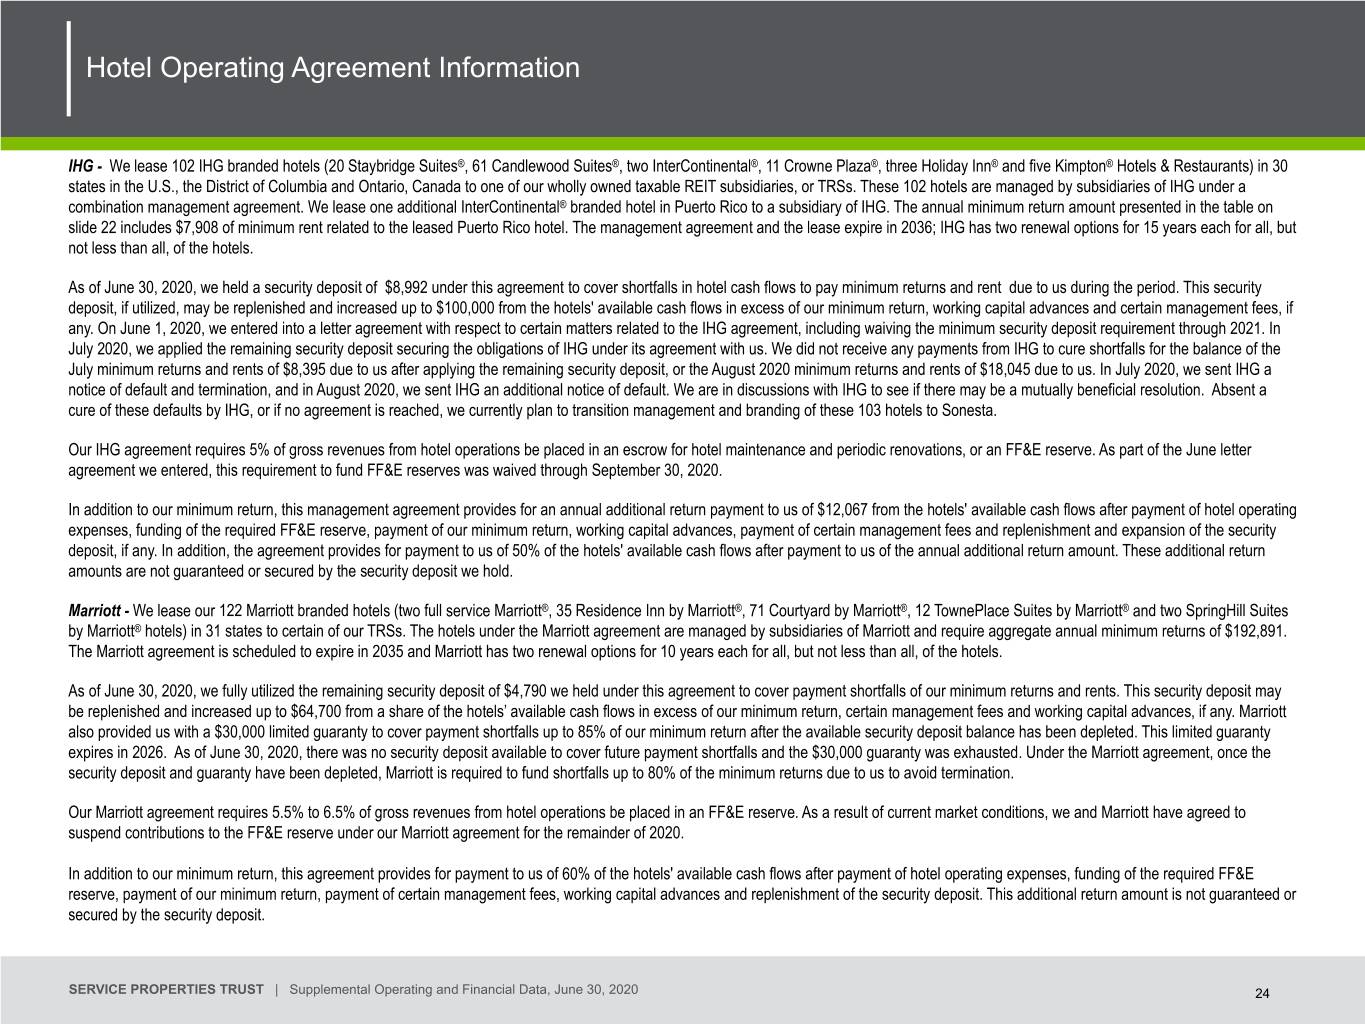
IHG Agreement: As of June 30, 2020, 103 of SVC’s hotels were operated by subsidiaries of InterContinental Hotels Group plc, or IHG, under one agreement requiring annual minimum returns and rents to SVC of $216.6 million as of June 30, 2020 (approximately $54.1 million per quarter). During the three months ended June 30, 2020, SVC realized returns and rents under its IHG agreement of $54.1 million. SVC’s IHG agreement is partially secured by a security deposit. During the three months ended June 30, 2020, SVC reduced the available security deposit by $33.7 million to cover shortfalls in hotel cash flows available to pay the minimum returns and rents due to SVC during the period. On June 1, 2020, SVC entered into a letter agreement with respect to certain matters related to its management agreement with IHG, including waiving the minimum security deposit requirement through 2021 and the requirement to fund FF&E reserves through September 30, 2020. As of June 30, 2020, the available IHG security deposit which SVC held to pay future payment shortfalls was $9.0 million. In July 2020, SVC applied the remaining security deposit securing IHG’s obligations under its IHG agreement. SVC did not receive any payments from IHG to cure shortfalls for the balance of the July minimum returns and rents of $8.4 million after applying the remaining security deposit or the August 2020 minimum returns and rents of $18.0 million due to SVC. In July 2020, SVC sent IHG a notice of default and termination, and in August 2020, SVC sent IHG an additional notice of default. SVC is in discussions with IHG to see if there may be a mutually beneficial resolution. Absent a cure of these defaults or if no agreement is reached, SVC currently plans to transition management and branding of these 103 hotels from IHG to subsidiaries of Sonesta Holdco Corporation, or Sonesta.
Marriott Agreement: As of June 30, 2020, 122 of SVC’s hotels were operated by subsidiaries of Marriott under one agreement requiring annual minimum returns to SVC of $192.9 million as of June 30, 2020 (approximately $48.2 million per quarter). During the three months ended June 30, 2020, SVC realized returns of $28.8 million. SVC’s agreement is partially secured by a security deposit and a limited guaranty from Marriott. During the three months ended June 30, 2020, SVC applied the remaining security deposit of $4.8 million and has drawn all $30.0 million of the guaranty to cover shortfalls in hotel cash flows available to pay the minimum returns due to SVC during the period. As of June 30, 2020, there was no security deposit available with SVC to pay future payment shortfalls and the guaranty was exhausted. We have the right to terminate the Marriott agreement after the security deposit and the guaranty have been depleted if Marriott fails to fund up to 80% of the minimum returns due to us. As of June 30, 2020, SVC has received payments or utilized the available security deposit for an aggregate of 80% of the minimum returns due to it. SVC’s Marriott agreement requires 5.5% to 6.5% of gross revenues from hotel operations be placed in an FF&E reserve. As a result of current market conditions, SVC and Marriott have agreed to suspend contributions to the FF&E reserve under the Marriott agreement for the remainder of 2020.
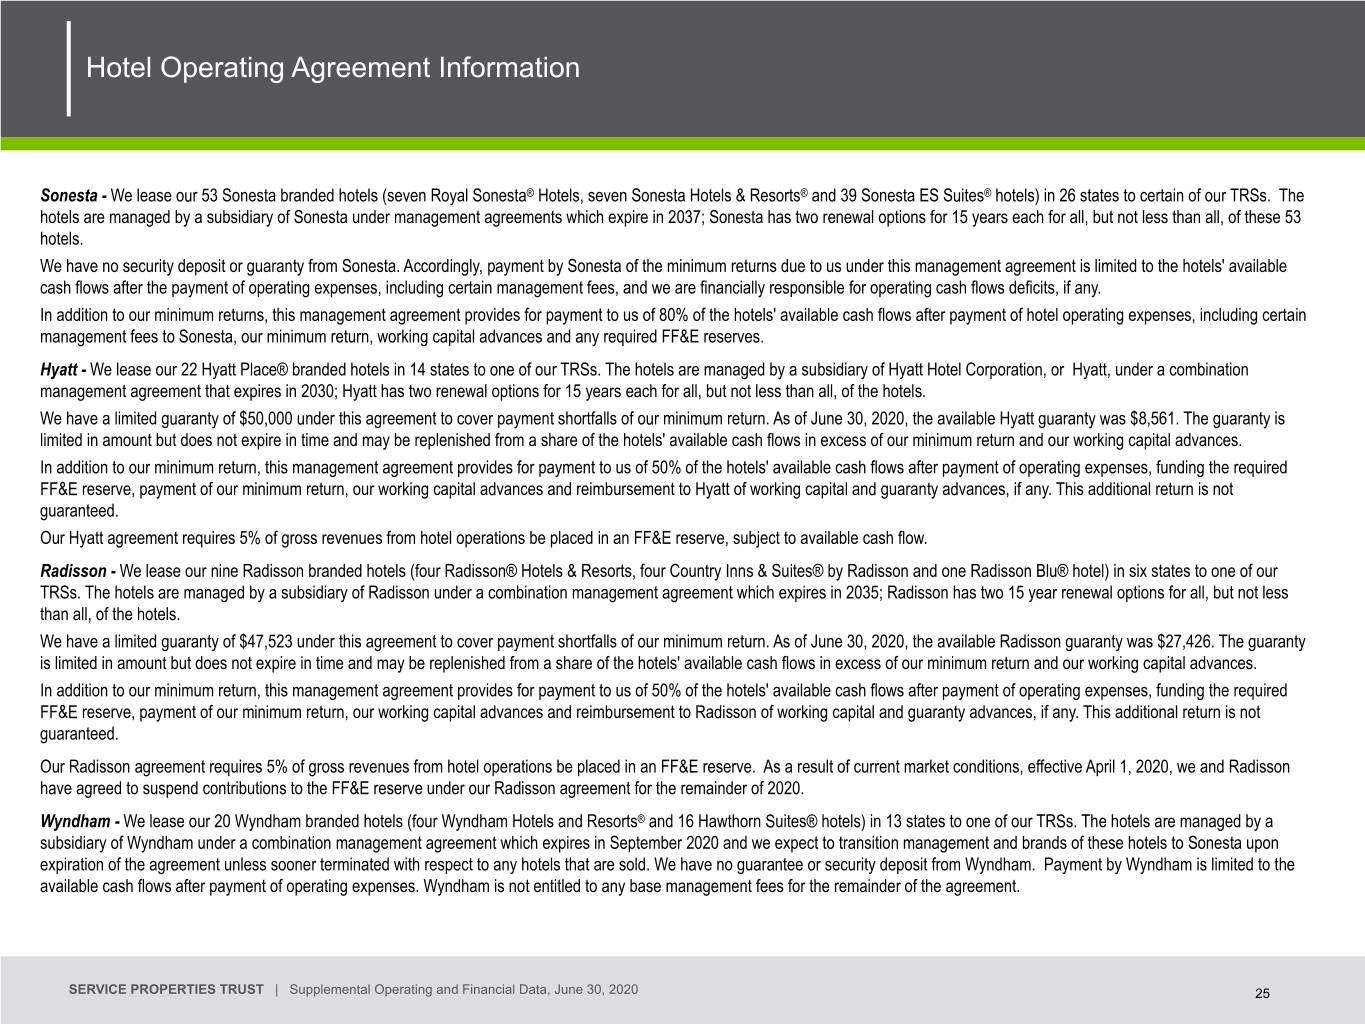
Sonesta Agreement: As of June 30, 2020, 53 of SVC’s hotels were operated by Sonesta under management agreements requiring annual minimum returns to SVC of $119.8 million as of June 30, 2020 (approximately $30.0 million per quarter). During the three months ended June 30, 2020, SVC’s hotels under the Sonesta agreement generated an operating cash flow deficit of $17.7 million. Because there is no guarantee or security deposit for this

5


agreement, the minimum returns SVC receives under this agreement are limited to available hotel cash flows, if any, after payment of hotel operating expenses including management fees.
Wyndham Agreement: As of June 30, 2020, 20 of SVC’s hotels were operated under a management agreement with subsidiaries of Wyndham. The Wyndham management agreement expires on September 30, 2020 and SVC expects to transition management and brands of these hotels to Sonesta upon expiration of the agreement unless sooner terminated with respect to any hotels that are sold. Under the agreement, payment by Wyndham is limited to available cash flows after payment of operating expenses. Wyndham is not entitled to any management fees for the remainder of the agreement. During the three months ended June 30, 2020, SVC’s hotels under its Wyndham agreement generated an operating cash flow deficit of $2.7 million.
Other Hotel Agreements: As of June 30, 2020, SVC’s remaining 31 hotels were managed under two agreements: one management agreement with a subsidiary of Hyatt Hotels Corporation (NYSE: H), or Hyatt, for 22 hotels requiring annual minimum returns of $22.0 million (approximately $5.5 million per quarter); and one management agreement with a subsidiary of Radisson Hospitality, Inc., or Radisson, for nine hotels, requiring annual minimum returns of $20.4 million (approximately $5.1 million per quarter). Minimum returns due to SVC are partially guaranteed under the Hyatt and Radisson agreements. Based on current estimates, SVC projects that it may exhaust the remainder of the guarantee from Hyatt during the fourth quarter of 2020.
During the quarter ended June 30, 2020, SVC advanced an aggregate of $80.5 million of working capital to certain of its hotel operators to cover projected operating losses. SVC advanced $37.0 million to IHG, $30.0 million to Marriott, $7.4 million to Sonesta, $2.4 million to Wyndham and $3.7 million to Hyatt. These working capital advances are reimbursable to SVC from a share of future cash flow from the applicable hotel operations in excess of the minimum returns and rents due to SVC and certain fees to the manager, if any.
Net Lease Portfolio:
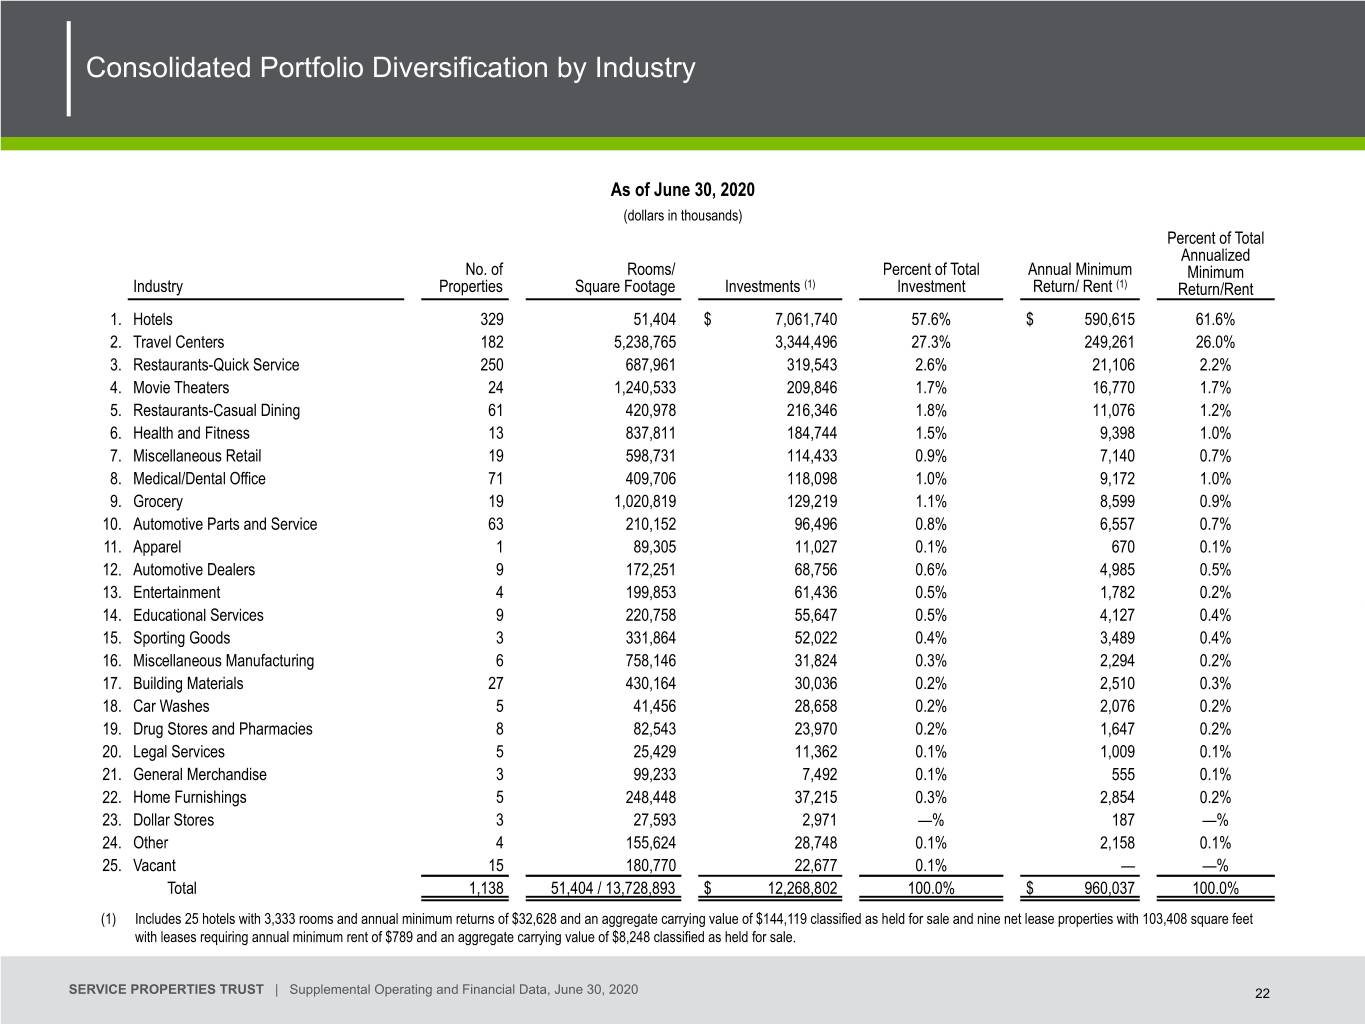
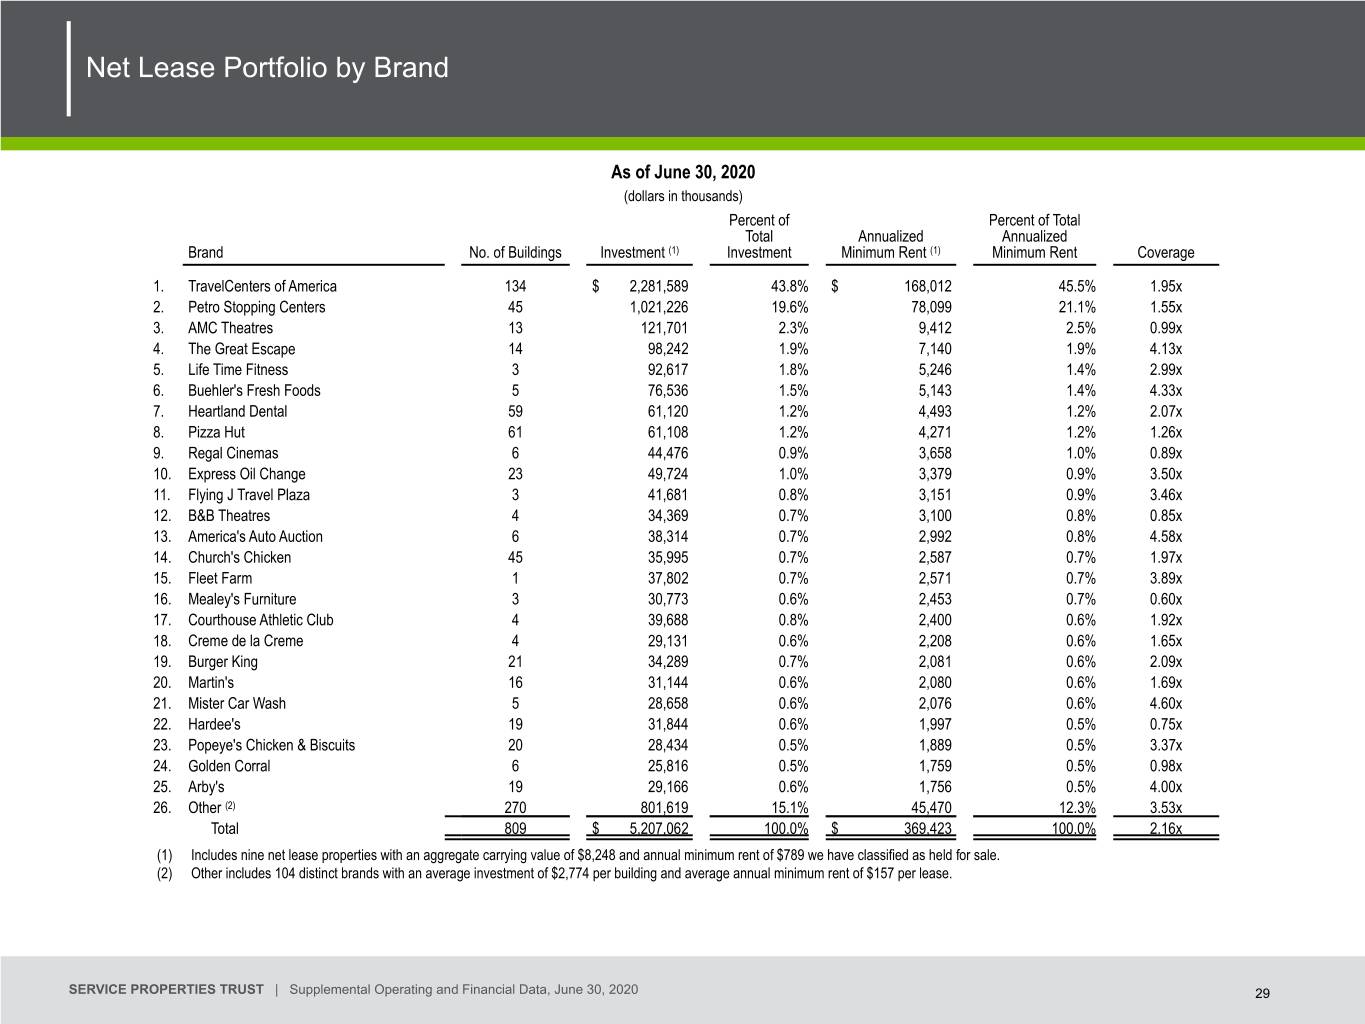
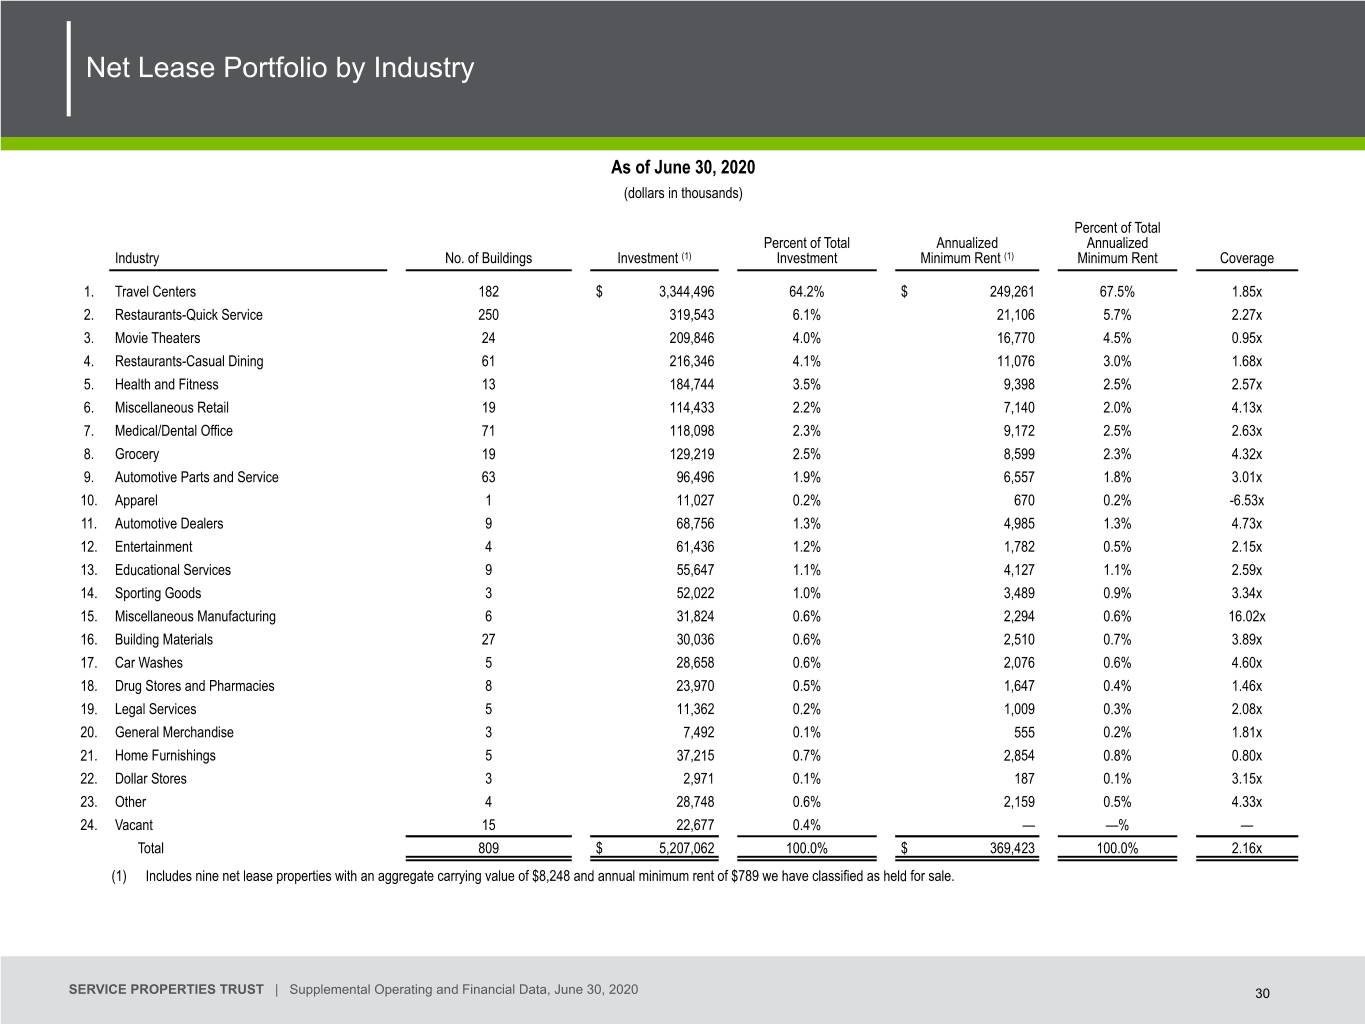
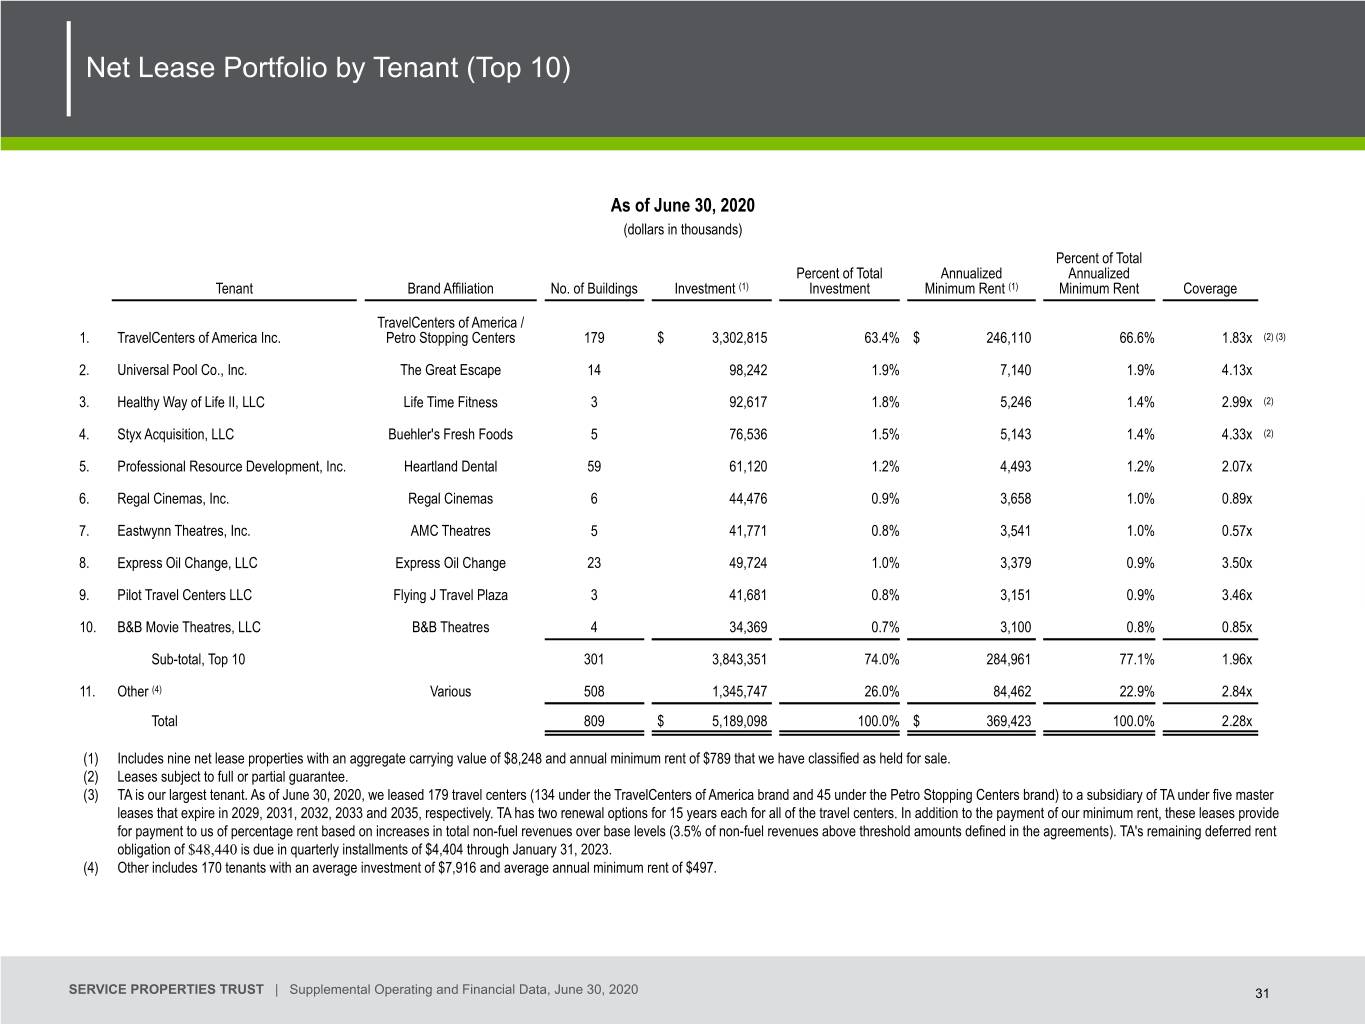
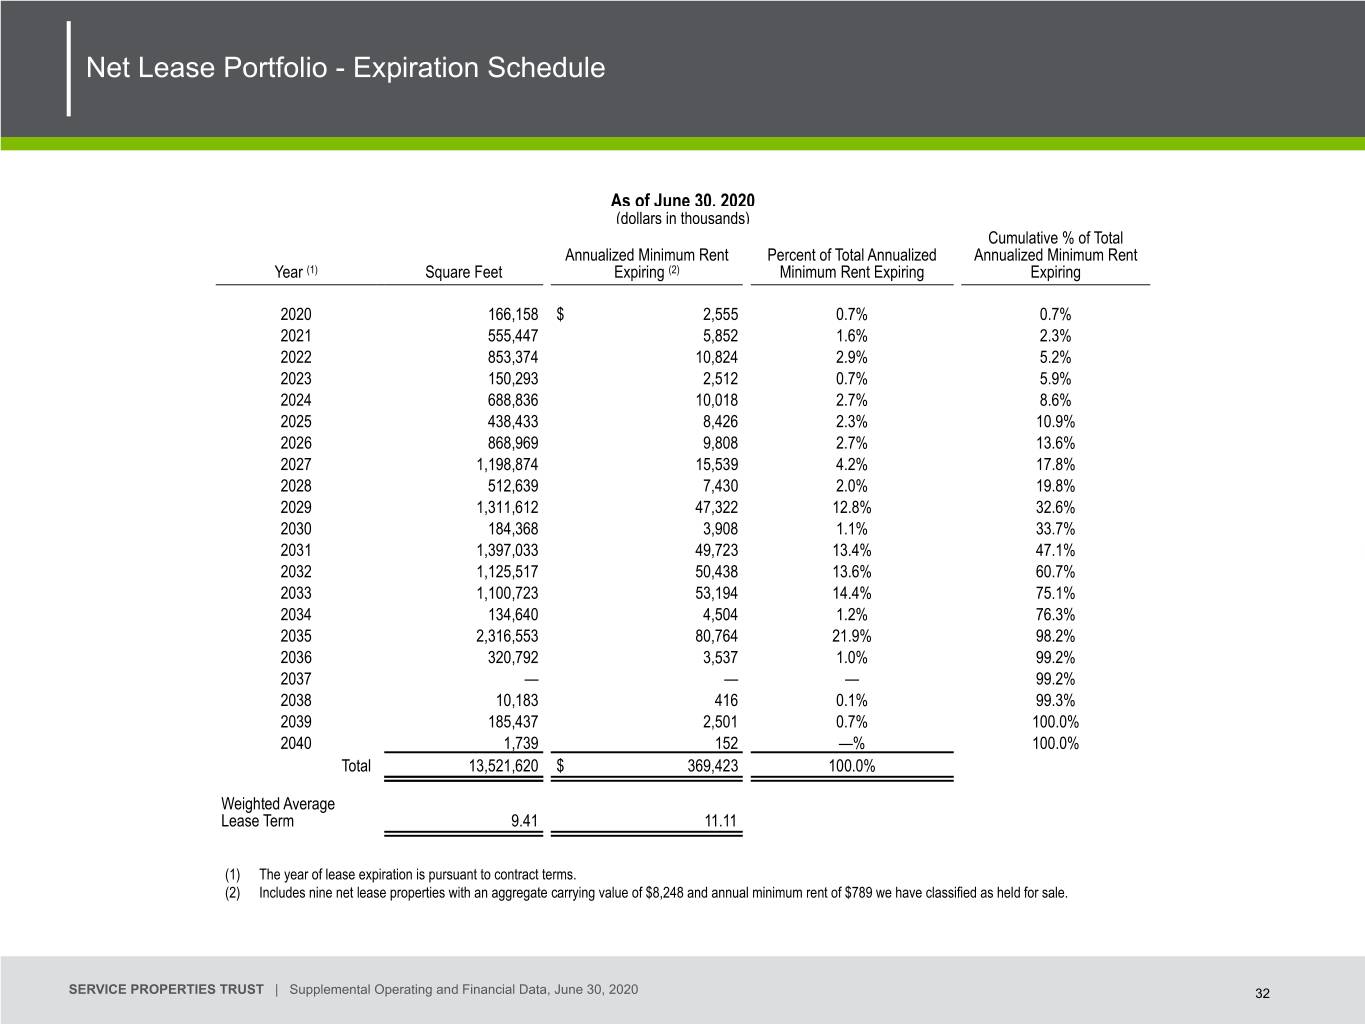
As of June 30, 2020, SVC owned 809 net lease service-oriented retail properties with an aggregate of 13.7 million square feet requiring aggregate annual minimum rent of $369.4 million which represented 38% of SVC’s total annual minimum returns and rents. The portfolio was 99% leased by 180 tenants operating under 129 brands in 22 distinct industries with a weighted (by annual minimum rent) average lease term of 11.11 years. As of the quarter ended June 30, 2020, the aggregate coverage of SVC’s net lease portfolio’s minimum rent was 2.16x. TravelCenters of America Inc. (Nasdaq: TA), or TA, is SVC’s largest tenant. As of June 30, 2020, SVC leased to TA a total of 179 travel centers under five leases that expire between 2029 and 2035 and require aggregate annual minimum rents of $246.1 million, or 25.6% of SVC’s minimum rents and returns. TA is current on all of its lease payments due to SVC.
During the quarter ended June 30, 2020, SVC collected 58.7% of rents from its other net lease tenants (45.6% in April, 2020, 57.6% in May, 2020 and 74.6% in June 2020). In July 2020, SVC collected 80.0% of rents from its other net lease tenants. As of August 6, 2020, SVC has entered into rent deferral agreements with 80 net lease retail tenants with leases requiring an aggregate of $59.3 million of annual minimum rents. Generally, these rent deferrals are for one to four months of rent and will be payable, in most cases, in 12 to 24 equal monthly installments beginning in September 2020. In aggregate, SVC has deferred $11.3 million of rents from its net lease tenants to date. During the quarter ended June 30, 2020, SVC recorded reserves for uncollectible revenues of $5.0 million for certain of its net lease tenants.

6


Leasing and Occupancy:
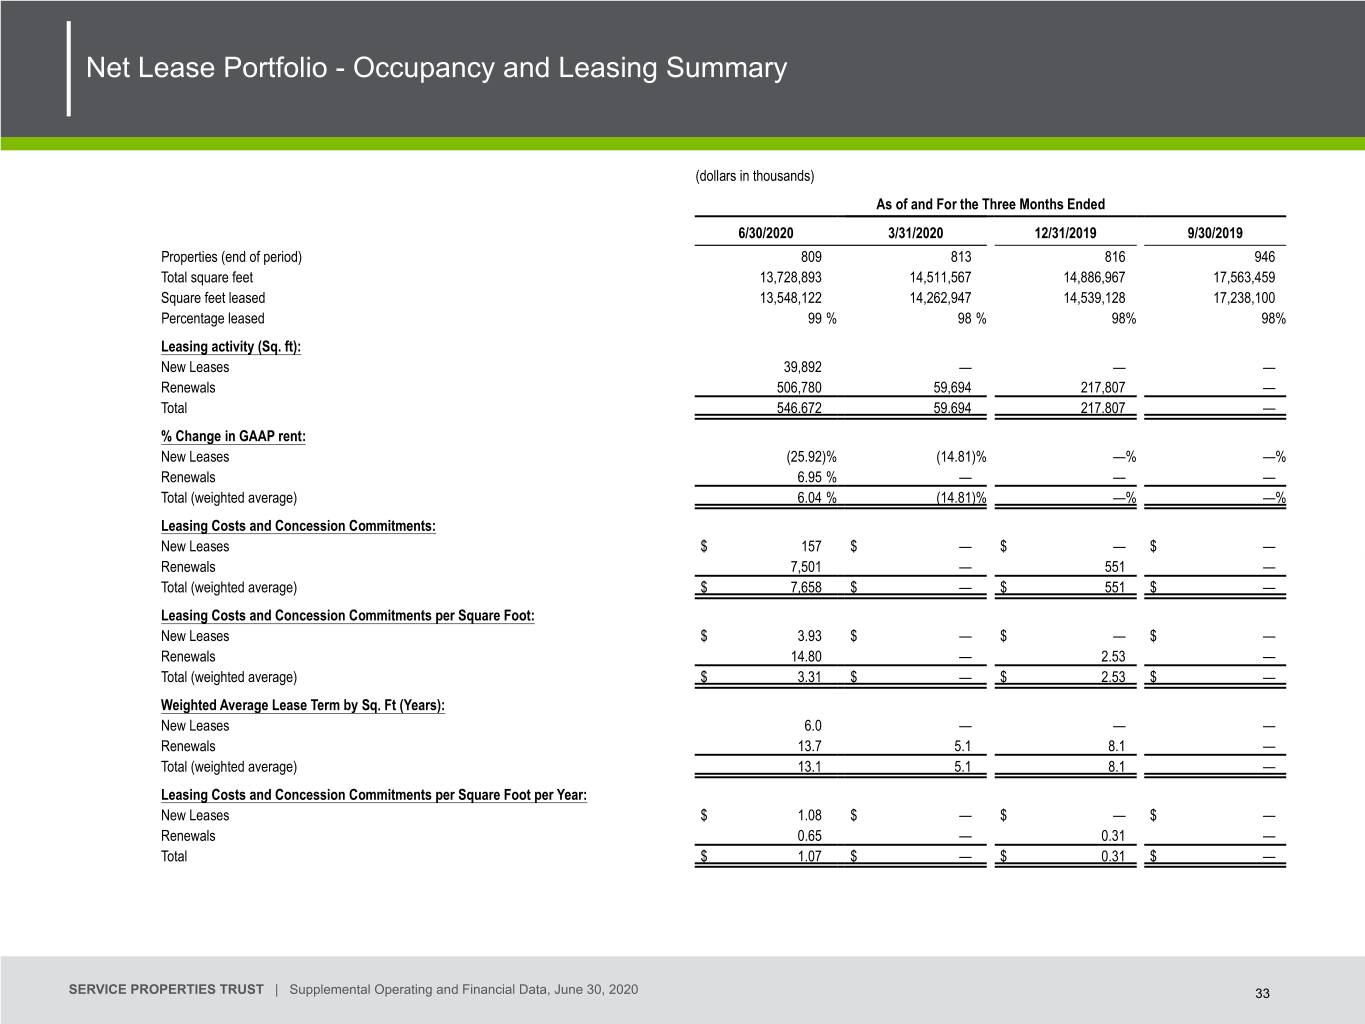
During the quarter ended June 30, 2020, SVC entered lease renewals for an aggregate of 506,780 rentable square feet at weighted (by rentable square feet) average rents that were 7.0% above prior rents for the same space. The weighted (by rentable square feet) average lease term for these leases was 13.7 years and leasing concessions and capital commitments were $7.5 million, or $14.80 per square foot. Also during the quarter ended June 30, 2020, SVC entered into new leases for an aggregate of 39,892 rentable square feet at weighted (by rentable square feet) average rents that were 25.9% below prior rents for the same space. The weighted (by rentable square feet) average lease term for these leases was six years and leasing concessions and capital commitments were $0.2 million, or $3.93 per square foot.
Conference Call:
At 10:00 a.m. Eastern Time this morning, John Murray, Chief Executive Officer, Brian Donley, Chief Financial Officer, and Todd Hargreaves, Vice President and Chief Investment Officer, will host a conference call to discuss SVC’s second quarter 2020 financial results. The conference call telephone number is (877) 329-3720. Participants calling from outside the United States and Canada should dial (412) 317-5434. No pass code is necessary to access the call from either number. Participants should dial in about 15 minutes prior to the scheduled start of the call. A replay of the conference call will be available through Friday, August 14, 2020. To access the replay, dial (412) 317-0088. The replay pass code is 10145356.
A live audio webcast of the conference call will also be available in a listen-only mode on SVC’s website, www.svcreit.com. Participants wanting to access the webcast should visit SVC’s website about five minutes before the call. The archived webcast will be available for replay on SVC’s website for about one week after the call. The transcription, recording and retransmission in any way of SVC’s second quarter conference call is strictly prohibited without the prior written consent of SVC.
Supplemental Data:
A copy of SVC’s Second Quarter 2020 Supplemental Operating and Financial Data is available for download at SVC’s website, www.svcreit.com. SVC’s website is not incorporated as part of this press release.
Service Properties Trust is a REIT which owns a diverse portfolio of hotels and net lease service and necessity-based retail properties across the United States and in Puerto Rico and Canada with 149 distinct brands across 23 industries. SVC’s properties are primarily operated under long-term management or lease agreements. SVC is managed by the operating subsidiary of The RMR Group Inc. (Nasdaq: RMR), or RMR Inc., an alternative asset management company that is headquartered in Newton, Massachusetts.
Non-GAAP Financial Measures and Certain Definitions:
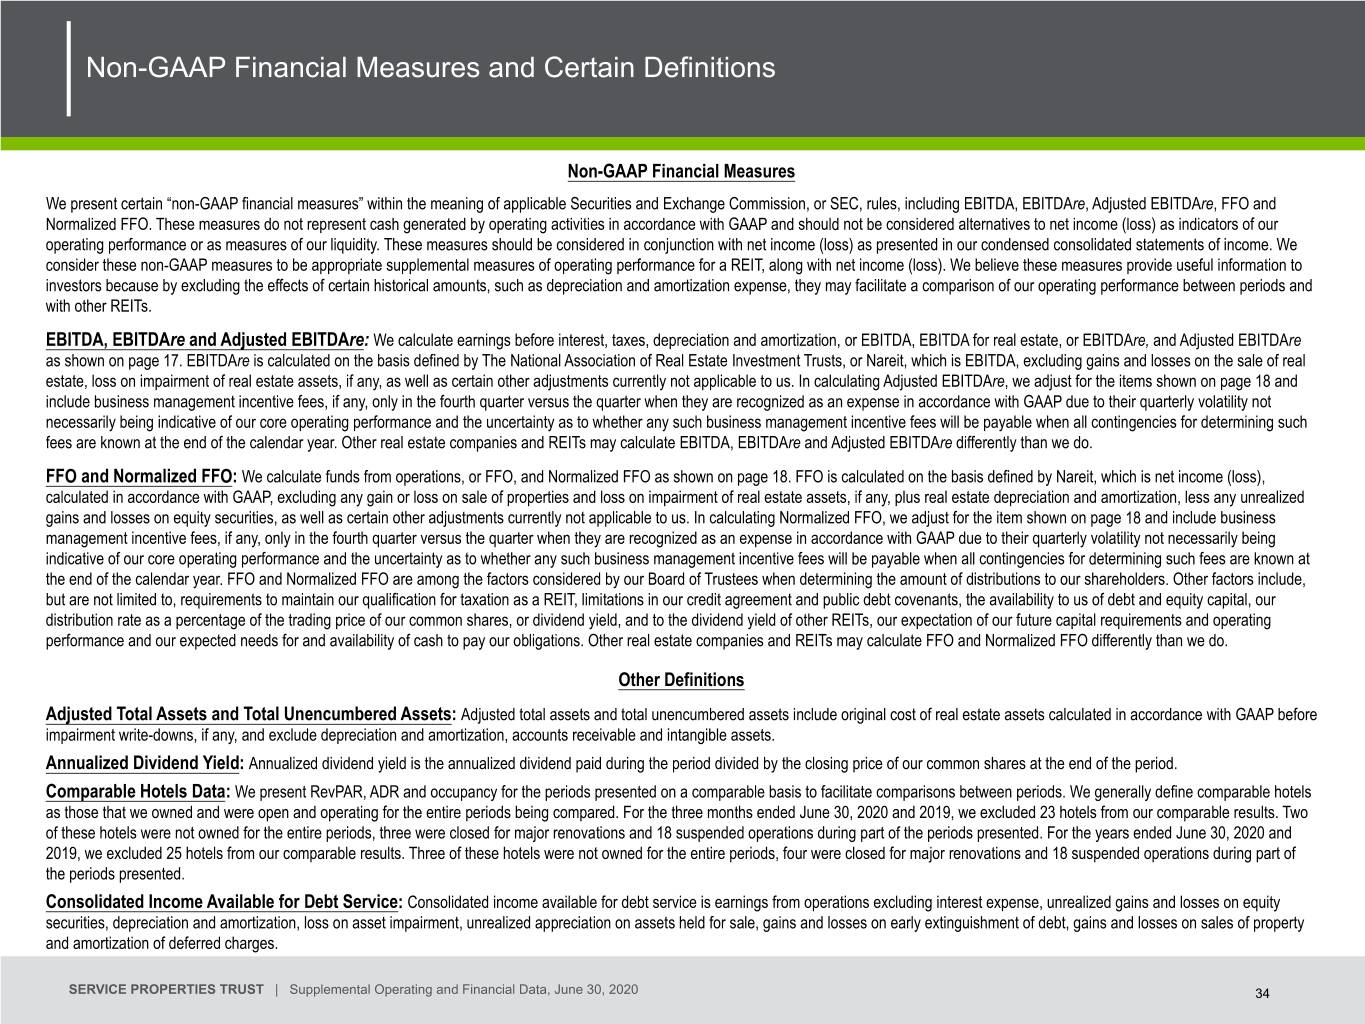
SVC presents certain “non-GAAP financial measures” within the meaning of applicable Securities and Exchange Commission, or SEC, rules, including earnings before interest, taxes, depreciation and amortization, or EBITDA, EBITDA for real estate, or EBITDAre, Adjusted EBITDAre, funds from operations, or FFO, and Normalized FFO. These measures do not represent cash generated by operating activities in accordance with GAAP and should not be considered alternatives to net income as indicators of SVC’s operating performance or as measures of SVC’s liquidity. These measures should be considered in conjunction with net income as presented in SVC’s condensed consolidated statements of income. SVC considers these non-GAAP measures to be appropriate supplemental measures of operating performance for a REIT, along with net income. SVC believes these measures provide useful information to investors because by excluding the effects of certain historical amounts, such as depreciation and amortization expense, they may facilitate a comparison of SVC’s operating performance between periods and with other REITs.

7


Please see the pages attached hereto for a more detailed statement of SVC’s operating results and financial condition and for an explanation of SVC’s calculation of FFO and Normalized FFO, EBITDA, EBITDAre and Adjusted EBITDAre and a reconciliation of those amounts to amounts determined in accordance with GAAP.
Comparable Hotels Data:
SVC presents RevPAR, ADR and occupancy for the periods presented on a comparable basis to facilitate comparisons between periods. SVC generally defines comparable hotels as those that were owned by it and were open and operating for the entire periods being compared. For the three months ended June 30, 2020 and 2019, SVC excluded 23 hotels from its comparable results. Two of these hotels were not owned for the entire periods, two were closed for major renovations and 19 suspended operations during part of the periods presented. For the six months ended June 30, 2020 and 2019, SVC excluded 25 hotels from its comparable results. Three of these hotels were not owned for the entire periods, three were closed for major renovations and 19 suspended operations during part of the periods presented.
Minimum Rent and Return Coverage:
Hotel coverage is calculated as total hotel revenues minus all hotel expenses and FF&E reserve escrows that are not subordinated to minimum returns due to SVC divided by the minimum returns or rents due to SVC.
SVC defines net lease coverage as earnings before interest, taxes, depreciation, amortization and rent, or EBITDAR, divided by the annual minimum rent due to SVC weighted by the minimum rent of the property to total minimum rents of the net lease portfolio. EBITDAR amounts used to determine rent coverage are generally for the latest twelve-month period reported based on the most recent operating information, if any, furnished by the tenant. Operating statements furnished by the tenant often are unaudited and, in certain cases, may not have been prepared in accordance with GAAP and are not independently verified by SVC. Tenants that do not report operating information are excluded from the coverage calculations. Coverage amounts include data for certain properties for periods prior to when SVC acquired them. In instances where we do not have financial information for the most recent quarter from our tenants, we have calculated an implied EBITDAR for the second quarter using industry benchmark data to more accurately reflect the impact of COVID-19 on our tenants’ operations. We believe using only financial information from the earlier periods could be misleading as it would not reflect the negative impact those tenants experienced as a result of the COVID-19 pandemic. As a result, we believe using this industry benchmark data provides a more accurate estimated representation of recent operating results and coverage for those tenants.

8


SERVICE PROPERTIES TRUST
CONDENSED CONSOLIDATED STATEMENTS OF INCOME
(amounts in thousands, except per share data)
(Unaudited)


Three Months Ended
June 30,
 
Six Months Ended
June 30,
 
 
2020
 
2019
 
2020
 
2019
Revenues:


Hotel operating revenues (1)
 
$
117,356

 
$
541,215

 
$
500,859

 
$
996,078

Rental income (2)
 
97,584

 
68,217

 
197,656

 
136,890

FF&E reserve income (3)


1,130

 
201

 
2,502

Total revenues
 
214,940

 
610,562

 
698,716

 
1,135,470


Expenses:


Hotel operating expenses (1)
 
46,957

 
380,431

 
318,105

 
698,116

Other operating expenses
 
3,565

 
1,272

 
7,324

 
2,712

Depreciation and amortization
 
127,427

 
99,196

 
255,353

 
198,561

General and administrative (4)
 
11,302

 
12,207

 
25,326

 
24,442

Loss on asset impairment (5)
 
28,514


45,254


Total expenses
 
217,765

 
493,106

 
651,362

 
923,831


Gain (loss) on sale of real estate (6)
 
(2,853
)


(9,764
)
 
159,535

Dividend income


876


1,752

Unrealized gains (losses) on equity securities, net (7)
 
3,848

 
(60,788
)
 
(1,197
)
 
(39,811
)
Gain on insurance settlement (8)
 
62,386


62,386


Interest income
 
15

 
449

 
277

 
1,086

Interest expense (including amortization of debt issuance costs and debt discounts and premiums of $3,486, $2,570, $6,774 and $5,140, respectively)
 
(72,072
)
 
(49,601
)
 
(143,147
)
 
(99,367
)
Loss on early extinguishment of debt (9)
 
(6,970
)


(6,970
)
 

Income (loss) before income taxes and equity in earnings (losses) of an investee
 
(18,471
)
 
8,392

 
(51,061
)
 
234,834

Income tax benefit (expense) (7)
 
(16,660
)
 
260

 
(17,002
)
 
(799
)
Equity in earnings (losses) of an investee (10)
 
(2,218
)
 
130

 
(2,936
)
 
534

Net income (loss)
 
$
(37,349
)
 
$
8,782

 
$
(70,999
)
 
$
234,569


Weighted average common shares outstanding (basic)
 
164,382

 
164,284

 
164,376

 
164,281

Weighted average common shares outstanding (diluted)
 
164,382

 
164,326

 
164,376

 
164,324


Net income (loss) per common share (basic and diluted)
 
$
(0.23
)
 
$
0.05

 
$
(0.43
)
 
$
1.43

See Notes on pages 11 and 12


9


SERVICE PROPERTIES TRUST
RECONCILIATIONS OF FUNDS FROM OPERATIONS,
NORMALIZED FUNDS FROM OPERATIONS, EBITDA, EBITDAre AND ADJUSTED EBITDAre
(amounts in thousands, except per share data)
(Unaudited)
 
Three Months Ended
June 30,
 
Six Months Ended
June 30,
 
2020
 
2019
 
2020
 
2019
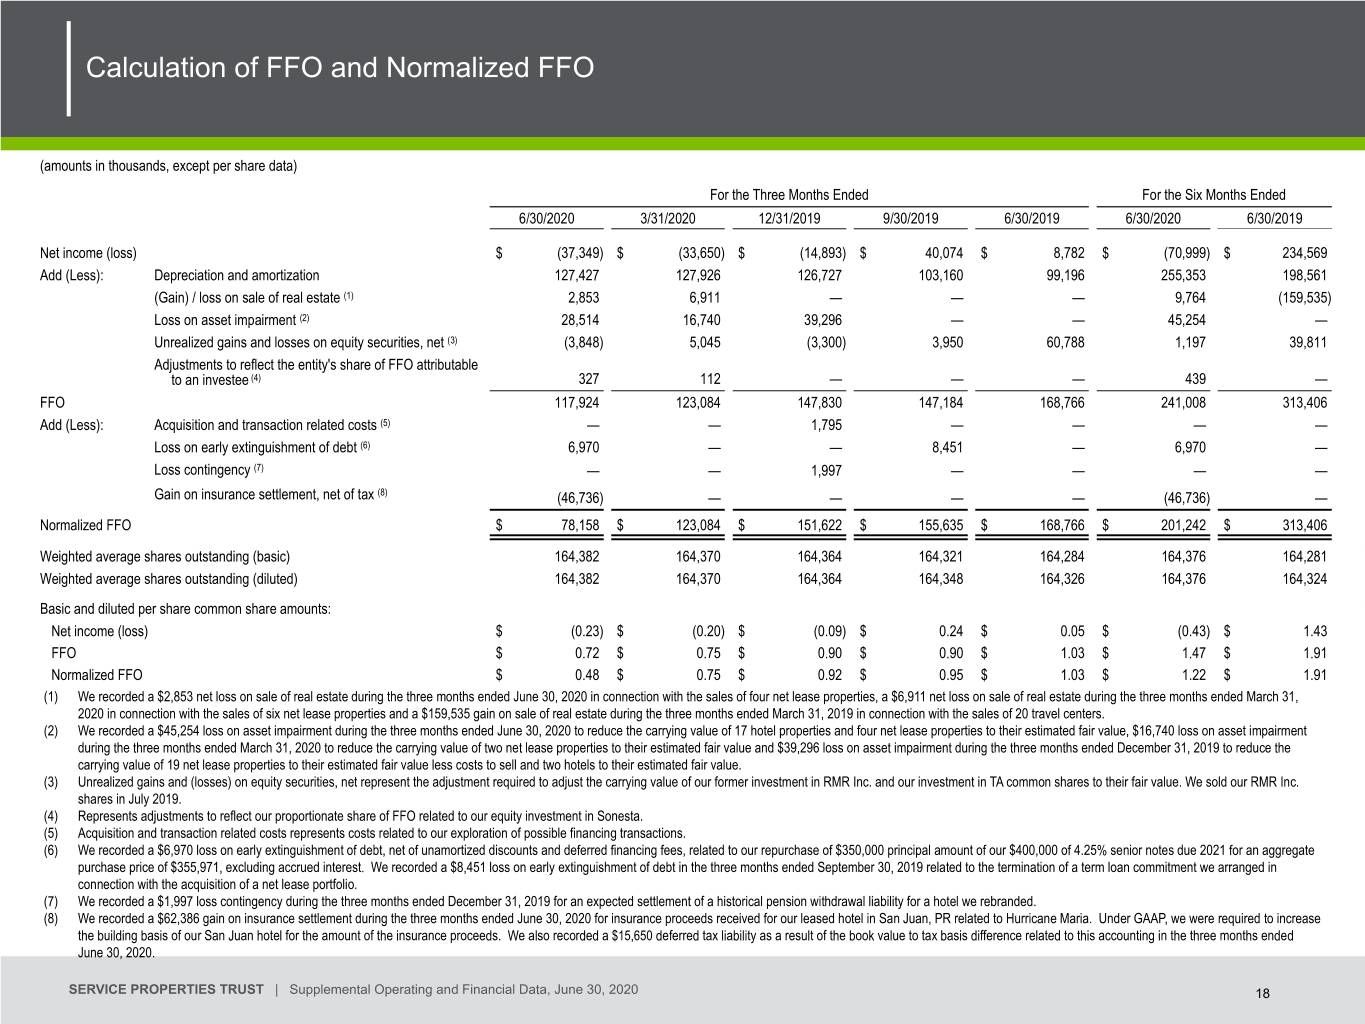
Calculation of FFO and Normalized FFO: (11)


Net income (loss)
$
(37,349
)
 
$
8,782

 
$
(70,999
)
 
$
234,569

Add (Less): Depreciation and amortization
127,427

 
99,196

 
255,353

 
198,561

(Gain) loss on sale of real estate (6)
2,853


9,764

 
(159,535
)
Loss on asset impairment (5)
28,514


45,254


Unrealized (gains) losses on equity securities, net (8)
(3,848
)
 
60,788

 
1,197

 
39,811

Adjustments to reflect the entity’s share of FFO attributable to an investee (10)
327


439


FFO
117,924

 
168,766

 
241,008

 
313,406

Add: Loss on early extinguishment of debt (9)
6,970


6,970


                      Gain on insurance settlement, net of tax (7)
(46,736
)


(46,736
)
 

Normalized FFO
$
78,158

 
$
168,766

 
$
201,242

 
$
313,406


Weighted average common shares outstanding (basic)
164,382

 
164,284

 
164,376

 
164,281

Weighted average common shares outstanding (diluted)
164,382

 
164,326

 
164,376

 
164,324


Basic and diluted per common share amounts:


FFO
$
0.72

 
$
1.03

 
$
1.47

 
$
1.91

Normalized FFO
$
0.48

 
$
1.03

 
$
1.22

 
$
1.91

Distributions declared per share
$
0.01

 
$
0.54

 
$
0.55

 
$
1.07

 
Three Months Ended
June 30,
 
Six Months Ended
June 30,
 
2020
 
2019
 
2020
 
2019
Calculation of EBITDA, EBITDAre and Adjusted EBITDAre:(12)


Net income (loss)
$
(37,349
)
 
$
8,782

 
$
(70,999
)
 
$
234,569

Add (Less): Interest expense
72,072

 
49,601

 
143,147

 
99,367

Income tax expense (7)
16,660

 
(260
)
 
17,002

 
799

Depreciation and amortization
127,427

 
99,196

 
255,353

 
198,561

EBITDA
178,810

 
157,319

 
344,503

 
533,296

Add (Less): (Gain) loss on sale of real estate (6)
2,853


9,764

 
(159,535
)
Loss on asset impairment (5)
28,514


45,254


EBITDAre
210,177

 
157,319

 
399,521

 
373,761

Add (Less):


General and administrative expense paid in common shares (13)
832

 
865

 
1,422

 
1,301

Adjustments to reflect the entity’s share of EBITDA attributable to an investee (10)
421


579


Loss on early extinguishment of debt (9)
6,970


6,970


Gain on insurance settlement (7)
(62,386
)


(62,386
)
 

Unrealized (gains) losses on equity securities, net (8)
(3,848
)
 
60,788

 
1,197

 
39,811

Adjusted EBITDAre
$
152,166

 
$
218,972

 
$
347,303

 
$
414,873

See Notes on pages 11 and 12

10


(1)
As of June 30, 2020, SVC owned 329 hotels; 328 of these hotels were managed by hotel operating companies and one hotel was leased to a hotel operating company. SVC’s condensed consolidated statements of income include hotel operating revenues and expenses of managed hotels and rental income and other operating expenses from its leased hotel and net lease properties. Certain of SVC’s managed hotels had net operating results that were, in the aggregate, $196,107 and $4,853 less than the minimum returns due to SVC for the three months ended June 30, 2020 and 2019, respectively, and $314,171 and $37,085 less than the minimum returns due to SVC for the six months ended June 30, 2020 and 2019, respectively. When managers of these hotels are required to fund the shortfalls under the terms of SVC’s management agreements or their guarantees, SVC reflects such fundings (including security deposit applications) in its condensed consolidated statements of income as a reduction of hotel operating expenses. The reduction to hotel operating expenses was $121,155 for the three months ended June 30, 2020 and $191,660 and $16,679 for the six months ended June 30, 2020 and 2019, respectively. There was no reduction to hotel operating expenses for the three months ended June 30, 2019. When SVC reduces the amounts of the security deposit it holds for any of its operating agreements for payment deficiencies, it does not result in additional cash flows to SVC of the deficiency amounts, but reduces the refunds due to the respective tenants or managers who have provided SVC with these deposits upon expiration of the applicable operating agreement. The security deposits are non-interest bearing and are not held in escrow. SVC had shortfalls at certain of its managed hotel portfolios not funded by the managers of these hotels under the terms of its management agreements of $73,617 and $5,090 for the three months ended June 30, 2020 and 2019, respectively, and $121,373 and $23,797 for the six months ended June 30, 2020 and 2019, respectively, which represent the unguaranteed portions of SVC’s minimum returns from its Sonesta, Marriott and Wyndham agreements. The net operating results of SVC’s managed hotel portfolios did not exceed the minimum returns due to SVC for either of the three and six months ended June 30, 2020. However, certain of SVC’s managed hotel portfolios had net operating results that were, in the aggregate, $21,102 and $10,494 more than the minimum returns due to SVC for the three and six months ended June 30, 2019, respectively. Certain of SVC’s guarantees and its security deposits may be replenished by a share of future cash flows from the applicable hotel operations in excess of the minimum returns due to SVC, certain fees to the manager, or working capital advances, if any, pursuant to the terms of the applicable agreements. When SVC’s guarantees and security deposits are replenished by cash flows from hotel operations, SVC reflects such replenishments in its condensed consolidated statements of income as an increase to hotel operating expenses. There were no such replenishments for the either of the three or six months ended June 30, 2020, respectively, and replenishments of $9,208 and $3,422 for the three and six months ended June 30, 2019, respectively.
(2)
SVC increased rental income by $875 for the three months ended June 30, 2020, reduced rental income by $3,190 for the three months ended June 30, 2019 and reduced rental income by $2,669 and $4,322 for the six months ended June 30, 2020 and 2019, respectively, to record scheduled rent changes under certain of SVC’s leases, the deferred rent obligations under SVC’s leases with TA and the estimated future payments to SVC under its leases with TA for the cost of removing underground storage tanks on a straight-line basis.
(3)
Various percentages of total sales at certain of SVC’s hotels are FF&E reserve escrows. SVC owns all the FF&E reserve escrows for its hotels. SVC reports deposits by its tenants into the escrow accounts under its hotel leases as FF&E reserve income. SVC does not report the amounts which are escrowed as FF&E reserves for its managed hotels as FF&E reserve income.
(4)
Incentive fees under SVC’s business management agreement with The RMR Group LLC are payable after the end of each calendar year, are calculated based on common share total return, as defined, and are included in general and administrative expense in SVC’s condensed consolidated statements of income. In calculating net income (loss) in accordance with GAAP, SVC recognizes estimated business management incentive fee expense, if any, in the first, second and third quarters. Although SVC recognizes this expense, if any, in the first, second and third quarters for purposes of calculating net income (loss), SVC does not include these amounts in the calculation of Normalized FFO or Adjusted EBITDAre until the fourth quarter, which is when the business management incentive fee expense amount for the year, if any, is determined. No business management incentive fee expense was recorded for the three and six months ended June 30, 2020 or 2019.
(5)
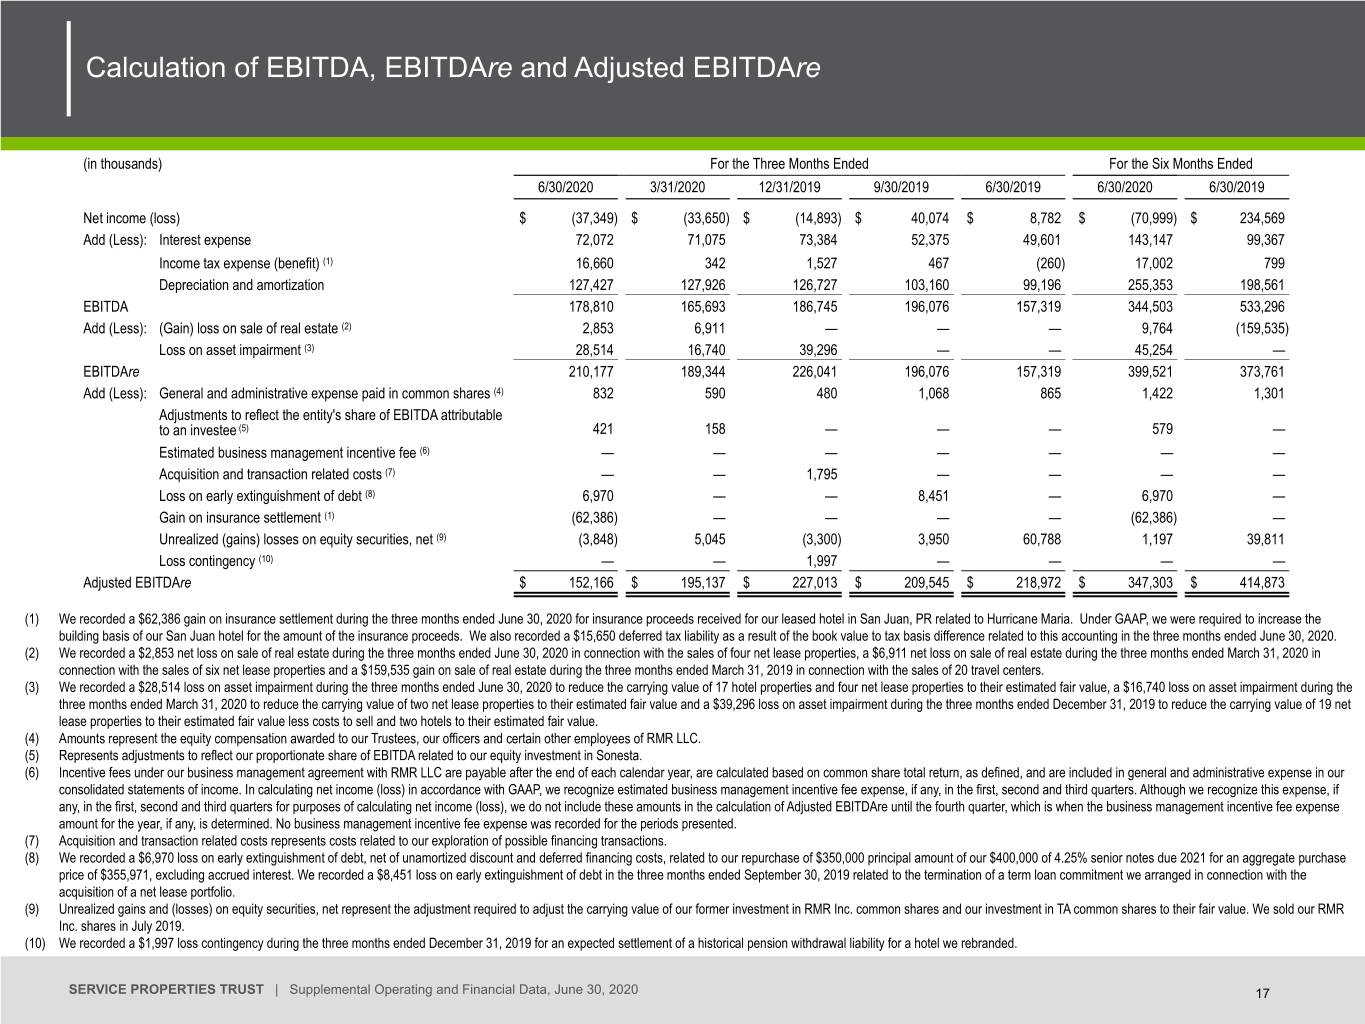
SVC recorded a $28,514 loss on asset impairment during the three months ended June 30, 2020 to reduce the carrying value of 17 hotel properties and four net lease properties to their estimated fair value. SVC recorded a $16,740 loss on asset impairment during the three months ended March 31, 2020 to reduce the carrying value of two net lease properties to their estimated fair value.
(6)
SVC recorded a $2,853 net loss on sale of real estate during the three months ended June 30, 2020 in connection with the sales of four net lease properties. SVC recorded a $6,911 net loss on sale of real estate during the three months ended March 31, 2020 in connection with the sales of six net lease properties. SVC recorded a $159,535 gain on sale of real estate during the three months ended March 31, 2019 in connection with the sales of 20 travel centers.
(7)
Unrealized gains (losses) on equity securities, net represents the adjustment required to adjust the carrying value of SVC’s former investment in RMR Inc. common stock and its investment in TA common shares to their fair value. SVC sold its RMR Inc. shares on July 1, 2019.
(8)
SVC recorded a $62,386 gain on insurance settlement during the three months ended June 30, 2020 for insurance proceeds received for its leased hotel in San Juan, PR related to Hurricane Maria. Under GAAP, SVC was required to increase the building basis of its San Juan hotel for the amount of the insurance proceeds. SVC also recorded a $15,650 deferred tax liability as a result of the book value to tax basis difference related to this accounting in the three months ended June 30, 2020.
(9)
SVC recorded a $6,970 loss on extinguishment of debt, net of unamortized discount and deferred financing costs, relating to its repurchase of $350,000 principal amount of its $400,000 of 4.25% senior notes due 2021, for an aggregate purchase price of $355,971, excluding accrued interest.
(10)
Represents SVC’s proportionate share of its equity investment in Sonesta during the three and six months ended June 30, 2020 and Affiliates Insurance Company during the three and six months ended June 30, 2019.
(11)
SVC calculates FFO and Normalized FFO as shown above. FFO is calculated on the basis defined by The National Association of Real Estate Investment Trusts, or Nareit, which is net income (loss), calculated in accordance with GAAP, excluding any gain or loss on sale of properties and loss on impairment of real estate assets, if any, plus real estate depreciation and amortization, less any unrealized gains and losses on equity securities, as well as certain other adjustments currently not applicable to SVC. In calculating Normalized FFO, SVC adjusts for the item shown above and includes business management incentive fees, if any, only in the fourth quarter versus the quarter when they are recognized as an expense in accordance with GAAP due to their quarterly volatility not necessarily being indicative of SVC’s core operating performance and the uncertainty as to whether any such business management incentive fees

11


will be payable when all contingencies for determining such fees are known at the end of the calendar year. FFO and Normalized FFO are among the factors considered by SVC’s Board of Trustees when determining the amount of distributions to its shareholders. Other factors include, but are not limited to, requirements to maintain SVC’s qualification for taxation as a REIT, limitations in its credit agreement and public debt covenants, the availability to SVC of debt and equity capital, SVC’s distribution rate as a percentage of the trading price of its common shares, or dividend yield, and to the dividend yield of other REITs, SVC’s expectation of its future capital requirements and operating performance, and SVC’s expected needs for and availability of cash to pay its obligations. Other real estate companies and REITs may calculate FFO and Normalized FFO differently than SVC does.
(12)
SVC calculates EBITDA, EBITDA for real estate, or EBITDAre, and Adjusted EBITDAre as shown above. EBITDAre is calculated on the basis defined by Nareit which is EBITDA, excluding gains and losses on the sale of real estate, loss on impairment of real estate assets, if any, as well as certain other adjustments currently not applicable to SVC. In calculating Adjusted EBITDAre, SVC adjusts for the items shown above and includes business management incentive fees, if any, only in the fourth quarter versus the quarter when they are recognized as an expense in accordance with GAAP due to their quarterly volatility not necessarily being indicative of SVC’s core operating performance and the uncertainty as to whether any such business management incentive fees will be payable when all contingencies for determining such fees are known at the end of the calendar year. Other real estate companies and REITs may calculate EBITDA, EBITDAre and Adjusted EBITDAre differently than SVC does.
(13)
Amounts represent the equity compensation for SVC’s Trustees, its officers and certain other employees of SVC’s manager.

12


SERVICE PROPERTIES TRUST
CONDENSED CONSOLIDATED BALANCE SHEETS
(amounts in thousands, except share data)
(Unaudited)
 
 
June 30, 2020
 
December 31, 2019
ASSETS


Real estate properties:


Land
 
$
2,033,292

 
$
2,066,602

Buildings, improvements and equipment
 
9,113,157

 
9,318,434

Total real estate properties, gross
 
11,146,449

 
11,385,036

Accumulated depreciation
 
(3,147,359
)
 
(3,120,761
)
Total real estate properties, net
 
7,999,090

 
8,264,275

Acquired real estate leases and other intangibles, net
 
350,546

 
378,218

Assets held for sale
 
152,367

 
87,493

Cash and cash equivalents
 
20,206

 
27,633

Restricted cash
 
29,652

 
53,626

Due from related persons
 
60,999

 
68,653

Other assets, net
 
266,685

 
154,069

Total assets
 
$
8,879,545

 
$
9,033,967


LIABILITIES AND SHAREHOLDERS’ EQUITY


Unsecured revolving credit facility
 
$
33,127

 
$
377,000

Unsecured term loan, net
 
397,358

 
397,889

Senior unsecured notes, net
 
5,732,018

 
5,287,658

Security deposits
 
9,276

 
109,403

Accounts payable and other liabilities
 
352,473

 
335,696

Due to related persons
 
9,572

 
20,443

Total liabilities
 
6,533,824

 
6,528,089


Commitments and contingencies


Shareholders’ equity:


Common shares of beneficial interest, $.01 par value; 200,000,000 shares authorized; 164,597,589 and 164,563,034 shares issued and outstanding, respectively
 
1,646

 
1,646

Additional paid in capital
 
4,548,880

 
4,547,529

Cumulative net income available for common shareholders
 
3,420,646

 
3,491,645

Cumulative common distributions
 
(5,625,451
)
 
(5,534,942
)
Total shareholders’ equity
 
2,345,721

 
2,505,878

Total liabilities and shareholders’ equity
 
$
8,879,545

 
$
9,033,967


13


Warning Concerning Forward-Looking Statements
This press release contains statements that constitute forward-looking statements within the meaning of the Private Securities Litigation Reform Act of 1995 and other securities laws. Whenever SVC uses words such as “believe,” “expect,” “anticipate,” “intend,” “plan,” “estimate,” “will,” “may” and negatives or derivatives of these or similar expressions, SVC is making forward-looking statements. These forward-looking statements are based upon SVC’s present intent, beliefs or expectations, but forward-looking statements are not guaranteed to occur and may not occur. Actual results may differ materially from those contained in or implied by SVC’s forward-looking statements. Forward-looking statements involve known and unknown risks, uncertainties and other factors, some of which are beyond SVC’s control. For example:
Mr. Murray indicates SVC’s belief that it is currently well positioned with a diverse portfolio of assets and ample liquidity. This may imply that SVC has the ability to withstand the current economic downturn. However, if the COVID-19 pandemic continues to have a negative impact on the economy, the economic downturn could continue for an extended period or worsen, SVC’s operators’ and tenants’ businesses, operations and cash positions may be materially and adversely impacted and result in additional operators and tenants being unable to pay rents and returns to SVC or in continuing as going concerns. In turn, SVC’s financial situation and liquidity could be materially and adversely impacted and the value of its properties could decline.
Mr. Murray indicates SVC has continued to take proactive steps to increase its liquidity, manage its debt maturities and preserve capital. However, if the COVID-19 pandemic or the current economic conditions continue for an extended period or worsen, these actions may not be adequate to ensure that SVC maintains sufficient liquidity. In addition, the capital spending deferred may become necessary at an earlier date than currently expected and the need to make other capital spending may arise unexpectedly or due to external or other events. Further, SVC may not resume paying regular quarterly distributions at or near historic levels in the near future, or otherwise increase or maintain the current level of distributions, and the reduced rate may extend for an indefinite period because of changes in SVC’s earnings, liquidity, financial leverage or other circumstances. Also, rent deferrals SVC agrees to may be insufficient and those tenants may continue to be unable or unwilling to pay amounts owed to SVC, including the deferred rent, and they may fail to continue as going concerns. In addition, additional SVC tenants may become unable or unwilling to pay rent and seek similar or additional relief from SVC, particularly if the current severe economic conditions do not soon significantly improve.
Mr. Murray indicates SVC’s belief that it experienced the height of the COVID-19 pandemic in April and trends are pointing to a slow and steady recovery. However, positive trends within the second quarter may not be indicative of future trends related to hotel occupancy and the ability of net lease tenants to pay amounts due under their leases. COVID-19 infections have recently increased in large parts of the United States and the United States economy is facing continuous challenges. These positive trends within the second quarter could reverse and further deteriorate as a result.
Mr. Murray indicates that SVC plans to move forward with certain of its previously planned hotel sales by year end. This may imply that SVC will succeed in completing those sales and at prices it expects. However, SVC may not be able to complete these sales by year end or at all at prices and other terms it considers acceptable. The sales of SVC’s properties are subject to various contingencies; accordingly, SVC cannot provide any assurance that it will sell any of these properties and the sales may be delayed or may not occur.
SVC’s perception that its diverse portfolio of suburban extended stay and limited service hotels are expected to recover faster than urban full-service hotels may not be realized.

14


Although SVC obtained a limited waiver of certain financial covenants through March 2021, it may fail to satisfy additional covenants contained in its credit agreement or fail to satisfy its public debt covenants. SVC’s ability to borrow under its revolving credit facility is subject to SVC satisfying those covenants and other conditions. If SVC’s operating results and financial condition are significantly and adversely impacted by current economic conditions or otherwise, SVC may fail to satisfy those covenants and conditions.
SVC fully utilized the security deposit it held from IHG and IHG has defaulted on its payments to SVC. There is no assurance IHG will cure these defaults or that SVC will successfully negotiate modifications to the existing agreements on favorable terms. Further, if SVC does not come to an agreement with IHG, it expects to rebrand all 103 hotels under the IHG agreement and the terms of the arrangements with any successor operator may not be as favorable as the existing agreements with IHG. SVC may not be able to rebrand and, even if it is able to rebrand, transitioning hotels to another operator is disruptive to their operations and requires significant capital investments and may not occur.
SVC fully utilized the security deposit it held and exhausted the $30.0 million limited guarantee to cover shortfalls in hotel cash flows available to pay the minimum returns due to SVC under its Marriott agreement. Under the Marriott agreement, if the security deposit and guaranty have been depleted, Marriott is required to fund shortfalls up to 80% of the minimum returns due to SVC to avoid termination. There can be no assurance that Marriott will pay any shortfalls.
SVC cannot be sure of the future financial performance of SVC’s properties and whether such performance will cover SVC’s minimum returns and rents, or regarding SVC’s managers’, tenants’ or guarantors’ future actions or their abilities or willingness to pay minimum returns and rents owed to SVC. If other operators do not honor their obligations, SVC may seek to terminate its agreements with them or other actions to enforce its rights.
SVC has no guarantees or security deposits for the minimum returns due to SVC from SVC’s Sonesta or Wyndham agreements. Accordingly, SVC has received and may continue to receive amounts that are less than the contractual minimum returns stated in these agreements or SVC may incur losses from these hotels.
The information contained in SVC’s filings with the SEC, including under the caption “Risk Factors” in SVC’s periodic reports, or incorporated therein, identifies other important factors that could cause differences from SVC’s forward-looking statements. SVC’s filings with the SEC are available on the SEC’s website at www.sec.gov.
You should not place undue reliance upon forward-looking statements.
Except as required by law, SVC does not intend to update or change any forward-looking statements as a result of new information, future events or otherwise.
(end)

15
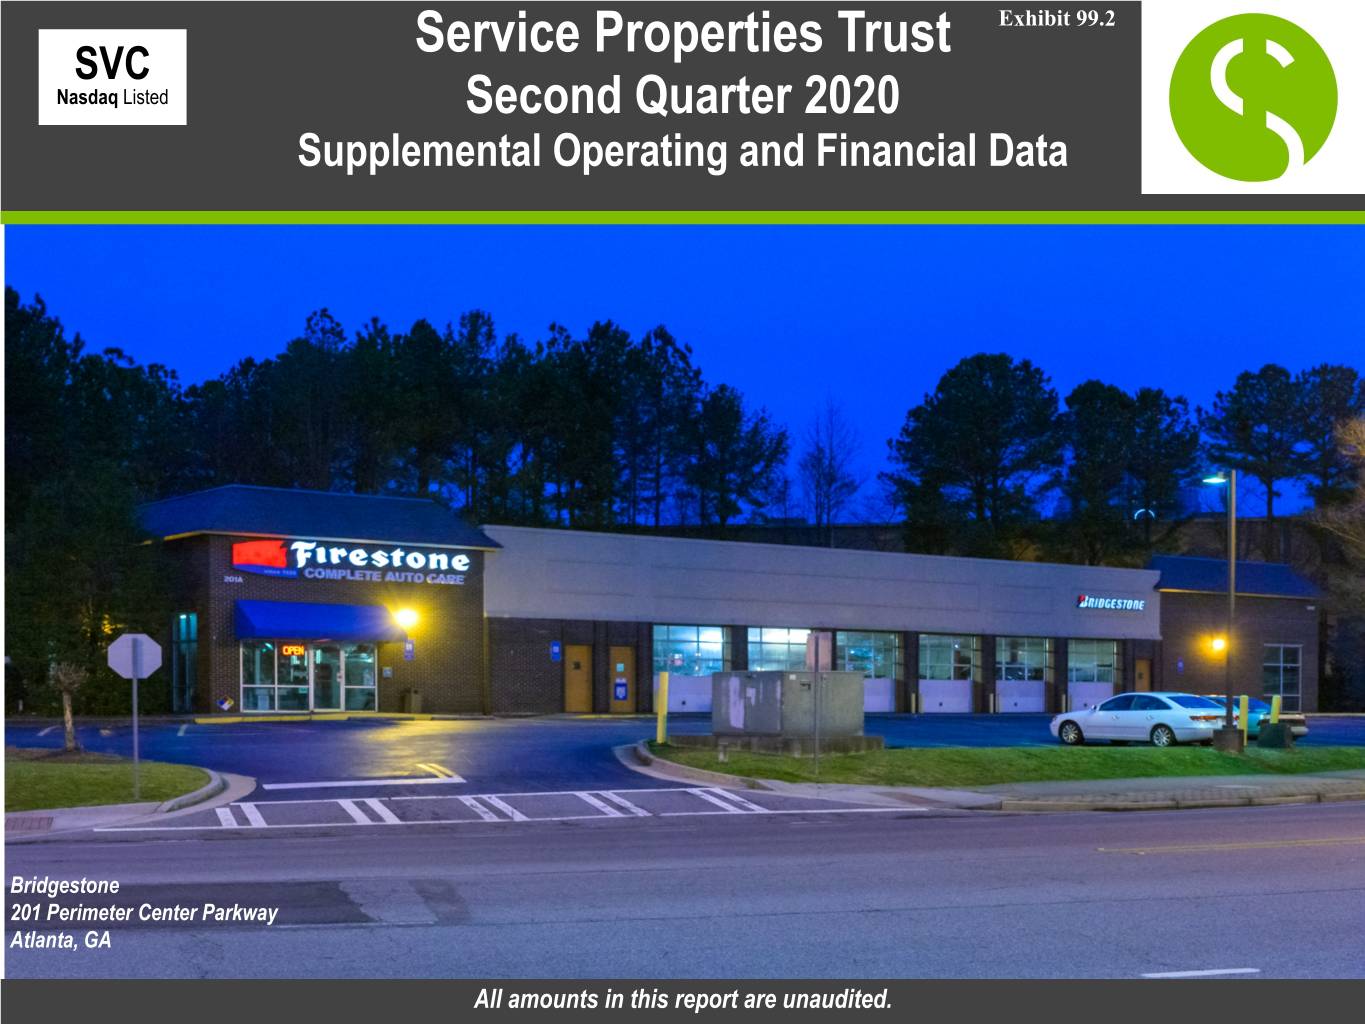
Service Properties Trust Exhibit 99.2 SVC Nasdaq Listed Second Quarter 2020 Supplemental Operating and Financial Data Bridgestone 201 Perimeter Center Parkway Atlanta, GA All amounts in this report are unaudited.


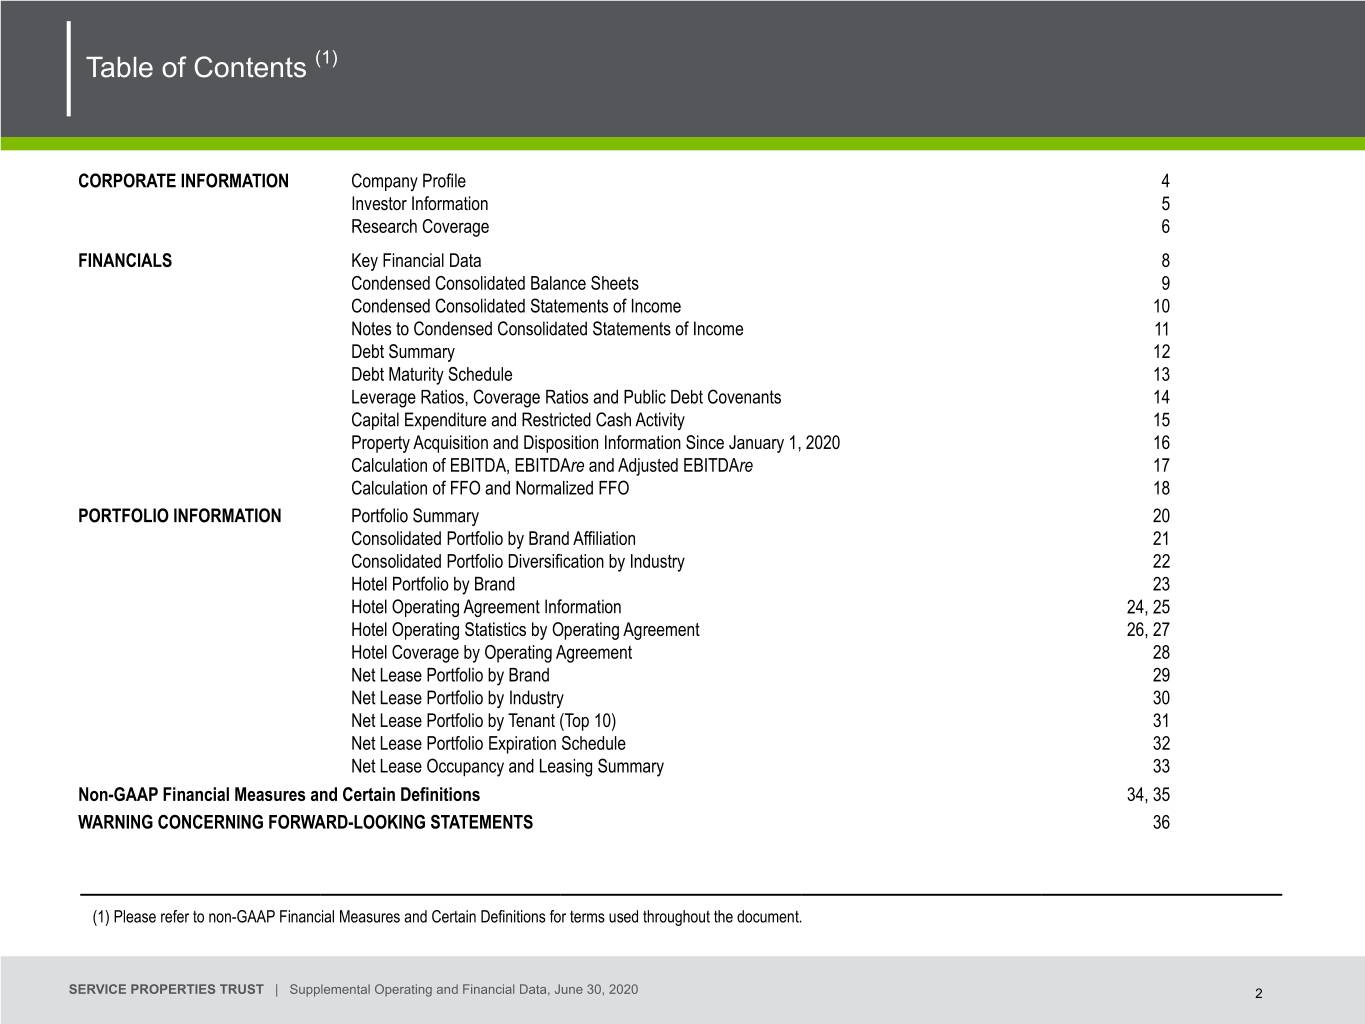
Table of Contents (1) CORPORATE INFORMATION Company Profile 4 Investor Information 5 Research Coverage 6 FINANCIALS Key Financial Data 8 Condensed Consolidated Balance Sheets 9 Condensed Consolidated Statements of Income 10 Notes to Condensed Consolidated Statements of Income 11 Debt Summary 12 Debt Maturity Schedule 13 Leverage Ratios, Coverage Ratios and Public Debt Covenants 14 Capital Expenditure and Restricted Cash Activity 15 Property Acquisition and Disposition Information Since January 1, 2020 16 Calculation of EBITDA, EBITDAre and Adjusted EBITDAre 17 Calculation of FFO and Normalized FFO 18 PORTFOLIO INFORMATION Portfolio Summary 20 Consolidated Portfolio by Brand Affiliation 21 Consolidated Portfolio Diversification by Industry 22 Hotel Portfolio by Brand 23 Hotel Operating Agreement Information 24, 25 Hotel Operating Statistics by Operating Agreement 26, 27 Hotel Coverage by Operating Agreement 28 Net Lease Portfolio by Brand 29 Net Lease Portfolio by Industry 30 Net Lease Portfolio by Tenant (Top 10) 31 Net Lease Portfolio Expiration Schedule 32 Net Lease Occupancy and Leasing Summary 33 Non-GAAP Financial Measures and Certain Definitions 34, 35 WARNING CONCERNING FORWARD-LOOKING STATEMENTS 36 (1) Please refer to non-GAAP Financial Measures and Certain Definitions for terms used throughout the document. SERVICE PROPERTIES TRUST | Supplemental Operating and Financial Data, June 30, 2020 2


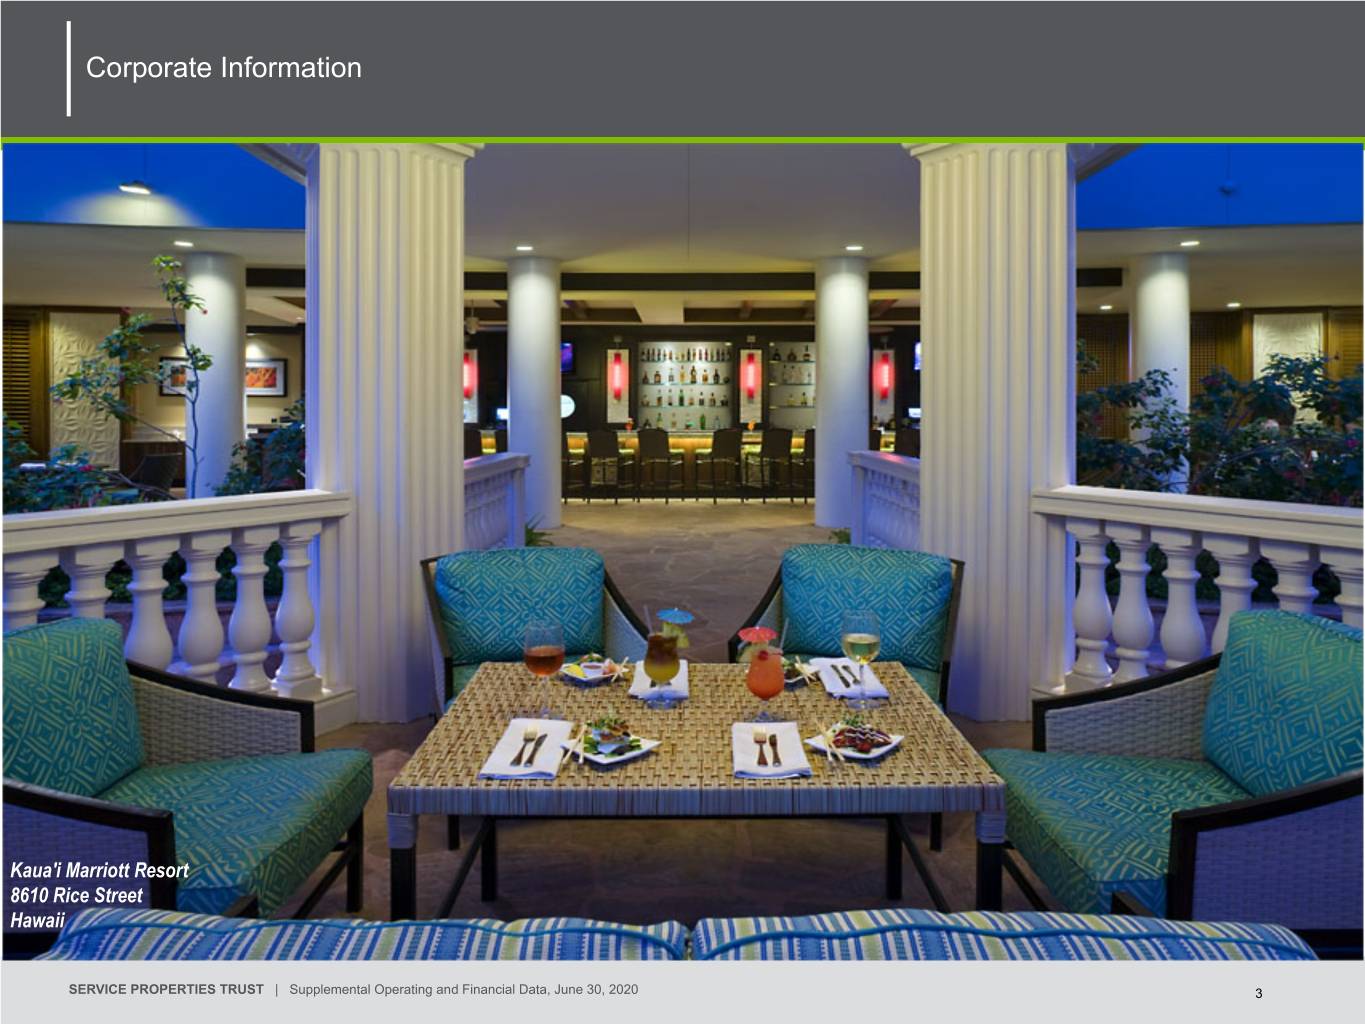
Corporate Information Kaua'i Marriott Resort 8610 Rice Street Hawaii SERVICE PROPERTIES TRUST | Supplemental Operating and Financial Data, June 30, 2020 3


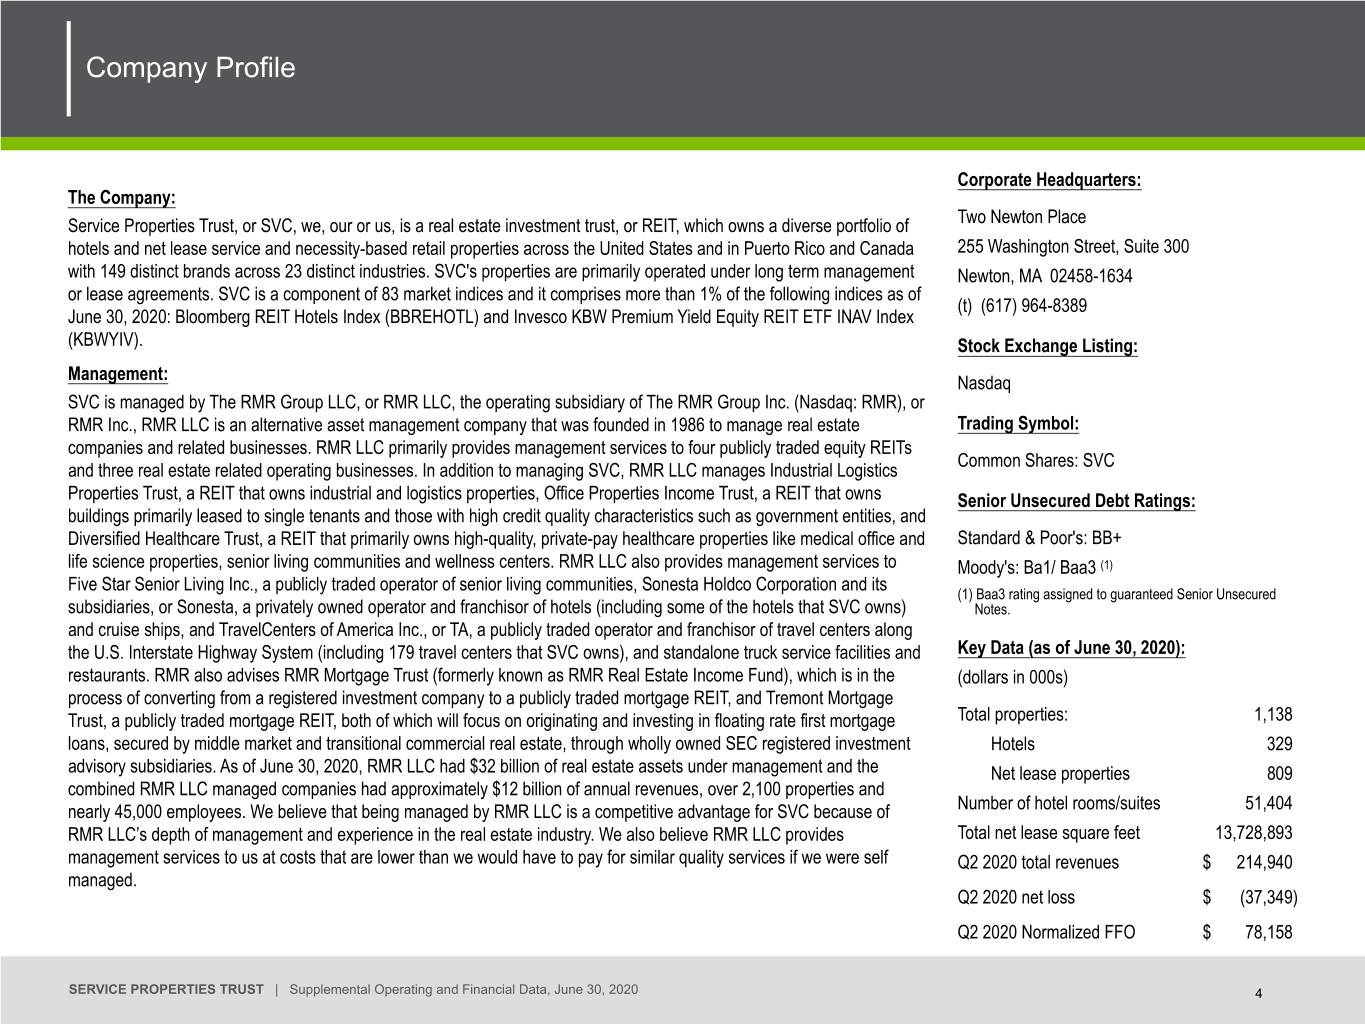
Company Profile Corporate Headquarters: The Company: Service Properties Trust, or SVC, we, our or us, is a real estate investment trust, or REIT, which owns a diverse portfolio of Two Newton Place hotels and net lease service and necessity-based retail properties across the United States and in Puerto Rico and Canada 255 Washington Street, Suite 300 with 149 distinct brands across 23 distinct industries. SVC's properties are primarily operated under long term management Newton, MA 02458-1634 or lease agreements. SVC is a component of 83 market indices and it comprises more than 1% of the following indices as of (t) (617) 964-8389 June 30, 2020: Bloomberg REIT Hotels Index (BBREHOTL) and Invesco KBW Premium Yield Equity REIT ETF INAV Index (KBWYIV). Stock Exchange Listing: Management: Nasdaq SVC is managed by The RMR Group LLC, or RMR LLC, the operating subsidiary of The RMR Group Inc. (Nasdaq: RMR), or RMR Inc., RMR LLC is an alternative asset management company that was founded in 1986 to manage real estate Trading Symbol: companies and related businesses. RMR LLC primarily provides management services to four publicly traded equity REITs Common Shares: SVC and three real estate related operating businesses. In addition to managing SVC, RMR LLC manages Industrial Logistics Properties Trust, a REIT that owns industrial and logistics properties, Office Properties Income Trust, a REIT that owns Senior Unsecured Debt Ratings: buildings primarily leased to single tenants and those with high credit quality characteristics such as government entities, and Diversified Healthcare Trust, a REIT that primarily owns high-quality, private-pay healthcare properties like medical office and Standard & Poor's: BB+ life science properties, senior living communities and wellness centers. RMR LLC also provides management services to Moody's: Ba1/ Baa3 (1) Five Star Senior Living Inc., a publicly traded operator of senior living communities, Sonesta Holdco Corporation and its (1) Baa3 rating assigned to guaranteed Senior Unsecured subsidiaries, or Sonesta, a privately owned operator and franchisor of hotels (including some of the hotels that SVC owns) Notes. and cruise ships, and TravelCenters of America Inc., or TA, a publicly traded operator and franchisor of travel centers along the U.S. Interstate Highway System (including 179 travel centers that SVC owns), and standalone truck service facilities and Key Data (as of June 30, 2020): restaurants. RMR also advises RMR Mortgage Trust (formerly known as RMR Real Estate Income Fund), which is in the (dollars in 000s) process of converting from a registered investment company to a publicly traded mortgage REIT, and Tremont Mortgage Trust, a publicly traded mortgage REIT, both of which will focus on originating and investing in floating rate first mortgage Total properties: 1,138 loans, secured by middle market and transitional commercial real estate, through wholly owned SEC registered investment Hotels 329 advisory subsidiaries. As of June 30, 2020, RMR LLC had $32 billion of real estate assets under management and the Net lease properties 809 combined RMR LLC managed companies had approximately $12 billion of annual revenues, over 2,100 properties and nearly 45,000 employees. We believe that being managed by RMR LLC is a competitive advantage for SVC because of Number of hotel rooms/suites 51,404 RMR LLC’s depth of management and experience in the real estate industry. We also believe RMR LLC provides Total net lease square feet 13,728,893 management services to us at costs that are lower than we would have to pay for similar quality services if we were self Q2 2020 total revenues $ 214,940 managed. Q2 2020 net loss $ (37,349) Q2 2020 Normalized FFO $ 78,158 SERVICE PROPERTIES TRUST | Supplemental Operating and Financial Data, June 30, 2020 4


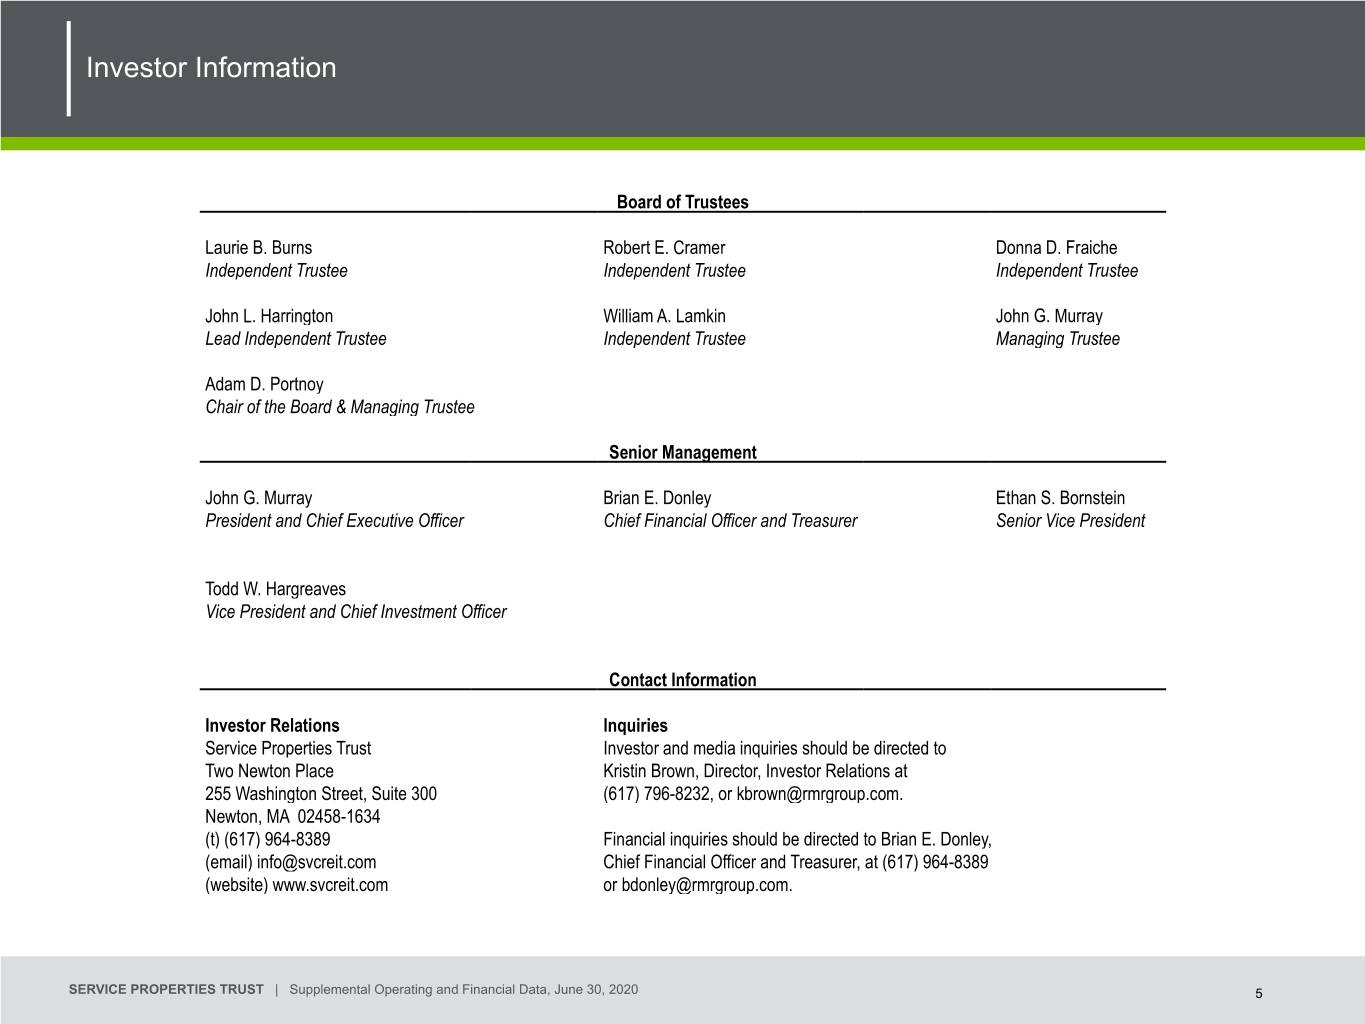
Investor Information Board of Trustees Laurie B. Burns Robert E. Cramer Donna D. Fraiche Independent Trustee Independent Trustee Independent Trustee John L. Harrington William A. Lamkin John G. Murray Lead Independent Trustee Independent Trustee Managing Trustee Adam D. Portnoy Chair of the Board & Managing Trustee Senior Management John G. Murray Brian E. Donley Ethan S. Bornstein President and Chief Executive Officer Chief Financial Officer and Treasurer Senior Vice President Todd W. Hargreaves Vice President and Chief Investment Officer Contact Information Investor Relations Inquiries Service Properties Trust Investor and media inquiries should be directed to Two Newton Place Kristin Brown, Director, Investor Relations at 255 Washington Street, Suite 300 (617) 796-8232, or [email protected]. Newton, MA 02458-1634 (t) (617) 964-8389 Financial inquiries should be directed to Brian E. Donley, (email) [email protected] Chief Financial Officer and Treasurer, at (617) 964-8389 (website) www.svcreit.com or [email protected]. SERVICE PROPERTIES TRUST | Supplemental Operating and Financial Data, June 30, 2020 5


Research Coverage Equity Research Coverage B. Riley | FBR Janney Montgomery Scott Wells Fargo Securities Bryan Maher Tyler Batory Dori Kesten (646) 885-5423 (215) 665-4448 (617) 603-4233 [email protected] [email protected] [email protected] Debt Research Coverage Wells Fargo Securities Thierry Perrein (704) 715-8455 [email protected] Rating Agencies Moody’s Investors Service S&P Global Reed Valutas Nicolas Villa (212) 553-14169 (212) 438-1534 [email protected] [email protected] SVC is followed by the analysts and its publicly held debt is rated by the rating agencies listed above. Please note that any opinions, estimates or forecasts regarding SVC's performance made by these analysts or agencies do not represent opinions, forecasts or predictions of SVC or its management. SVC does not by its reference above imply its endorsement of or concurrence with any information, conclusions or recommendations provided by any of these analysts or agencies. SERVICE PROPERTIES TRUST | Supplemental Operating and Financial Data, June 30, 2020 6


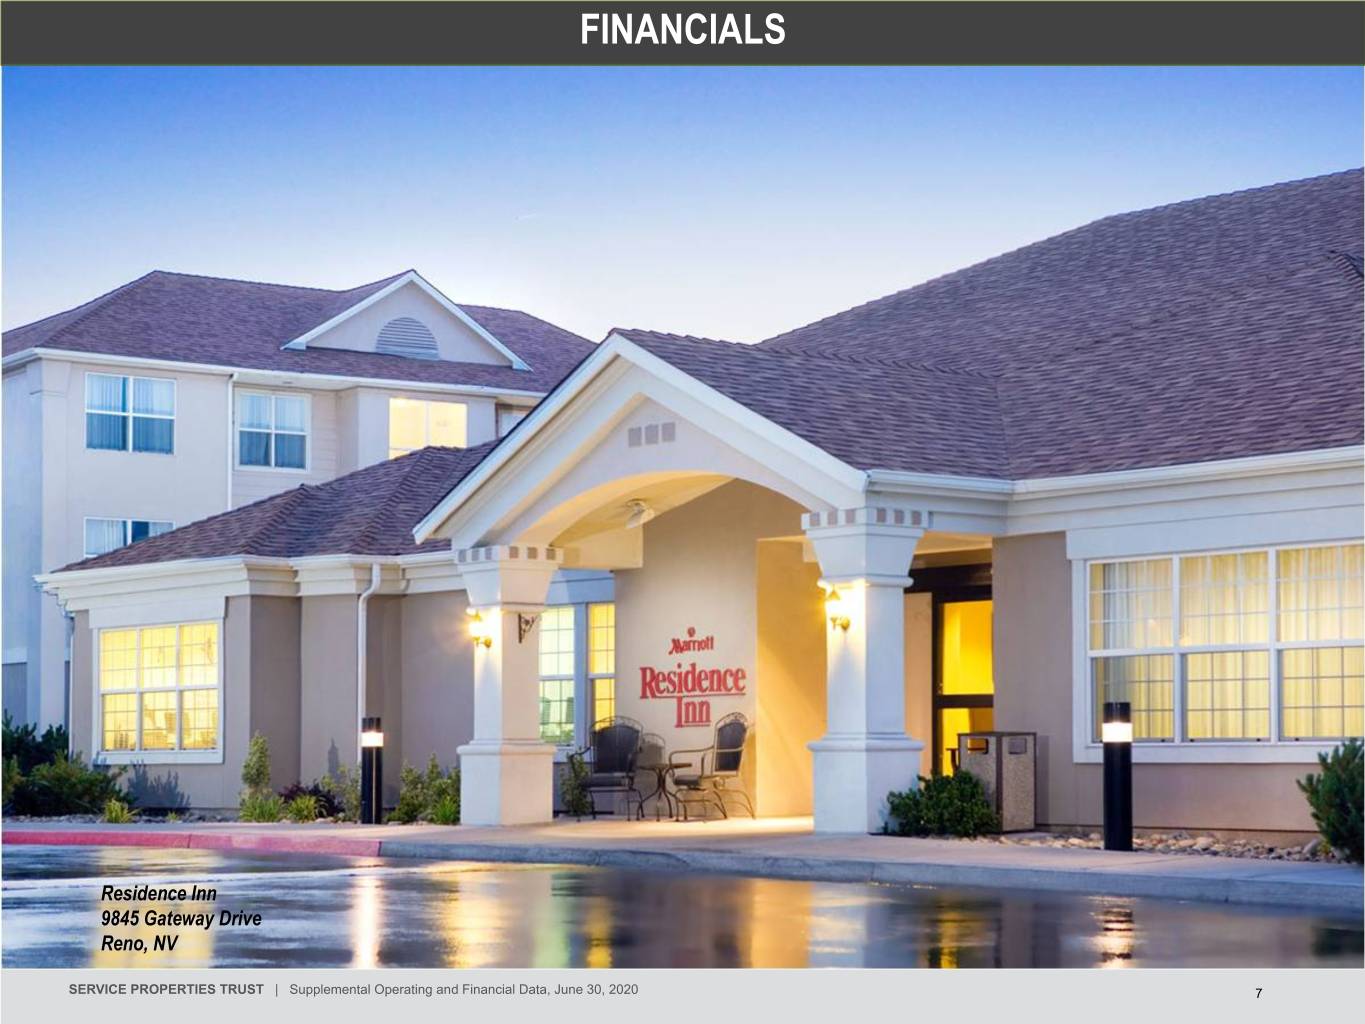
FINANCIALS Residence Inn 9845 Gateway Drive Reno, NV SERVICE PROPERTIES TRUST | Supplemental Operating and Financial Data, June 30, 2020 7


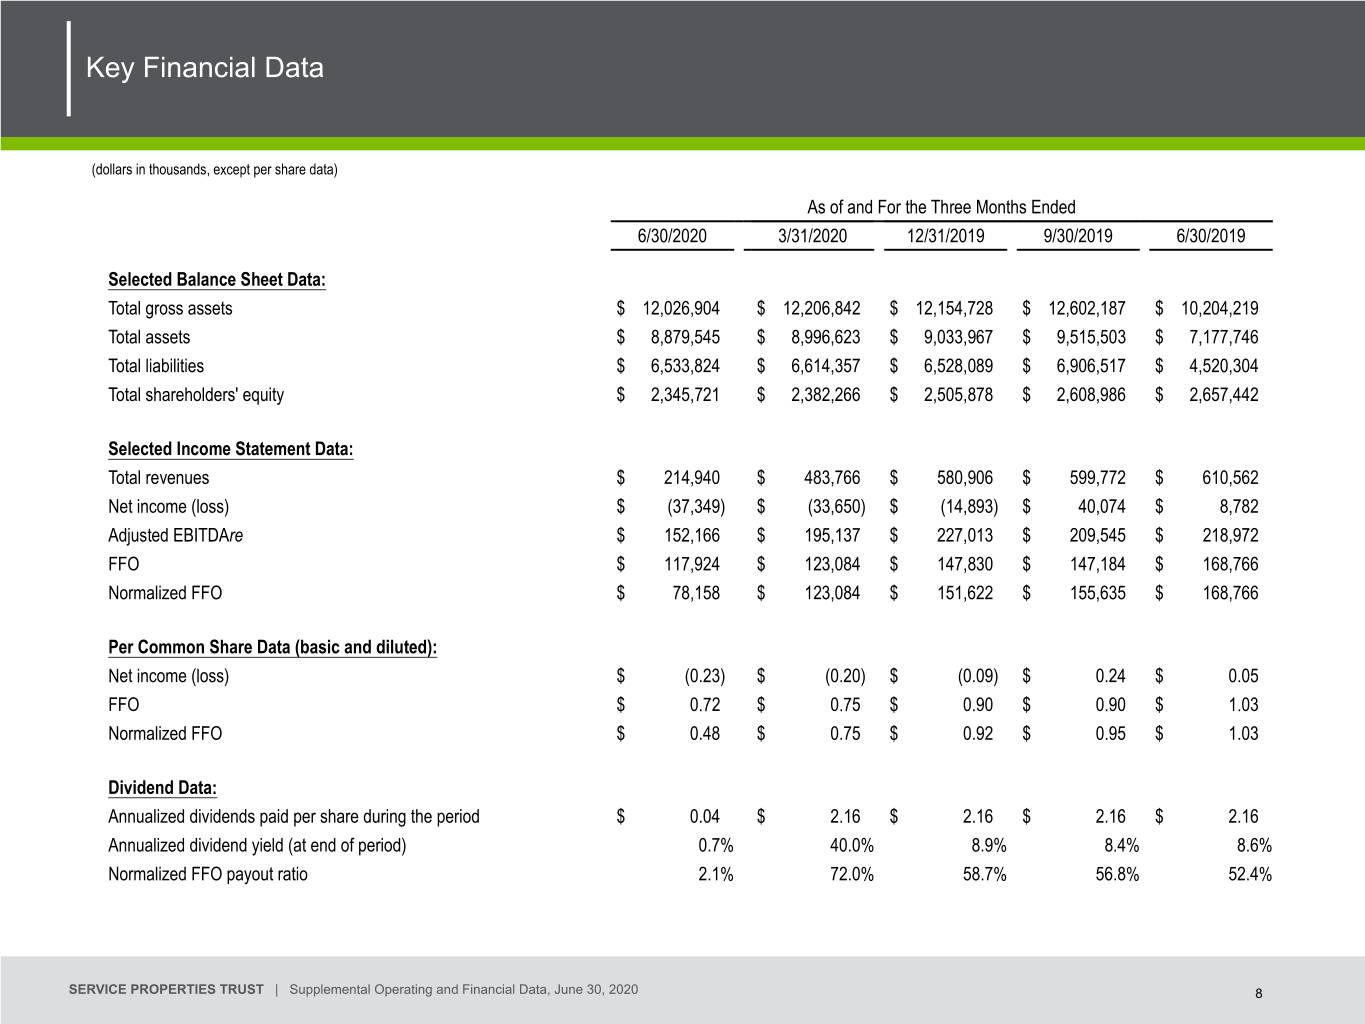
Key Financial Data (dollars in thousands, except per share data) As of and For the Three Months Ended 6/30/2020 3/31/2020 12/31/2019 9/30/2019 6/30/2019 Selected Balance Sheet Data: Total gross assets $ 12,026,904 $ 12,206,842 $ 12,154,728 $ 12,602,187 $ 10,204,219 Total assets $ 8,879,545 $ 8,996,623 $ 9,033,967 $ 9,515,503 $ 7,177,746 Total liabilities $ 6,533,824 $ 6,614,357 $ 6,528,089 $ 6,906,517 $ 4,520,304 Total shareholders' equity $ 2,345,721 $ 2,382,266 $ 2,505,878 $ 2,608,986 $ 2,657,442 Selected Income Statement Data: Total revenues $ 214,940 $ 483,766 $ 580,906 $ 599,772 $ 610,562 Net income (loss) $ (37,349) $ (33,650) $ (14,893) $ 40,074 $ 8,782 Adjusted EBITDAre $ 152,166 $ 195,137 $ 227,013 $ 209,545 $ 218,972 FFO $ 117,924 $ 123,084 $ 147,830 $ 147,184 $ 168,766 Normalized FFO $ 78,158 $ 123,084 $ 151,622 $ 155,635 $ 168,766 Per Common Share Data (basic and diluted): Net income (loss) $ (0.23) $ (0.20) $ (0.09) $ 0.24 $ 0.05 FFO $ 0.72 $ 0.75 $ 0.90 $ 0.90 $ 1.03 Normalized FFO $ 0.48 $ 0.75 $ 0.92 $ 0.95 $ 1.03 Dividend Data: Annualized dividends paid per share during the period $ 0.04 $ 2.16 $ 2.16 $ 2.16 $ 2.16 Annualized dividend yield (at end of period) 0.7% 40.0% 8.9% 8.4% 8.6% Normalized FFO payout ratio 2.1% 72.0% 58.7% 56.8% 52.4% SERVICE PROPERTIES TRUST | Supplemental Operating and Financial Data, June 30, 2020 8


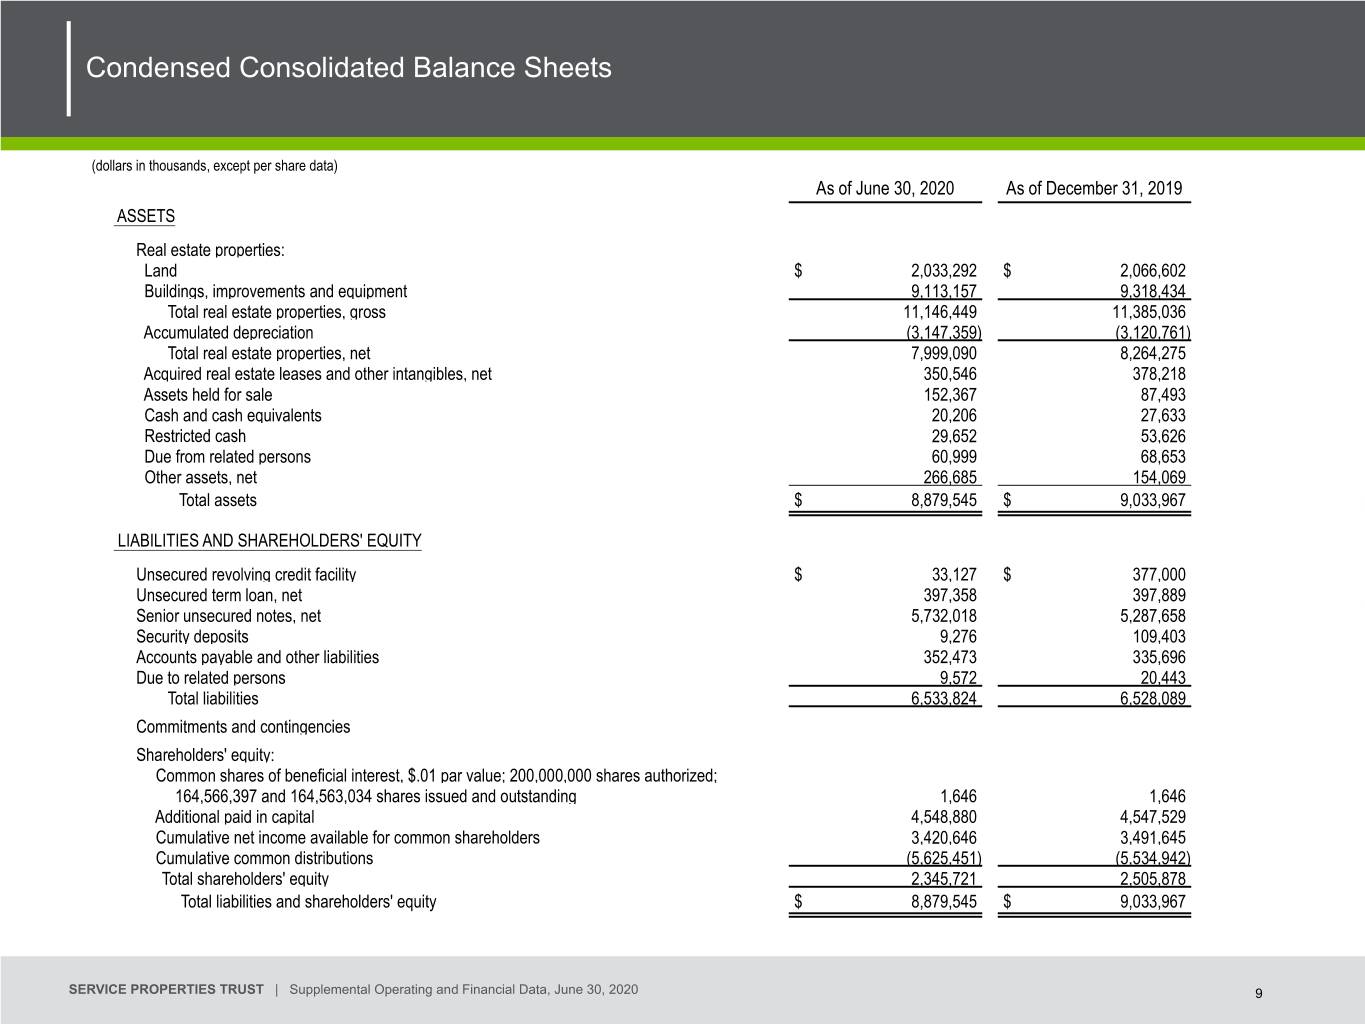
Condensed Consolidated Balance Sheets (dollars in thousands, except per share data) As of June 30, 2020 As of December 31, 2019 ASSETS Real estate properties: Land $ 2,033,292 $ 2,066,602 Buildings, improvements and equipment 9,113,157 9,318,434 Total real estate properties, gross 11,146,449 11,385,036 Accumulated depreciation (3,147,359) (3,120,761) Total real estate properties, net 7,999,090 8,264,275 Acquired real estate leases and other intangibles, net 350,546 378,218 Assets held for sale 152,367 87,493 Cash and cash equivalents 20,206 27,633 Restricted cash 29,652 53,626 Due from related persons 60,999 68,653 Other assets, net 266,685 154,069 Total assets $ 8,879,545 $ 9,033,967 LIABILITIES AND SHAREHOLDERS' EQUITY Unsecured revolving credit facility $ 33,127 $ 377,000 Unsecured term loan, net 397,358 397,889 Senior unsecured notes, net 5,732,018 5,287,658 Security deposits 9,276 109,403 Accounts payable and other liabilities 352,473 335,696 Due to related persons 9,572 20,443 Total liabilities 6,533,824 6,528,089 Commitments and contingencies Shareholders' equity: Common shares of beneficial interest, $.01 par value; 200,000,000 shares authorized; 164,566,397 and 164,563,034 shares issued and outstanding 1,646 1,646 Additional paid in capital 4,548,880 4,547,529 Cumulative net income available for common shareholders 3,420,646 3,491,645 Cumulative common distributions (5,625,451) (5,534,942) Total shareholders' equity 2,345,721 2,505,878 Total liabilities and shareholders' equity $ 8,879,545 $ 9,033,967 SERVICE PROPERTIES TRUST | Supplemental Operating and Financial Data, June 30, 2020 9


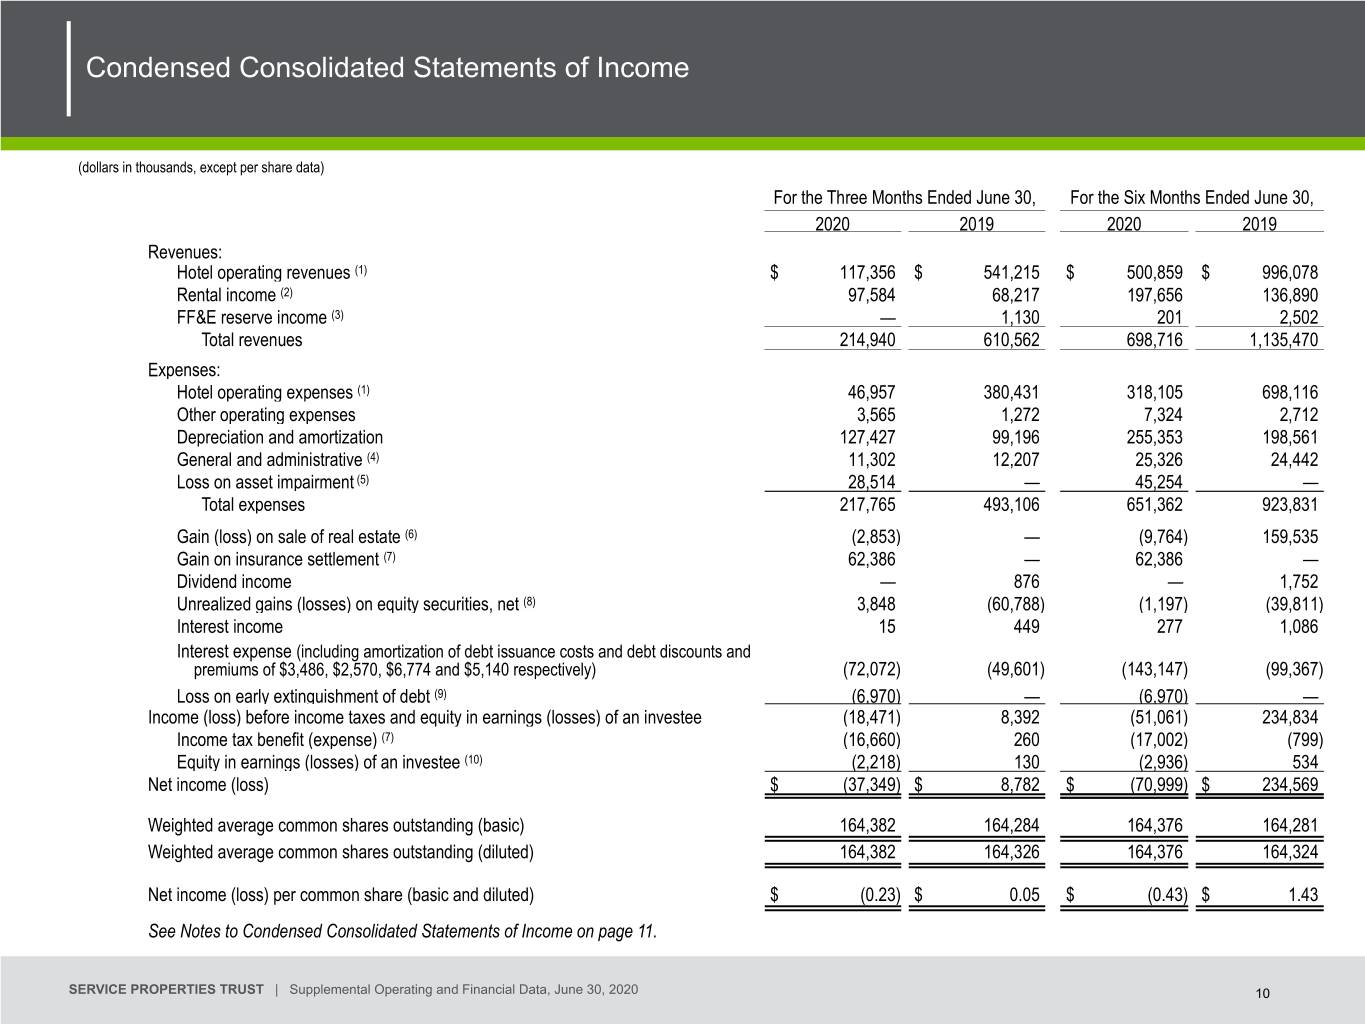
Condensed Consolidated Statements of Income (dollars in thousands, except per share data) For the Three Months Ended June 30, For the Six Months Ended June 30, 2020 2019 2020 2019 Revenues: Hotel operating revenues (1) $ 117,356 $ 541,215 $ 500,859 $ 996,078 Rental income (2) 97,584 68,217 197,656 136,890 FF&E reserve income (3) — 1,130 201 2,502 Total revenues 214,940 610,562 698,716 1,135,470 Expenses: Hotel operating expenses (1) 46,957 380,431 318,105 698,116 Other operating expenses 3,565 1,272 7,324 2,712 Depreciation and amortization 127,427 99,196 255,353 198,561 General and administrative (4) 11,302 12,207 25,326 24,442 Loss on asset impairment (5) 28,514 — 45,254 — Total expenses 217,765 493,106 651,362 923,831 Gain (loss) on sale of real estate (6) (2,853) — (9,764) 159,535 Gain on insurance settlement (7) 62,386 — 62,386 — Dividend income — 876 — 1,752 Unrealized gains (losses) on equity securities, net (8) 3,848 (60,788) (1,197) (39,811) Interest income 15 449 277 1,086 Interest expense (including amortization of debt issuance costs and debt discounts and premiums of $3,486, $2,570, $6,774 and $5,140 respectively) (72,072) (49,601) (143,147) (99,367) Loss on early extinguishment of debt (9) (6,970) — (6,970) — Income (loss) before income taxes and equity in earnings (losses) of an investee (18,471) 8,392 (51,061) 234,834 Income tax benefit (expense) (7) (16,660) 260 (17,002) (799) Equity in earnings (losses) of an investee (10) (2,218) 130 (2,936) 534 Net income (loss) $ (37,349) $ 8,782 $ (70,999) $ 234,569 Weighted average common shares outstanding (basic) 164,382 164,284 164,376 164,281 Weighted average common shares outstanding (diluted) 164,382 164,326 164,376 164,324 Net income (loss) per common share (basic and diluted) $ (0.23) $ 0.05 $ (0.43) $ 1.43 See Notes to Condensed Consolidated Statements of Income on page 11. SERVICE PROPERTIES TRUST | Supplemental Operating and Financial Data, June 30, 2020 10


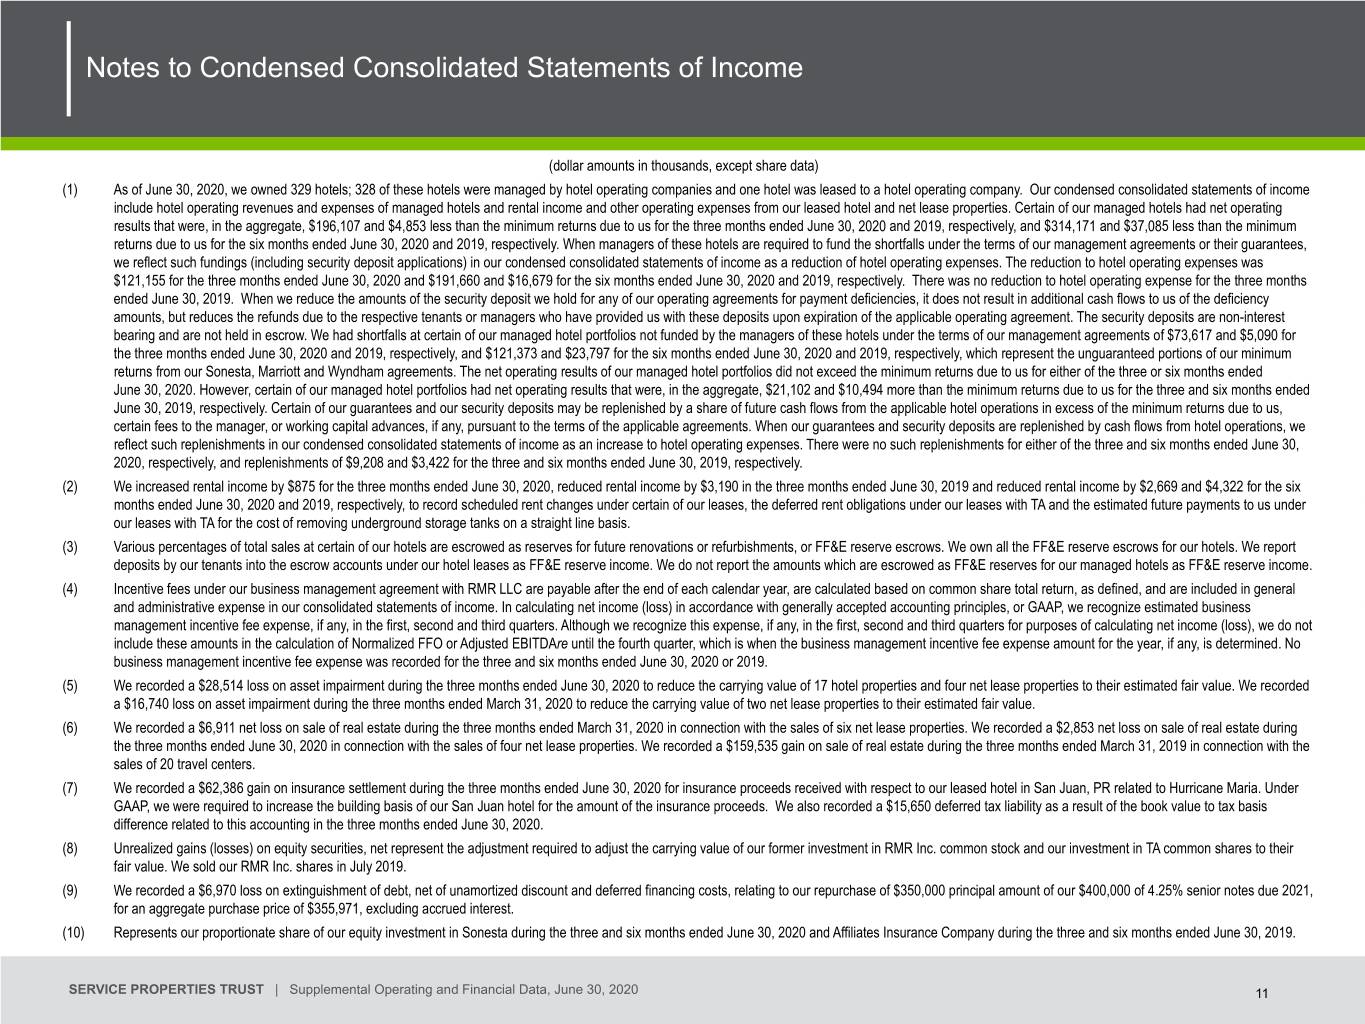
Notes to Condensed Consolidated Statements of Income (dollar amounts in thousands, except share data) (1) As of June 30, 2020, we owned 329 hotels; 328 of these hotels were managed by hotel operating companies and one hotel was leased to a hotel operating company. Our condensed consolidated statements of income include hotel operating revenues and expenses of managed hotels and rental income and other operating expenses from our leased hotel and net lease properties. Certain of our managed hotels had net operating results that were, in the aggregate, $196,107 and $4,853 less than the minimum returns due to us for the three months ended June 30, 2020 and 2019, respectively, and $314,171 and $37,085 less than the minimum returns due to us for the six months ended June 30, 2020 and 2019, respectively. When managers of these hotels are required to fund the shortfalls under the terms of our management agreements or their guarantees, we reflect such fundings (including security deposit applications) in our condensed consolidated statements of income as a reduction of hotel operating expenses. The reduction to hotel operating expenses was $121,155 for the three months ended June 30, 2020 and $191,660 and $16,679 for the six months ended June 30, 2020 and 2019, respectively. There was no reduction to hotel operating expense for the three months ended June 30, 2019. When we reduce the amounts of the security deposit we hold for any of our operating agreements for payment deficiencies, it does not result in additional cash flows to us of the deficiency amounts, but reduces the refunds due to the respective tenants or managers who have provided us with these deposits upon expiration of the applicable operating agreement. The security deposits are non-interest bearing and are not held in escrow. We had shortfalls at certain of our managed hotel portfolios not funded by the managers of these hotels under the terms of our management agreements of $73,617 and $5,090 for the three months ended June 30, 2020 and 2019, respectively, and $121,373 and $23,797 for the six months ended June 30, 2020 and 2019, respectively, which represent the unguaranteed portions of our minimum returns from our Sonesta, Marriott and Wyndham agreements. The net operating results of our managed hotel portfolios did not exceed the minimum returns due to us for either of the three or six months ended June 30, 2020. However, certain of our managed hotel portfolios had net operating results that were, in the aggregate, $21,102 and $10,494 more than the minimum returns due to us for the three and six months ended June 30, 2019, respectively. Certain of our guarantees and our security deposits may be replenished by a share of future cash flows from the applicable hotel operations in excess of the minimum returns due to us, certain fees to the manager, or working capital advances, if any, pursuant to the terms of the applicable agreements. When our guarantees and security deposits are replenished by cash flows from hotel operations, we reflect such replenishments in our condensed consolidated statements of income as an increase to hotel operating expenses. There were no such replenishments for either of the three and six months ended June 30, 2020, respectively, and replenishments of $9,208 and $3,422 for the three and six months ended June 30, 2019, respectively. (2) We increased rental income by $875 for the three months ended June 30, 2020, reduced rental income by $3,190 in the three months ended June 30, 2019 and reduced rental income by $2,669 and $4,322 for the six months ended June 30, 2020 and 2019, respectively, to record scheduled rent changes under certain of our leases, the deferred rent obligations under our leases with TA and the estimated future payments to us under our leases with TA for the cost of removing underground storage tanks on a straight line basis. (3) Various percentages of total sales at certain of our hotels are escrowed as reserves for future renovations or refurbishments, or FF&E reserve escrows. We own all the FF&E reserve escrows for our hotels. We report deposits by our tenants into the escrow accounts under our hotel leases as FF&E reserve income. We do not report the amounts which are escrowed as FF&E reserves for our managed hotels as FF&E reserve income. (4) Incentive fees under our business management agreement with RMR LLC are payable after the end of each calendar year, are calculated based on common share total return, as defined, and are included in general and administrative expense in our consolidated statements of income. In calculating net income (loss) in accordance with generally accepted accounting principles, or GAAP, we recognize estimated business management incentive fee expense, if any, in the first, second and third quarters. Although we recognize this expense, if any, in the first, second and third quarters for purposes of calculating net income (loss), we do not include these amounts in the calculation of Normalized FFO or Adjusted EBITDAre until the fourth quarter, which is when the business management incentive fee expense amount for the year, if any, is determined. No business management incentive fee expense was recorded for the three and six months ended June 30, 2020 or 2019. (5) We recorded a $28,514 loss on asset impairment during the three months ended June 30, 2020 to reduce the carrying value of 17 hotel properties and four net lease properties to their estimated fair value. We recorded a $16,740 loss on asset impairment during the three months ended March 31, 2020 to reduce the carrying value of two net lease properties to their estimated fair value. (6) We recorded a $6,911 net loss on sale of real estate during the three months ended March 31, 2020 in connection with the sales of six net lease properties. We recorded a $2,853 net loss on sale of real estate during the three months ended June 30, 2020 in connection with the sales of four net lease properties. We recorded a $159,535 gain on sale of real estate during the three months ended March 31, 2019 in connection with the sales of 20 travel centers. (7) We recorded a $62,386 gain on insurance settlement during the three months ended June 30, 2020 for insurance proceeds received with respect to our leased hotel in San Juan, PR related to Hurricane Maria. Under GAAP, we were required to increase the building basis of our San Juan hotel for the amount of the insurance proceeds. We also recorded a $15,650 deferred tax liability as a result of the book value to tax basis difference related to this accounting in the three months ended June 30, 2020. (8) Unrealized gains (losses) on equity securities, net represent the adjustment required to adjust the carrying value of our former investment in RMR Inc. common stock and our investment in TA common shares to their fair value. We sold our RMR Inc. shares in July 2019. (9) We recorded a $6,970 loss on extinguishment of debt, net of unamortized discount and deferred financing costs, relating to our repurchase of $350,000 principal amount of our $400,000 of 4.25% senior notes due 2021, for an aggregate purchase price of $355,971, excluding accrued interest. (10) Represents our proportionate share of our equity investment in Sonesta during the three and six months ended June 30, 2020 and Affiliates Insurance Company during the three and six months ended June 30, 2019. SERVICE PROPERTIES TRUST | Supplemental Operating and Financial Data, June 30, 2020 11


Debt Summary As of June 30, 2020 (dollars in thousands) Interest Principal Maturity Due at Years to Rate Balance Date Maturity Maturity Floating Rate Debt: $1,000,000 revolving credit facility (1) (2) (5) 1.850% $ 33,127 7/15/22 $ 33,127 2.0 $400,000 term loan (2) (3) (5) 2.931% 400,000 7/15/23 400,000 3.0 Subtotal / weighted average 2.848% $ 433,127 $ 433,127 3.0 Unsecured Fixed Rate Debt: Senior unsecured notes due 2021 4.250% $ 50,000 2/15/21 $ 50,000 0.6 Senior unsecured notes due 2022 5.000% 500,000 8/15/22 500,000 2.1 Senior unsecured notes due 2023 4.500% 500,000 6/15/23 500,000 3.0 Senior unsecured notes due 2024 4.650% 350,000 3/15/24 350,000 3.7 Senior unsecured notes due 2024 4.350% 825,000 10/1/24 825,000 4.3 Senior unsecured notes due 2025 4.500% 350,000 3/15/25 350,000 4.7 Senior unsecured notes due 2025 (6) 7.500% 800,000 9/15/25 800,000 5.2 Senior unsecured notes due 2026 5.250% 350,000 2/15/26 350,000 5.6 Senior unsecured notes due 2026 4.750% 450,000 10/1/26 450,000 6.3 Senior unsecured notes due 2027 4.950% 400,000 2/15/27 400,000 6.6 Senior unsecured notes due 2028 3.950% 400,000 1/15/28 400,000 7.5 Senior unsecured notes due 2029 4.950% 425,000 10/1/29 425,000 9.3 Senior unsecured notes due 2030 4.375% 400,000 2/15/30 400,000 9.6 Subtotal / weighted average 5.025% $ 5,800,000 $ 5,800,000 5.4 Total / weighted average (4) 4.873% $ 6,233,127 $ 6,233,127 5.3 (1) We are currently required to pay interest on borrowings under our revolving credit facility at a rate of LIBOR plus a premium of 205 basis points per annum, subject to an interest rate floor of 0.50%. We also pay a facility fee of 30 basis points per annum on the total amount of lending commitments under our revolving credit facility. Both the interest rate premium and facility fee are subject to adjustment based upon changes to our credit ratings. The interest rate listed above is as of June 30, 2020. Subject to the payment of an extension fee and meeting certain other conditions, we may extend the maturity date of our credit facility for two additional six month periods. (2) The maximum borrowing availability under our revolving credit facility and term loan combined may be increased to up to $2,300,000 subject to certain terms and conditions. This feature may not be utilized during the wavier period which runs through the first quarter of 2021 as prescribed under the terms of our May 2020 amendment to the credit agreement governing our revolving credit facility and term loan, or the Amendment. (3) We are required to pay interest on the amount outstanding under our term loan at a rate of LIBOR plus a premium of 225 basis points per annum, subject to adjustment based on changes to our credit ratings. The interest rate listed above is as of June 30, 2020. Our term loan is prepayable without penalty at any time. (4) The carrying value of our total debt of $6,162,247 as of June 30, 2020 is net of unamortized discounts and premiums and certain issuance costs totaling $70,880. (5) Under the Amendment, we have provided equity pledges on certain of our property owning subsidiaries to secure our obligations under the credit agreement. (6) The notes are guaranteed by certain of our subsidiaries. SERVICE PROPERTIES TRUST | Supplemental Operating and Financial Data, June 30, 2020 12


Debt Maturity Schedule As of June 30, 2020 1,400 1,200 1,000 ) s 800 n o i l l i $400 M ( $ 600 $33 $1,175 $1,150 400 $800 $500 $500 200 $400 $400 $425 $400 $50 0 2020 2021 2022 2023 2024 2025 2026 2027 2028 2029 2030 Fixed rate bonds Revolving Credit Facility (1) (2) Term loan (2) (3) (1) Represents amounts outstanding under our $1,000,000 revolving credit facility at June 30, 2020. Subject to the payment of an extension fee and meeting certain other conditions, we may extend the maturity date for two additional six month periods. (2) Under the Amendment, we have provided equity pledges of certain of our property owning subsidiaries to secure our obligations under the credit agreement. (3) Represents amounts outstanding on our term loan at June 30, 2020. Our term loan is prepayable without penalty at any time. SERVICE PROPERTIES TRUST | Supplemental Operating and Financial Data, June 30, 2020 13


Leverage Ratios, Coverage Ratios and Public Debt Covenants As of and For the Three Months Ended 6/30/2020 3/31/2020 12/31/2019 9/30/2019 6/30/2019 Leverage Ratios: Net debt / total gross assets 51.7% 50.4% 50.2% 51.8% 40.4% Net debt / gross book value of real estate assets 54.1% 52.0% 52.0% 56.0% 42.4% Secured debt / total assets 13.8% 0.0% 0.0% 0.0% 0.0% Variable rate debt / Net debt 7.0% 13.9% 12.7% 18.2% 11.9% Coverage Ratios: Adjusted EBITDAre / interest expense 2.1x 2.7x 3.1x 4.0x 4.4x Net debt / annualized Adjusted EBITDAre (1) 10.2x 7.9x 6.7x 6.6x 4.7x As of and For the Trailing Twelve Months Ended 6/30/2020 3/31/2020 12/31/2019 9/30/2019 6/30/2019 Public Debt Covenants: Total debt / adjusted total assets - allowable maximum 60.0% 50.1% 49.6% 49.4% 51.1% 40.4% Secured debt / adjusted total assets - allowable maximum 40.0% 3.5% 0.0% 0.0% 0.0% 0.0% Consolidated income available for debt service / debt service - required minimum 1.50x 2.85x 2.87x 2.86x 2.61x 3.79x Total unencumbered assets / unsecured debt - required minimum 150% 199.5% 201.5% 202.5% 195.8% 247.6% (1) We completed the SMTA Transaction on September 20, 2019. For purposes of calculating coverage ratios for the three months ended September 30, 2019, we included our pro forma estimates of the annualized Adjusted EBITDAre that we would have realized from this portfolio if we had owned it since the beginning of that three-month period. SERVICE PROPERTIES TRUST | Supplemental Operating and Financial Data, June 30, 2020 14


Capital Expenditure and Restricted Cash Activity (dollars in thousands) Capital Expenditures For the Three Months Ended 6/30/2020 3/31/2020 12/31/2019 9/30/2019 6/30/2019 Hotel capital improvements & FF&E Reserve fundings (1) $ 39,085 $ 35,015 $ 119,380 $ 36,335 $ 42,612 Net lease capital improvements 221 4,179 2,295 — — Total capital improvements & FF&E Reserve fundings $ 39,306 $ 39,194 $ 121,675 $ 36,335 $ 42,612 Restricted Cash As of and For the Three Months Ended 6/30/2020 3/31/2020 9/30/2019 6/30/2019 3/31/2019 Total restricted cash (beginning of period) $ 44,537 $ 53,626 $ 53,519 $ 37,792 $ 75,129 Manager deposits into FF&E Reserve — 33,806 18,100 46,618 21,484 SVC fundings into FF&E Reserve: IHG 3,900 — 25,100 — — Marriott 28,600 5,800 10,877 1,252 10,534 Radisson — — — 1,891 6,532 Hotel improvements funded from FF&E Reserves (47,385) (48,695) (53,970) (34,034) (48,973) FF&E reserves (end of period) 29,652 44,537 53,626 53,519 64,706 SVC sale proceeds (2) — — — — (26,914) Total restricted cash (end of period) $ 29,652 $ 44,537 $ 53,626 $ 53,519 $ 37,792 (1) Includes amounts we funded into our FF&E reserves and amounts directly reimbursed to our hotel managers for capital expenditures. (2) Represents a portion of the proceeds from our sales of 20 travel centers in January 2019 used to facilitate a tax deferred like-kind exchange pursuant to Section 1031 of the Internal Revenue Code of 1986, as amended, in the second quarter of 2019. SERVICE PROPERTIES TRUST | Supplemental Operating and Financial Data, June 30, 2020 15


Property Acquisition and Disposition Information Since January 1, 2020 (dollars in thousands except per room and per sq. ft. data) ACQUISITIONS: Number of Rooms or Suite (Hotels) / Average Purchase Square Footage Purchase Price per Room or Date Acquired Properties Brand Location (Net Lease) Operating Agreement Price (1) Suite / Square Foot 3/12/2020 3 Taco Bell Various 6,696 AG Bells LLC $ 7,071 $ 1,056 (1) Represents cash purchase price and excludes acquisition related costs. DISPOSITIONS: Average Sales Former Operating Price per Square Date Disposed Properties Brand Location Square Footage Agreement Sales Price (1) Foot 1/28/2020 1 Vacant Gothenburg, NE 31,978 Vacant $ 585 $ 18 2/6/2020 1 Vacant Rochester, MN 90,503 Vacant 2,600 29 2/13/2020 1 Vacant Ainsworth, NE 32,901 Vacant 775 24 2/14/2020 1 Vacant Dekalb, IL 5,052 Vacant 1,050 208 3/2/2020 1 HOM Furniture, Inc. Eau Claire, MI 98,824 HOM Furniture, Inc. 2,600 26 3/28/2020 1 Vacant Stillwater, OK 33,018 Vacant 400 12 5/26/2020 1 Vacant Pawtucket, RI 22,027 Vacant 1,610 73 5/28/2020 1 Destination XL Group, Inc. Canton, MA 755,992 Destination XL Group, Inc. 51,000 67 5/28/2020 1 Vacant Phoenix, AZ 29,434 Vacant 2,900 99 6/25/2020 1 Vacant Bellefontaine, OH 2,267 Vacant 440 194 10 1,101,996 $ 63,960 58 (1) Represents cash purchase or sales price and excludes closing related costs. SERVICE PROPERTIES TRUST | Supplemental Operating and Financial Data, June 30, 2020 16


Calculation of EBITDA, EBITDAre and Adjusted EBITDAre (in thousands) For the Three Months Ended For the Six Months Ended 6/30/2020 3/31/2020 12/31/2019 9/30/2019 6/30/2019 6/30/2020 6/30/2019 Net income (loss) $ (37,349) $ (33,650) $ (14,893) $ 40,074 $ 8,782 $ (70,999) $ 234,569 Add (Less): Interest expense 72,072 71,075 73,384 52,375 49,601 143,147 99,367 Income tax expense (benefit) (1) 16,660 342 1,527 467 (260) 17,002 799 Depreciation and amortization 127,427 127,926 126,727 103,160 99,196 255,353 198,561 EBITDA 178,810 165,693 186,745 196,076 157,319 344,503 533,296 Add (Less): (Gain) loss on sale of real estate (2) 2,853 6,911 — — — 9,764 (159,535) Loss on asset impairment (3) 28,514 16,740 39,296 — — 45,254 — EBITDAre 210,177 189,344 226,041 196,076 157,319 399,521 373,761 Add (Less): General and administrative expense paid in common shares (4) 832 590 480 1,068 865 1,422 1,301 Adjustments to reflect the entity's share of EBITDA attributable to an investee (5) 421 158 — — — 579 — Estimated business management incentive fee (6) — — — — — — — Acquisition and transaction related costs (7) — — 1,795 — — — — Loss on early extinguishment of debt (8) 6,970 — — 8,451 — 6,970 — Gain on insurance settlement (1) (62,386) — — — — (62,386) — Unrealized (gains) losses on equity securities, net (9) (3,848) 5,045 (3,300) 3,950 60,788 1,197 39,811 Loss contingency (10) — — 1,997 — — — — Adjusted EBITDAre $ 152,166 $ 195,137 $ 227,013 $ 209,545 $ 218,972 $ 347,303 $ 414,873 (1) We recorded a $62,386 gain on insurance settlement during the three months ended June 30, 2020 for insurance proceeds received for our leased hotel in San Juan, PR related to Hurricane Maria. Under GAAP, we were required to increase the building basis of our San Juan hotel for the amount of the insurance proceeds. We also recorded a $15,650 deferred tax liability as a result of the book value to tax basis difference related to this accounting in the three months ended June 30, 2020. (2) We recorded a $2,853 net loss on sale of real estate during the three months ended June 30, 2020 in connection with the sales of four net lease properties, a $6,911 net loss on sale of real estate during the three months ended March 31, 2020 in connection with the sales of six net lease properties and a $159,535 gain on sale of real estate during the three months ended March 31, 2019 in connection with the sales of 20 travel centers. (3) We recorded a $28,514 loss on asset impairment during the three months ended June 30, 2020 to reduce the carrying value of 17 hotel properties and four net lease properties to their estimated fair value, a $16,740 loss on asset impairment during the three months ended March 31, 2020 to reduce the carrying value of two net lease properties to their estimated fair value and a $39,296 loss on asset impairment during the three months ended December 31, 2019 to reduce the carrying value of 19 net lease properties to their estimated fair value less costs to sell and two hotels to their estimated fair value. (4) Amounts represent the equity compensation awarded to our Trustees, our officers and certain other employees of RMR LLC. (5) Represents adjustments to reflect our proportionate share of EBITDA related to our equity investment in Sonesta. (6) Incentive fees under our business management agreement with RMR LLC are payable after the end of each calendar year, are calculated based on common share total return, as defined, and are included in general and administrative expense in our consolidated statements of income. In calculating net income (loss) in accordance with GAAP, we recognize estimated business management incentive fee expense, if any, in the first, second and third quarters. Although we recognize this expense, if any, in the first, second and third quarters for purposes of calculating net income (loss), we do not include these amounts in the calculation of Adjusted EBITDAre until the fourth quarter, which is when the business management incentive fee expense amount for the year, if any, is determined. No business management incentive fee expense was recorded for the periods presented. (7) Acquisition and transaction related costs represents costs related to our exploration of possible financing transactions. (8) We recorded a $6,970 loss on early extinguishment of debt, net of unamortized discount and deferred financing costs, related to our repurchase of $350,000 principal amount of our $400,000 of 4.25% senior notes due 2021 for an aggregate purchase price of $355,971, excluding accrued interest. We recorded a $8,451 loss on early extinguishment of debt in the three months ended September 30, 2019 related to the termination of a term loan commitment we arranged in connection with the acquisition of a net lease portfolio. (9) Unrealized gains and (losses) on equity securities, net represent the adjustment required to adjust the carrying value of our former investment in RMR Inc. common shares and our investment in TA common shares to their fair value. We sold our RMR Inc. shares in July 2019. (10) We recorded a $1,997 loss contingency during the three months ended December 31, 2019 for an expected settlement of a historical pension withdrawal liability for a hotel we rebranded. SERVICE PROPERTIES TRUST | Supplemental Operating and Financial Data, June 30, 2020 17


Calculation of FFO and Normalized FFO (amounts in thousands, except per share data) For the Three Months Ended For the Six Months Ended 6/30/2020 3/31/2020 12/31/2019 9/30/2019 6/30/2019 6/30/2020 6/30/2019 Net income (loss) $ (37,349) $ (33,650) $ (14,893) $ 40,074 $ 8,782 $ (70,999) $ 234,569 Add (Less): Depreciation and amortization 127,427 127,926 126,727 103,160 99,196 255,353 198,561 (Gain) / loss on sale of real estate (1) 2,853 6,911 — — — 9,764 (159,535) Loss on asset impairment (2) 28,514 16,740 39,296 — — 45,254 — Unrealized gains and losses on equity securities, net (3) (3,848) 5,045 (3,300) 3,950 60,788 1,197 39,811 Adjustments to reflect the entity's share of FFO attributable to an investee (4) 327 112 — — — 439 — FFO 117,924 123,084 147,830 147,184 168,766 241,008 313,406 Add (Less): Acquisition and transaction related costs (5) — — 1,795 — — — — Loss on early extinguishment of debt (6) 6,970 — — 8,451 — 6,970 — Loss contingency (7) — — 1,997 — — — — Gain on insurance settlement, net of tax (8) (46,736) — — — — (46,736) — Normalized FFO $ 78,158 $ 123,084 $ 151,622 $ 155,635 $ 168,766 $ 201,242 $ 313,406 Weighted average shares outstanding (basic) 164,382 164,370 164,364 164,321 164,284 164,376 164,281 Weighted average shares outstanding (diluted) 164,382 164,370 164,364 164,348 164,326 164,376 164,324 Basic and diluted per share common share amounts: Net income (loss) $ (0.23) $ (0.20) $ (0.09) $ 0.24 $ 0.05 $ (0.43) $ 1.43 FFO $ 0.72 $ 0.75 $ 0.90 $ 0.90 $ 1.03 $ 1.47 $ 1.91 Normalized FFO $ 0.48 $ 0.75 $ 0.92 $ 0.95 $ 1.03 $ 1.22 $ 1.91 (1) We recorded a $2,853 net loss on sale of real estate during the three months ended June 30, 2020 in connection with the sales of four net lease properties, a $6,911 net loss on sale of real estate during the three months ended March 31, 2020 in connection with the sales of six net lease properties and a $159,535 gain on sale of real estate during the three months ended March 31, 2019 in connection with the sales of 20 travel centers. (2) We recorded a $45,254 loss on asset impairment during the three months ended June 30, 2020 to reduce the carrying value of 17 hotel properties and four net lease properties to their estimated fair value, $16,740 loss on asset impairment during the three months ended March 31, 2020 to reduce the carrying value of two net lease properties to their estimated fair value and $39,296 loss on asset impairment during the three months ended December 31, 2019 to reduce the carrying value of 19 net lease properties to their estimated fair value less costs to sell and two hotels to their estimated fair value. (3) Unrealized gains and (losses) on equity securities, net represent the adjustment required to adjust the carrying value of our former investment in RMR Inc. and our investment in TA common shares to their fair value. We sold our RMR Inc. shares in July 2019. (4) Represents adjustments to reflect our proportionate share of FFO related to our equity investment in Sonesta. (5) Acquisition and transaction related costs represents costs related to our exploration of possible financing transactions. (6) We recorded a $6,970 loss on early extinguishment of debt, net of unamortized discounts and deferred financing fees, related to our repurchase of $350,000 principal amount of our $400,000 of 4.25% senior notes due 2021 for an aggregate purchase price of $355,971, excluding accrued interest. We recorded a $8,451 loss on early extinguishment of debt in the three months ended September 30, 2019 related to the termination of a term loan commitment we arranged in connection with the acquisition of a net lease portfolio. (7) We recorded a $1,997 loss contingency during the three months ended December 31, 2019 for an expected settlement of a historical pension withdrawal liability for a hotel we rebranded. (8) We recorded a $62,386 gain on insurance settlement during the three months ended June 30, 2020 for insurance proceeds received for our leased hotel in San Juan, PR related to Hurricane Maria. Under GAAP, we were required to increase the building basis of our San Juan hotel for the amount of the insurance proceeds. We also recorded a $15,650 deferred tax liability as a result of the book value to tax basis difference related to this accounting in the three months ended June 30, 2020. SERVICE PROPERTIES TRUST | Supplemental Operating and Financial Data, June 30, 2020 18


PORTFOLIO INFORMATION Mister Car Wash 3101 Coors Blvd., NW Albuquerque, NM SERVICE PROPERTIES TRUST | Supplemental Operating and Financial Data, June 30, 2020 19


Portfolio Summary As of June 30, 2020 (dollars in thousands) Portfolio composition (1) Number of Properties Hotel Properties 329 Net Lease Properties 809 Total Properties 1,138 Diversification Facts Net lease: 38.4% Tenants/Operators 186 Brands 149 Hotel: 61.6% Industries 23 States (2) 47 Investments Hotels $ 7,061,740 Net Lease Properties 5,207,062 Geographical Diversification (1) Total Investments $ 12,268,802 Annualized Minimum Return and Rent Hotels $ 590,614 CA 11% Net Lease Properties 369,423 TX 8% Total Annualized Minimum Returns and Rents $ 960,037 Other 46% GA 7% (3) Minimum Return/Rent Coverage (37 States, Hotels 0.38x DC, PR, ON) IL 7% Sonesta Fort Lauderdale Beach Net Lease 2.28x Ft. Lauderdale, FL OH 4% Total Portfolio 1.11x Operator: Sonesta FL 4% (1) Based on the annualized Minimum Returns and Rents. Guest Rooms: 240 AZ NJ PA MA (2) We also own one property in Washington, D.C., two in Canada and one in Puerto Rico. 4% 3% 3% (3) Coverage data amounts include data for certain properties for periods prior to when we acquired 3% them. SERVICE PROPERTIES TRUST | Supplemental Operating and Financial Data, June 30, 2020 20


Consolidated Portfolio by Brand Affiliation As of June 30, 2020 (dollars in thousands) Percent of Total Number of Percent of Number of Rooms or Rooms or Suites Percent of Total Suites (Hotels) / (Hotels) / Square Percent of Investment Total Annual Number of Number of Square Footage Footage Total Per Annual Minimum Minimum Brand Affiliation Properties Properties (Net Lease) (Net Lease) Investment (1) Investment Room / SF Return / Rent (1) Return / Rent IHG 103 9.1% 17,154 33.5 % $ 2,381,721 15.2% $ 139 216,551 22.6 % Marriott 122 10.7% 17,085 33.1 % 1,869,817 19.4% 109 $ 192,891 20.1 % Sonesta 53 4.7% 9,588 18.7 % 2,004,204 16.3% 209 119,779 12.5 % Hyatt 22 1.9% 2,724 5.3 % 301,942 1.8% 111 22,037 2.3 % Radisson 9 0.8% 1,939 3.7 % 289,139 2.5% 149 20,442 2.1 % Wyndham 20 1.8% 2,914 5.7 % 214,917 2.4% 74 18,914 2.0 % Subtotal/Average Hotels 329 29.0% 51,404 100.0 % 7,061,740 57.6% 137 590,614 61.6 % TravelCenters of America 134 11.8% 3,720,693 27.1 % 2,281,589 18.6% 613 168,011 17.5 % Petro Stopping Centers 45 4.0% 1,470,004 10.7 % 1,021,226 8.3% 695 78,099 8.1 % AMC Theatres 13 1.1% 663,655 4.8 % 121,701 1.0% 183 9,412 1.0 % The Great Escape 14 1.2% 542,666 4.0 % 98,242 0.8% 181 7,140 0.7 % Life Time Fitness 3 0.3% 420,335 3.1 % 92,617 0.8% 220 5,246 0.5 % Buehler's Fresh Foods 5 0.4% 502,727 3.7 % 76,536 0.6% 152 5,143 0.5 % Heartland Dental 59 5.2% 234,274 1.7 % 61,120 0.5% 261 4,493 0.5 % Pizza Hut 61 5.4% 198,558 1.4 % 61,108 0.5% 308 4,271 0.4 % Regal Cinemas 6 0.5% 266,546 1.9 % 44,476 0.4% 167 3,658 0.4 % Express Oil Change 23 2.0% 83,825 0.6 % 49,724 0.4% 593 3,379 0.4 % Other (2) 446 39.1% 5,625,610 41.0 % 1,298,723 10.5% 231 80,571 8.4 % Subtotal/Average Net Lease (3) 809 71.0% 13,728,893 100.0 % 5,207,062 42.4% 379 369,423 38.4 % Total/Average 1,138 100.0% 51,404 / 13,728,893 100% / 100% $ 12,268,802 100.0% $137 / $363 $ 960,037 100.0 % (1) Includes 25 hotels with 3,333 rooms and annual minimum returns of $32,628 and an aggregate carrying value of $144,119 classified as held for sale and nine net lease properties with 103,408 square feet with leases requiring annual minimum rent of $789 and an aggregate carrying value of $8,248 classified as held for sale. (2) Other includes 119 distinct brands with an average investment of $10,914 and average annual minimum rent of $677. (3) The brands listed in the table above represent the top 10 net lease brands as a percentage of total annual minimum rent as of June 30, 2020. SERVICE PROPERTIES TRUST | Supplemental Operating and Financial Data, June 30, 2020 21


Consolidated Portfolio Diversification by Industry As of June 30, 2020 (dollars in thousands) Percent of Total Annualized No. of Rooms/ Percent of Total Annual Minimum Minimum Industry Properties Square Footage Investments (1) Investment Return/ Rent (1) Return/Rent 1. Hotels 329 51,404 $ 7,061,740 57.6% $ 590,615 61.6% 2. Travel Centers 182 5,238,765 3,344,496 27.3% 249,261 26.0% 3. Restaurants-Quick Service 250 687,961 319,543 2.6% 21,106 2.2% 4. Movie Theaters 24 1,240,533 209,846 1.7% 16,770 1.7% 5. Restaurants-Casual Dining 61 420,978 216,346 1.8% 11,076 1.2% 6. Health and Fitness 13 837,811 184,744 1.5% 9,398 1.0% 7. Miscellaneous Retail 19 598,731 114,433 0.9% 7,140 0.7% 8. Medical/Dental Office 71 409,706 118,098 1.0% 9,172 1.0% 9. Grocery 19 1,020,819 129,219 1.1% 8,599 0.9% 10. Automotive Parts and Service 63 210,152 96,496 0.8% 6,557 0.7% 11. Apparel 1 89,305 11,027 0.1% 670 0.1% 12. Automotive Dealers 9 172,251 68,756 0.6% 4,985 0.5% 13. Entertainment 4 199,853 61,436 0.5% 1,782 0.2% 14. Educational Services 9 220,758 55,647 0.5% 4,127 0.4% 15. Sporting Goods 3 331,864 52,022 0.4% 3,489 0.4% 16. Miscellaneous Manufacturing 6 758,146 31,824 0.3% 2,294 0.2% 17. Building Materials 27 430,164 30,036 0.2% 2,510 0.3% 18. Car Washes 5 41,456 28,658 0.2% 2,076 0.2% 19. Drug Stores and Pharmacies 8 82,543 23,970 0.2% 1,647 0.2% 20. Legal Services 5 25,429 11,362 0.1% 1,009 0.1% 21. General Merchandise 3 99,233 7,492 0.1% 555 0.1% 22. Home Furnishings 5 248,448 37,215 0.3% 2,854 0.2% 23. Dollar Stores 3 27,593 2,971 —% 187 —% 24. Other 4 155,624 28,748 0.1% 2,158 0.1% 25. Vacant 15 180,770 22,677 0.1% — —% Total 1,138 51,404 / 13,728,893 $ 12,268,802 100.0% $ 960,037 100.0% (1) Includes 25 hotels with 3,333 rooms and annual minimum returns of $32,628 and an aggregate carrying value of $144,119 classified as held for sale and nine net lease properties with 103,408 square feet with leases requiring annual minimum rent of $789 and an aggregate carrying value of $8,248 classified as held for sale. SERVICE PROPERTIES TRUST | Supplemental Operating and Financial Data, June 30, 2020 22


Hotel Portfolio by Brand As of June 30, 2020 (dollars in thousands) Percent of Percent of Number of Total Number Percent of Investment Number of Total Number Rooms or of Rooms or Total Hotel Per Room or Brand Manager Hotels of Hotels Suites Suites Investment Investment Suite Courtyard by Marriott® Marriott 71 21.8% 10,265 19.8% $ 1,022,653 14.5% $ 100 Royal Sonesta Hotels® Sonesta 7 2.1% 2,722 5.3% 915,769 13.0% 342 Sonesta ES Suites® Sonesta 39 11.9% 4,731 9.2% 651,675 9.2% 138 Crowne Plaza® IHG 11 3.3% 4,141 8.1% 644,170 9.1% 156 Candlewood Suites® IHG 61 18.5% 7,553 14.7% 605,986 8.6% 80 Residence Inn by Marriott® Marriott 35 10.6% 4,488 8.7% 566,784 8.0% 126 Kimpton® Hotels & Restaurants IHG 5 1.5% 1,421 2.8% 482,474 6.8% 340 Sonesta Hotels & Resorts® Sonesta 7 2.1% 2,135 4.2% 436,760 6.2% 205 Staybridge Suites® IHG 20 6.1% 2,481 4.8% 356,016 5.0% 143 Hyatt Place® Hyatt 22 6.7% 2,724 5.3% 301,942 4.3% 111 Radisson® Hotels & Resorts and Radisson Blu® Radisson 6 1.8% 1,509 2.9% 235,724 3.3% 156 InterContinental Hotels and Resorts® IHG 3 0.9% 804 1.6% 219,106 3.1% 273 Wyndham Hotels and Resorts® and Wyndham Grand® Wyndham 4 1.2% 1,158 2.3% 112,438 1.6% 97 Marriott® Hotel Marriott 2 0.6% 748 1.5% 132,267 1.9% 177 TownePlace Suites by Marriott® Marriott 12 3.6% 1,321 2.6% 121,739 1.7% 92 Hawthorn Suites® Wyndham 16 4.9% 1,756 3.4% 102,479 1.5% 58 Holiday Inn® IHG 3 0.9% 754 1.5% 73,969 1.0% 98 Country Inns & Suites® by Radisson Radisson 3 0.9% 430 0.8% 53,415 0.8% 124 SpringHill Suites by Marriott® Marriott 2 0.6% 263 0.5% 26,374 0.4% 100 Total/Average Hotels 329 100.0% 51,404 100.0% $ 7,061,740 100.0% $ 138 SERVICE PROPERTIES TRUST | Supplemental Operating and Financial Data, June 30, 2020 23


Hotel Operating Agreement Information IHG - We lease 102 IHG branded hotels (20 Staybridge Suites®, 61 Candlewood Suites®, two InterContinental®, 11 Crowne Plaza®, three Holiday Inn® and five Kimpton® Hotels & Restaurants) in 30 states in the U.S., the District of Columbia and Ontario, Canada to one of our wholly owned taxable REIT subsidiaries, or TRSs. These 102 hotels are managed by subsidiaries of IHG under a combination management agreement. We lease one additional InterContinental® branded hotel in Puerto Rico to a subsidiary of IHG. The annual minimum return amount presented in the table on slide 22 includes $7,908 of minimum rent related to the leased Puerto Rico hotel. The management agreement and the lease expire in 2036; IHG has two renewal options for 15 years each for all, but not less than all, of the hotels. As of June 30, 2020, we held a security deposit of $8,992 under this agreement to cover shortfalls in hotel cash flows to pay minimum returns and rent due to us during the period. This security deposit, if utilized, may be replenished and increased up to $100,000 from the hotels' available cash flows in excess of our minimum return, working capital advances and certain management fees, if any. On June 1, 2020, we entered into a letter agreement with respect to certain matters related to the IHG agreement, including waiving the minimum security deposit requirement through 2021. In July 2020, we applied the remaining security deposit securing the obligations of IHG under its agreement with us. We did not receive any payments from IHG to cure shortfalls for the balance of the July minimum returns and rents of $8,395 due to us after applying the remaining security deposit, or the August 2020 minimum returns and rents of $18,045 due to us. In July 2020, we sent IHG a notice of default and termination, and in August 2020, we sent IHG an additional notice of default. We are in discussions with IHG to see if there may be a mutually beneficial resolution. Absent a cure of these defaults by IHG, or if no agreement is reached, we currently plan to transition management and branding of these 103 hotels to Sonesta. Our IHG agreement requires 5% of gross revenues from hotel operations be placed in an escrow for hotel maintenance and periodic renovations, or an FF&E reserve. As part of the June letter agreement we entered, this requirement to fund FF&E reserves was waived through September 30, 2020. In addition to our minimum return, this management agreement provides for an annual additional return payment to us of $12,067 from the hotels' available cash flows after payment of hotel operating expenses, funding of the required FF&E reserve, payment of our minimum return, working capital advances, payment of certain management fees and replenishment and expansion of the security deposit, if any. In addition, the agreement provides for payment to us of 50% of the hotels' available cash flows after payment to us of the annual additional return amount. These additional return amounts are not guaranteed or secured by the security deposit we hold. Marriott - We lease our 122 Marriott branded hotels (two full service Marriott®, 35 Residence Inn by Marriott®, 71 Courtyard by Marriott®, 12 TownePlace Suites by Marriott® and two SpringHill Suites by Marriott® hotels) in 31 states to certain of our TRSs. The hotels under the Marriott agreement are managed by subsidiaries of Marriott and require aggregate annual minimum returns of $192,891. The Marriott agreement is scheduled to expire in 2035 and Marriott has two renewal options for 10 years each for all, but not less than all, of the hotels. As of June 30, 2020, we fully utilized the remaining security deposit of $4,790 we held under this agreement to cover payment shortfalls of our minimum returns and rents. This security deposit may be replenished and increased up to $64,700 from a share of the hotels’ available cash flows in excess of our minimum return, certain management fees and working capital advances, if any. Marriott also provided us with a $30,000 limited guaranty to cover payment shortfalls up to 85% of our minimum return after the available security deposit balance has been depleted. This limited guaranty expires in 2026. As of June 30, 2020, there was no security deposit available to cover future payment shortfalls and the $30,000 guaranty was exhausted. Under the Marriott agreement, once the security deposit and guaranty have been depleted, Marriott is required to fund shortfalls up to 80% of the minimum returns due to us to avoid termination. Our Marriott agreement requires 5.5% to 6.5% of gross revenues from hotel operations be placed in an FF&E reserve. As a result of current market conditions, we and Marriott have agreed to suspend contributions to the FF&E reserve under our Marriott agreement for the remainder of 2020. In addition to our minimum return, this agreement provides for payment to us of 60% of the hotels' available cash flows after payment of hotel operating expenses, funding of the required FF&E reserve, payment of our minimum return, payment of certain management fees, working capital advances and replenishment of the security deposit. This additional return amount is not guaranteed or secured by the security deposit. SERVICE PROPERTIES TRUST | Supplemental Operating and Financial Data, June 30, 2020 24


Hotel Operating Agreement Information Sonesta - We lease our 53 Sonesta branded hotels (seven Royal Sonesta® Hotels, seven Sonesta Hotels & Resorts® and 39 Sonesta ES Suites® hotels) in 26 states to certain of our TRSs. The hotels are managed by a subsidiary of Sonesta under management agreements which expire in 2037; Sonesta has two renewal options for 15 years each for all, but not less than all, of these 53 hotels. We have no security deposit or guaranty from Sonesta. Accordingly, payment by Sonesta of the minimum returns due to us under this management agreement is limited to the hotels' available cash flows after the payment of operating expenses, including certain management fees, and we are financially responsible for operating cash flows deficits, if any. In addition to our minimum returns, this management agreement provides for payment to us of 80% of the hotels' available cash flows after payment of hotel operating expenses, including certain management fees to Sonesta, our minimum return, working capital advances and any required FF&E reserves. Hyatt - We lease our 22 Hyatt Place® branded hotels in 14 states to one of our TRSs. The hotels are managed by a subsidiary of Hyatt Hotel Corporation, or Hyatt, under a combination management agreement that expires in 2030; Hyatt has two renewal options for 15 years each for all, but not less than all, of the hotels. We have a limited guaranty of $50,000 under this agreement to cover payment shortfalls of our minimum return. As of June 30, 2020, the available Hyatt guaranty was $8,561. The guaranty is limited in amount but does not expire in time and may be replenished from a share of the hotels' available cash flows in excess of our minimum return and our working capital advances. In addition to our minimum return, this management agreement provides for payment to us of 50% of the hotels' available cash flows after payment of operating expenses, funding the required FF&E reserve, payment of our minimum return, our working capital advances and reimbursement to Hyatt of working capital and guaranty advances, if any. This additional return is not guaranteed. Our Hyatt agreement requires 5% of gross revenues from hotel operations be placed in an FF&E reserve, subject to available cash flow. Radisson - We lease our nine Radisson branded hotels (four Radisson® Hotels & Resorts, four Country Inns & Suites® by Radisson and one Radisson Blu® hotel) in six states to one of our TRSs. The hotels are managed by a subsidiary of Radisson under a combination management agreement which expires in 2035; Radisson has two 15 year renewal options for all, but not less than all, of the hotels. We have a limited guaranty of $47,523 under this agreement to cover payment shortfalls of our minimum return. As of June 30, 2020, the available Radisson guaranty was $27,426. The guaranty is limited in amount but does not expire in time and may be replenished from a share of the hotels' available cash flows in excess of our minimum return and our working capital advances. In addition to our minimum return, this management agreement provides for payment to us of 50% of the hotels' available cash flows after payment of operating expenses, funding the required FF&E reserve, payment of our minimum return, our working capital advances and reimbursement to Radisson of working capital and guaranty advances, if any. This additional return is not guaranteed. Our Radisson agreement requires 5% of gross revenues from hotel operations be placed in an FF&E reserve. As a result of current market conditions, effective April 1, 2020, we and Radisson have agreed to suspend contributions to the FF&E reserve under our Radisson agreement for the remainder of 2020. Wyndham - We lease our 20 Wyndham branded hotels (four Wyndham Hotels and Resorts® and 16 Hawthorn Suites® hotels) in 13 states to one of our TRSs. The hotels are managed by a subsidiary of Wyndham under a combination management agreement which expires in September 2020 and we expect to transition management and brands of these hotels to Sonesta upon expiration of the agreement unless sooner terminated with respect to any hotels that are sold. We have no guarantee or security deposit from Wyndham. Payment by Wyndham is limited to the available cash flows after payment of operating expenses. Wyndham is not entitled to any base management fees for the remainder of the agreement. SERVICE PROPERTIES TRUST | Supplemental Operating and Financial Data, June 30, 2020 25


Hotel Operating Statistics by Operating Agreement (Comparable Hotels(1)) For the Three Months Ended June 30, For the Six Months Ended June 30, No. of No. of Rooms or No. of No. of Rooms Hotels (1) Suites 2020 2019 Change Hotels (1) or Suites 2020 2019 Change ADR IHG 95 15,013 $ 76.18 $ 118.83 (35.9%) 93 14,556 $ 96.68 $ 116.75 (17.2%) Marriott 121 16,730 103.73 135.44 (23.4%) 121 16,730 124.26 135.36 (8.2%) Sonesta (2) 43 6,348 82.75 113.90 (27.3%) 43 6,348 96.00 112.57 (14.7%) Hyatt 22 2,724 81.62 110.52 (26.1%) 22 2,724 98.82 111.68 (11.5%) Radisson 6 1,413 95.47 132.57 (28.0%) 6 1,413 111.77 129.42 (13.6%) Wyndham 19 2,695 61.32 76.49 (19.8%) 19 2,695 67.78 76.32 (11.2%) All Hotels Total/Average 306 44,923 $ 83.47 $ 121.87 (31.5%) 304 44,466 $ 103.85 $ 120.88 (14.1%) OCCUPANCY IHG 95 15,013 42.6% 81.3% (38.7)Pts 93 14,556 54.5% 77.0% (22.5)Pts Marriott 121 16,730 19.8% 75.9% (56.1)Pts 121 16,730 36.1% 70.4% (34.3)Pts Sonesta (2) 43 6,348 37.7% 70.9% (33.2)Pts 43 6,348 45.5% 66.0% (20.5)Pts Hyatt 22 2,724 28.1% 82.8% (54.7)Pts 22 2,724 43.8% 78.7% (34.9)Pts Radisson 6 1,413 16.7% 78.4% (61.7)Pts 6 1,413 37.6% 72.1% (34.5)Pts Wyndham 19 2,695 33.9% 70.2% (36.3)Pts 19 2,695 43.3% 65.7% (22.4)Pts All Hotels Total/Average 306 44,923 31.2% 77.2% (46.0)Pts 304 44,466 44.4% 72.2% (27.8)Pts RevPAR IHG 95 15,013 $ 32.45 $ 96.61 (66.4%) 93 14,556 $ 52.69 $ 89.90 (41.4%) Marriott 121 16,730 20.54 102.80 (80.0%) 121 16,730 44.86 95.29 (52.9%) Sonesta (2) 43 6,348 31.20 80.76 (61.4%) 43 6,348 43.68 74.30 (41.2%) Hyatt 22 2,724 22.94 91.51 (74.9%) 22 2,724 43.28 87.89 (50.8%) Radisson 6 1,413 15.94 103.93 (84.7%) 6 1,413 42.03 93.31 (55.0%) Wyndham 19 2,695 20.79 53.70 (61.3%) 19 2,695 29.35 50.14 (41.5%) All Hotels Total/Average 306 44,923 $ 26.04 $ 94.08 (72.3%) 304 44,466 $ 46.11 $ 87.28 (47.2%) (1) Excludes 23 hotels for the three months ended June 30, 2020 and 25 hotels for the six months ended June 30, 2020 that were closed, renovated or not owned during the period. (2) Operating data includes data for two hotels for periods prior to when these were managed by Sonesta. "ADR" is average daily rate; "RevPAR" is room revenue per available room. All operating data presented are based upon the operating results provided by our managers and tenants for the indicated periods. We have not independently verified our managers' or tenants' operating data. SERVICE PROPERTIES TRUST | Supplemental Operating and Financial Data, June 30, 2020 26


Hotel Operating Statistics by Operating Agreement No. of Rooms or For the Three Months Ended June 30, For the Six Months Ended June 30, 2020 No. of Hotels Suites 2020 2019 Change 2020 2019 Change ADR IHG (1) (2) 103 17,154 $ 76.44 $ 125.17 (38.9%) $ 99.80 $ 124.01 (19.5%) Marriott (1) 122 17,085 103.97 139.22 (25.3%) 128.86 139.68 (7.7%) Sonesta (1) (3) 53 9,588 87.14 155.21 (43.9%) 118.44 150.98 (21.6%) Hyatt 22 2,724 81.62 110.52 (26.1%) 98.82 111.68 (11.5%) Radisson (1) 9 1,939 95.37 137.14 (30.5%) 119.91 133.74 (10.3%) Wyndham (1) 20 2,914 61.32 83.44 (26.5%) 71.27 83.10 (14.2%) All Hotels Total/Average 329 51,404 $ 84.34 $ 132.55 (36.4%) $ 110.24 $ 131.39 (16.1%) OCCUPANCY IHG (1) (2) 103 17,154 38.2% 80.8% (42.6)Pts 50.3% 76.6% (26.3)Pts Marriott (1) 122 17,085 19.5% 76.1% (56.6)Pts 36.2% 70.8% (34.6)Pts Sonesta (1) (3) 53 9,588 25.9% 73.8% (47.9)Pts 38.3% 68.4% (30.1)Pts Hyatt 22 2,724 28.1% 82.8% (54.7)Pts 43.8% 78.7% (34.9)Pts Radisson (1) 9 1,939 12.4% 75.2% (62.8)Pts 33.1% 69.3% (36.2)Pts Wyndham (1) 20 2,914 31.4% 70.5% (39.1)Pts 42.1% 65.5% (23.4)Pts All Hotels Total/Average 329 51,404 27.8% 77.2% (49.4)Pts 41.9% 72.3% (30.4)Pts RevPAR IHG (1) (2) 103 17,154 $ 29.20 $ 101.14 (71.1%) $ 50.20 $ 94.99 (47.2%) Marriott (1) 122 17,085 20.27 105.95 (80.9%) 46.65 98.89 (52.8%) Sonesta (1) (3) 53 9,588 22.57 114.54 (80.3%) 45.36 103.27 (56.1%) Hyatt 22 2,724 22.94 91.51 (74.9%) 43.28 87.89 (50.8%) Radisson (1) 9 1,939 11.83 103.13 (88.5%) 39.69 92.68 (57.2%) Wyndham (1) 20 2,914 19.25 58.83 (67.3%) 30.00 54.43 (44.9%) All Hotels Total/Average 329 51,404 $ 23.45 $ 102.33 (77.1%) $ 46.19 $ 94.99 (51.4%) (1) During the three months ended June 30, 2020, ten Sonesta hotels, four IHG hotels, three Radisson hotels, one Marriott hotel and one Wyndham hotel were closed due to impact of the COVID-19 pandemic. (2) Operating data includes data for certain hotels for periods prior to when we acquired them. (3) Operating data includes data for two hotels for periods prior to when these were managed by Sonesta. "ADR" is average daily rate; "RevPAR" is room revenue per available room. All operating data presented are based upon the operating results provided by our managers and tenants for the indicated periods. We have not independently verified our managers' or tenants' operating data. SERVICE PROPERTIES TRUST | Supplemental Operating and Financial Data, June 30, 2020 27


Hotel Coverage by Operating Agreement (1) Number of For the Twelve Months Ended Operating Agreement Properties 6/30/2020 3/31/2020 12/31/2019 9/30/2019 6/30/2019 IHG (1) 103 0.50x 0.80x 0.91x 0.89x 0.97x Marriott (1) 122 0.52x 0.92x 1.06x 1.08x 1.10x Sonesta (1) 53 0.04x 0.38x 0.54x 0.59x 0.64x Hyatt 22 0.37x 0.76x 0.90x 0.90x 0.95x Radisson (1) 9 0.36x 0.84x 0.93x 0.95x 0.93x Wyndham (1) 20 0.04x 0.38x 0.50x 0.48x 0.50x Total Hotels 329 0.38x 0.73x 0.86x 0.87x 0.91x Number of For the Three Months Ended Operating Agreement Properties 6/30/2020 3/31/2020 12/31/2019 9/30/2019 6/30/2019 IHG (1) 103 (0.11x) 0.34x 0.88x 0.89x 1.10x Marriott (1) 122 (0.32x) 0.39x 0.86x 1.16x 1.29x Sonesta (1) 53 (0.59x) (0.22x) 0.31x 0.55x 0.89x Hyatt 22 (0.36x) 0.38x 0.69x 0.77x 1.20x Radisson (1) 9 (0.80x) 0.11x 0.76x 1.38x 1.13x Wyndham (1) 20 (0.61x) (0.25x) 0.32x 0.70x 0.74x Total Hotels 329 (0.33x) 0.20x 0.72x 0.90x 1.11x (1) During the three months ended June 30, 2020, ten Sonesta hotels, four IHG hotels, three Radisson hotels, one Marriott hotel and one Wyndham hotel were closed due to impact of COVID-19 pandemic. All operating data presented are based upon the operating results provided by our managers and tenants for the indicated periods. We have not independently verified our managers' or tenants’ operating data. SERVICE PROPERTIES TRUST | Supplemental Operating and Financial Data, June 30, 2020 28


Net Lease Portfolio by Brand As of June 30, 2020 (dollars in thousands) Percent of Percent of Total Total Annualized Annualized Brand No. of Buildings Investment (1) Investment Minimum Rent (1) Minimum Rent Coverage 1. TravelCenters of America 134 $ 2,281,589 43.8% $ 168,012 45.5% 1.95x 2. Petro Stopping Centers 45 1,021,226 19.6% 78,099 21.1% 1.55x 3. AMC Theatres 13 121,701 2.3% 9,412 2.5% 0.99x 4. The Great Escape 14 98,242 1.9% 7,140 1.9% 4.13x 5. Life Time Fitness 3 92,617 1.8% 5,246 1.4% 2.99x 6. Buehler's Fresh Foods 5 76,536 1.5% 5,143 1.4% 4.33x 7. Heartland Dental 59 61,120 1.2% 4,493 1.2% 2.07x 8. Pizza Hut 61 61,108 1.2% 4,271 1.2% 1.26x 9. Regal Cinemas 6 44,476 0.9% 3,658 1.0% 0.89x 10. Express Oil Change 23 49,724 1.0% 3,379 0.9% 3.50x 11. Flying J Travel Plaza 3 41,681 0.8% 3,151 0.9% 3.46x 12. B&B Theatres 4 34,369 0.7% 3,100 0.8% 0.85x 13. America's Auto Auction 6 38,314 0.7% 2,992 0.8% 4.58x 14. Church's Chicken 45 35,995 0.7% 2,587 0.7% 1.97x 15. Fleet Farm 1 37,802 0.7% 2,571 0.7% 3.89x 16. Mealey's Furniture 3 30,773 0.6% 2,453 0.7% 0.60x 17. Courthouse Athletic Club 4 39,688 0.8% 2,400 0.6% 1.92x 18. Creme de la Creme 4 29,131 0.6% 2,208 0.6% 1.65x 19. Burger King 21 34,289 0.7% 2,081 0.6% 2.09x 20. Martin's 16 31,144 0.6% 2,080 0.6% 1.69x 21. Mister Car Wash 5 28,658 0.6% 2,076 0.6% 4.60x 22. Hardee's 19 31,844 0.6% 1,997 0.5% 0.75x 23. Popeye's Chicken & Biscuits 20 28,434 0.5% 1,889 0.5% 3.37x 24. Golden Corral 6 25,816 0.5% 1,759 0.5% 0.98x 25. Arby's 19 29,166 0.6% 1,756 0.5% 4.00x 26. Other (2) 270 801,619 15.1% 45,470 12.3% 3.53x Total 809 $ 5,207,062 100.0% $ 369,423 100.0% 2.16x (1) Includes nine net lease properties with an aggregate carrying value of $8,248 and annual minimum rent of $789 we have classified as held for sale. (2) Other includes 104 distinct brands with an average investment of $2,774 per building and average annual minimum rent of $157 per lease. SERVICE PROPERTIES TRUST | Supplemental Operating and Financial Data, June 30, 2020 29


Net Lease Portfolio by Industry As of June 30, 2020 (dollars in thousands) Percent of Total Percent of Total Annualized Annualized Industry No. of Buildings Investment (1) Investment Minimum Rent (1) Minimum Rent Coverage 1. Travel Centers 182 $ 3,344,496 64.2% $ 249,261 67.5% 1.85x 2. Restaurants-Quick Service 250 319,543 6.1% 21,106 5.7% 2.27x 3. Movie Theaters 24 209,846 4.0% 16,770 4.5% 0.95x 4. Restaurants-Casual Dining 61 216,346 4.1% 11,076 3.0% 1.68x 5. Health and Fitness 13 184,744 3.5% 9,398 2.5% 2.57x 6. Miscellaneous Retail 19 114,433 2.2% 7,140 2.0% 4.13x 7. Medical/Dental Office 71 118,098 2.3% 9,172 2.5% 2.63x 8. Grocery 19 129,219 2.5% 8,599 2.3% 4.32x 9. Automotive Parts and Service 63 96,496 1.9% 6,557 1.8% 3.01x 10. Apparel 1 11,027 0.2% 670 0.2% -6.53x 11. Automotive Dealers 9 68,756 1.3% 4,985 1.3% 4.73x 12. Entertainment 4 61,436 1.2% 1,782 0.5% 2.15x 13. Educational Services 9 55,647 1.1% 4,127 1.1% 2.59x 14. Sporting Goods 3 52,022 1.0% 3,489 0.9% 3.34x 15. Miscellaneous Manufacturing 6 31,824 0.6% 2,294 0.6% 16.02x 16. Building Materials 27 30,036 0.6% 2,510 0.7% 3.89x 17. Car Washes 5 28,658 0.6% 2,076 0.6% 4.60x 18. Drug Stores and Pharmacies 8 23,970 0.5% 1,647 0.4% 1.46x 19. Legal Services 5 11,362 0.2% 1,009 0.3% 2.08x 20. General Merchandise 3 7,492 0.1% 555 0.2% 1.81x 21. Home Furnishings 5 37,215 0.7% 2,854 0.8% 0.80x 22. Dollar Stores 3 2,971 0.1% 187 0.1% 3.15x 23. Other 4 28,748 0.6% 2,159 0.5% 4.33x 24. Vacant 15 22,677 0.4% — —% — Total 809 $ 5,207,062 100.0% $ 369,423 100.0% 2.16x (1) Includes nine net lease properties with an aggregate carrying value of $8,248 and annual minimum rent of $789 we have classified as held for sale. SERVICE PROPERTIES TRUST | Supplemental Operating and Financial Data, June 30, 2020 30


Net Lease Portfolio by Tenant (Top 10) As of June 30, 2020 (dollars in thousands) Percent of Total Percent of Total Annualized Annualized Tenant Brand Affiliation No. of Buildings Investment (1) Investment Minimum Rent (1) Minimum Rent Coverage TravelCenters of America / 1. TravelCenters of America Inc. Petro Stopping Centers 179 $ 3,302,815 63.4% $ 246,110 66.6% 1.83x (2) (3) 2. Universal Pool Co., Inc. The Great Escape 14 98,242 1.9% 7,140 1.9% 4.13x 3. Healthy Way of Life II, LLC Life Time Fitness 3 92,617 1.8% 5,246 1.4% 2.99x (2) 4. Styx Acquisition, LLC Buehler's Fresh Foods 5 76,536 1.5% 5,143 1.4% 4.33x (2) 5. Professional Resource Development, Inc. Heartland Dental 59 61,120 1.2% 4,493 1.2% 2.07x 6. Regal Cinemas, Inc. Regal Cinemas 6 44,476 0.9% 3,658 1.0% 0.89x 7. Eastwynn Theatres, Inc. AMC Theatres 5 41,771 0.8% 3,541 1.0% 0.57x 8. Express Oil Change, LLC Express Oil Change 23 49,724 1.0% 3,379 0.9% 3.50x 9. Pilot Travel Centers LLC Flying J Travel Plaza 3 41,681 0.8% 3,151 0.9% 3.46x 10. B&B Movie Theatres, LLC B&B Theatres 4 34,369 0.7% 3,100 0.8% 0.85x Sub-total, Top 10 301 3,843,351 74.0% 284,961 77.1% 1.96x 11. Other (4) Various 508 1,345,747 26.0% 84,462 22.9% 2.84x Total 809 $ 5,189,098 100.0% $ 369,423 100.0% 2.28x (1) Includes nine net lease properties with an aggregate carrying value of $8,248 and annual minimum rent of $789 that we have classified as held for sale. (2) Leases subject to full or partial guarantee. (3) TA is our largest tenant. As of June 30, 2020, we leased 179 travel centers (134 under the TravelCenters of America brand and 45 under the Petro Stopping Centers brand) to a subsidiary of TA under five master leases that expire in 2029, 2031, 2032, 2033 and 2035, respectively. TA has two renewal options for 15 years each for all of the travel centers. In addition to the payment of our minimum rent, these leases provide for payment to us of percentage rent based on increases in total non-fuel revenues over base levels (3.5% of non-fuel revenues above threshold amounts defined in the agreements). TA's remaining deferred rent obligation of $48,440 is due in quarterly installments of $4,404 through January 31, 2023. (4) Other includes 170 tenants with an average investment of $7,916 and average annual minimum rent of $497. SERVICE PROPERTIES TRUST | Supplemental Operating and Financial Data, June 30, 2020 31


Net Lease Portfolio - Expiration Schedule As of June 30, 2020 (dollars in thousands) Cumulative % of Total Annualized Minimum Rent Percent of Total Annualized Annualized Minimum Rent Year (1) Square Feet Expiring (2) Minimum Rent Expiring Expiring 2020 166,158 $ 2,555 0.7% 0.7% 2021 555,447 5,852 1.6% 2.3% 2022 853,374 10,824 2.9% 5.2% 2023 150,293 2,512 0.7% 5.9% 2024 688,836 10,018 2.7% 8.6% 2025 438,433 8,426 2.3% 10.9% 2026 868,969 9,808 2.7% 13.6% 2027 1,198,874 15,539 4.2% 17.8% 2028 512,639 7,430 2.0% 19.8% 2029 1,311,612 47,322 12.8% 32.6% 2030 184,368 3,908 1.1% 33.7% 2031 1,397,033 49,723 13.4% 47.1% 2032 1,125,517 50,438 13.6% 60.7% 2033 1,100,723 53,194 14.4% 75.1% 2034 134,640 4,504 1.2% 76.3% 2035 2,316,553 80,764 21.9% 98.2% 2036 320,792 3,537 1.0% 99.2% 2037 — — — 99.2% 2038 10,183 416 0.1% 99.3% 2039 185,437 2,501 0.7% 100.0% 2040 1,739 152 —% 100.0% Total 13,521,620 $ 369,423 100.0% Weighted Average Lease Term 9.41 11.11 (1) The year of lease expiration is pursuant to contract terms. (2) Includes nine net lease properties with an aggregate carrying value of $8,248 and annual minimum rent of $789 we have classified as held for sale. SERVICE PROPERTIES TRUST | Supplemental Operating and Financial Data, June 30, 2020 32


Net Lease Portfolio - Occupancy and Leasing Summary (dollars in thousands) As of and For the Three Months Ended 6/30/2020 3/31/2020 12/31/2019 9/30/2019 Properties (end of period) 809 813 816 946 Total square feet 13,728,893 14,511,567 14,886,967 17,563,459 Square feet leased 13,548,122 14,262,947 14,539,128 17,238,100 Percentage leased 99 % 98 % 98% 98% Leasing activity (Sq. ft): New Leases 39,892 — — — Renewals 506,780 59,694 217,807 — Total 546.672 59.694 217.807 — % Change in GAAP rent: New Leases (25.92)% (14.81)% —% —% Renewals 6.95 % — — — Total (weighted average) 6.04 % (14.81)% —% —% Leasing Costs and Concession Commitments: New Leases $ 157 $ — $ — $ — Renewals 7,501 — 551 — Total (weighted average) $ 7,658 $ — $ 551 $ — Leasing Costs and Concession Commitments per Square Foot: New Leases $ 3.93 $ — $ — $ — Renewals 14.80 — 2.53 — Total (weighted average) $ 3.31 $ — $ 2.53 $ — Weighted Average Lease Term by Sq. Ft (Years): New Leases 6.0 — — — Renewals 13.7 5.1 8.1 — Total (weighted average) 13.1 5.1 8.1 — Leasing Costs and Concession Commitments per Square Foot per Year: New Leases $ 1.08 $ — $ — $ — Renewals 0.65 — 0.31 — Total $ 1.07 $ — $ 0.31 $ — SERVICE PROPERTIES TRUST | Supplemental Operating and Financial Data, June 30, 2020 33


Non-GAAP Financial Measures and Certain Definitions Non-GAAP Financial Measures We present certain “non-GAAP financial measures” within the meaning of applicable Securities and Exchange Commission, or SEC, rules, including EBITDA, EBITDAre, Adjusted EBITDAre, FFO and Normalized FFO. These measures do not represent cash generated by operating activities in accordance with GAAP and should not be considered alternatives to net income (loss) as indicators of our operating performance or as measures of our liquidity. These measures should be considered in conjunction with net income (loss) as presented in our condensed consolidated statements of income. We consider these non-GAAP measures to be appropriate supplemental measures of operating performance for a REIT, along with net income (loss). We believe these measures provide useful information to investors because by excluding the effects of certain historical amounts, such as depreciation and amortization expense, they may facilitate a comparison of our operating performance between periods and with other REITs. EBITDA, EBITDAre and Adjusted EBITDAre: We calculate earnings before interest, taxes, depreciation and amortization, or EBITDA, EBITDA for real estate, or EBITDAre, and Adjusted EBITDAre as shown on page 17. EBITDAre is calculated on the basis defined by The National Association of Real Estate Investment Trusts, or Nareit, which is EBITDA, excluding gains and losses on the sale of real estate, loss on impairment of real estate assets, if any, as well as certain other adjustments currently not applicable to us. In calculating Adjusted EBITDAre, we adjust for the items shown on page 18 and include business management incentive fees, if any, only in the fourth quarter versus the quarter when they are recognized as an expense in accordance with GAAP due to their quarterly volatility not necessarily being indicative of our core operating performance and the uncertainty as to whether any such business management incentive fees will be payable when all contingencies for determining such fees are known at the end of the calendar year. Other real estate companies and REITs may calculate EBITDA, EBITDAre and Adjusted EBITDAre differently than we do. FFO and Normalized FFO: We calculate funds from operations, or FFO, and Normalized FFO as shown on page 18. FFO is calculated on the basis defined by Nareit, which is net income (loss), calculated in accordance with GAAP, excluding any gain or loss on sale of properties and loss on impairment of real estate assets, if any, plus real estate depreciation and amortization, less any unrealized gains and losses on equity securities, as well as certain other adjustments currently not applicable to us. In calculating Normalized FFO, we adjust for the item shown on page 18 and include business management incentive fees, if any, only in the fourth quarter versus the quarter when they are recognized as an expense in accordance with GAAP due to their quarterly volatility not necessarily being indicative of our core operating performance and the uncertainty as to whether any such business management incentive fees will be payable when all contingencies for determining such fees are known at the end of the calendar year. FFO and Normalized FFO are among the factors considered by our Board of Trustees when determining the amount of distributions to our shareholders. Other factors include, but are not limited to, requirements to maintain our qualification for taxation as a REIT, limitations in our credit agreement and public debt covenants, the availability to us of debt and equity capital, our distribution rate as a percentage of the trading price of our common shares, or dividend yield, and to the dividend yield of other REITs, our expectation of our future capital requirements and operating performance and our expected needs for and availability of cash to pay our obligations. Other real estate companies and REITs may calculate FFO and Normalized FFO differently than we do. Other Definitions Adjusted Total Assets and Total Unencumbered Assets: Adjusted total assets and total unencumbered assets include original cost of real estate assets calculated in accordance with GAAP before impairment write-downs, if any, and exclude depreciation and amortization, accounts receivable and intangible assets. Annualized Dividend Yield: Annualized dividend yield is the annualized dividend paid during the period divided by the closing price of our common shares at the end of the period. Comparable Hotels Data: We present RevPAR, ADR and occupancy for the periods presented on a comparable basis to facilitate comparisons between periods. We generally define comparable hotels as those that we owned and were open and operating for the entire periods being compared. For the three months ended June 30, 2020 and 2019, we excluded 23 hotels from our comparable results. Two of these hotels were not owned for the entire periods, three were closed for major renovations and 18 suspended operations during part of the periods presented. For the years ended June 30, 2020 and 2019, we excluded 25 hotels from our comparable results. Three of these hotels were not owned for the entire periods, four were closed for major renovations and 18 suspended operations during part of the periods presented. Consolidated Income Available for Debt Service: Consolidated income available for debt service is earnings from operations excluding interest expense, unrealized gains and losses on equity securities, depreciation and amortization, loss on asset impairment, unrealized appreciation on assets held for sale, gains and losses on early extinguishment of debt, gains and losses on sales of property and amortization of deferred charges. SERVICE PROPERTIES TRUST | Supplemental Operating and Financial Data, June 30, 2020 34


Non-GAAP Financial Measures and Certain Definitions (continued) Coverage: We define hotel coverage as total hotel revenues minus all hotel expenses and FF&E reserve escrows that are not subordinated to minimum returns due to us divided by the minimum returns or rents due to us. Coverage amounts include operating data for certain hotels for periods prior to when we acquired them for periods they were managed by a different brand. We define net lease coverage as earnings before interest, taxes, depreciation, amortization and rent, or EBITDAR, divided by the annual minimum rent due to us weighted by the minimum rent of the property to total minimum rents of the net lease portfolio. EBITDAR amounts used to determine rent coverage are generally for the latest twelve month period reported based on the most recent operating information, if any, furnished by the tenant. Operating statements furnished by the tenant often are unaudited and, in certain cases, may not have been prepared in accordance with GAAP and are not independently verified by us. Tenants that do not report operating information are excluded from the coverage calculations. Coverage amounts include data for certain properties for periods prior to when we acquired them. In instances where we do not have financial information for the most recent quarter from our tenants, we have calculated an implied EBITDAR for the second quarter using industry benchmark data to more accurately reflect the impact of COVID-19 on our tenants’ operations. We believe using only financial information from the earlier periods could be misleading as it would not reflect the negative impact those tenants experienced as a result of the COVID-19 pandemic. As a result, we believe using this industry benchmark data provides a more accurate estimated representation of recent operating results and coverage for those tenants. Debt: Debt amounts reflect the principal balance as of the date reported. Net debt means total debt less unrestricted cash and cash equivalents as of the date reported. FF&E Reserve: Most of our hotel operating agreements require the deposit of a percentage of gross hotel revenues into escrows to fund FF&E reserves. We own all the FF&E reserve escrows for our hotels. Our net lease agreements do not require FF&E escrow deposits; however, certain tenants may request that we fund capital improvements in return for increases in the annual minimum rent. Our tenants are generally not obligated to request and we are not obligated to fund any such improvements. FF&E Reserve Deposits Not Funded by Hotel Operations: The operating agreements for our hotels generally provide that, if necessary, we will provide FF&E funding in excess of escrowed reserves. To the extent we make such fundings, our contractual annual minimum returns or rents generally increase by a percentage of the amounts we fund. Gross Book Value of Real Estate Assets: Gross book value of real estate assets is real estate properties at cost plus acquisition related costs, if any, before purchase price allocations, less impairment write-downs, if any. Investment: We define hotel investment as historical cost of our properties plus capital improvements funded by us less impairment write-downs, if any, and excludes capital improvements made from FF&E reserves funded from hotel operations that do not result in increases in minimum returns or rents. We define net lease investment as historical cost of our properties plus capital improvements funded by us less impairment write-downs, if any. Minimum Return/Rent: Each of our management agreements or leases with hotel operators provides for payment to us of an annual minimum return or minimum rent, respectively. Certain of these minimum payment amounts are secured by full or limited guarantees or security deposits. In addition, certain of our hotel management agreements provide for payment to us of additional amounts to the extent of available cash flows as defined in the management agreement. Payments of these additional amounts are not guaranteed or secured by deposits. Each of our agreements with our net lease tenants provides for payment to us of minimum rent. Certain of these minimum payment amounts are secured by full or limited guarantees. Annualized minimum rent amounts represent cash rent amounts due to us and exclude adjustments, if any, necessary to record scheduled rent changes under certain of our leases, the deferred rent obligations payable to us under our leases with TA and the estimated future payments to us under our TA leases for the cost of removing underground storage tanks at our travel centers on a straight line basis or any reimbursement of expenses paid by us. SMTA Transaction: On September 20, 2019, we acquired 767 net lease properties from Spirit MTA REIT, a Maryland REIT, (NYSE: SMTA), or SMTA, located in 45 states, for an aggregate transaction value of $2.5 billion. Total Gross Assets: Total gross assets is total assets plus accumulated depreciation. SERVICE PROPERTIES TRUST | Supplemental Operating and Financial Data, June 30, 2020 35


Warning Concerning Forward-looking Statements This supplemental operating and financial data may contain forward-looking statements within the meaning of the Private Securities Litigation Reform Act of 1995 and other securities laws. Whenever we use words such as “believe,” “expect,” “anticipate,” “intend,” “plan,” “estimate,” “will,” “may” and negatives or derivatives of these or similar expressions, we are making forward-looking statements. These forward-looking statements are based upon our present intent, beliefs or expectations, but forward-looking statements are not guaranteed to occur and may not occur. Actual results may differ materially from those contained in or implied by our forward-looking statements. Forward-looking statements involve known and unknown risks, uncertainties and other factors, some of which are beyond our control. The information contained in our filings with the SEC, including under “Risk Factors” in our periodic reports, or incorporated therein, identifies important factors that could cause our actual results to differ materially from those stated in or implied by our forward-looking statements. Our filings with the SEC are available on the SEC's website at www.sec.gov. You should not place undue reliance upon our forward-looking statements. Except as required by law, we do not intend to update or change any forward-looking statements as a result of new information, future events or otherwise. SERVICE PROPERTIES TRUST | Supplemental Operating and Financial Data, June 30, 2020 36