
UNITED STATES SECURITIES AND EXCHANGE COMMISSION
WASHINGTON, D.C. 20549

FORM 8-K
CURRENT REPORT
Pursuant to Section 13 or 15(d) of the Securities Exchange Act of 1934

February 11, 2022
(Date of Report/Date of earliest event reported)

SENSIENT TECHNOLOGIES CORPORATION
(Exact name of registrant as specified in its charter)

Wisconsin
001-07626
39-0561070
(State or other jurisdiction of incorporation)
(Commission File Number)
(IRS Employer Identification No.)

777 East Wisconsin Avenue
Milwaukee, Wisconsin 53202-5304
(Address and zip code of principal executive offices)

(414) 271-6755
(Registrant’s telephone number, including area code)

N/A
(Former name or former address, if changed since last report)

Check the appropriate box below if the Form 8-K filing is intended to simultaneously satisfy the filing obligation of the registrant under any of the following provisions:


Written communications pursuant to Rule 425 under the Securities Act (17 CFR 230.425)

Soliciting material pursuant to Rule 14a-12 under the Exchange Act (17 CFR 240.14a-12)

Pre-commencement communications pursuant to Rule 14d-2(b) under the Exchange Act (17 CFR 240.14d-2(b))

Pre-commencement communications pursuant to Rule 13e-4(c) under the Exchange Act (17 CFR 240.13e-4(c))

Securities registered pursuant to Section 12(b) of the Act:

Title of each class
Trading Symbol(s)
Name of each exchange on which registered
Common stock, par value $0.10 per share
SXT
New York Stock Exchange

Indicate by check mark whether the registrant is an emerging growth company as defined in Rule 405 of the Securities Act of 1933 (§230.405 of this chapter) or Rule 12b-2 of the Securities Exchange Act of 1934 (§240.12b-2 of this chapter).

Emerging growth company

If an emerging growth company, indicate by check mark if the registrant has elected not to use the extended transition period for complying with any new or revised financial accounting standards provided pursuant to Section 13(a) of the Exchange Act. ☐


Item 2.02
Results of Operations and Financial Condition.

Sensient Technologies Corporation (the “Company”) issued a press release on February 11, 2022 disclosing its results of operations for its quarter and year ended December 31, 2021, and its financial condition at that date.  The press release is furnished as Exhibit 99.1 to this Current Report on Form 8-K.

The information contained in this Item 2.02 (including Exhibit 99.1) is intended to be furnished under Item 2.02 of Form 8-K and shall not be deemed “filed” for purposes of Section 18 of the Securities Exchange Act of 1934, as amended (the “Exchange Act”), or otherwise subject to the liabilities of that section, nor shall it be deemed to be incorporated by reference into any registration statement or other document filed under the Securities Act of 1933, as amended, or the Exchange Act.

Item 7.01
Regulation FD Disclosure.

On February 11, 2022, the Company also posted an updated investor presentation for its quarter and year ended December 31, 2021 on the “Investor Information” section of its website.  A copy of the investor presentation is furnished as Exhibit 99.2 to this Current Report on Form 8-K.

The information contained in this Item 7.01 (including Exhibit 99.2) is intended to be furnished under Item 7.01 of Form 8-K and shall not be deemed “filed” for purposes of Section 18 of the Exchange Act, or otherwise subject to the liabilities of that section, nor shall it be deemed to be incorporated by reference into any registration statement or other document filed under the Securities Act of 1933, as amended, or the Exchange Act.

Item 9.01
Financial Statements and Exhibits.

  (d)
Exhibits. The following exhibits are furnished with this Current Report on Form 8-K:

EXHIBIT INDEX

Exhibit Number
Description
Sensient Technologies Corporation Earnings Press Release for the Quarter and Year Ended December 31, 2021.
Sensient Technologies Corporation Investor Presentation – Q4 2021.
104 Cover Page Interactive Data File (embedded within the Inline XBRL document).


SIGNATURES

Pursuant to the requirements of the Securities Exchange Act of 1934, the registrant has duly caused this report to be signed on its behalf by the undersigned hereunto duly authorized.

 
SENSIENT TECHNOLOGIES CORPORATION


By:
/s/ John J. Manning
 
 
Name:
John J. Manning
 
 
Title:
Senior Vice President, General Counsel, and Secretary
 
 
Date:
February 11, 2022


Exhibit 99.1

Contact:
Amy Agallar
 
(414) 347-3706

Sensient Technologies Corporation
Reports Results for the Quarter Ended December 31, 2021

Reported Consolidated Revenue Growth of 1.7%
 Adjusted Consolidated Local Currency Revenue Growth of 10.7%

Flavors & Extracts Continues its Strong Performance
Color and Asia Pacific Groups Report Double Digit Revenue and Profit Growth

MILWAUKEE— February 11, 2022 — Sensient Technologies Corporation (NYSE: SXT) reported consolidated revenue of $340.4 million in this year’s fourth quarter compared to $334.7 million in last year’s fourth quarter. Reported operating income in the fourth quarter of 2021 was $40.4 million compared to $34.8 million in the fourth quarter of 2020. Reported diluted earnings per share was 65 cents in the fourth quarter of 2021 compared to 59 cents in the fourth quarter of 2020. Foreign currency translation decreased revenue by approximately 1% and earnings per share by approximately 2% in the quarter.

The 2021 fourth quarter reported results include divestiture & other related costs and operational improvement plan costs, which in total decreased fourth quarter net earnings by $3.0 million ($0.07 per diluted share). The 2020 fourth quarter reported results include divestiture & other related costs, operational improvement plan costs, and a one-time COVID-19 employee payment, which in total decreased net earnings by $3.2 million ($0.07 per diluted share). The 2021 and 2020 fourth quarter reported results also include the operations of the divested product lines, which increased revenue by $0.7 million and $25.2 million in 2021 and 2020, respectively. The operations of the divested product lines also decreased diluted earnings per share by $0.01 in the fourth quarter of 2021 and increased diluted earnings per share by $0.06 in the fourth quarter of 2020. The adjustments to our reported results are described in more detail under “Reconciliation of Non-GAAP Amounts” at the end of this release.

- MORE -

Sensient Technologies Corporation
Page 2
Earnings Release – Quarter Ended December 31, 2021
 
February 11, 2022
 

BUSINESS REVIEW

    
Reported
 
Revenue
 
Quarter
   
Year-to-Date
 
Flavors & Extracts
   
-6.1%

   
-0.4%

Color
   
14.4%

   
8.8%

Asia Pacific
   
11.1%

   
11.6%

Total Revenue
   
1.7%

   
3.6%


Adjusted
Local Currency (1)
 
   
Revenue
 
Quarter
   
Year-to-Date
 
Flavors & Extracts
   
8.0%

   
9.4%

Color
   
15.8%

   
9.4%

Asia Pacific
   
15.0%

   
10.1%

Total Revenue
   
10.7%

   
9.1%

                 
(1) Adjusted local currency percentage changes are described in more detail in the “Reconciliation of Non-GAAP Amounts” at the end of this release.
 

The Flavors & Extracts Group reported fourth quarter revenue of $177.4 million compared to $189.1 million reported in the comparable period last year, a decrease of 6.1%, primarily due to the divestiture of the Fragrances product line in April 2021. Adjusted local currency revenue increased 8.0% in the quarter. The higher adjusted local currency revenue was primarily the result of favorable pricing and volume growth. Segment operating income was $21.9 million in the current quarter compared to $23.5 million reported in the comparable period last year, a decrease of 6.7%, primarily due to the divestiture of the Fragrance product line. Adjusted local currency operating income increased 10.6% in the quarter. The higher adjusted local currency operating income was primarily due to the favorable pricing and higher volumes.  Foreign currency translation decreased both segment revenue and operating income by approximately 1% in the quarter.

- MORE -

Sensient Technologies Corporation Page 3
Earnings Release – Quarter Ended December 31, 2021

February 11, 2022

 
The Color Group reported revenue of $137.1 million in the quarter compared to $119.8 million in last year’s comparable period, an increase of 14.4%. Adjusted local currency revenue increased 15.8% in the quarter. The Group experienced strong volume growth in both Food & Pharmaceutical Colors and Personal Care. Segment operating income was $24.1 million in the quarter compared to $20.5 million in last year’s comparable period, an increase of 17.3%. Adjusted local currency operating income increased 19.1% compared to the prior year’s fourth quarter. The higher operating income is primarily a result of the higher volumes. Foreign currency translation decreased both segment revenue and operating income by approximately 1% in the quarter.

The Asia Pacific Group reported revenue of $35.7 million in the quarter compared to $32.2 million in last year’s comparable period, an increase of 11.1%. Adjusted local currency revenue increased 15.0% in the quarter. Segment operating income was $7.2 million in the quarter compared to $6.0 million in last year’s comparable quarter, an increase of 18.9%. Adjusted local currency operating income increased 24.9% in the quarter. The higher profit was primarily a result of the favorable volume growth. Foreign currency translation decreased segment revenue and operating income by approximately 4% and 5%, respectively, in the quarter.

Corporate & Other reported operating costs of $12.8 million in the current quarter compared to $15.3 million in last year’s comparable period, a decrease of 16.1%. The lower costs are primarily due to the one-time COVID-19 employee payment in the fourth quarter of 2020. Adjusted local currency operating expenses for Corporate & Other increased 22.1% in the quarter primarily due to higher performance-based compensation.

- MORE -

Sensient Technologies Corporation
Page 4
Earnings Release – Quarter Ended December 31, 2021

February 11, 2022


2022 OUTLOOK

Sensient expects 2022 full year GAAP diluted earnings per share to grow at a mid-teen growth rate compared to the Company’s 2021 reported GAAP diluted earnings per share of $2.81. Our full year 2022 guidance does not include any material divestiture related costs, operational improvement plan costs, or results of divested businesses.

The Company expects 2022 local currency revenue to grow at a mid-single-digit rate compared to the Company’s 2021 adjusted revenue (2). The Company expects 2022 local currency adjusted EBITDA(2) and local currency diluted earnings per share to grow at a high single-digit rate compared to the Company’s 2021 adjusted EBITDA(2) and the Company’s 2021 adjusted diluted earnings per share(2) of $3.13, respectively.

 The Company expects earnings per share reported on a U.S. dollar basis to be impacted by approximately ten cents of foreign currency headwinds based on current exchange rates.

The Company’s guidance is based upon current trends, current tax law, and the effects of COVID-19 to date. The full impacts of the ongoing COVID-19 pandemic remain uncertain and management will continue to monitor its impacts on our business.

  (2)
See “Reconciliation of Non-GAAP Amounts” at the end of this release for more information.

- MORE -

Sensient Technologies Corporation
Page 5
Earnings Release – Quarter Ended December 31, 2021

February 11, 2022


USE OF NON-GAAP FINANCIAL MEASURES

The Company’s non-GAAP financial measures eliminate the impact of certain items, which, depending on the measure, include, currency movements, depreciation and amortization, non-cash share-based compensation, divestiture & other related costs, operational improvement plan costs and income, the 2020 COVID-19 employee payment costs, and the results of the divested operations. These measures are provided to enhance the overall understanding of the Company’s performance when viewed together with the GAAP results. Refer to “Reconciliation of Non-GAAP Amounts” at the end of this release.

CONFERENCE CALL

The Company will host a conference call to discuss its 2021 fourth quarter financial results at 8:30 a.m. CST on Friday, February 11, 2022. To participate in the conference call, contact Chorus Call Inc. at (844) 492-3726 or (412) 317-1078, and ask to join the Sensient Technologies Corporation conference call. Alternatively, the call can be accessed by using the webcast link that is available on the Investor Information section of the Company’s web site at www.sensient.com.

A replay of the call will be available one hour after the end of the conference call through February 18, 2022, by calling (877) 344-7529 and referring to conference identification number 4903818. An audio replay and written transcript of the call will also be posted on the Investor Information section of the Company’s web site at www.sensient.com on or after February 15, 2022.

- MORE -

Sensient Technologies Corporation
Page 6
Earnings Release – Quarter Ended December 31, 2021

February 11, 2022


This release contains statements that may constitute “forward-looking statements” within the meaning of Federal securities laws including under “2022 Outlook” above. Such forward-looking statements are not guarantees of future performance and involve known and unknown risks, uncertainties and other factors concerning the Company’s operations and business environment. Important factors that could cause actual results to differ materially from those suggested by these forward-looking statements and that could adversely affect the Company’s future financial performance include the following: the impact and uncertainty created by the ongoing COVID-19 pandemic, including, but not limited to, its effects on our employees, facilities, customers, and suppliers, the availability and cost of raw materials, energy, and other supplies, the availability and cost of labor, logistics, and transportation, governmental regulations and restrictions, and general economic conditions, including inflation; the pace and nature of new product introductions by the Company and the Company’s customers; the Company’s ability to anticipate and respond to changing consumer preferences and changing technologies; the Company’s ability to successfully implement its growth strategies; the outcome of the Company’s various productivity-improvement and cost-reduction efforts, acquisition and divestiture activities, and operational improvement plan; the effectiveness of the Company’s past restructuring activities; changes in costs of raw materials, including energy; industry, regulatory, legal, and economic factors related to the Company’s domestic and international business; the effects of tariffs, trade barriers, and disputes; growth in markets for products in which the Company competes; industry and customer acceptance of price increases; actions by competitors; currency exchange rate fluctuations; and other factors included in “Risk Factors” in the Company’s Annual Report on Form 10-K for the year ended December 31, 2020, and in other documents that the Company files with the SEC, including the Company’s Annual Report on Form 10-K for the year ended December 31, 2021 that will be filed by March 1, 2022. The risks and uncertainties identified above are not the only risks the Company faces. Additional risks and uncertainties not presently known to the Company or that it currently believes to be immaterial also may adversely affect the Company. Should any known or unknown risks and uncertainties develop into actual events, these developments could have material adverse effects on our business, financial condition, and results of operations. This release contains time-sensitive information that reflects management’s best analysis only as of the date of this release. Except to the extent required by applicable laws, the Company does not undertake to publicly update or revise its forward-looking statements even if experience or future changes make it clear that any projected results expressed or implied herein will not be realized.

ABOUT SENSIENT TECHNOLOGIES

Sensient Technologies Corporation is a leading global manufacturer and marketer of colors, flavors, and other specialty ingredients.  Sensient uses advanced technologies and robust global supply chain capabilities to develop specialized solutions for food and beverages, as well as products that serve the pharmaceutical, nutraceutical, cosmetic, and personal care industries. Sensient’s customers range in size from small entrepreneurial businesses to major international manufacturers representing some of the world’s best-known brands.  Sensient is headquartered in Milwaukee, Wisconsin.

www.sensient.com

- MORE -

Sensient Technologies Corporation
Page 7
(In thousands, except percentages and per share amounts)
 
(Unaudited)
 

Consolidated Statements of Earnings
 
Three Months Ended December 31,
   
Year Ended December 31,


2021
   
2020
   
% Change
   
2021
   
2020
   
% Change
 
                                     
Revenue
 
$
340,448
   
$
334,668
     
1.7%

 
$
1,380,264
   
$
1,332,001
     
3.6%

                                                 
Cost of products sold
   
228,065
     
230,674
     
(1.1%)

   
925,603
     
908,254
     
1.9%

Selling and administrative expenses
   
71,963
     
69,179
     
4.0%

   
284,633
     
271,091
     
5.0%

                                                 
Operating income
   
40,420
     
34,815
     
16.1%

   
170,028
     
152,656
     
11.4%

Interest expense
   
2,752
     
3,399
             
12,544
     
14,811
         
                                                 
Earnings before income taxes
   
37,668
     
31,416
             
157,484
     
137,845
         
Income taxes
   
10,439
     
6,247
             
38,739
     
28,373
         
                                                 
Net earnings
 
$
27,229
   
$
25,169
     
8.2%

 
$
118,745
   
$
109,472
     
8.5%

                                                 
Earnings per share of common stock:
                                               
Basic
 
$
0.65
   
$
0.59
           
$
2.82
   
$
2.59


Diluted
 
$
0.65
   
$
0.59
           
$
2.81
   
$
2.59
         
                                                 
Average common shares outstanding:
                                               
Basic
   
41,890
     
42,307
             
42,077
     
42,301


Diluted
   
42,173
     
42,404
             
42,258
     
42,346
         

Results by Segment
 
Three Months Ended December 31,
   
Year Ended December 31,
       
                                     
Revenue
 
2021
   
2020
   
% Change
   
2021
   
2020
   
% Change
 
                                     
Flavors & Extracts
 
$
177,448
   
$
189,060
     
(6.1%)

 
$
739,427
   
$
742,035
     
(0.4%)

Color
   
137,104
     
119,813
     
14.4%

   
545,270
     
501,018
     
8.8%

Asia Pacific
   
35,749
     
32,165
     
11.1%

   
135,348
     
121,227
     
11.6%

Intersegment elimination
   
(9,853
)
   
(6,370
)
     
   
(39,781
)
   
(32,279
)


Consolidated
 
$
340,448
   
$
334,668
     
1.7%

 
$
1,380,264
   
$
1,332,001
     
3.6%


Operating Income


Flavors & Extracts
 
$
21,942
   
$
23,507
     
(6.7%)

 
$
98,660
   
$
90,974
     
8.4%

Color
   
24,113
     
20,548
     
17.3%

   
103,575
     
96,034
     
7.9%

Asia Pacific
   
7,184
     
6,044
     
18.9%

   
26,330
     
22,075
     
19.3%

Corporate & Other
   
(12,819
)
   
(15,284
)
     
   
(58,537
)
   
(56,427
)


Consolidated
 
$
40,420
   
$
34,815
     
16.1%

 
$
170,028
   
$
152,656
     
11.4%


- MORE -

Sensient Technologies Corporation
Page 8
(In thousands)
 
(Unaudited)
 

Consolidated Condensed Balance Sheets
 
December 31,
2021
   
December 31,
2020


Cash and cash equivalents
 
$
25,740
   
$
24,770
 
Trade accounts receivable
   
261,121
     
234,132
 
Inventories
   
411,635
     
381,346
 
Prepaid expenses and other current assets
   
42,657
     
48,578
 
Assets held for sale
   
-
     
52,760
 
Total Current Assets
   
741,153
     
741,586
 
                 
Goodwill & intangible assets (net)
   
435,009
     
434,220
 
Property, plant, and equipment (net)
   
446,478
     
445,493
 
Other assets
   
122,853
     
119,561
 
                 
Total Assets
 
$
1,745,493
   
$
1,740,860
 
                 
Trade accounts payable
 
$
125,519
   
$
107,324
 
Short-term borrowings
   
8,539
     
9,247
 
Other current liabilities
   
98,247
     
82,045
 
Liabilities held for sale
   
-
     
17,339
 
Total Current Liabilities
   
232,305
     
215,955
 
                 
Long-term debt
   
503,006
     
518,004
 
Accrued employee and retiree benefits
   
28,579
     
28,941
 
Other liabilities
   
43,178
     
43,624
 
Shareholders’ Equity
   
938,425
     
934,336
 
                 
Total Liabilities and Shareholders’ Equity
 
$
1,745,493
   
$
1,740,860
 

- MORE -

Sensient Technologies Corporation
Page 9
(In thousands, except per share amounts)
 
(Unaudited)
 

Consolidated Statements of Cash Flows
           
Year Ended December 31,
           
   
2021
   
2020
 
Cash flows from operating activities:
           
Net earnings
 
$
118,745
   
$
109,472
 
Adjustments to arrive at net cash provided by operating activities:
                       
Depreciation and amortization
   
52,051
     
49,641
 
Share-based compensation expense
   
9,573
     
5,608
 
Net loss (gain) on assets
   
331
     
(252
)
Loss on divestitures and other charges
   
14,021
     
6,904
 
Deferred income taxes
   
(6,071
)
   
(8,705
)
Changes in operating assets and liabilities:
               
Trade accounts receivable
   
(34,571
)
   
(11,357
)
Inventories
   
(36,323
)
   
46,828
 
Prepaid expenses and other assets
   
(6,057
)
   
(12,868
)
Trade accounts payable and other accrued expenses
   
21,326
     
15,524
 
Accrued salaries, wages, and withholdings from employees
   
7,321
     
15,140
 
Income taxes
   
4,275
     
22
 
Other liabilities
   
597
     
2,823
 
                 
Net cash provided by operating activities
   
145,218
     
218,780
 
                 
Cash flows from investing activities:
               
Acquisition of property, plant, and equipment
   
(60,788
)
   
(52,162
)
Proceeds from sale of assets
   
216
     
1,075
 
Proceeds from divestiture of businesses
   
37,790
     
12,595
 
Acquisition of new business
   
(13,875
)
   
-
 
Other investing activities
   
1,097
     
5,071
 
                 
Net cash used in investing activities
   
(35,560
)
   
(33,421
)
                 
Cash flows from financing activities:
               
Proceeds from additional borrowings
   
112,194
     
36,667
 
Debt payments
   
(110,168
)
   
(154,348
)
Purchase of treasury stock
   
(42,511
)
   
-
 
Dividends paid
   
(66,694
)
   
(66,057
)
Other financing activities
   
(582
)
   
(415
)
                 
Net cash used in financing activities
   
(107,761
)
   
(184,153
)
                 
Effect of exchange rate changes on cash and cash equivalents
   
(927
)
   
2,411
 
                 
Net increase in cash and cash equivalents
   
970
     
3,617
 
Cash and cash equivalents at beginning of period
   
24,770
     
21,153
 
Cash and cash equivalents at end of period
 
$
25,740
   
$
24,770
 

Supplemental Information
Year Ended December 31,
 
2021
   
2020
 
             
Dividends paid per share
 
$
1.58
   
$
1.56
 

- MORE -

Sensient Technologies Corporation
Page 10
(In thousands, except percentages and per share amounts)
 
(Unaudited)
 

Reconciliation of Non-GAAP Amounts

The Company’s results for the three and twelve months ended December 31, 2021 and 2020 include adjusted revenue, adjusted operating income, adjusted net earnings, and adjusted diluted earnings per share, which exclude divestiture & other related costs, operational improvement plan costs and income, the results of the divested operations, and the 2020 COVID-19 employee payment.

   
Three Months Ended December 31,
   
Year Ended December 31,
 
   
2021
   
2020
   
% Change
   
2021
   
2020
   
% Change
 
Revenue (GAAP)
 
$
340,448
   
$
334,668
     
1.7%

 
$
1,380,264
   
$
1,332,001
     
3.6%

Revenue of the divested product lines
   
(663
)
   
(25,163
)
     
   
(30,062
)
   
(113,553
)
     
Adjusted revenue
 
$
339,785
   
$
309,505
     
9.8%

 
$
1,350,202
   
$
1,218,448
     
10.8%


Operating income (GAAP)
 
$
40,420
   
$
34,815
     
16.1%

 
$
170,028
   
$
152,656
     
11.4%

Divestiture & other related costs – Cost of products sold
   
58
     
4
       
   
86
     
1,795
       
Divestiture & other related costs – Selling and administrative expenses
   
579
     
1,671
       
   
14,052
     
10,360
       
Operating loss (income) of the divested product lines
   
518
     
(3,415
)
     
   
(1,880
)
   
(7,580
)
     
Operational improvement plan - Cost of products sold
   
-
     
-
       
   
-
     
35
       
Operational improvement plan - Selling and administrative
expenses (income)
   
115
     
698
       
   
(1,895
)
   
3,304
       
COVID-19 employee payment - Cost of products sold
   
-
     
1,036
       
   
-
     
1,036
       
COVID-19 employee payment - Selling and administrative expenses
   
-
     
1,986
       
   
-
     
1,986
       
Adjusted operating income
 
$
41,690
   
$
36,795
     
13.3%

 
$
180,391
   
$
163,592
     
10.3%


Net earnings (GAAP)
 
$
27,229
   
$
25,169
     
8.2%

 
$
118,745
   
$
109,472
     
8.5%

Divestiture & other related costs, before tax
   
637
     
1,675
       
   
14,138
     
12,155
       
Tax impact of divestiture & other related costs
   
1,809
     
(1,393
)
     
   
2,092
     
(2,605
)
     
Net loss (earnings) of the divested product lines, before tax
   
518
     
(3,415
)
     
   
(1,880
)
   
(7,580
)
     
Tax impact of the divested product lines
   
(130
)
   
790
       
   
460
     
1,945
       
Operational improvement plan costs (income), before tax
   
115
     
698
       
   
(1,895
)
   
3,339
       
Tax impact of operational improvement plan
   
427
     
(170
)
     
   
471
     
(826
)
     
COVID-19 employee payment, before tax
   
-
     
3,022
       
   
-
     
3,022
       
Tax impact of COVID-19 employee payment
   
-
     
(675
)
     
   
-
     
(675
)
     
Adjusted net earnings
 
$
30,605
   
$
25,701
     
19.1%

 
$
132,131
   
$
118,247
     
11.7%


Diluted earnings per share (GAAP)
 
$
0.65
   
$
0.59
     
10.2%

 
$
2.81
   
$
2.59
     
8.5%

Divestiture & other related costs, net of tax
   
0.06
     
0.01
       
   
0.38
     
0.23
       
Results of operations of the divested product lines, net of tax
   
0.01
     
(0.06
)
     
   
(0.03
)
   
(0.13
)
     
Operational improvement plan costs (income), net of tax
   
0.01
     
0.01
       
   
(0.03
)
   
0.06
       
COVID-19 employee payment, net of tax
   
-
     
0.06
       
   
-
     
0.06
       
Adjusted diluted earnings per share
 
$
0.73
   
$
0.61
     
19.7%

 
$
3.13
   
$
2.79
     
12.2%


Note: Earnings per share calculations may not foot due to rounding differences.
 
- MORE -

Sensient Technologies Corporation
Page 11
(In thousands)
 
(Unaudited)
 

Reconciliation of Non-GAAP Amounts - Continued
 
Results by Segment
 
Three Months Ended December 31,
 
               
Adjusted
               
Adjusted
 
Revenue
 
2021
   
Adjustments (1)
   
2021
   
2020
   
Adjustments (1)
   
2020
 
                                     
Flavors & Extracts
 
$
177,448
   
$
(221
)
 
$
177,227
   
$
189,060
   
$
(24,378
)
 
$
164,682
 
Color
   
137,104
     
(442
)
   
136,662
     
119,813
     
(766
)
   
119,047
 
Asia Pacific
   
35,749
     
-
     
35,749
     
32,165
     
(116
)
   
32,049
 
Intersegment elimination
   
(9,853
)
   
-
     
(9,853
)
   
(6,370
)
   
97
     
(6,273
)
                                                 
Consolidated
 
$
340,448
   
$
(663
)
 
$
339,785
   
$
334,668
   
$
(25,163
)
 
$
309,505
 
                                                 
Operating Income
                                               
                                                 
Flavors & Extracts
 
$
21,942
   
$
491
   
$
22,433
   
$
23,507
   
$
(3,214
)
 
$
20,293
 
Color
   
24,113
     
27
     
24,140
     
20,548
     
(158
)
   
20,390
 
Asia Pacific
   
7,184
     
-
     
7,184
     
6,044
     
(43
)
   
6,001
 
Corporate & Other
   
(12,819
)
   
752
     
(12,067
)
   
(15,284
)
   
5,395
     
(9,889
)
                                                 
Consolidated
 
$
40,420
   
$
1,270
   
$
41,690
   
$
34,815
   
$
1,980
   
$
36,795
 
                                                 
Results by Segment
 
Year Ended December 31,
 
                   
Adjusted
                   
Adjusted
 
Revenue
   
2021
   
Adjustments (1)
     
2021
     
2020
   
Adjustments (1)
     
2020
 
                                                 
Flavors & Extracts
 
$
739,427
   
$
(27,837
)
 
$
711,590
   
$
742,035
   
$
(99,543
)
 
$
642,492
 
Color
   
545,270
     
(2,080
)
   
543,190
     
501,018
     
(14,008
)
   
487,010
 
Asia Pacific
   
135,348
     
(295
)
   
135,053
     
121,227
     
(518
)
   
120,709
 
Intersegment elimination
   
(39,781
)
   
150
     
(39,631
)
   
(32,279
)
   
516
     
(31,763
)
                                                 
Consolidated
 
$
1,380,264
   
$
(30,062
)
 
$
1,350,202
   
$
1,332,001
   
$
(113,553
)
 
$
1,218,448
 
                                                 
Operating Income
                                               
                                                 
Flavors & Extracts
 
$
98,660
   
$
(2,368
)
 
$
96,292
   
$
90,974
   
$
(8,292
)
 
$
82,682
 
Color
   
103,575
     
575
     
104,150
     
96,034
     
871
     
96,905
 
Asia Pacific
   
26,330
     
(87
)
   
26,243
     
22,075
     
(159
)
   
21,916
 
Corporate & Other
   
(58,537
)
   
12,243
     
(46,294
)
   
(56,427
)
   
18,516
     
(37,911
)
                                                 
Consolidated
 
$
170,028
   
$
10,363
   
$
180,391
   
$
152,656
   
$
10,936
   
$
163,592
 

(1)
For Revenue, adjustments consist of revenues of the divested product lines. For Operating Income, adjustments consist of the results of the divested product lines, divestiture & other related costs, operational improvement plan costs and income, and the 2020 COVID-19 employee payment.
 
- MORE -

Sensient Technologies Corporation
Page 12
(In thousands, except percentages)
 
(Unaudited)
 

Reconciliation of Non-GAAP Amounts – Continued
 
The following tables summarize the percentage change in the 2021 results compared to the 2020 results for the corresponding periods.

   
Three Months Ended December 31,
 
Revenue
 
Total
   
Foreign Exchange Rates
   
Adjustments (2)
   
Adjusted Local Currency
 
Flavors & Extracts
   
(6.1%)

   
(0.7%)

   
(13.4%)

   
8.0%

Color
   
14.4%

   
(1.1%)

   
(0.3%)

   
15.8%

Asia Pacific
   
11.1%

   
(3.5%)

   
(0.4%)

   
15.0%

Total Revenue
   
1.7%

   
(1.2%)

   
(7.8%)

   
10.7%


Operating Income


Flavors & Extracts
   
(6.7%)

   
(0.7%)

   
(16.6%)

   
10.6%

Color
   
17.3%

   
(0.8%)

   
(1.0%)

   
19.1%

Asia Pacific
   
18.9%

   
(5.1%)

   
(0.9%)

   
24.9%

Corporate & Other
   
(16.1%)

   
0.0%

   
(38.2%)

   
22.1%

Total Operating Income
   
16.1%

   
(1.8%)

   
3.3%

   
14.6%

Diluted Earnings Per Share
   
10.2%

   
(1.7%)

   
(9.4%)

   
21.3%

Adjusted EBITDA
   
13.5%

   
(1.2%)

   
N/A

   
14.7%


Year Ended December 31,
 
Revenue
 
Total
   
Foreign Exchange Rates
   
Adjustments (2)
   
Adjusted Local Currency
 
Flavors & Extracts
   
(0.4%)

   
1.6%

   
(11.4%)

   
9.4%

Color
   
8.8%

   
2.1%

   
(2.7%)

   
9.4%

Asia Pacific
   
11.6%

   
1.7%

   
(0.2%)

   
10.1%

Total Revenue
   
3.6%

   
1.8%

   
(7.3%)

   
9.1%


Operating Income


Flavors & Extracts
   
8.4%

   
1.2%

   
(8.0%)

   
15.2%

Color
   
7.9%

   
2.6%

   
0.5%

   
4.8%

Asia Pacific
   
19.3%

   
(1.8%)

   
(0.5%)

   
21.6%

Corporate & Other
   
3.7%

   
0.0%

   
(18.4%)

   
22.1%

Total Operating Income
   
11.4%

   
2.1%

   
1.0%

   
8.3%

Diluted Earnings Per Share
   
8.5%

   
1.9%

   
(3.4%)

   
10.0%

Adjusted EBITDA
   
10.6%

   
2.0%

   
N/A

   
8.6%


(2)
For Revenue, adjustments consist of revenues of the divested product lines. For Operating Income, Diluted Earnings per Share, and Adjusted EBITDA, adjustments consist of the results of the divested product lines, divestiture & other related costs, operational improvement plan costs and income, and the 2020 COVID-19 employee payment.

The following table summarizes the reconciliation between Operating Income (GAAP) and Adjusted EBITDA for the three and twelve months ended December 31, 2021 and 2020.
 
   
Three Months Ended December 31,
   
Year Ended December 31,


2021
   
2020
   
% Change
   
2021
   
2020
   
% Change
 
Operating income (GAAP)
 
$
40,420
   
$
34,815
     
16.1%

 
$
170,028
   
$
152,656
     
11.4%

Depreciation and amortization
   
13,223
     
12,810
             
52,051
     
49,641
         
Depreciation and amortization, divested product lines
   
-
     
(48
)
           
(146
)
   
(193
)
       
Share-based compensation expense
   
3,142
     
1,591
             
9,573
     
5,608
         
Divestiture & other related costs, before tax
   
637
     
1,675
             
14,138
     
12,155
         
Results of operations of the divested product lines, before tax
   
518
     
(3,415
)
           
(1,880
)
   
(7,580
)
       
Operational improvement plan costs (income), before tax
   
115
     
698
             
(1,895
)
   
3,339
         
COVID-19 employee payment, before tax
   
-
     
3,022
             
-
     
3,022
         
Adjusted EBITDA
 
$
58,055
   
$
51,148
     
13.5%

 
$
241,869
   
$
218,648
     
10.6%


The following table summarizes the reconciliation between Net cash provided by operating activities (GAAP) and Free Cash Flow for the three and twelve months ended December 31, 2021 and 2020.

   
Three Months Ended December 31,
   
Year Ended December 31,
 
   
2021
   
2020
   
% Change
   
2021
   
2020
   
% Change
 
Net cash provided by operating activities (GAAP)
 
$
29,070
   
$
75,853
     
(61.7
%)
 
$
145,218
   
$
218,780
     
(33.6
%)
Capital expenditures
   
(23,180
)
   
(18,153
)
           
(60,788
)
   
(52,162
)
       
Free Cash Flow
 
$
5,890
   
$
57,700
     
(89.8
%)
 
$
84,430
   
$
166,618
     
(49.3
%)

We have included each of these non-GAAP measures in order to provide additional information regarding our underlying operating results and comparable period-over-period performance. Such information is supplemental to information presented in accordance with GAAP and is not intended to represent a presentation in accordance with GAAP. These non-GAAP measures should not be considered in isolation. Rather, they should be considered together with GAAP measures and the rest of the information included in this release and our SEC filings. Management internally reviews each of these non-GAAP measures to evaluate performance on a comparative period-to-period basis and to gain additional insight into underlying operating and performance trends, and we believe the information can be beneficial to investors for the same purposes. These non-GAAP measures may not be comparable to similarly titled measures used by other companies.


Exhibit 99.2

 Fourth Quarter 2021 Investor Presentation 
 

             FORWARD-LOOKING STATEMENTS  2  This document contains statements that may constitute “forward-looking statements” within the meaning of Federal securities laws including under “2022 Financial Outlook” in this presentation. Such forward-looking statements are not guarantees of future performance and involve known and unknown risks, uncertainties and other factors concerning the Company’s operations and business environment. Important factors that could cause actual results to differ materially from those suggested by these forward-looking statements and that could adversely affect the Company’s future financial performance include the following: the impact and uncertainty created by the ongoing COVID-19 pandemic, including, but not limited to, its effects on our employees, facilities, customers, and suppliers, the availability and cost of raw materials, energy, and other supplies, the availability and cost of labor, logistics, and transportation, governmental regulations and restrictions, and general economic conditions, including inflation; the pace and nature of new product introductions by the Company and the Company’s customers; the Company’s ability to anticipate and respond to changing consumer preferences and changing technologies; the Company’s ability to successfully implement its growth strategies; the outcome of the Company’s various productivity-improvement and cost-reduction efforts, acquisition and divestiture activities, and operational improvement plan; the effectiveness of the Company’s past restructuring activities; changes in costs of raw materials, including energy; industry, regulatory, legal, and economic factors related to the Company’s domestic and international business; the effects of tariffs, trade barriers, and disputes; growth in markets for products in which the Company competes; industry and customer acceptance of price increases; actions by competitors; currency exchange rate fluctuations; and other factors included in “Risk Factors” in the Company's Annual Report on Form 10-K for the year ended December 31, 2020, and in other documents that the Company files with the SEC. The risks and uncertainties identified above are not the only risks the Company faces. Additional risks and uncertainties not presently known to the Company or that it currently believes to be immaterial also may adversely affect the Company. Should any known or unknown risks and uncertainties develop into actual events, these developments could have material adverse effects on our business, financial condition, and results of operations. This presentation contains time-sensitive information that reflects management’s best analysis only as of the date of this presentation. Except to the extent required by applicable laws, the Company does not undertake to publicly update or revise its forward-looking statements even if experience or future changes make it clear that any projected results expressed or implied herein will not be realized. 
 

 NON-GAAP FINANCIAL MEASURES  2  Within this document, the Company reports certain non-GAAP financial measures, including: (1) adjusted revenue, adjusted operating income, adjusted net earnings, adjusted EBITDA, and adjusted diluted earnings per share (which exclude divestiture & other related costs, the results of the divested product lines, restructuring and other costs, which include operational improvement plan costs and income, and the 2020 one-time COVID-19 employee payment) (2) adjusted results by segment (which exclude divestiture & other related costs, operational improvement plan costs and income, and the results of the divested operations), (3) percentage changes in revenue, operating income, diluted earnings per share, and EBITDA on an adjusted local currency basis (which eliminate the effects that result from translating its international operations into U.S. dollars, divestiture & other related costs, the results of the divested product lines, restructuring and other costs, which include operational improvement plan costs, and the 2020 one-time COVID-19 employee payment), and (4) adjusted EBITDA (which excludes depreciation and amortization expense, non-cash share based compensation expense, the results of the divested product lines, the divestiture & other related costs, operational improvement plan costs and income, and the 2020 one-time COVID-19 employee payment). The Company has included each of these non-GAAP measures in order to provide additional information regarding the underlying operating results and comparable period- over-period performance. Such information is supplemental to information presented in accordance with GAAP and is not intended to represent a presentation in accordance with GAAP. These non-GAAP measures should not be considered in isolation. Rather, they should be considered together with GAAP measures and the rest of the information included in this presentation and the Company’s SEC filings. Management internally reviews each of these non-GAAP measures to evaluate performance on a comparative period-to-period basis and to gain additional insight into underlying operating and performance trends. The Company believes this information can be beneficial to investors for these same purposes. These non-GAAP measures may not be comparable to similarly titled measures used by other companies. Refer to “Non-GAAPFinancial Measures” at the end of this presentation for reconciliations and additional information. 
 

     Sensient Overview  2  Provider of customized solutions for food and beverage, pharmaceutical, and personal care customersGlobal market leader offering an extensive portfolio of natural flavor and color technology platforms and solutionsExceptional innovation & applications expertise with unique ability to service global, regional, and local customers 
 

     Innovative Technologies Creating Unique Solutions  2  Applications expertise and solutions-based sellingHigh impact relative to costTechnically-driven products that are difficult to replace Strong consumer trendsOpportunities to grow organically and through M&A 
 

     Focusing our portfolio and strengthening our commitment to the end markets  2  Investing in core focus areas of Flavors and Extracts, Natural Ingredients, Food and Pharmaceutical Colors, and Personal CareDivested non-core product lines (inks, fragrances, and yogurt fruitprep product lines) in 2020 and 2021Expanded flavor portfolio and strengthened technical solutions capabilities through the acquisition of Flavor Solutions, Inc. on July 15, 2021 
 

     Natural solutions provider focused on consistent and sustainable supply chain  2  Provider of natural solutions to support health & wellness and clean label consumer trendsRobust agronomy program ensures responsible procurement and traceability of sustainable ingredientsCommitted to delivering safe, authentic, high-quality natural products through Sensient’s CertasureTM program 
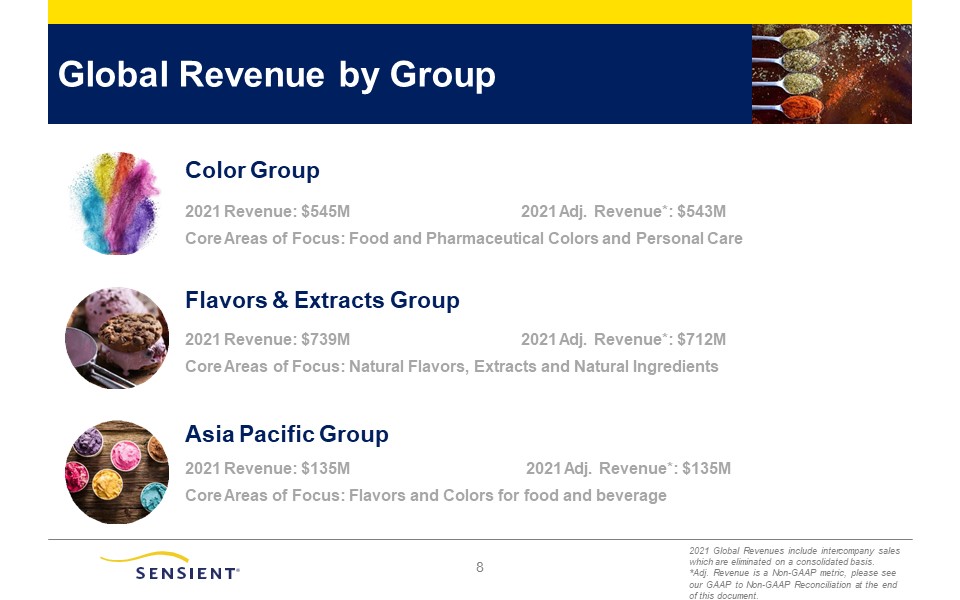
 

             8    Color Group2021 Revenue: $545M 2021 Adj. Revenue*: $543M Core Areas of Focus: Food and Pharmaceutical Colors and Personal CareFlavors & Extracts Group2021 Revenue: $739M 2021 Adj. Revenue*: $712M Core Areas of Focus: Natural Flavors, Extracts and Natural IngredientsAsia Pacific Group2021 Revenue: $135M 2021 Adj. Revenue*: $135M Core Areas of Focus: Flavors and Colors for food and beverage  Global Revenue by Group  2021 Global Revenues include intercompany sales which are eliminated on a consolidated basis.*Adj. Revenue is a Non-GAAP metric, please see our GAAP to Non-GAAP Reconciliation at the end of this document. 
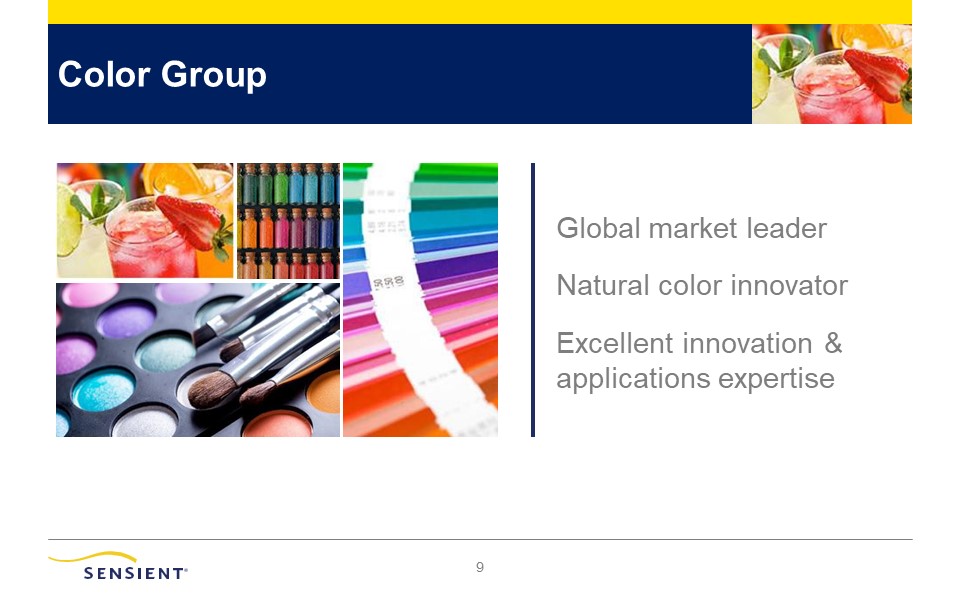
 

             9  Global market leaderNatural color innovatorExcellent innovation & applications expertise      Color Group 
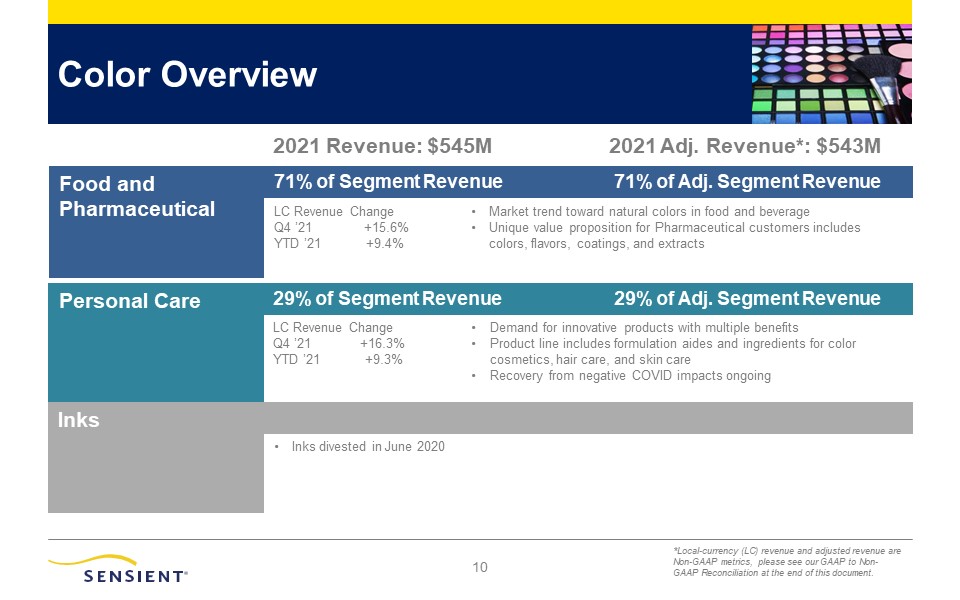
 

 10    Color Overview  Food and Pharmaceutical  71% of Segment Revenue 71% of Adj. Segment Revenue      LC Revenue ChangeQ4 ’21 +15.6%YTD ’21 +9.4%  Market trend toward natural colors in food and beverageUnique value proposition for Pharmaceutical customers includescolors, flavors, coatings, and extracts  Personal Care  29% of Segment Revenue 29% of Adj. Segment Revenue      LC Revenue ChangeQ4 ’21 +16.3%YTD ’21 +9.3%  Demand for innovative products with multiple benefitsProduct line includes formulation aides and ingredients for colorcosmetics, hair care, and skin careRecovery from negative COVID impacts ongoing  Inks        Inks divested in June 2020    2021 Revenue: $545M  2021 Adj. Revenue*: $543M  *Local-currency (LC) revenue and adjusted revenue are Non-GAAP metrics, please see our GAAP to Non- GAAP Reconciliation at the end of this document. 
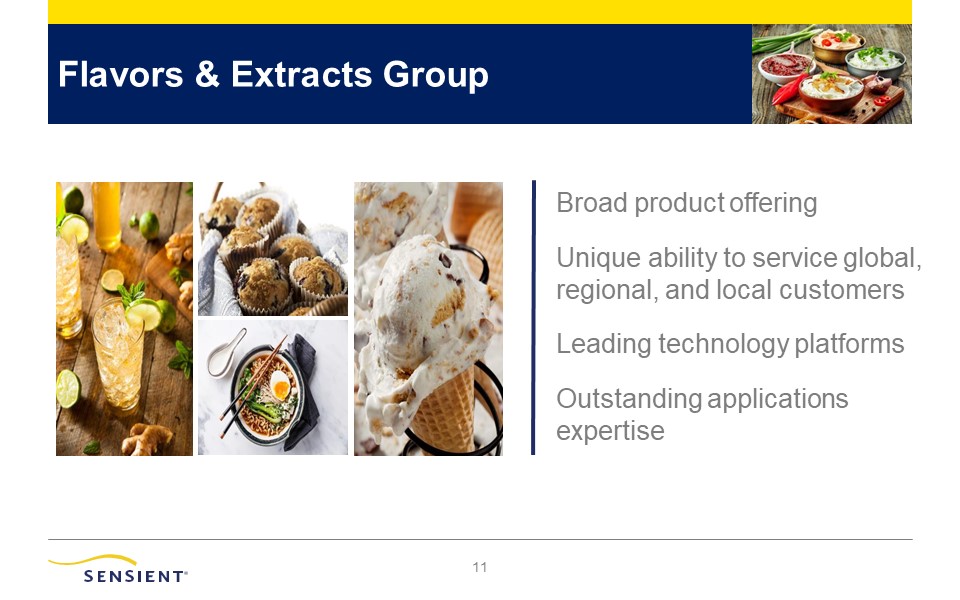
 

 11    Flavors & Extracts Group  Broad product offeringUnique ability to service global, regional, and local customersLeading technology platformsOutstanding applications expertise   
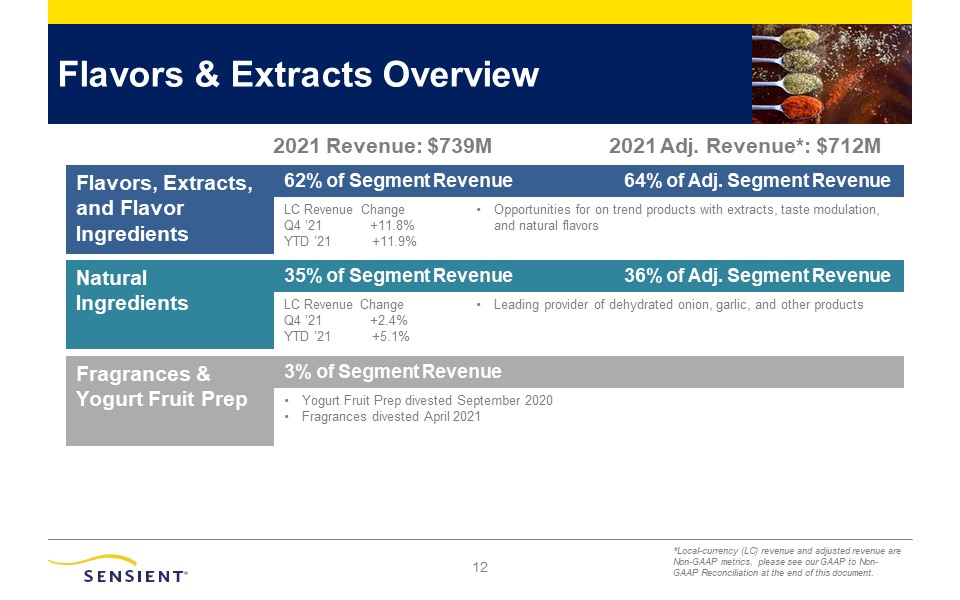
 

 12    Flavors & Extracts Overview  Flavors, Extracts, and Flavor Ingredients  62% of Segment Revenue 64% of Adj. Segment Revenue      LC Revenue Change Q4 ’21 +11.8%YTD ’21 +11.9%  Opportunities for on trend products with extracts, taste modulation, and natural flavors  NaturalIngredients  35% of Segment Revenue 36% of Adj. Segment Revenue      LC Revenue ChangeQ4 ’21 +2.4%YTD ’21 +5.1%  Leading provider of dehydrated onion, garlic, and other products  Fragrances & Yogurt Fruit Prep  3% of Segment Revenue    Yogurt Fruit Prep divested September 2020Fragrances divested April 2021  2021 Revenue: $739M  2021 Adj. Revenue*: $712M  *Local-currency (LC) revenue and adjusted revenue are Non-GAAP metrics, please see our GAAP to Non- GAAP Reconciliation at the end of this document. 
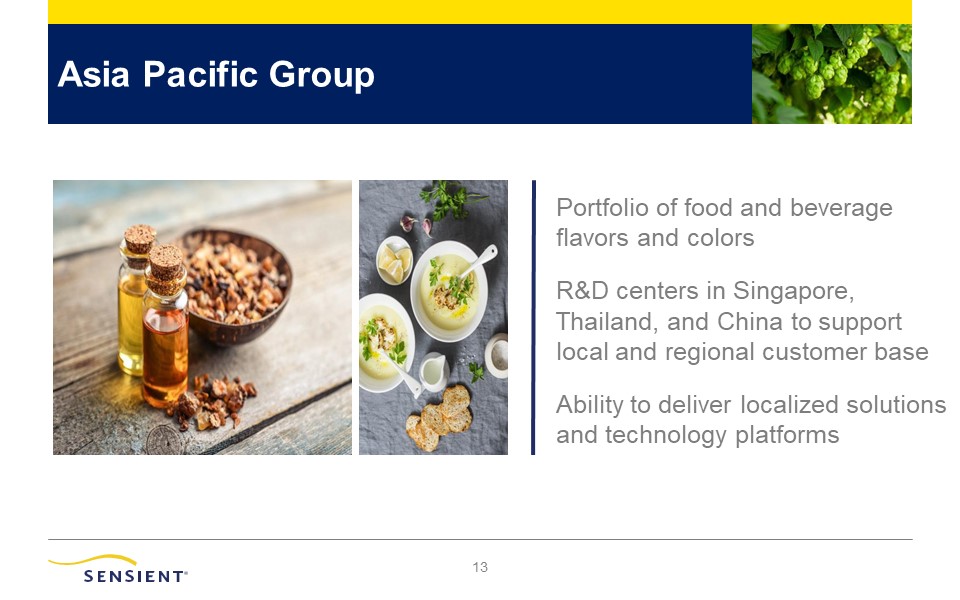
 

 13    Asia Pacific Group  Portfolio of food and beverage flavors and colorsR&D centers in Singapore, Thailand, and China to support local and regional customer baseAbility to deliver localized solutionsand technology platforms   
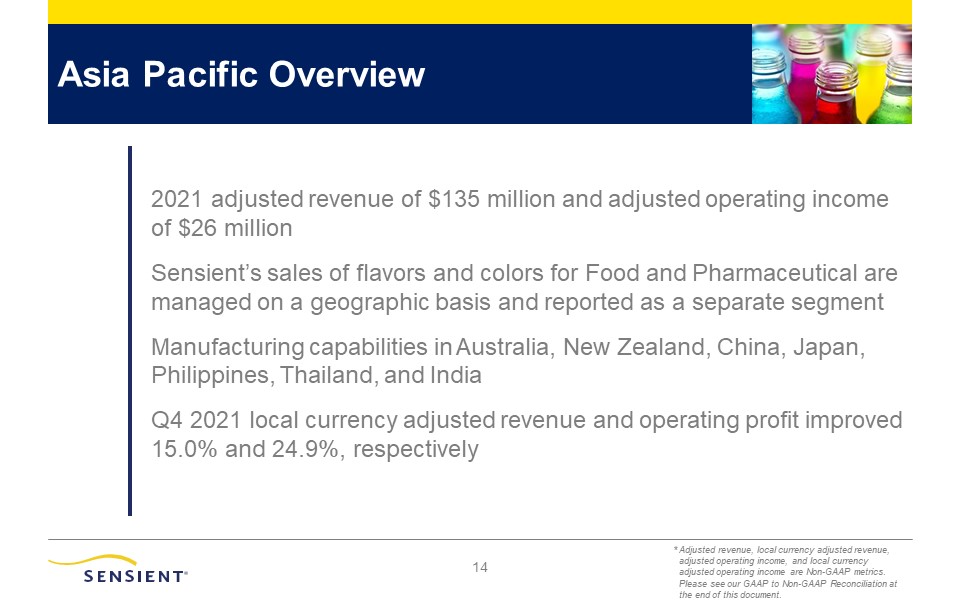
 

 14      2021 adjusted revenue of $135 million and adjusted operating income of $26 millionSensient’s sales of flavors and colors for Food and Pharmaceutical are managed on a geographic basis and reported as a separate segmentManufacturing capabilities in Australia, New Zealand, China, Japan, Philippines, Thailand, and IndiaQ4 2021 local currency adjusted revenue and operating profit improved15.0% and 24.9%, respectively  * Adjusted revenue, local currency adjusted revenue, adjusted operating income, and local currency adjusted operating income are Non-GAAP metrics. Please see our GAAP to Non-GAAP Reconciliation at the end of this document.  Asia Pacific Overview 
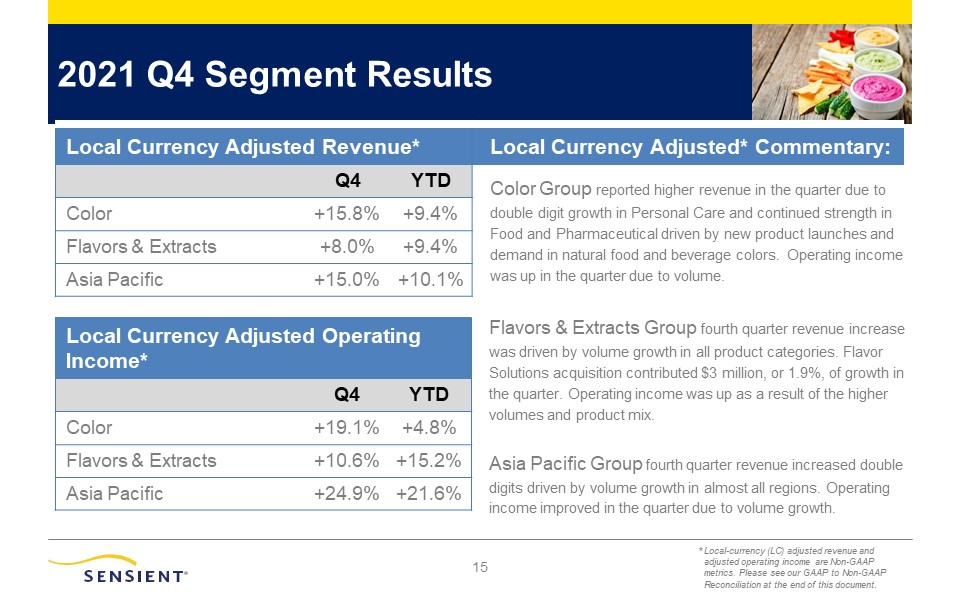
 

 15    2021 Q4 Segment Results  Local Currency Adjusted Revenue*      Local Currency Adjusted* Commentary:    Q4  YTD  Color Group reported higher revenue in the quarter due to double digit growth in Personal Care and continued strength in Food and Pharmaceutical driven by new product launches and demand in natural food and beverage colors. Operating income was up in the quarter due to volume.  Color  +15.8%  +9.4%    Flavors & Extracts  +8.0%  +9.4%    Asia Pacific  +15.0%  +10.1%    Flavors & Extracts Group fourth quarter revenue increase was driven by volume growth in all product categories. Flavor Solutions acquisition contributed $3 million, or 1.9%, of growth in the quarter. Operating income was up as a result of the higher volumes and product mix.Asia Pacific Group fourth quarter revenue increased double digits driven by volume growth in almost all regions. Operating income improved in the quarter due to volume growth.  Local Currency Adjusted OperatingIncome*        Q4  YTD  Color  +19.1%  +4.8%  Flavors & Extracts  +10.6%  +15.2%  Asia Pacific  +24.9%  +21.6%  * Local-currency (LC) adjusted revenue and adjusted operating income are Non-GAAP metrics. Please see our GAAP to Non-GAAP Reconciliation at the end of this document. 
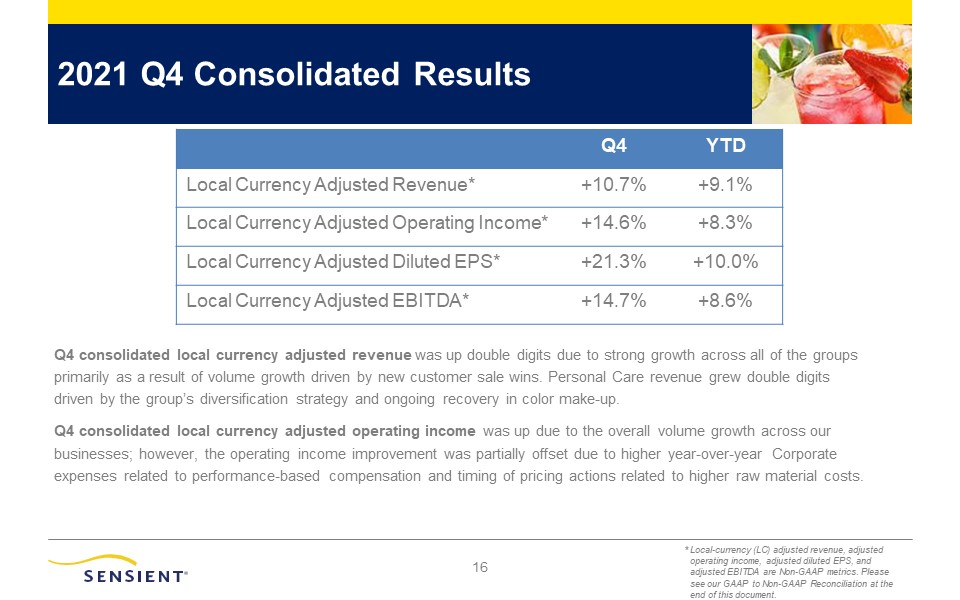
 

 16    2021 Q4 Consolidated Results    Q4  YTD  Local Currency Adjusted Revenue*  +10.7%  +9.1%  Local Currency Adjusted Operating Income*  +14.6%  +8.3%  Local Currency Adjusted Diluted EPS*  +21.3%  +10.0%  Local Currency Adjusted EBITDA*  +14.7%  +8.6%  Q4 consolidated local currency adjusted revenue was up double digits due to strong growth across all of the groups primarily as a result of volume growth driven by new customer sale wins. Personal Care revenue grew double digits driven by the group’s diversification strategy and ongoing recovery in color make-up.Q4 consolidated local currency adjusted operating income was up due to the overall volume growth across our businesses; however, the operating income improvement was partially offset due to higher year-over-year Corporate expenses related to performance-based compensation and timing of pricing actions related to higher raw material costs.  * Local-currency (LC) adjusted revenue, adjusted operating income, adjusted diluted EPS, and adjusted EBITDA are Non-GAAP metrics. Please see our GAAP to Non-GAAP Reconciliation at the end of this document. 
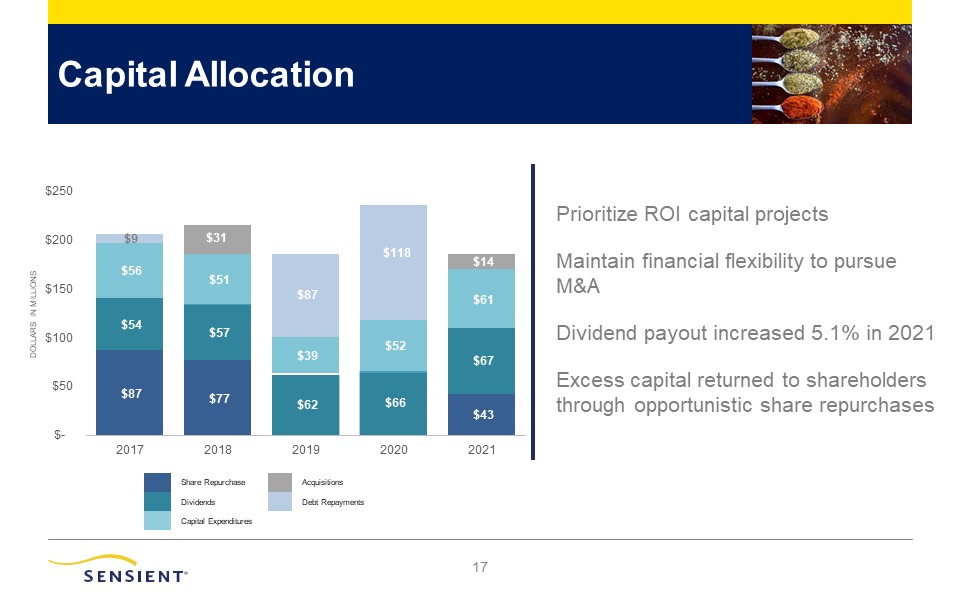
 

   Capital Allocation  Prioritize ROI capital projects  Maintain financial flexibility to pursueM&A  Dividend payout increased 5.1% in 2021  Excess capital returned to shareholdersthrough opportunistic share repurchases            $87  $77  $43  $54  $57  $62  $66  $67  $56  $51  $39  $52  $61  $31  $14  $9  $87  $118  $-  $50  $100  $150  $200  $250  2017  2018  2019  2020  2021  DOLLARS IN MILLIONS        Share Repurchase    Acquisitions  Dividends    Debt Repayments  Capital Expenditures      17 
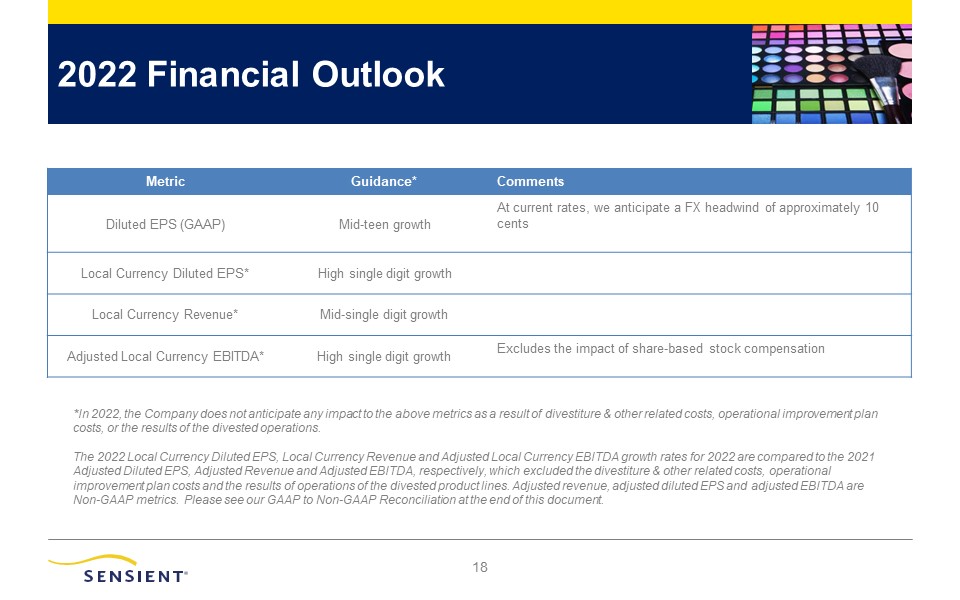
 

   2022 Financial Outlook  18  Metric  Guidance*  Comments  Diluted EPS (GAAP)  Mid-teen growth  At current rates, we anticipate a FX headwind of approximately 10 cents  Local Currency Diluted EPS*  High single digit growth    Local Currency Revenue*  Mid-single digit growth    Adjusted Local Currency EBITDA*  High single digit growth  Excludes the impact of share-based stock compensation  *In 2022, the Company does not anticipate any impact to the above metrics as a result of divestiture & other related costs, operational improvement plancosts, or the results of the divested operations.The 2022 Local Currency Diluted EPS, Local Currency Revenue and Adjusted Local Currency EBITDA growth rates for 2022 are compared to the 2021 Adjusted Diluted EPS, Adjusted Revenue and Adjusted EBITDA, respectively, which excluded the divestiture & other related costs, operational improvement plan costs and the results of operations of the divested product lines. Adjusted revenue, adjusted diluted EPS and adjusted EBITDA are Non-GAAP metrics. Please see our GAAP to Non-GAAP Reconciliation at the end of this document. 
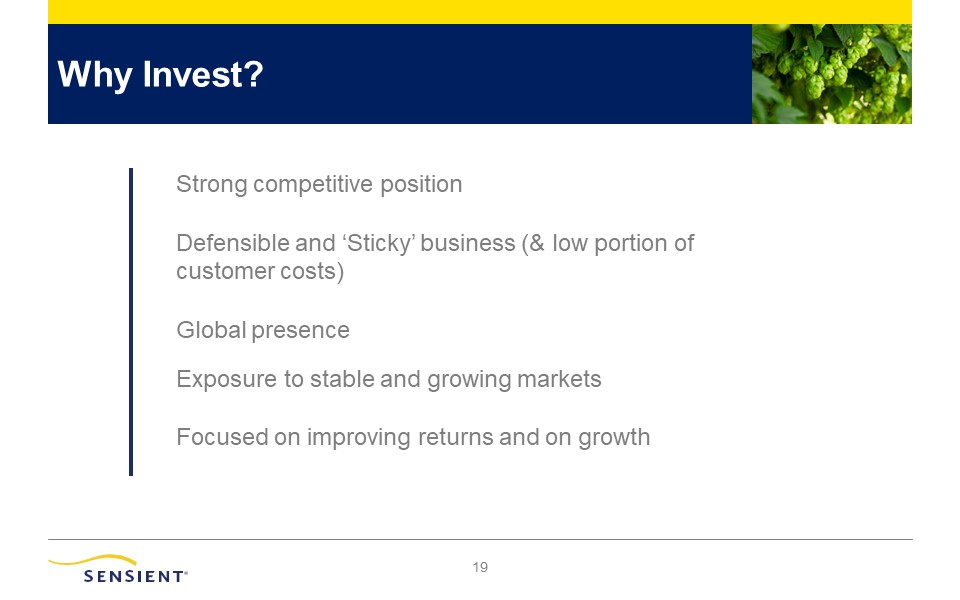
 

   Why Invest?    Strong competitive positionDefensible and ‘Sticky’ business (& low portion ofcustomer costs)Global presenceExposure to stable and growing markets Focused on improving returns and on growth  19 
 

   APPENDIX*  *Amounts in thousands, except percentages and per share amounts 
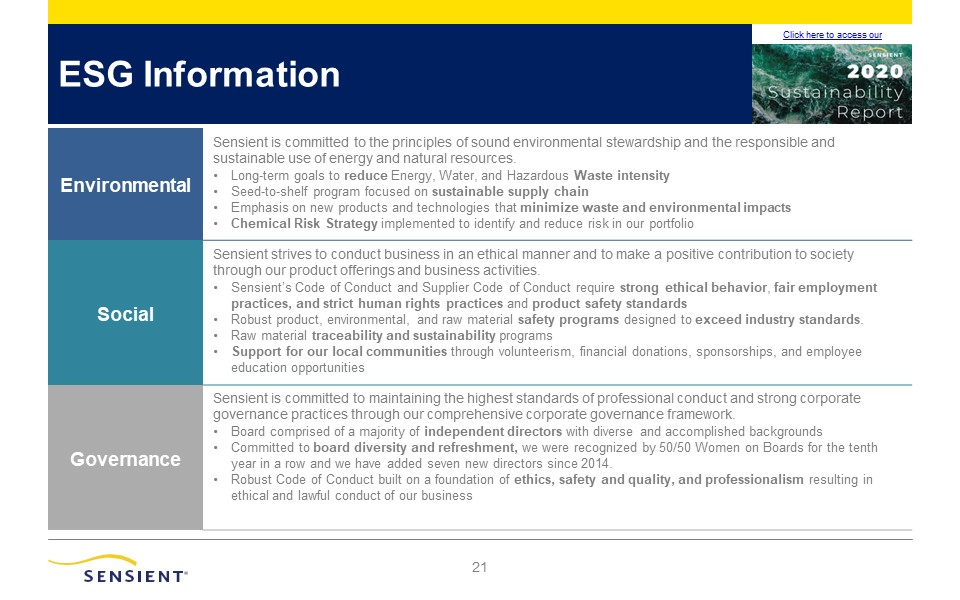
 

   ESG Information    Click here to access our  Environmental  Sensient is committed to the principles of sound environmental stewardship and the responsible and sustainable use of energy and natural resources.Long-term goals to reduce Energy, Water, and Hazardous Waste intensitySeed-to-shelf program focused on sustainable supply chainEmphasis on new products and technologies that minimize waste and environmental impactsChemical Risk Strategy implemented to identify and reduce risk in our portfolio  Social  Sensient strives to conduct business in an ethical manner and to make a positive contribution to society through our product offerings and business activities.Sensient’s Code of Conduct and Supplier Code of Conduct require strong ethical behavior, fair employment practices, and strict human rights practices and product safety standardsRobust product, environmental, and raw material safety programs designed to exceed industry standards.Raw material traceability and sustainability programsSupport for our local communities through volunteerism, financial donations, sponsorships, and employee education opportunities  Governance  Sensient is committed to maintaining the highest standards of professional conduct and strong corporategovernance practices through our comprehensive corporate governance framework.Board comprised of a majority of independent directors with diverse and accomplished backgroundsCommitted to board diversity and refreshment, we were recognized by 50/50 Women on Boards for the tenth year in a row and we have added seven new directors since 2014.Robust Code of Conduct built on a foundation of ethics, safety and quality, and professionalism resulting in ethical and lawful conduct of our business  21 
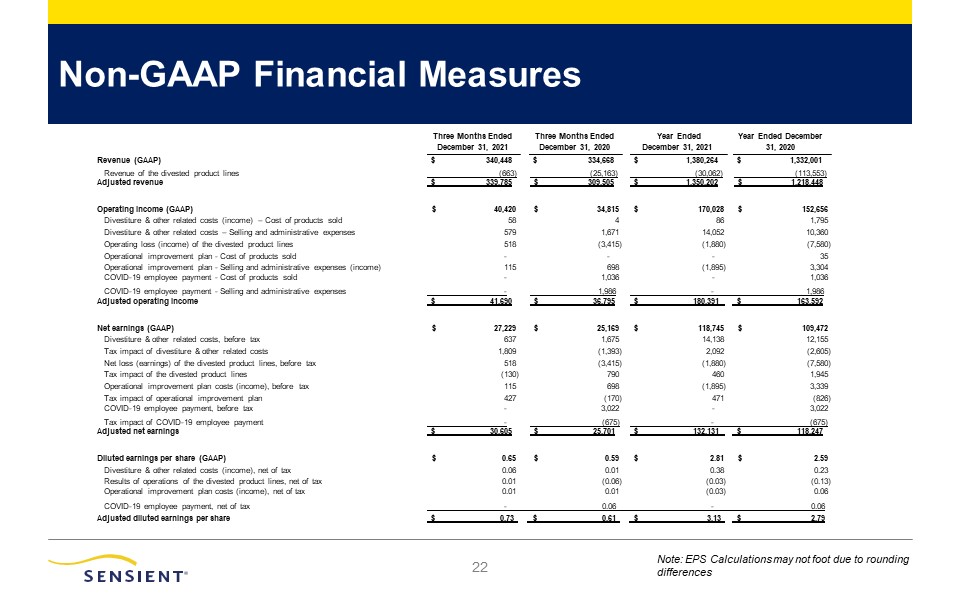
 

 22  Non-GAAP Financial Measures  Note: EPS Calculations may not foot due to rounding differences  Three Months Ended December 31, 2021$ 340,448  Year Ended December 31, 2021  Year Ended December 31, 2020$ 1,332,001  Revenue (GAAP)  1,380,264  Three Months Ended December 31, 2020$ 334,668 $  Revenue of the divested product lines   (663)     (25,163)     (30,062)     (113,553)    Adjusted revenue   $ 339,785      $ 309,505      $ 1,350,202      $ 1,218,448     Operating income (GAAP)  $  40,420  $  34,815  $  170,028  $  152,656  Divestiture & other related costs (income) – Cost of products sold    58    4    86    1,795  Divestiture & other related costs – Selling and administrative expenses    579    1,671    14,052    10,360  Operating loss (income) of the divested product lines    518    (3,415)    (1,880)    (7,580)  Operational improvement plan - Cost of products sold    -    -    -    35  Operational improvement plan - Selling and administrative expenses (income)    115    698    (1,895)    3,304  COVID-19 employee payment - Cost of products sold    -    1,036    -    1,036  COVID-19 employee payment - Selling and administrative expenses   -      1,986      - 1,986         Adjusted operating income   $ 41,690      $ 36,795      $ 180,391 $ 163,592         Net earnings (GAAP)  $  27,229  $  25,169  $  118,745  $  109,472  Divestiture & other related costs, before tax    637    1,675    14,138    12,155  Tax impact of divestiture & other related costs    1,809    (1,393)    2,092    (2,605)  Net loss (earnings) of the divested product lines, before tax    518    (3,415)    (1,880)    (7,580)  Tax impact of the divested product lines    (130)    790    460    1,945  Operational improvement plan costs (income), before tax    115    698    (1,895)    3,339  Tax impact of operational improvement plan    427    (170)    471    (826)  COVID-19 employee payment, before tax    -    3,022    -    3,022  Tax impact of COVID-19 employee payment   -      (675)     - (675)        Adjusted net earnings   $ 30,605      $ 25,701      $ 132,131 $ 118,247         Diluted earnings per share (GAAP)  $  0.65  $  0.59  $  2.81  $  2.59  Divestiture & other related costs (income), net of tax    0.06    0.01    0.38    0.23  Results of operations of the divested product lines, net of tax    0.01    (0.06)    (0.03)    (0.13)  Operational improvement plan costs (income), net of tax    0.01    0.01    (0.03)    0.06  COVID-19 employee payment, net of taxAdjusted diluted earnings per share   - 0.06 - 0.06 $ 0.73 $ 0.61 $ 3.13 $ 2.79                  
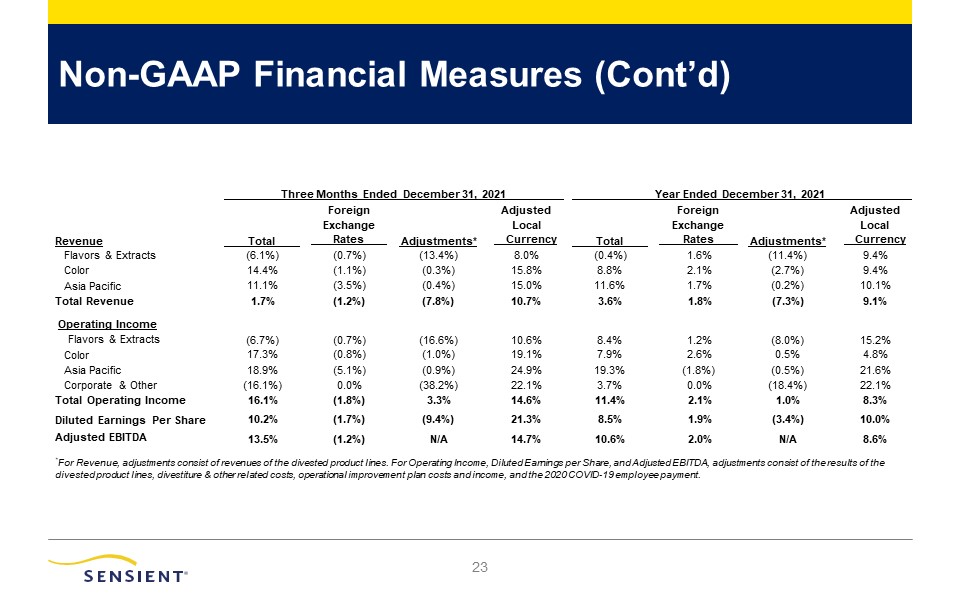
 

 Non-GAAP Financial Measures (Cont’d)  23  Revenue   Total   ForeignExchange Rates    Adjustments*  AdjustedLocal Currency    Total   ForeignExchange Rates    Adjustments*  AdjustedLocal Currency   Flavors & Extracts  (6.1%)  (0.7%)  (13.4%)  8.0%  (0.4%)  1.6%  (11.4%)  9.4%  Color  14.4%  (1.1%)  (0.3%)  15.8%  8.8%  2.1%  (2.7%)  9.4%  Asia Pacific  11.1%  (3.5%)  (0.4%)  15.0%  11.6%  1.7%  (0.2%)  10.1%  Total Revenue  1.7%  (1.2%)  (7.8%)  10.7%  3.6%  1.8%  (7.3%)  9.1%  Operating IncomeFlavors & Extracts  (6.7%)  (0.7%)  (16.6%)  10.6%  8.4%  1.2%  (8.0%)  15.2%  Color  17.3%  (0.8%)  (1.0%)  19.1%  7.9%  2.6%  0.5%  4.8%  Asia Pacific  18.9%  (5.1%)  (0.9%)  24.9%  19.3%  (1.8%)  (0.5%)  21.6%  Corporate & Other  (16.1%)  0.0%  (38.2%)  22.1%  3.7%  0.0%  (18.4%)  22.1%  Total Operating Income  16.1%  (1.8%)  3.3%  14.6%  11.4%  2.1%  1.0%  8.3%  Diluted Earnings Per Share  10.2%  (1.7%)  (9.4%)  21.3%  8.5%  1.9%  (3.4%)  10.0%  Adjusted EBITDA  13.5%  (1.2%)  N/A  14.7%  10.6%  2.0%  N/A  8.6%  * For Revenue, adjustments consist of revenues of the divested product lines. For Operating Income, Diluted Earnings per Share, and Adjusted EBITDA, adjustments consist of the results of the divested product lines, divestiture & other related costs, operational improvement plan costs and income, and the 2020 COVID-19 employee payment.   Three Months Ended December 31, 2021 Year Ended December 31, 2021  
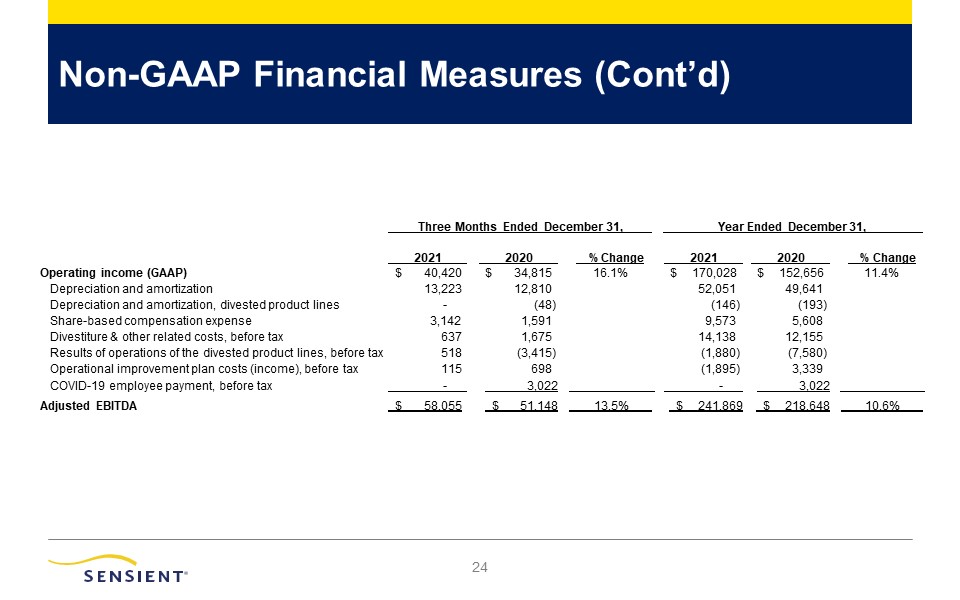
 

 Non-GAAP Financial Measures (Cont’d)  24     2021    2020    % Change    2021    2020    % Change   Operating income (GAAP)  $ 40,420  $ 34,815  16.1%  $ 170,028  $ 152,656  11.4%  Depreciation and amortization  13,223  12,810    52,051  49,641    Depreciation and amortization, divested product lines  -  (48)    (146)  (193)    Share-based compensation expense  3,142  1,591    9,573  5,608    Divestiture & other related costs, before tax  637  1,675    14,138  12,155    Results of operations of the divested product lines, before tax  518  (3,415)    (1,880)  (7,580)    Operational improvement plan costs (income), before tax  115  698    (1,895)  3,339    COVID-19 employee payment, before tax   -    3,022       -    3,022      Adjusted EBITDA   $ 58,055    $ 51,148    13.5%    $ 241,869    $ 218,648    10.6%    Three Months Ended December 31, Year Ended December 31,  
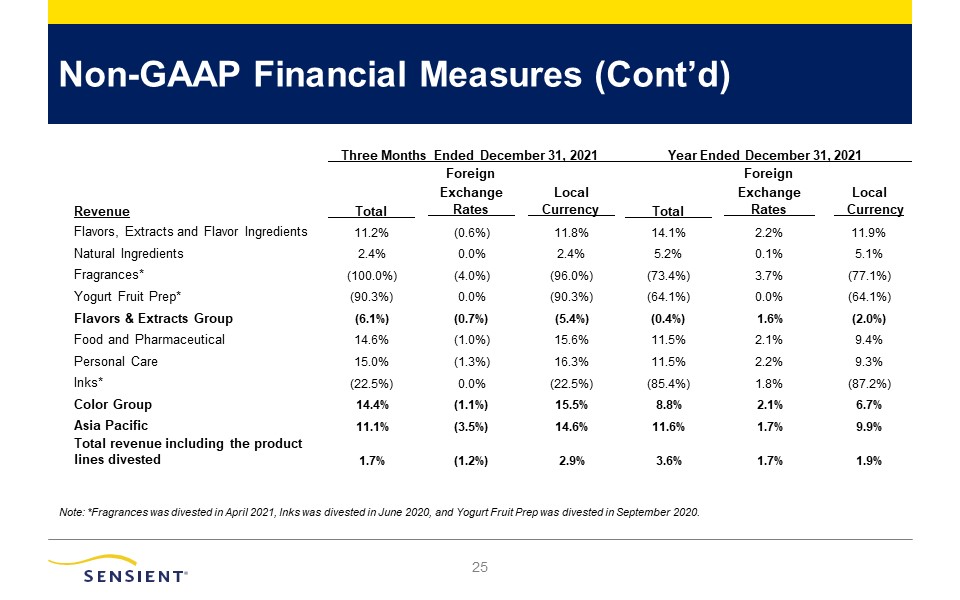
 

 Non-GAAP Financial Measures (Cont’d)  25  Note: *Fragrances was divested in April 2021, Inks was divested in June 2020, and Yogurt Fruit Prep was divested in September 2020.  Revenue   Total   Exchange Rates   Local Currency    Total   Exchange Rates   Local Currency   Flavors, Extracts and Flavor Ingredients  11.2%  (0.6%)  11.8%  14.1%  2.2%  11.9%  Natural Ingredients  2.4%  0.0%  2.4%  5.2%  0.1%  5.1%  Fragrances*  (100.0%)  (4.0%)  (96.0%)  (73.4%)  3.7%  (77.1%)  Yogurt Fruit Prep*  (90.3%)  0.0%  (90.3%)  (64.1%)  0.0%  (64.1%)  Flavors & Extracts Group  (6.1%)  (0.7%)  (5.4%)  (0.4%)  1.6%  (2.0%)  Food and Pharmaceutical  14.6%  (1.0%)  15.6%  11.5%  2.1%  9.4%  Personal Care  15.0%  (1.3%)  16.3%  11.5%  2.2%  9.3%  Inks*  (22.5%)  0.0%  (22.5%)  (85.4%)  1.8%  (87.2%)  Color Group  14.4%  (1.1%)  15.5%  8.8%  2.1%  6.7%  Asia Pacific  11.1%  (3.5%)  14.6%  11.6%  1.7%  9.9%  Total revenue including the productlines divested  1.7%  (1.2%)  2.9%  3.6%  1.7%  1.9%   Three Months Ended December 31, 2021 Year Ended December 31, 2021 Foreign Foreign 
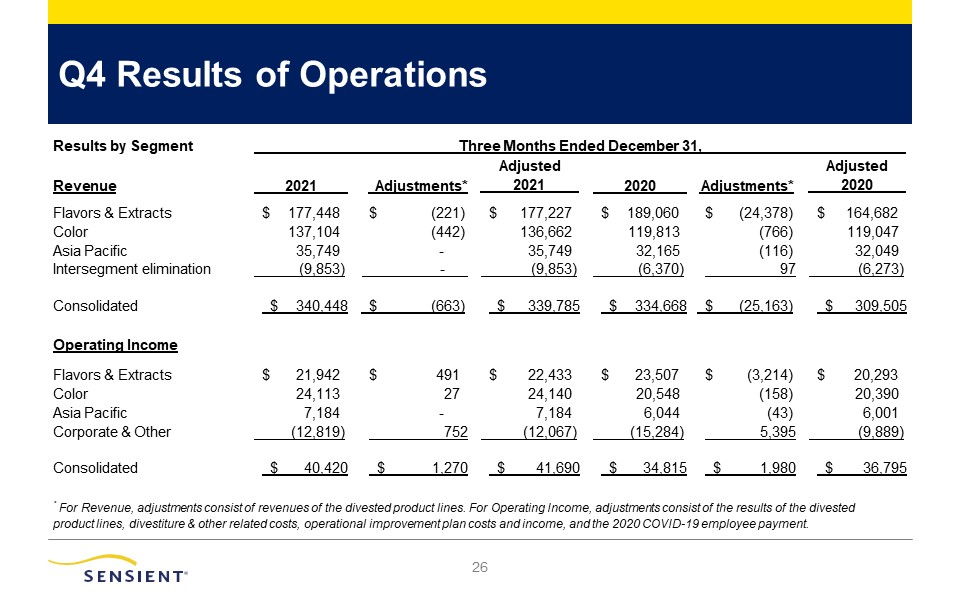
 

 Q4 Results of Operations  26  Results by Segment Three Months Ended December 31,   Revenue   2021    Adjustments*   Adjusted 2021    2020    Adjustments*  Adjusted 2020   Flavors & Extracts  $ 177,448  $ (221)  $ 177,227  $ 189,060  $ (24,378)  $ 164,682  Color  137,104  (442)  136,662  119,813  (766)  119,047  Asia Pacific  35,749  -  35,749  32,165  (116)  32,049  Intersegment elimination   (9,853)   -    (9,853)   (6,370)   97    (6,273)  Consolidated   $ 340,448    $ (663)   $ 339,785    $ 334,668    $ (25,163)   $ 309,505   Operating Income              Flavors & Extracts  $ 21,942  $ 491  $ 22,433  $ 23,507  $ (3,214)  $ 20,293  Color  24,113  27  24,140  20,548  (158)  20,390  Asia Pacific  7,184  -  7,184  6,044  (43)  6,001  Corporate & Other   (12,819)   752    (12,067)   (15,284)   5,395    (9,889)  Consolidated   $ 40,420    $ 1,270    $ 41,690    $ 34,815    $ 1,980    $ 36,795   * For Revenue, adjustments consist of revenues of the divested product lines. For Operating Income, adjustments consist of the results of the divested product lines, divestiture & other related costs, operational improvement plan costs and income, and the 2020 COVID-19 employee payment. 
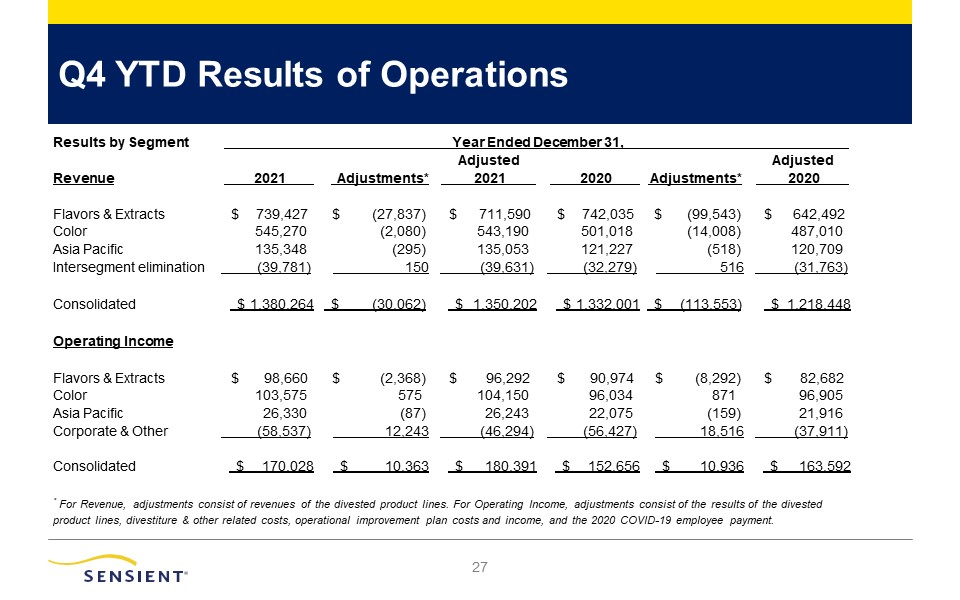
 

 Q4 YTD Results of Operations  27  Results by Segment Year Ended December 31,   Revenue   2021    Adjustments*   Adjusted 2021    2020    Adjustments*  Adjusted 2020   Flavors & Extracts  $ 739,427  $ (27,837)  $ 711,590  $ 742,035  $ (99,543)  $ 642,492  Color  545,270  (2,080)  543,190  501,018  (14,008)  487,010  Asia Pacific  135,348  (295)  135,053  121,227  (518)  120,709  Intersegment elimination   (39,781)   150    (39,631)   (32,279)   516    (31,763)  Consolidated   $ 1,380,264    $ (30,062)   $ 1,350,202    $ 1,332,001    $ (113,553)   $ 1,218,448   Operating Income              Flavors & Extracts  $ 98,660  $ (2,368)  $ 96,292  $ 90,974  $ (8,292)  $ 82,682  Color  103,575  575  104,150  96,034  871  96,905  Asia Pacific  26,330  (87)  26,243  22,075  (159)  21,916  Corporate & Other   (58,537)   12,243    (46,294)   (56,427)   18,516    (37,911)  Consolidated   $ 170,028    $ 10,363    $ 180,391    $ 152,656    $ 10,936    $ 163,592   * For Revenue, adjustments consist of revenues of the divested product lines. For Operating Income, adjustments consist of the results of the divested product lines, divestiture & other related costs, operational improvement plan costs and income, and the 2020 COVID-19 employee payment. 
 

                   28