Exhibit 99.2

Second Quarter 2023 Investor Presentation
FORWARD-LOOKING STATEMENTS 2 This document contains statements that may
constitute “forward-looking statements” within the meaning of Federal securities laws including under “2023 Financial Outlook” in this presentation. Such forward-looking statements are not guarantees of future performance and involve known
and unknown risks, uncertainties and other factors concerning the Company’s operations and business environment. Important factors that could cause actual results to differ materially from those suggested by these forward-looking statements
and that could adversely affect the Company’s future financial performance include the following: the Company’s ability to manage economic and capital market conditions and the impact of recessions and economic downturns; the impact of
macroeconomic and geopolitical volatility, including inflation and shortages impacting the availability and cost of raw materials, energy, and other supplies; the availability and cost of labor, logistics, and transportation; the impact and
uncertainty created by the COVID-19 pandemic and efforts to manage it on the global economy, including, but not limited to, its effects on our employees, facilities, customers, and suppliers, governmental regulations and restrictions, and
general economic conditions; the uncertain impacts of the ongoing conflict between Russia and Ukraine on our supply chain, input costs, including energy and transportation, and on general economic conditions; the pace and nature of new
product introductions by the Company and the Company’s customers; the Company’s ability to anticipate and respond to changing consumer preferences and changing technologies; the Company’s ability to successfully implement its growth
strategies; the outcome of the Company’s various productivity-improvement and cost-reduction efforts, acquisition and divestiture activities, and operational improvement plan; industry, regulatory, legal, and economic factors related to the
Company’s domestic and international business; the effects of tariffs, trade barriers, and disputes; growth in markets for products in which the Company competes; industry and customer acceptance of price increases; actions by competitors;
currency exchange rate fluctuations; and other factors included in “Risk Factors” in the Company's Annual Report on Form 10-K for the year ended December 31, 2022, and in other documents that the Company files with the SEC. The risks and
uncertainties identified above are not the only risks the Company faces. Additional risks and uncertainties not presently known to the Company or that it currently believes to be immaterial also may adversely affect the Company. Should any
known or unknown risks and uncertainties develop into actual events, these developments could have material adverse effects on our business, financial condition, and results of operations. This presentation contains time-sensitive
information that reflects management’s best analysis only as of the date of this presentation. Except to the extent required by applicable laws, the Company does not undertake to publicly update or revise its forward-looking statements even
if experience or future changes make it clear that any projected results expressed or implied herein will not be realized.
NON-GAAP FINANCIAL MEASURES 2 Within this document, the Company reports
certain non-GAAP financial measures, including: (1) percentage changes in revenue, operating income, diluted earnings per share, and adjusted EBITDA on a local currency basis (which eliminate the effects that result from translating its
international operations into U.S. dollars), and (2) adjusted EBITDA (which excludes depreciation and amortization expense, and non-cash share based compensation expense). The Company has included each of these non-GAAP measures in order to
provide additional information regarding the underlying operating results and comparable period-over-period performance. Such information is supplemental to information presented in accordance with GAAP and is not intended to represent a
presentation in accordance with GAAP. These non-GAAP measures should not be considered in isolation. Rather, they should be considered together with GAAP measures and the rest of the information included in this presentation and the
Company’s SEC filings. Management internally reviews each of these non-GAAP measures to evaluate performance on a comparative period-to-period basis and to gain additional insight into underlying operating and performance trends. The
Company believes this information can be beneficial to investors for these same purposes. These non-GAAP measures may not be comparable to similarly titled measures used by other companies. Refer to “Non-GAAP Financial Measures” at the end
of this presentation for reconciliations and additional information.
Sensient Overview 2 Provider of customized solutions for food and beverage,
pharmaceutical, and personal care customers Global market leader offering an extensive portfolio of natural flavor and color technology platforms and solutions Exceptional innovation & applications expertise with unique ability to
service global, regional, and local customers
Innovative Technologies Creating Unique Solutions 2 Applications expertise
and solutions-based selling High impact relative to cost Technically-driven products that are difficult to replace Strong consumer trends Opportunities to grow organically and through M&A
Focusing our portfolio and strengthening our commitment to the end
markets 2 Investing in core focus areas of Flavors and Extracts, Natural Ingredients, Food and Pharmaceutical Colors, and Personal Care Divested non-core product lines (inks, fragrances, and yogurt fruit prep product lines) in 2020 and
2021 Expanded flavor portfolio and strengthened technical solutions capabilities through the acquisition of Flavor Solutions, Inc. in July 2021 Strengthened extensive natural color portfolio by acquiring Endemix, a vertically integrated
natural color and extracts company, in October 2022
Natural solutions provider focused on consistent and sustainable supply
chain 2 Provider of natural solutions to support health & wellness and clean label consumer trends Robust agronomy program ensures responsible procurement and traceability of sustainable ingredients Committed to delivering safe,
authentic, high-quality natural products through Sensient’s CertasureTM program
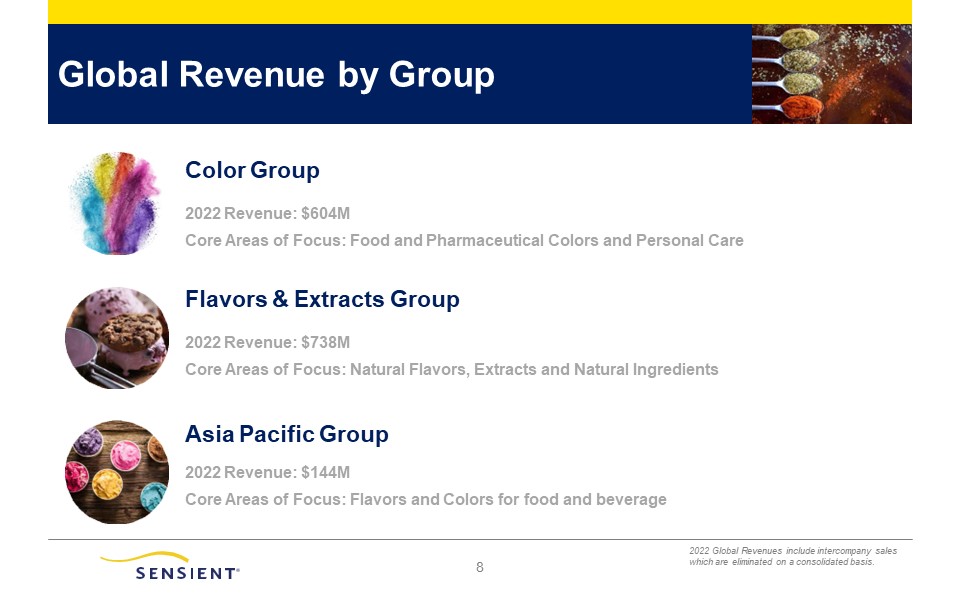
8 Color Group 2022 Revenue: $604M Core Areas of Focus: Food and
Pharmaceutical Colors and Personal Care Flavors & Extracts Group 2022 Revenue: $738M Core Areas of Focus: Natural Flavors, Extracts and Natural Ingredients Asia Pacific Group 2022 Revenue: $144M Core Areas of Focus: Flavors and
Colors for food and beverage Global Revenue by Group 2022 Global Revenues include intercompany sales which are eliminated on a consolidated basis.
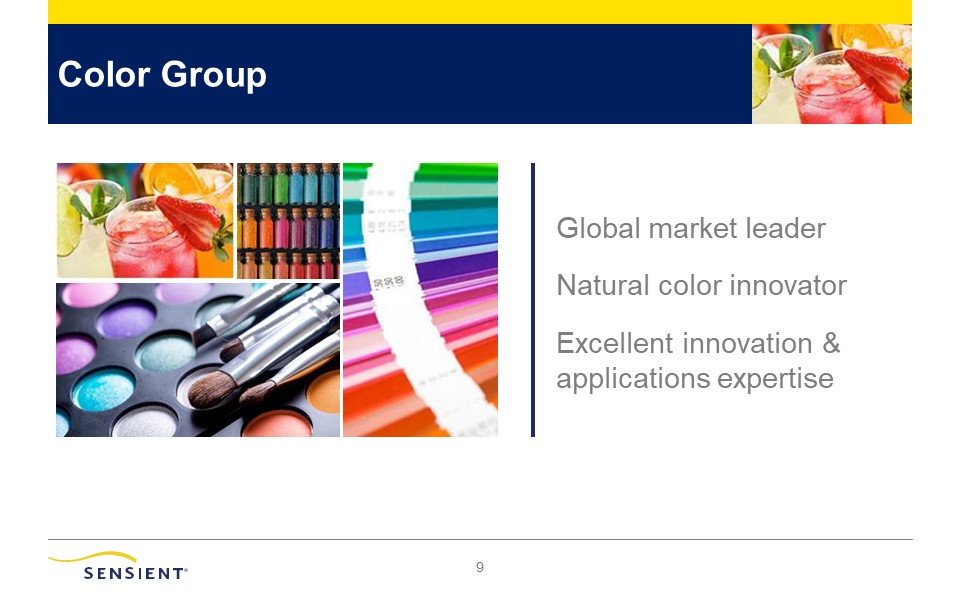
9 Global market leader Natural color innovator Excellent innovation &
applications expertise Color Group
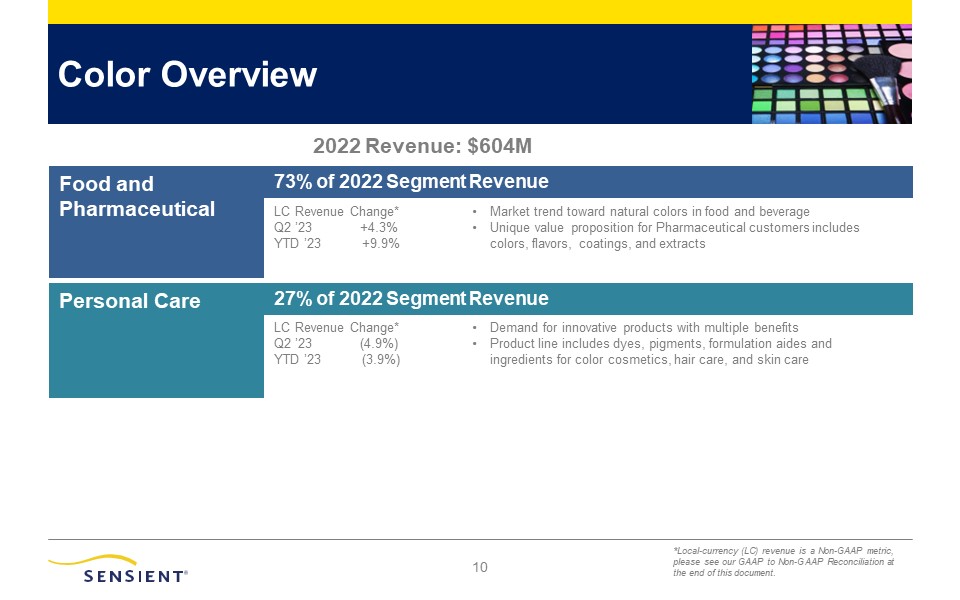
10 Color Overview Food and Pharmaceutical 73% of 2022 Segment Revenue LC
Revenue Change* Q2 ’23 +4.3% YTD ’23 +9.9% Market trend toward natural colors in food and beverage Unique value proposition for Pharmaceutical customers includes colors, flavors, coatings, and extracts Personal Care 27% of 2022
Segment Revenue LC Revenue Change* Q2 ’23 (4.9%) YTD ’23 (3.9%) Demand for innovative products with multiple benefits Product line includes dyes, pigments, formulation aides and ingredients for color cosmetics, hair care, and skin
care 2022 Revenue: $604M *Local-currency (LC) revenue is a Non-GAAP metric, please see our GAAP to Non-GAAP Reconciliation at the end of this document.
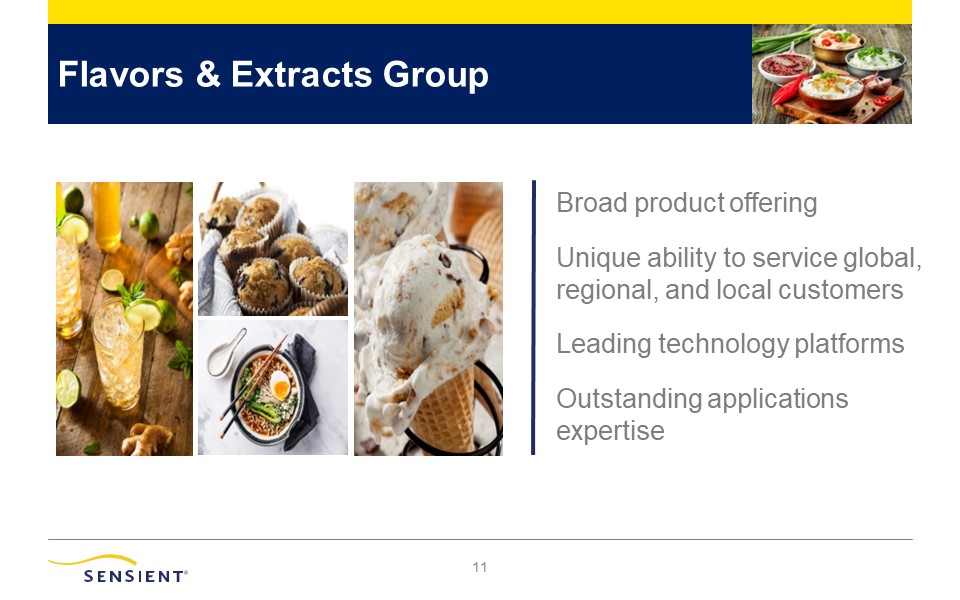
11 Flavors & Extracts Group Broad product offering Unique ability to
service global, regional, and local customers Leading technology platforms Outstanding applications expertise
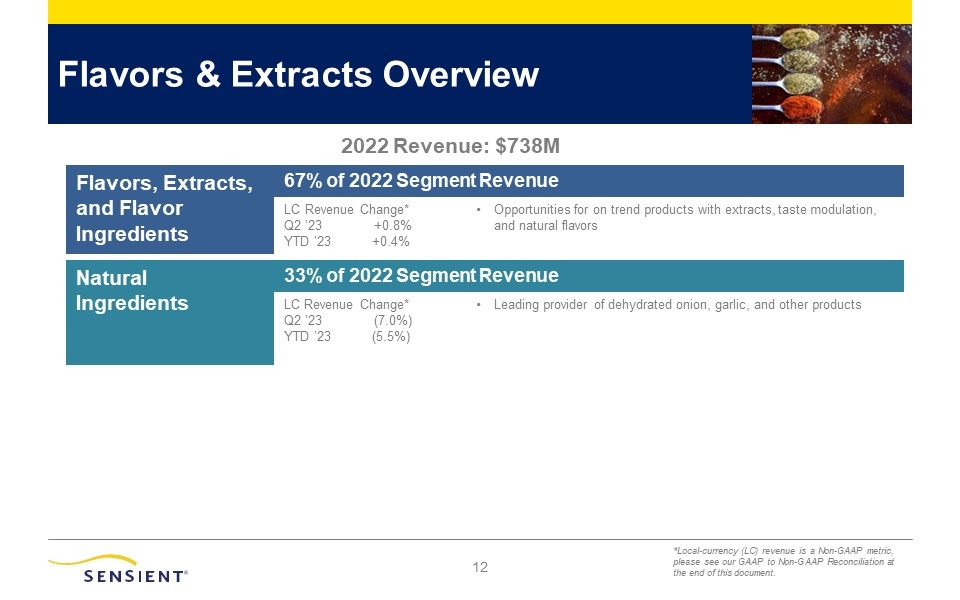
12 Flavors & Extracts Overview Flavors, Extracts, and Flavor
Ingredients 67% of 2022 Segment Revenue LC Revenue Change* Q2 ’23 +0.8% YTD ’23 +0.4% Opportunities for on trend products with extracts, taste modulation, and natural flavors Natural Ingredients 33% of 2022 Segment Revenue LC
Revenue Change* Q2 ’23 (7.0%) YTD ’23 (5.5%) Leading provider of dehydrated onion, garlic, and other products 2022 Revenue: $738M *Local-currency (LC) revenue is a Non-GAAP metric, please see our GAAP to Non-GAAP Reconciliation at the
end of this document.
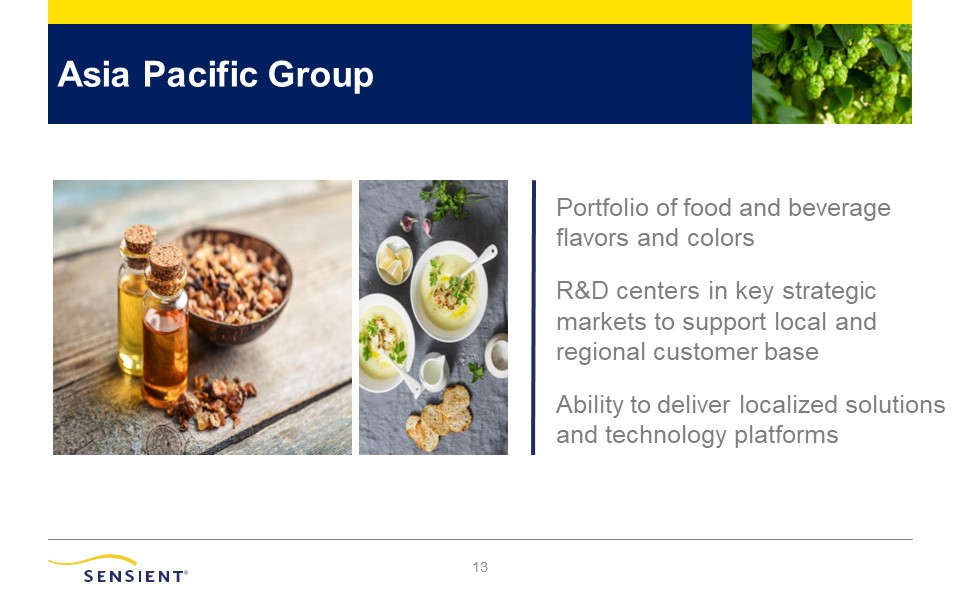
13 Asia Pacific Group Portfolio of food and beverage flavors and
colors R&D centers in key strategic markets to support local and regional customer base Ability to deliver localized solutions and technology platforms
14 2022 revenue of $144 million and operating income of $29
million Sensient’s sales of flavors and colors for Food and Pharmaceutical are managed on a geographic basis and reported as a separate segment Manufacturing capabilities in Australia, New Zealand, China, Japan, Philippines, Thailand, and
India Q2 2023 local currency revenue* declined 0.7% and operating profit* improved 0.9% *Local currency revenue and local currency operating profit are Non-GAAP metrics. Please see our GAAP to Non-GAAP Reconciliation at the end of this
document. Asia Pacific Overview
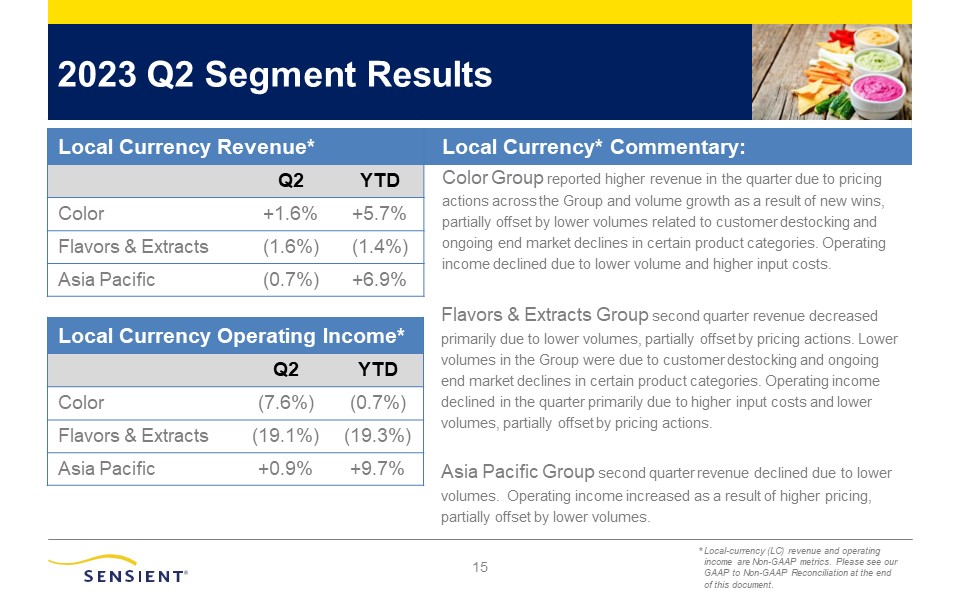
15 2023 Q2 Segment Results Flavors & Extracts Group second quarter
revenue decreased primarily due to lower volumes, partially offset by pricing actions. Lower volumes in the Group were due to customer destocking and ongoing end market declines in certain product categories. Operating income declined in
the quarter primarily due to higher input costs and lower volumes, partially offset by pricing actions. Asia Pacific Group second quarter revenue declined due to lower volumes. Operating income increased as a result of higher pricing,
partially offset by lower volumes. Local Currency Revenue* Local Currency* Commentary: Q2 YTD Color Group reported higher revenue in the quarter due to pricing actions across the Group and volume growth as a result of new wins,
partially offset by lower volumes related to customer destocking and ongoing end market declines in certain product categories. Operating income declined due to lower volume and higher input costs. Color +1.6% +5.7% Flavors &
Extracts (1.6%) (1.4%) Asia Pacific (0.7%) +6.9% Local Currency Operating Income* Q2 YTD Color (7.6%) (0.7%) Flavors & Extracts (19.1%) (19.3%) Asia Pacific +0.9% +9.7% * Local-currency (LC) revenue and operating
income are Non-GAAP metrics. Please see our GAAP to Non-GAAP Reconciliation at the end of this document.
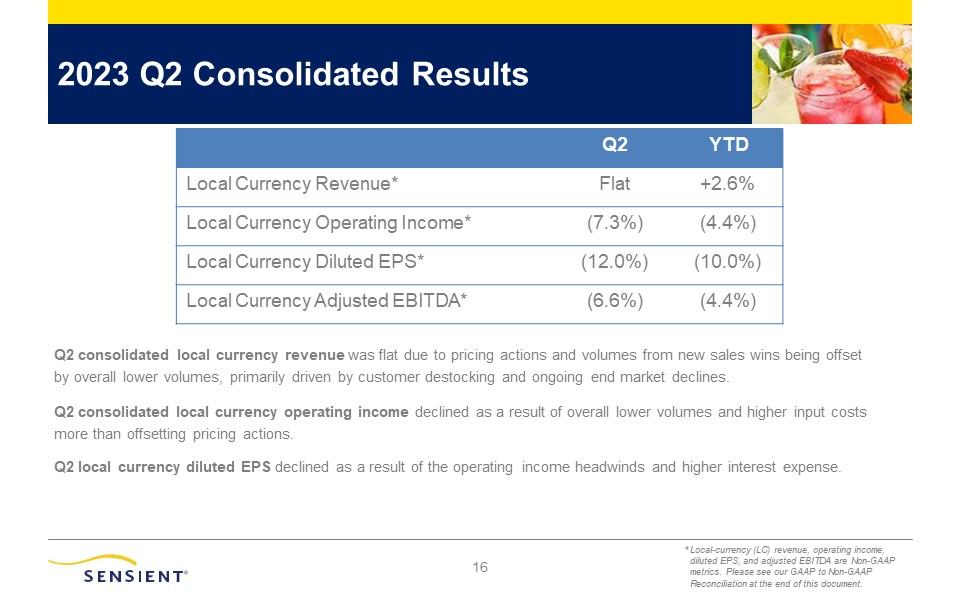
16 2023 Q2 Consolidated Results Q2 YTD Local Currency
Revenue* Flat +2.6% Local Currency Operating Income* (7.3%) (4.4%) Local Currency Diluted EPS* (12.0%) (10.0%) Local Currency Adjusted EBITDA* (6.6%) (4.4%) Q2 consolidated local currency revenue was flat due to pricing actions
and volumes from new sales wins being offset by overall lower volumes, primarily driven by customer destocking and ongoing end market declines. Q2 consolidated local currency operating income declined as a result of overall lower volumes
and higher input costs more than offsetting pricing actions. Q2 local currency diluted EPS declined as a result of the operating income headwinds and higher interest expense. * Local-currency (LC) revenue, operating income, diluted EPS,
and adjusted EBITDA are Non-GAAP metrics. Please see our GAAP to Non-GAAP Reconciliation at the end of this document.
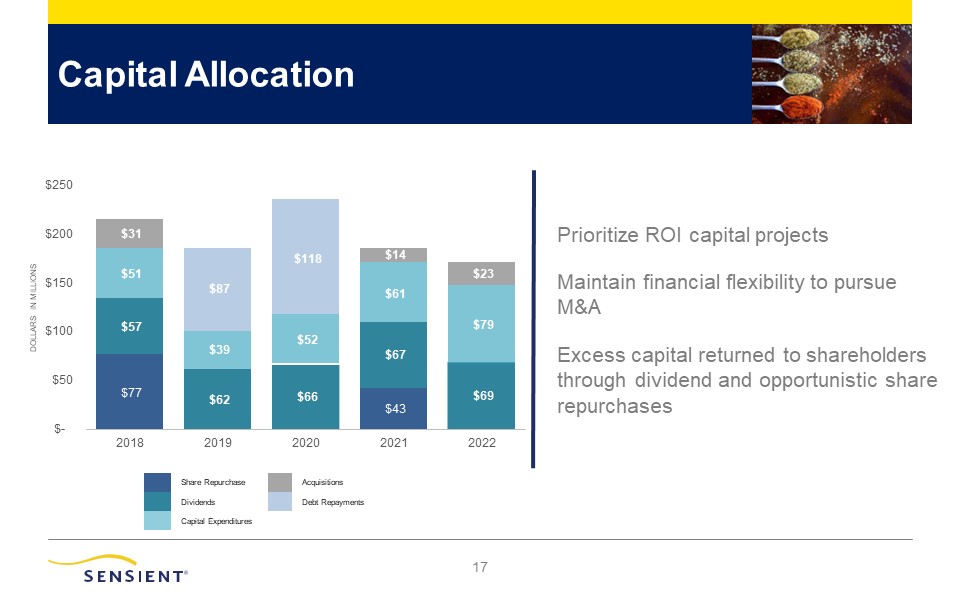
Capital Allocation Prioritize ROI capital projects Maintain financial
flexibility to pursue M&A Excess capital returned to shareholders through dividend and opportunistic share
repurchases $77 $43 $57 $62 $66 $67 $69 $51 $39 $52 $61 $79 $31 $14 $23 $87 $118 $- $50 $100 $150 $200 $250 2018 2019 2020 2021 2022 DOLLARS IN MILLIONS Share Repurchase Acquisitions Dividends Debt
Repayments Capital Expenditures 17
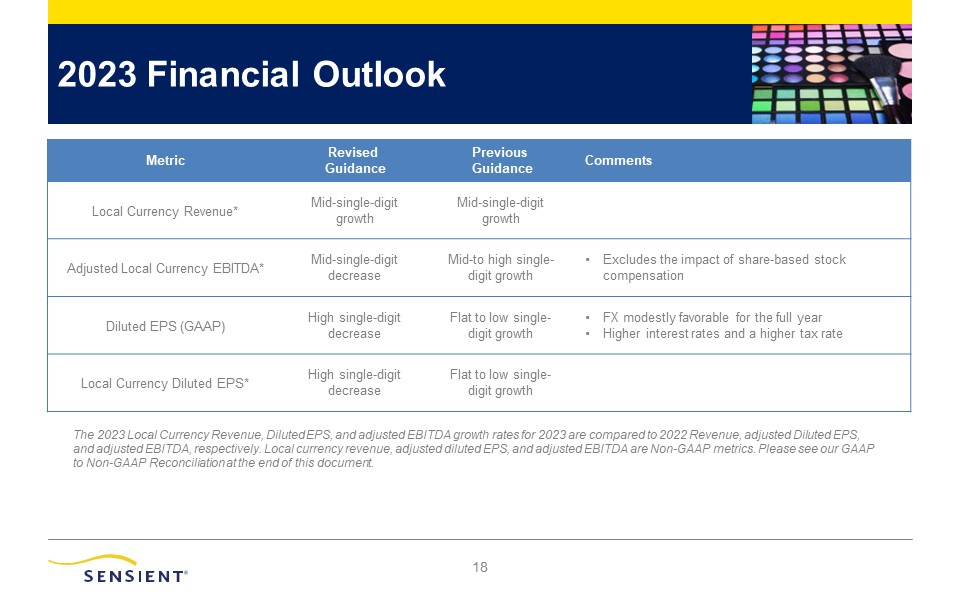
2023 Financial
Outlook 17 Metric Revised Guidance Previous Guidance Comments Local Currency Revenue* Mid-single-digit growth Mid-single-digit growth Adjusted Local Currency EBITDA* Mid-single-digit decrease Mid-to high single- digit
growth Excludes the impact of share-based stock compensation Diluted EPS (GAAP) High single-digit decrease Flat to low single- digit growth FX modestly favorable for the full year Higher interest rates and a higher tax rate Local
Currency Diluted EPS* High single-digit decrease Flat to low single- digit growth The 2023 Local Currency Revenue, Diluted EPS, and adjusted EBITDA growth rates for 2023 are compared to 2022 Revenue, adjusted Diluted EPS, and adjusted
EBITDA, respectively. Local currency revenue, adjusted diluted EPS, and adjusted EBITDA are Non-GAAP metrics. Please see our GAAP to Non-GAAP Reconciliation at the end of this document.
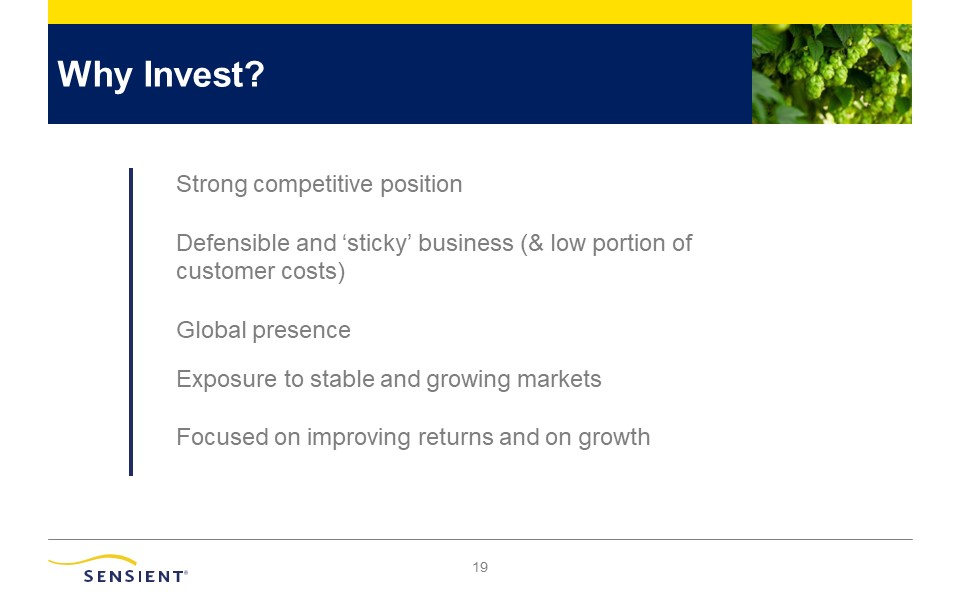
Why Invest? Strong competitive position Defensible and ‘sticky’ business
(& low portion of customer costs) Global presence Exposure to stable and growing markets Focused on improving returns and on growth 17
APPENDIX* *Amounts in thousands, except percentages and per share amounts
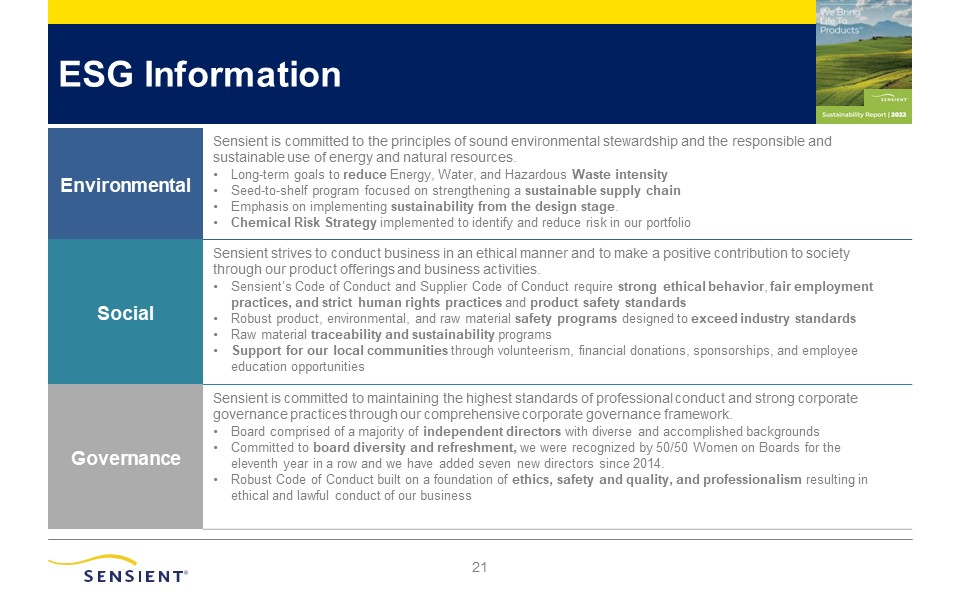
ESG Information Environmental Sensient is committed to the principles of
sound environmental stewardship and the responsible and sustainable use of energy and natural resources. Long-term goals to reduce Energy, Water, and Hazardous Waste intensity Seed-to-shelf program focused on strengthening a sustainable
supply chain Emphasis on implementing sustainability from the design stage. Chemical Risk Strategy implemented to identify and reduce risk in our portfolio Social Sensient strives to conduct business in an ethical manner and to make a
positive contribution to society through our product offerings and business activities. Sensient’s Code of Conduct and Supplier Code of Conduct require strong ethical behavior, fair employment practices, and strict human rights practices
and product safety standards Robust product, environmental, and raw material safety programs designed to exceed industry standards Raw material traceability and sustainability programs Support for our local communities through
volunteerism, financial donations, sponsorships, and employee education opportunities Governance Sensient is committed to maintaining the highest standards of professional conduct and strong corporate governance practices through our
comprehensive corporate governance framework. Board comprised of a majority of independent directors with diverse and accomplished backgrounds Committed to board diversity and refreshment, we were recognized by 50/50 Women on Boards for
the eleventh year in a row and we have added seven new directors since 2014. Robust Code of Conduct built on a foundation of ethics, safety and quality, and professionalism resulting in ethical and lawful conduct of our business 21
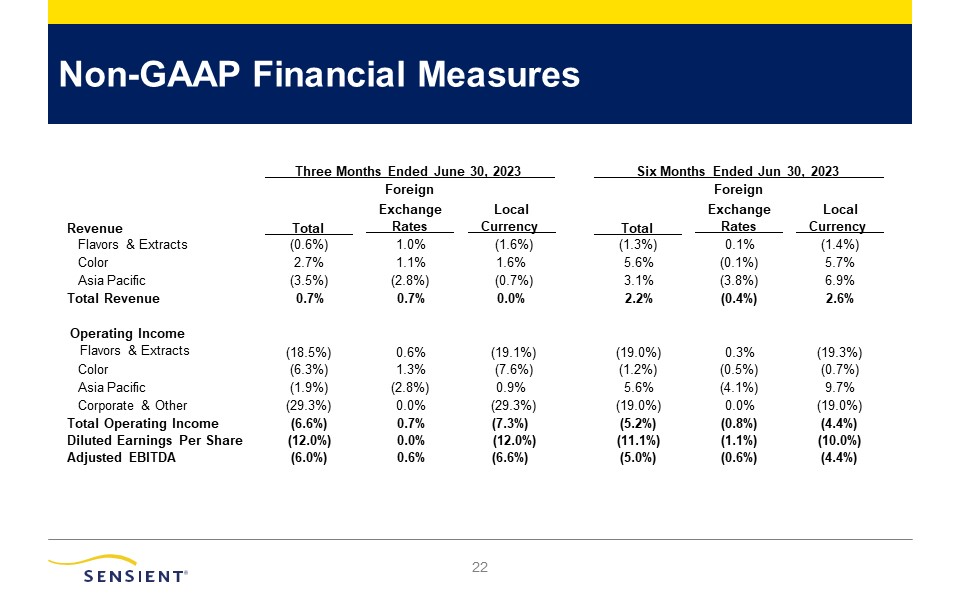
Non-GAAP Financial Measures 21 Revenue Total Exchange Rates Local
Currency Total Exchange Rates Local Currency Flavors & Extracts (0.6%) 1.0% (1.6%) (1.3%) 0.1% (1.4%) Color 2.7% 1.1% 1.6% 5.6% (0.1%) 5.7% Asia Pacific (3.5%) (2.8%) (0.7%) 3.1% (3.8%) 6.9% Total
Revenue 0.7% 0.7% 0.0% 2.2% (0.4%) 2.6% Operating Income Flavors & Extracts (18.5%) 0.6% (19.1%) (19.0%) 0.3% (19.3%) Color (6.3%) 1.3% (7.6%) (1.2%) (0.5%) (0.7%) Asia
Pacific (1.9%) (2.8%) 0.9% 5.6% (4.1%) 9.7% Corporate & Other (29.3%) 0.0% (29.3%) (19.0%) 0.0% (19.0%) Total Operating Income (6.6%) 0.7% (7.3%) (5.2%) (0.8%) (4.4%) Diluted Earnings Per
Share (12.0%) 0.0% (12.0%) (11.1%) (1.1%) (10.0%) Adjusted EBITDA (6.0%) 0.6% (6.6%) (5.0%) (0.6%) (4.4%) Three Months Ended June 30, 2023 Foreign Six Months Ended Jun 30, 2023 Foreign
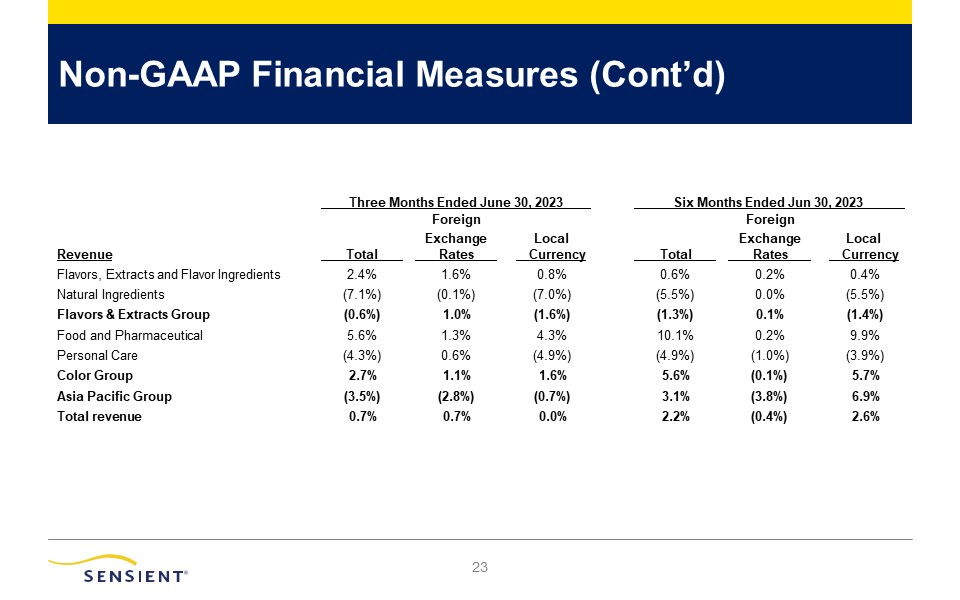
Non-GAAP Financial Measures (Cont’d) 21 Revenue Total Exchange Rates
Local Currency Total Exchange Rates Local Currency Flavors, Extracts and Flavor Ingredients 2.4% 1.6% 0.8% 0.6% 0.2% 0.4% Natural Ingredients (7.1%) (0.1%) (7.0%) (5.5%) 0.0% (5.5%) Flavors & Extracts
Group (0.6%) 1.0% (1.6%) (1.3%) 0.1% (1.4%) Food and Pharmaceutical 5.6% 1.3% 4.3% 10.1% 0.2% 9.9% Personal Care (4.3%) 0.6% (4.9%) (4.9%) (1.0%) (3.9%) Color Group 2.7% 1.1% 1.6% 5.6% (0.1%) 5.7% Asia Pacific
Group (3.5%) (2.8%) (0.7%) 3.1% (3.8%) 6.9% Total revenue 0.7% 0.7% 0.0% 2.2% (0.4%) 2.6% Three Months Ended June 30, 2023 Foreign Six Months Ended Jun 30, 2023 Foreign
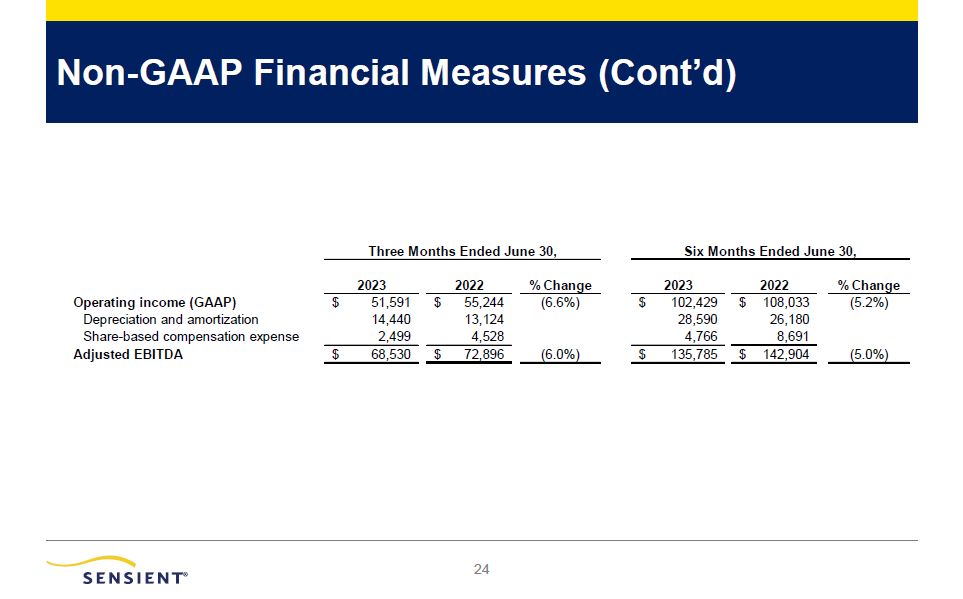
Non-GAAP Financial Measures (Cont’d) 21 2023 2022 % Change Operating
income (GAAP) Depreciation and amortization Share-based compensation expense Adjusted EBITDA $ 51,591 $ 55,244 ( 14,440 Three Months Ended June 30, Six Months Ended June 30,
21