Exhibit 99.1
|
|
Contact:
|
|
Amy Agallar
|
|
|
(414) 347-3706
|
|
Sensient Technologies Corporation
Reports Results for the Quarter Ended March 31, 2024
and Raises Full Year Guidance
MILWAUKEE— April 26, 2024 — Sensient Technologies Corporation (NYSE: SXT), a leading provider of flavors and colors
for the food, pharmaceutical, and personal care markets, today reported financial results for the first quarter ended March 31, 2024.
First Quarter Consolidated Results
| • |
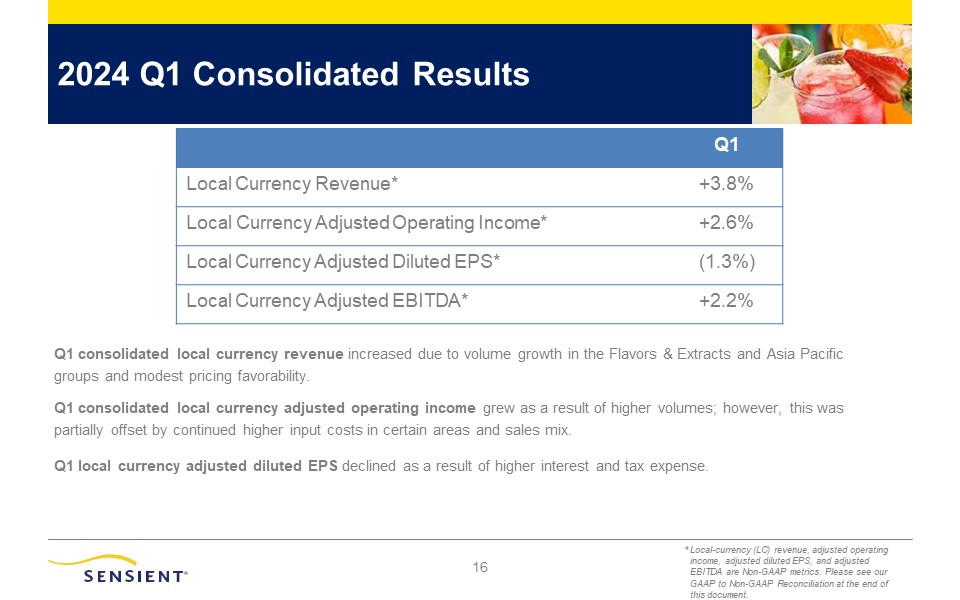
Reported revenue increased 4.2% to $384.7 million in the first quarter of 2024 versus last year’s first quarter results of $369.0 million. On a local currency basis(1), revenue increased
3.8%.
|
| • |
Reported operating income decreased 2.8% to $49.4 million compared to $50.8 million recorded in the first quarter of 2023. In the first quarter of 2024, the Company recorded $2.8 million of costs
related to its recently enacted Portfolio Optimization Plan. Local currency adjusted operating income(1) and local currency adjusted EBITDA(1) increased 2.6% and 2.2%, respectively, in the first quarter.
|
| • |
Reported diluted earnings per share decreased 8.8% to 73 cents in the first quarter of 2024 compared to 80 cents in the first quarter of 2023. Local currency adjusted EPS(1) decreased 1.3%
in the first quarter primarily as a result of higher interest expense and a higher tax rate.
|
“I am pleased that 2024 is off to a good start. Our underlying business and new sales
wins remain strong. I am confident that our teams will execute on our strategy and deliver on expectations for 2024,” said Paul Manning, Sensient’s Chairman, President, and Chief Executive Officer.
| Sensient Technologies Corporation | Page 2 |
| Earnings Release – Quarter Ended March 31, 2024 | |
| April 26, 2024 |
First Quarter Group Results
|
Revenue
|
Reported
Quarter
|
Local Currency(1)
Quarter
|
||||||
|
Flavors & Extracts
|
8.0
|
%
|
6.9
|
%
|
||||
|
Color
|
-0.7
|
%
|
-1.7
|
%
|
||||
|
Asia Pacific
|
0.6
|
%
|
4.1
|
%
|
||||
|
Total Revenue
|
4.2
|
%
|
3.8
|
%
|
||||
|
Operating Income
|
Reported
Quarter
|
Adjusted Local Currency(1)
Quarter
|
||||||
|
Flavors & Extracts
|
6.8
|
% |
6.3
|
% | ||||
|
Color
|
-0.6
|
% |
-1.8
|
% | ||||
|
Asia Pacific
|
-5.0
|
% |
-0.6
|
% | ||||
|
Total Operating Income
|
-2.8
|
% |
2.6
|
% | ||||
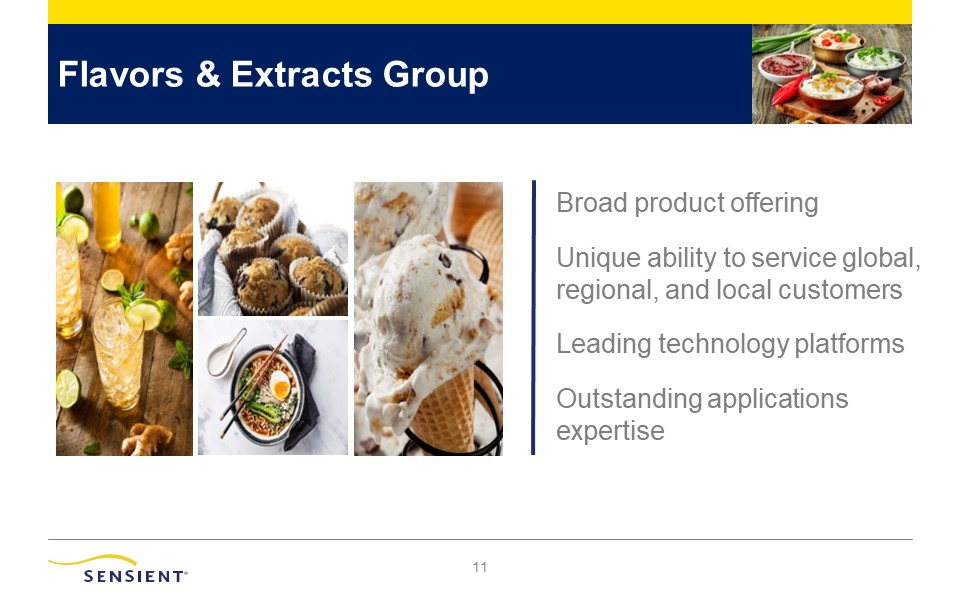
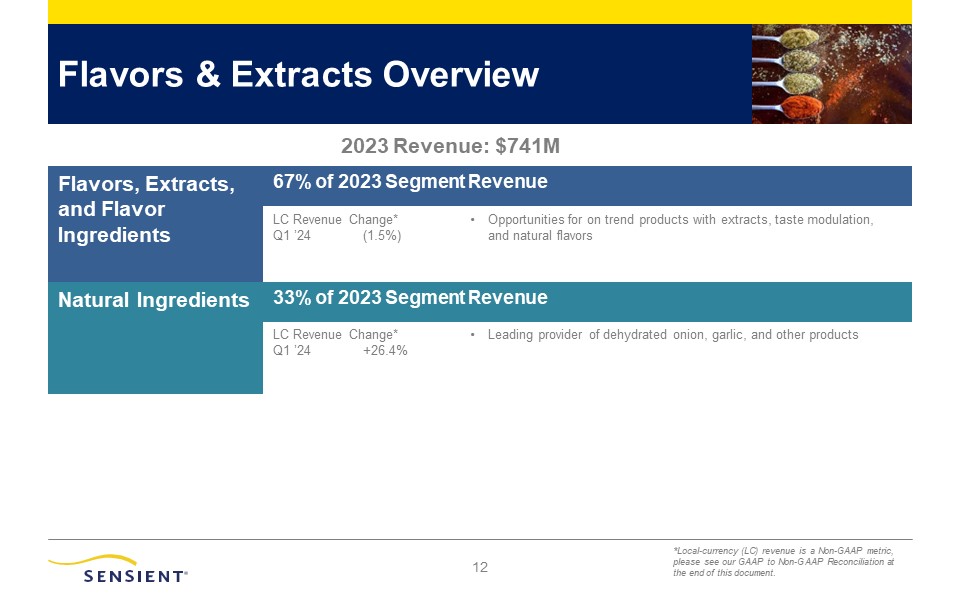
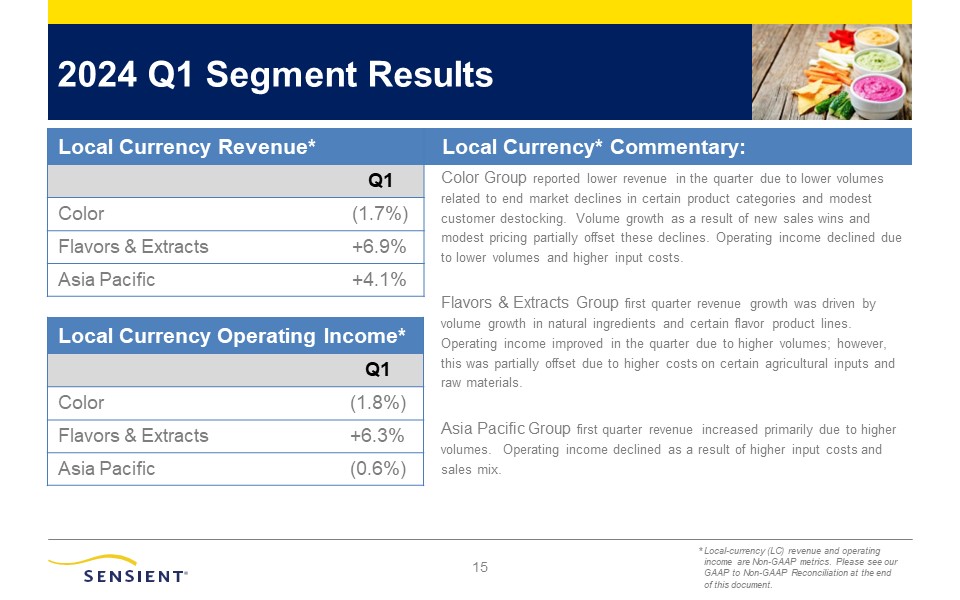
The Flavors & Extracts Group reported first quarter 2024 revenue of $193.1 million, an increase of $14.2 million versus the prior year’s first
quarter. The Group’s increased revenue was a result of higher volumes, favorable pricing, and favorable exchange rates. Segment operating income was $23.7 million in the first quarter of 2024, an increase of $1.5 million compared to the prior year’s
first quarter. The higher operating income was primarily due to the higher volumes and favorable pricing.
The Color Group reported revenue of $160.0 million in the first quarter of 2024, a decrease of $1.1 million compared to the prior year’s first quarter.
The Group’s revenue was negatively impacted by lower volumes in the food and pharmaceutical product line, primarily due to market declines and modest customer destocking. Segment operating income was $31.7 million in the first quarter of 2024, a
decrease of $0.2 million compared to the prior year’s first quarter results. The lower operating income is primarily a result of the lower volumes in the food and pharmaceutical product lines, partially offset by higher operating income in the
personal care product line.
| Sensient Technologies Corporation | Page 3 |
| Earnings Release – Quarter Ended March 31, 2024 | |
| April 26, 2024 |
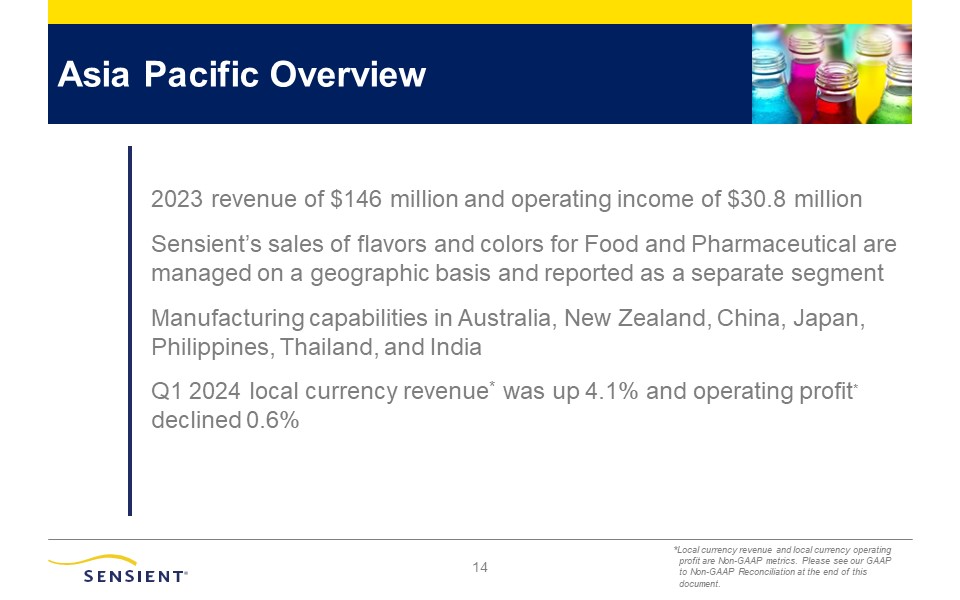
The Asia Pacific Group reported revenue of $40.3 million in the first quarter of 2024, an increase of $0.2 million compared to the prior year’s first
quarter. The Group’s revenue benefited from higher volumes, partially offset by unfavorable exchange rates. Segment operating income was $8.8 million in the quarter, a decrease of $0.5 million compared to the prior year’s first quarter. The lower
operating income is primarily a result of higher input costs and unfavorable exchange rates.
Corporate & Other reported operating expenses of $14.7 million in the first quarter of 2024, compared to $12.5 million of operating expenses
reported in the prior year’s first quarter. The increase was primarily due to the Portfolio Optimization Plan costs of $2.8 million recorded in the first quarter of 2024. Local currency adjusted operating expenses(1) for Corporate &
Other decreased $0.6 million compared to the prior year’s first quarter.
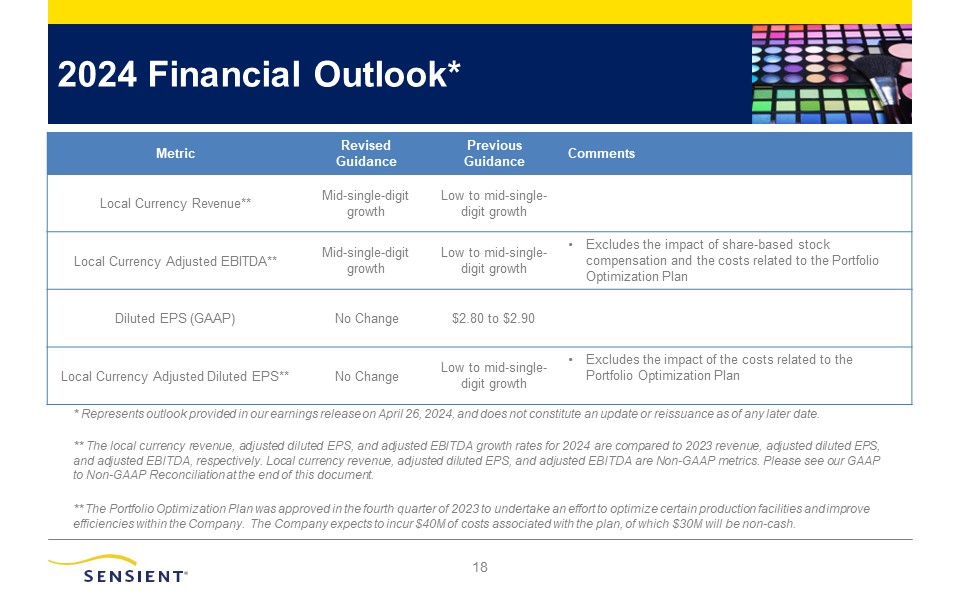
2024 OUTLOOK
Sensient continues to expect 2024 diluted earnings per share to be between $2.80 and $2.90, which includes approximately 15 cents of Portfolio
Optimization Plan costs in 2024, compared to the Company’s 2023 reported GAAP diluted earnings per share of $2.21.
The Company now expects 2024 revenue and 2024 adjusted EBITDA(1) to each grow at a mid-single-digit rate on a local currency basis compared
to the Company’s 2023 revenue and the Company’s 2023 adjusted EBITDA(1). The Company’s previous guidance called for 2024 revenue and 2024 adjusted EBITDA(1) to grow at a low to mid-single-digit rate on a local currency basis.
The Company continues to expect 2024 adjusted diluted earnings per share(1) to grow at a low to mid-single-digit rate on a local currency basis compared to the Company’s 2023 adjusted diluted earnings per share(1) of $2.86.
The Company continues to expect its 2024 diluted earnings per share to be impacted by higher interest expense. The Company also expects its full year 2024 adjusted tax rate to be between 24% and 25%.
| Sensient Technologies Corporation | Page 4 |
| Earnings Release – Quarter Ended March 31, 2024 | |
| April 26, 2024 |
The Company’s guidance is based on current conditions and economic and market trends in the markets in which the Company operates and is subject to
various risks and uncertainties as described below.
| (1) |
Please refer to “Reconciliation of Non-GAAP Amounts” at the end of this release for more information regarding our non-GAAP
financial measures.
|
USE OF NON-GAAP FINANCIAL MEASURES
The Company’s non-GAAP financial measures eliminate the impact of certain items, which, depending on the measure, include: currency movements,
depreciation and amortization, Portfolio Optimization Plan costs, and non-cash share-based compensation. These measures are provided to enhance the overall understanding of the Company’s performance when viewed together with the GAAP results. Refer
to “Reconciliation of Non-GAAP Amounts” at the end of this release.
CONFERENCE CALL
The Company will host a conference call to discuss its 2024 first quarter financial results at 8:30 a.m. CDT on Friday, April 26, 2024. To participate
in the conference call, contact Chorus Call Inc. at (844) 492-3726 or (412) 317-1078, and ask to join the Sensient Technologies Corporation conference call. Alternatively, the call can be accessed by using the webcast link that is available on the
Investor Information section of the Company’s web site at www.sensient.com.
A replay of the call will be available one hour after the end of the conference call through May 3, 2024, by calling (877) 344-7529 and using access
code 3617541. An audio replay and written transcript of the call will also be posted on the Investor Information section of the Company’s web site at www.sensient.com on or after April 30,
2024.
| Sensient Technologies Corporation | Page 5 |
| Earnings Release – Quarter Ended March 31, 2024 | |
| April 26, 2024 |
This release contains statements that may constitute “forward-looking statements” within the meaning of Federal securities laws
including under “2024 Outlook” above. Such forward-looking statements are not guarantees of future performance and involve known and unknown risks, uncertainties, and other factors concerning the Company’s operations and business environment.
Important factors that could cause actual results to differ materially from those suggested by these forward-looking statements and that could adversely affect the Company’s future financial performance include the following: the Company’s ability to
manage general business, economic, and capital market conditions, including actions taken by customers in response to such market conditions, and the impact of recessions and economic downturns; the impact of macroeconomic and geopolitical
volatility, including inflation and shortages impacting the availability and cost of raw materials, energy, and other supplies, disruptions and delays in the Company’s supply chain, and the conflicts between Russia and Ukraine and Israel and Hamas
and other parties in the Middle East; the availability and cost of labor, logistics, and transportation; the pace and nature of new product introductions by the Company and the Company’s customers; the Company’s ability to anticipate and respond to
changing consumer preferences and changing technologies; the Company’s ability to successfully implement its growth strategies; the outcome of the Company’s various productivity-improvement and cost-reduction efforts, acquisition and divestiture
activities, and Portfolio Optimization Plan; industry, regulatory, legal, and economic factors related to the Company’s domestic and international business; the effects of tariffs, trade barriers, and disputes; growth in markets for products in which
the Company competes; industry and customer acceptance of price increases; actions by competitors; the Company’s ability to enhance its innovation efforts and drive cost efficiencies; currency exchange rate fluctuations; and other factors included in
“Risk Factors” in the Company’s Annual Report on Form 10-K for the year ended December 31, 2023, and in other documents that the Company files with the SEC. The risks and uncertainties identified above are not the only risks the Company faces.
Additional risks and uncertainties not presently known to the Company or that it currently believes to be immaterial also may adversely affect the Company. Should any known or unknown risks and uncertainties develop into actual events, these
developments could have material adverse effects on our business, financial condition, and results of operations. This release contains time-sensitive information that reflects management’s best analysis only as of the date of this release. Except to
the extent required by applicable laws, the Company does not undertake to publicly update or revise its forward-looking statements even if experience or future changes make it clear that any projected results expressed or implied herein will not be
realized.
| Sensient Technologies Corporation | Page 6 |
| Earnings Release – Quarter Ended March 31, 2024 | |
| April 26, 2024 |
ABOUT SENSIENT TECHNOLOGIES
Sensient Technologies Corporation is a leading global manufacturer and marketer of colors, flavors, and other specialty ingredients. Sensient uses
advanced technologies and robust global supply chain capabilities to develop specialized solutions for food and beverages, as well as products that serve the pharmaceutical, nutraceutical, and personal care industries. Sensient’s customers range in
size from small entrepreneurial businesses to major international manufacturers representing some of the world’s best-known brands. Sensient is headquartered in Milwaukee, Wisconsin.
www.sensient.com
Page 7
Sensient Technologies Corporation
(In thousands, except percentages and per share amounts)
(Unaudited)
|
Consolidated Statements of Earnings
|
Three Months Ended March 31,
|
|||||||||||
|
2024
|
2023
|
% Change
|
||||||||||
|
Revenue
|
$
|
384,670
|
$
|
369,006
|
4.2
|
%
|
||||||
|
Cost of products sold
|
258,121
|
244,343
|
5.6
|
%
|
||||||||
|
Selling and administrative expenses
|
77,143
|
73,825
|
4.5
|
%
|
||||||||
|
Operating income
|
49,406
|
50,838
|
(2.8
|
%)
|
||||||||
|
Interest expense
|
7,045
|
6,002
|
||||||||||
|
Earnings before income taxes
|
42,361
|
44,836
|
||||||||||
|
Income taxes
|
11,421
|
11,185
|
||||||||||
|
Net earnings
|
$
|
30,940
|
$
|
33,651
|
(8.1
|
%)
|
||||||
|
Earnings per share of common stock:
|
||||||||||||
|
Basic
|
$
|
0.73
|
$
|
0.80
|
||||||||
|
Diluted
|
$
|
0.73
|
$
|
0.80
|
||||||||
|
Average common shares outstanding:
|
||||||||||||
|
Basic
|
42,104
|
41,970
|
||||||||||
|
Diluted
|
42,305
|
42,255
|
||||||||||
|
Results by Segment
|
Three Months Ended March 31,
|
|||||||||||
|
Revenue
|
2024
|
2023
|
% Change
|
|||||||||
|
Flavors & Extracts
|
$
|
193,092
|
$
|
178,852
|
8.0
|
%
|
||||||
|
Color
|
160,025
|
161,161
|
(0.7
|
%)
|
||||||||
|
Asia Pacific
|
40,306
|
40,085
|
0.6
|
%
|
||||||||
|
Intersegment elimination
|
(8,753
|
)
|
(11,092
|
)
|
||||||||
|
Consolidated
|
$
|
384,670
|
$
|
369,006
|
4.2
|
%
|
||||||
|
Operating Income
|
||||||||||||
|
Flavors & Extracts
|
$
|
23,678
|
$
|
22,180
|
6.8
|
%
|
||||||
|
Color
|
31,679
|
31,885
|
(0.6
|
%)
|
||||||||
|
Asia Pacific
|
8,776
|
9,241
|
(5.0
|
%)
|
||||||||
|
Corporate & Other
|
(14,727
|
)
|
(12,468
|
)
|
||||||||
|
Consolidated
|
$
|
49,406
|
$
|
50,838
|
(2.8
|
%)
|
||||||
Page 8
Sensient Technologies Corporation
(In thousands)
(Unaudited)
|
Consolidated Condensed Balance Sheets
|
March 31,
2024
|
December 31,
2023
|
||||||
|
Cash and cash equivalents
|
$
|
25,417
|
$
|
28,934
|
||||
|
Trade accounts receivable
|
298,488
|
272,164
|
||||||
|
Inventories
|
568,547
|
598,399
|
||||||
|
Prepaid expenses and other current assets
|
50,391
|
37,119
|
||||||
|
Total Current Assets
|
942,843
|
936,616
|
||||||
|
Goodwill & intangible assets (net)
|
432,247
|
436,177
|
||||||
|
Property, plant, and equipment (net)
|
498,188
|
505,277
|
||||||
|
Other assets
|
132,404
|
136,437
|
||||||
|
Total Assets
|
$
|
2,005,682
|
$
|
2,014,507
|
||||
|
Trade accounts payable
|
$
|
104,834
|
$
|
131,114
|
||||
|
Short-term borrowings
|
19,439
|
13,460
|
||||||
|
Other current liabilities
|
94,586
|
91,732
|
||||||
|
Total Current Liabilities
|
218,859
|
236,306
|
||||||
|
Long-term debt
|
643,511
|
645,085
|
||||||
|
Accrued employee and retiree benefits
|
28,276
|
27,715
|
||||||
|
Other liabilities
|
51,100
|
52,077
|
||||||
|
Shareholders’ Equity
|
1,063,936
|
1,053,324
|
||||||
|
Total Liabilities and Shareholders’ Equity
|
$
|
2,005,682
|
$
|
2,014,507
|
||||
Page 9
Sensient Technologies Corporation
(In thousands, except per share amounts)
(Unaudited)
|
Consolidated Statements of Cash Flows
|
||||||||
|
Three Months Ended March 31,
|
||||||||
|
2024
|
2023
|
|||||||
|
Cash flows from operating activities:
|
||||||||
|
Net earnings
|
$
|
30,940
|
$
|
33,651
|
||||
|
Adjustments to arrive at net cash provided by operating activities:
|
||||||||
|
Depreciation and amortization
|
14,709
|
14,150
|
||||||
|
Share-based compensation expense
|
1,995
|
2,267
|
||||||
|
Net loss (gain) on assets
|
(193
|
)
|
8
|
|||||
|
Portfolio Optimization Plan costs
|
1,189
|
-
|
||||||
|
Deferred income taxes
|
(4
|
)
|
(2,351
|
)
|
||||
|
Changes in operating assets and liabilities:
|
||||||||
|
Trade accounts receivable
|
(28,331
|
)
|
(7,142
|
)
|
||||
|
Inventories
|
26,624
|
(4,374
|
)
|
|||||
|
Prepaid expenses and other assets
|
(13,655
|
)
|
(2,062
|
)
|
||||
|
Trade accounts payable and other accrued expenses
|
(21,993
|
)
|
(19,251
|
)
|
||||
|
Accrued salaries, wages, and withholdings
|
29
|
(21,187
|
)
|
|||||
|
Income taxes
|
3,150
|
2,548
|
||||||
|
Other liabilities
|
674
|
698
|
||||||
|
Net cash provided by (used in) operating activities
|
15,134
|
(3,045
|
)
|
|||||
|
Cash flows from investing activities:
|
||||||||
|
Acquisition of property, plant, and equipment
|
(11,030
|
)
|
(22,278
|
)
|
||||
|
Proceeds from sale of assets
|
93
|
1
|
||||||
|
Other investing activities
|
(1
|
)
|
(602
|
)
|
||||
|
Net cash used in investing activities
|
(10,938
|
)
|
(22,879
|
)
|
||||
|
Cash flows from financing activities:
|
||||||||
|
Proceeds from additional borrowings
|
38,053
|
50,827
|
||||||
|
Debt payments
|
(27,031
|
)
|
(1,351
|
)
|
||||
|
Dividends paid
|
(17,312
|
)
|
(17,255
|
)
|
||||
|
Other financing activities
|
(2,828
|
)
|
(7,669
|
)
|
||||
|
Net cash (used in) provided by financing activities
|
(9,118
|
)
|
24,552
|
|||||
|
Effect of exchange rate changes on cash and cash equivalents
|
1,405
|
4,468
|
||||||
|
Net (decrease) increase in cash and cash equivalents
|
(3,517
|
)
|
3,096
|
|||||
|
Cash and cash equivalents at beginning of period
|
28,934
|
20,921
|
||||||
|
Cash and cash equivalents at end of period
|
$
|
25,417
|
$
|
24,017
|
||||
|
Supplemental Information
|
||||||||
|
Three Months Ended March 31,
|
2024
|
2023
|
||||||
|
Dividends paid per share
|
$
|
0.41
|
$
|
0.41
|
||||
Page 10
Sensient Technologies Corporation
(In thousands, except percentages and per share amounts)
(Unaudited)
Reconciliation of Non-GAAP Amounts
The Company’s results for the three months ended March 31, 2024 and 2023 include adjusted operating income, adjusted net earnings, and adjusted diluted earnings per
share, which, in each case, exclude Portfolio Optimization Plan costs.
|
Three Months Ended March 31,
|
||||||||||||
|
2024
|
2023
|
% Change
|
||||||||||
|
Operating income (GAAP)
|
$
|
49,406
|
$
|
50,838
|
(2.8
|
%)
|
||||||
|
Portfolio Optimization Plan costs – Cost of products sold
|
107
|
-
|
||||||||||
|
Portfolio Optimization Plan costs – Selling and administrative
|
||||||||||||
|
expenses
|
2,705
|
-
|
||||||||||
|
Adjusted operating income
|
$
|
52,218
|
$
|
50,838
|
2.7
|
%
|
||||||
|
Net earnings (GAAP)
|
$
|
30,940
|
$
|
33,651
|
(8.1
|
%)
|
||||||
|
Portfolio Optimization Plan costs, before tax
|
2,812
|
-
|
||||||||||
|
Tax impact of Portfolio Optimization Plan costs(1)
|
(355
|
)
|
-
|
|||||||||
|
Adjusted net earnings
|
$
|
33,397
|
$
|
33,651
|
(0.8
|
%)
|
||||||
|
Diluted earnings per share (GAAP)
|
$
|
0.73
|
$
|
0.80
|
(8.8
|
%)
|
||||||
|
Portfolio Optimization Plan costs, net of tax
|
0.06
|
-
|
||||||||||
|
Adjusted diluted earnings per share
|
$
|
0.79
|
$
|
0.80
|
(1.3
|
%)
|
||||||
Note: Earnings per share calculations may not foot due to rounding differences.
| (1) |
Tax impact adjustments were determined based on the nature of the underlying non-GAAP adjustments and their relevant jurisdictional tax rates.
|
|
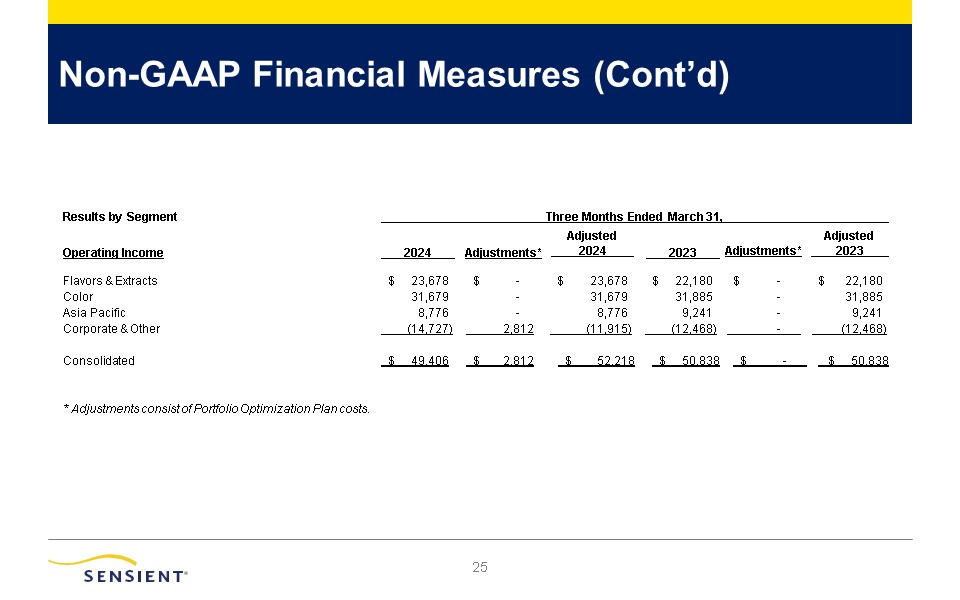
Results by Segment
|
Three Months Ended March 31,
|
|||||||||||||||||||||||
|
Operating Income
|
2024
|
Adjustments(2)
|
Adjusted
2024
|
2023
|
Adjustments(2)
|
Adjusted
2023
|
||||||||||||||||||
|
Flavors & Extracts
|
$
|
23,678
|
$
|
-
|
$
|
23,678
|
$
|
22,180
|
$
|
-
|
$
|
22,180
|
||||||||||||
|
Color
|
31,679
|
-
|
31,679
|
31,885
|
-
|
31,885
|
||||||||||||||||||
|
Asia Pacific
|
8,776
|
-
|
8,776
|
9,241
|
-
|
9,241
|
||||||||||||||||||
|
Corporate & Other
|
(14,727
|
)
|
2,812
|
(11,915
|
)
|
(12,468
|
)
|
-
|
(12,468
|
)
|
||||||||||||||
|
Consolidated
|
$
|
49,406
|
$
|
2,812
|
$
|
52,218
|
$
|
50,838
|
$
|
-
|
$
|
50,838
|
||||||||||||
| (2) |
Adjustments consist of Portfolio Optimization Plan costs.
|
The following table summarizes the percentage change in the 2024 results compared to the 2023 results for the corresponding periods.
|
Three Months Ended March 31,
|
||||||||||||||||
|
Revenue
|
Total
|
Foreign
Exchange
Rates
|
Adjustments(3)
|
Adjusted
Local
Currency
|
||||||||||||
|
Flavors & Extracts
|
8.0
|
%
|
1.1
|
%
|
N/A
|
6.9
|
%
|
|||||||||
|
Color
|
(0.7
|
%)
|
1.0
|
%
|
N/A
|
(1.7
|
%)
|
|||||||||
|
Asia Pacific
|
0.6
|
%
|
(3.5
|
%)
|
N/A
|
4.1
|
%
|
|||||||||
|
Total Revenue
|
4.2
|
%
|
0.4
|
%
|
N/A
|
3.8
|
%
|
|||||||||
|
Operating Income
|
||||||||||||||||
|
Flavors & Extracts
|
6.8
|
%
|
0.5
|
%
|
0.0
|
%
|
6.3
|
%
|
||||||||
|
Color
|
(0.6
|
%)
|
1.2
|
%
|
0.0
|
%
|
(1.8
|
%)
|
||||||||
|
Asia Pacific
|
(5.0
|
%)
|
(4.4
|
%)
|
0.0
|
%
|
(0.6
|
%)
|
||||||||
|
Corporate & Other
|
18.1
|
%
|
0.0
|
%
|
22.5
|
%
|
(4.4
|
%)
|
||||||||
|
Total Operating Income
|
(2.8
|
%)
|
0.2
|
%
|
(5.6
|
%)
|
2.6
|
%
|
||||||||
|
Diluted Earnings Per Share
|
(8.8
|
%)
|
0.0
|
%
|
(7.5
|
%)
|
(1.3
|
%)
|
||||||||
|
Adjusted EBITDA
|
2.5
|
%
|
0.3
|
%
|
N/A
|
2.2
|
%
|
|||||||||
| (3) |
Adjustments consist of Portfolio Optimization Plan costs.
|
Page 11
Sensient Technologies Corporation
(In thousands, except percentages)
(Unaudited)
Reconciliation of Non-GAAP Amounts – Continued
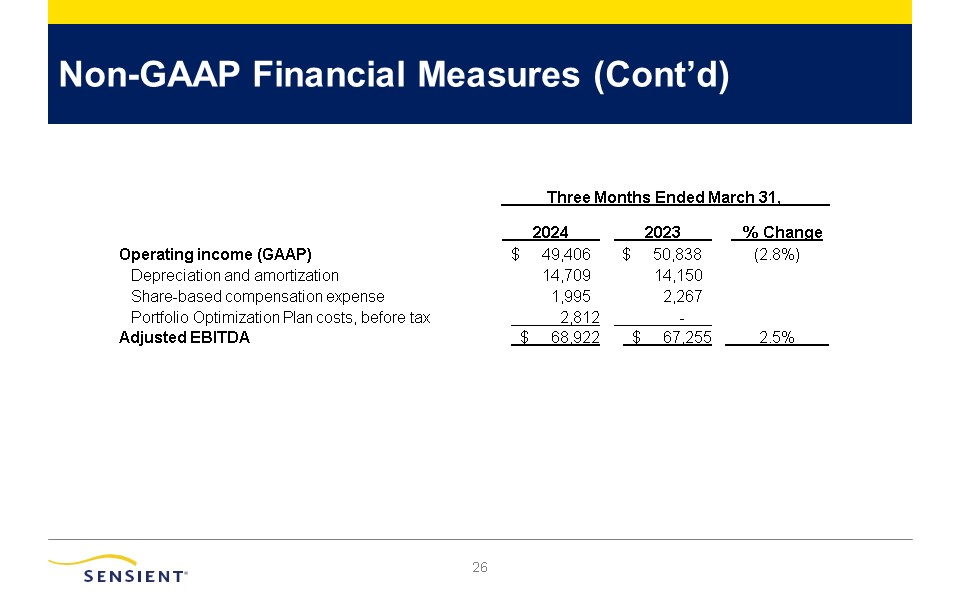
The following table summarizes the reconciliation between Operating Income (GAAP) and Adjusted EBITDA for the three months ended March 31, 2024 and 2023.
|
Three Months Ended March 31,
|
||||||||||||
|
2024
|
2023
|
% Change
|
||||||||||
|
Operating income (GAAP)
|
$
|
49,406
|
$
|
50,838
|
(2.8
|
%)
|
||||||
|
Depreciation and amortization
|
14,709
|
14,150
|
||||||||||
|
Share-based compensation expense
|
1,995
|
2,267
|
||||||||||
|
Portfolio Optimization Plan costs, before tax
|
2,812
|
-
|
||||||||||
|
Adjusted EBITDA
|
$
|
68,922
|
$
|
67,255
|
2.5
|
%
|
||||||
The following table summarizes the reconciliation between Debt (GAAP) and Net Debt, and Operating Income (GAAP) and Credit Adjusted EBITDA for the trailing twelve months
ended March 31, 2024 and 2023.
|
March 31,
|
||||||||
|
Debt
|
2024
|
2023
|
||||||
|
Short-term borrowings
|
$
|
19,439
|
$
|
24,849
|
||||
|
Long-term debt
|
643,511
|
679,779
|
||||||
|
Credit Agreement adjustments(1)
|
(13,775
|
)
|
(11,525
|
)
|
||||
|
Net Debt
|
$
|
649,175
|
$
|
693,103
|
||||
|
Operating income (GAAP)
|
$
|
153,591
|
$
|
194,800
|
||||
|
Depreciation and amortization
|
58,379
|
53,561
|
||||||
|
Share-based compensation expense
|
8,661
|
14,242
|
||||||
|
Portfolio Optimization Plan costs, before tax
|
30,653
|
-
|
||||||
|
Other non-operating gains(2)
|
(1,055
|
)
|
(3,359
|
)
|
||||
|
Credit Adjusted EBITDA
|
$
|
250,229
|
$
|
259,244
|
||||
|
Net Debt to Credit Adjusted EBITDA
|
2.6
|
x
|
2.7
|
x
|
||||
|
(1)
|
Adjustments include cash and cash equivalents, as described in the Company’s Third Amended and Restated Credit Agreement (Credit Agreement),
and certain letters of credit and hedge contracts.
|
|
(2)
|
Adjustments consist of certain financing transaction costs, certain non-financing interest items, and gains and losses related to certain
non-cash, non-operating, and/or non-recurring items as described in the Credit Agreement.
|
The following table summarizes the reconciliation between Diluted Earnings Per Share (GAAP) and Adjusted Diluted Earnings Per Share for the twelve months ended December
31, 2023.
|
Twelve Months Ended December 31,
|
||||
|
2023
|
||||
|
Diluted earnings per share (GAAP)
|
$
|
2.21
|
||
|
Portfolio Optimization Plan costs, net of tax
|
0.65
|
|||
|
Adjusted diluted earnings per share
|
$
|
2.86
|
||
Note: Earnings per share calculations may not foot due to rounding differences.
We have included each of these non-GAAP measures in order to provide additional information regarding our underlying operating results and comparable period-over-period
performance. Such information is supplemental to information presented in accordance with GAAP and is not intended to represent a presentation in accordance with GAAP. These non-GAAP measures should not be considered in isolation. Rather, they
should be considered together with GAAP measures and the rest of the information included in this release and our SEC filings. Management internally reviews each of these non-GAAP measures to evaluate performance on a comparative period-to-period
basis and to gain additional insight into underlying operating and performance trends, and we believe the information can be beneficial to investors for the same purposes. These non-GAAP measures may not be comparable to similarly titled measures
used by other companies.