
t-20240424
0000732717FALSE00007327172024-04-242024-04-240000732717us-gaap:CommonStockMember2024-04-242024-04-240000732717us-gaap:SeriesAPreferredStockMember2024-04-242024-04-240000732717us-gaap:SeriesCPreferredStockMember2024-04-242024-04-240000732717t:ATTInc2400GlobalNotesDueMarch152024Member2024-04-242024-04-240000732717t:ATTIncFloatingRateGlobalNotesDueMarch62025Member2024-04-242024-04-240000732717t:ATTInc3550GlobalNotesDueNovember182025Member2024-04-242024-04-240000732717t:ATTInc3500GlobalNotesDueDecember172025Member2024-04-242024-04-240000732717t:ATTInc0250GlobalNotesDueMarch42026Member2024-04-242024-04-240000732717t:ATTInc1800GlobalNotesDueSeptember52026Member2024-04-242024-04-240000732717t:ATTInc2900GlobalNotesDueDecember42026Member2024-04-242024-04-240000732717t:ATTInc1600GlobalNotesDueMay192028Member2024-04-242024-04-240000732717t:ATTInc2350GlobalNotesDueSeptember52029Member2024-04-242024-04-240000732717t:ATTInc4375GlobalNotesDueSeptember142029Member2024-04-242024-04-240000732717t:ATTInc2600GlobalNotesDueDecember172029Member2024-04-242024-04-240000732717t:ATTInc0800GlobalNotesDueMarch42030Member2024-04-242024-04-240000732717t:ATTInc3950GlobalNotesDueApril302031Member2024-04-242024-04-240000732717t:ATTInc2050GlobalNotesDueMay192032Member2024-04-242024-04-240000732717t:ATTInc3550GlobalNotesDueDecember172032Member2024-04-242024-04-240000732717t:ATTInc5200GlobalNotesDueNovember182033Member2024-04-242024-04-240000732717t:ATTInc3375GlobalNotesDueMarch152034Member2024-04-242024-04-240000732717t:ATTInc4300GlobalNotesDueNovember182034Member2024-04-242024-04-240000732717t:ATTInc2450GlobalNotesDueMarch152035Member2024-04-242024-04-240000732717t:ATTInc3150GlobalNotesDueSeptember42036Member2024-04-242024-04-240000732717t:ATTInc2600GlobalNotesDueMay192038Member2024-04-242024-04-240000732717t:ATTInc1800GlobalNotesDueSeptember142039Member2024-04-242024-04-240000732717t:ATTInc7000GlobalNotesDueApril302040Member2024-04-242024-04-240000732717t:ATTInc4250GlobalNotesDueJune12043Member2024-04-242024-04-240000732717t:ATTInc4875GlobalNotesDueJune12044Member2024-04-242024-04-240000732717t:ATTInc4000GlobalNotesDueJune12049Member2024-04-242024-04-240000732717t:ATTInc4250GlobalNotesDueMarch12050Member2024-04-242024-04-240000732717t:ATTInc3750GlobalNotesDueSeptember12050Member2024-04-242024-04-240000732717t:ATTInc5350GlobalNotesDueNovember12066Member2024-04-242024-04-240000732717t:ATTInc5625GlobalNotesDueAugust12067Member2024-04-242024-04-24

UNITED STATES
SECURITIES AND EXCHANGE COMMISSION
WASHINGTON, D.C. 20549

______________________________________________________
FORM 8-K
______________________________________________________
CURRENT REPORT
Pursuant to Section 13 or 15(d)
of the Securities Exchange Act of 1934
Date of report (Date of earliest event reported) April 24, 2024
______________________________________________________
AT&T INC.
(Exact Name of Registrant as Specified in Charter)
______________________________________________________
Delaware001-0861043-1301883
(State or Other Jurisdiction
of Incorporation)
(Commission
File Number)
(IRS Employer
Identification No.)
  
208 S. Akard St., Dallas, Texas
(Address of Principal Executive Offices)
75202
(Zip Code)
Registrant’s telephone number, including area code (210) 821-4105
(Former Name or Former Address, if Changed Since Last Report)
Check the appropriate box below if the Form 8-K filing is intended to simultaneously satisfy the filing obligation of the registrant under any of the following provisions (see General Instruction A.2. below):
Written communications pursuant to Rule 425 under the Securities Act (17 CFR 230.425)
Soliciting material pursuant to Rule 14a-12 under the Exchange Act (17 CFR 240.14a-12)
Pre-commencement communications pursuant to Rule 14d-2(b) under the Exchange Act (17 CFR 240-14d-2(b))
Pre-commencement communications pursuant to Rule 13e-4(c) under the Exchange Act (17 CFR 240.13e-4(c))

Securities Registered Pursuant to Section 12(b) of the Act
Title of each classTrading
Symbol(s)
Name of each exchange
on which registered
Common Shares (Par Value $1.00 Per Share)TNew York Stock Exchange
Depositary Shares, each representing a 1/1000th interest in a share of 5.000% Perpetual Preferred Stock, Series AT PRANew York Stock Exchange
Depositary Shares, each representing a 1/1000th interest in a share of 4.750% Perpetual Preferred Stock, Series CT PRCNew York Stock Exchange
AT&T Inc. 2.400% Global Notes due March 15, 2024T 24ANew York Stock Exchange
AT&T Inc. Floating Rate Global Notes due March 6, 2025T 25ANew York Stock Exchange
AT&T Inc. 3.550% Global Notes due November 18, 2025T 25BNew York Stock Exchange
AT&T Inc. 3.500% Global Notes due December 17, 2025T 25New York Stock Exchange


Title of each class
 
Trading
Symbol(s)
 
Name of each exchange
on which registered
AT&T Inc. 0.250% Global Notes due March 4, 2026T 26ENew York Stock Exchange
AT&T Inc. 1.800% Global Notes due September 5, 2026T 26DNew York Stock Exchange
AT&T Inc. 2.900% Global Notes due December 4, 2026T 26ANew York Stock Exchange
AT&T Inc. 1.600% Global Notes due May 19, 2028T 28CNew York Stock Exchange
AT&T Inc. 2.350% Global Notes due September 5, 2029T 29DNew York Stock Exchange
AT&T Inc. 4.375% Global Notes due September 14, 2029T 29BNew York Stock Exchange
AT&T Inc. 2.600% Global Notes due December 17, 2029T 29ANew York Stock Exchange
AT&T Inc. 0.800% Global Notes due March 4, 2030T 30BNew York Stock Exchange
AT&T Inc. 3.950% Global Notes due April 30, 2031T 31FNew York Stock Exchange
AT&T Inc. 2.050% Global Notes due May 19, 2032T 32ANew York Stock Exchange
AT&T Inc. 3.550% Global Notes due December 17, 2032T 32New York Stock Exchange
AT&T Inc. 5.200% Global Notes due November 18, 2033T 33New York Stock Exchange
AT&T Inc. 3.375% Global Notes due March 15, 2034T 34New York Stock Exchange
AT&T Inc. 4.300% Global Notes due November 18, 2034T 34CNew York Stock Exchange
AT&T Inc. 2.450% Global Notes due March 15, 2035T 35New York Stock Exchange
AT&T Inc. 3.150% Global Notes due September 4, 2036T 36ANew York Stock Exchange
AT&T Inc. 2.600% Global Notes due May 19, 2038T 38CNew York Stock Exchange
AT&T Inc. 1.800% Global Notes due September 14, 2039T 39BNew York Stock Exchange
AT&T Inc. 7.000% Global Notes due April 30, 2040T 40New York Stock Exchange
AT&T Inc. 4.250% Global Notes due June 1, 2043T 43New York Stock Exchange
AT&T Inc. 4.875% Global Notes due June 1, 2044T 44New York Stock Exchange
AT&T Inc. 4.000% Global Notes due June 1, 2049T 49ANew York Stock Exchange
AT&T Inc. 4.250% Global Notes due March 1, 2050T 50New York Stock Exchange
AT&T Inc. 3.750% Global Notes due September 1, 2050T 50ANew York Stock Exchange
AT&T Inc. 5.350% Global Notes due November 1, 2066TBBNew York Stock Exchange
AT&T Inc. 5.625% Global Notes due August 1, 2067TBCNew York Stock Exchange

Indicate by check mark whether the registrant is an emerging growth company as defined in Rule 405 of the Securities Act of 1933 (§230.405 of this chapter) or Rule 12b-2 of the Securities Exchange Act of 1934 (§240.12b-2 of this chapter).
Emerging growth company 
If an emerging growth company, indicate by check mark if the registrant has elected not to use the extended transition period for complying with any new or revised financial accounting standards provided pursuant to Section 13(a) of the Exchange Act.  ☐


Item 2.02 Results of Operations and Financial Condition.

The registrant announced on April 24, 2024, its results of operations for the first quarter of 2024. The text of the press release and accompanying financial information are attached as exhibits and incorporated herein by reference.

Item 9.01 Financial Statements and Exhibits.
The following exhibits are furnished as part of this report:
(d)
Exhibits
 
  
104Cover Page Interactive Data File (embedded within the Inline XBRL document)


Signature

Pursuant to the requirements of the Securities Exchange Act of 1934, the Registrant has duly caused this report to be signed on its behalf by the undersigned hereunto duly authorized.
 AT&T INC.


Date: April 24, 2024
By: /s/ Sabrina Sanders                                .
      Sabrina Sanders
Senior Vice President - Chief Accounting Officer
   and Controller

imagea.jpg

AT&T Delivers Strong First-Quarter Cash from Operations and Free Cash Flow Powered by 5G and Fiber Growth
Company’s investment-led approach and connectivity momentum
fuels Mobility service and broadband revenue growth

DALLAS, April 24, 2024 — AT&T Inc. (NYSE: T) reported first-quarter results that highlighted consistent 5G and fiber customer additions and showcased profitable growth driven by increased Mobility service and broadband revenues.
First-Quarter Consolidated Results
Revenues of $30.0 billion
Diluted EPS of $0.47; adjusted EPS* of $0.55
Operating income of $5.8 billion; adjusted operating income* of $6.0 billion
Net income of $3.8 billion; adjusted EBITDA* of $11.0 billion
Cash from operating activities of $7.5 billion, up $0.9 billion year over year
Capital expenditures of $3.8 billion; capital investment* of $4.6 billion
Free cash flow* of $3.1 billion, up $2.1 billion year over year

First-Quarter Highlights
349,000 postpaid phone net adds with an expected industry-leading postpaid
phone churn of 0.72%
Mobility service revenues of $16.0 billion, up 3.3% year over year
252,000 AT&T Fiber net adds; 17th consecutive quarter of 200,000+ net adds
Consumer broadband revenues of $2.7 billion, up 7.7% year over year
27.1 million consumer and business locations passed with fiber

“Our results this quarter reflect continued strong growth in our Mobility and Consumer Wireline connectivity businesses, which represent about 80% of our total revenues,” said John Stankey, AT&T CEO. “Customers are choosing AT&T and staying with us. We achieved a record-low first-quarter postpaid phone churn, grew consumer broadband subscribers for the third consecutive quarter, and expanded margins in Mobility and Consumer Wireline. We’re also delivering on our commitment to grow and improve the quality and cadence of free cash flow, which increased by more than $2 billion year over year. This consistent, solid performance driven by our investment-led strategy gives us confidence to re-affirm our full-year consolidated financial guidance.”

* Further clarification and explanation of non-GAAP measures and reconciliations to their most comparable GAAP measures can be found in the “Non-GAAP Measures and Reconciliations to GAAP Measures” section of the release and at https://investors.att.com.

© 2024 AT&T Intellectual Property. All rights reserved. AT&T and the Globe logo are registered trademarks of AT&T Intellectual Property.

imagea.jpg
2024 Outlook
For the full year, AT&T reiterates guidance of:
Wireless service revenue growth in the 3% range.
Broadband revenue growth of 7%+.
Adjusted EBITDA* growth in the 3% range.
Capital investment* in the $21-$22 billion range.
Free cash flow* in the $17-$18 billion range.
Adjusted EPS* in the $2.15-$2.25 range.
In 2025, the company expects to deliver Adjusted EPS* growth.

Note: AT&T’s first-quarter earnings conference call will be webcast at 8:30 a.m. ET on Wednesday, April 24, 2024. The webcast and related materials, including financial highlights, will be available at https://investors.att.com.
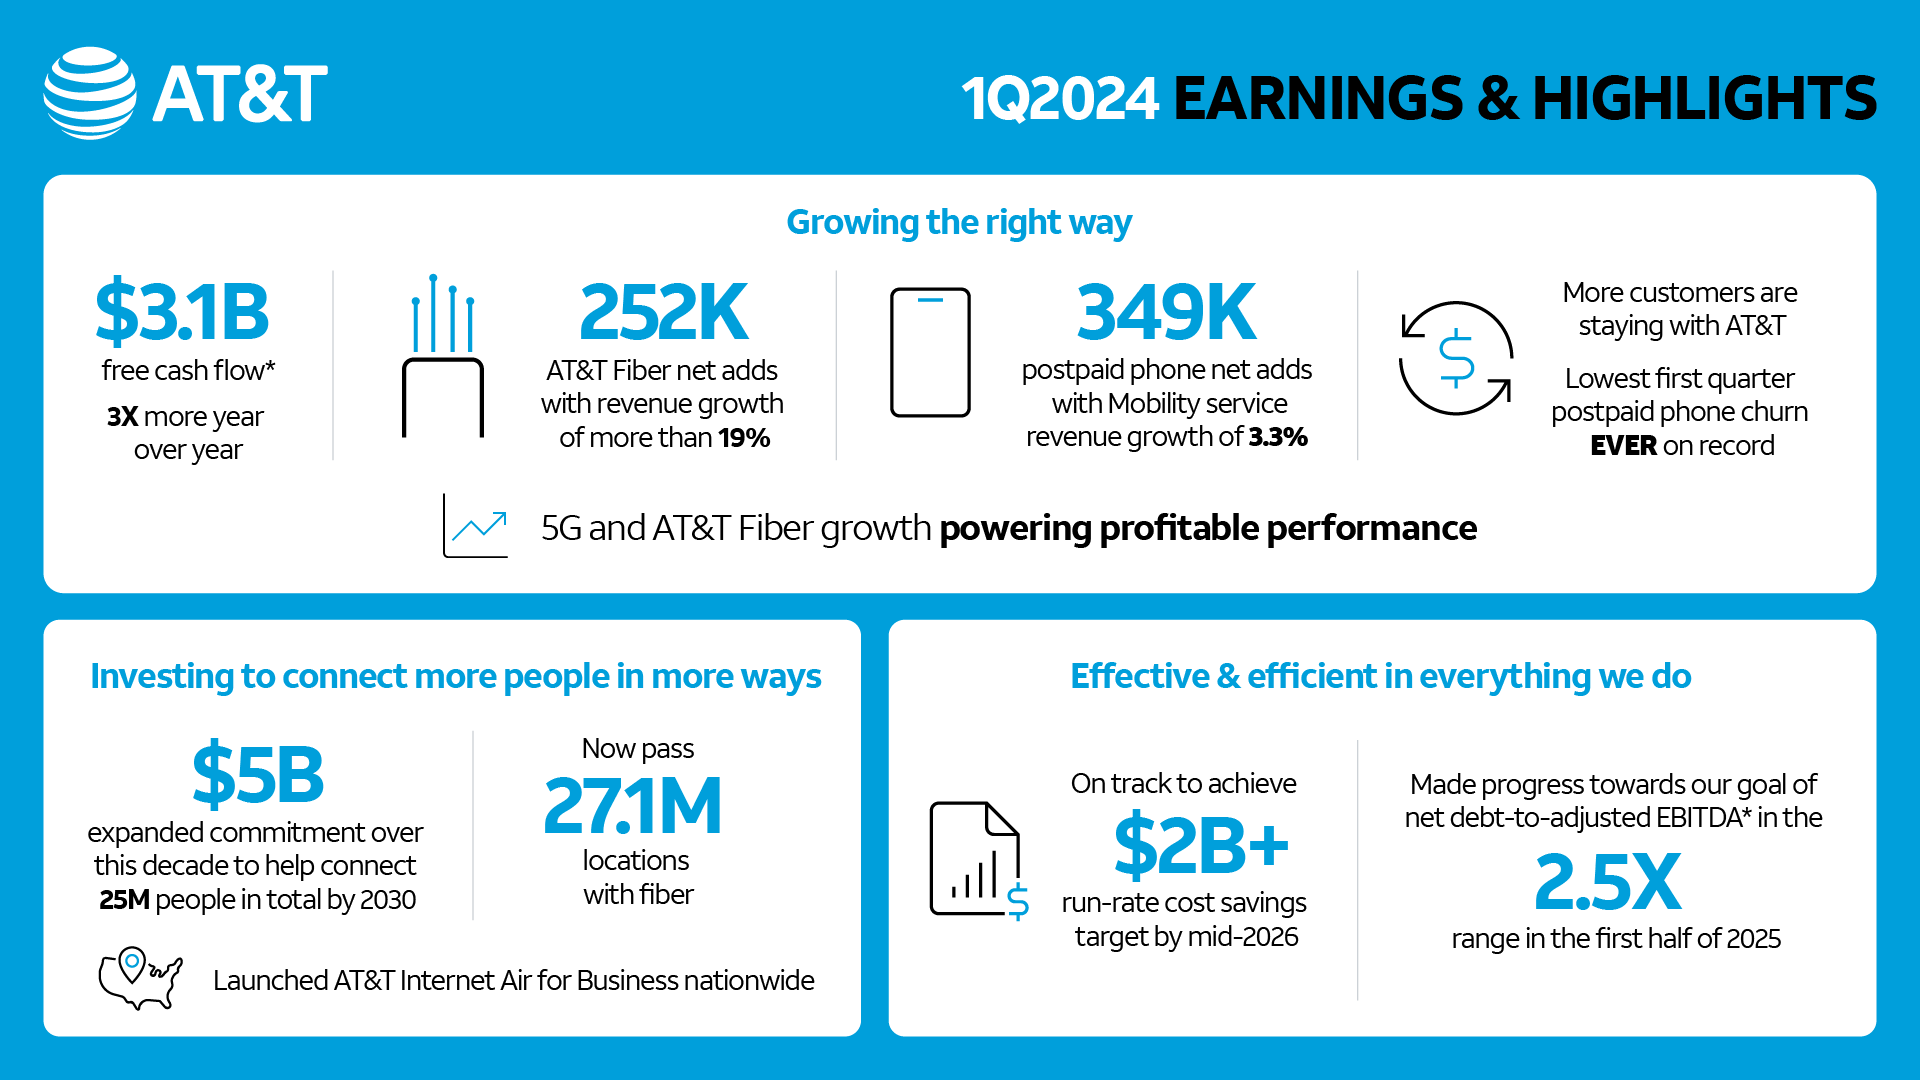
image_0a.jpg

* Further clarification and explanation of non-GAAP measures and reconciliations to their most comparable GAAP measures can be found in the “Non-GAAP Measures and Reconciliations to GAAP Measures” section of the release and at https://investors.att.com.

© 2024 AT&T Intellectual Property. All rights reserved. AT&T and the Globe logo are registered trademarks of AT&T Intellectual Property.

imagea.jpg
Consolidated Financial Results
Revenues for the first quarter totaled $30.0 billion versus $30.1 billion in the year-ago quarter, down 0.4%. This was due to declines in Mobility equipment revenues, driven mainly by lower sales volumes, and lower Business Wireline revenues. This was mostly offset by increased service revenues, driven by Mobility, Consumer Wireline, and Mexico. Revenue trends also include increases from favorable impacts of foreign exchange rates in Mexico.
Operating expenses were $24.2 billion, essentially stable with $24.1 billion in the year-ago quarter. Operating expenses increased primarily due to higher depreciation related to our continued fiber and 5G investment, accelerated depreciation on wireless network equipment due to Open RAN transformation and associated restructuring charges. This was largely offset by lower Mobility equipment costs from lower sales volumes and benefits from continued transformation.
Operating income was $5.8 billion versus $6.0 billion in the year-ago quarter. When adjusting for certain items, adjusted operating income* was $6.0 billion, essentially flat with the year-ago quarter.
Equity in net income of affiliates was $0.3 billion, primarily from the DIRECTV investment. With adjustment for our proportionate share of intangible amortization, adjusted equity in net income from the DIRECTV investment* was $0.6 billion.
Net income was $3.8 billion versus $4.5 billion in the year-ago quarter.
Net income attributable to common stock was $3.4 billion versus $4.2 billion in the year-ago quarter. Earnings per diluted common share was $0.47 versus $0.57 in the year-ago quarter. Adjusting for $0.08, which includes restructuring and non-cash impairments, our proportionate share of intangible amortization from the DIRECTV equity method investment, and other items, adjusted earnings per diluted common share* was $0.55 compared to $0.60 in the year-ago quarter.
Adjusted EBITDA was $11.0 billion versus $10.6 billion in the year-ago quarter.
Cash from operating activities was $7.5 billion, up $0.9 billion year over year, due to operational growth and timing of working capital, including higher receivable sales, partially offset by higher mobile device payments.
Capital expenditures were $3.8 billion in the quarter versus $4.3 billion in the year-ago quarter. Capital investment*, which includes $0.8 billion of cash payments for vendor financing, totaled $4.6 billion versus $6.4 billion in the year-ago quarter.
Free cash flow* was $3.1 billion for the quarter versus $1.0 billion in the year-ago quarter.
Total debt was $132.8 billion at the end of the first quarter, and net debt* was $128.7 billion. In the quarter, the company repaid $4.7 billion of long-term debt. The company continues to expect to achieve net debt-to-adjusted EBITDA* in the 2.5x range in the first half of 2025.

* Further clarification and explanation of non-GAAP measures and reconciliations to their most comparable GAAP measures can be found in the “Non-GAAP Measures and Reconciliations to GAAP Measures” section of the release and at https://investors.att.com.

© 2024 AT&T Intellectual Property. All rights reserved. AT&T and the Globe logo are registered trademarks of AT&T Intellectual Property.

imagea.jpg
Segment and Business Unit Results

Communications Segment
Dollars in millionsFirst QuarterPercent
Unaudited20242023Change
  
Operating Revenues $ 28,857  $ 29,152  (1.0%)
Operating Income                      6,745                       6,743 ---%
Operating Income Margin
23.4%23.1%30 BP

Communications segment revenues were $28.9 billion, down 1.0% year over year, with operating income essentially flat year over year.

Mobility
Dollars in millions; Subscribers in thousandsFirst QuarterPercent
Unaudited20242023Change
  
Operating Revenues $ 20,594
 $ 20,582
0.1%
 Service
                    15,994                     15,483 3.3%
 Equipment
                      4,600                       5,099  (9.8%)
Operating Expenses                    14,126                     14,311  (1.3%)
Operating Income                      6,468                       6,271 3.1%
Operating Income Margin
31.4%30.5%90 BP
  
EBITDA* $ 8,955  $ 8,369 7.0%
EBITDA Margin*
43.5%40.7%280 BP
EBITDA Service Margin*
56.0%54.1%190 BP
  
Total Wireless Net Adds (excl. Connected Devices)1
                         741                       690 
Postpaid
                        389
                         542  
Postpaid phone
                         349                          424 
Postpaid other
                           40                          118  
Prepaid phone
                             1                            40  
  
Postpaid Churn0.89 %0.99 % (10 BP)
Postpaid Phone-Only Churn0.72 %0.81 % (9 BP)
Prepaid Churn2.77 %2.73 %4 BP
  
Postpaid Phone ARPU$55.57 $55.05 0.9%

Mobility grew service revenue 3.3% with record-low 1Q postpaid phone churn of 0.72% that contributed to postpaid phone net adds of 349,000 and year-over-year margin expansion.

Mobility revenues were up 0.1% year over year, driven by service revenue growth of 3.3% from subscriber and postpaid ARPU growth, offset by lower equipment revenues due to lower sales volumes. Operating expenses were down 1.3% year over year due to lower equipment expenses resulting from lower device sales, partially offset by higher depreciation expense due to our Open RAN deployment and network transformation. Operating income was $6.5 billion, up 3.1% year over year. EBITDA* was $9.0 billion, up $586 million year over year, reflecting service revenue growth. This was the company’s highest first-quarter Mobility EBITDA*.

* Further clarification and explanation of non-GAAP measures and reconciliations to their most comparable GAAP measures can be found in the “Non-GAAP Measures and Reconciliations to GAAP Measures” section of the release and at https://investors.att.com.

© 2024 AT&T Intellectual Property. All rights reserved. AT&T and the Globe logo are registered trademarks of AT&T Intellectual Property.

imagea.jpg

Business Wireline
Dollars in millionsFirst QuarterPercent
Unaudited20242023Change
  
Operating Revenues $ 4,913  $ 5,331  (7.8%)
Operating Expenses                      4,849                       4,953  (2.1%)
Operating Income                           64                          378  (83.1%)
Operating Income Margin
1.3%7.1% (580 BP)
  
EBITDA* $ 1,426  $ 1,708  (16.5%)
EBITDA Margin*
29.0%32.0% (300 BP)

Business Wireline revenues and profitability declined year over year, driven by intensifying secular pressures on legacy voice and data services that were partially offset by growth in fiber and other advanced connectivity services.

Business Wireline revenues were down 7.8% year over year, primarily due to lower demand for legacy voice and data services as well as product simplification, partially offset by growth in connectivity services, and non-recurring equipment revenues. Operating expenses were down 2.1% year over year, due to lower personnel costs, and lower marketing and customer support expenses, partially offset by higher equipment costs. Operating income was $64 million, down 83.1% year over year, and EBITDA* was $1.4 billion, down $282 million.

Consumer Wireline
Dollars in millions; Subscribers in thousandsFirst QuarterPercent
Unaudited20242023Change
  
Operating Revenues $ 3,350  $ 3,239 3.4%
Broadband
                      2,722                       2,527 7.7%
Operating Expenses                      3,137                       3,145  (0.3%)
Operating Income                         213                            94 ---%
Operating Income Margin
6.4%2.9%350 BP
    
EBITDA* $ 1,094  $ 955 14.6%
EBITDA Margin*
32.7%29.5%320 BP
    
Broadband Net Adds (excluding DSL)
                           55                          (23)  
Fiber
                         252                          272  
Non Fiber
                       (197)                       (295)
AT&T Internet Air
                         110                               -  

Broadband ARPU$65.98$61.317.6%
Fiber ARPU$68.61$65.924.1%

Consumer Wireline achieved positive broadband net adds for the third consecutive quarter, driven by 252,000 AT&T Fiber net additions and the recent launch of AT&T Internet Air.

Consumer Wireline revenues were up 3.4% year over year, driven by growth in broadband revenues attributable to fiber revenues, which grew 19.5%, partially offset by declines in legacy voice and data services and other services. Operating expenses were down 0.3% year over year, largely driven by lower customer support costs that were offset by increased network-related costs and depreciation. Operating income was $213 million versus $94 million in the prior-year quarter, and EBITDA* was $1.1 billion, up $139 million year over year.
* Further clarification and explanation of non-GAAP measures and reconciliations to their most comparable GAAP measures can be found in the “Non-GAAP Measures and Reconciliations to GAAP Measures” section of the release and at https://investors.att.com.

© 2024 AT&T Intellectual Property. All rights reserved. AT&T and the Globe logo are registered trademarks of AT&T Intellectual Property.

imagea.jpg
Latin America Segment – Mexico
Dollars in millions; Subscribers in thousandsFirst QuarterPercent
Unaudited20242023Change
  
Operating Revenues $ 1,063  $ 883 20.4%
 Service
                         690                          591 16.8%
 Equipment
                         373                          292 27.7%
Operating Expenses                      1,060                          913 16.1%
Operating Income/(Loss)                             3                           (30)---%
EBITDA*                         180                          145 24.1%
  
Total Wireless Net Adds                         143                            10  
Postpaid
                         116                            49  
Prepaid
                           79                           (58) 
Reseller
                         (52)                           19  

Latin America segment revenues were up 20.4% year over year, primarily due to favorable impacts of foreign exchange rates, higher equipment sales and subscriber growth. Operating expenses were up 16.1% due to unfavorable impact of foreign exchange and higher equipment costs attributable to subscriber growth. Operating income was $3 million compared to ($30) million in the year-ago quarter. EBITDA* was $180 million, up $35 million year over year.

1 Effective with our first-quarter 2024 reporting, we have removed connected devices from our total Mobility subscribers, consistent with industry standards and our key performance metrics. Connected devices include data-centric devices such as session-based tablets, monitoring devices and primarily wholesale automobile systems.

About AT&T
We help more than 100 million U.S. families, friends and neighbors, plus nearly 2.5 million businesses, connect to greater possibility. From the first phone call 140+ years ago to our 5G wireless and multi-gig internet offerings today, we @ATT innovate to improve lives. For more information about AT&T Inc. (NYSE:T), please visit us at about.att.com. Investors can learn more at investors.att.com.

Cautionary Language Concerning Forward-Looking Statements
Information set forth in this news release contains financial estimates and other forward-looking statements that are subject to risks and uncertainties, and actual results might differ materially. A discussion of factors that may affect future results is contained in AT&T’s filings with the Securities and Exchange Commission. AT&T disclaims any obligation to update and revise statements contained in this news release based on new information or otherwise. This news release may contain certain non-GAAP financial measures. Reconciliations between the non-GAAP financial measures and the GAAP financial measures are available on the company’s website at https://investors.att.com.

Non-GAAP Measures and Reconciliations to GAAP Measures
Schedules and reconciliations of non-GAAP financial measures cited in this document to the most directly comparable financial measures under generally accepted accounting principles (GAAP) can be found at https://investors.att.com and in our Form 8-K dated April 24, 2024. Adjusted diluted EPS, adjusted operating income, EBITDA, adjusted EBITDA, free cash flow, net debt and net debt-to-adjusted EBITDA are non-GAAP financial measures frequently used by investors and credit rating agencies.

* Further clarification and explanation of non-GAAP measures and reconciliations to their most comparable GAAP measures can be found in the “Non-GAAP Measures and Reconciliations to GAAP Measures” section of the release and at https://investors.att.com.

© 2024 AT&T Intellectual Property. All rights reserved. AT&T and the Globe logo are registered trademarks of AT&T Intellectual Property.

imagea.jpg
Adjusted diluted EPS is calculated by excluding from operating revenues, operating expenses, other income (expenses) and income tax expense, certain significant items that are non-operational or non-recurring in nature, including dispositions and merger integration and transaction costs, actuarial gains and losses, significant abandonments and impairment, benefit-related gains and losses, employee separation and other material gains and losses.

Non-operational items arising from asset acquisitions and dispositions include the amortization of intangible assets. While the expense associated with the amortization of certain wireless licenses and customer lists is excluded, the revenue of the acquired companies is reflected in the measure and those assets contribute to revenue generation.

We also adjust for net actuarial gains or losses associated with our pension and postemployment benefit plans due to the often-significant impact on our results (we immediately recognize this gain or loss in the income statement, pursuant to our accounting policy for the recognition of actuarial gains and losses). Consequently, our adjusted results reflect an expected return on plan assets rather than the actual return on plan assets, as included in the GAAP measure of income.

The tax impact of adjusting items is calculated using the effective tax rate during the quarter except for adjustments that, given their magnitude, can drive a change in the effective tax rate, in these cases we use the actual tax expense or combined marginal rate of approximately 25%.

For 1Q24, adjusted EPS of $0.55 is diluted EPS of $0.47 adjusted for $0.06 restructuring and non-cash impairments, $0.03 proportionate share of intangible amortization at the DIRECTV equity method investment, minus $0.01 benefit-related, transaction and other items.

For 1Q23, adjusted EPS of $0.60 is diluted EPS of $0.57 adjusted for $0.04 proportionate share of intangible amortization at the DIRECTV equity method investment, minus $0.01 benefit-related and other items.

The company expects adjustments to 2024 reported diluted EPS to include our proportionate share of intangible amortization at the DIRECTV equity method investment in the range of $0.5-$0.7 billion, a non-cash mark-to-market benefit plan gain/loss, and other items. The company expects the mark-to-market adjustment, which is driven by interest rates and investment returns that are not reasonably estimable at this time, to be a significant item. Our projected 2024 and 2025 adjusted EPS depend on future levels of revenues and expenses, most of which are not reasonably estimable at this time. Accordingly, we cannot provide a reconciliation between these projected non-GAAP metrics and the reported GAAP metrics without unreasonable effort.

Adjusted operating income is operating income adjusted for revenues and costs we consider non-operational in nature, including items arising from asset acquisitions or dispositions. For 1Q24, adjusted operating income of $6.0 billion is calculated as operating income of $5.8 billion plus $167 million of adjustments. For 1Q23, adjusted operating income of $6.0 billion is calculated as operating income of $6.0 billion minus $27 million of adjustments. Adjustments for all periods are detailed in the Discussion and Reconciliation of Non-GAAP Measures included in our Form 8-K dated April 24, 2024.

EBITDA is net income plus income tax, interest, and depreciation and amortization expenses minus equity in net income of affiliates and other income (expense) – net. Adjusted EBITDA is calculated by excluding from EBITDA certain significant items that are non-operational or non-recurring in nature, including dispositions and merger integration and transaction costs, significant abandonments and impairments, benefit-related gains and losses, employee separation and other material gains and losses. Adjusted EBITDA estimates depend on future levels of revenues and expenses which are not reasonably estimable at this time. Accordingly, we cannot provide a reconciliation between projected adjusted EBITDA and the most comparable GAAP metrics without unreasonable effort.


* Further clarification and explanation of non-GAAP measures and reconciliations to their most comparable GAAP measures can be found in the “Non-GAAP Measures and Reconciliations to GAAP Measures” section of the release and at https://investors.att.com.

© 2024 AT&T Intellectual Property. All rights reserved. AT&T and the Globe logo are registered trademarks of AT&T Intellectual Property.

imagea.jpg
For 1Q24, adjusted EBITDA of $11.0 billion is calculated as net income of $3.8 billion, plus income tax expense of $1.1 billion, plus interest expense of $1.7 billion, minus equity in net income of affiliates of $0.3 billion, minus other income (expense) – net of $0.5 billion, plus depreciation and amortization of $5.0 billion, plus adjustments of $152 million. For 1Q23, adjusted EBITDA of $10.6 billion is calculated as net income of $4.5 billion, plus income tax expense of $1.3 billion, plus interest expense of $1.7 billion, minus equity in net income of affiliates of $0.5 billion, minus other income (expense) – net of $0.9 billion, plus depreciation and amortization of $4.6 billion, minus adjustments of $44 million. Adjustments for all periods are detailed in the Discussion and Reconciliation of Non-GAAP Measures included in our Form 8-K dated April 24, 2024.

At the segment or business unit level, EBITDA is operating income before depreciation and amortization. EBITDA margin is operating income before depreciation and amortization, divided by total revenues. EBITDA service margin is operating income before depreciation and amortization, divided by total service revenues.

Free cash flow for 1Q24 of $3.1 billion is cash from operating activities of $7.5 billion, plus cash distributions from DIRECTV classified as investing activities of $0.2 billion, minus capital expenditures of $3.8 billion and cash paid for vendor financing of $0.8 billion. For 1Q23, free cash flow of $1.0 billion is cash from operating activities of $6.7 billion, plus cash distributions from DIRECTV classified as investing activities of $0.8 billion, minus capital expenditures of $4.3 billion and cash paid for vendor financing of $2.1 billion. Due to high variability and difficulty in predicting items that impact cash from operating activities, cash distributions from DIRECTV, capital expenditures and vendor financing payments, the company is not able to provide a reconciliation between projected free cash flow and the most comparable GAAP metric without unreasonable effort.

Capital investment provides a comprehensive view of cash used to invest in our networks, product developments and support systems. In connection with capital improvements, we have favorable payment terms of 120 days or more with certain vendors, referred to as vendor financing, which are excluded from capital expenditures and reported as financing activities. Capital investment includes capital expenditures and cash paid for vendor financing ($0.8 billion in 1Q24 and $2.1 billion in 1Q23). For 2024, capital investment is expected to be in the $21-$22 billion range. Due to high variability and difficulty in predicting items that impact capital expenditures and vendor financing payments, the company is not able to provide a reconciliation between projected capital investment and the most comparable GAAP metrics without unreasonable effort.

Adjusted equity in net income from DIRECTV investment of $0.6 billion for 1Q24 is calculated as equity income from DIRECTV of $0.3 billion reported in Equity in Net Income of Affiliates and excludes $0.3 billion of AT&T’s proportionate share of the noncash depreciation and amortization of fair value accretion from DIRECTV’s revaluation of assets and purchase price allocation.

Net debt of $128.7 billion at March 31, 2024, is calculated as total debt of $132.8 billion less cash and cash equivalents of $3.5 billion and time deposits (i.e. deposits at financial institutions that are greater than 90 days) of $0.5 billion.

Net debt-to-adjusted EBITDA is calculated by dividing net debt by the sum of the most recent four quarters of adjusted EBITDA. Net debt and adjusted EBITDA are calculated as defined above. Net debt and adjusted EBITDA estimates depend on future levels of revenues, expenses and other metrics which are not reasonably estimable at this time. Accordingly, we cannot provide a reconciliation between projected net debt-to-adjusted EBITDA and the most comparable GAAP metrics and related ratios without unreasonable effort.

For more information, contact:
Brittany Siwald
AT&T Inc.
Phone: (214) 202-6630
Email: [email protected]
* Further clarification and explanation of non-GAAP measures and reconciliations to their most comparable GAAP measures can be found in the “Non-GAAP Measures and Reconciliations to GAAP Measures” section of the release and at https://investors.att.com.

© 2024 AT&T Intellectual Property. All rights reserved. AT&T and the Globe logo are registered trademarks of AT&T Intellectual Property.

AT&T Inc.
Financial Data
Consolidated Statements of Income
Dollars in millions except per share amounts
UnauditedFirst QuarterPercent
20242023Change
Operating Revenues
Service$24,842 $24,617 0.9 %
Equipment5,186 5,522 (6.1)%
Total Operating Revenues30,028 30,139 (0.4)%
Operating Expenses
Cost of revenues
Equipment5,143 5,658 (9.1)%
Other cost of revenues (exclusive of depreciation
   and amortization shown separately below)
6,811 6,673 2.1 %
Selling, general and administrative7,021 7,175 (2.1)%
Asset impairments and abandonments and restructuring159 — — %
Depreciation and amortization5,047 4,631 9.0 %
Total Operating Expenses24,181 24,137 0.2 %
Operating Income5,847 6,002 (2.6)%
Interest Expense1,724 1,708 0.9 %
Equity in Net Income of Affiliates295 538 (45.2)%
Other Income (Expense) — Net451 935 (51.8)%
Income Before Income Taxes4,869 5,767 (15.6)%
Income Tax Expense1,118 1,314 (14.9)%
Net Income3,751 4,453 (15.8)%
Less: Net Income Attributable to Noncontrolling Interest(306)(225)(36.0)%
Net Income Attributable to AT&T$3,445 $4,228 (18.5)%
Less: Preferred Stock Dividends(50)(52)3.8 %
Net Income Attributable to Common Stock$3,395 $4,176 (18.7)%
Basic Earnings Per Share Attributable to Common Stock$0.47 $0.58 (19.0)%
Weighted Average Common Shares Outstanding (000,000)7,192 7,168 0.3 %
Diluted Earnings Per Share Attributable to Common Stock$0.47 $0.57 (17.5)%
Weighted Average Common Shares Outstanding with Dilution (000,000)7,193 7,474 (3.8)%
1


AT&T Inc.  
Financial Data  
Consolidated Balance Sheets
Dollars in millions
Mar. 31,Dec. 31,
20242023
Assets(Unaudited)
Current Assets
Cash and cash equivalents$3,520 $6,722 
Accounts receivable – net of related allowances for credit loss of $463 and $4999,577 10,289 
Inventories2,127 2,177 
Prepaid and other current assets15,221 17,270 
Total current assets30,445 36,458 
Property, Plant and Equipment – Net127,851 128,489 
Goodwill – Net67,854 67,854 
Licenses – Net127,423 127,219 
Other Intangible Assets – Net5,281 5,283 
Investments in and Advances to Equity Affiliates891 1,251 
Operating Lease Right-Of-Use Assets20,668 20,905 
Other Assets19,015 19,601 
Total Assets$399,428 $407,060 
Liabilities and Stockholders’ Equity
Current Liabilities
Debt maturing within one year$7,060 $9,477 
Accounts payable and accrued liabilities31,973 35,852 
Advanced billings and customer deposits3,713 3,778 
Dividends payable2,088 2,020 
Total current liabilities44,834 51,127 
Long-Term Debt125,704 127,854 
Deferred Credits and Other Noncurrent Liabilities
Deferred income taxes58,820 58,666 
Postemployment benefit obligation8,743 8,734 
Operating lease liabilities17,291 17,568 
Other noncurrent liabilities23,441 23,696 
Total deferred credits and other noncurrent liabilities108,295 108,664 
Redeemable Noncontrolling Interest1,975 1,973 
Stockholders’ Equity
Preferred stock — 
Common stock7,621 7,621 
Additional paid-in capital111,599 114,519 
Retained (deficit) earnings(1,570)(5,015)
Treasury stock(15,277)(16,128)
Accumulated other comprehensive income2,167 2,300 
Noncontrolling interest14,080 14,145 
Total stockholders’ equity118,620 117,442 
Total Liabilities and Stockholders’ Equity$399,428 $407,060 
2


AT&T Inc.  
Financial Data  
Consolidated Statements of Cash Flows
Dollars in millions
UnauditedFirst Quarter
20242023
Operating Activities
Net income$3,751 $4,453 
Adjustments to reconcile net income to net cash provided by operating activities:
Depreciation and amortization5,047 4,631 
Provision for uncollectible accounts472 477 
Deferred income tax expense479 529 
Net (gain) loss on investments, net of impairments201 (93)
Pension and postretirement benefit expense (credit)(471)(670)
Asset impairments and abandonments and restructuring159 — 
Changes in operating assets and liabilities:
Receivables512 620 
Other current assets629 364 
Accounts payable and other accrued liabilities(3,497)(3,409)
Equipment installment receivables and related sales24 (243)
Deferred customer contract acquisition and fulfillment costs103 (22)
Postretirement claims and contributions(54)(89)
Other - net192 130 
Total adjustments3,796 2,225 
Net Cash Provided by Operating Activities 7,547 6,678 
Investing Activities
Capital expenditures(3,758)(4,335)
Acquisitions, net of cash acquired(211)(291)
Dispositions8 15 
Distributions from DIRECTV in excess of cumulative equity in earnings194 774 
(Purchases), sales and settlements of securities and investments - net1,079 19 
Other - net(273)— 
Net Cash Used in Investing Activities (2,961)(3,818)
Financing Activities
Net change in short-term borrowings with original maturities of three months or less1,933 (536)
Issuance of other short-term borrowings491 3,627 
Repayment of other short-term borrowings(1,996)— 
Issuance of long-term debt 3,366 
Repayment of long-term debt(4,685)(5,945)
Repayment of note payable to DIRECTV (130)
Payment of vendor financing(841)(2,113)
Purchase of treasury stock(157)(188)
Issuance of treasury stock 
Dividends paid(2,034)(2,014)
Other - net(526)219 
Net Cash Used in Financing Activities(7,815)(3,711)
Net increase (decrease) in cash and cash equivalents and restricted cash(3,229)(851)
Cash and cash equivalents and restricted cash beginning of year6,833 3,793 
Cash and Cash Equivalents and Restricted Cash End of Period$3,604 $2,942 
3


AT&T Inc.
Consolidated Supplementary Data
Supplementary Financial Data
Dollars in millions except per share amounts
UnauditedFirst QuarterPercent
20242023Change
Capital expenditures
Purchase of property and equipment$3,721 $4,291 (13.3)%
Interest during construction37 44 (15.9)%
Total Capital Expenditures$3,758 $4,335 (13.3)%
Acquisitions, net of cash acquired
Business acquisitions$ $— — %
Spectrum acquisitions145 63 — %
Interest during construction - spectrum66 228 (71.1)%
Total Acquisitions$211 $291 (27.5)%
Cash paid for interest$2,077 $1,971 5.4 %
Cash paid for income taxes, net of (refunds)$(9)$10 — %
Dividends Declared per Common Share$0.2775 $0.2775 — %
End of Period Common Shares Outstanding (000,000)7,170 7,149 0.3 %
Debt Ratio52.4 %55.9 %(350) BP
Total Employees148,290 157,790 (6.0)%
4


COMMUNICATIONS SEGMENT

The Communications segment provides wireless and wireline telecom and broadband services to consumers located in the U.S. and businesses globally. The Communications segment contains three reporting units: Mobility, Business Wireline and Consumer Wireline.

Segment Results
Dollars in millions
UnauditedFirst QuarterPercent
20242023Change
Segment Operating Revenues
Mobility$20,594 $20,582 0.1 %
Business Wireline4,913 5,331 (7.8)%
Consumer Wireline3,350 3,239 3.4 %
Total Segment Operating Revenues28,857 29,152 (1.0)%
Segment Operating Income
Mobility6,468 6,271 3.1 %
Business Wireline64 378 (83.1)%
Consumer Wireline213 94 — %
Total Segment Operating Income$6,745 $6,743 — %


Supplementary Operating Data
Subscribers and connections in thousands
UnauditedMarch 31,Percent
20242023Change
Broadband Connections
Broadband15,143 15,061 0.5 %
DSL191 284 (32.7)%
Total Broadband Connections15,334 15,345 (0.1)%
Voice Connections
Retail Consumer Switched Access Lines3,934 4,938 (20.3)%
Consumer VoIP Connections
2,467 2,835 (13.0)%
Total Retail Consumer Voice Connections6,401 7,773 (17.7)%
First QuarterPercent
20242023Change
Broadband Net Additions
Broadband65 (14)— %
DSL(19)(27)29.6 %
Total Broadband Net Additions46 (41)— %
5


Mobility

Mobility provides nationwide wireless service and equipment.
Mobility Results
Dollars in millions
UnauditedFirst QuarterPercent
20242023Change
Operating Revenues
Service$15,994 $15,483 3.3 %
Equipment4,600 5,099 (9.8)%
Total Operating Revenues20,594 20,582 0.1 %
Operating Expenses
Operations and support11,639 12,213 (4.7)%
Depreciation and amortization2,487 2,098 18.5 %
Total Operating Expenses14,126 14,311 (1.3)%
Operating Income$6,468 $6,271 3.1 %
Operating Income Margin31.4 %30.5 %90  BP
Supplementary Operating Data
Subscribers and connections in thousands
UnauditedMarch 31,Percent
20242023Change
Mobility Subscribers
Postpaid87,450 85,421 2.4 %
Postpaid phone71,558 70,049 2.2 %
Prepaid19,211 19,200 0.1 %
Reseller7,852 6,192 26.8 %
Total Mobility Subscribers1
114,513 110,813 3.3 %
1Effective with our first-quarter 2024 reporting, we have removed connected devices from our total Mobility subscribers, consistent with industry standards and our key performance metrics. Connected devices include data-centric devices such as session-based tablets, monitoring devices and primarily wholesale automobile systems.
First QuarterPercent
20242023Change
Mobility Net Additions
Postpaid Phone Net Additions349 424 (17.7)%
Total Phone Net Additions350 464 (24.6)%
Postpaid389 542 (28.2)%
Prepaid1 40 (97.5)%
Reseller351 108 — %
Total Mobility Net Additions1
741 690 7.4 %
Postpaid Churn0.89 %0.99 %(10) BP
Postpaid Phone-Only Churn0.72 %0.81 %(9) BP
1Excludes migrations between wireless subscriber categories, including connected devices, and acquisition-related activity during the period.


6


Business Wireline

Business Wireline provides advanced ethernet-based fiber services, IP Voice and managed professional services, as well as our fixed wireless access product and traditional voice and data services and related equipment to business customers.
Business Wireline Results
Dollars in millions
UnauditedFirst QuarterPercent
20242023Change
Operating Revenues
Service$4,700 $5,200 (9.6)%
Equipment213 131 62.6 %
Total Operating Revenues4,913 5,331 (7.8)%
Operating Expenses  
Operations and support3,487 3,623 (3.8)%
Depreciation and amortization1,362 1,330 2.4 %
Total Operating Expenses4,849 4,953 (2.1)%
Operating Income$64 $378 (83.1)%
Operating Income Margin1.3 %7.1 %(580) BP

7


Consumer Wireline

Consumer Wireline provides broadband services, including fiber connections that provide multi-gig services to residential customers in select locations and our fixed wireless access product that provides home internet services. Consumer Wireline also provides legacy telephony voice communication services.
Consumer Wireline Results
Dollars in millions
UnauditedFirst QuarterPercent
20242023Change
Operating Revenues
Broadband$2,722 $2,527 7.7 %
Legacy voice and data services342 396 (13.6)%
Other service and equipment286 316 (9.5)%
Total Operating Revenues3,350 3,239 3.4 %
Operating Expenses
Operations and support2,256 2,284 (1.2)%
Depreciation and amortization881 861 2.3 %
Total Operating Expenses3,137 3,145 (0.3)%
Operating Income$213 $94 — %
Operating Income Margin6.4 %2.9 %350  BP
 
Supplementary Operating Data
Subscribers and connections in thousands
UnauditedMarch 31,Percent
20242023Change
Broadband Connections
Total Broadband and DSL Connections13,930 13,949 (0.1)%
Broadband1
13,784 13,730 0.4 %
Fiber Broadband Connections8,559 7,487 14.3 %
Voice Connections
Retail Consumer Switched Access Lines1,553 1,921 (19.2)%
Consumer VoIP Connections1,869 2,212 (15.5)%
Total Retail Consumer Voice Connections3,422 4,133 (17.2)%
1 Includes AT&T Internet Air
First QuarterPercent
20242023Change
Broadband Net Additions
Total Broadband and DSL Net Additions40 (42)— %
Broadband Net Additions1
55 (23)— %
Fiber Broadband Net Additions252 272 (7.4)%
1 Includes AT&T Internet Air
8


LATIN AMERICA SEGMENT

The segment provides wireless services and equipment to customers in Mexico.
Segment Results
Dollars in millions
UnauditedFirst QuarterPercent
 20242023Change
Operating Revenues
Wireless service$690 $591 16.8 %
Wireless equipment373 292 27.7 %
Total Segment Operating Revenues1,063 883 20.4 %
Operating Expenses
Operations and support883 738 19.6 %
Depreciation and amortization177 175 1.1 %
Total Segment Operating Expenses1,060 913 16.1 %
Operating Income (Loss)$3 $(30)— %
Operating Income Margin0.3 %(3.4)%370  BP
Supplementary Operating Data
Subscribers and connections in thousands
UnauditedMarch 31,Percent
 20242023Change
Mexico Wireless Subscribers
Postpaid5,352 4,973 7.6 %
Prepaid16,742 16,146 3.7 %
Reseller365 494 (26.1)%
Total Mexico Wireless Subscribers22,459 21,613 3.9 %
 First QuarterPercent
 20242023Change
Mexico Wireless Net Additions
Postpaid116 49 — %
Prepaid79 (58)— %
Reseller(52)19 — %
Total Mexico Wireless Net Additions143 10 — %

9


SUPPLEMENTAL SEGMENT RECONCILIATION
Three Months Ended
Dollars in millions
Unaudited
March 31, 2024
RevenuesOperations
and Support
Expenses
EBITDADepreciation
and
Amortization
Operating
Income (Loss)
Communications
Mobility$20,594 $11,639 $8,955 $2,487 $6,468 
Business Wireline4,913 3,487 1,426 1,362 64 
Consumer Wireline3,350 2,256 1,094 881 213 
Total Communications28,857 17,382 11,475 4,730 6,745 
Latin America - Mexico1,063 883 180 177 3 
Segment Total29,920 18,265 11,655 4,907 6,748 
Corporate and Other
Corporate:
DTV-related retained costs 134 (134)120 (254)
Parent administration support 392 (392)1 (393)
Securitization fees26 165 (139) (139)
Value portfolio82 26 56 4 52 
Total Corporate108 717 (609)125 (734)
Certain significant items 152 (152)15 (167)
Total Corporate and Other108 869 (761)140 (901)
AT&T Inc.$30,028 $19,134 $10,894 $5,047 $5,847 
March 31, 2023
RevenuesOperations and Support ExpensesEBITDADepreciation and AmortizationOperating Income (Loss)
Communications
Mobility$20,582 $12,213 $8,369 $2,098 $6,271 
Business Wireline5,331 3,623 1,708 1,330 378 
Consumer Wireline3,239 2,284 955 861 94 
Total Communications29,152 18,120 11,032 4,289 6,743 
Latin America - Mexico883 738 145 175 (30)
Segment Total30,035 18,858 11,177 4,464 6,713 
Corporate and Other
Corporate:
DTV-related retained costs— 169 (169)144 (313)
Parent administration support(9)374 (383)(384)
Securitization fees19 121 (102)— (102)
Value portfolio94 28 66 61 
Total Corporate104 692 (588)150 (738)
Certain significant items— (44)44 17 27 
Total Corporate and Other104 648 (544)167 (711)
AT&T Inc.$30,139 $19,506 $10,633 $4,631 $6,002 
10

Discussion and Reconciliation of Non-GAAP Measures
 
We believe the following measures are relevant and useful information to investors as they are part of AT&T's internal management reporting and planning processes and are important metrics that management uses to evaluate the operating performance of AT&T and its segments. Management also uses these measures as a method of comparing performance with that of many of our competitors. These measures should be considered in addition to, but not as a substitute for, other measures of financial performance reported in accordance with U.S. generally accepted accounting principles (GAAP).

Free Cash Flow

Free cash flow is defined as cash from operations and cash distributions from DIRECTV classified as investing activities minus capital expenditures and cash paid for vendor financing (classified as financing activities). Free cash flow after dividends is defined as cash from operations and cash distributions from DIRECTV classified as investing activities, minus capital expenditures, cash paid for vendor financing and dividends on common and preferred shares. Free cash flow dividend payout ratio is defined as the percentage of dividends paid on common and preferred shares to free cash flow. We believe these metrics provide useful information to our investors because management views free cash flow as an important indicator of how much cash is generated by routine business operations, including capital expenditures and vendor financing, and from our continued economic interest in the U.S. video operations as part of our DIRECTV equity method investment, and makes decisions based on it. Management also views free cash flow as a measure of cash available to pay debt and return cash to shareowners.
Free Cash Flow and Free Cash Flow Dividend Payout Ratio
Dollars in millions 
 First Quarter
 20242023
Net cash provided by operating activities1
$7,547 $6,678 
Add: Distributions from DIRECTV classified as investing activities194 774 
Less: Capital expenditures(3,758)(4,335)
Less: Cash paid for vendor financing(841)(2,113)
Free Cash Flow3,142 1,004 
Less: Dividends paid(2,034)(2,014)
Free Cash Flow after Dividends$1,108 $(1,010)
Free Cash Flow Dividend Payout Ratio64.7 %200.6 %
1Includes distributions from DIRECTV of $324 in the first quarter of 2024 and $534 in the first quarter of 2023.

Cash Paid for Capital Investment

In connection with capital improvements, we negotiate with some of our vendors to obtain favorable payment terms of 120 days or more, referred to as vendor financing, which are excluded from capital expenditures and reported in accordance with GAAP as financing activities. We present an additional view of cash paid for capital investment to provide investors with a comprehensive view of cash used to invest in our networks, product developments and support systems. 
Cash Paid for Capital Investment
Dollars in millions
 First Quarter
 20242023
Capital Expenditures$(3,758)$(4,335)
Cash paid for vendor financing(841)(2,113)
Cash paid for Capital Investment$(4,599)$(6,448)

EBITDA

Our calculation of EBITDA, as presented, may differ from similarly titled measures reported by other companies. For AT&T, EBITDA excludes other income (expense) – net, and equity in net income (loss) of affiliates, as these do not reflect the operating results of our subscriber base or operations that are not under our control. Equity in net income (loss) of affiliates represents the proportionate share of the net income (loss) of affiliates in which we exercise significant influence, but do not control. Because we do not control these entities, management excludes these results when evaluating the performance of our primary operations. EBITDA also excludes interest expense and the provision for income taxes. Excluding these items


eliminates the expenses associated with our capital and tax structures. Finally, EBITDA excludes depreciation and amortization in order to eliminate the impact of capital investments. EBITDA does not give effect to cash used for debt service requirements and thus does not reflect available funds for distributions, reinvestment or other discretionary uses. EBITDA is not presented as an alternative measure of operating results or cash flows from operations, as determined in accordance with GAAP.

EBITDA service margin is calculated as EBITDA divided by service revenues.

These measures are used by management as a gauge of our success in acquiring, retaining and servicing subscribers because we believe these measures reflect AT&T's ability to generate and grow subscriber revenues while providing a high level of customer service in a cost-effective manner. Management also uses these measures as a method of comparing cash generation potential with that of many of its competitors. The financial and operating metrics which affect EBITDA include the key revenue and expense drivers for which management is responsible and upon which we evaluate performance.

We believe EBITDA Service Margin (EBITDA as a percentage of service revenues) to be a more relevant measure than EBITDA Margin (EBITDA as a percentage of total revenue) for our Mobility business unit operating margin. We also use wireless service revenues to calculate margin to facilitate comparison, both internally and externally with our wireless competitors, as they calculate their margins using wireless service revenues as well.

There are material limitations to using these non-GAAP financial measures. EBITDA, EBITDA margin and EBITDA service margin, as we have defined them, may not be comparable to similarly titled measures reported by other companies. Furthermore, these performance measures do not take into account certain significant items, including depreciation and amortization, interest expense, tax expense and equity in net income (loss) of affiliates. For market comparability, management analyzes performance measures that are similar in nature to EBITDA as we present it, and considering the economic effect of the excluded expense items independently as well as in connection with its analysis of net income as calculated in accordance with GAAP. EBITDA, EBITDA margin and EBITDA service margin should be considered in addition to, but not as a substitute for, other measures of financial performance reported in accordance with GAAP.

EBITDA, EBITDA Margin and EBITDA Service Margin
Dollars in millions 
 First Quarter
 20242023
Net Income
$3,751 $4,453 
Additions:  
Income Tax Expense1,118 1,314 
Interest Expense1,724 1,708 
Equity in Net (Income) of Affiliates(295)(538)
Other (Income) Expense - Net(451)(935)
Depreciation and amortization5,047 4,631 
EBITDA10,894 10,633 
Transaction and other costs32 — 
   Benefit-related (gain) loss (39)(44)
Asset impairments and abandonments and restructuring159 — 
Adjusted EBITDA1
$11,046 $10,589 
1See "Adjusting Items" section for additional discussion and reconciliation of adjusted items.
   
2


Segment and Business Unit EBITDA, EBITDA Margin and EBITDA Service Margin
Dollars in millions 
 First Quarter
 20242023
Communications Segment
Operating Income$6,745 $6,743 
  Add: Depreciation and amortization4,730 4,289 
EBITDA$11,475 $11,032 
Total Operating Revenues$28,857 $29,152 
Operating Income Margin23.4 %23.1 %
EBITDA Margin39.8 %37.8 %
Mobility
Operating Income$6,468 $6,271 
  Add: Depreciation and amortization2,487 2,098 
EBITDA$8,955 $8,369 
Total Operating Revenues$20,594 $20,582 
Service Revenues15,994 15,483 
Operating Income Margin31.4 %30.5 %
EBITDA Margin43.5 %40.7 %
EBITDA Service Margin56.0 %54.1 %
Business Wireline
Operating Income$64 $378 
  Add: Depreciation and amortization1,362 1,330 
EBITDA$1,426 $1,708 
Total Operating Revenues$4,913 $5,331 
Operating Income Margin1.3 %7.1 %
EBITDA Margin29.0 %32.0 %
Consumer Wireline
Operating Income$213 $94 
  Add: Depreciation and amortization881 861 
EBITDA$1,094 $955 
Total Operating Revenues$3,350 $3,239 
Operating Income Margin6.4 %2.9 %
EBITDA Margin32.7 %29.5 %
Latin America Segment
Operating Income (Loss)$3 $(30)
  Add: Depreciation and amortization177 175 
EBITDA$180 $145 
Total Operating Revenues$1,063 $883 
Operating Income Margin0.3 %-3.4 %
EBITDA Margin16.9 %16.4 %


3


Adjusting Items

Adjusting items include revenues and costs we consider non-operational in nature, including items arising from asset acquisitions or dispositions, including the amortization of intangible assets. While the expense associated with the amortization of certain wireless licenses and customer lists is excluded, the revenue of the acquired companies is reflected in the measure and that those assets contribute to revenue generation. We also adjust for net actuarial gains or losses associated with our pension and postemployment benefit plans due to the often-significant impact on our results (we immediately recognize this gain or loss in the income statement, pursuant to our accounting policy for the recognition of actuarial gains and losses). Consequently, our adjusted results reflect an expected return on plan assets rather than the actual return on plan assets, as included in the GAAP measure of income.

The tax impact of adjusting items is calculated using the effective tax rate during the quarter except for adjustments that, given their magnitude, can drive a change in the effective tax rate, in these cases we use the actual tax expense or combined marginal rate of approximately 25%.   
Adjusting Items
Dollars in millions 
 First Quarter
 20242023
Operating Expenses  
Transaction and other costs$32 $— 
   Benefit-related (gain) loss(39)(44)
Asset impairments and abandonments and restructuring
159 — 
Adjustments to Operations and Support Expenses152 (44)
   Amortization of intangible assets15 17 
Adjustments to Operating Expenses167 (27)
Other  
 DIRECTV intangible amortization (proportionate share)286 341 
   Benefit-related (gain) loss, impairments of investment and other
254 (111)
Adjustments to Income Before Income Taxes707 203 
Tax impact of adjustments162 46 
Adjustments to Net Income$545 $157 

Adjusted Operating Income, Adjusted Operating Income Margin, Adjusted EBITDA, Adjusted EBITDA margin, Adjusted EBITDA service margin and Adjusted diluted EPS are non-GAAP financial measures calculated by excluding from operating revenues, operating expenses, other income (expenses) and income tax expense, certain significant items that are non-operational or non-recurring in nature, including dispositions and merger integration and transaction costs, actuarial gains and losses, significant abandonments and impairments, benefit-related gains and losses, employee separation and other material gains and losses. Management believes that these measures provide relevant and useful information to investors and other users of our financial data in evaluating the effectiveness of our operations and underlying business trends.

Adjusted Operating Revenues, Adjusted Operating Income, Adjusted Operating Income Margin, Adjusted EBITDA, Adjusted EBITDA margin, Adjusted EBITDA service margin and Adjusted diluted EPS should be considered in addition to, but not as a substitute for, other measures of financial performance reported in accordance with GAAP. AT&T's calculation of Adjusted items, as presented, may differ from similarly titled measures reported by other companies.
4


Adjusted Operating Income, Adjusted Operating Income Margin,
Adjusted EBITDA and Adjusted EBITDA Margin
Dollars in millions 
 First Quarter
 20242023
Operating Income$5,847 $6,002 
Adjustments to Operating Expenses167 (27)
Adjusted Operating Income$6,014 $5,975 
EBITDA$10,894 $10,633 
Adjustments to Operations and Support Expenses152 (44)
Adjusted EBITDA$11,046 $10,589 
Total Operating Revenues$30,028 $30,139 
Operating Income Margin19.5 %19.9 %
Adjusted Operating Income Margin20.0 %19.8 %
Adjusted EBITDA Margin36.8 %35.1 %

Adjusted Diluted EPS
 First Quarter
 20242023
Diluted Earnings Per Share (EPS)$0.47 $0.57 
 DIRECTV intangible amortization (proportionate share)0.03 0.04 
   Restructuring and impairments0.06 — 
   Benefit-related, transaction and other costs(0.01)(0.01)
Adjusted EPS$0.55 $0.60 
Year-over-year growth - Adjusted-8.3 % 
Weighted Average Common Shares Outstanding with Dilution (000,000)7,193 7,474 

5


Net Debt to Adjusted EBITDA

Net Debt to EBITDA ratios are non-GAAP financial measures frequently used by investors and credit rating agencies and management believes these measures provide relevant and useful information to investors and other users of our financial data. Our Net Debt to Adjusted EBITDA ratio is calculated by dividing the Net Debt by the sum of the most recent four quarters Adjusted EBITDA. Net Debt is calculated by subtracting cash and cash equivalents and deposits at financial institutions that are greater than 90 days (e.g., certificates of deposit and time deposits), from the sum of debt maturing within one year and long-term debt.
Net Debt to Adjusted EBITDA - 2024
Dollars in millions   
 Three Months Ended 
 June 30,Sept. 30,Dec. 31,March 31,Four Quarters
 
20231
20231
20231
2024
Adjusted EBITDA$11,053 $11,203 $10,555 $11,046 $43,857 
End-of-period current debt    7,060 
End-of-period long-term debt    125,704 
Total End-of-Period Debt    132,764 
Less: Cash and Cash Equivalents    3,520 
Less: Time Deposits500 
Net Debt Balance    128,744 
Annualized Net Debt to Adjusted EBITDA Ratio   2.94 
1As reported in AT&T's Form 8-K filed January 24, 2024.

Net Debt to Adjusted EBITDA - 2023
Dollars in millions   
 Three Months Ended 
 June 30,Sept. 30,Dec. 31,March 31,Four Quarters
 
20221
20221
20221
20231
Adjusted EBITDA$10,330 $10,714 $10,231 $10,589 $41,864 
End-of-period current debt    13,757 
End-of-period long-term debt    123,727 
Total End-of-Period Debt    137,484 
Less: Cash and Cash Equivalents    2,821 
Net Debt Balance    134,663 
Annualized Net Debt to Adjusted EBITDA Ratio  3.22 
1As reported in AT&T's Form 8-K filed January 24, 2024.


6


Supplemental Operational Measures

As a supplemental presentation to our Communications segment operating results, we are providing a view of our AT&T Business Solutions results which includes both wireless and fixed operations. This combined view presents a complete profile of the entire business customer relationship and underscores the importance of mobile solutions to serving our business customers. Our supplemental presentation of business solutions operations is calculated by combining our Mobility and Business Wireline operating units, and then adjusting to remove non-business operations. The following table presents a reconciliation of our supplemental Business Solutions results.
Supplemental Operational Measure
 First Quarter
 March 31, 2024March 31, 2023
 MobilityBusiness
Wireline
Adj.1
Business
Solutions
MobilityBusiness
Wireline
Adj.1
Business
Solutions
Percent
Change
Operating Revenues        
Wireless service$15,994 $ $(13,608)$2,386 $15,483 $— $(13,203)$2,280 4.6 %
Wireline service 4,700  4,700 — 5,200 — 5,200 (9.6)%
Wireless equipment4,600  (3,834)766 5,099 — (4,326)773 (0.9)%
Wireline equipment 213  213 — 131 — 131 62.6 %
Total Operating Revenues20,594 4,913 (17,442)8,065 20,582 5,331 (17,529)8,384 (3.8)%
Operating Expenses        
Operations and support11,639 3,487 (9,526)5,600 12,213 3,623 (10,196)5,640 (0.7)%
EBITDA8,955 1,426 (7,916)2,465 8,369 1,708 (7,333)2,744 (10.2)%
Depreciation and amortization2,487 1,362 (2,033)1,816 2,098 1,330 (1,712)1,716 5.8 %
Total Operating Expenses14,126 4,849 (11,559)7,416 14,311 4,953 (11,908)7,356 0.8 %
Operating Income$6,468 $64 $(5,883)$649 $6,271 $378 $(5,621)$1,028 (36.9)%
Operating Income Margin8.0 %12.3 %(430) BP
1Non-business wireless reported in the Communications segment under the Mobility business unit.
7