Table of Contents
TransAlta Corporation • Annual Information Form 1
Presentation of Information
This Annual Information Form (AIF) is dated Feb. 26, 2026 and the information provided herein is given as of or for the year ended Dec. 31, 2025, unless otherwise noted. All dollar amounts are in Canadian dollars, unless otherwise noted. All references to the "Company" and to "TransAlta", "we", "our" and "us" refer to TransAlta Corporation and its subsidiaries on a consolidated basis. Reference to "TransAlta Corporation" refers to TransAlta Corporation only. Certain capitalized terms defined throughout the body of this AIF and abbreviations and acronyms that may not otherwise be defined are defined in Appendix "B" – Glossary of Terms.
Certain portions of TransAlta's management's discussion and analysis dated Feb. 26, 2026 (MD&A) are incorporated by reference into this AIF as stated below and noted elsewhere in this AIF. The MD&A can be found on SEDAR+ at www.sedarplus.ca and EDGAR at www.sec.gov.
References to our 2025 Sustainability Report dated Feb. 26, 2026 are provided for informational purposes only and no information contained therein is incorporated by reference into this AIF.
Forward-Looking Statements
This AIF, including the MD&A incorporated by reference herein, includes "forward-looking information," within the meaning of applicable Canadian securities laws, and "forward-looking statements," within the meaning of applicable U.S. securities laws, including the Private Securities Litigation Reform Act of 1995 (collectively referred to herein as forward-looking statements).
Forward-looking statements are not facts, but only predictions and generally can be identified by the use of statements that include phrases such as "may", "will", "can", "could", "would", "shall", "believe", "expect", "estimate", "anticipate", "intend", "plan", "forecast", "foresee", "potential", "enable", "continue" or other comparable terminology. These statements are not guarantees of our future performance, events or results and are subject to risks, uncertainties and other important factors that could cause our actual performance, events or results to be materially different from those set out in or implied by the forward-looking statements.
In particular, this AIF (including the information incorporated by reference herein) contains forward-looking statements about the following, among other things:
•Our projects and facilities, including in respect of Sheerness Unit 1, Centralia Unit 2, our Ontario Wind Facilities and Sundance 6;
•Expected costs and schedules for planned projects, including the Centralia coal-to-gas conversion project;
•Execution of a data centre memorandum of understanding and its framework for phased development of the Keephills site, including the execution of definitive binding agreements with our counterparties for phase 1, the evaluation of opportunities for additional phases of development and the potential for such additional phases of development to aggregate to 1GW of load;
•Expected regulatory processes and outcomes, including in respect of the U.S. Department of Energy Order regarding Centralia Unit 2;
•Our CEO and CFO succession plans;
•Our normal course issuer bid;
•Coal retirements and our strategy to transition to clean electricity;
•Expected industry, market, regulatory and economic conditions;
•The cyclicality of our business; and
•Expected timing and outcomes with respect to legal proceedings and regulatory actions.
The forward-looking statements contained in this AIF (or incorporated herein by reference) are based on many assumptions including, but not limited to, the following:
•No significant changes to applicable laws and regulations, including carbon pricing, renewable energy incentives, royalty rates and climate-related regulations;
•No unexpected delays in obtaining required regulatory and other third-party approvals;
•No material adverse impacts to investment and credit markets;
•No significant changes to power price and hedging assumptions;
TransAlta Corporation • Annual Information Form 2
•No significant changes to gas commodity price assumptions and transport costs;
•No significant changes to interest or foreign exchange rates;
•No significant changes to the demand and growth of renewables generation;
•No significant changes to the integrity and reliability of our facilities;
•No significant changes to the Company's debt and credit ratings;
•No unforeseen changes to economic and market conditions;
•No significant event occurring outside the ordinary course of business;
•No significant changes to the Company's ability to develop, access or implement, on a timely basis and on reasonable terms, the technology necessary to efficiently and effectively operate the Company's assets and achieve expected future results;
•No significant supply chain disruptions or shortages of raw materials or skilled labour;
•No significant changes to the Company's ability to access the capital markets on reasonable terms; and
•No material changes to international trade laws, regulations, agreements, treaties, taxes, tariffs, duties or policies of Canada, the United States or other countries.
These assumptions are based on information currently available to TransAlta, including information obtained from third-party sources. Actual results may differ materially from those predicted.
Factors that may adversely impact what is expressed or implied by forward-looking statements contained in this AIF (or incorporated herein by reference) include, but are not limited to:
•Fluctuations in power prices;
•Changes in supply and demand for electricity;
•Our ability to contract our electricity generation for prices that will provide expected returns;
•Our ability to replace contracts as they expire;
•Risks associated with development projects and acquisitions;
•Our ability to develop, access or implement, on a timely basis and on reasonable terms, the technology necessary to efficiently and effectively operate our assets and achieve expected future results;
•Any difficulty raising needed capital in the future on reasonable terms;
•Our ability to achieve our targets relating to environmental, social and governance (ESG) performance;
•Long-term commitments on gas transportation capacity that may not be fully utilized over time;
•Changes to the legislative, regulatory and political environments, including changes to carbon pricing, renewable energy policies and emissions regulations in Canada, the United States and Australia;
•Environmental requirements and changes in, or liabilities under, these requirements;
•Operational risks involving our facilities, including unplanned outages and equipment failure;
•Disruptions in the transmission and distribution of electricity;
•Grid reliability;
•Reductions in production;
•Impairments and/or writedowns of assets;
•Adverse impacts on our information technology systems and our internal control systems, including increased cybersecurity threats;
•Commodity risk management and energy trading risks;
•Reduced labour availability, ability to continue to staff our operations and facilities and other labour relations matters;
•Disruptions to our supply chains;
•Weather conditions and their impact on electricity generation and demand;
•Climate-change related risks, including the increased frequency and severity of extreme weather events;
•Reductions to our generating units' relative efficiency or capacity factors;
•General economic risks, including deterioration of equity and debt markets, increasing interest rates, changes to foreign exchange rates or rising inflation;
•General domestic and international economic and political developments, including potential trade tariffs;
•Industry risk and competition, including from emerging technologies affecting the demand, generation, distribution or storage of electricity;
•Counterparty credit risk;
•Inadequacy or unavailability of insurance coverage;
•Increases in the Company's income taxes and any risk of reassessments;
TransAlta Corporation • Annual Information Form 3
•Legal, regulatory and contractual disputes and proceedings involving the Company;
•Reputational and stakeholder-related risks; and
•Reliance on key personnel.
The foregoing risk factors, among others, are described in further detail under the heading "Risk Management" in the MD&A, which section is incorporated by reference herein.
Readers are urged to consider these factors carefully when evaluating the forward-looking statements and are cautioned not to place undue reliance on them. The forward-looking statements included in this AIF are made only as of the date hereof and we do not undertake to publicly update these forward-looking statements to reflect new information, future events or otherwise, except as required by applicable laws. The purpose of the financial outlooks contained herein (including as may be incorporated by reference) is to give the reader information about management's current expectations and plans and readers are cautioned that such information may not be appropriate for other purposes.
Corporate Structure
Name and Incorporation
The Company was formed by a Certificate of Amalgamation issued on Oct. 8, 1992. On Dec. 31, 1992, a Certificate of Amendment was issued in connection with a plan of arrangement under the CBCA involving the Company and TransAlta Utilities Corporation (TAU). Effective Jan. 1, 2009, the Company amalgamated with TAU, TransAlta Energy Corporation and Keephills 3 GP Ltd. Effective June 1, 2023, TransAlta Corporation amalgamated with TransAlta Investment Ltd.
We amended our articles at several instances in connection with issuances of preferred shares including on Oct. 1, 2020, when we created the Series I Shares, a new series of redeemable, retractable first preferred shares that were issued to an affiliate of Brookfield Renewable Partners (Brookfield). See the "Capital Structure – Exchangeable Securities" section of this AIF.
TransAlta Corporation • Annual Information Form 4
Intercorporate Relationships
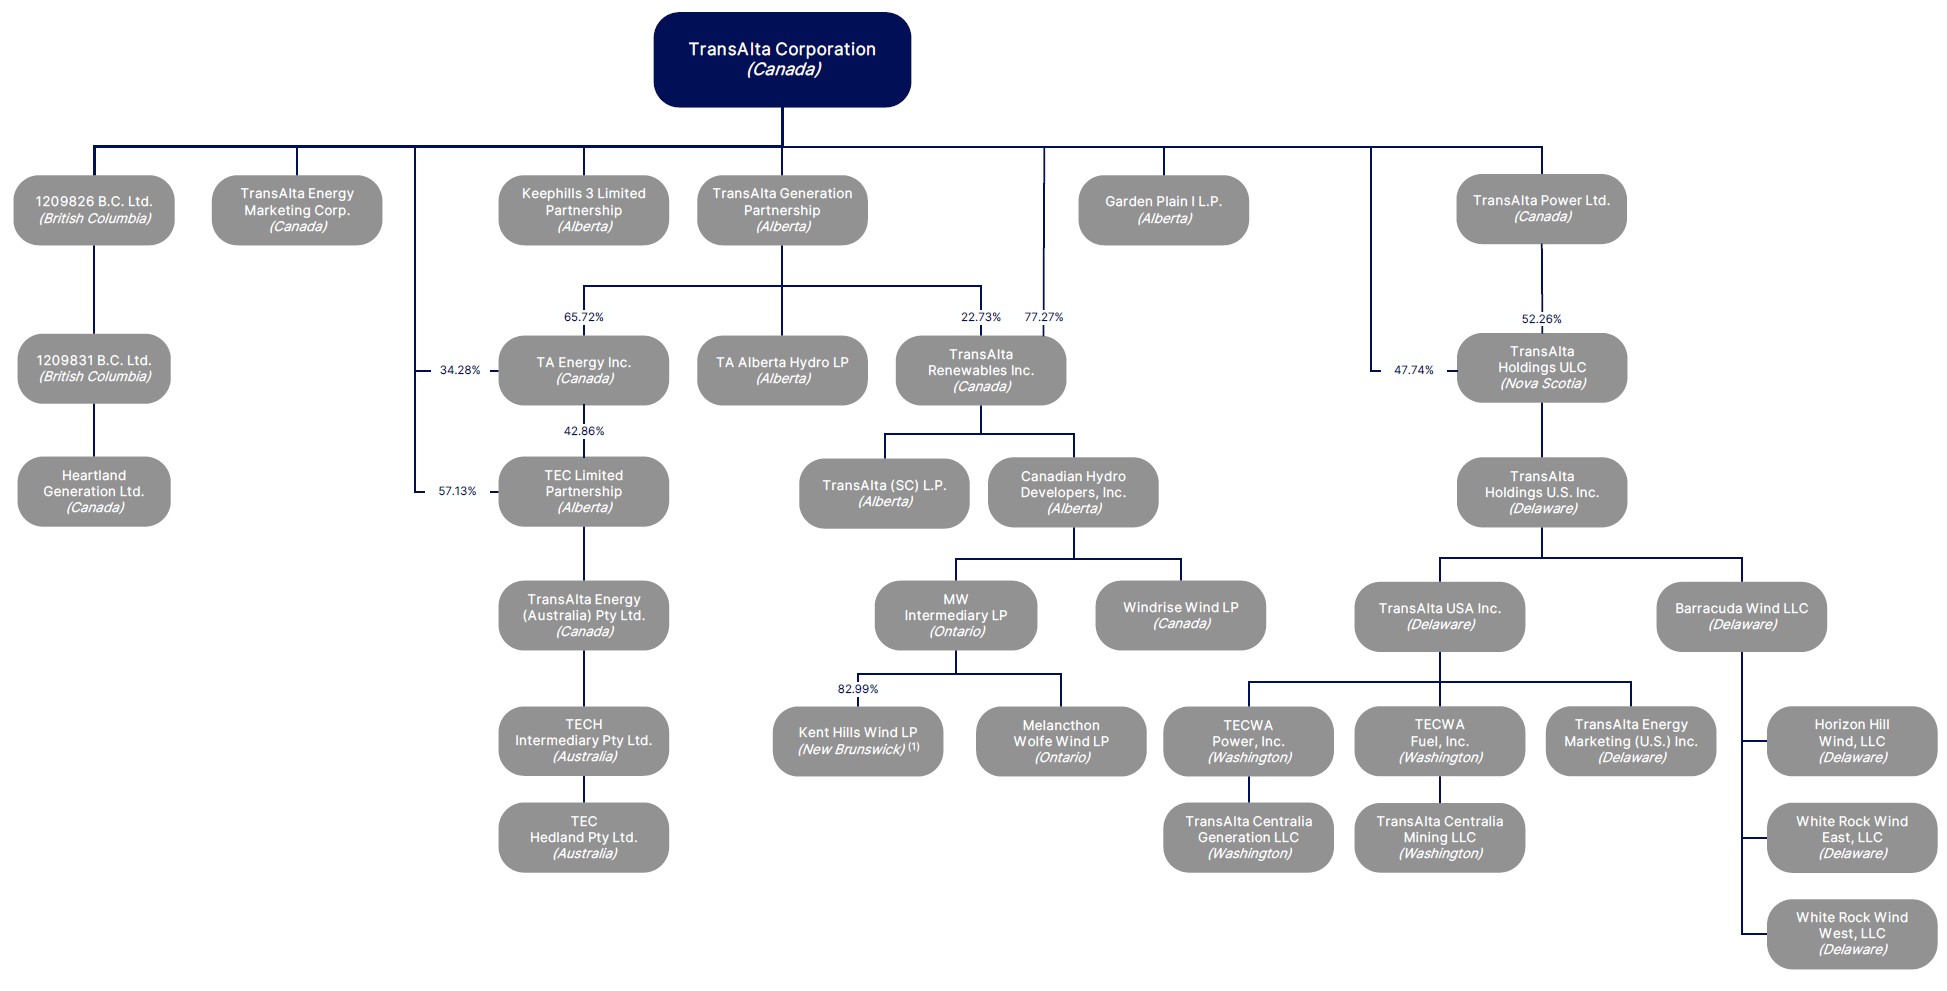
As of Dec. 31, 2025, our principal subsidiaries and their respective jurisdictions of formation are set out in the organization chart below. Our remaining subsidiaries each account for (i) less than 10 per cent of our consolidated assets as at Dec. 31, 2025 and (ii) less than 10 per cent of our consolidated revenues for the year ended Dec. 31, 2025. The diagram below does not include all subsidiaries of TransAlta. The total assets and revenues of excluded subsidiaries in the aggregate did not exceed 20 per cent of our total consolidated assets or total consolidated revenues as at and for the year ended Dec. 31, 2025. Except as otherwise indicated below, we beneficially own, control or direct, directly or indirectly, 100 per cent of the voting shares or units in each of these subsidiaries.
(1) We beneficially own, control or direct, directly or indirectly, 83 per cent of the voting units in Kent Hills Wind LP.
General Development of the Business
Summarized below are significant developments that have occurred in our business during the last three financial years and year to date in 2026. These events include growth, innovation, acquisitions, recontracting, retirement of assets, dispositions, corporate changes, and other events or conditions that have influenced the general development of the Company's business.
Three-Year History
2026
MOU for Data Centre Development at Keephills Site
On Feb. 26, 2026, the Company entered into a Memorandum of Understanding (MOU) with Canada Pension Plan Investments and Brookfield to advance data centre development in Alberta, for which TransAlta will be the exclusive site and power provider. The MOU establishes a framework for phased development at the Company's Keephills site in Parkland County, including an initial long-term power purchase agreement for approximately 230 MW and the evaluation of opportunities for additional development aggregating up to 1 GW
TransAlta Corporation • Annual Information Form 5
of load. Development is subject to regulatory approvals and the parties reaching definitive binding agreements.
Acquisition of Far North Power
On Feb. 2, 2026 the Company closed the acquisition of Far North Power Corporation (Far North)for a purchase price of $95 million from an affiliate of Hut 8 Corporation, subject to working capital and other adjustments. The acquisition adds 310 MW of capacity from four natural gas-fired facilities in our core market of Ontario, increasing the Company's total installed capacity in the province to 1,384 MW.
2025
Mothballing of Sheerness Unit 1
On Dec. 18, 2025, the Company provided notice to the Alberta Electric System Operator (AESO) that Sheerness Unit 1 will be temporarily mothballed effective April 1, 2026, for a period of up to two years. TransAlta maintains the flexibility to return the mothballed unit to service when market fundamentals or contracting opportunities are secured.
Centralia Unit 2
On Dec. 16, 2025, the Company received an order from the United States Department of Energy (DOE) mandating Centralia Unit 2 remain available to operate if called upon for a period of 90 days, until March 16, 2026. We are currently complying with the order and continue to work with the state and federal governments in relation thereto.
On Dec. 9, 2025, we announced the signing of a long-term tolling agreement (Tolling Agreement) with Puget Sound Energy, Inc. (PSE) to convert our Centralia Unit 2 facility from coal to natural gas-fired generation. The Tolling Agreement provides a fixed-price capacity payment that provides PSE the exclusive right to the capacity, energy and ancillary service attributes of, as well as the dispatch rights to, the 700 MW facility. Approximately US$600 million of capital expenditures will be required to extend the useful life of the facility and convert it from coal to natural gas-fired generation. The target commercial operation date is late-2028 and the facility will operate until the end of 2044 under the terms of the Tolling Agreement. We anticipate declaring a final investment decision after receiving all required approvals in early 2027. The Tolling Agreement is subject to customary regulatory approvals, including PSE receiving satisfactory approval from the Washington Utilities and Transportation Commission.
President and Chief Executive Officer Succession
On Nov. 6, 2025, we announced that John Kousinioris, President and Chief Executive Officer and a director of TransAlta, plans to retire effective April 30, 2026. Concurrent with this announcement, the Board of Directors (Board) has appointed Joel Hunter, TransAlta’s Executive Vice President, Finance and Chief Financial Officer, to succeed Mr. Kousinioris as President and Chief Executive Officer and be nominated to join the Board effective April 30, 2026. Mr. Kousinioris has agreed to serve as a strategic advisor to Mr. Hunter and the Board for a period of six months following his retirement.
Demand Transmission Service Contract
On Oct. 3, 2025, we entered into a 230 MW Demand Transmission Service Contract with the AESO, representing the full allocation awarded to us through Phase I of the AESO's Data Centre Large Load Integration Program.
Completion of Required Divestitures
On Aug. 1, 2025, we completed the sale of our 48 MW Poplar Hill facility, followed by completing of the sale of our 50 per cent interest in the 97 MW Rainbow Lake facility on Oct. 2, 2025. Both divestitures were required by the consent agreement entered into with the federal Competition Bureau as part of its regulatory approval for the Company's acquisition of Heartland Generation Ltd.
Recontracting of Ontario Wind Facilities
During the second quarter of 2025, we successfully recontracted our Melancthon 1, Melancthon 2 and Wolfe Island wind facilities through the Ontario Independent Electricity System Operator Five-Year Medium-Term 2 Energy Contract (MT2e). MT2e will replace current energy contracts for the three wind facilities when they expire, extending the contract dates until April 30, 2031, for Melancthon 1 and April 30, 2034, for Melancthon 2 and Wolfe Island.
TransAlta Corporation • Annual Information Form 6
Normal Course Issuer Bid
On May 27, 2025, the Company renewed its normal course issuer bid (NCIB). Pursuant to the NCIB, we may repurchase up to a maximum of 14,000,000 of our common shares. The period during which we are authorized to make purchases under the NCIB commenced on May 31, 2025, and ends on May 30, 2026, or on such earlier date as the Company purchase the maximum number of common shares under the NCIB or elects to terminate the NCIB. For the year ended Dec. 31, 2025, we purchased and cancelled 1,932,800 common shares, at an average price of $12.42 per common share, for a total cost of $24 million, including taxes.
Mothballing of Sundance 6
On April 1, 2025, we mothballed our Sundance Unit 6 facility for a period of up to two years depending on market conditions. We maintain flexibility to return the mothballed unit to service when market fundamentals improve or opportunities to contract are secured.
Nova Clean Energy, LLC
During the first quarter of 2025, we made a strategic investment in Nova Clean Energy, LLC (Nova), a developer of renewable energy projects. Our investment includes a US$75 million term loan and a US$100 million revolving facility. The term loan is convertible to a minority equity interest at our option. This investment provides us with the exclusive right to purchase Nova's late-stage development projects in the western U.S.
2024
Acquisition of Heartland Generation from Energy Capital Partners
On Dec. 4, 2024, the Company closed the acquisition of Heartland Generation Ltd. and certain affiliates (collectively, Heartland) for a purchase price of $542 million from an affiliate of Energy Capital Partners, the parent of Heartland.
Horizon Hill Wind Facility
On May 21, 2024, the 202 MW Horizon Hill wind facility achieved commercial operation. The facility is located in Logan County, Oklahoma and is fully contracted to Meta Platforms Inc. for the offtake of 100 per cent of the generation.
White Rock Wind Facility
On Jan. 1, 2024, the 100 MW White Rock West wind facility achieved commercial operation. On April 22, 2024, the 202 MW White Rock East wind facility also completed commissioning. The facilities are located in Caddo County, Oklahoma and are contracted under two long-term power purchase agreements (PPAs) with Amazon Energy LLC for the offtake of 100 per cent of the generation.
Production Tax Credit (PTC) Sale Agreements
On Feb. 22, 2024, the Company entered into 10-year transfer agreements with an AA- rated customer for the sale of approximately 80 per cent of the expected PTCs to be generated from the White Rock and the Horizon Hill wind facilities. On June 21, 2024, the Company entered into an additional 10-year transfer agreement with an A+ rated customer for the sale of the remaining 20 per cent of the expected PTCs.
Mount Keith West Network Upgrade Project.
Construction of the Mount Keith West Network upgrade project commenced in the fourth quarter of 2024 under the PPA with BHP Nickel West (BHP). The works comprise upgrades to the Mount Keith 132kV network via an extension of existing Gas Insulated Switchgear, new 132kV transformers and new 11kV switchrooms that will replace legacy 11kV switchgear located at TransAlta’s diesel power station.
Mount Keith 132kV Transmission Expansion
The Mount Keith 132kV expansion project was completed during the first quarter of 2024. The expansion was developed under the existing PPA with BHP, which extends until Dec. 31, 2038. The expansion will facilitate the connection of additional generating capacity to the transmission network which supports BHP's operations.
2023
Northern Goldfields Solar Achieves Commercial Operation
On Nov. 22, 2023, the 48 MW Northern Goldfields solar and battery storage facilities achieved commercial operation. The facilities consist of the 27 MW Mount Keith solar facility, the 11 MW Leinster solar facility, the 10
TransAlta Corporation • Annual Information Form 7
MW Leinster battery energy storage system and interconnecting transmission infrastructure, all of which are now integrated into TransAlta’s existing 145 MW Southern Cross Energy North remote network in Western Australia. The facilities are fully contracted to BHP under a PPA expiring in 2038.
Kent Hills Wind Facilities
Our Kent Hills wind facilities were partially returned to service in the fourth quarter of 2023, with all turbines commissioned and the remediation project completed in the first quarter of 2024. On June 2, 2022, we announced the rehabilitation plan for the Kent Hills 1 and 2 wind facilities. In addition to the announcement, TransAlta amended and extended PPAs with New Brunswick Power Corporation (NB Power) in respect of each of the Kent Hills 1, 2 and 3 wind facilities, providing for an additional 10-year contract term to December 2045 and an effective 10 per cent reduction to the original contract prices from January 2023 through December 2033. In addition, both parties have agreed to work in good faith to evaluate the installation of a battery energy storage system at Kent Hills and to consider a potential repowering of Kent Hills at the end of life in 2045.
Garden Plain Wind Facility Reaches Commercial Operations
In August 2023, the Garden Plain wind facility was commissioned adding 130 MW to our gross installed capacity. The facility is fully contracted with Pembina Pipeline Corporation and PepsiCo Canada, with a weighted average contract life of approximately 17 years. The facility consists of 26 Siemens-Gamesa turbines.
Acquisition of TransAlta Renewables Inc.
On Oct. 5, 2023, the Company completed the acquisition of TransAlta Renewables Inc. (TransAlta Renewables) for $1.3 billion, consisting of $800 million of cash and approximately 46 million common shares of the Company. TransAlta's acquisition of TransAlta Renewables' common shares resulted in TransAlta Renewables becoming a wholly owned subsidiary of the Company. Before this, TransAlta and its affiliates collectively owned 60.1 per cent of TransAlta Renewables.
TransAlta Corporation • Annual Information Form 8
Business of TransAlta
TransAlta is one of Canada's largest publicly traded power generators, owning and operating a diverse fleet across Canada, the United States and Western Australia. Our business is comprised of six segments (i) Hydro; (ii) Wind and Solar; (iii) Gas; (iv) Energy Transition; (v) Energy Marketing; and (vi) Corporate. Our Hydro, Wind and Solar, Gas and Energy Transition segments are responsible for operating and maintaining our electrical generation facilities in Canada, the United States and Western Australia. Our Energy Marketing segment is responsible for marketing and scheduling our merchant asset fleet in North America (excluding Alberta) along with the procurement of natural gas, transport and storage for our gas fleet, providing knowledge to support our growth team, and generating a stand-alone gross margin separate from our asset business through a leading North American energy marketing platform and trading.
In Alberta, the Company manages merchant exposure by executing hedging strategies that include a significant base of commercial and industrial customers, supplemented with financial hedges. A significant portion of our thermal generation capacity in Alberta is hedged to provide greater cash flow certainty while also capturing higher returns for our shareholders by optimizing of our merchant generation portfolio.
These segments are all supported by a Corporate segment.
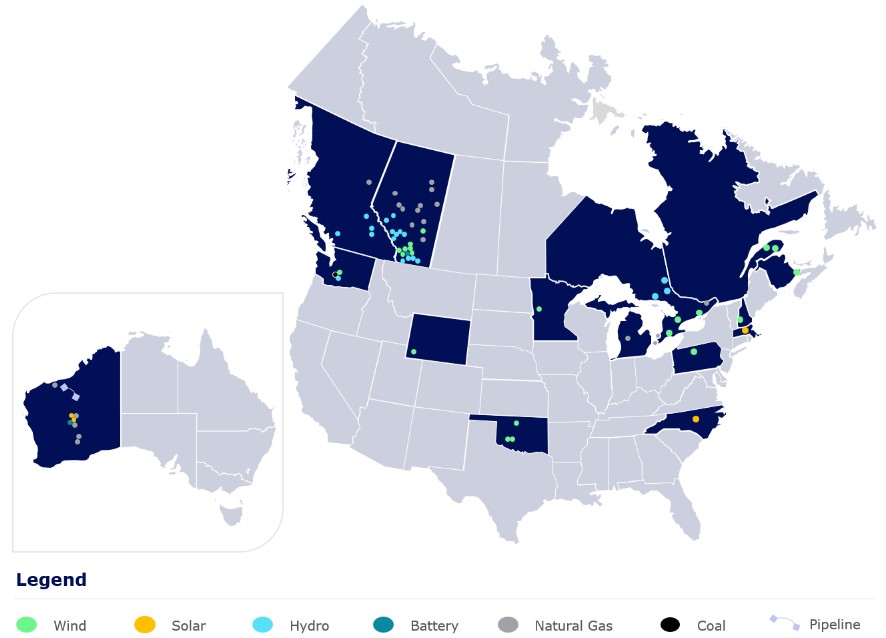
TransAlta's Map of Operations
The following map outlines the Company's operations as of Dec. 31, 2025:
The following sections of this AIF provide detailed information on these business segments.
TransAlta Corporation • Annual Information Form 9
Hydro Segment
The Hydro segment has a net ownership interest of approximately 922 MW of owned hydroelectric generating capacity. The facilities are located in Alberta, British Columbia, and Ontario. As well as contracting for power, we enter into long, and short-term contracts to sell the environmental attributes from our merchant hydro facilities. These activities help to ensure earnings stability from these assets. Generally, for facilities under long-term contracts, the benefit of the environmental attributes generated is provided to the contract holder.
The following table summarizes our hydroelectric facilities as at Dec. 31, 2025:
| | | | | | | | | | | | | | | | | | | | | | | | | | | | | |
| Facility Name | Province | Nameplate Capacity (MW)(1) | Consolidated Interest | Gross Installed Capacity (MW)(1) | Ownership | Net Capacity Ownership Interest (MW)(1) | Commercial Operation Date(2) | Revenue Source(3) | Contract Expiry Date(4) |
Alberta - Bow River System | | | | | | | | |
Barrier(5)(6) | AB | 13 | 100 | % | 13 | 100 | % | 13 | 1947 | Merchant | ‑ |
Bearspaw(5)(6) | AB | 17 | 100 | % | 17 | 100 | % | 17 | 1954 | Merchant | ‑ |
Cascade(5)(6) | AB | 36 | 100 | % | 36 | 100 | % | 36 | 1942, 1957 | Merchant | ‑ |
Ghost(5)(6) | AB | 54 | 100 | % | 54 | 100 | % | 54 | 1929, 1954 | Merchant | ‑ |
Horseshoe(5)(6) | AB | 14 | 100 | % | 14 | 100 | % | 14 | 1911 | Merchant | ‑ |
Interlakes(5)(6) | AB | 5 | 100 | % | 5 | 100 | % | 5 | 1955 | Merchant | ‑ |
Kananaskis(5)(6) | AB | 19 | 100 | % | 19 | 100 | % | 19 | 1913, 1951 | Merchant | ‑ |
Pocaterra(6) | AB | 15 | 100 | % | 15 | 100 | % | 15 | 1955 | Merchant | ‑ |
Rundle(5)(6) | AB | 50 | 100 | % | 50 | 100 | % | 50 | 1951, 1960 | Merchant | ‑ |
Spray(5)(6) | AB | 112 | 100 | % | 112 | 100 | % | 112 | 1951, 1960 | Merchant | ‑ |
Three Sisters(5) | AB | 3 | 100 | % | 3 | 100 | % | 3 | 1951 | Merchant | ‑ |
Alberta - Oldman River System | | | | | | | | |
Belly River(6) | AB | 3 | 100 | % | 3 | 100 | % | 3 | 1991 | Merchant | ‑ |
St. Mary(6) | AB | 2 | 100 | % | 2 | 100 | % | 2 | 1992 | Merchant | ‑ |
Taylor(6) | AB | 13 | 100 | % | 13 | 100 | % | 13 | 2000 | Merchant | ‑ |
Waterton(6) | AB | 3 | 100 | % | 3 | 100 | % | 3 | 1992 | Merchant | ‑ |
Alberta - North Saskatchewan River System(6) | | | | | | | |
Bighorn(5)(6) | AB | 120 | 100 | % | 120 | 100 | % | 120 | 1972 | Merchant | ‑ |
Brazeau(5)(6) | AB | 355 | 100 | % | 355 | 100 | % | 355 | 1965, 1967 | Merchant | ‑ |
| BC Hydro | | | | | | | | | |
Akolkolex(6) | BC | 10 | 100 | % | 10 | 100 | % | 10 | 1995 | LTC | 2046 |
Bone Creek(6) | BC | 19 | 100 | % | 19 | 100 | % | 19 | 2011 | LTC | 2031 |
Pingston(6) | BC | 45 | 50 | % | 22.5 | 100 | % | 23 | 2003, 2004 | LTC | 2043 |
Upper Mamquam(6) | BC | 25 | 100 | % | 25 | 100 | % | 25 | 2005 | LTC | 2045 |
| Ontario Hydro | | | | | | | | |
Misema | ON | 3 | 100 | % | 3 | 100 | % | 3 | 2003 | LTC | 2027 |
Moose Rapids(6) | ON | 1 | 100 | % | 1 | 100 | % | 1 | 1997 | LTC | 2030 |
Ragged Chute | ON | 7 | 100 | % | 7 | 100 | % | 7 | 1991 | LTC | 2029 |
| Total Hydroelectric Capacity | 944 | | 922 | | 922 | | | |
(1) MW are rounded to the nearest whole number. The gross installed capacity reflects the basis of consolidation of underlying assets owned, whereas net capacity ownership interest deducts capacity attributable to the non-controlling interest in these assets and is calculated after the consolidation of underlying assets.
(2) A second date in this column refers to a second unit that was subsequently operational.
(3) The large majority of the Company’s contracted operating facilities benefit from inflation adjustment provisions that apply to all or a portion of revenues under such contracts.
(4) Where no contract expiry date is indicated, the facility operates as merchant.
(5) These facilities form part of the hydro assets that are subject to an Investment Agreement. See the "Capital Structure – Investment Agreement" section of this AIF for further details.
(6) These facilities are EcoLogo® certified. EcoLogo certification is granted to products with an environmental performance that meets or exceeds all government, industrial safety and performance standards.
TransAlta Corporation • Annual Information Form 10
Wind and Solar Segment
The Wind and Solar segment holds interests in approximately 2,559 MW of net wind and solar generating capacity. This capacity consists of 12 wind facilities in Alberta, four in Ontario, two in Québec, three in New Brunswick and eight in the United States, more specifically in Washington, Wyoming, Minnesota, Oklahoma, Pennsylvania and New Hampshire. The Company also holds a 10 MW utility-scale battery energy storage system in Alberta, 143 MW of solar facilities in Massachusetts and North Carolina, and a 38 MW solar facility and a 10 MW battery energy storage system in Western Australia. In addition to contracting for the sale of the power generation, we also enter into long- and short-term contracts to sell the environmental and tax attributes from the merchant wind and solar facilities. These activities help to ensure earnings consistency from these assets. Generally, for facilities under a long-term PPA, the purchaser also benefits from any environmental attributes associated with the facility.
The following table summarizes our Wind and Solar generation facilities as at Dec. 31, 2025:
TransAlta Corporation • Annual Information Form 11
| | | | | | | | | | | | | | | | | | | | | | | | | | | | | |
| Facility Name | Province/ State | Nameplate Capacity (MW)(1) | Consolidated Interest | Gross Installed Capacity (MW)(1) | Ownership | Net Capacity Ownership Interest (MW)(1) | Commercial Operation Date(2) | Revenue Source(3) | Contract Expiry Date(4) |
| Alberta Wind | | | | | | | | |
Ardenville(5) | AB | 69 | 100 | % | 69 | 100 | % | 69 | 2010 | Merchant | ‑ |
Blue Trail and Macleod Flats(5) | AB | 69 | 100 | % | 69 | 100 | % | 69 | 2009 and 2004 | Merchant | ‑ |
Castle River(5)(6) | AB | 44 | 100 | % | 44 | 100 | % | 44 | 1997‑2001 | Merchant | - |
Cowley North(5) | AB | 20 | 100 | % | 20 | 100 | % | 20 | 2001 | Merchant | ‑ |
Garden Plain | AB | 130 | 100 | % | 130 | 100 | % | 130 | 2023 | LTC | 2035-2041 |
McBride Lake(5) | AB | 75 | 50 | % | 38 | 100 | % | 38 | 2004 | Merchant | |
Oldman(5) | AB | 4 | 100 | % | 4 | 100 | % | 4 | 2007 | Merchant | - |
Sinnott(5) | AB | 5 | 100 | % | 5 | 100 | % | 5 | 2001 | Merchant | ‑ |
Soderglen(5) | AB | 71 | 50 | % | 36 | 100 | % | 36 | 2006 | Merchant | ‑ |
Summerview 1(5) | AB | 68 | 100 | % | 68 | 100 | % | 68 | 2004 | Merchant | ‑ |
Summerview 2 (5) | AB | 66 | 100 | % | 66 | 100 | % | 66 | 2010 | Merchant | ‑ |
Windrise | AB | 206 | 100 | % | 206 | 100 | % | 206 | 2021 | LTC | 2041 |
| Alberta Battery Energy Storage | | | | | | | | |
WindCharger | AB | 10 | 100 | % | 10 | 100 | % | 10 | 2020 | Merchant | ‑ |
| Eastern Canada Wind | | | | | | | | |
Kent Breeze | ON | 20 | 100 | % | 20 | 100 | % | 20 | 2011 | LTC | 2031 |
Kent Hills 1 | NB | 96 | 100 | % | 96 | 83 | % | 80 | 2008 | LTC | 2045 |
Kent Hills 2 | NB | 54 | 100 | % | 54 | 83 | % | 45 | 2010 | LTC | 2045 |
Kent Hills 3 | NB | 17 | 100 | % | 17 | 83 | % | 14 | 2018 | LTC | 2045 |
Le Nordais(5)(7) | QC | 98 | 100 | % | 98 | 100 | % | 98 | 1999 | LTC | 2033 |
Melancthon 1 | ON | 68 | 100 | % | 68 | 100 | % | 68 | 2006 | LTC | 2031 |
Melancthon 2 | ON | 132 | 100 | % | 132 | 100 | % | 132 | 2008 | LTC | 2034 |
New Richmond(5) | QC | 68 | 100 | % | 68 | 100 | % | 68 | 2013 | LTC | 2033 |
Wolfe Island | ON | 198 | 100 | % | 198 | 100 | % | 198 | 2009 | LTC | 2034 |
US Wind | | | | | | | | |
Antrim | NH | 29 | 100 | % | 29 | 100 | % | 29 | 2019 | LTC | 2039 |
Big Level | PA | 90 | 100 | % | 90 | 100 | % | 90 | 2019 | LTC | 2034 |
Horizon Hill | OK | 202 | 100 | % | 202 | 100 | % | 202 | 2024 | LTC | - |
Lakeswind | MN | 50 | 100 | % | 50 | 100 | % | 50 | 2014 | LTC | 2034 |
Skookumchuck Wind | WA | 137 | 49 | % | 67 | 100 | % | 67 | 2020 | LTC | 2040 |
White Rock East | OK | 202 | 100 | % | 202 | 100 | % | 202 | 2024 | LTC | - |
White Rock West | OK | 100 | 100 | % | 100 | 100 | % | 100 | 2024 | LTC | - |
Wyoming Wind | WY | 140 | 100 | % | 140 | 100 | % | 140 | 2003 | LTC | 2028 |
US Solar | | | | | | | | |
Mass Solar (7) | MA | 21 | 100 | % | 21 | 100 | % | 21 | 2012-2015 | LTC | 2032-2045 |
North Carolina Solar(7) | NC | 122 | 100 | % | 122 | 100 | % | 122 | 2019-2021 | LTC | 2033 |
Australian Solar | | | | | | | | | |
Northern Goldfields(7) | WA | 38 | 100 | % | 38 | 100 | % | 38 | 2023 | LTC | 2038 |
Australia Battery Energy Storage | | | | | | | | |
Northern Goldfields Battery | WA | 10 | 100 | % | 10 | 100 | % | 10 | 2023 | LTC | 2038 |
Total Wind and Solar Capacity | 2,729 | | 2,587 | | 2,559 | | | |
| | | | |
| | | | | | | | | |
| | | | | | | | | |
| | | | | | | | | |
| | | | | | | | | |
| | | | | | | | | |
| | | | | | | | | |
| | | | | | | | | |
| | | | | | | | | |
| | | | | | | | | |
| | | | | | | | | |
| | | | | | | | | |
(1) MW are rounded to the nearest whole number. The gross installed capacity reflects the basis of consolidation of the underlying assets owned, whereas net capacity ownership interest deducts capacity attributable to non-controlling interest in these assets and is calculated after consolidation of the underlying assets.
(2) A second date in this column refers to a second facility that was subsequently operational.
(3) The large majority of the Company’s contracted operating facilities benefit from inflation adjustment provisions that apply to all or a portion of revenues under such contracts.
TransAlta Corporation • Annual Information Form 12
(4) Where no contract expiry date is indicated, the facility operates as merchant or certain contract terms are confidential and have not been disclosed.
(5) These facilities are EcoLogo® certified. EcoLogo certification is granted to products with an environmental performance that meets or exceeds all government, industrial safety and performance standards.
(6) Includes six additional turbines at other locations.
(7) Includes multiple facilities.
TransAlta Corporation • Annual Information Form 13
Gas Segment
The Gas segment has a net ownership interest of 4,525 MW of owned gas electrical-generating capacity. The facilities are located in British Columbia, Alberta, Ontario, Michigan and Western Australia. This segment includes our ownership interest in a natural gas pipeline located in Western Australia.
The following table summarizes our natural-gas-fired generation facilities as at Dec. 31, 2025:
| | | | | | | | | | | | | | | | | | | | | | | | | | | | | |
| Facility Name | Province/ State | Nameplate Capacity (MW)(1) | Consolidated Interest | Gross Installed Capacity (MW)(1) | Ownership | Net Capacity Ownership Interest (MW)(1) | Commercial Operation Date | Revenue Source(2) | Contract Expiry Date(3) |
British Columbia | | | | | | | | | |
McMahon | BC | 120 | 50 | % | 60 | 100 | % | 60 | 1993 | LTC | 2029 |
| Alberta | | | | | | | | |
Battle River 4 | AB | 155 | 100 | % | 155 | 100 | % | 155 | 1975 | Merchant | - |
Battle River 5 | AB | 395 | 100 | % | 395 | 100 | % | 395 | 1981 | Merchant | - |
Fort Saskatchewan | AB | 118 | 60 | % | 71 | 50 | % | 35 | 1999 | LTC/Merchant | 2029 |
Joffre | AB | 474 | 40 | % | 190 | 100 | % | 190 | 2000 | LTC/Merchant | 2041 |
Keephills Unit No. 2 | AB | 395 | 100 | % | 395 | 100 | % | 395 | 1984 | Merchant | - |
| Keephills Unit No. 3 | AB | 466 | 100 | % | 466 | 100 | % | 466 | 2011 | Merchant | - |
Muskeg River | AB | 202 | 100 | % | 202 | 100 | % | 202 | 2003 | LTC | 2042 |
Poplar Creek(4) | AB | 230 | 100 | % | 230 | 100 | % | 230 | 2001 | LTC | 2030 |
Primrose | AB | 100 | 50 | % | 50 | 100 | % | 50 | 1998 | LTC | 2028 |
Scotford | AB | 195 | 100 | % | 195 | 100 | % | 195 | 2003 | LTC/Merchant | 2043 |
Sheerness Unit No.1 | AB | 400 | 100 | % | 400 | 75 | % | 300 | 1986 | Merchant | - |
| Sheerness Unit No.2 | AB | 400 | 100 | % | 400 | 75 | % | 300 | 1990 | Merchant | - |
Sundance Unit No. 6 | AB | 401 | 100 | % | 401 | 100 | % | 401 | 1980 | Merchant | - |
Valleyview 1 | AB | 50 | 100 | % | 50 | 100 | % | 50 | 2001 | Merchant | - |
Valleyview 2 | AB | 50 | 100 | % | 50 | 100 | % | 50 | 2008 | Merchant | - |
| Total Alberta Gas Capacity | 4,031 | | 3,650 | | 3,414 | | | |
Ontario and United States | | | | |
Ada | MI | 29 | 100 | % | 29 | 100 | % | 29 | 1991 | LTC | 2026 |
Ottawa | ON | 74 | 100 | % | 74 | 50 | % | 37 | 1992 | LTC/Merchant | 2033 |
Sarnia | ON | 499 | 100 | % | 499 | 100 | % | 499 | 2003 | LTC | 2031 |
Windsor | ON | 72 | 100 | % | 72 | 50 | % | 36 | 1996 | LTC/Merchant | 2031 |
Total Ontario and United States Gas Capacity | 674 | | 674 | | 601 | | | |
| Australia | | | | |
| Fortescue River Gas Pipeline | WA | N/A | 43 | % | N/A | 100 | % | N/A | 2015 | LTC | 2035 |
Parkeston | WA | 110 | 50 | % | 55 | 100 | % | 55 | 1996 | LTC/Merchant | 2027 |
South Hedland | WA | 150 | 100 | % | 150 | 100 | % | 150 | 2017 | LTC | 2042 |
Southern Cross (5) | WA | 245 | 100 | % | 245 | 100 | % | 245 | 1996 | LTC | 2038 |
Total Australian Gas Capacity | 505 | | 450 | | 450 | | | |
Total Gas Capacity | 5,330 | | 4,834 | | 4,525 | | | |
(1) MW are rounded to the nearest whole number. The gross installed capacity reflects the basis of consolidation of the underlying assets owned, whereas net capacity ownership interest deducts capacity attributable to non-controlling interest in these assets and is calculated after the consolidation of the underlying assets.
(2) The large majority of the Company’s contracted operating facilities benefit from inflation-adjustment provisions that apply to all or a portion of our revenues under such contracts.
(3) Where no contract expiry date is indicated, the facility operates as merchant.
(4) The Poplar Creek facility is operated by Suncor Energy Inc.
(5) Includes four facilities. Excludes the Northern Goldfields facilities, which are in the Wind and Solar segment.
TransAlta Corporation • Annual Information Form 14
Energy Transition Segment
The Energy Transition segment has a net ownership interest of approximately 671 MW of owned generating capacity. The segment includes one remaining operating unit at Centralia, the Skookumchuck hydro facility, the retired Centralia unit, the retired Alberta thermal units, the Highvale mine and the mine reclamation activities.
The following table summarizes our Energy Transition facilities as at Dec. 31, 2025:
| | | | | | | | | | | | | | | | | | | | | | | | | | | | | |
| Facility Name | Province/ State | Nameplate Capacity (MW)(1) | Consolidated Interest | Gross Installed Capacity (MW)(1) | Ownership | Net Capacity Ownership Interest (MW)(1) | Commercial Operation Date | Revenue Source | Contract Expiry Date |
| US | | | | | | | | | |
| Centralia | WA | 670 | 100 | % | 670 | 100 | % | 670 | 1971 | LTC/Merchant | 2025 |
Skookumchuck(2) | WA | 1 | 100 | % | 1 | 100 | % | 1 | 1970 | LTC | 2025 |
| Total Energy Transition Capacity | 671 | | 671 | | 671 | | | |
(1) MW are rounded to the nearest whole number. The gross installed capacity reflects the basis of consolidation of underlying assets owned, whereas net capacity ownership interest deducts capacity attributable to non-controlling interest in these assets and is calculated after the consolidation of underlying assets.
(2) This facility is used to provide a reliable water supply to the Centralia facility.
Reclamation Activities
Centralia Mine
We own a coal mine adjacent to the Centralia facility, although mining operations were discontinued at the Centralia coal mine on Nov. 27, 2006. The mine is currently in the reclamation phase and we continue to perform reclamation and associated work.
Under the U.S. Federal Mine Safety and Health Act, we must report all citations at our Centralia mine. No injury incidents were reported at the mine in 2025. The total dollar value of all Mine Safety and Health Administration (MSHA) assessments is not material.
| | | | | | | | | | | | | | | | | | | | | | | | | | | | | | | | |
Mine or
Operating
Name/MSHA
Identification
Number | Total Number of Section 104 Violations for which Citations Received | Total Number of Orders Issued Under Section 104(b) | Total Number of Citations and Orders for Unwarrantable Failure to Comply with Mandatory Health or Safety Standards Under Section 104(d) | Total Number of Flagrant Violations Under Section 110(b)(2) | Total Number of Imminent Danger Orders Issued Under Section 107(a) | Total Dollar Value of MSHA Assessments Proposed | Total Number of Mining Related Fatalities | Received
Notice of
Pattern
Violations
Under
Section
104(e)
(yes/no) | Received
Notice of
Potential
to Have
Pattern
Under
Section
104(e)
(yes/no) | Number of Legal Actions Initiated or Pending During Period |
| 4500416 | 8 | 0 | 0 | 0 | 0 | 1,208 (1) | 0 | No | No | 0 |
(1) Citation in Contest: Coalview Centralia LLC ($1,208). The U.S. government has removed TransAlta from any accountability related to the associated citations and penalties.
Highvale Mine
We own the Highvale mine that supplied coal to the previously coal-fired Sundance and Keephills facilities. The Company discontinued all mining operations at the Highvale mine at the end of 2021 and as of Jan. 1, 2022, the mine is in the reclamation phase.
Coal Retirements
In aggregate, TransAlta has retired 4,464 MW of coal-fired generation capacity since 2018 while converting 1,659 MW to cleaner-burning natural gas. The following seven units have been retired: Centralia Thermal No. 1, Keephills 1, and Sundance 1, 2, 3, 4 and 5. The retirements remain consistent with our strategy to transition to clean electricity. Pursuant to the Bill, Centralia Unit 2 was scheduled to cease operation on coal effective Dec. 31, 2025. On Dec. 16, 2025, the Company received an order from the DOE mandating Centralia Unit 2 remain available to operate if called upon for a period of 90 days, until March 16, 2026. We are currently complying with the order and continue to work with the state and federal governments in relation thereto.
TransAlta Corporation • Annual Information Form 15
Energy Marketing Segment
Our Energy Marketing segment provides a number of strategic functions, including the following:
•Gathering and analyzing market trends to enable more effective strategic planning and decision-making;
•Actively engaging in the trading of power, natural gas and environmental products across a variety of North American markets, excluding Alberta;
•Negotiating and managing fuel supply arrangements with third parties for our generation assets, including scheduling, billing and settlement of physical deliveries of natural gas and other fuels; and
•Negotiating and entering into contractual agreements with customers for the sale of output from our generation assets outside of Alberta, including electricity, steam or other energy-related commodities.
The Energy Marketing segment derives all of its revenue by trading electricity and other energy commodities (i.e., fuels and environmental products), by providing fee-based asset management services to third parties and earning margins on third-party gas and power transactions. The origination and trading activities are primarily focused on proprietary trading, with additional focus on the existing assets and customers of the Company.
The key risk control activities of the Energy Marketing segment include the measurement and management of market, credit, operational, reputational, compliance and legal risks. The segment uses value at risk, gross margin at risk and tail risk measures to monitor and manage the risks within our asset and trading portfolios. Value at risk and gross margin at risk measure the potential losses that could occur over a given time period due to changes in market risk factors. Back tests are used to provide further sensitivities to the market risks within the portfolio. Compliance, goodwill and legal risks are managed within our legal and compliance policies, and monitoring tools are used to flag compliance risks. The Energy Marketing segment actively manages the risks within approved limits of our governance policies.
Corporate Segment
Our Corporate segment supports each of the above segments and includes the Company's finance, sustainability, legal, human resources, administrative, business development and investor relations functions.
Competitive Environment
Power generation is an industry in the midst of an exciting transformation and the demand for electricity has the potential to grow significantly over the long-term due to general trends toward electrification and data centre development. We also anticipate the generation mix to undergo a major shift in our key markets. In addition to the need to keep pace with ongoing demand growth for electricity, there are several key factors driving the need for significant investment in new generating capacity, which include, without limitation:
•Coal-based generation is being retired. These retirements are being driven by asset age, as well as government policy that places an escalating price on greenhouse gas (GHG) emissions and, in some cases, mandates the retirement of these assets;
•Government policies that impose costs or provide incentives for lower emission technologies are creating opportunities for renewable generation technologies. These opportunities are coinciding with a significant decline in the installed costs of wind and solar generation and battery storage. As a result, these technologies now account for the majority of the new generating capacity added to many of the world's electricity grids;
•In tandem, the need and value of reliability within electricity systems across TransAlta's portfolio is becoming an important focus for system operators and customers. Opportunities for legacy gas-fired generation are being identified as systems seek to balance renewable demands with the need for reliable generation; and
•Growing electricity demand, from electrification and data centre development, is driving load growth. Electrification is seen as one of the most effective levers to reduce GHG emissions in many sectors, such as transportation. In tandem, growing demand related to artificial intelligence and data centre development is resulting in expanded load forecasts.
TransAlta Corporation • Annual Information Form 16
Alberta
Approximately 58 per cent of our gross installed capacity is located in Alberta. As of Dec. 31, 2025, our portfolio of merchant assets in Alberta is a combination of hydro facilities, wind facilities, a battery storage facility, and natural-gas-fired facilities. This balance of fuel types provides us with portfolio generation diversification, along with capacity that can be monetized as ancillary services or dispatched into the energy market during times of supply tightness. To reduce the exposure from variable spot power prices on our merchant generation, we enter into financial hedges and/or physical retail supply contracts through our Commercial and Industrial Business. The combined liquidity provided by these channels enables us to actively secure revenue, respond to changing market conditions and adjust the proportion of our hedges we have in relation to the expected generation from our asset portfolio.
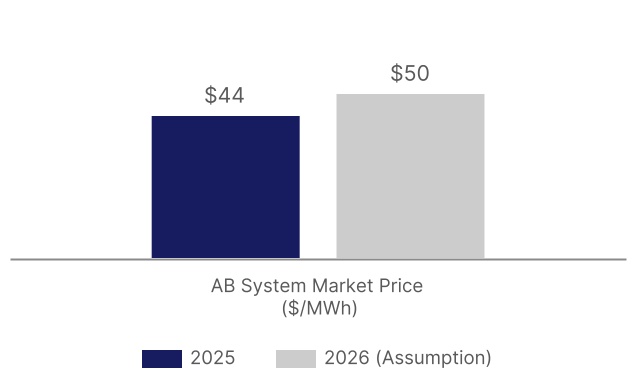
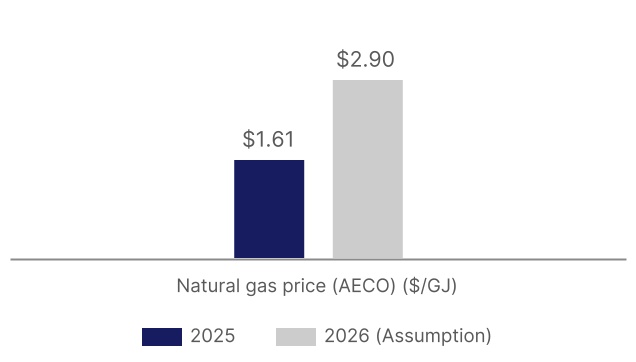
Alberta's annual electricity demand increased from 2024 to 2025 by approximately two per cent. The average pool price in Alberta declined from $63/MWh in 2024 to $44/MWh in 2025. While demand growth was positive, supply additions, notably natural gas and cogeneration, meant that the market was more supplied as compared to 2024. Natural gas prices for the year 2025 were actually higher than 2024 (2.15/GJ vs 1.42/GJ).
We currently expect additional compliance costs as a result of the Canadian federal government’s Greenhouse Gas Pollution Pricing Act, which sets a national price on GHG emissions and requires each province expected to implement a GHG policy equivalent, to continue to rise. We believe our portfolio of assets provides us with brownfield development opportunities in wind, solar, hydro and natural gas that give us an advantage over competitors when constructing generation facilities that use these fuel types.
U.S. Pacific Northwest
Our generating capacity in the U.S. Pacific Northwest includes the remaining Centralia coal unit and our 49 per cent interest in the Skookumchuck wind facility. The Centralia coal unit was scheduled to be legislatively retired on Dec. 31, 2025. On Dec. 16, 2025, the Company received an order from the DOE remain available to operate if called upon for a period of 90 days, until March 16, 2026. We are currently complying with the order and continue to work with the state and federal governments in relation thereto.
System capacity in the region is primarily composed of hydro and gas generation, with some wind additions over the last few years in response to government programs favouring renewable generation. Demand growth in the region has been limited and further constrained by an emphasis on energy efficiency. We expect to see significant change in this market over the next decade as coal generation is retired and renewable portfolio standard requirements continue to strengthen. On Dec. 9, 2025, we announced the signing of the Tolling Agreement with PSE to convert our Centralia Unit 2 facility from coal to natural gas-fired generation. The target commercial operation date is late-2028 and the facility will operate until the end of 2044 under the terms of the Tolling Agreement. We anticipate declaring a final investment decision after receiving all required approvals in early 2027. The Tolling Agreement is subject to customary regulatory approvals, including PSE receiving satisfactory approval from the Washington Utilities and Transportation Commission.
Australia
Our business is solely in Western Australia, and is primarily focused on serving the mining industry and related load across the state including remote, islanded operations. The primary exports from Western Australia are iron ore, natural gas and gold. Commodity exports from Western Australia contribute significantly to the economy, driven by large-scale creditworthy producers. Mining companies are exploring the addition of renewable generation, supported by thermal generation and battery energy storage systems, to new and existing sites to reduce their reliance on gas and diesel. We expect this trend to continue and to create further opportunities for our business in Western Australia.
Contracted Gas and Renewables
We develop and acquire gas and renewable generation facilities in highly competitive markets. Our track record as an experienced operator and developer supports our competitive position. Where possible, we aim to reduce our cost of capital and improve our competitive profile through efficient financing structures. In the United States, our substantial tax attributes further increase our competitiveness.
TransAlta Corporation • Annual Information Form 17
In renewables, we are primarily evaluating greenfield opportunities in Western Canada and the United States, along with acquisitions in markets where we have existing operations. We maintain highly qualified and experienced development teams to identify and develop these opportunities. During the first quarter of 2025, we made a strategic investment in Nova, a developer of renewable energy projects. The investment includes a US$75 million term loan and US$100 million revolving facility. The term loan is convertible to a minority equity interest in Nova at our option. This investment provides us with the exclusive right to purchase Nova's late-stage development projects in the western U.S.
In cogeneration, we are working with experienced development and construction teams to evaluate behind-the-fence solutions. Our existing contracted gas generation facilities are generally well positioned for recontracting given the forecasted demand profile and the substantial cost and timing advantage of recontracting existing generation relative to new builds.
Seasonality and Cyclicality
Our business is cyclical due to: (a) the nature of electricity generation and the limited ability to store electricity; and (b) the variability of wind, solar and run-of-river hydroelectric resources, which fluctuate based on both seasonal patterns and annual weather variation.
Typically, run-of-river hydroelectric facilities and solar facilities generate most of their electricity and revenues during the spring and summer months when the melting snow starts feeding the watersheds and the rivers, and the sun is at its peak. Inversely, wind speeds are historically greater during the cold winter months when the air density is at its peak. Our technological and geographical diversification strategically reduces our exposure to the variations of any one natural resource in any regions. Financial results in any one quarter may not, however, be representative of all quarters. See the "Risk Factors" section of this AIF for further details.
Environmental Protection
Our business is subject to federal, provincial, and state laws and regulations relating to environmental protection. Compliance with new regulatory requirements may require additional capital expenditures. For further information on carbon compliance costs, please refer to the "Operating and Financial Performance - Financial Performance Review of Consolidated Information" section of the MD&A which is incorporated by reference into this AIF.
Employees
The Company is required to develop and retain a skilled workforce for its operations. Many of TransAlta's employees possess specialized skills and training and we must compete in the labour market for these workers. As at Dec. 31, 2025, we had 1,350 active employees, which includes full-time, part-time and temporary employees. Approximately 32 per cent of our employees are represented by labour unions. We are currently a party to 13 different collective bargaining agreements. As at Dec. 31, 2025, women accounted for 27 per cent of all employees and 33 per cent of our executive team.
Social and Environmental Policies
Sustainability, or ESG management and performance, is a core value at TransAlta. Sustainability is overseen by TransAlta's Governance, Safety and Sustainability Committee (GSSC) of TransAlta's board of directors (Board). The GSSC assists the Board in fulfilling its oversight responsibilities with respect to the Company’s monitoring of climate change, environmental, health and safety regulations, public policy changes and the development of strategies, policies and practices for climate change, environment, health and safety and social well-being, including human rights, working conditions and responsible sourcing.
The following policies help govern sustainability at TransAlta and are publicly available in the "Governance" section of the Investor Centre on our website at www.transalta.com:
• Corporate Code of Conduct
• Supplier Code of Conduct
TransAlta Corporation • Annual Information Form 18
• Whistleblower Policy
• Total Safety Management Policy
• Environmental Policy
• Human Rights and Discrimination Policy
• Indigenous Relations Policy
• Board and Workforce Diversity Policy and Diversity and Inclusion Pledge.
For more information, refer to our 2025 Sustainability Report dated Feb. 26, 2026 in the "Results & Reporting" section of the Investor Centre on our website at www.transalta.com.
Risk Factors
For a discussion of risk factors affecting TransAlta, see the "Risk Management" section of the MD&A, which is incorporated by reference herein.
Dividends
Our Board has not adopted a formal dividend policy. Dividends on our common shares are paid at the discretion of the Board. In determining the payment and level of future dividends, the Board considers our financial performance, results of operations, cash flow and needs, with respect to financing our ongoing operations and growth, balanced against returning capital to shareholders. Our short- and long-term borrowings may prohibit us from paying dividends at any time at which a default or event of default would exist under such debt, or if a default or event of default would exist as a result of paying the dividend.
Dividends on our first preferred shares are payable quarterly, as and when declared by the Board. The dividends declared on our common and preferred shares during the past three completed financial years are set out in the section "Other Consolidated Analysis – Selected Annual Information" of the MD&A, which is incorporated by reference herein.
Capital Structure
Share Capital
Our authorized share capital consists of an unlimited number of common shares and an unlimited number of first preferred shares, issuable in series. For the number of common shares and first preferred shares issued and outstanding as at Dec. 31, 2025, see the "Financial Condition – Returns to Providers of Capital – Share Capital" section of the MD&A, which is incorporated by reference into this AIF.
Common Shares
Each common share of the Company entitles the holder thereof to one vote for each common share held at all meetings of shareholders of the Company, except meetings at which only holders of another specified class or series of shares are entitled to vote, to receive dividends if, as and when declared by the Board of Directors, subject to prior satisfaction of preferential dividends applicable to any first preferred shares, and to participate rateably in any distribution of our assets upon a liquidation, dissolution or winding up and subject to prior rights and privileges attaching to first preferred shares. The common shares are not convertible and are not entitled to any pre-emptive rights. The common shares are not entitled to cumulative voting.
First Preferred Shares
We are authorized to issue an unlimited number of first preferred shares, issuable in series and, with respect to each series, the Board of Directors is authorized to fix the number of shares comprising the series and determine the designation, rights, privileges, restrictions and conditions attaching to such shares, subject to certain limitations.
TransAlta Corporation • Annual Information Form 19
The first preferred shares of all series rank senior to all other shares of the Company with respect to priority in payment of dividends and with respect to distribution of assets in the event of liquidation, dissolution or winding up of the Company, or a reduction of stated capital. Holders of first preferred shares are entitled to receive cumulative quarterly dividends on the subscription price thereof as and when declared by the Board of Directors at the rate established by the Board of Directors at the time of issue of shares of a series. No dividends may be declared or paid on any other shares of the Company unless all cumulative dividends accrued upon all outstanding first preferred shares have been paid or declared and set apart. In the event of the liquidation, dissolution or winding up of the Company, or a reduction of stated capital, no sum shall be paid or assets distributed to holders of other shares of the Company until the holders of first preferred shares shall have been paid the subscription price of the shares, plus a sum equal to the premium payable on a redemption, plus a sum equal to the arrears of dividends accumulated on the first preferred shares to the date of such liquidation, dissolution, winding up or reduction of stated capital, as applicable. After the payment of such amount, the holders of first preferred shares shall not be entitled to share further in the distribution of our assets.
The Board of Directors may include, in the share conditions attaching to a particular series of first preferred shares, certain voting rights effective upon our failing to make payment of six quarterly dividend payments, whether or not consecutive. These voting rights continue for so long as any dividends remain in arrears. These voting rights are the right to one vote for each $25.00 of subscription price on all matters in respect of which shareholders vote, and additionally, the right of all series of first preferred shares, voting as a combined class, to elect two directors of TransAlta if the Board of Directors then consists of less than 16 directors, or three directors if the Board of Directors consists of 16 or more directors. Otherwise, except as required by law, the holders of first preferred shares shall not be entitled to vote or to receive notice of or attend any meeting of the shareholders of the Company.
Subject to the share conditions attaching to any particular series providing to the contrary, we may redeem the first preferred shares of a series, in whole or from time to time in part, at the redemption price applicable to each series and we have the right to acquire any of the first preferred shares of one or more series by purchase for cancellation in the open market or by invitation for tenders at a price not to exceed the redemption price applicable to the series.
Series A, B, C, D, E, F and G First Preferred Shares
The holders of Series A, C, E and G first preferred shares will be entitled to receive quarterly fixed cumulative preferential cash dividends, as and when declared by the Board, to be reset periodically on prescribed dates to an annualized rate equal to the sum of the then five-year Government of Canada bond yield, calculated at the start of the applicable five-year period, and a spread as set forth in the table below and have the right to convert their shares into cumulative redeemable Series B, D, F and H first preferred shares, respectively, subject to certain conditions, on such conversion dates as set forth in the table below. The Series A, C, E and G first preferred shares are redeemable by TransAlta in whole or in part on such redemption dates as set forth in the table below, by the payment of an amount in cash for each share to be redeemed equal to $25.00 plus all accrued and unpaid dividends thereon.
The holders of Series B, D, F and H first preferred shares will be entitled to receive quarterly floating rate cumulative preferential cash dividends, as and when declared by the Board, at an annualized rate equal to the sum of the then 90-day Government of Canada treasury bill rate, recalculated quarterly, and a spread as set forth in the table below and have the right to convert their shares into Series A, C, E and G first preferred shares, respectively, subject to certain conditions, on such conversion dates as set forth in the table below. The Series B, D, F and H first preferred shares are redeemable by TransAlta in whole or in part after their respective initial redemption date as set forth in the table below, by the payment of an amount in cash for each share to be redeemed equal to (i) $25.00 in the case of redemptions on such redemption dates as set out in the table below, or (ii) $25.50 in the case of redemptions on any other date, in each case plus all accrued and unpaid dividends thereon.
TransAlta Corporation • Annual Information Form 20
| | | | | | | | | | | |
Series of First Preferred Shares | Initial Redemption/ Conversion Date | Redemption/ Conversion Dates | Spread (%) |
Series A | March 31, 2016 | March 31, 2021 and every fifth year thereafter | 2.03 |
Series B | - | March 31, 2021 and every fifth year thereafter | 2.03 |
Series C | June 30, 2017 | June 30, 2022 and every fifth year thereafter | 3.10 |
Series D | - | June 30, 2022 and every fifth year thereafter | 3.10 |
Series E | Sept. 30, 2017 | Sept. 30, 2022 and every fifth year thereafter | 3.65 |
Series F | - | Sept. 30, 2022 and every fifth year thereafter | 3.65 |
Series G | Sept. 30, 2019 | Sept. 30, 2024 and every fifth year thereafter | 3.80 |
Series H | - | Sept. 30, 2024 and every fifth year thereafter | 3.80 |
The holders of the Series A, B, C, D, E, F and G first preferred shares are not entitled to any voting rights or to receive notice of or to attend shareholders' meetings unless dividends on such series of first preferred shares are in arrears to the extent of six quarterly dividends, whether or not consecutive. Until all arrears of dividends have been paid, holders of the first preferred shares of such series will be entitled: (i) to receive notice of and to attend all shareholders' meetings at which directors are to be elected (other than separate meetings of holders of another class or series of shares); (ii) to one vote in respect of each first preferred share of such series held on all matters in respect of which shareholders vote; and (iii) to vote, together with all other holders of first preferred shares of any series, as a combined class, to elect two directors of the Company if the Board of Directors then consists of fewer than 16 directors, or three directors if the Board of Directors consists of 16 or more directors. Otherwise, except as required by law, the holders of first preferred shares shall not be entitled to vote or to receive notice of or attend any meeting of the shareholders of the Company.
Series I First Preferred Shares
The first preferred shares, Series I (Series I Shares), are issued to an affiliate of Brookfield and have a perpetual term and rank pari passu to all existing series of first preferred shares of the Company with respect to dividends and liquidation preferences. The Series I Shares are entitled to a seven per cent cumulative dividend payable quarterly in cash.
Under the Investment Agreement with Brookfield, redemption of the Series I Shares will be satisfied through the Hydro Equity Interest (as defined below), or in some cases cash, based on their redemption price. The redemption price payable is equal to the subscription price paid by Brookfield together with all accrued but unpaid dividends thereon (the Redemption Price). Upon the occurrence of an Optional Redemption, as defined and described below, or a Cash Acceleration Event, as defined and described below, the Company will pay the Redemption Price in cash (the Cash Redemption Amount).
Except in the case of an Optional Redemption by the Company or a Cash Acceleration Event, as described below, the Series I Shares will be exchangeable into interests (Hydro Equity Interest) in the equity (the Hydro Equity) of TA Alberta Hydro LP (Hydro Assets Owner), a special purpose vehicle formed by the Company. At any time after Dec. 31, 2024, but prior to Dec. 31, 2028, Brookfield will be entitled to exchange all, but not less than all, of the Series I Shares requiring the Company to redeem or exchange all of the Series I Shares held by Brookfield (minus the number of Series I Shares that have been redeemed pursuant to an Optional Redemption) (the Exchange Right).
Prior to any Optional Redemption by the Company, the exercise of the Exchange Right or the occurrence of an Equity Acceleration Event, as defined and described below, will entitle Brookfield to receive that percentage of a Hydro Equity Interest that is equal to the aggregate Redemption Price for all Series I Shares issued to Brookfield divided by the tax-affected equity value of the Hydro Assets Owner, as further described in the Investment Agreement (Equity Redemption Amount). The maximum Hydro Equity Interest issuable to Brookfield upon the exercise of the Exchange Right is 49 per cent of the total Hydro Equity. The balance of the Redemption Price will be paid by the Company in cash.
If, at the time the Exchange Right is exercised, the Equity Redemption Amount is insufficient to permit Brookfield to acquire 49 per cent of the Hydro Equity, Brookfield has a one-time top-up option, exercisable until Dec. 31, 2028, to acquire an additional amount of Hydro Equity. As long as Brookfield holds at least 8.5 per cent of the Company's issued and outstanding common shares, Brookfield may purchase: (a) if the 20-day
TransAlta Corporation • Annual Information Form 21
volume weighted average price (VWAP) of the common shares is not less than $14, up to an additional 10 per cent of Hydro Equity, to a maximum interest of 49 per cent of the Hydro Equity; or (b) if the 20-day VWAP of the common shares is not less than $17, the additional percentage required that would bring Brookfield’s ownership level up to but not exceeding 49 per cent of the Hydro Equity. If the Exchange Right is exercised and the Equity Redemption Amount is insufficient to permit Brookfield to acquire at least 25 per cent of the Hydro Equity, Brookfield will have an option to acquire that additional percentage of Hydro Equity that would result in Brookfield having 25 per cent of the Hydro Equity upon payment in cash. If Brookfield exercises its top-up option, the cash amount payable by Brookfield is calculated as the same price as in the case of an exchange for the Hydro Equity Interest; however, in such a case, the price is based on the equity value of the Hydro Assets Owner without any reduction for the tax deficiency value associated with certain tax pools. Exercise of this top-up option triggers a lock-up obligation of Brookfield for a further period of 18 months following its exercise.
At any time after Dec. 31, 2028, the Company may redeem the Series I Shares and the related debentures, in whole or in part, at the Redemption Price (the Optional Redemption) provided that the minimum proceeds to Brookfield for each such redemption (other than the final redemption) may not be less than $100,000,000 and further provided that all Series I Shares and related debentures must be redeemed by the Company within 36 months of the date of the first Optional Redemption.
The Investment Agreement also provides for certain acceleration events. In the event of bankruptcy or a breach of certain material covenants by the Company (each, an Equity Acceleration Event), Brookfield will be entitled to give notice and will be entitled to the Equity Redemption Amount. If the Company does not obtain the requisite regulatory approvals for the exchange of Hydro Equity contemplated by the Exchange Right or the Equity Redemption Amount or a final order is made that enjoins the completion of the Exchange Right (Cash Acceleration Event), then Brookfield will be entitled to the Cash Redemption Amount.
Related-Party Articles Provisions
The articles of the Company contain provisions restricting the ability of the Company to enter into a "Specified Transaction" with a "Major Shareholder." A Specified Transaction requires the approval of a majority of the votes cast by holders of voting shares of the Company, as well as the approval of a majority of the votes cast by holders of such voting shares, excluding any Major Shareholder. A Major Shareholder generally means the beneficial owner of more than 20 per cent of the outstanding voting shares of the Company. The articles contain a broad definition of beneficial ownership, and in particular, a person is considered to beneficially own shares owned by their associates and affiliates, as those terms are defined in the articles. Transactions that are considered to be Specified Transactions include the following: a merger or amalgamation of the Company with a Major Shareholder; the furnishing of financial assistance by the Company to a Major Shareholder; certain sales of assets or provision of services by the Company to a Major Shareholder or vice versa; certain issuances of securities by the Company that increase the proportionate voting interest of a Major Shareholder; a reorganization or recapitalization of the Company that increases the proportionate voting interest of a Major Shareholder; and the creation of a class or series of non-voting shares of the Company that has a residual right to participate in earnings of the Company and assets of the Company upon dissolution or winding up.
TransAlta Corporation • Annual Information Form 22
Shareholder Rights Plan
The Company implemented a shareholder rights plan (Rights Plan) pursuant to a Shareholder Rights Plan Agreement (Rights Plan Agreement) dated as of Oct. 13, 1992, as amended and restated as of April 28, 2022, between the Company and Computershare Trust Company of Canada. On Nov. 4, 2024, the Company entered into an agreement with Odyssey Trust Company and Computershare Trust Company of Canada pursuant to which Computershare Trust Company of Canada resigned as rights agent under the Rights Plan and Odyssey Trust Company was appointed as rights agent under the Rights Plan. The Rights Plan was last confirmed at our annual and special meeting of shareholders on April 24, 2025, and will expire at the close of business on the date of our 2028 Annual and Special Meeting of Shareholders, unless ratified and extended by a further vote of the shareholders. For more information, see the Rights Plan Agreement, as amended and restated. A copy of the Rights Plan Agreement is available electronically on SEDAR+ under our profile, which can be accessed at www.sedarplus.ca, and on the SEC's EDGAR system at www.sec.gov. A copy of the Rights Plan Agreement may also be obtained by contacting the Corporate Secretary, TransAlta Corporation, TransAlta Place, Suite 1400, 1100 1 St SE, Calgary, Alberta T2G 1B1; telephone: (403) 267-7110; or by email: [email protected]. For more information about our Capital Structure, please refer see the "Financial Condition" section of the MD&A, which is incorporated by reference into this AIF.
Exchangeable Securities
On March 22, 2019, we entered into the Investment Agreement, whereby Brookfield invested $750 million in the Company through the purchase of Exchangeable Securities, which are exchangeable into an equity ownership interest of TA Alberta Hydro LP. See the "Capital Structure – First Preferred Shares – Series I First Preferred Shares" section of this AIF for further details.
Investment Agreement
The following description of certain provisions of the Investment Agreement is a summary only; it is not comprehensive and is qualified in its entirety by reference to the full text of the Investment Agreement, a copy of which can be found on SEDAR+ under our profile at www.sedarplus.ca and on EDGAR under our profile at www.sec.gov.
Under the terms of the Investment Agreement, Brookfield committed to purchase TransAlta common shares on the open market to increase its share ownership in TransAlta to not less than nine per cent by May 1, 2021. As of Dec. 31, 2025, Brookfield, through its affiliates, held, owned or had control over an aggregate of 26,923,345 common shares, representing 9.1 per cent of the issued and outstanding common shares, calculated on an undiluted basis.
The Investment Agreement contemplates that the Exchangeable Securities will be a long-term investment and therefore may not be transferred except by Brookfield to one of its affiliates. Brookfield has agreed to be the sole representative of all of its permitted transferees for the purpose of the Investment Agreement. So long as Brookfield holds the Exchangeable Securities, it is entitled to nominate two directors for election to the Board.
The Investment Agreement included certain standstill commitments by Brookfield that are extended for so long as Brookfield has nominees on the Board of Directors, including restrictions on Brookfield's ability to solicit proxies from the Company's shareholders or making a shareholder proposal.
In accordance with the terms of the Investment Agreement, TransAlta formed a hydro assets operating committee (Hydro Committee) consisting of two representatives from Brookfield and two representatives from TransAlta to provide advice and recommendations in connection with the operation and value maximization of the Alberta hydro assets. In connection with this, the Company committed to pay Brookfield an annual management fee of $1.5 million for six years commencing on May 1, 2019. The Hydro Committee concluded on April 30, 2025.
TransAlta Corporation • Annual Information Form 23
Registration Rights Agreement
The following description of certain provisions of the Registration Rights Agreement entered into between Eagle Hydro II (an affiliate of Brookfield) and the Company on May 1, 2019 (Registration Rights Agreement) is a summary only; it is not comprehensive and is qualified in its entirety by reference to the full text of the Registration Rights Agreement, a copy of which can be found on SEDAR+ under our profile at www.sedarplus.ca.
The Registration Rights Agreement provides that Eagle Hydro II and any affiliate of Brookfield that becomes party to the Registration Rights Agreement (each a Holder) may, at any time and from time to time, make a written request (Demand Registration) to the Company to file a Prospectus Supplement with the securities commissions or similar authorities in each of the provinces of Canada in respect of the distribution of all or part of the common shares then held by the Holder (Registrable Securities), subject to certain restrictions set forth in the Registration Rights Agreement. Upon receipt by the Company of a Demand Registration, the Company will promptly file a Prospectus Supplement in order to permit the offer and sale or other disposition or distribution in Canada of all or any portion of the Registrable Securities held, directly or indirectly, by the Holder (a Demand Offering). The Company will not be obligated to effect: (a) more than three Demand Offerings in total during the term of the Registration Rights Agreement; or (b) a Demand Offering if the Registrable Securities have an aggregate market price of less than $50 million.
If at any time the Company proposes to file a prospectus supplement with respect to the distribution of any TransAlta common shares to the public, then the Company will give notice of the proposed distribution to each Holder not less than five business days in advance of the anticipated filing date of the prospectus supplement (or, in the case of a “bought deal” or another public offering that is not expected to include a road show, such notice as is practicable under the circumstances), which notice will offer each Holder the opportunity to qualify for distribution such number of Registrable Securities as such Holder may request. The Company will use commercially reasonable efforts to include in such Prospectus Supplement such Registrable Securities (a Piggy Back Offering), unless the Company’s managing underwriter or underwriters determine, in good faith, that including such Registrable Securities in the distribution would, in their opinion, adversely affect the Company’s distribution or sales price of the securities being offered by the Company.
The Demand Offerings and Piggy Back Offerings are subject to various conditions and limitations. The Company is entitled to defer any Demand Offering in certain circumstances, including during a regular annual and quarterly blackout period in respect of the release of its financial results.
The Registration Rights Agreement includes provisions providing for each of the Company and the Holders to indemnify each other for losses or claims caused by the applicable party’s inclusion of a misrepresentation in disclosure included in any prospectus and for breaches of applicable securities laws.
In the case of a prospectus supplement filed in connection with a Demand Offering or Piggy Back Offering, the Company will pay all applicable fees and expenses incidental to the Company’s performance of, or compliance with, the terms of such offering, provided that in the event any Registrable Securities are freely tradeable at the time the Company receives the offering request, the Company and the Holders will be jointly and severally responsible for the proportionate share of registration fees and expenses of any Holders based on the total offering price of the freely tradeable securities sold by the Holders to the total offering price of all the Securities sold by the Company in such offering. The Company and the Holders will be jointly and severally responsible for paying all selling expenses (including fees or commissions payable to an underwriter, investment banker, manager or agent and any transfer taxes attributable to the sale of Registrable Securities) with respect to Registrable Securities sold by the Holders and the Company will pay all selling expenses with respect to any Securities sold for the account of the Company. The Company and the Holders will be solely responsible on a joint and several basis for all out-of-pocket expenses incurred by any Holders in connection with a Demand Offering or Piggy Back Offering.
If a Holder ceases to be affiliated with the Company, the Holder will cease to have any rights or obligations under the Registration Rights Agreement. The Registration Rights Agreement will terminate when Brookfield, together with its affiliates, beneficially owns in the aggregate less than three per cent of the issued and outstanding common shares.
TransAlta Corporation • Annual Information Form 24
Additional details about the Brookfield Investment can be found in our material change report dated March 26, 2019, available electronically on SEDAR+ at www.sedarplus.ca and on EDGAR at www.sec.gov. Copies of the Investment Agreement, together with copies of the exchangeable debenture and the Registration Rights Agreement are also available on SEDAR+ and on EDGAR. Shareholders are encouraged to read these documents in their entirety.
Credit Ratings
Credit ratings provide information relating to our financing costs, liquidity and operations and affect our ability to obtain short-term and long-term financing and/or the cost of such financing. Our credit ratings as at Dec. 31, 2025, are as follows:
| | | | | | | | | | | |
| Morningstar DBRS | Moody's | S&P Global Ratings |
Issuer rating | BBB (low) | Not applicable | BB+ |
Corporate family rating | Not applicable | Ba1 | Not applicable |
Preferred shares | Pfd-3 (low)(1) | Not applicable | P-4(High) |
Unsecured debt/Medium term notes | BBB (low) | Ba1/LGD4 | BB+ |
Rating outlook | Stable | Stable | Stable |
(1) The outstanding Preferred Shares all have the same rating.
Morningstar DBRS
Morningstar DBRS' corporate rating analysis begins by evaluating of the fundamental creditworthiness of the issuer and also takes the issuer's business and financial risks into account, which is reflected in an "issuer rating." Issuer ratings address the overall credit strength of the issuer. Unlike ratings on individual securities or classes of securities, issuer ratings are based on the entity itself and do not include consideration for security or ranking. Ratings that apply to actual securities (secured or unsecured) may be higher, lower or equal to the issuer rating for a given entity. As at Dec. 31, 2025, our issuer rating was BBB (low) with a stable outlook. An issuer rating of BBB means the issuer has adequate credit quality, its capacity for the payment of financial obligations is considered acceptable, and it may be vulnerable to future events. Each rating category is denoted by the subcategories "high" and "low." The absence of either a "high" or "low" designation indicates the rating is in the middle of the category. A BBB rating is the fourth highest out of 10 categories.
The Morningstar DBRS preferred share rating scale is used in the Canadian securities market and is meant to give an indication of the risk that a borrower will not fulfil its full obligations in a timely manner, with respect to both dividend and principal commitments. Every Morningstar DBRS rating is based on quantitative and qualitative considerations relevant to the borrowing entity. Each rating category is denoted by the subcategories "high" and "low." The absence of either a "high" or "low" designation indicates the rating is in the middle of the category. Preferred shares rated Pfd-3 are of adequate credit quality. While protection of dividends and principal is still considered acceptable, the issuing entity is more susceptible to adverse changes in financial and economic conditions, and there may be other adverse conditions present that detract from debt protection. Each of the Series A, B, C, D, E and G first preferred shares have been rated Pfd-3 (low) (stable). The Pfd-3 rating is the third highest out of six categories.
The Morningstar DBRS long-term rating scale provides an opinion on the risk of default, which is the risk that an issuer will fail to satisfy its financial obligations in accordance with the terms under which an obligation has been issued. Ratings are based on quantitative and qualitative considerations relevant to the issuer, and the relative ranking of claims. All rating categories other than AAA and D also contain subcategories "high" and "low". The absence of either a "high" or "low" designation indicates the rating is in the middle of the category. Debt securities rated BBB are of adequate credit quality. The capacity for the payment of financial obligations is considered acceptable, but may be vulnerable to future events. A BBB rating is the fourth highest out of 10 categories.
TransAlta Corporation • Annual Information Form 25
Moody's
Moody's Corporate Family Ratings (CFRs) are long-term ratings that reflect the relative likelihood of a default on a corporate family's debt and debt-like obligations and the expected financial loss suffered in the event of default. A CFR is assigned to a corporate family as if it had a single class of debt and a single consolidated legal entity structure. A CFR does not refer to an obligation or class of debt and thus does not reflect priority of claim. As at Dec. 31, 2025, our Corporate Family Rating was Ba1 with a stable outlook. Obligations rated Ba are judged to be speculative and are subject to substantial credit risk. Moody's appends the numerical modifiers 1, 2 and 3 to each generic rating classification from Aa through Caa. The modifier 1 indicates that the obligation ranks in the higher end of its generic rating category, the modifier 2 indicates a mid-range ranking, and the modifier 3 indicates a ranking in the lower end of that generic rating category. The Ba rating category is the fifth-highest rating out of nine rating categories.
Moody's long-term ratings are assigned to issuers or obligations with an original maturity of 11 months or more and reflect both the likelihood of a default or impairment on contractual financial obligations and the expected financial loss suffered in the event of default or impairment. As at Dec. 31, 2025, our senior unsecured long-term debt is rated Ba1/LGD4. The Ba rating category is the fifth-highest rating out of nine rating categories. Obligations rated Ba are judged to be speculative and are subject to substantial credit risk.
Moody's Loss Given Default (LGD) assessments are point-in-time opinions about expected loss given default expressed as a percentage of principal and accrued interest at the resolution of the default. One of the six LGD assessments is assigned to individual loan, bond and preferred stock issues. The firm-wide or enterprise expected LGD rate generally approximates a weighted average of the expected LGD rates on the firm's liabilities (excluding preferred stock), where the weights equal each obligation's expected share of the total liabilities at default. As at Dec. 31, 2025, our LGD assessment from Moody's was LGD4, which represents a loss range of greater than or equal to 50 per cent and less than 70 per cent. LGD4 is the fourth-highest assessment category out of six categories.
S&P Global Ratings
The S&P Global Ratings issue credit rating is a forward-looking opinion about the creditworthiness of an obligor with respect to a specific financial obligation, a specific class of financial obligations or a specific financial program (including ratings on medium-term note programs and commercial paper programs). It takes into consideration the creditworthiness of guarantors, insurers or other forms of credit enhancement on the obligation and takes into account the currency in which the obligation is denominated. The opinion reflects S&P Global Ratings' view of the obligor's capacity and willingness to meet its financial commitments as they come due, and may assess terms, such as collateral security and subordination, which could affect ultimate payment in the event of default. As at Dec. 31, 2025, our issuer credit rating was BB+ with a stable outlook. This is the fifth highest of 11 ratings categories. An obligor rated BB is less vulnerable in the near–term than other lower-rated obligors. However, it faces major ongoing uncertainties and exposure to adverse business, financial or economic conditions that could lead to the obligor's inadequate capacity to meet its financial commitments. The ratings from AA to CCC may be modified by the addition of a plus (+) or minus (-) sign to show relative standing within the major rating categories.
The S&P Global Ratings Canadian preferred share rating scale serves issuers, investors and intermediaries in the Canadian financial markets by expressing preferred share ratings (determined in accordance with global rating criteria) in terms of rating symbols that have been actively used in the Canadian market over a number of years. The S&P Global Ratings preferred share rating on the Canadian scale is a forward-looking opinion about the creditworthiness of an obligor with respect to a specific preferred share obligation issued in the Canadian market, relative to preferred shares issued by other issuers in the Canadian market. There is a direct correspondence between the specific ratings assigned on the Canadian preferred share scale and the various rating levels on the global debt rating scale of S&P Global Ratings. Each of our outstanding Preferred Shares Series has been rated P-4 (High). The P-4 (High) rating is the fourth highest of eight categories. A P-4 (High) rating corresponds to a B+ rating on the global preferred share rating scale. Obligors rated BB, B, CCC, CC and C are regarded as having significant speculative characteristics, of which BB indicates the least degree of speculation and C the highest. While some obligors will likely have some quality and protective characteristics, these may be outweighed by large uncertainties or major exposures to adverse conditions. An obligor rated B
TransAlta Corporation • Annual Information Form 26
is more vulnerable to nonpayment than obligations rated BB, but the obligor currently has the capacity to meet its financial commitments on the obligation. Adverse business, financial or economic conditions will likely impair the obligor's capacity or willingness to meet its financial commitments.
We are focused on maintaining a strong financial position and cash flow coverage ratios to support our business. Our available credit facilities, funds from operations and debt financing options provide us with financial flexibility.
Note Regarding Credit Ratings
Credit ratings are intended to provide investors with an independent measure of the credit quality of an issue of securities. The credit ratings accorded to our outstanding securities by Morningstar DBRS, Moody's and S&P Global Ratings, as applicable, are not recommendations to purchase, hold or sell such securities. There is no assurance that the ratings will remain in effect for any given period or that a rating will not be revised or withdrawn entirely by Morningstar DBRS, Moody's or S&P Global Ratings in the future if, in its judgement, circumstances so warrant.
We have paid fees for rating services to Morningstar DBRS, Moody's and S&P Global Ratings during the last two years. We have also paid fees to S&P Global Ratings, Morningstar DBRS and Kroll Bond Rating Agency for certain other services provided to the Company during the last two years.
Market for Securities
Common Shares
Our common shares are listed on the Toronto Stock Exchange (TSX) under the symbol "TA" and on the New York Stock Exchange (NYSE) under the symbol "TAC".
The following table sets forth the reported high and low trading prices and trading volumes of our common shares as reported by the TSX for the periods indicated:
| | | | | | | | | | | |
| Price ($) | |
| Month | High | Low | Volume |
| 2025 | | | |
| January | 21.22 | 14.84 | 54,878,324 |
| February | 16.97 | 14.50 | 42,577,370 |
| March | 15.22 | 12.33 | 45,841,176 |
| April | 13.72 | 11.16 | 35,558,270 |
| May | 13.52 | 11.56 | 32,126,154 |
| June | 15.66 | 13.16 | 38,122,840 |
| July | 17.58 | 14.08 | 34,020,420 |
| August | 17.46 | 16.35 | 25,539,916 |
| September | 19.21 | 16.49 | 21,320,772 |
| October | 24.96 | 18.86 | 44,836,160 |
| November | 25.03 | 18.78 | 38,368,736 |
| December | 21.06 | 16.97 | 24,753,314 |
TransAlta Corporation • Annual Information Form 27
Our Series A, B, C, D, E, and G first preferred shares are listed on the TSX under the symbols "TA.PR.D", "TA.PR.E", "TA.PR.F", "TA.PR.G", "TA.PR.H" and "TA.PR.J", respectively.
The following table sets forth the reported high and low trading prices and trading volumes of our Series A, B, C, D, E and G first preferred shares as reported by the TSX for the periods indicated:
| | | | | | | | | | | | | | | | | | | | | | | |
Year | Quarter | Series A First Preferred | Series B First Preferred | Series C First Preferred | Series D First Preferred | Series E First Preferred | Series G First Preferred |
2025 | | | | | | | |
January | High | 16.06 | 16.85 | 21.40 | 21.65 | 24.09 | 24.38 |
| Low | 15.41 | 16.10 | 20.58 | 19.60 | 23.23 | 23.50 |
| Volume Traded | 577,228 | 57,917 | 130,727 | 12,815 | 346,701 | 102,303 |
February | High | 16.05 | 17.50 | 21.55 | 23.75 | 24.22 | 24.69 |
| Low | 15.65 | 16.75 | 20.78 | 20.65 | 23.67 | 24.00 |
| Volume Traded | 210,067 | 58,177 | 92,436 | 5,115 | 84,711 | 81,998 |
March | High | 15.90 | 17.12 | 21.55 | 22.60 | 24.05 | 24.78 |
| Low | 15.40 | 15.80 | 20.82 | 20.65 | 23.04 | 24.20 |
| Volume Traded | 129,403 | 25,690 | 149,670 | 3,880 | 77,514 | 86,954 |
April | High | 15.66 | 16.50 | 21.32 | 23.03 | 23.70 | 24.75 |
| Low | 14.60 | 15.10 | 18.75 | 18.25 | 21.08 | 22.81 |
| Volume Traded | 152,982 | 28,436 | 118,894 | 4,805 | 82,475 | 85,047 |
May | High | 16.90 | 17.50 | 22.15 | 22.75 | 24.87 | 25.10 |
| Low | 15.26 | 16.10 | 20.44 | 20.30 | 22.94 | 24.15 |
| Volume Traded | 56,287 | 48,735 | 173,557 | 4,425 | 275,240 | 151,404 |
June | High | 17.01 | 17.55 | 22.28 | 23.19 | 24.96 | 25.28 |
| Low | 16.24 | 16.51 | 21.59 | 20.50 | 24.34 | 24.74 |
| Volume Traded | 128,601 | 21,537 | 153,753 | 9,550 | 101,900 | 69,861 |
July | High | 17.84 | 17.84 | 22.90 | 23.44 | 25.35 | 25.50 |
| Low | 17.21 | 17.21 | 22.00 | 20.99 | 24.45 | 24.90 |
| Volume Traded | 54,677 | 54,677 | 83,710 | 6,050 | 124,746 | 66,192 |
August | High | 18.48 | 18.92 | 23.05 | 24.29 | 25.24 | 25.53 |
| Low | 17.75 | 17.52 | 22.10 | 21.66 | 24.88 | 25.00 |
| Volume Traded | 241,086 | 46,146 | 54,712 | 2,625 | 92,723 | 83,585 |
September | High | 18.73 | 18.99 | 22.92 | 25.00 | 25.20 | 25.48 |
| Low | 18.06 | 18.00 | 21.95 | 21.52 | 24.69 | 25.00 |
| Volume Traded | 509,164 | 34,006 | 212,571 | 2,900 | 102,306 | 156,502 |
October | High | 18.70 | 18.85 | 24.21 | 24.60 | 25.50 | 25.95 |
| Low | 18.18 | 18.35 | 22.74 | 22.00 | 25.05 | 25.30 |
| Volume Traded | 275,046 | 27,348 | 134,414 | 4,088 | 217,361 | 57,031 |
November | High | 19.21 | 19.19 | 24.40 | 25.08 | 25.88 | 26.15 |
| Low | 18.30 | 18.50 | 23.84 | 22.40 | 25.29 | 25.53 |
| Volume Traded | 203,048 | 31,326 | 163,848 | 1,400 | 66,776 | 41,604 |
December | High | 20.48 | 20.33 | 24.92 | 25.41 | 25.79 | 26.07 |
| Low | 18.90 | 18.89 | 23.98 | 22.00 | 25.32 | 25.65 |
| Volume Traded | 82,910 | 30,958 | 229,334 | 6,700 | 59,291 | 43,622 |
TransAlta Corporation • Annual Information Form 28
Directors and Officers
The name, province or state and country of residence of each of our directors as at Dec. 31, 2025, their respective position and office and their respective principal occupation during the five preceding years, are set out below. The year in which each director was appointed to serve on the Board of Directors is also set out below. Each director is appointed to serve until the next annual meeting of TransAlta or until his or her successor is elected or appointed.
| | | | | | | | |
| Name, Province (State) and Country of Residence | Year First Became Director | Principal Occupation |
Brian Baker Alberta, Canada | 2025 | Mr. Baker is the Operating Partner in Brookfield Asset Management's Infrastructure Group. Mr. Baker primarily works with Brookfield's Midstream operating companies to set strategic direction, manage risk and support growth initiatives. Mr. Baker has held several senior roles across Brookfield's Infrastructure Group since he joined Brookfield in 2007, including heading investment activities in Europe and North America for over a decade where he oversaw acquisitions in the Data Infrastructure, Transportation, Utilities and Midstream sectors. Mr. Baker currently serves as Chair of the Board of Inter Pipeline Ltd. and he is a director of Rockpoint Gas Storage and NorthRiver Midstream Inc., all three of which are energy infrastructure companies located in western Canada. Mr. Baker is a Chartered Professional Accountant. |
John P. Dielwart Alberta, Canada | 2014 | Mr. Dielwart is the Chair of the Board of Directors. He was formerly Chief Executive Officer of ARC Resources Ltd., overseeing the growth of the company from a startup in 1996 to a company with a total capitalization of approximately $10 billion at the time of his retirement in 2013. After his retirement from ARC Resources, Mr. Dielwart re-joined ARC Financial Corp. as Vice-Chair and Partner. In 2020, Mr. Dielwart resigned from the Board of ARC Financial but remained as Partner and a member of ARC Financial's Investment Committee. He is currently representing ARC Financial on the board of Aspenleaf Energy Limited. He is a past-Chair of the Board of Governors of the Canadian Association of Petroleum Producers and a member of the Association of Professional Engineers and Geoscientists of Alberta. |
Alan J. Fohrer California, United States | 2013 | Mr. Fohrer is the former Chair and Chief Executive Officer of Southern California Edison Company, a subsidiary of Edison International (Edison) that is one of the largest electric utilities in the United States. Mr. Fohrer served as President and Chief Executive Officer of Edison Mission Energy (EME) from 2000 to 2001, a former subsidiary of Edison that owned and operated independent power facilities. During his tenure at EME, Mr. Fohrer restructured a number of international projects, which enhanced the value of the assets sold in subsequent years. Mr. Fohrer also served as Vice-President, Senior Vice-President, Executive Vice-President and Chief Financial Officer of both Edison and Southern California Edison from 1991 to 2000. After 37 years with Edison, Mr. Fohrer retired in December 2010. Mr. Fohrer is currently an independent member of the board of TXNM Energy, Inc. (previously PNM Resources, Inc.), a publicly traded energy holding company. He is also a member of the Viterbi School of Engineering Board of Councilors for the University of Southern California and on the Board of the California Science Center Foundation. Mr. Fohrer has served on boards of directors of the Institute of Nuclear Power Operations, the California Chamber of Commerce, Duratek, Inc., Osmose Utilities Services, Inc., MWH, Inc., Blue Shield of California and Synagro. |
TransAlta Corporation • Annual Information Form 29
| | | | | | | | |
| Name, Province (State) and Country of Residence | Year First Became Director | Principal Occupation |
Laura W. Folse Texas, United States | 2021 | Ms. Folse was the Chief Executive Officer of BP Wind Energy North America Inc. As Chief Executive Officer for BP Wind Energy she led a business with over 500 employees and contractors that consisted of 14 wind energy generation plants across eight states with an operating capacity of over 2.5 gigawatts. Prior to her role as Chief Executive Officer of BP Wind Energy, she served at BP p.l.c. as Executive Vice President, Science, Technology, Environment and Regulatory Affairs, in which she led the operational, scientific and technological programs within the multi-billion dollar cleanup and restoration effort in response to the 2010 BP Macondo well explosion off the coast of Louisiana. At its peak, the cleanup project team that she led consisted of over 45,000 people working across the U.S. Gulf and Mexico. She successfully negotiated with federal, state and local government officials to implement and conclude the offshore and onshore cleanup efforts. Prior thereto, she held numerous leadership roles with increasing responsibility and complexity within BP p.l.c. Ms. Folse is an independent member of the Board of Directors of Pacolet Milliken, a private investment company operating in real estate and power and infrastructure. Ms. Folse was a board member for the American Wind Energy Association from 2016 to 2019. |
John H. Kousinioris Alberta, Canada | 2021 | Mr. Kousinioris is President and Chief Executive Officer of TransAlta. Prior to his appointment as President and CEO in 2021, Mr. Kousinioris served as Chief Operating Officer of the Company. As Chief Operating Officer, he was responsible for overseeing operations, shared services, commercial, trading, customer solutions, hedging and optimization at the Company. Prior thereto, Mr. Kousinioris was TransAlta's Chief Growth Officer and Chief Legal and Compliance Officer. Mr. Kousinioris’ prior leadership roles have provided him with responsibility for almost every aspect of the Company’s business. He was also the President of TransAlta Renewables Inc. until Feb. 5, 2021. Prior to joining TransAlta, Mr. Kousinioris was a partner and co-head of the corporate commercial department at Bennett Jones LLP with 30 years of experience in securities law, mergers and acquisitions, and corporate governance matters. He is also Chair of the Board of Governors of Bow Valley College and a member of the Board of Directors of the Calgary Stampede Foundation. |
Candace J. MacGibbon Ontario, Canada | 2023 | Ms. MacGibbon is the former Chief Executive Officer and Director of INV Metals Inc., a TSX-listed mining company, from 2015 to 2021, where she was responsible for determining and implementing corporate strategy. Prior thereto, Ms. MacGibbon was the former President and Chief Financial Officer of INV Metals Inc. from 2008 to 2015, responsible for financial and regulatory reporting and for the company's treasury, financial strength and investment policy. Ms. MacGibbon previously held roles within global mining institutional equity sales with RBC Capital Markets and in base metals research as an equity research associate with BMO Capital Markets. Ms. MacGibbon was a former manager at Deloitte LLP and cost analyst with Inco Limited. She is also a board member of OR Royalties Inc. and a member of OR Royalties Inc. Audit and Human Resources Committees. Ms. MacGibbon is a board member of Kinross Gold Corporation and a member of Kinross Gold Audit and Risk Committee. Ms. MacGibbon is the president of the Canadian Institute of Mining, Petroleum and Metallurgy. She is a Chartered Professional Accountant with over 25 years’ experience in the mining sector and capital markets. |
TransAlta Corporation • Annual Information Form 30
| | | | | | | | |
| Name, Province (State) and Country of Residence | Year First Became Director | Principal Occupation |
Thomas M. O'Flynn New Jersey, United States | 2021 | Mr. O’Flynn was the Chief Executive Officer and Chief Investment Officer, AES Infrastructure Advisors. Prior thereto, until 2019, he was Executive Vice President and Chief Financial Officer, Head of U.S. Renewables at AES Corporation and responsible for all aspects of global finance and merger and acquisition (M&A) teams across six global regions. During his tenure, Mr. O’Flynn helped lead AES through a significant transformation, including strategic exits of non-core markets, which resulted in improved financial stability and allowed for the redeployment of cash to primary growth markets. AES's total shareholder return increased 54 per cent during his tenure and its credit rating improved significantly. Mr. O’Flynn was also a key driver in initiating a major transition to renewables and green energy to significantly improve AES’s growth profile and reduce its carbon footprint. Mr. O'Flynn is the Lead Operating Director of Dimension Renewable Energy, a community solar company. He is an Operating Director of Exus Management Partners, a renewables management and development company. Mr. O'Flynn is a director of Nexus Water Group, a water utility company. Mr. O'Flynn is a former Senior Advisor with Energy Impact Partners, a private energy technology fund investing in high-growth companies in the energy, utility and transportation industries. Mr. O’Flynn was Chief Financial Officer of Powin Energy from December 2021 until December 2022, a battery energy storage company in which Energy Impact Partners is a significant investor. Mr. O’Flynn was with The Blackstone Group Inc. where he was Senior Advisor, Power and Utility Sector, and Chief Operating Officer and Chief Financial Officer of Transmission Developers Inc., a Blackstone-controlled entity that develops innovative power transmission projects in an environmentally responsible manner. Prior thereto he was Executive Vice President and Chief Financial Officer at Public Service Enterprise Group Incorporated and was Head of North American Power at Morgan Stanley. |
Bryan D. Pinney Alberta, Canada | 2018 | Mr. Pinney has over 30 years of experience serving many of Canada's largest corporations, primarily in energy, resources and construction. Mr. Pinney served as Calgary Managing Partner of Deloitte LLP from 2002 through 2007 and as National Managing Partner of Audit & Assurance from 2007 to 2011 and Vice-Chair until June 2015. Mr. Pinney was a past member of Deloitte LLP's Board of Directors. He was a partner at Andersen LLP and served as Calgary Managing Partner from 1991 through May 2002. Mr. Pinney is currently the lead director of North American Construction Group Ltd. (NYSE, TSX) and a director of SNDL Inc. (NASDAQ). Mr. Pinney is the former chair of the Board of Governors of Mount Royal University and has served on a number of non-profit boards. He is a Fellow of the Institute of Chartered Accountants and a Chartered Business Valuator, and he holds the ICD.D designation granted by the Institute of Corporate Directors. |
TransAlta Corporation • Annual Information Form 31
| | | | | | | | |
| Name, Province (State) and Country of Residence | Year First Became Director | Principal Occupation |
James Reid Alberta, Canada | 2021 | Mr. Reid is a former Managing Partner of Brookfield Asset Management Inc. who led Brookfield's Private Equity Group in Calgary, Alberta. In that role he was responsible for originating, evaluating and structuring investments and financings in the energy sector and overseeing operations in Brookfield's private equity energy segment. Prior to moving into the private equity group, Mr. Reid was the Chief Investment Officer, Energy for Brookfield’s Infrastructure Group. He established Brookfield’s Calgary office in 2003 after spending several years as Chief Financial Officer for two oil and gas exploration and production companies in Western Canada. Mr. Reid is also one of two Brookfield nominees to the Board pursuant to the Investment Agreement. Mr. Reid obtained his Chartered Accountant designation at PricewaterhouseCoopers in Toronto. |
Manjit K. Sharma Ontario, Canada | 2023 | Ms. Sharma has over 35 years of experience that spans a variety of industries (power generation, oil and gas, financial services, manufacturing, engineering services and others). From 2020 to 2021, she was the Interim Chief Financial Officer of WSP Canada Inc. In this role, she was responsible for leading the finance, real estate, procurement, tax and shared services functions on an interim contract. She was the Chief Financial Officer of GE Canada from 2016 to 2019. From 1999 to 2016, she held various senior positions with GE Canada, with responsibilities that spanned business strategy development and execution, business product and services development, mergers and acquisitions, tax oversight, risk, governance, key components of human resources strategy (including compensation, union negotiations, pension and benefits), and diversity and inclusion. Ms. Sharma currently serves as a board member of each of Vermilion Energy Inc., Finning International Inc. and Export Development Canada. Ms. Sharma is a Fellow Chartered Accountant and holds the ICD.D Directors designation and the GCB.D Global Competent Boards designation. |
Sandra R. Sharman Ontario, Canada | 2020 | Ms. Sharman is Special Advisor and former Senior Executive Vice-President and Group Head, People, Culture and Brand, Canadian Imperial Bank of Commerce (CIBC) (chartered bank). In this role, she leads the Human Resources, Communications, Marketing and Enterprise Real Estate teams at CIBC, supporting execution of business strategy, transforming to a purpose-driven bank and enabling a world-class culture. Ms. Sharman and her team are responsible for developing and delivering the Global Human Capital Strategy designed to challenge conventional thinking, drive business solutions and shape the culture of the bank. Ms. Sharman is a proven business leader with over 30 years of human resources and financial services experience in both Canada and the United States, and she has played a leading role in shaping an inclusive and collaborative culture at CIBC, focused on empowering and enabling employees to reach their full potential. Ms. Sharman assumed the leadership of Human Resources at CIBC in 2014 and added accountability for communications and public affairs in 2017. Since then, her portfolio has expanded to encompass purpose, brand, marketing and, most recently, corporate real estate. |
TransAlta Corporation • Annual Information Form 32
Officers
The name, province or state and country of residence of each of our executive officers as at Feb. 26, 2026, their respective position and office and their respective principal occupation are set out below.
| | | | | | | | |
| Name | Principal Occupation | Residence |
John H. Kousinioris | President and Chief Executive Officer | Alberta, Canada |
Joel E. Hunter | Executive Vice President, Finance and Chief Financial Officer | Alberta, Canada |
Jane N. Fedoretz | Executive Vice President, People, Culture and Chief Administrative Officer | Alberta, Canada |
| Christopher D. Fralick | Executive Vice President, Generation | Alberta, Canada |
Mark A. Flickinger | Executive Vice President, Project Delivery and Construction | Idaho, United States |
Blain M. van Melle | Executive Vice President, Commercial and Customer Relations | Alberta, Canada |
Nancy L. Brennan | Executive Vice President, Legal and External Affairs | Alberta, Canada |
David C. Little | Senior Vice President, Growth | California,
United States |
All the executive officers of TransAlta have held their present principal occupation or position for the past five years, except for the following:
•On Nov. 6, 2025, the Company announced that John Kousinioris, President and Chief Executive Officer and a Director of TransAlta, plans to retire effective April 30, 2026. Prior to April 2021, Mr. Kousinioris was Chief Operating Officer of TransAlta.
•On Nov. 6, 2025, the Board of Directors appointed Joel Hunter, TransAlta’s Executive Vice President, Finance and Chief Financial Officer, to succeed Mr. Kousinioris as President and Chief Executive Officer and be nominated to join the Board effective April 30, 2026. Prior to July 2024, Mr. Hunter was Executive Vice-President and Chief Financial Officer at TC Energy Corporation. Prior to August 2021, Mr. Hunter was Senior Vice-President, Capital Markets at TC Energy Corporation.
•Prior to November 2023, Ms. Fedoretz was Executive Vice President, People, Talent and Transformation of TransAlta.
•Prior to September 2022, Mr. Fralick was President and Chief Executive Officer of Atura Power, a Canadian power generation company.
•Prior to July 2024, Mr. Flickinger was Vice President of Engineering and Construction of Pattern Energy Group LP.
•Prior to November 2023, Mr. van Melle was Executive Vice President, Alberta Business of TransAlta.
•Prior to December 2024, Ms. Brennan was Executive Vice President, Legal, External Affairs and Corporate Secretary. Prior to July 2024, Ms. Brennan was Executive Vice President, Legal of TransAlta. Prior to February 2024, Ms. Brennan was Senior Vice President, Sustainability, External Relations and General Counsel of Keyera Corp.
•Prior to November 2023, Mr. Little was Vice President and Managing Director - USA of Innergex Renewable Energy Inc. Prior to July 2021, Mr. Little was Senior Director and Head of USA of Innergex Renewable Energy Inc.
As of Feb. 26, 2026, the directors and executive officers of TransAlta, as a group, beneficially owned, directly or indirectly, or exercised control or direction over less than one per cent of our outstanding common shares.
Corporate Cease Trade Orders and Bankruptcies
Except as noted below, no director, executive officer or controlling security holder of the Company is, as of the date of this AIF, or has been, within the past 10 years, a director or executive officer of any other issuer that, while that person was acting in that capacity:
TransAlta Corporation • Annual Information Form 33
•Was the subject of a cease trade or similar order or an order that denied the relevant company access to any exemption under securities legislation for a period of more than 30 consecutive days; or
•Was subject to an event that resulted, after the person ceased to be a director or executive officer, in the company being the subject of a cease trade or similar order or an order that denied the relevant company access to any exemption under securities legislation for a period of more than 30 consecutive days; or
•Within a year of that person ceasing to act in that capacity, became bankrupt, made a proposal under any legislation relating to bankruptcy or insolvency or was subject to or instituted any proceedings, arrangement or compromise with creditors or had a receiver, receiver manager or trustee appointed to hold its assets.
Mr. Reid was a director of Second Wave Petroleum Inc. (SWP), a private oil and gas exploration and production company. On June 30, 2017, SWP made an assignment into bankruptcy pursuant to the Bankruptcy and Insolvency Act (Canada) (BIA). On Sept. 7, 2017, SWP made a proposal under the BIA and on Oct. 5, 2017, the proposal was approved by the Court of Queen's Bench of Alberta and the bankruptcy was annulled. Mr. Reid retired from the board of directors of SWP in December 2025.
Mr. Dielwart was chair of the board of directors of Denbury Resources Inc. (Denbury), which filed for bankruptcy protection in the United States on July 29, 2020, under a prepackaged reorganization plan with its bondholders. Denbury emerged from Chapter 11 on Sept. 18, 2020, at which time the board of directors was reconstituted and Mr. Dielwart ceased being a director.
Personal Bankruptcies
No director, executive officer or controlling security holder of the Company has, within the 10 years before the date of this AIF, become bankrupt, made a proposal under any legislation relating to bankruptcy or insolvency, or became subject to or instituted any proceedings, arrangement or compromise with creditors, or had a receiver, receiver manager or trustee appointed to hold such person's assets.
Penalties or Sanctions
No director, executive officer or controlling security holder of the Company has been subject to any penalties or sanctions imposed by a court relating to securities legislation or by a securities regulatory authority or has entered into a settlement agreement with a securities regulatory authority, other than penalties for late filing of insider reports; or been subject to any other penalties or sanctions imposed by a court or regulatory body that would likely be considered important to a reasonable investor in making an investment decision.
Conflicts of Interest
Circumstances may arise where members of the Board of Directors serve as directors or officers of corporations that are in competition with the interests of TransAlta. No assurances can be given that opportunities identified by such members of the Board of Directors will be provided to us. However, our policies provide that each director and executive officer must comply with the disclosure requirements of the CBCA regarding any material interest. If a declaration of material interest is made, the declaring director shall not vote on the matter if put to a vote of the Board of Directors. In addition, the declaring director may be requested to recuse himself or herself from the meeting when such matter is being discussed.
Legal Proceedings and Regulatory Actions
TransAlta is occasionally named as a party in claims and legal proceedings that arise during the normal course of its business. We review each of these claims, including the nature of the claim, the amount in dispute or claimed, and the availability of insurance coverage. There can be no assurance that any particular claim will be resolved in our favour or that such claim may not have a material adverse effect on TransAlta.
TransAlta Corporation • Annual Information Form 34
Brazeau Facility — Well Licence Applications to Consider Hydraulic Fracturing
The Alberta Energy Regulator (AER) issued a subsurface order on May 27, 2019, which does not permit any hydraulic fracturing within three kilometres of the Brazeau facility, but permits hydraulic fracturing in all formations (except the Duvernay) within three to five kilometres of the Brazeau facility.
Subsequently, two oil and gas operators submitted applications to the AER for 10 well licences (which include hydraulic fracturing activities) within three to five kilometres of the Brazeau facility.
The Company's position, based on independent expert analysis commissioned by the Government of Alberta, is that hydraulic fracturing activities within five kilometres of the Brazeau facility pose an unacceptable risk and that the applications should be denied. The regulatory hearing to consider these applications - Proceeding 379 - has been adjourned to the fourth quarter of 2026.
Brazeau Facility — Claim against the Government of Alberta
On Sept. 9, 2022, the Company filed a Statement of Claim against the Government of Alberta in the Alberta Court of King’s Bench seeking a declaration that: (a) granting mineral leases within five kilometres of the Brazeau facility is a breach of a 1960 agreement between the Company and the Government of Alberta; and (b) the Government of Alberta is required to indemnify the Company for any costs or damages that result from the risks of hydraulic fracturing near the Brazeau facility. On Sept. 29, 2022, the Government of Alberta filed its Statement of Defence, which asserts, among other things, that the Company: (a) is trying to usurp the jurisdiction of the AER; and (b) is out of time under the Limitations Act (Alberta). The trial is scheduled to be heard in the second or third quarter of 2026 if the parties are unable to resolve the dispute before then.
Interests of Management and Others in Material Transactions
No director or executive officer of TransAlta, no person or company that is the direct or indirect beneficial owner of, or who exercises control or direction over more than 10 per cent of our common shares, and no associate or affiliate of any of them, has or has had any material interest, direct or indirect, in any transaction involving TransAlta within the three most recently completed financial years or to date in 2025 or in any proposed transactions that have materially affected or will materially affect TransAlta.
In connection with the Brookfield Investment, Mr. James Reid and Mr. Brian Baker were initially nominated by Brookfield and elected to the Board of Directors on May 4, 2021, and April 24, 2025, respectively. See the "Directors and Officers" section of this AIF for more details. Brookfield is also entitled to receive certain funding fees, management fees and interest and dividends on its $750 million investment.
Transfer Agent and Registrar
The transfer agent and registrar for our common shares and Series A, B, C, D, E and G first preferred shares is Odyssey Trust Company. Common shares are transferable in Vancouver, Calgary and Toronto. Series A, B, C, D, E and G first preferred shares are transferable in Calgary and Toronto. The transfer agent and registrar for our common shares in the United States is Odyssey Transfer and Trust Company at its principal office in Woodbury, Minnesota.
Material Contracts
Other than contracts entered into in the ordinary course of business, the Company believes that the following are material contracts, the particulars of which are disclosed in this AIF, to which the Company or its subsidiaries are a party:
TransAlta Corporation • Annual Information Form 35
•Investment Agreement: See the "Capital Structure – Exchangeable Securities – Investment Agreement" section of this AIF for further details.
•Registration Rights Agreement: See the "Capital Structure – Exchangeable Securities – Registration Rights Agreement" section of this AIF for further details.
•Off-Coal Agreement: On Nov. 24, 2016, we entered into the Off-Coal Agreement with the Government of Alberta pertaining to our cessation of emissions from the Keephills 3 and Sheerness coal-fired facilities. Under the Off-Coal Agreement, we are entitled to receive annual cash payments of approximately $41 million, net to TransAlta, from the Government of Alberta. These payments started in 2017 and will terminate in 2030, subject to satisfaction of certain terms and conditions that include our cessation of all coal-fired emissions on or before Dec. 31, 2030. Other conditions include maintaining prescribed spending on investment and investment-related activities in Alberta, maintaining a significant business presence in Alberta (including through the maintenance of prescribed employment levels), maintaining spending on programs and initiatives to support the communities surrounding the facilities and the employees of the Company negatively impacted by the phase-out of coal generation, and the fulfilment of all obligations to affected employees, in each case as prescribed by the Off-Coal Agreement.
Interests of Experts
The Company's auditors are Ernst & Young LLP, Chartered Professional Accountants, located at 2200, 215 – 2nd Street, S.W., Calgary, Alberta, T2P 1M4.
Ernst & Young LLP is independent in the context of the Rules of Professional Conduct of the Chartered Professional Accountants of Alberta and within the meaning of the rules and regulations adopted by the United States Securities and Exchange Commission and the Public Company Accounting Oversight Board (United States).
Annual Confirmation
As of Feb. 26, 2026, TransAlta qualifies as a “well-known seasoned issuer” (WKSI) under National Instrument 44-102 – Shelf Distributions and is therefore eligible to file a WKSI base shelf prospectus.
Additional Information
Additional information in relation to TransAlta may be found on our website at www.transalta.com and under TransAlta's profile on SEDAR+ at www.sedarplus.ca and EDGAR at www.sec.gov.
Additional information, including directors' and officers' remuneration and indebtedness, principal holders of our securities and securities authorized for issuance under equity compensation plans (all where applicable) is contained in our Management Proxy Circular for the most recent annual meeting of shareholders that involved the election of directors and can be obtained upon request from our Investor Relations department, or as filed on SEDAR+ at www.sedarplus.ca and EDGAR at www.sec.gov.
Additional financial information is provided in our audited consolidated financial statements as at and for the year ended Dec. 31, 2025, and in the related MD&A.
Audit, Finance and Risk Committee
General
The members of TransAlta's Audit, Finance and Risk Committee (AFRC) satisfy the requirements for independence under the provisions of the Canadian Securities Administrators, National Instrument 52-110 – Audit Committees, Section 303A of the NYSE Rules and Rule 10A-3 under the U.S. Securities and Exchange Act
TransAlta Corporation • Annual Information Form 36
of 1934. The AFRC's Charter requires that it be made up of a minimum of three independent directors. The AFRC currently consists of four independent members: Thomas M. O'Flynn (Chair), Alan J. Fohrer, Candace J. MacGibbon and Bryan D. Pinney.
All members of the committee are financially literate pursuant to both Canadian and U.S. securities requirements and each member of the AFRC has also been determined by the Board of Directors to be an "audit committee financial expert," within the meaning of Section 407 of the U.S. Sarbanes-Oxley Act of 2002.
Audit, Finance and Risk Committee Charter
The Charter of the AFRC is attached as Appendix "A".
Relevant Education and Experience of Audit, Finance and Risk Committee Members
The following is a brief summary of the education or experience of each member of the AFRC that is relevant to the performance of his or her responsibilities as a member of the AFRC, including any education or experience that has provided the member with an understanding of the accounting principles that we use to prepare our annual and interim financial statements.
TransAlta Corporation • Annual Information Form 37
| | | | | |
| Name of AFRC Member | Relevant Education and Experience |
Thomas M. O'Flynn (Chair) | Mr. O'Flynn was the Chief Financial Officer of Powin Energy, an entity in which Energy Impact Partners LP (a private energy technology fund) is a major investor. Before this, Mr. O'Flynn was Chief Executive Officer and Chief Investment Officer at the AES Infrastructure Advisors, Executive Vice President and Chief Financial Officer at Public Service Enterprise Group Incorporated and Head of North American Power at Morgan Stanley. Mr. O'Flynn has a Bachelor of Arts in economics from Northwestern University and a Master of Business Administration, Finance from the University of Chicago. |
| Alan J. Fohrer | Before his retirement in December 2010, Mr. Fohrer was Chair and Chief Executive Officer of Southern California Edison Company, a subsidiary of Edison and one of the largest electric utilities in the United States. Prior to that, Mr. Fohrer served as Vice-President, Senior Vice-President, Executive Vice-President and Chief Financial Officer of both Edison and Southern California Edison Company. Mr. Fohrer also serves on the audit committee of TXNM Energy, Inc., a public company. Mr. Fohrer holds a Master of Business Administration from California State University in Los Angeles. |
Candace J. MacGibbon | Ms. MacGibbon was the former Chief Executive Officer and Chief Financial Officer of INV Metals Inc. Prior to this, she was a former manager at Deloitte LLP and held roles within RBC Capital Markets and BMO Capital Markets. Ms. MacGibbon currently serves as a board member of Osisko Gold Royalties, where she is a member of both the Audit and Human Resources committees, and she is also a board member of Kinross Gold Corporation, serving on its Audit and Risk Committee. In addition, she is a director of the Canada Growth Fund. Ms. MacGibbon holds a Bachelor of Arts degree in economics from the University of Western Ontario and is a Chartered Professional Accountant with over 25 years of experience in the mining sector and capital markets. |
Bryan D. Pinney | Mr. Pinney has 40 years of experience in financial auditing, valuation and advising companies in energy and natural resources. He is an independent director of North American Construction Group Ltd. and chair of its Audit and Finance Committee. He is also an independent director of SNDL, Inc. and chair of its Audit and Finance Committee. He served as a member of Deloitte’s Board of Directors and chair of the Finance and Audit Committee. He was the recent chair and a member of the Board of Governors of Mount Royal University and has previously served on a number of non-profit boards. He has been a Chartered Accountant since December 1978, a Fellow of the Chartered Professional Accountants of Alberta since January 2009 and a Chartered Business Valuator of Canada since December 1990. Mr. Pinney obtained a Bachelor of Arts in business administration from the University of Western Ontario in 1975 and also completed the Directors Education Program offered by the Institute of Corporate Directors in Canada in 2012. |
TransAlta Corporation • Annual Information Form 38
Other Board Committees
In addition to the AFRC, TransAlta's Board of Directors has three other standing committees: the Governance, Safety and Sustainability Committee, the Human Resources Committee and the Investment Performance Committee. As of Dec. 31, 2025, the members of these committees are:
| | | | | | | | |
Governance, Safety and Sustainability Committee | | Human Resources Committee |
Chair: Bryan D. Pinney | | Chair: Sandra R. Sharman |
| Alan J. Fohrer | | Candace J. MacGibbon |
| Laura W. Folse | | Manjit K. Sharma |
| Sandra R. Sharman | |
|
| | |
Investment Performance Committee | | |
Chair: Laura W. Folse | | |
Brian Baker | | |
Thomas M. O'Flynn | | |
James Reid | | |
Manjit K. Sharma | | |
Mr. John P. Dielwart also attends each of the committee meetings in his capacity as Chair of the Board of Directors.
Charters of the Governance, Safety and Sustainability Committee, the Human Resources Committee and the Investment Performance Committee may be found on our website under Governance, Board Committees at www.transalta.com. Further information about the Board of Directors and our corporate governance may also be found on our website or in our Management Proxy Circular, which is filed on SEDAR+ at www.sedarplus.ca and EDGAR at www.sec.gov.
Fees Paid to Ernst & Young LLP
For the years ended Dec. 31, 2025, and Dec. 31, 2024, Ernst & Young LLP and its affiliates billed $5,398,388 and $4,407,734, respectively, as detailed below.
| | | | | | | | | | | | | | | | | | | | |
| Ernst & Young LLP |
Year Ended Dec. 31 | 2025 | 2024 |
Audit fees | $ | 4,968,834 | $ | 3,653,823 |
Audit-related fees | | 423,354 | | 347,345 |
| Tax fees | | 6,200 | | 356,391 |
| All other fees | | 0 | | 50,175 |
| Total | $ | 5,398,388 | | $ | 4,407,734 | |
The nature of each category of fees is described below:
Audit Fees
Audit fees are for professional services rendered for the audit and review of our financial statements or services provided in connection with statutory and regulatory filings and providing comfort letters associated with securities documents and statutory audits.
TransAlta Corporation • Annual Information Form 39
Audit-Related Fees
Assurance and related services that are reasonably related to the performance of the audit or review of our financial statements that are not included in the audit fees. Audit-related fees include pension audits and other compliance audits.
Tax Fees
Tax fees are tax-related services for the review of tax returns, assistance with questions on tax audits and tax planning.
All Other Fees
All other fees related to training services and advice and assistance with ESG services provided by the auditor.
Pre-Approval Policies and Procedures
The AFRC has considered whether the provision of services other than audit services is compatible with maintaining the auditors' independence. In May 2002, the AFRC adopted a policy that prohibits TransAlta from engaging the auditors for "prohibited" categories of non-audit services and requires pre-approval of the AFRC for other permissible categories of non-audit services, such categories being determined under the Sarbanes Oxley Act of 2002. This policy also provides that the Chair of the AFRC may approve permissible non-audit services during the quarter and report such approval to the AFRC at its next regularly scheduled meeting.
TransAlta Corporation • Annual Information Form 40
Appendix "A"
TransAlta Corporation (the Corporation)
Audit, Finance and Risk Committee Charter
1. Establishment of Committee and Procedures
a. Composition of Committee
The Audit, Finance and Risk Committee (the Committee) of the board of directors (the Board) of TransAlta Corporation (the Corporation) shall consist of not less than three directors. All members of the Committee shall be determined by the Board to be independent as required under the provisions of Canadian Securities Regulators' Multilateral Instrument 52-110 Audit Committees, Section 303A of the New York Stock Exchange rules and Rule 10A-3 of the U.S. Securities and Exchange Act of 1934, as such rules apply to audit committee members. All members of the Committee must be financially literate pursuant to both Canadian and U.S. securities requirements and at least one member must be determined by the Board to be an "audit committee financial expert" within the meaning of Section 407 of the United States Sarbanes-Oxley Act of 2002 ("Sarbanes-Oxley Act"). Determinations as to whether a particular director satisfies the requirements for membership on the Committee shall be made by the Board at the recommendation of the Governance, Safety and Sustainability Committee (the GSSC) of the Board.
b. Appointment of Committee Members
Members of the Committee shall be appointed from time to time by the Board, on the recommendation of the GSSC, and shall hold office until the next annual meeting of shareholders, or until their successors are earlier appointed, or until they cease to be directors of the Corporation.
c. Vacancies
Where a vacancy occurs at any time in the membership of the Committee, it may be filled by the Board and on the recommendation of the GSSC. The Board shall fill any vacancy if the membership of the Committee is less than three directors.
d. Committee Chair
The Board shall appoint a Chair for the Committee on the recommendation of the GSSC.
e. Absence of Committee Chair
If the Chair of the Committee is not present at any meeting of the Committee, one of the members of the Committee who is present at the meeting shall be chosen by the Committee to preside at the meeting.
f. Secretary of Committee
The Committee shall appoint a Secretary who need not be a director of the Corporation.
g. Meetings
The Chair of the Committee may call a regular meeting of the Committee. The Committee shall meet at least quarterly and at such other times each year as it deems appropriate to fulfill its responsibilities. In addition, the Chair of the Committee or any two members may call a special meeting of the Committee at any time.
The Committee shall also meet in separate executive sessions.
h. Quorum
A majority of the members of the Committee, present in person or by telephone or other telecommunication device that permits all persons participating in the meeting to speak to each other, shall constitute a quorum.
TransAlta Corporation • Annual Information Form A-1
i. Notice of Meetings
Notice of the time and place of every meeting shall be given in writing (including by way of written facsimile communication or email) to each member of the Committee at least 48 hours prior to the time fixed for such meeting, provided, however, that a member may in any manner waive notice of a meeting; and attendance of a member at a meeting constitutes a waiver of notice of the meeting, except where a member attends for the express purpose of objecting to the transaction of any business on the ground that the meeting is not lawfully called. Notice of every meeting shall also be provided to the external and internal auditors.
j. Attendance at Meetings
At the invitation of the Chair of the Committee, other Board members, the President and Chief Executive Officer (CEO) of the Corporation, other officers or employees of the Corporation, the external auditors, and other experts or consultants may attend a meeting of the Committee.
k. Procedure, Records and Reporting
Subject to any statute or the articles and by-laws of the Corporation, the Committee shall fix its own procedures at meetings, keep records of its proceedings and report to the Board generally not later than the next scheduled meeting of the Board.
l. Review of Charter and Evaluation of Committee
The Committee shall evaluate its performance and review and assess the adequacy of its Charter at least annually or otherwise, as it deems appropriate. All changes proposed by the Committee are reviewed and approved by the GSSC and the Board.
m. Outside Experts and Advisors
In consultation with the Board, the Committee Chair, on behalf of the Committee or any of its members, is authorized, at the expense of the Corporation, when deemed necessary or desirable, to retain independent counsel, outside experts and other advisors to advise the Committee independently on any matter. The retention of such counsel, expert or advisor in no way requires the Committee to act in accordance with the recommendations of such counsel, expert or advisor.
2. Duties and Responsibilities of the Chair
The fundamental responsibility of the Chair of the Committee is to effectively manage the duties of the Committee.
The Chair is responsible for:
a. Chairing meetings of the Committee and ensuring that the Committee is properly organized so that it functions effectively and meets its obligations and responsibilities.
b. Establishing the frequency of Committee meetings, duly convening the same and confirming that quorum is present when required.
c. Working with the CEO, the Executive Vice President, Finance and Chief Financial Officer (the CFO) of the Corporation, or the Corporate Secretary of the Corporation, as applicable, on the development of agendas and related materials for the meetings.
d. Providing leadership to the Committee and assisting the Committee in ensuring the proper and timely discharge of its responsibilities.
e. Reporting to the Board on the recommendations and decisions of the Committee.
The Chair of the Committee shall review all expense accounts and perquisites of the Chair of the Board and the CEO not less than quarterly to ensure compliance with the Corporation’s policies, and shall report to the Committee on an annual basis.
TransAlta Corporation • Annual Information Form A-2
3. Mandate of the Committee
The Committee provides assistance to the Board in fulfilling its oversight responsibilities with respect to: i) the integrity of the Corporation's financial statements and financial reporting process; ii) the systems of internal financial controls and disclosure controls established by management of the Corporation ("Management"); iii) the risk identification and assessment process conducted by Management including the programs established by Management to respond to such risks; iv) the internal audit function; v) compliance with financial, legal and regulatory requirements; and vi) the external auditors' qualifications, independence and performance. In so doing, it is the Committee's responsibility to maintain an open avenue of communication between it and the external auditors, the internal auditors and Management.
The function of the Committee is oversight. Management is responsible for the preparation, presentation and integrity of the interim and annual financial statements and related disclosure documents. Management is also responsible for maintaining appropriate accounting and financial reporting policies and systems of internal controls and disclosure controls and procedures to comply with accounting standards, applicable laws and regulations that provide reasonable assurance that the assets of the Corporation are safeguarded and transactions are authorized, executed, recorded and properly reported.
While the Committee has the responsibilities and powers set forth herein, it is not the duty of the Committee to plan or conduct audits or to determine that the Corporation's financial statements are complete and accurate and in accordance with generally accepted accounting principles. This is the responsibility of Management and the external auditors.
The Committee must also designate at least one member as an "audit committee financial expert." The designation of a member or members as an "audit committee financial expert" is based on that individual's education and experience, which the individual will bring to bear in carrying out his or her duties on the Committee. Designation as an "audit committee financial expert" does not impose on such person any duties, obligations and liability that are greater than the duties, obligations and liability imposed on another member of the Committee and Board in the absence of such designation.
Management is also responsible for the identification and management of the Corporation's risks and the development and implementation of policies and procedures to mitigate such risks. The Committee's role is to provide oversight in order to ensure that the Corporation's assets are protected and safeguarded within reasonable business limits. The Committee reports to the Board on its risk oversight responsibilities.
4. Duties and Responsibilities of the Committee
a. Financial Reporting, External Auditors and Financial Planning
i) Duties and Responsibilities Related to Financial Reporting and the Audit Process
(A) Review with Management and the external auditors the Corporation's financial reporting process the work to be conducted in conjunction with the annual audit and the preparation of the financial statements, including, without limitation, the annual audit plan of the external auditors, the judgment of the external auditors as to the quality, not just the acceptability, of and the appropriateness of the Corporation's accounting principles as applied in its financial reporting and the degree of aggressiveness or conservatism of the Corporation's accounting principles and underlying estimates;
(B) Review with Management and the external auditors the Corporation's audited annual financial statements, including the notes thereto, "Management's Discussion and Analysis," the related earnings release, and recommend their approval to the Board for release to the public;
(C) Review with Management and the external auditors the Corporation's interim financial statements, including the notes thereto, "Management's Discussion and Analysis," the related earnings release, and approve their release to the public as required;
(D) In reviewing the financial statements and related financial disclosure, the Committee shall review and discuss with Management and the external auditors:
TransAlta Corporation • Annual Information Form A-3
• any changes in accounting principles, practices or policies considering their applicability to the business and financial impact;
• Management's processes for formulating sensitive accounting estimates and the reasonableness of
the estimates;
• the use of "pro forma" or "non-comparable" information and the applicable reconciliation;
• alternative treatments of financial information within generally accepted accounting principles that have been discussed between Management and the auditors, ramifications of the use of such alternative disclosures and treatments and the treatment preferred by the external auditors; and
• disclosures made to the Committee by the CEO and CFO during their certification process for the relevant periodic/annual report filed with securities regulators to ensure that information required to be disclosed is recorded, processed, summarized and reported within the time periods specified for the reporting period. Obtain assurances from the CEO and CFO as to the adequacy and effectiveness of the Corporation's disclosure controls and procedures and systems of internal control over financial reporting and that any fraud involving Management or other employees who have a significant role in the Corporation's internal controls is reported to the Committee.
(E) In reviewing the financial statements and related financial disclosure, the Committee shall also, with the external auditors:
• discuss the cooperation they received from Management during the course of their review and their access to all records, data and information requested; and
• satisfy itself that there are no unresolved issues between Management and the external auditors that could reasonably be expected to materially affect the financial statements.
(F) Review quarterly with senior Management, the Executive Vice President, Legal (or, as necessary, outside legal advisors) of the Corporation, and the Corporation's internal and external auditors, the effectiveness of the Corporation's internal controls to ensure the Corporation is in compliance with legal and regulatory requirements and the Corporation's policies;
(G) Review with Management and the external auditors the processes relating to the assessment of potential fraud, programs and controls to mitigate the risk of fraud, and the processes put in place for monitoring the risks within the targeted areas; and
(H) Discuss with Management and the external auditors any correspondence from or with regulators or governmental agencies, any employee complaints or any published reports that raise material issues regarding the Corporation's financial statements or accounting policies.
ii Duties and Responsibilities Related to the External Auditors
(A) The Committee shall have direct responsibility for the compensation and oversight of the external auditors including nominating the external auditors to the Board for appointment by the shareholders at the Corporation's general annual meeting. In performing its function, the Committee shall:
• review and approve annually the external auditors audit plan;
• review and approve the basis and amount of the external auditors' fees and ensure the Corporation has provided appropriate funding for payment of compensation to the external auditors;
TransAlta Corporation • Annual Information Form A-4
• subject to the delegation granted to the Chair of the Committee, pre-approve all audit related services including all non-prohibited non-audit services provided by the external auditors; the Chair of the Committee is authorized to approve all audit related services including non-prohibited non-audit services provided by the external auditors, and shall report all such approvals to the Committee at its next scheduled meeting;
• review and discuss annually with the external auditors all relationships that the external auditors and their affiliates have with the Corporation and its affiliates in order to determine the external auditors' independence, including, without limitation: (a) requesting, receiving and reviewing, at least annually, a formal written statement from the external auditors delineating all relationships that may reasonably be thought to bear on their independence with the Corporation; (b) discussing with the external auditors any relationships or services that the external auditors believe may affect their objectivity and professional skepticism; (c) reviewing with the external auditors the experience and qualifications of the senior personnel who are providing audit services to the Corporation; (d) reviewing the quality control procedures of the external auditors, including obtaining confirmation that the external auditors are in compliance with Canadian and U.S. regulatory registration requirements; and (e) evaluating the communication and interaction with the external auditor including quality of service considerations;
• in the year preceding the change of the lead (or coordinating) audit partner (having primary responsibility for the audit), and in any event not less than every five years, perform a comprehensive review of the external auditor which takes into consideration (a) the impact of the tenure of the audit firm on audit quality, trends in the audit firm's performance and expertise in the industry, incidences of independence threats and the effectiveness of safeguards to mitigate those threats, (b) the responsiveness of the audit firm to changes in the entity's business and suggestions for improvement from regulators, the Committee and/or Management, (c) the consistency and rigour of the professional skepticism applied by the external auditor, and the quality of the engagement team and its communications, review of Canadian Public Accountability Board (CPAB) inspection findings since the previous comprehensive review and how the audit firm responded to these findings, and following this comprehensive review, determine whether the audit firm should be nominated to the Board as the external auditors for appointment by the shareholders at the Corporation's next general annual meeting;
• inform the external auditors and Management that the external auditors shall have direct access to the Committee at all times, as well as the Committee to the external auditors;
• instruct the external auditors that they are ultimately accountable to the Committee as representatives of the shareholders of the Corporation; and
• at least annually, obtain and review the external auditors' report with respect to the auditing firm's internal quality-control procedures, any material issues raised by the most recent internal quality-control review or peer review of the auditing firm, any inquiry or investigation by governmental or professional authorities within the preceding five years undertaken respecting one or more independent audits carried out by the external auditors, and any steps taken to deal with any such issues.
iii Duties and Responsibilities Related to Financial Planning
(A) Review and recommend to the Board for approval the Corporation's issuance and redemption of securities (including the review of all public filings to effect any of the issuances or redemptions), financial commitments and limits, and any material changes underlying any of these commitments;
TransAlta Corporation • Annual Information Form A-5
(B) Review annually the Corporation's annual tax plan;
(C) Receive regular updates with respect to the Corporation's financial obligations, loans, credit facilities, credit position and financial liquidity;
(D) Review annually with Management the Corporation's overall financing plan in support of the Corporation's capital expenditure plan and overall budget/medium range forecast; and
(E) Review with Management at least annually the approach and nature of earnings guidance and financial information to be disclosed to analysts and rating agencies.
b. Internal Audit
i. Approve whether the internal audit function should be outsourced and if outsourced, approve the audit firm to perform such internal audit service; provided that in no event shall the external auditor be retained to also perform the internal audit function;
ii. Review and consider, as appropriate, any significant reports and recommendations made by internal audit relating to internal audit issues, together with Management's response thereto;
iii. Review annually the scope and plans for the work of the internal audit group, the adequacy of the group's resources, the internal auditors' access to the Corporation's records, property and personnel;
iv. Recognize and advise senior Management that the internal auditors shall have unfettered access to the Committee, as well as the Committee to the internal auditors;
v. Meet separately with Management, the external auditors and internal auditors to review issues and matters of concern respecting audits and financial reporting;
vi. Review with the senior financial members of Management and the internal audit group the adequacy of the Corporation's systems of internal control and procedures; and
vii. Recommend to the Human Resources Committee of the Board the appointment, termination or transfer of the lead individual responsible for internal audit, provided that if the internal audit function has been, or is being, outsourced to an audit firm, the Committee itself shall approve the appointment, termination or transfer of such audit firm.
c. Risk Management
The Board is responsible for ensuring that the Corporation has adopted processes and key policies for the identification, assessment and management of its principal risks. The Board has delegated to the Committee the responsibility for the oversight of Management's identification, and evaluation, of the Corporation's principal risks, and the implementation of appropriate policies, processes and systems to manage or mitigate the risks within the Corporation's risk appetite. The Committee reports to the Board thereon.
The Committee shall:
i. Review, at least quarterly, Management's assessment of the Corporation's principal risks; discuss with Management the processes for the identification of these risks and the efficacy of the policies and procedures for mitigating and/or addressing these risks;
ii. Receive and review Managements' quarterly risk update including an update on residual risks;
iii. Review the Corporation's enterprise risk management framework and reporting methodology;
iv. Review annually the Corporation's Financial and Commodity Exposure Management Policies and approve changes to such policies;
v. Review and approve the Corporation's strategic hedging program, guidelines and risk tolerance;
vi. Review and monitor quarterly results of financial and commodity exposure management activities, including foreign currency and interest rate risk strategies, counterparty credit exposure and the use of derivative instruments;
TransAlta Corporation • Annual Information Form A-6
vii. Review the Corporation's annual insurance program, including the risk retention philosophy, potential exposure and corporate liability protection programs;
viii. Periodically consider the respective roles and responsibilities of the external auditor, the internal audit department, internal and external counsel concerning risk management and review their performance in relation to such roles and responsibilities; and
ix. Annually, together with Management, report and review with the Board:
x. the Corporation's principal risks and overall risk appetite/profile;
xi. the Corporation's strategies in addressing its risk profile;
xii. the processes, policies, procedures and controls in place to manage or mitigate the principal risks; and
xiii. the overall effectiveness of the enterprise risk management process and program.
d. Governance
i) Public Disclosure, Legal and Regulatory Reporting
(A) On behalf of the Committee, the Chair shall review all public disclosure inclusive of material financial information extracted or derived from the Corporation's financial statements prior to dissemination to the public;
(B) Review quarterly with the Executive Vice President, Legal and Corporate Secretary, and, if necessary, outside legal advisors, significant legal, compliance or regulatory matters that may have a material effect on the Corporation's financial statements;
(C) Discuss with the external auditors their perception of the Corporation's financial and accounting personnel, any recommendations which the external auditors may have, including those contained in the Management letter, with respect to improving internal financial controls, choice of accounting principles or management reporting systems, and review all Management letters from the external auditors together with Management's written responses thereto;
(D) Review with Management, the external auditors and internal legal counsel (external counsel if necessary), any litigation, claim or contingency, including tax assessments, that could have a material effect upon the financial position of the Corporation, and the manner in which these may be or have been disclosed in the financial statements;
(E) Review annually the Insider Trading Policy and approve changes as required; and
(F) Review annually the Corporation's Disclosure Policy and Social Media Policy to ensure continued applicability with the law and the Corporation's disclosure principles.
ii. Pension Plan Governance
(A) Together with the Human Resources Committee of the Board (the “HRC”), review and recommend to the Board for approval amendments to the Corporation’s pension plans resulting in additional funding requirements or costs to the Corporation;
(B) Together with the HRC, review annually, and otherwise as may be required, the overall governance of the Corporation's pension plans, including the plans’ terms of reference and investment policies and approve the broad objectives of the plan(s) and any material changes to the plan(s) and report to the Board annually; and
(C) Together with the HRC, review and recommend annually to the Board the approval of the Annual Pension Report and financial statements of the Corporation’s pension plans.
iii. Information Technology – Cyber security and Artificial Intelligence
(A) Receive bi-annually a system status update with respect to the Corporation's core IT operating systems;
TransAlta Corporation • Annual Information Form A-7
(B) Review annually the Corporation's cyber security programs and their effectiveness. Receive an update on the Corporation's compliance program for cyber threats and security; and
(C) Review periodically developments in respect of artificial and generative artificial intelligence, including opportunities, challenges and/or associated risks which could have a material impact on the execution of the Corporation’s strategy or key business objectives.
iv. Administrative Responsibilities
(A) Review the annual audit of expense accounts and perquisites of the directors, the CEO and the CEO's direct reports and their use of corporate assets;
(B) Establish procedures for the receipt, retention and treatment of complaints relating to securities law, accounting, internal accounting controls, or auditing matters;
(C) Review incidents, complaints or information reported through the Ethics Help Line addressed to the Committee or relating to securities law, accounting, internal accounting controls, or auditing matters;
(D) Establish procedures for the investigation of complaints or allegations, and, in respect of potentially material complaints or allegations, report to the Board thereon and ensure that appropriate action is taken as necessary to address such matter;
(E) Review and consider any related party transaction and recommend, if necessary, the use of a standing committee or an ad hoc special committee to assist the Board in the evaluation of any such related party transaction;
(F) Review and approve the Corporation's hiring policies for employees or former employees of the external auditors and monitor the Corporation's adherence to the policy; and
(G) Report annually to shareholders on the work of the Committee during the year.
5. Compliance and Powers of the Committee
a. The responsibilities of the Committee comply with applicable Canadian laws and regulations, such as the rules of the Canadian Securities Administrators, and with the disclosure and listing requirements of the Toronto Stock Exchange, as they exist on the date hereof. In addition, this Charter complies with applicable U.S. laws, such as the Sarbanes-Oxley Act and the rules and regulations adopted thereunder, and with the New York Stock Exchange's corporate governance standards, as they exist on the date hereof.
b. The Committee may, at the request of the Board or on its own initiative, investigate such other matters as are considered necessary or appropriate in carrying out its mandate.
TransAlta Corporation • Annual Information Form A-8
Appendix "B"
Glossary of Terms
Units of measure
"GW" – Gigawatt – A measure of electric power equal to 1,000 MW.
"GW/h" – Gigawatt hour – A measure of electricity consumption equivalent to the use of 1,000 megawatts of power over a period of one hour.
"MW" – Megawatt – A measure of electric power equal to 1,000,000 watts.
"MWh" – Megawatt-hour – A measure of electricity consumption equivalent to the use of 1,000,000 watts of power over a period of one hour.
Government and regulatory bodies terms
"AER" – Alberta Energy Regulator
"AESO" – The independent system operator and regulatory authority for the Alberta Interconnected Electric System.
"BIA" – Bankruptcy and Insolvency Act (Canada)
"CBCA" – Canada Business Corporations Act.
"MSA" – Market Surveillance Administrator.
"MSHA" – Mine Safety and Health Administration.
"NYSE" – New York Stock Exchange.
"TSX" – Toronto Stock Exchange.
General terms and terms related to our operations
"capacity" – The rated continuous load-carrying ability, expressed in megawatts, of generation equipment.
"cogeneration" – A generating facility that produces electricity and another form of useful thermal energy (such as heat or steam) used for industrial, commercial, heating or cooling purposes.
"GHG" – Greenhouse gases that have the potential to retain heat in the atmosphere, including water vapour, carbon dioxide, methane, nitrous oxide, hydrofluorocarbons, and perfluorocarbons.
"IFRS" – International Financial Reporting Standards.
"net capacity" – The maximum capacity or effective rating, modified for ambient limitations, that a generating unit or power plant can sustain over a specific period, less the capacity used to supply the demand of station service or auxiliary needs.
"VWAP" – Volume weighted average price
TransAlta Corporation • Annual Information Form B-1
TRANSALTA CORPORATION
Management’s Discussion and Analysis
This Management’s Discussion and Analysis (MD&A) contains forward-looking statements. These statements are based on certain estimates and assumptions and involve risks and uncertainties. Actual results may differ materially. Refer to the "Forward-Looking Statements" section of this MD&A for additional information.
Table of Contents
This MD&A should be read in conjunction with our 2025 audited annual consolidated financial statements (the consolidated financial statements) and our 2025 Annual Information Form (AIF), each for the fiscal year ended Dec. 31, 2025. In this MD&A, unless the context otherwise requires, “we”, “our”, “us”, the “Company” and “TransAlta” refer to TransAlta Corporation and its subsidiaries. The consolidated financial statements have been prepared in accordance with International Financial Reporting Standards (IFRS) for Canadian publicly accountable enterprises as issued by the International Accounting Standards Board (IASB) and in effect at Dec. 31, 2025. All tabular amounts in the following discussion are in millions of Canadian dollars unless otherwise noted, except amounts per share, which are in whole dollars to the nearest two decimals. This MD&A is dated Feb. 26, 2026. Additional information respecting TransAlta, including our AIF for the year ended Dec. 31, 2025, is available on SEDAR+ at www.sedarplus.ca, on EDGAR at www.sec.gov and on our website at www.transalta.com. Information on or connected to our website is not incorporated by reference herein.
| | | | | | | | |
| TransAlta Corporation | 2025 Annual Report | M1 |
Forward-Looking Statements
This MD&A includes "forward-looking information" within the meaning of applicable Canadian securities laws and "forward-looking statements" within the meaning of applicable U.S. securities laws, including the Private Securities Litigation Reform Act of 1995 (collectively referred to herein as "forward-looking statements").
Forward-looking statements are not facts, but only predictions and generally can be identified by the use of statements that include phrases such as "may", "will", "can", "could", "would", "shall", "believe", "expect", "estimate", "anticipate", "intend", "plan", "forecast", "foresee", "potential", "enable", "continue" or other comparable terminology.
In particular, this MD&A contains forward-looking statements about the following, among other things:
•The strategic objectives of the Company and that the execution of the Company’s strategy will realize value for shareholders;
•Our capital allocation and financing strategy;
•Our 2026 Outlook;
•Our financial and operational performance, including our hedge position;
•The optimization and diversification of our existing assets;
•The increasingly contracted nature of our fleet;
•Expectations about strategies for growth and expansion;
•Execution of a data centre memorandum of understanding and its framework for phased development of the Keephills site, including the execution of definitive binding agreements with our counterparties for phase 1, the evaluation of opportunities for additional phases of development and the potential for such additional phases of development to aggregate to 1GW of load;
•Expected costs and schedules for planned projects, including the Centralia coal-to-gas conversion project;
•Expected regulatory processes and outcomes, including in respect of the U.S. Department of Energy Order regarding Centralia Unit 2;
•The power generation industry and the supply of, and demand for, electricity;
•Our CEO and CFO succession plans;
•The cyclicality of our business;
•Expected outcomes with respect to legal proceedings;
•The expected impact of future tax and accounting changes; and
•Expected industry, market and economic conditions.
The forward-looking statements contained in this MD&A are based on many assumptions including, but not limited to, the following:
•No significant changes to applicable laws and regulations, including carbon pricing, renewable energy incentives, royalty rates and climate-related regulations;
•No unexpected delays in obtaining required regulatory and other third-party approvals;
•No material adverse impacts to investment and credit markets;
•No significant changes to power price and hedging assumptions;
•No significant changes to gas commodity price assumptions and transport costs;
•No significant changes to interest or foreign exchange rates;
•No significant changes to the demand for, and growth of, electricity generation;
•No significant changes to the integrity and reliability of our facilities;
•No significant changes to the Company's debt and credit ratings;
•No unforeseen changes to economic and market conditions;
•No significant event occurring outside the ordinary course of business;
•No significant changes to the Company's ability to develop, access or implement, on a timely basis and on reasonable terms, the technology necessary to efficiently and effectively operate the Company's assets and achieve expected future results;
•No significant supply chain disruptions or shortages of raw materials or skilled labour;
•No significant changes to the Company's ability to access the capital markets on reasonable terms; and
•No material changes to international trade laws, regulations, agreements, treaties, taxes, tariffs, duties or policies of Canada, the United States or other countries.
These assumptions are based on information currently available to TransAlta, including information obtained from third-party sources. Actual results may differ materially from those predicted by such assumptions.
Factors that may adversely impact what is expressed or implied by forward-looking statements contained in this MD&A include, but are not limited to:
•Fluctuations in power prices;
•Changes in supply and demand for electricity;
•Our ability to contract our electricity generation for prices that will provide expected returns;
•Our ability to replace contracts as they expire;
•Risks associated with development projects and acquisitions;
•Our ability to develop, access or implement, on a timely basis and on reasonable terms, the technology necessary to efficiently and effectively operate our assets and achieve expected future results;
| | | | | | | | |
M2 | TransAlta Corporation | 2025 Annual Report |
•Any difficulty raising needed capital in the future on reasonable terms;
•Long-term commitments on gas transportation capacity that may not be fully utilized over time;
•Changes to legislative, regulatory and political environments, including changes to carbon pricing, renewable energy policies and emissions regulations in Canada, the United States and Australia;
•Environmental requirements and changes in, or liabilities under, these requirements;
•Operational risks involving our facilities, including unplanned outages and equipment failure;
•Disruptions in the transmission and distribution of electricity;
•Grid reliability;
•Reductions in production;
•Impairments and/or writedowns of assets;
•Adverse impacts on our information technology systems and our internal control systems, including increased cybersecurity threats;
•Commodity risk management and energy-trading risks;
•Reduced labour availability, ability to continue to staff our operations and facilities and other labour relations matters;
•Disruptions to our supply chains;
•Weather conditions and their impact on electricity generation and demand;
•Climate change-related risks, including the increased frequency and severity of extreme weather events;
•Reductions to our generating units' relative efficiency or capacity factors;
•General economic risks, including deterioration of equity markets, increasing interest rates, changes to foreign exchange rates or rising inflation;
•General domestic and international economic and political developments, including potential trade tariffs;
•Industry risk and competition, including from emerging technologies affecting the demand, generation, distribution or storage of electricity;
•Counterparty credit risks;
•Inadequacy or unavailability of insurance coverage;
•Increases in the Company's income taxes and any risk of reassessments;
•Legal, regulatory and contractual disputes and proceedings involving the Company;
•Reputational and stakeholder-related risks; and
•Reliance on key personnel.
The foregoing risk factors, among others, are described in further detail in the "Risk Management" section of this MD&A.
Readers are urged to consider these factors carefully when evaluating the forward-looking statements, which reflect the Company's expectations only as of the date of this MD&A and are cautioned not to place undue reliance on them. The forward-looking statements included in this document are made only as of the date of its release and we do not undertake to publicly update these forward-looking statements to reflect new information, future events or otherwise, except as required by applicable laws. The purpose of the financial outlooks contained in this document is to give the reader information about management's current expectations and plans and readers are cautioned that such information may not be appropriate for other purposes. In light of these risks, uncertainties and assumptions, the forward-looking statements might occur to a different extent or at a different time than we have described, or might not occur at all. We cannot assure that projected results or events will be achieved.
| | | | | | | | |
| TransAlta Corporation | 2025 Annual Report | M3 |
Description of the Business
TransAlta Corporation is one of Canada’s largest publicly traded power generators, owning and operating a diverse fleet across Canada, the United States (U.S.) and Western Australia. Our portfolio includes hydro, wind, solar, battery storage and thermal generation, complemented by our asset optimization and energy marketing capabilities. As one of Canada’s largest producers of wind and thermal generation and Alberta’s largest producer of hydroelectric power, TransAlta remains committed to a diverse generation mix. With strong cash flows underpinned by a high-quality portfolio, TransAlta strives to deliver sustainable long-term shareholder value in an evolving energy landscape.
Portfolio of Assets
Our asset portfolio is geographically diversified with operations across our core markets.
Our Hydro, Wind and Solar, Gas and Energy Transition segments are responsible for operating and maintaining our generation facilities. Our Energy Marketing segment is responsible for marketing and scheduling our merchant asset fleet in North America (excluding Alberta) along with the procurement, transport and storage of natural gas, providing knowledge to support our growth team, and
generating a stand-alone gross margin separate from our asset business through a leading North American energy marketing and trading platform.
Our diversified portfolio consists of both high-quality contracted assets and merchant assets. Our contracted assets provide stable long-term cash flow and earnings, balancing our merchant fleet. Our merchant assets include our unique hydro merchant portfolio and our merchant legacy thermal portfolio and wind assets. Our merchant exposure is primarily in Alberta, where 58 per cent of our capacity is located and 77 per cent of our Alberta capacity is available to participate in the merchant market.
In Alberta, the Company manages its merchant exposure by executing hedging strategies that include a significant base of commercial and industrial customers, supplemented with financial hedges. A significant portion of our thermal and hydro generation capacity in Alberta may be hedged to provide greater cash flow certainty while also being available to capture upside through the optimization of our merchant generation portfolio. Refer to the "2026 Outlook" section and the "Optimization of the Alberta Portfolio" section of this MD&A for further details.
| | | | | | | | |
M4 | TransAlta Corporation | 2025 Annual Report |
The following table provides our consolidated ownership by segment of our facilities across the regions in which we operate as at Dec. 31, 2025:
| | | | | | | | | | | | | | | | | | | | | | |
As at Dec. 31, 2025 | Hydro | Wind & Solar | Gas | Energy Transition(2) | | | Total |
| Alberta | Gross installed capacity (MW)(1) | 834 | | 764 | | 3,650 | | — | | | | 5,248 | |
Number of facilities | 17 | | 14 | | 15 | | — | | | | 46 | |
Weighted average contract life (years) | — | | 16 | | 8 | | — | | | | 10 | |
Contracted capacity (MW) | — | | 336 | | 887 | | — | | | | 1,223 | |
Contracted capacity as a % of total capacity (%) | — | | 44 | | 24 | | — | | | | 23 | |
| | | | | | | |
| Canada, excluding Alberta | Gross installed capacity (MW)(1) | 88 | | 751 | | 705 | | — | | | | 1,544 | |
Number of facilities | 7 | | 9 | | 4 | | — | | | | 20 | |
Weighted average contract life (years) | 14 | | 8 | | 6 | | — | | | | 7 | |
Contracted capacity (MW) | 88 | | 751 | | 705 | | — | | | | 1,544 | |
Contracted capacity as a % of total capacity (%) | 100 | 100 | 100 | — | | | | 100 |
| | | | | | | |
| U.S. | Gross installed capacity (MW)(1) | — | | 1,024 | | 29 | | 671 | | | | 1,724 | |
Number of facilities | — | | 10 | | 1 | | 2 | | | | 13 | |
Weighted average contract life (years) | — | | 12 | | — | | — | | | | 9 | |
Contracted capacity (MW) | — | | 1,024 | | 29 | | 301 | | | | 1,354 | |
Contracted capacity as a % of total capacity (%) | — | | 100 | | 100 | | 45 | | | | 79 | |
| | | | | | | |
Western Australia | Gross installed capacity (MW)(1) | — | | 48 | | 450 | | — | | | | 498 | |
Number of facilities | — | | 3 | | 6 | | — | | | | 9 | |
Weighted average contract life (years) | — | | 13 | | 13 | | — | | | | 13 | |
Contracted capacity (MW) | — | | 48 | | 450 | | — | | | | 498 | |
Contracted capacity as a % of total capacity (%) | — | | 100 | | 100 | | — | | | | 100 | |
| Total | Gross installed capacity (MW)(1) | 922 | | 2,587 | | 4,834 | | 671 | | | | 9,014 | |
Number of facilities | 24 | | 36 | | 26 | | 2 | | | | 88 | |
Weighted average contract life (years) | 14 | | 11 | | 8 | | — | | | | 9 | |
Contracted capacity (MW) | 88 | | 2,159 | | 2,071 | | 301 | | | | 4,619 | |
Contracted capacity as a % of total capacity (%)(3) | 10 | | 83 | | 43 | | 45 | | | | 51 | |
| | | | | | | | |
(1)Gross installed capacity for consolidated reporting is based on a proportionate interest held in a facility. Refer to the "Plant Summary" section of the 2025 Annual Report for details.
(2)Includes the Centralia coal facility and the Skookumchuck hydro facility.
(3)Approximately 51 per cent of our total installed capacity is contracted with creditworthy counterparties.
| | | | | | | | |
| TransAlta Corporation | 2025 Annual Report | M5 |
Highlights
The Company demonstrated strong operational performance for the year ended Dec. 31, 2025. Lower power pricing in Alberta, subdued market volatility and lower wind resource impacted the Company's results year-over-year, with Adjusted EBITDA coming in below the lower end of the range of management's expectations. Free cash flow, while lower year-over-year, came in slightly above the midpoint of the Company's 2025
Outlook, primarily due to lower current tax expense and lower distributions paid to non-controlling interests. The Company partially mitigated the impact of lower power pricing in Alberta by settling a higher volume of hedges at prices that were significantly above the spot market and also benefited from the integration of Heartland assets, acquired at the end of 2024.
| | | | | | | | | | | | | | |
| | |
| 3 months ended Dec. 31, | Year ended Dec. 31 |
| (in millions of Canadian dollars except where noted) | 2025 | 2024 | 2025 | 2024 |
Operational information(1) | | | | |
| Availability (%) | 90.1 | | 87.8 | | 92.3 | | 91.2 | |
| Production (GWh) | 6,725 | | 6,199 | | 24,521 | | 22,811 | |
Select financial information(1) | | | | |
| Revenues | 599 | | 678 | | 2,405 | | 2,845 | |
| | | | |
| | | | |
| | | | |
Adjusted EBITDA(2) | 247 | | 282 | | 1,104 | | 1,255 | |
Adjusted Earnings before income taxes(2) | 14 | | 38 | | 181 | | 396 | |
(Loss) earnings before income taxes | (42) | | (51) | | (141) | | 319 | |
Adjusted Net (Loss) Earnings Attributable to Common Shareholders(2) | (19) | | 3 | | 57 | | 236 | |
Net (loss) earnings attributable to common shareholders | (62) | | (65) | | (190) | | 177 | |
Cash flows(1) | | | | |
| Cash flow from operating activities | 231 | | 215 | | 646 | | 796 | |
Funds from operations(2) | 162 | | 135 | | 749 | | 816 | |
Free cash flow(2) | 93 | | 46 | | 514 | | 575 | |
Per share(1) | | | | |
Weighted average number of common shares outstanding | 297 | | 298 | | 297 | | 302 | |
Adjusted Net (Loss) Earnings Attributable to Common Shareholders per share(2)(3) | (0.06) | | 0.01 | | 0.19 | | 0.78 | |
Net (loss) earnings per share attributable to common shareholders, basic and diluted | (0.21) | | (0.22) | | (0.64) | | 0.59 | |
| Dividends declared per common share | 0.13 | | 0.13 | | 0.26 | | 0.24 | |
| Dividends declared per preferred share | 0.68 | | 0.69 | | 1.36 | | 1.36 | |
Cash flow from operating activities per share(4) | 0.78 | | 0.72 | | 2.18 | | 2.64 | |
Funds from operations per share(2)(3) | 0.55 | | 0.45 | | 2.52 | | 2.70 | |
Free cash flow per share(2)(3) | 0.31 | | 0.15 | | 1.73 | | 1.90 | |
| | | | |
| | | | |
| | | | |
| | | | |
| | | | |
| | | | |
| | | | |
| | | | |
| | | | |
| | | | |
| | | | |
| | | | |
| | | | |
(1)On Dec. 4, 2024, the Company completed the acquisition of Heartland Generation, which added 1,747 MW to gross installed capacity, excluding the Poplar Hill and Rainbow Lake facilities (collectively, the Required Divestitures). Refer to the "Significant and Subsequent Events" section of this MD&A. IFRS financial statements include the results attributable to the Required Divestitures up until the date of disposal, in accordance with a consent agreement entered into with the Commissioner of Competition for Canada. Our non-IFRS measures and operational Key Performance Indicators exclude the results of the Required Divestitures.
(2)These are non-IFRS measures and ratios, which are not defined and have no standardized meaning under IFRS and may not be comparable to similar measures presented by other issuers. Refer to the "Segmented Financial Performance and Operating Results" section of this MD&A for further discussion of these items. Also, refer to the "Non-IFRS and Supplementary Financial Measures" section of this MD&A for more information regarding these non-IFRS measures and ratios, including, where applicable, reconciliations to measures calculated in accordance with IFRS.
(3)Adjusted Net (Loss) Earnings Attributable to Common Shareholders per share, funds from operations (FFO) per share and free cash flow (FCF) per share are calculated using the weighted average number of common shares outstanding during the period. Refer to the "Non-IFRS and Supplementary Financial Measures" section of this MD&A for more information regarding these non-IFRS measures and ratios.
(4)Represents a supplementary financial measure and is calculated as cash flow from operating activities for the period divided by the weighted average number of common shares outstanding during the period.
| | | | | | | | |
M6 | TransAlta Corporation | 2025 Annual Report |
| | | | | | | | |
| (in millions of Canadian dollars except where noted) | | |
As at Dec. 31 | 2025 | 2024 |
| Liquidity and capital resources | | |
Available liquidity(1) | 1,500 | | 1,616 | |
Adjusted Net Debt to Adjusted EBITDA (times)(2)(3) | 4.0 | | 3.6 | |
Total Consolidated Net Debt(2)(4) | 3,725 | | 3,798 | |
| Assets and liabilities | | |
| Total assets | 8,661 | | 9,499 | |
Total long-term liabilities(5) | 5,366 | | 5,087 | |
Total liabilities | 7,196 | | 7,656 | |
(1)Available liquidity is a supplementary financial measure and is calculated as the sum of total available capacity under the committed credit and term facilities and cash and cash equivalents less bank overdraft and the amounts drawn under the non-committed demand facilities.
(2)These are non-IFRS measures and ratios, which are not defined and have no standardized meaning under IFRS and may not be comparable to similar measures presented by other issuers. Refer to the "Segmented Financial Performance and Operating Results" section of this MD&A for further discussion of these items. Also, refer to the "Non-IFRS and Supplementary Financial Measures" section of this MD&A for more information regarding these non-IFRS measures and ratios, including, where applicable, reconciliations to measures calculated in accordance with IFRS.
(3)The most directly comparable IFRS ratio to Adjusted Net Debt to Adjusted EBITDA (times) is calculated as credit facilities, long-term debt and lease liabilities of $3,593 million (Dec. 31, 2024 — $3,808 million) divided by loss before income taxes for the last four quarters of $141 million (Dec. 31, 2024 — earnings before income taxes $319 million) and is equal to (25) times (Dec. 31, 2024 — 12 times). Refer to the "Key Non-IFRS Financial Ratios" section of this MD&A for details of the calculation.
(4)The most directly comparable IFRS measure to Total Consolidated Net Debt is total credit facilities, long-term debt and lease liabilities, which is equal to $3,593 million (Dec. 31, 2024 — $3,808 million). Refer to the table in the "Financial Condition" section of this MD&A for more details on the composition of Total Consolidated Net Debt.
(5)Total long-term liabilities are equal to total non-current liabilities in the consolidated statements of financial position under IFRS.
Significant and Subsequent Events
Memorandum of Understanding for Data Centre Development at Keephills Site Signed
On Feb. 26, 2026, the Company entered into a Memorandum of Understanding (MOU) with Canada Pension Plan Investments and Brookfield to advance data centre development in Alberta, for which TransAlta is the exclusive site and power provider. The MOU establishes a framework for phased development at the Company's Keephills site in Parkland County, including an initial long-term power purchase agreement for approximately 230 MW and the evaluation of additional development aggregating up to 1 Gigawatt of load. Development is subject to regulatory approvals and the parties reaching definitive agreements.
Declared Increase in Common Share Dividend
The Company’s Board has approved a $0.02 annualized (eight per cent) increase to the common share dividend and declared a dividend of $0.07 per common share on Feb. 25, 2026 to be payable on July 1, 2026 to shareholders of record at the close of business on June 1, 2026. The quarterly dividend of $0.07 per common share
represents an annualized dividend of $0.28 per common share.
Acquisition of Far North
On Feb. 2, 2026, the Company closed the acquisition of Far North Power Corporation (Far North) for a purchase price of $95 million from an affiliate of Hut 8 Corporation, subject to working capital and other adjustments. The net cash payment for the transaction was funded through a combination of cash on hand and borrowings under TransAlta's credit facilities.
The transaction adds 310 MW of capacity from four natural gas-fired facilities in our core market of Ontario, increasing the Company's total installed capacity in the province to 1,384 MW.
US$400 Million Senior Notes Offering and Early Redemption of the 7.8% Senior Notes
On Dec. 22, 2025, the Company issued US$400 million senior notes with a fixed annual coupon rate of 5.9 per cent, maturing on Feb. 1, 2034. The notes are unsecured and rank equally in right of payment with all existing and future senior indebtedness and senior in right of payment
| | | | | | | | |
| TransAlta Corporation | 2025 Annual Report | M7 |
to all future subordinated indebtedness. The notes were issued at 99.4 per cent of par value, resulting in net proceeds of $541 million (US$393 million), and are callable in three years. Interest payments on the notes are made semi-annually, on Feb. 1 and Aug. 1, with the first payment scheduled for Aug. 1, 2026.
The proceeds from the offering were used to redeem all of the Company's outstanding 7.8 per cent US$400 million senior notes for the total redemption price of $573 million (US$416 million) in advance of the scheduled maturity date of Nov. 15, 2029.
Mothballing of Sheerness Unit 1
On Dec. 18, 2025, the Company provided notice to the Alberta Electric System Operator (AESO) that Sheerness Unit 1 will be mothballed effective April 1, 2026, for a period of up to two years. The Company maintains the flexibility to return the mothballed unit to service when market fundamentals improve or contracting opportunities are secured. The unit will remain available and fully operational through the first quarter of 2026 and Sheerness Unit 2 will remain fully in service.
Centralia Unit 2 Mandated to Remain Available
On Dec. 16, 2025, the Company received an order from the United States Department of Energy (the Order) requiring that our 700 MW Centralia Unit 2 facility remain available if called upon to operate for a period of 90 days, until March 16, 2026. The Company is currently compliant with the Order and continues to work with the state and federal governments in relation thereto.
Centralia Tolling Agreement Signed
On Dec. 9, 2025, the Company announced it had entered into a long-term tolling agreement (Tolling Agreement) with Puget Sound Energy to convert our 700 MW Centralia Unit 2 facility from coal to natural gas. The conversion extends the operating life of facility and will leverage existing turbines, transmission and infrastructure, while also lowering emissions.
The Tolling Agreement provides a fixed-price capacity payment through 2044 for the facility. The coal-to-gas conversion project is expected to require approximately US$600 million in capital and, once in service, will generate contracted cash flow over the life of the Tolling Agreement. The Company expects to declare a final investment decision for the project in early 2027, after receiving required regulatory approvals. Permitting work will continue through 2026, followed by construction in 2027–2028, with converted natural gas-fired operations expected to begin in late 2028.
Chief Executive Officer Succession
On Nov. 6, 2025, the Company announced that John Kousinioris, President and Chief Executive Officer and a Director of TransAlta, plans to retire effective April 30, 2026. Concurrent with this announcement, the Board of Directors appointed Joel Hunter, TransAlta’s Executive Vice President, Finance and Chief Financial Officer, to succeed Mr. Kousinioris as President and Chief Executive Officer and be nominated to join the Board effective April 30, 2026. Mr. Kousinioris has agreed to serve as a strategic advisor to Mr. Hunter and the Board for a period of six months following his retirement. The Company’s Chief Financial Officer successor will be announced in the coming months.
Demand Transmission Service Contract
On Oct. 3, 2025, the Company entered into a 230 MW Demand Transmission Service Contract with the AESO, representing the full allocation awarded to the Company through Phase I of the AESO's Data Centre Large Load Integration Program.
Completion of Required Divestitures
On Aug. 1, 2025, the Company completed the sale of its 100 per cent interest in the 48 MW Poplar Hill facility, followed by the completion of the sale of its 50 per cent interest in the 97 MW Rainbow Lake facility on Oct. 2, 2025. Both divestitures were required by the consent agreement entered into with the federal Competition Bureau as part of its regulatory approval for the Company's acquisition of Heartland Generation. Energy Capital Partners received the proceeds from the sale of both facilities, net of certain adjustments.
Credit Facility Extension
On July 16, 2025, the Company strengthened its liquidity profile by executing agreements with its lending syndicate to extend its committed credit facilities totalling $2.1 billion by one year. The revised agreements reduced the syndicated facility size from $1.95 billion to $1.90 billion, and extended its maturity to June 30, 2029. The bilateral credit facilities of $240 million were extended by one year to June 30, 2027. The amended agreements enhance financial flexibility, which is a strategic priority.
Recontracting of Ontario Wind Facilities
During the second quarter of 2025, the Company successfully recontracted its Melancthon 1, Melancthon 2 and Wolfe Island wind facilities through the Ontario Independent Electricity System Operator Five-Year Medium-Term 2 Energy Contract (MT2e). MT2e will replace current energy contracts for the three wind
| | | | | | | | |
M8 | TransAlta Corporation | 2025 Annual Report |
facilities when they expire, extending the contract dates until April 30, 2031, for Melancthon 1 and April 30, 2034, for Melancthon 2 and Wolfe Island.
Senior Notes Offering
On March 24, 2025, the Company issued $450 million of senior notes with a fixed annual coupon of 5.625 per cent, maturing on March 24, 2032. The notes are unsecured and rank equally in right of payment with all existing and future senior indebtedness and are senior in right of payment to all future subordinated indebtedness. Interest payments on the notes are made semi-annually, on March 24 and Sept. 24, with the first payment made on Sept. 24, 2025.
On March 25, 2025, the Company repaid its $400 million variable rate term loan facility in advance of the scheduled maturity date of Sept. 7, 2025, with the proceeds received from the senior notes offering.
Nova Clean Energy, LLC
During the first quarter of 2025, the Company made a strategic investment in Nova Clean Energy, LLC (Nova), a developer of renewable energy projects. The investment includes a US$75 million term loan and US$100 million revolving facility. As at Dec. 31, 2025, US$106 million was drawn by Nova under the credit facilities. The outstanding principal under the term loan and the revolving facility bear interest at seven per cent per year with interest due quarterly. The terms of the term loan and the revolving
facility are six and five years, respectively, unless accelerated. The term loan is convertible to a minority equity interest at any time, prior to maturity, at the option of the Company and any remaining unused term loan commitments at the time of conversion would be terminated. This investment provides the Company with the exclusive right to purchase Nova's late-stage development projects in the western U.S.
Normal Course Issuer Bid (NCIB)
On May 27, 2025, the Company announced that it had received approval from the Toronto Stock Exchange to repurchase up to a maximum of 14 million common shares during the 12-month period that commenced May 31, 2025 and will terminate on May 30, 2026.
For the year ended Dec. 31, 2025, the Company purchased and cancelled a total of 1,932,800 common shares, at an average price of $12.42 per common share, for a total cost of $24 million, including taxes.
Mothballing of Sundance 6
On April 1, 2025, the Company mothballed the Sundance Unit 6 facility for a period of up to two years depending on market conditions. TransAlta maintains the flexibility to return the mothballed unit to service when market fundamentals improve or opportunities to contract are secured.
Operating and Financial Performance
Operating Performance
The following table provides availability (%) by segment:
| | | | | | | | | | | | | | | |
| 3 months ended Dec. 31, | Year ended Dec. 31 | |
| 2025 | 2024 | 2025 | 2024 | |
| Hydro | 94.4 | | 85.8 | | 92.0 | | 90.7 | | |
| Wind and Solar | 94.6 | | 92.2 | | 94.4 | | 93.4 | | |
| Gas | 85.9 | | 84.1 | | 91.8 | | 92.2 | | |
Energy Transition | 92.5 | | 91.7 | | 88.5 | | 80.0 | | |
| Availability (%) | 90.1 | | 87.8 | | 92.3 | | 91.2 | | |
Availability is an important measure for the Company as it represents the percentage of time a facility is available to produce electricity, and is an indicator of the overall performance of the fleet.
Availability is impacted by planned and unplanned outages, and derates. The Company schedules planned outages to maintain, repair or make improvements to the facilities at times chosen to minimize operational impacts. In high price environments, outage schedules may be adjusted to accelerate the unit's return to service.
| | | | | | | | |
| TransAlta Corporation | 2025 Annual Report | M9 |
Three months ended Dec. 31, 2025
Availability for the three months ended Dec. 31, 2025, was 90.1 per cent compared to 87.8 per cent for the same period in 2024, primarily due to:
•Lower planned maintenance outages in the Hydro, Gas and Energy Transition segments; and
•Lower unplanned maintenance outages in the Wind and Solar segment.
Year ended Dec. 31, 2025
Availability for the year ended Dec. 31, 2025, was 92.3 per cent compared to 91.2 per cent in 2024. Higher availability compared to the prior year was primarily due to:
•Lower planned and unplanned outages at the Centralia facility in the Energy Transition segment;
•The impact from the White Rock and Horizon Hill wind facilities which achieved commercial operation in the first half of 2024 and operated at higher availability in 2025; and
•Lower planned and unplanned maintenance outages in the Hydro segment; partially offset by
•Higher unplanned outages and derates in the Gas segment.
Production and Long-Term Average Generation
The following table provides the production and long-term average generation (LTA generation) on a consolidated basis for each of our segments:
| | | | | | | | | | | | | | | | | | | | | | | |
| 2025 | | 2024 |
3 months ended Dec. 31 | Actual production (GWh) | LTA generation (GWh) | Production as a % of LTA | | Actual production (GWh) | LTA generation (GWh) | Production as a % of LTA |
| Hydro | 336 | | 447 | | 75 | % | | 452 | | 447 | | 101 | % |
Wind and Solar | 2,008 | | 2,175 | | 92 | % | | 1,831 | | 2,175 | | 84 | % |
| | | | | | | |
| | | | | | | |
Gas | 3,499 | | | | | 2,875 | | | |
| Energy Transition | 882 | | | | | 1,041 | | | |
| | | | | | | |
| | | | | | | |
| Total | 6,725 | | | | | 6,199 | | | |
| | | | | | | |
| | | | | | | | | | | | | | | | | | | | | | | | | | |
| 2025 | 2024 | |
| Year ended Dec. 31 | Actual production (GWh) | LTA generation (GWh) | Production as a % of LTA | Actual production (GWh) | LTA generation (GWh) | Production as a % of LTA | | | | |
| Hydro | 1,914 | | 2,015 | | 95 | % | 1,723 | | 2,015 | | 86 | % | | | | | | |
Wind and Solar(1) | 6,454 | | 7,457 | | 87 | % | 5,949 | | 6,876 | | 87 | % | | | | | | |
| | | | | | | | | | | | |
| | | | | | | | | | | | |
Gas | 13,003 | | | | 12,317 | | | | | | | | | |
| Energy Transition | 3,150 | | | | 2,822 | | | | | | | | | |
| | | | | | | | | | | | |
| | | | | | | | | | | | |
| Total | 24,521 | | | | 22,811 | | | | | | | | | |
| | | | | | | | | | | | |
(1)LTA generation for Wind and Solar increased as a result of new wind facilities, including the White Rock and the Horizon Hill wind facilities commissioned in the first half of 2024.
In addition to availability, the Company uses LTA generation as another indicator of performance for its renewable facilities, whereby actual production levels are compared against expected long-term average production levels. In the short term, for each of the Hydro and Wind and Solar segments, the conditions will vary from one period to the next. Over longer durations, facilities are expected to produce in-line with their long-term averages, which is broadly considered a reliable indicator of performance.
LTA generation is calculated on an annualized basis from the average annual energy yield predicted from our simulation model based on historical resource data performed over a period of typically greater than 25 years.
The LTA generation for Gas and Energy Transition is not applicable as these facilities are dispatchable and their production largely depends on market conditions and merchant demand.
| | | | | | | | |
M10 | TransAlta Corporation | 2025 Annual Report |
Three months ended Dec. 31, 2025
Total production for the three months ended Dec. 31, 2025, increased by 526 GWh, or eight per cent, compared to the same period in 2024, primarily due to:
•Addition of production from the Heartland gas facilities acquired in December 2024;
•Higher production at the Sarnia gas facility due to higher availability compared to the same period in 2024, when the facility experienced a planned outage during a portion of the quarter; and
•Higher availability and wind resource across Canada and the U.S. partially offset by
•Higher dispatch optimization in Alberta in the Gas segment due to lower market prices;
•Lower production in the Hydro segment due to lower market prices and water conservation; and
•Lower production at Centralia due to lower Mid-Columbia prices.
Year ended Dec. 31, 2025
Total production for 2025 increased by 1,710 GWh, or seven per cent, compared to 2024, primarily due to:
•Addition of production from the Heartland gas facilities acquired in December 2024;
•Production impact from the White Rock and Horizon Hill wind facilities which achieved commercial operation in the first half of 2024;
•Higher production at the Sarnia gas facility due to higher availability compared to 2024, when the facility experienced a planned outage during a portion of the fourth quarter;
•Improved availability at Centralia;
•Higher production in the Hydro segment due to higher water reserves and optimization of water supply; and
•Higher wind resource in Eastern Canada; partially offset by
•Higher dispatch optimization in Alberta in the Gas segment due to lower market prices.
Market Pricing
| | | | | | | | | | | | | | | |
| 3 months ended Dec. 31, | Year ended Dec. 31 | |
| 2025 | 2024 | 2025 | 2024 | |
Alberta spot power price ($/MWh) | 43 | | 52 | | 44 | | 63 | | |
Mid-Columbia spot power price (US$/MWh) | 38 | | 41 | | 42 | | 56 | | |
Ontario spot power price(1) ($/MWh) | 78 | | 34 | | 60 | | 32 | | |
Natural gas price (AECO) per GJ ($) | 2.15 | | 1.42 | | 1.61 | | 1.29 | | |
(1)Ontario spot power prices through to the end of April 2025 were based on the hourly Ontario energy price (HOEP). Starting May 1, 2025 prices are based on the settled day ahead hourly Ontario zonal energy prices.
For the three months and year ended Dec. 31, 2025, spot power prices in Alberta were 17 and 30 per cent lower, respectively, compared to the same periods in 2024, driven by generally milder weather and increased supply from new renewable and gas-fired facilities.
For the three months and year ended Dec. 31, 2025, Mid-Columbia spot power prices in the Pacific Northwest were seven and 25 per cent lower, respectively, compared to the same periods in 2024, due to the impact of milder weather.
Ontario spot power prices were higher on average compared to the three months and year ended Dec. 31, 2024, due to nuclear refurbishments occurring in 2025 and higher natural gas prices.
For the three months and year ended Dec. 31, 2025, AECO natural gas prices were 51 and 25 per cent higher, respectively, compared to the same periods in 2024, mainly due to lower gas production and lower storage levels in Alberta and throughout North America, as well as stronger demand.
| | | | | | | | |
| TransAlta Corporation | 2025 Annual Report | M11 |
Financial Performance Review of Consolidated Information
| | | | | | | | | | | | | | | |
| | | |
| 3 months ended Dec. 31, | Year ended Dec. 31 | |
| 2025 | 2024 | 2025 | 2024 | |
| Revenues | 599 | | 678 | | 2,405 | | 2,845 | | |
| Fuel and purchased power | (258) | | (249) | | (935) | | (939) | | |
Carbon compliance costs | (40) | | (39) | | (50) | | (112) | | |
| Operations, maintenance and administration | (186) | | (234) | | (711) | | (655) | | |
| Depreciation and amortization | (148) | | (143) | | (579) | | (531) | | |
Asset impairment reversals (charges) | 68 | | (20) | | 13 | | (46) | | |
| | | | | |
| | | | | |
Interest expense | (81) | | (92) | | (347) | | (324) | | |
| | | | | |
(Loss) earnings before income taxes | (42) | | (51) | | (141) | | 319 | | |
Income tax recovery (expense) | 2 | | 8 | | (17) | | (80) | | |
Net (loss) earnings attributable to common shareholders | (62) | | (65) | | (190) | | 177 | | |
Net (loss) earnings attributable to non-controlling interests | (4) | | (4) | | (20) | | 10 | | |
Three months ended Dec. 31, 2025
Revenues for the three months ended Dec. 31, 2025 decreased by $79 million, or 12 per cent, compared to the same period in 2024, primarily due to:
•Lower spot power prices in the Alberta market;
•Higher dispatch optimization in the Gas segment driven by lower power prices in Alberta;
•Higher unrealized mark-to-market losses on the long-term wind energy sales related to the Oklahoma facilities in the Wind and Solar segment;
•Lower revenues in the Energy Transition segment due to lower Mid-Columbia prices, reduced production and a lower volume of favourable hedge positions settled;
•Lower realized mark-to-market gains on settled trades in the Gas segment; partially offset by
•The addition of the Heartland facilities in the Gas segment;
•Lower unrealized mark-to-market losses in the Gas segment due to favourable changes in forward prices;
•Higher revenue from the Sarnia gas facility in the current period as the facility experienced a planned outage during a portion of the quarter in 2024;
•Lower unrealized mark-to-market losses in the Energy Marketing segment due to more favourable forward positions across North American power and natural gas markets; and
•Higher revenues in the Wind and Solar segment due to higher wind resource in Alberta and the U.S..
Fuel and purchased power costs for the three months ended Dec. 31, 2025 increased by $9 million, or four per cent, compared to the same period in 2024, primarily due to:
•The full quarter impact from the addition of the Heartland facilities in the fourth quarter of 2024;
•Higher natural gas prices; and
•Higher production at the Sarnia gas facility as the facility experienced a planned outage during a portion of the quarter in 2024; partially offset by
•Lower purchased power costs driven by lower Mid-Columbia prices on repurchases of power and lower production in the Energy Transition segment.
Carbon compliance costs for the three months ended Dec. 31, 2025 were comparable to the same period of 2024 primarily due to:
•The full quarter impact from the addition of the Heartland facilities in the fourth quarter of 2024;
•Higher production at the Sarnia gas facility in the current period as the facility experienced a planned outage during a portion of the quarter in 2024; and
•An increase in the carbon price from $80 to $95 per tonne; partially offset by
•Favourable impact on carbon compliance cost from higher production at lower-carbon-emitting cogeneration facilities.
OM&A expenses for the three months ended Dec. 31, 2025 decreased by $48 million, or 21 per cent, compared to the same period in 2024, primarily due to:
•No penalties recognized in the current period compared to the same period in 2024, when the Company recognized the penalties assessed by the Alberta Market Surveillance Administrator for self-reported contraventions pertaining to Brazeau hydro ancillary services provided during 2021 and 2022;
•Lower acquisition-related transaction and restructuring costs;
| | | | | | | | |
M12 | TransAlta Corporation | 2025 Annual Report |
•Lower spending related to the planning, design and implementation of an upgrade to our Enterprise Resource Planning (ERP) system; and
•Lower incentive costs; partially offset by
•The full quarter impact from the addition of the Heartland facilities in the fourth quarter of 2024 and associated corporate costs.
Depreciation and amortization for the three months ended Dec. 31, 2025 increased by $5 million, or three per cent, compared to the same period in 2024, primarily due to full quarter impact from the addition of Heartland facilities in the fourth quarter of 2024.
Asset impairment reversals for the three months ended Dec. 31, 2025 increased by $88 million, from asset impairment charges for the same period in 2024, primarily due to:
•A change in the decommissioning and restoration provisions driven by the revisions in estimated cash flows, timing of cash flows and discount rates in the Energy Transition segment; and
•Lower impairment charges related to development projects that are no longer proceeding.
Interest expense for the three months ended Dec. 31, 2025 decreased by $11 million, or 12 per cent, compared to 2024, primarily due to:
•Lower interest on exchangeable debentures due to the financing costs amortization completion in 2024; and
•Net gain on early redemption of the US$400 million senior notes; partially offset by
•Higher interest on debt driven by the addition of the Heartland term facility.
Loss before income taxes for the three months ended Dec. 31, 2025 totalling $42 million, decreased by $9 million, or 18 per cent, compared to the same period in 2024, due to:
•The items noted above; partially offset by
•Realized foreign exchange loss on early redemption of the US$400 million senior notes; and
•Lower unrealized foreign exchange gains due to unfavourable changes in foreign exchange rates.
Income tax recovery for the three months ended Dec. 31, 2025 decreased by $6 million, or 75 per cent, compared to the same period in 2024 due to a decrease in loss before income taxes.
Net loss attributable to common shareholders for the three months ended Dec. 31, 2025 increased by $3 million, or 5 per cent, compared to the same period of 2024 due to the above noted items.
Year ended Dec. 31, 2025
Revenues totalled $2,405 million, a decrease of $440 million, or 15 per cent, compared to 2024, primarily due to:
•Lower Alberta and Mid-Columbia power prices;
•Higher dispatch optimization in the Gas segment driven by lower power prices in Alberta;
•Higher unrealized mark-to-market losses in the Wind and Solar, Gas and Energy Transition segments primarily related to unfavourable changes in forward prices; and
•Lower realized mark-to-market gains on settled trades in the Energy Marketing, Gas and Energy Transition segments; partially offset by
•The full year impact from the addition of the Heartland facilities in the fourth quarter of 2024;
•Higher revenues from the Sarnia gas facility in the current period as the facility experienced a planned outage during a portion of the fourth quarter in 2024; and
•The impact from the White Rock and Horizon Hill wind facilities which achieved commercial operation in the first half of 2024.
Fuel and purchased power costs totalled $935 million, which is comparable to 2024, primarily due to:
•Lower purchased power costs driven by higher availability in the Energy Transition segment; partially offset by
•The full year impact from the addition of the Heartland facilities in the fourth quarter of 2024;
•Higher natural gas prices;
•Higher production in the Energy Transition segment due to higher availability; and
•Higher production at the Sarnia gas facility in the fourth quarter of 2025 compared to the same period in 2024, when the facility experienced a planned outage during a portion of the fourth quarter in 2024.
Carbon compliance costs totalled $50 million, a decrease of $62 million, or 55 per cent, compared to 2024, primarily due to:
•Higher utilization of internally generated and externally purchased emission credits in the current period compared to the same period in 2024 to settle a portion of our GHG obligation and a portion of the 2024 GHG obligation assumed with the Heartland acquisition; and
•The favourable impact on carbon compliance costs due to increased production from lower-carbon-emitting cogeneration facilities; partially offset by
•The addition of carbon compliance costs from the Heartland facilities acquired in the fourth quarter of 2024; and
| | | | | | | | |
| TransAlta Corporation | 2025 Annual Report | M13 |
•An increase in the carbon price from $80 per tonne in 2024 to $95 per tonne in 2025.
OM&A expenses totalled $711 million, an increase of $56 million, or nine per cent, compared to 2024, primarily due to:
•The full year impact from the addition of the Heartland facilities in the fourth quarter of 2024 and associated corporate costs;
•Higher spending to support strategic and growth initiatives;
•Higher spending related to the planning, design and implementation of an upgrade to our ERP system; and
•The full year impact from the White Rock and Horizon Hill wind facilities which achieved commercial operation in the first half of 2024; partially offset by
•No penalties recognized in 2025 compared to 2024, when the Company recognized the penalties assessed by the Alberta Market Surveillance Administrator for Brazeau self-reported contraventions pertaining to hydro ancillary services provided during 2021 and 2022; and
•Lower acquisition-related transaction and restructuring costs.
Depreciation and amortization totalled $579 million, an increase of $48 million, or nine per cent, compared to 2024, primarily due to:
•The full year impact from the addition of the Heartland facilities in the fourth quarter of 2024; and
•The full year impact from the White Rock and Horizon Hill wind facilities which achieved commercial operation in the first half of 2024; partially offset by
•Revisions to the useful lives of certain gas facilities in the fourth quarter of 2024.
Asset impairment reversals totalled $13 million, an increase of $59 million compared to asset impairment charges in the same period in 2024, primarily due to:
•A change in decommissioning and restoration provisions driven by the revisions in estimated cash flows, timing of cash flows and discount rates, and higher impairment reversals related to generation equipment in the Energy Transition segment; partially offset by
•An impairment charge on Required Divestiture assets previously classified as Assets Held for Sale; and
•An impairment charge, net of impairment reversals, related to certain Wind and Solar facilities due to changes in expected production volumes and price assumptions.
Interest expense totalled $347 million, an increase of $23 million, or seven per cent, compared to 2024, primarily due to:
•Higher interest on debt driven by the addition of the Heartland term facility;
•No capitalized interest during 2025 due to lower construction activity compared to the same period in 2024; partially offset by
•Lower interest on debt due to the refinancing of senior notes at lower interest rates during 2025;
•Lower interest on exchangeable debentures due to the financing costs amortization completion in 2024; and
•Net gain on early redemption of the US$400 million senior notes.
Loss before income taxes totalled $141 million, an increase of $460 million, or 144 per cent from earnings before income taxes of $319 million for the same period in 2024, primarily due to:
•The items noted above;
•Realized foreign exchange loss on early redemption of the US$400 million senior notes; and
•Higher unrealized foreign exchange losses due to unfavourable changes in foreign currency rates.
Income tax expense totalled $17 million, a decrease of $63 million, or 79 per cent, compared to 2024, due to the increase in loss before income taxes, partially offset by a higher valuation allowance on U.S. operations.
Net loss attributable to non-controlling interests totalled $20 million an increase of $30 million from net earnings of $10 million for the same period in 2024, primarily due to lower net earnings for TA Cogen resulting from lower merchant pricing in the Alberta market.
Refer to the "Segment Financial Performance and Operating Results" section for additional information.
| | | | | | | | |
M14 | TransAlta Corporation | 2025 Annual Report |
Adjusted EBITDA
For the three months ended Dec. 31, 2025, the Company's Adjusted EBITDA was $247 million compared to $282 million for the same period in 2024, a decrease of $35 million, or 12 per cent.
The major factors impacting Adjusted EBITDA for the three months ended Dec. 31, 2025 are summarized in the following table:
| | | | | |
| 3 months ended Dec. 31 |
Adjusted EBITDA(1) for the three months ended Dec. 31, 2024(2) | 282 | |
Hydro: Lower due to lower spot and ancillary services power prices in the Alberta market and lower merchant volumes in Alberta driven by lower market prices and water conservation. | (18) | |
Wind and Solar: Higher due to higher wind resource and availability across Canada and the U.S. and higher environmental and tax attributes revenues driven by an increase in sales of emission credits to third parties. | 7 | |
Gas: Lower primarily due to higher dispatch optimization driven by lower market prices, lower spot power prices in the Alberta market, lower hedge power prices compared to the same period in 2024 and an increase in the carbon price, partially offset by the positive contribution from the addition of the Heartland facilities, higher production at the Sarnia gas facility due to higher availability compared to the same period in 2024, when the facility experienced a planned outage during a portion of the quarter, and favourable hedge positions settled, which generated positive contributions over settled spot prices in Alberta. | (20) | |
Energy Transition: Lower primarily due to lower Mid-Columbia power prices, partially offset by lower purchased power costs due to fewer repurchases to fulfil contractual obligations during outages and favourable hedge positions settled, which generated positive contributions over settled spot prices. | (10) | |
Energy Marketing: Lower primarily due to comparatively subdued market volatility across North American natural gas and power markets and lower realized gains. | (5) | |
Corporate: Higher primarily due to lower incentive costs, partially offset by the addition of corporate costs related to Heartland. | 11 | |
Adjusted EBITDA(1) for the three months ended Dec. 31, 2025 | 247 | |
(1)Adjusted EBITDA is a non-IFRS measure. Refer to the "Non-IFRS and Supplementary Financial Measures" section of this MD&A. The most directly comparable IFRS measure is loss before income taxes of $42 million for the three months ended Dec. 31, 2025 ($51 million for the three months ended Dec. 31, 2024). Refer to the "Reconciliation of Non-IFRS Measures on a Consolidated Basis by Segments" section of this MD&A.
(2)During the first quarter of 2025, our Adjusted EBITDA composition was amended to exclude the impact of realized gain (loss) on closed exchange positions and Australian interest income. The Company has therefore applied this composition to all previously reported periods. Refer to the "Non-IFRS and Supplementary Financial Measures" section of this MD&A for more details.
| | | | | | | | |
| TransAlta Corporation | 2025 Annual Report | M15 |
For the year ended Dec. 31, 2025, the Company's Adjusted EBITDA was $1,104 million compared to $1,255 million in 2024, a decrease of $151 million, or 12 per cent.
The major factors impacting Adjusted EBITDA for the year ended Dec. 31, 2025 are summarized in the following table:
| | | | | |
| Year ended Dec. 31 |
Adjusted EBITDA(1) for the year ended Dec. 31, 2024(2) | 1,255 | |
Hydro: Lower primarily due to lower spot and ancillary services power prices in the Alberta market, partially offset by higher merchant and contract volumes, higher volume of favourable hedge positions settled (which generated positive contributions over settled spot prices in Alberta), higher regulated transmission revenues related to the reimbursement of costs incurred in prior periods and higher environmental and tax attributes revenue due to increased intercompany sales of emission credits to the Gas segment to fulfil our 2024 GHG obligation. | (31) | |
Wind and Solar: Higher primarily due to the positive contribution from the impact of the White Rock and Horizon Hill wind facilities, which achieved commercial operation in the first half of 2024; higher environmental and tax attributes revenue due to increased sales of emission credits to third parties and intercompany sales to the Gas segment; and higher production volumes due to higher availability across the fleet and higher wind resource in Eastern Canada and the U.S.; partially offset by lower Alberta spot power prices, lower wind resource in Alberta and lower liquidated damages recognized at various wind facilities. | 22 | |
Gas: Lower primarily due to higher dispatch optimization driven by lower market prices, lower spot power prices in the Alberta market, lower hedge power prices compared to the same period in 2024, higher natural gas prices and an increase in the carbon price, partially offset by the positive contributions from the addition of the Heartland facilities, favourable hedge positions settled (which generated positive contributions over settled spot prices in Alberta and the reduction of carbon compliance costs driven by using internally generated and externally purchased emission credits to settle a portion of our GHG obligation and a portion of the 2024 GHG obligation assumed in the Heartland acquisition) and an increase of production from lower carbon-emitting cogeneration facilities. | (86) | |
Energy Transition: Higher primarily due to lower purchased power costs driven by higher availability and favourable hedge positions settled, which generated positive contributions over settled spot prices, partially offset by lower revenue due to lower Mid-Columbia prices and higher OM&A related to community fund spending. | 11 | |
Energy Marketing: Lower primarily due to comparatively subdued market volatility across North American natural gas and power markets and lower realized gains in 2025 compared to 2024. | (61) | |
Corporate: Lower primarily due to increased spending to support strategic and growth initiatives and the addition of corporate costs related to Heartland, partially offset by cost saving initiatives. | (6) | |
Adjusted EBITDA(1) for the year ended Dec. 31, 2025 | 1,104 | |
(1)Adjusted EBITDA is a non-IFRS measure. Refer to the "Non-IFRS and Supplementary Financial Measures" section of this MD&A. The most directly comparable IFRS measure is loss before income taxes of $141 million for the year ended Dec. 31, 2025 (earnings before income taxes were $319 million for the year ended Dec. 31, 2024). Refer to "Reconciliation of Non-IFRS Measures on a Consolidated Basis by Segments" section of this MD&A.
(2)During the first quarter of 2025, our Adjusted EBITDA composition was amended to exclude the impact of realized gain (loss) on closed exchange positions and Australian interest income. The Company has therefore applied this composition to all previously reported periods. Refer to the "Non-IFRS and Supplementary Financial Measures" section of this MD&A for more details.
| | | | | | | | |
M16 | TransAlta Corporation | 2025 Annual Report |
Free Cash Flow
For the three months ended Dec. 31, 2025, the Company's free cash flow (FCF) increased by $47 million, or 102 per cent, compared to the same period in 2024.
The major factors impacting FCF for the three months ended Dec. 31, 2025 are summarized in the following table:
| | | | | |
| 3 months ended Dec. 31 |
FCF(1) for the three months ended Dec. 31, 2024. | 46 | |
Lower Adjusted EBITDA(2) due to the items noted above. | (35) | |
| |
Higher current income tax recovery due to the higher loss before income taxes in 2025. | 28 | |
Lower sustaining capital expenditures(3) due to lower major maintenance for our Canadian gas facilities and lower major maintenance at our Hydro facilities in Alberta due to timing of spend. | 22 | |
| |
| |
Higher provisions settled, resulting in lower FCF. | (8) | |
Lower realized foreign exchange losses from operating activities. | 20 | |
Other(4) | 6 | |
Other non-cash items(5) | 14 | |
FCF(1) for the three months ended Dec. 31, 2025 | 93 | |
(1)FCF is a non-IFRS measure, is not defined and has no standardized meaning under IFRS and may not be comparable to similar measures presented by other issuers. Refer to the "Non-IFRS and Supplementary Financial Measures" section of this MD&A for more information regarding this measure. The most directly comparable IFRS measure is cash flow from operating activities, which was $231 million and $215 million for the three months ended Dec. 31, 2025 and 2024, respectively. Refer to the "Cash Flows" section of this MD&A.
(2)During the first quarter of 2025, our Adjusted EBITDA composition was amended to exclude the impact of realized gain (loss) on closed exchange positions and Australian interest income. The Company has therefore applied this composition to all previously reported periods. Refer to the "Non-IFRS and Supplementary Financial Measures" section of this MD&A.
(3)Sustaining capital expenditures is a supplementary financial measure. Refer to "Capital Expenditures" section of this MD&A for more information regarding this measure.
(4)Other consists primarily of lower decommissioning and restoration costs settled, lower Net Interest Expense, and lower dividends paid on preferred shares, partially offset by higher loan advances and higher distributions paid to subsidiaries' non-controlling interests relating to TA Cogen.
(5)Other non-cash items primarily consist of changes in deferred payments, contract assets and liabilities, onerous contracts and long-term incentive accruals.
| | | | | | | | |
| TransAlta Corporation | 2025 Annual Report | M17 |
For the year ended Dec. 31, 2025, the Company's FCF decreased by $61 million, or 11 per cent, compared to 2024, but was within the range of our expected full-year financial guidance.
The major factors impacting FCF for the year ended Dec. 31, 2025 are summarized in the following table:
| | | | | |
| Year ended Dec. 31 |
FCF(1) for the year ended Dec. 31, 2024 | 575 | |
Lower Adjusted EBITDA(2) due to the items noted above. | (151) | |
Lower current income tax expense due to loss before income taxes in 2025 compared to earnings before income taxes in the same period in 2024. | 94 | |
Higher Net Interest Expense(3) due to higher interest on debt primarily driven by the addition of the Heartland term facility and lower capitalized interest resulting from lower construction activity compared to the same period in 2024. | (33) | |
Lower distributions paid to subsidiaries' non-controlling interests relating to lower TA Cogen net earnings resulting from lower merchant pricing in the Alberta market. | 29 |
Higher provisions settled in the current year compared to the prior year, resulting in lower FCF. | (14) | |
Higher sustaining capital expenditures due to higher major maintenance at our Canadian gas facilities due to timing of spend and the addition of maintenance for the gas facilities acquired from Heartland, and higher major maintenance in the Wind and Solar segment, partially offset by no major maintenance occurring in the Energy Transition segment in the current period and lower major maintenance at our Hydro facilities in Alberta due to timing of spend. In addition, the first quarter of 2024 was impacted by the receipt of a lease incentive related to the Company's head office. | (20) | |
Lower realized foreign exchange losses from operating activities. | 27 | |
| |
| |
| |
Other non-cash items(4) | 8 | |
Other(5) | (1) | |
FCF(1) for the year ended Dec. 31, 2025 | 514 | |
(1)FCF is a non-IFRS measure, is not defined and has no standardized meaning under IFRS and may not be comparable to similar measures presented by other issuers. Refer to the "Non-IFRS and Supplementary Financial Measures" section of this MD&A for more information regarding this measure. The most directly comparable IFRS measure is cash flow from operating activities, which was $646 million and $796 million for the years ended Dec. 31, 2025 and 2024, respectively. Refer to the "Cash Flows" section of this MD&A.
(2)During the first quarter of 2025, our Adjusted EBITDA composition was amended to exclude the impact of realized gain (loss) on closed exchange positions and Australian interest income. The Company has therefore applied this composition to all previously reported periods. Refer to the "Non-IFRS and Supplementary Financial Measures" section of this MD&A.
(3)Net Interest Expense is a non-IFRS measure, is not defined and has no standardized meaning under IFRS and may not be comparable to similar measures presented by other issuers. Refer to "Non-IFRS and Supplementary Financial Measures" section of this MD&A for more information regarding this measure. The most directly comparable IFRS measure is interest expense of $347 million for the year ended Dec. 31, 2025 (Dec. 31, 2024 — $324 million).
(4)Other non-cash items primarily consist of changes in deferred payments, contract assets and liabilities, onerous contracts and long-term incentive accruals.
(5)Other primarily consists of lower decommissioning and restoration costs settled and lower principal payments on lease liabilities, partially offset by higher loan advances.
| | | | | | | | |
M18 | TransAlta Corporation | 2025 Annual Report |
2026 Outlook
For 2026, the Company expects Adjusted EBITDA to be in the range of $950 million to $1,050 million and FCF to be in the range of $350 million to $450 million, based on the following expectations:
•Lower contribution from the Energy Transition segment due to the Centralia facility ceasing dispatchable coal-fired generation at the end of 2025;
•Lower contribution from the Alberta merchant gas portfolio as a result of lower average hedge prices and higher fuel costs, partially offset by lower carbon compliance costs due to a higher utilization of internally generated low-cost environmental credits;
•Lower contributions from Sarnia, reflecting a step down in contracted pricing and the expiry of the contract and decommissioning of the Ada Cogeneration facility;
•Higher contributions within the Hydro, Gas and Wind and Solar segments due to the expected realization of carbon credits against in-year, in addition to 2025, carbon compliance costs in Alberta;
•Higher contributions from the Gas segment due to the acquisition of the Far North Ontario gas facilities;
•Higher contributions from the Wind and Solar segment as a result of higher expected production;
•Higher income tax expense; and
•Lower Net Interest Expense as a result of lower interest rates on refinanced debt and lower interest on non-recourse debt as a result of amortizing repayments.
The following table outlines our expectations on key financial targets and related assumptions for 2026 and should be read in conjunction with the narrative discussion that follows and the "Risk Management" section of this MD&A:
| | | | | | | | | | | | |
| Measure | 2026 Target(2) | 2025 Target | | 2025 Actual(3) |
Adjusted EBITDA(1) | $950 million to $1,050 million | $1,150 million to $1,250 million | | $1,104 million |
FCF(1) | $350 million to $450 million | $450 million to $550 million | | $514 million |
FCF per share(1) | $1.18 to $1.51 | $1.51 to $1.85 | | $1.73 |
Dividend per share | $0.28 annualized | $0.26 annualized | | $0.26 annualized |
(1)These are non-IFRS measures, which are not defined and have no standardized meaning under IFRS and may not be comparable to similar measures presented by other issuers. Refer to the "Reconciliation of Non-IFRS Measures" section of this MD&A for further discussion of these items, including, where applicable, reconciliations to measures calculated in accordance with IFRS. See also the "Non-IFRS and Supplementary Financial Measures" section of this MD&A.
(2)Represents forward-looking information.
(3)The actual 2025 amounts for the most directly comparable IFRS measures for Adjusted EBITDA and FCF were as follows: Loss before income taxes of $141 million and Cash flow from operating activities of $646 million. The most directly comparable IFRS ratio to FCF per share is cash flow from operating activities per share of $2.18, which is calculated as cash flow from operating activities for the period divided by the weighted average number of common shares outstanding during the period. Refer to the "Non-IFRS and Supplementary Financial Measures" section of the MD&A for additional information.
The Company's outlook for 2026 may be impacted by a number of factors as detailed further below.
Range of key 2026 power and gas price assumptions
| | | | | | | | | | | | | |
| Market | | 2026 Assumptions | 2025 Assumptions | 2025 Actual | |
| Alberta spot ($/MWh) | | $40 to $60 | $40 to $60 | $44 | |
| | | | | |
| AECO gas price ($/GJ) | | $2.65 to $3.15 | $1.60 to $2.10 | $1.61 | |
Alberta spot price sensitivity: a +/- $1 per MWh change in spot price is expected to have a +/- $2 million impact on Adjusted EBITDA for 2026.
| | | | | | | | |
| TransAlta Corporation | 2025 Annual Report | M19 |
Other assumptions relevant to the 2026 outlook
| | | | | | | | | | | | | |
| Measure | 2026 Expectations | 2025 Expectations | | 2025 Actual | |
Energy Marketing Adjusted Revenues(1) | $110 million to $130 million | $110 million to $130 million | | $122 million | |
Sustaining capital expenditures(2) | $140 million to $160 million | $145 million to $165 million | | $162 million | |
Current income tax expense | $70 million to $100 million | $95 million to $130 million | | $49 million | |
Net Interest Expense(1) | $240 million to $260 million | $255 million to $275 million | | $264 million | |
(1)Energy Marketing Adjusted Revenues and Net Interest Expense are non-IFRS measures, are not defined, have no standardized meaning under IFRS and may not be comparable to similar measures presented by other issuers. The most directly comparable IFRS measure to Energy Marketing Adjusted Revenues is revenues of $130 million for the year ended Dec. 31, 2025 and to Net Interest Expense — interest expense of $347 million for the year ended Dec. 31, 2025.
(2)Sustaining capital expenditures is a supplementary financial measure. Refer to "Capital Expenditures" section of this MD&A for more information regarding this measure.
Alberta Hedging
| | | | | | | | | | | | | | | | | | |
| Range of hedging assumptions | Q1 2026 | Q2 2026 | Q3 2026 | Q4 2026 | 2027 | |
| Hedged production (GWh) | 2,302 | | 1,990 | | 2,172 | | 2,027 | | 3,967 | | |
| Hedge price ($/MWh) | $65 | $65 | $65 | $65 | $71 | |
Hedged gas amounts (GJ) | 12 million | 7 million | 8 million | 7 million | 19 million | |
| Hedge gas prices ($/GJ) | $3.21 | $3.33 | $3.29 | $3.39 | $3.04 | |
| | | | | | |
| | | | | | |
Market Pricing
The following graphs include 2026 pricing assumptions and are subject to change:
Annual Average Spot Electricity Prices
Annual Average Gas (AECO) Prices
For 2026, spot electricity prices in Alberta are expected to be higher compared to 2025, driven by ongoing load growth and slowing additions of new supply in the province. Where power prices settle in relationship to 2025 prices, will ultimately depend on actual weather conditions.
AECO natural gas prices are expected to be higher than in 2025.
The objective of our portfolio management strategy in Alberta is to balance opportunity and risk and to deliver optimization strategies that contribute to our total
investment, which includes a return on invested capital. We can be more or less hedged in a given period, and we expect to realize our annual targets through a combination of forward hedging and selling generation into the spot market. The assets within the Alberta electricity portfolio are managed as a portfolio to maximize the overall value of generation and capacity from our hydro, wind, energy storage and thermal facilities. Hedging is a key component of cash flow certainty and the hedges are primarily tied to our portfolio of gas facilities and also allocated to our portfolio of hydro facilities rather than a single facility.
| | | | | | | | |
M20 | TransAlta Corporation | 2025 Annual Report |
Sustaining Capital Expenditures
Our estimate for total sustaining capital is as follows:
| | | | | | | | | |
| | Expected spend in 2026 | Spent in 2025 |
| Total sustaining capital | | $140 million to $160 million | $162 million |
The Company expects sustaining capital to be in the range of $140 million to $160 million in 2026. The Gas segment is expected to incur higher sustaining capital related to planned major maintenance, offset by lower spend in the Hydro segment.
Liquidity and Capital Resources
We maintain adequate available liquidity under our committed credit facilities. As at Dec. 31, 2025, we had access to $1.5 billion in liquidity, including $205 million in cash, which exceeds the funds required for committed growth, sustaining capital and productivity projects.
Segmented Financial Performance and Operating Results
Segmented information is prepared on the same basis that the Company manages its business, evaluates financial results and makes key operating decisions. The following table reflects the summary financial information on a consolidated basis for the three months and year ended Dec. 31:
| | | | | | | | | | | | | | | |
| 3 months ended Dec. 31, | Year ended Dec. 31 | |
| 2025 | 2024 | 2025 | 2024 | |
| Hydro | 39 | | 57 | | 285 | | 316 | | |
| Wind and Solar | 102 | | 95 | | 338 | | 316 | | |
Gas | 96 | | 116 | | 438 | | 524 | | |
| Energy Transition | 16 | | 26 | | 100 | | 89 | | |
| Energy Marketing | 21 | | 26 | | 85 | | 146 | | |
Corporate | (27) | | (38) | | (142) | | (136) | | |
Total Adjusted EBITDA(1)(2) | 247 | | 282 | | 1,104 | | 1,255 | | |
Adjusted Earnings before income taxes(1) | 14 | | 38 | | 181 | | 396 | | |
(Loss) earnings before income taxes | (42) | | (51) | | (141) | | 319 | | |
Adjusted Net (Loss) Earnings Attributable to Common Shareholders(1) | (19) | | 3 | | 57 | | 236 | | |
Net (loss) earnings attributable to common shareholders | (62) | | (65) | | (190) | | 177 | | |
(1)These are non-IFRS measures, which are not defined, have no standardized meaning under IFRS and may not be comparable to similar measures presented by other issuers. Refer to the "Non-IFRS and Supplementary Financial Measures" section of this MD&A for more information regarding these measures. The most directly comparable IFRS measure to Adjusted EBITDA and Adjusted Earnings before income taxes is (loss) earnings before income taxes. The most directly comparable IFRS measure to Adjusted Net (Loss) Earnings Attributable to Common Shareholders is Net (loss) earnings attributable to common shareholders. Refer to "Reconciliation of Non-IFRS Measures on a Consolidated Basis by Segments" section of this MD&A.
(2)During the first quarter of 2025, our Adjusted EBITDA composition was amended to exclude the impact of realized gain (loss) on closed exchange positions and Australian interest income. Therefore, the Company has applied this composition to all previously reported periods. Refer to the "Non-IFRS and Supplementary Financial Measures" section of this MD&A.
Three months ended Dec. 31, 2025
Adjusted Earnings before income taxes for the three months ended Dec. 31, 2025 decreased by $24 million, or 63 per cent, from Adjusted Earnings before income taxes for the same period in 2024, primarily due to:
•The factors causing lower Adjusted EBITDA described in the "Adjusted EBITDA" section of this MD&A; and
•Higher depreciation due to the addition of the Heartland gas facilities in December 2024; partially offset by
•Lower interest expense as explained in the Corporate segment of the "Segmented Financial Performance and Operating Results" section of this MD&A.
| | | | | | | | |
| TransAlta Corporation | 2025 Annual Report | M21 |
Adjusted Net Loss attributable to common shareholders for the three months ended Dec. 31, 2025 increased by $22 million from Adjusted Earnings Attributable to Common Shareholders for the same period in 2024, primarily due to:
•The factors causing higher Adjusted Earnings before Income Taxes described above; and
•Lower calculated tax expense on adjustments and reclassifications compared to the same period in 2024; partially offset by
•Lower income tax recovery compared to the same period in 2024 due to a decrease in loss before income taxes.
Loss before income taxes for the three months ended Dec. 31, 2025, decreased by $9 million, or 18 per cent, compared to the same period in 2024. Net loss attributable to common shareholders for the three months ended Dec. 31, 2025, decreased by $3 million compared to the same period in 2024. For an explanation of the variance and reconciliation to the most directly comparable IFRS measure refer to the "Financial Performance Review of Consolidated Information" and "Non-IFRS and Supplementary IFRS Measures" sections of this MD&A, respectively.
Year ended Dec. 31, 2025
Adjusted Earnings before income taxes for the year ended Dec. 31, 2025 decreased by $215 million, or 54 per cent, compared to the same period in 2024, primarily due to:
•The factors causing lower Adjusted EBITDA described in the "Adjusted EBITDA" section of this MD&A;
•Higher depreciation and amortization due to the addition of the Heartland gas facilities in December 2024 and the full-year impact from the White Rock and Horizon Hill wind facilities which achieved commercial operation in the first half of 2024; and
•Higher interest expense as explained in the "Financial Performance Review of Consolidated Information" and Corporate segment of the "Segmented Financial Performance and Operating Results" section of this MD&A.
Adjusted Net Earnings Attributable to Common Shareholders for the year ended Dec. 31, 2025 decreased by $179 millions, or 76 per cent, compared to the same period in 2024, primarily due to:
•The factors causing lower Adjusted Earnings before Income Taxes described above; partially offset by
•Lower income tax expense due to a higher loss before income taxes compared to earnings before income taxes in the same period in 2024, partially offset by higher valuation allowance on U.S. operations; and
•Higher net loss attributable to non-controlling interests compared to net earnings in the same period of 2024.
Loss before income taxes for the year ended Dec. 31, 2025, increased by $460 million, or 144 per cent, from earnings before income taxes in 2024. Net loss attributable to common shareholders for the year ended Dec. 31, 2025, increased by $367 million compared to net earnings attributable to common shareholders in 2024. For an explanation of the variance and reconciliation to the most directly comparable IFRS measure refer to the "Financial Performance Review of Consolidated Information and Non-IFRS" and "Supplementary IFRS Measures" sections of this MD&A, respectively.
| | | | | | | | |
M22 | TransAlta Corporation | 2025 Annual Report |
Hydro
| | | | | | | | | | | | | | | | | | | | | | | | | | | | |
| | | | | | | | |
| | | 3 months ended Dec. 31 | Year ended Dec. 31 |
| | | 2025 | 2024 | Change | 2025 | 2024 | Change |
Gross installed capacity (MW) | | | 922 | | 922 | | — | | — | % | 922 | | 922 | | — | | — | % |
LTA generation (GWh) | | | 447 | | 447 | | — | | — | % | 2,015 | | 2,015 | | — | | — | % |
| Availability (%) | | | 94.4 | | 85.8 | | 8.6 | | 10 | % | 92.0 | | 90.7 | | 1.3 | | 1 | % |
| | | | | | | | | | |
| Production | | | | | | | | | | |
| Contract production (GWh) | | | 70 | | 85 | | (15) | | (18) | % | 346 | | 281 | | 65 | | 23 | % |
| Merchant production (GWh) | | | 266 | | 367 | | (101) | | (28) | % | 1,568 | | 1,442 | | 126 | | 9 | % |
| Total energy production (GWh) | | | 336 | | 452 | | (116) | | (26) | % | 1,914 | | 1,723 | | 191 | | 11 | % |
Ancillary service volumes (GWh)(1) | | | 761 | | 713 | | 48 | | 7 | % | 2,934 | | 2,951 | | (17) | | (1) | % |
| | | | | | | | | | |
Alberta Hydro Assets ancillary services revenues(1) | | | 27 | | 28 | | (1) | | (4) | % | 112 | | 136 | | (24) | | (18) | % |
Alberta Hydro Assets revenues(2) | | | 22 | | 33 | | (11) | | (33) | % | 125 | | 144 | | (19) | | (13) | % |
Other Hydro Assets revenues and other Hydro revenues(3) | | | 11 | | 16 | | (5) | | (31) | % | 57 | | 49 | | 8 | | 16 | % |
| | | | | | | | | | |
Environmental and tax attributes revenues | | | — | | — | | — | | — | % | 70 | | 61 | | 9 | | 15 | % |
| | | | | | | | | | |
| | | | | | | | | | |
Adjusted Revenues(4) | | | 60 | | 77 | | (17) | | (22) | % | 364 | | 390 | | (26) | | (7) | % |
| Fuel and purchased power | | | (4) | | (3) | | (1) | | 33 | % | (20) | | (16) | | (4) | | 25 | % |
Adjusted Gross Margin(4) | | | 56 | | 74 | | (18) | | (24) | % | 344 | | 374 | | (30) | | (8) | % |
Adjusted OM&A(4) | | | (16) | | (16) | | — | | — | % | (56) | | (55) | | (1) | | 2 | % |
| Taxes, other than income taxes | | | (1) | | (1) | | — | | — | % | (3) | | (3) | | — | | — | % |
Adjusted EBITDA(4) | | | 39 | | 57 | | (18) | | (32) | % | 285 | | 316 | | (31) | | (10) | % |
Depreciation and amortization | | | (12) | | (18) | | 6 | | (33) | % | (38) | | (41) | | 3 | | (7) | % |
Adjusted Earnings before Income Taxes(4) | | | 27 | | 39 | | (12) | | (31) | % | 247 | | 275 | | (28) | | (10) | % |
Earnings before income taxes | | | 25 | | 24 | | 1 | | 4 | % | 251 | | 263 | | (12) | | (5) | % |
Supplementary Information: Gross revenues per MWh | | | | | | | | | | |
| | | | | | | | | | |
Alberta Hydro Assets revenues ($/MWh)(2) | | | 83 | | 90 | | (7) | | (8) | % | 79 | | 100 | | (21) | | (21) | % |
Alberta Hydro Assets ancillary services revenues ($/MWh)(1) | | | 35 | | 39 | | (4) | | (10) | % | 38 | | 46 | | (8) | | (17) | % |
| | | | | | | | | | |
| | | | | | | | | | |
(1)Alberta Hydro Assets ancillary services revenues is a supplementary financial measure. Alberta Hydro Assets ancillary services revenues are revenues earned from providing services required to ensure that the interconnected electric system is operated in a manner that provides a satisfactory level of service with acceptable levels of voltage and frequency as described in the AESO Consolidated Authoritative Document Glossary. Revenues per MWh are calculated by dividing Alberta Hydro Assets ancillary services revenues by ancillary service volumes in MWh.
(2)Alberta Hydro Assets revenues is a supplementary financial measure and is comprised of revenues from 13 hydro facilities on the Bow and North Saskatchewan river systems, as well as revenues from swaps and forward hedges. Revenues per MWh are calculated by dividing Alberta Hydro Assets revenues by merchant production in MWh.
(3)Other Hydro Assets revenues is a supplementary financial measure and consists of revenues from our hydro facilities in British Columbia, Ontario and Alberta (other than the Alberta Hydro Assets). Other Hydro revenues is a supplementary financial measure and includes revenues from our transmission business and other contractual arrangements, including the flood mitigation agreement with the Government of Alberta and black start services.
(4)Adjusted Revenues, Adjusted Gross Margin, Adjusted OM&A, Adjusted EBITDA and Adjusted Earnings before Income Taxes are non-IFRS measures, are not defined and have no standardized meaning under IFRS and may not be comparable to similar measures presented by other issuers. Refer to the "Non-IFRS and Supplementary Financial Measures" section of this MD&A for more information regarding these measures. The most directly comparable IFRS measure to Adjusted Revenues is revenues of $58 million and $368 million for the three months and year ended Dec. 31, 2025, respectively (Dec. 31, 2024 — $93 million and $409 million), to Adjusted Gross Margin — gross margin of $54 million and $348 million for the three months and year ended Dec. 31, 2025, respectively (Dec. 31, 2024 — $90 million and $393 million), to Adjusted OM&A - OM&A of $16 million and $56 million the three months and year ended Dec. 31, 2025, respectively (Dec. 31, 2024 — $47 million and $86 million), to Adjusted EBITDA and Adjusted Earnings before Income Taxes — earnings before income taxes of $25 million and $251 million for the three months and year ended Dec. 31, 2025, respectively (Dec. 31, 2024 — $24 million and $263 million).
| | | | | | | | |
| TransAlta Corporation | 2025 Annual Report | M23 |
Three months ended Dec. 31, 2025
Adjusted Revenues for the three months ended Dec. 31, 2025 decreased compared to the same period in 2024, primarily due to:
•Lower spot and ancillary services power prices in the Alberta market; and
•Lower merchant volumes in Alberta due to lower market prices and water conservation.
Adjusted EBITDA and Adjusted Earnings before income taxes for the three months ended Dec. 31, 2025, decreased compared to the same period in 2024, primarily due to lower Adjusted Revenues as explained by the factors above.
Earnings before income taxes for the three months ended Dec. 31, 2025 were consistent compared to the same period in 2024 primarily due to:
•No penalties recognized in the current period compared to the same period in 2024, when the Company recognized the penalties assessed by the Alberta Market Surveillance Administrator for self-reported contraventions pertaining to Brazeau hydro ancillary services provided during 2021 and 2022; partially offset by
•Lower Adjusted Earnings before income taxes.
Year ended Dec. 31, 2025
Adjusted Revenues for the year ended Dec. 31, 2025, decreased compared to 2024, primarily due to:
•Lower spot and ancillary services power prices in the Alberta market; partially offset by
•Higher merchant and contract volumes;
•Higher volume of favourable hedge positions settled, which generated positive contributions over settled spot prices in Alberta;
•Higher regulated transmission revenues related to the reimbursement of costs incurred in prior periods; and
•Higher environmental and tax attributes revenues due to increased intercompany sales of emission credits to the Gas segment to fulfil our GHG obligation.
Adjusted EBITDA and Adjusted Earnings before income taxes for the year ended Dec. 31, 2025 decreased compared to 2024, primarily due to lower Adjusted Revenues as explained by the factors above.
Earnings before income taxes for the year ended Dec. 31, 2025 decreased compared to 2024 primarily due to:
•Lower Adjusted Earnings before income taxes; partially offset by
•No penalties recognized in 2025 compared to 2024, when the Company recognized the penalties assessed by the Alberta Market Surveillance Administrator for self-reported contraventions pertaining to Brazeau hydro ancillary services provided during 2021 and 2022.
For further discussion on Alberta market conditions and pricing, refer to the "Optimization of Alberta Portfolio" section of this MD&A.
| | | | | | | | |
M24 | TransAlta Corporation | 2025 Annual Report |
Wind and Solar | | | | | | | | | | | | | | | | | | | | | | | | | | | | | | | |
| | | | | | | | | |
| | | 3 months ended Dec. 31 | Year ended Dec. 31 | |
| | | 2025 | 2024 | Change | 2025 | 2024 | Change | |
Gross installed capacity (MW) | | | 2,587 | | 2,587 | — | | — | % | 2,587 | | 2,587 | — | | — | % | |
| LTA generation (GWh) | | | 2,175 | | 2,175 | — | | — | % | 7,457 | | 6,876 | 581 | | 8 | % | |
| Availability (%) | | | 94.6 | | 92.2 | 2.4 | | 3 | % | 94.4 | | 93.4 | 1.0 | | 1 | % | |
| | | | | | | | | | | |
| Production | | | | | | | | | | | |
| Contract production (GWh) | | | 1,651 | | 1,469 | | 182 | | 12 | % | 5,450 | | 4,720 | | 730 | | 15 | % | |
| Merchant production (GWh) | | | 357 | | 362 | | (5) | | (1) | % | 1,004 | | 1,229 | | (225) | | (18) | % | |
| Total production (GWh) | | | 2,008 | | 1,831 | | 177 | | 10 | % | 6,454 | | 5,949 | | 505 | | 8 | % | |
| | | | | | | | | | | |
Adjusted Revenues(1) | | | 120 | | 114 | | 6 | | 5 | % | 394 | | 372 | | 22 | | 6 | % | |
| | | | | | | | | | | |
Environmental and tax attributes revenues(1) | | | 23 | | 16 | | 7 | | 44 | % | 106 | | 77 | | 29 | | 38 | % | |
| | | | | | | | | | | |
Adjusted Revenues(2)(3) | | | 143 | | 130 | | 13 | | 10 | % | 500 | | 449 | | 51 | | 11 | % | |
| Fuel and purchased power | | | (7) | | (8) | | 1 | | (13) | % | (31) | | (30) | | (1) | | 3 | % | |
Carbon compliance costs | | | (1) | | — | | (1) | | — | % | (3) | | — | | (3) | | — | % | |
Adjusted Gross Margin(2)(3) | | | 135 | | 122 | | 13 | | 11 | % | 466 | | 419 | | 47 | | 11 | % | |
OM&A | | | (24) | | (27) | | 3 | | (11) | % | (106) | | (97) | | (9) | | 9 | % | |
| Taxes, other than income taxes | | | (8) | | (3) | | (5) | | 167 | % | (23) | | (16) | | (7) | | 44 | % | |
Adjusted Net Other Operating (Expense) Income (3) | | | (1) | | 3 | | (4) | | (133) | % | 1 | | 10 | | (9) | | (90) | % | |
Adjusted EBITDA(2)(3) | | | 102 | | 95 | | 7 | | 7 | % | 338 | | 316 | | 22 | | 7 | % | |
Depreciation and amortization | | | (52) | | (55) | | 3 | | (5) | % | (209) | | (198) | | (11) | | 6 | % | |
Adjusted Earnings before Income Taxes(2)(3) | | | 50 | | 40 | | 10 | | 25 | % | 129 | | 118 | | 11 | | 9 | % | |
(Loss) earnings before income taxes(4) | | | (38) | | 12 | | (50) | | (417) | % | (165) | | 19 | | (184) | | (968) | % | |
| | | | | | | | | | | |
| | | | | | | | | | | |
| | | | | | | | | | | |
| | | | | | | | | | | |
(1)Production Tax Credits related to the U.S. wind facilities that are subject to tax equity financing arrangements are excluded from the Environmental and tax attributes revenues line and are included under Adjusted Revenues line.
(2)The Skookumchuck wind facility has been included on a proportionate basis in the Wind and Solar segment.
(3)Adjusted Revenues, Adjusted Gross Margin, Adjusted Net Other Operating Income, Adjusted EBITDA and Adjusted Earnings before Income Taxes are non-IFRS measures, are not defined and have no standardized meaning under IFRS and may not be comparable to similar measures presented by other issuers. Refer to the "Non-IFRS and Supplementary Financial Measures" section of this MD&A for more information regarding these measures. The most directly comparable IFRS measure to Adjusted Revenues is revenues of $51 million and $206 million for the three months and year ended Dec. 31, 2025, respectively (Dec. 31, 2024 — $97 million and $336 million), to Adjusted Gross Margin — gross margin of $43 million and $172 million for the three months and year ended Dec. 31, 2025, respectively (Dec. 31, 2024— $89 million and $306 million), to Adjusted Net Other Operating (Expense) Income — net other operating expense of $1 million and income of $3 million for the three months and year ended Dec. 31, 2025, respectively (Dec. 31, 2024 — net other operating income of $3 million and $10 million), to Adjusted EBITDA and Adjusted Earnings before Income Taxes — loss before income taxes of $38 million and $165 million for the three months and year ended Dec. 31, 2025, respectively (Dec. 31, 2024 — earnings before income taxes of $12 million and $19 million).
(4)(Loss) earnings before income taxes exclude the contribution from Skookumchuck wind facility.
| | | | | | | | |
| TransAlta Corporation | 2025 Annual Report | M25 |
Three months ended Dec. 31, 2025
Adjusted Revenues for the three months ended Dec. 31, 2025 increased compared to the same period in 2024, primarily due to:
•Higher wind resource and availability across Canada and the U.S.; and
•Higher environmental and tax attributes revenue driven by an increase in sales of emission credits to third parties.
Adjusted EBITDA and Adjusted Earnings before income taxes for the three months ended Dec. 31, 2025 increased compared to the same period in 2024, primarily due to higher Adjusted Revenues as explained by the factors above.
Loss before income taxes for the three months ended Dec. 31, 2025 increased from earnings before income taxes for the same period in 2024 primarily due to:
•Higher unrealized mark-to-market losses on the long-term wind energy sales related to the Oklahoma facilities; partially offset by
•Higher Adjusted Earnings before income taxes;
Year ended Dec. 31, 2025
Adjusted Revenues for the year ended Dec. 31, 2025, increased compared to 2024, primarily due to:
•The impact from the White Rock and Horizon Hill wind facilities which achieved commercial operation in the first half of 2024;
•Higher environmental and tax attributes revenues due to the increased sales of emission credits to third parties and intercompany sales to the Gas segment; and
•Higher production volumes due to higher availability across the fleet and higher wind resource in Eastern Canada and the U.S.; partially offset by
•Lower Alberta spot power prices; and
•Lower production volumes in Alberta due to lower wind resource.
Adjusted EBITDA for the year ended Dec. 31, 2025 increased compared to 2024, primarily due to:
•Higher Adjusted Revenues as explained by the factors above; partially offset by
•Higher OM&A and taxes, other than income taxes, due to the addition of new wind facilities in the first half of 2024; and
•Lower liquidated damages recognized at various wind facilities.
Adjusted Earnings before income taxes for the year ended Dec. 31, 2025 increased compared to 2024, primarily due to:
•Higher Adjusted EBITDA; partially offset by
•Higher depreciation and amortization due to the addition of new wind facilities in the first half of 2024.
Loss before income taxes for the year ended Dec. 31, 2025 increased from earnings before income taxes in 2024 due to:
•Higher unrealized mark-to-market losses on the long-term wind energy sales related to the Garden Plain and Oklahoma facilities, partially offset by unrealized mark-to-market gains related to the Big Level facility; and
•Higher impairment charges, net of reversals, recognized for certain facilities due to changes in expected production volumes and lower power price assumptions; partially offset by
•Higher Adjusted Earnings before income taxes as explained above.
| | | | | | | | |
M26 | TransAlta Corporation | 2025 Annual Report |
Gas
| | | | | | | | | | | | | | | | | | | | | | | | | | | | | |
| | | | | | | | |
| | | 3 months ended Dec. 31, | Year ended Dec. 31 |
| | | 2025 | 2024 | Change | 2025 | | 2024 | Change |
Gross installed capacity (MW) | | | 4,834 | | 4,834 | | — | | — | % | 4,834 | | | 4,834 | | — | | — | % |
| Availability (%) | | | 85.9 | | 84.1 | | 1.8 | | 2 | % | 91.8 | | | 92.2 | | (0.4) | | — | % |
| Production | | | | | | | | | | | |
Contract sales volume (GWh) | | | 2,455 | | 1,932 | | 523 | | 27 | % | 9,539 | | | 6,874 | | 2,665 | | 39 | % |
Merchant sales volume (GWh) | | | 1,292 | | 1,387 | | (95) | | (7) | % | 4,566 | | | 6,576 | | (2,010) | | (31) | % |
Purchased power (GWh)(1) | | | (248) | | (444) | | 196 | | (44) | % | (1,102) | | | (1,133) | | 31 | | (3) | % |
Total production (GWh) | | | 3,499 | | 2,875 | | 624 | | 22 | % | 13,003 | | | 12,317 | | 686 | | 6 | % |
| | | | | | | | | | | |
Adjusted Revenues(2) | | | 359 | | 351 | | 8 | | 2 | % | 1,328 | | | 1,314 | | 14 | | 1 | % |
Adjusted Fuel and Purchased Power(2) | | | (161) | | (135) | | (26) | | 19 | % | (547) | | | (474) | | (73) | | 15 | % |
Carbon compliance costs | | | (39) | | (39) | | — | | — | % | (115) | | | (145) | | 30 | | (21) | % |
Adjusted Gross Margin(2) | | | 159 | | 177 | | (18) | | (10) | % | 666 | | | 695 | | (29) | | (4) | % |
Adjusted OM&A(2) | | | (68) | | (67) | | (1) | | 1 | % | (251) | | | (198) | | (53) | | 27 | % |
| Taxes, other than income taxes | | | (6) | | (4) | | (2) | | 50 | % | (21) | | | (13) | | (8) | | 62 | % |
| Net other operating income | | | 11 | | 10 | | 1 | | 10 | % | 44 | | | 40 | | 4 | | 10 | % |
Adjusted EBITDA(2)(3) | | | 96 | | 116 | | (20) | | (17) | % | 438 | | | 524 | | (86) | | (16) | % |
| Depreciation and amortization | | | (69) | | (49) | | (20) | | 41 | % | (266) | | | (212) | | (54) | | 25 | % |
Adjusted Earnings before Income Taxes(2) | | | 27 | | 67 | | (40) | | (60) | % | 172 | | | 312 | | (140) | | (45) | % |
Earnings before income taxes | | | 15 | | 37 | | (22) | | (59) | % | 120 | | | 355 | | (235) | | (66) | % |
| | | | | | | | | | | |
| | | | | | | | | | | |
| | | | | | | | | | | |
(1)Power required to fulfil contractual obligations is included in purchased power.
(2)Adjusted Revenues, Adjusted Fuel and Purchased Power, Adjusted Gross Margin, Adjusted OM&A, Adjusted EBITDA and Adjusted Earnings before Income Taxes are non-IFRS measures, are not defined and have no standardized meaning under IFRS and may not be comparable to similar measures presented by other issuers. The most directly comparable IFRS measure to Adjusted Revenues is revenues of $347 million and $1,267 million for the three months and year ended Dec. 31, 2025, respectively (Dec. 31, 2024 — 319 million and $1,350 million), to Adjusted Fuel and Purchased Power — fuel and purchased power of $161 million and $549 million for the three months and year ended Dec. 31, 2025, respectively (Dec. 31, 2024 — $134 million and $475 million), to Adjusted Gross Margin — gross margin of $147 million and $603 million for the three months and year ended Dec. 31, 2025, respectively (Dec. 31, 2024 — $146 million and $730 million), to Adjusted OM&A — OM&A of $69 million and $257 million for the three months and year ended Dec. 31, 2025, respectively (Dec. 31, 2024 — $67 million and $198 million), to Adjusted EBITDA and Adjusted Earnings before Income Taxes — loss before income taxes of $15 million and earnings before income taxes of $120 million for the three months and year ended Dec. 31, 2025, respectively (Dec. 31, 2024 — earnings before income taxes of $37 million and $355 million).
(3)During the first quarter of 2025, our Adjusted EBITDA composition was amended to exclude the impact of realized gain (loss) on closed exchange positions and Australian interest income. Therefore, the Company has applied this composition to all previously reported periods. Refer to the "Non-IFRS and Supplementary Financial Measures" section of this MD&A.
Three months ended Dec. 31, 2025
Adjusted Revenues for the three months ended Dec. 31, 2025 are comparable to the same period in 2024, primarily due to:
•The addition of the Heartland facilities;
•Higher production at the Sarnia gas facility due to higher availability compared to the same period in 2024, when the facility experienced a planned outage during a portion of the quarter; and
•Favourable hedge positions settled, which generated positive contributions over settled spot prices in Alberta; partially offset by
•Higher dispatch optimization due to lower market prices driven by milder weather and new gas generation in Alberta; and
•Lower spot power prices in the Alberta market and lower hedge power prices compared to the same period in 2024.
Adjusted EBITDA for the three months ended Dec. 31, 2025 decreased compared to the same period in 2024, primarily due to:
•Higher fuel costs, carbon compliance cost and OM&A related to the addition of the Heartland facilities;
| | | | | | | | |
| TransAlta Corporation | 2025 Annual Report | M27 |
•Higher fuel costs due to higher production at the Sarnia gas facility as the facility experienced a planned outage during a portion of the quarter in 2024; and
•An increase in the carbon price from $80 to $95 per tonne, impacting gross margin from our Canadian gas facilities; partially offset by
•Favourable impact on carbon compliance cost due to an increase of production from lower-carbon-emitting cogeneration facilities.
Adjusted Earnings before income taxes for the three months ended Dec. 31, 2025 decreased compared to the same period in 2024 due to:
•Lower Adjusted EBITDA as explained above; and
•Higher depreciation due to the full quarter impact from the addition of the Heartland facilities.
Earnings before income taxes for the three months ended Dec. 31, 2025 decreased compared the same period in 2024, primarily due to:
•Lower Adjusted Earnings before income taxes compared to the same period in 2024; partially offset by
•Higher unrealized mark-to-market gains due to favourable hedges.
Year ended Dec. 31, 2025
Adjusted Revenues for the year ended Dec. 31, 2025 increased compared to 2024, primarily due to:
•Addition of gas facilities from Heartland;
•Higher production at the Sarnia gas facility due to higher availability in the fourth quarter of 2025 compared to the same period in 2024, when the facility had a planned outage during a portion of the fourth quarter in 2024; and
•Favourable hedge positions settled, which generated positive contributions over settled spot prices in Alberta; partially offset by
•Higher dispatch optimization due to lower market prices driven by new gas generation in Alberta; and
•Lower spot power prices in the Alberta market and lower hedge power prices compared to the same period in 2024.
Adjusted EBITDA for the year ended Dec. 31, 2025 decreased compared to 2024, primarily due to:
•Higher fuel costs, carbon compliance cost and OM&A related to the addition of the Heartland facilities;
•Higher natural gas prices;
•Higher fuel costs at the Sarnia gas facility due to higher production; and
•An increase in the carbon price from $80 to $95 per tonne, impacting gross margin from our Canadian gas facilities; partially offset by
•A reduction to carbon compliance costs by using internally generated and externally purchased emission credits in the current period compared to the same period in the prior year to settle a portion of our GHG obligation and a portion of the 2024 GHG obligation assumed in the Heartland acquisition; and
•Higher Adjusted Revenues as explained by the factors above; and
•Favourable impact on carbon compliance cost due to an increase of production from lower-carbon-emitting cogeneration facilities.
Adjusted Earnings before income taxes for the year ended Dec. 31, 2025 decreased compared to 2024 due to:
•Lower Adjusted EBITDA as explained above; and
•Higher depreciation due to the addition of the Heartland facilities; partially offset by
•Revisions to the useful lives of certain gas facilities in the fourth quarter of 2024.
Earnings before income taxes for the year ended Dec. 31, 2025 decreased compared to 2024 due to:
•Higher unrealized mark-to-market losses due to less favourable hedges;
•Lower Adjusted Earnings before income taxes compared to the same period in 2024; partially offset by
•Higher lease income due to the addition of finance leases from the Heartland acquisition.
| | | | | | | | |
M28 | TransAlta Corporation | 2025 Annual Report |
Energy Transition
| | | | | | | | | | | | | | | | | | | | | | | | | | | | | | |
| | | | | | | | | |
| | | 3 months ended Dec. 31, | Year ended Dec. 31 |
| | | 2025 | 2024 | Change | 2025 | | 2024 | | Change |
Gross installed capacity (MW) | | | 671 | | 671 | | — | | — | % | 671 | | | 671 | | | — | | — | % |
| Availability (%) | | | 92.5 | | 91.7 | | 0.8 | | 1 | % | 88.5 | | | 80.0 | | | 8.5 | | 11 | % |
| | | | | | | | | | | | |
| Production | | | | | | | | | | | | |
Contract sales volume (GWh) | | | 663 | | 839 | | (176) | | (21) | % | 2,628 | | | 3,338 | | | (710) | | (21) | % |
Merchant sales volume (GWh) | | | 951 | | 1,137 | | (186) | | (16) | % | 3,467 | | | 3,201 | | | 266 | | 8 | % |
Purchased power (GWh)(1) | | | (732) | | (935) | | 203 | | (22) | % | (2,945) | | | (3,717) | | | 772 | | (21) | % |
| Total production (GWh) | | | 882 | | 1,041 | | (159) | | (15) | % | 3,150 | | | 2,822 | | | 328 | | 12 | % |
| | | | | | | | | | | | |
Adjusted Revenues(2) | | | 115 | | 147 | | (32) | | (22) | % | 504 | | | 580 | | | (76) | | (13) | % |
| Fuel and purchased power | | | (81) | | (102) | | 21 | | (21) | % | (328) | | | (418) | | | 90 | | (22) | % |
Carbon compliance costs | | | — | | — | | — | | — | % | — | | | (1) | | | 1 | | (100) | % |
Adjusted Gross Margin(2) | | | 34 | | 45 | | (11) | | (24) | % | 176 | | | 161 | | | 15 | | 9 | % |
Adjusted OM&A(2) | | | (18) | | (19) | | 1 | | (5) | % | (73) | | | (69) | | | (4) | | 6 | % |
| Taxes, other than income taxes | | | — | | — | | — | | — | % | (3) | | | (3) | | | — | | — | % |
| | | | | | | | | | | | |
Adjusted EBITDA(2) | | | 16 | | 26 | | (10) | | (38) | % | 100 | | | 89 | | | 11 | | 12 | % |
| Depreciation and amortization | | | (10) | | (18) | | 8 | | (44) | % | (49) | | | (66) | | | 17 | | (26) | % |
Adjusted Earnings before Income Taxes(2) | | | 6 | | 8 | | (2) | | (25) | % | 51 | | | 23 | | | 28 | | 122 | % |
| Earnings before income taxes | | | 64 | | 15 | | 49 | | 327 | % | 114 | | | 46 | | | 68 | | 148 | % |
Supplementary information: | | | | | | | | | | | | |
Highvale mine reclamation spend(3) | | | 4 | | 3 | | 1 | | 33 | % | 12 | | | 11 | | | 1 | | 9 | % |
Centralia mine reclamation spend(3) | | | 3 | | 4 | | (1) | | (25) | % | 15 | | | 16 | | | (1) | | (6) | % |
| | | | | | | | | | | | |
| | | | | | | | | | | | |
(1)All of the power produced by Centralia is sold by the Energy Marketing segment for physical market delivery, which is shown as merchant sales volumes. Power required to fulfil contractual obligations is included in purchased power. Total production from the facility includes the net result of merchant sales volumes and purchased power.
(2)Adjusted Revenues, Adjusted Gross Margin, Adjusted OM&A, Adjusted EBITDA and Adjusted Earnings before Income Taxes are non-IFRS measures, are not defined and have no standardized meaning under IFRS and may not be comparable to similar measures presented by other issuers. The most directly comparable IFRS measure to Adjusted Revenues is revenues of $110 million and $495 million for the three months and year ended Dec. 31, 2025, respectively (Dec. 31, 2024 — $155 million and $616 million), to Adjusted Gross Margin — gross margin of $29 million and $167 million for the three months and year ended Dec. 31, 2025, respectively (Dec. 31, 2024 — $53 million and $197 million), to Adjusted OM&A — OM&A of $20 million and $75 million for the three months and year ended Dec. 31, 2025, respectively (Dec. 31, 2024 — $19 million and $69 million), to Adjusted EBITDA and Adjusted Earnings before Income Taxes — earnings before income taxes of $64 million and $114 million for the three months and year ended Dec. 31, 2025, respectively (Dec. 31, 2024 — $15 million and $46 million).
(3)Highvale and Centralia mine reclamation spend, which represent the costs necessary to bring the sites to their original condition, are supplementary financial measures and are included in the Decommissioning and restoration liabilities settled during the period in the consolidated statements of financial position under IFRS.
Three months ended Dec. 31, 2025
Adjusted Revenues for the three months ended Dec. 31, 2025 decreased compared to the same period in 2024, primarily due to:
•Lower Mid-Columbia prices; partially offset by
•Favourable hedge positions settled, which generated positive contributions over settled spot prices.
Adjusted EBITDA for the three months ended Dec. 31, 2025 decreased compared to the same period in 2024, primarily due to:
•Lower Adjusted Revenues as explained above; partially offset by
•Lower purchased power costs due to fewer repurchases to fulfil contractual obligations during outages.
Adjusted Earnings before Income Taxes for the three months ended Dec. 31, 2025 decreased compared to the same period in 2024, primarily due to:
•Lower Adjusted EBITDA as explained above; partially offset by
•Lower depreciation due to Centralia approaching its end of life as a coal-fired facility.
| | | | | | | | |
| TransAlta Corporation | 2025 Annual Report | M29 |
Earnings before income taxes for the three months ended Dec. 31, 2025 increased compared to the same period in 2024 due to:
•A change in decommissioning and restoration provisions driven by the revisions in estimated cash flows, timing of cash flows and discount rates; partially offset by
•Higher unrealized mark-to-market losses due to less favourable hedges;
•Lower net other operating income in the current period due to Sundance A decommissioning cost reimbursement in the same period of 2024; and
•Lower Adjusted Earnings before income taxes as explained above.
Year ended Dec. 31, 2025
Adjusted Revenues for year ended Dec. 31, 2025 decreased compared to 2024, primarily due to:
•Lower Mid-Columbia prices; partially offset by
•Favourable hedge positions settled, which generated positive contributions over settled spot prices; and
•Higher production.
Adjusted EBITDA for the year ended Dec. 31, 2025 increased compared to 2024 due to:
•Lower purchased power costs driven by higher availability; partially offset by
•Lower Adjusted Revenues as explained above; and
•Higher OM&A related to community fund spending.
Adjusted Earnings before income taxes for the year ended Dec. 31, 2025 increased compared to 2024 due to:
•Lower depreciation due to Centralia approaching its end of life as a coal-fired facility.; and
•Higher Adjusted EBITDA as explained above.
Earnings before income taxes for the year ended Dec. 31, 2025 increased compared to 2024 due to:
•Impairment reversal related to generation equipment;
•A change in decommissioning and restoration provisions driven by the revisions in estimated cash flows, timing of cash flows and discount rates; and
•Higher Adjusted Earnings before Income Taxes as explained above; partially offset by
•Higher unrealized mark-to-market losses due to less favourable hedges; and
•Lower net other operating income in the current period due to Sundance A decommissioning cost reimbursement in the same period of 2024.
Mine reclamation spending for the three months and the year ended Dec. 31, 2025, was consistent with 2024.
Energy Marketing | | | | | | | | | | | | | | | | | | | | | | | | | | | | |
| | | | | | | | |
| | | 3 months ended Dec. 31 | Year ended Dec. 31 |
| | | 2025 | 2024 | Change | 2025 | 2024 | Change |
Adjusted Revenues(1) | | | 30 | | 33 | | (3) | | (9) | % | 122 | | 182 | | (60) | | (33) | % |
| OM&A | | | (9) | | (7) | | (2) | | 29 | % | (37) | | (36) | | (1) | | 3 | % |
Adjusted EBITDA(1) | | | 21 | | 26 | | (5) | | (19) | % | 85 | | 146 | | (61) | | (42) | % |
Depreciation and amortization | | | — | | — | | — | | — | % | (2) | | (2) | | — | | — | % |
Adjusted Earnings before Income Taxes(1)(2) | | | 21 | | 26 | | (5) | | (19) | % | 83 | | 144 | | (61) | | (42) | % |
Earnings before income taxes | | | 19 | | 7 | | 12 | | 171 | % | 91 | | 130 | | (39) | | (30) | % |
| | | | | | | | | | |
(1)Adjusted Revenues, Adjusted EBITDA and Adjusted Earnings before Income Taxes are non-IFRS measures, are not defined and have no standardized meaning under IFRS and may not be comparable to similar measures presented by other issuers. The most directly comparable IFRS measure to Adjusted Revenues for the three months and year ended Dec. 31, 2025 is revenues of $28 million and $130 million, respectively (Dec. 31, 2024 — $14 million and $168 million), to Adjusted EBITDA and Adjusted Earnings before Income Taxes — earnings before income taxes of $19 million and $91 million, respectively (Dec. 31, 2024 — $7 million and $130 million).
(2)During the first quarter of 2025, our Adjusted EBITDA composition was amended to exclude the impact of realized gain (loss) on closed exchange positions. Therefore, the Company has applied this composition to all previously reported periods. Refer to the "Non-IFRS and Supplementary Financial Measures" section of this MD&A.
Three months and year ended Dec. 31, 2025
Adjusted Revenues and Adjusted EBITDA for the three months and the year ended Dec. 31, 2025 decreased compared to the same periods in 2024, primarily due to:
•Comparatively subdued market volatility across North American natural gas and power markets; and
•Lower realized gains in 2025 compared to the same period in the prior year.
| | | | | | | | |
M30 | TransAlta Corporation | 2025 Annual Report |
Adjusted Earnings before Income Taxes for the three months and year ended Dec. 31, 2025 decreased compared to the same periods in 2024 mainly due to lower Adjusted Revenues as explained above.
Earnings before income taxes for the three months ended Dec. 31, 2025 increased compared to the same period in 2024 due to:
•Lower unrealized mark-to-market losses due to more favourable positions; partially offset by
•Lower Adjusted Earnings before Income Taxes as explained above.
Earnings before income taxes for the year ended Dec. 31, 2025 decreased compared to 2024 due to:
•Lower Adjusted Earnings before Income Taxes; partially offset by
•Higher unrealized mark-to-market gains due to more favourable positions.
Corporate
| | | | | | | | | | | | | | | | | | | | | | | | | | |
| | | | | | | |
| 3 months ended Dec. 31, | Year ended Dec. 31 |
| 2025 | 2024 | Change | 2025 | 2024 | Change |
Adjusted OM&A(1) | (28) | | (38) | | 10 | | (26) | % | (141) | | (135) | | (6) | | 4 | % |
| Taxes, other than income taxes | 1 | | — | | 1 | | — | % | (1) | | (1) | | — | | — | % |
Adjusted EBITDA(1) | (27) | | (38) | | 11 | | (29) | % | (142) | | (136) | | (6) | | 4 | % |
| Depreciation and amortization | (6) | | (4) | | (2) | | 50 | % | (21) | | (18) | | (3) | | 17 | % |
Equity income (loss) | — | | (3) | | 3 | | (100) | % | (2) | | (4) | | 2 | | (50) | % |
| Interest income | 9 | | 11 | | (2) | | (18) | % | 30 | | 32 | | (2) | | (6) | % |
| Interest expense | (80) | | (93) | | 13 | | (14) | % | (350) | | (328) | | (22) | | 7 | % |
Realized foreign exchange loss(2) | (13) | | (15) | | 2 | | (13) | % | (16) | | (22) | | 6 | | (27) | % |
Adjusted Loss before Income Taxes(1) | (117) | | (142) | | 25 | | (18) | % | (501) | | (476) | | (25) | | 5 | % |
| Loss before income taxes | (127) | | (146) | | 19 | | (13) | % | (552) | | (494) | | (58) | | 12 | % |
| | | | | | | | |
| | | | | | | | |
| | | | | | | | |
| | | | | | | | |
| | | | | | | | |
| | | | | | | | |
| | | | | | | | |
| | | | | | | | |
| | | | | | | | |
(1)Adjusted OM&A, Adjusted EBITDA and Adjusted Loss before Income Taxes are non-IFRS measures, are not defined and have no standardized meaning under IFRS and may not be comparable to similar measures presented by other issuers. The most directly comparable IFRS measure to Adjusted OM&A for the three months and year ended Dec. 31, 2025 is OM&A of $50 million and $185 million, respectively (Dec. 31, 2024 — $68 million and $173 million). The most directly comparable IFRS measure to Adjusted EBITDA and Adjusted Loss before Income Taxes is loss before income taxes of $127 million and $552 million for the three months and year ended Dec. 31, 2025, respectively (Dec. 31, 2024 — $146 million and $494 million).
(2)Realized foreign exchange (loss) gain is a supplementary financial measure consisting of foreign exchange gains and losses related to the actual payment transactions. Refer to the "Non-IFRS and Supplementary Financial Measures" section of this MD&A for more details.
Three months ended Dec. 31, 2025
Adjusted EBITDA for the three months ended Dec. 31, 2025 increased compared to the same period in 2024, primarily due to lower Adjusted OM&A driven by lower incentive costs, partially offset by the addition of corporate costs related to Heartland.
Adjusted Loss before Income Taxes for the three months ended Dec. 31, 2025 decreased compared to the same period in 2024, primarily due to:
•Lower interest expense driven by lower interest on debt, and net gain on early redemption of the US$400 million senior notes, partially offset by full quarter interest on the Heartland term facility; and
•Higher Adjusted EBITDA as explained above.
Loss before income taxes for the three months ended Dec. 31, 2025 decreased compared to the same period in 2024 due to:
•Lower Adjusted Loss before Income Taxes as explained above;
•Lower acquisition-related transaction and restructuring costs compared to the same period of 2024; and
•Lower spending related to the planning, design and implementation of an upgrade to our ERP system; partially offset by
•Higher termination and restructuring costs associated with cost saving initiatives, mainly comprising termination and severance payments;
•Lower unrealized foreign exchange gains driven by unfavourable changes in foreign currency rates; and
•Lower impairment charges related to development projects that are no longer proceeding.
| | | | | | | | |
| TransAlta Corporation | 2025 Annual Report | M31 |
Year ended Dec. 31, 2025
Adjusted EBITDA for the year ended Dec. 31, 2025, decreased compared to 2024, primarily due to:
•Increased spending to support strategic and growth initiatives; and
•The full year impact from the addition of the Heartland facilities acquired in the fourth quarter of 2024 and associated corporate costs; partially offset by
•Cost saving initiatives.
Adjusted Loss before Income Taxes for the year ended Dec. 31, 2025 increased compared to 2024 due to:
•Lower Adjusted EBITDA as explained above; and
•Higher interest expense due to higher interest on debt driven by the addition of the Heartland term facility, and lower capitalized interest resulting from lower construction activity during 2025 compared to 2024, partially offset by lower interest on senior notes due to the refinancing at lower interest rates during 2025 and a net gain on the early redemption of the US$400 million senior notes.
Loss before income taxes for the year ended Dec. 31, 2025 increased compared to 2024 due to:
•Higher Adjusted Loss before income taxes as explained above;
•Higher spending related to the planning, design and implementation of an upgrade to our ERP system; and
•Higher unrealized foreign exchange losses due to unfavourable changes in foreign currency rates; partially offset by
•Lower Heartland acquisition-related transaction and restructuring costs, mainly comprising severance, legal and consulting fees; and
•Lower impairment charges related to development projects that are no longer proceeding.
| | | | | | | | |
M32 | TransAlta Corporation | 2025 Annual Report |
Performance by Segment with Supplementary Geographical Information
The following table provides Adjusted EBITDA by segment across the regions we operate in:
| | | | | | | | | | | | | | | | | | | | | | | | |
| | | | | | | | |
| | | | | | | | |
| | | | | | | | |
| | | | | | | | |
| | | | | | | | |
| | | | | | | | |
| | | | | | | | |
| | | | | | | | |
| | | | | | | | |
| | | | | | | | |
| | | | | | | | |
| | | | | | | | |
| | | | | | | | |
| | | | | | | | |
| | | | | | | | |
| | | | | | | | |
3 months ended Dec. 31, 2025 | | Hydro | Wind & Solar(3) | Gas | Energy Transition | Energy Marketing | Corporate | Total |
| Alberta | | 36 | | 12 | | 39 | | (4) | | 21 | | (27) | | 77 | |
| Canada, excluding Alberta | | 3 | | 41 | | 31 | | — | | — | | — | | 75 | |
| U.S. | | — | | 47 | | 3 | | 20 | | — | | — | | 70 | |
Western Australia | | — | | 2 | | 23 | | — | | — | | — | | 25 | |
Adjusted EBITDA(1) | | 39 | | 102 | | 96 | | 16 | | 21 | | (27) | | 247 | |
Adjusted Earnings (Loss) before Income Taxes(1) | | 27 | | 50 | | 27 | | 6 | | 21 | | (117) | | 14 | |
Earnings (loss) before income taxes | | 25 | | (38) | | 15 | | 64 | | 19 | | (127) | | (42) | |
| | | | | | | | |
3 months ended Dec. 31, 2024 | | Hydro | Wind & Solar(3) | Gas | Energy Transition | Energy Marketing | Corporate | Total |
| Alberta | | 54 | | 8 | | 74 | | (3) | | 26 | | (38) | | 121 | |
| Canada, excluding Alberta | | 3 | | 42 | | 19 | | — | | — | | — | | 64 | |
| U.S. | | — | | 43 | | 3 | | 29 | | — | | — | | 75 | |
Western Australia | | — | | 2 | | 20 | | — | | — | | — | | 22 | |
Adjusted EBITDA(1)(2) | | 57 | | 95 | | 116 | | 26 | | 26 | | (38) | | 282 | |
Adjusted Earnings (Loss) before Income Taxes(1) | | 39 | | 40 | | 67 | | 8 | | 26 | | (142) | | 38 | |
Earnings (loss) before income taxes | | 24 | | 12 | | 37 | | 15 | | 7 | | (146) | | (51) | |
(1)Adjusted EBITDA and Adjusted Earnings (Loss) before Income Taxes are non-IFRS measures, are not defined, have no standardized meaning under IFRS and may not be comparable to similar measures presented by other issuers.
(2)During the first quarter of 2025, our Adjusted EBITDA composition was amended to exclude the impact of realized gain (loss) on closed exchange positions and Australian interest income. Therefore, the Company has applied this composition to all previously reported periods. Refer to the "Non-IFRS and Supplementary Financial Measures" section of this MD&A.
(3)(Loss) earnings before income taxes for the Wind and Solar segment exclude the contribution from Skookumchuck wind facility.
| | | | | | | | |
| TransAlta Corporation | 2025 Annual Report | M33 |
| | | | | | | | | | | | | | | | | | | | | | | | |
| | | | | | | | |
| | | | | | | | |
| | | | | | | | |
| | | | | | | | |
| | | | | | | | |
| | | | | | | | |
| | | | | | | | |
| | | | | | | | |
| | | | | | | | |
| | | | | | | | |
| | | | | | | | |
| | | | | | | | |
| | | | | | | | |
| | | | | | | | |
| | | | | | | | |
| | | | | | | | |
Year ended Dec. 31, 2025 | | Hydro | Wind & Solar(3) | Gas | Energy Transition | Energy Marketing | Corporate | Total |
| Alberta | | 271 | | 43 | | 220 | | (11) | | 85 | | (142) | | 466 | |
| Canada, excluding Alberta | | 14 | | 136 | | 112 | | — | | — | | — | | 262 | |
| U.S. | | — | | 151 | | 12 | | 111 | | — | | — | | 274 | |
Western Australia | | — | | 8 | | 94 | | — | | — | | — | | 102 | |
Adjusted EBITDA(1) | | 285 | | 338 | | 438 | | 100 | | 85 | | (142) | | 1,104 | |
Adjusted Earnings (Loss) before Income Taxes(1) | | 247 | | 129 | | 172 | | 51 | | 83 | | (501) | | 181 | |
Earnings (loss) before income taxes | | 251 | | (165) | | 120 | | 114 | | 91 | | (552) | | (141) | |
| | | | | | | | |
Year ended Dec. 31, 2024 | | Hydro | Wind & Solar(3) | Gas | Energy Transition | Energy Marketing | Corporate | Total |
| Alberta | | 307 | | 51 | | 333 | | (10) | | 146 | | (136) | | 691 | |
| Canada, excluding Alberta | | 9 | | 122 | | 91 | | — | | — | | — | | 222 | |
| U.S. | | — | | 135 | | 12 | | 99 | | — | | — | | 246 | |
Western Australia | | — | | 8 | | 88 | | — | | — | | — | | 96 | |
Adjusted EBITDA(1)(2) | | 316 | | 316 | | 524 | | 89 | | 146 | | (136) | | 1,255 | |
Adjusted Earnings (Loss) before Income Taxes(1) | | 275 | | 118 | | 312 | | 23 | | 144 | | (476) | | 396 | |
Earnings (loss) before income taxes | | 263 | | 19 | | 355 | | 46 | | 130 | | (494) | | 319 | |
(1)Adjusted EBITDA and Adjusted Earnings (Loss) before Income Taxes are non-IFRS measures, are not defined, have no standardized meaning under IFRS and may not be comparable to similar measures presented by other issuers.
(2)During the first quarter of 2025, our Adjusted EBITDA composition was amended to exclude the impact of realized gain (loss) on closed exchange positions and Australian interest income. Therefore, the Company has applied this composition to all previously reported periods. Refer to the "Non-IFRS and Supplementary Financial Measures" section of this MD&A.
(3)(Loss) earnings before income taxes for the Wind and Solar segment exclude the contribution from Skookumchuck wind facility.
Optimization of the Alberta Portfolio
The Alberta electricity portfolio metrics disclosed below are supplementary financial measures used to present the detailed performance by segment for the Alberta market.
Our merchant exposure is primarily in Alberta, where 58 per cent of our capacity is located, 77 per cent of which is available to participate in the merchant market. Our portfolio of assets consists of hydro, wind, battery storage and natural gas generation facilities.
The acquisition of Heartland on Dec 4. 2024, enhanced and further diversified TransAlta’s competitive portfolio in the highly dynamic and shifting electricity landscape in Alberta, by adding 376 MW of contracted cogeneration capacity, 361 MW of contracted and merchant peaking generation capacity, 950 MW of merchant natural gas-fired thermal generation capacity and transmission capacity. We believe that the fast-ramping nature of certain Heartland facilities are well positioned to respond to price volatility
and deliver peaking capacity during periods of higher demand in the Alberta market.
Generating capacity in Alberta is subject to market forces. Power from commercial generation is cleared through a wholesale electricity market. Power is dispatched in accordance with an economic merit order administered by the AESO, based upon offers by generators to sell power in the real-time energy-only market. Our merchant Alberta fleet operates under this framework and we internally manage our offers to sell power.
Optimization of portfolio performance in the Alberta merchant market is driven by the diversity of fuel types, which enables portfolio management. It also provides us with capacity that can be monetized as either energy production or ancillary services. A significant portion of the installed generation capacity in the portfolio has been hedged to provide greater cash flow certainty. The Company's hedging strategy includes maintaining a
| | | | | | | | |
M34 | TransAlta Corporation | 2025 Annual Report |
significant base of commercial and industrial customers and is supplemented with financial hedges.
During periods of low market prices, the Company may choose not to generate power from the thermal fleet and instead monetize its hedged or contract positions. This results in a change in revenue that does not correlate with a change in production. During the year, there were periods of low market prices, and the Company opted not to generate production from its thermal fleet, which resulted in thermal generation sold through contracts with commercial and industrial customers, and financial hedges exceeding the actual merchant production generated.
The Alberta hydro and gas fleets provide ancillary services. The hydro fleet also provides grid reliability products such as black start services in the event of a system-wide blackout. Hydro assets also support drought mitigation by systematically regulating river flows.
Our Alberta wind and hydro fleets provide a steady stream of environmental credits that the Company sells to third parties and to the Gas segment.
The following table provides information for the Company's Alberta electricity portfolio for the three months ended Dec. 31:
| | | | | | | | | | | | | | | | | | | | | | | | | | | | | | | | | | | | | |
| 2025 | 2024 | |
3 months ended Dec. 31 | Hydro | Wind & Solar | Gas | Energy Transition | Total | Hydro | Wind & Solar | Gas | Energy Transition | Total | | | | | |
| Gross installed capacity (MW) | 834 | | 764 | | 3,650 | | — | | 5,248 | | 834 | | 764 | | 3,650 | | — | | 5,248 | | | | | | |
Total production(1) (GWh) | 266 | | 640 | | 2,183 | | — | | 3,089 | | 367 | | 619 | | 2,164 | | — | | 3,150 | | | | | | |
| Contract production (GWh) | — | | 284 | | 1,382 | | — | | 1,666 | | — | | 257 | | 837 | | — | | 1,094 | | | | | | |
| Merchant production (GWh) | 266 | | 356 | | 801 | | — | | 1,423 | | 367 | | 362 | | 1,327 | | — | | 2,056 | | | | | | |
| | | | | | | | | | | | | | | |
| Ancillary services volumes (GWh) | 761 | | 21 | | 199 | | — | | 981 | | 713 | | 12 | | 201 | | — | | 926 | | | | | | |
Hedged volumes (GWh) | 210 | | 47 | | 1,803 | | — | | 2,060 | | 205 | | 44 | | 2,388 | | — | | 2,637 | | | | | | |
| Production contracted or hedged (%) | 79 | % | 52 | % | 146 | % | — | % | 121 | % | 56 | % | 49 | % | 149 | % | — | % | 118 | % | | | | | |
Hedged volumes as a percentage of gross installed capacity (%) | 12 | % | 3 | % | 23 | % | — | % | 18 | % | 11 | % | 3 | % | 30 | % | — | % | 23 | % | | | | | |
| | | | | | | | | | | | | | | |
Adjusted Revenues(2)(3) ($) | 53 | | 27 | | 218 | | 2 | | 300 | | 72 | | 24 | | 236 | | 1 | | 333 | | | | | | |
Fuel ($) | (1) | | (4) | | (99) | | (1) | | (105) | | (1) | | (3) | | (86) | | (1) | | (91) | | | | | | |
Purchased power ($) | (2) | | — | | (11) | | — | | (13) | | (1) | | (1) | | (14) | | — | | (16) | | | | | | |
Carbon compliance costs(3)($) | — | | (1) | | (30) | | (1) | | (32) | | — | | — | | (34) | | — | | (34) | | | | | | |
Adjusted Gross Margin(2) ($) | 50 | | 22 | | 78 | | — | | 150 | | 70 | | 20 | | 102 | | — | | 192 | | | | | | |
| | | | | | | | | | | | | | | |
(1)Total production includes contract and merchant production and excludes ancillary services volumes.
(2)Revenues have been adjusted to exclude the impact of unrealized mark-to-market gains or losses. During the first quarter of 2025, our Adjusted Revenues and Adjusted Gross Margin composition was amended to exclude the impact of realized gain (loss) on closed exchange positions. Therefore, the Company has applied this composition to all previously reported periods.
(3)The intercompany sales of emission credits from the Hydro and Wind and Solar segments to the Gas segment are eliminated on consolidation in the Corporate segment. Refer to the "Non-IFRS and Supplementary Financial Measures" section of this MD&A.
Three months ended Dec. 31, 2025
Total production for the Alberta portfolio for the three months ended Dec. 31, 2025, was 3,089 GWh, compared to 3,150 GWh for the same period in 2024. The decrease of 61 GWh, or two per cent, was primarily due to:
•Lower merchant production in the Gas segment due to dispatch optimization driven by lower market prices; and
•Lower production from the Hydro segment due to lower market prices and water conservation; partially offset by
•Higher contract production in the Gas segment due to the addition of the Heartland gas facilities in the fourth quarter of 2024; and
•Higher production volumes in the Wind and Solar segment due to higher wind resource in Alberta.
| | | | | | | | |
| TransAlta Corporation | 2025 Annual Report | M35 |
Ancillary services volumes for the three months ended Dec. 31, 2025 were 981 GWh compared to 926 GWh in the same period of 2024. The increase of 55 GWh, or six per cent, was primarily due to an increase in Hydro ancillary services volumes in the course of optimizing our portfolio and water reserves in the quarter.
Hedged volumes for the Alberta portfolio for the three months ended Dec. 31, 2025, decreased compared to the same period in 2024 due to planned outages in the Gas segment. Realized gains and losses on financial hedges are included in Adjusted Revenues in the table above.
Adjusted Gross Margin for the Alberta portfolio for the three months ended Dec. 31, 2025, was $150 million, compared to $192 million in 2024. The decrease of $42 million, or 22 per cent, was primarily due to:
•The impact of lower Alberta spot and hedge power prices;
•Higher dispatch optimization in the Gas segment;
•Lower favourable contributions from the hedge positions settled;
•Lower revenues in the Hydro segment due to lower market prices and optimization of water reserves;
•Higher fuel costs in the Gas segment due to higher natural gas prices; and
•An increase in the carbon price per tonne from $80 in 2024 to $95 in 2025; partially offset by
•Positive contribution from the addition of the Heartland facilities in the Gas segment; and
•Favourable impact on carbon compliance cost due to an increase of production from lower-carbon-emitting cogeneration facilities.
The following table provides information for the Company's Alberta electricity portfolio for the year ended Dec. 31: | | | | | | | | | | | | | | | | | | | | | | | | | | | | | | | | | | | | | | |
| 2025 | 2024 | | | | | | |
Year ended Dec. 31 | Hydro | Wind & Solar | Gas | Energy
Transition | Total | Hydro | Wind & Solar | Gas | Energy Transition | Total | | | | | | |
Gross installed capacity (MW) | 834 | | 764 | | 3,650 | | — | | 5,248 | | 834 | | 764 | | 3,650 | | — | | 5,248 | | | | | | | |
Total production(1) (GWh) | 1,568 | | 1,883 | | 8,506 | | — | | 11,957 | | 1,443 | | 1,981 | | 8,385 | | — | | 11,809 | | | | | | | |
| Contract production (GWh) | — | | 879 | | 5,244 | | — | | 6,123 | | — | | 928 | | 2,566 | | — | | 3,494 | | | | | | | |
| Merchant production (GWh) | 1,568 | | 1,004 | | 3,262 | | — | | 5,834 | | 1,443 | | 1,053 | | 5,819 | | — | | 8,315 | | | | | | | |
| Ancillary services volumes (GWh) | 2,934 | | 71 | | 852 | | — | | 3,857 | | 2,951 | | 36 | | 550 | | — | | 3,537 | | | | | | | |
| | | | | | | | | | | | | | | | |
Hedged volumes (GWh) | 1,206 | | 134 | | 7,313 | | — | | 8,653 | | 558 | | 136 | | 8,386 | | — | | 9,080 | | | | | | | |
| Production contracted or hedged (%) | 77 | % | 54 | % | 148 | % | — | % | 124 | % | 39 | % | 54 | % | 131 | % | — | % | 106 | % | | | | | | |
Hedged volumes as a percentage of gross installed capacity (%) | 17 | % | 2 | % | 23 | % | — | % | 19 | % | 8 | % | 2 | % | 26 | % | — | % | 20 | % | | | | | | |
| | | | | | | | | | | | | | | | |
Adjusted Revenues(2)(3) ($) | 338 | | 106 | | 812 | | 6 | | 1,262 | | 370 | | 105 | | 880 | | 5 | | 1,360 | | | | | | | |
Fuel ($) | (6) | | (13) | | (330) | | (1) | | (350) | | (6) | | (11) | | (297) | | (1) | | (315) | | | | | | | |
Purchased power ($) | (10) | | (2) | | (50) | | — | | (62) | | (7) | | (3) | | (60) | | — | | (70) | | | | | | | |
Carbon compliance costs(3) ($) | — | | (3) | | (81) | | (1) | | (85) | | — | | — | | (125) | | (1) | | (126) | | | | | | | |
Adjusted Gross Margin(2) ($) | 322 | | 88 | | 351 | | 4 | | 765 | | 357 | | 91 | | 398 | | 3 | | 849 | | | | | | | |
(1)Total production includes contract and merchant production and excludes ancillary services volumes.
(2)Revenues have been adjusted to exclude the impact of unrealized mark-to-market gains or losses. During the first quarter of 2025, our Adjusted Revenues and Adjusted Gross Margin composition was amended to exclude the impact of realized gain (loss) on closed exchange positions. Therefore, the Company has applied this composition to all previously reported periods.
(3)The intercompany sales of emission credits from the Hydro and Wind and Solar segments to the Gas segment are eliminated on consolidation in the Corporate segment. Refer to the "Non-IFRS and Supplementary Financial Measures" section of this MD&A.
| | | | | | | | |
M36 | TransAlta Corporation | 2025 Annual Report |
Year ended Dec. 31, 2025
Total production for the Alberta portfolio for the year ended Dec. 31, 2025 was 11,957 GWh, compared to 11,809 GWh in 2024. The increase of 148 GWh, or one per cent, was primarily due to:
•Higher contract production in the Gas segment due to the addition of the Heartland gas facilities in the fourth quarter of 2024; and
•Higher production from the Hydro segment due to higher water resource and the optimization of water supply to facilitate generation during higher demand periods; partially offset by
•Lower merchant production in the Gas segment due to higher dispatch optimization driven by lower market prices; and
•Lower production volumes in the Wind and Solar segment due to lower wind resource compared to the same period in 2024.
Ancillary services volumes for the year ended Dec. 31, 2025 were 3,857 GWh compared to 3,537 GWh in 2024. The increase of 320 GWh, or nine per cent, was primarily due to an increase in volumes in the Gas segment due to the addition of the Heartland facilities.
Hedged volumes for the year ended Dec. 31, 2025, decreased by five per cent compared to 2024, whereas merchant production decreased by 30 per cent. The Company deployed a defensive strategy to enter into financial hedges for the merchant portfolio at attractive margins in anticipation of the risk of lower prices in 2025. Realized gains and losses on financial hedges are included in Adjusted Revenues in the table above.
Adjusted Gross Margin for the Alberta portfolio for the year ended Dec. 31, 2025, was $765 million, compared to $849 million in 2024. The decrease of $84 million, or 10 per cent, was primarily due to:
•The impact of lower Alberta spot and ancillary services prices, and lower hedge prices;
•Lower merchant production in the Gas segment due to higher dispatch optimization driven by lower market prices; and
•An increase in the carbon price from $80 per tonne in 2024 to $95 per tonne in 2025;
•Higher fuel costs in the Gas segment due to higher natural gas prices; and
•Lower favourable contributions from the hedge positions settled in the year; partially offset by
•Positive contribution from the addition of the Heartland facilities in the Gas segment;
•Lower carbon compliance costs due to the use of internally generated and externally purchased emission credits to settle a portion of our GHG obligation in 2025 as well as a portion of the 2024 GHG obligation assumed in the Heartland acquisition and the favourable impact of increased production from lower-carbon-emitting cogeneration facilities; and
•Higher environmental and tax attributes revenue due to increased sales of emission credits to third parties and intercompany sales from the Hydro and Wind and Solar segments to the Gas segment.
| | | | | | | | |
| TransAlta Corporation | 2025 Annual Report | M37 |
The following table provides information for the Company's Alberta electricity portfolio:
| | | | | | | | | | | | | | | |
| | | |
| 3 months ended Dec. 31 | Year ended Dec. 31 | |
| 2025 | 2024 | 2025 | 2024 | |
| Alberta Market | | | | | |
| Spot power price average per MWh | 43 | | 52 | | 44 | | 63 | | |
| Natural gas price (AECO) per GJ | 2.15 | | 1.42 | | 1.61 | | 1.29 | | |
| Carbon compliance price per tonne | 95 | | 80 | | 95 | | 80 | | |
| Alberta Portfolio Results | | | | | |
Realized merchant power price per MWh(1) | 105 | | 110 | | 107 | | 109 | | |
| Hydro energy spot power price per MWh | 53 | | 78 | | 58 | | 91 | | |
Hydro ancillary services price per MWh | 35 | | 39 | | 38 | | 46 | | |
| Wind energy spot power price per MWh | 26 | | 26 | | 24 | | 35 | | |
Gas spot power price per MWh | 65 | | 75 | | 66 | | 86 | | |
Hedged power price average per MWh(2) | 73 | | 80 | | 70 | | 84 | | |
Hedged volume (GWh) | 2,060 | | 2,637 | | 8,653 | | 9,080 | | |
Fuel cost per MWh(3) | 48 | | 42 | | 41 | | 38 | | |
Carbon compliance cost per MWh(4) | 15 | | 16 | | 10 | | 15 | | |
(1)Realized merchant power price per MWh for the Alberta electricity portfolio is a supplementary financial measure and represents the average price realized as a result of the Company's merchant power sales and portfolio optimization activities. It is calculated as merchant revenues (excluding assets under long-term contract and ancillary revenues, but including the impact of gains and losses from derivatives and trading activities) for the reporting period divided by total merchant GWh produced during the reporting period.
(2)Hedged power price average per MWh is a supplementary financial measure and is calculated as the average sales price for all hedges and direct customer sales during the reporting period.
(3)Fuel cost per MWh is a supplementary financial measure and is calculated as total fuel costs for the facilities in Alberta divided by production from carbon-emitting generation in the Gas and Energy Transition segments.
(4)Carbon compliance per MWh is a supplementary financial measure and is calculated as total carbon compliance costs for the Gas and Energy Transition segments in Alberta divided by production from carbon-emitting generation in the Gas and Energy Transition segments.
The average spot power price per MWh in Alberta for the three months and year ended Dec. 31, 2025 decreased by $9 and $19 per MWh, respectively, compared to the same periods in 2024, primarily due to the addition of increased supply from renewables and combined-cycle gas facilities into the market and the impact of milder weather during the year.
The realized merchant power price per MWh of production for Alberta for the three months and year ended Dec. 31, 2025, decreased by $5 and $2 per MWh, respectively, compared to the same periods in 2024, primarily due to:
•Lower average spot power prices as explained above and lower hedge power prices compared to the same period in 2024; partially offset by
•Favourable hedge positions settling and production optimization, which generated positive contributions over settled spot prices in Alberta.
Fuel cost per MWh for the three months and year ended Dec. 31, 2025, increased by $6 and $3 per MWh, respectively, compared to the same periods in 2024, primarily due to higher natural gas prices.
Carbon compliance cost per MWh of production for the Alberta portfolio for the three months and year ended Dec. 31, 2025, decreased by $1 and $5 per MWh, respectively, compared to the same periods in 2024, primarily due to:
•A favourable impact on carbon compliance cost per MWh due to increased production from lower-carbon-emitting cogeneration facilities; partially offset by
•An increase in the carbon compliance price per tonne from $80 per tonne in 2024 to $95 per tonne in 2025.
Carbon compliance cost for the year ended Dec. 31, 2025 was further impacted by the use of a higher quantity of internally generated and externally purchased emission credits in the current period compared to the prior year to settle a portion of our GHG obligation and a portion of the 2024 GHG obligation assumed in the Heartland acquisition.
| | | | | | | | |
M38 | TransAlta Corporation | 2025 Annual Report |
Selected Quarterly Information
Our results are seasonal due to the nature of the electricity market and related fuel costs. Higher maintenance costs are often incurred in the spring and fall when electricity prices are expected to be lower, and electricity prices generally increase in the peak winter and summer months in our main markets due to increased heating and cooling loads. Margins are also typically impacted in the second quarter due to the volume of hydro production resulting
from spring runoff and rainfall in the Pacific Northwest, which impacts production at Centralia. Typically, hydroelectric facilities generate most of their electricity and revenues during the spring months when melting snow starts feeding watersheds and rivers. Inversely, wind speeds are historically greater during the cold winter months and lower in the warm summer months.
| | | | | | | | | | | | | | |
| | Q1 2025 | Q2 2025 | Q3 2025 | Q4 2025 |
| Revenues | 758 | | 433 | | 615 | | 599 | |
Gross margin | 432 | | 334 | | 353 | | 301 | |
OM&A | 173 | | 173 | | 179 | | 186 | |
Depreciation and amortization | 146 | | 150 | | 135 | | 148 | |
| | | | |
Earnings (loss) before income taxes | 49 | | (95) | | (53) | | (42) | |
| | | | |
| | | | |
Net earnings (loss) attributable to common shareholders | 46 | | (112) | | (62) | | (62) | |
Net earnings (loss) per share attributable to common shareholders, basic and diluted(1) | 0.15 | | (0.38) | | (0.20) | | (0.21) | |
| | | | |
| | | | |
| | | | |
| | | | | | | | | | | | | | |
| Q1 2024 | Q2 2024 | Q3 2024 | Q4 2024 |
| Revenues | 947 | | 582 | | 638 | | 678 | |
Gross margin | 584 | | 436 | | 384 | | 390 | |
| OM&A | 134 | | 144 | | 143 | | 234 | |
| Depreciation and amortization | 124 | | 131 | | 133 | | 143 | |
| Earnings (loss) before income taxes | 267 | | 94 | | 9 | | (51) | |
| Net earnings (loss) attributable to common shareholders | 222 | | 56 | | (36) | | (65) | |
Net earnings (loss) per share attributable to common shareholders, basic and diluted(1) | 0.72 | | 0.18 | | (0.12) | | (0.22) | |
| | | | |
| | | | |
(1)Basic and diluted earnings (loss) per share attributable to common shareholders is calculated in each period using the basic and diluted weighted average common shares outstanding during the period, respectively. As a result, the sum of the earnings (loss) per share for the four quarters making up the calendar year may sometimes differ from the annual earnings (loss) per share.
Operating results have been impacted by the following events:
•The acquisition of Heartland on Dec. 4, 2024; and
•The Mount Keith 132kV expansion in the first quarter of 2024 and the impact from the White Rock and Horizon Hill wind facilities which achieved commercial operation in the first half of 2024.
In addition to the items described above, revenues have been impacted by:
•Additional production from the Heartland facilities, which was more than offset by lower production from the Company's existing Gas facilities;
•Lower Alberta spot and hedged power prices in all quarters of 2025;
•Lower Mid-Columbia power prices in three quarters of 2025 and higher prices in the second quarter 2025;
•Higher Ontario spot power prices in all four quarters of 2025;
•The effects of unrealized mark-to-market gains and losses from hedging and derivative positions due to favourable and unfavourable changes in forward rates; and
•The effects of realized mark-to-market gains and losses on settled trades.
| | | | | | | | |
| TransAlta Corporation | 2025 Annual Report | M39 |
Gross Margin has been impacted by:
•Factors impacting revenues as described above;
•Lower purchased power costs driven by higher availability in the Energy Transition segment in the first, third and fourth quarters of 2025; partially offset by
•The impact from the addition of the Heartland facilities in all four quarters of 2025;
•Higher natural gas prices in the first, second and fourth quarters of 2025 and lower natural gas prices in the third quarter of 2025; and
•Higher costs of carbon per tonne, which increased from $80 in 2024 to $95 in 2025. In the second quarter of 2025, carbon compliance costs were reduced by $103 million due to using internally generated and externally purchased emission credits to settle a portion of our 2024 GHG obligation and a portion of the GHG obligation assumed in the Heartland acquisition. In the second quarter of 2024, carbon compliance costs were reduced by $42 million due to using internally generated and externally purchased emission credits to settle a portion of our 2023 GHG obligation.
OM&A has been impacted by:
•Higher spending to support strategic and growth initiatives in the first and second quarters of 2025 and in the third and fourth quarters of 2024, compared to same periods in the prior year;
•The impact from the Horizon Hill and White Rock wind facilities which achieved commercial operation in the first half of 2024;
•The addition of the Heartland facilities and associated corporate costs in all quarters of 2025 and part of the fourth quarter of 2024;
•Higher costs stemming from the planning, design and implementation of an upgrade to our ERP system in the first three quarters of 2025 and the fourth quarter of 2024; and
•In the fourth quarter of 2024, penalties assessed by the Alberta Market Surveillance Administrator for self-reported contraventions pertaining to Brazeau hydro ancillary services provided during 2021 and 2022.
Depreciation has been higher in all quarters of 2025 due to:
•An increase in depreciation due to the impact from the White Rock and Horizon wind facilities which achieved commercial operation in the first half of 2024; and
•The acquisition of Heartland in the fourth quarter of 2024; partially offset by
•Revision to the useful lives of certain facilities in the third quarter of 2024.
(Loss) earnings before income taxes have been impacted by the factors explained above and by asset impairment charges and reversals due to:
•A change in the decommissioning provisions for retired assets driven by changes in estimated cash flows and discount rates in the third and fourth quarters of 2024 and the third and fourth quarters of 2025;
•A change in the decommissioning provision for Centralia driven by a change in the timing of cash flow estimates in the fourth quarter of 2025; and
•Impairment, net of reversals, related to certain Wind and Solar facilities due to changes in expected production volumes and lower power price assumptions in the third quarter of 2025.
Net (loss) earnings attributable to common shareholders have been impacted by:
•Lower earnings in the first quarter of 2025 and higher losses in the second, third and fourth quarters of 2025 as explained above; and
•Lower net earnings and higher net losses attributable to non-controlling interests in all four quarters of 2025 primarily due to lower net earnings for TA Cogen resulting from lower merchant pricing in the Alberta market.
| | | | | | | | |
M40 | TransAlta Corporation | 2025 Annual Report |
Financial Condition
Balance Sheet Analysis
The following table highlights significant changes in the Consolidated Statements of Financial Position from Dec. 31, 2024 to Dec. 31, 2025.
| | | | | | | | | | | | |
| As at | Dec. 31, 2025 | Dec. 31, 2024 | Increase/(decrease) | |
| Total current assets | 1,336 | | 1,773 | | (437) | | |
| Total non-current assets | 7,325 | | 7,726 | | (401) | | |
| Total assets | 8,661 | | 9,499 | | (838) | | |
| | | | |
| Total current liabilities | 1,830 | | 2,569 | | (739) | | |
| Total non-current liabilities | 5,366 | | 5,087 | | 279 | | |
| Total liabilities | 7,196 | | 7,656 | | (460) | | |
| | | | |
| | | | |
Working Capital
The deficit of current assets over current liabilities, including the current portion of long-term debt and lease liabilities, was $494 million as at Dec. 31, 2025 (Dec. 31, 2024 – deficit of current assets over current liabilities of $796 million).
The deficit of current assets relative to current liabilities is primarily caused by the classification of exchangeable securities totaling $750 million as current liabilities because of Brookfield's conversion option that can be exercised at any time after Dec. 31, 2024, although there is no obligation to deliver cash equivalent resources and Brookfield cannot call for repayment. Refer to Note 26 of the consolidated financial statements for details.
The deficit as at Dec. 31, 2025 decreased from Dec. 31, 2024 primarily as a result of a decrease in the current portion of credit facilities, long-term debt and lease liabilities. On March 25, 2025, the Company repaid its $400 million variable rate term loan facility in advance of the scheduled maturity date of Sept. 7, 2025, with the proceeds received from the $450 million senior notes offering completed in the first quarter of 2025. For the working capital management discussion, refer to the "Financial Capital" section below.
Non-Current Assets
Non-current assets as at Dec. 31, 2025, were $7,325 million, a decrease of $401 million from $7,726 million as at Dec. 31, 2024, primarily due to:
•Lower property, plant and equipment (PP&E) resulting from depreciation of $547 million for the year ended Dec. 31, 2025, and higher foreign exchange losses on translation of the balances denominated in foreign currency to the presentation currency, partially offset by
capital additions of $249 million (refer to the "Capital Expenditures" section of this MD&A for more information); and
•Lower risk management assets due to changes in market pricing across multiple markets and changes in price forecasts; partially offset by
•Higher long-term financial assets due a term loan and a revolving facility made available to Nova, a developer of renewable energy projects.
Non-Current Liabilities
Non-current liabilities as at Dec. 31, 2025 were $5,366 million, an increase of $279 million from $5,087 million as at Dec. 31, 2024, mainly due to:
•Higher risk management liabilities due to forward price changes and volatility in market pricing across multiple markets; and
•An increase in credit facilities, long-term debt and lease liabilities due to the $450 million senior notes offering on March 24, 2025; partially offset by
•A decrease in decommissioning and other provisions due to liabilities settled, revisions in discount rates and estimated decommissioning costs; and
•A decrease in long-term debt due to scheduled principal repayments related to our bonds, senior notes and tax equity financing, as well as repayments, net of cash drawings under the syndicated credit facility.
On Dec. 22, 2025 the Company issued US$400 million of senior notes with a fixed annual coupon rate of 5.9 per cent, maturing on Feb. 1, 2034. The proceeds were used to redeem all of the outstanding 7.8 per cent US$400 million senior notes in advance of the scheduled maturity date of Nov. 15, 2029. Refer to "Financial Capital" and "Significant and Subsequent Events" sections of this MD&A.
| | | | | | | | |
| TransAlta Corporation | 2025 Annual Report | M41 |
Contractual Obligations
Refer to Note 36 Commitments and Contingencies in the consolidated financial statements for details. Material contractual obligations as at Dec. 31, 2025 are as follows:
| | | | | | | | | | | | | | | | | | | | | | | |
| | 2026 | 2027 | 2028 | 2029 | 2030 | 2031 and thereafter | Total |
Natural gas and transportation contracts(1) | 83 | | 67 | | 67 | | 63 | | 62 | | 350 | | 692 | |
Transmission(1) | 29 | | 31 | | 22 | | 20 | | 21 | | 114 | | 237 | |
| | | | | | | |
Long-term service agreements(1) | 55 | | 44 | | 21 | | 14 | | 15 | | 105 | | 254 | |
Operating leases(1,2) | 5 | | 2 | | 2 | | 2 | | 2 | | 59 | | 72 | |
Long-term debt(3) | 170 | | 331 | | 163 | | 343 | | 281 | | 2,199 | | 3,487 | |
Exchangeable securities(4) | — | | — | | — | | — | | — | | 750 | | 750 | |
| Principal payments on lease liabilities | 5 | | 5 | | 5 | | 5 | | 5 | | 121 | | 146 | |
Interest on long-term debt and lease liabilities(1)(5) | 179 | | 184 | | 167 | | 156 | | 138 | | 705 | | 1,529 | |
Interest on exchangeable securities(1)(4) | 53 | | 53 | | 53 | | 52 | | 53 | | 457 | | 721 | |
Growth(1) | 7 | | — | | 11 | | — | | — | | — | | 18 | |
| | | | | | | |
| Total | 586 | | 717 | | 511 | | 655 | | 577 | | 4,860 | | 7,906 | |
(1)Not recognized as a financial liability on the Consolidated Statements of Financial Position and excludes the impact of interest rate hedges.
(2)Includes leases that have not been recognized as a lease liability and leases that have not yet commenced.
(3)Excludes impact of hedge accounting and derivatives.
(4)The exchangeable debentures are due May 1, 2039 and the exchangeable preferred shares are perpetual. However, a cash payment could occur after Dec. 31, 2028, at the Company's option, if the exchangeable securities are not exchanged by Brookfield Renewable Partners or its affiliates (collectively Brookfield). At Brookfield's option, the exchangeable securities are currently exchangeable into an equity ownership interest in TransAlta’s Alberta Hydro Assets between Dec. 31, 2024 and Dec. 31, 2028.
(5)Interest on long-term debt is based on debt currently in place with no assumption as to refinancing on maturity.
Financial Capital
The Company is focused on maintaining a strong balance sheet and financial position to ensure access to sufficient financial capital. The Company expects the cash flow from operating activities to be sufficient to meet its obligations, support sustaining capital expenditures and fund dividends over both the short- and long-term. Given its financing track record in recent years, the Company has robust access to capital markets for future funding needs. The Company has a total of $2.2 billion committed capacity under its credit facilities as at Dec. 31, 2025, of which $1.3 billion remains available for short-term borrowings. Refer to the "Credit Facilities" section below for further details.
The Company manages working capital deficits through ongoing cash generation from operating activities, available credit facilities and access to capital markets.
Management continues to monitor liquidity and considers current leverage appropriate given the characteristics of the Company’s contracted and merchant assets.
Credit ratings provide information relating to the Company's financing costs, liquidity and operations, and affect the Company's ability to obtain short and long-term financing and/or the cost of such financing. Maintaining a strong balance sheet also allows the Company to enter into contracts with a variety of counterparties on terms and prices that are favourable to the Company’s financial results and provide TransAlta with better access to capital markets through commodity and credit cycles.
In 2025, Moody's reaffirmed the Company's long-term rating of Ba1 with a stable outlook. Morningstar DBRS reaffirmed the Company's issuer rating and unsecured debt/medium-term notes rating of BBB (low) and the Company's preferred shares rating of Pfd-3 (low), all with a stable outlook. In addition, S&P Global Ratings reaffirmed the Company's senior unsecured debt rating and issuer credit rating of BB+ with a stable outlook. Risks associated with our credit ratings are discussed in the "Risk Management" section of this MD&A.
| | | | | | | | |
M42 | TransAlta Corporation | 2025 Annual Report |
Capital Structure
Our capital structure consists of the following components as shown below:
| | | | | | | | | | | | | | | | | | | | | | |
| As at Dec. 31 | 2025 | | 2024 | |
| $ | % of total | $ | % of total | | |
| | | | | | | | |
Senior unsecured debt | 1,734 | | | 31 | | | 1,789 | | 29 | | | |
| | | | | | | | |
| | | | | | | | |
| | | | | | | | |
| Non-recourse debt | 1,471 | | | 26 | | | 1,575 | | 27 | | | |
| | | | | | | | |
| | | | | | | | |
| | | | | | | | |
| | | | | | | | |
| | | | | | | | |
| | | | | | | | |
| | | | | | | | |
| | | | | | | | |
| Recourse debt - OCP Bond | 166 | | | 3 | | | 192 | | 3 | | | |
| | | | | | | | |
Tax equity financing | 76 | | | 1 | | | 101 | | 1 | | | |
| Lease liabilities | 146 | | | 3 | | | 151 | | 2 | | | |
Credit facilities, long-term debt and lease liabilities(1) | 3,593 | | | 64 | | | 3,808 | | 62 | | | |
| Add: Exchangeable debentures | 350 | | | 6 | | | 350 | | 6 | | | |
| Add: Bank overdraft | — | | | — | | | 1 | | — | | | |
| Less: Cash and cash equivalents | (205) | | | (3) | | | (337) | | (6) | | | |
Less: TransAlta OCP LP restricted cash(2) | (17) | | | — | | | (17) | | — | | | |
| Less: Fair value of foreign exchange forward contracts on foreign-currency denominated debt | 4 | | | — | | | (7) | | — | | | |
Total Consolidated Net Debt(3)(4)(5) | 3,725 | | | 67 | | | 3,798 | | 62 | | | |
Exchangeable preferred securities(5) | 400 | | | 7 | | | 400 | | 7 | | | |
| Total equity | 1,465 | | | 26 | | | 1,843 | | 31 | | | |
| | | | | | | | |
| | | | | | | | |
| | | | | | | | |
| | | | | | | | |
| | | | | | | | |
| Total capital | 5,590 | | | 100 | | | 6,041 | | 100 | | | |
| | | | | | | | |
(1)Credit facilities, long-term debt and lease liabilities consist of current and non-current portions in the Consolidated Statements of Financial Position. For detailed breakdown refer to Note 25 of the Consolidated Statements of Financial Position.
(2)Principal portion of the TransAlta OCP LP restricted cash related to the TransAlta OCP LP bonds, as this cash is restricted specifically to repay the bonds.
(3)Total Consolidated Net Debt is a non-IFRS measure, which is not defined and has no standardized meaning under IFRS and may not be comparable to similar measures presented by other issuers. The most directly comparable IFRS measure is total credit facilities, long-term debt and lease liabilities. Refer to the "Non-IFRS and Supplementary Financial Measures" section of this MD&A for further discussion.
(4)Tax equity financing for the Skookumchuck wind facility, an equity-accounted joint venture, is not represented in these amounts.
(5)Total Consolidated Net Debt excludes the exchangeable preferred shares as they are considered equity with dividend payments for credit purposes.
We have enhanced liquidity and shareholder value through the following:
2025
•On Dec. 22, 2025, the Company issued US$400 million of senior notes with a fixed annual coupon rate of 5.9 per cent, maturing on Feb. 1, 2034. The notes are unsecured and rank equally in right of payment with all existing and future senior indebtedness and senior in right of payment to all future subordinated indebtedness. The notes were issued at 99.4 per cent of par value, resulting in proceeds of $541 million (US$393 million) and are callable in three years. Interest payments on the notes are made semi-annually, on Feb. 1 and Aug. 1, with the first payment commencing Aug. 1, 2026.
•On Dec. 22, 2025 the Company redeemed all of its outstanding 7.8 per cent US$400 million senior notes in advance of the scheduled maturity date of Nov. 15, 2029.
•During the year ended Dec. 31, 2025, the size of the syndicated credit facility was reduced from $1.95 to
$1.90 billion, and the maturity was extended by one year to June 30, 2029.
•During the year ended Dec. 31, 2025, the maturity of the bilateral credit facilities in the aggregate amount of $240 million were also extended by one year to June 30, 2027.
•On March 24, 2025, the Company issued $450 million of senior notes with a fixed annual coupon of 5.6 per cent, maturing on March 24, 2032. The notes are unsecured and rank equally in right of payment with all existing and future senior indebtedness and senior in right of payment to all future subordinated indebtedness. Interest payments on the notes are made semi-annually, on March 24 and Sept. 24.
•On March 25, 2025, the Company repaid its $400 million variable rate term loan facility in advance of the scheduled maturity date of Sept. 7, 2025, with the proceeds received from the $450 million senior notes offering.
| | | | | | | | |
| TransAlta Corporation | 2025 Annual Report | M43 |
•During the year ended Dec. 31, 2025, the Company purchased and cancelled 1,932,800 common shares at an average price of $12.42 per share through our NCIB program, for a total cost of $24 million.
2024
•During the year ended Dec. 31, 2024, the Company purchased and cancelled 13,467,400 common shares at an average price of $10.59 per share through our NCIB program, for a total cost of $143 million; and
•The Company assumed new credit facilities and letter of credit facilities as part of the Heartland acquisition.
Credit Facilities
The Company's credit facilities are summarized in Note 25 of the Consolidated Financial Statements.
The Company maintains a strong financial position, with $1.5 billion in liquidity as at Dec. 31, 2025. Credit facilities are the primary source of short-term liquidity after internally generated cash flow.
As at Dec. 31, 2025, the Company had total committed capacity of $2.2 billion, against which $606 million of letters of credit were issued and $98 million was drawn in cash. Under the $400 million non-committed capacity, the Company issued $223 million of fully backstopped letters of credit, which reduced the available capacity on the committed credit facilities. The Company is in compliance with all covenants under its credit facilities and all undrawn amounts are fully available.
In addition to the net $1.3 billion of remaining committed capacity, the Company held $205 million in cash and cash equivalents, resulting in total available liquidity of $1.5 billion as at Dec. 31, 2025.
TransAlta's debt has terms and conditions, including financial covenants, that are considered ordinary and customary. As at Dec. 31, 2025, the Company was in compliance with all of its debt covenants.
Non-Recourse Debt and Other
All non-recourse debt, the TransAlta OCP LP bond, and the Heartland credit facilities are subject to customary financing conditions and covenants that may restrict the Company’s ability to access funds generated by the facilities’ operations. Upon meeting certain distribution tests, typically performed once per quarter, the funds can be distributed by the subsidiary entities to their respective parent entity. These conditions include meeting a debt-service coverage ratio prior to distribution, which was met by these entities in the fourth quarter of 2025, with the exception of Windrise Wind LP. The funds in Windrise that have accumulated since the fourth quarter test will remain there until the next debt-service coverage ratio is
calculated in the first quarter of 2026. At Dec. 31, 2025, $101 million (Dec. 31, 2024 – $117 million) of cash was subject to these financial restrictions.
At Dec. 31, 2025, $8 million (AU$9 million) of funds held by TEC Hedland Pty Ltd. are not accessible by other corporate entities as the funds must be solely used by the project entities to pay major maintenance costs.
Additionally, certain non-recourse bonds require that reserve accounts be established and funded through cash held on deposit and/or by providing letters of credit.
Between 2026 and 2028, the Company has a total of $664 million of scheduled debt and tax equity repayments. The $750 million of exchangeable securities are exchangeable into an equity ownership interest in TransAlta’s Alberta Hydro Assets between Dec. 31, 2024 and Dec. 31, 2028.
Guarantee Contracts
We have obligations to issue letters of credit and cash collateral to secure potential liabilities to certain parties, including those related to potential environmental obligations, commodity risk management and hedging activities, pension plan obligations, construction projects and purchase obligations. At Dec. 31, 2025, we provided letters of credit totalling $829 million (2024 – $865 million) and cash collateral of $92 million (2024 – $124 million).
These letters of credit and cash collateral secure certain amounts included on our Consolidated Statements of Financial Position under risk management liabilities, defined benefit obligations and other long-term liabilities and decommissioning and other provisions. A decrease in the value of letters of credit outstanding as at Dec. 31, 2025 primarily relates to the changes in the contractual requirements under a third-party contract and a decrease in the letters of credit issued under the Heartland credit facilities.
U.S. Tax Equity Financing and Production Tax Credits
The Company owns equity interests in wind facilities that qualify for tax incentives available for renewable energy facilities in the U.S. Current U.S. tax law allows qualified wind energy projects to receive production tax credits (PTCs) that are earned for each MWh of generation during the first 10 years of the project's operation. To monetize tax incentives, the Company has partnered with Tax Equity Investors (TEIs) who invest in these facilities in exchange for a share of the tax incentives and cash. TransAlta accounts for the TEIs' interest as long-term debt, where cash distributions and allocations of tax incentives to the TEIs primarily reduce the long-term debt balance. Upon the TEIs achieving an agreed-upon after-tax investment return, the project flip point occurs (Flip Point). Prior to achieving the Flip Point, the TEIs are allocated substantially all of the
| | | | | | | | |
M44 | TransAlta Corporation | 2025 Annual Report |
taxable attributes, including PTCs produced and a proportion of cash. After the Flip Point has been reached,
the Company retains substantially all of the cash and the taxable income (losses) generated by the facility.
The following table outlines information regarding the Company's tax equity financing arrangements with PTC eligibility:
| | | | | | | | | | | | | | | | | | | | | | | | |
| Facility | Commercial operation date | Expected Flip Point | Initial TEI investment ($US) | Expected annual PTC ($US) | Expected annual Pay-go Contribution ($) | TEI allocation of cash distributions (pre-Flip Point) Undiscounted(1) ($US) | TEI allocation of taxable income and PTCs (pre-Flip Point) | |
| Lakeswind | 2014 | 2030 | 45 | | — | | — | | 11 | | 99 | % | |
| Big Level and Antrim | 2019 | 2029 | 126 | | 11 | | 2 | | 33 | | 99 | % | |
Skookumchuck(2) | 2020 | 2030 | 121 | | 11 | | — | | 14 | | 99 | % | |
| North Carolina Solar | 2021 | 2030 | 64 | | — | | — | | 3 | | — | % | |
| | | | | | | | |
| | | | | | | | |
| | | | | | | | |
(1)Cumulative expected cash distributions from Dec. 31, 2025 to the expected Flip Point.
(2)The Company has a 49 per cent interest in the Skookumchuck wind facility, which is treated as an equity investment under IFRS and our proportionate share of the net earnings is reflected as equity income on the statement of earnings under IFRS.
Returns to Providers of Capital
Interest Income and Interest Expense
The components of interest expense are disclosed in Note 10 of the Consolidated Financial Statements. Net Interest Expense in the reconciliation of our Adjusted EBITDA to our FFO and FCF is calculated as follows:
| | | | | | | | | | | | | | |
| 3 months ended Dec. 31, | Year ended Dec. 31 |
| 2025 | 2024 | 2025 | 2024 |
Interest expense | 81 | | 92 | | 347 | | 324 | |
Less: Interest Income | (10) | | (11) | | (28) | | (30) | |
Less: non-cash items(1) | (11) | | (17) | | (55) | | (63) | |
| | | | |
| | | | |
| | | | |
| | | | |
| | | | |
| | | | |
Net Interest Expense(2) | 60 | | 64 | | 264 | | 231 | |
(1)Non-cash items include accretion of provisions, financing cost amortization, interest paid in kind and other non-cash items.
(2)Net Interest Expense is a non-IFRS measure, is not defined and has no standardized meaning under IFRS and may not be comparable to similar measures presented by other issuers. Refer to the table above for detailed calculation.
Interest income for the three months and year ended Dec. 31, 2025 was comparable to the same period in 2024.
Interest expense for the three months ended Dec. 31, 2025 was lower compared to the same period in 2024, primarily due to lower interest on senior notes following their refinancing at lower interest rates during 2025 and the net gain on the early redemption of the US$400 million senior notes, partially offset by higher interest on debt with the addition of the Heartland term facility.
Interest expense for the year ended Dec. 31, 2025 was higher compared to the same period in 2024, primarily due to higher interest on debt driven by the addition of the Heartland term facility, and lower capitalized interest resulting from lower construction activity during 2025 compared to 2024, partially offset by lower interest on
senior notes due to the refinancing at lower interest rates during 2025 and a net gain on the early redemption of the US$400 million senior notes.
Share Capital
For details on Common and preferred shares issued and outstanding refer to Notes 28 and 29 of the Consolidated Financial Statements.
As at Feb.26, 2026 the outstanding number of common shares was 296.8 million. The outstanding number of preferred shares was as follows: Series A 9.6 million, Series B 2.4 million, Series C 10.0 million, Series D 1.0 million, Series E 9.0 million, Series G 6.6 million.
| | | | | | | | |
| TransAlta Corporation | 2025 Annual Report | M45 |
Cash Flows
The following table highlights significant changes in the Consolidated Statements of Cash Flows for the year ended Dec. 31, 2025 and Dec. 31, 2024:
| | | | | | | | | | | | | | |
| | |
| Year ended Dec. 31 | 2025 | | 2024 | Increase/ (decrease) |
Cash and cash equivalents, beginning of year | 337 | | | 348 | | (11) | |
| Provided by (used in): | | | | |
| Operating activities | 646 | | | 796 | | (150) | |
| Investing activities | (418) | | | (520) | | 102 | |
| Financing activities | (362) | | | (291) | | (71) | |
Effect of translation on foreign currency cash | 2 | | | 4 | | (2) | |
| | | | |
Cash and cash equivalents, end of year | 205 | | | 337 | | (132) | |
Cash Flow from Operating Activities
Cash from operating activities for the year ended Dec. 31, 2025, decreased compared to 2024, primarily due to the following:
| | | | | |
| Year ended Dec. 31 |
Cash flow from operating activities for the year ended Dec. 31, 2024 | 796 | |
Lower gross margin due to lower revenues, partially offset by lower carbon compliance and lower fuel and purchased power costs. | (87) | |
Higher OM&A due to the addition of the Heartland facilities and associated corporate costs; spending on strategic and growth initiatives, higher spending related to the planning, design and implementation of an ERP system upgrade and the impact from the White Rock and Horizon Hill wind facilities which achieved commercial operation in the first half of 2024, partially offset by lower Heartland acquisition-related transaction and restructuring costs, mainly comprising severance, legal and consulting fees. | (56) | |
| |
Lower current income tax expense due to a higher loss before income taxes in 2025 compared to earnings before income taxes in the same period in 2024. | 94 | |
| |
Higher interest expense primarily due to higher interest on debt driven by the addition of the Heartland term facility, and lower capitalized interest resulting from lower construction activity in 2025. | (23) | |
| Unfavourable change in non-cash operating working capital balances due to lower accounts payable and accrued liabilities and lower income taxes payable, partially offset by lower accounts receivable and lower collateral provided. | (35) | |
Settlement of Brazeau penalties related to 2024 assessment by the Alberta Market Surveillance Administrator for self-reported contraventions pertaining to hydro ancillary services provided during 2021 and 2022. | (33) | |
| Other non-cash items | (10) | |
Cash flow from operating activities for the year ended Dec. 31, 2025 | 646 | |
| | | | | | | | |
M46 | TransAlta Corporation | 2025 Annual Report |
Cash Flow Used in Investing Activities
Cash used in investing activities for the year ended Dec. 31, 2025, decreased compared to 2024, primarily due to the following:
| | | | | |
| Year ended Dec. 31 |
Cash flow used in investing activities for the year ended Dec. 31, 2024 | (520) | |
| |
| |
Increase in long-term financial assets during 2025 related to the Company's investment in Nova. | (145) | |
Lower additions to PP&E due to larger construction program in the year ended Dec. 31, 2024 compared to the current year. | 62 | |
Acquisition of Heartland in 2024. | 217 | |
| |
| |
Unfavourable change in non-cash investing working capital balances due to lower capital accruals. | (3) | |
| |
| |
Other(1) | (29) | |
| Cash flow used in investing activities for the year ended Dec. 31, 2025 | (418) | |
(1)Mainly includes finance lease payments, and proceeds on the sale of property plant and equipment offset by an increase in the restricted cash balance and other investing items.
Cash Flow Used in Financing Activities
Cash used in financing activities for the year ended Dec. 31, 2025, increased compared to 2024, primarily due to the following:
| | | | | |
| Year ended Dec. 31 |
| Cash flow used in financing activities for the year ended Dec. 31, 2024 | (291) | |
Repayment of US$400 million 7.8 per cent senior notes during the fourth quarter of 2025. | (573) | |
| Repayment of the $400 million variable rate term facility during the first quarter of 2025. | (400) | |
| Higher amount of long-term debt repayments during 2025 compared to prior year. | (175) | |
Issuance of US$400 million 5.9 per cent senior notes during the fourth quarter of 2025. | 541 | |
Issuance of $450 million 5.6 per cent senior notes during the first quarter of 2025. | 450 | |
| Lower repurchases of common shares under the NCIB in 2025 compared to prior year. | 119 | |
| Repayments, net of cash drawings under the syndicated credit facility. | (48) | |
Lower distributions paid to non-controlling interests due to lower net earnings. | 29 | |
Higher financing fees related to the issuance of new debt. | (7) | |
| |
| |
Other(1) | (7) | |
| Cash flow used in financing activities for the year ended Dec. 31, 2025 | (362) | |
(1)Consists of higher dividends paid on common shares, lower proceeds on issuance of common shares and lower realized gains on financial instruments, partially offset by a favourable change in non-cash financing working capital balances and lower payments under finance lease obligations.
| | | | | | | | |
| TransAlta Corporation | 2025 Annual Report | M47 |
Capital Expenditures
Sustaining capital and growth and development capital expenditures represent supplementary financial measures used to present our spending related to the safe and reliable operation of our existing facilities and the construction of projects, respectively. The sum of sustaining capital and growth and development capital
expenditures, adjusted for non-cash items and transfers, is equal to the additions to property, plant and equipment and intangible assets, and development capital expenditures during the period in the consolidated statement of cash flows.
Sustaining Capital Expenditures
We are in a long-cycle business that requires significant capital expenditures. Our goal is to undertake sustaining capital expenditures that ensure our facilities operate reliably and safely. Sustaining capital are capital
expenditures incurred for major maintenance to sustain the existing capacity or production of the existing asset to the end of its useful life.
The Company's sustaining capital expenditures by segment are summarized in the table below:
| | | | | | | | | | | | | | | |
| 3 months ended Dec. 31 | Year ended Dec. 31 | |
| 2025 | 2024 | 2025 | 2024 | |
| Hydro | 14 | | 22 | | 46 | | 56 | | |
| Wind and Solar | 6 | | 8 | | 24 | | 20 | | |
| Gas | 22 | | 32 | | 78 | | 52 | | |
| Energy Transition | — | | — | | — | | 12 | | |
| | | | | |
| Corporate | 3 | | 5 | | 14 | | 2 | | |
Sustaining capital expenditures | 45 | | 67 | | 162 | | 142 | | |
Total sustaining capital expenditures for the three months ended Dec. 31, 2025 were $22 million lower compared to the same period in 2024, primarily due to:
•Lower major maintenance for our Canadian gas facilities due to timing of spend; and
•Lower major maintenance at our Hydro facilities in Alberta due to timing of spend.
Total sustaining capital expenditures in 2025 were $20 million higher compared to 2024, primarily due to:
•Higher major maintenance for our Canadian gas facilities due to timing of spend and the addition of maintenance for the gas facilities acquired from Heartland;
•Higher major maintenance in the Wind and Solar segment; partially offset by
•No major maintenance occurring in the Energy Transition segment in the current period; and
•Lower major maintenance at our Hydro facilities in Alberta due to timing of spend.
Total sustaining capital expenditures for the year ended Dec. 31, 2024 were also impacted by the receipt of a lease incentive related to the Company's head office during the first quarter of 2024, included in the Corporate segment.
| | | | | | | | |
M48 | TransAlta Corporation | 2025 Annual Report |
Growth and Development Capital Expenditures
Growth and development expenditures are impacted by the timing and construction of projects within the development pipeline. Growth capital represents capital expenditures incurred that will add megawatts to the Company or will generate new incremental revenues and
consists of engineering, design, contracting, permitting, payroll and overhead expenditures that meet capitalization criteria.
The following table provides our growth and development spending by segment:
| | | | | | | | | | | | | | | |
| 3 months ended Dec. 31 | Year ended Dec. 31 | |
| 2025 | 2024 | 2025 | 2024 | |
| Hydro | 1 | | 3 | | 3 | | 9 | | |
| Wind and Solar | 34 | | 10 | | 33 | | 64 | | |
| Gas | 13 | | 21 | | 56 | | 59 | | |
| Energy Transition | 4 | | — | | 8 | | — | | |
| | | | | |
Growth and development expenditures | 52 | | 34 | | 100 | | 132 | | |
Growth and development expenditures for the three months ended Dec. 31, 2025 were higher compared to the same period in 2024, primarily due to:
•Higher spend in the Wind and Solar segment driven by the final completion payments for the Oklahoma wind facilities and the Garden Plain wind facility payment to a third-party contractor for a dispute arising during the construction phase; partially offset by
•Lower spend in the Gas segment primarily due to a completion of the capital maintenance at Sarnia caused by the plant outage during a portion of the fourth quarter in 2024.
Growth and development expenditures for the year ended Dec. 31, 2025 were lower compared to 2024, primarily due to:
•Lower spend for Wind and Solar as the majority of the growth projects achieved commercial operation in the first half of 2024; partially offset by
•Higher spend in the Energy Transition segment related to the Centralia conversion from coal to natural gas, which extends the operating life of the existing plant.
Refer to the "Strategic Priorities" section of this MD&A for more details.
| | | | | | | | |
| TransAlta Corporation | 2025 Annual Report | M49 |
Strategic Priorities
The Company remains focused on investing in electricity solutions that meet the evolving needs of customers and communities. Our strategy focuses on maximizing the value of our base business, including the effective operation of our diverse fleet, enhancing value with our unique marketing and trading capabilities, continuously optimizing our Alberta fleet and expanding our generating portfolio by adding strategic assets through M&A, redevelopment at our legacy generation sites and from our development pipeline. With a disciplined approach to capital allocation, we are well-positioned to create long-term shareholder value through opportunities in our core operating markets of Canada, the U.S. and Western Australia.
The Company continues to make strong progress on key strategic priorities, ensuring the business remains resilient, growth-focused and aligned with the evolving energy landscape.
Operate with Excellence to Maximize Value of Our Base Business
Safe, Reliable Operations
Safety is our core value, and safe production is the only production. The Company's safety driven operational strategy is built on our extensive operating history and the expertise of our team, enabling us to deliver our current and future operational commitments. We are also committed to continuous improvement and identifying additional ways to maximize operational efficiencies and reduce costs, which ultimately benefit our customers and increase shareholder value.
Optimize Alberta Fleet
In Alberta, the Company continues to proactively deploy hedging strategies and optimization activities to mitigate the impact of lower merchant power prices. The acquisition of Heartland Generation has significantly strengthened our Alberta portfolio, and our fleet is continuously optimized to address increasing volatility in supply and intermittency in Alberta. The Company is maximizing the value of its hydro fleet by enhancing its operational capabilities and flexibility.
The Company is also advancing initiatives to maximize the value of our existing thermal assets and meet the growing demand for data centre load as well as affordable and reliable power.
Enhance Financial Flexibility
The Company maintains a strong financial position, with $1.5 billion in liquidity as of Dec. 31, 2025, and a disciplined approach to capital allocation and cost control. The Company balances investments in growth, debt repayments and returns to shareholders through share repurchases and dividend payments. Reflecting confidence in the business, the annual common share dividend was increased by eight per cent to $0.28 per share, our seventh consecutive dividend increase, effective July 1, 2026.
Grow with Discipline to Maximize Value for Our Shareholders
Advance Legacy Site Projects
The Company is seeing considerable opportunities to support the build-out of the energy transition, inclusive of data centres, with innovative, reliable and affordable power solutions in our core operating jurisdictions of Alberta and Washington State, where we are actively pursuing accretive opportunities with existing and prospective customers. We believe that our current sites hold significant value and provide unique advantages to customers that can be realized through brownfield development.
Specifically, we are pleased to have announced a tolling agreement to progress a coal-to-gas conversion at Centralia, along with a memorandum of understanding to advance a data centre development in Alberta.
Pursue Accretive M&A
The Company will continue to pursue M&A opportunities, with a focus within our core jurisdictions that are accretive and complementary to our asset portfolio or can be enhanced through our energy marketing and trading business.
Develop Greenfield Projects
Development of greenfield projects is focused in our core jurisdictions and is diversified across fuel types and technologies. The Company's development pipeline provides optionality for attractive long-term growth that will increase shareholder value beyond opportunities that are present at our legacy sites.
| | | | | | | | |
M50 | TransAlta Corporation | 2025 Annual Report |
Growth
Over the course of 2024 and 2025, we refined our development pipeline to align with evolving regulatory and interconnection dynamics, while progressing opportunities at our legacy assets. The pipeline now includes 860 MW of mid-stage projects and 2,590 MW of early-stage projects. We remain focused on the redevelopment of existing thermal sites and pursuing greenfield and M&A opportunities in our core markets.
Early-Stage Development
Project feasibility is evaluated through initial assessments including market, technical, land and permitting evaluations. Milestones include securing key landowner control, establishment of interconnection access, transmission capacity, on-site resource measurement and initial stakeholder consultations. Projects are advanced to mid-stage development if a viable economic development path is identified.
The following table shows the pipeline of future growth projects currently under early-stage development:
| | | | | | | | | | | | | | | | | |
| Early-Stage Projects (MW) | Thermal Generation | Wind | Solar | Storage | Total |
| Various | 1,590 | | 465 | | 190 | | 345 | | 2,590 | |
Mid-Stage Development
Project scope and commercial structure are matured at mid-stage development. Key milestones include finalizing core technologies and location, securing full land control, progressing through the interconnection process, initiating
offtake negotiations, advancing environmental and regulatory applications, and preparing a Class 4 capital cost estimate. Successful completion of mid-stage development means a project is ready for detailed definition to support a final investment decision.
The following table shows the pipeline of future growth projects currently under mid-stage development:
| | | | | | | | | | | | | | | | | |
| Mid-Stage Projects (MW) | Thermal Generation | Wind | Solar | Storage | Total |
| Canada | — | | 100 | | — | | 20 | | 120 | |
U.S. | 700 | | — | | — | | — | | 700 | |
| Western Australia | — | | — | | 40 | | — | | 40 | |
| Total | 700 | | 100 | | 40 | | 20 | | 860 | |
Projects under Construction
Current projects under construction are financed through existing liquidity in the near term and we continue to explore permanent financing solutions on an asset-by asset basis.
The following projects have been approved by the Board of Directors, have executed Power Purchase Agreements (PPA) and are currently under construction or in the process of being commissioned:
| | | | | | | | | | | | | | | | | | | | | | | | | | | | | | | | | | | | |
| | | | Total project ($ millions) | | | | | |
| Project | Type | Region | MW | Estimated
spend | Spent to
date | Target
completion
date | PPA Term (years) | | | Status |
| | | | | | | | | | | | |
| | | | | | | | | | | | |
| | | | | | | | | | | |
| | | | | | | | | | | | |
| | | | | | | | | | | | |
| Western Australia | | | | | | | | | | | |
| | | | | | | | | | | | |
| Mount Keith West network upgrade | Transmission | WA | — | AU$40 | | — | AU$42 | AU$37 | Q1 2026 | 13 | | | •All major equipment delivered and installed •On-track to be completed in Q1 2026 |
Total(1) | | | — | $34 | — | $36 | | $36 | | | | | |
(1)Total estimated spend was converted using a Canadian dollar forward exchange rate for 2025. Spent to date was converted using the period-end closing rate.
| | | | | | | | |
| TransAlta Corporation | 2025 Annual Report | M51 |
Other Consolidated Analysis
Related-Party Transactions
In the normal course of operations, we enter into transactions on market terms with related parties, including consolidated and equity accounted entities, which have been measured at exchange value and are recognized in the consolidated financial statements, including, but not limited to power purchase and derivative contracts. Refer to Note 35, Related-Party Transactions in the consolidated financial statements for further details.
Commitments
Refer to Note 36 Commitments and Contingencies in the consolidated financial statements for further details.
Contingencies
TransAlta is occasionally named as a party in various claims and legal and regulatory proceedings that arise during the normal course of its business. TransAlta reviews
each of these claims, including the nature of the claim, the amount in dispute or claimed and the availability of insurance coverage. There can be no assurance that any particular claim will be resolved in the Company’s favour or that such claims may not have a material adverse effect on TransAlta. Inquiries from regulatory bodies may also arise in the normal course of business, to which the Company responds as required.
The Company conducts internal reviews of its offers and offer behaviour in both the energy and ancillary services markets in Alberta on an ongoing basis and will self-report suspected contraventions or respond to inquiries from regulatory agencies as required. There currently is no certainty that any particular matter will be resolved in the Company’s favour or that such matters may not have a material adverse effect on TransAlta.
Refer to Note 36 Commitments and Contingencies in the consolidated financial statements for further details.
Selected Annual Information
| | | | | | | | | | | | | |
| | | |
| Year ended and as at Dec. 31 | | | 2025 | 2024 | 2023 |
| Revenues | | | 2,405 | | 2,845 | | 3,355 | |
| | | | | |
| | | | | |
| | | | | |
| (Loss) earnings before income taxes | | | (141) | | 319 | | 880 | |
| | | | | |
| Net (loss) earnings attributable to common shareholders | | | (190) | | 177 | | 644 | |
| Net (loss) earnings per share attributable to common shareholders, basic and diluted | | | (0.64) | | 0.59 | | 2.33 | |
| Total assets | | | 8,661 | | 9,499 | | 8,659 | |
| Total non-current liabilities | | | 5,366 | | 5,087 | | 5,253 | |
| Dividends declared per common share | | | 0.26 | | 0.24 | | 0.22 | |
| Dividends declared per preferred share: | | | 1.36 | | 1.36 | | 1.33 | |
| Series A | | | 0.72 | | 0.72 | | 0.72 | |
| Series B | | | 1.16 | | 1.60 | | 1.72 | |
| Series C | | | 1.46 | | 1.46 | | 1.46 | |
| Series D | | | 1.42 | | 1.87 | | 1.99 | |
| Series E | | | 1.72 | | 1.72 | | 1.72 | |
| Series G | | | 1.69 | | 1.47 | | 1.25 | |
Series I(1) | | | 70.00 | | 70.00 | | 70.00 | |
| | | | | |
(1)The Series I Preferred Shares are accounted for as long-term debt. Refer to Note 26 for further details.
Refer to "Financial Performance Review of Consolidated Information" and "Selected Quarterly Information" sections of this MD&A for the factors impacting the years ended Dec. 31, 2025 and 2024.
| | | | | | | | |
M52 | TransAlta Corporation | 2025 Annual Report |
Revenues totalled $2,845 million for the year ended Dec. 31, 2024, a decrease of $510 million, or 15 per cent, compared to 2023, primarily due to:
•Lower merchant spot and hedged power prices across markets; partially offset by
•Commercial operation of the White Rock and Horizon Hill wind facilities, the Northern Goldfields solar facilities, the Mount Keith 132kV expansion and return to service of the Kent Hills wind facilities; and
•Higher revenue due to the acquisition of Heartland in the fourth quarter of 2024.
Earnings before income taxes for the year ended Dec. 31, 2024 decreased by $561 million, or 64 per cent, compared to 2023, primarily due to:
•The factors causing lower revenues above;
•Higher asset impairment charges related to an increase in the decommissioning provision on retired assets, driven by a decrease in discount rates and revisions in estimated decommissioning costs, and higher impairment charges related to development projects that are no longer proceeding;
•Higher OM&A due to Heartland acquisition-related transaction and restructuring costs, spending relating to planning and design work on a planned upgrade to our ERP system and penalties assessed by the Alberta Market Surveillance Administrator for self-reported contraventions pertaining to Hydro ancillary services provided during 2021 and 2022;
•Higher interest expense primarily due to lower capitalized interest resulting from lower construction activity in 2024 compared to 2023; partially offset by
•Lower fuel and purchased power costs due to lower Mid-Columbia prices on repurchases of power, lower fuel consumption due to higher dispatch optimization in the Gas segment in Alberta, higher economic dispatch in the Energy Transition segment and lower natural gas prices; and
•Lower depreciation expense due to revisions to useful lives of certain facilities in prior and current periods, partially offset by commercial operation of the White Rock and Horizon Hill wind facilities and return to service of the Kent Hills wind facilities.
Net earnings attributable to common shareholders for the year ended Dec. 31, 2024, decreased by $467 million, or 73 per cent, compared to 2023, primarily due to:
•The factors causing lower earnings before income taxes as explained above; partially offset by
•Lower net earnings attributable to non-controlling interests primarily due to lower net earnings for TA Cogen, resulting from lower merchant pricing in the Alberta market.
Total assets as at Dec. 31, 2024 increased by $840 million compared to Dec. 31, 2023 primarily due to the Heartland acquisition.
Total non-current liabilities as at Dec. 31, 2024 decreased by $166 million compared to Dec. 31, 2023 primarily due to:
•The exchangeable securities being classified as current liabilities; partially offset by
•An increase in non-current liabilities due to the acquisition of Heartland.
Non-IFRS and Supplementary Financial Measures
We use a number of financial measures to evaluate our performance and the performance of our business segments, including measures and ratios that are presented on a non-IFRS basis, as described below. Unless otherwise indicated, all amounts are in Canadian dollars and have been derived from our consolidated financial statements prepared in accordance with IFRS. We believe that these non-IFRS amounts, measures and ratios, read together with our IFRS amounts, provide readers with a better understanding of how management assesses results.
Non-IFRS amounts, measures and ratios do not have standardized meanings under IFRS. They are unlikely to be comparable to similar measures presented by other companies and should not be viewed in isolation from, as an alternative to, or more meaningful than our IFRS results.
We calculate adjusted measures by adjusting certain IFRS measures for certain items that we do not believe reflect
our ongoing operations in the period. Except as otherwise described, these adjusted measures are calculated on a consistent basis from period to period and are adjusted for specific items in each period, unless stated otherwise.
Non-IFRS Financial Measures
Adjusted EBITDA, Adjusted Revenues, Adjusted Fuel and Purchased Power, Adjusted Gross Margin, Adjusted OM&A, Adjusted Net Other Operating Income, Adjusted (Loss) Earnings before Income Taxes, Adjusted Net (Loss) Earnings after Income Taxes Attributable to Common Shareholders, FFO, FCF, Total Consolidated Net Debt, Adjusted Net Debt and Net Interest Expense are non-IFRS measures that are presented in this MD&A. This section provides additional information on these non-IFRS measures, including their reconciliation to the most comparable IFRS measure.
| | | | | | | | |
| TransAlta Corporation | 2025 Annual Report | M53 |
Adjusted EBITDA
Each business segment assumes responsibility for its operating results measured by Adjusted EBITDA. Adjusted EBITDA is an important metric for management that represents our core operational results.
During the first quarter of 2025, our Adjusted EBITDA composition was amended to remove the impact of realized gain (loss) on closed exchange positions, which was included in Adjusted EBITDA composition until the fourth quarter of 2024. The adjustment was intended to explain a timing difference between our internally and externally reported results and was useful at a time when markets were more volatile. The impact of realized gain (loss) on closed exchange positions was removed to simplify our reporting. Accordingly, the Company has applied this composition to all previously reported periods.
During the first quarter of 2025, our Adjusted EBITDA composition was amended to remove the impact of Australian interest income, which was included in Adjusted EBITDA composition until the fourth quarter of 2024. Initially, on the commissioning of the South Hedland facility in July 2017, we prepaid approximately $74 million of electricity transmission and distribution costs. Interest income, which was recorded on the prepaid funds, was reclassified as a reduction in the transmission and distribution costs expensed each period to reflect the net cost to the business. The impact of Australian interest income was removed to simplify our reporting since the amounts were not material. Accordingly, the Company has applied this composition to all previously reported periods.
Interest, taxes, depreciation and amortization are not included, as differences in accounting treatment may distort our core business results. In addition, certain reclassifications and adjustments are made to better assess results, excluding those items that may not be reflective of ongoing business performance. This presentation may facilitate the readers' analysis of trends. The most directly comparable IFRS measure is earnings before income taxes.
The following are descriptions of the adjustments made to arrive at the non-IFRS measures:
Adjusted Revenue
Adjusted Revenues are revenues (the most directly comparable IFRS measure) adjusted to exclude:
•The impact of unrealized mark-to-market gains or losses and unrealized foreign exchange gains or losses on commodity transactions.
•Certain assets that we own in Canada and Western Australia are fully contracted and recorded as finance leases under IFRS. We believe that it is more appropriate to reflect the payments we receive under the contracts as a capacity payment in our revenues instead of as
finance lease income and a decrease in finance lease receivables.
•Revenues from the Required Divestitures as they do not reflect ongoing business performance.
•The Brazeau penalties in 2024, which were issued by the Alberta Market Surveillance Administrator for self-reported contraventions pertaining to Hydro ancillary services provided during 2021 and 2022. The penalties have been excluded from the Adjusted Revenues for the year ended Dec. 31, 2024 as they do not represent ongoing performance. In 2022 a provision of $20 million was initially recognized in revenue reflecting a potential disgorgement of revenue and $2 million for potential penalties and fines. The final assessment contained no disgorgement of revenue and penalties of $33 million. This resulted in a reversal of the original disgorgement provision in revenue in the year ended Dec. 31, 2024 and recognition of the full amount of the penalties assessed in OM&A.
Adjusted Fuel and Purchased Power
Adjusted Fuel and Purchased Power is fuel and purchased power (the most directly comparable IFRS measure) adjusted to exclude fuel and purchased power from the Required Divestitures as it does not reflect ongoing business performance.
Adjusted OM&A
Adjusted OM&A is OM&A (the most directly comparable IFRS measure) adjusted to exclude:
•Termination, restructuring and facility shutdown costs mainly for costs incurred as part of strategic decisions and facility shutdowns, and that do not represent ongoing business performance and are not reflective of the Company's ability to generate cash flows in the future. Termination, restructuring and facility shutdown costs mainly include termination, severance, inventory write downs and related costs.
•Acquisition-related transaction and restructuring costs, mainly comprising severance, legal and consultant fees as these do not reflect ongoing business performance.
•ERP integration costs representing planning, design and implementation costs of upgrades to the existing ERP system as they represent project costs that do not occur on a regular basis, and therefore do not reflect ongoing performance.
•OM&A from the Required Divestitures as it does not reflect ongoing business performance.
| | | | | | | | |
M54 | TransAlta Corporation | 2025 Annual Report |
•The Brazeau penalties in 2024, which were issued by the Alberta Market Surveillance Administrator for self-reported contraventions pertaining to Hydro ancillary services provided during 2021 and 2022. The penalties have been excluded from OM&A for the year ended Dec. 31, 2024 as it does not represent ongoing performance. The provision was initially recognized in 2022 based on an estimate and revised in 2024 based on the actual resolution of the matter.
Adjusted Net Other Operating Income
Adjusted Net Other Operating Income is net other operating income (the most directly comparable IFRS measure) adjusted to exclude:
•Insurance recoveries related to the Kent Hills replacement costs of the tower collapse as these relate to investing activities and are not reflective of ongoing business performance.
•The Sundance A decommissioning cost reimbursement in 2024 is not included as it relates to a settlement of a contingency for a facility that is no longer in operation. Refer to Note 8 from our consolidated financial statements for further details.
Additional Adjustments
Adjustments to Earnings (Loss) in Addition to Interest, Taxes, Depreciation and Amortization
•Fair value change in contingent consideration payable is not included as it is not reflective of ongoing business performance.
•Asset impairment charges and reversals are not included as these are accounting adjustments that impact depreciation and amortization and do not reflect ongoing business performance.
•Any gains or losses on asset sales or foreign exchange gains or losses are not included as these are not part of operating income.
Adjustments for Equity-Accounted Investments
During the fourth quarter of 2020, we acquired a 49 per cent interest in the Skookumchuck wind facility, which is treated as an equity investment under IFRS and our proportionate share of the net earnings is reflected as equity income on the statement of earnings under IFRS. As this investment is part of our regular power-generating operations, we have included our proportionate share of Adjusted EBITDA for the Skookumchuck wind facility in our total Adjusted EBITDA. In addition, in the Wind and Solar adjusted results, we have included our proportionate share of revenues and expenses to reflect the full operational results of this investment. We have not included Adjusted EBITDA of other equity-accounted investments in our total Adjusted EBITDA as it does not represent our regular power-generating operations.
Adjusted (Loss) Earnings before Income Taxes
Adjusted (loss) Earnings before Income Taxes represents segmented (loss) earnings adjusted for certain items that we believe do not reflect ongoing business performance and is an important metric for evaluating performance trends in each segment.
For details of the adjustments made to (loss) earnings before income taxes (the most directly comparable IFRS measure) to calculate Adjusted (Loss) Earnings before Income Taxes, refer to the "Reconciliation of Non-IFRS Measures on a Consolidated Basis by Segment" section of this MD&A.
Adjusted Net (Loss) Earnings Attributable to Common Shareholders
Adjusted Net (Loss) Earnings Attributable to Common Shareholders represents net (loss) earnings attributable to common shareholders adjusted for specific reclassifications and adjustments and their tax impact, and is an important metric for evaluating performance. For details of the reclassifications and adjustments made to net (loss) earnings attributable to common shareholders (the most directly comparable IFRS measure), please refer to the reconciliation of net (loss) earnings to Adjusted Net (Loss) Earnings attributable to common shareholders in the "Reconciliation of Non-IFRS Measures on a Consolidated Basis by Segment" section of this MD&A.
Adjusted Net (Loss) Earnings per Common Share Attributable to Common Shareholders
Adjusted Net (Loss) Earnings per Common Share Attributable to Common Shareholders is calculated as Adjusted Net (Loss) Earnings attributable to Common Shareholders divided by a weighted average number of common shares outstanding during the period. The measure is useful in showing the earnings per common share for our core operational results as it excludes the impact of items that do not reflect an ongoing business performance. Adjusted Net (Loss) Earnings Attributable per Common Share is a non-IFRS ratio and the most directly comparable IFRS measure is net (loss) income per common share attributable to common shareholders. Refer to the reconciliation of (loss) earnings before income taxes to Adjusted Net (Loss) Earnings Attributable to Common Shareholders in the "Reconciliation of Non-IFRS Measures on a Consolidated Basis by Segment" section of this MD&A.
| | | | | | | | |
| TransAlta Corporation | 2025 Annual Report | M55 |
Funds From Operations (FFO)
FFO is an important metric as it provides a proxy for cash generated from operating activities before changes in working capital and provides the ability to evaluate cash flow trends in comparison with results from prior periods. FFO is a non-IFRS measure. For a description of the adjustments made to cash flow from operating activities (the most directly comparable IFRS measure) to calculate FFO, refer to the "Reconciliation of Cash Flow from Operations to FFO and FCF" section of this MD&A.
Adjustments to Cash Flow from Operations
•FFO related to the Skookumchuck wind facility, which is treated as an equity-accounted investment under IFRS and equity income, net of distributions from joint ventures, is included in cash flow from operations under IFRS. As this investment is part of our regular power-generating operations, we have included our proportionate share of FFO.
•Payments received on finance lease receivables are reclassified to reflect cash from operations.
•We adjust for costs associated with acquisition-related transaction and restructuring costs that are not reflective of ongoing operations.
•We adjust for the items included in the cash flow from operating activities related to the decision in 2020 to accelerate being off-coal and the shutdown of the Highvale mine in 2021 (Clean energy transition provisions and adjustments).
•Penalties totalling $33 million were issued by the Alberta Market Surveillance Administrator for self-reported contraventions pertaining to ancillary services provided during 2021 and 2022 at our Brazeau hydro facility. The penalties were recognized in OM&A during the fourth quarter of 2024 and paid during the first quarter of 2025, and have been excluded from FFO composition as they do not reflect ongoing business performance.
•Sundance A decommissioning cost reimbursement in 2024 is not included as it relates to a settlement of a contingency for a facility that is no longer in operation.
•Other adjustments include payments/receipts for production tax credits, which are reductions to tax equity debt and include distributions from equity-accounted joint ventures.
Free Cash Flow (FCF)
FCF is an important metric as it represents the amount of cash that is available to invest in growth initiatives, make scheduled principal debt repayments, repay maturing debt, pay common share dividends or repurchase common shares, and it provides the ability to compare cash flow trends with results from prior periods. Changes in working capital are excluded so that FFO and FCF are not distorted by changes that we consider temporary in nature, reflecting, among other things, the impact of seasonal
factors and timing of receipts and payments. FCF is a non-IFRS measure. For a description of the adjustments made to cash flow from operating activities (the most directly comparable IFRS measure) to calculate FCF, refer to the "Reconciliation of Cash Flow from Operations to FFO and FCF" section of this MD&A.
Adjusted Net Debt
Adjusted Net Debt is calculated as a sum of current and non-current portions of credit facilities, long-term debt and lease liabilities, exchangeable debentures, 50 per cent of issued preferred shares and exchangeable preferred shares, less cash and cash equivalents, less the principal portion of TransAlta OCP restricted cash and fair value of hedging instruments on debt. Presenting this item from period to period provides management and investors with the ability to evaluate leverage trends more readily in comparison with prior periods’ results. The most directly comparable IFRS measure is total credit facilities, long-term debt and lease liabilities.
Total Consolidated Net Debt
Total consolidated debt is calculated as a sum of current and non-current portions of credit facilities, long-term debt and lease liabilities, exchangeable debentures, less principal portion of TransAlta OCP restricted cash. Total Consolidated Net Debt excludes the exchangeable preferred shares as they are considered equity with dividend payments for credit purposes. Presenting this item from period to period provides management and investors with the ability to evaluate leverage trends more readily in comparison with prior periods’ results. The most directly comparable IFRS measure is total credit facilities, long-term debt and lease liabilities; for reconciliation, refer to "Financial Capital" section of this MD&A.
Net Interest Expense
Net Interest Expense is calculated as total interest expense less total interest income and non-cash items. For detailed calculation refer to the table in the "Reconciliation of Adjusted EBITDA to FFO and FCF" section of this MD&A. Net Interest Expense is a proxy for the actual cash interest paid that approximates the cash outflow in the FFO and FCF calculation. The most directly comparable IFRS measure is total interest expense.
Adjusted Gross Margin
Adjusted Gross Margin is calculated as Adjusted Revenues less Adjusted Fuel and Purchased Power and carbon compliance costs, where adjustments to revenue or fuel and purchased power were applied as stated above. The Skookumchuck wind facility has been included on a proportionate basis in the Wind and Solar segment. The most directly comparable IFRS measure is gross margin in the consolidated statement of earnings.
| | | | | | | | |
M56 | TransAlta Corporation | 2025 Annual Report |
Non-IFRS Ratios
FFO per share, FCF per share and Adjusted Net Debt to Adjusted EBITDA are non-IFRS ratios that are presented in this MD&A. Refer to the "Reconciliation of Cash Flow from Operations to FFO and FCF" and "Key Non-IFRS Financial Ratios" sections of this MD&A for additional information.
FFO per Share and FCF per Share
FFO per share and FCF per share are calculated using the weighted average number of common shares outstanding during the period. FFO per share and FCF per share are non-IFRS ratios.
Supplementary Financial Measures
•Available liquidity
•Cash flow from operating activities per share
•Sustaining capital expenditures
•Growth and development expenditures
•Alberta Hydro Assets ancillary services revenues (total and revenues per MWh)
•Alberta Hydro Assets revenues (total and revenues per MWh)
•Other Hydro Assets revenues
•Other Hydro revenues
•Highvale mine reclamation spend
•Centralia mine reclamation spend
•Realized foreign exchange gain (loss)
•Unrealized foreign exchange gain (loss)
•The Alberta electricity portfolio metrics
•Realized merchant power price per MWh
•Hedged power price average per MWh
•Fuel cost per MWh
•Carbon compliance per MWh
| | | | | | | | |
| TransAlta Corporation | 2025 Annual Report | M57 |
Fourth Quarter Reconciliation of Non-IFRS Measures on a Consolidated Basis by Segment
The following table reflects Adjusted EBITDA by segment and provides reconciliation to loss before income taxes for the three months ended Dec. 31, 2025:
| | | | | | | | | | | | | | | | | | | | | | | | | | | | | | | | |
| Hydro | Wind & Solar(1) | Gas | Energy Transition | Energy
Marketing | Corporate | Total | Equity- accounted investments(1) | Reclass adjustments | IFRS financials |
| Revenues | 58 | | 58 | | 347 | | 110 | | 28 | | 5 | | 606 | | (7) | | — | | 599 | |
| Reclassifications and adjustments: | | | | | | | | | | |
Unrealized mark-to-market loss (gain) | 2 | | 83 | | (1) | | 5 | | 1 | | — | | 90 | | — | | (90) | | — | |
| | | | | | | | | | |
| Decrease in finance lease receivable | — | | 1 | | 6 | | — | | — | | — | | 7 | | — | | (7) | | — | |
| Finance lease income | — | | 1 | | 5 | | — | | — | | — | | 6 | | — | | (6) | | — | |
| | | | | | | | | | |
| | | | | | | | | | |
| Unrealized foreign exchange loss on commodity | — | | — | | 2 | | — | | 1 | | — | | 3 | | — | | (3) | | — | |
Adjusted Revenue | 60 | | 143 | | 359 | | 115 | | 30 | | 5 | | 712 | | (7) | | (106) | | 599 | |
| Fuel and purchased power | (4) | | (7) | | (161) | | (81) | | — | | (5) | | (258) | | — | | — | | (258) | |
| | | | | | | | | | |
| | | | | | | | | | |
| | | | | | | | | | |
| | | | | | | | | | |
| Carbon compliance | — | | (1) | | (39) | | — | | — | | — | | (40) | | — | | — | | (40) | |
Adjusted Gross Margin | 56 | | 135 | | 159 | | 34 | | 30 | | — | | 414 | | (7) | | (106) | | 301 | |
| OM&A | (16) | | (24) | | (69) | | (20) | | (9) | | (50) | | (188) | | 2 | | — | | (186) | |
| Reclassifications and adjustments: | | | | | | | | | | |
| Termination, restructuring and facility shutdown costs | — | | — | | 1 | | 2 | | — | | 12 | | 15 | | — | | (15) | | — | |
| | | | | | | | | | |
| | | | | | | | | | |
ERP integration costs | — | | — | | — | | — | | — | | 9 | | 9 | | — | | (9) | | — | |
| Acquisition-related transaction and restructuring costs | — | | — | | — | | — | | — | | 1 | | 1 | | — | | (1) | | — | |
| Adjusted OM&A | (16) | | (24) | | (68) | | (18) | | (9) | | (28) | | (163) | | 2 | | (25) | | (186) | |
| Taxes, other than income taxes | (1) | | (8) | | (6) | | — | | — | | 1 | | (14) | | — | | — | | (14) | |
| Net other operating (expense) income | — | | (1) | | 11 | | — | | — | | — | | 10 | | — | | — | | 10 | |
| | | | | | | | | | |
| | | | | | | | | | |
| | | | | | | | | | |
Adjusted EBITDA(2) | 39 | | 102 | | 96 | | 16 | | 21 | | (27) | | 247 | | | | |
| Depreciation and amortization | (12) | | (52) | | (69) | | (10) | | — | | (6) | | (149) | | 1 | | — | | (148) | |
| Equity income | — | | — | | — | | — | | — | | — | | — | | — | | 4 | | 4 | |
| Interest income | — | | — | | — | | — | | — | | 9 | | 9 | | 1 | | — | | 10 | |
| Interest expense | — | | — | | — | | — | | — | | (80) | | (80) | | (1) | | — | | (81) | |
Realized foreign exchange loss(3) | — | | — | | — | | — | | — | | (13) | | (13) | | — | | — | | (13) | |
Adjusted Earnings (Loss) before income taxes(2) | 27 | | 50 | | 27 | | 6 | | 21 | | (117) | | 14 | | | | |
| Reclassifications and adjustments above | (2) | | (85) | | (13) | | (7) | | (2) | | (22) | | (131) | | | | |
| Finance lease income | — | | 1 | | 5 | | — | | — | | — | | 6 | | — | | — | | 6 | |
Skookumchuk earnings reclass to Equity income(1) | — | | (4) | | — | | — | | — | | 4 | | — | | — | | — | | — | |
| | | | | | | | | | |
| Asset impairment reversals | — | | — | | — | | 65 | | — | | 3 | | 68 | | — | | — | | 68 | |
| Loss on sale of assets and other | — | | — | | (4) | | — | | — | | (5) | | (9) | | — | | — | | (9) | |
Unrealized foreign exchange gain(3) | — | | — | | — | | — | | — | | 10 | | 10 | | — | | — | | 10 | |
| | | | | | | | | | |
| Earnings (loss) before income taxes | 25 | | (38) | | 15 | | 64 | | 19 | | (127) | | (42) | | — | | — | | (42) | |
(1)The Skookumchuck wind facility has been included on a proportionate basis in the Wind and Solar segment.
(2)Adjusted EBITDA, Adjusted Earnings (Loss) before income taxes are non-IFRS measures, are not defined and has no standardized meaning under IFRS and may not be comparable to similar measures presented by other issuers. Refer to the "Additional IFRS Measures and Non-IFRS Measures" section of this MD&A.
(3)Realized and unrealized foreign exchange (loss) gain are supplementary financial measures. Refer to the "Non-IFRS and Supplementary Financial Measures" section of this MD&A for more details.
| | | | | | | | |
M58 | TransAlta Corporation | 2025 Annual Report |
The following table reflects Adjusted EBITDA by segment and provides reconciliation to loss before income taxes for the three months ended Dec. 31, 2024:
| | | | | | | | | | | | | | | | | | | | | | | | | | | | | | | | |
| Hydro | Wind & Solar(1) | Gas | Energy Transition | Energy
Marketing | Corporate | Total | Equity- accounted investments(1) | Reclass adjustments | IFRS financials |
| Revenues | 93 | | 104 | | 319 | | 155 | | 14 | | — | | 685 | | (7) | | — | | 678 | |
| Reclassifications and adjustments: | | | | | | | | | | |
| Unrealized mark-to-market (gain) loss | 4 | | 23 | | 26 | | (8) | | 19 | | — | | 64 | | — | | (64) | | — | |
| | | | | | | | | | |
| Decrease in finance lease receivable | — | | 1 | | 5 | | — | | — | | — | | 6 | | — | | (6) | | — | |
| Finance lease income | — | | 2 | | 3 | | — | | — | | — | | 5 | | — | | (5) | | — | |
Revenues from Required Divestitures | — | | — | | (1) | | — | | — | | — | | (1) | | — | | 1 | | — | |
Brazeau penalties | (20) | | — | | — | | — | | — | | — | | (20) | | — | | 20 | | — | |
| Unrealized foreign exchange gain on commodity | — | | — | | (1) | | — | | — | | — | | (1) | | — | | 1 | | — | |
Adjusted Revenues | 77 | | 130 | | 351 | | 147 | | 33 | | — | | 738 | | (7) | | (53) | | 678 | |
| Fuel and purchased power | (3) | | (8) | | (136) | | (102) | | — | | — | | (249) | | — | | — | | (249) | |
| Reclassifications and adjustments: | | | | | | | | | | |
Fuel and purchased power related to Required Divestitures | — | | — | | 1 | | — | | — | | — | | 1 | | — | | (1) | | — | |
| | | | | | | | | | |
| | | | | | | | | | |
| | | | | | | | | | |
Adjusted Fuel and Purchased Power | (3) | | (8) | | (135) | | (102) | | — | | — | | (248) | | — | | (1) | | (249) | |
| Carbon compliance | — | | — | | (39) | | — | | — | | — | | (39) | | — | | — | | (39) | |
Gross margin | 74 | | 122 | | 177 | | 45 | | 33 | | — | | 451 | | (7) | | (54) | | 390 | |
| OM&A | (47) | | (27) | | (67) | | (19) | | (7) | | (68) | | (235) | | 1 | | — | | (234) | |
| Reclassifications and adjustments: | | | | | | | | | | |
Brazeau penalties | 31 | | — | | — | | — | | — | | — | | 31 | | — | | (31) | | — | |
ERP integration costs | — | | — | | — | | — | | — | | 14 | | 14 | | — | | (14) | | — | |
Acquisition-related transaction and restructuring costs | — | | — | | — | | — | | — | | 16 | | 16 | | — | | (16) | | — | |
| Adjusted OM&A | (16) | | (27) | | (67) | | (19) | | (7) | | (38) | | (174) | | 1 | | (61) | | (234) | |
| Taxes, other than income taxes | (1) | | (3) | | (4) | | — | | — | | — | | (8) | | (1) | | — | | (9) | |
| Net other operating income | — | | 3 | | 10 | | 9 | | — | | — | | 22 | | — | | — | | 22 | |
| Reclassifications and adjustments: | | | | | | | | | | |
| | | | | | | | | | |
| Sundance A decommissioning cost reimbursement | — | | — | | — | | (9) | | — | | — | | (9) | | — | | 9 | | — | |
Adjusted Net Other Operating Income | — | | 3 | | 10 | | — | | — | | — | | 13 | | — | | 9 | | 22 | |
Adjusted EBITDA(2)(3) | 57 | | 95 | | 116 | | 26 | | 26 | | (38) | | 282 | | | | |
| Depreciation and amortization | (18) | | (55) | | (49) | | (18) | | — | | (4) | | (144) | | 1 | | — | | (143) | |
| Equity income | — | | — | | — | | — | | — | | (3) | | (3) | | — | | 5 | | 2 | |
| Interest income | — | | — | | — | | — | | — | | 11 | | 11 | | — | | — | | 11 | |
| Interest expense | — | | — | | — | | — | | — | | (93) | | (93) | | 1 | | — | | (92) | |
Realized foreign exchange loss(4) | — | | — | | — | | — | | — | | (15) | | (15) | | — | | — | | (15) | |
Adjusted Earnings (Loss) before income taxes(2) | 39 | | 40 | | 67 | | 8 | | 26 | | (142) | | 38 | | | | |
| Reclassifications and adjustments above | (15) | | (26) | | (33) | | 17 | | (19) | | (30) | | (106) | | — | | — | | — | |
| Finance lease income | — | | 2 | | 3 | | — | | — | | — | | 5 | | — | | — | | 5 | |
Skookumchuk earnings reclass to equity income(1) | — | | (5) | | — | | — | | — | | 5 | | — | | — | | — | | — | |
| Asset impairment charges | — | | 1 | | — | | (10) | | — | | (11) | | (20) | | — | | — | | (20) | |
| | | | | | | | | | |
Unrealized foreign exchange gain(4) | — | | — | | — | | — | | — | | 32 | | 32 | | — | | — | | 32 | |
| Earnings (loss) before income taxes | 24 | | 12 | | 37 | | 15 | | 7 | | (146) | | (51) | | — | | — | | (51) | |
(1)The Skookumchuck wind facility has been included on a proportionate basis in the Wind and Solar segment.
(2)Adjusted EBITDA, Adjusted Earnings (Loss) before income taxes are non-IFRS measures, are not defined, have no standardized meaning under IFRS and may not be comparable to similar measures presented by other issuers. Refer to the "Non-IFRS and Supplementary Financial Measures" section of this MD&A.
(3)During the first quarter of 2025, our Adjusted EBITDA composition was amended to exclude the impact of realized gain (loss) on closed exchange positions and Australian interest income. Therefore, the Company has applied this composition to all previously reported periods.
(4)Realized and unrealized foreign exchange (loss) gain are supplementary financial measures. Refer to the "Non-IFRS and Supplementary Financial Measures" section of this MD&A for more details.
| | | | | | | | |
| TransAlta Corporation | 2025 Annual Report | M59 |
Full-Year Reconciliation of Non-IFRS Measures on a Consolidated Basis by Segment
The following table reflects Adjusted EBITDA by segment and provides reconciliation to loss before income taxes for the year ended Dec. 31, 2025:
| | | | | | | | | | | | | | | | | | | | | | | | | | | | | | | | |
| Hydro | Wind & Solar(1) | Gas | Energy Transition | Energy
Marketing | Corporate | Total | Equity- accounted investments(1) | Reclass adjustments | IFRS financials |
| Revenues | 368 | | 227 | | 1,267 | | 495 | | 130 | | (61) | | 2,426 | | (21) | | — | | 2,405 | |
| Reclassifications and adjustments: | | | | | | | | | | |
| Unrealized mark-to-market (gain) loss | (4) | | 265 | | 26 | | 9 | | (8) | | — | | 288 | | — | | (288) | | — | |
| | | | | | | | | | |
| Decrease in finance lease receivable | — | | 3 | | 27 | | — | | — | | — | | 30 | | — | | (30) | | — | |
| Finance lease income | — | | 5 | | 18 | | — | | — | | — | | 23 | | — | | (23) | | — | |
| Revenues from Required Divestitures | — | | — | | (11) | | — | | — | | — | | (11) | | — | | 11 | | — | |
| | | | | | | | | | |
| Unrealized foreign exchange loss on commodity | — | | — | | 1 | | — | | — | | — | | 1 | | — | | (1) | | — | |
Adjusted Revenue | 364 | | 500 | | 1,328 | | 504 | | 122 | | (61) | | 2,757 | | (21) | | (331) | | 2,405 | |
| Fuel and purchased power | (20) | | (31) | | (549) | | (328) | | — | | (7) | | (935) | | — | | — | | (935) | |
| Reclassifications and adjustments: | | | | | | | | | | |
Fuel and purchased power related to Required Divestitures | — | | — | | 2 | | — | | — | | — | | 2 | | — | | (2) | | — | |
| | | | | | | | | | |
Adjusted Fuel and Purchased Power | (20) | | (31) | | (547) | | (328) | | — | | (7) | | (933) | | — | | (2) | | (935) | |
| Carbon compliance (costs) recovery | — | | (3) | | (115) | | — | | — | | 68 | | (50) | | — | | — | | (50) | |
Adjusted Gross Margin | 344 | 466 | | 666 | | 176 | | 122 | | — | | 1,774 | | (21) | | (333) | | 1,420 | |
| OM&A | (56) | | (106) | | (257) | | (75) | | (37) | | (185) | | (716) | | 5 | | — | | (711) | |
| Reclassifications and adjustments: | | | | | | | | | | |
| Termination, restructuring and facility shutdown costs | — | | — | | 1 | | 2 | | — | | 12 | | 15 | | — | | (15) | | — | |
| | | | | | | | | | |
OM&A related to Required Divestitures | — | | — | | 5 | | — | | — | | — | | 5 | | — | | (5) | | — | |
| | | | | | | | | | |
ERP integration costs | — | | — | | — | | — | | — | | 25 | | 25 | | — | | (25) | | — | |
| Acquisition-related transaction and restructuring costs | — | | — | | — | | — | | — | | 7 | | 7 | | | (7) | | — | |
| Adjusted OM&A | (56) | | (106) | | (251) | | (73) | | (37) | | (141) | | (664) | | 5 | | (52) | | (711) | |
| Taxes, other than income taxes | (3) | | (23) | | (21) | | (3) | | — | | (1) | | (51) | | 1 | | — | | (50) | |
| Net other operating income | — | | 3 | | 44 | | — | | — | | — | | 47 | | — | | — | | 47 | |
| Reclassifications and adjustments: | | | | | | | | | | |
| | | | | | | | | | |
| | | | | | | | | | |
| Insurance recovery | — | | (2) | | — | | — | | — | | — | | (2) | | — | | 2 | | — | |
Adjusted Net Other Operating Income | — | | 1 | | 44 | | — | | — | | — | | 45 | | — | | 2 | | 47 | |
Adjusted EBITDA(2) | 285 | 338 | | 438 | | 100 | | 85 | | (142) | | 1,104 | | | | |
| Depreciation and amortization | (38) | | (209) | | (266) | | (49) | | (2) | | (21) | | (585) | | 6 | | — | | (579) | |
| Equity income | — | | — | | — | | — | | — | | (2) | | (2) | | — | | 8 | | 6 | |
| Interest income | — | | — | | — | | — | | — | | 30 | | 30 | | (2) | | — | | 28 | |
| Interest expense | — | | — | | — | | — | | — | | (350) | | (350) | | 3 | | — | | (347) | |
Realized foreign exchange loss(3) | — | | — | | — | | — | | — | | (16) | | (16) | | — | | — | | (16) | |
Adjusted Earnings (Loss) before income taxes(2) | 247 | 129 | | 172 | | 51 | | 83 | | (501) | | 181 | | | | |
| Reclassifications and adjustments above: | 4 | | (271) | | (69) | | (11) | | 8 | | (44) | | (383) | | | | |
Finance lease income | — | | 5 | | 18 | | — | | — | | — | | 23 | | — | | — | | 23 | |
Skookumchuk earnings reclass to Equity income(1) | — | | (8) | | — | | — | | — | | 8 | | — | | — | | — | | — | |
Fair value change in contingent consideration payable | — | | — | | 37 | | — | | — | | — | | 37 | | — | | — | | 37 | |
Asset impairment (charges) reversals | — | | (20) | | (37) | | 74 | | — | | (4) | | 13 | | — | | — | | 13 | |
Loss on sale of assets and other | — | | — | | (1) | | — | | — | | (6) | | (7) | | — | | — | | (7) | |
Unrealized foreign exchange loss(3) | — | | — | | — | | — | | — | | (5) | | (5) | | — | | — | | (5) | |
Earnings (loss) before income taxes | 251 | (165) | | 120 | | 114 | | 91 | | (552) | | (141) | | — | | — | | (141) | |
(1)The Skookumchuck wind facility has been included on a proportionate basis in the Wind and Solar segment.
(2)Adjusted EBITDA, Adjusted Earnings (loss) before income taxes are non-IFRS measures, are not defined, have no standardized meaning under IFRS and may not be comparable to similar measures presented by other issuers. Refer to the "Non-IFRS and Supplementary Financial Measures" section of this MD&A.
(3)Realized and unrealized foreign exchange (loss) gain are supplementary financial measures. Refer to the "Non-IFRS and Supplementary Financial Measures" section of this MD&A for more details.
| | | | | | | | |
M60 | TransAlta Corporation | 2025 Annual Report |
The following table reflects Adjusted EBITDA by segment and provides reconciliation to earnings before income taxes for the year ended Dec. 31, 2024:
| | | | | | | | | | | | | | | | | | | | | | | | | | | | | | | | |
| Hydro | Wind & Solar(1) | Gas | Energy Transition | Energy
Marketing | Corporate | Total | Equity- accounted investments(1) | Reclass adjustments | IFRS financials |
| Revenues | 409 | | 357 | | 1,350 | | 616 | | 168 | | (34) | | 2,866 | | (21) | | — | | 2,845 | |
| Reclassifications and adjustments: | | | | | | | | | | |
Unrealized mark-to-market loss (gain) | 1 | | 84 | | (60) | | (36) | | 14 | | — | | 3 | | — | | (3) | | — | |
| | | | | | | | | | |
| Decrease in finance lease receivable | — | | 2 | | 19 | | — | | — | | — | | 21 | | — | | (21) | | — | |
| Finance lease income | — | | 6 | | 8 | | — | | — | | — | | 14 | | | (14) | | — | |
| Revenues from Required Divestitures | — | | — | | (1) | | — | | — | | — | | (1) | | — | | 1 | | — | |
| Brazeau penalties | (20) | | — | | — | | — | | — | | — | | (20) | | — | | 20 | | — | |
| Unrealized foreign exchange gain on commodity | — | | — | | (2) | | — | | — | | — | | (2) | | — | | 2 | | — | |
Adjusted Revenues | 390 | | 449 | | 1,314 | | 580 | | 182 | | (34) | | 2,881 | | (21) | | (15) | | 2,845 | |
| Fuel and purchased power | (16) | | (30) | | (475) | | (418) | | — | | — | | (939) | | — | | — | | (939) | |
| Reclassifications and adjustments: | | | | | | | | | | |
| Fuel and purchased power related to Required Divestitures | — | | — | | 1 | | — | | — | | — | | 1 | | — | | (1) | | — | |
Adjusted Fuel and Purchased Power | (16) | | (30) | | (474) | | (418) | | — | | — | | (938) | | — | | (1) | | (939) | |
Carbon compliance (costs) recovery | — | | — | | (145) | | (1) | | — | | 34 | | (112) | | — | | — | | (112) | |
Adjusted Gross Margin | 374 | | 419 | | 695 | | 161 | | 182 | | — | | 1,831 | | (21) | | (16) | | 1,794 | |
| OM&A | (86) | | (97) | | (198) | | (69) | | (36) | | (173) | | (659) | | 4 | | — | | (655) | |
| Reclassification and adjustments: | | | | | | | | | | |
| Brazeau penalties | 31 | | — | | — | | — | | — | | — | | 31 | | — | | (31) | | — | |
| ERP integration costs | — | | — | | — | | — | | — | | 14 | | 14 | | — | | (14) | | — | |
| Acquisition-related transaction and restructuring costs | — | | — | | — | | — | | — | | 24 | | 24 | | — | | (24) | | — | |
| Adjusted OM&A | (55) | | (97) | | (198) | | (69) | | (36) | | (135) | | (590) | | 4 | | (69) | | (655) | |
| Taxes, other than income taxes | (3) | | (16) | | (13) | | (3) | | — | | (1) | | (36) | | — | | — | | (36) | |
| Net other operating income | — | | 10 | | 40 | | 9 | | — | | — | | 59 | | — | | — | | 59 | |
| Reclassifications and adjustments: | | | | | | | | | | |
| Sundance A decommissioning cost reimbursement | — | | — | | — | | (9) | | — | | — | | (9) | | — | | 9 | | — | |
Adjusted Net Other Operating Income | — | | 10 | | 40 | | — | | — | | — | | 50 | | — | | 9 | | 59 | |
Adjusted EBITDA(2)(3) | 316 | | 316 | | 524 | | 89 | | 146 | | (136) | | 1,255 | | | | |
| Depreciation and amortization | (41) | | (198) | | (212) | | (66) | | (2) | | (18) | | (537) | | 6 | | — | | (531) | |
| Equity income | — | | — | | — | | — | | — | | (4) | | (4) | | — | | 9 | | 5 | |
| Interest income | — | | — | | — | | — | | — | | 32 | | 32 | | (2) | | — | | 30 | |
| Interest expense | — | | — | | — | | — | | — | | (328) | | (328) | | 4 | | — | | (324) | |
Realized foreign exchange loss(4) | — | | — | | — | | — | | — | | (22) | | (22) | | — | | — | | (22) | |
Adjusted earnings (loss) before income taxes(2) | 275 | | 118 | | 312 | | 23 | | 144 | | (476) | | 396 | | | | |
| Reclassifications and adjustments above | (12) | | (92) | | 35 | | 45 | | (14) | | (38) | | (76) | | | | |
| Finance lease income | — | | 6 | | 8 | | — | | — | | — | | 14 | | — | | — | | 14 | |
Skookumchuk earnings reclass to equity income(1) | — | | (9) | | — | | — | | — | | 9 | | — | | — | | — | | — | |
Asset impairment charges | — | | (4) | | — | | (24) | | — | | (18) | | (46) | | — | | — | | (46) | |
| Gain on sale of assets and other | — | | — | | — | | 2 | | — | | 2 | | 4 | | | — | | 4 | |
Unrealized foreign exchange gain(4) | — | | — | | — | | — | | — | | 27 | | 27 | | — | | — | | 27 | |
| Earnings (loss) before income taxes | 263 | | 19 | | 355 | | 46 | | 130 | | (494) | | 319 | | — | | — | | 319 | |
(1)The Skookumchuck wind facility has been included on a proportionate basis in the Wind and Solar segment.
(2)Adjusted EBITDA, Adjusted Earnings (Loss) before income taxes are non-IFRS measures, are not defined, have no standardized meaning under IFRS and may not be comparable to similar measures presented by other issuers. Refer to the "Non-IFRS and Supplementary Financial Measures" section of this MD&A.
(3)During the first quarter of 2025, our Adjusted EBITDA composition was amended to exclude the impact of realized gain (loss) on closed exchange positions and Australian interest income. Therefore, the Company has applied this composition to all previously reported periods.
(4)Realized and unrealized foreign exchange (loss) gain are supplementary financial measures. Refer to the "Non-IFRS and Supplementary Financial Measures" section of this MD&A for more details.
| | | | | | | | |
| TransAlta Corporation | 2025 Annual Report | M61 |
Reconciliation of (Loss) Earnings before Income Taxes to Adjusted Net (Loss) Earnings Attributable to Common Shareholders
The following table reflects reconciliation of (loss) earnings before income taxes to Adjusted Net (Loss) Earnings Attributable to Common Shareholders for the three months and the year ended Dec. 31, 2025 and Dec. 31, 2024:
| | | | | | | | | | | | | | | |
| | | |
| 3 months ended Dec. 31 | Year ended Dec. 31 | |
| (in millions of Canadian dollars except where noted) | 2025 | 2024 | 2025 | 2024 | |
(Loss) earnings before income taxes | (42) | | (51) | | (141) | | 319 | | |
| Income tax expense (recovery) | (2) | | (8) | | 17 | | 80 | | |
Net (loss) earnings | (40) | | (43) | | (158) | | 239 | | |
Net loss (earnings) attributable to non-controlling interests | 4 | | 4 | | 20 | | (10) | | |
Preferred share dividends | (26) | | (26) | | (52) | | (52) | | |
Net (loss) earnings attributable to common shareholders | (62) | | (65) | | (190) | | 177 | | |
| Adjustments and reclassifications (pre-tax): | | | | | |
| | | | | |
| | | | | |
| | | | | |
| | | | | |
| | | | | |
Adjustments and reclassifications to revenues | 106 | | 53 | | 331 | | 15 | | |
| | | | | |
| | | | | |
Adjustments and reclassifications to fuel and purchased power | — | | (1) | | 2 | | 1 | | |
| | | | | |
| | | | | |
| Adjustments and reclassifications to OM&A | 25 | | 61 | | 52 | | 69 | | |
| | | | | |
Adjustments and reclassifications to net other operating income | — | | (9) | | (2) | | (9) | | |
| Fair value change in contingent consideration payable (gain) | — | | — | | (37) | | — | | |
Finance lease income | (6) | | (5) | | (23) | | (14) | | |
| Asset impairment (reversals) charges | (68) | | 20 | | (13) | | 46 | | |
Loss (gain) on sale of assets and other | 9 | | — | | 7 | | (4) | | |
Unrealized foreign exchange (gain) loss(1) | (10) | | (32) | | 5 | | (27) | | |
Calculated tax expense on adjustments and reclassifications(2) | (13) | | (20) | | (75) | | (18) | | |
Adjusted Net (Loss) Earnings Attributable to Common Shareholders(3) | (19) | | 2 | | 57 | | 236 | | |
| Weighted average number of common shares outstanding in the period | 297 | | 298 | | 297 | | 302 | | |
Net (loss) income per common share attributable to common shareholders | (0.21) | | (0.22) | | (0.64) | | 0.59 | | |
Adjustments and reclassifications (net of tax) | 0.15 | | 0.22 | | 0.83 | | 0.19 | | |
Adjusted Net (Loss) Earnings per Common Share Attributable to Common Shareholders(3) | (0.06) | | — | | 0.19 | | 0.78 | | |
| | | | | |
(1)Unrealized foreign exchange (gain) loss is a supplementary financial measure. Refer to the "Non-IFRS and Supplementary Financial Measures" section of this MD&A for more details.
(2)Represents a theoretical tax calculated by applying the Company's consolidated effective tax rate of 23.3 per cent for the three months and year ended Dec. 31, 2025 (three months and year ended Dec. 31, 2024 — 23.3 per cent). The amount does not take into account the impact of different tax jurisdictions the Company's operations are domiciled and does not include the impact of deferred taxes.
(3)Adjusted Net (Loss) Earnings Attributable to Common Shareholders and Adjusted Net (Loss) Earnings per Common Share attributable to Common Shareholders are non-IFRS measures, are not defined, have no standardized meaning under IFRS and may not be comparable to similar measures presented by other issuers. The most directly comparable IFRS measures are net (loss) earnings attributable to common shareholders and net (loss) earnings per share attributable to common shareholders, basic and diluted. Refer to the "Non-IFRS and Supplementary Financial Measures" section of this MD&A for more details.
| | | | | | | | |
M62 | TransAlta Corporation | 2025 Annual Report |
Reconciliation of Cash Flow from Operations to FFO and FCF
The table below reconciles our cash flow from operating activities to our FFO and FCF:
| | | | | | | | | | | | | | | |
| | | |
| 3 months ended Dec. 31 | Year ended Dec. 31 | |
| 2025 | 2024 | 2025 | 2024 | |
Cash flow from operating activities(1) | 231 | | 215 | | 646 | | 796 | | |
| Change in non-cash operating working capital balances | (97) | | (97) | | (3) | | (38) | | |
| Cash flow from operations before changes in working capital | 134 | | 118 | | 643 | | 758 | | |
| Adjustments | | | | | |
Share of adjusted FFO from joint venture(1) | 2 | | 4 | | 6 | | 8 | | |
| Decrease in finance lease receivable | 7 | | 6 | | 30 | | 21 | | |
Brazeau penalties payment | — | | — | | 33 | | — | | |
| | | | | |
| Sundance A decommissioning cost reimbursement | — | | (9) | | — | | (9) | | |
| | | | | |
Acquisition-related transaction and restructuring costs | — | | 11 | | 8 | | 19 | | |
Other(2) | 19 | | 5 | | 29 | | 19 | | |
FFO(3) | 162 | | 135 | | 749 | | 816 | | |
| Deduct: | | | | | |
Sustaining capital expenditures(1) | (45) | | (67) | | (162) | | (142) | | |
Productivity capital expenditures | (1) | | (1) | | (1) | | (1) | | |
| Dividends paid on preferred shares | (12) | | (13) | | (52) | | (52) | | |
| Distributions paid to subsidiaries’ non-controlling interests | (8) | | (6) | | (11) | | (40) | | |
| Principal payments on lease liabilities | (3) | | (3) | | (4) | | (6) | | |
Other | — | | 1 | | (5) | | — | | |
FCF(3) | 93 | | 46 | | 514 | | 575 | | |
| Weighted average number of common shares outstanding in the period | 297 | | 298 | | 297 | | 302 | | |
| Cash flow from operating activities per share | 0.78 | | 0.72 | | 2.18 | | 2.64 | | |
FFO per share(3) | 0.55 | | 0.45 | | 2.52 | | 2.70 | | |
FCF per share(3) | 0.31 | | 0.15 | | 1.73 | | 1.90 | | |
(1)Includes our share of amounts for the Skookumchuck wind facility, an equity-accounted joint venture. Supplementary financial measure. Refer to the "Non-IFRS and Supplementary Financial Measures" section of this MD&A for more details.
(2)Other consists of production tax credits, which is a reduction to tax equity debt, distributions from an equity-accounted joint venture and other adjustments to OM&A that are not reflective of ongoing operations.
(3)These items are non-IFRS measures, which are not defined and have no standardized meaning under IFRS and may not be comparable to similar measures presented by other issuers. During the first quarter of 2025, our Adjusted EBITDA composition was amended to exclude the impact of realized gain (loss) on closed exchange positions and Australian interest income. Consequently the change had an impact on FFO and FCF. Therefore, the Company has applied this composition to all previously reported periods. Refer to the "Non-IFRS and Supplementary Financial Measures" section of this MD&A.
| | | | | | | | |
| TransAlta Corporation | 2025 Annual Report | M63 |
The table below provides a reconciliation of our Adjusted EBITDA to our FFO and FCF:
| | | | | | | | | | | | | | | |
| | | |
| 3 months ended Dec. 31 | Year ended Dec. 31 | |
| 2025 | 2024 | 2025 | 2024 | |
Adjusted EBITDA(1)(2) | 247 | | 282 | | 1,104 | | 1,255 | | |
| Provisions | (6) | | 2 | | (4) | | 10 | | |
Net Interest Expense(3) | (60) | | (64) | | (264) | | (231) | | |
Current income tax recovery (expense) | 8 | | (20) | | (49) | | (143) | | |
Realized foreign exchange loss(4) | — | | (20) | | — | | (27) | | |
Decommissioning and restoration costs settled | (8) | | (12) | | (39) | | (41) | | |
Other non-cash items(5) | (19) | | (33) | | 1 | | (7) | | |
FFO(2)(6) | 162 | | 135 | | 749 | | 816 | | |
| Deduct: | | | | | |
Sustaining capital(2)(4) | (45) | | (67) | | (162) | | (142) | | |
| Productivity capital | (1) | | (1) | | (1) | | (1) | | |
| Dividends paid on preferred shares | (12) | | (13) | | (52) | | (52) | | |
| Distributions paid to subsidiaries’ non-controlling interests | (8) | | (6) | | (11) | | (40) | | |
| Principal payments on lease liabilities | (3) | | (3) | | (4) | | (6) | | |
Other(7) | — | | 1 | | (5) | | — | | |
FCF(2)(6) | 93 | | 46 | | 514 | | 575 | | |
(1)Adjusted EBITDA is defined in the "Non-IFRS and Supplementary Financial Measures" section of this MD&A and reconciled to (loss) earnings before income taxes above. During the first quarter of 2025, our Adjusted EBITDA composition was amended to exclude the impact of realized gain (loss) on closed exchange positions and Australian interest income. Therefore, the Company has applied this composition to all previously reported periods.
(2)Includes our share of amounts for the Skookumchuck wind facility, an equity-accounted joint venture.
(3)Net Interest Expense is a non-IFRS measure, not defined and has no standardized meaning under IFRS and may not be comparable to similar measures presented by other issuers. Net Interest Expense includes interest expense less interest income and excludes non-cash items like financing amortization and accretion. Net Interest Expense reconciliation is available in "Financial Capital" section of this MD&A
(4)Supplementary financial measure. Refer to the "Non-IFRS and Supplementary Financial Measures" section of this MD&A for more details.
(5)Other non-cash items primarily consist of changes in deferred payments, contract assets and liabilities, onerous contracts and long-term incentive accruals.
(6)These items are non-IFRS measures, are not defined and have no standardized meaning under IFRS and may not be comparable to similar measures presented by other issuers. FFO and FCF are defined in the "Non-IFRS and Supplementary Financial Measures" section of this MD&A and reconciled to cash flow from operating activities above.
(7)Other consists of unsecured loan advanced by the Company's subsidiary, Kent Hills Wind LP to its 17 per cent partner.
| | | | | | | | |
M64 | TransAlta Corporation | 2025 Annual Report |
Key Non-IFRS Financial Ratios
The methodologies and ratios used by rating agencies to assess our credit rating are not publicly disclosed. We have developed our own definitions of ratios and targets to help evaluate the strength of our financial position.
These metrics and ratios are not defined and have no standardized meaning under IFRS and may not be comparable to those used by other entities or by rating agencies.
Adjusted Net Debt to Adjusted EBITDA
| | | | | | | | | | | | |
| (in millions of Canadian dollars except where noted) | | | | |
As at Dec. 31 | 2025 | | 2024 | |
Credit facilities, long-term debt and lease liabilities(1) | 3,593 | | | 3,808 | | |
Exchangeable debentures | 350 | | | 350 | | |
Less: Cash and cash equivalents | (205) | | | (337) | | |
Add: Bank overdraft | — | | | 1 | | |
Add: 50 per cent of issued preferred shares and exchangeable preferred shares(2) | 671 | | | 671 | | |
Other(3) | (13) | | | (24) | | |
Adjusted Net Debt(4) | 4,396 | | | 4,469 | | |
Adjusted EBITDA(5) | 1,104 | | | 1,255 | | |
Adjusted Net Debt to Adjusted EBITDA (times) | 4.0 | | | 3.6 | | |
(1)Consists of current and non-current portions of long-term debt, which includes lease liabilities and tax equity financing.
(2)Exchangeable preferred shares are considered equity with dividend payments for credit-rating purposes. For accounting purposes, they are accounted for as debt with interest expense in the consolidated financial statements. For purposes of this ratio, we consider 50 per cent of issued preferred shares, including exchangeable preferred shares, as debt.
(3)Includes principal portion of TransAlta OCP restricted cash ($17 million as at Dec. 31, 2025 and Dec. 31, 2024) and fair value of hedging instruments on debt (included in risk management assets and/or liabilities on the Consolidated Statements of Financial Position).
(4)The tax equity financing for the Skookumchuck wind facility, an equity-accounted joint venture, is not represented in this amount. Adjusted Net Debt is a non-IFRS measure, is not defined and has no standardized meaning under IFRS and may not be comparable to similar measures presented by other issuers. Presenting this item from period to period provides management and investors with the ability to evaluate earnings trends more readily in comparison with prior periods’ results. Refer to the "Non-IFRS and Supplementary Financial Measures" section of this MD&A.
(5)Last four quarters.
The Company's capital is managed using a net debt position. We use the Adjusted Net Debt to Adjusted EBITDA ratio as a measurement of financial leverage and to assess our ability to service debt. Our target for Adjusted Net Debt to Adjusted EBITDA is 3.0 to 4.0 times.
Our Adjusted Net Debt to Adjusted EBITDA ratio at Dec. 31, 2025 was higher compared to Dec. 31, 2024, due to lower Adjusted EBITDA for the year ended Dec. 31, 2025.
| | | | | | | | |
| TransAlta Corporation | 2025 Annual Report | M65 |
Material Accounting Policies, Accounting Changes and Critical Accounting Estimates
Material Accounting Policies and Accounting Changes
Our material accounting policies are described in Note 2 of the consolidated financial statements.
For a description of current and future accounting changes impacting our business, refer to Note 3 of the consolidated financial statements.
Critical Accounting Judgments and Estimates
The preparation of the Consolidated Financial Statements in accordance with IFRS requires management to apply judgment and to develop estimates and assumptions based on the conditions and information available as of the reporting date. These judgments, estimates, and assumptions influence the reported amounts of assets, liabilities, revenue, and expenses, and actual results may differ from those estimates.
Management reviews these judgments and estimates on a continuous basis. Any revisions are recognized in the period in which they are identified and in any subsequent periods impacted by the change. Refer to Note 2 of the consolidated financial statements for a description of our significant accounting judgments and key sources of estimation uncertainty. Additional detail regarding the estimates and judgments that have the most significant effect on the amounts recognized in the Consolidated Financial Statements is as follows:
Impairment of PP&E and Goodwill
An assessment is made at each reporting date as to whether there is any indication that an impairment loss may exist or that a previously recognized impairment loss may no longer exist or may have decreased. An impairment exists when the carrying amount of an asset exceeds its recoverable amount, which is the higher of its fair value less costs of disposal and its value in use. An impairment loss recognized in a prior period is reversed if there has been a change in the estimates used to determine the asset's recoverable amount.
During the year ended Dec. 31, 2025, internal valuations indicated that the carrying values of four wind facilities exceeded their fair value less costs of disposal primarily due to updated production profiles and lower power price assumptions, which unfavourably impacted estimated future cash flows and resulted in an impairment charge of $37 million. The recoverable amount of $363 million for these four facilities was estimated based on fair value less
costs of disposal using a discounted cash flow model and was categorized as a Level III fair value measurement. The discount rates used in the fair value measurements were in the range of 5.53 to 7.24 per cent.
During the year ended Dec. 31, 2025, the Company recognized impairment reversals for one wind facility and one solar facility, which had been previously impaired. The impairment reversals of $17 million were primarily due to changes in power price assumptions that favourably impacted estimated future cash flows. The recoverable amount of $233 million for these two facilities was estimated based on fair value less costs of disposal using a discounted cash flow model and was categorized as a Level III fair value measurement. The discount rates used in the fair value measurements were in the range of 6.10 to 7.24 per cent.
We assess goodwill for impairment annually or when events indicate potential impairment. Key assumptions in determining recoverable amounts include:
•Discount rates,
•Forecasts of electricity production for each facility, taking into consideration contracts for the sale of electricity, historical production, regional supply-demand balances and capital maintenance and expansion plans, and
•Forecasted sales prices for each facility, based on contract prices for facilities subject to long- or short-term contracts, forward price curves for merchant plants and regional supply-demand balances. Where forward price curves are not available for the duration of the facility’s useful life, prices are determined by extrapolation techniques using historical industry and company-specific data.
For the purposes of the 2025 goodwill impairment review, the Company determined the recoverable amounts of Hydro, Wind and Solar, Gas and Energy Marketing segments by calculating the fair value less costs of disposal using discounted cash flow projections. The recoverable amounts are based on the Company's long-range forecasts for the periods extending to the last planned asset retirement in 2072. The resulting fair value measurements are categorized within Level III of the fair value hierarchy. No impairment of goodwill arose for any segment. Refer to Notes 2(Q)(II), 7 and 22 of the Company's 2025 audited annual consolidated financial statements for further details.
| | | | | | | | |
M66 | TransAlta Corporation | 2025 Annual Report |
Fair Value of Level III Derivative Instruments
Some of the Company’s derivative instruments fall under Level III fair value classification because they are not traded on an active exchange or have terms that extend beyond the time period for which exchange-based quotes are available and require the use of internal valuation techniques or models to determine fair value.
We also hold commodity contracts extending beyond liquid trading periods. For these, forward prices are estimated using a combination of external and internal models, including discounting, which results in Level III classification. Fair values can fluctuate significantly with market conditions and may be favourable or unfavourable.
The effect of using reasonably possible alternative assumptions as inputs to valuation techniques for contracts included in the Level III fair value measurements at Dec. 31, 2025 is an estimated total upside of $144 million (2024 – $200 million) and total downside of $132 million (2024 – $146 million) impact to the carrying value of the financial instruments. Fair values are stressed for unobservable inputs, which can include variable volumes, unobservable prices and wind discounts, among other inputs. The variable volumes are stressed up and
down based on historically available production data. Prices are stressed for longer-term deals where there are no liquid market quotes using various internal and external forecasting sources to establish a high and a low price range. Wind discounts represent price to volume relationships and are stressed specific to each location.
The determination of the fair value of these contracts and derivative instruments can be complex and relies on judgments and estimates concerning future prices, volatility and liquidity, among other factors. These fair value estimates may not necessarily be indicative of the amounts that could be realized or settled and changes in these assumptions could affect the reported fair value of financial instruments. Fair values can fluctuate significantly and can be favourable or unfavourable depending on current market conditions. Judgment is also used to determine whether a highly probable forecasted transaction designated in a cash flow hedge is expected to occur based on the Company’s estimates of pricing and production to allow the future transaction to be fulfilled.
Refer to Notes 2(Q)(V) and Note 14(B)(I)(c)) of the Company's 2025 audited annual consolidated financial statements for further details.
Financial Instruments
Financial instruments are used for proprietary trading purposes and to manage our exposure to interest rates, commodity prices and currency fluctuations, as well as other market risks. We may currently use physical and financial swaps, forward sale and purchase contracts, futures contracts, foreign exchange contracts, interest rate swaps and options to achieve our risk management objectives. Some of our physical commodity contracts have been entered into and are held for the purposes of meeting our expected purchase, sale or usage requirements and, as such, are not considered financial instruments, and are not recognized as a financial asset or financial liability. Other physical commodity contracts that are not held for normal purchase or sale requirements, and derivative financial instruments are recognized on the Consolidated Statements of Financial Position and are accounted for using the fair value method of accounting. The initial recognition of fair value and subsequent changes in fair value can affect reported earnings in the period when the change occurs if hedge accounting is not elected. Otherwise, changes in fair value will generally not affect earnings until the financial instrument is settled.
Some of our financial instruments and physical commodity contracts qualify for, and are recorded under, hedge accounting rules. The accounting for those contracts, for which we have elected to apply hedge accounting, depends on the type of hedge. Our financial instruments are mainly used for cash flow hedges or non-hedges.
These categories and their associated accounting treatments are explained in further detail below.
For all types of hedges, we test for effectiveness at the end of each reporting period to determine if the instruments are performing as intended and hedge accounting can still be applied. The financial instruments we enter into are designed to ensure that future cash inflows and outflows are predictable. In a hedging relationship, the effective portion of the change in the fair value of the hedging derivative does not impact net earnings (loss), while any ineffective portion is recognized in net earnings (loss).
We have certain contracts in our portfolio that, at their inception, do not qualify for, or we have chosen not to elect to apply, hedge accounting. For these contracts, we recognize in net earnings (loss) mark-to-market gains and losses resulting from changes in forward prices compared to the price at which these contracts were transacted. These changes in price alter the timing of earnings recognition, but do not necessarily determine the final settlement amount received. The fair value of future contracts will continue to fluctuate as market prices change. The fair value of derivatives that are not traded on an active exchange, or extend beyond the time period for which exchange-based quotes are available, are determined using valuation techniques or models.
| | | | | | | | |
| TransAlta Corporation | 2025 Annual Report | M67 |
Cash Flow Hedges
Cash flow hedges are categorized as project, foreign exchange, interest rate or commodity hedges and are used to offset foreign exchange, interest rate and commodity price exposures resulting from market fluctuations.
Foreign currency forward contracts and cross-currency swaps may be used to hedge foreign exchange exposures resulting from anticipated contracts and firm commitments denominated in foreign currencies, primarily related to capital expenditures and currency exposures related to U.S. dollar denominated debt.
Physical and financial swaps, forward sale and purchase contracts, futures contracts and options may be used primarily to offset the variability in future cash flows caused by fluctuations in electricity and natural gas prices. Interest rate swaps may be used to convert the fixed interest cash flows related to interest expense on debt to floating rates and vice versa.
In a cash flow hedge, changes in the fair value of the hedging instrument (a forward contract or financial swap, for example) are recognized in risk management assets or liabilities and the related gains or losses are recognized in other comprehensive income or loss (OCI). These gains or losses are subsequently reclassified from OCI to net earnings (loss) in the same period as the hedged forecast cash flows impact net earnings (loss) and offset the losses or gains arising from the forecast transactions. For project hedges, the gains and losses reclassified from OCI are included in the carrying amount of the related PP&E.
Hedge accounting follows a principles-based approach for qualifying hedges that is aligned with an entity's approach to risk management. When we do not elect hedge accounting or when the hedge is no longer effective and does not qualify for hedge accounting, the gains or losses as a result of changes in prices, interest or exchange rates related to these financial instruments are recorded in net earnings (loss) in the period in which they arise.
Net Investment Hedges
Foreign-denominated long-term debt is used to hedge exposure to changes in the carrying values of our net investments in foreign operations that have a functional currency other than the Canadian dollar. Our net investment hedges using U.S. dollar denominated debt remain effective and in place. Gains or losses on these instruments are recognized and deferred in OCI and reclassified to net earnings (loss) on the disposal of the foreign operation. We also manage foreign exchange risk by matching foreign-denominated expenses with revenues, such as offsetting revenues from our U.S. operations with interest payments on our U.S. dollar denominated debt.
Non-Hedges
Financial instruments not designated as hedges are used for proprietary trading and to reduce commodity price, foreign exchange and interest rate risks. Changes in the fair value of financial instruments not designated as hedges are recognized in risk management assets or liabilities and the related gains or losses are recognized in net earnings (loss) in the period in which the change occurs.
Fair Values
The majority of fair values for our foreign exchange, interest rate, commodity hedges and non-hedge derivatives are calculated using adjusted quoted prices from an active market or inputs validated by broker quotes. We may enter into commodity transactions involving non-standard features for which market-observable data is not available. These transactions are defined under IFRS as Level III instruments. Level III instruments incorporate inputs that are not observable from the market and fair value is therefore determined using valuation techniques. Fair values are validated by using reasonably possible alternative assumptions as inputs to valuation techniques and any material differences are disclosed in the notes to the consolidated financial statements.
At Dec. 31, 2025, Level III instruments had a net liabilities carrying value of $312 million (2024 – net liabilities $234 million). The Level III liabilities increased in 2025 primarily due to unfavourable changes in market pricing across multiple markets driven by higher volatility, partially offset by an increase in long-term financial assets as a result of the Company making available a term loan and revolving facility to a developer of renewable energy projects and a decrease in the fair value of contingent consideration payable driven by updated expectations on the fair value less costs to sell on the Required Divestitures and derecognition of contingent consideration upon completion of the Required Divestitures. Our risk management profile and practices have not changed materially from Dec. 31, 2024.
Refer to the "Material Accounting Policies, Accounting Changes and Critical Accounting Estimates" section of this MD&A for further details regarding valuation techniques and Note 14 of the Company's 2025 audited annual consolidated financial statements for further details.
| | | | | | | | |
M68 | TransAlta Corporation | 2025 Annual Report |
Risk Management
Our business activities expose us to a variety of risks and opportunities including, but not limited to, regulatory changes, rapidly changing market dynamics and increased volatility in our key commodity markets. Our goal is to manage these risks and opportunities so that we are in a position to develop our business and achieve our goals while remaining reasonably protected from an unacceptable level of risk or financial exposure. We use a multi-level risk management oversight structure to manage the risks and opportunities arising from our business activities, the markets in which we operate and the political environments and structures with which we interact.
Risk Controls
Our risk controls have several key components:
Enterprise Tone
We strive to foster beliefs and actions that are true to and respectful of our many stakeholders. We do this by investing in communities where we live and work, operating and growing sustainably, putting safety first and being responsible to the many groups and individuals with whom we work.
Policies
We maintain a comprehensive set of enterprise-wide policies. These policies establish delegated authorities and limits for business transactions, and they allow for an exception approval process. Periodic reviews and audits are performed to ensure compliance with these policies. All employees and directors are required to sign the Corporate Code of Conduct on an annual basis.
Reporting
On a regular basis, residual risk exposures are reported to key decision-makers including the Board, the Audit, Finance and Risk Committee (AFRC), senior management and/or the Commodity Risk & Compliance Committee, as applicable. Reporting to this latter committee includes analysis of new risks, monitoring of status to risk limits, reviewing events that can affect these risks, and discussing and reviewing the status of actions to minimize risks. This monthly reporting provides for effective and timely risk management and oversight.
Whistleblower System
We have a process in place where employees, contractors, shareholders or other stakeholders may confidentially or anonymously report any potential legal or ethical concerns, including concerns relating to accounting, internal control accounting, auditing or financial matters, or concerns relating to alleged violations of any laws or our Corporate Code of Conduct. These concerns can be submitted confidentially and anonymously, either directly to the AFRC or through TransAlta’s toll-free telephone or online Ethics
Helpline. The AFRC Chair is immediately notified of any material complaints and, otherwise, the AFRC receives a report at every quarterly committee meeting on all findings related to any material complaints or complaints relating to accounting or financial reporting or alleged breaches in internal controls over financial reporting.
Value at Risk and Trading Positions
Value at risk (VaR) is one of the primary measures used to manage our exposure to market risk resulting from commodity risk management activities. VaR is calculated and reported on a daily basis. This metric describes the potential change in the value of our trading portfolio over a three-day period within a 95 per cent confidence level, resulting from normal market fluctuations.
VaR is a commonly used metric that is employed by industry to track the risk in commodity risk management positions and portfolios. Two common methodologies for estimating VaR are the historical variance/covariance and scenario analysis approaches. We estimate VaR using the historical variance/covariance approach. An inherent limitation of historical variance/covariance VaR is that historical information used in the estimate may not be indicative of future market risk. Stress tests are performed periodically to measure the financial impact to the trading portfolio resulting from potential market events, including fluctuations in market prices, volatilities of those prices and the relationships between those prices. We also employ additional risk mitigation measures. VaR at Dec. 31, 2025, associated with our proprietary commodity risk management activities was $1 million (2024 – $3 million). Refer to the "Risk Factors – Commodity Price Risk" section of this MD&A below for further discussion.
Risk Factors
Risk is an inherent factor of doing business. The following section addresses some, but not all, risk factors that could affect our future plans, performance, results or outcomes and our activities in mitigating those risks. These risks do not occur in isolation, but must be considered in conjunction with each other.
A reference herein to a material adverse effect on the Company means such an effect on the Company or its business, operations, financial condition, results of operations and/or its cash flows, as the context requires.
| | | | | | | | |
| TransAlta Corporation | 2025 Annual Report | M69 |
For some risk factors, we show the after-tax effect on net earnings (loss) of changes in certain key variables. The analysis is based on business conditions and production volumes in 2025. Each item in the sensitivity analysis assumes all other potential variables are held constant. While these sensitivities are applicable to the period and the magnitude of changes on which they are based, they may not be applicable in other periods, under other economic circumstances or for a greater magnitude of changes. The changes in rates should also not be assumed to be proportionate to earnings in all instances.
Equipment failure and the operation and maintenance of our facilities involve risks that may materially and adversely affect our business.
There is a risk of equipment failure or underperformance to our operations due to wear and tear, latent defect, design error or operator error, among other things, which could have a material adverse effect on our business. Although our generation facilities have generally operated in accordance with expectations, there can be no assurance that they will continue to do so. Our facilities are exposed to operational risks that can lead to outages and increased production risk that could have a material adverse effect on our business. Further, some of our generation facilities were constructed many years ago and may require significant capital expenditures to maintain peak reliability or operations. Newer facilities also require various levels of capital expenditures to maintain peak reliability or operations. There can be no assurance that our maintenance program will be able to detect potential failures in our facilities before they occur or eliminate all adverse consequences in the event of failure.
As well, we are exposed to procurement risk for specialized parts that may have long lead times. If we are unable to procure these parts when they are needed for maintenance activities, we could face an extended period where our equipment is unavailable to produce electricity. Further, if a manufacturer is unable or unwilling to provide satisfactory maintenance or warranty support on reasonable terms, we may have to enter into alternative arrangements with other providers or perform the services ourselves. These arrangements could be more expensive than our current arrangements and if we are unable to enter into satisfactory alternative arrangements, our inability to access technical expertise or parts could have a material adverse effect. TransAlta manages this risk with our capital spares policy.
While we maintain an inventory of, or otherwise make arrangements to obtain, spare parts to replace critical equipment and maintain insurance for property damage and business interruption to protect against certain operating risks, these protections may not be adequate to cover lost revenues or increased expenses and penalties
that could result if we were unable to operate our generation facilities at a level necessary to comply with our contracts. In addition, circumstances could arise whereby the Company may be obligated to produce power at a cost that exceeds the revenues generated from that production.
In addition, there can be no assurance that we will be able to restore equipment or assets that have reached the end of their useful lives.
Unexpected changes in the cost of maintenance or in the cost and durability of components for the Company's facilities may adversely affect the results of our operations.
Inflation or other increases in the Company's cost structure that are beyond the control of the Company could materially adversely impact our financial performance. Examples of such costs include, but are not limited to, unexpected increases in the cost of procuring materials and services required for maintenance activities, and unexpected replacement or repair costs associated with equipment underperformance or lower-than-anticipated durability.
Changes in the price of electricity may materially adversely affect our business.
A portion of our revenues are tied, either directly or indirectly, to the market price for electricity in the markets in which we operate, and in particular in the Alberta electricity market. Market electricity prices are impacted by a number of factors, including the strength of the economy, the available transmission capacity, the price of fuel that is used to generate electricity (and, accordingly, certain of the factors that affect the price of fuel described below), the management of generation, the amount of excess generating capacity relative to load in a particular market, the cost of controlling emissions and cost of carbon, the structure of the particular market, the availability of transmission (including from other jurisdictions), increased adoption of energy-efficiency and conservation initiatives, and weather conditions that impact electrical load. As a result, we cannot precisely predict future electricity prices and electricity price volatility (particularly lower Alberta electricity prices) that could have a material and adverse effect on us. Further, the Alberta market is the only fully deregulated electricity market in Canada and this market structure permits corporate offtakers to invest in new renewable generation in the province solely for environmental, social and governance reasons (i.e., to align with decarbonization goals) that may not align with supply and demand fundamentals. This could potentially result in an oversupply of intermittent electricity in the Alberta electricity market and could put downward pressure on electricity prices and contribute to significant price volatility in the near term.
| | | | | | | | |
M70 | TransAlta Corporation | 2025 Annual Report |
Our facilities and construction projects have structured agreements in their contracts around force majeure events that are beyond our control, but positions the organization to industry standards for insurance or contract claw back in costs. Such events could result in material adverse effects.
Our facilities, construction projects and operations are exposed to potential interruption and damage, or partial or full loss resulting from environmental disasters (e.g., floods, high winds, fires, ice storms, earthquakes and public health crises, such as pandemics and epidemics), other seismic activity and equipment failures. Climate change can also increase the frequency and severity of these extreme weather events. There can be no assurance that in the event of an earthquake, flood, cyclone, hurricane, tornado, tsunami, terrorist attack, act of war or other natural, man-made or technical catastrophe, all or some parts of our generation facilities and infrastructure systems will not be disrupted. The occurrence of a significant event that disrupts the ability of our power generation assets to produce power for an extended period, including events that preclude existing customers under PPAs from purchasing electricity, could have a material negative impact on our business. Our facilities, construction projects and operations could be exposed to the effects of severe weather conditions, natural and man-made disasters and other potentially catastrophic events. The occurrence of such an event may not release us from performing our obligations pursuant to PPAs or other agreements with third parties. In addition, many of our generation facilities are located in remote areas, which can make repair of damage costly or difficult to access. Catastrophic events, including public health crises, could result in volatility and disruption to global supply chains, disruption to global financial markets, trade and market sentiment, risks to employee health and safety, a slowdown or temporary suspension of operations in impacted locations, postponements in the initiation and/or completion of the Company's development or construction projects, and delays in the completion of services, any of which may result in the Company incurring penalties under contracts, additional costs or the cancellation of contracts.
Risks relating to TransAlta's development and growth projects and acquisitions may materially and adversely affect us.
Development and growth projects and acquisitions that we undertake may be subject to execution and capital cost risks, including, but not limited to, risks relating to regulatory approvals, third-party opposition, cost escalations, securing land rights, construction delays, shortages of raw materials, supply chain constraints, or skilled labour and capital constraints. The occurrences of these risks could have a material and adverse impact on us, our financial condition, our ability to operate and our cash flows.
Expansion of our business through development projects and acquisitions may place increased demands on our management, operating systems, internal controls and financial and physical resources. In addition, the process of integrating acquired businesses or development projects may involve unforeseen difficulties. Failure to successfully manage or integrate any acquired businesses or development projects could have a material adverse impact on us, our financial condition, our ability to operate and our cash flows. Further, we cannot make assurances that we will be successful in integrating any acquisition or that the commercial opportunities or operational synergies of any acquisition will be realized as expected.
We may pursue acquisitions in new markets that are subject to regulation by various foreign governments and regulatory authorities and to the application of foreign laws. Such foreign laws or regulations may not provide for the same type of legal certainty and rights, in connection with our contractual relationships in such countries, as are afforded to us currently, which may adversely affect our ability to receive revenues or enforce our rights in connection with any such foreign operations. In addition, the laws and regulations of some countries may limit our ability to hold a majority interest in some of the projects that we may acquire, thus limiting our ability to control the operation of such projects. Any existing or new operations may also be subject to significant political, economic and financial risks, which vary by country, and may include: (a) changes in government policies or personnel; (b) changes in general economic conditions; (c) restrictions on currency transfer or convertibility; (d) changes in labour relations; (e) political instability and civil unrest; (f) regulatory or other changes in the local electricity market; and (g) breach or repudiation of important contractual undertakings by governmental entities and expropriation and confiscation of assets and facilities for less than fair market value.
With respect to acquisitions, we cannot make assurances that we will identify suitable transactions or that we will have access to sufficient resources, through our credit facilities, the capital markets or otherwise, to pursue and complete any identified acquisition opportunities on a timely basis and at a reasonable cost. Any acquisition that we propose or complete would be subject to regulatory approvals and other normal commercial risks that could result in the transaction not being completed on the terms anticipated, on time, or at all. In the event we are unable to close a transaction that we've entered into, we may be subject to termination fees that could become payable to the vendor. An unavoidable level of risk remains regarding potential undisclosed or unknown liabilities relating to any acquisition. The existence of such undisclosed liabilities may have a material adverse impact on our business, financial condition, results of operations and cash flows.
| | | | | | | | |
| TransAlta Corporation | 2025 Annual Report | M71 |
We could suffer lost revenues or increased expenses and penalties if we are unable to operate our generation facilities at a level necessary to comply with our PPAs.
The ability of our facilities to generate the maximum amount of power or steam that can be sold under PPAs is an important determinant of our revenues. Under certain PPAs, if the facility is not capable of generating electricity or steam for the required availability in a given contract year, we may be required to make penalty payments to the purchaser, and in some cases this could give rise to termination rights. The payment of any such penalties or the termination of such PPAs could adversely affect our revenues and profitability.
We rely on access to parts and equipment from certain key suppliers and we may be adversely affected if these relationships are not maintained.
Our ability to compete and expand depends on having access, at a reasonable cost, to equipment, parts and components that are technologically and economically competitive with those used by our competitors. Although we have individual framework agreements with various suppliers, there can be no assurance that these relationships with suppliers will be maintained or not adversely affected. If they are not maintained, or are adversely affected, our ability to compete may be impaired due to lack of access or significant delays to the supply of equipment, parts or components.
We depend on certain joint venture, strategic and other partners that may have interests or objectives that conflict with our objectives and such differences could have a negative impact on us.
We have entered into various arrangements with communities or joint venture, strategic or other partners in connection with the operation of our facilities and assets. Certain of these partners may have or develop interests or objectives that are different from, or in conflict with, our objectives. Any such differences could have a negative impact on the Company's ability to realize the anticipated benefits of, or the anticipated increase in the value of facilities or assets subject to, these arrangements. We are sometimes required through the permitting and approval processes to notify and consult with various stakeholder groups, including landowners, Indigenous groups and municipalities. Any unforeseen delays in this process may negatively impact our ability to complete any given facility on time or at all and could result in write-offs or give rise to reputational harm.
Dam and dyke failures may result in lost generating capacity, increased maintenance and repair costs and other liabilities.
A natural or man-made disaster, and certain other events, including natural or induced seismic activity, could potentially cause dam failures at our hydroelectric facilities and various dam sites. The occurrence of dam or dyke failures at any of our facilities could result in a loss of generating capacity, damage to the environment or damages and harm to third parties or the public, and such failures could require us to incur significant expenditures of capital and other resources or expose us to significant liabilities for damages. There can be no assurance that our dam safety program will be able to detect potential dam failures prior to their occurrence or eliminate all adverse consequences in the event of failure. Other safety regulations could change from time to time, potentially impacting our costs and operations. Reinforcing all dams or dykes to enable them to withstand more severe events could require us to incur significant expenditures of capital and other resources. The consequences of dam or dyke failures could have a material adverse effect on us. This includes any increased risk of dam failure due to induced seismic activity triggered by hydraulic fracturing near our hydroelectric facilities, which could increase the risk of dam failure or require the Company to incur potentially significant capital investments to mitigate such risk and that would not otherwise be required.
The power generation industry has certain inherent risks related to worker health and safety, and the environment, that could cause us to suffer unanticipated expenditures or to incur fines, penalties or other consequences material to our business and operations.
The ownership and operation of our power generation assets carry an inherent risk of liability and reputational harm related to worker health and safety, and the environment, including the risk of government-imposed orders to remedy unsafe conditions and/or to remediate or otherwise address environmental contamination, potential penalties for contravention of health, safety and environmental laws, licences, permits and other approvals, and potential civil liability. Compliance with (and any future changes to) health, safety and environmental laws and the requirements of licences, permits and other approvals are expected to remain material to our business. The occurrence of any of these events or any changes, additions to, or more rigorous enforcement of health, safety and environmental laws, licences, permits or other approvals could have a significant impact on our operations and/or result in additional material expenditures. As a consequence, no assurances can be given that additional environmental and workers' health and safety issues relating to presently known or unknown matters will
| | | | | | | | |
M72 | TransAlta Corporation | 2025 Annual Report |
not require unanticipated expenditures, or result in fines, penalties or other consequences (including changes to operations) material to our business and operations.
Climate change and other variations in weather can affect demand for electricity and our ability to generate electricity.
Due to the nature of our business, our earnings are sensitive to weather variations from period to period, as well as long-term changes due to climate change. Variations in winter weather affect the demand for electrical heating requirements. Variations in summer weather affect the demand for electrical cooling requirements. These variations in demand can translate into electricity market price volatility. Variations in precipitation also affect water supplies, which in turn affect our hydroelectric assets. Also, variations in sunlight and wind conditions can have an effect on energy production levels from our solar and wind facilities. Typically, when winters are warmer or summers are cooler, demand for energy is lower than expected, resulting in less electricity consumption than forecasted and often resulting in lower than expected market prices for electricity. Conversely, when winters are colder or summers are warmer, market prices for natural gas or electricity tend to be higher; however, in these circumstances, if we have entered into hedges and are unable to produce or consume the amount of natural gas or electricity that we have hedged we could be required to purchase additional volumes at higher prices to cover our hedge position.
Our generation facilities and their operations are exposed to potential damage and partial or complete loss resulting
from environmental disasters (e.g., floods, strong winds, wildfires, earthquakes, tornados and cyclones), equipment failures and other events beyond our control, which could make it difficult for the Company to continue to generate electricity during such periods, and such circumstances could pose threats to the Company's equipment and personnel.
The accumulation of ice on wind turbine blades depends on a number of factors including temperature and ambient humidity, and can have a significant impact on energy yields and could result in the wind turbine experiencing more downtime. Extremely cold temperatures can also impact the ability of wind turbines to operate effectively, and this could result in more downtime and reduced production. Sudden temperature changes can increase the risk of ice crystal formation, which can pose a number of constraints on our hydro operations.
Climate change is expected to change the volume and timing of precipitation which may impact the ability of hydro facilities to maximize the generation from available water. These changes in flow may result in additional operational costs to manage water through the hydro plants. Variations in weather may be impacted by climate change resulting in sustained higher temperatures, rising sea levels and altered precipitation patterns that could have an impact on our generating assets. Furthermore, climate change could result in increased variability or sustained long-term changes to our water and wind resources impacting hydroelectric and wind electricity generation, which could adversely affect our revenues and profitability.
The sensitivity of volumes to our net earnings is shown below:
| | | | | | | | |
| Factor | Increase or
decrease
(per cent) | Approximate
impact on net
earnings
(millions) |
| Availability/production | 1 | | $17 | |
Variation in wind levels may negatively impact the amount of electricity generated at our wind facilities.
Given that wind is variable, the amount of electricity produced from our wind facilities is also variable. In addition, the strength and consistency of the wind resource at our wind facilities may vary from what we anticipate due to a number of factors, including the extent to which our site-specific historic wind data and wind forecasts accurately reflect actual long-term wind speeds, strength and consistency; the potential impact of climatic factors; the accuracy of our assumptions relating to, among other things, weather, icing, degradation, site
access, wake and wind shear line losses and wind shear; and the potential impact of topographical variations and the potential for electricity losses to occur before delivery.
A reduced amount of wind at the location of one or more of our wind facilities over an extended period may reduce the production from such facilities, as well as any environmental attributes that accrue to us related to that production and reduce our revenues and profitability.
| | | | | | | | |
| TransAlta Corporation | 2025 Annual Report | M73 |
There can be no assurance that we will achieve or continue to meet our sustainability targets, and failure to do so may adversely affect our business.
The Company annually establishes sustainability targets to, among things, manage current and emerging material sustainability issues, which include targets relating to decarbonization. The Board of Directors has the discretion to determine the sustainability targets being adopted by the Company and may modify or cancel any previously established sustainability target at any time. The Board of Director's determination to establish, alter or cancel any sustainability target will depend on, among other things: the United Nations Sustainable Development Goals; results of operations; technological considerations; financial condition; market opportunities; legal, regulatory and contractual considerations; and other relevant factors. Further, there is no certainty that the Company will be successful in achieving any particular sustainability target within the stated time frame, or at all. If we are not able to achieve, or adhere to, our sustainability targets, we may not satisfy our stakeholders' current and future expectations, which could negatively impact our reputation and could result in certain investors being unable to hold our common shares.
Many of our activities and properties are subject to environmental regulations, and any liabilities arising under these requirements may materially adversely affect our business.
Our operations are subject to federal, provincial, state and local environmental laws, regulations and guidelines relating to the generation and transmission of electrical and thermal energy and surface mine reclamation (collectively, environmental regulations). These environmental regulations pertain to pollution and the protection of the environment, health and safety, and govern, among other things, air emissions, water usage and discharges, storage, treatment and disposal of waste and other materials, and remediation of sites and responsible land use. These laws and regulations can impose liability and obligations for costs to investigate and remediate contamination without regard to fault, and under certain circumstances liability may be joint and several, resulting in one responsible party being held responsible for the entire obligation. Environmental regulations can also impose, among other things, restrictions, liabilities and obligations in connection with the generation, handling, use, storage, transport, treatment and disposal of hazardous substances and waste, and can impose cleanup, disclosure or other responsibilities with respect to spills, releases and emissions of various substances to the environment. Environmental regulations can also require that facilities and other properties associated with our operations be operated, maintained, abandoned and
reclaimed to the satisfaction of applicable regulatory authorities. In addition, the relative stringency of environmental regulations can reduce or decline based on political direction, resulting in potentially unstable policy environments at national, state/provincial and regional levels in Canada, the U.S. and Western Australia, which may impose different compliance requirements or standards on our business. These various compliance standards may impact costs and/or our ability to operate our facilities.
Changes in standards, new or amended regulation, increased enforcement by regulatory authorities, more extensive permitting requirements, an increase in the number and types of assets operated by the Company subject to environmental regulation and the implementation or change to regional, provincial, state and national environmental regulations may impose varying obligations on us in the jurisdictions in which we operate, and could increase our expenditures. To the extent these expenditures cannot be passed through to our customers under our PPAs or otherwise, our costs could be material. In addition, compliance with environmental regulation may result in restrictions on some of our operations. It is anticipated that compliance costs are at risk of change due to increased political and public attention.
If we do not comply with environmental regulations, regulatory agencies could seek to impose statutory, administrative and/or criminal liabilities on us, curtail our operations, or require significant expenditures on compliance, new equipment or technology, reporting obligations and research and development.
With Bill C-59 we anticipate continued scrutiny by lawyers and other stakeholders relating to sustainability performance. We could face civil liability in the event that private parties seek to impose liability on us for property damage, personal injury or other costs and losses. We cannot guarantee that lawsuits or administrative or investigative actions will not be started against us and otherwise affect our operations and assets. If an action is filed against us or may otherwise affect our operations and assets, we could be required to make substantial expenditures to defend against, or provide evidence of our activities or to bring our Company, our operations and assets into compliance, which could have a material adverse effect on our business.
The estimated reclamation costs applicable to the Company's operations may be inaccurate and could require greater financial resources than currently anticipated. As an owner of mines that were previously in operation, we maintain permits from the applicable regulatory body providing for the authorization of certain mining operations that result in a disturbance of the surface. These requirements sought to limit the adverse impacts of coal mining with more restrictive requirements potentially being adopted from time to time. As an owner of mines that were
| | | | | | | | |
M74 | TransAlta Corporation | 2025 Annual Report |
previously in operation, we may also be required to submit a bond or otherwise secure payment of certain long-term obligations including mine closure or reclamation costs. Surety bond costs have increased in recent years and the market terms of such bonds have generally become more unfavourable. In addition, the number of companies willing to issue surety bonds has decreased. We could be required to self-fund these obligations should we be unable to renew or secure the required surety bonds for our mining operations or if it becomes more economical to do so.
The laws and regulations in the markets in which we operate are subject to change, which may materially adversely affect us.
Most of the markets in which we operate and intend to operate are subject to significant regulatory oversight and control. We are not able to predict whether there will be any further changes in the regulatory environment, including potential carbon and other environmental regulations, changes in market structure or market design, or changes in other laws and regulations. Existing market rules, regulations and reliability standards are often dynamic and may be revised or re-interpreted, and new laws and regulations may be adopted or become applicable to us or our facilities, which could have a material adverse effect on us. Many of our projects must also comply with reliability standards, including those established by the North American Electric Reliability Corporation and Alberta Reliability Standards. Failure to comply with these mandatory reliability standards could result in sanctions, including substantial monetary penalties. We manage these risks systematically through a regulatory and compliance program designed to reduce any potential negative impact on us. However, we cannot guarantee that we will be able to adapt our business in a timely manner in response to any changes in the regulatory regimes in which we operate, and such failure to adapt could have a material adverse effect on our business.
Regulatory authorities may also from time to time audit or investigate our activities in the markets in which we operate or pursue trading. Such audits or investigations may result in sanctions or penalties that may materially affect our future activities, reputation or financial status.
Our facilities are also subject to various licensing and permitting requirements in the jurisdictions in which we operate. Many of these licences and permits need to be renewed from time to time. If we are unsuccessful in obtaining or renewing such licences or permits, or the terms of such licences or permits are changed in a manner that is adverse to our business, we could be materially adversely affected.
Any changes in the rules and regulations of provincial or state public utility commissions or other regulatory bodies in the other markets in which we compete, or may compete in the future, may materially adversely affect us. The laws
and regulations in the markets in which we operate are subject to change, which may materially adversely affect us.
As mandated by the U.S. Department of Energy, TransAlta Centralia Generation LLC has received an Order requiring Centralia Unit 2 in Washington State remain available if called upon to operate for a period of 90 days, until March 16, 2026. The coal used to fuel the Centralia facility is sourced from the Powder River Basin in Montana and Wyoming through contracts to purchase and transport such coal to the facility. The loss of our suppliers or inability to receive coal at Centralia under our existing coal contracts at sufficient quantities, or at all, could also significantly affect our ability to serve our customers and have an adverse impact on our financial condition and results of operations. As we approach the planned conversion of Centralia following the conclusion of the mandated coal operation period ending March 16, 2026, we will continue to monitor and adapt our fuel supply risk management strategies to support operational reliability and financial stability throughout the transition.
The reduction, elimination or expiration of government subsidies and economic incentives could adversely affect our prospects for growth.
We seek to access government policies that promote power generation and enhance the economic feasibility of power projects. Over recent years, the focus of programs has largely been on renewable energy projects. Renewable power generation sources have and in some cases continue to benefit from various incentives in the form of feed-in tariffs, rebates, tax credits, renewable portfolio standards (such as the U.S. government policy mechanism that supports the adoption of renewable power by setting a targeted percentage of a jurisdiction's total electricity procurement from renewable power) and other incentives throughout the markets in which we participate or intend to participate. As incentives have been reduced or eliminated, we have seen some reduction in development opportunities, but given that this impacts all developers and generators, we are seeing a common impact.
We may be adversely affected if our supply of water is materially reduced.
Our hydroelectric and natural gas facilities and our coal-fired facility require continuous water flow for their operation. Shifts in weather or climate patterns, seasonable precipitation, the timing and rate of melting, run-off and other factors beyond our control may reduce the water flow to our facilities. Any material reduction in the water flow to our facilities would limit our ability to produce and market electricity from these facilities and could have a material adverse effect on us. There is an increasing level of regulation respecting the use, treatment
| | | | | | | | |
| TransAlta Corporation | 2025 Annual Report | M75 |
and discharge of water, and respecting the licensing of water rights in jurisdictions where we operate. Any change in regulations could have a material adverse effect on us.
Availability or disruption of fuel supply to our thermal plants could have an adverse impact on the operation of our facilities and our financial condition.
Our gas facilities rely on having adequate supplies of natural gas and our Centralia facility requires adequate supplies of coal to run the facility reliably and at full capacity. As a result, we face the risk of not having adequate fuel supplies available due to insufficient natural gas transportation service; disruptions in fuel supplies due to weather, strikes, lockouts, or equipment breakdowns; delays in receiving regulatory approvals; or if increases in the cost of fuel we must buy to generate electricity exceed the price we can obtain for the electricity we sell. Several factors affect the price of fuel, many of which are beyond our control, including:
•Prevailing market prices for fuel;
•Global demand for energy products;
•The cost of carbon and other environmental concerns;
•Weather-related disruptions affecting the ability to deliver fuels or near-term demand for fuels;
•Increases in the supply of energy products in the wholesale power markets;
•Political instability;
•The extent of fuel transportation capacity, cost of fuel transportation service into our markets or potential rail strikes; and
•The cost of mining or extraction that, in turn, depends on various factors such as labour market pressures, equipment replacement costs and permitting.
Changes in any of these factors may increase our cost of producing power or decrease the amount of revenue received from the sale of power, which could have a material adverse effect on us.
In the event the Company secures more natural gas than required to operate its facilities, it may have difficulty reselling the excess natural gas and could be exposed to the market price for natural gas for any such resales. There is no certainty that the Company will be successful in reselling or recovering its costs in respect of such resales of natural gas.
As well, the coal used to fuel the Centralia facility is sourced from the Powder River Basin in Montana and Wyoming through contracts to purchase and transport it to our Centralia facility. The loss of our suppliers or inability to receive coal at Centralia under our existing coal contracts
at sufficient quantities, or at all, could also significantly affect our ability to serve our customers and have an adverse impact on our financial condition and results of operations.
We could face the risk of inadequate supply service due to our reliance on the Pioneer Pipeline and on the ATCO Pipeline as a significant provider of natural gas for our Sundance and Keephills units.
To manage gas supply risk, the Company enters into long term transportation service agreements to ensure that facilities have adequate gas supply. This could result in the additional risk of being in a surplus position where some of the transportation capacity may not be needed, yet the Company is still required to pay for the unused transportation. To manage this risk the Company will remarket excess natural gas transport capacity in the short-term while seeking long-term or permanent assignments.
Our facilities rely on national and regional transmission systems and related facilities that are owned and operated by third parties and have both regulatory and physical constraints that could impede access to electricity markets.
Our power generation facilities depend on electric transmission systems and related facilities owned and operated primarily by third parties to deliver the electricity that we generate to delivery points where ownership changes and we are paid. The risks associated with aging transmission infrastructure in the markets where we operate are increasing because new connections to the transmission system are consuming capacity faster than it is being added by new transmission developments.
Further, transmission systems operate with both regulatory and physical constraints that in certain circumstances may impede access to electricity markets. There may be instances in system emergencies in which our power generation facilities are physically disconnected from the power grid, or our production curtailed for periods of time. Most of our electricity sales contracts do not provide for payments to be made if electricity is not delivered.
Our power generation facilities may also be subject to changes in regulations governing the cost and characteristics of use of the transmission and distribution systems to which our power generation facilities are connected. In the future, our power generation facilities may not be able to secure access to this interconnection or transmission capacity at reasonable prices, in a timely fashion or at all, which could then cause delays and additional costs as we attempt to negotiate or renegotiate PPAs or construct new projects. In addition, we may not benefit from preferential arrangements in the future. Any such increased costs and delays could delay the
| | | | | | | | |
M76 | TransAlta Corporation | 2025 Annual Report |
commercial operation dates of any new projects and negatively impact our revenues and financial condition.
Cyberattacks may cause disruptions to our operations and could have a material adverse effect on our business.
We rely on information technology systems to process, transmit, and store data essential to the safe operation of our assets. Geopolitical tensions and the pandemic have contributed to a significant increase in both the frequency and complexity of cyberattacks. Threats now range from war‑driven attacks on critical infrastructure to social‑engineering schemes exploiting hybrid work environments. As the threat landscape continues to evolve—including ransomware, insider threats, supply chain compromises, targeted phishing and AI‑enabled attacks—any breach of our systems could disrupt operations or compromise proprietary, confidential, or personal information.
Cyber threats originate from a variety of actors, including nation‑states, organized groups, and malware developers. Attackers increasingly target users and internal systems rather than traditional perimeter defenses. A successful cyber incident could enable unauthorized access, destruction, or disclosure of information and may impact public safety, personnel, business operations, service delivery, reputation, or financial performance.
Our technology and systems for communication and monitoring may be vulnerable to security breaches or interruptions, which could result in increased operating expenses and other liabilities.
We rely on technology, mainly on computer, telephone, satellite, cellular and related networks and infrastructure, to conduct our business and monitor the production of our generation facilities. These systems and infrastructure could be vulnerable to unforeseen problems including, but not limited to, cyberattacks, breaches, vandalism and theft. Our operations are dependent upon our ability to protect our information and operating technology against damage from fire, power loss, telecommunications failure or a similar catastrophic event. While we have dedicated resources for maintaining appropriate levels of cybersecurity and we use third-party technology to help protect us against security breaches and cyber incidents, our measures may not be effective and our information technology and infrastructure may be vulnerable to attacks by hackers or breached due to employee error, malfeasance or other disruptions. Any such security breaches and cyber incidents or other disruptions could jeopardize the security of information stored in and transmitted through our systems and network infrastructure, and could result in significant setbacks and potential liabilities and deter future customers. Additionally, we must be able to protect our generation facility
infrastructure against physical damage and any service disruptions.
Any damage or failure that causes an interruption in operations could have an adverse effect on our customers. While we have systems, policies, hardware, practices and procedures designed to prevent or limit the effect of failure or interruptions of our generation facilities and infrastructure, there can be no assurance that these measures will be sufficient and that any such failures or interruptions will not occur or, if they do occur, that they will be adequately addressed in a timely manner.
We operate in a highly competitive environment and may not be able to compete successfully.
We operate in a number of Canadian provinces, as well as in the U.S. and Western Australia. These areas of operation are affected by competition ranging from large utilities to small independent power producers, as well as private equity, pension funds, international conglomerates, traditional energy companies and technology firms. In addition, potential customers may look to deploy their own capital to self-supply their own electricity needs. Some competitors have significantly greater financial and other resources than we do. Such competition could have a material adverse effect on our business. Emerging technology affecting the demand, generation, distribution or storage of electricity may also significantly impact our business and ability to compete. Climate change and regulatory incentives are expected to drive innovation and transformation of the power generation sector, including energy production and consumption, and there can be no certainty that the Company will benefit from such innovation or transformation. Furthermore, older facilities may, over time, be unable to compete with newer, more efficient facilities that benefit from advances in power technologies and cost-efficient new technologies, including gas turbines with lower heat rates. In Alberta, some industrial customers rely on behind-the-fence generation; these customers are not being supplied electricity from the grid, which reduces the competitive load in the province and puts downward pressure on pool prices. Further, certain large industrial companies in Alberta operate significant cogeneration facilities, which generate steam required for their operations and often results in large amounts of excess generation being offered to the wholesale electricity market. These cogeneration facilities offer their energy into the market at low prices to ensure it is dispatched, which results in the facility realizing an achieved price close to the average pool price, which potentially puts downward pressure on the pool price and could result in certain of the Company's facilities not being dispatched.
| | | | | | | | |
| TransAlta Corporation | 2025 Annual Report | M77 |
Changes in general economic and market conditions may have a material adverse effect on us.
Adverse changes in general economic and market conditions could negatively impact demand for electricity as well as our revenue, operating costs, the timing and extent of capital expenditures, the net recoverable value of PP&E, financing costs, credit and liquidity risk and counterparty risk which could cause us to suffer a material adverse effect.
We may be unsuccessful in legal actions.
We are occasionally named as a party in various disputes, claims and legal or regulatory proceedings that arise during the normal course of our business. We review each of these claims, including the nature and merits of the claim, the amount in dispute or the remedy claimed and the availability of insurance coverage. There can be no assurance that any particular dispute, claim or proceeding will be resolved in our favour or that our liabilities with respect to such claims will not have a material adverse effect on us. Refer to the "Other Consolidated Analysis" section of this MD&A for further details.
We may have difficulty raising needed capital in the future, which could significantly harm our business.
If our sources of cash and cash flow from operations are insufficient to fund our activities or we are unable to divest assets to generate capital, we may need to raise additional funds. Additional financing may not be available when needed, and if such financing is available, it may not be available on terms that are favourable to our business.
Recovery of the capital investment in power projects generally occurs over a long period of time. As a result, we must obtain funds from equity or debt financings to help finance the acquisition and development of projects and to support the general and administrative costs of operating our business. Our ability to arrange financing, either at the corporate level or at the subsidiary level (including non-recourse project debt or tax equity), and the costs of such capital are dependent on numerous factors, including: (a) general economic and capital market conditions; (b) credit availability from banks and other financial institutions; (c) investor confidence and the markets in which we conduct operations; (d) our financial performance and/or the expected financial performance of certain assets; (e) our level of indebtedness and compliance with covenants in our debt agreements; (f) our cash flow and/or the expected cash flow of certain assets; and (g) our credit ratings. We are subject to certain financial covenants under our credit facility that could limit the amount of additional debt that the Company could raise in certain circumstances. An inability to raise debt could reduce the number of projects that we are able to finance. If we are unable to raise
additional funds when needed, we could be required to delay the acquisition and construction of growth projects, reduce the scope of projects, abandon or sell some of our projects or generation facilities, or default on our contractual commitments in the future, any of which could adversely affect our business, financial condition and results of operations.
A downgrade of our credit ratings could affect us materially and adversely.
Rating agencies regularly evaluate us, basing their ratings of our long and short-term debt, along with our issuer rating, on a number of factors. There can be no assurance that one or more of our credit ratings and the corresponding outlooks will not be changed. Our borrowing costs and ability to raise funds are directly impacted by our credit ratings. Credit ratings may be important to suppliers or counterparties when they seek to engage in certain transactions with us. A credit rating downgrade could potentially impair our ability to enter into arrangements with suppliers or counterparties, to engage in certain transactions, and could limit our access to private and public credit markets and increase the costs of borrowing under our existing credit facilities.
Changes to our reputation may have a material adverse effect on us.
Reputation risk relates to the risk associated with our business because of changes in opinion from the general public, private stakeholders, governments, financiers and other entities. Our reputation is one of our most valued assets. The potential for harming our reputation exists in every business decision and all risks can have an impact on reputation, which in turn can negatively impact our business and securities. Reputational risk cannot be managed in isolation from other forms of risk. Negative impacts from a compromised reputation could include revenue loss, reduction in our customer base and the decreased value of our securities.
We may fail to meet financial expectations.
Our quarterly revenue, earnings, cash flows and results of operations are difficult to predict and fluctuate from quarter to quarter. Our quarterly results of operations are influenced by a number of factors, including the risks described in this MD&A, many of which are outside of our control and that may cause such results to fall below market expectations. Although we base our planned operating expenses in part on our expectations of future revenue, a significant portion of our expenses are relatively fixed in the short-term. If revenue for a particular quarter is lower than expected, we will likely be unable to proportionately reduce our operating expenses for that quarter, which will adversely affect our results of operations for that quarter.
| | | | | | | | |
M78 | TransAlta Corporation | 2025 Annual Report |
Our cash dividend payments are not guaranteed.
The payment of dividends is not guaranteed and could fluctuate. The Board of Directors has the discretion to determine the amount and timing of any dividends to be declared and paid to our shareholders. In addition, the payment of dividends on common shares is, in all cases, subject to prior satisfaction of preferential dividends applicable to each series of our first preferred shares. We may alter our dividend on common shares at any time. The Board of Directors' determination to declare dividends will depend on, among other things: results of operations; financial condition; current and expected future levels of earnings; operating cash flow; liquidity requirements; market opportunities; income taxes; maintenance and growth capital expenditures; debt repayments; legal, regulatory and contractual constraints; working capital requirements; taxes payable; and other relevant factors. Our short- and long-term borrowings may prohibit us from paying dividends at any time at which a default or event of default would exist under such debt, or if a default or event of default would exist as a result of paying the dividend.
Over time, our capital and other cash needs may change significantly from our current needs, which could affect whether we pay dividends and the amount of any dividends we may pay in the future. If we continue to pay dividends at the current level, we may not retain a sufficient amount of cash to finance growth opportunities, meet any large unanticipated liquidity requirements or fund our operations in the event of a significant business downturn. The Board of Directors, subject to the requirements of our bylaws and other governance documents, may amend, revoke or suspend our dividends at any time. A decline in the market price or liquidity, or both, of our common shares could result if the Board of Directors reduces or eliminates the payment of dividends.
We are dependent on the operations of our facilities for our cash availability. The actual amount of cash available for dividends to holders of our common shares will depend upon numerous factors relating to each of our generation facilities including: their operating performance; profitability; changes in gross margin; fluctuations in working capital; capital expenditure levels; applicable laws; tax position; financing; compliance with contracts; and contractual restrictions contained in the instruments governing any indebtedness. Any reduction in the amount of cash available for distribution from our generation facilities will reduce the amount of cash available to pay dividends to holders of our common shares.
The market price for our common shares may be volatile.
The market price for our common shares may be volatile and subject to wide fluctuations in response to numerous factors, many of which are beyond our control, including:
(a) actual or anticipated fluctuations in our results of operations; (b) recommendations by securities research analysts; (c) changes in the economic performance or market valuations of other companies that investors deem comparable; (d) the loss or resignation of executive officers and other key personnel; (e) sales or perceived sales of additional common shares; (f) significant acquisitions or business combinations, strategic partnerships, joint ventures or capital commitments by or involving us or our competitors; and (g) trends, concerns, technological or competitive developments, regulatory changes and other related issues in the power generation industry or our target markets.
Financial markets have experienced significant price and volume fluctuations that have particularly affected the market prices of equity securities of companies and these fluctuations have, in many cases, been unrelated to the operating performance, underlying asset values or prospects of such companies. Accordingly, the market price of our common shares may decline even if our operating results, underlying asset values or prospects have not changed. Additionally, these factors, as well as other related factors, may cause decreases in asset values that may result in impairment losses.
We may not be able to extend, renew or replace expiring or terminated PPAs, or other customer contracts at favourable rates or on a long-term basis.
Our ability to extend, renew or replace our existing PPAs or other customer contracts depends on a number of factors beyond our control, including, but not limited to: whether the PPA counterparty has a continued need for energy at the time of the agreement’s expiration; the presence or absence of governmental incentives; prevailing market prices; the availability of other electricity sources; the satisfactory performance of our obligations under such PPAs; the age and condition of the facility and the forecasted maintenance and sustaining capital costs to continue operations; macroeconomic factors present at the time, such as population, business trends, international trade laws, regulations, agreements, treaties, policies and related impacts on energy demand; and the effects of regulation on our contractual counterparties.
If we are not able to extend, renew or replace existing PPAs on acceptable terms before the PPAs expire, or if such agreements are otherwise terminated before their expiration, we may not be able to sell electricity to the market or to other customers. If we are able to sell electricity on an uncontracted basis, we would sell electricity at prevailing market prices that could be materially lower than under the applicable contract. This could result in us having less stable cash flows. If there is no satisfactory market for a project’s uncontracted energy, we may decommission the project before the end of its
| | | | | | | | |
| TransAlta Corporation | 2025 Annual Report | M79 |
useful life. Any failure to extend, renew or replace a significant portion of our existing PPAs, or other customer contracts, or extending, renewing or replacing them at lower prices or with other unfavourable terms relative to the existing PPA, or the decommissioning of a project, could have a material adverse effect on our business, financial condition, results of operations and ability to pay dividends to our shareholders.
We may fail to fully or effectively hedge our supply and price risk exposure.
We closely monitor the risks associated with changes in electricity and input fuel prices on our future operations and, where we consider it appropriate, use various physical and financial instruments to hedge our assets and operations from such price risks. The efficacy of our risk management and hedging program may be adversely impacted by unanticipated events and costs that we are not able to effectively mitigate, including unanticipated events that impact supply and demand, such as extreme weather and unplanned outages. We may also be adversely impacted if we make incorrect assumptions that were relied upon in establishing our hedges. We are exposed to changes in electricity prices and natural gas prices on purchases of electricity or natural gas from the market to fulfil our supply obligations under these short- and long-term hedge contracts. If we are unable to produce or consume the amount of natural gas or electricity that we have hedged, we could incur losses as we could be required to purchase additional volumes in the market at higher prices to cover our hedge position. Comparably, if the market price for electricity is higher than the hedged price we would be subject to the opportunity cost associated with not realizing the higher market price.
We are also exposed to basis risk as certain of our generating facilities receives the "node" price for the electricity it delivers to the grid while the financial PPA for such generating facility settles at the "hub" price. The differences between the "node" and "hub" price can be significant from time to time.
Trading risks may have a material adverse effect on our business.
Our trading and marketing business frequently involves establishing trading positions in the wholesale energy markets on both a medium-term and short-term basis, and on both an asset and proprietary basis. To the extent that we have long positions in the energy markets, a downturn in market prices will result in losses from a decline in the value of these long positions. Conversely, to the extent that we enter into forward sales contracts to deliver energy that we do not own, or take short positions in the energy markets, an upturn in market prices will expose us to losses as we attempt to cover any short positions by acquiring energy in a rising market.
In addition, from time to time, we may have a trading strategy consisting of simultaneously holding a long position and a short position, from which we expect to earn a profit based on changes in the relative value of the two positions. If, however, the relative value of the two positions changes in a direction or manner that we did not anticipate, we would realize losses from such a paired position.
If the strategy that we use to hedge our exposures to these various risks is not effective, we could incur significant losses. Our trading positions can be impacted by volatility in the energy markets that, in turn, depend on various factors, including weather in various geographical areas and short-term supply and demand imbalances, which cannot be predicted with any certainty. A shift in the energy markets could adversely affect our positions, which could also have a material adverse effect on our business.
Our risk management group uses a number of risk management controls to limit our exposure to risks arising from our trading activities. These controls include risk capital limits, Value at Risk, Gross Margin at Risk, tail risk scenarios, position limits, concentration limits, credit limits and approved product controls. We cannot guarantee that losses will not occur and such losses may be outside the parameters of our risk controls.
Certain of the contracts to which we are a party require that we provide collateral against our obligations.
We are exposed to risk under certain arrangements, including financial derivative contracts and electricity and natural gas purchase and sale contracts entered into for the purposes of hedging and proprietary trading. The terms and conditions of these contracts may require us to provide collateral when the fair value of these contracts exceeds any credit limits granted by our counterparties and the contract obliges that we provide the collateral. The change in fair value of these contracts often occurs due to changes in commodity prices. These contracts include: (a) financial derivative contracts when forward commodity prices are more or less than contracted prices, depending on the transactions; (b) purchase agreements, when forward commodity prices are less than contracted prices; and (c) sales agreements, when forward commodity prices exceed contracted prices. Downgrades in our creditworthiness by certain credit rating agencies may decrease the credit limits granted by our counterparties and, accordingly, increase the amount of collateral we may have to provide. Any increase in the amount of collateral provided by the Company could reduce our liquidity and materially adversely affect us.
| | | | | | | | |
M80 | TransAlta Corporation | 2025 Annual Report |
If counterparties to our contracts are unable to meet their obligations, we may be materially and adversely affected.
If purchasers of our electricity and steam or other contractual counterparties default on their obligations, we may be materially and adversely affected. While we have procedures and controls in place to manage counterparty credit risk before entering into contracts, all contracts inherently contain default risk. Moreover, while we seek to monitor trading activities to ensure that the credit limits for counterparties are not exceeded, we cannot guarantee that a party will not default. If counterparties to our contracts are unable to meet their obligations, we could suffer a reduction in revenue that could have a material adverse effect on our business.
If established credit exposure limits are exceeded, we take steps to reduce this exposure, such as by requesting collateral, if applicable, or by halting commercial activities with the affected counterparty. However, there can be no
assurances that we will be successful in avoiding losses as a result of a contract counterparty not meeting its obligations.
As needed, additional risk mitigation tactics will be taken to reduce the risk to TransAlta. These risk mitigation tactics may include, but are not limited to, immediate follow-up on overdue amounts, adjusting payment terms to ensure a portion of funds are received sooner, requiring additional collateral, reducing transaction terms and working closely with impacted counterparties on negotiated solutions.
Our credit risk management profile and practices have not changed materially from Dec. 31, 2024. We had no material counterparty losses in 2025. We continue to keep a close watch on changes and trends in the market and the impact these changes could have on our energy trading business and hedging activities and will take appropriate actions as required, although no assurance can be given that we will always be successful.
The following table outlines our maximum exposure to credit risk without taking into account collateral held or right of set-off, including the distribution of credit ratings, as at Dec. 31, 2025:
| | | | | | | | | | | | | | |
| Investment
grade
(per cent) | Non-investment
grade
(per cent) | Total
(per cent) | Total
amount
($) |
Trade and other receivables(1) | 84 | | 16 | | 100 | | 699 | |
| Long-term finance lease receivables | 100 | | — | | 100 | | 277 | |
Risk management assets(1) | 53 | | 47 | | 100 | | 194 | |
Long-term financial assets(2) | — | | 100 | | 100 | | 140 | |
Loans receivable(3) | — | | 100 | | 100 | | 31 | |
| Total | | | | 1,341 | |
(1)Letters of credit and cash and cash equivalents are the primary types of collateral held as security related to these amounts.
(2)Included within long-term financial assets with counterparties that have no external credit rating.
(3)Includes $31 million loans receivable included within other assets with a counterparty that has no external credit rating.
The maximum credit exposure to any one customer for commodity trading operations, including the fair value of open trading positions net of any collateral held, is $51 million (2024 – $77 million).
Because of our multinational operations, we are subject to currency rate, tax, regulatory and political risks.
We are exposed to various currencies as a result of our investments and operations in foreign jurisdictions, the earnings from those operations, the acquisition of equipment and services and foreign-denominated commodities from foreign suppliers, and our U.S. and Australian dollar-denominated debt. Our exposures are primarily to the U.S. and Australian currencies, and changes in the values of these currencies relative to the Canadian dollar could negatively impact our operating cash flows or the value of our foreign investments.
While we attempt to manage this risk by using hedging instruments, including cross-currency interest rate swaps, forward exchange contracts and matching revenues and expenses by currency at the corporate level, there can be no assurance that these risk management efforts will be effective, and fluctuations in these exchange rates may have a material adverse effect on our business.
In addition to currency rate risk, our foreign operations may be subject to tax, regulatory and political risk. Any change to the regulations governing power generation or the political climate in the countries where we have operations could impose additional costs and have a material adverse effect on us.
| | | | | | | | |
| TransAlta Corporation | 2025 Annual Report | M81 |
The sensitivity of our net (loss) earnings to changes in foreign exchange rates has been prepared using management’s assessment that an average $0.03 increase or decrease in the U.S. or Australian currencies relative to the Canadian dollar is a reasonable potential change over the next quarter and is shown below:
| | | | | | | | |
| Factor | Increase or
decrease | Approximate impact on net (loss) earnings (millions) |
| Exchange rate | $0.03 | $17 | |
We are not able to insure against all potential risks and may become subject to higher insurance premiums.
Our business is exposed to the risks inherent in the construction and operation of electricity generation facilities, such as breakdowns, manufacturing defects, natural disasters, injury, damage to third parties, theft, terrorist attacks, cyberattacks and sabotage. We are also exposed to environmental risks. We maintain insurance policies, covering usual and customary risks associated with our business, with creditworthy insurance carriers. Our insurance policies, however, may not cover losses, or may be subject to limitations in coverage as a result of force majeure, natural disasters, terrorist or cyberattacks or sabotage, armed hostilities, or other perils. Our insurance policies may be subject to increase resulting from climate change, for example due to increased storm severity and frequency. In addition, we generally do not maintain insurance for certain environmental risks, such as environmental contamination. Our insurance policies are subject to annual review by the respective insurers and may not be renewed at all or on similar or favourable terms. A significant uninsured loss or a loss significantly exceeding the limits of our insurance policies or the failure to renew such insurance policies on similar or favourable terms could have a material adverse effect on our business, financial condition and results of operations.
Our insurance coverage may not be available in the future on commercially reasonable terms or adequate insurance
limits may not be available in the market. In addition, the insurance proceeds received for loss or damage to any of our generation facilities may not be sufficient to permit us to continue to make payments on our debt.
Provision for income taxes may not be sufficient.
Our operations are complex and located in several countries, and the computation of the provision for income taxes involves tax interpretations, regulations and legislation that are continually changing. In addition, our tax filings are subject to audit by taxation authorities. While we believe that our tax filings have been made in material compliance with all applicable tax interpretations, regulations and legislation, we cannot guarantee that we will not have disagreements with taxation authorities with respect to our tax filings that could have a material adverse effect on our business.
The Company and its subsidiaries are subject to changing laws, treaties and regulations in and between countries. Various tax proposals in the countries where we operate could result in changes to the basis on which deferred taxes are calculated or could result in changes to income or non-income tax expense. There has recently been an increased focus on issues related to the taxation of multinational corporations. A change in tax laws, treaties or regulations, or in the interpretation thereof, could result in a materially higher income or non-income tax expense that could have a material adverse impact on us.
The sensitivity of changes in income tax rates upon our net earnings is shown below:
| | | | | | | | |
| Factor | Increase or
decrease
(per cent) | Approximate impact on net (loss) earnings (millions) |
| Tax rate | 1 | | $1 | |
If we fail to attract and retain key personnel, we could be materially adversely affected.
The loss of any of our key personnel or our inability to attract, train, retain and motivate additional qualified management and other personnel could have a material adverse effect on our business. Competition for these
personnel is intense and there can be no assurance that we will be successful in this regard.
If we are unable to successfully negotiate new collective bargaining agreements with our unionized workforce, as required, we will be adversely affected. While we believe we have a satisfactory relationship with our unionized employees, we cannot guarantee that we will be able to
| | | | | | | | |
M82 | TransAlta Corporation | 2025 Annual Report |
successfully negotiate or renegotiate our collective bargaining agreements on terms agreeable to
TransAlta. In 2025 we successfully renegotiated one collective bargaining agreement.
We expect to renegotiate four collective bargaining agreements in 2026. Any hurdles in negotiating these collective bargaining agreements could lead to higher employee costs and a work stoppage or strike, which could have a material adverse effect on us.
We are subject to risks associated with our ownership interests in projects that are under construction, which could result in our inability to complete construction projects on time or at all, and make projects too expensive to complete or cause the return on an investment to be less than expected.
TransAlta has interests in certain projects that have not yet started operations or are under construction. There may be delays or unexpected developments in completing any future construction projects, which could cause the construction costs of these projects to exceed our expectations, result in substantial delays or prevent the project from commencing commercial operations. Various factors could contribute to construction-cost overruns, construction halts or delays or the failure to commence commercial operations, including: delays in obtaining, or the inability to obtain, necessary land rights, permits and licences; delays and increased costs related to the interconnection of new projects to the transmission system; the inability to acquire or maintain land use and access rights; the failure to receive contracted third-party services; interruptions to dispatch at the projects; supply chain disruptions, including as a result of changes in international trade laws, regulations, agreements, treaties,
taxes, tariffs, duties or policies of Canada, the U.S. or other countries in which the Company's suppliers are located; work stoppages; labour disputes; weather interferences; unforeseen engineering, environmental and geological problems, including, but not limited to, discoveries of contamination, protected plant or animal species or habitat, archaeological or cultural resources or other environment-related factors; unanticipated cost overruns in excess of budgeted contingencies; and failure of contracting parties to perform under contracts.
In addition, if we or one of our subsidiaries has an agreement for a third party to complete construction of any project, TransAlta is subject to the viability and performance of the third party. Our inability to find a replacement contracting party, if the original contracting party has failed to perform, could result in the abandonment of the construction of such project, while we could remain obligated under other agreements associated with the project, including, but not limited to, offtake PPA's.
New technology and artificial intelligence may present emerging risks that could have a material adverse effect on the Company.
We are introducing artificial intelligence and robotics at some of our facilities. The use of artificial intelligence and robotics at our facilities may not yield materially better results, higher outputs or increased productivity and there is no certainty that we will realize benefits from investments in these technologies. Additionally, the use of artificial intelligence is subject to the risk that privacy concerns relating to such technology could deter current and potential customers.
Changes in interest rates can impact our borrowing costs and affect our interest rate risk.
Changes in interest rates can impact our borrowing costs. Changes in our cost of capital may also affect the feasibility of new growth initiatives.
At Dec. 31, 2025, approximately 10 per cent (2024 – 23 per cent) of our total long-term debt was subject to changes in floating interest rates through a combination of floating rate debt and interest rate swaps.
We manage interest rate risk by establishing and adhering to policies that include:
•Employing a combination of fixed and floating rate debt instruments;
•Monitoring the mixture of floating and fixed rate debt and adjusting to ensure efficiency; and
•Opportunistically hedging probable debt issuances and outstanding variable rate borrowings using interest rate swaps.
The sensitivity of changes in interest rates upon our net earnings is shown below:
| | | | | | | | |
| Factor | Increase or
decrease
(per cent) | Approximate impact
on net earnings
(millions) |
| Interest rate | 50 | $1 | |
| | | | | | | | |
| TransAlta Corporation | 2025 Annual Report | M83 |
Disclosure Controls and Procedures
Management is responsible for establishing and maintaining adequate internal control over financial reporting (ICFR) and disclosure controls and procedures (DC&P). For the year ended Dec. 31, 2025, the majority of our workforce supporting and executing our ICFR and DC&P continue to work on a hybrid basis. The Company has implemented appropriate controls and oversight for both in-office and remote work. There has been minimal impact to the design and performance of our internal controls.
ICFR is a framework designed to provide reasonable assurance regarding the reliability of financial reporting and the preparation of the consolidated financial statements for external purposes in accordance with IFRS. Management has used the Internal Control – Integrated Framework issued by the Committee of Sponsoring Organizations of the Treadway Commission (2013 framework) to assess the effectiveness of the Company’s ICFR.
DC&P refer to controls and other procedures designed to ensure that information required to be disclosed in the reports we file or submit under securities legislation is recorded, processed, summarized and reported within the time frame specified in applicable securities legislation. DC&P include, without limitation, controls and procedures designed to ensure that information required to be disclosed by us in our reports that we file or submit under applicable securities legislation is accumulated and
communicated to management, including our Chief Executive Officer and Chief Financial Officer, as appropriate to allow timely decisions regarding our required disclosure.
Together, the ICFR and DC&P frameworks provide internal control over financial reporting and disclosure. In designing and evaluating our ICFR and DC&P, management recognizes that any controls and procedures, no matter how well designed and operated, can provide only reasonable assurance of achieving the desired control objectives and as such may not prevent or detect all misstatements and management is required to apply its judgment in evaluating and implementing possible controls and procedures. Further, the effectiveness of ICFR is subject to the risk that controls may become inadequate because of changes in conditions or that the degree of compliance with policies or procedures may change.
Management has evaluated, with the participation of our Chief Executive Officer and Chief Financial Officer, the effectiveness of our ICFR and DC&P as of the end of the period covered by this MD&A. Based on the foregoing evaluation, our Chief Executive Officer and Chief Financial Officer have concluded that, as at Dec. 31, 2025, the end of the period covered by this MD&A, our ICFR and DC&P were effective.
| | | | | | | | |
M84 | TransAlta Corporation | 2025 Annual Report |