Exhibit 99.1
The
Bancorp, Inc. Reports Third Quarter 2025 Financial Results
Wilmington, DE – October 30, 2025 – The Bancorp, Inc. (“The Bancorp” or the “Company”
or “we” or “our”) (NASDAQ: TBBK), a financial holding company, today reported its financial results for the third
quarter of 2025.
Highlights
| | • | The
Bancorp reported net income of $54.9 million, or $1.18 per diluted share (“EPS”),
for the quarter ended September 30, 2025, compared to net income of $51.5 million, or
$1.04 per diluted share, for the quarter ended September 30, 2024, or an EPS increase of
13%. While net income increased 7% between these periods, outstanding shares were reduced
as a result of share repurchases as detailed below. |
| | • | Return
on assets and return on equity for the quarter ended September 30, 2025, amounted to 2.5%
and 27%, respectively, compared to 2.5% and 26%, respectively, for the quarter ended September
30, 2024 (all percentages “annualized”). |
| | • | Net
interest income increased to $94.2 million for the quarter ended September 30, 2025, compared
to $93.7 million for the quarter ended September 30, 2024. |
| | • | Net
interest margin amounted to 4.45% for the quarter ended September 30, 2025, compared to 4.78%
for the quarter ended September 30, 2024, and 4.44% for the quarter ended June 30, 2025.
|
| | • | The
average interest rate on $7.84 billion of average deposits and interest-bearing liabilities
during the third quarter of 2025 was 2.15%. compared to 2.54% for the third quarter of 2024.
Average deposits of $7.63 billion for the third quarter of 2025 increased $618.2 million,
or 9% over third quarter 2024. |
| | • | Gross
dollar volume (“GDV”), representing the total amounts spent on prepaid, debit
and credit cards totaled $44.04 billion for the quarter ended September 30, 2025, an increase
of $6.14 billion, or 16%, compared to the quarter ended September 30, 2024. The increase
reflected continued organic volume growth with existing partners and products and the impact
of new products launched within the past year. Total prepaid, debit card, ACH, and other
payment fees increased 10% to $30.6 million for the third quarter of 2025 compared to the
third quarter of 2024. |
| | • | Loans,
net of deferred fees and costs were $6.67 billion at September 30, 2025, compared to
$5.91 billion at September 30, 2024 and $6.54 billion at June 30, 2025. Those changes reflected
an increase of 2% quarter over linked quarter and an increase of 13% year over year. |
| | • | Real
estate bridge loans (“REBLs”) characterized as criticized assets decreased in
the third quarter of 2025 to $185.3 million at September 30, 2025 from $215.8 million at
June 30, 2025. Included in the September 30, 2025 balance is $102.0 million of assets
under contract and expected to close during the fourth quarter, thus further reducing the
criticized balance if completed. |
| | • | Consumer
fintech loans increased to $785.0 million at September 30, 2025, a 15% increase compared
to the $680.5 million balance at June 30, 2025 and increased 180% compared to the September
30, 2024 balance of $280.1 million. Certain loan fees on consumer fintech loans are recorded
as non-interest income. Such non-interest income amounted to $4.5 million for the quarter
ended September 30, 2025 and $1.6 million for the quarter
ended September 30, 2024. |
| | • | As
of September 30, 2025, the Company’s Tier 1 capital to average assets (leverage), Tier
1 capital to risk-weighted assets, total capital to risk-weighted assets and common
equity Tier 1 to risk-weighted assets ratios were 8.74%, 12.99%, 14.09% and 12.99%, respectively.
Those respective ratios for our wholly owned subsidiary, The Bancorp Bank, N.A., at that
date were 9.85%, 14.66%, 15.77% and 14.66% compared to well-capitalized minimums of 5%, 8%,
10%, and 6.5%. The Bancorp Bank, N.A. also remains well capitalized under banking regulations.
|
| | • | Book
value per common share at September 30, 2025, was $17.48 compared to $16.90 per common share
at September 30, 2024, an increase of 3%. |
| | • | The
Bancorp repurchased 2,034,053 shares of its common stock at an average cost
of $73.74 per share during the quarter ended September 30, 2025. As a result of share repurchases,
outstanding shares, net of treasury shares, at September 30,
2025 amounted to 44.5 million, compared to 48.2 million shares at September 30, 2024, or
a reduction of 8%. |
“We had another successful quarter as we continue to build new Fintech capabilities and implement
and expand partner programs,” said Damian Kozlowski, CEO of The Bancorp. He also noted that “We are lowering guidance from
$5.25 to $5.10 earnings per share for 2025, primarily due to lower projected balances for our traditional lending businesses and an increased
credit provision for leasing as a result of losses on the disposition of previously identified credits in trucking. In addition, we are
not giving specific guidance for 2026 other than we are targeting a minimum $7 earnings per share run-rate by the fourth quarter of 2026.
We are initiating preliminary guidance for 2027 of $8.25 earnings per share. We believe that our three major Fintech initiatives of credit
sponsorship expansion, embedded finance platform development and new program implementations, plus platform efficiency and productivity
gains from platform restructuring and new AI tools, and a continued high level of capital return through share buybacks, will contribute
to earnings per share accretion. Earnings per share gains are subject to uncertainty, particularly as it relates to the development and
implementation timelines in Fintech, and our stock price for buybacks.”
Conference Call Webcast
You may access the LIVE webcast of The Bancorp’s Quarterly Earnings Conference Call at 8:00 AM ET
Friday, October 31, 2025, by clicking on the webcast link on The Bancorp’s homepage at www.thebancorp.com or you may dial 1.800.549.8228,
conference ID 37073. You may listen to the replay of the webcast following the live call on The Bancorp’s investor relations website
(archived for one year) or telephonically until Friday, November 7, 2025, by dialing 1.888.660.6264, playback code 37073#.
About The Bancorp
The Bancorp, Inc. (NASDAQ: TBBK), headquartered in Wilmington, Delaware,
through its subsidiary, The Bancorp Bank, N.A, provides a variety of services including providing non-bank financial companies with the
people, processes, and technology to meet their unique banking needs. Through its Fintech Solutions, Institutional Banking, Commercial
Lending, and Real Estate Bridge Lending businesses, The Bancorp provides partner-focused solutions paired with cutting-edge technology
for companies that range from entrepreneurial startups to Fortune 500 companies. With over 20 years of experience, The Bancorp has become
a leader in the financial services industry, earning recognition as the #1 issuer of prepaid cards in the U.S., a nationwide provider
of bridge financing for real estate capital improvement plans, an SBA National Preferred Lender, a leading provider of securities-backed
lines of credit, with one of the few bank-owned commercial vehicle leasing groups. By its company-wide commitment to excellence, The Bancorp
has also been ranked as one of the 100 Fastest-Growing Companies by Fortune, a Top 50 Employer by Equal Opportunity Magazine and was selected
to be included in the S&P Small Cap 600. For more about The Bancorp, visit https://thebancorp.com/.
Forward-Looking Statements
Statements in this earnings release regarding The Bancorp’s business that are not historical facts,
are “forward-looking statements.” These statements may be identified by the use of forward-looking terminology, including,
but not limited to the words “intend,” “may,” “believe,” “will,” “expect,”
“look,” “anticipate,” “plan,” “estimate,” “continue,” or similar words. Forward-looking
statements include, but are not limited to, statements regarding our anticipated 2025, 2026 and 2027 results, including earnings per
share accretion, future growth, productivity and efficiency, the expansion, expected timelines and implementation of our Fintech initiatives,
the possible benefits of our platform restructuring and adoption of AI tools, and share repurchases. Such forward-looking statements
relate to our current assumptions, projections and expectations about our business and future events, including current expectations
about important economic and political factors, among other factors, and are subject to risks and uncertainties, which could cause the
actual results, events or achievements to differ materially from those set forth in or implied by the forward-looking statements and
related assumptions. Factors that could cause results to differ from those expressed in the forward-looking statements also include,
but are not limited to the risks and uncertainties referenced or described in The Bancorp’s filings with the Securities and Exchange
Commission, including the “Risk Factors” and “Management’s Discussion and Analysis of Financial Condition and
Results of Operations” sections of the Company’s Annual Report on Form 10-K/A, as amended, for the fiscal year ended December
31, 2024 and other documents that the Company files from time to time with the Securities and Exchange Commission. The forward-looking
statements speak only as of the date of this press release. The Bancorp does not undertake any duty to publicly revise or update forward-looking
statements in this press release to reflect events or circumstances that arise after the date of this press release, except as may be
required under applicable law.
The Bancorp, Inc. Contact
Andres Viroslav
Director, Investor Relations
215-861-7990
[email protected]
Source: The Bancorp, Inc.
The Bancorp, Inc.
Financial highlights
(unaudited)
| | |
Three months ended | |
Nine months ended |
| | |
September 30, | |
September 30, |
| Condensed Consolidated Income Statements | |
2025 | |
2024 | |
2025 | |
2024 |
| | |
(Dollars in thousands, except per share and share data) |
| | |
| |
| |
| |
|
| Net interest income | |
$ | 94,197 | | |
$ | 93,732 | | |
$ | 283,432 | | |
$ | 281,945 | |
| Provision for credit losses on non-consumer fintech loans | |
| 5,755 | | |
| 3,476 | | |
| 8,123 | | |
| 7,316 | |
| Provision for credit losses on consumer fintech loans | |
| 39,790 | | |
| — | | |
| 128,891 | | |
| — | |
| Provision (reversal) for unfunded commitments | |
| (491 | ) | |
| 79 | | |
| (744 | ) | |
| (340 | ) |
| Non-interest income | |
| | | |
| | | |
| | | |
| | |
| Fintech fees | |
| | | |
| | | |
| | | |
| | |
| ACH, card and other payment processing fees | |
| 5,077 | | |
| 3,892 | | |
| 15,771 | | |
| 9,856 | |
| Prepaid, debit card and related fees | |
| 25,513 | | |
| 23,907 | | |
| 77,340 | | |
| 72,948 | |
| Consumer credit fintech fees | |
| 4,493 | | |
| 1,600 | | |
| 12,063 | | |
| 1,740 | |
| Total fintech fees | |
| 35,083 | | |
| 29,399 | | |
| 105,174 | | |
| 84,544 | |
| Net realized and unrealized gains on commercialloans, at fair value | |
| 1,005 | | |
| 606 | | |
| 1,710 | | |
| 2,205 | |
| Leasing related income | |
| 1,397 | | |
| 1,072 | | |
| 5,500 | | |
| 2,889 | |
| Consumer fintech loan credit enhancement | |
| 39,790 | | |
| — | | |
| 128,891 | | |
| — | |
Other non-interest income(1) | |
| 3,141 | | |
| 1,031 | | |
| 6,526 | | |
| 2,574 | |
| Total non-interest income | |
| 80,416 | | |
| 32,108 | | |
| 247,801 | | |
| 92,212 | |
| Non-interest expense | |
| | | |
| | | |
| | | |
| | |
| Salaries and employee benefits | |
| 37,350 | | |
| 33,821 | | |
| 108,153 | | |
| 97,964 | |
| Data processing expense | |
| 1,259 | | |
| 1,408 | | |
| 3,691 | | |
| 4,252 | |
| Legal expense | |
| 1,483 | | |
| 1,055 | | |
| 5,303 | | |
| 2,509 | |
| FDIC insurance | |
| 905 | | |
| 904 | | |
| 3,160 | | |
| 2,618 | |
| Software | |
| 5,040 | | |
| 4,561 | | |
| 15,197 | | |
| 13,687 | |
| Other non-interest expense | |
| 10,367 | | |
| 11,506 | | |
| 31,417 | | |
| 30,383 | |
| Total non-interest expense | |
| 56,404 | | |
| 53,255 | | |
| 166,921 | | |
| 151,413 | |
| Income before income taxes | |
| 73,155 | | |
| 69,030 | | |
| 228,042 | | |
| 215,768 | |
| Income tax expense | |
| 18,228 | | |
| 17,513 | | |
| 56,121 | | |
| 54,136 | |
| Net income | |
$ | 54,927 | | |
$ | 51,517 | | |
$ | 171,921 | | |
$ | 161,632 | |
| | |
| | | |
| | | |
| | | |
| | |
| Net income per share - basic | |
$ | 1.20 | | |
$ | 1.06 | | |
$ | 3.69 | | |
$ | 3.18 | |
| | |
| | | |
| | | |
| | | |
| | |
| Net income per share - diluted | |
$ | 1.18 | | |
$ | 1.04 | | |
$ | 3.64 | | |
$ | 3.15 | |
| Weighted average shares - basic | |
| 45,865,172 | | |
| 48,759,369 | | |
| 46,554,311 | | |
| 50,807,021 | |
| Weighted average shares - diluted | |
| 46,518,125 | | |
| 49,478,236 | | |
| 47,209,469 | | |
| 51,361,104 | |
(1) For the three and nine months ended September 30, 2025, includes $2.3 million of income from the release of an earnest
money deposit related to the termination of an agreement of sale for a $43.0 million other real estate owned apartment complex property.
| Condensed Consolidated Balance Sheets | |
September 30, | |
June 30, | |
December 31, | |
September 30, |
| | |
2025 (unaudited) | |
2025 (unaudited) | |
2024 | |
2024 (unaudited) |
| | |
(Dollars in thousands, except share data) |
| Assets: | |
| |
| |
| |
|
| Cash and cash equivalents | |
| | | |
| | | |
| | | |
| | |
| Cash and due from banks | |
$ | 10,162 | | |
$ | 11,637 | | |
$ | 6,064 | | |
$ | 8,660 | |
| Interest earning deposits at Federal Reserve Bank | |
| 74,517 | | |
| 328,628 | | |
| 564,059 | | |
| 47,105 | |
| Total cash and cash equivalents | |
| 84,679 | | |
| 340,265 | | |
| 570,123 | | |
| 55,765 | |
| | |
| | | |
| | | |
| | | |
| | |
| Investment securities, available-for-sale, at fair value, net of $10.0 million allowance for credit loss as of September 30, 2024, and $0 for all other periods presented | |
| 1,384,256 | | |
| 1,481,500 | | |
| 1,502,860 | | |
| 1,588,289 | |
| Commercial loans, at fair value | |
| 142,658 | | |
| 185,476 | | |
| 223,115 | | |
| 252,004 | |
| Loans, net of deferred fees and costs | |
| 6,672,637 | | |
| 6,535,432 | | |
| 6,113,628 | | |
| 5,906,616 | |
| Allowance for credit losses | |
| (64,152 | ) | |
| (59,393 | ) | |
| (44,853 | ) | |
| (31,004 | ) |
| Loans, net | |
| 6,608,485 | | |
| 6,476,039 | | |
| 6,068,775 | | |
| 5,875,612 | |
| Federal Home Loan Bank, Atlantic Central Bankers Bank, and Federal Reserve Bank stock | |
| 25,250 | | |
| 16,250 | | |
| 15,642 | | |
| 21,717 | |
| Premises and equipment, net | |
| 25,947 | | |
| 26,495 | | |
| 27,566 | | |
| 28,091 | |
| Accrued interest receivable | |
| 43,831 | | |
| 40,607 | | |
| 41,713 | | |
| 42,915 | |
| Intangible assets, net | |
| 955 | | |
| 1,055 | | |
| 1,254 | | |
| 1,353 | |
| Other real estate owned | |
| 61,974 | | |
| 66,054 | | |
| 62,025 | | |
| 61,739 | |
| Deferred tax asset, net | |
| 10,034 | | |
| 12,436 | | |
| 18,874 | | |
| 9,604 | |
| Credit enhancement asset | |
| 29,318 | | |
| 26,982 | | |
| 12,909 | | |
| — | |
| Other assets | |
| 182,037 | | |
| 166,072 | | |
| 182,687 | | |
| 157,501 | |
| Total assets | |
$ | 8,599,424 | | |
$ | 8,839,231 | | |
$ | 8,727,543 | | |
$ | 8,094,590 | |
| | |
| | | |
| | | |
| | | |
| | |
| Liabilities: | |
| | | |
| | | |
| | | |
| | |
| Deposits | |
| | | |
| | | |
| | | |
| | |
| Demand and interest checking | |
$ | 7,254,896 | | |
$ | 7,705,813 | | |
$ | 7,434,212 | | |
$ | 6,844,128 | |
| Savings and money market | |
| 75,901 | | |
| 60,122 | | |
| 311,834 | | |
| 81,624 | |
| Total deposits | |
| 7,330,797 | | |
| 7,765,935 | | |
| 7,746,046 | | |
| 6,925,752 | |
| | |
| | | |
| | | |
| | | |
| | |
| Short-term borrowings | |
| 200,000 | | |
| — | | |
| — | | |
| 135,000 | |
| Senior debt | |
| 196,052 | | |
| 96,391 | | |
| 96,214 | | |
| 96,125 | |
| Subordinated debenture | |
| 13,401 | | |
| 13,401 | | |
| 13,401 | | |
| 13,401 | |
| Other long-term borrowings | |
| 13,806 | | |
| 13,898 | | |
| 14,081 | | |
| 38,157 | |
| Other liabilities | |
| 67,206 | | |
| 89,340 | | |
| 68,018 | | |
| 70,829 | |
| Total liabilities | |
$ | 7,821,262 | | |
$ | 7,978,965 | | |
$ | 7,937,760 | | |
$ | 7,279,264 | |
| | |
| | | |
| | | |
| | | |
| | |
| Shareholders' equity: | |
| | | |
| | | |
| | | |
| | |
Common stock - authorized, 75,000,000 shares of $1.00 par value(1) | |
| 48,404 | | |
| 48,104 | | |
| 47,713 | | |
| 48,231 | |
| Additional paid-in capital | |
| 19,400 | | |
| 12,608 | | |
| 3,233 | | |
| 26,573 | |
| Retained earnings | |
| 951,076 | | |
| 896,149 | | |
| 779,155 | | |
| 723,247 | |
| Accumulated other comprehensive income (loss) | |
| 8,814 | | |
| 1,609 | | |
| (17,637 | ) | |
| 17,275 | |
Treasury stock at cost(2) | |
| (249,532 | ) | |
| (98,204 | ) | |
| (22,681 | ) | |
| — | |
| Total shareholders' equity | |
| 778,162 | | |
| 860,266 | | |
| 789,783 | | |
| 815,326 | |
| | |
| | | |
| | | |
| | | |
| | |
| Total liabilities and shareholders' equity | |
$ | 8,599,424 | | |
$ | 8,839,231 | | |
$ | 8,727,543 | | |
$ | 8,094,590 | |
| | |
September 30, | |
June 30, | |
December 31, | |
September 30, |
| | |
2025 (unaudited) | |
2025 (unaudited) | |
2024 | |
2024 (unaudited) |
| (1)Common stock | |
| | | |
| | | |
| | | |
| | |
| Shares issued | |
| 48,404,006 | | |
| 48,104,006 | | |
| 47,713,481 | | |
| 48,230,334 | |
| Shares outstanding | |
| 44,528,879 | | |
| 46,262,932 | | |
| 47,310,750 | | |
| 48,230,334 | |
| (2)Treasury stock | |
| 3,875,127 | | |
| 1,841,074 | | |
| 402,731 | | |
| — | |
| Average balance sheet and net interest income | |
Three months ended September 30, 2025 | |
Three months ended September 30, 2024 |
| | |
(Dollars in thousands; unaudited) |
| | |
Average | |
| |
Average | |
Average | |
| |
Average |
| Assets: | |
Balance | |
Interest | |
Rate | |
Balance | |
Interest | |
Rate |
| | |
| |
| |
| |
| |
| |
|
| Interest earning assets: | |
| | | |
| | | |
| | | |
| | | |
| | | |
| | |
Loans, net of deferred fees and costs(1) | |
$ | 6,681,717 | | |
$ | 114,841 | | |
| 6.87 | % | |
$ | 6,017,911 | | |
$ | 116,367 | | |
| 7.73 | % |
Leases-bank qualified(2) | |
| 7,579 | | |
| 179 | | |
| 9.45 | % | |
| 5,151 | | |
| 146 | | |
| 11.34 | % |
| Investment securities-taxable | |
| 1,418,058 | | |
| 17,354 | | |
| 4.90 | % | |
| 1,575,091 | | |
| 19,767 | | |
| 5.02 | % |
Investment securities-nontaxable(2) | |
| 8,385 | | |
| 131 | | |
| 6.25 | % | |
| 2,927 | | |
| 55 | | |
| 7.52 | % |
| Interest earning deposits at Federal Reserve Bank | |
| 354,991 | | |
| 3,954 | | |
| 4.46 | % | |
| 247,344 | | |
| 3,387 | | |
| 5.48 | % |
| Net interest earning assets | |
| 8,470,730 | | |
| 136,459 | | |
| 6.44 | % | |
| 7,848,424 | | |
| 139,722 | | |
| 7.12 | % |
| | |
| | | |
| | | |
| | | |
| | | |
| | | |
| | |
| Allowance for credit losses | |
| (59,166 | ) | |
| | | |
| | | |
| (28,254 | ) | |
| | | |
| | |
| Other assets | |
| 308,654 | | |
| | | |
| | | |
| 222,646 | | |
| | | |
| | |
| | |
$ | 8,720,218 | | |
| | | |
| | | |
$ | 8,042,816 | | |
| | | |
| | |
| | |
| | | |
| | | |
| | | |
| | | |
| | | |
| | |
| Liabilities and Shareholders' Equity: | |
| | | |
| | | |
| | | |
| | | |
| | | |
| | |
| Deposits: | |
| | | |
| | | |
| | | |
| | | |
| | | |
| | |
| Demand and interest checking | |
$ | 7,560,744 | | |
$ | 38,233 | | |
| 2.02 | % | |
$ | 6,942,029 | | |
$ | 42,149 | | |
| 2.43 | % |
| Savings and money market | |
| 64,529 | | |
| 563 | | |
| 3.49 | % | |
| 65,079 | | |
| 549 | | |
| 3.37 | % |
| Total deposits | |
| 7,625,273 | | |
| 38,796 | | |
| 2.04 | % | |
| 7,007,108 | | |
| 42,698 | | |
| 2.44 | % |
| | |
| | | |
| | | |
| | | |
| | | |
| | | |
| | |
| Short-term borrowings | |
| 45,067 | | |
| 495 | | |
| 4.39 | % | |
| 73,480 | | |
| 1,030 | | |
| 5.61 | % |
| Long-term borrowings | |
| 13,866 | | |
| 197 | | |
| 5.68 | % | |
| 38,235 | | |
| 689 | | |
| 7.21 | % |
| Subordinated debentures | |
| 13,401 | | |
| 259 | | |
| 7.73 | % | |
| 13,401 | | |
| 297 | | |
| 8.87 | % |
| Senior debt | |
| 140,992 | | |
| 2,450 | | |
| 6.95 | % | |
| 96,071 | | |
| 1,234 | | |
| 5.14 | % |
| Total deposits and liabilities | |
| 7,838,599 | | |
| 42,197 | | |
| 2.15 | % | |
| 7,228,295 | | |
| 45,948 | | |
| 2.54 | % |
| | |
| | | |
| | | |
| | | |
| | | |
| | | |
| | |
| Other liabilities | |
| 62,405 | | |
| | | |
| | | |
| 18,362 | | |
| | | |
| | |
| Total liabilities | |
| 7,901,004 | | |
| | | |
| | | |
| 7,246,657 | | |
| | | |
| | |
| | |
| | | |
| | | |
| | | |
| | | |
| | | |
| | |
| Shareholders' equity | |
| 819,214 | | |
| | | |
| | | |
| 796,159 | | |
| | | |
| | |
| | |
$ | 8,720,218 | | |
| | | |
| | | |
$ | 8,042,816 | | |
| | | |
| | |
Net interest income on tax equivalent basis(2) | |
| | | |
$ | 94,262 | | |
| | | |
| | | |
$ | 93,774 | | |
| | |
| | |
| | | |
| | | |
| | | |
| | | |
| | | |
| | |
| Tax equivalent adjustment | |
| | | |
| 65 | | |
| | | |
| | | |
| 42 | | |
| | |
| | |
| | | |
| | | |
| | | |
| | | |
| | | |
| | |
| Net interest income | |
| | | |
$ | 94,197 | | |
| | | |
| | | |
$ | 93,732 | | |
| | |
Net interest margin(2) | |
| | | |
| | | |
| 4.45 | % | |
| | | |
| | | |
| 4.78 | % |
|
(1) Includes commercial loans, at fair value. All periods include non-accrual loans. |
(2) Full taxable equivalent basis, using 21% respective statutory federal tax rates in 2025 and
2024. |
| Average balance sheet and net interest income | |
Nine months ended September 30, 2025 | |
Nine months ended September 30, 2024 |
| | |
(Dollars in thousands; unaudited) |
| | |
Average | |
| |
Average | |
Average | |
| |
Average |
| Assets: | |
Balance | |
Interest | |
Rate | |
Balance | |
Interest | |
Rate |
| | |
| |
| |
| |
| |
| |
|
| Interest earning assets: | |
| | | |
| | | |
| | | |
| | | |
| | | |
| | |
Loans, net of deferred fees and costs(1) | |
$ | 6,542,172 | | |
$ | 335,831 | | |
| 6.84 | % | |
$ | 5,828,938 | | |
$ | 345,497 | | |
| 7.90 | % |
Leases-bank qualified(2) | |
| 7,058 | | |
| 492 | | |
| 9.29 | % | |
| 4,840 | | |
| 379 | | |
| 10.44 | % |
Investment securities-taxable(3) | |
| 1,456,402 | | |
| 57,874 | | |
| 5.30 | % | |
| 1,255,532 | | |
| 46,921 | | |
| 4.98 | % |
Investment securities-nontaxable(2) | |
| 7,683 | | |
| 367 | | |
| 6.37 | % | |
| 2,905 | | |
| 155 | | |
| 7.11 | % |
| Interest earning deposits at Federal Reserve Bank | |
| 746,470 | | |
| 24,960 | | |
| 4.46 | % | |
| 486,883 | | |
| 19,948 | | |
| 5.46 | % |
| Net interest earning assets | |
| 8,759,785 | | |
| 419,524 | | |
| 6.39 | % | |
| 7,579,098 | | |
| 412,900 | | |
| 7.26 | % |
| | |
| | | |
| | | |
| | | |
| | | |
| | | |
| | |
| Allowance for credit losses | |
| (52,227 | ) | |
| | | |
| | | |
| (27,993 | ) | |
| | | |
| | |
| Other assets | |
| 341,661 | | |
| | | |
| | | |
| 280,733 | | |
| | | |
| | |
| | |
$ | 9,049,219 | | |
| | | |
| | | |
$ | 7,831,838 | | |
| | | |
| | |
| | |
| | | |
| | | |
| | | |
| | | |
| | | |
| | |
| Liabilities and Shareholders' Equity: | |
| | | |
| | | |
| | | |
| | | |
| | | |
| | |
| Deposits: | |
| | | |
| | | |
| | | |
| | | |
| | | |
| | |
| Demand and interest checking | |
$ | 7,906,597 | | |
$ | 126,680 | | |
| 2.14 | % | |
$ | 6,684,671 | | |
$ | 120,405 | | |
| 2.40 | % |
| Savings and money market | |
| 88,687 | | |
| 2,454 | | |
| 3.69 | % | |
| 58,777 | | |
| 1,453 | | |
| 3.30 | % |
| Total deposits | |
| 7,995,284 | | |
| 129,134 | | |
| 2.15 | % | |
| 6,743,448 | | |
| 121,858 | | |
| 2.41 | % |
| | |
| | | |
| | | |
| | | |
| | | |
| | | |
| | |
| Short-term borrowings | |
| 15,334 | | |
| 500 | | |
| 4.35 | % | |
| 55,820 | | |
| 2,344 | | |
| 5.60 | % |
| Repurchase agreements | |
| — | | |
| — | | |
| — | | |
| 4 | | |
| — | | |
| — | |
| Long-term borrowings | |
| 13,957 | | |
| 590 | | |
| 5.64 | % | |
| 38,371 | | |
| 2,060 | | |
| 7.16 | % |
| Subordinated debentures | |
| 13,401 | | |
| 771 | | |
| 7.67 | % | |
| 13,401 | | |
| 880 | | |
| 8.76 | % |
| Senior debt | |
| 111,354 | | |
| 4,917 | | |
| 5.89 | % | |
| 95,983 | | |
| 3,701 | | |
| 5.14 | % |
| Total deposits and liabilities | |
| 8,149,330 | | |
| 135,912 | | |
| 2.22 | % | |
| 6,947,027 | | |
| 130,843 | | |
| 2.51 | % |
| | |
| | | |
| | | |
| | | |
| | | |
| | | |
| | |
| Other liabilities | |
| 115,916 | | |
| | | |
| | | |
| 73,507 | | |
| | | |
| | |
| Total liabilities | |
| 8,265,246 | | |
| | | |
| | | |
| 7,020,534 | | |
| | | |
| | |
| | |
| | | |
| | | |
| | | |
| | | |
| | | |
| | |
| Shareholders' equity | |
| 783,973 | | |
| | | |
| | | |
| 811,304 | | |
| | | |
| | |
| | |
$ | 9,049,219 | | |
| | | |
| | | |
$ | 7,831,838 | | |
| | | |
| | |
Net interest income on tax equivalent basis(2) | |
| | | |
$ | 283,612 | | |
| | | |
| | | |
$ | 282,057 | | |
| | |
| | |
| | | |
| | | |
| | | |
| | | |
| | | |
| | |
| Tax equivalent adjustment | |
| | | |
| 180 | | |
| | | |
| | | |
| 112 | | |
| | |
| | |
| | | |
| | | |
| | | |
| | | |
| | | |
| | |
| Net interest income | |
| | | |
$ | 283,432 | | |
| | | |
| | | |
$ | 281,945 | | |
| | |
Net interest margin(2) | |
| | | |
| | | |
| 4.32 | % | |
| | | |
| | | |
| 4.96 | % |
(1) Includes commercial loans, at fair value. All periods include non-accrual loans.
(2) Full taxable equivalent basis, using 21% respective statutory federal tax rates in 2025 and
2024.
(3) The nine months ended September 30, 2025 includes $3.0 million of interest income from a security
that was known as “CRE-2” and which relates to the Company’s discontinued commercial real estate securitization business.
The CRE-2 interest was repaid in the second quarter of 2025 as a result of the final sale of underlying collateral related to that security.
CRE-2 was the last security remaining related to the Company’s discontinued commercial real estate securitization business.
| Capital ratios | |
Tier 1 capital | |
Tier 1 capital | |
Total capital | |
Common equity |
| | |
to average | |
to risk-weighted | |
to risk-weighted | |
Tier 1 to risk |
| | |
assets ratio | |
assets ratio | |
assets ratio | |
weighted assets |
| As of September 30, 2025 | |
| | | |
| | | |
| | | |
| | |
| The Bancorp, Inc. | |
| 8.74% | | |
| 12.99% | | |
| 14.09% | | |
| 12.99% | |
| The Bancorp Bank, National Association | |
| 9.85% | | |
| 14.66% | | |
| 15.77% | | |
| 14.66% | |
| "Well capitalized" institution (under federal regulations-Basel III) | |
| 5.00% | | |
| 8.00% | | |
| 10.00% | | |
| 6.50% | |
| | |
| | | |
| | | |
| | | |
| | |
| As of December 31, 2024 | |
| | | |
| | | |
| | | |
| | |
| The Bancorp, Inc. | |
| 9.41% | | |
| 13.85% | | |
| 14.65% | | |
| 13.85% | |
| The Bancorp Bank, National Association | |
| 10.38% | | |
| 15.25% | | |
| 16.06% | | |
| 15.25% | |
| "Well capitalized" institution (under federal regulations-Basel III) | |
| 5.00% | | |
| 8.00% | | |
| 10.00% | | |
| 6.50% | |
| | |
| |
| |
| |
|
| | |
Three months ended | |
Nine months ended |
| | |
September 30, | |
September 30, |
| | |
2025 | |
2024 | |
2025 | |
2024 |
| Selected operating ratios | |
| | | |
| | | |
| | | |
| | |
Return on average assets(1) | |
| 2.50% | | |
| 2.55% | | |
| 2.54% | | |
| 2.76% | |
Return on average equity(1) | |
| 26.60% | | |
| 25.74% | | |
| 29.32% | | |
| 26.61% | |
| Net interest margin | |
| 4.45% | | |
| 4.78% | | |
| 4.32% | | |
| 4.96% | |
(1) Annualized.
Book value per share table |
September 30, |
|
June 30, |
|
December 31, |
September 30, |
|
2025 |
|
2025 |
|
2024 |
|
2024 |
Book value per share |
$ |
17.48 |
|
$ |
18.60 |
|
$ |
16.69 |
|
$ |
16.90 |
Gross dollar volume (“GDV”)(1) | |
Three months ended |
| | |
September 30, | |
June 30, | |
December 31, | |
September 30, |
| | |
2025 | |
2025 | |
2024 | |
2024 |
| | |
(Dollars in thousands) |
| Prepaid and debit card GDV | |
$ | 44,037,511 | | |
$ | 43,649,005 | | |
$ | 39,656,909 | | |
$ | 37,898,006 | |
(1) Gross dollar volume represents the total dollar amount spent on prepaid, debit and credit cards issued by The Bancorp
Bank, N.A.
Business line quarterly summary: |
Quarter ended September 30, 2025 |
(Dollars in millions) |
|
|
|
|
|
Balances |
|
|
|
|
|
|
|
|
|
|
|
|
% Growth |
|
|
|
|
|
Major business lines |
|
Average approximate rates(1) |
|
|
Total loan portfolio(2) |
|
Year over Year |
|
Linked quarter annualized |
|
|
|
|
|
Loans |
|
|
|
|
|
|
|
|
|
|
|
|
|
|
Institutional banking(3) |
|
6.5% |
|
$ |
1,895 |
|
6% |
|
5% |
|
|
|
|
|
Small business lending(4) |
|
7.6% |
|
|
1,059 |
|
12% |
|
9% |
|
|
|
|
|
Direct lease financing |
|
8.1% |
|
|
693 |
|
(3%) |
|
(3%) |
|
|
|
|
|
Real estate bridge loans (non-SBA) - recorded at fair value |
|
6.6% |
|
|
71 |
|
nm |
|
nm |
|
|
|
|
|
Real estate bridge loans - recorded at amortized cost |
|
8.5% |
|
|
2,132 |
|
(3%) |
|
(1%) |
|
|
|
|
|
Consumer fintech loans - interest bearing |
|
5.1% |
|
|
105 |
|
nm |
|
nm |
|
|
|
|
|
Consumer fintech loans - non-interest bearing(5) |
|
— |
|
|
680 |
|
nm |
|
nm |
|
|
|
|
|
Other loans(6) |
|
5.9% |
|
|
164 |
|
nm |
|
(14%) |
|
|
|
|
|
Unamortized loan fees and costs |
|
— |
|
|
16 |
|
nm |
|
nm |
|
|
|
|
|
Weighted average yield |
|
6.8% |
|
$ |
6,815 |
|
|
|
|
|
|
Non-interest income: Fintech fees |
|
|
|
|
|
|
|
|
|
|
|
|
|
|
% Growth |
Deposits: Fintech solutions group |
|
|
|
|
|
|
|
|
|
|
|
Current quarter |
|
Year over Year |
Fintech deposits and fees |
|
2.1% |
|
$ |
7,342 |
|
10% |
|
nm |
|
$ |
35.1 |
|
19% |
(1) Average rates are for the three months ended September 30, 2025.
(2) Loan and deposit categories are based on period-end and average quarterly balances, respectively. Total loan portfolio
includes both loans recorded at amortized cost and loans at fair value.
(3) Institutional Banking loans are comprised of securities-backed lines of credit (“SBLOC’) loans collateralized
by marketable securities, insurance-backed lines of credit (“IBLOC”) loans collateralized by the cash surrender value of
eligible life insurance policies, and investment advisor financing.
(4) Small Business Lending (“SBL”) is substantially comprised of Small Business Administration (“SBA”)-guaranteed
loans and includes SBL loans at fair value. Growth rates exclude the impact of $4 million of loans that do not qualify for true sale
accounting at September 30, 2025 compared to $4 million at prior quarter end and $28 million at September 30, 2024.
(5) Income related to non-interest-bearing balances is included in non-interest income.
(6) Includes warehouse financing related to loan sales to third-party purchasers of $122.5 million.
Summary of credit lines available
The Bancorp Bank, N.A. maintains lines of credit exceeding potential liquidity requirements as follows. The Bancorp also has access to
other substantial sources of liquidity.
| | |
September 30, 2025 |
| | |
| (Dollars in thousands) | |
| Federal Reserve Bank | |
$ | 2,064,218 | |
| Federal Home Loan Bank | |
| 912,186 | |
| Total lines of credit capacity | |
$ | 2,976,404 | |
| | |
| | |
| Current balance – Short-term borrowings | |
| 200,000 | |
| Available capacity | |
$ | 2,776,404 | |
Estimated insured vs. uninsured deposits
The vast majority of The Bancorp Bank, N.A.’s deposits are low balance, insured deposits, and accordingly do not constitute the
liquidity risk experienced by certain institutions. The deposit base is comprised as follows:
| | |
September 30, 2025 |
| Insured | |
| 92% | |
Low balance accounts(1) | |
| 3% | |
| Other uninsured | |
| 5% | |
| Total deposits | |
| 100% | |
(1) Comprised of small balances, such as anonymous gift cards and corporate incentive cards
for which there is no identified depositor.
Loan Portfolio | |
September 30, | |
June 30, | |
December 31, | |
September 30, |
| | |
2025 (unaudited) | |
2025 (unaudited) | |
2024 | |
2024 (unaudited) |
| |
(Dollars in thousands) |
| SBL non-real estate | |
$ | 222,933 | | |
$ | 204,087 | | |
$ | 190,322 | | |
$ | 179,915 | |
| SBL commercial mortgage | |
| 729,620 | | |
| 723,754 | | |
| 662,091 | | |
| 665,608 | |
| SBL construction | |
| 34,518 | | |
| 30,705 | | |
| 34,685 | | |
| 30,158 | |
| Small business loans | |
| 987,071 | | |
| 958,546 | | |
| 887,098 | | |
| 875,681 | |
| Direct lease financing | |
| 693,322 | | |
| 698,086 | | |
| 700,553 | | |
| 711,836 | |
SBLOC / IBLOC(1) | |
| 1,609,047 | | |
| 1,601,405 | | |
| 1,564,018 | | |
| 1,543,215 | |
| Advisor financing | |
| 285,531 | | |
| 272,155 | | |
| 273,896 | | |
| 248,422 | |
| Real estate bridge loans | |
| 2,131,689 | | |
| 2,140,039 | | |
| 2,109,041 | | |
| 2,189,761 | |
Consumer fintech(2) | |
| 785,045 | | |
| 680,487 | | |
| 454,357 | | |
| 280,092 | |
| Other loans | |
| 164,487 | | |
| 169,945 | | |
| 111,328 | | |
| 46,586 | |
| | |
| 6,656,192 | | |
| 6,520,663 | | |
| 6,100,291 | | |
| 5,895,593 | |
| Unamortized loan fees and costs | |
| 16,445 | | |
| 14,769 | | |
| 13,337 | | |
| 11,023 | |
| Total loans, including unamortized fees and costs | |
$ | 6,672,637 | | |
$ | 6,535,432 | | |
$ | 6,113,628 | | |
$ | 5,906,616 | |
(1) SBLOC loans are collateralized by marketable securities, while IBLOC are collateralized by
the cash surrender value of insurance policies. At September 30, 2025 and December 31, 2024, IBLOC loans
amounted to $471.6 million and $548.1 million, respectively.
(2) At September 30, 2025, consumer fintech loans consisted of $416.0 million of secured credit card loans, with the balance
comprised of other short-term extensions of credit.
The Bancorp Bank, N.A. emphasizes safety and soundness, and its balance sheet has a risk profile enhanced
by the special nature of the collateral supporting its loan niches, related underwriting, and the characteristics of its funding sources,
including those highlighted in the bullets below. Those loan niches and funding sources have contributed to increased earnings levels,
even during periods in which markets have experienced various economic stresses.
At September 30, 2025, consumer fintech loans included $416.0 million of secured credit card accounts,
which are backed dollar for dollar by cash collateral by each individual cardholder and are required to be repaid in-full monthly. The
remaining consumer fintech loans consist of cashflow underwritten short-term liquidity products to individual borrowers ranging in maturities
from 30 to 365 days, with The Bancorp Bank, N.A.’s partner(s) providing a full guarantee against losses. The Bancorp Bank, N.A.
maintains cash collateral for the expected losses on dollars already lent, as well as right of offset against other revenues generated
through those relationships.
The REBL portfolio is largely comprised of rehabilitation bridge loans for apartment buildings. The Company
has minimal exposure to non-multifamily commercial real estate such as office buildings. These loans generally have three-year terms
with two one-year extension options to allow for the rehabilitation work to be completed and rentals stabilized for an extended period,
before being refinanced at lower rates through U.S. Government Sponsored Entities or other lenders.
The REBL portfolio consists primarily of workforce housing, which we consider to be working class apartments
at more affordable rental rates. Related collateral values should accordingly be more stable than higher rent properties, even in stressed
economies. While the macro-economic environment has challenged the multifamily bridge space, the stability of the Company’s
REBL portfolio is evidenced by the estimated values of the underlying collateral. The Company’s $2.13 billion REBL portfolio at
September 30, 2025 has a weighted average origination date “as is” loan-to-value ratio of 70%, based on third-party appraisals.
Further, the weighted average origination date “as stabilized” loan-to-value ratio (“LTV”), which measures the
estimated value of the apartments after the rehabilitation is complete, may provide even greater protection.
As part of the underwriting process, The Bancorp Bank, N.A. reviews prospective borrowers’ previous
rehabilitation experience in addition to overall financial wherewithal. These transactions also include significant borrower equity
contributions with required performance metrics. Underwriting generally includes, but is not limited to, assessment of local
market information relating to vacancy and rental rates, review of post rehabilitation rental rate assumptions against geo-specific affordability
indices, negative news searches, lien searches, visitations by bank personnel and/or designated engineers, and other information sources.
Rehabilitation progress is monitored through ongoing draw requests and financial reporting covenants. This generally allows for early
identification of potential issues and expedited action to address on a timely basis.
Operations and ongoing loan evaluation are overseen by multiple levels of management in addition to the
REBL team’s experienced professional staff and third-party consultants utilized during the underwriting and asset management process.
This oversight includes a separate loan committee specific to REBL, which is comprised of seasoned and experienced lending professionals
who do not directly report to anyone on the REBL team. There is also a separate loan review department, a surveillance committee and
additional staff which evaluate potential losses under the current expected credit losses methodology, all of which similarly do not
report to anyone on the REBL team.
The SBLOC and IBLOC portfolios are respectively secured by marketable securities and the cash value of
life insurance. The majority of SBA 7(a) loans are government guaranteed, while SBA 504 loans are made with 50%-60% LTVs.
Additional details regarding our loan portfolios are included in the following sections of this press release.
This press release also discloses in this press release is the summarization of the earnings contributions of our payments businesses,
which further enhances The Bancorp’s risk profile. The Company’s risk profile inherent in its loan portfolios, funding, and
earnings levels, may present opportunities to further increase stockholder value, while still prudently maintaining capital levels.
Small Business Lending
Small business loans as of September 30, 2025
| | |
Loan principal |
| | |
(Dollars in millions) |
Commercial mortgage SBA(1) | |
$ | 378 | |
Construction SBA(2) | |
| 21 | |
Non-guaranteed portion of U.S. government guaranteed 7(a) Program loans(3) | |
| 121 | |
| Non-SBA SBLs | |
| 128 | |
| Subtotal - SBL loans, excluding guaranteed portion and Other | |
$ | 648 | |
U.S. government guaranteed portion of SBA loans(4) | |
| 407 | |
Other(5) | |
| 4 | |
| Total SBL principal | |
$ | 1,059 | |
| | |
| | |
| SBL, at amortized cost | |
| 987 | |
SBL, included in loans, at fair value(6) | |
| 72 | |
| Total SBL principal | |
$ | 1,059 | |
(1) Substantially all these loans are made under the 504 Program, which dictates origination date
LTV percentages, generally 50%-60%, to which The Bancorp Bank, N.A. adheres.
(2) Includes $15 million in 504 Program first mortgages with an origination date LTV of 50%-60%,
and $6 million in SBA interim loans with an approved SBA post-construction full takeout/payoff.
(3) Includes the unguaranteed portion of 7(a) Program loans which are 70% or more guaranteed by
the U.S. government. SBA 7(a) Program loans are not made on the basis of real estate LTV; however, they are subject to SBA's "All Available
Collateral" rule which mandates that to the extent a borrower or its 20% or greater principals have available collateral (including personal
residences), the borrower must pledge that available collateral to fully collateralize the loan, after applying SBA-determined liquidation
rates. In addition, all 7(a) Program loans and 504 Program loans require the personal guaranty of all 20% or greater owners.
(4) Includes the portion of SBA 7(a) Program loans which have been guaranteed by the U.S. government,
and therefore are assumed to have no credit risk.
(5) Comprised of $4 million of loans sold that do not qualify for true sale accounting.
(6) The SBLs held at fair value are comprised of the government guaranteed portion of 7(a) Program
loans at the dates indicated.
Small business loans by type as of September 30, 2025
(Excludes government guaranteed portion of SBA 7(a) Program and Other loans)
| | |
SBL commercial mortgage(1) | |
SBL construction(1) | |
SBL non-real estate | |
Total | |
% Total |
| | |
(Dollars in millions) |
| Funeral homes and funeral services | |
$ | 45 | | |
$ | — | | |
$ | 39 | | |
$ | 84 | | |
| 13 | % |
| Hotels (except casino hotels) and motels | |
| 83 | | |
| — | | |
| — | | |
| 83 | | |
| 13 | % |
| Full-service restaurants | |
| 31 | | |
| 2 | | |
| 3 | | |
| 36 | | |
| 6 | % |
| Child day care services | |
| 26 | | |
| — | | |
| 4 | | |
| 30 | | |
| 5 | % |
| Car washes | |
| 11 | | |
| 13 | | |
| — | | |
| 24 | | |
| 4 | % |
| Homes for the elderly | |
| 21 | | |
| — | | |
| — | | |
| 21 | | |
| 3 | % |
| Gasoline stations with convenience stores | |
| 15 | | |
| 1 | | |
| — | | |
| 16 | | |
| 2 | % |
| Outpatient mental health and substance abuse centers | |
| 15 | | |
| — | | |
| — | | |
| 15 | | |
| 2 | % |
| General line grocery merchant wholesalers | |
| 13 | | |
| — | | |
| — | | |
| 13 | | |
| 2 | % |
| Plumbing, heating, and air-conditioning companies | |
| 10 | | |
| — | | |
| 1 | | |
| 11 | | |
| 2 | % |
| Fitness and recreational sports centers | |
| 7 | | |
| — | | |
| 2 | | |
| 9 | | |
| 1 | % |
| Caterers | |
| 9 | | |
| — | | |
| — | | |
| 9 | | |
| 1 | % |
| Offices of lawyers | |
| 9 | | |
| — | | |
| — | | |
| 9 | | |
| 1 | % |
| Limited-service restaurants | |
| 4 | | |
| — | | |
| 3 | | |
| 7 | | |
| 1 | % |
| All other specialty trade contractors | |
| 6 | | |
| — | | |
| 1 | | |
| 7 | | |
| 1 | % |
| Used car dealers | |
| 7 | | |
| — | | |
| — | | |
| 7 | | |
| 1 | % |
| Charter bus industry | |
| 6 | | |
| — | | |
| — | | |
| 6 | | |
| 1 | % |
| Lessors of nonresidential buildings | |
| 6 | | |
| — | | |
| — | | |
| 6 | | |
| 1 | % |
| General warehousing and storage | |
| 6 | | |
| — | | |
| — | | |
| 6 | | |
| 1 | % |
| Automotive body, paint, and interior repair | |
| 6 | | |
| — | | |
| — | | |
| 6 | | |
| 1 | % |
| Nursing care facilities | |
| 6 | | |
| — | | |
| — | | |
| 6 | | |
| 1 | % |
| Appliance repair and maintenance | |
| 6 | | |
| — | | |
| — | | |
| 6 | | |
| 1 | % |
| Residential remodelers | |
| 5 | | |
| — | | |
| — | | |
| 5 | | |
| 1 | % |
| Offices of dentists | |
| 5 | | |
| — | | |
| — | | |
| 5 | | |
| 1 | % |
Other(2) | |
| 179 | | |
| 8 | | |
| 34 | | |
| 221 | | |
| 34 | % |
| Total | |
$ | 537 | | |
$ | 24 | | |
$ | 87 | | |
$ | 648 | | |
| 100 | % |
(1) Of the SBL commercial mortgage and SBL construction loans, $162 million represents the total
of the non-guaranteed portion of SBA 7(a) Program loans and non-SBA loans. The balance of those categories represents SBA 504 Program
loans with 50%-60% origination date LTVs. SBL Commercial excludes $4 million of loans sold that do not qualify for true sale accounting.
(2) Loan types of less than $5 million are spread over approximately one hundred different
business types.
SBL State diversification as of September 30, 2025
(Excludes government guaranteed portion of SBA 7(a) Program loans and Other loans)
| | |
SBL commercial mortgage(1) | |
SBL construction(1) | |
SBL non-real estate | |
Total | |
% Total |
| | |
(Dollars in millions) |
| California | |
$ | 142 | | |
$ | 7 | | |
$ | 9 | | |
$ | 158 | | |
| 24 | % |
| Florida | |
| 85 | | |
| 8 | | |
| 5 | | |
| 98 | | |
| 15 | % |
| North Carolina | |
| 44 | | |
| — | | |
| 4 | | |
| 48 | | |
| 7 | % |
| New York | |
| 41 | | |
| — | | |
| 3 | | |
| 44 | | |
| 7 | % |
| Texas | |
| 30 | | |
| 5 | | |
| 6 | | |
| 41 | | |
| 6 | % |
| New Jersey | |
| 30 | | |
| — | | |
| 9 | | |
| 39 | | |
| 6 | % |
| Georgia | |
| 29 | | |
| 3 | | |
| 2 | | |
| 34 | | |
| 5 | % |
| Pennsylvania | |
| 19 | | |
| — | | |
| 13 | | |
| 32 | | |
| 5 | % |
| Maine | |
| 17 | | |
| — | | |
| 12 | | |
| 29 | | |
| 4 | % |
| Other states | |
| 100 | | |
| 1 | | |
| 24 | | |
| 125 | | |
| 21 | % |
| Total | |
$ | 537 | | |
$ | 24 | | |
$ | 87 | | |
$ | 648 | | |
| 100 | % |
(1) Of the SBL commercial mortgage and SBL construction loans, $162 million represents the
total of the non-guaranteed portion of SBA 7(a) Program loans and non-SBA loans. The balance of those categories represents SBA 504 Program
loans with 50%-60% origination date LTVs. SBL Commercial excludes $4 million of loans that do not qualify for true sale accounting.
Top 10 SBL loans as of September 30, 2025
(Excludes government guaranteed portion of SBA 7(a) Program loans and Other loans)
Type |
|
State |
|
Balance |
|
|
|
|
(Dollars in millions) |
General line grocery merchant wholesalers |
|
|
CA |
|
$ |
13 |
|
Funeral homes and funeral services |
|
|
ME |
|
|
12 |
|
Funeral homes and funeral services |
|
|
PA |
|
|
12 |
|
Outpatient mental health and substance abuse center |
|
|
FL |
|
|
10 |
|
Hotel |
|
|
FL |
|
|
8 |
|
Funeral homes and funeral services |
|
|
ME |
|
|
8 |
|
Lawyer's office |
|
|
CA |
|
|
8 |
|
Hotel |
|
|
VA |
|
|
7 |
|
Hotel |
|
|
NC |
|
|
7 |
|
Charter bus industry |
|
|
NY |
|
|
6 |
|
Total |
|
|
|
|
$ |
91 |
|
Commercial Real Estate Bridge Lending
Commercial real estate bridge lending, excluding SBA loans, are as follows:
Type as of September 30, 2025
| Type | |
# Loans | |
Balance | |
Weighted average origination date LTV | |
Weighted average interest rate |
| | |
(Dollars in millions) |
Real estate bridge loans (multifamily apartment loans recorded at amortized cost)(1) | |
| 178 | | |
$ | 2,132 | | |
| 70% | | |
| 8.48% | |
| Real estate bridge loans (non-SBA), at fair value | |
| 5 | | |
| 71 | | |
| 66% | | |
| 6.60% | |
| Total commercial real estate loans | |
| 183 | | |
$ | 2,203 | | |
| 70% | | |
| 8.42% | |
(1) In the third quarter of 2021, we resumed the origination of bridge loans for multi-family
apartment rehabilitation which comprise these categories. Such loans held at fair value were originally intended for sale but are now
being retained on the balance sheet. In addition to “as is” origination date appraisals, on which the weighted average origination
date LTVs are based, third-party appraisers also estimated “as stabilized” values, which represents additional potential
collateral value as rehabilitation progresses, and units are re-leased at stabilized rental rates. The weighted average origination date
“as stabilized” LTV was estimated at 60%.
State diversification as of September 30, 2025 |
|
|
15 largest loans as of September 30, 2025 |
|
|
|
|
|
|
|
|
|
|
|
|
|
|
|
|
State |
|
|
Balance |
|
Origination date LTV |
|
State |
|
|
|
Balance |
|
Origination date LTV |
(Dollars in millions) |
|
|
(Dollars in millions) |
Texas |
|
$ |
618 |
|
|
71% |
|
|
Texas |
|
|
$ |
46 |
|
75% |
Georgia |
|
|
317 |
|
|
70% |
|
|
Texas |
|
|
|
41 |
|
64% |
Florida |
|
|
233 |
|
|
68% |
|
|
Michigan |
|
|
|
39 |
|
62% |
New Jersey |
|
|
138 |
|
|
69% |
|
|
New Jersey |
|
|
|
35 |
|
62% |
Indiana |
|
|
137 |
|
|
71% |
|
|
Florida |
|
|
|
35 |
|
72% |
Ohio |
|
|
120 |
|
|
71% |
|
|
Pennsylvania |
|
|
|
34 |
|
63% |
Michigan |
|
|
75 |
|
|
64% |
|
|
Indiana |
|
|
|
34 |
|
76% |
Other states each <$70 million |
|
|
565 |
|
|
69% |
|
|
Texas |
|
|
|
32 |
|
67% |
Total |
|
$ |
2,203 |
|
|
70% |
|
|
New Jersey |
|
|
|
31 |
|
71% |
|
|
|
|
|
|
|
|
|
Texas |
|
|
|
31 |
|
77% |
|
|
|
|
|
|
|
|
|
Georgia |
|
|
|
30 |
|
69% |
|
|
|
|
|
|
|
|
|
Ohio |
|
|
|
29 |
|
74% |
|
|
|
|
|
|
|
|
|
Texas |
|
|
|
27 |
|
79% |
|
|
|
|
|
|
|
|
|
New Jersey |
|
|
|
26 |
|
71% |
|
|
|
|
|
|
|
|
|
Texas |
|
|
|
25 |
|
70% |
|
|
|
|
|
|
|
|
|
15 largest commercial real estate loans |
|
|
$ |
495 |
|
70% |
Institutional Banking
Institutional banking loans outstanding at September 30, 2025
Type |
Principal |
|
% of total |
|
|
(Dollars in millions) |
|
|
SBLOC |
$ |
1,137 |
|
60% |
IBLOC |
|
472 |
|
25% |
Advisor financing |
|
286 |
|
15% |
Total |
$ |
1,895 |
|
100% |
SBLOC
For SBLOC, we generally lend up to 50% of the value of equities and 80% for investment grade securities. While
the value of equities has fallen in excess of 30% in recent years, the reduction in collateral value of brokerage accounts collateralizing
SBLOC loans generally has been less, for two reasons. First, many collateral accounts are “balanced” and accordingly have
a component of debt securities, which have either not decreased in value as much as equities, or in some cases may have increased in
value. Second, many of these accounts have the benefit of professional investment advisors who provided some protection against market
downturns, through diversification and other means. Additionally, borrowers often utilize only a portion of collateral value, which lowers
the percentage of principal to collateral.
Top 10 SBLOC loans at September 30, 2025
|
Principal amount |
|
% Principal to collateral |
|
(Dollars in millions) |
|
$ |
24 |
|
10% |
|
|
10 |
|
34% |
|
|
9 |
|
35% |
|
|
8 |
|
83% |
|
|
8 |
|
10% |
|
|
8 |
|
46% |
|
|
7 |
|
20% |
|
|
7 |
|
4% |
|
|
6 |
|
33% |
|
|
6 |
|
37% |
Total and weighted average |
$ |
93 |
|
28% |
IBLOC
IBLOC loans are backed by the cash value of eligible life insurance policies which have been assigned to us. We
generally lend up to 95% of such cash value. Our underwriting standards require approval of the insurance companies which carry the policies
backing these loans. Currently, ten insurance companies have been approved and, as of October 28, 2025, all were rated A- (Excellent)
or better by AM BEST.
Direct Lease Financing
Direct lease financing by type as of September 30, 2025
|
|
Principal balance(1) |
|
% Total |
|
|
(Dollars in millions) |
|
|
Government agencies and public institutions(2) |
$ |
131 |
|
19% |
Real estate and rental and leasing |
|
130 |
|
19% |
Construction |
|
124 |
|
18% |
Waste management and remediation services |
|
94 |
|
14% |
Health care and social assistance |
|
29 |
|
4% |
Other services (except public administration) |
|
25 |
|
4% |
Professional, scientific, and technical services |
|
20 |
|
3% |
Transit and other transportation |
|
19 |
|
3% |
Wholesale trade |
|
17 |
|
2% |
General freight trucking |
|
12 |
|
2% |
Arts, entertainment, and recreation |
|
11 |
|
2% |
Finance and insurance |
|
10 |
|
1% |
Other |
|
71 |
|
9% |
Total |
$ |
693 |
|
100% |
(1) Of the total $693 million of direct lease financing, $640 million consisted of vehicle and
financing leases with the remaining balance consisting of equipment leases.
(2) Includes public universities as well as school districts.
Direct lease financing by state as of September 30, 2025
State |
|
Principal balance |
|
% Total |
|
|
(Dollars in millions) |
|
|
Florida |
$ |
120 |
|
17% |
New York |
|
56 |
|
9% |
Utah |
|
53 |
|
8% |
Connecticut |
|
48 |
|
7% |
California |
|
43 |
|
6% |
Pennsylvania |
|
40 |
|
6% |
Texas |
|
37 |
|
5% |
Maryland |
|
30 |
|
4% |
New Jersey |
|
29 |
|
4% |
North Carolina |
|
21 |
|
3% |
Idaho |
|
19 |
|
3% |
Alabama |
|
17 |
|
2% |
Georgia |
|
16 |
|
2% |
Ohio |
|
15 |
|
2% |
Tennessee |
|
13 |
|
2% |
Other states |
|
136 |
|
20% |
Total |
$ |
693 |
|
100% |
Portfolio Performance
| Allowance for credit losses | |
Nine months ended | |
Year ended |
| | |
September 30, | |
September 30, | |
December 31, |
| | |
2025 (unaudited) | |
2024 (unaudited) | |
2024 |
| | |
(Dollars in thousands) |
| | |
| |
| |
|
| Balance in the allowance for credit losses at beginning of period | |
$ | 44,853 | | |
$ | 27,378 | | |
$ | 27,378 | |
| | |
| | | |
| | | |
| | |
| Loans charged-off: | |
| | | |
| | | |
| | |
| SBA non-real estate | |
| 546 | | |
| 431 | | |
| 708 | |
| Direct lease financing | |
| 4,416 | | |
| 3,625 | | |
| 4,575 | |
| Consumer fintech | |
| 142,062 | | |
| — | | |
| 19,619 | |
| Other loans | |
| 924 | | |
| 16 | | |
| 18 | |
| Total | |
| 147,948 | | |
| 4,072 | | |
| 24,920 | |
| | |
| | | |
| | | |
| | |
| Recoveries: | |
| | | |
| | | |
| | |
| SBA non-real estate | |
| 73 | | |
| 102 | | |
| 229 | |
| Direct lease financing | |
| 575 | | |
| 279 | | |
| 318 | |
| Consumer fintech | |
| 29,580 | | |
| — | | |
| 1,877 | |
| Other loans | |
| 5 | | |
| 1 | | |
| 1 | |
| Total | |
| 30,233 | | |
| 382 | | |
| 2,425 | |
| Net charge-offs | |
| 117,715 | | |
| 3,690 | | |
| 22,495 | |
| Provision for credit losses on non-consumer fintech loans | |
| 8,123 | | |
| 7,316 | | |
| 9,319 | |
| Provision for credit losses on consumer fintech loans | |
| 128,891 | | |
| — | | |
| 30,651 | |
| | |
| | | |
| | | |
| | |
| Balance in allowance for credit losses at end of period | |
$ | 64,152 | | |
$ | 31,004 | | |
$ | 44,853 | |
| Net charge-offs/average loans | |
| 1.85% | | |
| 0.07% | | |
| 0.40% | |
| Net charge-offs/average assets | |
| 1.30% | | |
| 0.05% | | |
| 0.28% | |
| Loan delinquency and Non-accrual | |
September 30, 2025 |
| | |
30-59 days
past due | |
60-89 days
past due | |
90+ days
still accruing | |
Non-accrual | |
Total
past due | |
Current | |
Total
loans |
| SBL non-real estate | |
$ | — | | |
$ | — | | |
$ | 2 | | |
$ | 7,125 | | |
$ | 7,127 | | |
$ | 215,806 | | |
$ | 222,933 | |
| SBL commercial mortgage | |
| — | | |
| — | | |
| — | | |
| 16,178 | | |
| 16,178 | | |
| 713,442 | | |
| 729,620 | |
| SBL construction | |
| — | | |
| — | | |
| — | | |
| 2,917 | | |
| 2,917 | | |
| 31,601 | | |
| 34,518 | |
| Direct lease financing | |
| 2,422 | | |
| 8,045 | | |
| 251 | | |
| 5,896 | | |
| 16,614 | | |
| 676,708 | | |
| 693,322 | |
| SBLOC / IBLOC | |
| 3,922 | | |
| — | | |
| 1,184 | | |
| 446 | | |
| 5,552 | | |
| 1,603,495 | | |
| 1,609,047 | |
| Advisor financing | |
| — | | |
| — | | |
| — | | |
| — | | |
| — | | |
| 285,531 | | |
| 285,531 | |
| Real estate bridge loans | |
| — | | |
| 19,372 | | |
| 17,942 | | |
| 36,677 | | |
| 73,991 | | |
| 2,057,698 | | |
| 2,131,689 | |
| Consumer fintech | |
| 20,439 | | |
| 1,951 | | |
| 1,163 | | |
| — | | |
| 23,553 | | |
| 761,492 | | |
| 785,045 | |
| Other loans | |
| 75 | | |
| — | | |
| 3 | | |
| 147 | | |
| 225 | | |
| 164,262 | | |
| 164,487 | |
| Unamortized loan fees and costs | |
| — | | |
| — | | |
| — | | |
| — | | |
| — | | |
| 16,445 | | |
| 16,445 | |
| | |
$ | 26,858 | | |
$ | 29,368 | | |
$ | 20,545 | | |
$ | 69,386 | | |
$ | 146,157 | | |
$ | 6,526,480 | | |
$ | 6,672,637 | |
Other loan information
Of the $55.1 million special mention and $130.2 million substandard loans real estate bridge loans
at September 30, 2025, none were modified in the third quarter of 2025.
Other real estate owned year to date activity
| | |
Nine months ended |
| | |
September 30, 2025 |
| Beginning balance | |
$ | 62,025 | |
| Transfer from loans, net | |
| 2,401 | |
| Total realized net gains included in earnings: Non-interest expense - other | |
| 594 | |
| Sales | |
| (4,926 | ) |
| Advances | |
| 1,880 | |
| Ending balance | |
$ | 61,974 | |
Other real estate owned includes a REBL apartment building rehabilitation bridge loan with a balance of $43.0 million and $41.1 million
as of September 30, 2025, and December 31, 2024, respectively. As of September 30, 2025, the majority of capital improvements on the
property have been completed. Third-party appraisals on the property as of June 30, 2025, for “as stabilized” and "as is"
values are $59.1 million and $51.4 million, respectively, or respective LTVs of 73% and 83%.
As previously disclosed, in June 2025, the Company terminated a pending agreement of sale for the property and demanded the escrow agent
release to Company all earnest money deposits received to date, totaling $3.0 million. On June 26, 2025, without providing
any legal or contractual basis to do so, the purchaser objected to the release of the earnest money deposits. In the third quarter of
2025, the matter was settled for $2.3 million which was recognized in other non-interest income.
Asset Quality Ratios
| | |
September 30, | |
June 30, | |
December 31, | |
September 30, |
| | |
2025 | |
2025 | |
2024 | |
2024 |
| | |
| |
| |
| |
|
| Nonperforming loans to total loans | |
| 1.35% | | |
| 0.96% | | |
| 0.55% | | |
| 0.52% | |
| Nonperforming assets to total assets | |
| 1.77% | | |
| 1.45% | | |
| 1.14% | | |
| 1.28% | |
| Allowance for credit losses to total loans | |
| 0.96% | | |
| 0.91% | | |
| 0.73% | | |
| 0.52% | |
Non-GAAP Financial Measures
Calculation of efficiency ratio
The efficiency ratio is calculated by dividing GAAP total non-interest expense by the total of GAAP net interest income and non-interest
income. This ratio compares revenues generated with the amount of expense required to generate such revenues and may be used as
one measure of overall efficiency.
| | |
Three months ended | |
Nine months ended |
| | |
September 30, | |
September 30, | |
September 30, | |
September 30, |
| | |
2025 | |
2024 | |
2025 | |
2024 |
| | |
(Dollars in thousands) |
| Net interest income | |
$ | 94,197 | | |
$ | 93,732 | | |
$ | 283,432 | | |
$ | 281,945 | |
| Non-interest income | |
| 80,416 | | |
| 32,108 | | |
| 247,801 | | |
| 92,212 | |
| Less: Consumer fintech loan credit enhancement | |
| (39,790 | ) | |
| — | | |
| (128,891 | ) | |
| — | |
Adjusted total revenue(1) | |
$ | 134,823 | | |
$ | 125,840 | | |
$ | 402,342 | | |
$ | 374,157 | |
| Non-interest expense | |
$ | 56,404 | | |
$ | 53,255 | | |
$ | 166,921 | | |
$ | 151,413 | |
| | |
| | | |
| | | |
| | | |
| | |
| Efficiency ratio | |
| 42% | | |
| 42% | | |
| 41% | | |
| 40% | |
(1) Excludes consumer fintech loan credit enhancement income which represents the amount of consumer fintech loan charge-offs that we expect to recover under third-party contracts. The provision for those loans correlates to a like amount of credit enhancement income.
|
Exhibit 99.2

THE BANCORP INVESTOR PRESENTATION OCTOBER 2025
2 DISCLOSURES Statements in this presentation regarding The Bancorp, Inc.’s (“The Bancorp”) business , that are not historical facts, are “forward - looking statements.” These statements may be identified by the use of forward - looking terminology, including the words “intend,” “may,” “believe,” “will,” “expect,” “look,” “anticipate,” “plan,” “estimate,” “continue,” or similar words. Forward - looking statements include but are not limited to, statements regarding our anticipated 2025, 2026, and 2027 results, earnings per share accretion, future profitability and growth, share repurchases, our ability to achieve long - term financial targets, the expansion, expected timelines and implementation of our Fintech initiatives, the possible benefits of our platform restructuring, and adoption of AI tools . These forward - looking statements relate to our current assumptions, projections, and expectations about our business and future events, including current expectations about important economic and political factors, among other factors, and are subject to risks and uncertainties, which could cause the actual results, events, or achievements to differ materially from those set forth in or implied by the forward - looking statements and related assumptions. Factors that could cause results to differ from those expressed in the forward - looking statements also include, but are not limited to, the risks and uncertainties referenced or described in The Bancorp’s filings with the Securities and Exchange Commission, including the “Risk Factors” and “Management’s Discussion and Analysis of Financial Condition and Results of Operations” sections of the Company’s Annual Report on Form 10 - K, as amended, for the fiscal year ended December 31, 2024 and other documents that the Company files from time to time with the Securities and Exchange Commission. The Bancorp does not undertake any duty to publicly revise or update forward - looking statements in this presentation to reflect events or circumstances that arise after the date of this presentation, except as may be required under applicable law. This presentation contains information regarding financial results that is calculated and presented on the basis of methodologies other than in accordance with accounting principles generally accepted in the United States (“GAAP”), such as those identified in the Appendix. Any non - GAAP financial measures used in this presentation are in addition to, and should not be considered superior to, or a substitute for, financial statements prepared in accordance with GAAP. Non - GAAP financial measures are subject to significant inherent limitations. The non - GAAP measures presented herein may not be comparable to similar non - GAAP measures presented by other companies. This presentation includes market, industry and economic data that was obtained from various publicly available sources and other sources believed by the Company to be true. Although the Company believes it to be reliable, the Company has not independently verified any of the data from third party sources referred to in this presentation or analyzed or verified the underlying reports relied upon or referred to by such sources, or ascertained the underlying economic and other assumptions relied upon by such sources. The Company believes that its market, industry, and economic data is accurate and that its estimates and assumptions are reasonable, but there can be no assurance as to the accuracy or completeness thereof. Past performance is not indicative nor a guarantee of future results. Copies of the documents filed by The Bancorp with the SEC are available free of charge from the website of the SEC at www.sec.gov as well as on The Bancorp’s website at www.thebancorp.com . FORWARD LOOKING STATEMENTS & OTHER DISCLOSURES
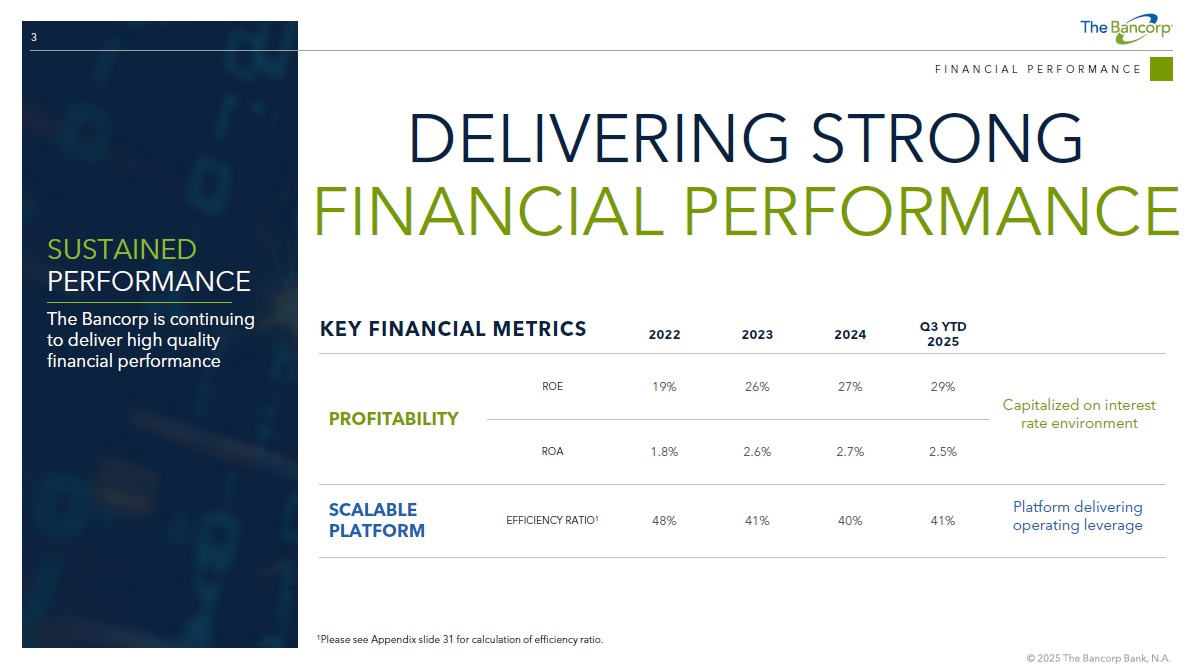
3 FINANCIAL PERFORMANCE DELIVERING STRONG FINANCIAL PERFORMANCE Q3 YTD 2025 2024 2023 2022 29% 27% 26% 19% ROE PROFITABILITY 2.5% 2.7% 2.6% 1.8% ROA 41% 40% 41% 48% EFFICIENCY RATIO 1 SCALABLE PLATFORM KEY FINANCIAL METRICS 1 Please see Appendix slide 31 for calculation of efficiency ratio. Platform delivering operating leverage Capitalized on interest rate environment SUSTAINED PERFORMANCE The Bancorp is continuing to deliver high quality financial performance
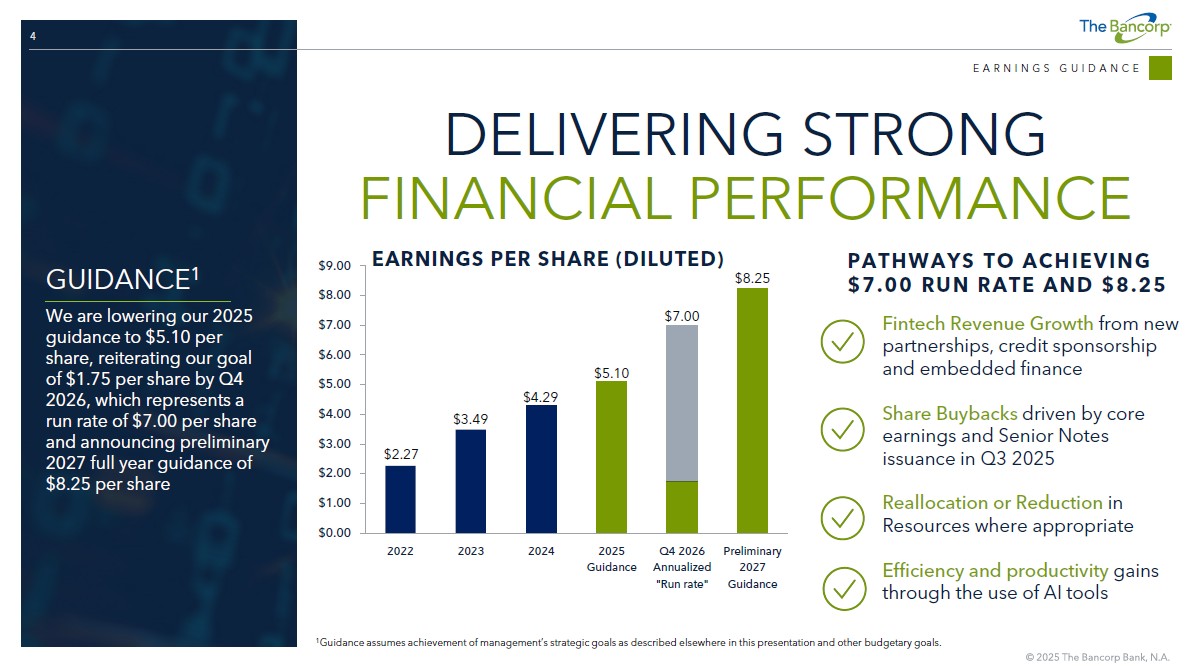
4 $0.00 $1.00 $2.00 $3.00 $4.00 $5.00 $6.00 $7.00 $8.00 $9.00 2022 2023 2024 2025 Guidance Q4 2026 Annualized "Run rate" Preliminary 2027 Guidance EARNINGS PER SHARE (DILUTED) DELIVERING STRONG FINANCIAL PERFORMANCE GUIDANCE 1 We are lowering our 2025 guidance to $5.10 per share, reiterating our goal of $1.75 per share by Q4 2026, which represents a run rate of $7.00 p er share and announcing preliminary 2027 full year guidance of $8.25 per share 1 Guidance assumes achievement of management’s strategic goals as described elsewhere in this presentation and other budgetary goa ls. $5.10 $3.49 $4.29 $7.00 Fintech Revenue Growth from n ew partnerships, credit sponsorship and embedded finance Share Buybacks driven by core earnings and Senior Notes issuance in Q3 2025 Reallocation or Reduction in Resources where appropriate Efficiency and productivity gains through the use of AI tools EARNINGS GUIDANCE PATHWAYS TO ACHIEVING $7.00 RUN RATE AND $8.25 $8.25 $2.27
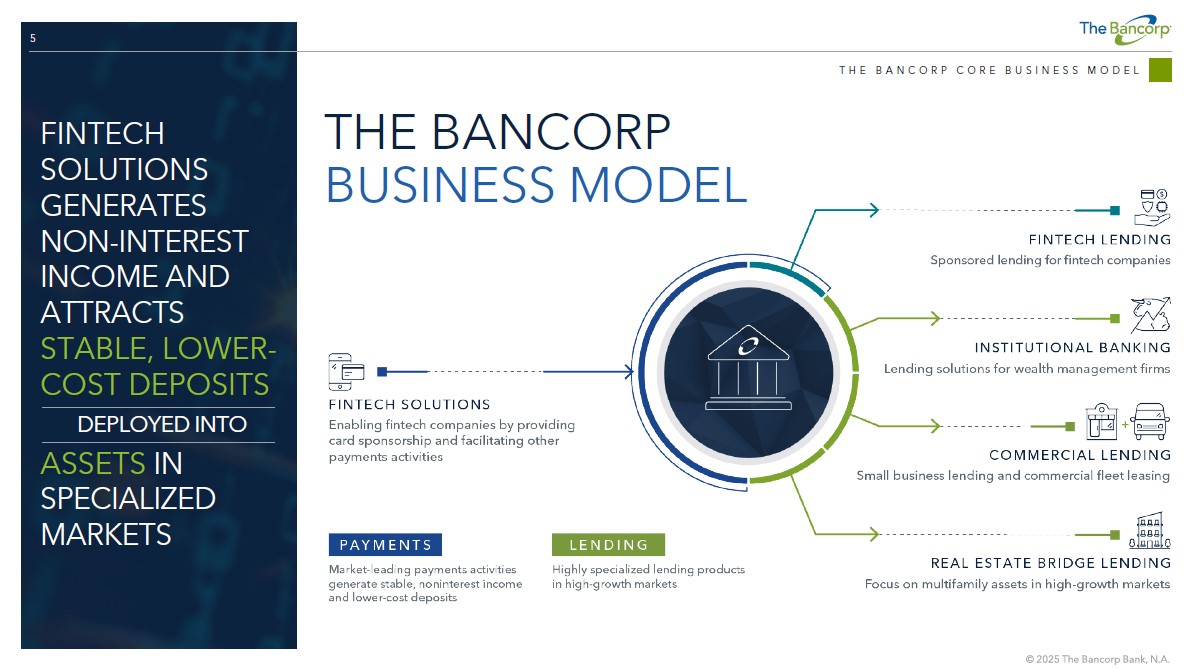
5 THE BANCORP CORE BUSINESS MODEL FINTECH SOLUTIONS GENERATES NON - INTEREST INCOME AND ATTRACTS STABLE, LOWER - COST DEPOSITS DEPLOYED INTO ASSETS IN SPECIALIZED MARKETS THE BANCORP BUSINESS MODEL
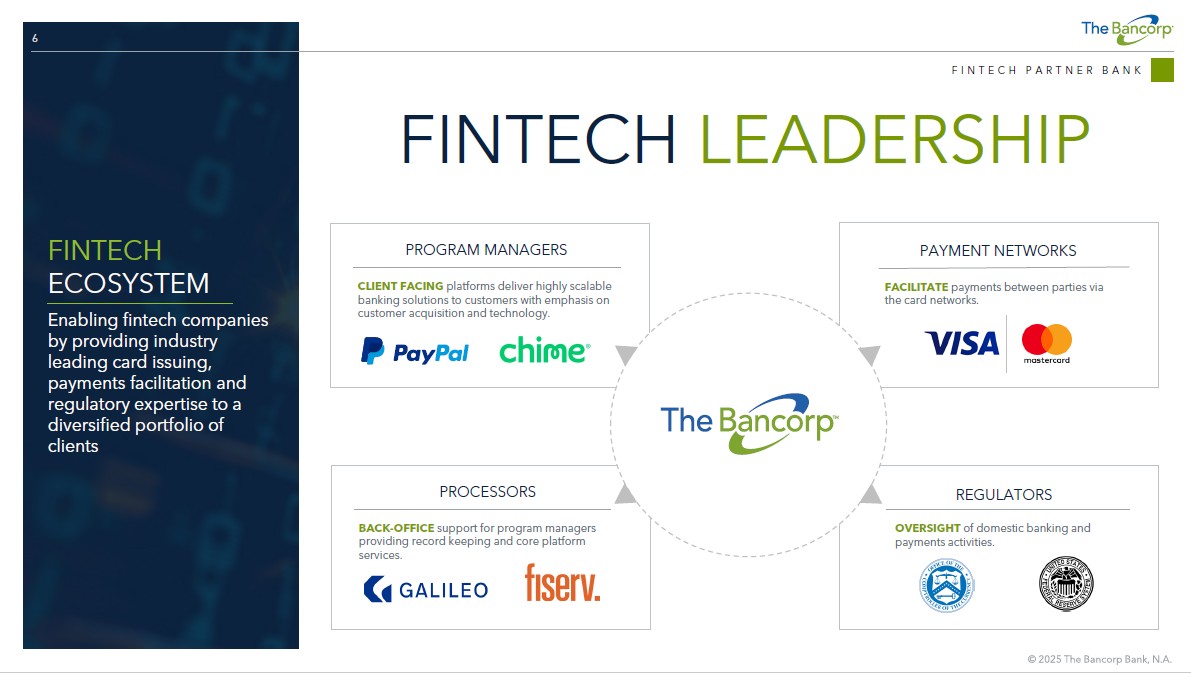
6 FINTECH PARTNER BANK FINTECH LEADERSHIP PAYMENT NETWORKS FACILITATE payments between parties via the card networks. PROGRAM MANAGERS CLIENT FACING platforms deliver highly scalable banking solutions to customers with emphasis on customer acquisition and technology. REGULATORS OVERSIGHT of domestic banking and payments activities. PROCESSORS BACK - OFFICE support for program managers providing record keeping and core platform services. FINTECH ECOSYSTEM Enabling fintech companies by providing industry leading card issuing, payments facilitation and regulatory expertise to a diversified portfolio of clients
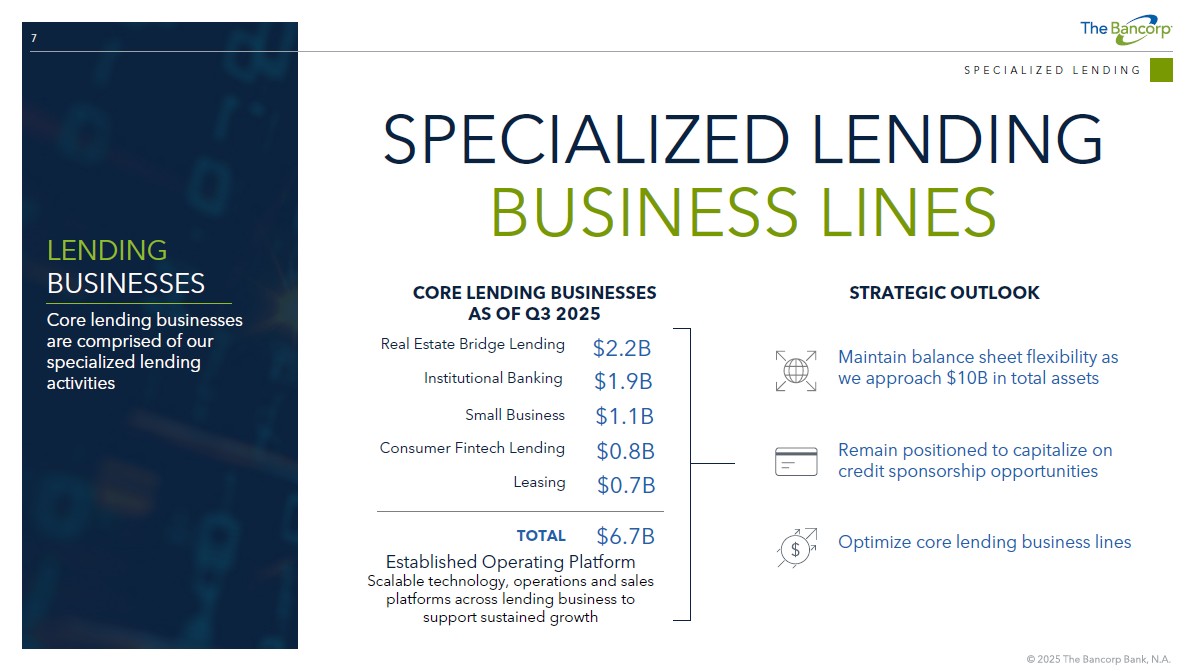
7 SPECIALIZED LENDING SPECIALIZED LENDING BUSINESS LINES LENDING BUSINESSES Core lending businesses are comprised of our specialized lending activities Institutional Banking $1.9B Maintain balance sheet flexibility as we approach $10B in total assets Remain positioned to capitalize on credit sponsorship opportunities Optimize core lending business lines Real Estate Bridge Lending $2.2B Small Business $1.1B Consumer Fintech Lending $ 0.8B CORE LENDING BUSINESSES AS OF Q3 2025 TOTAL $ 6.7 B Established Operating Platform Scalable technology, operations and sales platforms across lending business to support sustained growth STRATEGIC OUTLOOK Leasing $ 0.7B
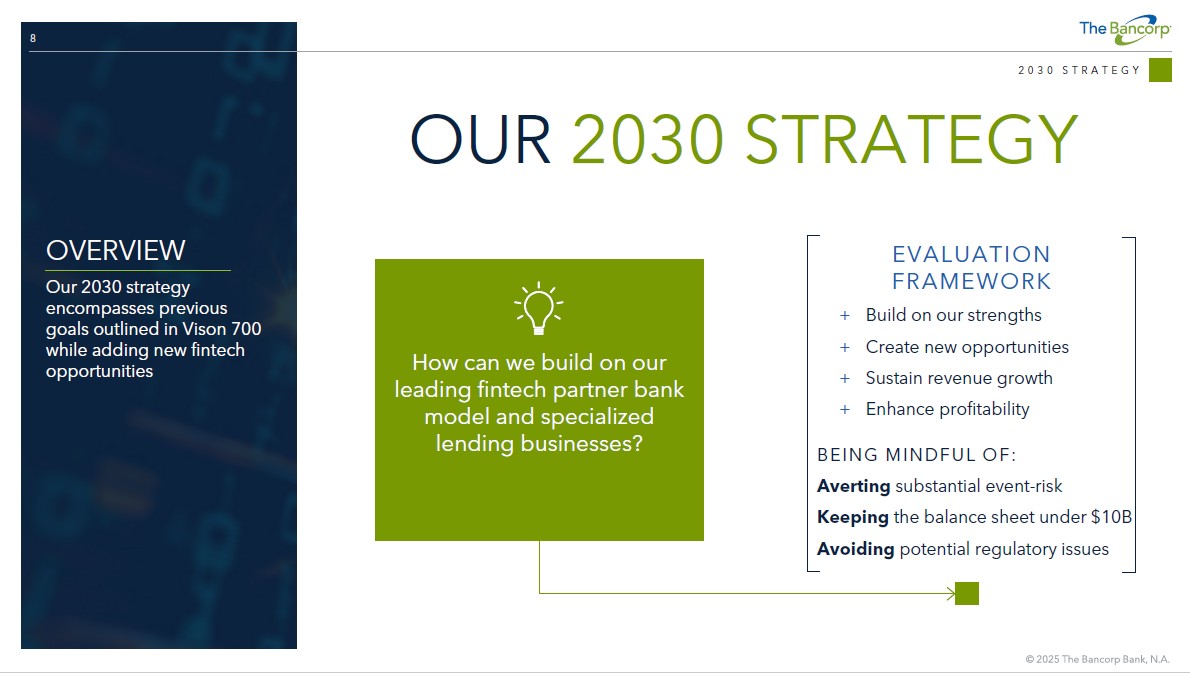
8 2030 STRATEGY OUR 2030 STRATEGY OVERVIEW Our 2030 strategy encompasses previous goals outlined in Vison 700 while adding new fintech opportunities Build on our strengths Create new opportunities Sustain revenue growth Enhance profitability Averting substantial event - risk Keeping the balance sheet under $10B Avoiding potential regulatory issues + + + + EVALUATION FRAMEWORK BEING MINDFUL OF: How can we build on our leading fintech partner bank model and specialized lending businesses?
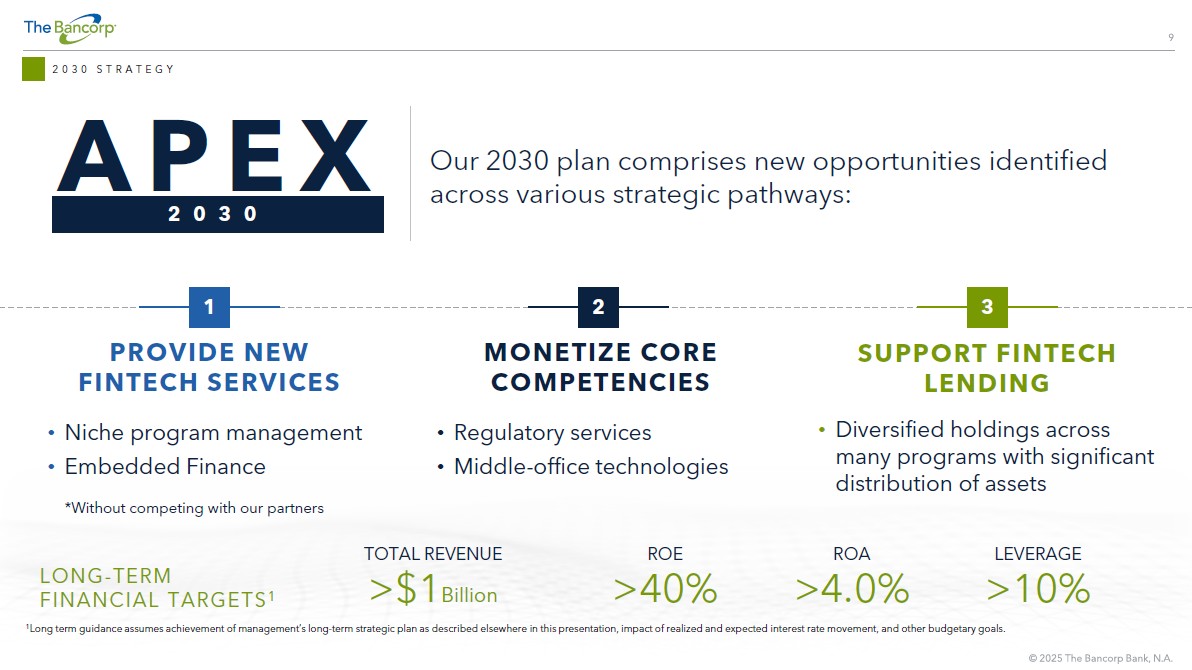
2030 STRATEGY *Without competing with our partners 1 PROVIDE NEW FINTECH SERVICES 3 SUPPORT FINTECH LENDING 2 MONETIZE CORE COMPETENCIES Our 2030 plan comprises new opportunities identified across various strategic pathways: 1 Long term guidance assumes achievement of management’s long - term strategic plan as described elsewhere in this presentation, imp act of realized and expected interest rate movement, and other budgetary goals. TOTAL REVENUE >$1 Billion ROE >40% ROA >4.0% LEVERAGE >10% LONG - TERM FINANCIAL TARGETS 1 • Niche program management • Embedded Finance • Regulatory services • Middle - office technologies • Diversified holdings across many programs with significant distribution of assets APEX 2030

FINTECH SOLUTIONS: DEPOSIT & FEE GENERATION
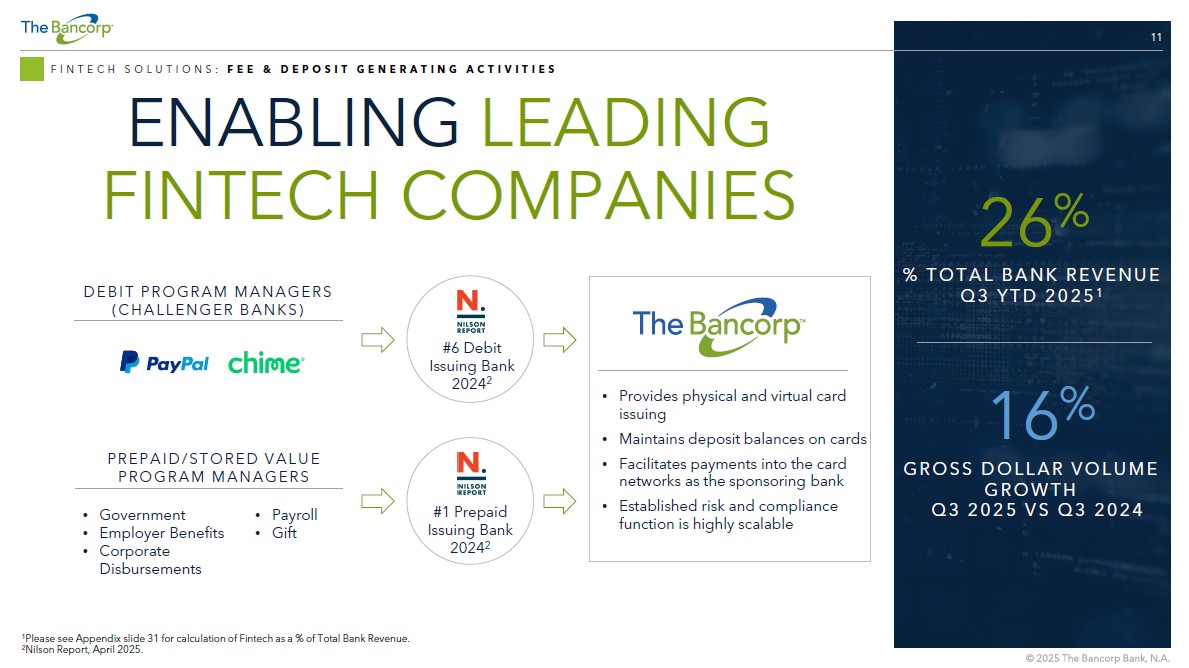
11 FINTECH SOLUTIONS: FEE & DEPOSIT GENERATING ACTIVITIES ENABLING LEADING FINTECH COMPANIES DEBIT PROGRAM MANAGERS (CHALLENGER BANKS) PREPAID/STORED VALUE PROGRAM MANAGERS • Provides physical and virtual card issuing • Maintains deposit balances on cards • Facilitates payments into the card networks as the sponsoring bank • Established risk and compliance function is highly scalable #6 Debit Issuing Bank 2024 2 #1 Prepaid Issuing Bank 2024 2 • Government • Employer Benefits • Corporate Disbursements • Payroll • Gift 1 Please see Appendix slide 31 for calculation of Fintech as a % of Total Bank Revenue. 2 Nilson Report, April 2025. % TOTAL BANK REVENUE Q3 YTD 2025 1 26 % GROSS DOLLAR VOLUME GROWTH Q3 2025 VS Q3 2024 16 %
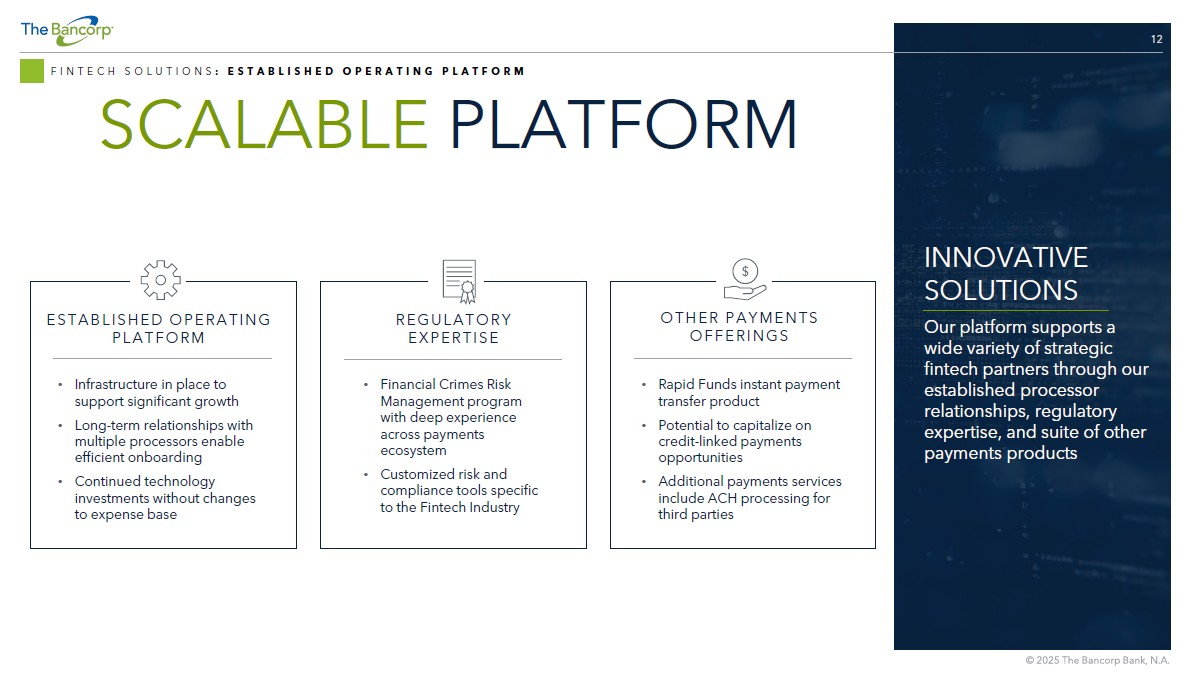
12 FINTECH SOLUTIONS : ESTABLISHED OPERATING PLATFORM SCALABLE PLATFORM ESTABLISHED OPERATING PLATFORM • Infrastructure in place to support significant growth • Long - term relationships with multiple processors enable efficient onboarding • Continued technology investments without changes to expense base REGULATORY EXPERTISE • Financial Crimes Risk Management program with deep experience across payments ecosystem • Customized risk and compliance tools specific to the Fintech Industry OTHER PAYMENTS OFFERINGS • Rapid Funds instant payment transfer product • Potential to capitalize on credit - linked payments opportunities • Additional payments services include ACH processing for third parties INNOVATIVE SOLUTIONS Our platform supports a wide variety of strategic fintech partners through our established processor relationships, regulatory expertise, and suite of other payments products
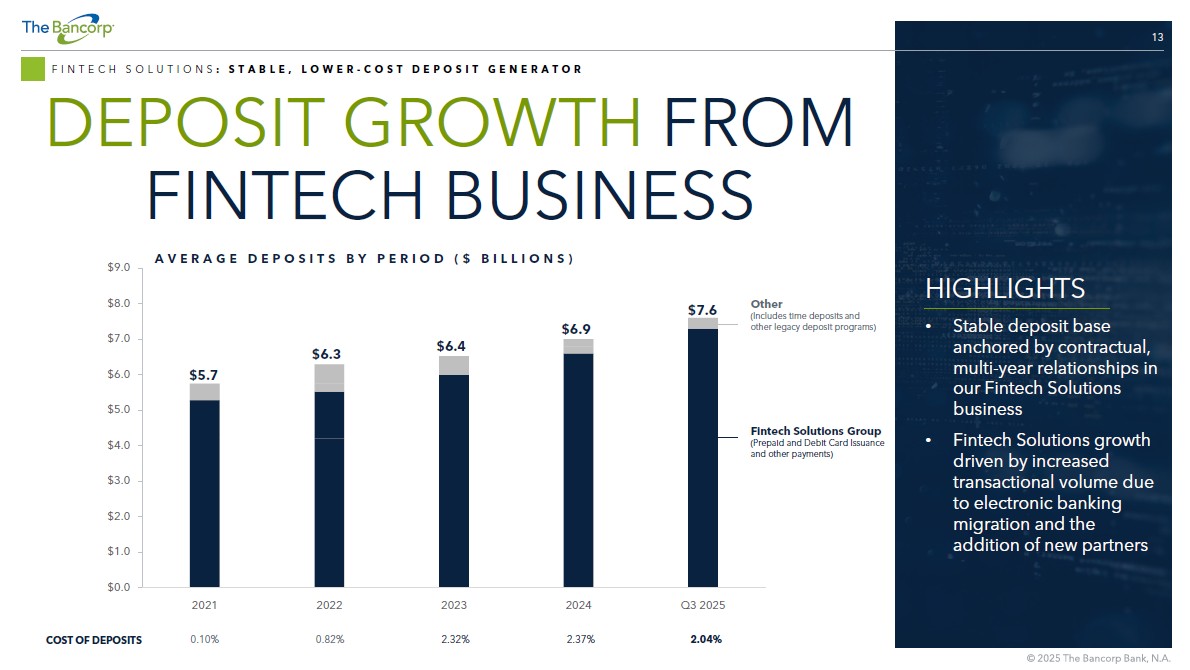
13 FINTECH SOLUTIONS : STABLE, LOWER - COST DEPOSIT GENERATOR DEPOSIT GROWTH FROM FINTECH BUSINESS HIGHLIGHTS • Stable deposit base anchored by contractual, multi - year relationships in our Fintech Solutions business • Fintech Solutions growth driven by increased transactional volume due to electronic banking migration and the addition of new partners $0.0 $1.0 $2.0 $3.0 $4.0 $5.0 $6.0 $7.0 $8.0 $9.0 2021 2022 2023 2024 Q3 2025 AVERAGE DEPOSITS BY PERIOD ($ BILLIONS) Fintech Solutions Group (Prepaid and Debit Card Issuance and other payments) Other (Includes time deposits and other legacy deposit programs) 2.04% 2.37% 2.32% 0.82% 0.10% COST OF DEPOSITS $5.7 $6.3 $6.4 $6.9 $7.6
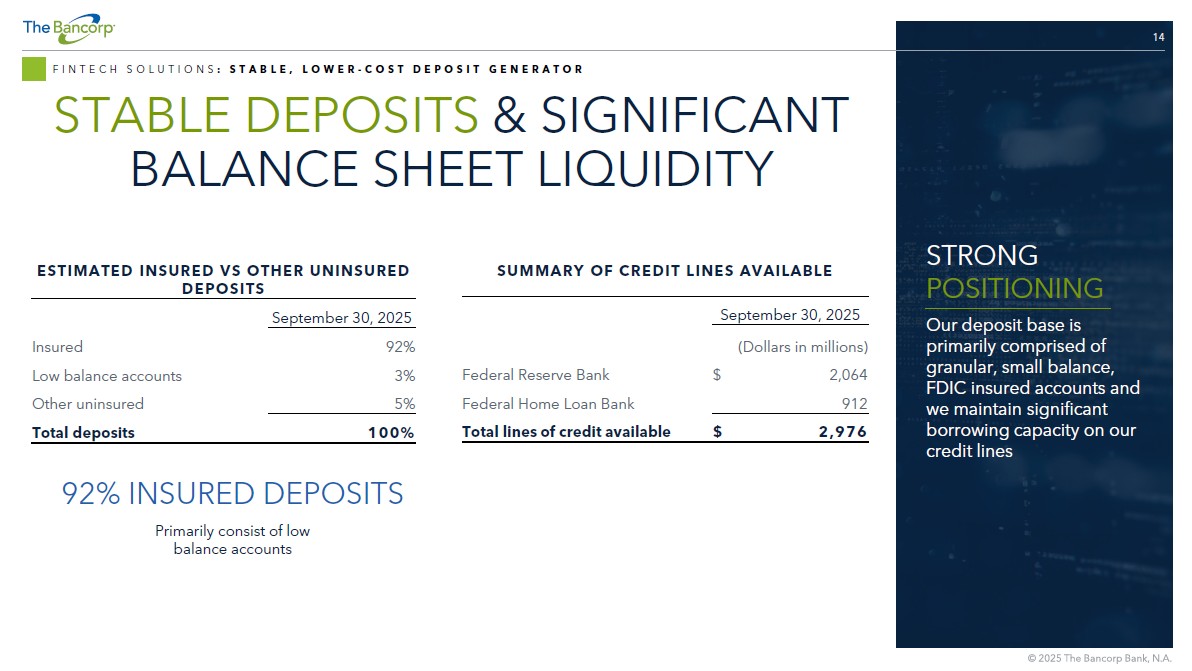
14 FINTECH SOLUTIONS : STABLE, LOWER - COST DEPOSIT GENERATOR STABLE DEPOSITS & SIGNIFICANT BALANCE SHEET LIQUIDITY STRONG POSITIONING Our deposit base is primarily comprised of granular, small balance, FDIC insured accounts and we maintain significant borrowing capacity on our credit lines ESTIMATED INSURED VS OTHER UNINSURED DEPOSITS September 30, 2025 92% Insured 3% Low balance accounts 5% Other uninsured 100% Total deposits SUMMARY OF CREDIT LINES AVAILABLE September 30, 2025 (Dollars in millions) 2,064 $ Federal Reserve Bank 912 Federal Home Loan Bank 2,976 $ Total lines of credit available 9 2 % INSURED DEPOSITS Primarily consist of low balance accounts

LOANS, LEASES & SUPPORTING COLLATERAL
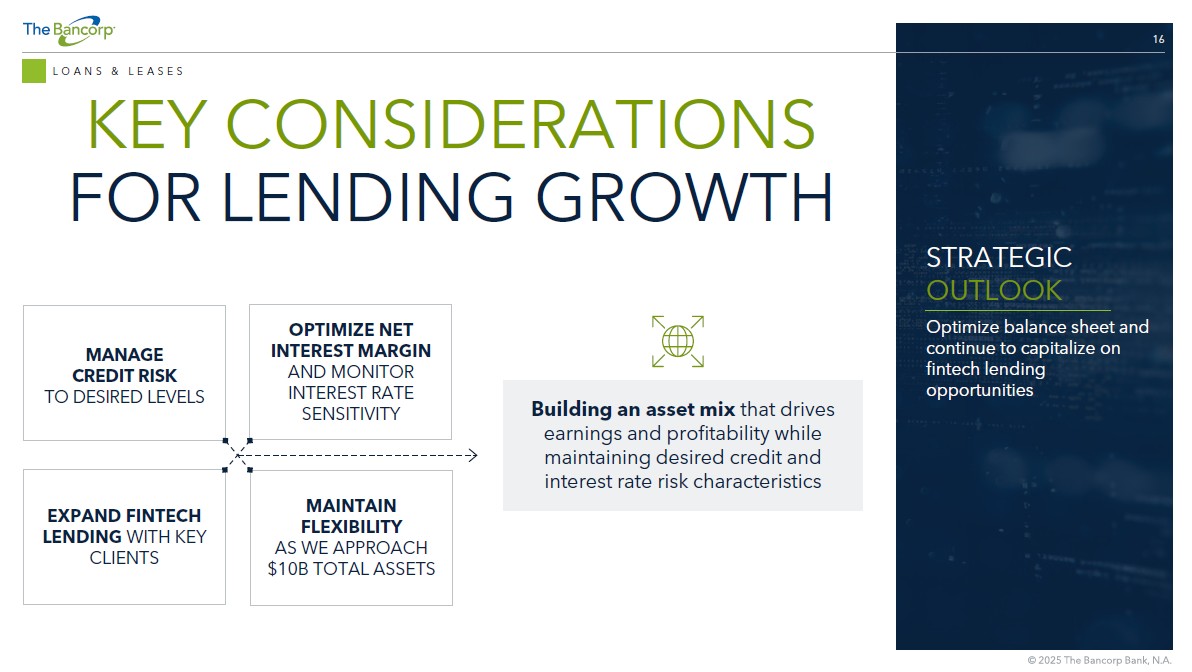
16 LOANS & LEASES STRATEGIC OUTLOOK Optimize balance sheet and continue to capitalize on fintech lending opportunities KEY CONSIDERATIONS FOR LENDING GROWTH MANAGE CREDIT RISK TO DESIRED LEVELS OPTIMIZE NET INTEREST MARGIN AND MONITOR INTEREST RATE SENSITIVITY EXPAND FINTECH LENDING WITH KEY CLIENTS MAINTAIN FLEXIBILITY AS WE APPROACH $10B TOTAL ASSETS Building an asset mix that drives earnings and profitability while maintaining desired credit and interest rate risk characteristics
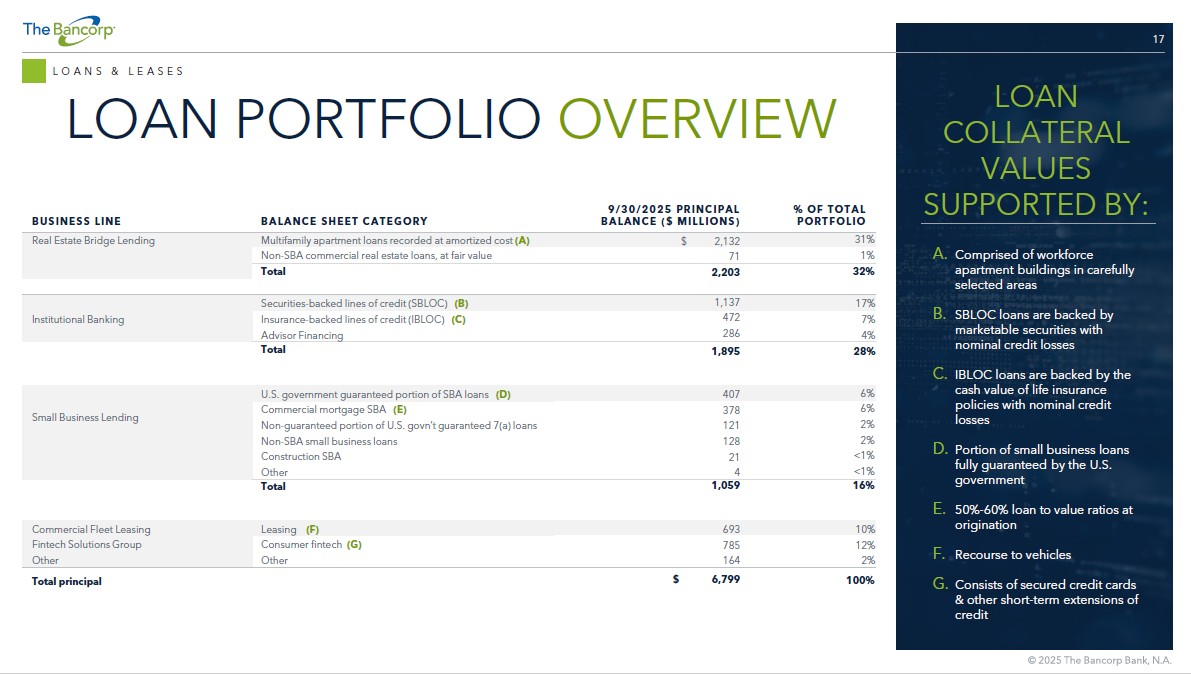
17 LOANS & LEASES LOAN PORTFOLIO OVERVIEW % OF TOTAL PORTFOLIO 9/30/2025 PRINCIPAL BALANCE ($ MILLIONS) BALANCE SHEET CATEGORY BUSINESS LINE 31% $ 2,132 Multifamily apartment loans recorded at amortized cost (A) Real Estate Bridge Lending 1% 71 Non - SBA commercial real estate loans, at fair value 32% 2,203 Total 17% 1,137 Securities - backed lines of credit (SBLOC) ( B) Institutional Banking 7% 472 Insurance - backed lines of credit (IBLOC) (C) 4% 286 Advisor Financing 28% 1,895 Total 6% 407 U.S. government guaranteed portion of SBA loans ( D) Small Business Lending 6% 378 Commercial mortgage SBA ( E) 2% 121 Non - guaranteed portion of U.S. govn’t guaranteed 7(a) loans 2% 128 Non - SBA small business loans <1% 21 Construction SBA <1% 4 Other 16% 1,059 Total 10% 693 Leasing ( F) Commercial Fleet Leasing 12% 785 Consumer fintech ( G) Fintech Solutions Group 2% 164 Other Other 100% $ 6,799 Total principal LOAN COLLATERAL VALUES SUPPORTED BY: A. Comprised of workforce apartment buildings in carefully selected areas B. SBLOC loans are backed by marketable securities with nominal credit losses C. IBLOC loans are backed by the cash value of life insurance policies with nominal credit losses D. Portion of small business loans fully guaranteed by the U.S. government E. 50% - 60% loan to value ratios at origination F. Recourse to vehicles G. Consists of secured credit cards & other short - term extensions of credit
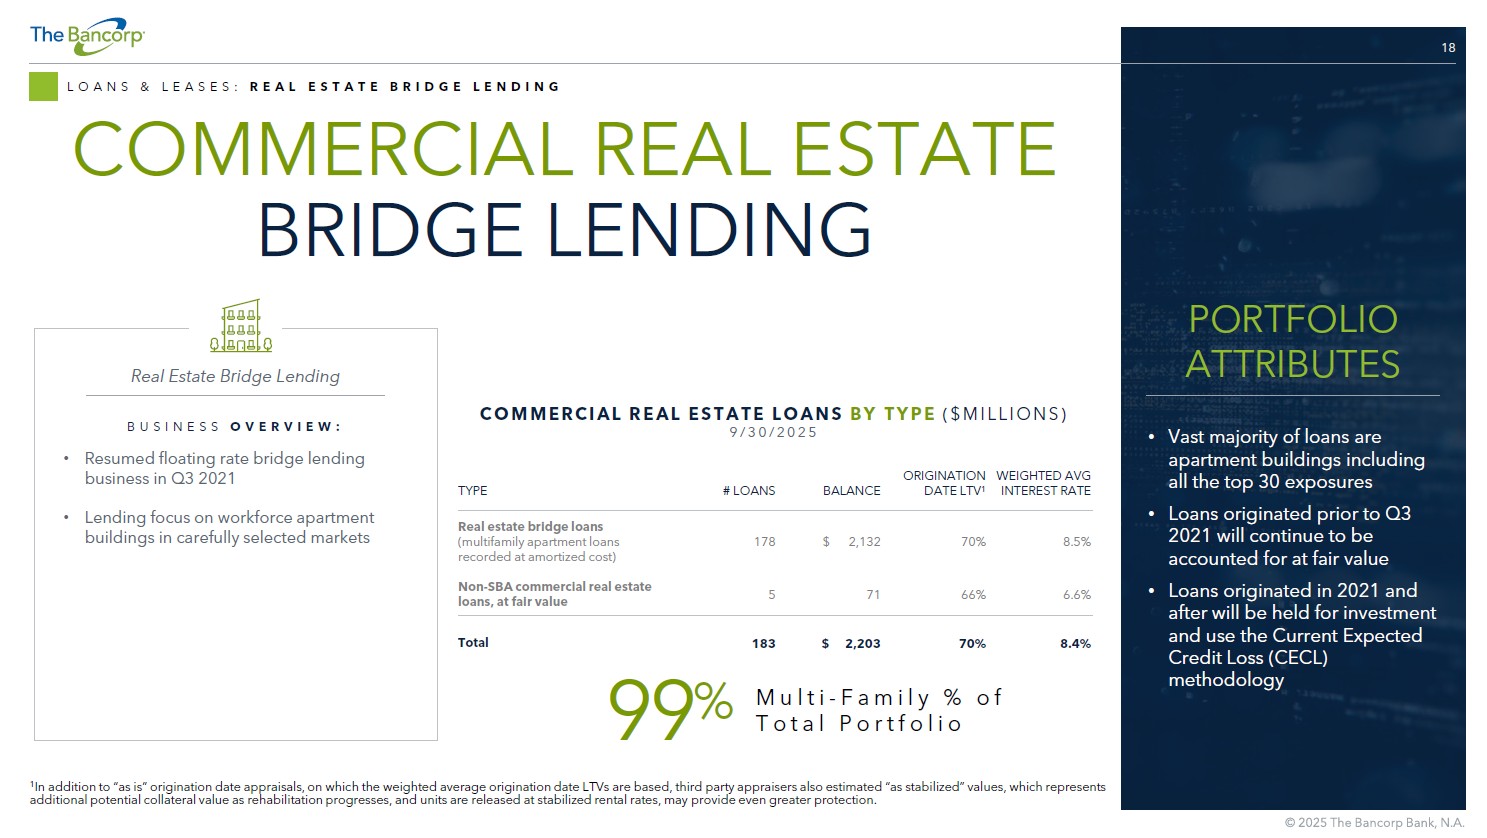
18 LOANS & LEASES: REAL ESTATE BRIDGE LENDING COMMERCIAL REAL ESTATE BRIDGE LENDING WEIGHTED AVG INTEREST RATE ORIGINATION DATE LTV 1 BALANCE # LOANS TYPE 8.5% 70% $ 2,132 178 Real estate bridge loans (multifamily apartment loans recorded at amortized cost) 6.6% 66% 71 5 Non - SBA commercial real estate loans, at fair value 8.4% 70% $ 2,203 183 Total COMMERCIAL REAL ESTATE LOANS BY TYPE ($MILLIONS) 9/30/2025 BUSINESS OVERVIEW: • Resumed floating rate bridge lending business in Q3 2021 • Lending focus on workforce apartment buildings in carefully selected markets Real Estate Bridge Lending • Vast majority of loans are apartment buildings including all the top 30 exposures • Loans originated prior to Q3 2021 will continue to be accounted for at fair value • Loans originated in 2021 and after will be held for investment and use the Current Expected Credit Loss (CECL) methodology PORTFOLIO ATTRIBUTES 1 In addition to “as is” origination date appraisals, on which the weighted average origination date LTVs are based, third part y a ppraisers also estimated “as stabilized” values, which represents additional potential collateral value as rehabilitation progresses, and units are released at stabilized rental rates, may provide even greater pr ote ction. 99 % Multi - Family % of Total Portfolio
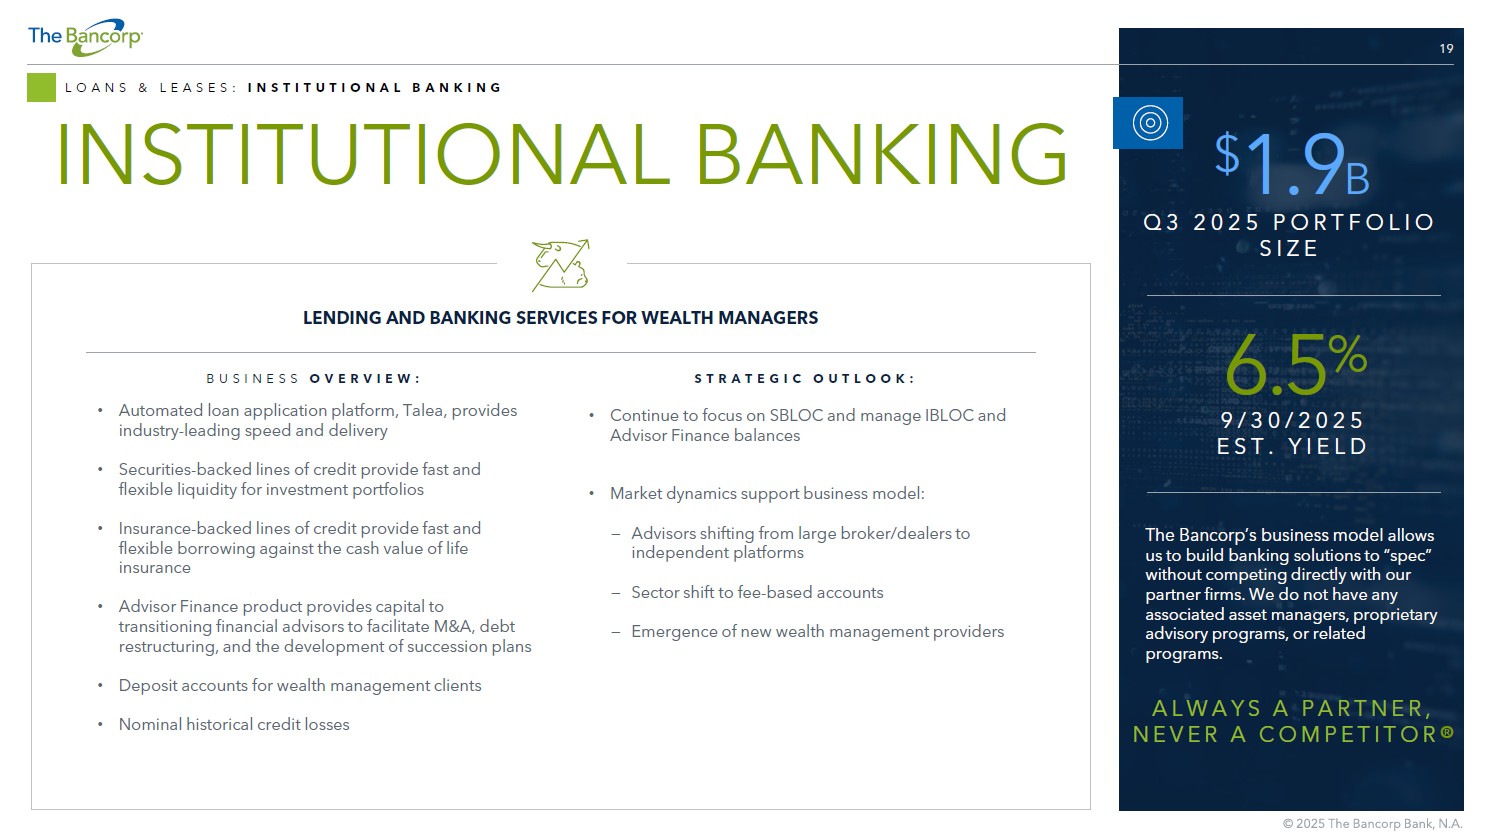
19 LOANS & LEASES: INSTITUTIONAL BANKING INSTITUTIONAL BANKING BUSINESS OVERVIEW: • Automated loan application platform, Talea, provides industry - leading speed and delivery • Securities - backed lines of credit provide fast and flexible liquidity for investment portfolios • Insurance - backed lines of credit provide fast and flexible borrowing against the cash value of life insurance • Advisor Finance product provides capital to transitioning financial advisors to facilitate M&A, debt restructuring, and the development of succession plans • Deposit accounts for wealth management clients • Nominal historical credit losses STRATEGIC OUTLOOK: • Continue to focus on SBLOC and manage IBLOC and Advisor Finance balances • Market dynamics support business model: − Advisors shifting from large broker/dealers to independent platforms − Sector shift to fee - based accounts − Emergence of new wealth management providers LENDING AND BANKING SERVICES FOR WEALTH MANAGERS The Bancorp’s business model allows us to build banking solutions to “spec” without competing directly with our partner firms. We do not have any associated asset managers, proprietary advisory programs, or related programs. ALWAYS A PARTNER, NEVER A COMPETITOR ® $ 1.9 B Q3 2025 PORTFOLIO SIZE 6.5 % 9/30/2025 EST. YIELD
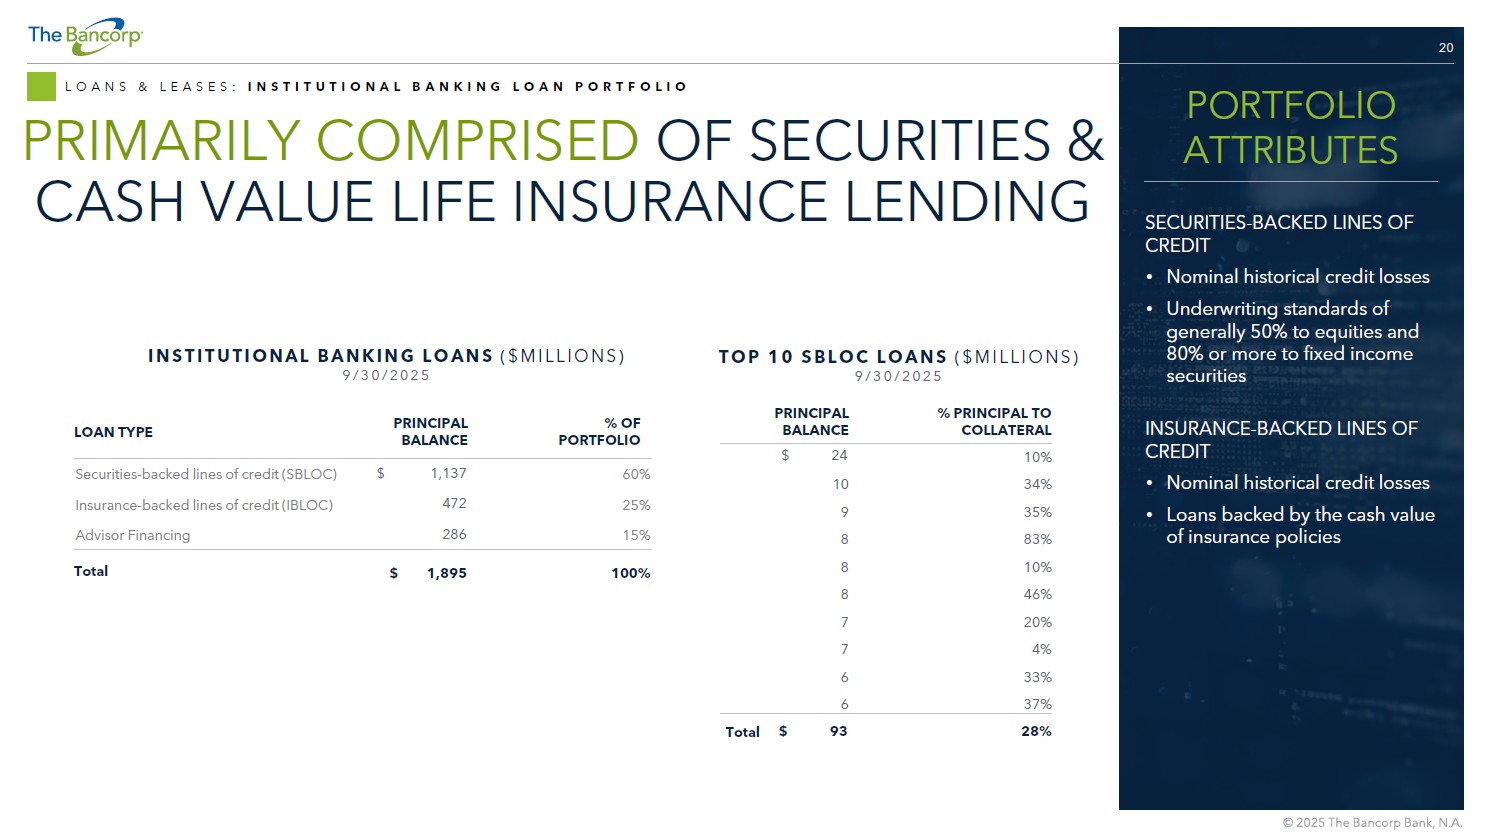
20 LOANS & LEASES: INSTITUTIONAL BANKING LOAN PORTFOLIO PRIMARILY COMPRISED OF SECURITIES & CASH VALUE LIFE INSURANCE LENDING % OF PORTFOLIO PRINCIPAL BALANCE LOAN TYPE 60% $ 1,137 Securities - backed lines of credit (SBLOC) 25% 472 Insurance - backed lines of credit (IBLOC) 15% 286 Advisor Financing 100% $ 1,895 Total INSTITUTIONAL BANKING LOANS ($MILLIONS) 9/30/2025 % PRINCIPAL TO COLLATERAL PRINCIPAL BALANCE 10% $ 24 34% 10 35% 9 83% 8 10% 8 46% 8 20% 7 4% 7 33% 6 37% 6 28% $ 93 Total TOP 10 SBLOC LOANS ($MILLIONS) 9/30/2025 SECURITIES - BACKED LINES OF CREDIT • Nominal historical credit losses • Underwriting standards of generally 50% to equities and 80% or more to fixed income securities INSURANCE - BACKED LINES OF CREDIT • Nominal historical credit losses • Loans backed by the cash value of insurance policies PORTFOLIO ATTRIBUTES
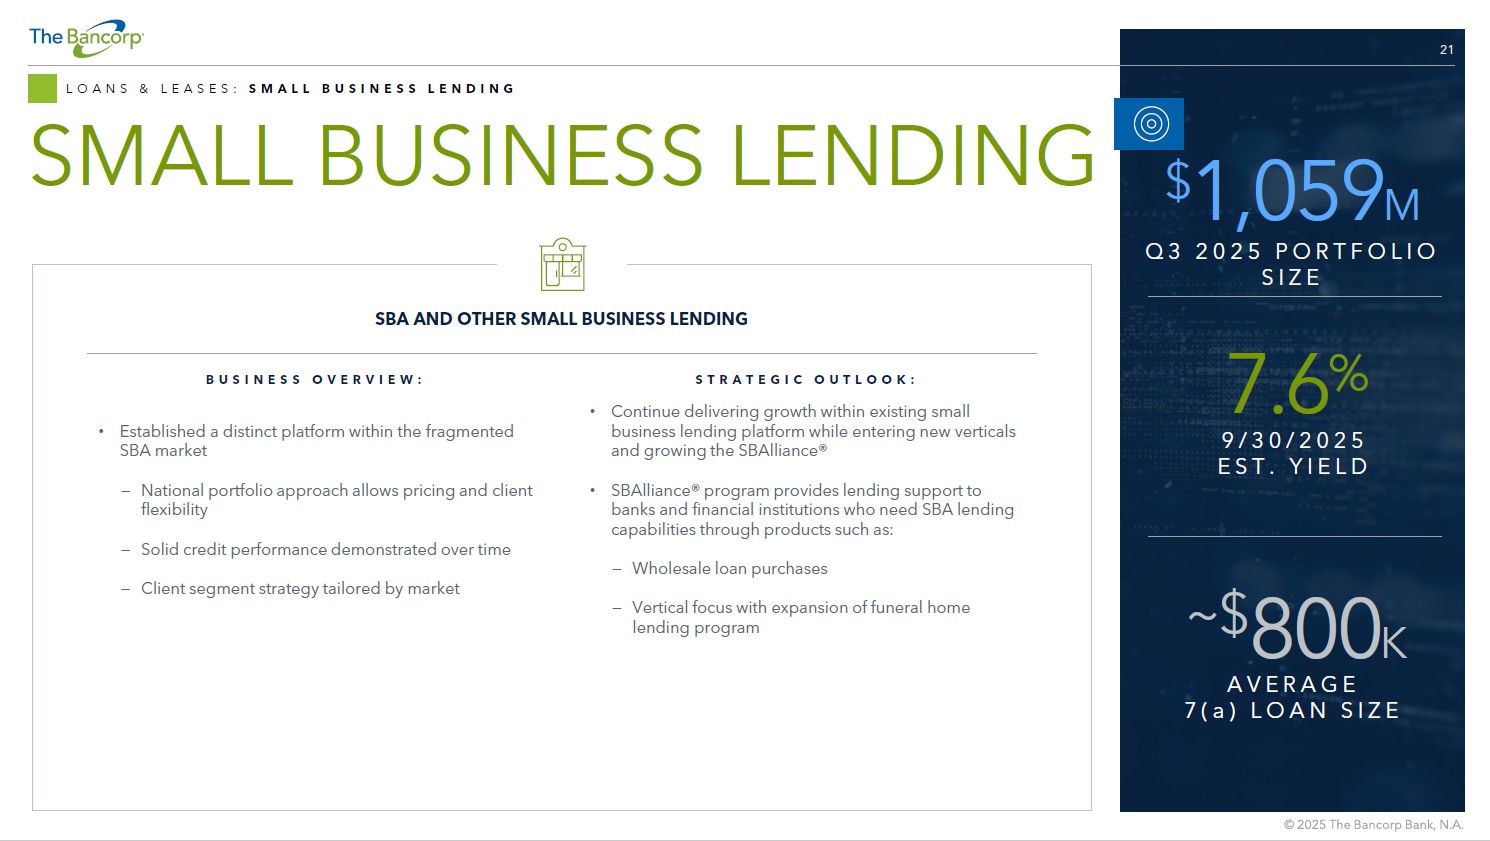
21 LOANS & LEASES: SMALL BUSINESS LENDING SMALL BUSINESS LENDING $ 1,059 M Q3 2025 PORTFOLIO SIZE 7.6 % 9/30/2025 EST. YIELD BUSINESS OVERVIEW: • Established a distinct platform within the fragmented SBA market − National portfolio approach allows pricing and client flexibility − Solid credit performance demonstrated over time − Client segment strategy tailored by market STRATEGIC OUTLOOK: • Continue delivering growth within existing small business lending platform while entering new verticals and growing the SBAlliance® • SBAlliance® program provides lending support to banks and financial institutions who need SBA lending capabilities through products such as: − Wholesale loan purchases − Vertical focus with expansion of funeral home lending program SBA AND OTHER SMALL BUSINESS LENDING ~$ 800 K AVERAGE 7(a) LOAN SIZE
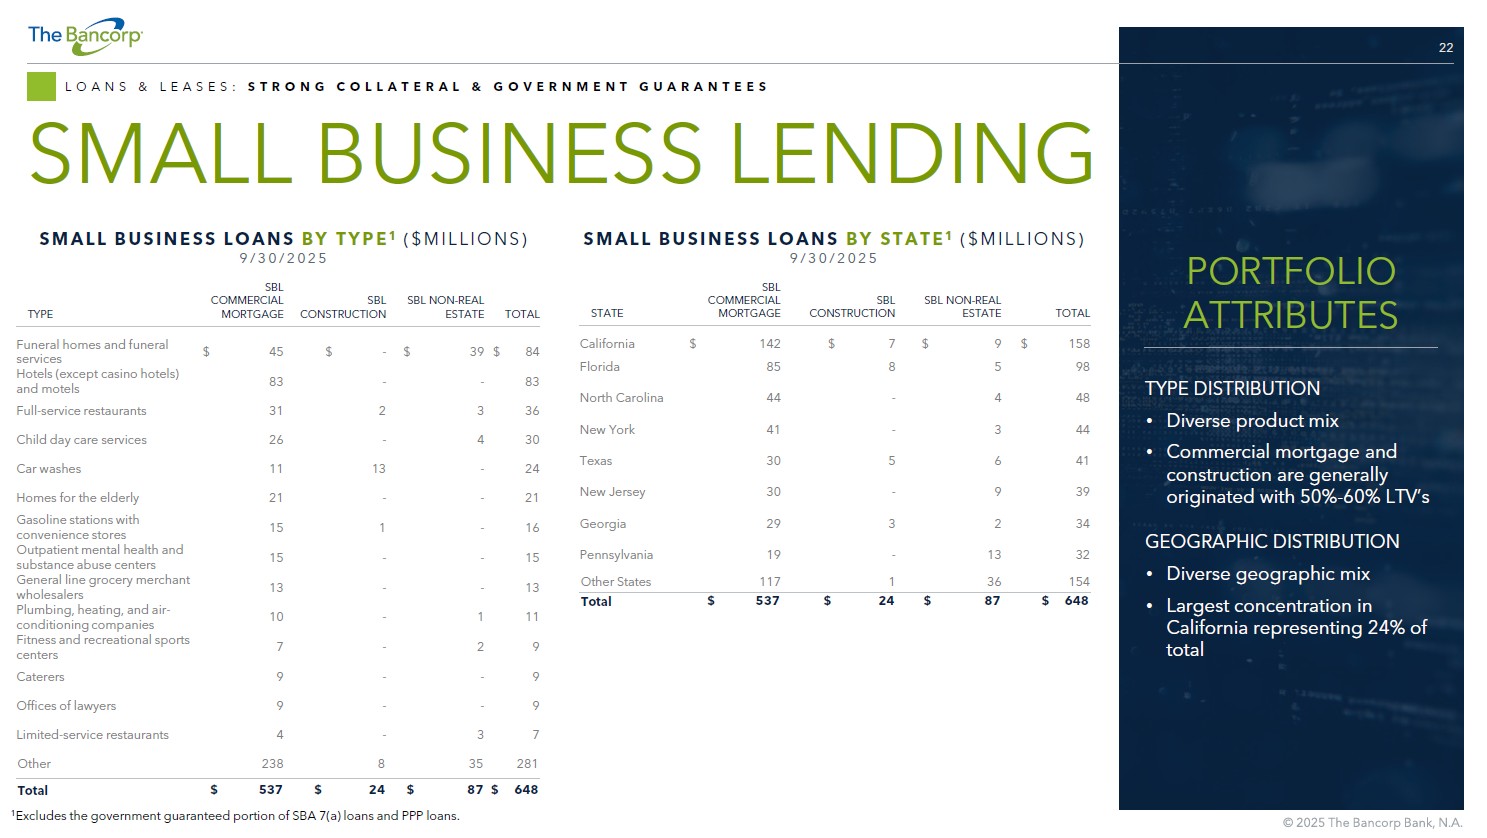
22 LOANS & LEASES: STRONG COLLATERAL & GOVERNMENT GUARANTEES SMALL BUSINESS LENDING SMALL BUSINESS LOANS BY TYPE 1 ($MILLIONS) 9/30/2025 SMALL BUSINESS LOANS BY STATE 1 ($MILLIONS) 9/30/2025 TOTAL SBL NON - REAL ESTATE SBL CONSTRUCTION SBL COMMERCIAL MORTGAGE STATE $ 158 $ 9 $ 7 $ 142 California 98 5 8 85 Florida 48 4 - 44 North Carolina 44 3 - 41 New York 41 6 5 30 Texas 39 9 - 30 New Jersey 34 2 3 29 Georgia 32 13 - 19 Pennsylvania 154 36 1 117 Other States $ 648 $ 87 $ 24 $ 537 Total TOTAL SBL NON - REAL ESTATE SBL CONSTRUCTION SBL COMMERCIAL MORTGAGE TYPE $ 84 $ 39 $ - $ 45 Funeral homes and funeral services 83 - - 83 Hotels (except casino hotels) and motels 36 3 2 31 Full - service restaurants 30 4 - 26 Child day care services 24 - 13 11 Car washes 21 - - 21 Homes for the elderly 16 - 1 15 Gasoline stations with convenience stores 15 - - 15 Outpatient mental health and substance abuse centers 13 - - 13 General line grocery merchant wholesalers 11 1 - 10 Plumbing, heating, and air - conditioning companies 9 2 - 7 Fitness and recreational sports centers 9 - - 9 Caterers 9 - - 9 Offices of lawyers 7 3 - 4 Limited - service restaurants 281 35 8 238 Other $ 648 $ 87 $ 24 $ 537 Total 1 Excludes the government guaranteed portion of SBA 7(a) loans and PPP loans. TYPE DISTRIBUTION • Diverse product mix • Commercial mortgage and construction are generally originated with 50% - 60% LTV’s GEOGRAPHIC DISTRIBUTION • Diverse geographic mix • Largest concentration in California representing 24% of total PORTFOLIO ATTRIBUTES
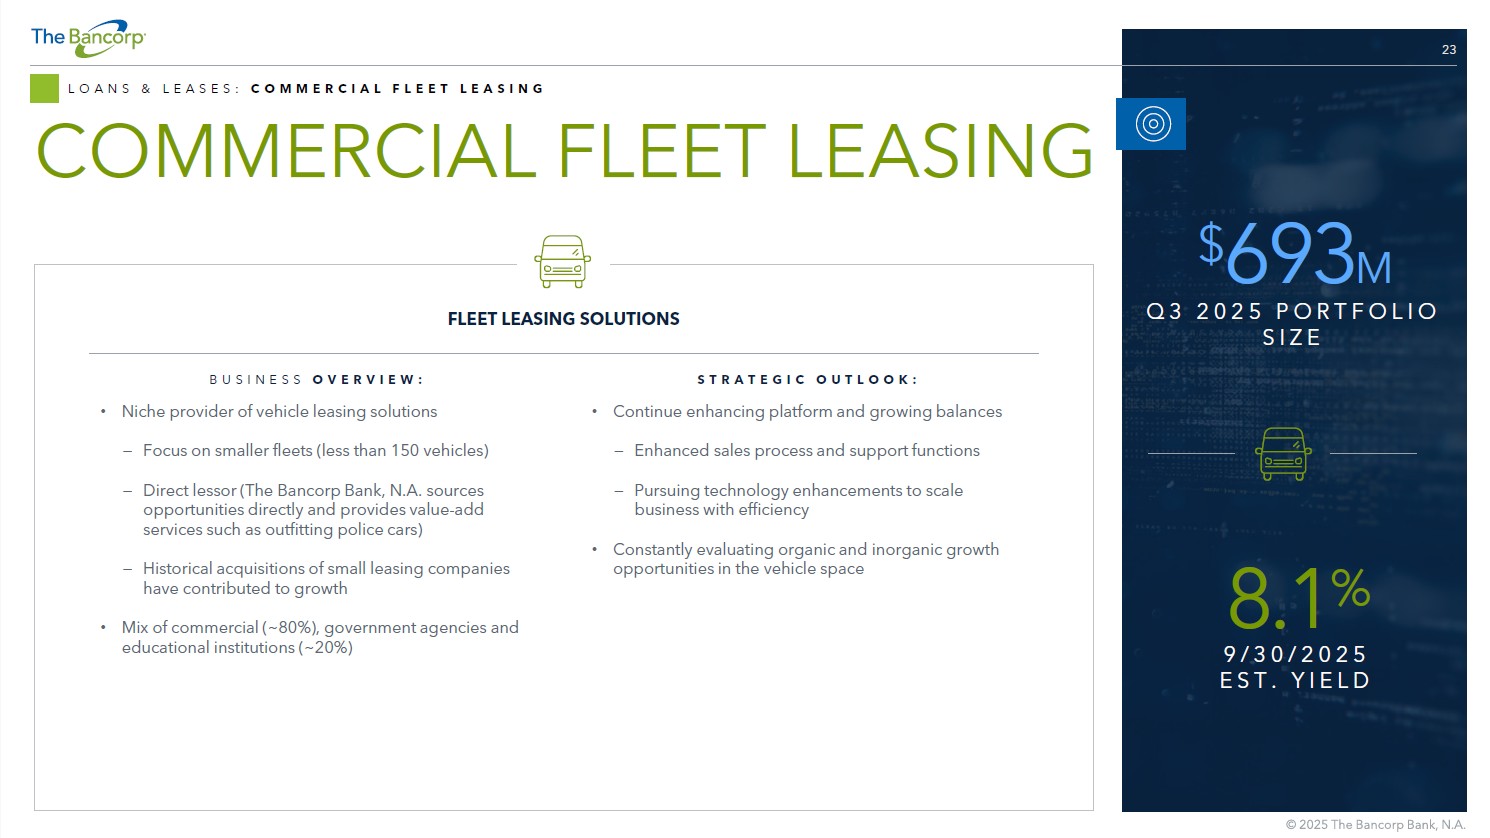
23 LOANS & LEASES: COMMERCIAL FLEET LEASING COMMERCIAL FLEET LEASING BUSINESS OVERVIEW: • Niche provider of vehicle leasing solutions − Focus on smaller fleets (less than 150 vehicles) − Direct lessor (The Bancorp Bank, N.A. sources opportunities directly and provides value - add services such as outfitting police cars) − Historical acquisitions of small leasing companies have contributed to growth • Mix of commercial (~80%), government agencies and educational institutions (~20%) STRATEGIC OUTLOOK: • Continue enhancing platform and growing balances − Enhanced sales process and support functions − Pursuing technology enhancements to scale business with efficiency • Constantly evaluating organic and inorganic growth opportunities in the vehicle space FLEET LEASING SOLUTIONS $ 693 M Q3 2025 PORTFOLIO SIZE 8.1 % 9/30/2025 EST. YIELD
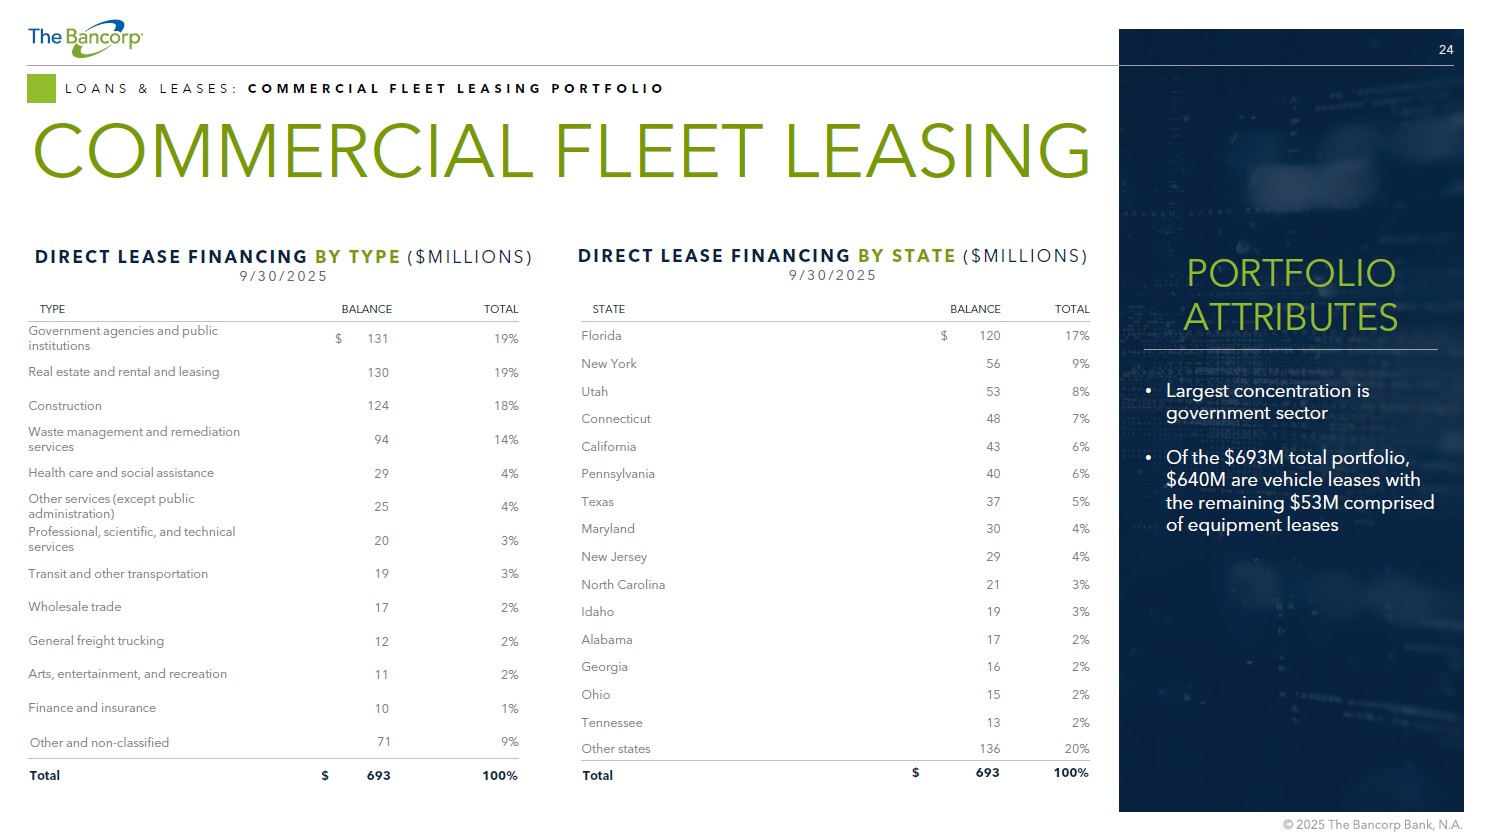
24 TOTAL BALANCE STATE 17% $ 120 Florida 9% 56 New York 8% 53 Utah 7% 48 Connecticut 6% 43 California 6% 40 Pennsylvania 5% 37 Texas 4% 30 Maryland 4% 29 New Jersey 3% 21 North Carolina 3% 19 Idaho 2% 17 Alabama 2% 16 Georgia 2% 15 Ohio 2% 13 Tennessee 20% 136 Other states 100% $ 693 Total LOANS & LEASES: COMMERCIAL FLEET LEASING PORTFOLIO COMMERCIAL FLEET LEASING • Largest concentration is government sector • Of the $693M total portfolio, $640M are vehicle leases with the remaining $53M comprised of equipment leases PORTFOLIO ATTRIBUTES TOTAL BALANCE TYPE 19% $ 131 Government agencies and public institutions 19% 130 Real estate and rental and leasing 18% 124 Construction 14% 94 Waste management and remediation services 4% 29 Health care and social assistance 4% 25 Other services (except public administration) 3% 20 Professional, scientific, and technical services 3% 19 Transit and other transportation 2% 17 Wholesale trade 2% 12 General freight trucking 2% 11 Arts, entertainment, and recreation 1% 10 Finance and insurance 9% 71 Other and non - classified 100% $ 693 Total DIRECT LEASE FINANCING BY STATE ($MILLIONS) 9/30/2025 DIRECT LEASE FINANCING BY TYPE ($MILLIONS) 9/30/2025

FINANCIAL REVIEW
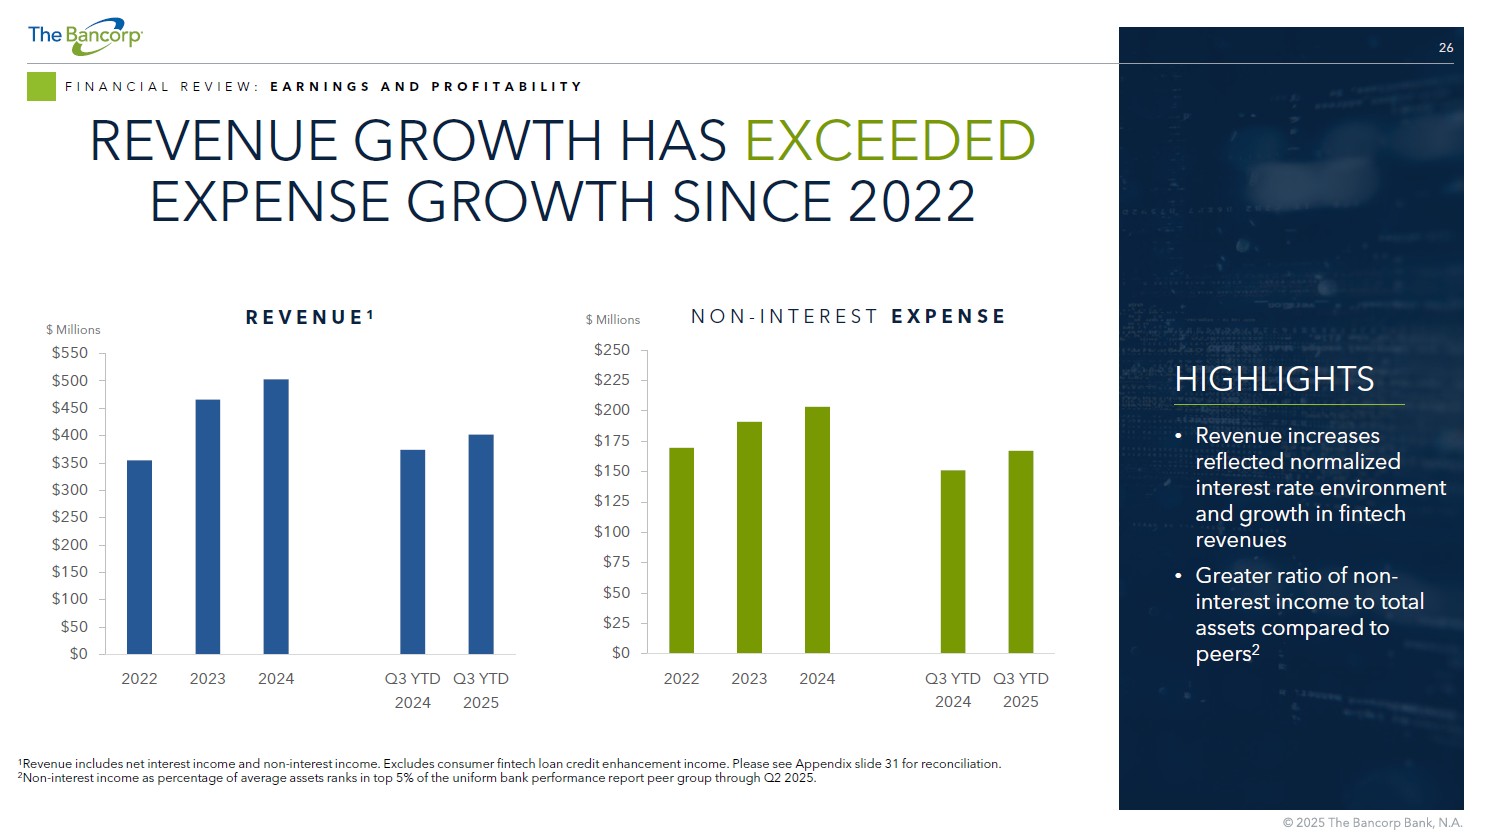
26 FINANCIAL REVIEW: EARNINGS AND PROFITABILITY REVENUE GROWTH HAS EXCEEDED EXPENSE GROWTH SINCE 2022 1 Revenue includes net interest income and non - interest income. Excludes consumer fintech loan credit enhancement income. Please s ee Appendix slide 31 for reconciliation. 2 Non - interest income as percentage of average assets ranks in top 5% of the uniform bank performance report peer group through Q2 2025. $0 $25 $50 $75 $100 $125 $150 $175 $200 $225 $250 2022 2023 2024 Q3 YTD 2024 Q3 YTD 2025 NON - INTEREST EXPENSE $ Millions $0 $50 $100 $150 $200 $250 $300 $350 $400 $450 $500 $550 2022 2023 2024 Q3 YTD 2024 Q3 YTD 2025 REVENUE 1 $ Millions HIGHLIGHTS • Revenue increases reflected normalized interest rate environment and growth in fintech revenues • Greater ratio of non - interest income to total assets compared to peers 2
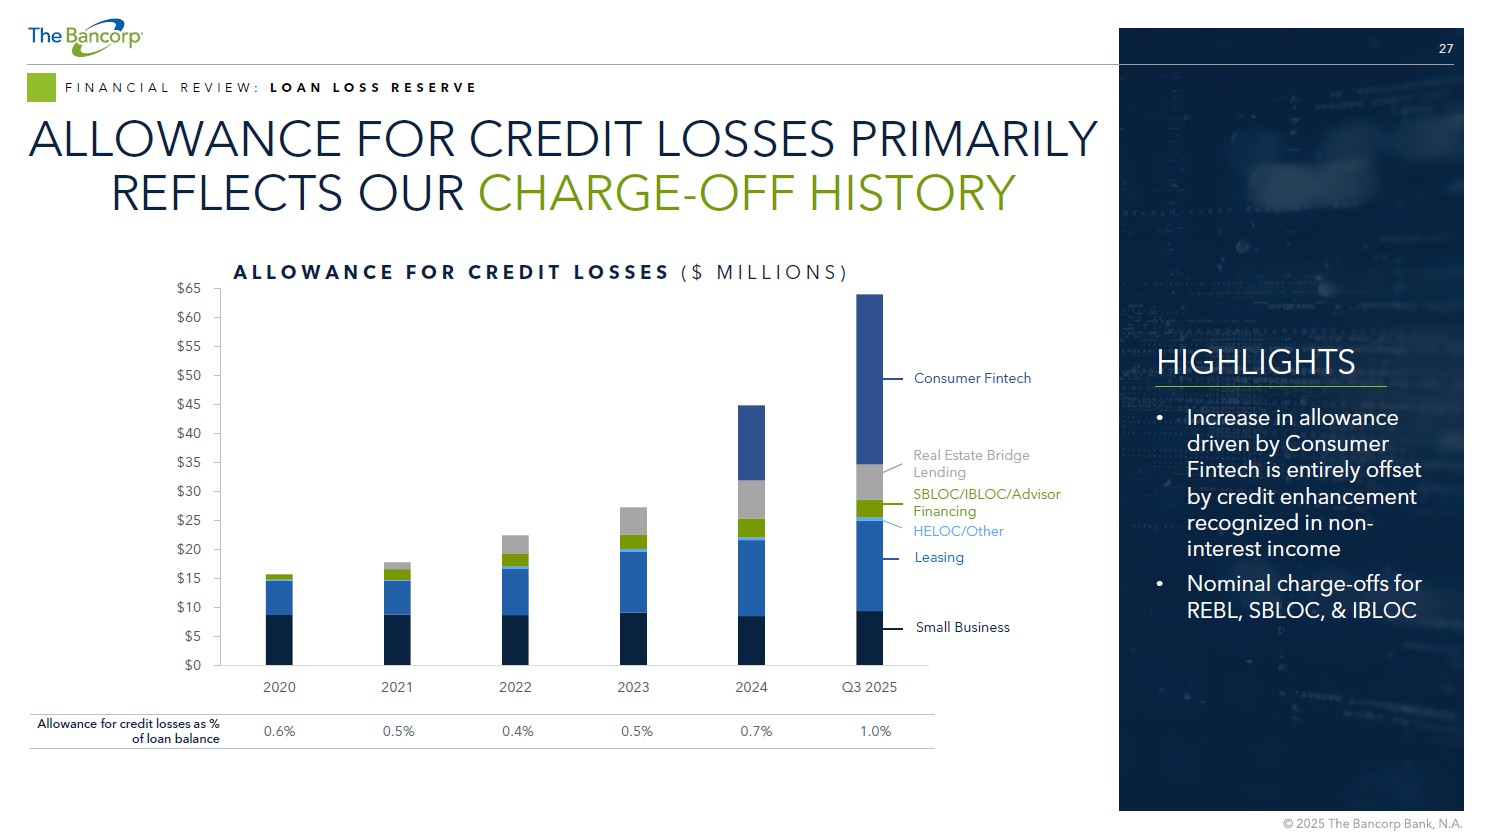
27 $0 $5 $10 $15 $20 $25 $30 $35 $40 $45 $50 $55 $60 $65 2020 2021 2022 2023 2024 Q3 2025 FINANCIAL REVIEW: LOAN LOSS RESERVE ALLOWANCE FOR CREDIT LOSSES PRIMARILY REFLECTS OUR CHARGE - OFF HISTORY HIGHLIGHTS • Increase in allowance driven by Consumer Fintech is entirely offset by credit enhancement recognized in non - interest income • Nominal charge - offs for REBL, SBLOC, & IBLOC ALLOWANCE FOR CREDIT LOSSES ($ MILLIONS) 1.0% 0.7% 0.5% 0.4% 0.5% 0.6% Allowance for credit losses as % of loan balance Small Business HELOC/Other SBLOC/IBLOC/Advisor Financing Leasing Real Estate Bridge Lending Consumer Fintech
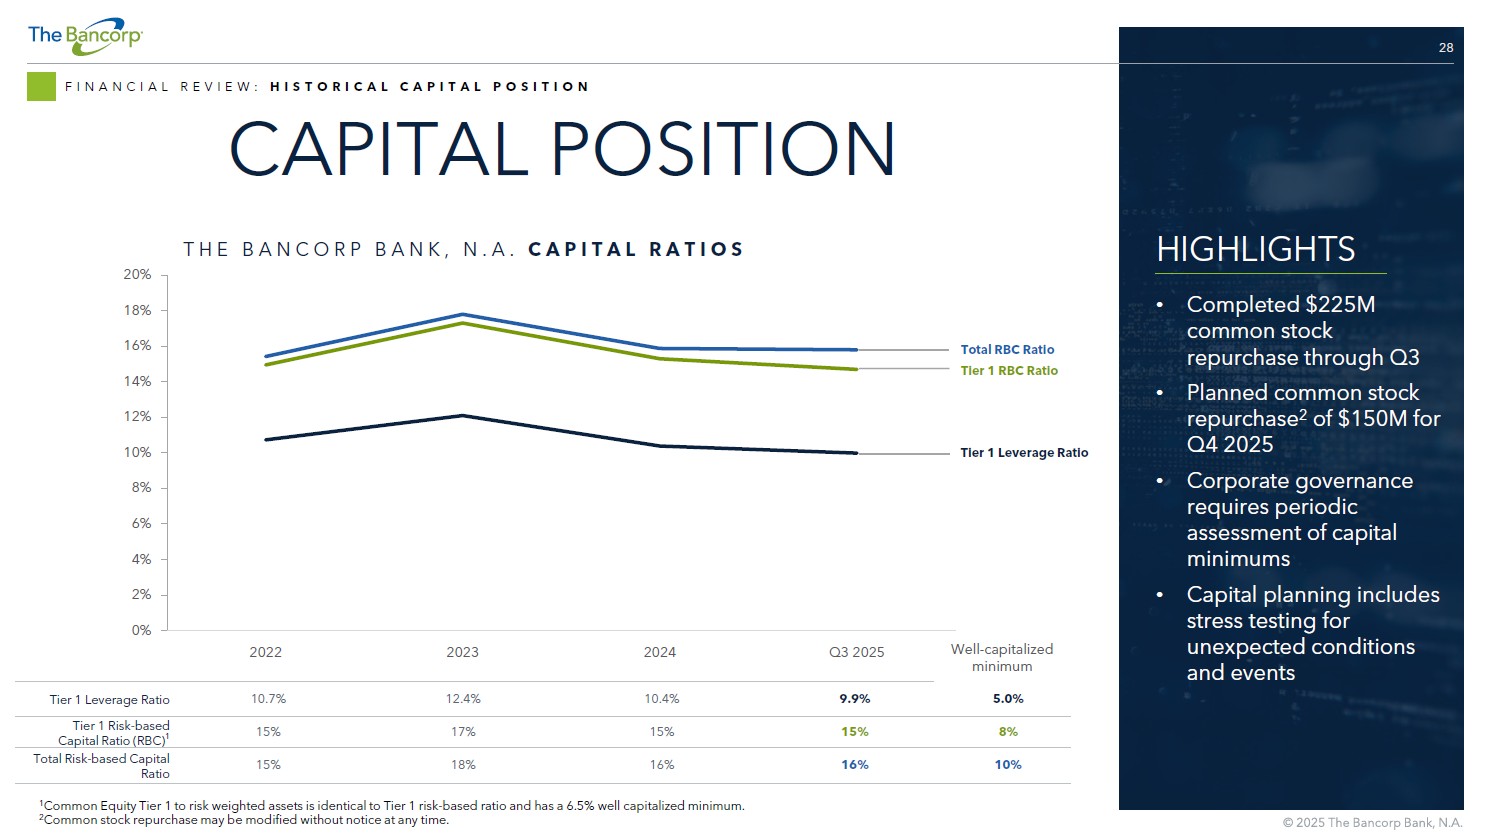
28 FINANCIAL REVIEW: HISTORICAL CAPITAL POSITION CAPITAL POSITION HIGHLIGHTS • Completed $225M common stock repurchase through Q3 • Planned common stock repurchase 2 of $150M for Q4 2025 • Corporate governance requires periodic assessment of capital minimums • Capital planning includes stress testing for unexpected conditions and events 0% 2% 4% 6% 8% 10% 12% 14% 16% 18% 20% 2022 2023 2024 Q3 2025 5.0% 9.9% 10.4% 12.4% 10.7% Tier 1 Leverage Ratio 8% 15% 15% 17% 15% Tier 1 Risk - based Capital Ratio (RBC) 1 10% 16% 16% 18% 15% Total Risk - based Capital Ratio Tier 1 RBC Ratio Total RBC Ratio Tier 1 Leverage Ratio THE BANCORP BANK, N.A. CAPITAL RATIOS Well - capitalized minimum 1 Common Equity Tier 1 to risk weighted assets is identical to Tier 1 risk - based ratio and has a 6.5% well capitalized minimum. 2 Common stock repurchase may be modified without notice at any time.
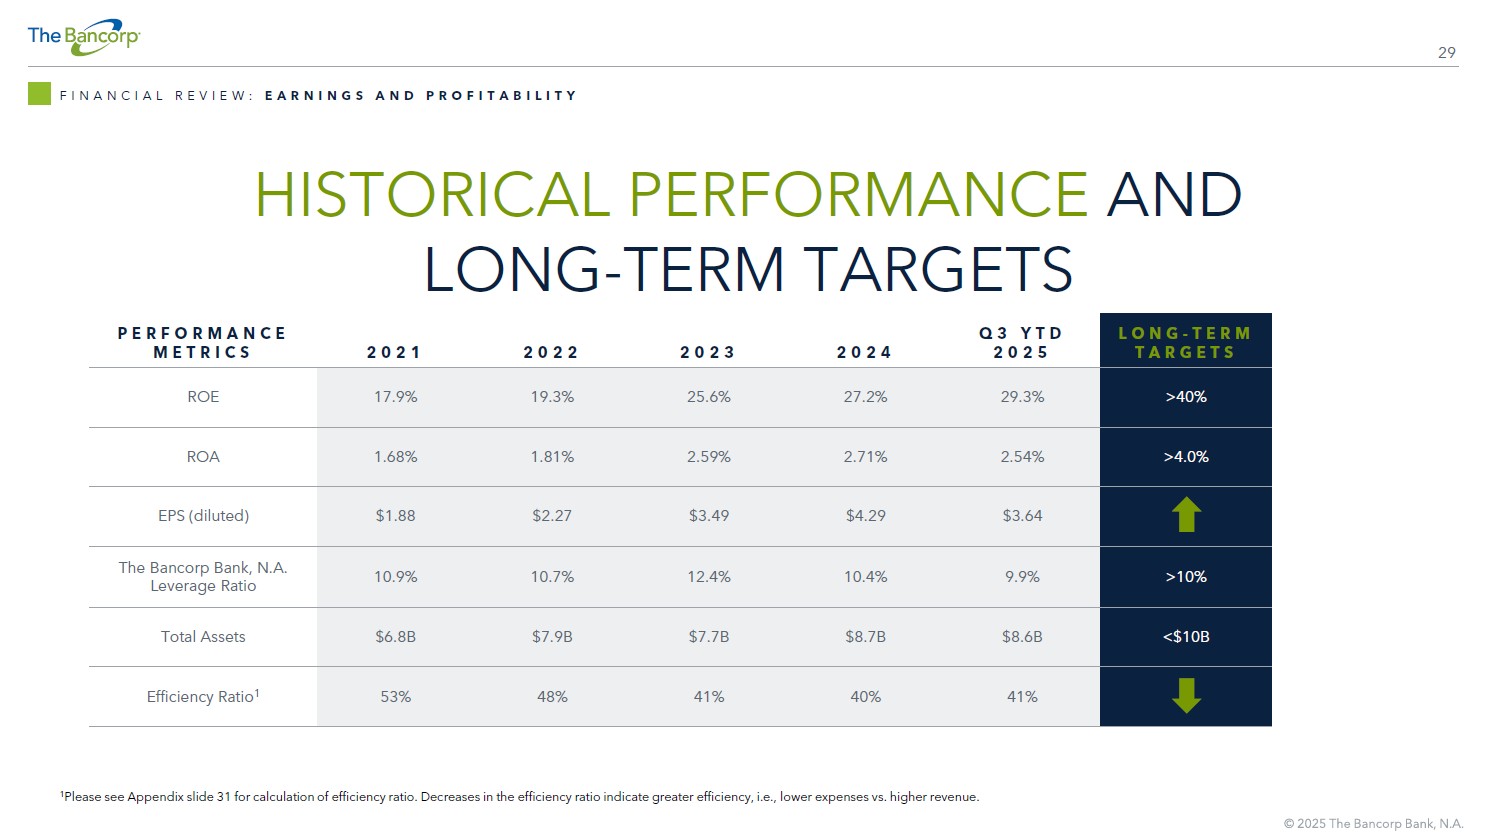
29 HISTORICAL PERFORMANCE AND LONG - TERM TARGETS FINANCIAL REVIEW: EARNINGS AND PROFITABILITY LONG - TERM TARGETS Q3 YTD 2025 2024 2023 2022 2021 PERFORMANCE METRICS >40% 29.3% 27.2% 25.6% 19.3% 17.9% ROE >4.0% 2.54% 2.71% 2.59% 1.81% 1.68% ROA $3.64 $4.29 $3.49 $2.27 $1.88 EPS (diluted) >10% 9.9% 10.4% 12.4% 10.7% 10.9% The Bancorp Bank, N.A. Leverage Ratio <$10B $8.6B $8.7B $7.7B $7.9B $6.8B Total Assets 41% 40% 41% 48% 53% Efficiency Ratio 1 1 Please see Appendix slide 31 for calculation of efficiency ratio. Decreases in the efficiency ratio indicate greater efficien cy, i.e., lower expenses vs. higher revenue.

APPENDIX
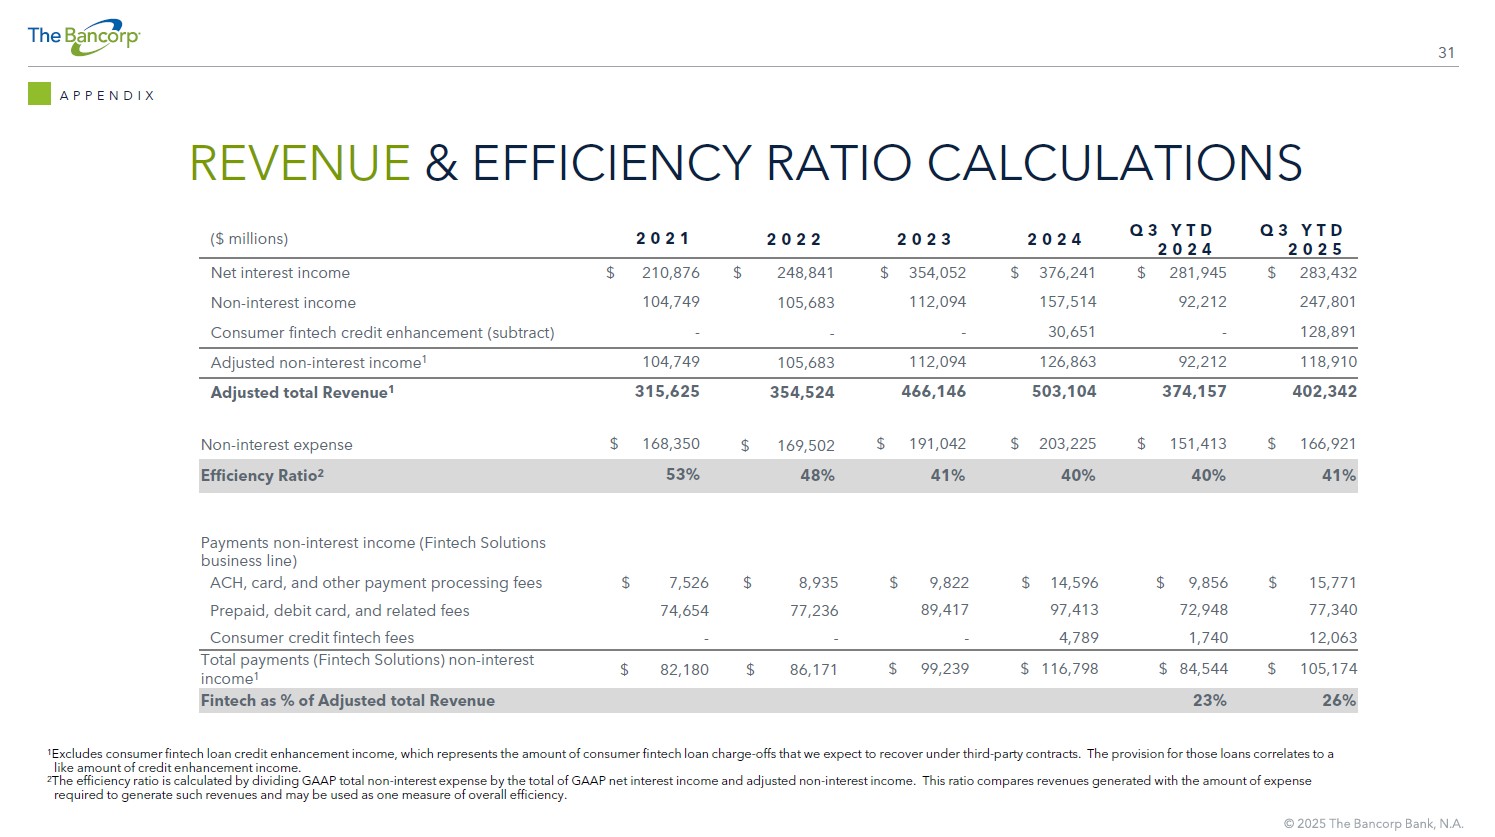
31 REVENUE & EFFICIENCY RATIO CALCULATIONS APPENDIX Q3 YTD 2025 Q3 YTD 2024 2024 2023 2022 2021 ($ millions) $ 283,432 $ 281,945 $ 376,241 $ 354,052 $ 248,841 $ 210,876 Net interest income 247,801 92,212 157,514 112,094 105,683 104,749 Non - interest income 128,891 - 30,651 - - - Consumer fintech credit enhancement (subtract) 118,910 92,212 126,863 112,094 105,683 104,749 Adjusted non - interest income 1 402,342 374,157 503,104 466,146 354,524 315,625 Adjusted total Revenue 1 $ 166,921 $ 151,413 $ 203,225 $ 191,042 $ 169,502 $ 168,350 Non - interest expense 41% 40% 40% 41% 48% 53% Efficiency Ratio 2 Payments non - interest income (Fintech Solutions business line) $ 15,771 $ 9,856 $ 14,596 $ 9,822 $ 8,935 $ 7,526 ACH, card, and other payment processing fees 77,340 72,948 97,413 89,417 77,236 74,654 Prepaid, debit card, and related fees 12,063 1,740 4,789 - - - Consumer credit fintech fees $ 105,174 $ 84,544 $ 116,798 $ 99,239 $ 86,171 $ 82,180 Total payments (Fintech Solutions) non - interest income 1 26% 23% Fintech as % of Adjusted total Revenue 1 Excludes consumer fintech loan credit enhancement income, which represents the amount of consumer fintech loan charge - offs that we expect to recover under third - party contracts. The provision for those loans correlates to a like amount of credit enhancement income. 2 The efficiency ratio is calculated by dividing GAAP total non - interest expense by the total of GAAP net interest income and adju sted non - interest income. This ratio compares revenues generated with the amount of expense required to generate such revenues and may be used as one measure of overall efficiency.