tbi-20210426false000076889900007688992021-04-262021-04-26
UNITED STATES
SECURITIES AND EXCHANGE COMMISSION
WASHINGTON, DC 20549
FORM 8-K
CURRENT REPORT
PURSUANT TO SECTION 13 OR 15(D) OF THE
SECURITIES EXCHANGE ACT OF 1934
Date of report (Date of earliest event reported): April 26, 2021
TrueBlue, Inc.
(Exact Name of Registrant as Specified in Its Charter)
Washington
(State or Other Jurisdiction
of Incorporation)
| | | | | | | | |
| 001-14543 | | 91-1287341 |
(Commission
File Number) | | (IRS Employer
Identification No.) |
1015 A Street, Tacoma, Washington 98402
(Address of principal executive offices) (Zip Code)
Registrant’s telephone number, including area code: (253) 383-9101
Not Applicable
(Former Name or Former Address, if Changed Since Last Report)
Check the appropriate box below if the Form 8-K filing is intended to simultaneously satisfy the filing obligation of the registrant under any of the following provisions (see General Instruction A.2. below):
| | | | | |
| ☐ | Written communications pursuant to Rule 425 under the Securities Act (17 CFR 230.425) |
| | | | | |
| ☐ | Soliciting material pursuant to Rule 14a-12 under the Exchange Act (17 CFR 240.14a-12) |
| | | | | |
| ☐ | Pre-commencement communications pursuant to Rule 14d-2(b) under the Exchange Act (17 CFR 240.14d-2(b)) |
| | | | | |
| ☐ | Pre-commencement communications pursuant to Rule 13e-4(c) under the Exchange Act (17 CFR 240.13e-4(c)) |
Securities registered pursuant to Section 12(b) of the Act:
| | | | | | | | |
| Title of each class | Trading Symbol(s) | Name of each exchange on which registered |
| Common stock, no par value | TBI | New York Stock Exchange |
Indicate by check mark whether the registrant is an emerging growth company as defined in as defined in Rule 405 of the Securities Act of 1933 (§230.405 of this chapter) or Rule 12b-2 of the Securities Exchange Act of 1934 (§240.12b-2 of this chapter).
Emerging growth company ☐
If an emerging growth company, indicate by check mark if the registrant has elected not to use the extended transition period for complying with any new or revised financial accounting standards provided pursuant to Section 13(a) of the Exchange Act. ☐
| | | | | |
| Item 2.02. | Results of Operations and Financial Condition. |
On April 26, 2021, TrueBlue, Inc. (the “company”) issued a press release (the “Press Release”) reporting its financial results for the first quarter ended March 28, 2021, a copy of which is attached hereto as Exhibit 99.1 and the contents of which are incorporated herein by this reference. Also attached to this report as Exhibit 99.2 is a slide presentation relating to the financial results for the first quarter ended March 28, 2021 (the “Earnings Results Presentation”), which will be discussed by management of the company on a live conference call at 2:30 p.m. Pacific Time (5:30 p.m. Eastern Time) on Monday, April 26, 2021. The Earnings Results Presentation is also available on the company’s website at www.trueblue.com.
In accordance with General Instruction B.2. of Form 8-K, the information contained above in this report (including the Press Release and the Earnings Results Presentation) shall not be deemed “Filed” for purposes of Section 18 of the Securities Exchange Act of 1934, as amended, or otherwise subject to the liabilities of that section, nor shall the Press Release or the Earnings Results Presentation be deemed incorporated by reference in any filing under the Securities Act of 1933, as amended, except as shall be expressly set forth by specific reference in such a filing. This report will not be deemed a determination or an admission as to the materiality of any information in the report that is required to be disclosed solely by Regulation FD.
| | | | | |
| Item 7.01. | Regulation FD Disclosure. |
We are also attaching our Investor Roadshow Presentation to this report as Exhibit 99.3, which we will reference in our Q1 2021 earnings results discussion and which may be used in future investor conferences. The Investor Roadshow Presentation is also available on the company’s website at www.trueblue.com.
In accordance with General Instruction B.2. of Form 8-K, the information contained above in this report (including the Investor Roadshow Presentation) shall not be deemed “Filed” for purposes of Section 18 of the Securities Exchange Act of 1934, as amended, or otherwise subject to the liabilities of that section, nor shall the Investor Roadshow Presentation be deemed incorporated by reference in any filing under the Securities Act of 1933, as amended, except as shall be expressly set forth by specific reference in such a filing. This report will not be deemed a determination or an admission as to the materiality of any information in the report that is required to be disclosed solely by Regulation FD.
| | | | | |
| Item 9.01. | Financial Statements and Exhibits. |
(d)Exhibits
| | | | | | | | |
Exhibit
Number | Exhibit Description | Filed Herewith |
| 99.1 | | X |
| 99.2 | | X |
| 99.3 | | X |
| 104 | Cover page interactive data file - The cover page from this Current Report on Form 8-K is formatted as Inline XBRL | X |
SIGNATURE
Pursuant to the requirements of the Securities Exchange Act of 1934, the registrant has duly caused this report to be signed on its behalf by the undersigned hereunto duly authorized.
| | | | | | | | | | | | | | |
| | | | |
| | | TRUEBLUE, INC. |
| | (Registrant) |
| | |
| Date: | April 26, 2021 | By: | | /s/ Derrek L. Gafford |
| | | | Derrek L. Gafford |
| | | | Chief Financial Officer and Executive Vice President |
TRUEBLUE REPORTS FIRST QUARTER 2021 RESULTS
Broad-based revenue recovery underway across all segments
TACOMA, WASH. - Apr. 26, 2021 -- TrueBlue (NYSE:TBI) today announced its first quarter results for 2021.
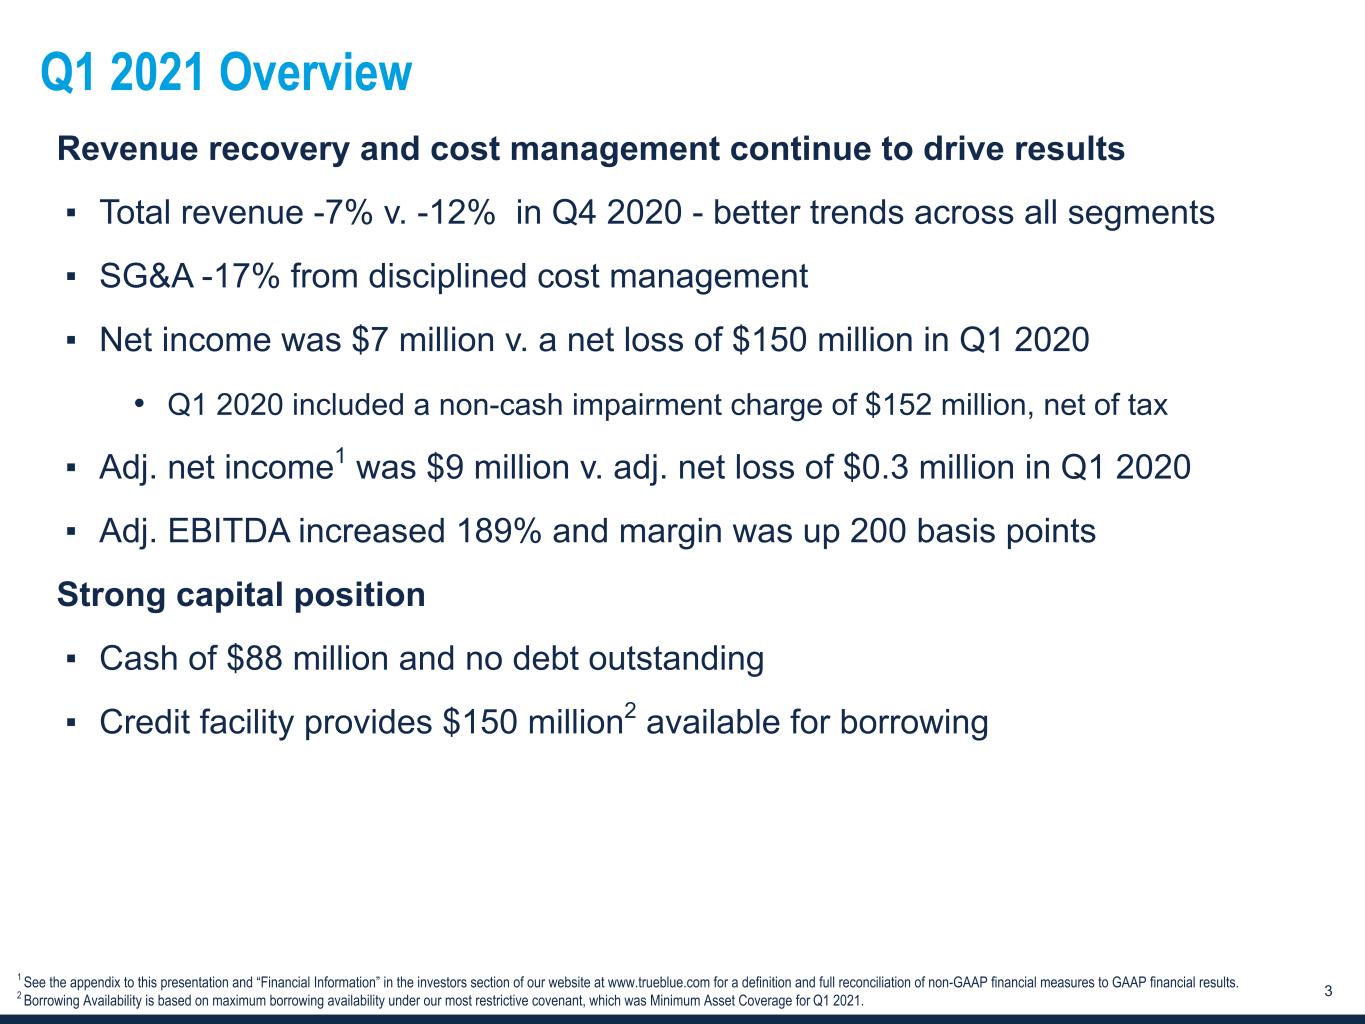
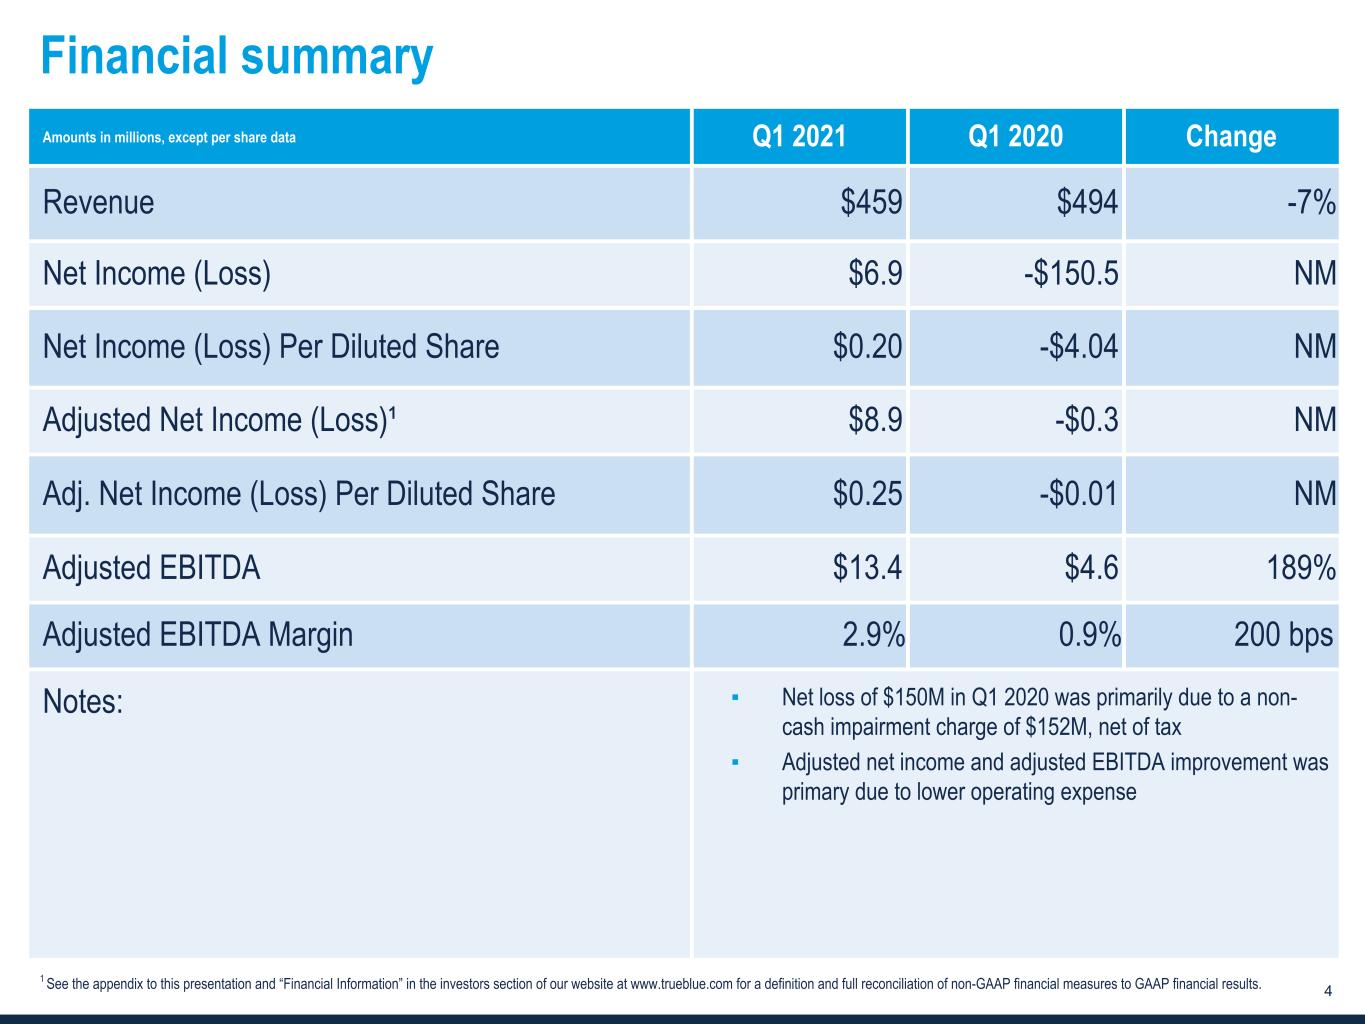
First quarter revenue was $459 million, a decrease of 7 percent compared to revenue of $494 million in the first quarter of 2020. Net income per diluted share was $0.20 compared to net loss per diluted share of $4.04 in the first quarter of 2020. Included in the results for the first quarter of 2020 is a non-cash goodwill and intangible asset impairment charge of $175 million, which is equivalent to $152 million after tax or $4.08 per diluted share. First quarter adjusted net income1 per diluted share was $0.25 compared to adjusted net loss per diluted share of $0.01 in the first quarter of 2020.
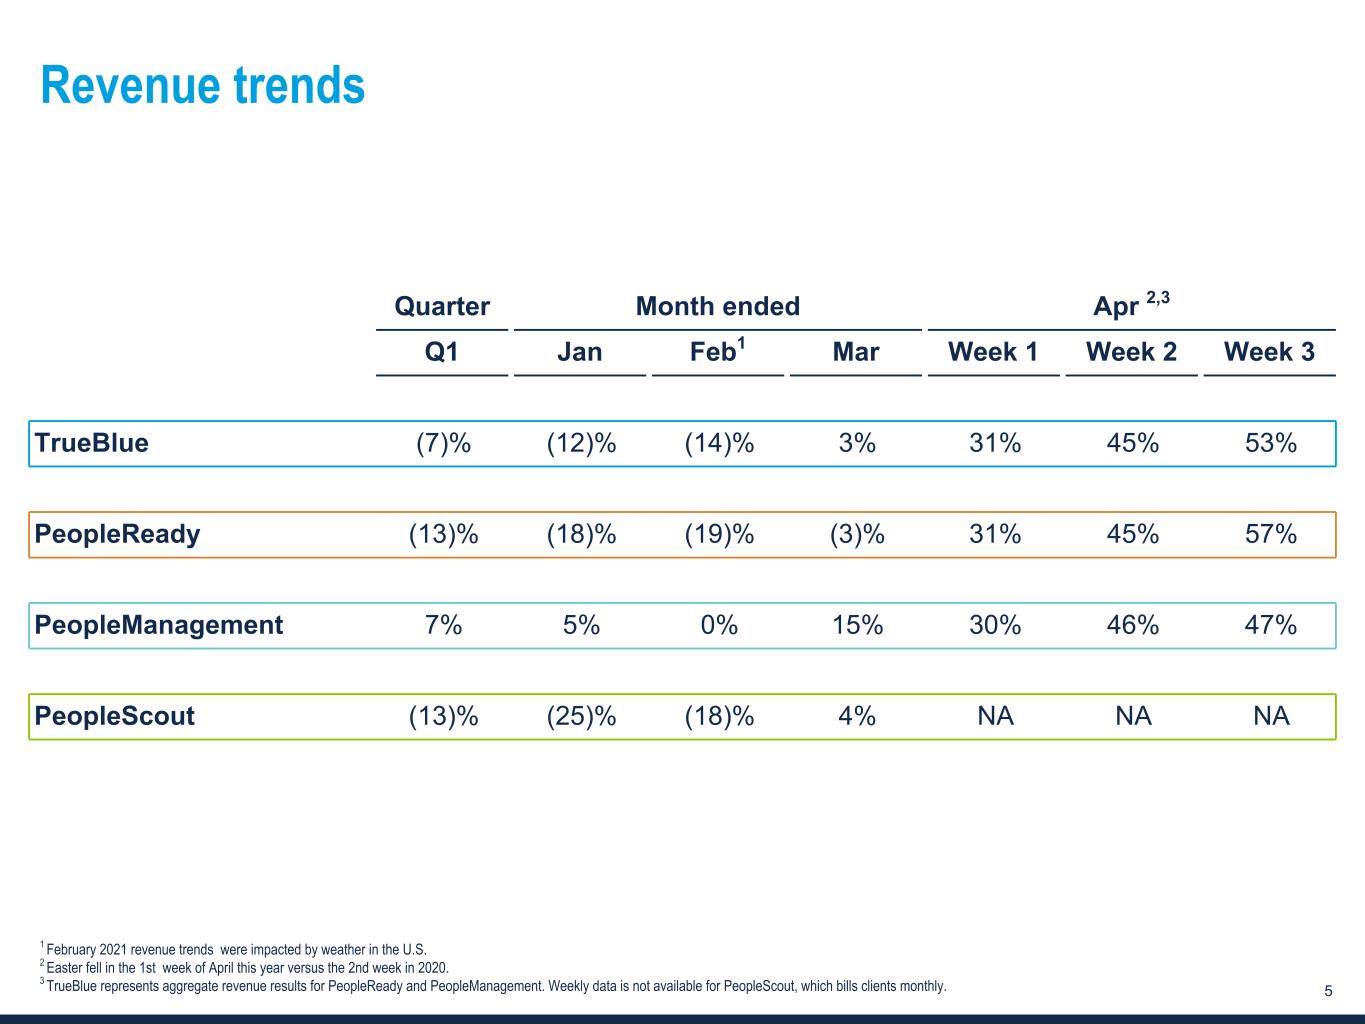
“We had a strong start to the year driven by revenue recovery across all segments and disciplined cost management,” said Patrick Beharelle, CEO of TrueBlue. “We are seeing encouraging new business wins and recovery of existing client volumes, including some of the markets that were hit the hardest last year. Our focus on efficiently managing costs while ensuring we continue to invest in sales resources and digital strategies has allowed us to accelerate our strategic priorities and emerge stronger as the economy begins to shift back to growth.
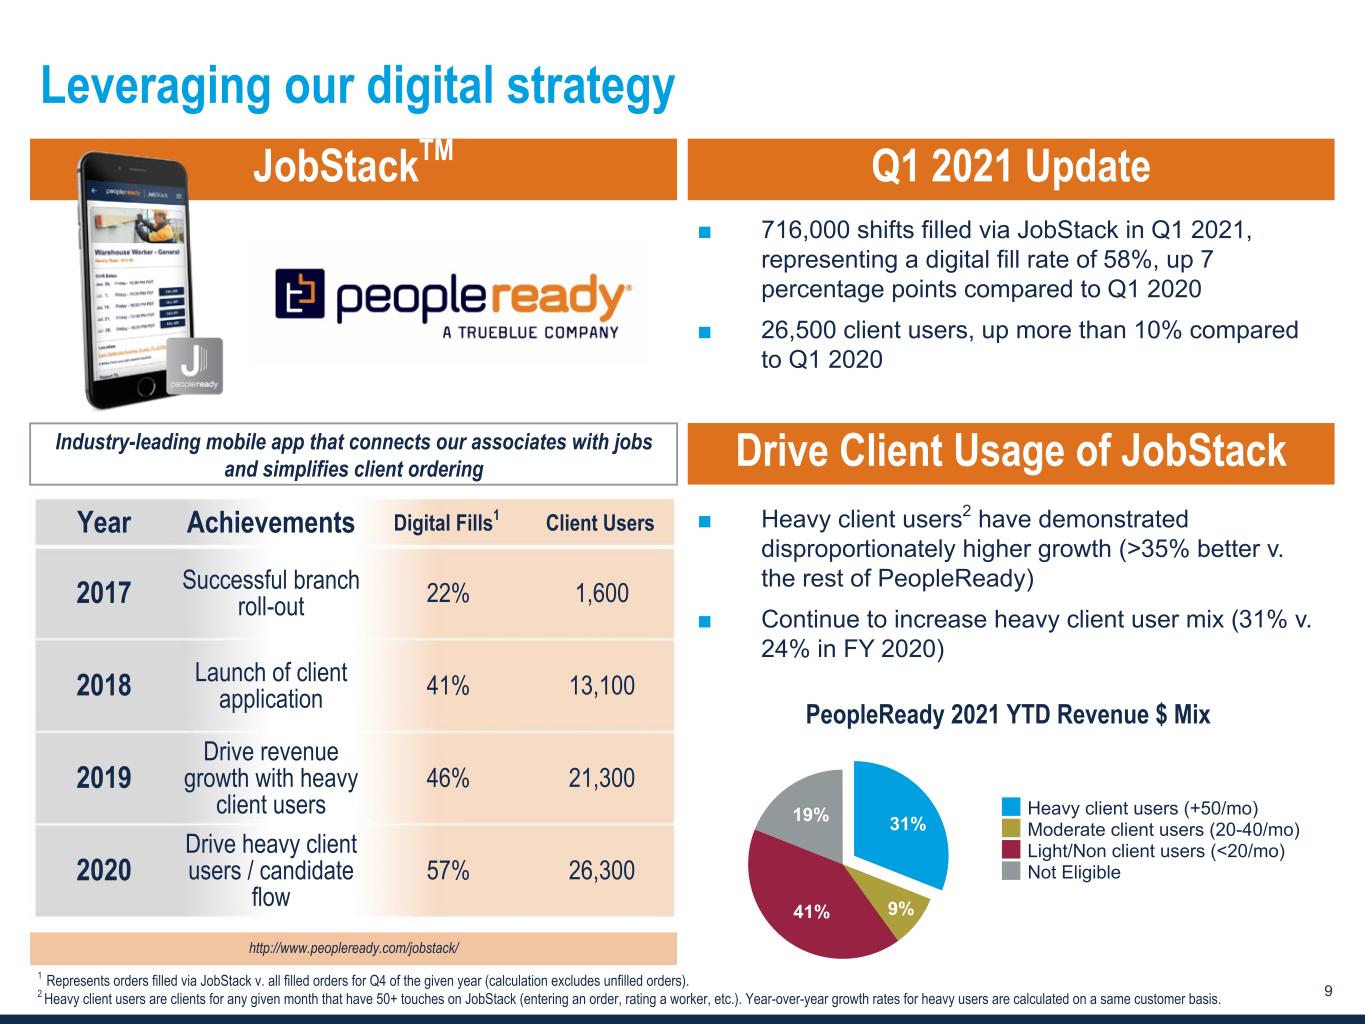
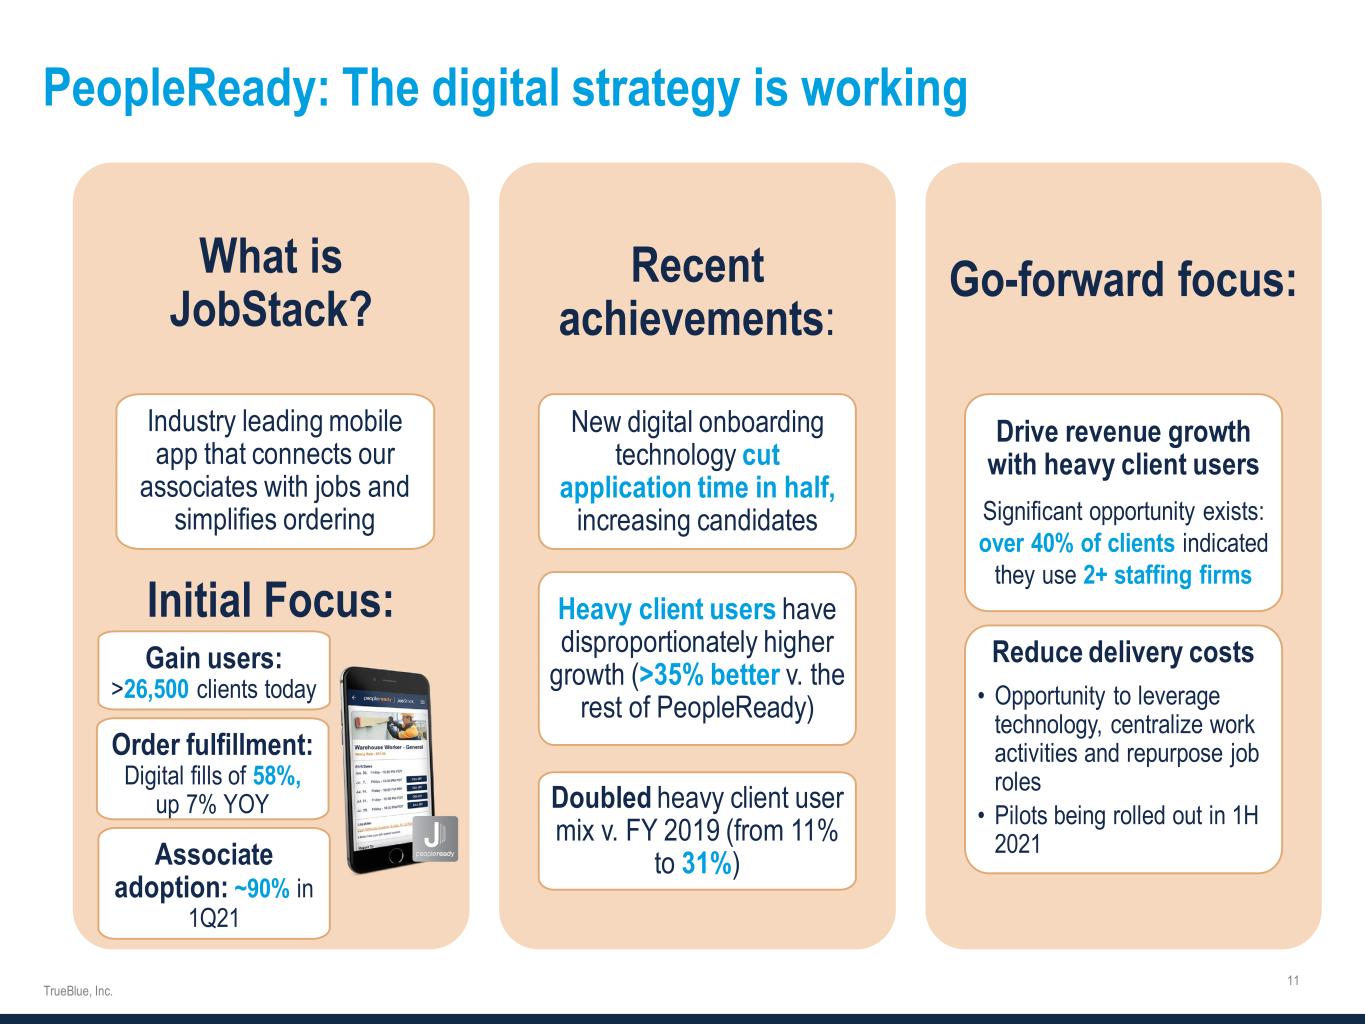
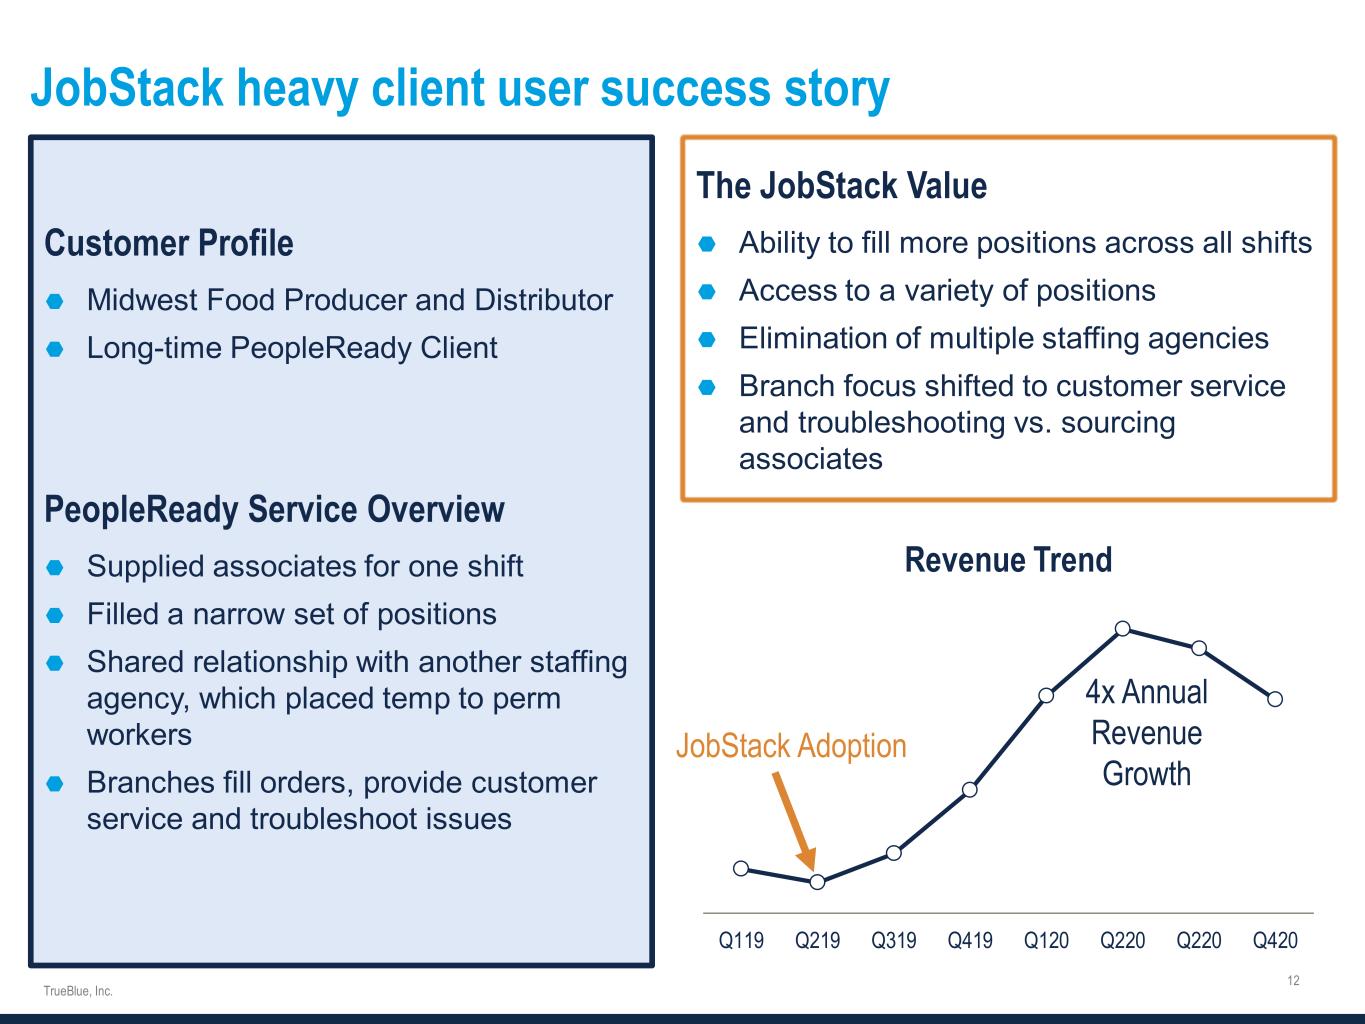
“Our efforts are producing competitive differentiation and in the case of PeopleReady, JobStack heavy client users continue to show higher revenue growth compared to the rest of the customer base,” Mr. Beharelle continued. “We are excited about our market positioning and ability to increase market share.”
2021 Outlook
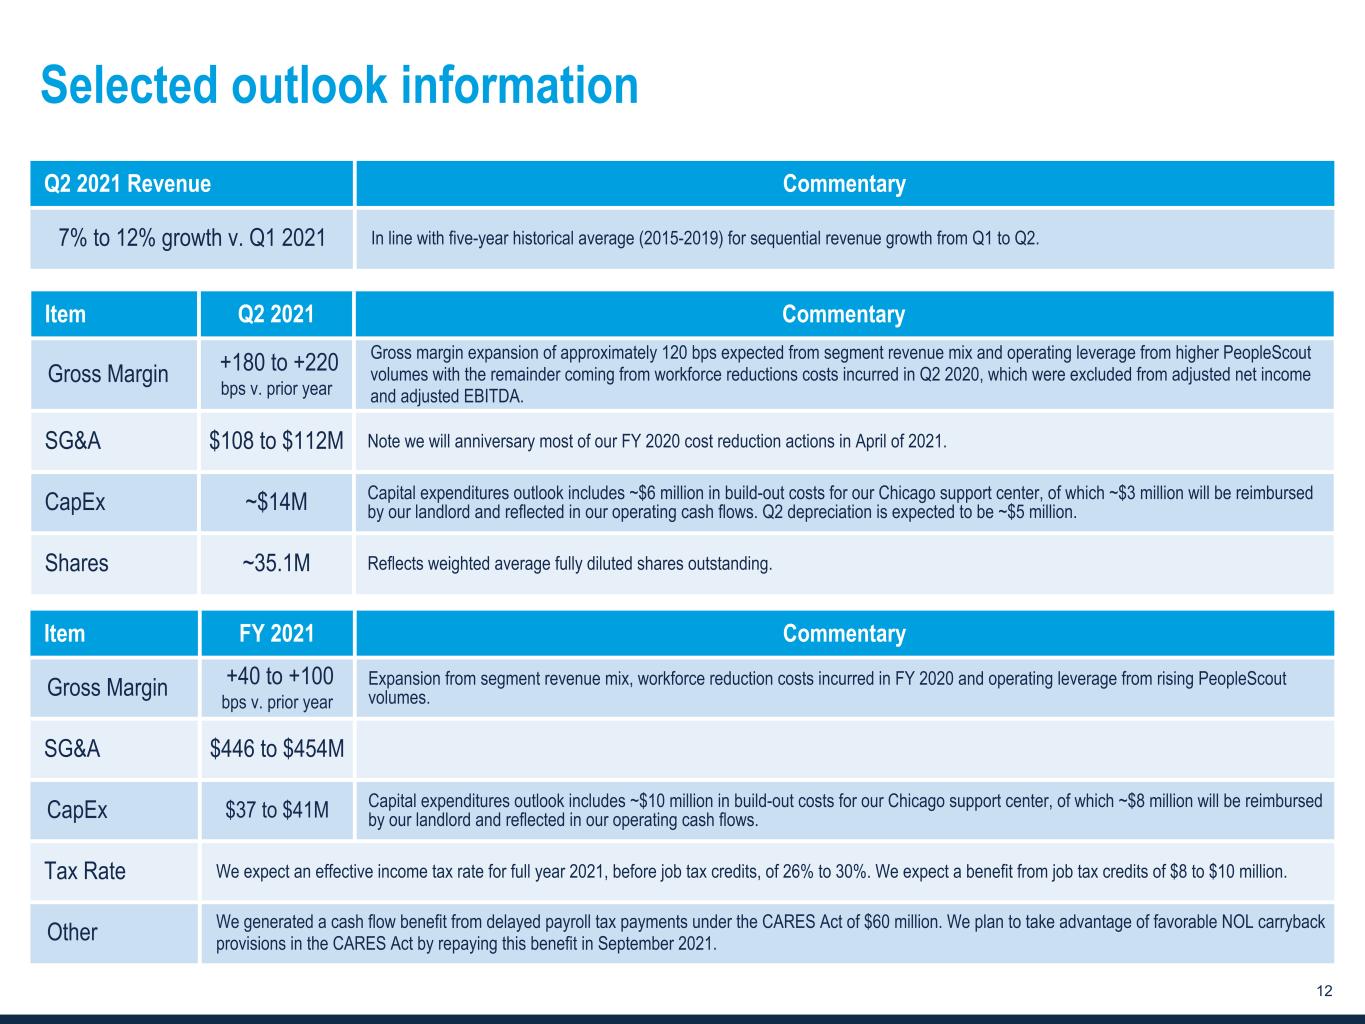
TrueBlue is providing certain forward-looking information to help investors form their own estimates, which can be found in the quarterly earnings presentation filed today.
Management will discuss first quarter 2021 results on a webcast at 2:30 p.m. PT (5:30 p.m. ET), today, Monday, Apr. 26, 2021. The webcast can be accessed on TrueBlue’s website: www.trueblue.com.
About TrueBlue
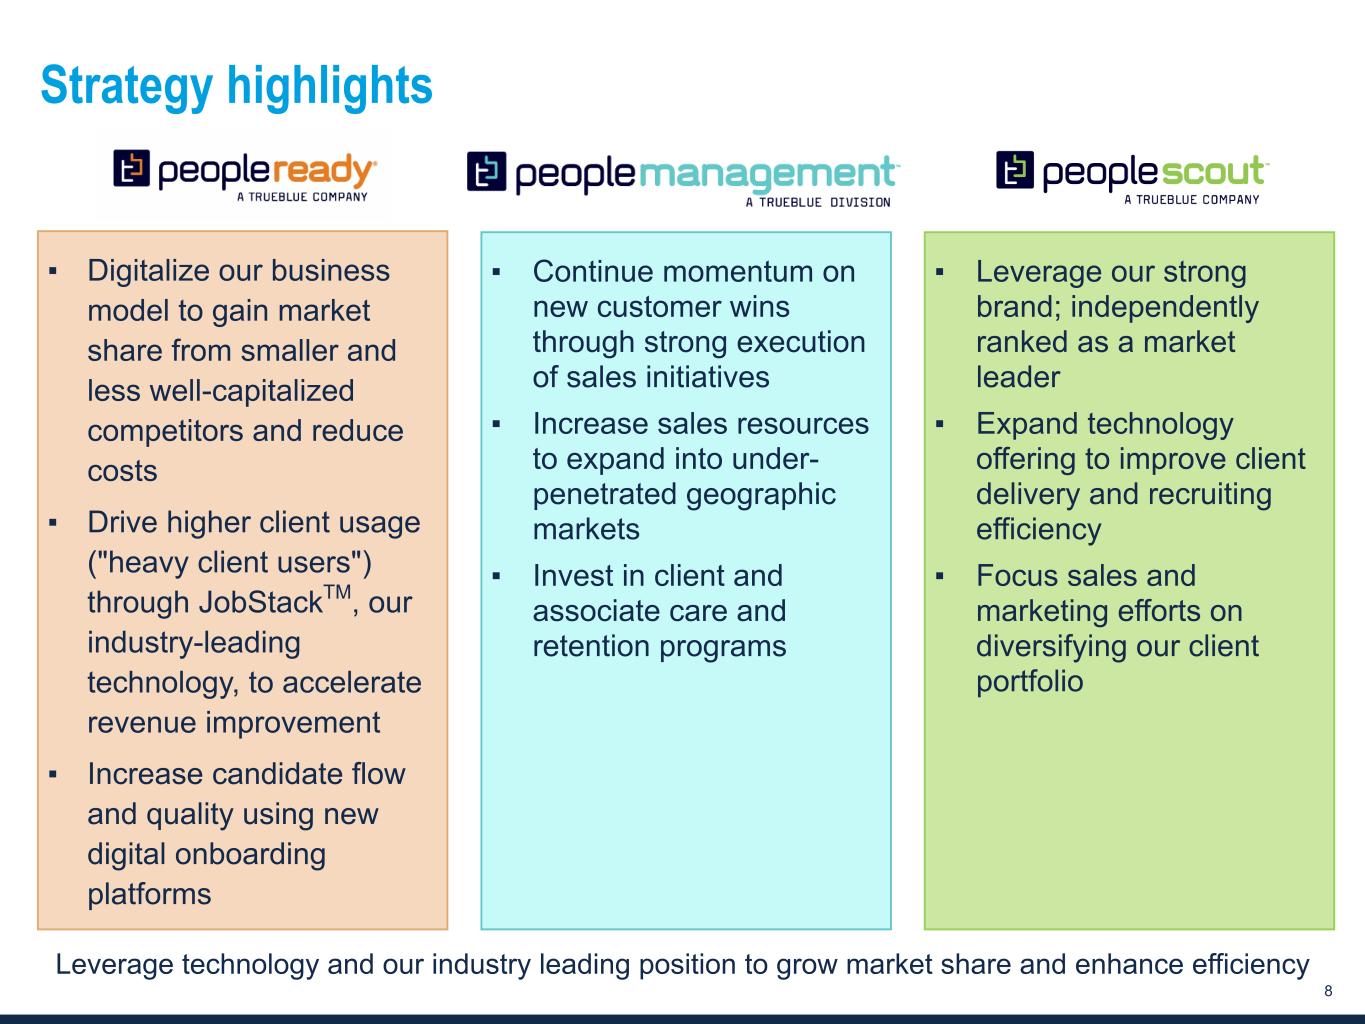
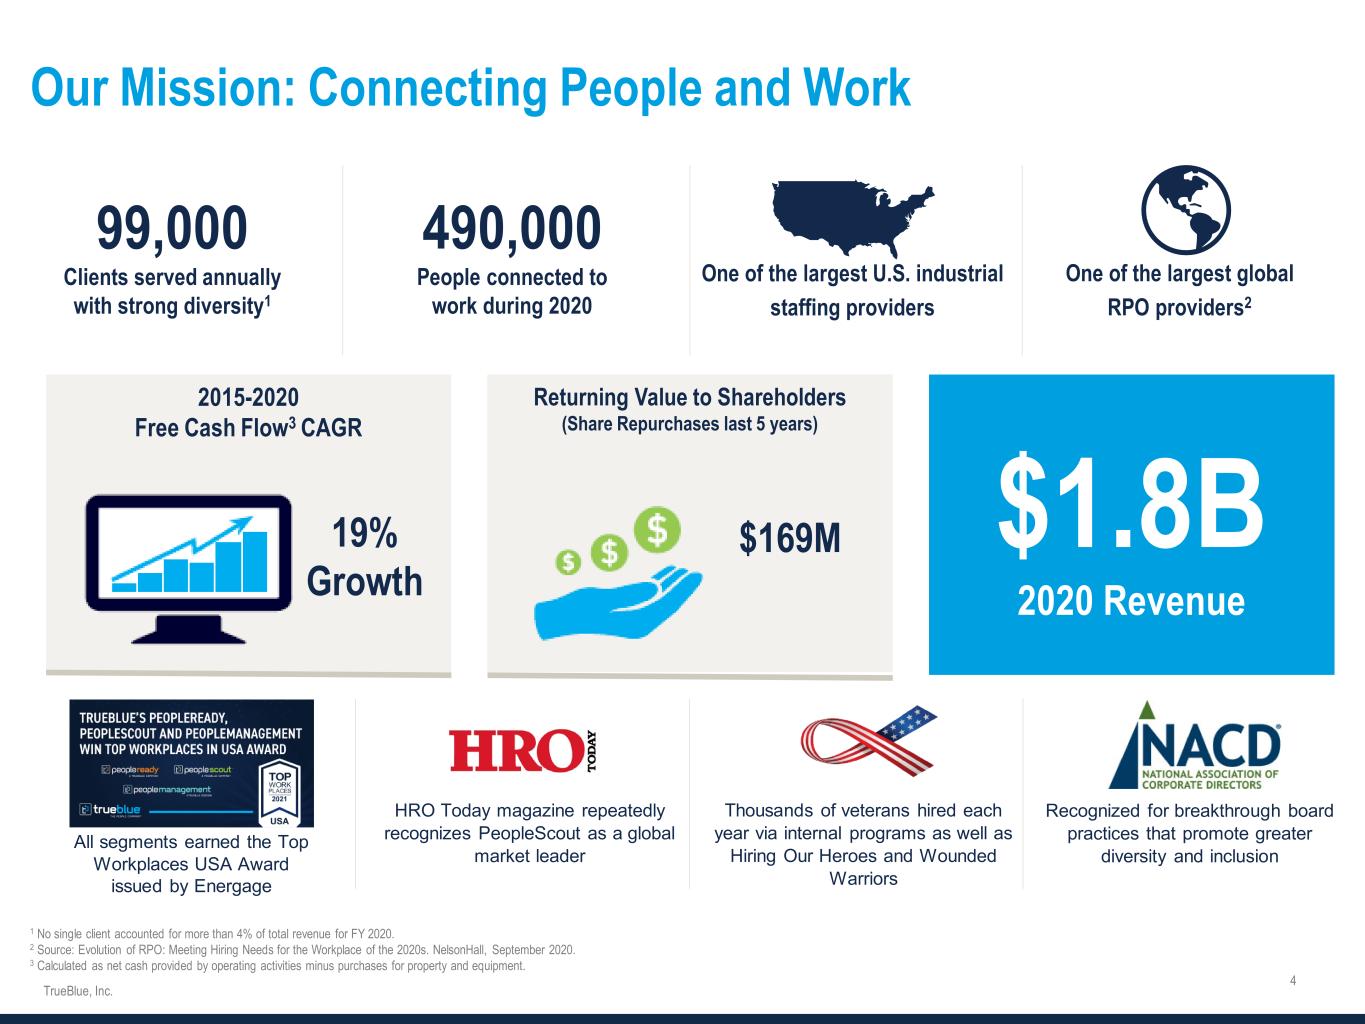
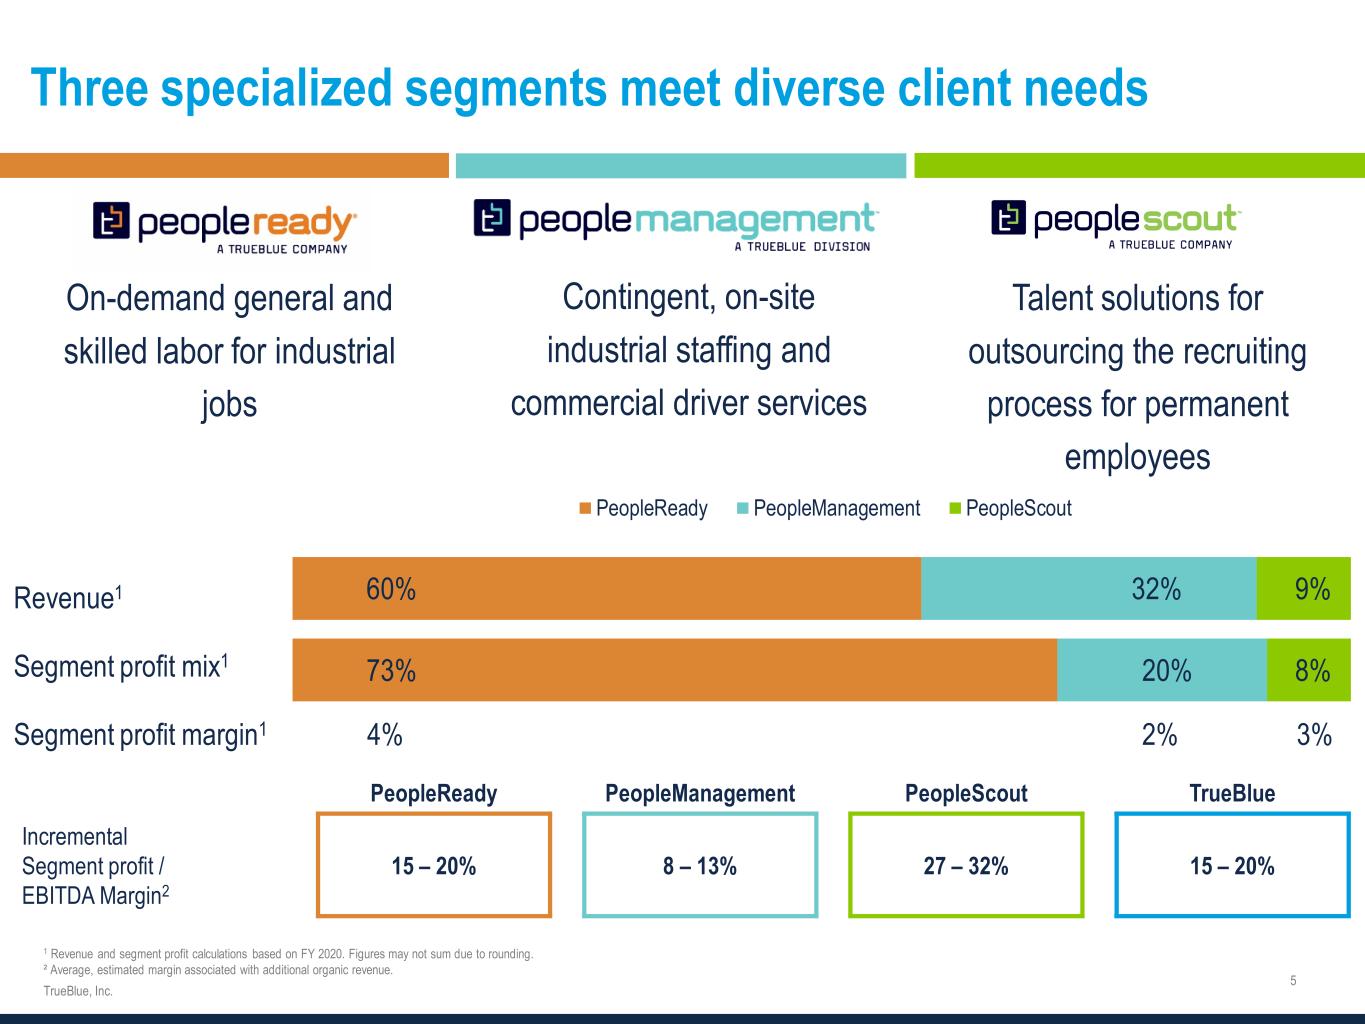
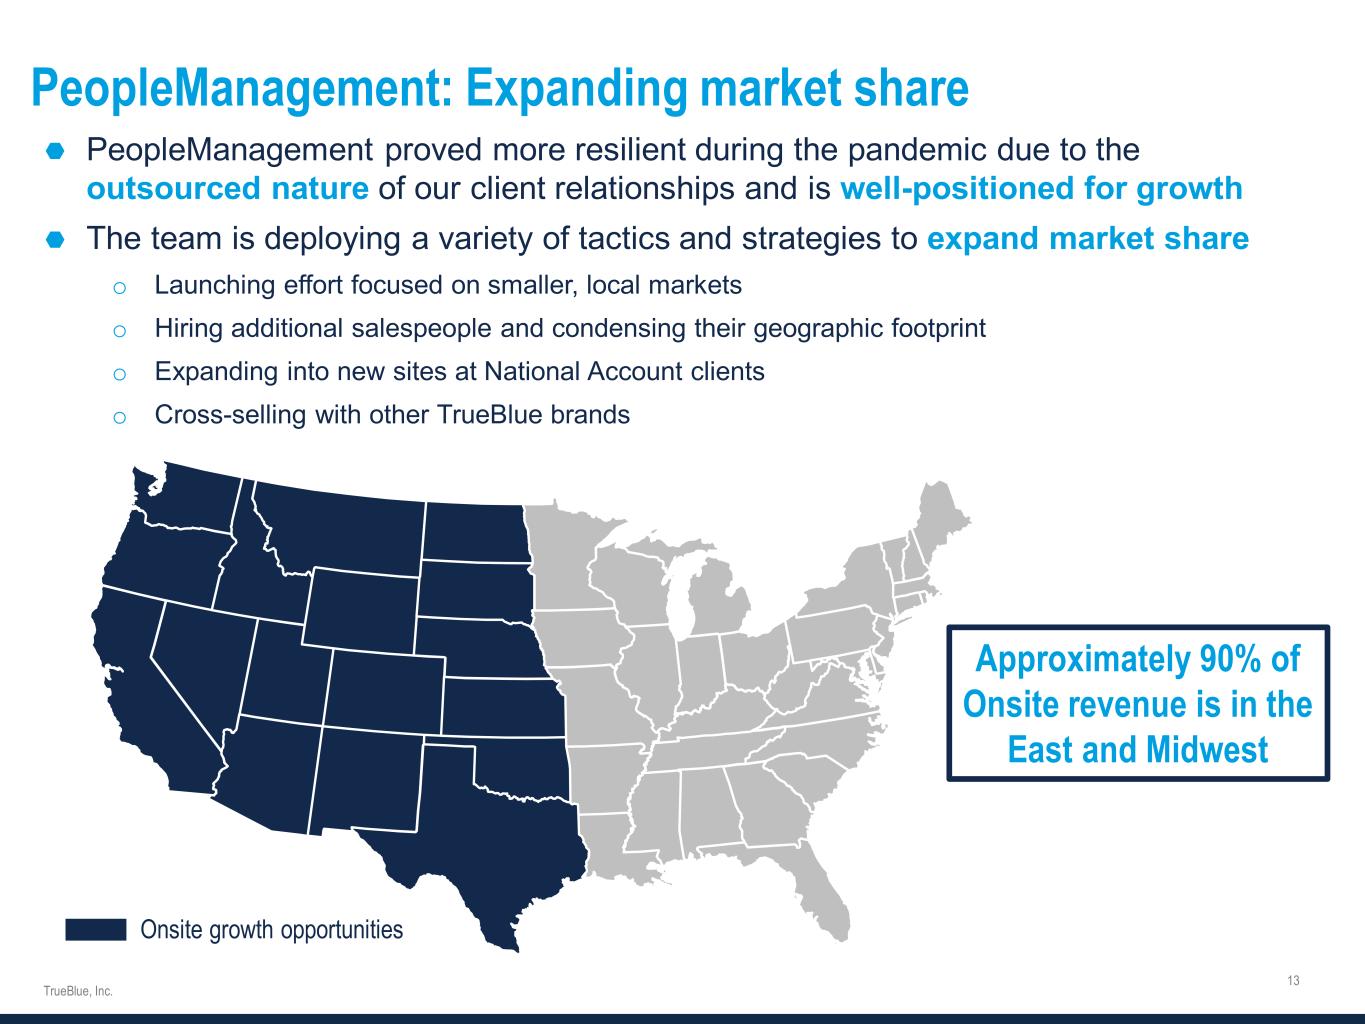
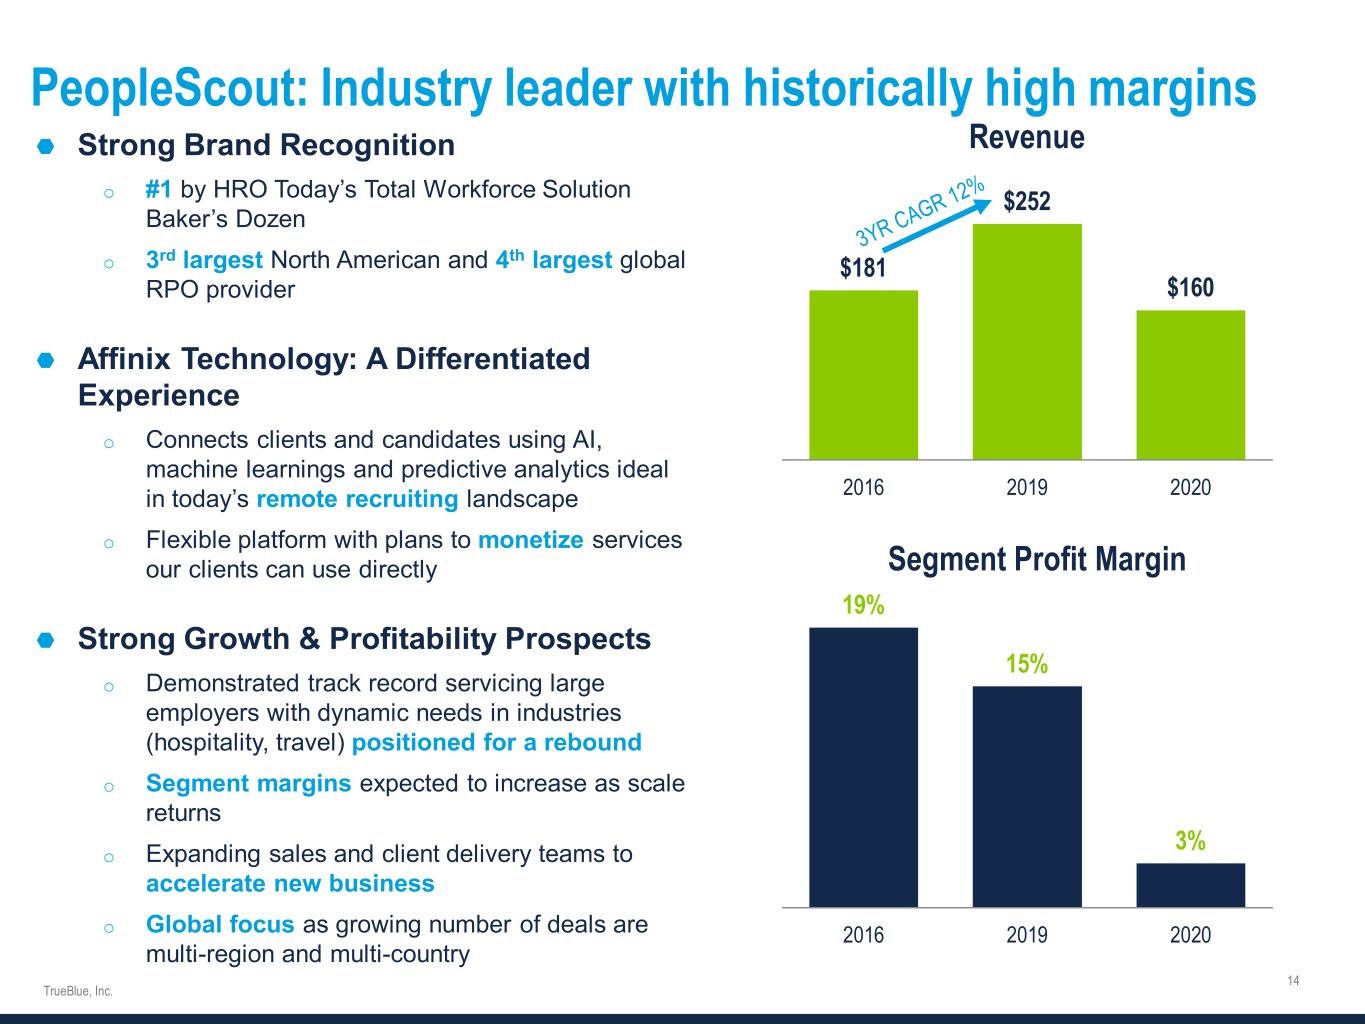
TrueBlue (NYSE: TBI) is a leading provider of specialized workforce solutions that help clients achieve business growth and improve productivity. In 2020, TrueBlue connected approximately 490,000 people with work. Its PeopleReady segment offers on-demand, industrial staffing, PeopleManagement offers contingent, on-site industrial staffing and commercial driver services, and PeopleScout offers recruitment process outsourcing (RPO) and managed service provider (MSP) solutions to a wide variety of industries. Learn more at www.trueblue.com.
1 See the financial statements accompanying the release and the company’s website for more information on non-GAAP terms.
Forward-looking statements
This document contains forward-looking statements relating to our plans and expectations, all of which are subject to risks and uncertainties. Such statements are based on management’s expectations and assumptions as of the date of this release and involve many risks and uncertainties that could cause actual results to differ materially from those expressed or implied in our forward-looking statements including: (1) national and global economic conditions, (2) the continued impact of COVID-19 and related economic impact and governmental response, (3) our ability to access sufficient capital to finance our operations, including our ability to comply with covenants contained in our revolving credit facility, (4) our ability to attract and retain clients, (5) our ability to attract sufficient qualified candidates and employees to meet the needs of our clients, (6) our ability to maintain profit margins, (7) new laws, regulations, and government incentives that could affect our operations or financial results, (8) our ability to successfully execute on business strategies to further digitalize our business model, and (9) any reduction or change in tax credits we utilize, including the Work Opportunity Tax Credit. Other information regarding factors that could affect our results is included in our Securities Exchange Commission (SEC) filings, including the company’s most recent reports on Forms 10-K and 10-Q, copies of which may be obtained by visiting our website at www.trueblue.com under the Investor Relations section or the SEC’s website at www.sec.gov. We assume no obligation to update or revise any forward-looking statement, whether as a result of new information, future events, or otherwise, except as required by law. Any other references to future financial estimates are included for informational purposes only and subject to risk factors discussed in our most recent filings with the SEC.
In addition, we use several non-GAAP financial measures when presenting our financial results in this document. Please refer to the reconciliations between our GAAP and non-GAAP financial measures in the appendix to this document and on our website at
www.trueblue.com under the Investor Relations section for additional information on both current and historical periods. The presentation of these non-GAAP financial measures is used to enhance the understanding of certain aspects of our financial performance. It is not meant to be considered in isolation, superior to, or as a substitute for the directly comparable financial measures prepared in accordance with U.S. GAAP, and may not be comparable to similarly titled measures of other companies.
Contact:
Derrek Gafford, Executive Vice President and CFO
253-680-8214
TRUEBLUE, INC.
SUMMARY CONSOLIDATED STATEMENTS OF OPERATIONS
(Unaudited)
| | | | | | | | | | | | | | | |
| | | | | | | |
| 13 weeks ended | | |
| (in thousands, except per share data) | Mar 28, 2021 | | Mar 29, 2020 | | | | |
| Revenue from services | $ | 458,706 | | | $ | 494,252 | | | | | |
| Cost of services | 348,132 | | | 368,093 | | | | | |
| Gross profit | 110,574 | | | 126,159 | | | | | |
| Selling, general and administrative expense | 97,401 | | | 117,381 | | | | | |
| Depreciation and amortization | 6,962 | | | 9,094 | | | | | |
| Goodwill and intangible asset impairment charge | — | | | 175,189 | | | | | |
| Income (loss) from operations | 6,211 | | | (175,505) | | | | | |
| Interest expense and other income, net | 575 | | | 263 | | | | | |
| Income (loss) before tax expense (benefit) | 6,786 | | | (175,242) | | | | | |
| Income tax benefit | (112) | | | (24,748) | | | | | |
| Net income (loss) | $ | 6,898 | | | $ | (150,494) | | | | | |
| | | | | | | |
| Net income (loss) per common share: | | | | | | | |
| Basic | $ | 0.20 | | | $ | (4.04) | | | | | |
| Diluted | $ | 0.20 | | | $ | (4.04) | | | | | |
| | | | | | | |
| Weighted average shares outstanding: | | | | | | | |
| Basic | 34,674 | | | 37,255 | | | | | |
| Diluted | 35,066 | | | 37,255 | | | | | |
TRUEBLUE, INC.
SUMMARY CONSOLIDATED BALANCE SHEETS
(Unaudited)
| | | | | | | | | | | |
| (in thousands) | Mar 28, 2021 | | Dec 27, 2020 |
| ASSETS | | | |
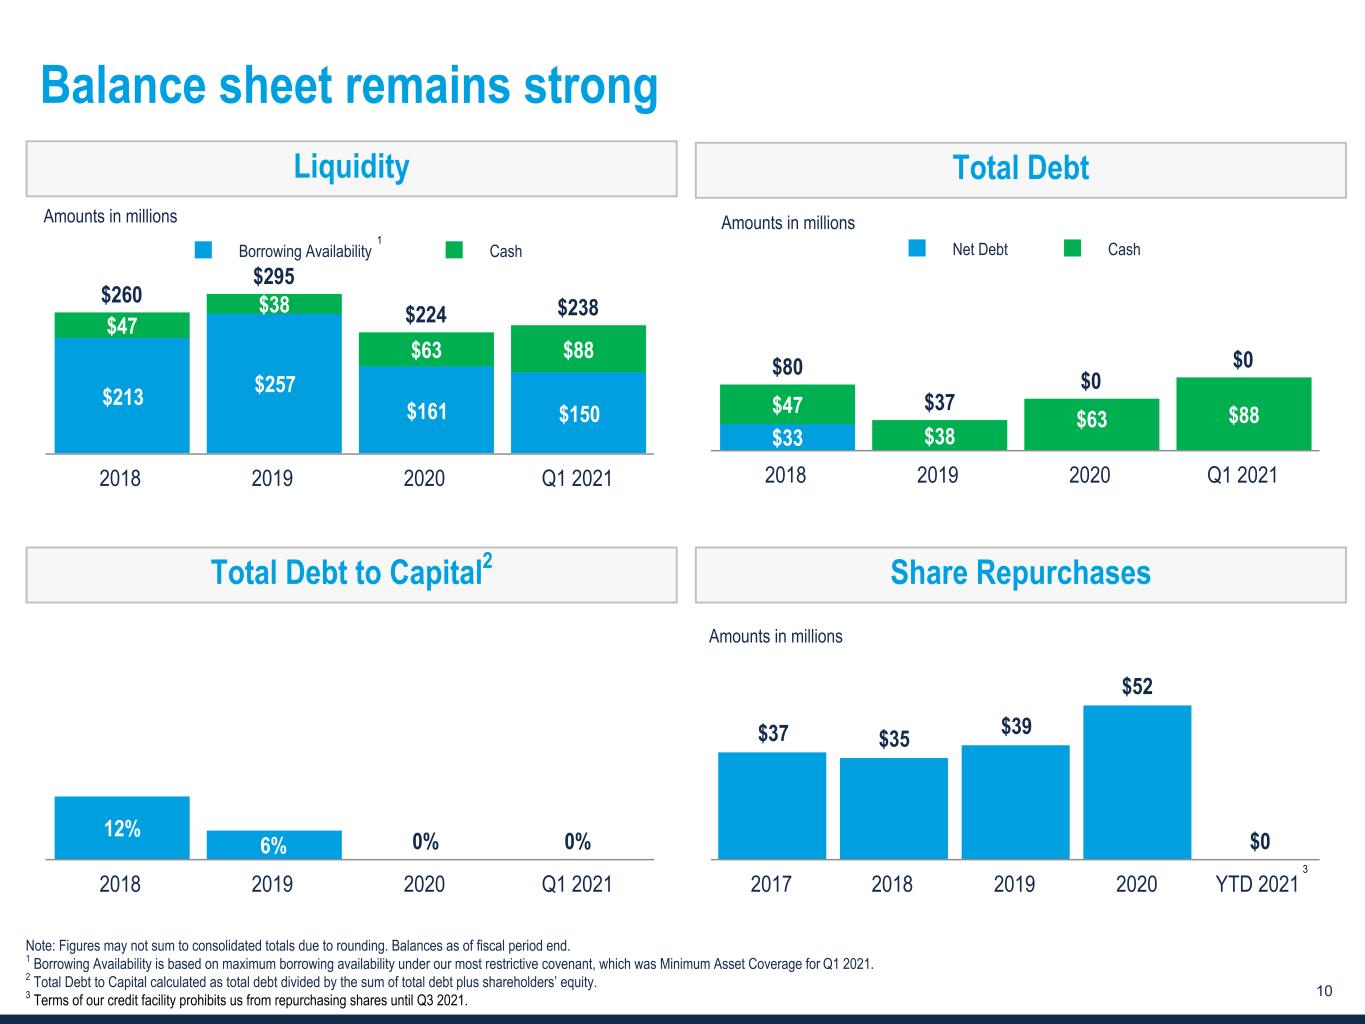
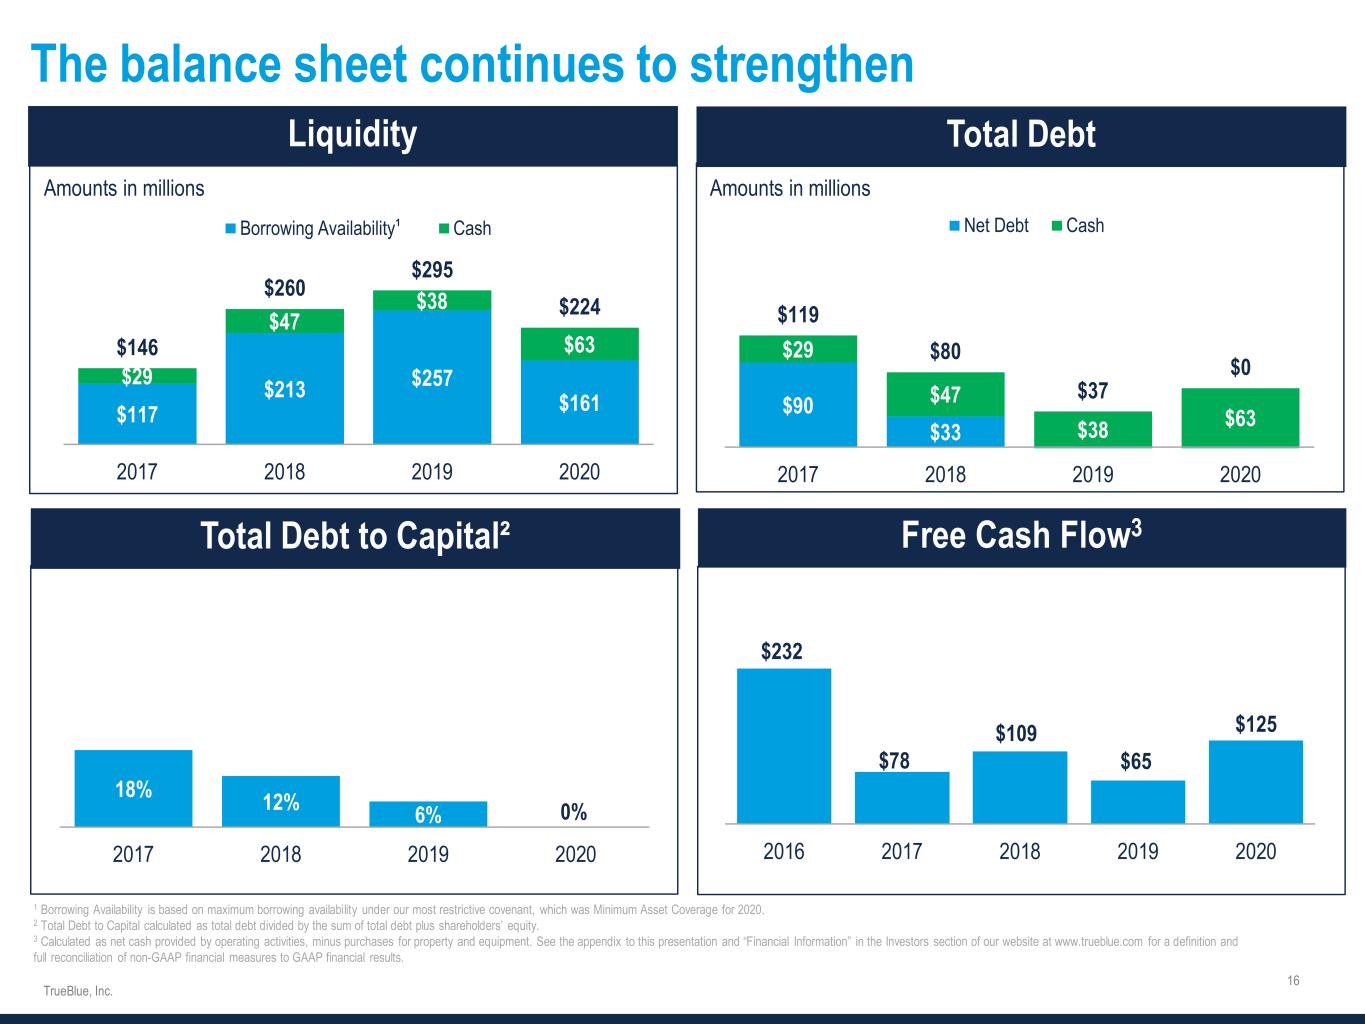
| Cash and cash equivalents | $ | 88,006 | | | $ | 62,507 | |
| Accounts receivable, net | 260,108 | | | 278,343 | |
| Other current assets | 35,897 | | | 38,035 | |
| Total current assets | 384,011 | | | 378,885 | |
| Property and equipment, net | 76,109 | | | 71,734 | |
| Restricted cash and investments | 231,178 | | | 240,534 | |
| Goodwill and intangible assets, net | 122,038 | | | 123,802 | |
| Other assets, net | 166,101 | | | 165,622 | |
| Total assets | $ | 979,437 | | | $ | 980,577 | |
| | | |
| LIABILITIES AND SHAREHOLDERS’ EQUITY | | | |
| Accounts payable and other accrued expenses | $ | 48,168 | | | $ | 58,447 | |
| Accrued wages and benefits | 126,906 | | | 122,657 | |
| Current portion of workers’ compensation claims reserve | 62,005 | | | 66,007 | |
| | | |
| Other current liabilities | 21,410 | | | 21,856 | |
| Total current liabilities | 258,489 | | | 268,967 | |
| Workers’ compensation claims reserve, less current portion | 191,989 | | | 189,486 | |
| | | |
| Other long-term liabilities | 83,332 | | | 84,934 | |
| Total liabilities | 533,810 | | | 543,387 | |
| Shareholders’ equity | 445,627 | | | 437,190 | |
| Total liabilities and shareholders’ equity | $ | 979,437 | | | $ | 980,577 | |
TRUEBLUE, INC.
CONSOLIDATED STATEMENTS OF CASH FLOWS
(Unaudited)
| | | | | | | | | | | |
| 13 weeks ended |
| (in thousands) | Mar 28, 2021 | | Mar 29, 2020 |
| Cash flows from operating activities: | | | |
| Net income (loss) | $ | 6,898 | | | $ | (150,494) | |
Adjustments to reconcile net income (loss) to net cash provided by operating activities: | | | |
| Depreciation and amortization | 6,962 | | | 9,094 | |
| Goodwill and intangible asset impairment charge | — | | | 175,189 | |
| Allowance for credit losses | 207 | | | 3,289 | |
| Stock-based compensation | 3,343 | | | 1,508 | |
| Deferred income taxes | (5,002) | | | (23,432) | |
| Non-cash lease expense | 3,920 | | | 3,763 | |
| Other operating activities | (438) | | | 5,375 | |
| Changes in operating assets and liabilities: | | | |
| Accounts receivable | 18,025 | | | 45,407 | |
| Income tax receivable | 4,910 | | | 435 | |
| Operating lease right-of-use-asset | 3,501 | | | — | |
| Other assets | (4,578) | | | 5,958 | |
| Accounts payable and other accrued expenses | (9,633) | | | (28,443) | |
| Accrued wages and benefits | 4,249 | | | (11,733) | |
| Workers’ compensation claims reserve | (1,499) | | | (2,163) | |
| Operating lease liabilities | (3,320) | | | (3,811) | |
| | | |
| Other liabilities | 338 | | | (2,334) | |
| Net cash provided by operating activities | 27,883 | | | 27,608 | |
| Cash flows from investing activities: | | | |
| Capital expenditures | (10,003) | | | (7,028) | |
| | | |
| | | |
| | | |
| Purchases of restricted available-for-sale investments | (14) | | | (1,149) | |
| Sales of restricted available-for-sale investments | 452 | | | 1,269 | |
| | | |
| Maturities of restricted held-to-maturity investments | 6,371 | | | 6,168 | |
| | | |
| Net cash used in investing activities | (3,194) | | | (740) | |
| Cash flows from financing activities: | | | |
| Purchases and retirement of common stock | — | | | (52,348) | |
| Net proceeds from employee stock purchase plans | 255 | | | 323 | |
| Common stock repurchases for taxes upon vesting of restricted stock | (2,555) | | | (1,792) | |
| Net change in revolving credit facility | — | | | 256,400 | |
| | | |
| | | |
| Other | (94) | | | (508) | |
| Net cash provided by (used in) financing activities | (2,394) | | | 202,075 | |
| Effect of exchange rate changes on cash, cash equivalents and restricted cash | 262 | | | (1,738) | |
| Net change in cash, cash equivalents, and restricted cash | 22,557 | | | 227,205 | |
| Cash, cash equivalents and restricted cash, beginning of period | 118,612 | | | 92,371 | |
| Cash, cash equivalents and restricted cash, end of period | $ | 141,169 | | | $ | 319,576 | |
TRUEBLUE, INC.
SEGMENT DATA
(Unaudited)
| | | | | | | | | | | | | | | |
| | | | | | | |
| 13 weeks ended | | |
| (in thousands) | Mar 28, 2021 | | Mar 29, 2020 | | | | |
| Revenue from services: | | | | | | | |
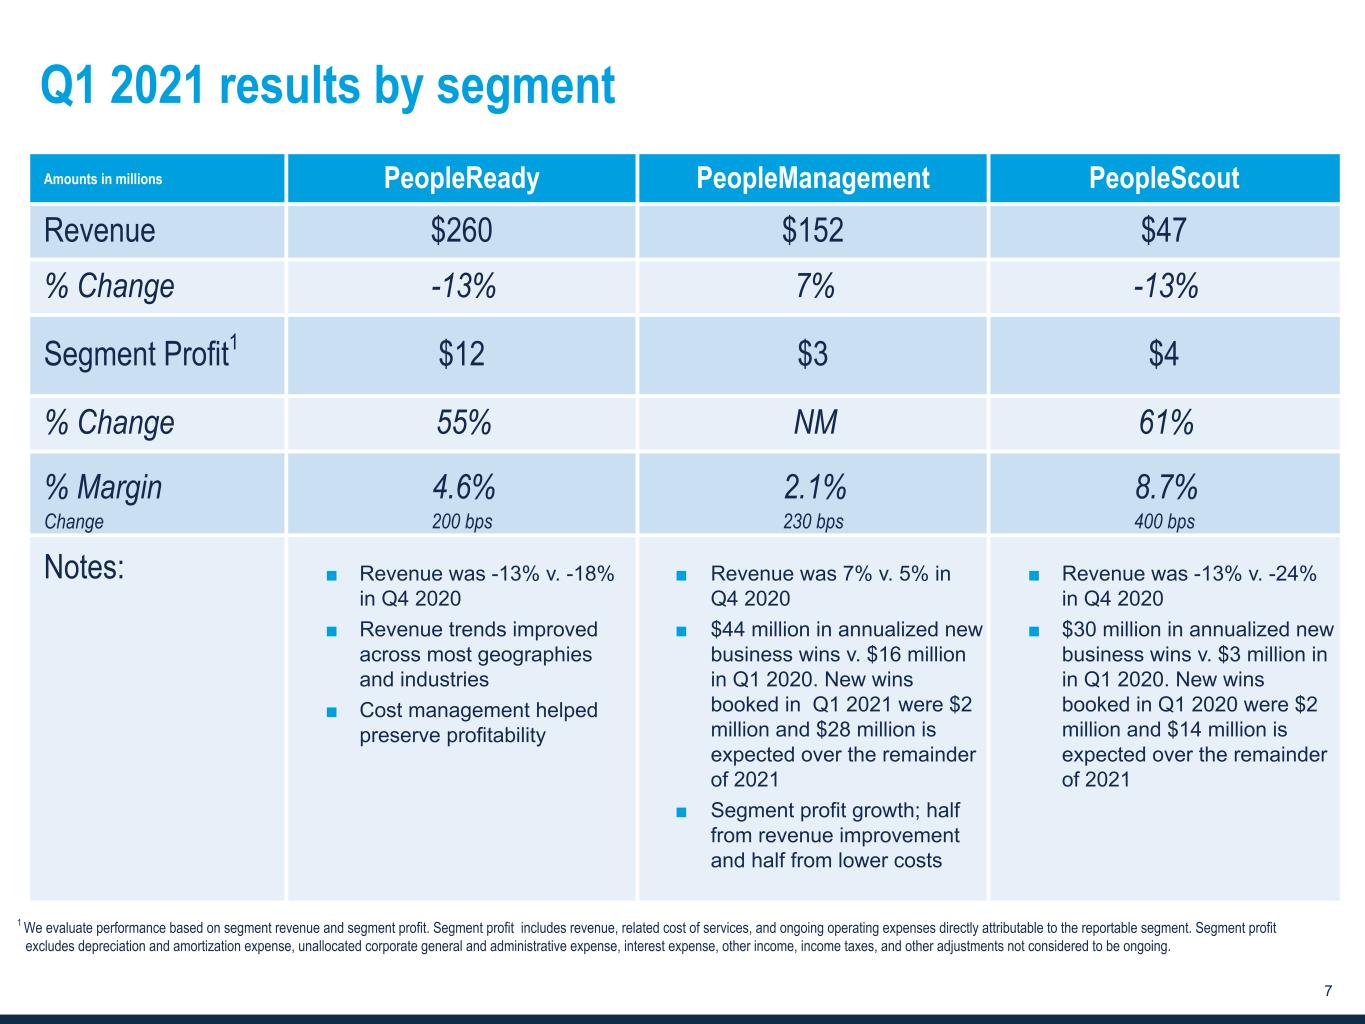
| PeopleReady | $ | 260,392 | | | $ | 299,294 | | | | | |
| PeopleManagement | 151,754 | | | 141,614 | | | | | |
| PeopleScout | 46,560 | | | 53,344 | | | | | |
| Total company | $ | 458,706 | | | $ | 494,252 | | | | | |
| | | | | | | |
Segment profit (loss) (1): | | | | | | | |
| PeopleReady | $ | 11,860 | | | $ | 7,655 | | | | | |
| PeopleManagement | 3,116 | | | (314) | | | | | |
| PeopleScout | 4,037 | | | 2,508 | | | | | |
| Total segment profit | 19,013 | | | 9,849 | | | | | |
| Corporate unallocated expense | (5,619) | | | (5,209) | | | | | |
Total company Adjusted EBITDA (2) | 13,394 | | | 4,640 | | | | | |
| Work Opportunity Tax Credit processing fees (3) | (135) | | | (135) | | | | | |
| Amortization of software as a service assets (4) | (673) | | | (552) | | | | | |
| | | | | | | |
| Goodwill and intangible asset impairment charge | — | | | (175,189) | | | | | |
| | | | | | | |
| Workforce reduction costs (5) | (70) | | | (1,308) | | | | | |
| COVID-19 government subsidies | 1,743 | | | — | | | | | |
| Other adjustments, net (6) | (1,086) | | | 6,133 | | | | | |
EBITDA (2) | 13,173 | | | (166,411) | | | | | |
| Depreciation and amortization | (6,962) | | | (9,094) | | | | | |
| Interest expense and other income, net | 575 | | | 263 | | | | | |
| Income (loss) before tax benefit | 6,786 | | | (175,242) | | | | | |
| Income tax benefit | 112 | | | 24,748 | | | | | |
| Net income (loss) | $ | 6,898 | | | $ | (150,494) | | | | | |
(1)We evaluate performance based on segment revenue and segment profit. Segment profit includes revenue, related cost of services, and ongoing operating expenses directly attributable to the reportable segment. Segment profit excludes depreciation and amortization expense, unallocated corporate general and administrative expense, interest expense, other income, income taxes, and other adjustments not considered to be ongoing.
(2)See the Non-GAAP Financial Measures table on the next page for definitions of EBITDA and Adjusted EBITDA.
(3)These third-party processing fees are associated with generating the Work Opportunity Tax Credits, which are designed to encourage employers to hire workers from certain targeted groups with higher than average unemployment rates.
(4)Amortization of software as a service assets is reported in selling, general and administrative expense.
(5)Workforce reduction costs for the 13 weeks ended March 31, 2020 were primarily due to employee reductions as part of our cost management actions in response to COVID-19.
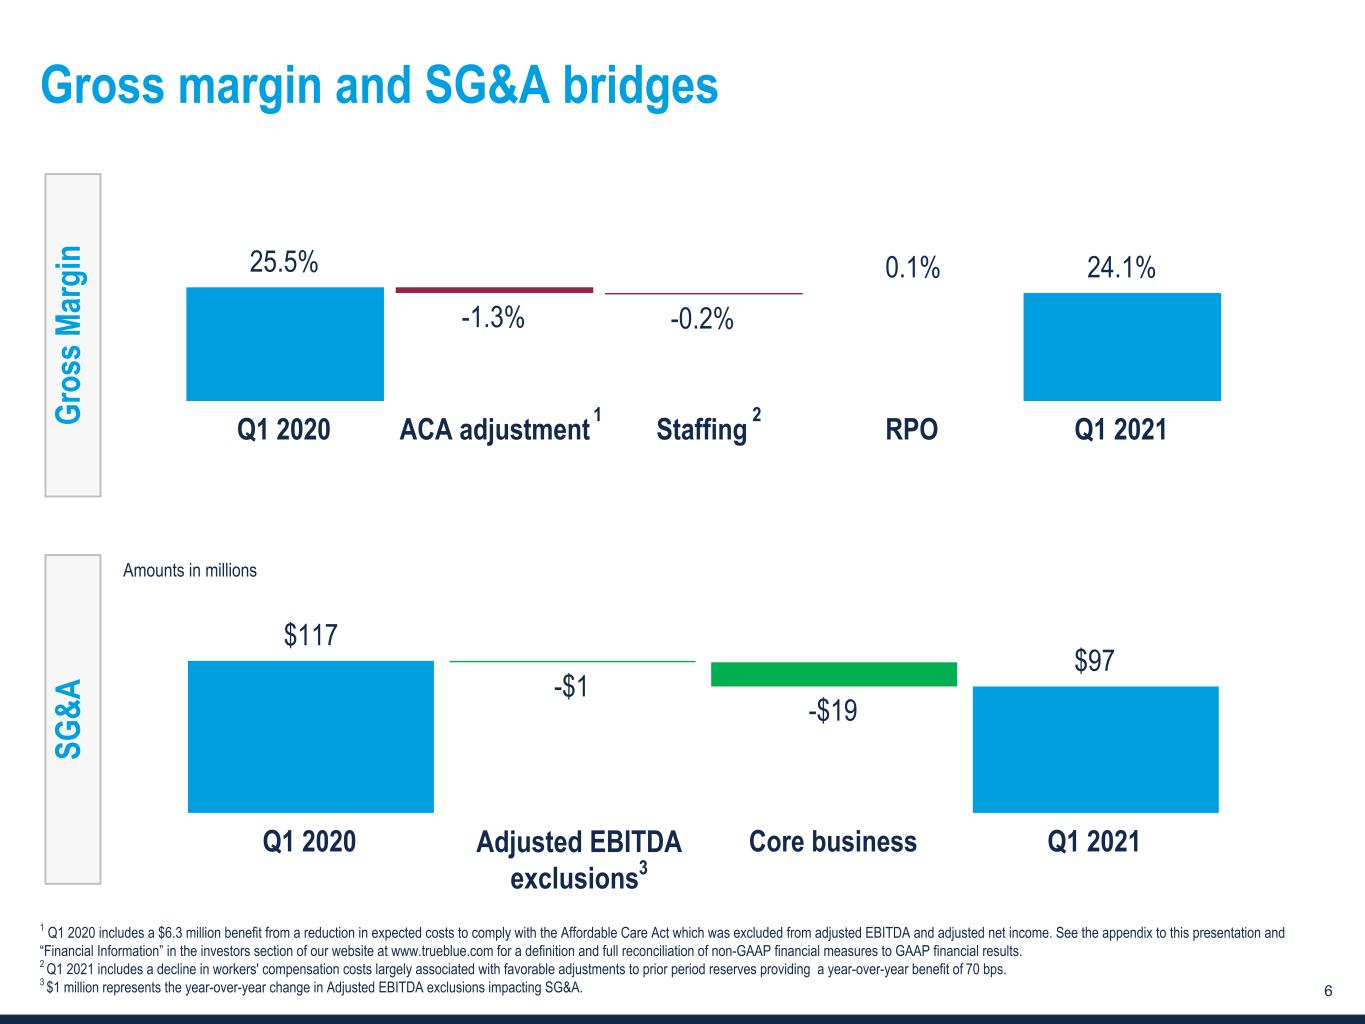
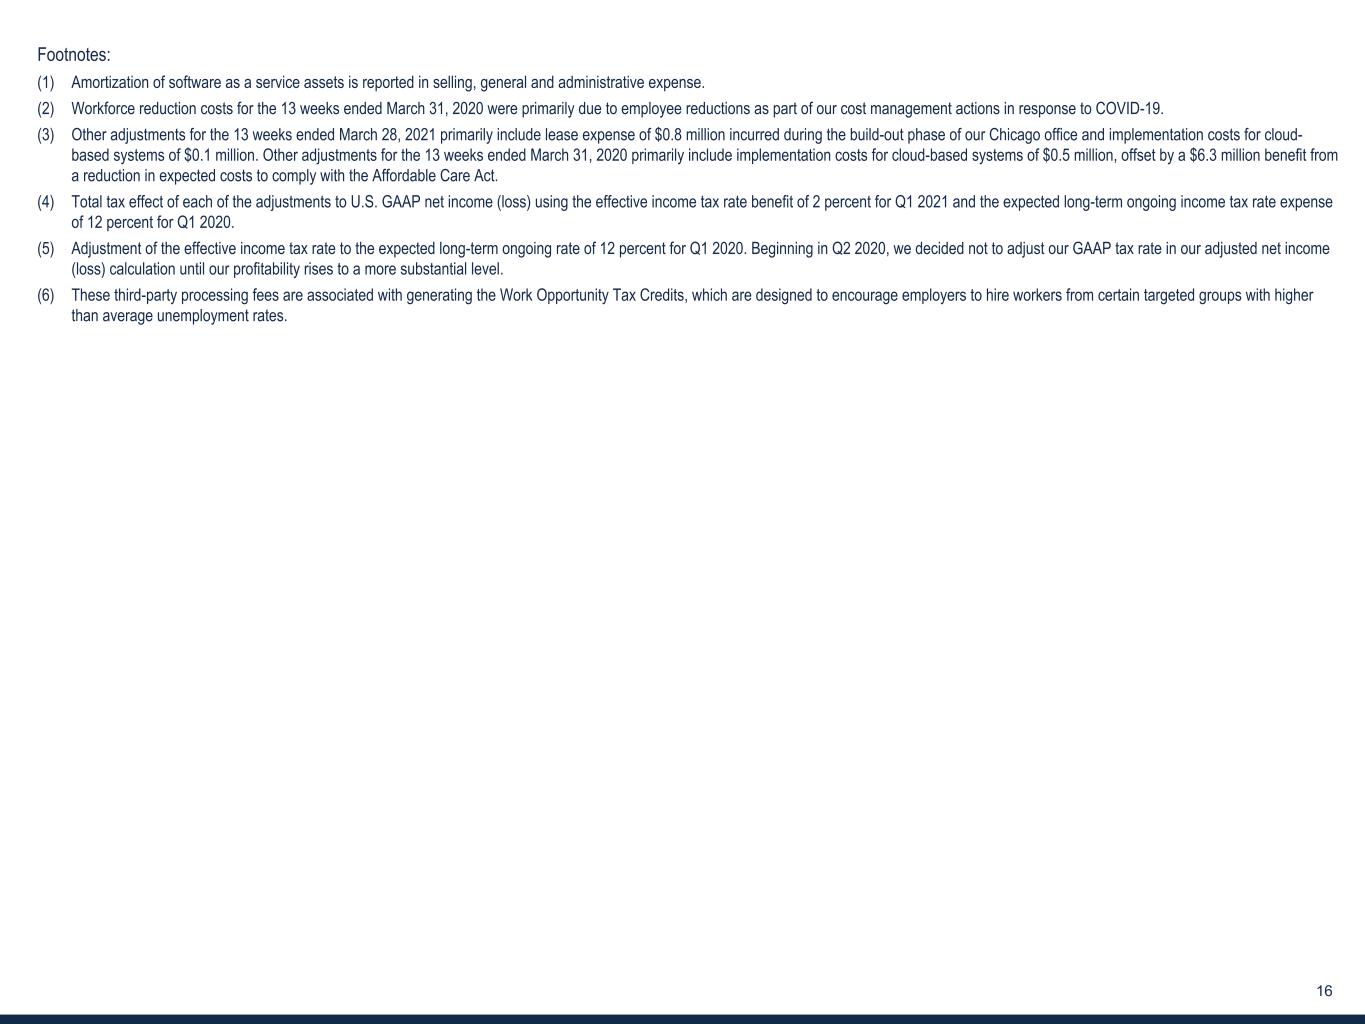
(6)Other adjustments for the 13 weeks ended March 28, 2021 primarily include lease expense of $0.8 million incurred during the build-out phase of our Chicago office and implementation costs for cloud-based systems of $0.1 million. Other adjustments for the 13 weeks ended March 31, 2020 primarily include implementation costs for cloud-based systems of $0.5 million, offset by a $6.3 million benefit from a reduction in expected costs to comply with the Affordable Care Act.
TRUEBLUE, INC.
NON-GAAP FINANCIAL MEASURES AND NON-GAAP RECONCILIATIONS
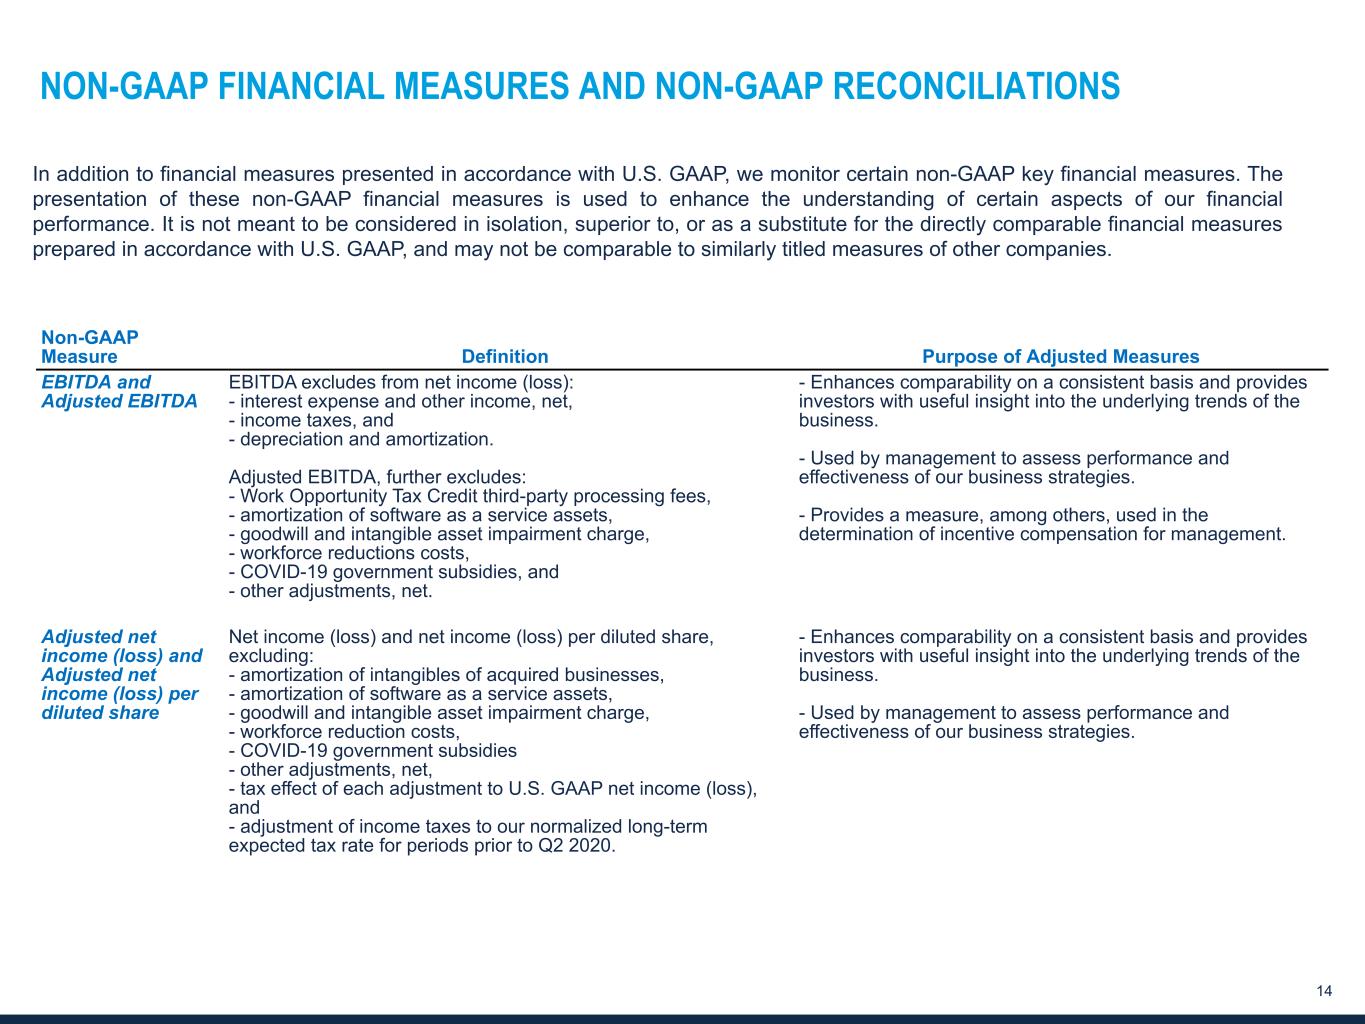
In addition to financial measures presented in accordance with U.S. GAAP, we monitor certain non-GAAP key financial measures. The presentation of these non-GAAP financial measures is used to enhance the understanding of certain aspects of our financial performance. It is not meant to be considered in isolation, superior to, or as a substitute for the directly comparable financial measures prepared in accordance with U.S. GAAP, and may not be comparable to similarly titled measures of other companies.
| | | | | | | | | | | |
| Non-GAAP Measure | Definition | | Purpose of Adjusted Measures |
EBITDA and
Adjusted EBITDA | EBITDA excludes from net income (loss): - interest expense and other income, net, - income taxes, and - depreciation and amortization.
Adjusted EBITDA, further excludes: - Work Opportunity Tax Credit third-party processing fees, - amortization of software as a service assets, - goodwill and intangible asset impairment charge, - workforce reductions costs, - COVID-19 government subsidies, and - other adjustments, net.
| | - Enhances comparability on a consistent basis and provides investors with useful insight into the underlying trends of the business.
- Used by management to assess performance and effectiveness of our business strategies.
- Provides a measure, among others, used in the determination of incentive compensation for management. |
| Adjusted net income (loss) and Adjusted net income (loss) per diluted share | Net income (loss) and net income (loss) per diluted share, excluding: - amortization of intangibles of acquired businesses, - amortization of software as a service assets, - goodwill and intangible asset impairment charge, - workforce reduction costs, - COVID-19 government subsidies - other adjustments, net, - tax effect of each adjustment to U.S. GAAP net income (loss), and - adjustment of income taxes to our normalized long-term expected tax rate for periods prior to Q2 2020.
| | - Enhances comparability on a consistent basis and provides investors with useful insight into the underlying trends of the business.
- Used by management to assess performance and effectiveness of our business strategies. |
| | | |
| | | |
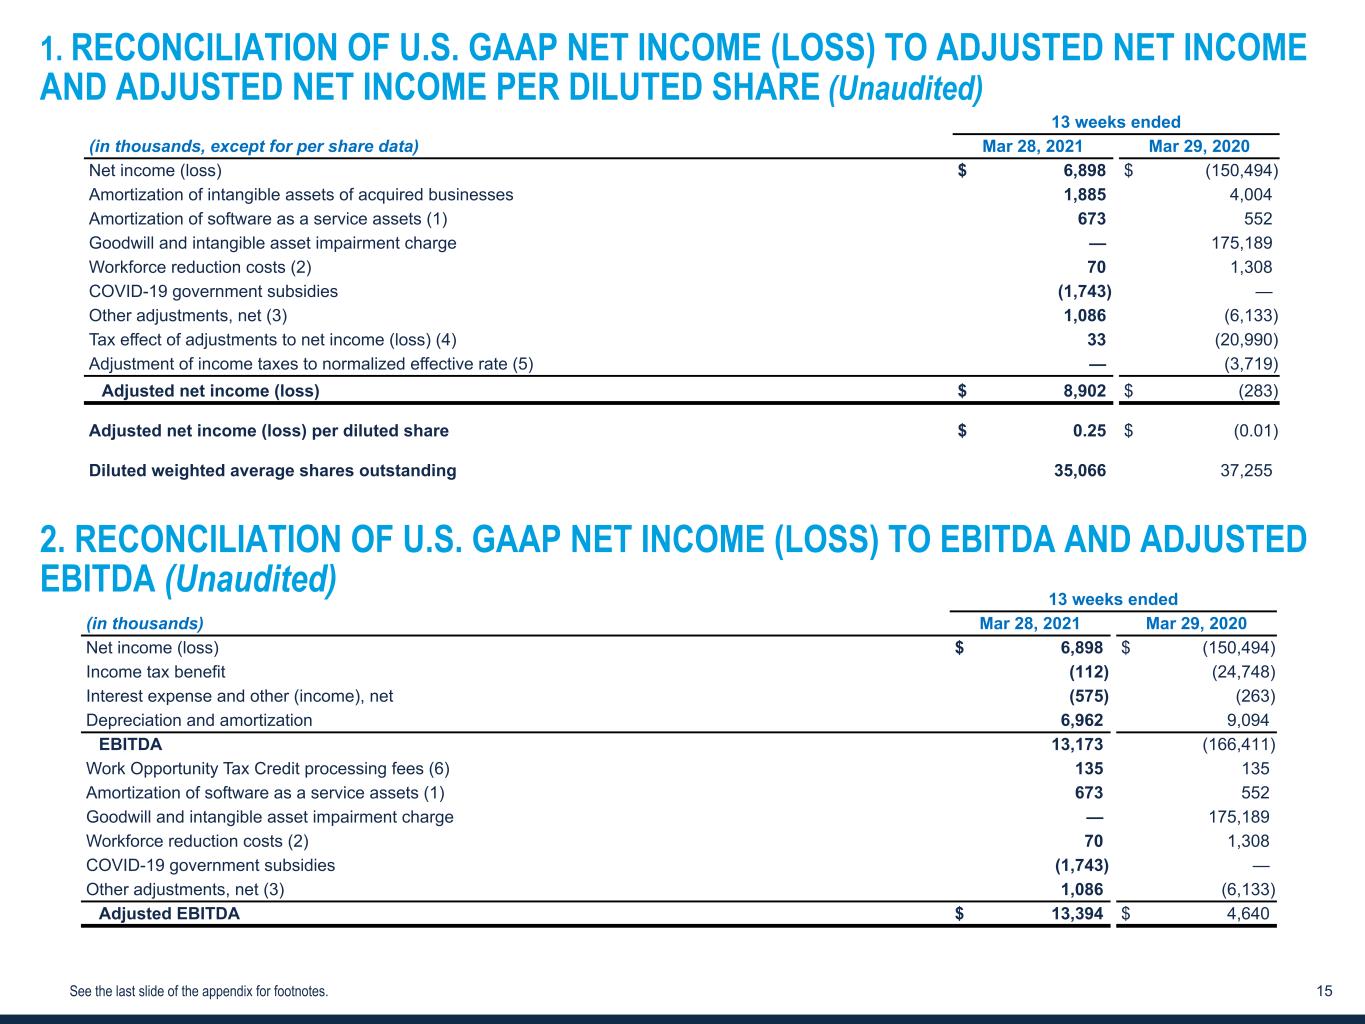
1.RECONCILIATION OF U.S. GAAP NET INCOME (LOSS) TO ADJUSTED NET INCOME AND ADJUSTED NET INCOME PER DILUTED SHARE
(Unaudited)
| | | | | | | | | | | | | | | |
| | | | | | | |
| 13 weeks ended | | |
| (in thousands, except for per share data) | Mar 28, 2021 | | Mar 29, 2020 | | | | |
| Net income (loss) | $ | 6,898 | | | $ | (150,494) | | | | | |
| Amortization of intangible assets of acquired businesses | 1,885 | | | 4,004 | | | | | |
| Amortization of software as a service assets (1) | 673 | | | 552 | | | | | |
| | | | | | | |
| Goodwill and intangible asset impairment charge | — | | | 175,189 | | | | | |
| Workforce reduction costs (2) | 70 | | | 1,308 | | | | | |
| COVID-19 government subsidies | (1,743) | | | — | | | | | |
| Other adjustments, net (3) | 1,086 | | | (6,133) | | | | | |
| Tax effect of adjustments to net income (loss) (4) | 33 | | | (20,990) | | | | | |
| Adjustment of income taxes to normalized effective rate (5) | — | | | (3,719) | | | | | |
| Adjusted net income (loss) | $ | 8,902 | | | $ | (283) | | | | | |
| | | | | | | |
| Adjusted net income (loss) per diluted share | $ | 0.25 | | | $ | (0.01) | | | | | |
| | | | | | | |
| Diluted weighted average shares outstanding | 35,066 | | | 37,255 | | | | | |
| | | | | | | |
2.RECONCILIATION OF U.S. GAAP NET INCOME (LOSS) TO EBITDA AND ADJUSTED EBITDA
(Unaudited)
| | | | | | | | | | | | | | | |
| | | | | | | |
| 13 weeks ended | | |
| (in thousands) | Mar 28, 2021 | | Mar 29, 2020 | | | | |
| Net income (loss) | $ | 6,898 | | | $ | (150,494) | | | | | |
| Income tax benefit | (112) | | | (24,748) | | | | | |
| Interest expense and other (income), net | (575) | | | (263) | | | | | |
| Depreciation and amortization | 6,962 | | | 9,094 | | | | | |
| EBITDA | 13,173 | | | (166,411) | | | | | |
| Work Opportunity Tax Credit processing fees (6) | 135 | | | 135 | | | | | |
| Amortization of software as a service assets (1) | 673 | | | 552 | | | | | |
| | | | | | | |
| Goodwill and intangible asset impairment charge | — | | | 175,189 | | | | | |
| | | | | | | |
| Workforce reduction costs (2) | 70 | | | 1,308 | | | | | |
| COVID-19 government subsidies | (1,743) | | | — | | | | | |
| Other adjustments, net (3) | 1,086 | | | (6,133) | | | | | |
| Adjusted EBITDA | $ | 13,394 | | | $ | 4,640 | | | | | |
| | | | | | | |
(1)Amortization of software as a service assets is reported in selling, general and administrative expense.
(2)Workforce reduction costs for the 13 weeks ended March 31, 2020 were primarily due to employee reductions as part of our cost management actions in response to COVID-19.
(3)Other adjustments for the 13 weeks ended March 28, 2021 primarily include lease expense of $0.8 million incurred during the build-out phase of our Chicago office and implementation costs for cloud-based systems of $0.1 million. Other adjustments for the 13 weeks ended March 31, 2020 primarily include implementation costs for cloud-based systems of $0.5 million, offset by a $6.3 million benefit from a reduction in expected costs to comply with the Affordable Care Act.
(4)Total tax effect of each of the adjustments to U.S. GAAP net income (loss) using the effective income tax rate benefit of 2 percent for Q1 2021 and the expected long-term ongoing income tax rate expense of 12 percent for Q1 2020.
(5)Adjustment of the effective income tax rate to the expected long-term ongoing rate of 12 percent for Q1 2020. Beginning in Q2 2020, we decided not to adjust our GAAP tax rate in our adjusted net income (loss) calculation until our profitability rises to a more substantial level.
(6)These third-party processing fees are associated with generating the Work Opportunity Tax Credits, which are designed to encourage employers to hire workers from certain targeted groups with higher than average unemployment rates.