tbi-20250505
false000076889900007688992025-05-052025-05-05

UNITED STATES
SECURITIES AND EXCHANGE COMMISSION
WASHINGTON, DC 20549
FORM 8-K
CURRENT REPORT
PURSUANT TO SECTION 13 OR 15(D) OF THE
SECURITIES EXCHANGE ACT OF 1934
Date of report (Date of earliest event reported): May 5, 2025
636706_TB_Logo_CLR_JPG.jpg
TrueBlue, Inc.
(Exact Name of Registrant as Specified in Its Charter)
Washington
(State or Other Jurisdiction
of Incorporation)
001-14543 91-1287341
(Commission
File Number)
 (IRS Employer
Identification No.)
 
1015 A Street, Tacoma, Washington 98402
(Address of principal executive offices) (Zip Code)
Registrant’s telephone number, including area code:    (253383-9101

Not Applicable
(Former Name or Former Address, if Changed Since Last Report)
Check the appropriate box below if the Form 8-K filing is intended to simultaneously satisfy the filing obligation of the registrant under any of the following provisions (see General Instruction A.2. below):
Written communications pursuant to Rule 425 under the Securities Act (17 CFR 230.425)
Soliciting material pursuant to Rule 14a-12 under the Exchange Act (17 CFR 240.14a-12)
Pre-commencement communications pursuant to Rule 14d-2(b) under the Exchange Act (17 CFR 240.14d-2(b))
Pre-commencement communications pursuant to Rule 13e-4(c) under the Exchange Act (17 CFR 240.13e-4(c))
Securities registered pursuant to Section 12(b) of the Act:
Title of each classTrading Symbol(s)Name of each exchange on which registered
Common stock, no par valueTBINew York Stock Exchange

Indicate by check mark whether the registrant is an emerging growth company as defined in as defined in Rule 405 of the Securities Act of 1933 (§230.405 of this chapter) or Rule 12b-2 of the Securities Exchange Act of 1934 (§240.12b-2 of this chapter).
Emerging growth company


If an emerging growth company, indicate by check mark if the registrant has elected not to use the extended transition period for complying with any new or revised financial accounting standards provided pursuant to Section 13(a) of the Exchange Act.


Item 2.02.Results of Operations and Financial Condition.
On May 5, 2025, TrueBlue, Inc. (the “company”) issued a press release (the “Press Release”) reporting its financial results for the first quarter ended March 30, 2025, and certain outlook information for the second quarter and fiscal year 2025, a copy of which is attached hereto as Exhibit 99.1 and the contents of which are incorporated herein by this reference. Also attached to this report as Exhibit 99.2 is a slide presentation relating to the financial results for the first quarter and fiscal year ended March 30, 2025 (the “Earnings Results Presentation”), which will be discussed by management of the company on a live conference call at 2:00 p.m. Pacific Time (5:00 p.m. Eastern Time) on Monday, May 5, 2025. The Earnings Results Presentation is also available on the company’s website at www.trueblue.com.

In accordance with General Instruction B.2. of Form 8-K, the information contained above in this report (including the Press Release and the Earnings Results Presentation) shall not be deemed “Filed” for purposes of Section 18 of the Securities Exchange Act of 1934, as amended, or otherwise subject to the liabilities of that section, nor shall the Press Release or the Earnings Results Presentation be deemed incorporated by reference in any filing under the Securities Act of 1933, as amended, except as shall be expressly set forth by specific reference in such a filing. This report will not be deemed a determination or an admission as to the materiality of any information in the report that is required to be disclosed solely by Regulation FD.

Item 7.01.Regulation FD Disclosure.
We are also attaching our Investor Roadshow Presentation to this report as Exhibit 99.3, which we will reference in our Q1 2025 earnings results discussion and which may be used in future investor conferences. The Investor Roadshow Presentation is also available on the company’s website at www.trueblue.com.

In accordance with General Instruction B.2. of Form 8-K, the information contained above in this report (including the Investor Roadshow Presentation) shall not be deemed “Filed” for purposes of Section 18 of the Securities Exchange Act of 1934, as amended, or otherwise subject to the liabilities of that section, nor shall the Investor Roadshow Presentation be deemed incorporated by reference in any filing under the Securities Act of 1933, as amended, except as shall be expressly set forth by specific reference in such a filing. This report will not be deemed a determination or an admission as to the materiality of any information in the report that is required to be disclosed solely by Regulation FD.

Item 9.01.Financial Statements and Exhibits.
(d)Exhibits
Exhibit
Number
Exhibit DescriptionFiled Herewith
99.1X
99.2X
99.3X
104Cover page interactive data file - The cover page from this Current Report on Form 8-K is formatted as Inline XBRLX


SIGNATURE
Pursuant to the requirements of the Securities Exchange Act of 1934, the registrant has duly caused this report to be signed on its behalf by the undersigned hereunto duly authorized.
 
  TRUEBLUE, INC.
 (Registrant)
Date:May 5, 2025By:
/s/ Carl R. Schweihs
  
Carl R. Schweihs
  
Chief Financial Officer and Executive Vice President


TRUEBLUE REPORTS FIRST QUARTER 2025 RESULTS

TACOMA, WASH. - May 5, 2025 -- TrueBlue (NYSE:TBI) today announced its first quarter results for 2025.

First Quarter 2025 Financial Highlights

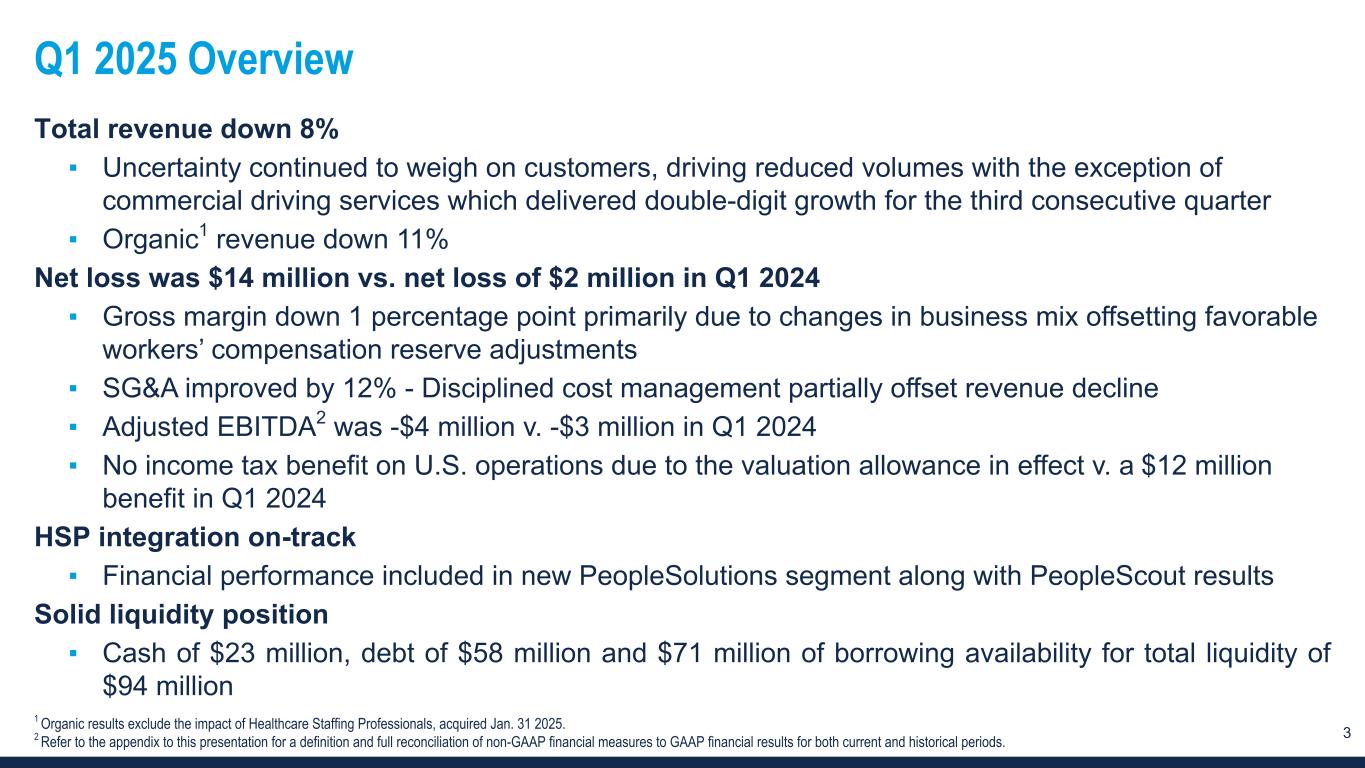
Revenue of $370 million compared to $403 million in the prior year period
$11 million of inorganic revenue from the January 31st acquisition of HSP
Net loss of $14 million compared to net loss of $2 million in the prior year period
SG&A expense improved by 12 percent to $95 million compared to $107 million in the prior year period
Adjusted EBITDA1 of -$4 million compared to -$3 million in the prior year period
No income tax benefit on U.S. operations due to the valuation allowance in effect compared to a $12 million benefit in the prior year period
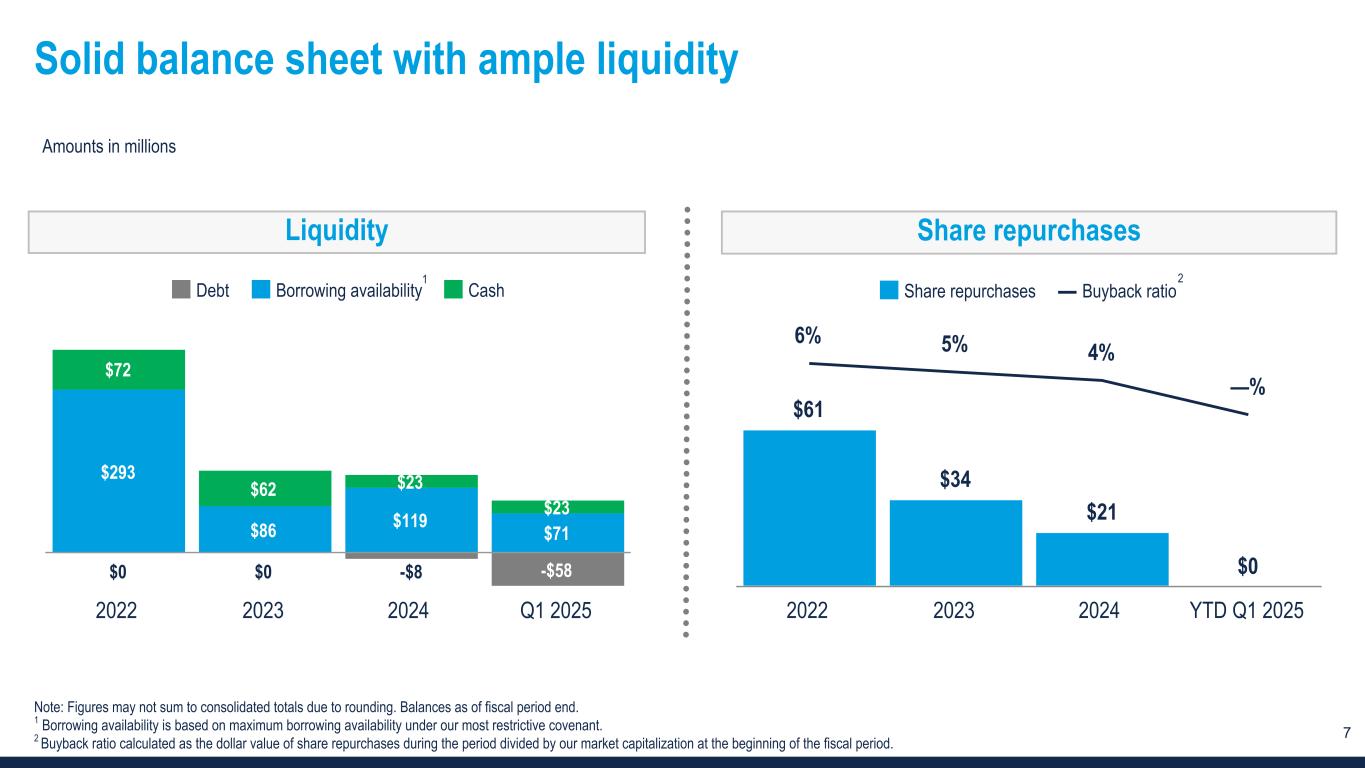
Cash of $23 million, debt of $58 million and $71 million of borrowing availability for total liquidity of $94 million at period end

Commentary

“While subdued market demand continued in the first quarter as expected, I am proud of the resilience and dedication shown by the TrueBlue team, delivering revenue results near the high-end of our outlook range,” said Taryn Owen, President and CEO of TrueBlue. “Evolving governmental policies have hindered business confidence and consequently continue to suppress the staffing industry. Our depth of expertise enables us to understand the unique challenges our clients face in times like these, and we continue to support them with innovative and flexible workforce solutions as they navigate an increasingly complex and unpredictable business landscape.”

“As we leverage our inherent strengths and comprehensive service offerings to meet the needs of the market today, we are also paving the path forward with our strategic priorities to capture market share and enhance our long-term profitability,” continued Ms. Owen. “We are building on our momentum from the past year, expanding in secular growth markets and high-value roles, including the healthcare space with the recent addition of HSP to the TrueBlue portfolio. We also continue to find new ways to optimize our business model and advance our digital transformation as we remain focused on top line growth and margin expansion.”

Results

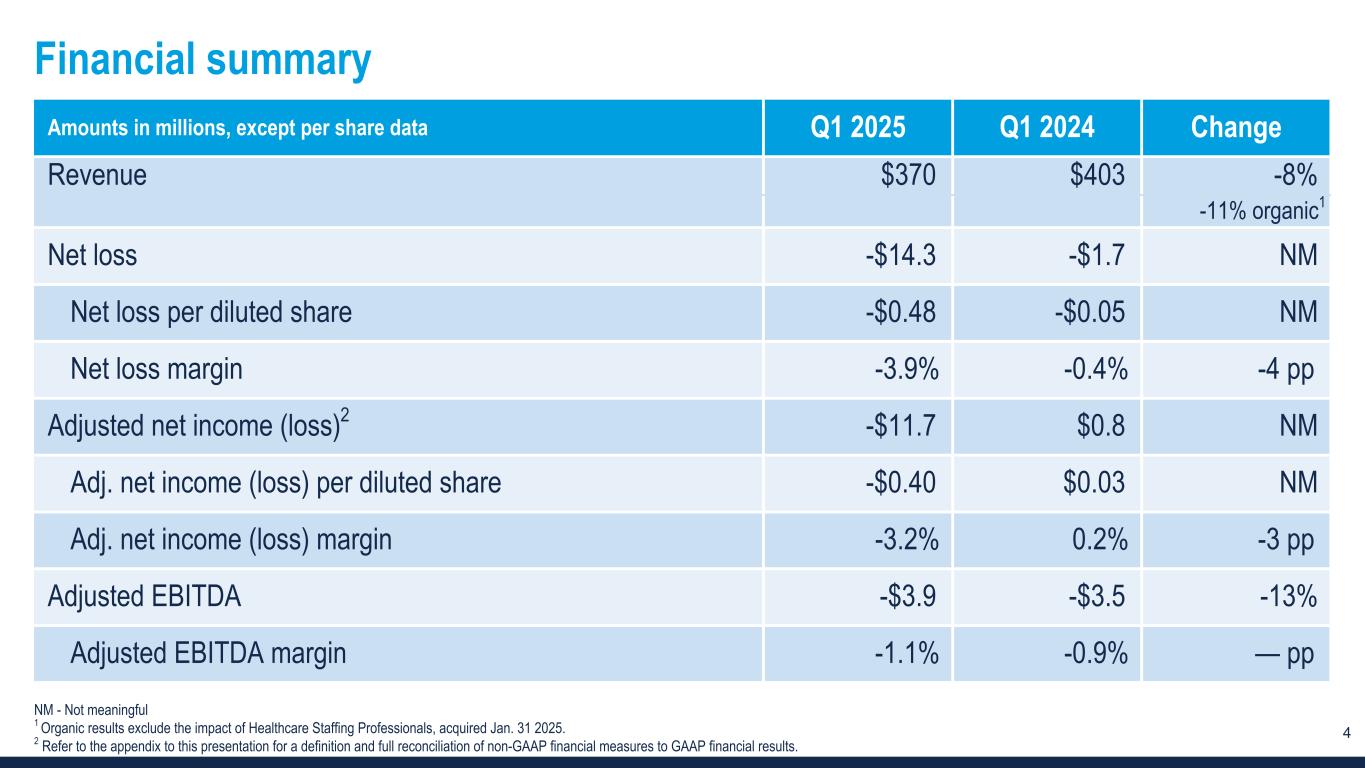
First quarter revenue was $370 million, a decrease of 8 percent compared to revenue of $403 million in the first quarter of 2024. Net loss per diluted share was $0.48 compared to net loss per diluted share of $0.05 in the prior year period. Adjusted net loss1 per diluted share was $0.40 compared to adjusted net income per diluted share of $0.03 in the prior year period.

2025 Outlook

TrueBlue is providing certain forward-looking information to help investors form their estimates, which can be found in the quarterly earnings presentation filed today.

Management will discuss first quarter 2025 results on a webcast at 2:00 p.m. PT (5:00 p.m. ET), today, Monday, May 5, 2025.

The quarterly earnings presentation and webcast can be accessed on the Investor Relations section of the TrueBlue website: investor.trueblue.com.

About TrueBlue

TrueBlue (NYSE: TBI) is transforming the way organizations connect with talent in an ever-changing world of work. As The People Company®, we put people first – connecting job seekers with meaningful opportunities while delivering smart, scalable workforce solutions for enterprises across industries and worldwide. Powered by innovative technology and decades of expertise, our brands – PeopleReady, PeopleScout, Staff Management |


SMX, Centerline, SIMOS, and Healthcare Staffing Professionals – offer flexible staffing, workforce management, and recruitment solutions that propel businesses and careers. Discover how we’re shaping the future of work at www.trueblue.com.

1 Refer to the financial statements accompanying this release for more information regarding non-GAAP terms.

Forward-looking statements and non-GAAP financial measures

This document contains forward-looking statements relating to our plans and expectations including, without limitation, statements regarding the future performance and operations of our business, expectations regarding stabilization in demand, and expected growth from our digital investments, all of which are subject to risks and uncertainties. Such statements are based on management’s expectations and assumptions as of the date of this release and involve many risks and uncertainties that could cause actual results to differ materially from those expressed or implied in our forward-looking statements including: (1) national and global economic conditions, which can be negatively impacted by factors such as rising interest rates, inflation, changes in government policies, political instability, epidemics and global trade uncertainty, (2) our ability to maintain profit margins, (3) our ability to attract and retain clients, (4) our ability to access sufficient capital to finance our operations, including our ability to comply with covenants contained in our revolving credit facility, (5) our ability to successfully execute on business strategies and further digitalize our business model, (6) our ability to attract sufficient qualified candidates and employees to meet the needs of our clients, (7) new laws, regulations, and government incentives that could affect our operations or financial results, (8) any reduction or change in tax credits we utilize, including the Work Opportunity Tax Credit, (9) our ability to successfully integrate acquired businesses, and (10) the timing and amount of common stock repurchases, if any, which will be determined at management’s discretion and depend upon several factors, including market and business conditions, the trading price of our common stock and the nature of other investment opportunities. Other information regarding factors that could affect our results is included in our Securities and Exchange Commission (SEC) filings, including the company’s most recent reports on Forms 10-K and 10-Q, copies of which may be obtained by visiting our website at www.trueblue.com under the Investor Relations section or the SEC’s website at www.sec.gov. We assume no obligation to update or revise any forward-looking statement, whether as a result of new information, future events, or otherwise, except as required by law. Any other references to future financial estimates are included for informational purposes only and subject to risk factors discussed in our most recent filings with the SEC.
In addition, we use several non-GAAP financial measures when presenting our financial results in this document. Please refer to the reconciliations between our U.S. GAAP and non-GAAP financial measures in the appendix to this document and on our website at www.trueblue.com under the Investor Relations section for additional information on both current and historical periods. The presentation of these non-GAAP financial measures is used to enhance the understanding of certain aspects of our financial performance. It is not meant to be considered in isolation, superior to, or as a substitute for the directly comparable financial measures prepared in accordance with U.S. GAAP, and may not be comparable to similarly titled measures of other companies.

Contact

Investor Relations
[email protected]


TRUEBLUE, INC.
SUMMARY CONSOLIDATED STATEMENTS OF OPERATIONS
(Unaudited)
13 weeks ended
(in thousands, except per share data)Mar 30, 2025Mar 31, 2024
Revenue from services$370,254 $402,853 
Cost of services283,912 303,467 
Gross profit86,342 99,386 
Selling, general and administrative expense94,621 106,937 
Depreciation and amortization5,844 7,958 
Loss from operations(14,123)(15,509)
Interest and other income (expense), net
193 1,599 
Loss before tax expense (benefit)
(13,930)(13,910)
Income tax expense (benefit)418 (12,212)
Net loss$(14,348)$(1,698)
Net loss per common share:
Basic$(0.48)$(0.05)
Diluted$(0.48)$(0.05)
Weighted average shares outstanding:
Basic29,698 31,102 
Diluted29,698 31,102 


TRUEBLUE, INC.
SUMMARY CONSOLIDATED BALANCE SHEETS
(Unaudited)
(in thousands)Mar 30, 2025Dec 29, 2024
ASSETS
Cash and cash equivalents$23,059 $22,536 
Accounts receivable, net219,056 214,704 
Other current assets38,932 39,853 
Total current assets281,047 277,093 
Property and equipment, net87,851 89,602 
Restricted cash, cash equivalents and investments
170,208 179,916 
Goodwill and intangible assets, net62,673 30,406 
Other assets, net90,692 98,359 
Total assets$692,471 $675,376 
LIABILITIES AND SHAREHOLDERS’ EQUITY
Accounts payable and other accrued expenses$38,026 $45,599 
Accrued wages and benefits66,339 61,380 
Current portion of workers’ compensation claims reserve31,397 34,729 
Other current liabilities20,562 18,417 
Total current liabilities156,324 160,125 
Workers’ compensation claims reserve, less current portion91,531 105,063 
Long-term debt, less current portion57,800 7,600 
Other long-term liabilities84,599 87,229 
Total liabilities390,254 360,017 
Shareholders’ equity302,217 315,359 
Total liabilities and shareholders’ equity$692,471 $675,376 


TRUEBLUE, INC.
CONSOLIDATED STATEMENTS OF CASH FLOWS
(Unaudited)
13 weeks ended
(in thousands)Mar 30, 2025Mar 31, 2024
Cash flows from operating activities:
Net loss$(14,348)$(1,698)
Adjustments to reconcile net loss to net cash (used in) provided by operating activities:
Depreciation and amortization (inclusive of depreciation included in cost of services)
6,810 7,958 
Provision for credit losses250 370 
Stock-based compensation2,060 2,102 
Deferred income taxes (12,206)
Non-cash lease expense2,753 3,036 
Other operating activities1,486 (2,980)
Changes in operating assets and liabilities:
Accounts receivable9,133 8,292 
Income taxes receivable and payable373 975 
Other assets7,150 1,571 
Accounts payable and other accrued expenses(9,580)(11,515)
Accrued wages and benefits(5,418)480 
Workers’ compensation claims reserve(16,865)(8,669)
Operating lease liabilities(3,035)(3,204)
Other liabilities(2,884)1,249 
Net cash used in operating activities
(22,115)(14,239)
Cash flows from investing activities:
Capital expenditures(4,680)(7,375)
Acquisition of business, net of cash acquired(30,044)— 
Proceeds from business divestiture, net 2,928 
Purchases of restricted held-to-maturity investments (10,180)
Maturities of restricted held-to-maturity investments10,756 15,546 
Net cash (used in) provided by investing activities
(23,968)919 
Cash flows from financing activities:
Purchases and retirement of common stock (10,067)
Net proceeds from employee stock purchase plans70 220 
Common stock repurchases for taxes upon vesting of restricted stock(895)(2,012)
Net change in revolving credit facility50,200 — 
Other(6)(1,803)
Net cash provided by (used in) financing activities
49,369 (13,662)
Effect of exchange rate changes on cash, cash equivalents and restricted cash and cash equivalents(230)(604)
Net change in cash, cash equivalents, and restricted cash and cash equivalents3,056 (27,586)
Cash, cash equivalents and restricted cash and cash equivalents, beginning of period61,100 99,306 
Cash, cash equivalents and restricted cash and cash equivalents, end of period$64,156 $71,720 


TRUEBLUE, INC.
SEGMENT DATA
(Unaudited)

13 weeks ended
(in thousands)Mar 30, 2025Mar 31, 2024
Revenue from services:
PeopleReady$189,305 $222,661 
PeopleManagement135,532 133,860 
PeopleSolutions (1)
45,417 46,332 
Total company$370,254 $402,853 
Segment profit (loss)(2):
PeopleReady$(2,974)$(5,058)
PeopleManagement2,894 2,751 
PeopleSolutions
1,952 4,879 
Total segment profit1,872 2,572 
Corporate unallocated expense(5,794)(6,052)
Total company Adjusted EBITDA (3)
(3,922)(3,480)
Third-party processing fees for hiring tax credits (4)
(90)(90)
Amortization of software as a service assets (5)
(1,093)(1,343)
Acquisition/integration costs(710)— 
PeopleReady technology upgrade costs (6)
 (385)
COVID-19 government subsidies, net (44)
Other adjustments, net (7)
(1,498)(2,209)
EBITDA (2)
(7,313)(7,551)
Depreciation and amortization (8)
(6,810)(7,958)
Interest and other income (expense), net
193 1,599 
Loss before tax (expense) benefit
(13,930)(13,910)
Income tax (expense) benefit
(418)12,212 
Net loss$(14,348)$(1,698)
(1)PeopleSolutions segment includes previously reported PeopleScout segment as well as Healthcare Staffing Professionals Inc. acquired on January 31, 2025.
(2)We evaluate performance based on segment revenue and segment profit (loss). Segment profit (loss) includes revenue, related cost of services, and ongoing operating expenses directly attributable to the reportable segment. Segment profit (loss) excludes depreciation and amortization expense, unallocated corporate general and administrative expense, interest expense, other income, income taxes, and other adjustments not considered to be ongoing.
(3)See the Non-GAAP Financial Measures table on the next page for definitions of EBITDA and Adjusted EBITDA.
(4)These third-party processing fees are associated with generating hiring tax credits.
(5)Amortization of software as a service assets is reported in selling, general and administrative expense.

(6)Costs associated with upgrading legacy PeopleReady technology.
(7)Other adjustments for the 13 weeks ended March 30, 2025 and March 31, 2024 primarily include workforce reduction costs of $1.4 million ($0.1 million in cost of services and $1.3 million in selling, general and administrative expense) and $1.9 million ($0.1 million in cost of services and $1.8 million in selling, general and administrative expense), respectively.
(8)Includes software depreciation reported in cost of services.


TRUEBLUE, INC.
NON-GAAP FINANCIAL MEASURES AND NON-GAAP RECONCILIATIONS

In addition to financial measures presented in accordance with U.S. GAAP, we monitor certain non-GAAP key financial measures. The presentation of these non-GAAP financial measures is used to enhance the understanding of certain aspects of our financial performance. It is not meant to be considered in isolation, superior to, or as a substitute for the directly comparable financial measures prepared in accordance with U.S. GAAP, and may not be comparable to similarly titled measures of other companies.
Non-GAAP measureDefinitionPurpose of adjusted measures
Adjusted net income (loss) and
Adjusted net income (loss) per diluted share
Net loss and net loss per diluted share, excluding:
gain on divestiture,
amortization of intangibles,
acquisition/integration costs,
PeopleReady technology upgrade costs,
COVID-19 government subsidies, net,
other adjustments, net, and
tax effect of the adjustments and deferred tax asset valuation allowance.

Enhances comparability on a consistent basis and provides investors with useful insight into the underlying trends of the business.
Used by management to assess performance and effectiveness of our business strategies.
Provides a measure, among others, used in the determination of incentive compensation for management.

EBITDA and
Adjusted EBITDA
EBITDA excludes from net loss:
income tax expense (benefit),
interest and other (income) expense, net, and
depreciation and amortization.

Adjusted EBITDA further excludes:
third-party processing fees for hiring tax credits,
amortization of software as a service assets,
acquisition/integration costs,
PeopleReady technology upgrade costs,
COVID-19 government subsidies, net, and
other adjustments, net.

Enhances comparability on a consistent basis and provides investors with useful insight into the underlying trends of the business.
Used by management to assess performance and effectiveness of our business strategies.
Provides a measure, among others, used in the determination of incentive compensation for management.
Adjusted SG&A expense
Selling, general and administrative expense excluding:
third-party processing fees for hiring tax credits,
amortization of software as a service assets,
acquisition/integration costs,
PeopleReady technology upgrade costs,
COVID-19 government subsidies, net, and
other adjustments, net.

Enhances comparability on a consistent basis and provides investors with useful insight into the underlying trends of the business.


1.RECONCILIATION OF U.S. GAAP NET LOSS TO ADJUSTED NET INCOME (LOSS) AND ADJUSTED NET INCOME (LOSS) PER DILUTED SHARE
(Unaudited)
13 weeks ended
(in thousands, except for per share data)Mar 30, 2025Mar 31, 2024
Net loss$(14,348)$(1,698)
Gain on divestiture
 (745)
Amortization of intangible assets401 1,521 
Acquisition/integration costs710 — 
PeopleReady technology upgrade costs (1)
 385 
COVID-19 government subsidies, net 44 
Other adjustments, net (2)
1,498 2,209 
Tax effect of adjustments and deferred tax asset valuation allowance (3)
 (888)
Adjusted net income (loss)
$(11,739)$828 
Adjusted net income (loss) per diluted share
$(0.40)$0.03 
Diluted weighted average shares outstanding29,698 31,380 
Margin / % of revenue:
Net loss
(3.9)%(0.4)%
Adjusted net income (loss)
(3.2)%0.2%
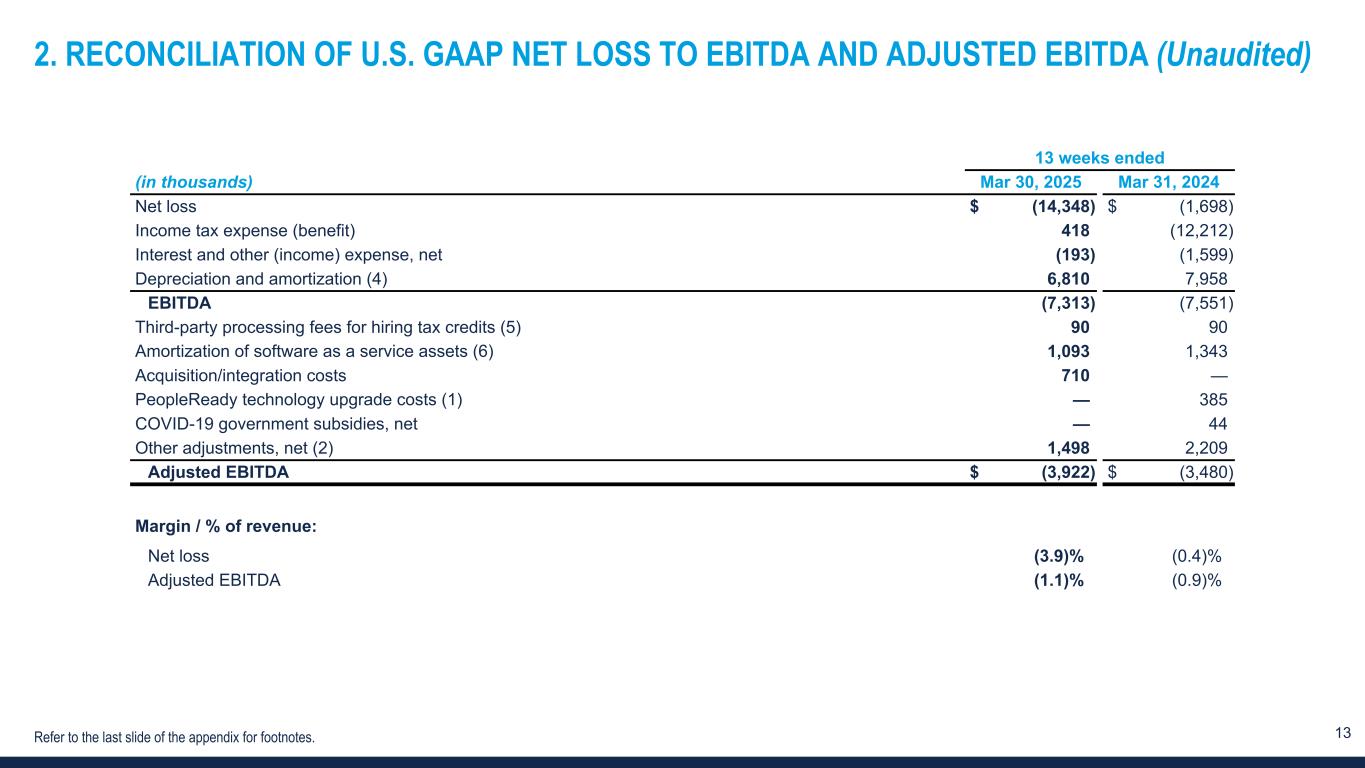
2.RECONCILIATION OF U.S. GAAP NET LOSS TO EBITDA AND ADJUSTED EBITDA
(Unaudited)
13 weeks ended
(in thousands)Mar 30, 2025Mar 31, 2024
Net loss$(14,348)$(1,698)
Income tax expense (benefit)
418 (12,212)
Interest and other (income) expense, net
(193)(1,599)
Depreciation and amortization (4)
6,810 7,958 
EBITDA(7,313)(7,551)
Third-party processing fees for hiring tax credits (5)
90 90 
Amortization of software as a service assets (6)
1,093 1,343 
Acquisition/integration costs710 — 
PeopleReady technology upgrade costs (1)
 385 
COVID-19 government subsidies, net 44 
Other adjustments, net (2)
1,498 2,209 
Adjusted EBITDA $(3,922)$(3,480)
Margin / % of revenue:
Net loss
(3.9)%(0.4)%
Adjusted EBITDA (1.1)%(0.9)%


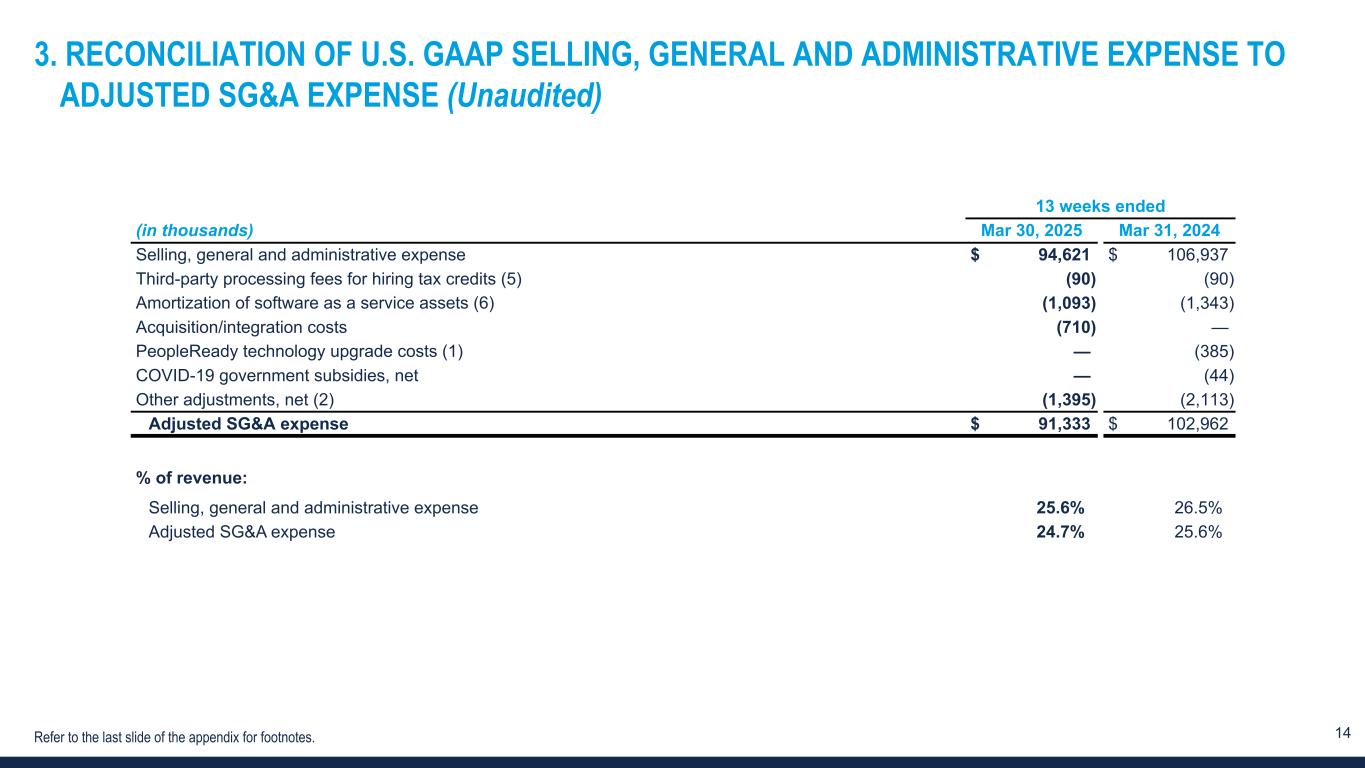
3.RECONCILIATION OF U.S. GAAP SELLING, GENERAL AND ADMINISTRATIVE EXPENSE TO ADJUSTED SG&A EXPENSE
(Unaudited)
13 weeks ended
(in thousands)Mar 30, 2025Mar 31, 2024
Selling, general and administrative expense$94,621 $106,937 
Third-party processing fees for hiring tax credits (5)
(90)(90)
Amortization of software as a service assets (6)
(1,093)(1,343)
Acquisition/integration costs(710)— 
PeopleReady technology upgrade costs (1)
 (385)
COVID-19 government subsidies, net (44)
Other adjustments, net (2)
(1,395)(2,113)
Adjusted SG&A expense$91,333 $102,962 
% of revenue:
Selling, general and administrative expense25.6%26.5%
Adjusted SG&A expense24.7%25.6%
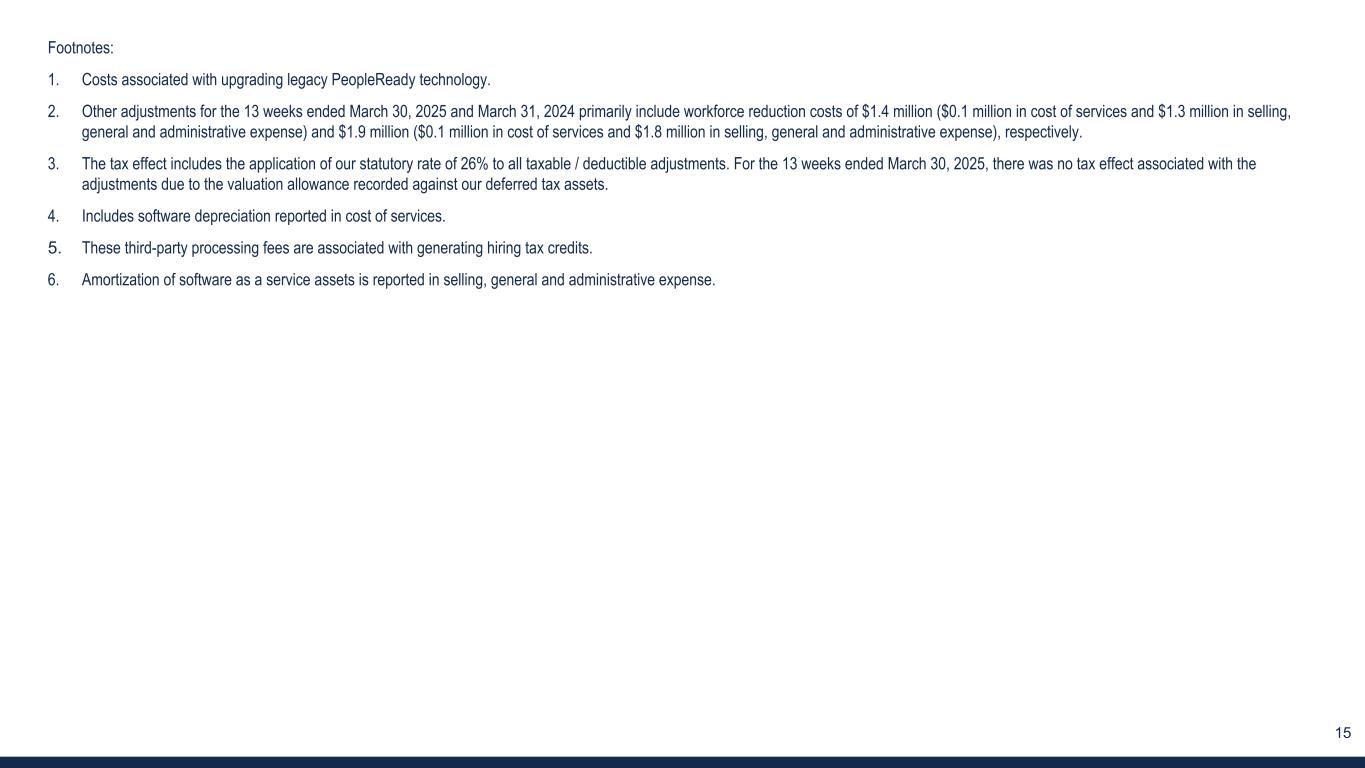
(1)Costs associated with upgrading legacy PeopleReady technology.
(2)Other adjustments for the 13 weeks ended March 30, 2025 and March 31, 2024 primarily include workforce reduction costs of $1.4 million ($0.1 million in cost of services and $1.3 million in selling, general and administrative expense) and $1.9 million ($0.1 million in cost of services and $1.8 million in selling, general and administrative expense), respectively.
(3)The tax effect includes the application of our statutory rate of 26% to all taxable / deductible adjustments. For the 13 weeks ended March 30, 2025, there was no tax effect associated with the adjustments due to the valuation allowance recorded against our deferred tax assets.
(4)Includes software depreciation reported in cost of services.
(5)These third-party processing fees are associated with generating hiring tax credits.
(6)Amortization of software as a service assets is reported in selling, general and administrative expense.


Q1 2025 EARNINGS


2 Forward-looking statements and non-GAAP financial measures This presentation contains forward-looking statements relating to our plans and expectations including, without limitation, statements regarding the future performance and operations of our business, expectations regarding stabilization in demand, and expected growth from our digital investments, all of which are subject to risks and uncertainties. Such statements are based on management’s expectations and assumptions as of the date of this presentation and involve many risks and uncertainties that could cause actual results to differ materially from those expressed or implied in our forward-looking statements including: (1) national and global economic conditions, which can be negatively impacted by factors such as rising interest rates, inflation, changes in government policies, political instability, epidemics and global trade uncertainty, (2) our ability to maintain profit margins, (3) our ability to attract and retain clients, (4) our ability to access sufficient capital to finance our operations, including our ability to comply with covenants contained in our revolving credit facility, (5) our ability to successfully execute on business strategies and further digitalize our business model, (6) our ability to attract sufficient qualified candidates and employees to meet the needs of our clients, (7) new laws, regulations, and government incentives that could affect our operations or financial results, (8) any reduction or change in tax credits we utilize, including the Work Opportunity Tax Credit, (9) our ability to successfully integrate acquired businesses, and (10) the timing and amount of common stock repurchases, if any, which will be determined at management’s discretion and depend upon several factors, including market and business conditions, the trading price of our common stock and the nature of other investment opportunities. Other information regarding factors that could affect our results is included in our Securities and Exchange Commission (SEC) filings, including the company’s most recent reports on Forms 10-K and 10-Q, copies of which may be obtained by visiting our website at www.trueblue.com under the Investor Relations section or the SEC’s website at www.sec.gov. We assume no obligation to update or revise any forward-looking statement, whether as a result of new information, future events, or otherwise, except as required by law. Any other references to future financial estimates are included for informational purposes only and subject to risk factors discussed in our most recent filings with the SEC. Any comparisons made herein to other periods are based on a comparison to the same period in the prior year unless otherwise stated. In addition, we use several non-GAAP financial measures when presenting our financial results in this presentation. Please refer to the reconciliations between our U.S. GAAP and non-GAAP financial measures in the appendix to this presentation and on our website at www.trueblue.com under the Investor Relations section for additional information on both current and historical periods. The presentation of these non-GAAP financial measures is used to enhance the understanding of certain aspects of our financial performance. It is not meant to be considered in isolation, superior to, or as a substitute for the directly comparable financial measures prepared in accordance with U.S. GAAP, and may not be comparable to similarly titled measures of other companies. Any comparisons made herein to other periods are based on a comparison to the same period in the prior year unless otherwise stated.


3 Q1 2025 Overview Total revenue down 8% ▪ Uncertainty continued to weigh on customers, driving reduced volumes with the exception of commercial driving services which delivered double-digit growth for the third consecutive quarter ▪ Organic1 revenue down 11% Net loss was $14 million vs. net loss of $2 million in Q1 2024 ▪ Gross margin down 1 percentage point primarily due to changes in business mix offsetting favorable workers’ compensation reserve adjustments ▪ SG&A improved by 12% - Disciplined cost management partially offset revenue decline ▪ Adjusted EBITDA2 was -$4 million v. -$3 million in Q1 2024 ▪ No income tax benefit on U.S. operations due to the valuation allowance in effect v. a $12 million benefit in Q1 2024 HSP integration on-track ▪ Financial performance included in new PeopleSolutions segment along with PeopleScout results Solid liquidity position ▪ Cash of $23 million, debt of $58 million and $71 million of borrowing availability for total liquidity of $94 million 1 Organic results exclude the impact of Healthcare Staffing Professionals, acquired Jan. 31 2025. 2 Refer to the appendix to this presentation for a definition and full reconciliation of non-GAAP financial measures to GAAP financial results for both current and historical periods.


4 Financial summary Amounts in millions, except per share data Q1 2025 Q1 2024 Change Revenue $370 $403 -8 % -11% organic1 Net loss -$14.3 -$1.7 NM Net loss per diluted share -$0.48 -$0.05 NM Net loss margin -3.9 % -0.4 % -4 pp Adjusted net income (loss)2 -$11.7 $0.8 NM Adj. net income (loss) per diluted share -$0.40 $0.03 NM Adj. net income (loss) margin -3.2 % 0.2 % -3 pp Adjusted EBITDA -$3.9 -$3.5 -13 % Adjusted EBITDA margin -1.1 % -0.9 % — pp NM - Not meaningful 1 Organic results exclude the impact of Healthcare Staffing Professionals, acquired Jan. 31 2025. 2 Refer to the appendix to this presentation for a definition and full reconciliation of non-GAAP financial measures to GAAP financial results.


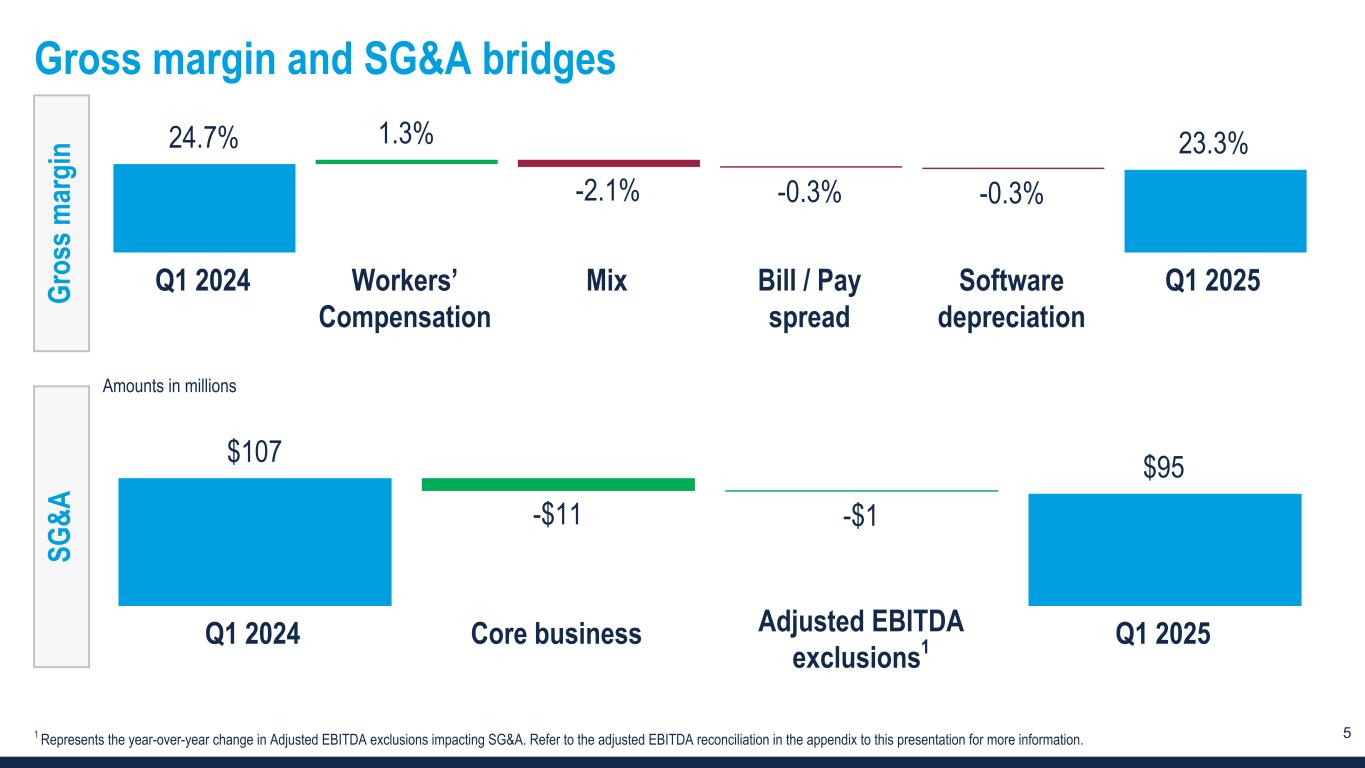
5 Gross margin and SG&A bridges Gr os s m ar gi n 24.7% 1.3% -2.1% -0.3% -0.3% 23.3% Q1 2024 Workers’ Compensation Mix Bill / Pay spread Software depreciation Q1 2025 SG &A $107 -$11 -$1 $95 Q1 2024 Core business Q1 2025 Amounts in millions 1 Represents the year-over-year change in Adjusted EBITDA exclusions impacting SG&A. Refer to the adjusted EBITDA reconciliation in the appendix to this presentation for more information. Adjusted EBITDA exclusions1


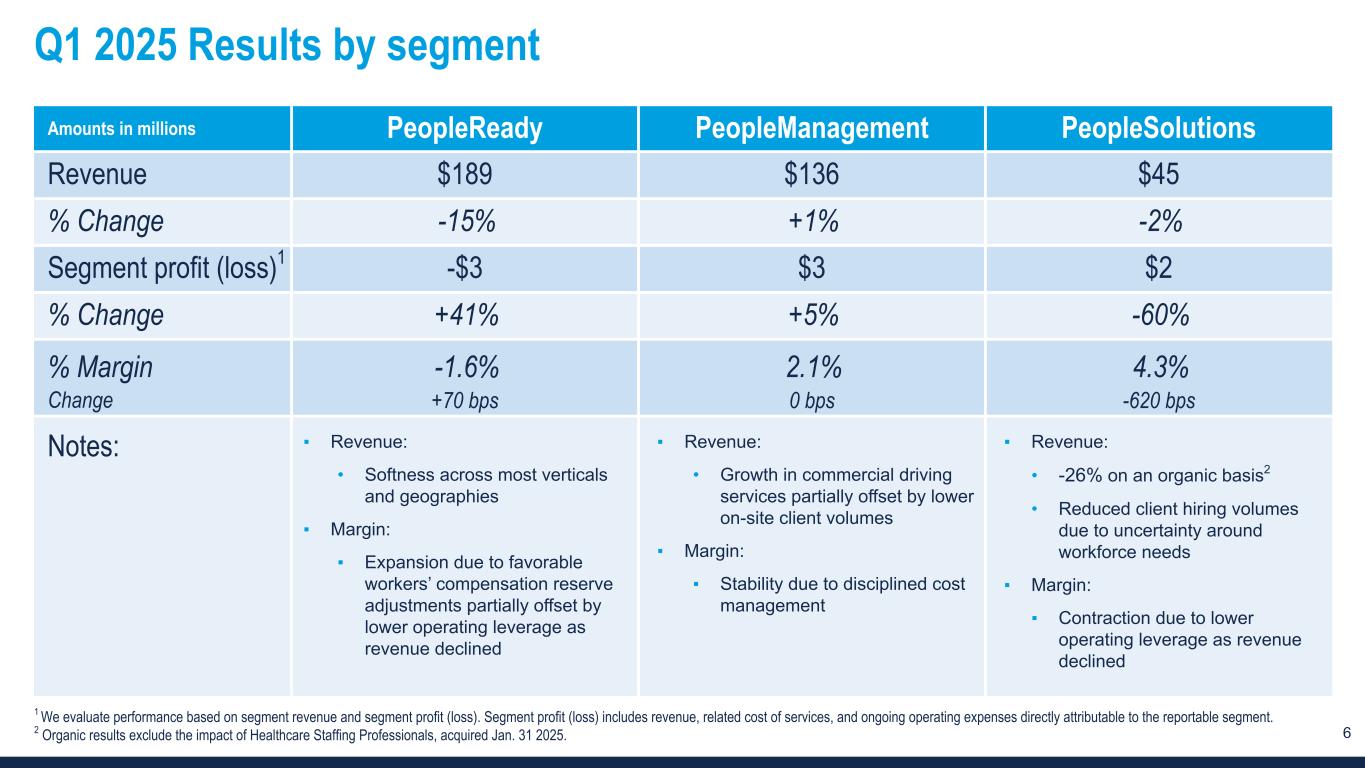
6 Q1 2025 Results by segment Amounts in millions PeopleReady PeopleManagement PeopleSolutions Revenue $189 $136 $45 % Change -15% +1% -2% Segment profit (loss)1 -$3 $3 $2 % Change +41% +5% -60% % Margin -1.6% 2.1% 4.3% Change +70 bps 0 bps -620 bps Notes: ▪ Revenue: • Softness across most verticals and geographies ▪ Margin: ▪ Expansion due to favorable workers’ compensation reserve adjustments partially offset by lower operating leverage as revenue declined ▪ Revenue: • Growth in commercial driving services partially offset by lower on-site client volumes ▪ Margin: ▪ Stability due to disciplined cost management ▪ Revenue: • -26% on an organic basis2 • Reduced client hiring volumes due to uncertainty around workforce needs ▪ Margin: ▪ Contraction due to lower operating leverage as revenue declined 1 We evaluate performance based on segment revenue and segment profit (loss). Segment profit (loss) includes revenue, related cost of services, and ongoing operating expenses directly attributable to the reportable segment. 2 Organic results exclude the impact of Healthcare Staffing Professionals, acquired Jan. 31 2025.


7 Solid balance sheet with ample liquidity $0 $0 -$8 -$58 $293 $86 $119 $71 $72 $62 $23 $23 Debt Borrowing availability Cash 2022 2023 2024 Q1 2025 Amounts in millions Note: Figures may not sum to consolidated totals due to rounding. Balances as of fiscal period end. 1 Borrowing availability is based on maximum borrowing availability under our most restrictive covenant. 2 Buyback ratio calculated as the dollar value of share repurchases during the period divided by our market capitalization at the beginning of the fiscal period. Liquidity Share repurchases 1 $61 $34 $21 $0 6% 5% 4% —% Share repurchases Buyback ratio 2022 2023 2024 YTD Q1 2025 2


Outlook


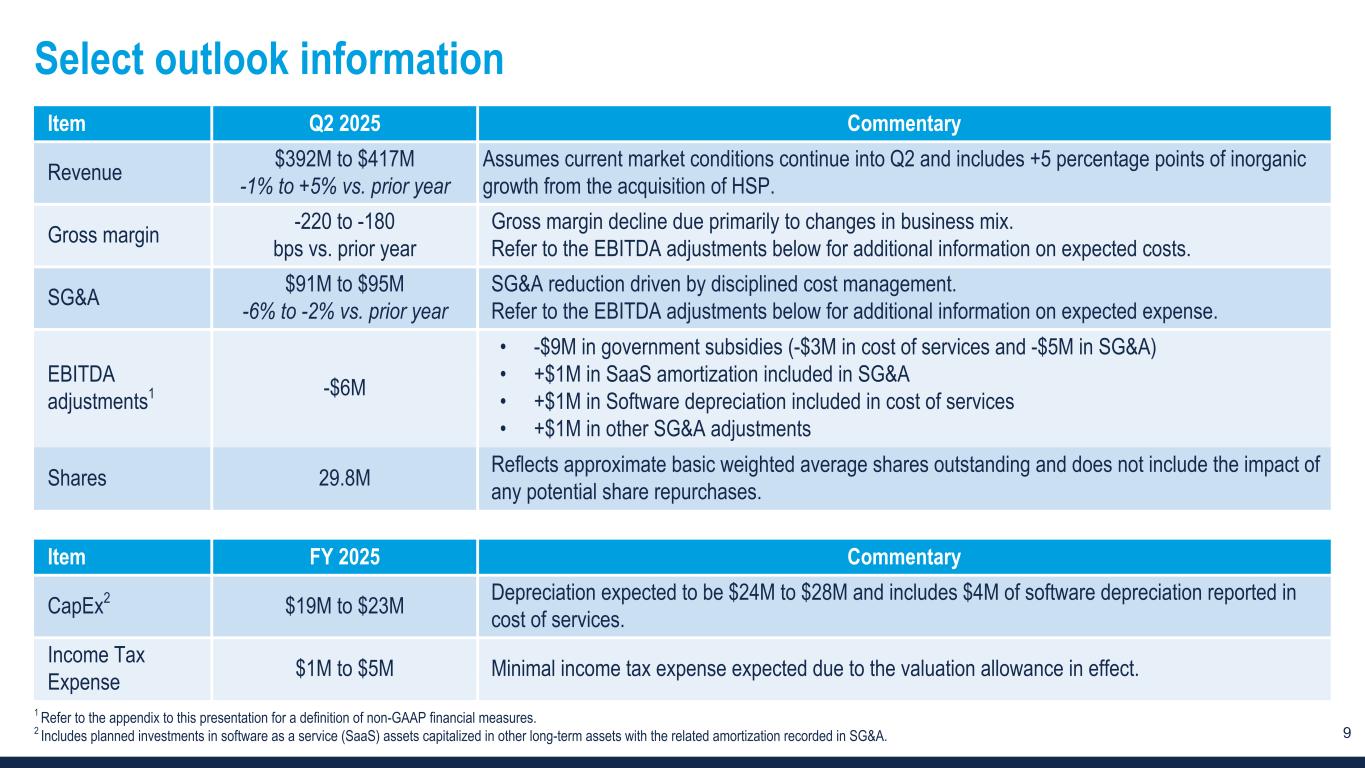
9 Select outlook information Item Q2 2025 Commentary Revenue $392M to $417M -1% to +5% vs. prior year Assumes current market conditions continue into Q2 and includes +5 percentage points of inorganic growth from the acquisition of HSP. Gross margin -220 to -180 bps vs. prior year Gross margin decline due primarily to changes in business mix. Refer to the EBITDA adjustments below for additional information on expected costs. SG&A $91M to $95M -6% to -2% vs. prior year SG&A reduction driven by disciplined cost management. Refer to the EBITDA adjustments below for additional information on expected expense. EBITDA adjustments1 -$6M • -$9M in government subsidies (-$3M in cost of services and -$5M in SG&A) • +$1M in SaaS amortization included in SG&A • +$1M in Software depreciation included in cost of services • +$1M in other SG&A adjustments Shares 29.8M Reflects approximate basic weighted average shares outstanding and does not include the impact of any potential share repurchases. Item FY 2025 Commentary CapEx2 $19M to $23M Depreciation expected to be $24M to $28M and includes $4M of software depreciation reported in cost of services. Income Tax Expense $1M to $5M Minimal income tax expense expected due to the valuation allowance in effect. 1 Refer to the appendix to this presentation for a definition of non-GAAP financial measures. 2 Includes planned investments in software as a service (SaaS) assets capitalized in other long-term assets with the related amortization recorded in SG&A.


Appendix


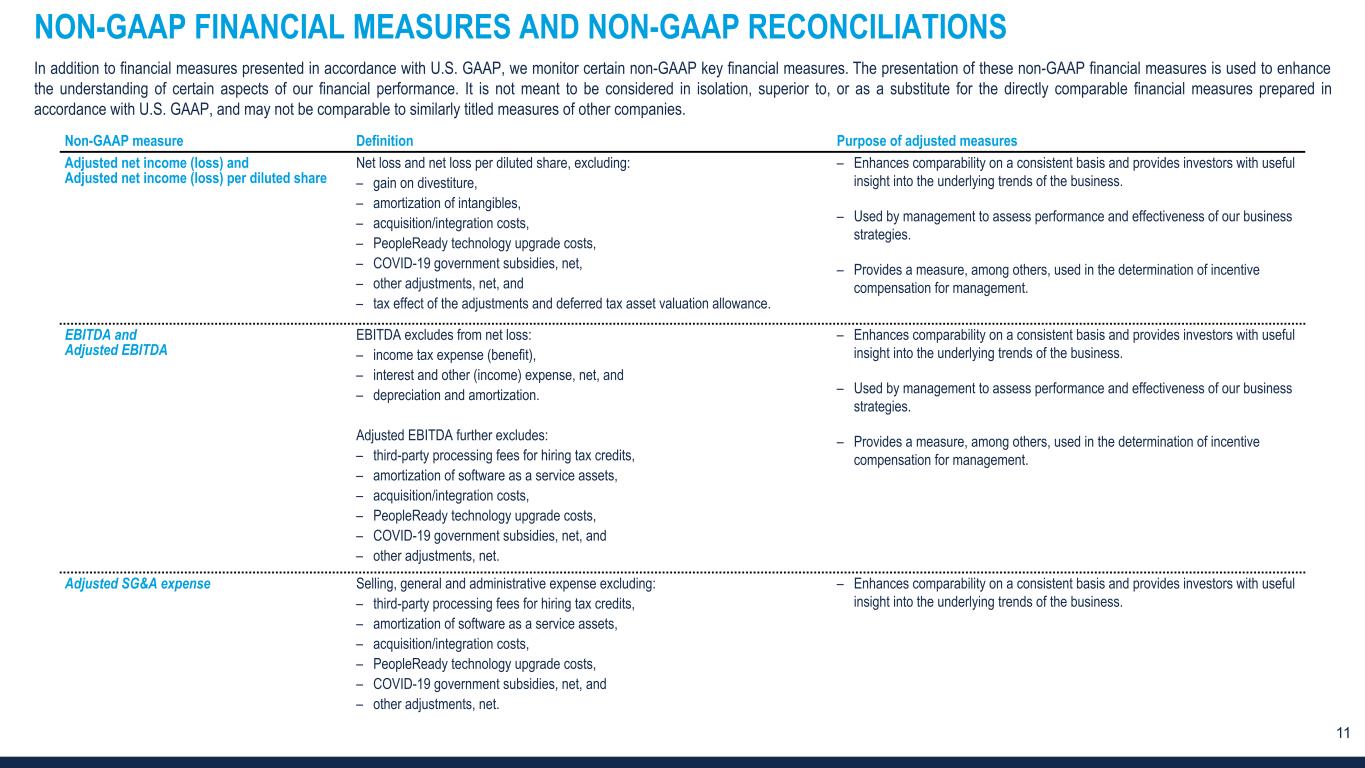
11 NON-GAAP FINANCIAL MEASURES AND NON-GAAP RECONCILIATIONS In addition to financial measures presented in accordance with U.S. GAAP, we monitor certain non-GAAP key financial measures. The presentation of these non-GAAP financial measures is used to enhance the understanding of certain aspects of our financial performance. It is not meant to be considered in isolation, superior to, or as a substitute for the directly comparable financial measures prepared in accordance with U.S. GAAP, and may not be comparable to similarly titled measures of other companies. Non-GAAP measure Definition Purpose of adjusted measures Adjusted net income (loss) and Adjusted net income (loss) per diluted share Net loss and net loss per diluted share, excluding: – gain on divestiture, – amortization of intangibles, – acquisition/integration costs, – PeopleReady technology upgrade costs, – COVID-19 government subsidies, net, – other adjustments, net, and – tax effect of the adjustments and deferred tax asset valuation allowance. – Enhances comparability on a consistent basis and provides investors with useful insight into the underlying trends of the business. – Used by management to assess performance and effectiveness of our business strategies. – Provides a measure, among others, used in the determination of incentive compensation for management. EBITDA and Adjusted EBITDA EBITDA excludes from net loss: – income tax expense (benefit), – interest and other (income) expense, net, and – depreciation and amortization. Adjusted EBITDA further excludes: – third-party processing fees for hiring tax credits, – amortization of software as a service assets, – acquisition/integration costs, – PeopleReady technology upgrade costs, – COVID-19 government subsidies, net, and – other adjustments, net. – Enhances comparability on a consistent basis and provides investors with useful insight into the underlying trends of the business. – Used by management to assess performance and effectiveness of our business strategies. – Provides a measure, among others, used in the determination of incentive compensation for management. Adjusted SG&A expense Selling, general and administrative expense excluding: – third-party processing fees for hiring tax credits, – amortization of software as a service assets, – acquisition/integration costs, – PeopleReady technology upgrade costs, – COVID-19 government subsidies, net, and – other adjustments, net. – Enhances comparability on a consistent basis and provides investors with useful insight into the underlying trends of the business.


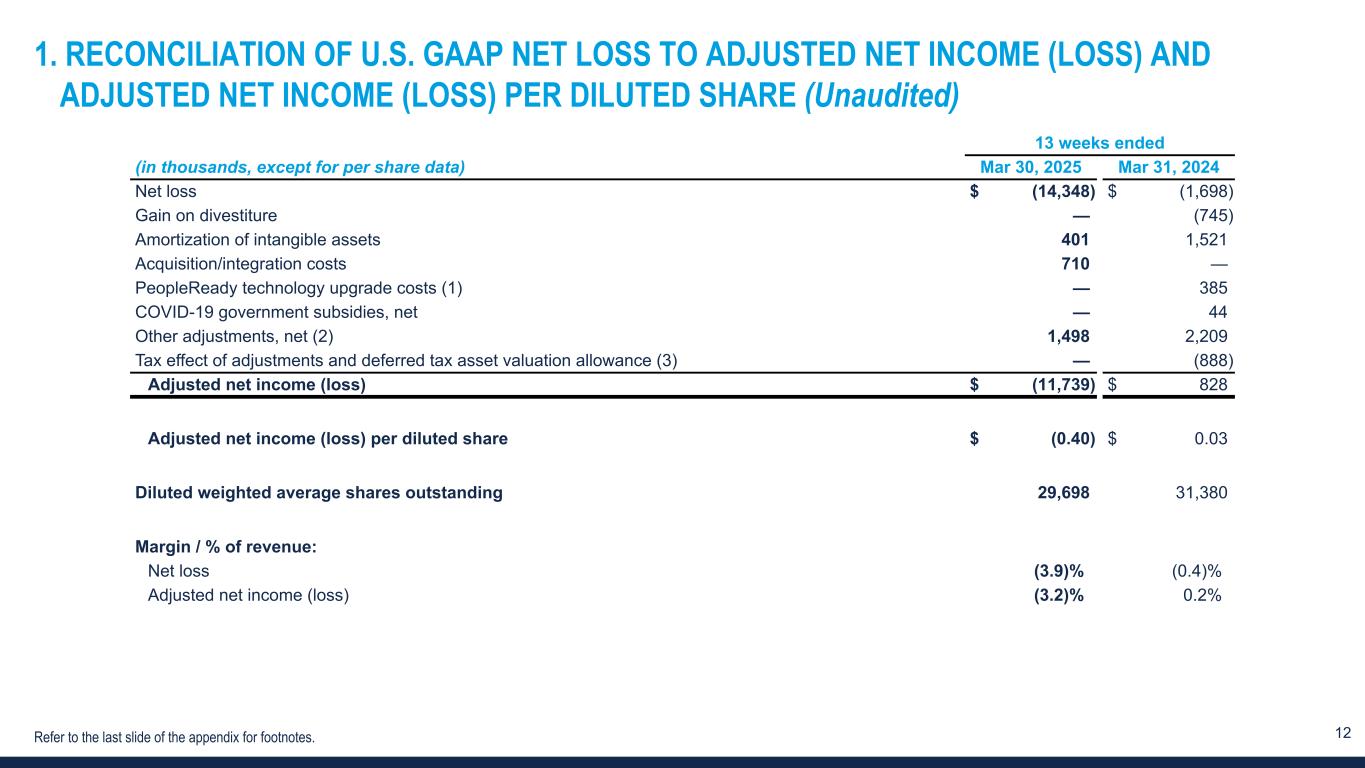
12 1. RECONCILIATION OF U.S. GAAP NET LOSS TO ADJUSTED NET INCOME (LOSS) AND ADJUSTED NET INCOME (LOSS) PER DILUTED SHARE (Unaudited) 13 weeks ended (in thousands, except for per share data) Mar 30, 2025 Mar 31, 2024 Net loss $ (14,348) $ (1,698) Gain on divestiture — (745) Amortization of intangible assets 401 1,521 Acquisition/integration costs 710 — PeopleReady technology upgrade costs (1) — 385 COVID-19 government subsidies, net — 44 Other adjustments, net (2) 1,498 2,209 Tax effect of adjustments and deferred tax asset valuation allowance (3) — (888) Adjusted net income (loss) $ (11,739) $ 828 Adjusted net income (loss) per diluted share $ (0.40) $ 0.03 Diluted weighted average shares outstanding 29,698 31,380 Margin / % of revenue: Net loss (3.9) % (0.4) % Adjusted net income (loss) (3.2) % 0.2 % Refer to the last slide of the appendix for footnotes.


13 2. RECONCILIATION OF U.S. GAAP NET LOSS TO EBITDA AND ADJUSTED EBITDA (Unaudited) Refer to the last slide of the appendix for footnotes. 13 weeks ended (in thousands) Mar 30, 2025 Mar 31, 2024 Net loss $ (14,348) $ (1,698) Income tax expense (benefit) 418 (12,212) Interest and other (income) expense, net (193) (1,599) Depreciation and amortization (4) 6,810 7,958 EBITDA (7,313) (7,551) Third-party processing fees for hiring tax credits (5) 90 90 Amortization of software as a service assets (6) 1,093 1,343 Acquisition/integration costs 710 — PeopleReady technology upgrade costs (1) — 385 COVID-19 government subsidies, net — 44 Other adjustments, net (2) 1,498 2,209 Adjusted EBITDA $ (3,922) $ (3,480) Margin / % of revenue: Net loss (3.9) % (0.4) % Adjusted EBITDA (1.1) % (0.9) %


14 3. RECONCILIATION OF U.S. GAAP SELLING, GENERAL AND ADMINISTRATIVE EXPENSE TO ADJUSTED SG&A EXPENSE (Unaudited) Refer to the last slide of the appendix for footnotes. 13 weeks ended (in thousands) Mar 30, 2025 Mar 31, 2024 Selling, general and administrative expense $ 94,621 $ 106,937 Third-party processing fees for hiring tax credits (5) (90) (90) Amortization of software as a service assets (6) (1,093) (1,343) Acquisition/integration costs (710) — PeopleReady technology upgrade costs (1) — (385) COVID-19 government subsidies, net — (44) Other adjustments, net (2) (1,395) (2,113) Adjusted SG&A expense $ 91,333 $ 102,962 % of revenue: Selling, general and administrative expense 25.6 % 26.5 % Adjusted SG&A expense 24.7 % 25.6 %


15 Footnotes: 1. Costs associated with upgrading legacy PeopleReady technology. 2. Other adjustments for the 13 weeks ended March 30, 2025 and March 31, 2024 primarily include workforce reduction costs of $1.4 million ($0.1 million in cost of services and $1.3 million in selling, general and administrative expense) and $1.9 million ($0.1 million in cost of services and $1.8 million in selling, general and administrative expense), respectively. 3. The tax effect includes the application of our statutory rate of 26% to all taxable / deductible adjustments. For the 13 weeks ended March 30, 2025, there was no tax effect associated with the adjustments due to the valuation allowance recorded against our deferred tax assets. 4. Includes software depreciation reported in cost of services. 5. These third-party processing fees are associated with generating hiring tax credits. 6. Amortization of software as a service assets is reported in selling, general and administrative expense.


 
Investor Roadshow Presentation May 2025


Forward-Looking Statements This presentation contains forward-looking statements relating to our plans and expectations including, without limitation, statements regarding the future performance and operations of our business, expectations regarding stabilization in demand, and expected growth from our digital investments, all of which are subject to risks and uncertainties. Such statements are based on management’s expectations and assumptions as of the date of this presentation and involve many risks and uncertainties that could cause actual results to differ materially from those expressed or implied in our forward-looking statements including: (1) national and global economic conditions, which can be negatively impacted by factors such as rising interest rates, inflation, changes in government policies, political instability, epidemics and global trade uncertainty, (2) our ability to maintain profit margins, (3) our ability to attract and retain clients, (4) our ability to access sufficient capital to finance our operations, including our ability to comply with covenants contained in our revolving credit facility, (5) our ability to successfully execute on business strategies and further digitalize our business model, (6) our ability to attract sufficient qualified candidates and employees to meet the needs of our clients, (7) new laws, regulations, and government incentives that could affect our operations or financial results, (8) any reduction or change in tax credits we utilize, including the Work Opportunity Tax Credit, (9) our ability to successfully integrate acquired businesses, and (10) the timing and amount of common stock repurchases, if any, which will be determined at management’s discretion and depend upon several factors, including market and business conditions, the trading price of our common stock and the nature of other investment opportunities. Other information regarding factors that could affect our results is included in our Securities and Exchange Commission (SEC) filings, including the company’s most recent reports on Forms 10-K and 10-Q, copies of which may be obtained by visiting our website at www.trueblue.com under the Investor Relations section or the SEC’s website at www.sec.gov. We assume no obligation to update or revise any forward-looking statement, whether as a result of new information, future events, or otherwise, except as required by law. Any other references to future financial estimates are included for informational purposes only and subject to risk factors discussed in our most recent filings with the SEC. Any comparisons made herein to other periods are based on a comparison to the same period in the prior year unless otherwise stated.


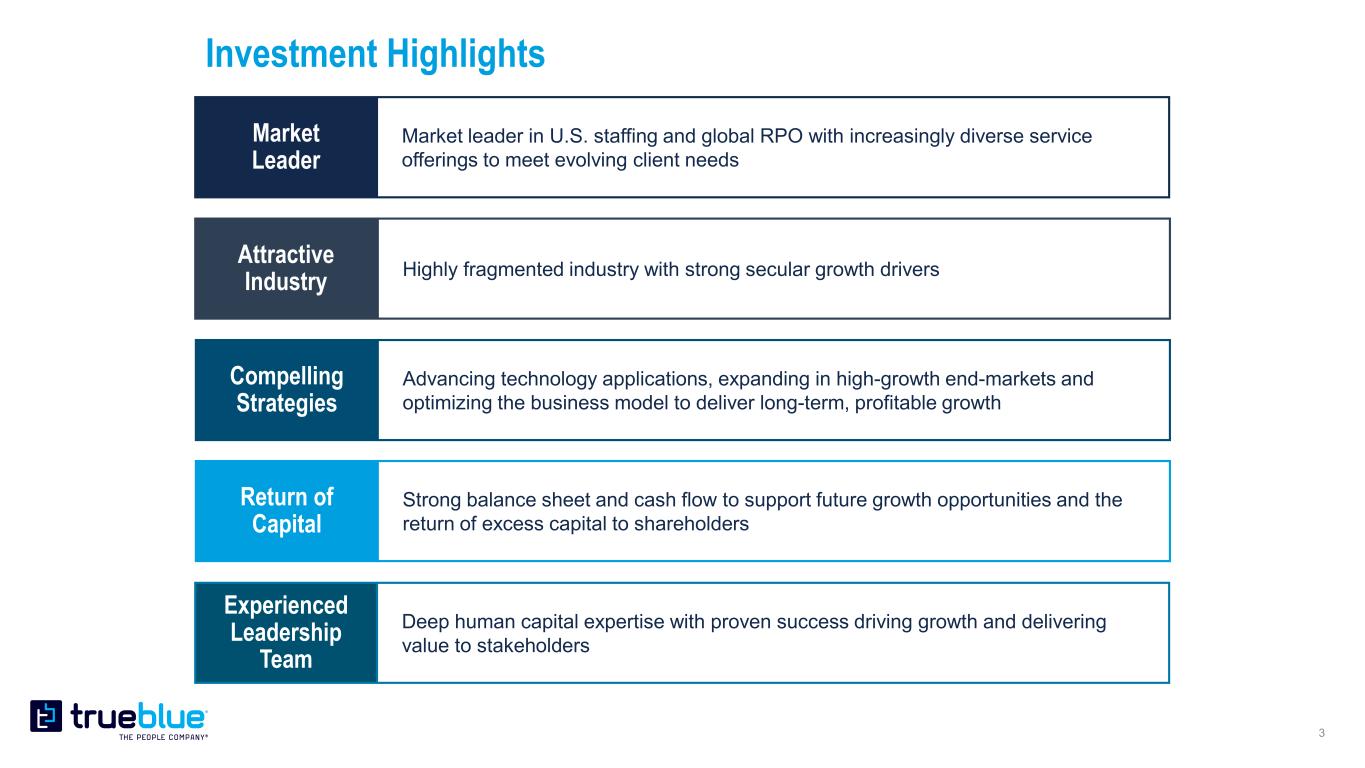
Investment Highlights Return of Capital Market leader in U.S. staffing and global RPO with increasingly diverse service offerings to meet evolving client needs Highly fragmented industry with strong secular growth drivers Strong balance sheet and cash flow to support future growth opportunities and the return of excess capital to shareholders Advancing technology applications, expanding in high-growth end-markets and optimizing the business model to deliver long-term, profitable growth Experienced Leadership Team Deep human capital expertise with proven success driving growth and delivering value to stakeholders


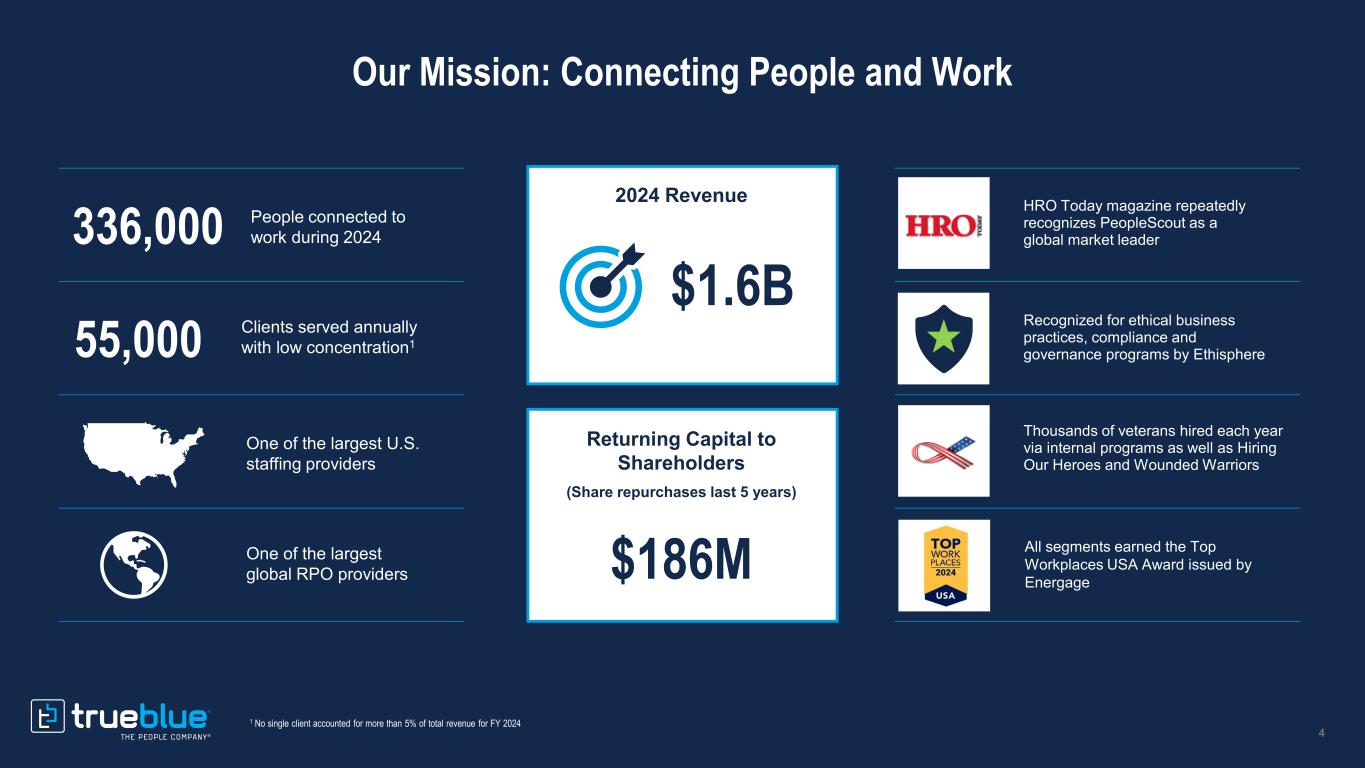
Our Mission: Connecting People and Work Returning Capital to Shareholders 2024 Revenue (Share repurchases last 5 years) $186M $1.6B 336,000 People connected to work during 2024 One of the largest U.S. staffing providers One of the largest global RPO providers HRO Today magazine repeatedly recognizes PeopleScout as a global market leader Thousands of veterans hired each year via internal programs as well as Hiring Our Heroes and Wounded Warriors Recognized for ethical business practices, compliance and governance programs by Ethisphere 1 No single client accounted for more than 5% of total revenue for FY 2024 All segments earned the Top Workplaces USA Award issued by Energage 55,000 Clients served annually with low concentration1


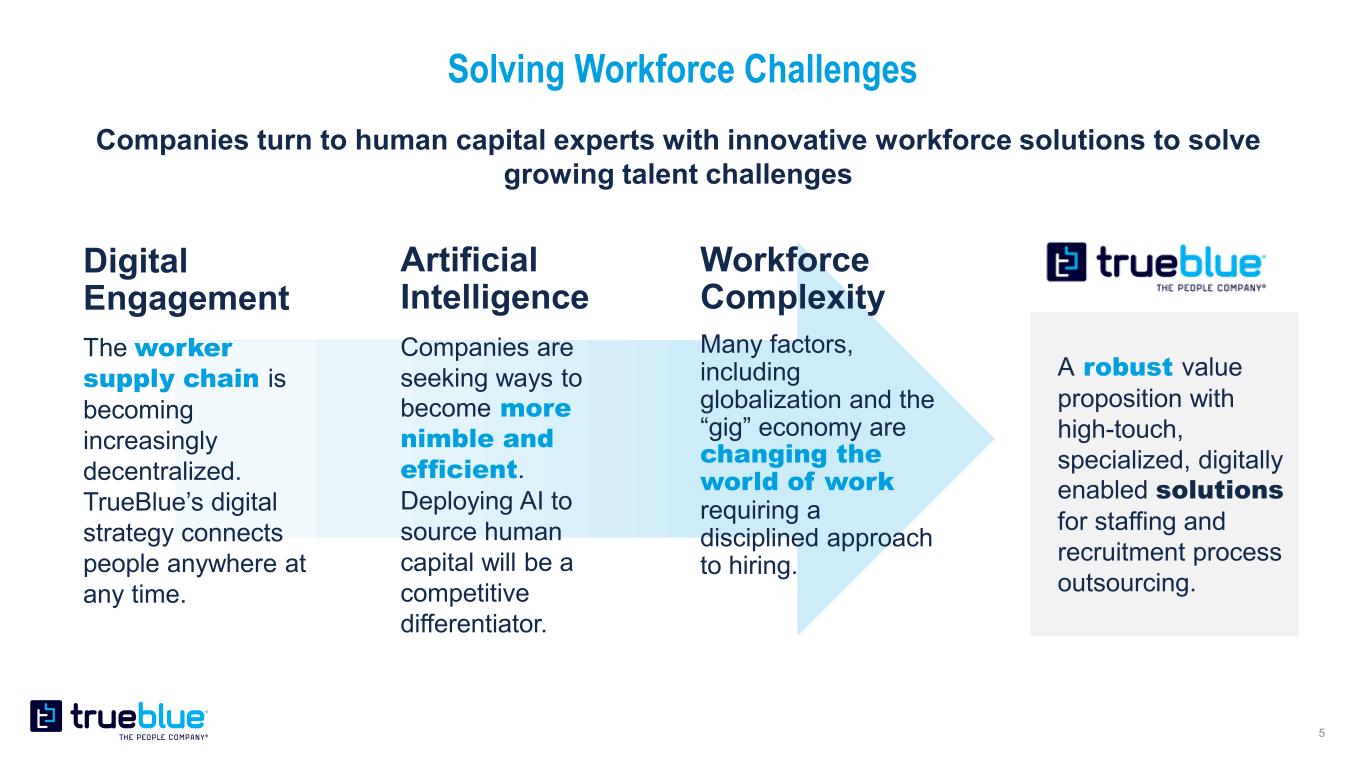
Solving Workforce Challenges Workforce Complexity Many factors, including globalization and the “gig” economy are changing the world of work requiring a disciplined approach to hiring. Artificial Intelligence Companies are seeking ways to become more nimble and efficient Deploying AI to source human capital will be a competitive differentiator. Digital Engagement The worker supply chain is becoming increasingly decentralized. TrueBlue’s digital strategy connects people anywhere at any time. Companies turn to human capital experts with innovative workforce solutions to solve growing talent challenges A robust value proposition with high-touch, specialized, digitally enabled solutions for staffing and recruitment process outsourcing.


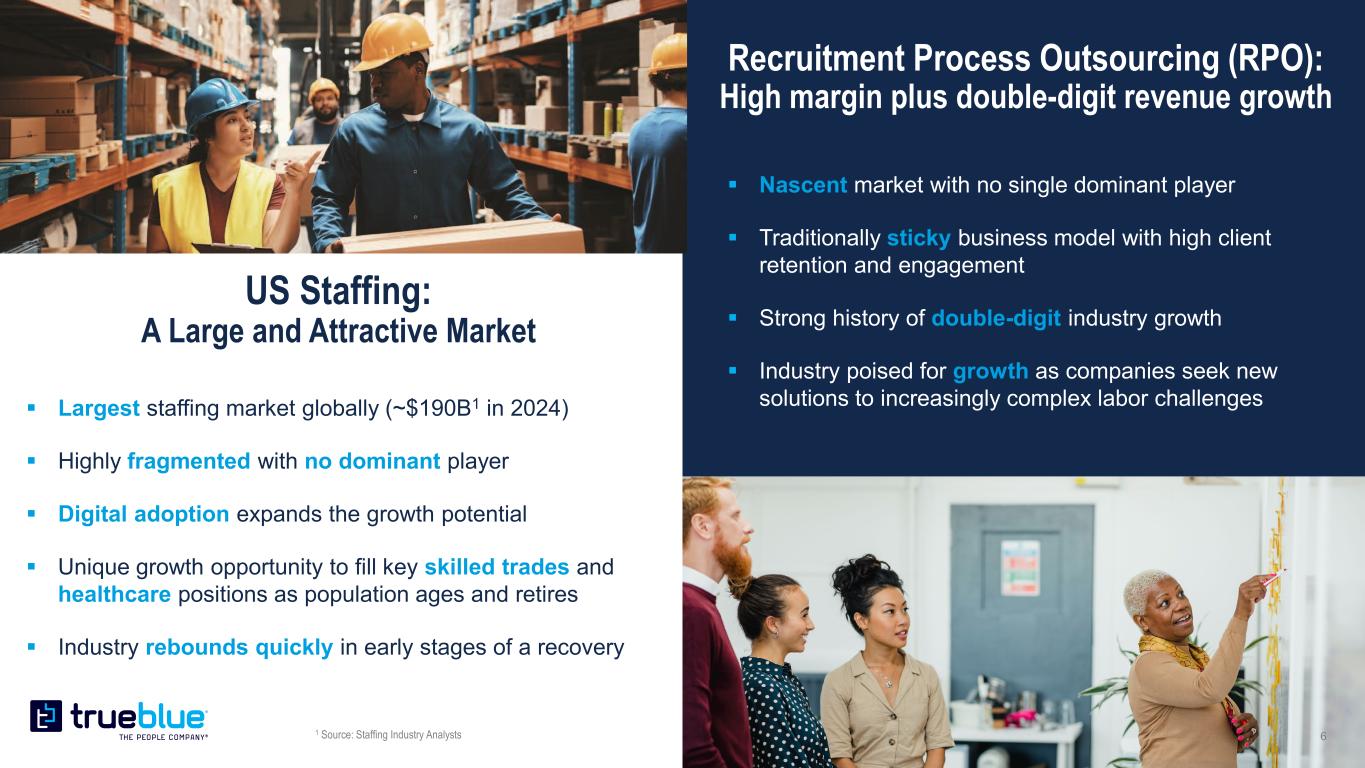
6 US Staffing: A Large and Attractive Market Recruitment Process Outsourcing (RPO): High margin plus double-digit revenue growth  Largest staffing market globally (~$190B1 in 2024)  Highly fragmented with no dominant player  Digital adoption expands the growth potential  Unique growth opportunity to fill key skilled trades and healthcare positions as population ages and retires  Industry rebounds quickly in early stages of a recovery 1 Source: Staffing Industry Analysts  Nascent market with no single dominant player  Traditionally sticky business model with high client retention and engagement  Strong history of double-digit industry growth  Industry poised for growth as companies seek new solutions to increasingly complex labor challenges


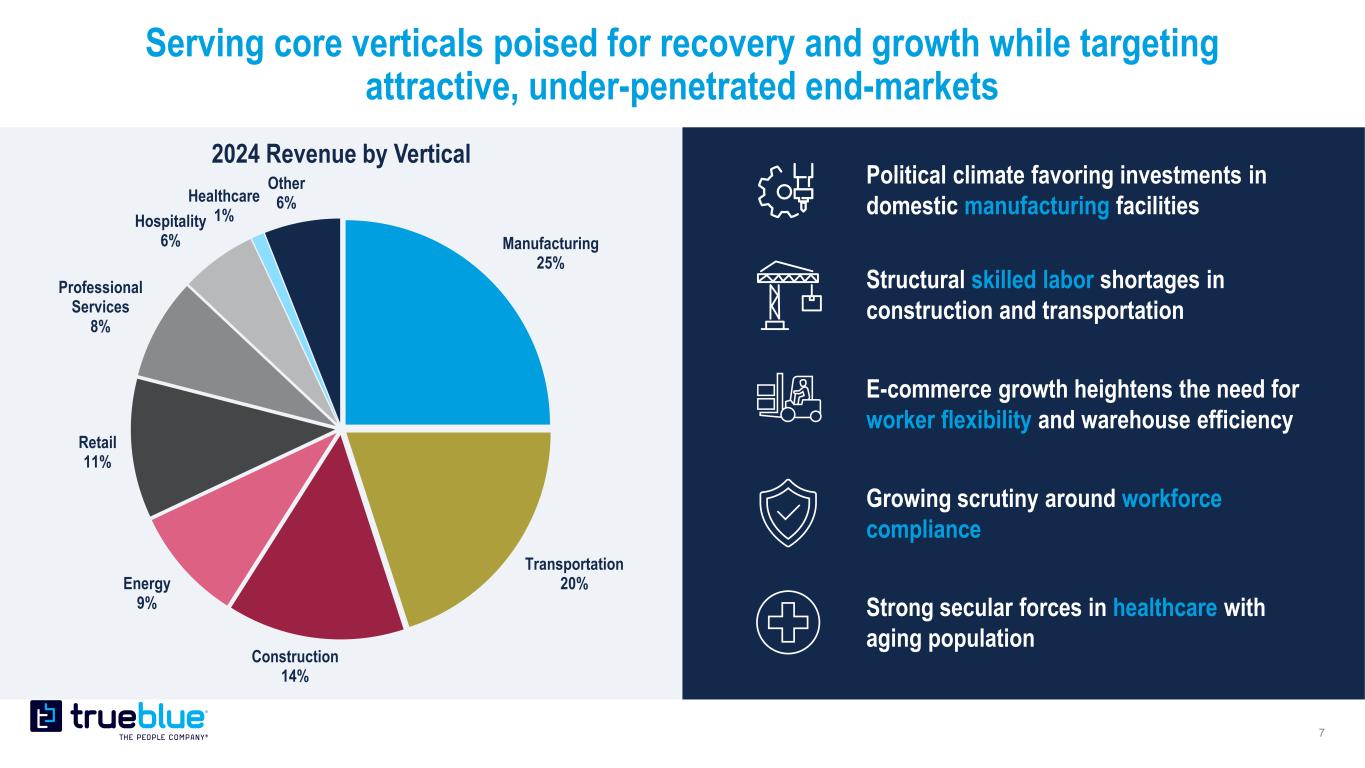
Manufacturing 25% Transportation 20% Construction 14% Energy 9% Retail 11% Professional Services 8% Hospitality 6% Healthcare 1% Other 6% 2024 Revenue by Vertical Serving core verticals poised for recovery and growth while targeting attractive, under-penetrated end-markets Political climate favoring investments in domestic manufacturing facilities Structural skilled labor shortages in construction and transportation E-commerce growth heightens the need for worker flexibility and warehouse efficiency Growing scrutiny around workforce compliance Strong secular forces in healthcare with aging population


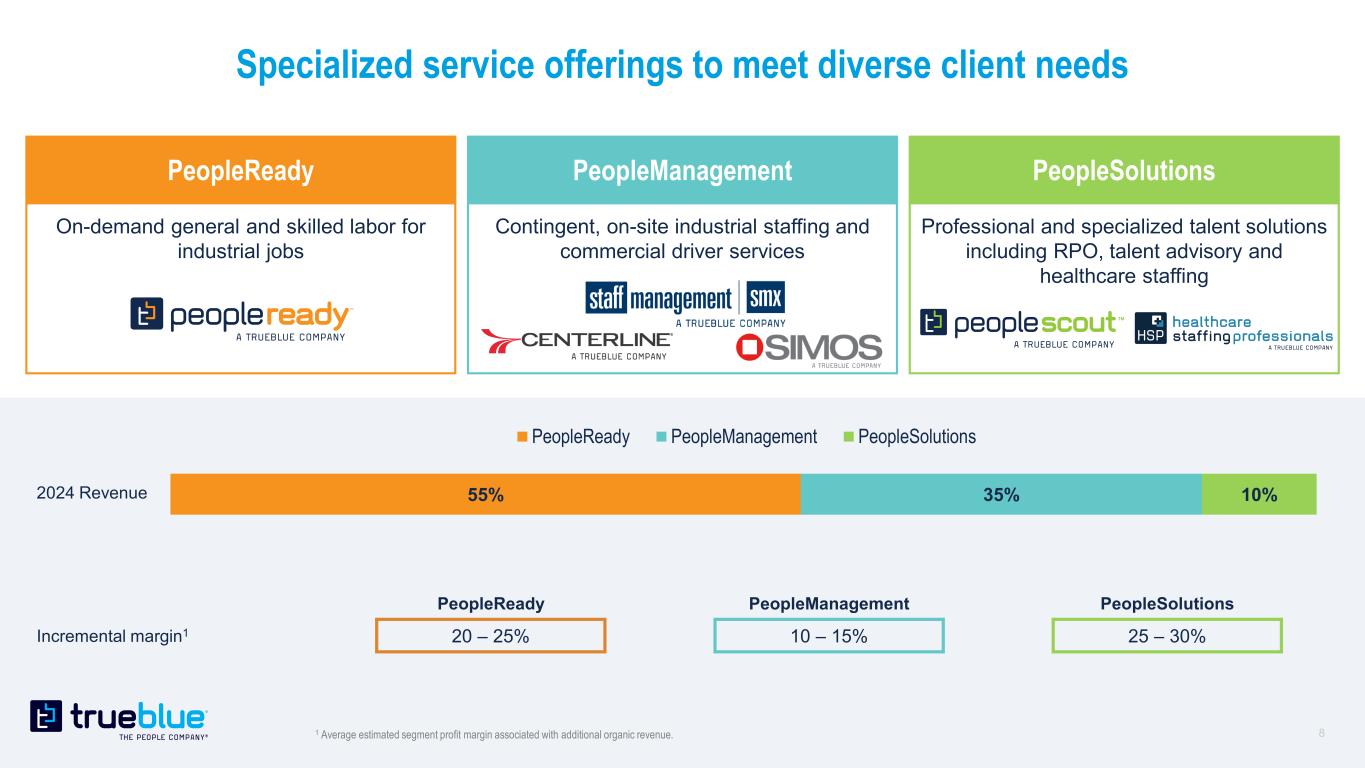
Specialized service offerings to meet diverse client needs 55% 35% 10% PeopleReady PeopleManagement PeopleSolutions 1 Average estimated segment profit margin associated with additional organic revenue. Contingent, on-site industrial staffing and commercial driver services PeopleManagement On-demand general and skilled labor for industrial jobs PeopleReady Professional and specialized talent solutions including RPO, talent advisory and healthcare staffing PeopleSolutions 2024 Revenue PeopleReady PeopleManagement PeopleSolutions Incremental margin1 20 – 25% 10 – 15% 25 – 30%


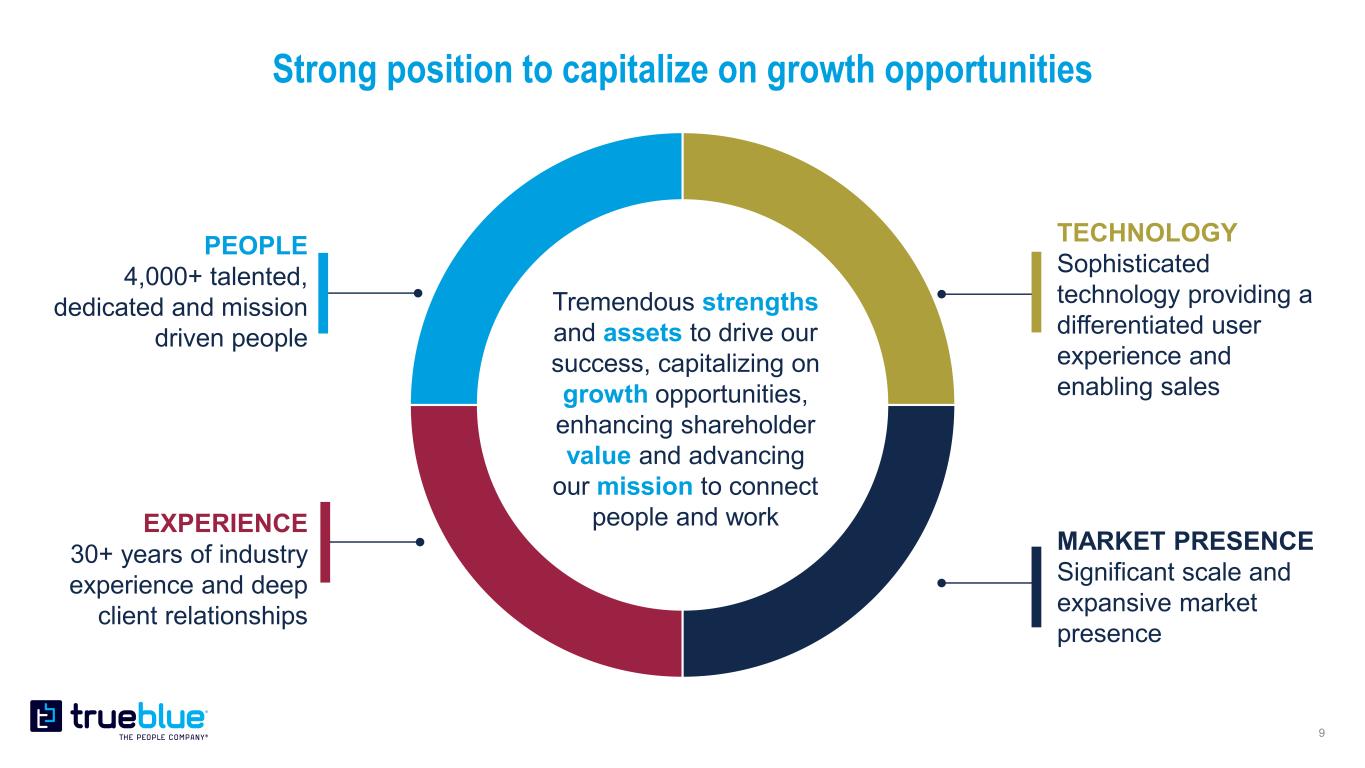
Strong position to capitalize on growth opportunities PEOPLE 4,000+ talented, dedicated and mission driven people EXPERIENCE 30+ years of industry experience and deep client relationships TECHNOLOGY Sophisticated technology providing a differentiated user experience and enabling sales MARKET PRESENCE Significant scale and expansive market presence Tremendous strengths and assets to drive our success, capitalizing on growth opportunities, enhancing shareholder value and advancing our mission to connect people and work


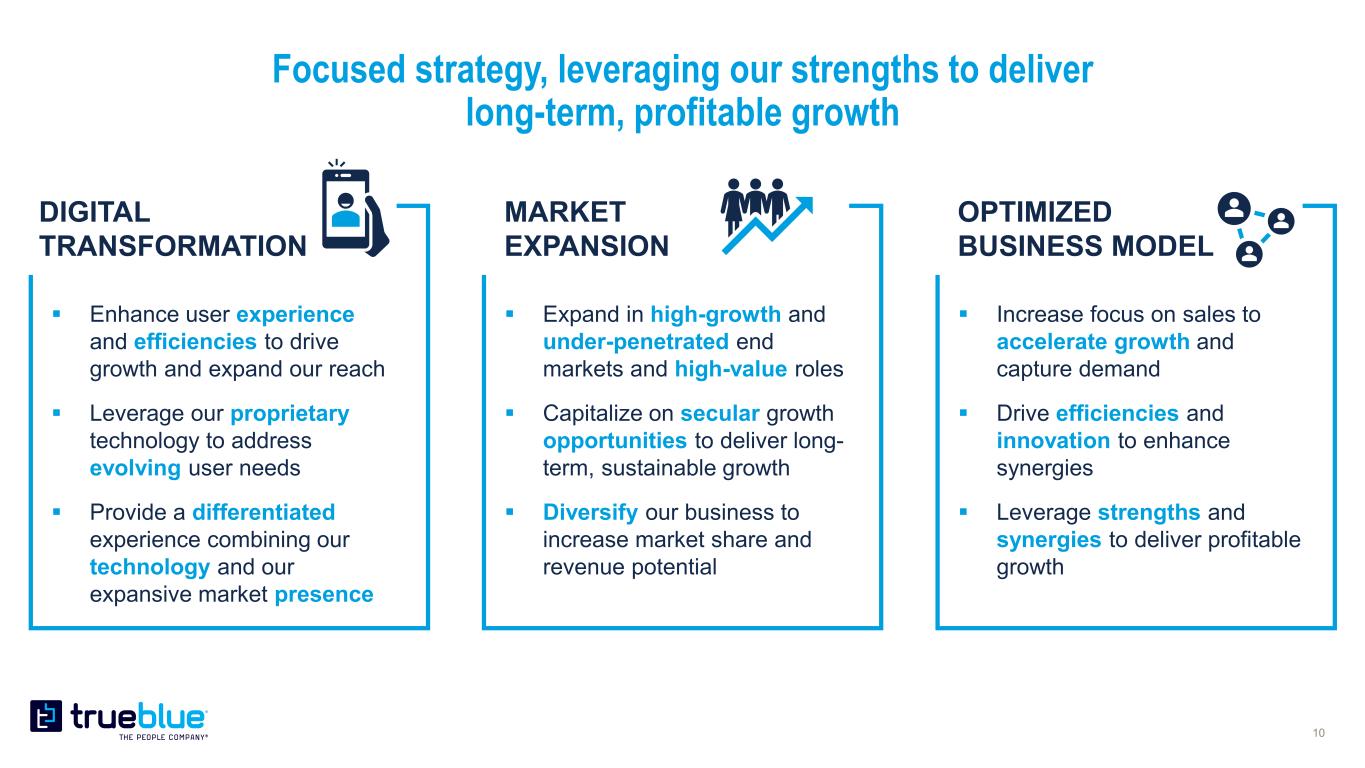
Focused strategy, leveraging our strengths to deliver long-term, profitable growth  Enhance user experience and efficiencies to drive growth and expand our reach  Leverage our proprietary technology to address evolving user needs  Provide a differentiated experience combining our technology and our expansive market presence  Increase focus on sales to accelerate growth and capture demand  Drive efficiencies and innovation to enhance synergies  Leverage strengths and synergies to deliver profitable growth  Expand in high-growth and under-penetrated end markets and high-value roles  Capitalize on secular growth opportunities to deliver long- term, sustainable growth  Diversify our business to increase market share and revenue potential DIGITAL TRANSFORMATION MARKET EXPANSION OPTIMIZED BUSINESS MODEL


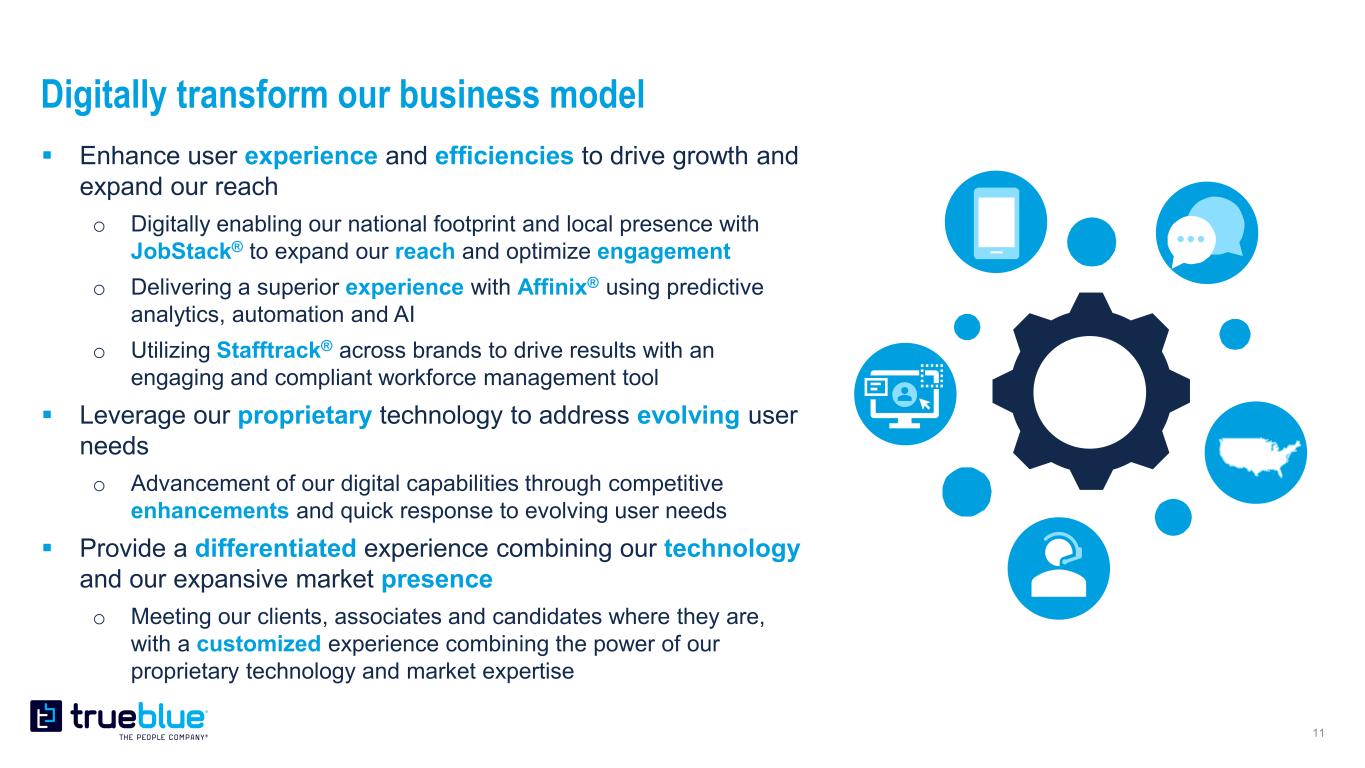
Digitally transform our business model  Enhance user experience and efficiencies to drive growth and expand our reach o Digitally enabling our national footprint and local presence with JobStack® to expand our reach and optimize engagement o Delivering a superior experience with Affinix® using predictive analytics, automation and AI o Utilizing Stafftrack® across brands to drive results with an engaging and compliant workforce management tool  Leverage our proprietary technology to address evolving user needs o Advancement of our digital capabilities through competitive enhancements and quick response to evolving user needs  Provide a differentiated experience combining our technology and our expansive market presence o Meeting our clients, associates and candidates where they are, with a customized experience combining the power of our proprietary technology and market expertise


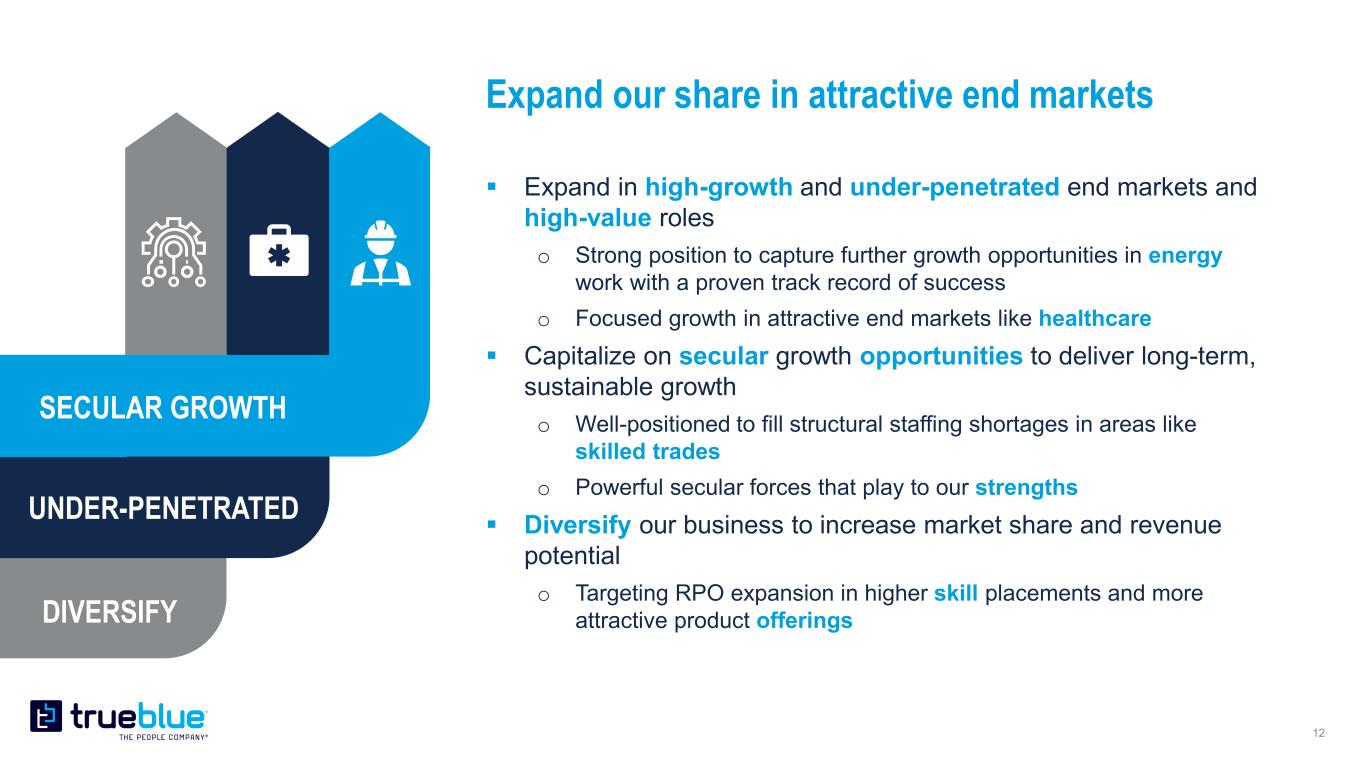
Expand our share in attractive end markets  Expand in high-growth and under-penetrated end markets and high-value roles o Strong position to capture further growth opportunities in energy work with a proven track record of success o Focused growth in attractive end markets like healthcare  Capitalize on secular growth opportunities to deliver long-term, sustainable growth o Well-positioned to fill structural staffing shortages in areas like skilled trades o Powerful secular forces that play to our strengths  Diversify our business to increase market share and revenue potential o Targeting RPO expansion in higher skill placements and more attractive product offerings SECULAR GROWTH UNDER-PENETRATED DIVERSIFY


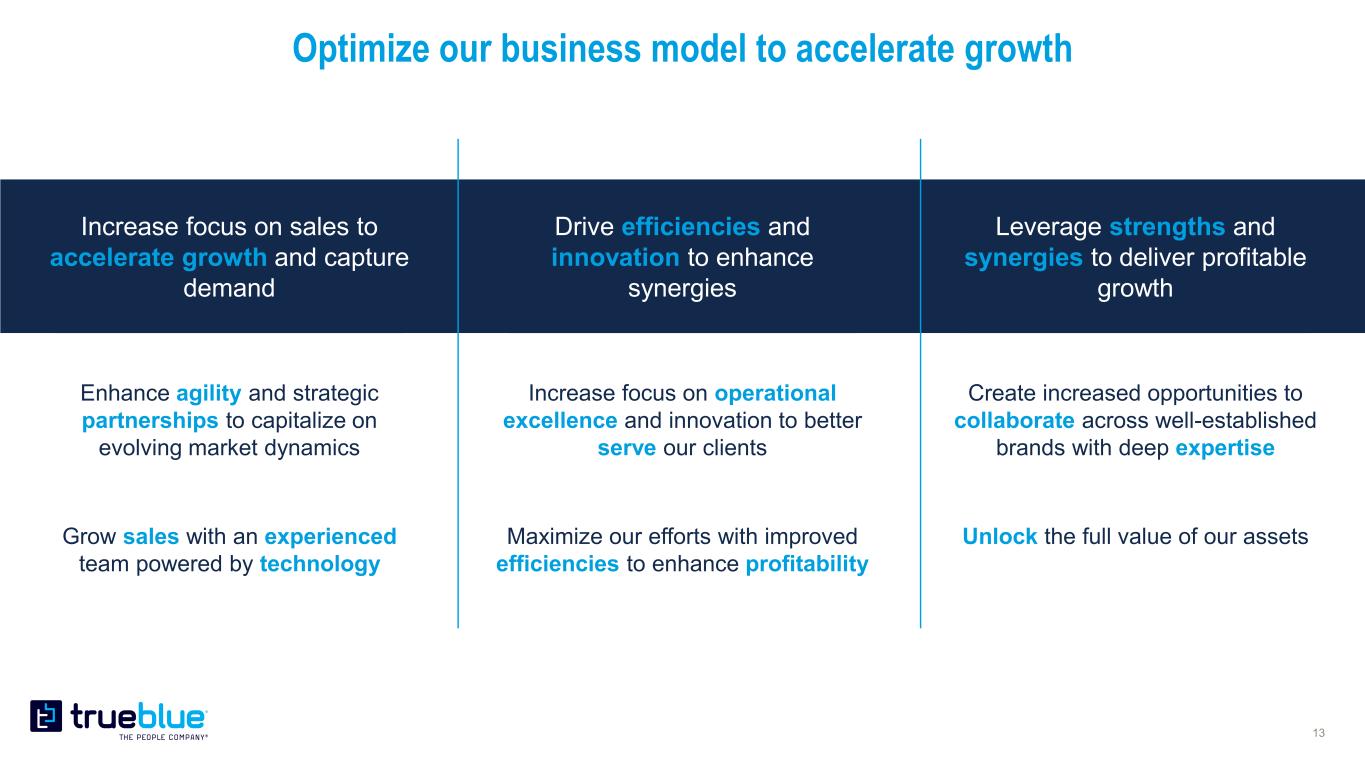
Optimize our business model to accelerate growth Increase focus on sales to accelerate growth and capture demand Leverage strengths and synergies to deliver profitable growth Drive efficiencies and innovation to enhance synergies Create increased opportunities to collaborate across well-established brands with deep expertise Unlock the full value of our assets Increase focus on operational excellence and innovation to better serve our clients Maximize our efforts with improved efficiencies to enhance profitability Enhance agility and strategic partnerships to capitalize on evolving market dynamics Grow sales with an experienced team powered by technology


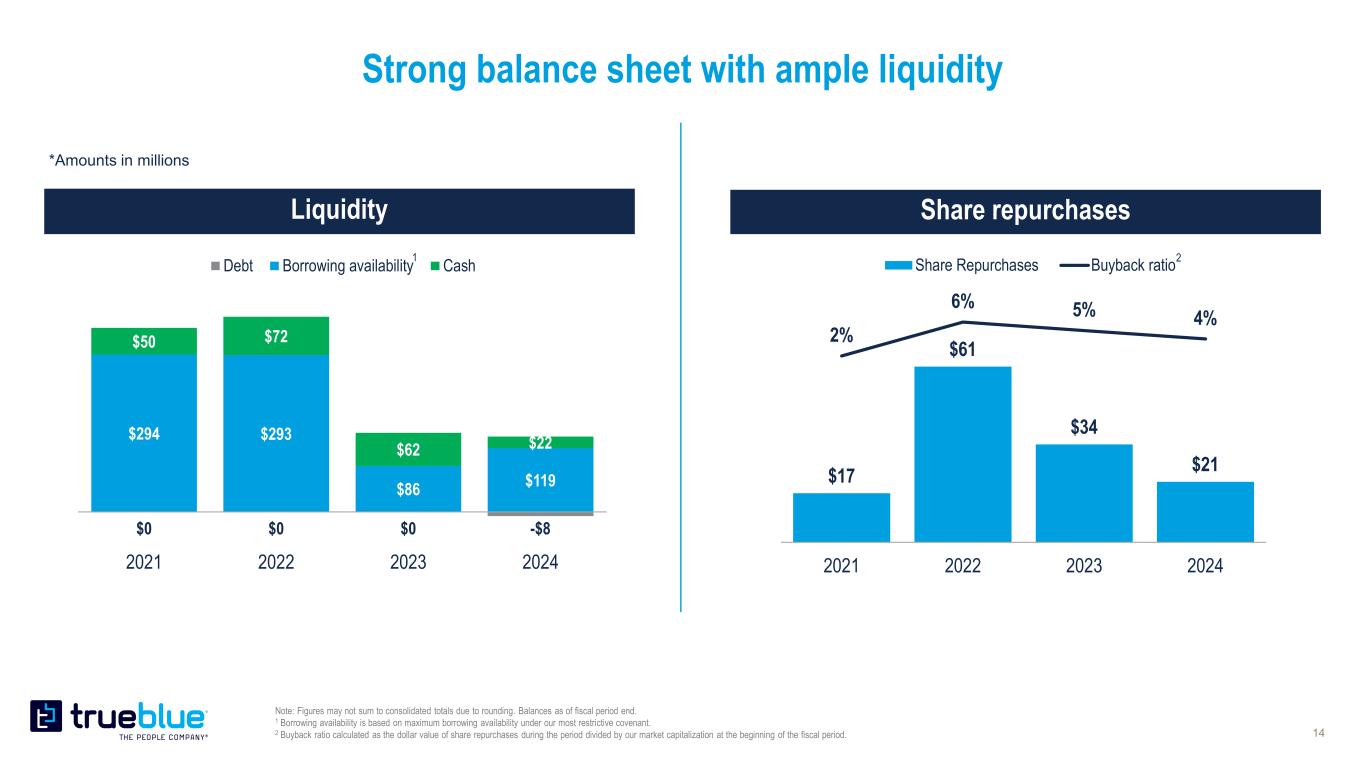
Strong balance sheet with ample liquidity Note: Figures may not sum to consolidated totals due to rounding. Balances as of fiscal period end. 1 Borrowing availability is based on maximum borrowing availability under our most restrictive covenant. 2 Buyback ratio calculated as the dollar value of share repurchases during the period divided by our market capitalization at the beginning of the fiscal period. $0 $0 $0 -$8 $294 $293 $86 $119 $50 $72 $62 $22 2021 2022 2023 2024 Debt Borrowing availability Cash *Amounts in millions 1 $17 $61 $34 $21 2% 6% 5% 4% -20% -15% -10% -5% 0% 5% 10% 0 10 20 30 40 50 60 70 80 90 100 2021 2022 2023 2024 Share Repurchases Buyback ratio2


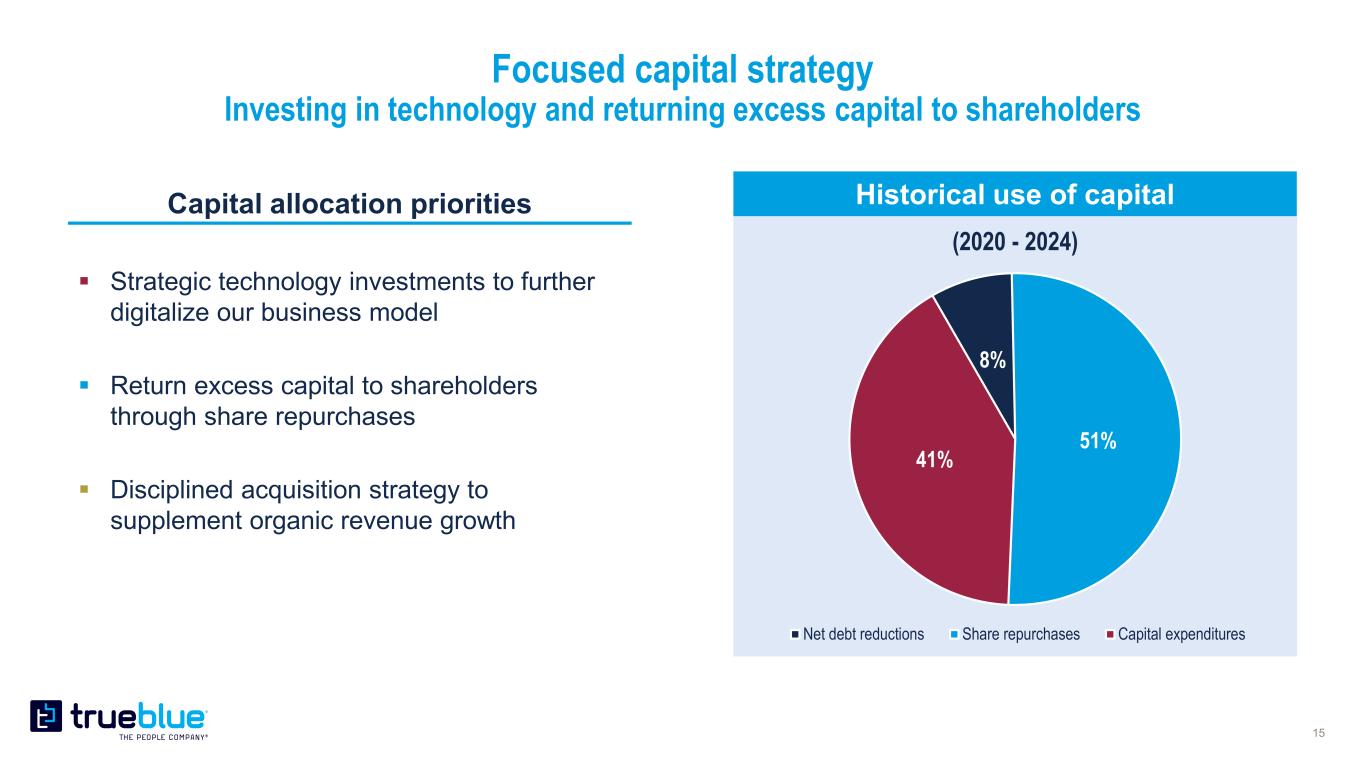
Focused capital strategy Investing in technology and returning excess capital to shareholders 8% 51% 41% (2020 - 2024) Net debt reductions Share repurchases Capital expenditures Historical use of capitalCapital allocation priorities  Strategic technology investments to further digitalize our business model  Return excess capital to shareholders through share repurchases  Disciplined acquisition strategy to supplement organic revenue growth


TARYN OWEN PRESIDENT AND CHIEF EXECUTIVE OFFICER Leadership with Deep Expertise CARL SCHWEIHS EVP AND CHIEF FINANCIAL OFFICER KRISTY WILLIS EVP AND PRESIDENT, PEOPLEREADY RICK BETORI EVP AND PRESIDENT, PEOPLESOLUTIONS JERRY WIMER SVP AND PRESIDENT, PEOPLEMANAGEMENT GARRETT FERENCZ EVP AND CHIEF LEGAL OFFICER JEFF DIRKS SVP AND CHIEF DIGITAL OFFICER GREG NETOLICKY SVP AND CHIEF PEOPLE OFFICER CAROLINE SABETTI SVP AND CHIEF MARKETING AND COMMUNICATIONS OFFICER MAXIE JUZANG SVP AND PRESIDENT, HEALTHCARE STAFFING PROFESSIONALS


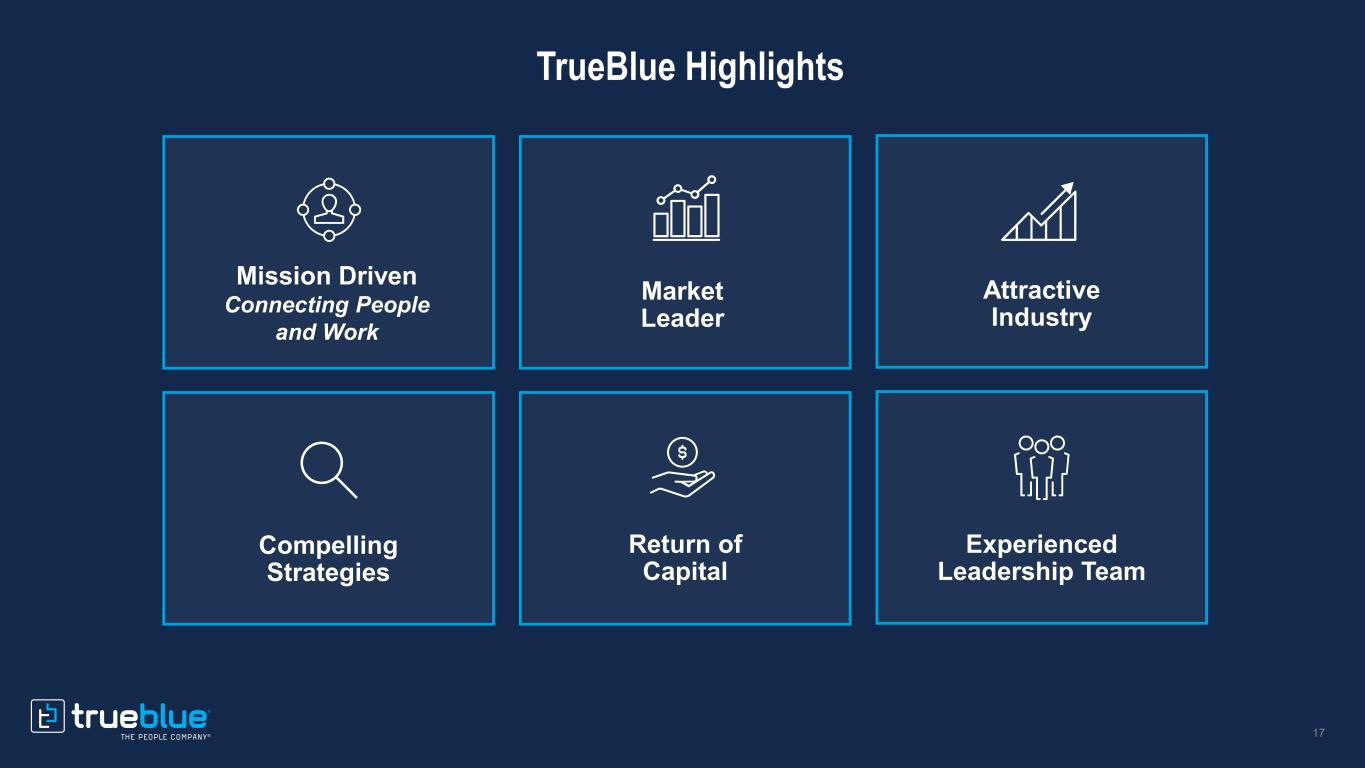
TrueBlue Highlights Mission Driven Connecting People and Work


THANK YOU