TRUEBLUE REPORTS FOURTH QUARTER AND FULL-YEAR 2025 RESULTS
TACOMA, WASH. - Feb. 18, 2025 -- TrueBlue (NYSE:TBI) today announced its fourth quarter and full-year results for 2025.
Fourth Quarter 2025 Financial Highlights
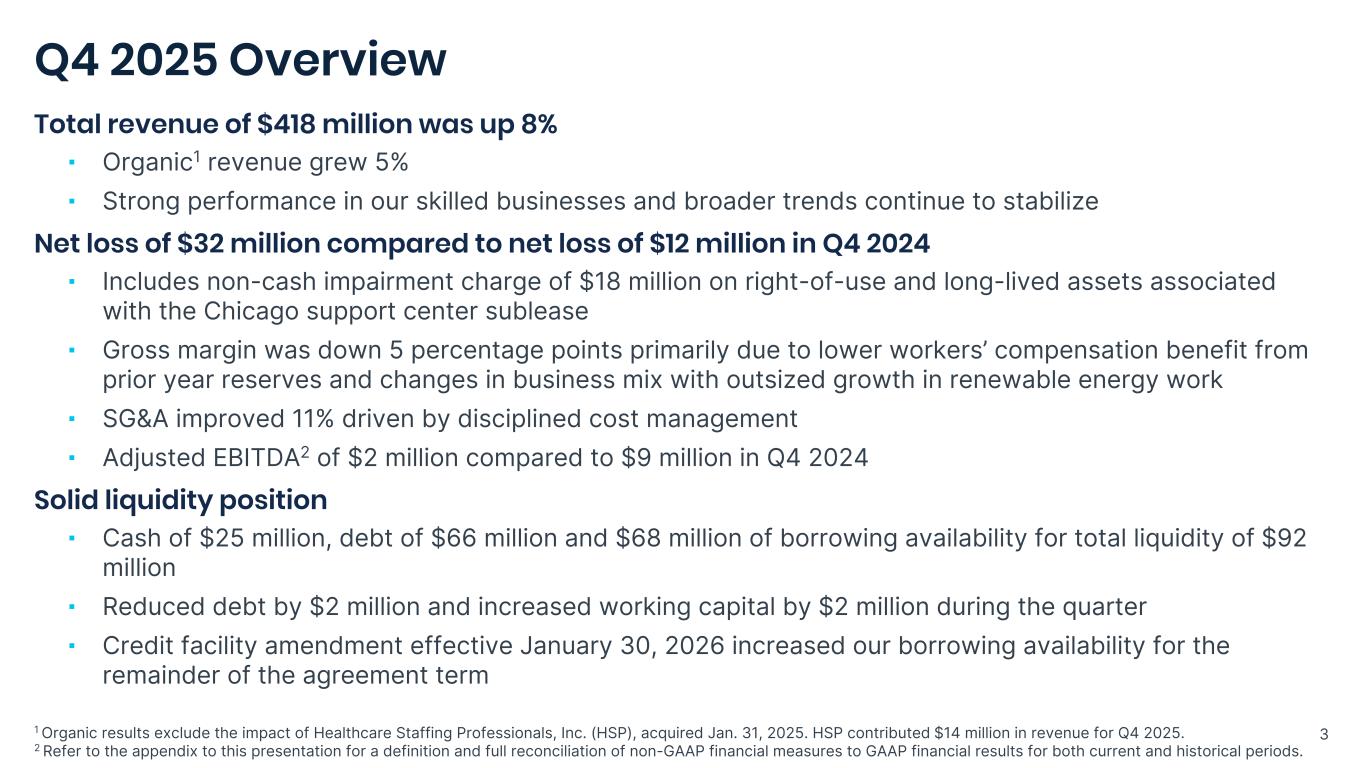
•Revenue of $418 million, up 8 percent compared to the prior year period
◦$14 million of revenue from the January 2025 HSP acquisition
•Net loss of $32 million compared to net loss of $12 million in the prior year period
◦Includes non-cash impairment charge of $18 million on right-of-use and long-lived assets associated with the Chicago support center sublease
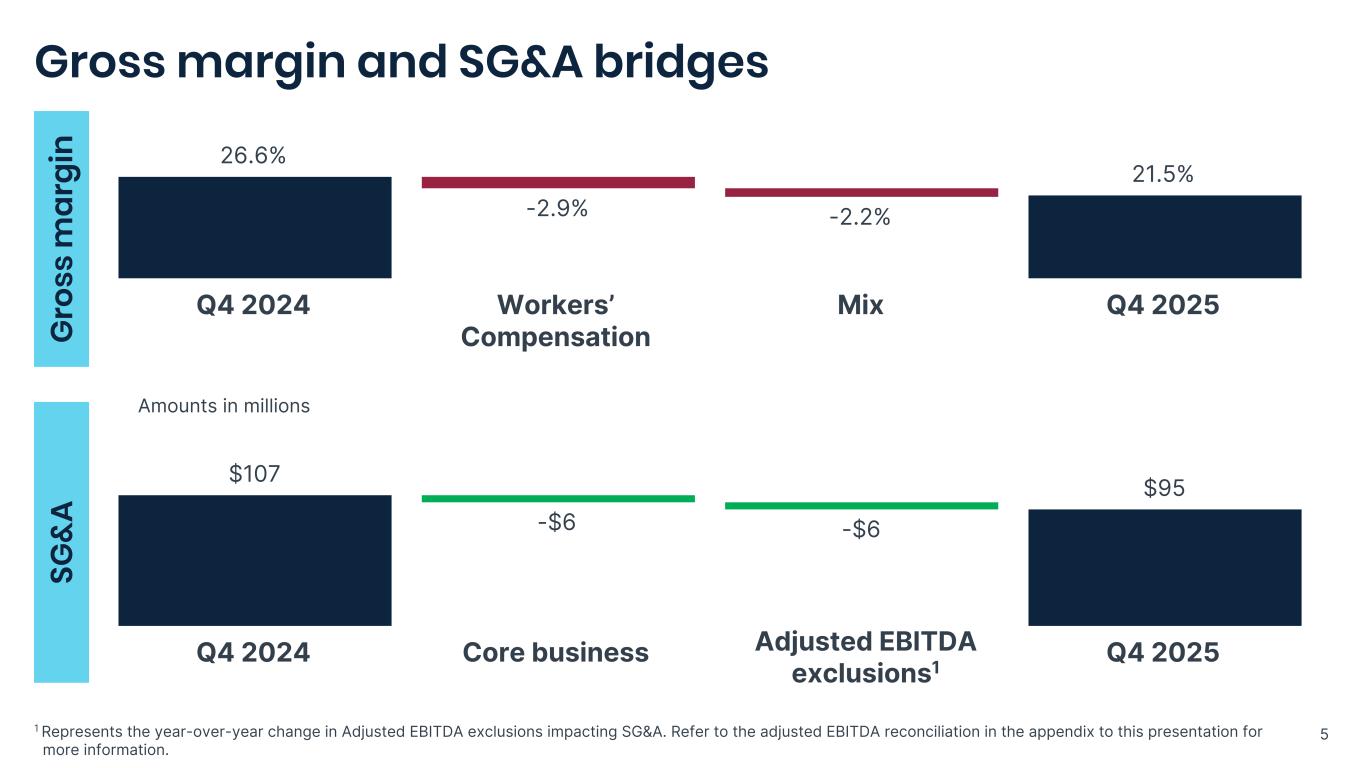
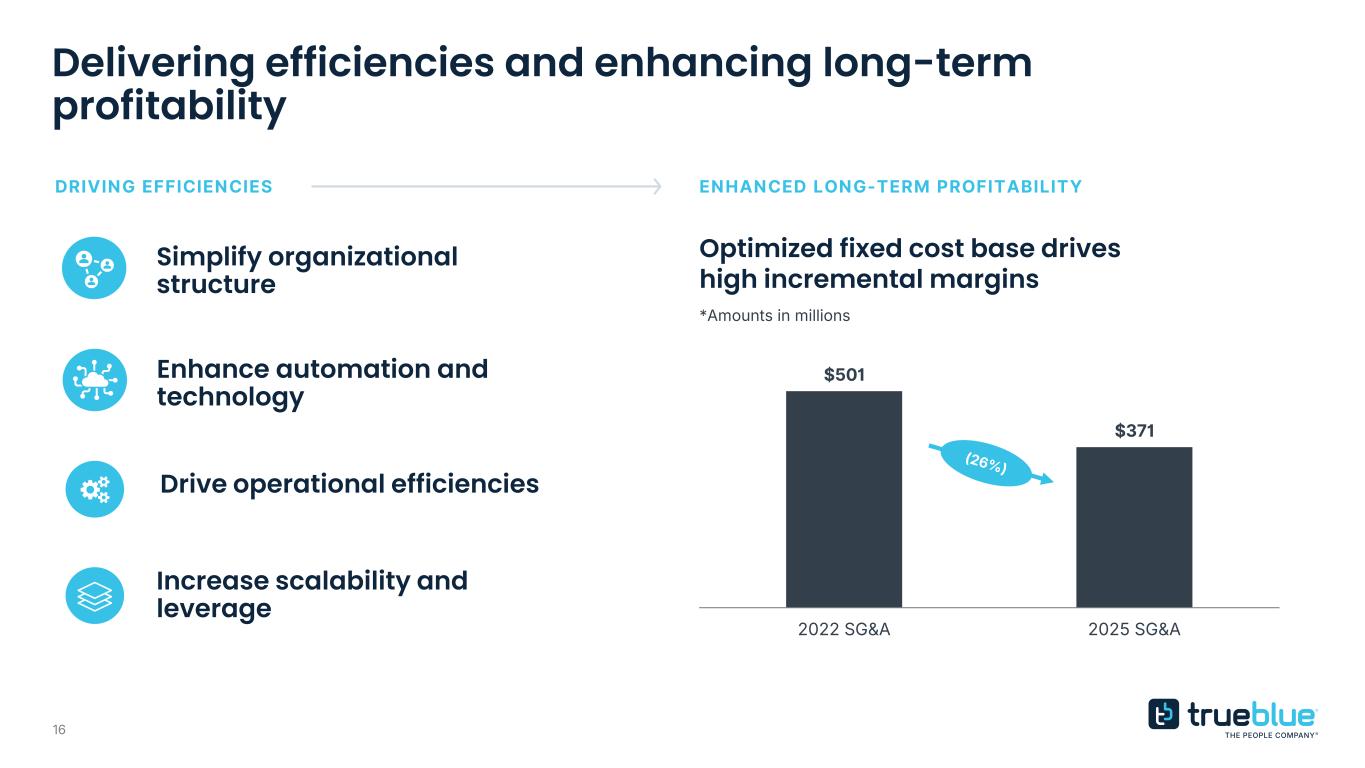
◦SG&A expense improved 11 percent to $95 million compared to $107 million in the prior year period
◦Adjusted EBITDA1 of $2 million compared to $9 million in the prior year period
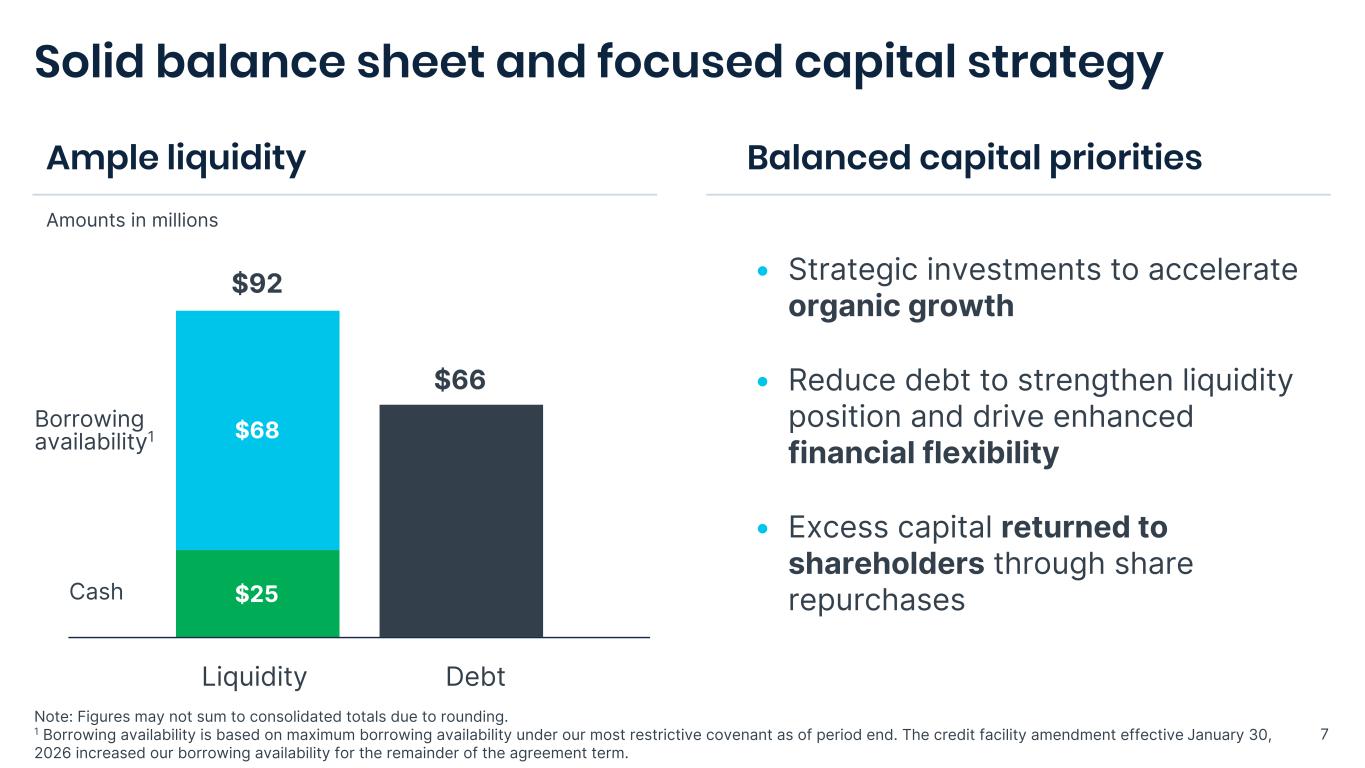
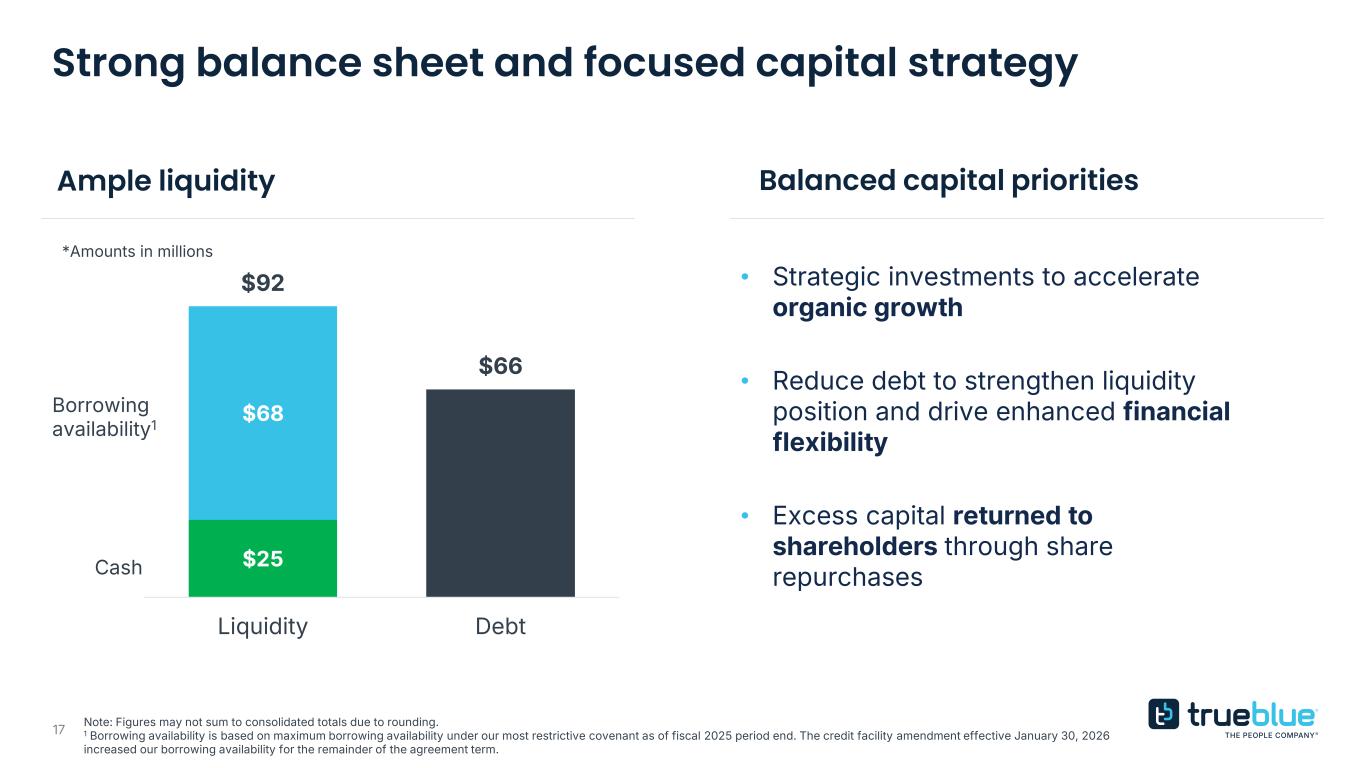
•Cash of $25 million, debt of $66 million and $68 million of borrowing availability, for total liquidity of $92 million at period end
◦Reduced debt by $2 million and increased working capital by $2 million during the quarter.
◦Credit facility amendment effective January 30, 2026 increased our borrowing availability for the remainder of the agreement term.
Commentary
“We delivered our second consecutive quarter of organic revenue growth driven by continued momentum in our skilled businesses and greater stability in broader demand trends,” said Taryn Owen, President and CEO of TrueBlue. “As we continue to drive top-line growth, we remain equally focused on further improving our profitability, lowering operating costs and building a more efficient, agile organization.”
Ms. Owen continued, “Throughout 2025, we executed on our strategic priorities with discipline and focus, building a strong foundation for sustainable, profitable growth. We are executing a clear strategy to improve margins and drive consistent revenue growth, underscoring our commitment to generate long-term, sustainable value for all TrueBlue shareholders.”
Results
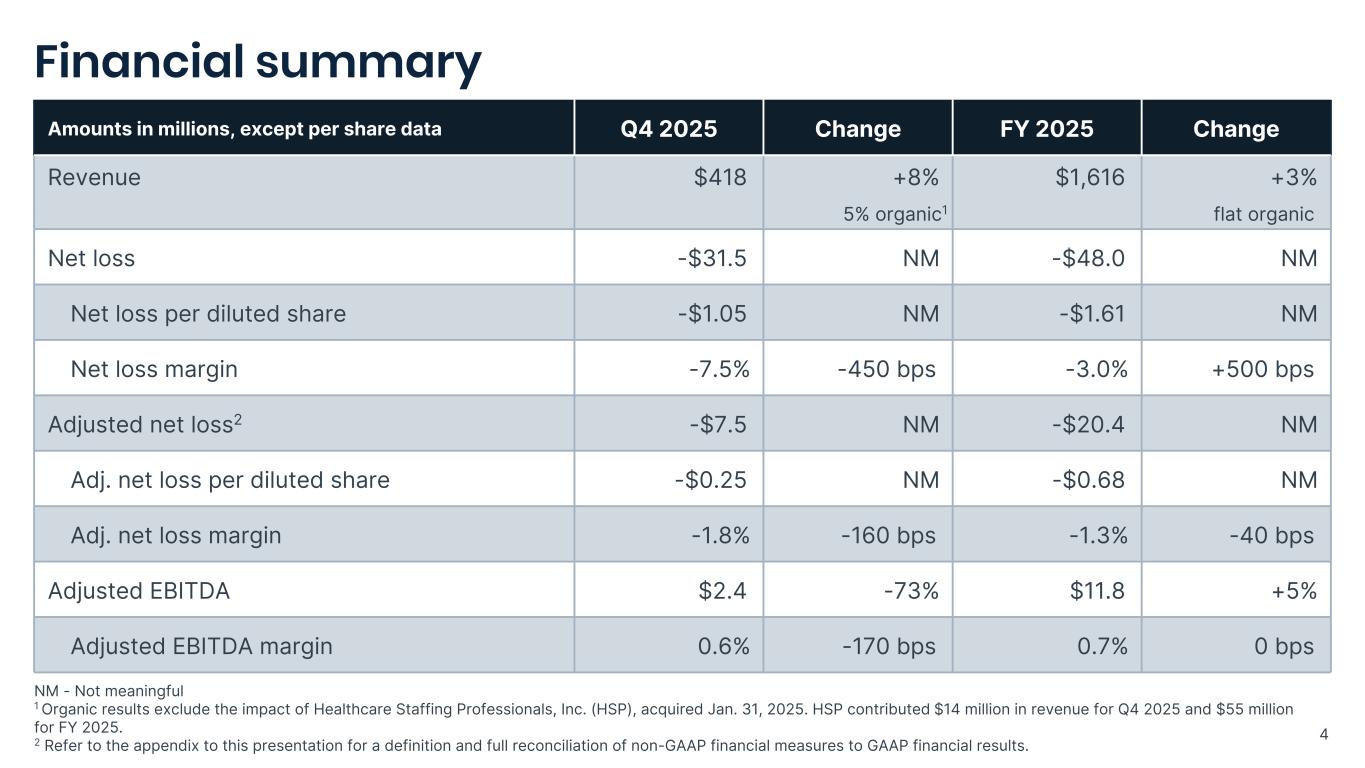
Fourth quarter revenue was $418 million, an 8 percent increase compared to the prior year period. Net loss per diluted share was $1.05 compared to net loss per diluted share of $0.40 in the prior year period. Adjusted net loss1 per diluted share was $0.25 compared to adjusted net loss per diluted share of $0.02 in the prior year period.
Full-year revenue was $1.6 billion, a 3 percent increase compared to the prior year period. Net loss per diluted share was $1.61 compared to net loss per diluted share of $4.17 in the prior year period. Adjusted net loss per diluted share was $0.68 compared to adjusted net loss per diluted share of $0.46 in the prior year period.
2026 Outlook
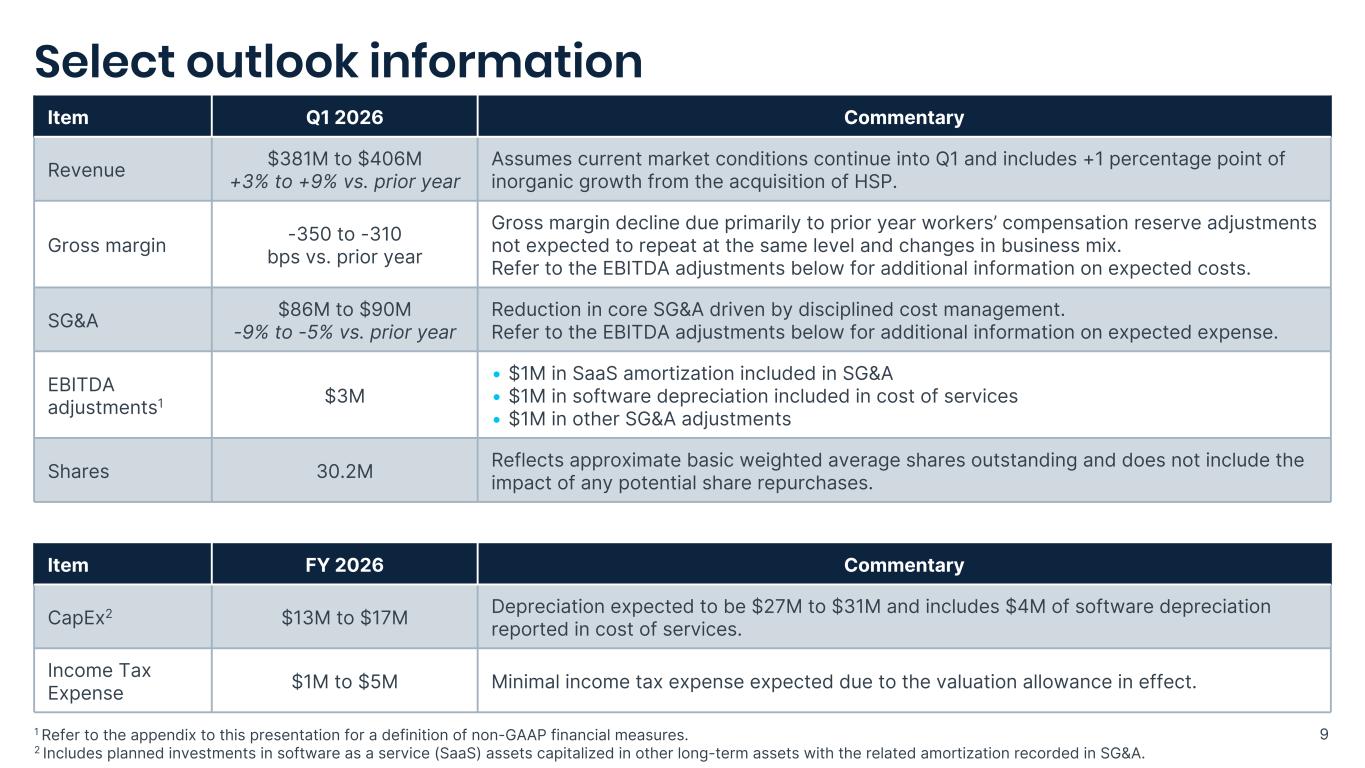
TrueBlue is providing certain forward-looking information to help investors form their estimates, which can be found in the quarterly earnings presentation filed today.
Management will discuss fourth quarter 2025 results on a webcast at 2:00 p.m. PT (5:00 p.m. ET), today, Wednesday, Feb. 18, 2025.
The quarterly earnings presentation and webcast can be accessed on the Investor Relations section of the TrueBlue website: investor.trueblue.com.
About TrueBlue
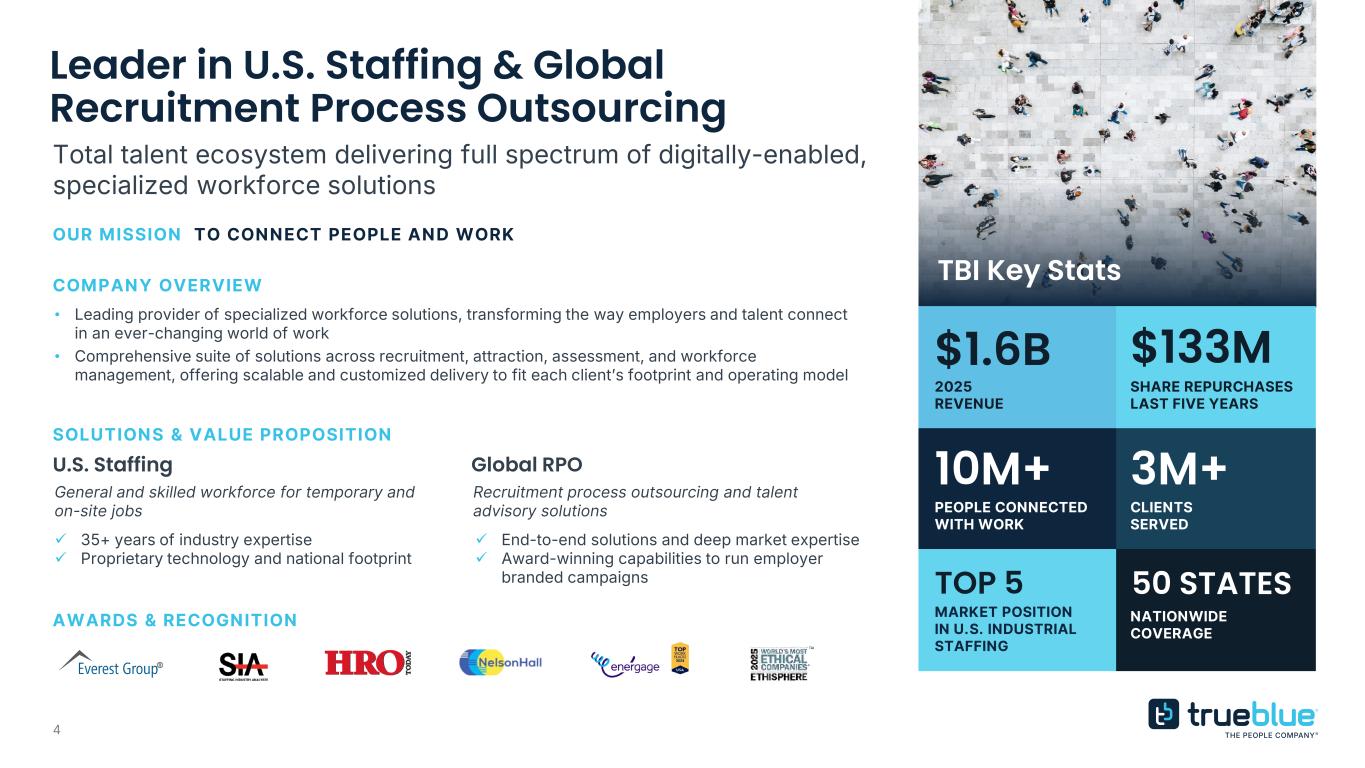
TrueBlue (NYSE: TBI) is a leading provider of specialized workforce solutions. As The People Company®, we put people first–advancing our mission to connect people and work while delivering smart, scalable solutions that help
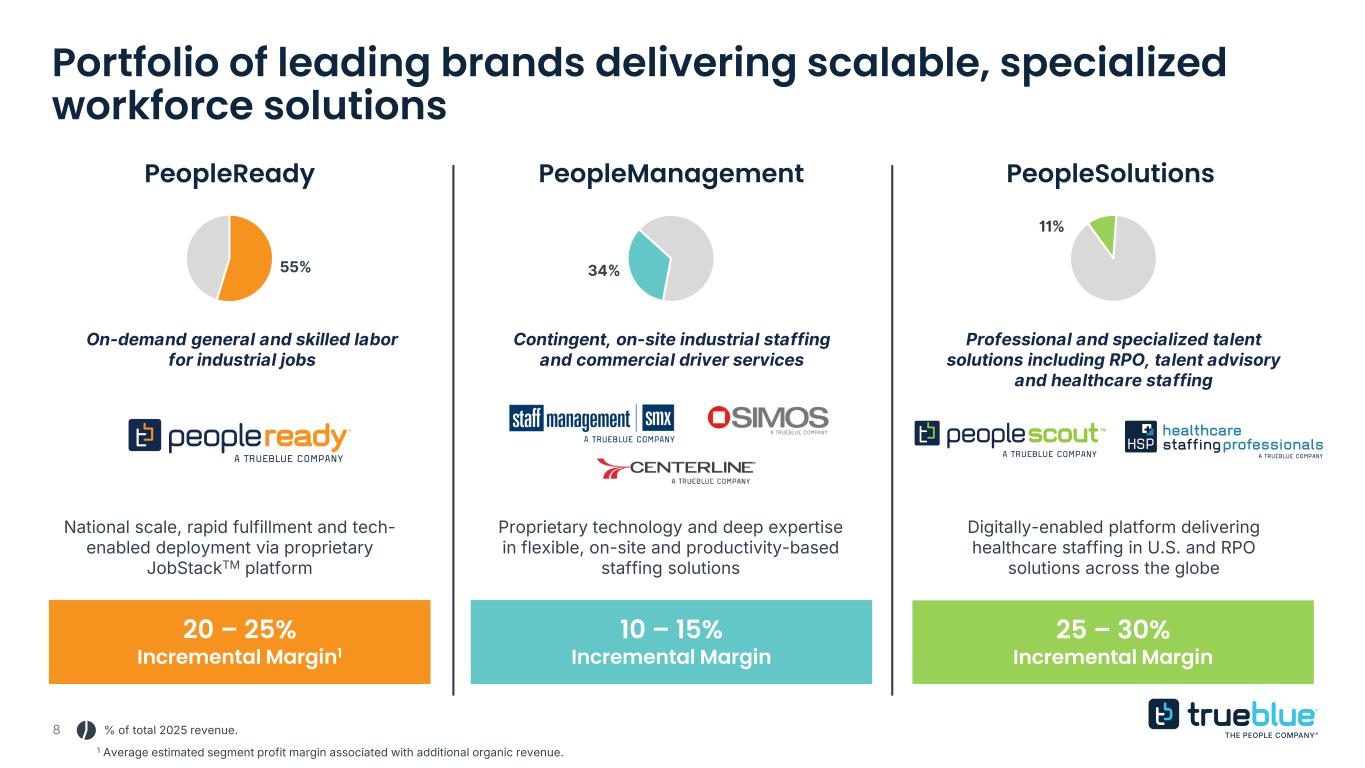
businesses grow and communities thrive. Since our founding, TrueBlue has connected more than 10 million people with work and served over 3 million clients across a variety of industries. Powered by proprietary, digitally enabled platforms and decades of expertise, our brands–PeopleReady, PeopleScout, Staff Management | SMX, Centerline, SIMOS, and Healthcare Staffing Professionals–provide a full spectrum of flexible staffing, workforce management, and recruitment solutions that bring precision, speed and scale to the changing world of work. Learn more at www.trueblue.com.
1 Refer to the financial statements accompanying this release for more information regarding non-GAAP terms.
Forward-looking statements and non-GAAP financial measures
This document contains forward-looking statements relating to our plans and expectations including, without limitation, statements regarding the future performance and operations of our business, expectations regarding stabilization in demand, and expected growth from our digital investments, all of which are subject to risks and uncertainties. Such statements are based on management’s expectations and assumptions as of the date of this release and involve many risks and uncertainties that could cause actual results to differ materially from those expressed or implied in our forward-looking statements including: (1) national and global economic conditions, which can be negatively impacted by factors such as rising interest rates, inflation, changes in government policies, political instability, epidemics and global trade uncertainty, (2) factors relating to any unsolicited offer (“Offer”) to purchase the shares of the Company, actions taken by the Company or its shareholders in respect to such an Offer, and the effects of such an Offer, or the completion or failure to complete an Offer, on the Company’s business, or other developments involving such an Offer; (3) actions of activist investors including costs and expenses incurred to address activism-related matters and the distraction of management from business operations in responding to those actions, including any proposals or a proxy context for the election of directors at our annual meeting of shareholders; (4) our ability to maintain profit margins, (5) our ability to attract and retain clients, (6) our ability to access sufficient capital to finance our operations, including our ability to comply with covenants contained in our revolving credit facility, (7) our ability to successfully execute on business strategies and further digitalize our business model, (8) our ability to attract sufficient qualified candidates and employees to meet the needs of our clients, (9) new laws, regulations, and government incentives that could affect our operations or financial results, (10) any reduction or change in tax credits we utilize, including the Work Opportunity Tax Credit, (11) our ability to successfully integrate acquired businesses, and (12) the timing and amount of common stock repurchases, if any, which will be determined at management’s discretion and depend upon several factors, including market and business conditions, the trading price of our common stock and the nature of other investment opportunities. Other information regarding factors that could affect our results is included in our Securities and Exchange Commission (SEC) filings, including the Company’s most recent reports on Forms 10-K and 10-Q, copies of which may be obtained by visiting our website at www.trueblue.com under the Investor Relations section or the SEC’s website at www.sec.gov. We assume no obligation to update or revise any forward-looking statement, whether as a result of new information, future events, or otherwise, except as required by law. Any other references to future financial estimates are included for informational purposes only and subject to risk factors discussed in our most recent filings with the SEC. Any comparisons made herein to other periods are based on a comparison to the same period in the prior year unless otherwise stated.
In addition, we use several non-GAAP financial measures when presenting our financial results in this document. Please refer to the reconciliations between our U.S. GAAP and non-GAAP financial measures in the appendix to this document and on our website at www.trueblue.com under the Investor Relations section for additional information on both current and historical periods. The presentation of these non-GAAP financial measures is used to enhance the understanding of certain aspects of our financial performance. It is not meant to be considered in isolation, superior to, or as a substitute for the directly comparable financial measures prepared in accordance with U.S. GAAP, and may not be comparable to similarly titled measures of other companies.
Contact
Investor Relations
TRUEBLUE, INC.
SUMMARY CONSOLIDATED STATEMENTS OF OPERATIONS
(Unaudited)
| | | | | | | | | | | | | | | | | | | | | | | |
| | | | | | | |
| 13 weeks ended | | 52 weeks ended |
| (in thousands, except per share data) | Dec 28, 2025 | | Dec 29, 2024 | | Dec 28, 2025 | | Dec 29, 2024 |
| Revenue from services | $ | 418,178 | | | $ | 385,953 | | | $ | 1,615,997 | | | $ | 1,567,393 | |
| Cost of services | 328,134 | | | 283,406 | | | 1,248,155 | | | 1,161,000 | |
| Gross profit | 90,044 | | | 102,547 | | | 367,842 | | | 406,393 | |
| Selling, general and administrative expense | 94,940 | | | 106,942 | | | 371,087 | | | 410,870 | |
| Depreciation and amortization | 6,162 | | | 6,008 | | | 24,823 | | | 28,624 | |
| Goodwill and intangible asset impairment charge | — | | | — | | | 200 | | | 59,674 | |
Right-of-use and other long-lived asset impairment charge | 18,366 | | | — | | | 18,366 | | | — | |
| Loss from operations | (29,424) | | | (10,403) | | | (46,634) | | | (92,775) | |
Interest and other income (expense), net | (1,034) | | | 390 | | | 1,003 | | | 4,251 | |
| Loss before tax expense | (30,458) | | | (10,013) | | | (45,631) | | | (88,524) | |
| Income tax expense | 1,078 | | | 1,692 | | | 2,329 | | | 37,224 | |
| Net loss | $ | (31,536) | | | $ | (11,705) | | | $ | (47,960) | | | $ | (125,748) | |
| | | | | | | |
| Net loss per common share: | | | | | | | |
| Basic | $ | (1.05) | | | $ | (0.40) | | | $ | (1.61) | | | $ | (4.17) | |
| Diluted | $ | (1.05) | | | $ | (0.40) | | | $ | (1.61) | | | $ | (4.17) | |
| | | | | | | |
| Weighted average shares outstanding: | | | | | | | |
| Basic | 29,945 | | | 29,561 | | | 29,849 | | | 30,177 | |
| Diluted | 29,945 | | | 29,561 | | | 29,849 | | | 30,177 | |
TRUEBLUE, INC.
SUMMARY CONSOLIDATED BALANCE SHEETS
(Unaudited)
| | | | | | | | | | | |
| (in thousands) | Dec 28, 2025 | | Dec 29, 2024 |
| ASSETS | | | |
| Cash and cash equivalents | $ | 24,510 | | | $ | 22,536 | |
| Accounts receivable, net | 241,233 | | | 214,704 | |
| Other current assets | 31,866 | | | 39,853 | |
| Total current assets | 297,609 | | | 277,093 | |
| Property and equipment, net | 73,117 | | | 89,602 | |
Restricted cash, cash equivalents and investments | 136,588 | | | 179,916 | |
| Goodwill and intangible assets, net | 60,591 | | | 30,406 | |
| Other assets, net | 70,762 | | | 98,359 | |
| Total assets | $ | 638,667 | | | $ | 675,376 | |
| | | |
| LIABILITIES AND SHAREHOLDERS’ EQUITY | | | |
| Accounts payable and other accrued expenses | $ | 36,111 | | | $ | 45,599 | |
| Accrued wages and benefits | 61,736 | | | 61,380 | |
| Current portion of workers’ compensation claims reserve | 24,193 | | | 34,729 | |
| | | |
| Other current liabilities | 16,493 | | | 18,417 | |
| Total current liabilities | 138,533 | | | 160,125 | |
| Workers’ compensation claims reserve, less current portion | 72,551 | | | 105,063 | |
| Long-term debt, less current portion | 65,800 | | | 7,600 | |
| Other long-term liabilities | 87,226 | | | 87,229 | |
| Total liabilities | 364,110 | | | 360,017 | |
| Shareholders’ equity | 274,557 | | | 315,359 | |
| Total liabilities and shareholders’ equity | $ | 638,667 | | | $ | 675,376 | |
TRUEBLUE, INC.
CONSOLIDATED STATEMENTS OF CASH FLOWS
(Unaudited)
| | | | | | | | | | | |
| 52 weeks ended |
| (in thousands) | Dec 28, 2025 | | Dec 29, 2024 |
| Cash flows from operating activities: | | | |
| Net loss | $ | (47,960) | | | $ | (125,748) | |
Adjustments to reconcile net loss to net cash used in operating activities: | | | |
Depreciation and amortization (inclusive of depreciation included in cost of services) | 28,852 | | | 29,561 | |
| Goodwill and intangible asset impairment charge | 200 | | | 59,674 | |
Right-of-use and other long-lived asset impairment charge | 18,366 | | | — | |
| Provision for credit losses | 2,811 | | | 2,321 | |
| Stock-based compensation | 7,256 | | | 7,591 | |
| Deferred income taxes | (552) | | | 34,060 | |
| Non-cash lease expense | 11,013 | | | 12,402 | |
| Other operating activities | (5,038) | | | (5,137) | |
| Changes in operating assets and liabilities: | | | |
| Accounts receivable | (15,463) | | | 35,731 | |
| Income taxes receivable and payable | 4,094 | | | 3,196 | |
| | | |
| Other assets | 15,767 | | | 22,766 | |
| Accounts payable and other accrued expenses | (11,102) | | | (8,908) | |
| Accrued wages and benefits | (10,014) | | | (19,147) | |
| | | |
| Workers’ compensation claims reserve | (43,049) | | | (56,723) | |
| Operating lease liabilities | (11,651) | | | (12,324) | |
| Other liabilities | (1,572) | | | 3,627 | |
Net cash used in operating activities | (58,042) | | | (17,058) | |
| Cash flows from investing activities: | | | |
| Capital expenditures | (15,678) | | | (24,151) | |
| Acquisition of business, net of cash acquired | (30,149) | | | — | |
| Proceeds from business divestiture, net | 400 | | | 3,099 | |
| Payments for company-owned life insurance | (2) | | | (4,000) | |
| Proceeds from company-owned life insurance | 300 | | | — | |
| | | |
| | | |
| Purchases of restricted held-to-maturity investments | (10,877) | | | (11,242) | |
| Maturities of restricted held-to-maturity investments | 39,944 | | | 33,841 | |
| | | |
Net cash used in investing activities | (16,062) | | | (2,453) | |
| Cash flows from financing activities: | | | |
| Purchases and retirement of common stock | — | | | (21,293) | |
| Net proceeds from employee stock purchase plans | 454 | | | 738 | |
| Common stock repurchases for taxes upon vesting of restricted stock | (1,097) | | | (2,325) | |
| Net change in revolving credit facility | 58,200 | | | 7,600 | |
| | | |
| | | |
| Other | (414) | | | (1,807) | |
Net cash provided by (used in) financing activities | 57,143 | | | (17,087) | |
| | | |
| Effect of exchange rate changes on cash, cash equivalents and restricted cash and cash equivalents | (119) | | | (1,608) | |
| Net change in cash, cash equivalents, and restricted cash and cash equivalents | (17,080) | | | (38,206) | |
| Cash, cash equivalents and restricted cash and cash equivalents, beginning of period | 61,100 | | | 99,306 | |
| Cash, cash equivalents and restricted cash and cash equivalents, end of period | $ | 44,020 | | | $ | 61,100 | |
TRUEBLUE, INC.
SEGMENT DATA
(Unaudited)
| | | | | | | | | | | | | | | | | | | | | | | |
| | | | | | | |
| 13 weeks ended | | 52 weeks ended |
| (in thousands) | Dec 28, 2025 | | Dec 29, 2024 | | Dec 28, 2025 | | Dec 29, 2024 |
| Revenue from services: | | | | | | | |
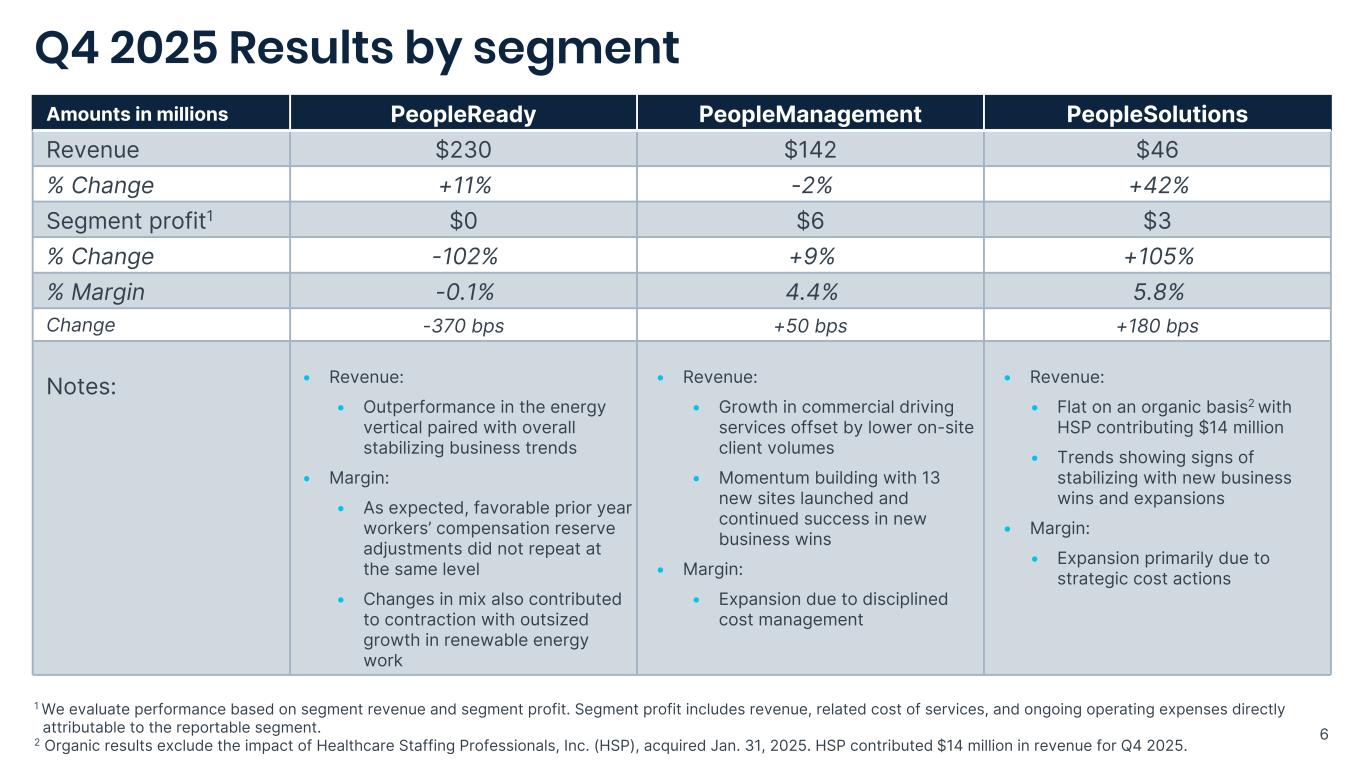
| PeopleReady | $ | 229,920 | | | $ | 207,687 | | | $ | 883,887 | | | $ | 868,549 | |
| PeopleManagement | 142,158 | | | 145,738 | | | 544,448 | | | 542,201 | |
PeopleSolutions (1) | 46,100 | | | 32,528 | | | 187,662 | | | 156,643 | |
| Total company | $ | 418,178 | | | $ | 385,953 | | | $ | 1,615,997 | | | $ | 1,567,393 | |
| | | | | | | |
Segment profit (loss) (2): | | | | | | | |
| PeopleReady | $ | (121) | | | $ | 7,404 | | | $ | 6,534 | | | $ | 5,783 | |
| PeopleManagement | 6,225 | | | 5,695 | | | 17,772 | | | 15,119 | |
PeopleSolutions | 2,661 | | | 1,301 | | | 11,332 | | | 12,152 | |
| Total segment profit | 8,765 | | | 14,400 | | | 35,638 | | | 33,054 | |
| Corporate unallocated expense | (6,376) | | | (5,501) | | | (23,884) | | | (21,887) | |
Total company Adjusted EBITDA (3) | 2,389 | | | 8,899 | | | 11,754 | | | 11,167 | |
Third-party processing fees for hiring tax credits (4) | (60) | | | (90) | | | (150) | | | (240) | |
Amortization of software as a service assets (5) | (1,202) | | | (1,752) | | | (4,394) | | | (6,162) | |
| Acquisition/integration costs | (27) | | | — | | | (932) | | | — | |
| Goodwill and intangible asset impairment charge | — | | | — | | | (200) | | | (59,674) | |
| Impairment charge on right-of-use and long-lived assets | (18,366) | | | — | | | (18,366) | | | — | |
| | | | | | | |
Workforce reduction costs (6) | (3,989) | | | (960) | | | (9,361) | | | (7,329) | |
PeopleReady technology upgrade costs (7) | — | | | (8,318) | | | — | | | (8,807) | |
COVID-19 government subsidies, net (8) | — | | | — | | | 8,573 | | | 9,652 | |
| | | | | | | |
| Other adjustments, net (9) | (974) | | | (1,237) | | | (4,706) | | | (1,821) | |
EBITDA (3) | (22,229) | | | (3,458) | | | (17,782) | | | (63,214) | |
| Depreciation and amortization (10) | (7,195) | | | (6,945) | | | (28,852) | | | (29,561) | |
Interest and other income (expense), net | (1,034) | | | 390 | | | 1,003 | | | 4,251 | |
| Loss before tax expense | (30,458) | | | (10,013) | | | (45,631) | | | (88,524) | |
| Income tax expense | (1,078) | | | (1,692) | | | (2,329) | | | (37,224) | |
| Net loss | $ | (31,536) | | | $ | (11,705) | | | $ | (47,960) | | | $ | (125,748) | |
(1)PeopleSolutions segment includes previously reported PeopleScout segment as well as Healthcare Staffing Professionals Inc. acquired on January 31, 2025.
(2)We evaluate performance based on segment revenue and segment profit (loss). Segment profit (loss) includes revenue, related cost of services, and ongoing operating expenses directly attributable to the reportable segment. Segment profit (loss) excludes depreciation and amortization expense, unallocated corporate general and administrative expense, interest expense, other income, income taxes, and other adjustments not considered to be ongoing.
(3)See the Non-GAAP Financial Measures table on the next page for definitions of EBITDA and Adjusted EBITDA.
(4)These third-party processing fees are associated with generating hiring tax credits.
(5)Amortization of software as a service assets is reported in selling, general and administrative expense.
(6)Workforce reduction costs were reported as $0.2 million in cost of services and $3.8 million in selling, general and administrative expense for the 13 weeks ended December 28, 2025 and $0.5 million in cost of services and $8.8 million in selling, general and administrative expense for the 52 weeks ended December 28, 2025. Workforce reduction costs were reported as $0.1 million in cost of services and $0.9 million in selling, general and administrative expense for the 13 weeks ended December 29, 2024 and $0.5 million in cost of services and $6.8 million in selling, general and administrative expense for the 52 weeks ended December 29, 2024.
(7)Costs associated with upgrading legacy PeopleReady technology.
(8)COVID-19 government subsidies net of related fees were reported as $3.2 million in cost of services and $5.4 million in selling, general and administrative expense for the 52 weeks ended December 28, 2025. For the 52 weeks ended December 29, 2024, COVID-19 government subsidies net of related fees were reported as $2.9 million in cost of services and $6.8 million in selling, general and administrative expense.
(9)Other adjustments for the 13 and 52 weeks ended December 28, 2025 include non-routine professional fees and other expenses. Other adjustments for the 13 and 52 weeks ended December 29, 2024 include lease exit costs and other expenses.
(10)Includes software depreciation reported in cost of services.
TRUEBLUE, INC.
NON-GAAP FINANCIAL MEASURES AND NON-GAAP RECONCILIATIONS
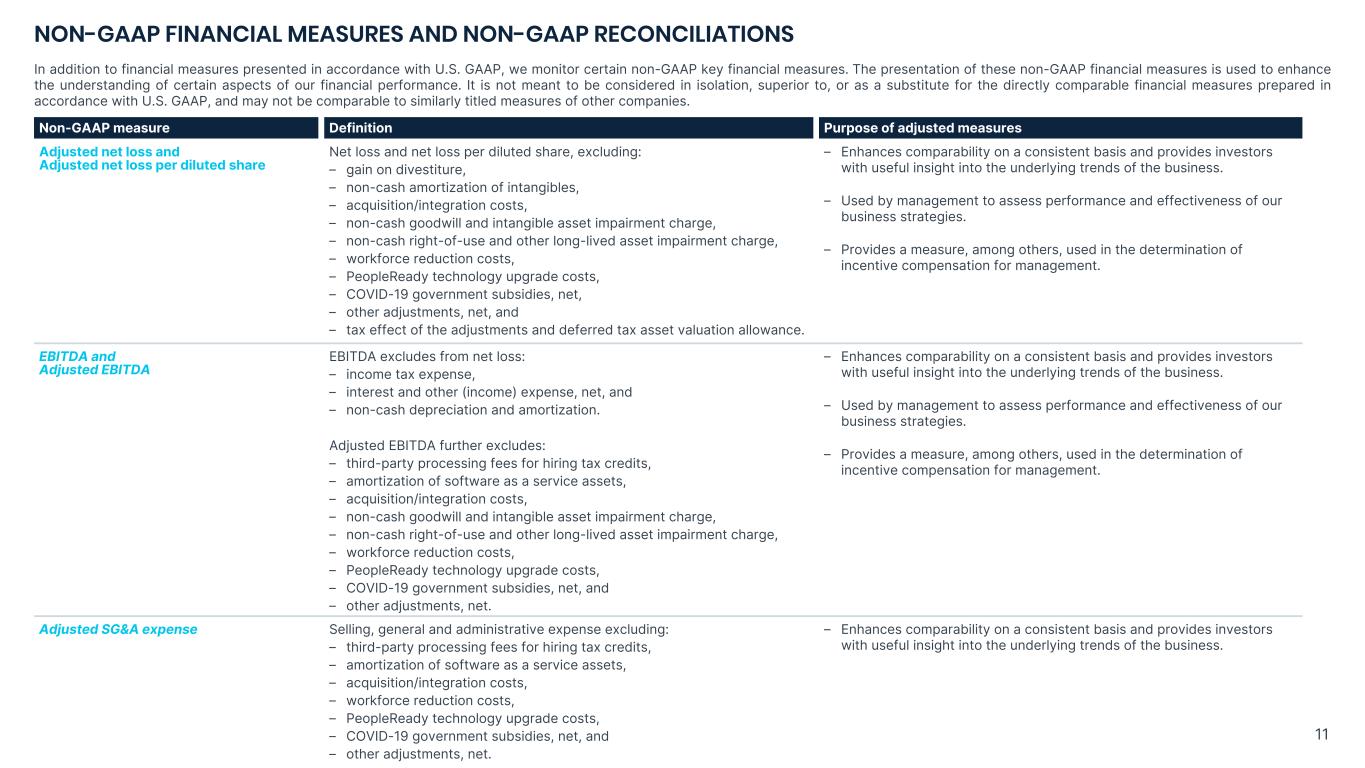
In addition to financial measures presented in accordance with U.S. GAAP, we monitor certain non-GAAP key financial measures. The presentation of these non-GAAP financial measures is used to enhance the understanding of certain aspects of our financial performance. It is not meant to be considered in isolation, superior to, or as a substitute for the directly comparable financial measures prepared in accordance with U.S. GAAP, and may not be comparable to similarly titled measures of other companies.
| | | | | | | | | | | | | | |
| Non-GAAP measure | | Definition | | Purpose of adjusted measures |
| | | | |
Adjusted net loss and
Adjusted net loss per diluted share | | Net loss and net loss per diluted share, excluding: –gain on divestiture, –non-cash amortization of intangibles, –acquisition/integration costs, –non-cash goodwill and intangible asset impairment charge, –non-cash right-of-use and other long-lived asset impairment charge, –workforce reduction costs, –PeopleReady technology upgrade costs, –COVID-19 government subsidies, net, –other adjustments, net, and –tax effect of the adjustments and deferred tax asset valuation allowance.
| | –Enhances comparability on a consistent basis and provides investors with useful insight into the underlying trends of the business. –Used by management to assess performance and effectiveness of our business strategies. –Provides a measure, among others, used in the determination of incentive compensation for management. |
EBITDA and
Adjusted EBITDA | | EBITDA excludes from net loss: –income tax expense, –interest and other (income) expense, net, and –non-cash depreciation and amortization.
Adjusted EBITDA further excludes: –third-party processing fees for hiring tax credits, –amortization of software as a service assets, –acquisition/integration costs, –non-cash goodwill and intangible asset impairment charge, –non-cash right-of-use and other long-lived asset impairment charge, –workforce reduction costs, –PeopleReady technology upgrade costs, –COVID-19 government subsidies, net, and –other adjustments, net. | | –Enhances comparability on a consistent basis and provides investors with useful insight into the underlying trends of the business. –Used by management to assess performance and effectiveness of our business strategies. –Provides a measure, among others, used in the determination of incentive compensation for management. |
| Adjusted SG&A expense | | Selling, general and administrative expense excluding: –third-party processing fees for hiring tax credits, –amortization of software as a service assets, –acquisition/integration costs, –workforce reduction costs, –PeopleReady technology upgrade costs, –COVID-19 government subsidies, net, and –other adjustments, net.
| | –Enhances comparability on a consistent basis and provides investors with useful insight into the underlying trends of the business. |
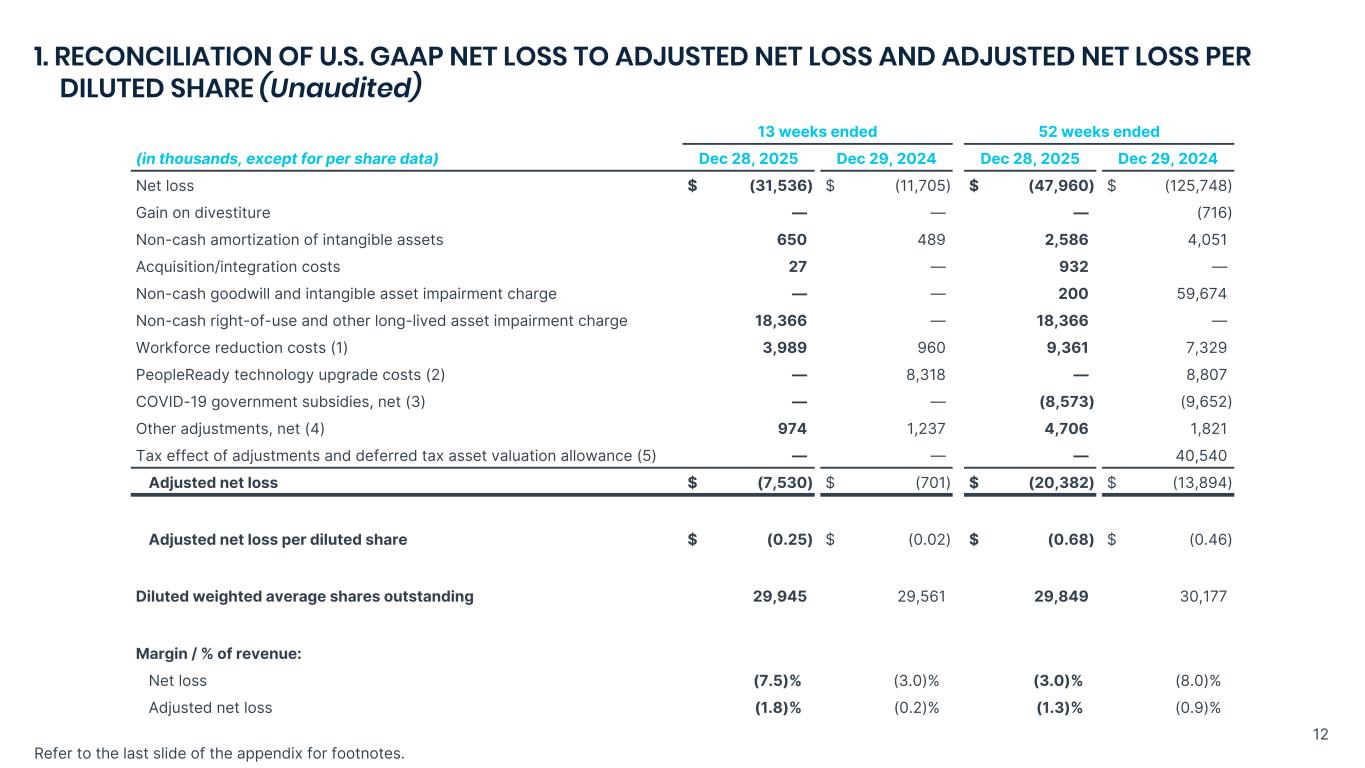
1.RECONCILIATION OF U.S. GAAP NET LOSS TO ADJUSTED NET LOSS AND ADJUSTED NET LOSS PER DILUTED SHARE
(Unaudited)
| | | | | | | | | | | | | | | | | | | | | | | |
| | | | | | | |
| 13 weeks ended | | 52 weeks ended |
| (in thousands, except for per share data) | Dec 28, 2025 | | Dec 29, 2024 | | Dec 28, 2025 | | Dec 29, 2024 |
| Net loss | $ | (31,536) | | | $ | (11,705) | | | $ | (47,960) | | | $ | (125,748) | |
Gain on divestiture | — | | | — | | | — | | | (716) | |
| Non-cash amortization of intangible assets | 650 | | | 489 | | | 2,586 | | | 4,051 | |
| | | | | | | |
| Acquisition/integration costs | 27 | | | — | | | 932 | | | — | |
| Non-cash goodwill and intangible asset impairment charge | — | | | — | | | 200 | | | 59,674 | |
Non-cash right-of-use and other long-lived asset impairment charge | 18,366 | | | — | | | 18,366 | | | — | |
| | | | | | | |
Workforce reduction costs (1) | 3,989 | | | 960 | | | 9,361 | | | 7,329 | |
PeopleReady technology upgrade costs (2) | — | | | 8,318 | | | — | | | 8,807 | |
COVID-19 government subsidies, net (3) | — | | | — | | | (8,573) | | | (9,652) | |
| | | | | | | |
| Other adjustments, net (4) | 974 | | | 1,237 | | | 4,706 | | | 1,821 | |
| Tax effect of adjustments and deferred tax asset valuation allowance (5) | — | | | — | | | — | | | 40,540 | |
| | | | | | | |
| Adjusted net loss | $ | (7,530) | | | $ | (701) | | | $ | (20,382) | | | $ | (13,894) | |
| | | | | | | |
| Adjusted net loss per diluted share | $ | (0.25) | | | $ | (0.02) | | | $ | (0.68) | | | $ | (0.46) | |
| | | | | | | |
| Diluted weighted average shares outstanding | 29,945 | | | 29,561 | | | 29,849 | | | 30,177 | |
| | | | | | | |
| Margin / % of revenue: | | | | | | | |
| Net loss | (7.5)% | | (3.0)% | | (3.0)% | | (8.0)% |
| Adjusted net loss | (1.8)% | | (0.2)% | | (1.3)% | | (0.9)% |
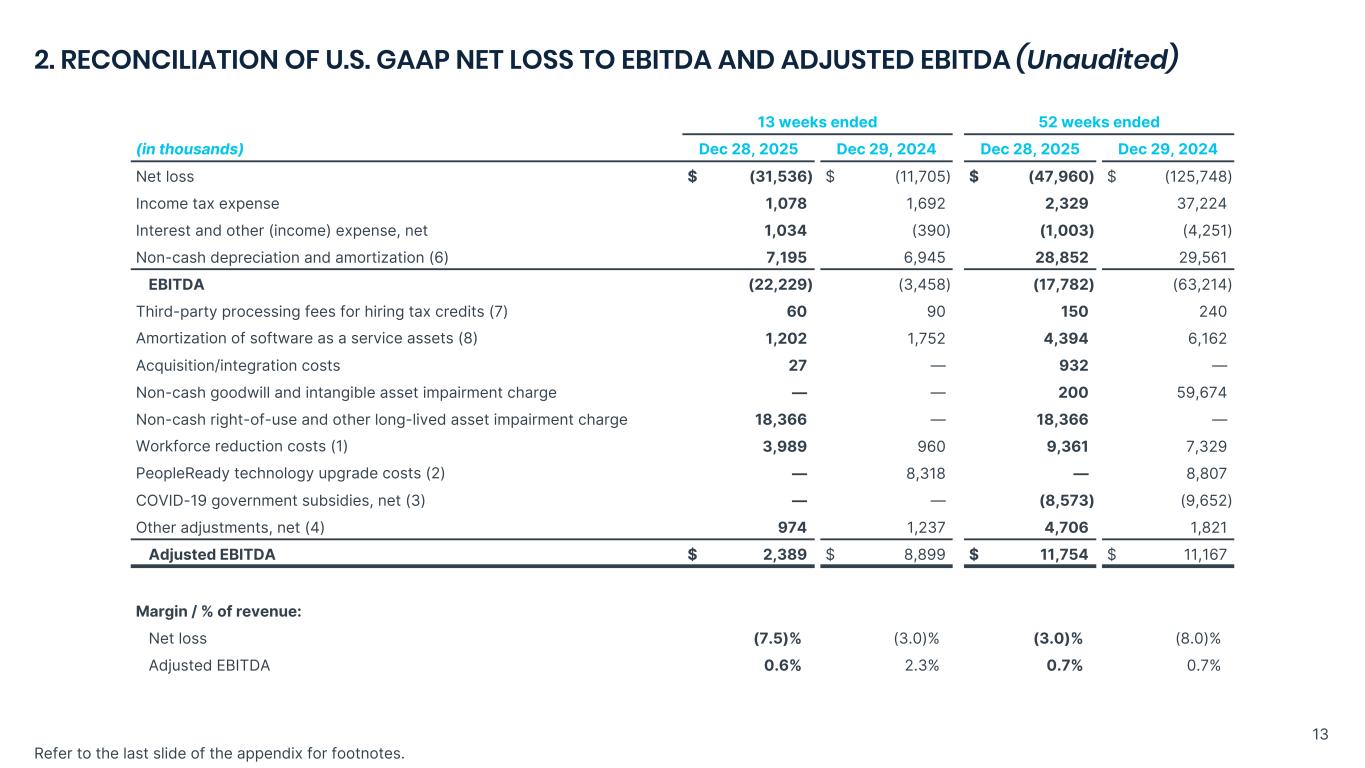
2.RECONCILIATION OF U.S. GAAP NET LOSS TO EBITDA AND ADJUSTED EBITDA
(Unaudited)
| | | | | | | | | | | | | | | | | | | | | | | |
| | | | | | | |
| 13 weeks ended | | 52 weeks ended |
| (in thousands) | Dec 28, 2025 | | Dec 29, 2024 | | Dec 28, 2025 | | Dec 29, 2024 |
| Net loss | $ | (31,536) | | | $ | (11,705) | | | $ | (47,960) | | | $ | (125,748) | |
| Income tax expense | 1,078 | | | 1,692 | | | 2,329 | | | 37,224 | |
Interest and other (income) expense, net | 1,034 | | | (390) | | | (1,003) | | | (4,251) | |
| Non-cash depreciation and amortization (6) | 7,195 | | | 6,945 | | | 28,852 | | | 29,561 | |
| EBITDA | (22,229) | | | (3,458) | | | (17,782) | | | (63,214) | |
| Third-party processing fees for hiring tax credits (7) | 60 | | | 90 | | | 150 | | | 240 | |
| Amortization of software as a service assets (8) | 1,202 | | | 1,752 | | | 4,394 | | | 6,162 | |
| Acquisition/integration costs | 27 | | | — | | | 932 | | | — | |
| Non-cash goodwill and intangible asset impairment charge | — | | | — | | | 200 | | | 59,674 | |
Non-cash right-of-use and other long-lived asset impairment charge | 18,366 | | | — | | | 18,366 | | | — | |
| | | | | | | |
Workforce reduction costs (1) | 3,989 | | | 960 | | | 9,361 | | | 7,329 | |
PeopleReady technology upgrade costs (2) | — | | | 8,318 | | | — | | | 8,807 | |
COVID-19 government subsidies, net (3) | — | | | — | | | (8,573) | | | (9,652) | |
| | | | | | | |
| Other adjustments, net (4) | 974 | | | 1,237 | | | 4,706 | | | 1,821 | |
| Adjusted EBITDA | $ | 2,389 | | | $ | 8,899 | | | $ | 11,754 | | | $ | 11,167 | |
| | | | | | | |
| Margin / % of revenue: | | | | | | | |
| Net loss | (7.5)% | | (3.0)% | | (3.0)% | | (8.0)% |
| Adjusted EBITDA | 0.6% | | 2.3% | | 0.7% | | 0.7% |
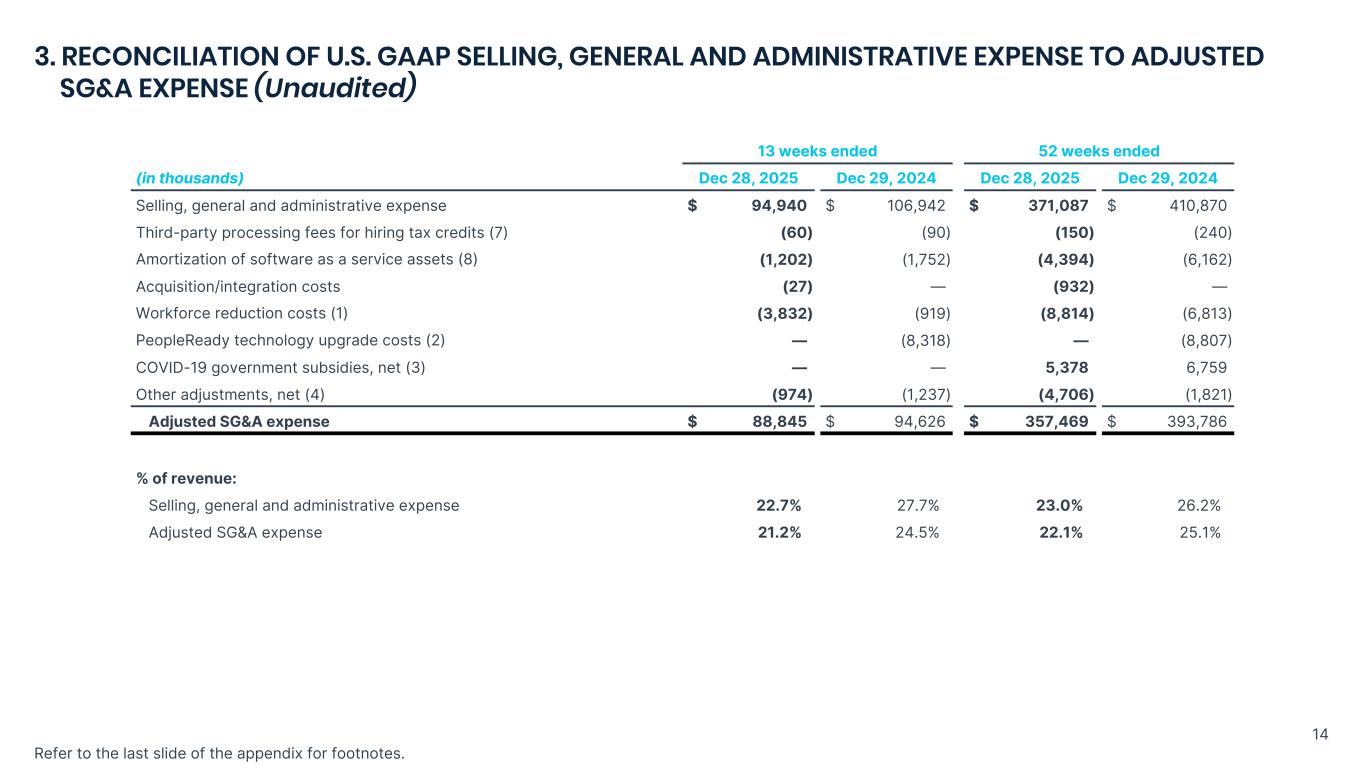
3.RECONCILIATION OF U.S. GAAP SELLING, GENERAL AND ADMINISTRATIVE EXPENSE TO ADJUSTED SG&A EXPENSE
(Unaudited)
| | | | | | | | | | | | | | | | | | | | | | | |
| | | | | | | |
| 13 weeks ended | | 52 weeks ended |
| (in thousands) | Dec 28, 2025 | | Dec 29, 2024 | | Dec 28, 2025 | | Dec 29, 2024 |
| Selling, general and administrative expense | $ | 94,940 | | | $ | 106,942 | | | $ | 371,087 | | | $ | 410,870 | |
| Third-party processing fees for hiring tax credits (7) | (60) | | | (90) | | | (150) | | | (240) | |
| Amortization of software as a service assets (8) | (1,202) | | | (1,752) | | | (4,394) | | | (6,162) | |
| Acquisition/integration costs | (27) | | | — | | | (932) | | | — | |
| | | | | | | |
Workforce reduction costs (1) | (3,832) | | | (919) | | | (8,814) | | | (6,813) | |
PeopleReady technology upgrade costs (2) | — | | | (8,318) | | | — | | | (8,807) | |
COVID-19 government subsidies, net (3) | — | | | — | | | 5,378 | | | 6,759 | |
| | | | | | | |
| Other adjustments, net (4) | (974) | | | (1,237) | | | (4,706) | | | (1,821) | |
| Adjusted SG&A expense | $ | 88,845 | | | $ | 94,626 | | | $ | 357,469 | | | $ | 393,786 | |
| | | | | | | |
| % of revenue: | | | | | | | |
| Selling, general and administrative expense | 22.7% | | 27.7% | | 23.0% | | 26.2% |
| Adjusted SG&A expense | 21.2% | | 24.5% | | 22.1% | | 25.1% |
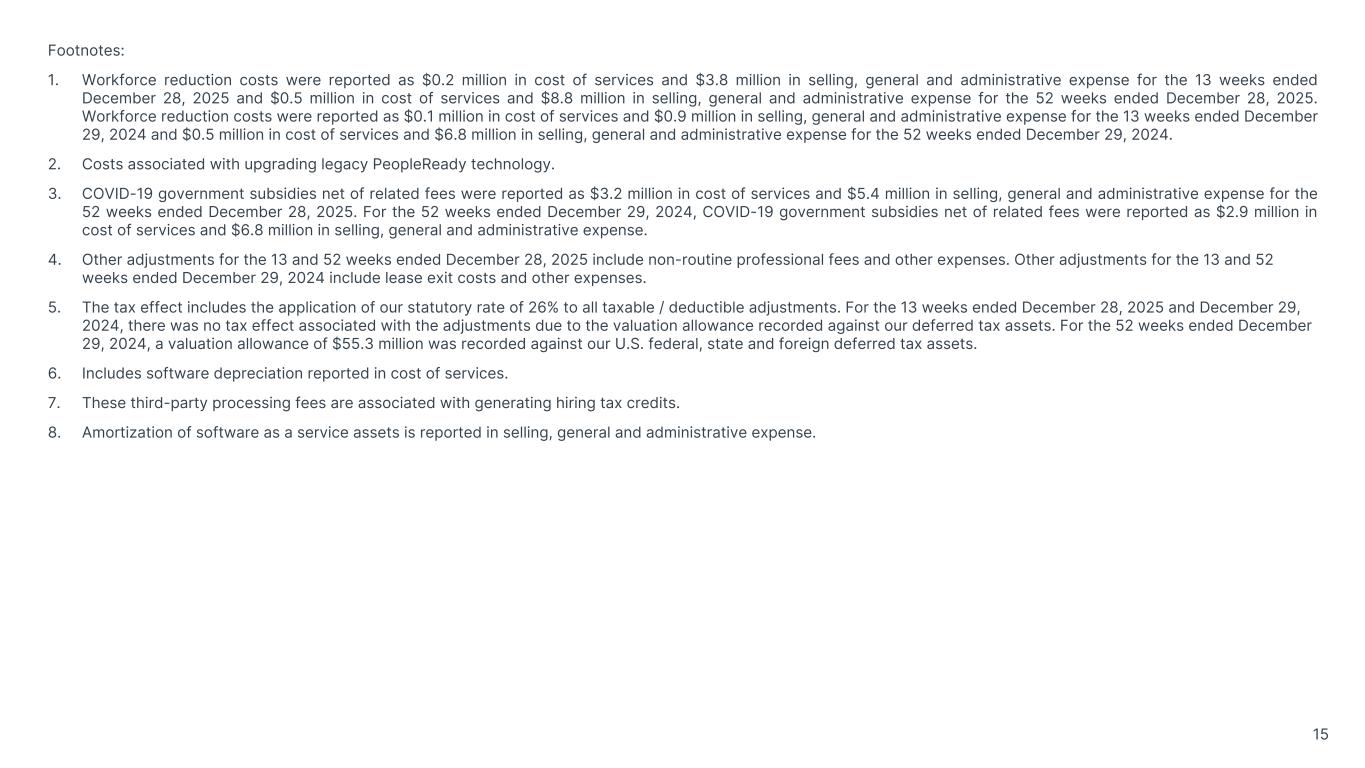
(1)Workforce reduction costs were reported as $0.2 million in cost of services and $3.8 million in selling, general and administrative expense for the 13 weeks ended December 28, 2025 and $0.5 million in cost of services and $8.8 million in selling, general and administrative expense for the 52 weeks ended December 28, 2025. Workforce reduction costs were reported as $0.1 million in cost of services and $0.9 million in selling, general and administrative expense for the 13 weeks ended December 29, 2024 and $0.5 million in cost of services and $6.8 million in selling, general and administrative expense for the 52 weeks ended December 29, 2024.
(2)Costs associated with upgrading legacy PeopleReady technology.
(3)COVID-19 government subsidies net of related fees were reported as $3.2 million in cost of services and $5.4 million in selling, general and administrative expense for the 52 weeks ended December 28, 2025. For the 52 weeks ended December 29, 2024, COVID-19 government subsidies net of related fees were reported as $2.9 million in cost of services and $6.8 million in selling, general and administrative expense.
(4)Other adjustments for the 13 and 52 weeks ended December 28, 2025 include non-routine professional fees and other expenses. Other adjustments for the 13 and 52 weeks ended December 29, 2024 include lease exit costs and other expenses.
(5)The tax effect includes the application of our statutory rate of 26% to all taxable / deductible adjustments. For the 13 weeks ended December 28, 2025 and December 29, 2024, there was no tax effect associated with the adjustments due to the valuation allowance recorded against our deferred tax assets. For the 52 weeks ended December 29, 2024, a valuation allowance of $55.3 million was recorded against our U.S. federal, state and foreign deferred tax assets.
(6)Includes software depreciation reported in cost of services.
(7)These third-party processing fees are associated with generating hiring tax credits.
(8)Amortization of software as a service assets is reported in selling, general and administrative expense.