TRUEBLUE REPORTS THIRD QUARTER 2020 RESULTS
Company returns to profitability
TACOMA, WASH. - Oct. 26, 2020 -- TrueBlue (NYSE:TBI) today announced its third quarter results for 2020.
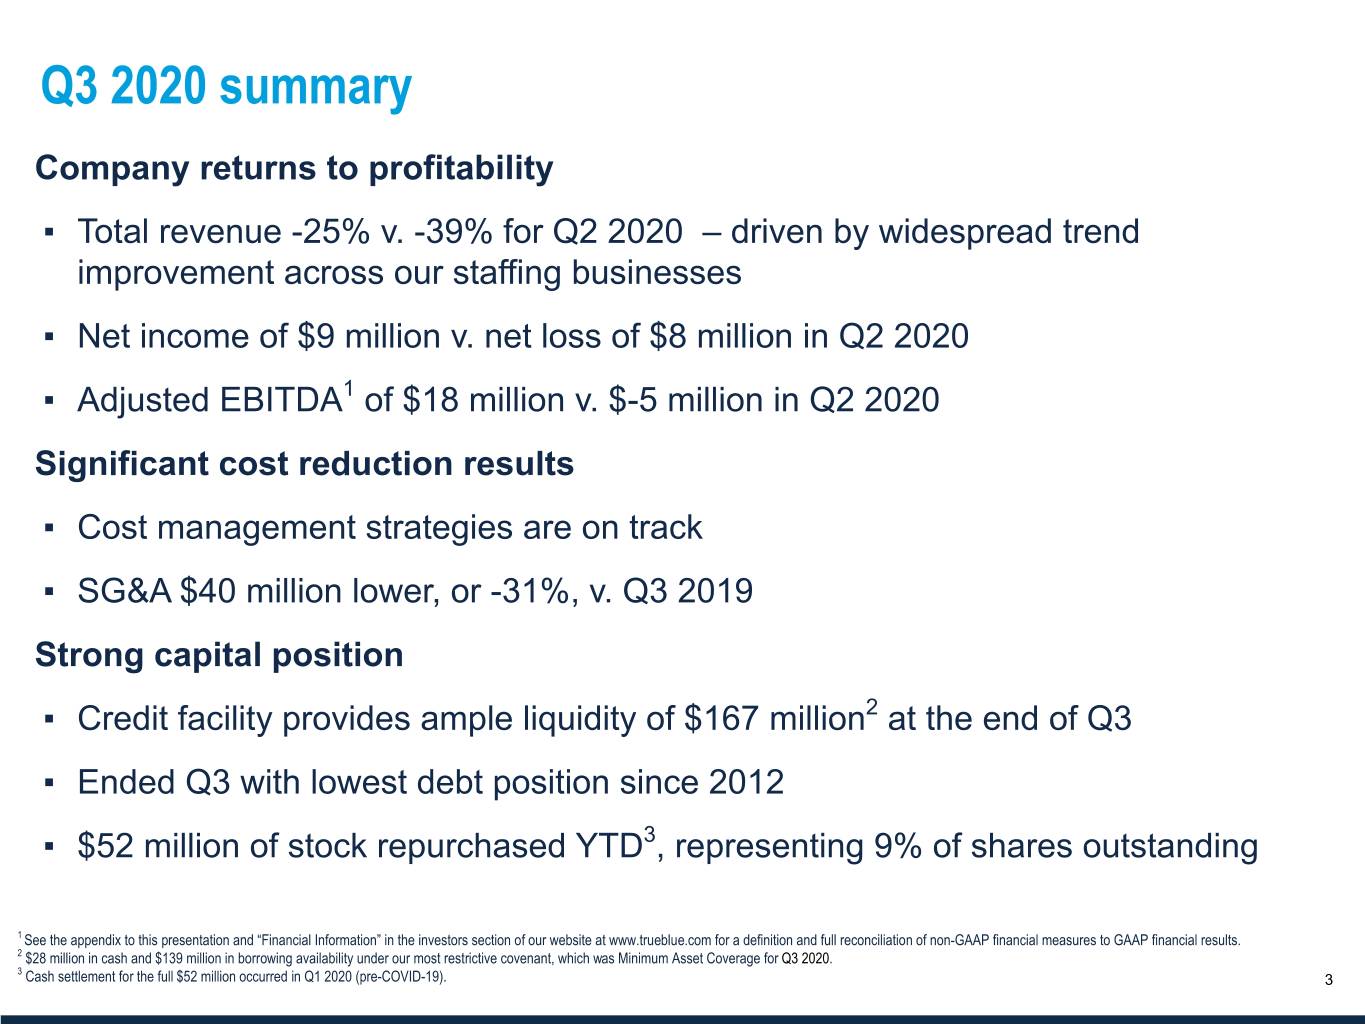
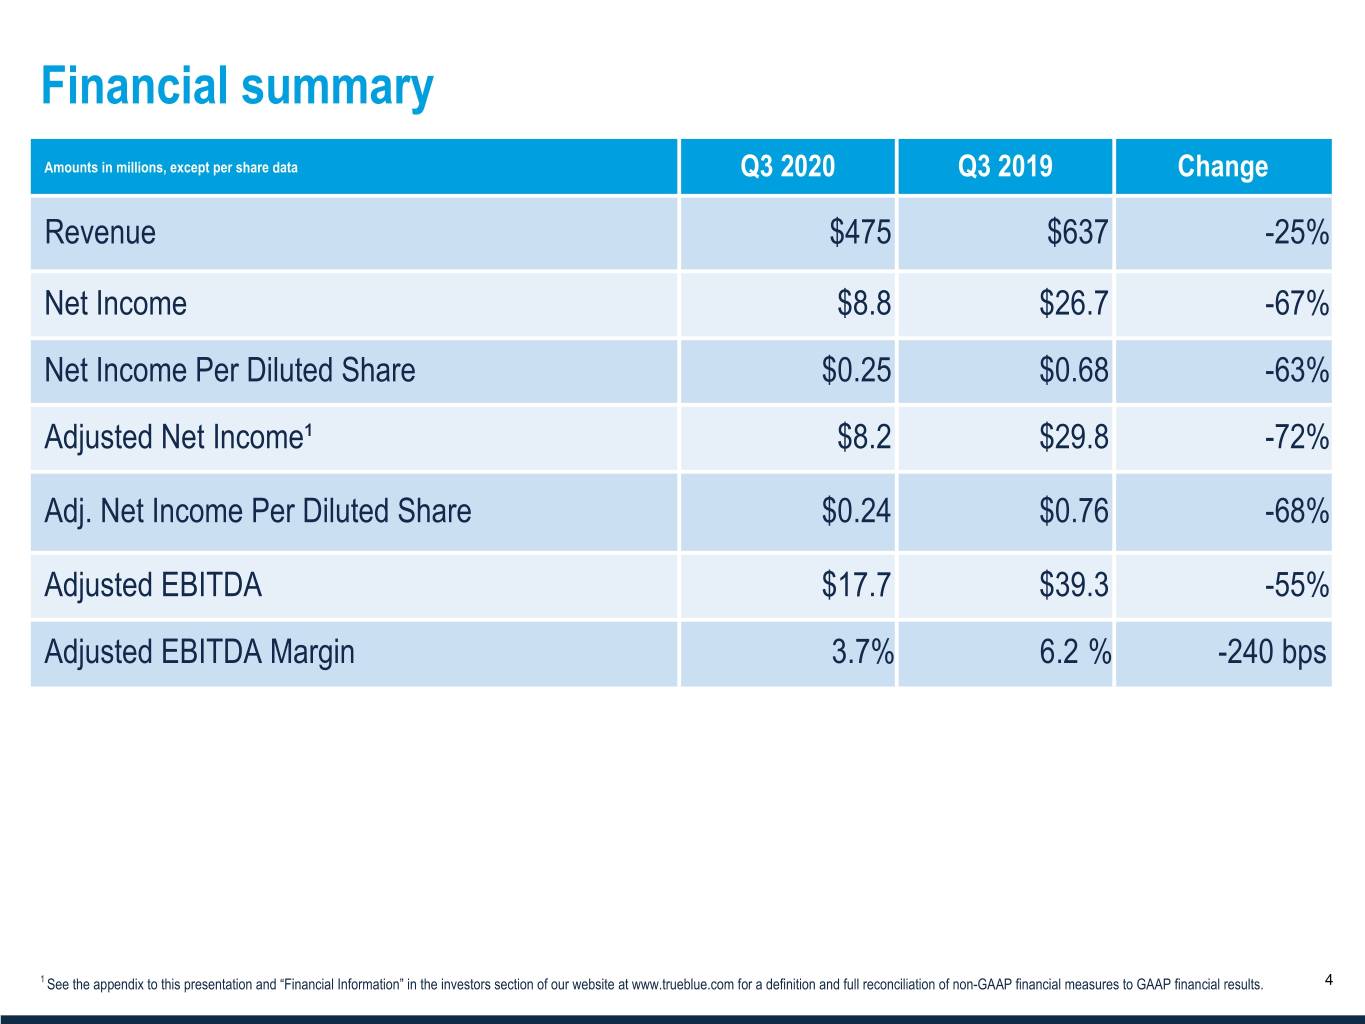
Third quarter revenue was $475 million, a decrease of 25 percent compared to revenue of $637 million in the third quarter of 2019. Third quarter net income per diluted share was $0.25 compared to a net loss per diluted share of $0.23 in the second quarter of 2020 and net income per diluted share of $0.68 in the third quarter of 2019. Third quarter adjusted net income1 per diluted share was $0.24 compared to an adjusted net loss per diluted share of $0.12 in the second quarter of 2020 and adjusted net income per diluted share of $0.76 in the third quarter of 2019.
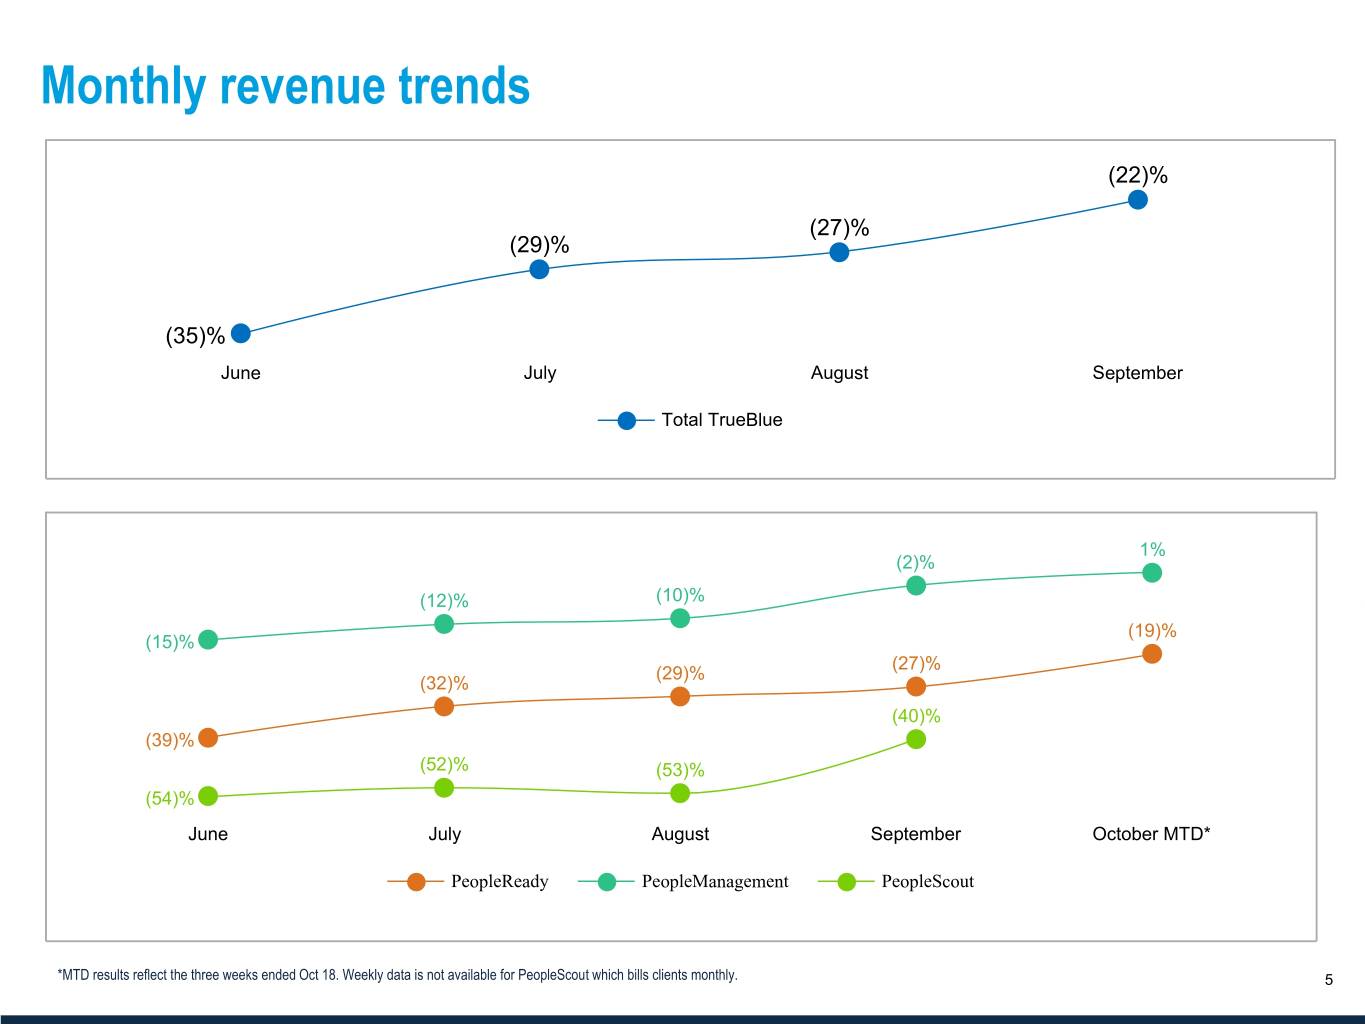
“We have taken the right actions to restore profitability and position the company for long-term growth as the economy recovers,” said Patrick Beharelle, CEO of TrueBlue. “During the third quarter we saw steady improvements in our revenue trends across most of the industries and geographies we serve. Our cost management actions continue to show meaningful results which helps position us for strong incremental profit margins when revenue growth returns.
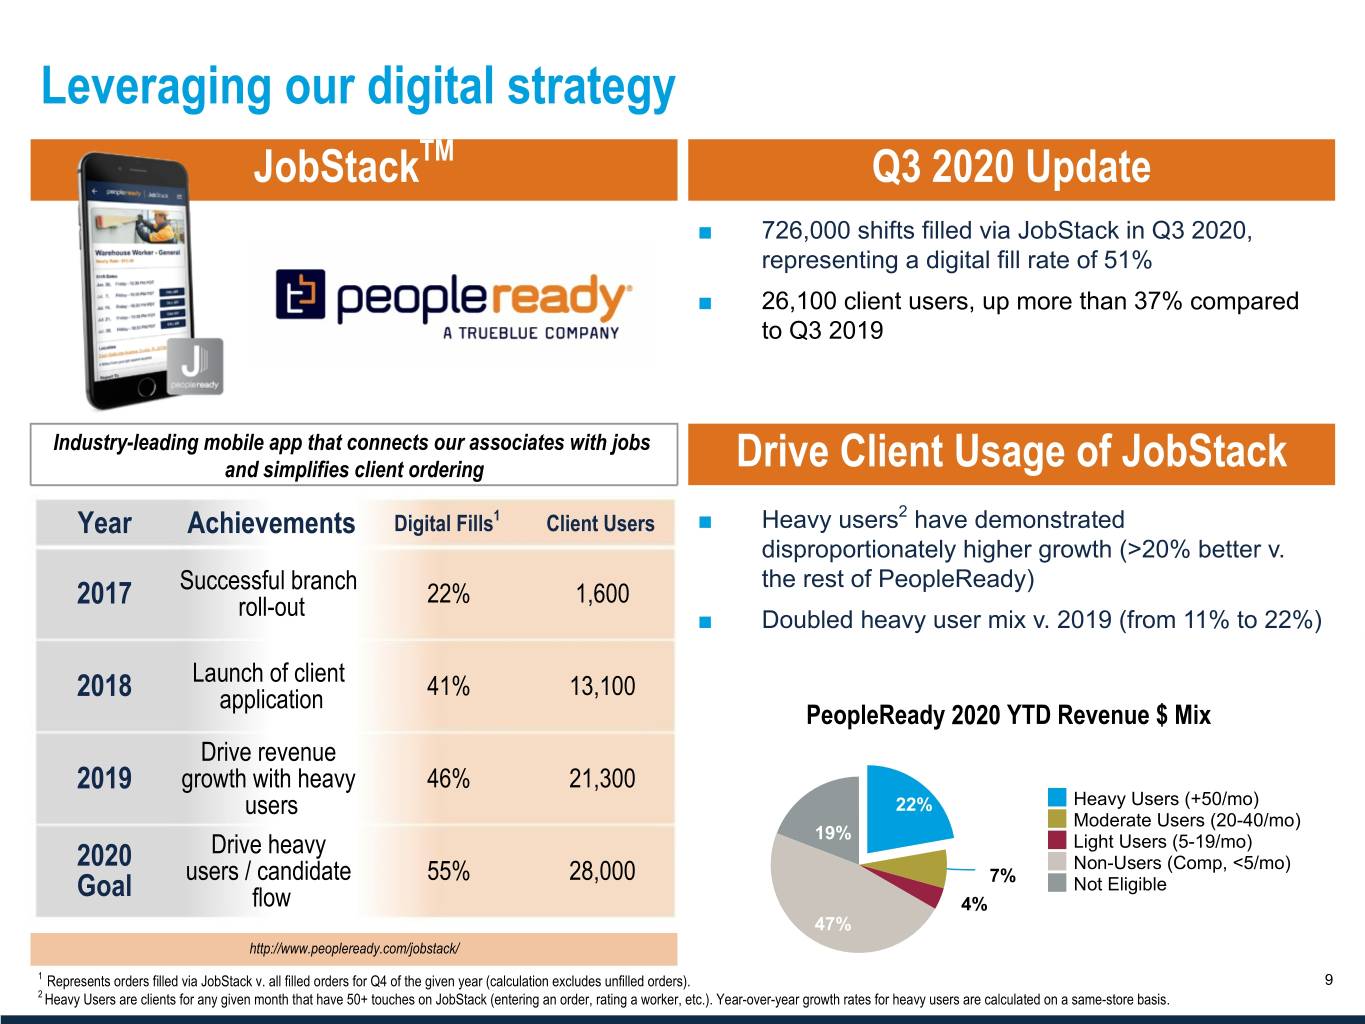
“We’re adding new features to PeopleReady’s JobStack app and refining our process to drive heavy user growth and applicant throughput,” Mr. Beharelle continued. “Looking ahead, we see an opportunity to leverage this technology to capture additional market share while reducing our service delivery costs.”
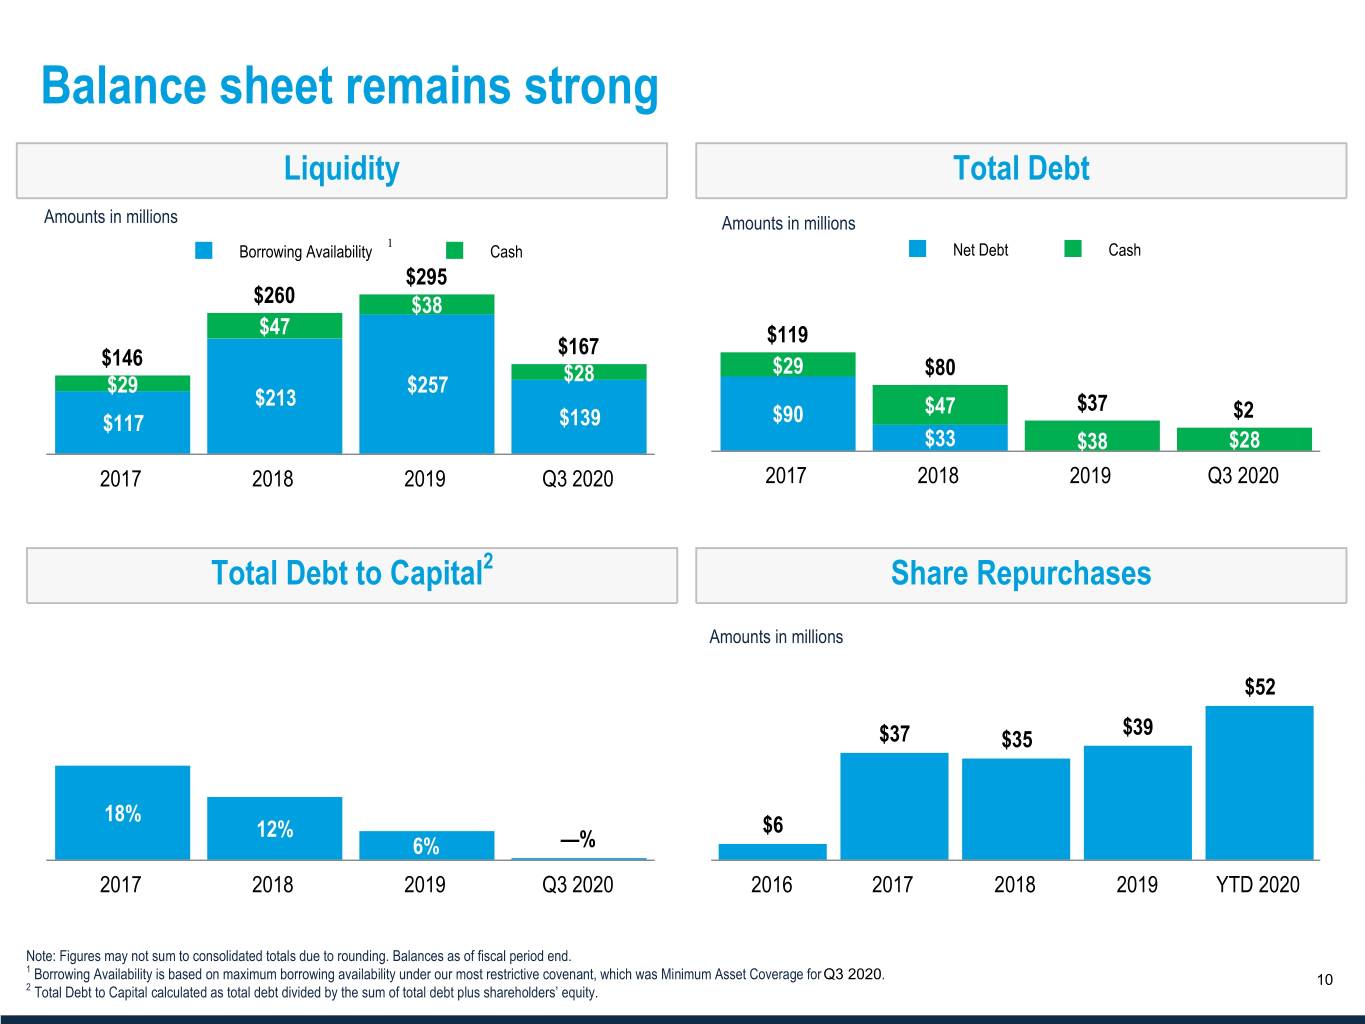
“Our balance sheet continues to shine, providing financial and operational flexibility,” said Derrek Gafford, CFO of TrueBlue. “Our credit facility provides ample liquidity, and our debt position is at its lowest level since 2012. We also repurchased 9% of our common stock earlier this year.”
2020 Outlook
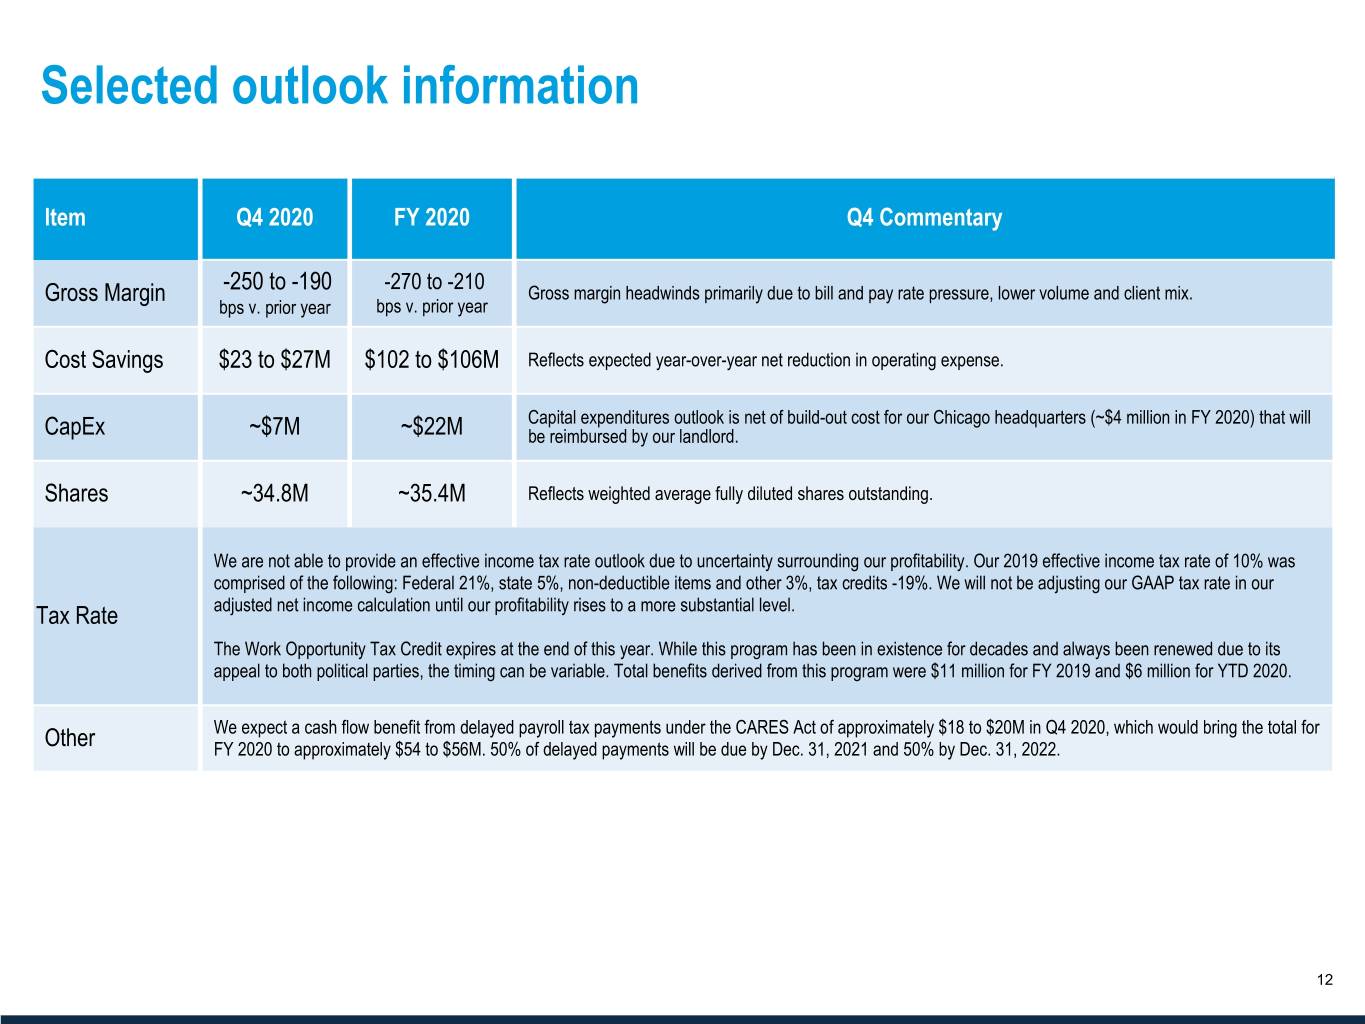
TrueBlue is providing certain forward-looking information to help investors form their own estimates, which can be found in the quarterly earnings presentation filed today.
Management will discuss third quarter 2020 results on a webcast at 2 p.m. PDT (5 p.m. EDT), today, Monday, Oct. 26, 2020. The webcast can be accessed on TrueBlue’s website: www.trueblue.com.
About TrueBlue
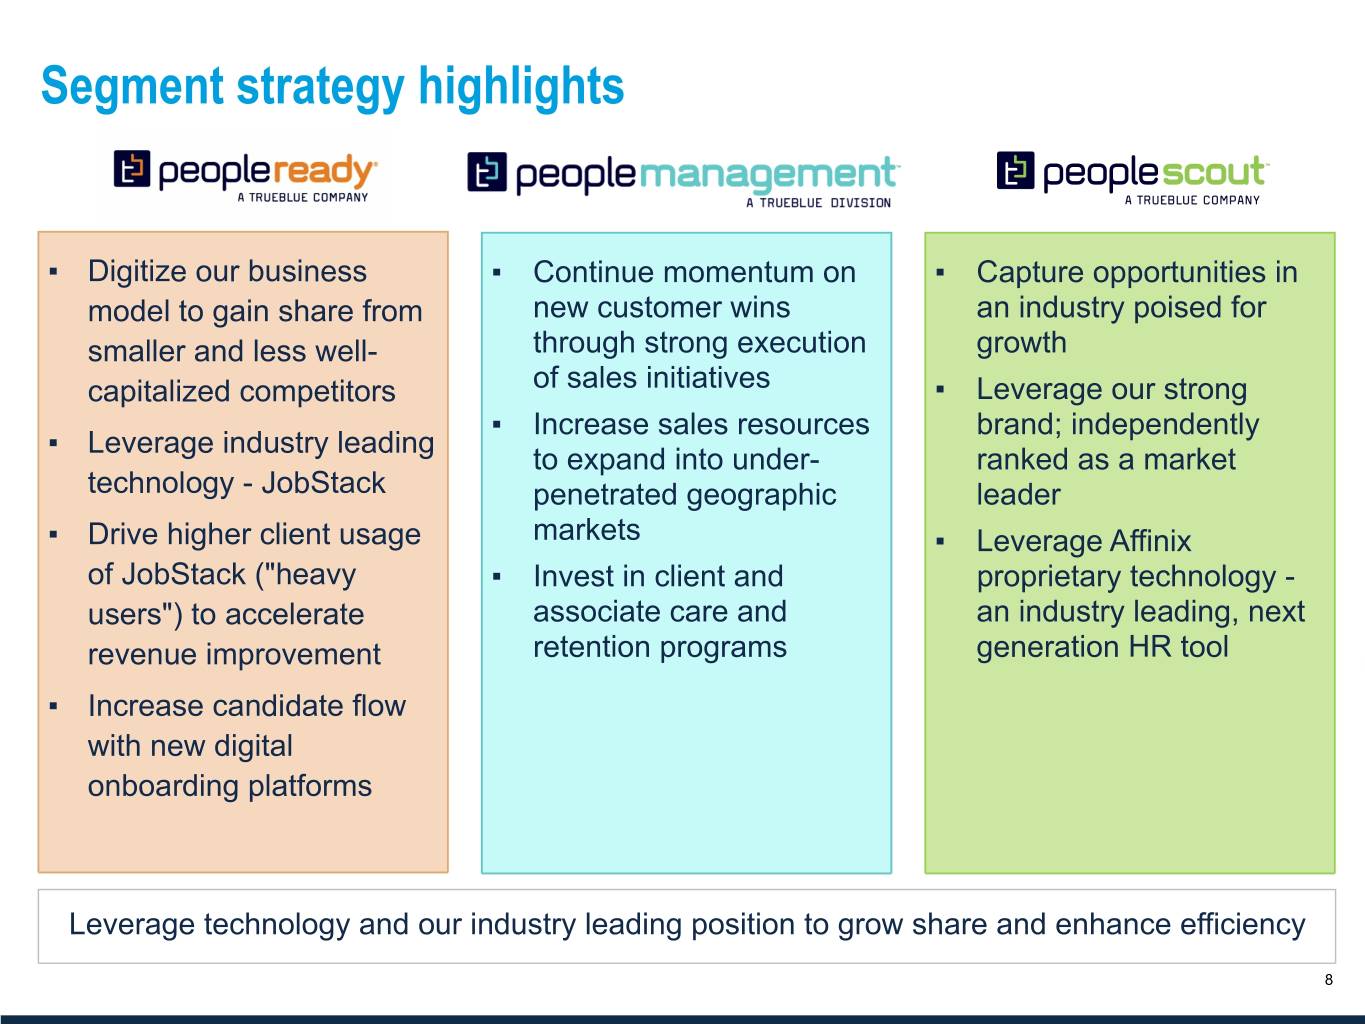
TrueBlue (NYSE: TBI) is a leading provider of specialized workforce solutions that help clients achieve business growth and improve productivity. In 2019, TrueBlue connected approximately 724,000 people with work. Its PeopleReady segment offers on-demand, industrial staffing, PeopleManagement offers contingent, on-site industrial staffing and commercial driver services, and PeopleScout offers recruitment process outsourcing (RPO) and managed service provider (MSP) solutions to a wide variety of industries. Learn more at www.trueblue.com.
1 See the financial statements accompanying the release and the company’s website for more information on non-GAAP terms.
Forward-looking statements
This document contains forward-looking statements relating to our plans and expectations, all of which are subject to risks and uncertainties. Such statements are based on management’s expectations and assumptions as of the date of this release and involve many risks and uncertainties that could cause actual results to differ materially from those expressed or implied in our forward-looking statements including: (1) national and global economic conditions, (2) the continued impact of COVID-19 and related economic impact and governmental response, (3) our ability to successfully reduce operating expenses and otherwise adapt to the changing economic environment caused by COVID–19, (4) our ability to access sufficient capital to finance our operations, including our ability to comply with or obtain waivers for covenants contained in our revolving credit facility, (5) our ability to attract and retain clients, (6) our ability to attract sufficient qualified candidates and employees to meet the needs of our clients, (7) our ability to maintain profit margins, (8) new laws and regulations that could affect our operations or financial results, (9) our ability to successfully execute on business strategies to further digitize our business model, and (10) any reduction or change in tax credits we utilize, including the Work Opportunity Tax Credit. Other information regarding factors that could affect our results is included in our Securities Exchange Commission (SEC) filings, including the company’s most recent reports on Forms 10-K and 10-Q, copies of which may be obtained by visiting our website at www.trueblue.com under the Investor Relations section or the SEC’s website at www.sec.gov. We assume no obligation to update or revise any forward-looking statement, whether as a result of new information, future events, or otherwise, except as required by law. Any other references to future financial estimates are included for informational purposes only and subject to risk factors discussed in our most recent filings with the SEC.
In addition, we use several non-GAAP financial measures when presenting our financial results in this document. Please refer to the reconciliations between our GAAP and non-GAAP financial measures in the appendix to this document and on our website at www.trueblue.com under the Investor Relations section for additional information on both current and historical periods. The presentation of these non-GAAP financial measures is used to enhance the understanding of certain aspects of our financial performance. It is not meant to be considered in isolation, superior to, or as a substitute for the directly comparable financial measures prepared in accordance with U.S. GAAP, and may not be comparable to similarly titled measures of other companies.
Contact:
Derrek Gafford, Executive Vice President and CFO
253-680-8214
TRUEBLUE, INC.
SUMMARY CONSOLIDATED STATEMENTS OF OPERATIONS
(Unaudited)
| | | | | | | | | | | | | | | | | | | | |
| | | | | | |
| 13 Weeks Ended | | | | 39 Weeks Ended | |
| (in thousands, except per share data) | Sep 27, 2020 | | Sep 29, 2019 | | Sep 27, 2020 | Sep 29, 2019 |
| Revenue from services | $ | 474,530 | | | $ | 636,793 | | | $ | 1,327,726 | | $ | 1,777,739 | |
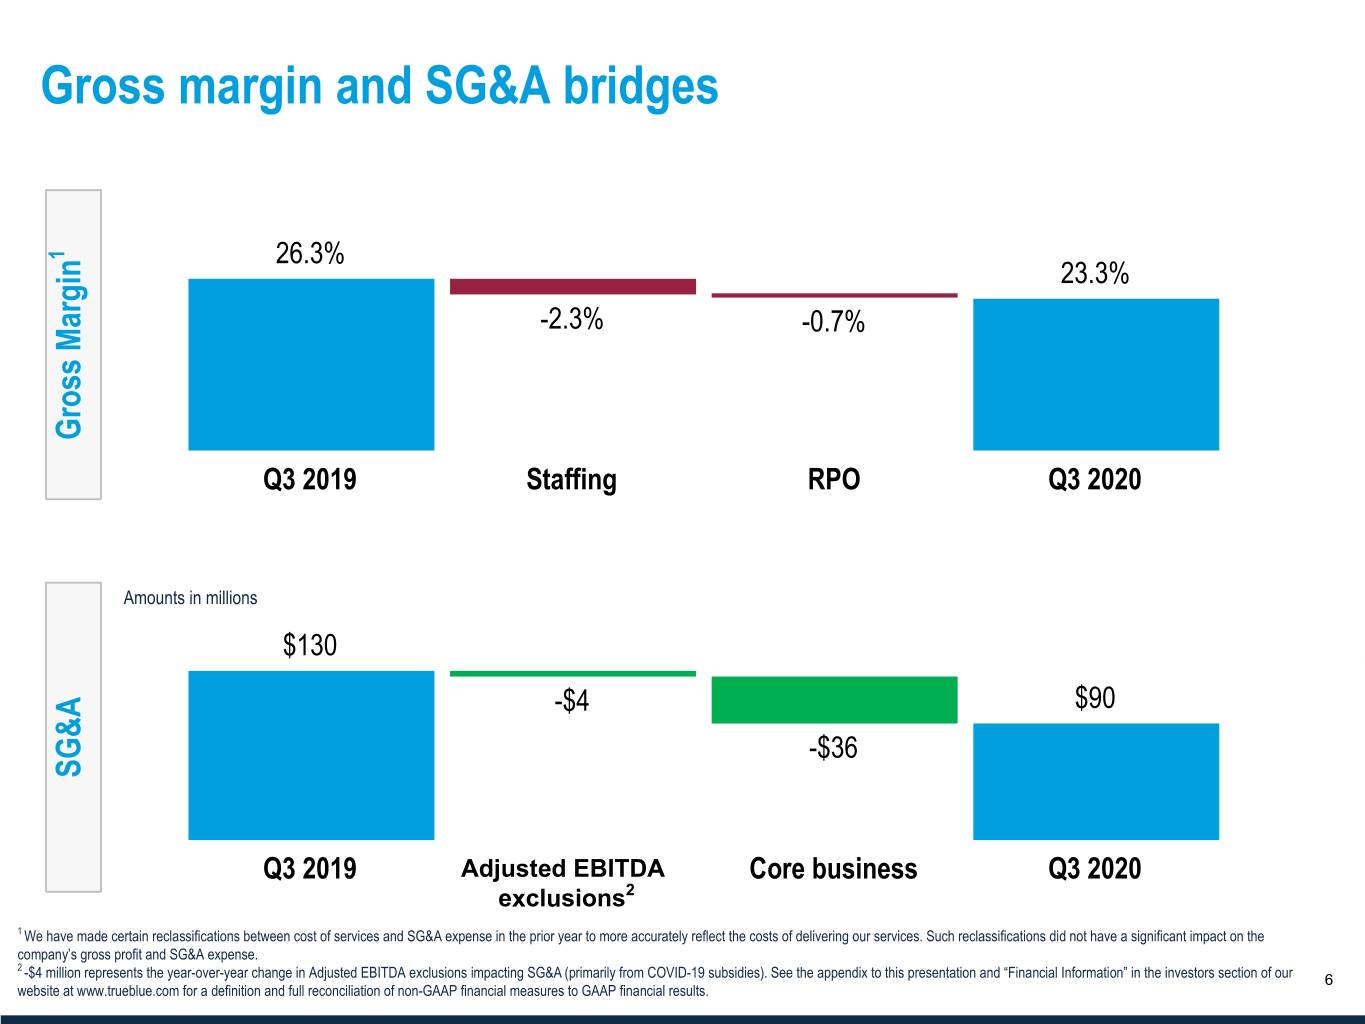
| Cost of services | 364,066 | | | 469,058 | | | 1,007,878 | | 1,306,626 | |
| Gross profit | 110,464 | | | 167,735 | | | 319,848 | | 471,113 | |
| Selling, general and administrative expense | 90,100 | | | 129,800 | | | 304,681 | | 383,745 | |
| Depreciation and amortization | 7,652 | | | 8,749 | | | 24,002 | | 28,528 | |
| Goodwill and intangible asset impairment charge | — | | | — | | | 175,189 | | — | |
| Income (loss) from operations | 12,712 | | | 29,186 | | | (184,024) | | 58,840 | |
| Interest and other income (expense), net | (174) | | | 471 | | | (323) | | 1,851 | |
| Income (loss) before tax expense (benefit) | 12,538 | | | 29,657 | | | (184,347) | | 60,691 | |
| Income tax expense (benefit) | 3,743 | | | 2,981 | | | (34,480) | | 6,333 | |
| Net income (loss) | $ | 8,795 | | | $ | 26,676 | | | $ | (149,867) | | $ | 54,358 | |
| | | | | | |
| Net income (loss) per common share: | | | | | | |
| Basic | $ | 0.25 | | | $ | 0.69 | | | $ | (4.20) | | $ | 1.39 | |
| Diluted | $ | 0.25 | | | $ | 0.68 | | | $ | (4.20) | | $ | 1.38 | |
| | | | | | |
| Weighted average shares outstanding: | | | | | | |
| Basic | 34,597 | | | 38,741 | | | 35,643 | | 39,090 | |
| Diluted | 34,904 | | | 39,213 | | | 35,643 | | 39,479 | |
TRUEBLUE, INC.
SUMMARY CONSOLIDATED BALANCE SHEETS
(Unaudited)
| | | | | | | | | | | |
| | | |
| (in thousands) | Sep 27, 2020 | | Dec 29, 2019 |
| ASSETS | | | |
| Cash and cash equivalents | $ | 28,233 | | | $ | 37,608 | |
| Accounts receivable, net | 279,812 | | | 342,303 | |
| Other current assets | 42,704 | | | 41,822 | |
| Total current assets | 350,749 | | | 421,733 | |
| Property and equipment, net | 66,994 | | | 66,150 | |
| Restricted cash and investments | 229,815 | | | 230,932 | |
| Goodwill and intangible assets, net | 124,916 | | | 311,171 | |
| Other assets, net | 135,724 | | | 106,169 | |
| Total assets | $ | 908,198 | | | $ | 1,136,155 | |
| | | |
| LIABILITIES AND SHAREHOLDERS’ EQUITY | | | |
| Current liabilities | $ | 202,427 | | | $ | 230,806 | |
| Long-term debt, less current portion | 1,500 | | | 37,100 | |
| Other long-term liabilities | 280,089 | | | 242,276 | |
| Total liabilities | 484,016 | | | 510,182 | |
| Shareholders’ equity | 424,182 | | | 625,973 | |
| Total liabilities and shareholders’ equity | $ | 908,198 | | | $ | 1,136,155 | |
TRUEBLUE, INC.
CONSOLIDATED STATEMENTS OF CASH FLOWS
(Unaudited)
| | | | | | | | | | | |
| | | |
| 39 Weeks Ended | | |
| (in thousands) | Sep 27, 2020 | | Sep 29, 2019 |
| Cash flows from operating activities: | | | |
| Net income (loss) | $ | (149,867) | | | $ | 54,358 | |
Adjustments to reconcile net income (loss) to net cash provided by operating activities: | | | |
| Depreciation and amortization | 24,002 | | | 28,528 | |
| Goodwill and intangible asset impairment charge | 175,189 | | | — | |
| Provision for doubtful accounts | 6,582 | | | 5,997 | |
| Stock-based compensation | 6,762 | | | 8,119 | |
| Deferred income taxes | (25,955) | | | 1,058 | |
| Non-cash lease expense | 11,115 | | | 11,087 | |
| Other operating activities | 1,944 | | | (1,701) | |
| Changes in operating assets and liabilities: | | | |
| Accounts receivable | 55,408 | | | (17,616) | |
| Income tax receivable | (4,928) | | | (3,982) | |
| Other assets | (2,646) | | | (9,449) | |
| Accounts payable and other accrued expenses | (12,723) | | | (6,970) | |
| Accrued wages and benefits | (7,395) | | | (141) | |
| Workers’ compensation claims reserve | (824) | | | (7,176) | |
| Operating lease liabilities | (11,410) | | | (11,297) | |
| Deferred employer payroll taxes | 36,312 | | | — | |
| Other liabilities | (2,798) | | | 1,723 | |
| Net cash provided by operating activities | 98,768 | | | 52,538 | |
| Cash flows from investing activities: | | | |
| Capital expenditures | (16,244) | | | (18,297) | |
| | | |
| Divestiture of business | — | | | 215 | |
| | | |
| Purchases of restricted available-for-sale investments | (2,310) | | | (5,299) | |
| Sales of restricted available-for-sale investments | 3,212 | | | 3,881 | |
| Purchases of restricted held-to-maturity investments | (32,495) | | | (17,298) | |
| Maturities of restricted held-to-maturity investments | 24,358 | | | 25,095 | |
| | | |
| Net cash used in investing activities | (23,479) | | | (11,703) | |
| Cash flows from financing activities: | | | |
| Purchases and retirement of common stock | (52,346) | | | (31,316) | |
| Net proceeds from employee stock purchase plans | 734 | | | 1,023 | |
| Common stock repurchases for taxes upon vesting of restricted stock | (2,331) | | | (1,934) | |
| Net change in revolving credit facility | (35,600) | | | (36,200) | |
| | | |
| | | |
| Other | (1,436) | | | (203) | |
| Net cash used in financing activities | (90,979) | | | (68,630) | |
| Effect of exchange rate changes on cash, cash equivalents and restricted cash | (466) | | | 732 | |
| Net change in cash, cash equivalents, and restricted cash | (16,156) | | | (27,063) | |
| Cash, cash equivalents and restricted cash, beginning of period | 92,371 | | | 102,450 | |
| Cash, cash equivalents and restricted cash, end of period | $ | 76,215 | | | $ | 75,387 | |
TRUEBLUE, INC.
SEGMENT DATA
(Unaudited)
| | | | | | | | | | | | | | |
| | | | | | |
| 13 Weeks Ended | | | | | |
| (in thousands) | Sep 27, 2020 | | Sep 29, 2019 | | | |
| Revenue from services: | | | | | | |
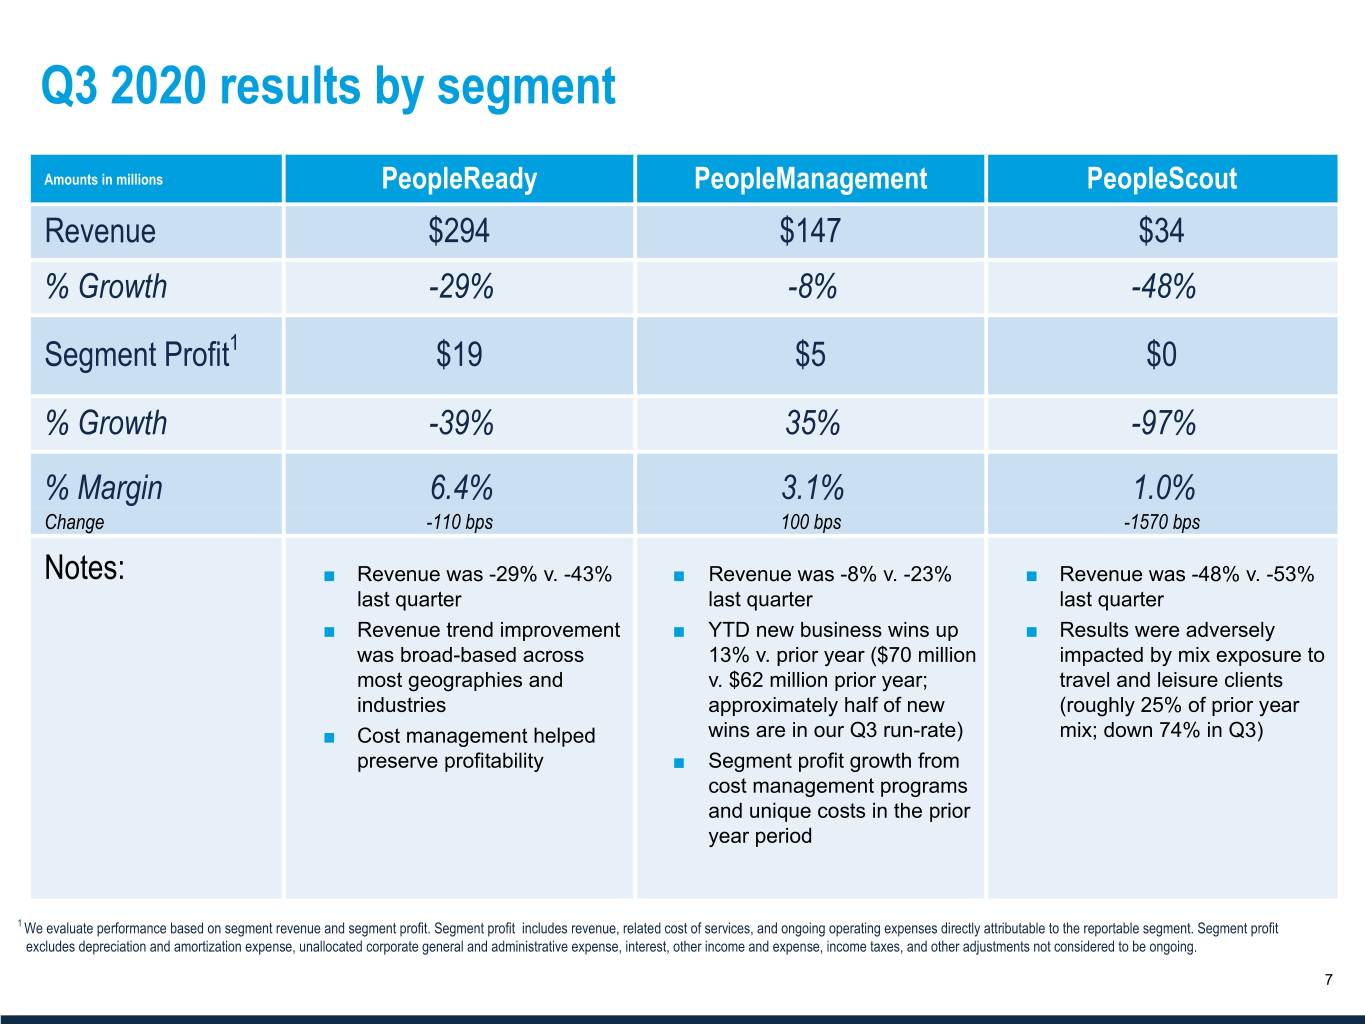
| PeopleReady | $ | 293,546 | | | $ | 413,132 | | | | |
| PeopleManagement | 147,241 | | | 159,315 | | | | |
| PeopleScout | 33,743 | | | 64,346 | | | | |
| | | | | | |
| Total company | $ | 474,530 | | | $ | 636,793 | | | | |
| | | | | | |
Segment profit (1): | | | | | | |
| PeopleReady | $ | 18,714 | | | $ | 30,878 | | | | |
| PeopleManagement | 4,574 | | | 3,381 | | | | |
| PeopleScout | 349 | | | 10,774 | | | | |
| Total segment profit | 23,637 | | | 45,033 | | | | |
| Corporate unallocated expense | (5,968) | | | (5,769) | | | | |
Total company Adjusted EBITDA (2) | 17,669 | | | 39,264 | | | | |
| Work Opportunity Tax Credit processing fees (3) | (174) | | | (240) | | | | |
| Acquisition/integration costs (4) | — | | | (362) | | | | |
| | | | | | |
| | | | | | |
| Other adjustments (5) | 2,869 | | | (727) | | | | |
EBITDA (2) | 20,364 | | | 37,935 | | | | |
| Depreciation and amortization | (7,652) | | | (8,749) | | | | |
| Interest and other income (expense), net | (174) | | | 471 | | | | |
| Income before tax expense | 12,538 | | | 29,657 | | | | |
| Income tax expense | (3,743) | | | (2,981) | | | | |
| Net income | $ | 8,795 | | | $ | 26,676 | | | | |
(1)We evaluate performance based on segment revenue and segment profit. Segment profit includes revenue, related cost of services, and ongoing operating expenses directly attributable to the reportable segment. Segment profit excludes depreciation and amortization expense, unallocated corporate general and administrative expense, interest, other income and expense, income taxes, and other adjustments not considered to be ongoing.
(2)See the Non-GAAP Financial Measures table on the next page for definitions of EBITDA and Adjusted EBITDA.
(3)These third-party processing fees are associated with generating the Work Opportunity Tax Credits, which are designed to encourage employers to hire workers from certain targeted groups with higher than average unemployment rates.
(4)Acquisition/integration costs relate to the acquisition of TMP Holdings LTD completed on June 12, 2018.
(5)Other adjustments for the 13 weeks ended September 27, 2020 primarily include $4.1 million in COVID-19 government subsidies which are partially offset by amortization of software as a service assets of $0.6 million, which is reported in selling, general and administrative expense, workforce reduction costs of $0.3 million and implementation costs for cloud-based systems of $0.1 million. Other adjustments for the 13 weeks ended September 29, 2019 primarily include amortization of software as a service assets of $0.4 million and implementation costs for cloud-based systems of $0.4 million.
TRUEBLUE, INC.
NON-GAAP FINANCIAL MEASURES AND NON-GAAP RECONCILIATIONS
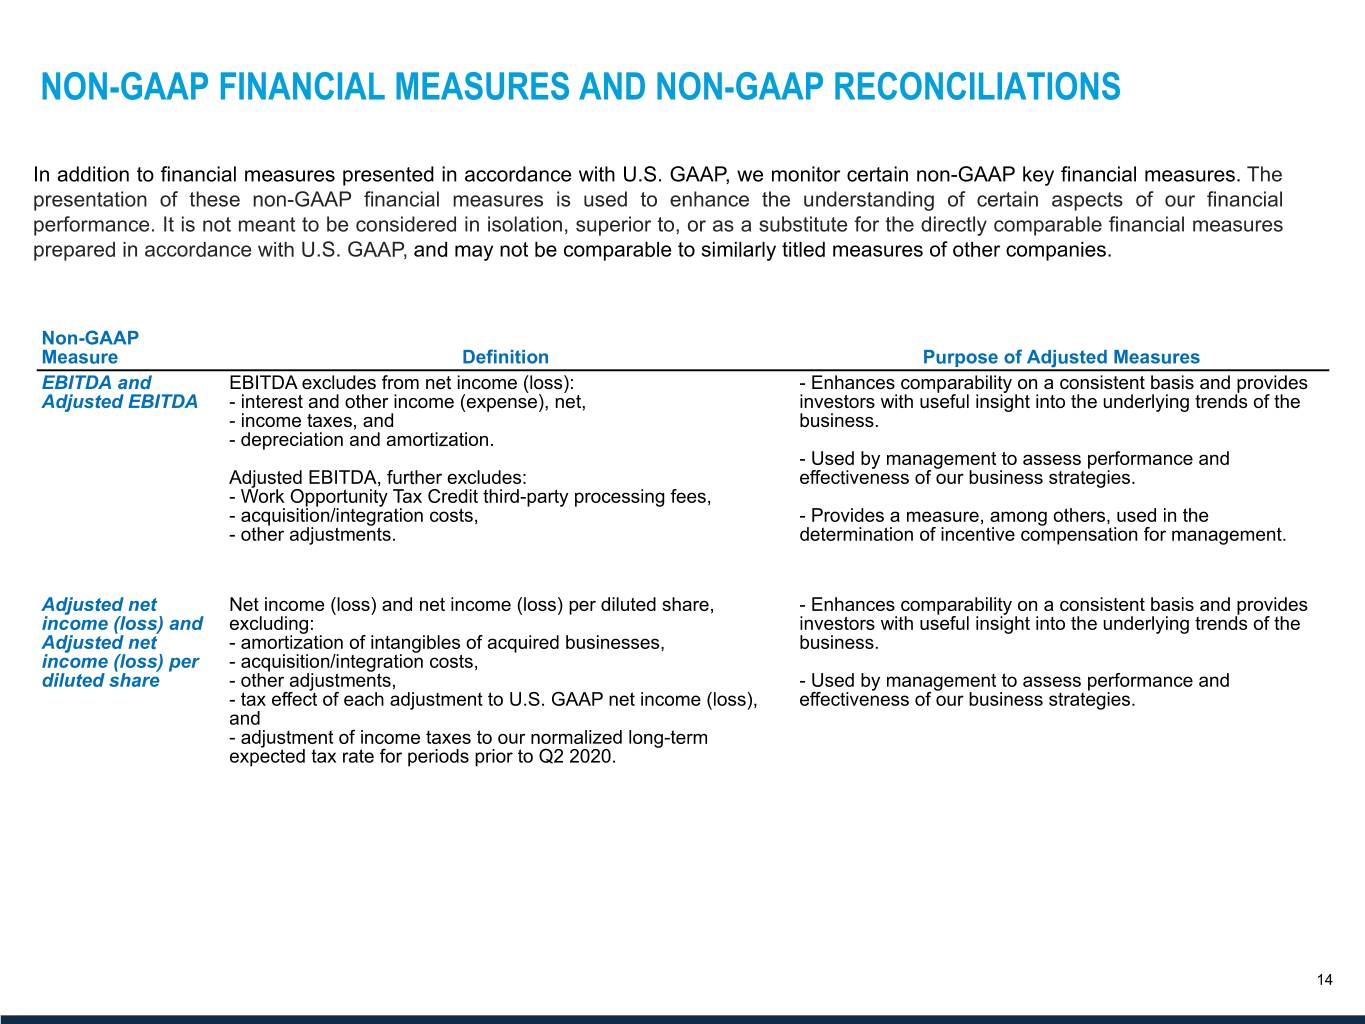
In addition to financial measures presented in accordance with U.S. GAAP, we monitor certain non-GAAP key financial measures. The presentation of these non-GAAP financial measures is used to enhance the understanding of certain aspects of our financial performance. It is not meant to be considered in isolation, superior to, or as a substitute for the directly comparable financial measures prepared in accordance with U.S. GAAP, and may not be comparable to similarly titled measures of other companies.
| | | | | | | | | | | |
| Non-GAAP Measure | Definition | | Purpose of Adjusted Measures |
EBITDA and
Adjusted EBITDA | EBITDA excludes from net income (loss): - interest and other income (expense), net, - income taxes, and - depreciation and amortization.
Adjusted EBITDA, further excludes: - Work Opportunity Tax Credit third-party processing fees, - acquisition/integration costs, - other adjustments. | | - Enhances comparability on a consistent basis and provides investors with useful insight into the underlying trends of the business.
- Used by management to assess performance and effectiveness of our business strategies.
- Provides a measure, among others, used in the determination of incentive compensation for management. |
| Adjusted net income (loss) and Adjusted net income (loss) per diluted share | Net income (loss) and net income (loss) per diluted share, excluding: - amortization of intangibles of acquired businesses, - acquisition/integration costs, - other adjustments, - tax effect of each adjustment to U.S. GAAP net income (loss), and - adjustment of income taxes to our normalized long-term expected tax rate for periods prior to Q2 2020. | | - Enhances comparability on a consistent basis and provides investors with useful insight into the underlying trends of the business.
- Used by management to assess performance and effectiveness of our business strategies. |
| | | |
| | | |
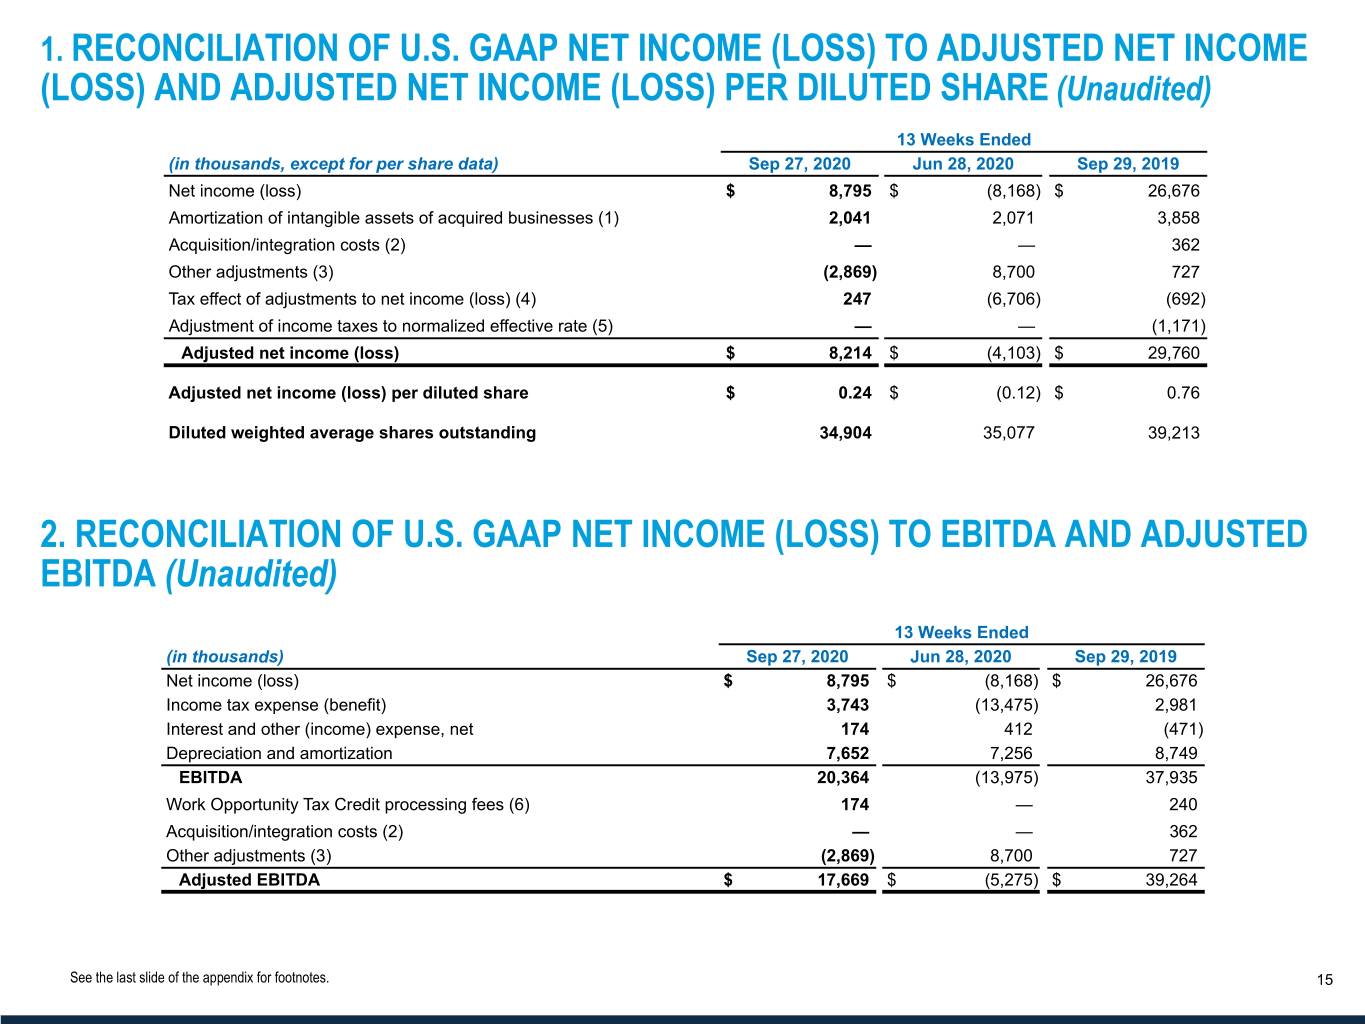
1.RECONCILIATION OF U.S. GAAP NET INCOME (LOSS) TO ADJUSTED NET INCOME (LOSS) AND ADJUSTED NET INCOME (LOSS) PER DILUTED SHARE
(Unaudited)
| | | | | | | | | | | | | | | | | | | | | |
| | | | | | | | | |
| 13 Weeks Ended | | | | | | | | |
| (in thousands, except for per share data) | Sep 27, 2020 | | Jun 28, 2020 | | Sep 29, 2019 | | | | |
| Net income (loss) | $ | 8,795 | | | $ | (8,168) | | | $ | 26,676 | | | | | |
| Amortization of intangible assets of acquired businesses (1) | 2,041 | | | 2,071 | | | 3,858 | | | | | |
| Acquisition/integration costs (2) | — | | | — | | | 362 | | | | | |
| | | | | | | | | |
| Other adjustments (3) | (2,869) | | | 8,700 | | | 727 | | | | | |
| Tax effect of adjustments to net income (loss) (4) | 247 | | | (6,706) | | | (692) | | | | | |
| Adjustment of income taxes to normalized effective rate (5) | — | | | — | | | (1,171) | | | | | |
| Adjusted net income (loss) | $ | 8,214 | | | $ | (4,103) | | | $ | 29,760 | | | | | |
| | | | | | | | | |
| Adjusted net income (loss) per diluted share | $ | 0.24 | | | $ | (0.12) | | | $ | 0.76 | | | | | |
| | | | | | | | | |
| Diluted weighted average shares outstanding | 34,904 | | | 35,077 | | | 39,213 | | | | | |
| | | | | | | | | |
2.RECONCILIATION OF U.S. GAAP NET INCOME (LOSS) TO EBITDA AND ADJUSTED EBITDA
(Unaudited)
| | | | | | | | | | | | | | | | | | | | | |
| | | | | | | | | |
| 13 Weeks Ended | | | | | | | | |
| (in thousands) | Sep 27, 2020 | | Jun 28, 2020 | | Sep 29, 2019 | | | | |
| Net income (loss) | $ | 8,795 | | | $ | (8,168) | | | $ | 26,676 | | | | | |
| Income tax expense (benefit) | 3,743 | | | (13,475) | | | 2,981 | | | | | |
| Interest and other (income) expense, net | 174 | | | 412 | | | (471) | | | | | |
| Depreciation and amortization | 7,652 | | | 7,256 | | | 8,749 | | | | | |
| EBITDA | 20,364 | | | (13,975) | | | 37,935 | | | | | |
| Work Opportunity Tax Credit processing fees (6) | 174 | | | — | | | 240 | | | | | |
| Acquisition/integration costs (2) | — | | | — | | | 362 | | | | | |
| | | | | | | | | |
| | | | | | | | | |
| Other adjustments (3) | (2,869) | | | 8,700 | | | 727 | | | | | |
| Adjusted EBITDA | $ | 17,669 | | | $ | (5,275) | | | $ | 39,264 | | | | | |
| | | | | | | | | |
(1)Amortization of intangible assets of acquired businesses.
(2)Acquisition/integration costs for the acquisition of TMP Holding LTD completed on June 12, 2018.
(3)Other adjustments for the 13 weeks ended September 27, 2020 primarily include $4.1 million in COVID-19 government subsidies which are partially offset by amortization of software as a service assets of $0.6 million, which is reported in selling, general and administrative expense, workforce reduction costs of $0.3 million and implementation costs for cloud-based systems of $0.1 million. Other adjustments for the 13 weeks ended June 28, 2020 primarily include workforce reduction costs of $11.0 million and amortization of software as a service assets of $0.6 million, partially offset by $3.1 million in COVID-19 government subsidies. Other adjustments for the 13 weeks ended September 29, 2019 primarily include amortization of software as a service assets of $0.4 million and implementation costs for cloud-based systems of $0.4 million.
(4)Total tax effect of each of the adjustments to U.S. GAAP net income (loss) using the effective rate of 30 percent for Q3 2020, the effective rate of 62 percent for Q2 2020 and the expected long-term ongoing rate of 14 percent for Q3 2019.
(5)Adjustment of the effective income tax rate to the expected long-term ongoing rate of 14 percent for Q3 2019. Beginning in Q2 2020, we decided not to adjust our GAAP tax rate in our adjusted net income (loss) calculation until our profitability rises to a more substantial level.
(6)These third-party processing fees are associated with generating the Work Opportunity Tax Credits, which are designed to encourage employers to hire workers from certain targeted groups with higher than average unemployment rates.