tbi-20210726
false000076889900007688992021-07-262021-07-26

UNITED STATES
SECURITIES AND EXCHANGE COMMISSION
WASHINGTON, DC 20549
FORM 8-K
CURRENT REPORT
PURSUANT TO SECTION 13 OR 15(D) OF THE
SECURITIES EXCHANGE ACT OF 1934
Date of report (Date of earliest event reported): July 26, 2021
tbi-20210726_g1.jpg
TrueBlue, Inc.
(Exact Name of Registrant as Specified in Its Charter)
Washington
(State or Other Jurisdiction
of Incorporation)
001-14543 91-1287341
(Commission
File Number)
 (IRS Employer
Identification No.)
 
1015 A Street, Tacoma, Washington 98402
(Address of principal executive offices) (Zip Code)
Registrant’s telephone number, including area code:    (253383-9101

Not Applicable
(Former Name or Former Address, if Changed Since Last Report)
Check the appropriate box below if the Form 8-K filing is intended to simultaneously satisfy the filing obligation of the registrant under any of the following provisions (see General Instruction A.2. below):
Written communications pursuant to Rule 425 under the Securities Act (17 CFR 230.425)
Soliciting material pursuant to Rule 14a-12 under the Exchange Act (17 CFR 240.14a-12)
Pre-commencement communications pursuant to Rule 14d-2(b) under the Exchange Act (17 CFR 240.14d-2(b))
Pre-commencement communications pursuant to Rule 13e-4(c) under the Exchange Act (17 CFR 240.13e-4(c))
Securities registered pursuant to Section 12(b) of the Act:
Title of each classTrading Symbol(s)Name of each exchange on which registered
Common stock, no par valueTBINew York Stock Exchange

Indicate by check mark whether the registrant is an emerging growth company as defined in as defined in Rule 405 of the Securities Act of 1933 (§230.405 of this chapter) or Rule 12b-2 of the Securities Exchange Act of 1934 (§240.12b-2 of this chapter).

Emerging growth company


If an emerging growth company, indicate by check mark if the registrant has elected not to use the extended transition period for complying with any new or revised financial accounting standards provided pursuant to Section 13(a) of the Exchange Act.


Item 2.02.Results of Operations and Financial Condition.
On July 26, 2021, TrueBlue, Inc. (the “company”) issued a press release (the “Press Release”) reporting its financial results for the second quarter ended June 27, 2021, and revenue and earnings outlook for the third quarter of 2021, a copy of which is attached hereto as Exhibit 99.1 and the contents of which are incorporated herein by this reference. Also attached to this report as Exhibit 99.2 is a slide presentation relating to the financial results for the second quarter ended June 27, 2021 (the “Earnings Results Presentation”), which will be discussed by management of the company on a live conference call at 2:30 p.m. Pacific Time (5:30 p.m. Eastern Time) on Monday, July 26, 2021. The Earnings Results Presentation is also available on the company’s website at www.trueblue.com.

In accordance with General Instruction B.2. of Form 8-K, the information contained above in this report (including the Press Release and the Earnings Results Presentation) shall not be deemed “Filed” for purposes of Section 18 of the Securities Exchange Act of 1934, as amended, or otherwise subject to the liabilities of that section, nor shall the Press Release or the Earnings Results Presentation be deemed incorporated by reference in any filing under the Securities Act of 1933, as amended, except as shall be expressly set forth by specific reference in such a filing. This report will not be deemed a determination or an admission as to the materiality of any information in the report that is required to be disclosed solely by Regulation FD.

Item 7.01.Regulation FD Disclosure.
We are also attaching our Investor Roadshow Presentation to this report as Exhibit 99.3, which we will reference in our Q2 2021 earnings results discussion and which may be used in future investor conferences. The Investor Roadshow Presentation is also available on the company’s website at www.trueblue.com.

In accordance with General Instruction B.2. of Form 8-K, the information contained above in this report (including the Investor Roadshow Presentation) shall not be deemed “Filed” for purposes of Section 18 of the Securities Exchange Act of 1934, as amended, or otherwise subject to the liabilities of that section, nor shall the Investor Roadshow Presentation be deemed incorporated by reference in any filing under the Securities Act of 1933, as amended, except as shall be expressly set forth by specific reference in such a filing. This report will not be deemed a determination or an admission as to the materiality of any information in the report that is required to be disclosed solely by Regulation FD.

Item 9.01.Financial Statements and Exhibits.
(d)Exhibits
Exhibit
Number
Exhibit DescriptionFiled Herewith
99.1X
99.2X
99.3X
104Cover page interactive data file - The cover page from this Current Report on Form 8-K is formatted as Inline XBRLX


SIGNATURE
Pursuant to the requirements of the Securities Exchange Act of 1934, the registrant has duly caused this report to be signed on its behalf by the undersigned hereunto duly authorized.
 
  TRUEBLUE, INC.
 (Registrant)
Date:July 26, 2021By:/s/ Derrek L. Gafford
  Derrek L. Gafford
  Chief Financial Officer and Executive Vice President


TRUEBLUE REPORTS SECOND QUARTER 2021 RESULTS
Strong revenue growth across all segments delivers improving results

TACOMA, WASH. - Jul. 26, 2021 -- TrueBlue (NYSE:TBI) today announced its second quarter results for 2021.

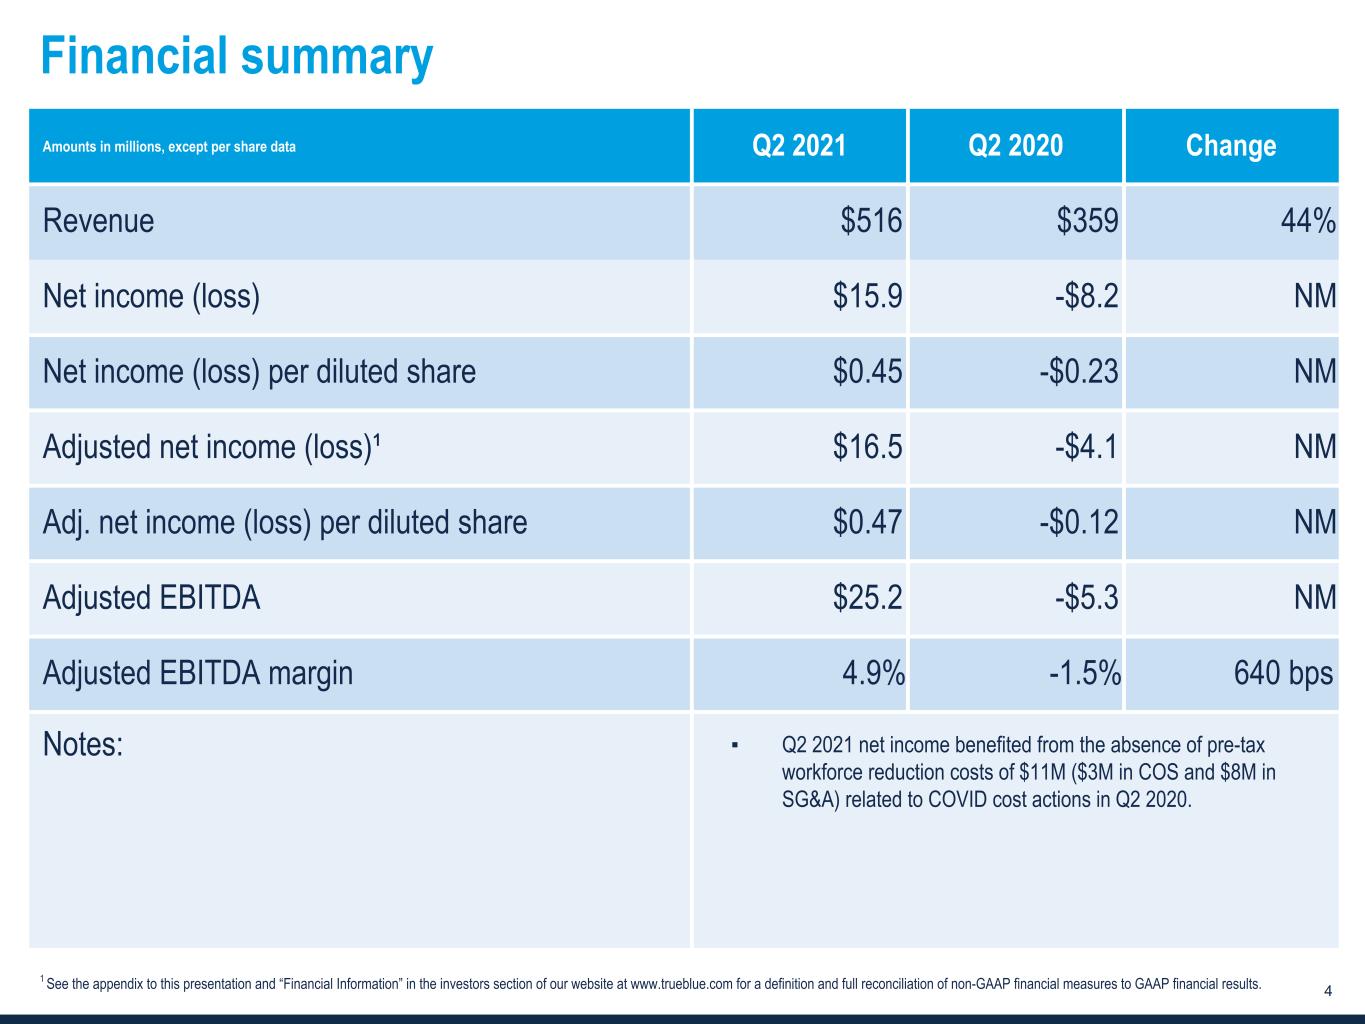
Second quarter revenue was $516 million, an increase of 44 percent compared to revenue of $359 million in the second quarter of 2020. Net income per diluted share was $0.45 compared to net loss per diluted share of $0.23 in the second quarter of 2020. Second quarter adjusted net income1 per diluted share was $0.47 compared to adjusted net loss per diluted share of $0.12 in the second quarter of 2020.

“The momentum from earlier in the year carried into the second quarter with strong revenue growth across all segments driven by new business wins and higher existing client volumes,” said Patrick Beharelle, CEO of TrueBlue. “We are capitalizing on strong demand in the markets and industries we serve and driving improvement in our segment profit margins.

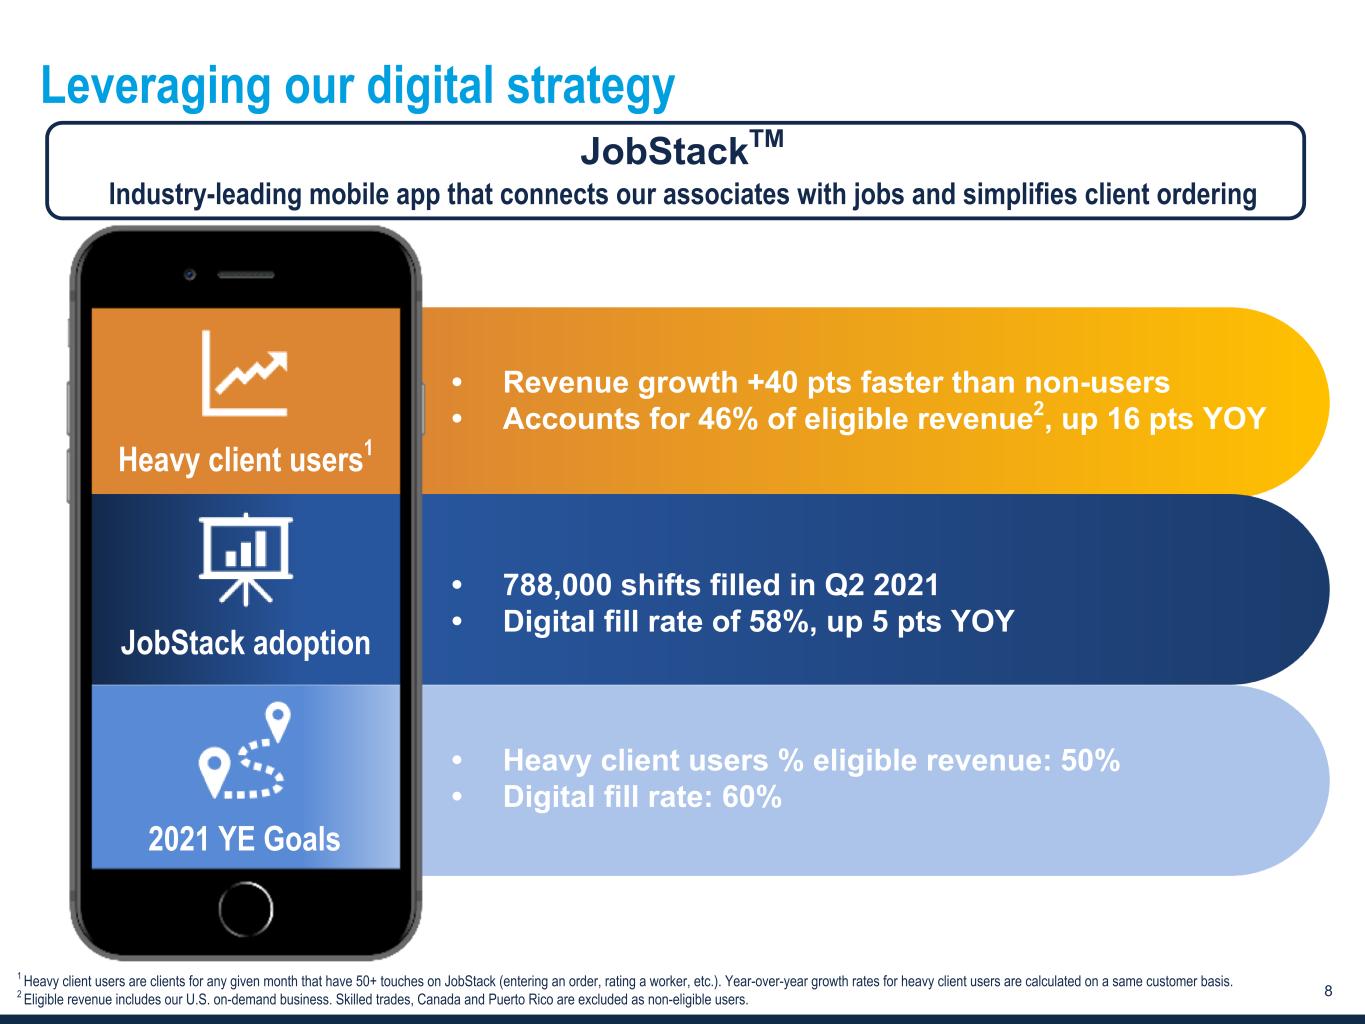
“I’m enthusiastic that our technology strategies will also make our service delivery costs more scalable resulting in a higher EBITDA1 margin during this economic expansion compared to the last cycle,” Mr. Beharelle continued. “JobStack continues to be a competitive differentiator for our PeopleReady business as heavy client users show stronger growth compared to the rest of our customer base and now represent 46% of PeopleReady U.S. on-demand revenue. We are excited about the prospects for the remainder of the year and beyond.”

2021 Outlook

TrueBlue is providing certain forward-looking information to help investors form their own estimates, which can be found in the quarterly earnings presentation filed today.

Management will discuss second quarter 2021 results on a webcast at 2:30 p.m. PT (5:30 p.m. ET), today, Monday, Jul. 26, 2021. The webcast can be accessed on TrueBlue’s website: www.trueblue.com.

About TrueBlue

TrueBlue (NYSE: TBI) is a leading provider of specialized workforce solutions that help clients achieve business growth and improve productivity. In 2020, TrueBlue connected approximately 490,000 people with work. Its PeopleReady segment offers on-demand, industrial staffing, PeopleManagement offers contingent, on-site industrial staffing and commercial driver services, and PeopleScout offers recruitment process outsourcing (RPO) and managed service provider (MSP) solutions to a wide variety of industries. Learn more at www.trueblue.com.

1 See the financial statements accompanying the release and the company’s website for more information on non-GAAP terms.

Forward-looking statements

This document contains forward-looking statements relating to our plans and expectations, all of which are subject to risks and uncertainties. Such statements are based on management’s expectations and assumptions as of the date of this release and involve many risks and uncertainties that could cause actual results to differ materially from those expressed or implied in our forward-looking statements including: (1) national and global economic conditions, (2) the continued impact of COVID-19 and related economic impact and governmental response, (3) our ability to access sufficient capital to finance our operations, including our ability to comply with covenants contained in our revolving credit facility, (4) our ability to attract and retain clients, (5) our ability to attract sufficient qualified candidates and employees to meet the needs of our clients, (6) our ability to maintain profit margins, (7) new laws, regulations, and government incentives that could affect our operations or financial results, (8) our ability to successfully execute on business strategies to further digitalize our business model, and (9) any reduction or change in tax credits we utilize, including the Work Opportunity Tax Credit. Other information regarding factors that could affect our results is included in our Securities Exchange Commission (SEC) filings, including the company’s most recent reports on Forms 10-K and 10-Q, copies of which may be obtained by visiting our website at www.trueblue.com under the Investor Relations section or the SEC’s website at www.sec.gov. We assume no obligation to update or revise any forward-looking statement, whether as a result of new information, future events, or otherwise, except as required by law. Any other references to future financial estimates are included for informational purposes only and subject to risk factors discussed in our most recent filings with the SEC.
In addition, we use several non-GAAP financial measures when presenting our financial results in this document. Please refer to the reconciliations between our GAAP and non-GAAP financial measures in the appendix to this document and on our website at www.trueblue.com under the Investor Relations section for additional information on both current and historical periods. The


presentation of these non-GAAP financial measures is used to enhance the understanding of certain aspects of our financial performance. It is not meant to be considered in isolation, superior to, or as a substitute for the directly comparable financial measures prepared in accordance with U.S. GAAP, and may not be comparable to similarly titled measures of other companies.

Contact:
Derrek Gafford, Executive Vice President and CFO
253-680-8214


TRUEBLUE, INC.
SUMMARY CONSOLIDATED STATEMENTS OF OPERATIONS
(Unaudited)
13 weeks ended
26 weeks ended
(in thousands, except per share data)Jun 27, 2021Jun 28, 2020Jun 27, 2021Jun 28, 2020
Revenue from services$515,955 $358,944 $974,661 $853,196 
Cost of services379,487 275,719 727,619 643,812 
Gross profit136,468 83,225 247,042 209,384 
Selling, general and administrative expense110,508 97,200 207,909 214,581 
Depreciation and amortization7,017 7,256 13,979 16,350 
Goodwill and intangible asset impairment charge —  175,189 
Income (loss) from operations18,943 (21,231)25,154 (196,736)
Interest expense and other income, net724 (412)1,299 (149)
Income (loss) before tax expense (benefit)19,667 (21,643)26,453 (196,885)
Income tax expense (benefit)3,783 (13,475)3,671 (38,223)
Net income (loss)$15,884 $(8,168)$22,782 $(158,662)
Net income (loss) per common share:
Basic$0.46 $(0.23)$0.66 $(4.39)
Diluted$0.45 $(0.23)$0.65 $(4.39)
Weighted average shares outstanding:
Basic34,818 35,077 34,746 36,166 
Diluted35,352 35,077 35,205 36,166 


TRUEBLUE, INC.
SUMMARY CONSOLIDATED BALANCE SHEETS
(Unaudited)
(in thousands)Jun 27, 2021Dec 27, 2020
ASSETS
Cash and cash equivalents$105,234 $62,507 
Accounts receivable, net292,731 278,343 
Other current assets34,560 38,035 
Total current assets432,525 378,885 
Property and equipment, net82,079 71,734 
Restricted cash and investments224,649 240,534 
Goodwill and intangible assets, net120,274 123,802 
Other assets, net158,541 165,622 
Total assets$1,018,068 $980,577 
LIABILITIES AND SHAREHOLDERS’ EQUITY
Accounts payable and other accrued expenses$52,116 $58,447 
Accrued wages and benefits136,675 122,657 
Current portion of workers’ compensation claims reserve60,032 66,007 
Other current liabilities25,715 21,856 
Total current liabilities274,538 268,967 
Workers’ compensation claims reserve, less current portion194,863 189,486 
Other long-term liabilities83,437 84,934 
Total liabilities552,838 543,387 
Shareholders’ equity465,230 437,190 
Total liabilities and shareholders’ equity$1,018,068 $980,577 


TRUEBLUE, INC.
CONSOLIDATED STATEMENTS OF CASH FLOWS
(Unaudited)
26 weeks ended
(in thousands)Jun 27, 2021Jun 28, 2020
Cash flows from operating activities:
Net income (loss)$22,782 $(158,662)
Adjustments to reconcile net income (loss) to net cash provided by operating activities:
Depreciation and amortization13,979 16,350 
Goodwill and intangible asset impairment charge 175,189 
Allowance for credit losses2,094 5,923 
Stock-based compensation6,916 4,345 
Deferred income taxes652 (27,049)
Non-cash lease expense7,853 7,454 
Other operating activities(1,473)2,669 
Changes in operating assets and liabilities:
Accounts receivable(16,486)111,803 
Income tax receivable1,103 (7,291)
Operating lease right-of-use-asset6,135 — 
Other assets(2,495)4,682 
Accounts payable and other accrued expenses(6,952)(22,197)
Other accrued wages and benefits11,208 (10,809)
Deferred employer payroll taxes2,810 15,730 
Workers’ compensation claims reserve(598)(5,668)
Operating lease liabilities(6,729)(7,643)
Other liabilities6,563 (1,344)
Net cash provided by operating activities47,362 103,482 
Cash flows from investing activities:
Capital expenditures(19,868)(11,641)
Purchases of restricted available-for-sale investments(14)(1,739)
Sales of restricted available-for-sale investments452 2,581 
Purchases of restricted held-to-maturity investments (11,458)
Maturities of restricted held-to-maturity investments15,143 16,190 
Net cash used in investing activities(4,287)(6,067)
Cash flows from financing activities:
Purchases and retirement of common stock (52,346)
Net proceeds from employee stock purchase plans538 536 
Common stock repurchases for taxes upon vesting of restricted stock(2,686)(1,956)
Net change in revolving credit facility 7,900 
Other(188)(1,344)
Net cash used in financing activities(2,336)(47,210)
Effect of exchange rate changes on cash, cash equivalents and restricted cash319 (736)
Net change in cash, cash equivalents, and restricted cash41,058 49,469 
Cash, cash equivalents and restricted cash, beginning of period118,612 92,371 
Cash, cash equivalents and restricted cash, end of period$159,670 $141,840 


TRUEBLUE, INC.
SEGMENT DATA
(Unaudited)

13 weeks ended
(in thousands)Jun 27, 2021Jun 28, 2020
Revenue from services:
PeopleReady$299,316 $209,151 
PeopleManagement152,356 118,661 
PeopleScout64,283 31,132 
Total company$515,955 $358,944 
Segment profit (loss) (1):
PeopleReady$18,437 $633 
PeopleManagement3,221 1,803 
PeopleScout10,857 (2,782)
Total segment profit (loss)32,515 (346)
Corporate unallocated expense(7,307)(4,929)
Total company Adjusted EBITDA (2)
25,208 (5,275)
Work Opportunity Tax Credit processing fees (3)(30)— 
Amortization of software as a service assets (4)(646)(565)
Workforce reduction costs (5)(14)(11,011)
COVID-19 government subsidies2,296 3,104 
Other adjustments, net (6)(854)(228)
EBITDA (2)
25,960 (13,975)
Depreciation and amortization (7,017)(7,256)
Interest expense and other income, net724 (412)
Income (loss) before tax (expense) benefit19,667 (21,643)
Income tax (expense) benefit(3,783)13,475 
Net income (loss)$15,884 $(8,168)
(1)We evaluate performance based on segment revenue and segment profit. Segment profit includes revenue, related cost of services, and ongoing operating expenses directly attributable to the reportable segment. Segment profit excludes depreciation and amortization expense, unallocated corporate general and administrative expense, interest expense, other income, income taxes, and other adjustments not considered to be ongoing.
(2)See the Non-GAAP Financial Measures table on the next page for definitions of EBITDA and Adjusted EBITDA.
(3)These third-party processing fees are associated with generating the Work Opportunity Tax Credits, which are designed to encourage employers to hire workers from certain targeted groups with higher than average unemployment rates.

(4)Amortization of software as a service assets is reported in selling, general and administrative expense.
(5)Workforce reduction costs for the 13 weeks ended June 28, 2020 were primarily due to employee reductions as part of our cost management actions in response to COVID-19 ($3.0 million in cost of services and $8.0 million in selling, general and administrative expense).
(6)Other adjustments for the 13 weeks ended June 27, 2021 primarily include redundant lease expense of $0.8 million incurred while transitioning into our new Chicago office. Other adjustments also include implementation costs for cloud-based systems of $0.1 million for all periods presented.


TRUEBLUE, INC.
NON-GAAP FINANCIAL MEASURES AND NON-GAAP RECONCILIATIONS

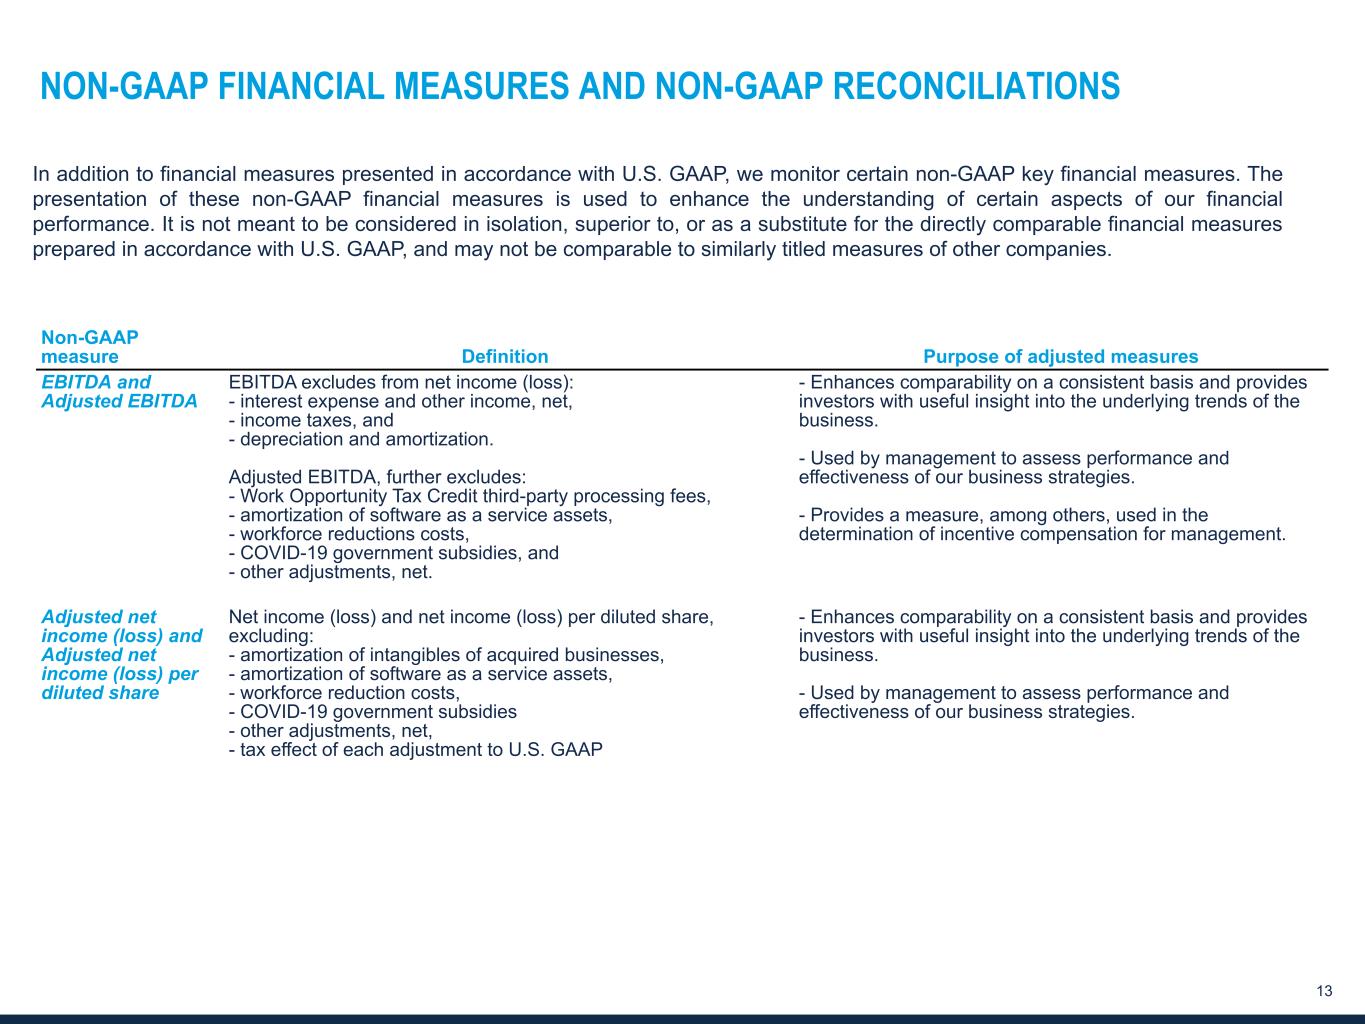
In addition to financial measures presented in accordance with U.S. GAAP, we monitor certain non-GAAP key financial measures. The presentation of these non-GAAP financial measures is used to enhance the understanding of certain aspects of our financial performance. It is not meant to be considered in isolation, superior to, or as a substitute for the directly comparable financial measures prepared in accordance with U.S. GAAP, and may not be comparable to similarly titled measures of other companies.
Non-GAAP measureDefinitionPurpose of adjusted measures
EBITDA and
Adjusted EBITDA
EBITDA excludes from net income (loss):
- interest expense and other income, net,
- income taxes, and
- depreciation and amortization.

Adjusted EBITDA, further excludes:
- Work Opportunity Tax Credit third-party processing fees,
- amortization of software as a service assets,
- workforce reductions costs,
- COVID-19 government subsidies, and
- other adjustments, net.

- Enhances comparability on a consistent basis and provides investors with useful insight into the underlying trends of the business.

- Used by management to assess performance and effectiveness of our business strategies.

- Provides a measure, among others, used in the determination of incentive compensation for management.
Adjusted net income (loss) and Adjusted net income (loss) per diluted share
Net income (loss) and net income (loss) per diluted share, excluding:
- amortization of intangibles of acquired businesses,
- amortization of software as a service assets,
- workforce reduction costs,
- COVID-19 government subsidies
- other adjustments, net,
- tax effect of each adjustment to U.S. GAAP

- Enhances comparability on a consistent basis and provides investors with useful insight into the underlying trends of the business.

- Used by management to assess performance and effectiveness of our business strategies.
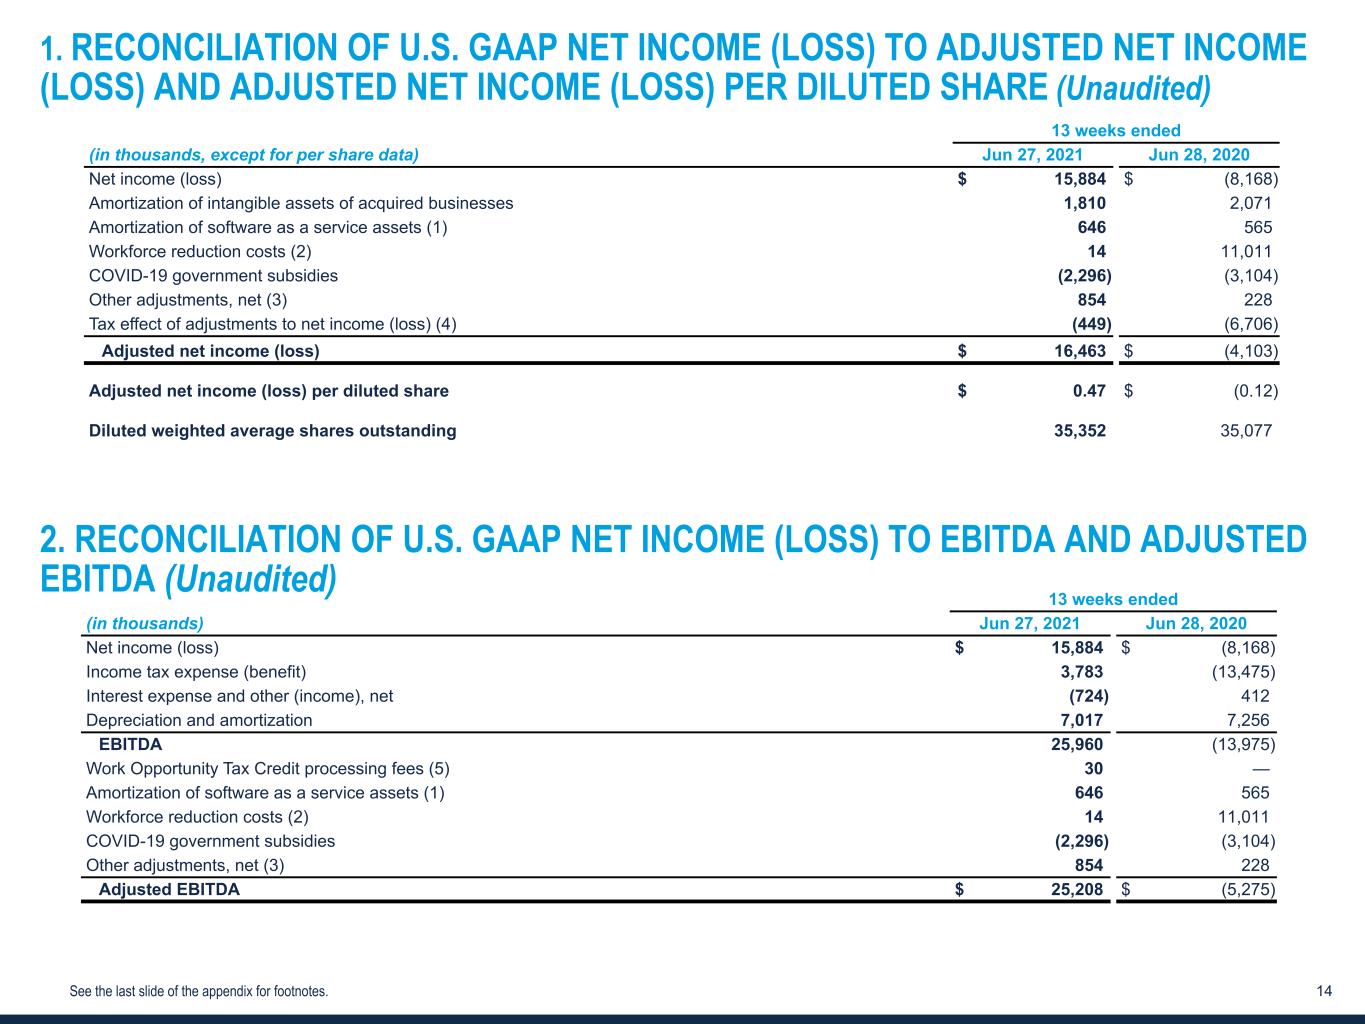
1.RECONCILIATION OF U.S. GAAP NET INCOME (LOSS) TO ADJUSTED NET INCOME (LOSS) AND ADJUSTED NET INCOME (LOSS) PER DILUTED SHARE
(Unaudited)
13 weeks ended
(in thousands, except for per share data)Jun 27, 2021Jun 28, 2020
Net income (loss)$15,884 $(8,168)
Amortization of intangible assets of acquired businesses1,810 2,071 
Amortization of software as a service assets (1)646 565 
Workforce reduction costs (2)14 11,011 
COVID-19 government subsidies(2,296)(3,104)
Other adjustments, net (3)854 228 
Tax effect of adjustments to net income (loss) (4)(449)(6,706)
Adjusted net income (loss)$16,463 $(4,103)
Adjusted net income (loss) per diluted share$0.47 $(0.12)
Diluted weighted average shares outstanding35,352 35,077 


2.RECONCILIATION OF U.S. GAAP NET INCOME (LOSS) TO EBITDA AND ADJUSTED EBITDA
(Unaudited)
13 weeks ended
(in thousands)Jun 27, 2021Jun 28, 2020
Net income (loss)$15,884 $(8,168)
Income tax expense (benefit)3,783 (13,475)
Interest expense and other (income), net(724)412 
Depreciation and amortization7,017 7,256 
EBITDA25,960 (13,975)
Work Opportunity Tax Credit processing fees (5)30 — 
Amortization of software as a service assets (1)646 565 
Workforce reduction costs (2)14 11,011 
COVID-19 government subsidies(2,296)(3,104)
Other adjustments, net (3)854 228 
Adjusted EBITDA $25,208 $(5,275)

(1)Amortization of software as a service assets is reported in selling, general and administrative expense.

(2)Workforce reduction costs for the 13 weeks ended June 28, 2020 were primarily due to employee reductions as part of our cost management actions in response to COVID-19 ($3.0 million in cost of services and $8.0 million in selling, general and administrative expense).

(3)Other adjustments for the 13 weeks ended June 27, 2021 primarily include redundant lease expense of $0.8 million incurred while transitioning into our new Chicago office. Other adjustments also include implementation costs for cloud-based systems of $0.1 million for all periods presented.

(4)Total tax effect of each of the adjustments to U.S. GAAP net income (loss) using the expected income tax rate of 14 percent for 2021 and the effective income tax rate of 62 percent for Q2 2020.

(5)These third-party processing fees are associated with generating the Work Opportunity Tax Credits, which are designed to encourage employers to hire workers from certain targeted groups with higher than average unemployment rates.


Q2 2021 Earnings July 2021


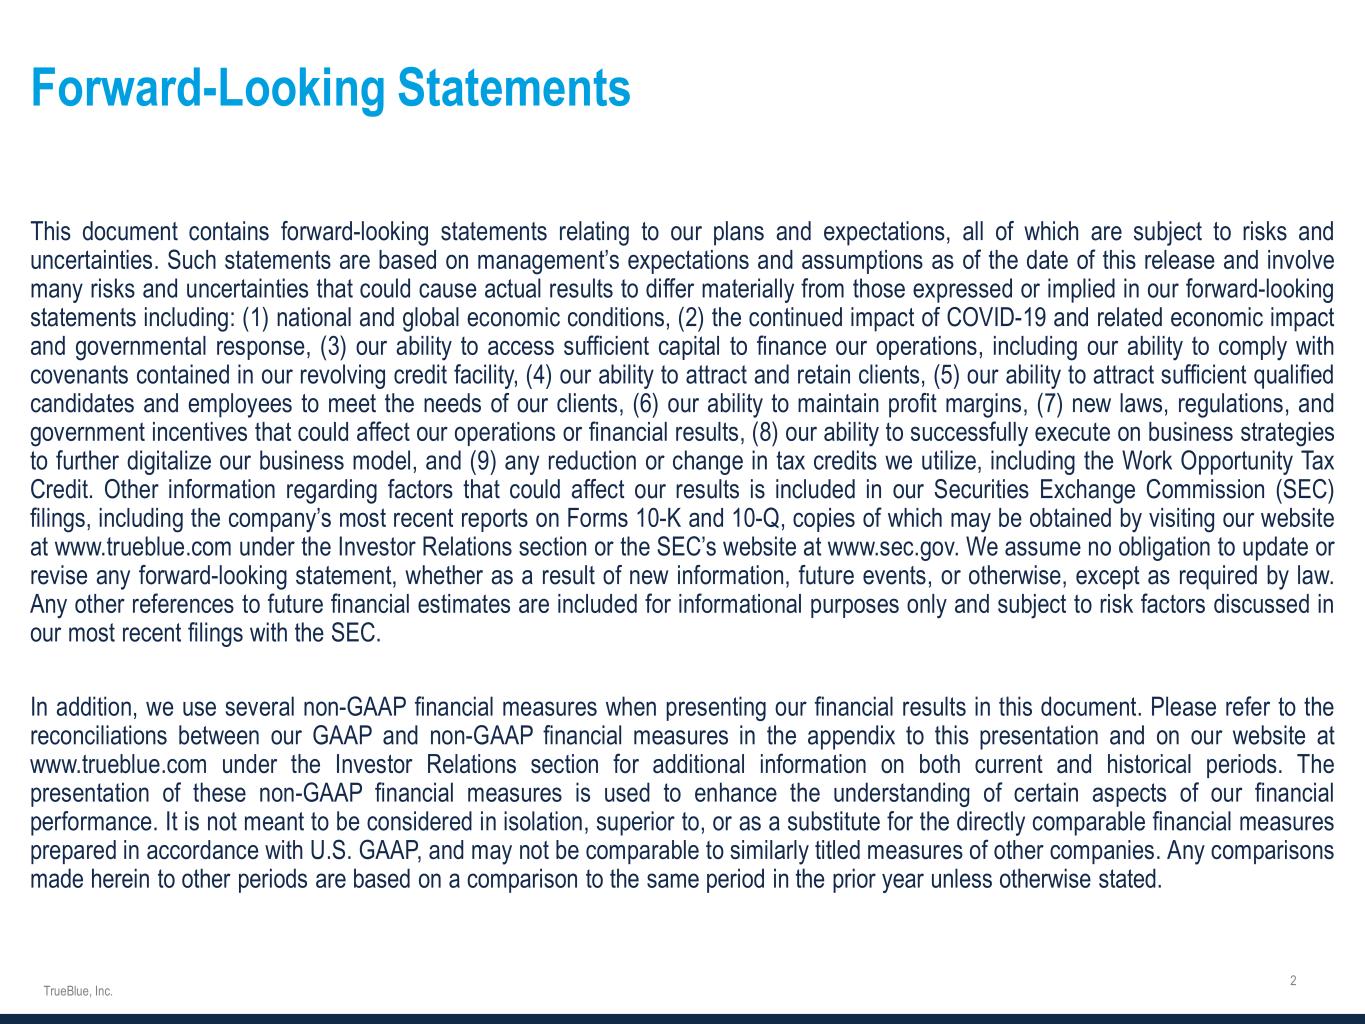
www.TrueBlue.c om 2 Forward-looking statements This document contains forward-looking statements relating to our plans and expectations, all of which are subject to risks and uncertainties. Such statements are based on management’s expectations and assumptions as of the date of this release and involve many risks and uncertainties that could cause actual results to differ materially from those expressed or implied in our forward-looking statements including: (1) national and global economic conditions, (2) the continued impact of COVID-19 and related economic impact and governmental response, (3) our ability to access sufficient capital to finance our operations, including our ability to comply with covenants contained in our revolving credit facility, (4) our ability to attract and retain clients, (5) our ability to attract sufficient qualified candidates and employees to meet the needs of our clients, (6) our ability to maintain profit margins, (7) new laws, regulations, and government incentives that could affect our operations or financial results, (8) our ability to successfully execute on business strategies to further digitalize our business model, and (9) any reduction or change in tax credits we utilize, including the Work Opportunity Tax Credit. Other information regarding factors that could affect our results is included in our Securities Exchange Commission (SEC) filings, including the company’s most recent reports on Forms 10-K and 10-Q, copies of which may be obtained by visiting our website at www.trueblue.com under the Investor Relations section or the SEC’s website at www.sec.gov. We assume no obligation to update or revise any forward-looking statement, whether as a result of new information, future events, or otherwise, except as required by law. Any other references to future financial estimates are included for informational purposes only and subject to risk factors discussed in our most recent filings with the SEC. In addition, we use several non-GAAP financial measures when presenting our financial results in this document. Please refer to the reconciliations between our GAAP and non-GAAP financial measures in the appendix to this presentation and on our website at www.trueblue.com under the Investor Relations section for additional information on both current and historical periods. The presentation of these non-GAAP financial measures is used to enhance the understanding of certain aspects of our financial performance. It is not meant to be considered in isolation, superior to, or as a substitute for the directly comparable financial measures prepared in accordance with U.S. GAAP, and may not be comparable to similarly titled measures of other companies. Any comparisons made herein to other periods are based on a comparison to the same period in the prior year unless otherwise stated.


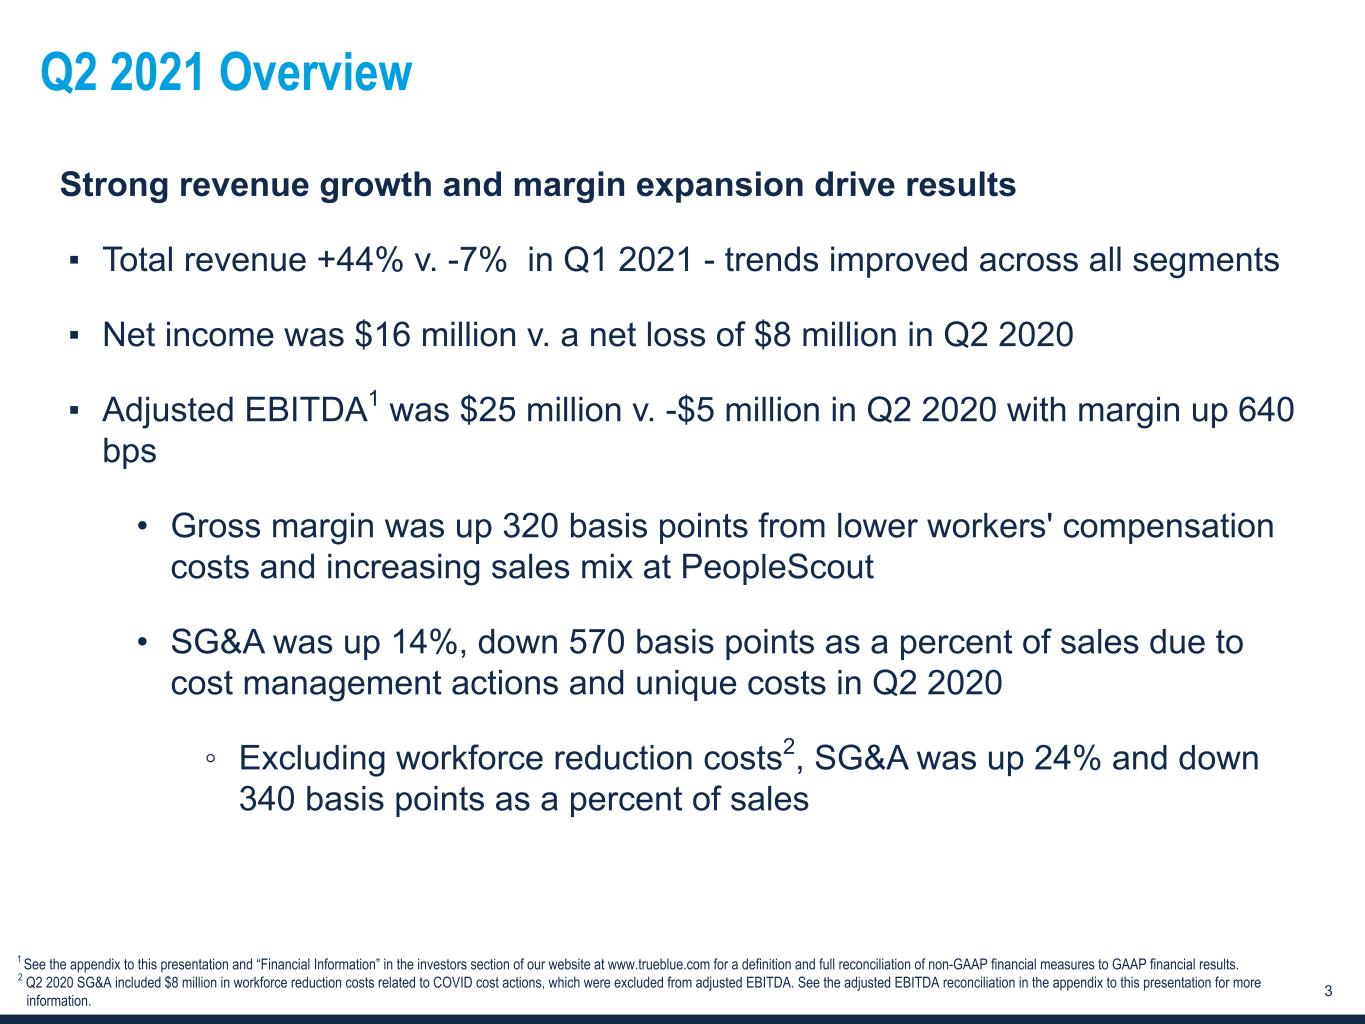
www.TrueBlue.c om 3 Q2 2021 Overview Strong revenue growth and margin expansion drive results ▪ Total revenue +44% v. -7% in Q1 2021 - trends improved across all segments ▪ Net income was $16 million v. a net loss of $8 million in Q2 2020 ▪ Adjusted EBITDA1 was $25 million v. -$5 million in Q2 2020 with margin up 640 bps • Gross margin was up 320 basis points from lower workers' compensation costs and increasing sales mix at PeopleScout • SG&A was up 14%, down 570 basis points as a percent of sales due to cost management actions and unique costs in Q2 2020 ◦ Excluding workforce reduction costs2, SG&A was up 24% and down 340 basis points as a percent of sales 1 See the appendix to this presentation and “Financial Information” in the investors section of our website at www.trueblue.com for a definition and full reconciliation of non-GAAP financial measures to GAAP financial results. 2 Q2 2020 SG&A included $8 million in workforce reduction costs related to COVID cost actions, which were excluded from adjusted EBITDA. See the adjusted EBITDA reconciliation in the appendix to this presentation for more information.


www.TrueBlue.c om 4 Financial summary 1 See the appendix to this presentation and “Financial Information” in the investors section of our website at www.trueblue.com for a definition and full reconciliation of non-GAAP financial measures to GAAP financial results. Amounts in millions, except per share data Q2 2021 Q2 2020 Change Revenue $516 $359 44 % Net income (loss) $15.9 -$8.2 NM Net income (loss) per diluted share $0.45 -$0.23 NM Adjusted net income (loss)¹ $16.5 -$4.1 NM Adj. net income (loss) per diluted share $0.47 -$0.12 NM Adjusted EBITDA $25.2 -$5.3 NM Adjusted EBITDA margin 4.9 % -1.5 % 640 bps Notes: ▪ Q2 2021 net income benefited from the absence of pre-tax workforce reduction costs of $11M ($3M in COS and $8M in SG&A) related to COVID cost actions in Q2 2020.


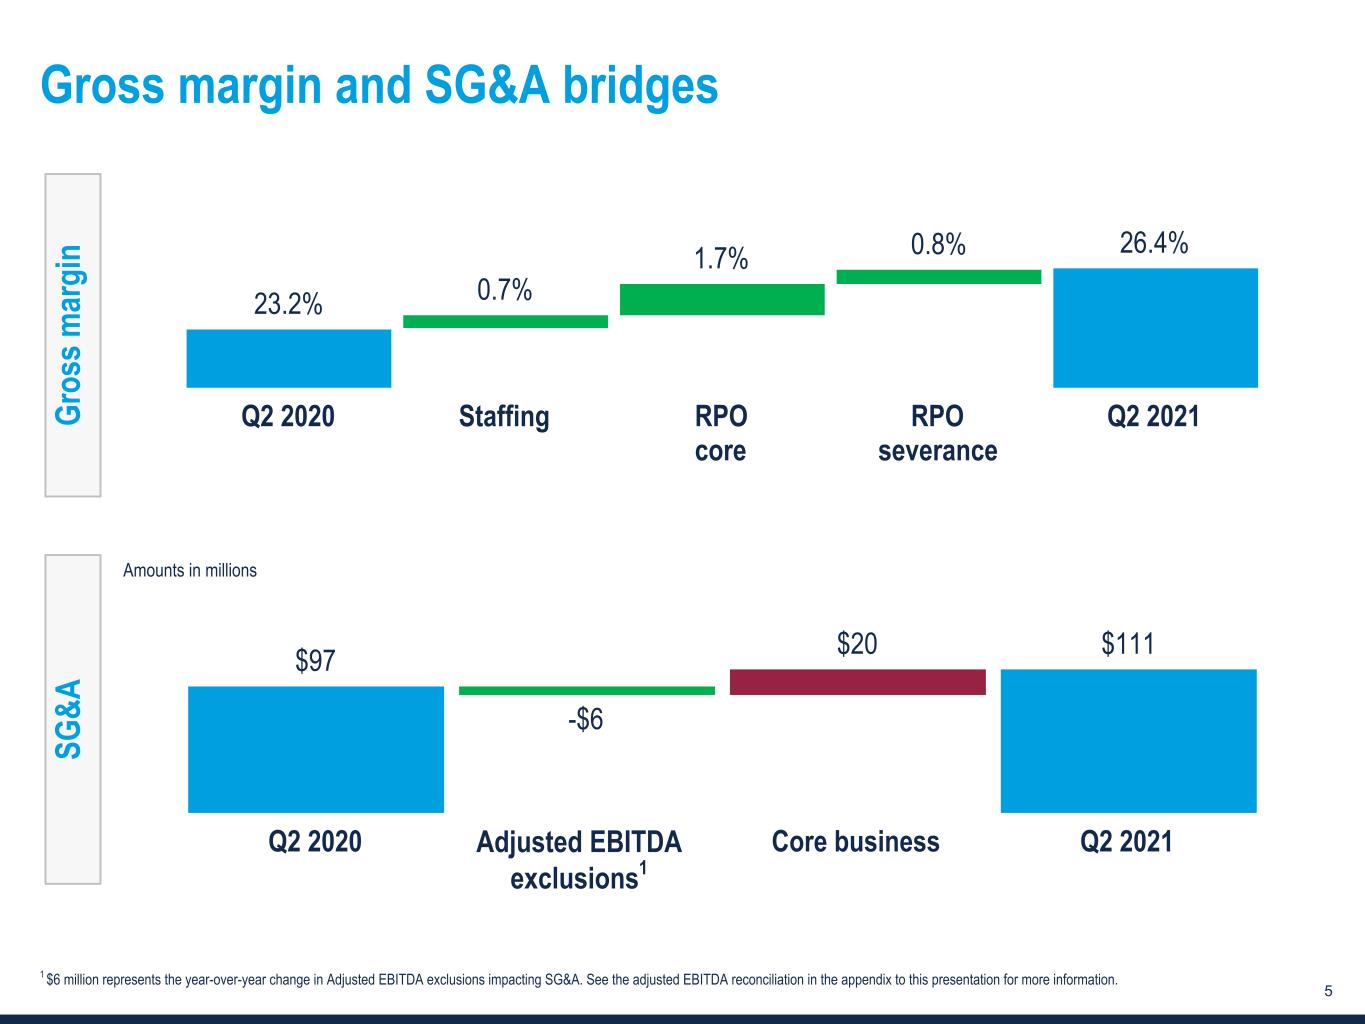
www.TrueBlue.c om 5 Gross margin and SG&A bridges Amounts in millions Gr os s m ar gi n SG &A $97 -$6 $20 $111 Q2 2020 Core business Q2 2021 23.2% 0.7% 1.7% 0.8% 26.4% Q2 2020 Staffing RPO core RPO severance Q2 2021 Adjusted EBITDA exclusions1 1 $6 million represents the year-over-year change in Adjusted EBITDA exclusions impacting SG&A. See the adjusted EBITDA reconciliation in the appendix to this presentation for more information.


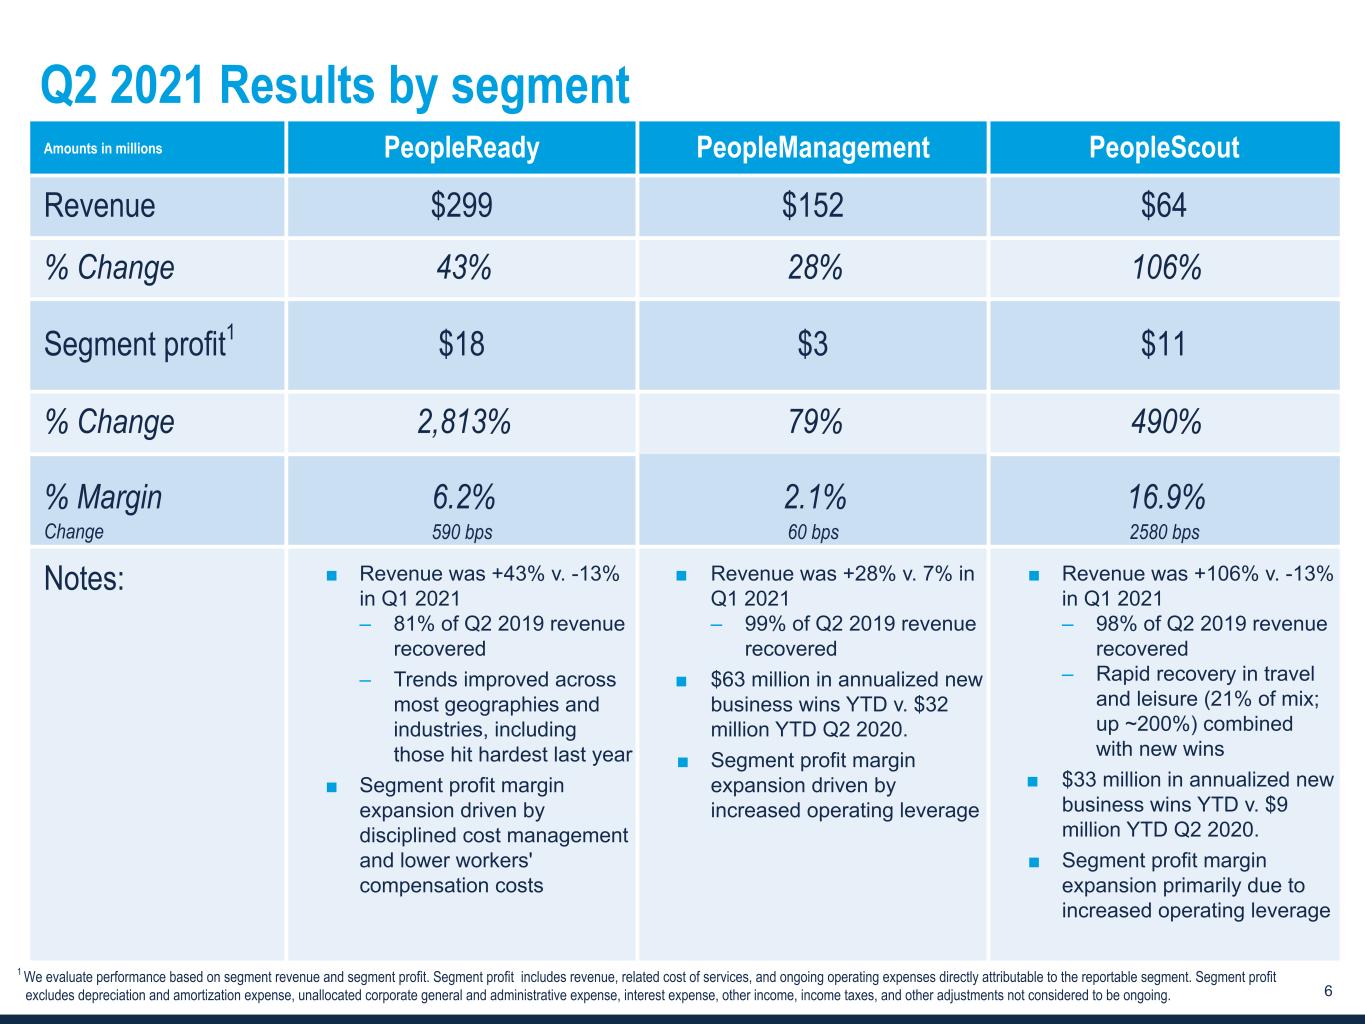
www.TrueBlue.c om 6 Q2 2021 Results by segment Amounts in millions PeopleReady PeopleManagement PeopleScout Revenue $299 $152 $64 % Change 43% 28% 106% Segment profit1 $18 $3 $11 % Change 2,813% 79% 490% % Margin 6.2% 2.1% 16.9% Change 590 bps 60 bps 2580 bps Notes: ■ Revenue was +43% v. -13% in Q1 2021 – 81% of Q2 2019 revenue recovered – Trends improved across most geographies and industries, including those hit hardest last year ■ Segment profit margin expansion driven by disciplined cost management and lower workers' compensation costs ■ Revenue was +28% v. 7% in Q1 2021 – 99% of Q2 2019 revenue recovered ■ $63 million in annualized new business wins YTD v. $32 million YTD Q2 2020. ■ Segment profit margin expansion driven by increased operating leverage ■ Revenue was +106% v. -13% in Q1 2021 – 98% of Q2 2019 revenue recovered – Rapid recovery in travel and leisure (21% of mix; up ~200%) combined with new wins ■ $33 million in annualized new business wins YTD v. $9 million YTD Q2 2020. ■ Segment profit margin expansion primarily due to increased operating leverage 1 We evaluate performance based on segment revenue and segment profit. Segment profit includes revenue, related cost of services, and ongoing operating expenses directly attributable to the reportable segment. Segment profit excludes depreciation and amortization expense, unallocated corporate general and administrative expense, interest expense, other income, income taxes, and other adjustments not considered to be ongoing.


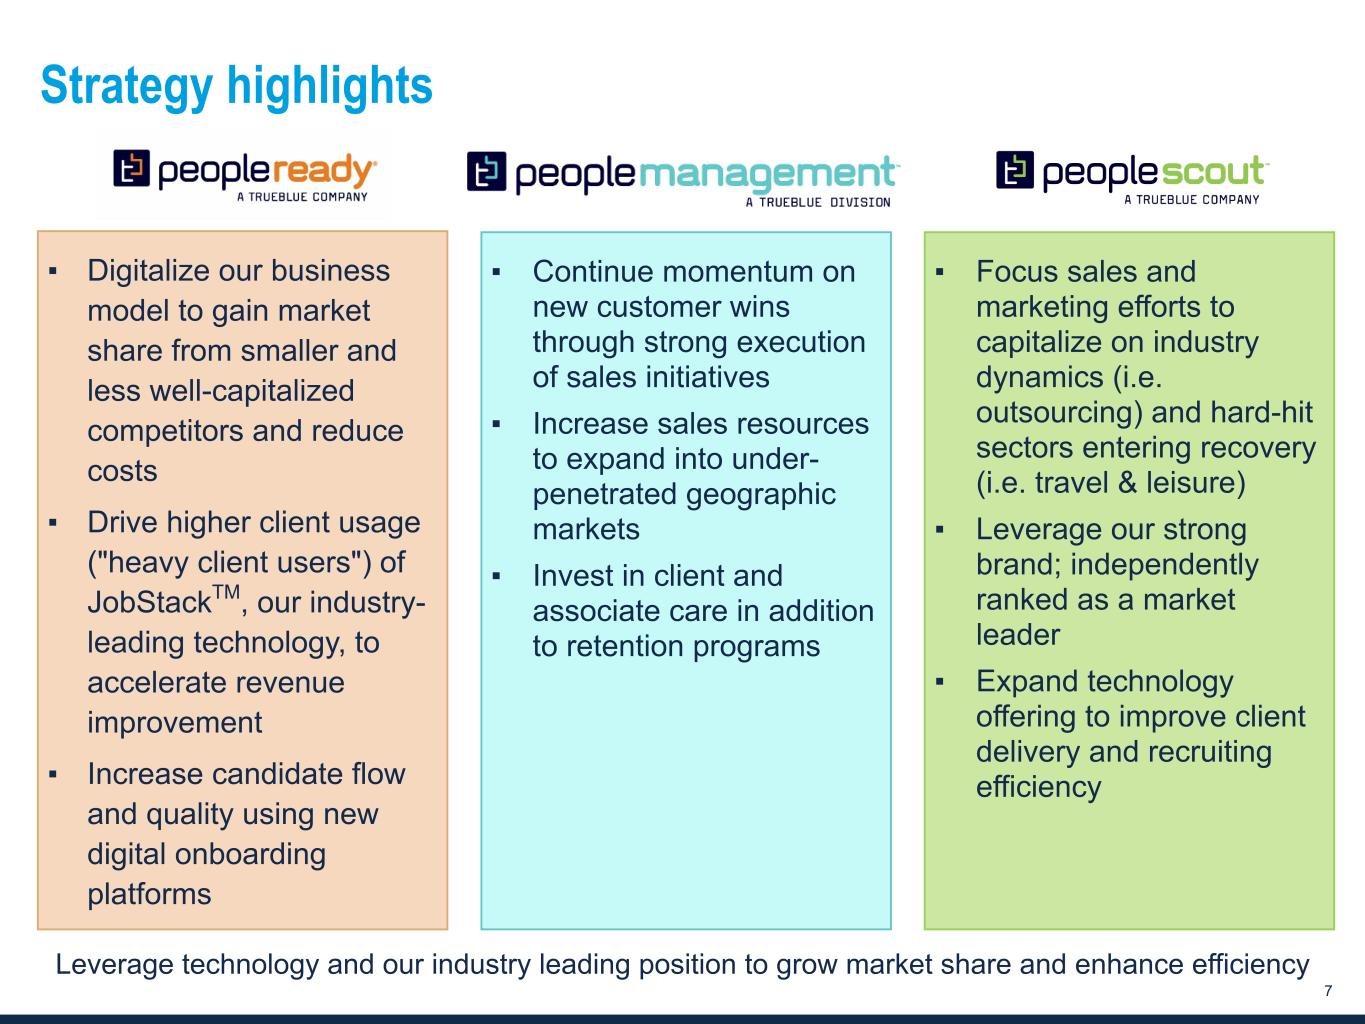
www.TrueBlue.c om 7 Strategy highlights Lev rage technology and our industry leading position to grow market share and enhance efficiency ▪ Focus sales and marketing efforts to capitalize on industry dynamics (i.e. outsourcing) and hard-hit sectors entering recovery (i.e. travel & leisure) ▪ Leverage our strong brand; independently ranked as a market leader ▪ Expand technology offering to improve client delivery and recruiting efficiency ▪ Digitalize our business model to gain market share from smaller and less well-capitalized competitors and reduce costs ▪ Drive higher client usage ("heavy client users") of JobStackTM, our industry- leading technology, to accelerate revenue improvement ▪ Increase candidate flow and quality using new digital onboarding platforms ▪ Continue momentum on new customer wins through strong execution of sales initiatives ▪ Increase sales resources to expand into under- penetrated geographic markets ▪ Invest in client and associate care in addition to retention programs


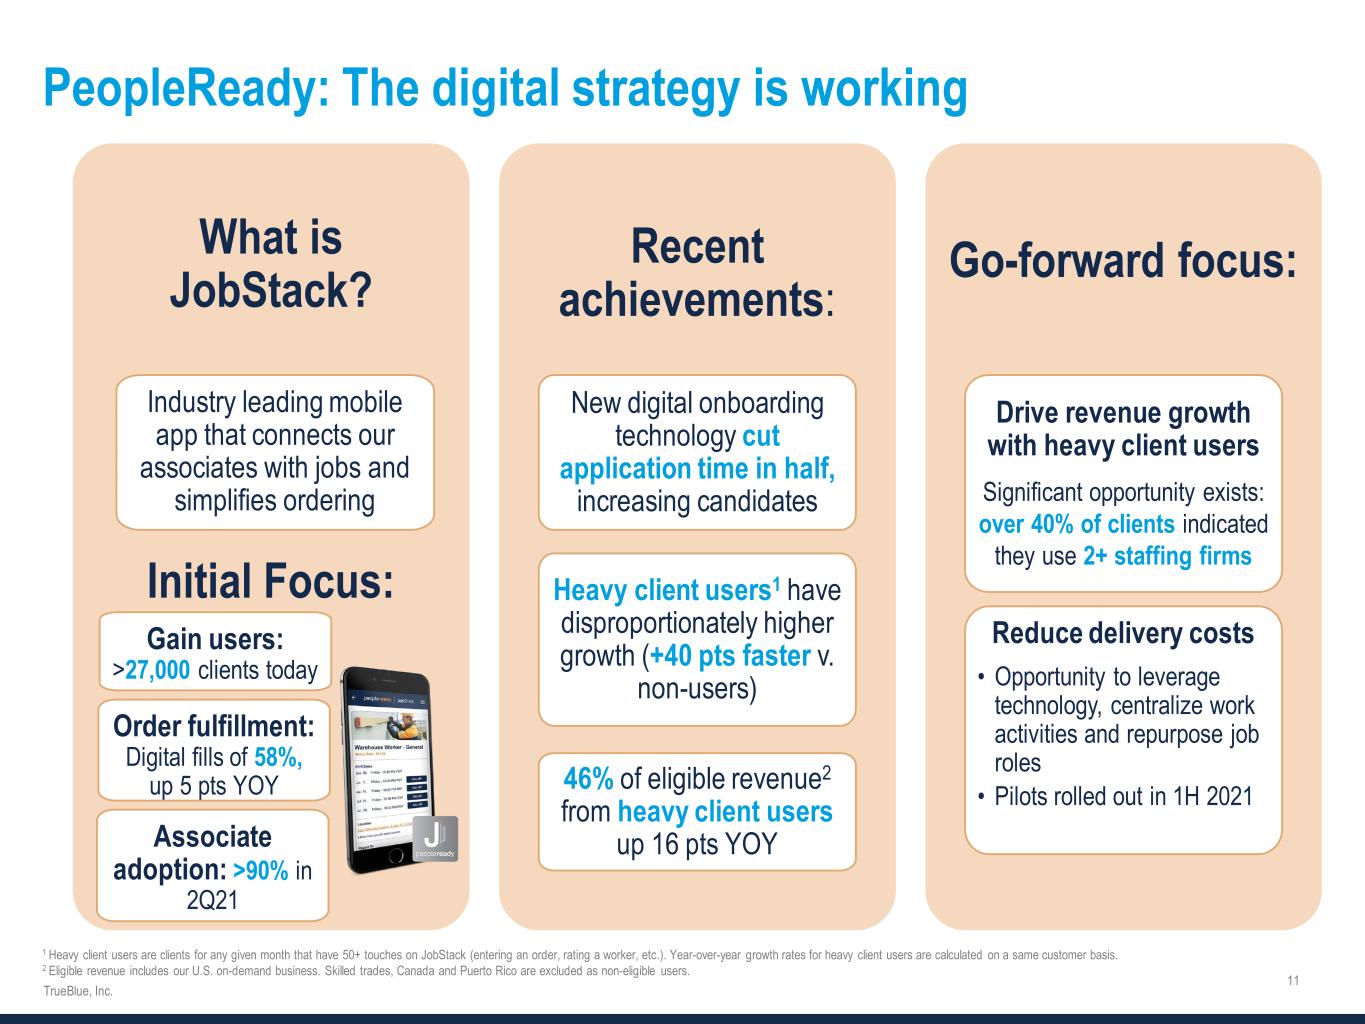
www.TrueBlue.c om 8 JobStackTM Industry-leading mobile app that connects our associates with jobs and simplifies client ordering Leveraging our digital strategy Heavy client users1 JobStack adoption 2021 YE Goals • Revenue growth +40 pts faster than non-users • Accounts for 46% of eligible revenue2, up 16 pts YOY • 788,000 shifts filled in Q2 2021 • Digital fill rate of 58%, up 5 pts YOY • Heavy client users % eligible revenue: 50% • Digital fill rate: 60% 1 Heavy client users are clients for any given month that have 50+ touches on JobStack (entering an order, rating a worker, etc.). Year-over-year growth rates for heavy client users are calculated on a same customer basis. 2 Eligible revenue includes our U.S. on-demand business. Skilled trades, Canada and Puerto Rico are excluded as non-eligible users.


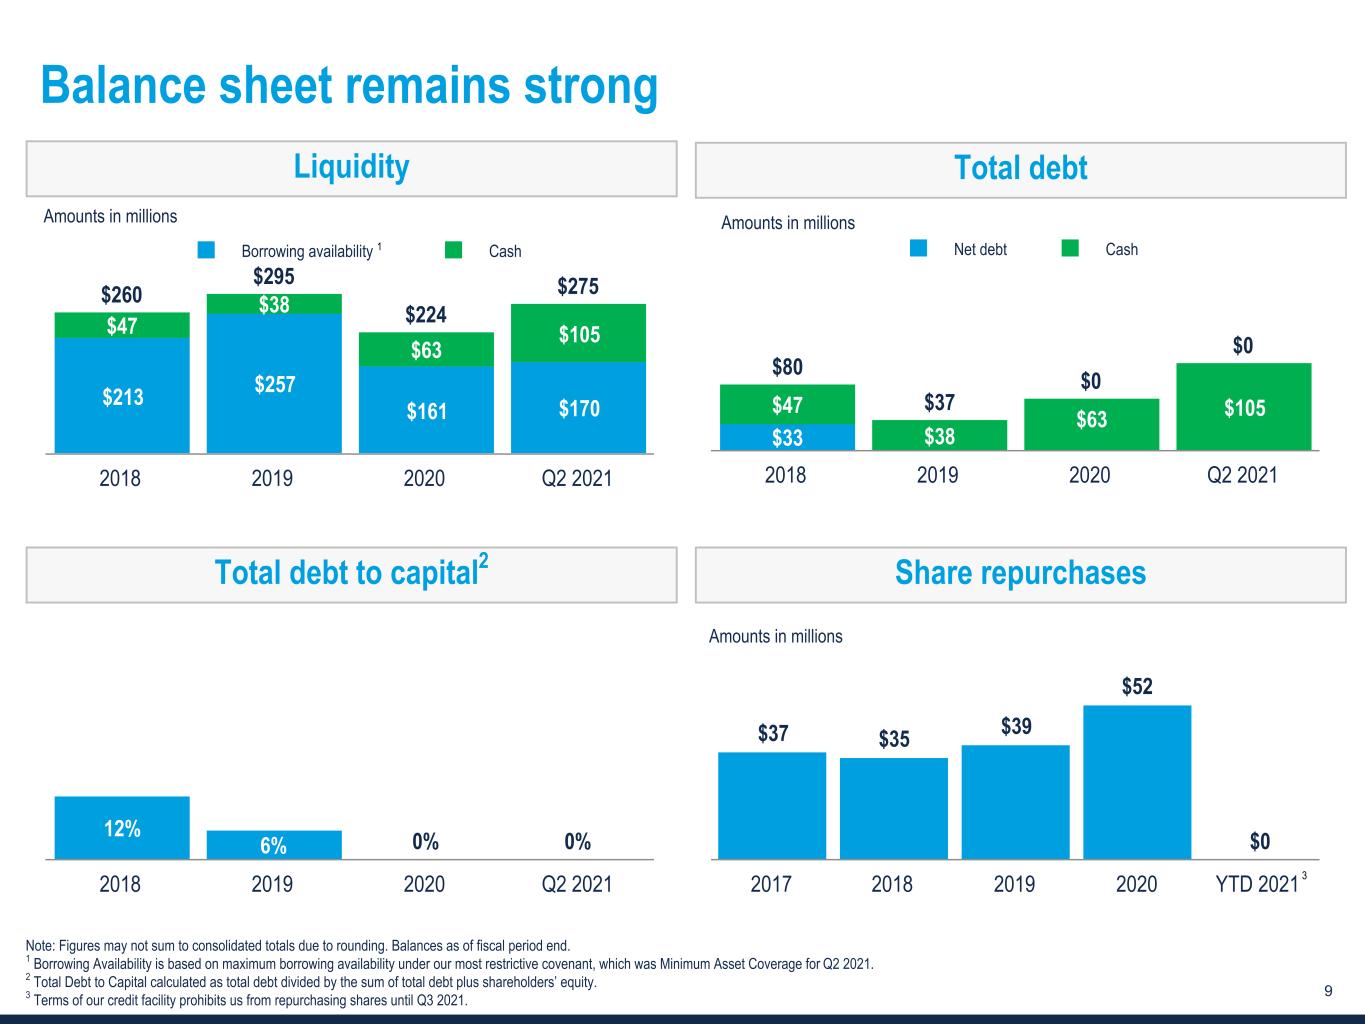
www.TrueBlue.c om 9 12% 6% 0% 0% 2018 2019 2020 Q2 2021 $80 $37 $0 $0 $33 $47 $38 $63 $105 Net debt Cash 2018 2019 2020 Q2 2021 $260 $295 $224 $275 $213 $257 $161 $170 $47 $38 $63 $105 Borrowing availability Cash 2018 2019 2020 Q2 2021 Balance sheet remains strong Amounts in millions Note: Figures may not sum to consolidated totals due to rounding. Balances as of fiscal period end. 1 Borrowing Availability is based on maximum borrowing availability under our most restrictive covenant, which was Minimum Asset Coverage for Q2 2021. 2 Total Debt to Capital calculated as total debt divided by the sum of total debt plus shareholders’ equity. 3 Terms of our credit facility prohibits us from repurchasing shares until Q3 2021. Liquidity Amounts in millions Share repurchasesTotal debt to capital2 Total debt 1 $37 $35 $39 $52 $0 2017 2018 2019 2020 YTD 2021 Amounts in millions 3


Outlook


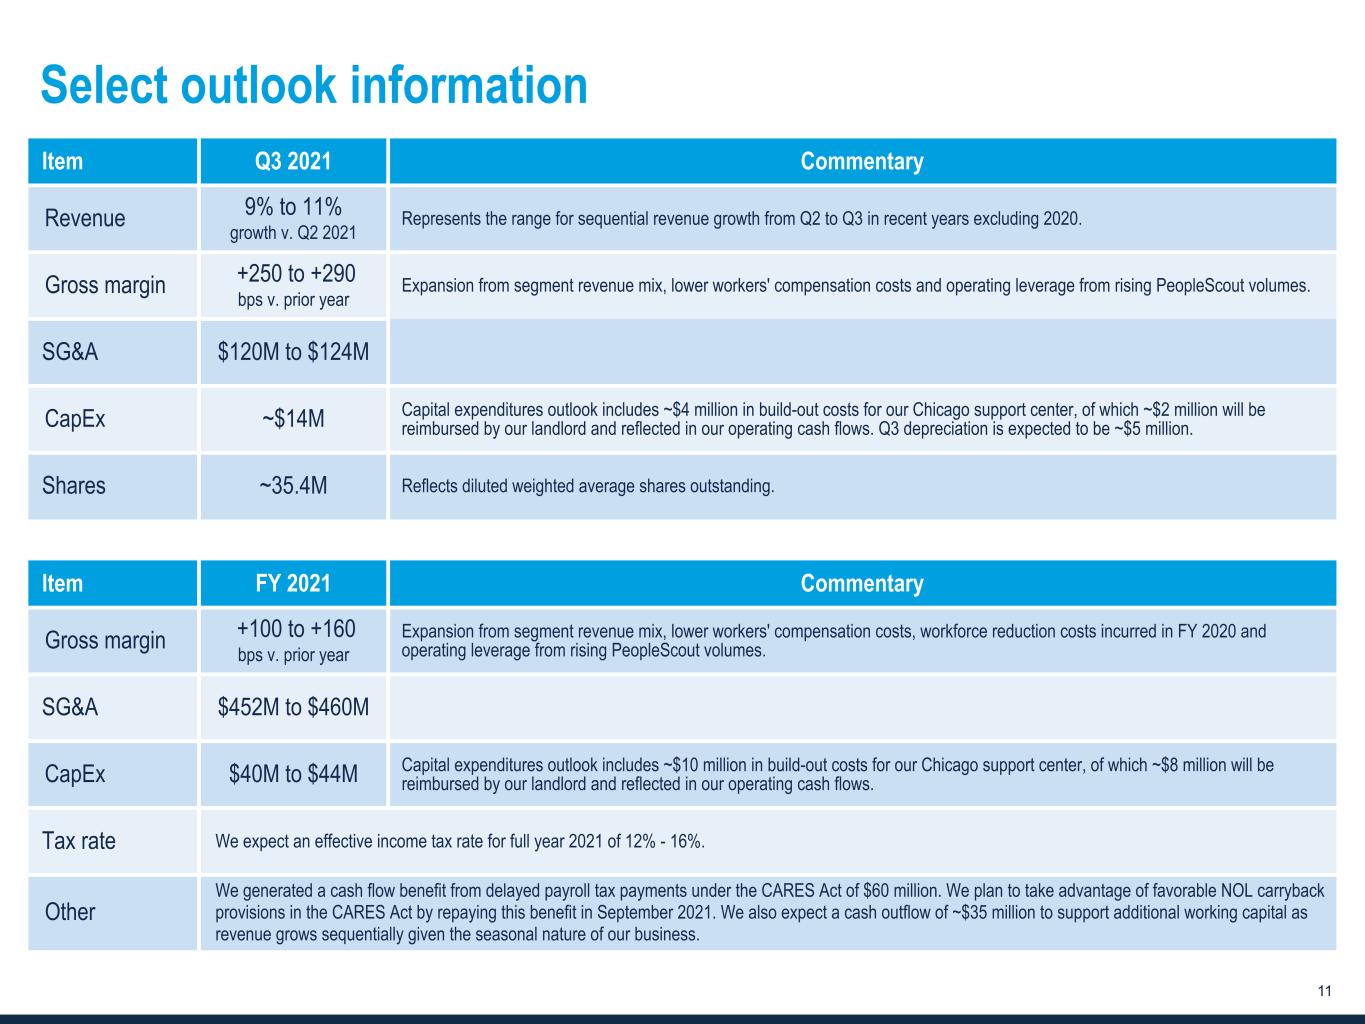
www.TrueBlue.c om 11 Select outlook information Item FY 2021 Commentary Gross margin +100 to +160 bps v. prior year Expansion from segment revenue mix, lower workers' compensation costs, workforce reduction costs incurred in FY 2020 and operating leverage from rising PeopleScout volumes. SG&A $452M to $460M CapEx $40M to $44M Capital expenditures outlook includes ~$10 million in build-out costs for our Chicago support center, of which ~$8 million will be reimbursed by our landlord and reflected in our operating cash flows. Tax rate We expect an effective income tax rate for full year 2021 of 12% - 16%. Other We generated a cash flow benefit from delayed payroll tax payments under the CARES Act of $60 million. We plan to take advantage of favorable NOL carryback provisions in the CARES Act by repaying this benefit in September 2021. We also expect a cash outflow of ~$35 million to support additional working capital as revenue grows sequentially given the seasonal nature of our business. Item Q3 2021 Commentary Revenue 9% to 11% growth v. Q2 2021 Represents the range for sequential revenue growth from Q2 to Q3 in recent years excluding 2020. Gross margin +250 to +290 bps v. prior year Expansion from segment revenue mix, lower workers' compensation costs and operating leverage from rising PeopleScout volumes. SG&A $120M to $124M CapEx ~$14M Capital expenditures outlook includes ~$4 million in build-out costs for our Chicago support center, of which ~$2 million will be reimbursed by our landlord and reflected in our operating cash flows. Q3 depreciation is expected to be ~$5 million. Shares ~35.4M Reflects diluted weighted average shares outstanding.


Appendix


www.TrueBlue.c om 13 NON-GAAP FINANCIAL MEASURES AND NON-GAAP RECONCILIATIONS In addition to financial measures presented in accordance with U.S. GAAP, we monitor certain non-GAAP key financial measures. The presentation of these non-GAAP financial measures is used to enhance the understanding of certain aspects of our financial performance. It is not meant to be considered in isolation, superior to, or as a substitute for the directly comparable financial measures prepared in accordance with U.S. GAAP, and may not be comparable to similarly titled measures of other companies. Non-GAAP measure Definition Purpose of adjusted measures EBITDA and Adjusted EBITDA EBITDA excludes from net income (loss): - interest expense and other income, net, - income taxes, and - depreciation and amortization. Adjusted EBITDA, further excludes: - Work Opportunity Tax Credit third-party processing fees, - amortization of software as a service assets, - workforce reductions costs, - COVID-19 government subsidies, and - other adjustments, net. - Enhances comparability on a consistent basis and provides investors with useful insight into the underlying trends of the business. - Used by management to assess performance and effectiveness of our business strategies. - Provides a measure, among others, used in the determination of incentive compensation for management. Adjusted net income (loss) and Adjusted net income (loss) per diluted share Net income (loss) and net income (loss) per diluted share, excluding: - amortization of intangibles of acquired businesses, - amortization of software as a service assets, - workforce reduction costs, - COVID-19 government subsidies - other adjustments, net, - tax effect of each adjustment to U.S. GAAP - Enhances comparability on a consistent basis and provides investors with useful insight into the underlying trends of the business. - Used by management to assess performance and effectiveness of our business strategies.


www.TrueBlue.c om 14 1. RECONCILIATION OF U.S. GAAP NET INCOME (LOSS) TO ADJUSTED NET INCOME (LOSS) AND ADJUSTED NET INCOME (LOSS) PER DILUTED SHARE (Unaudited) 13 weeks ended (in thousands, except for per share data) Jun 27, 2021 Jun 28, 2020 Net income (loss) $ 15,884 $ (8,168) Amortization of intangible assets of acquired businesses 1,810 2,071 Amortization of software as a service assets (1) 646 565 Workforce reduction costs (2) 14 11,011 COVID-19 government subsidies (2,296) (3,104) Other adjustments, net (3) 854 228 Tax effect of adjustments to net income (loss) (4) (449) (6,706) Adjusted net income (loss) $ 16,463 $ (4,103) Adjusted net income (loss) per diluted share $ 0.47 $ (0.12) Diluted weighted average shares outstanding 35,352 35,077 See the last slide of the appendix for footnotes. 2. RECONCILIATION OF U.S. GAAP NET INCOME (LOSS) TO EBITDA AND ADJUSTED EBITDA (Unaudited) 13 weeks ended (in thousands) Jun 27, 2021 Jun 28, 2020 Net income (loss) $ 15,884 $ (8,168) Income tax expense (benefit) 3,783 (13,475) Interest expense and other (income), net (724) 412 Depreciation and amortization 7,017 7,256 EBITDA 25,960 (13,975) Work Opportunity Tax Credit processing fees (5) 30 — Amortization of software as a service assets (1) 646 565 Workforce reduction costs (2) 14 11,011 COVID-19 government subsidies (2,296) (3,104) Other adjustments, net (3) 854 228 Adjusted EBITDA $ 25,208 $ (5,275)


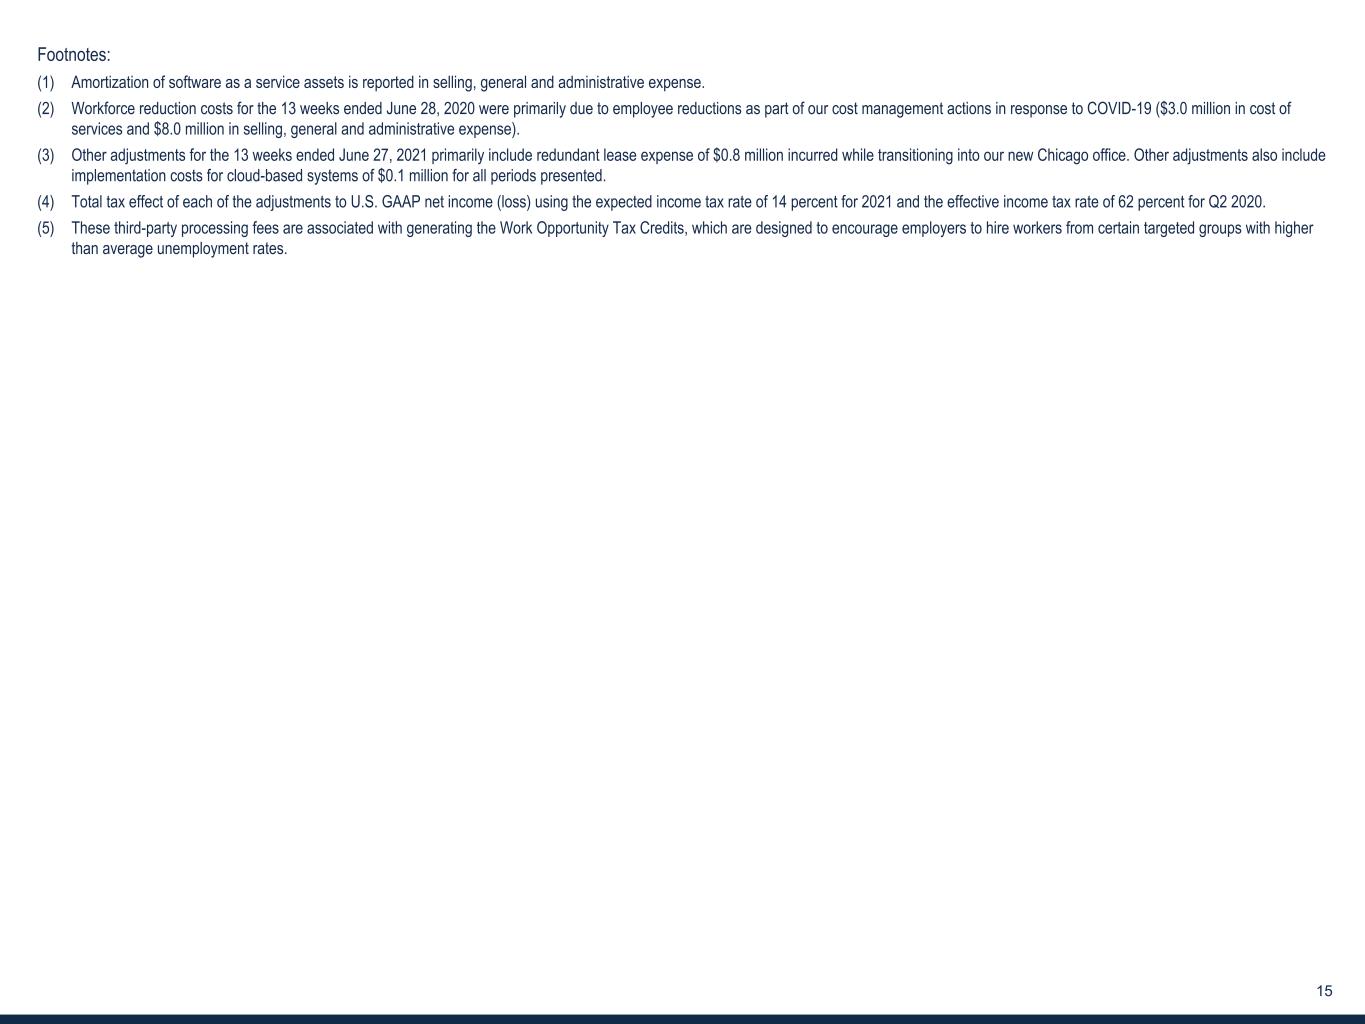
www.TrueBlue.c om 15 Footnotes: (1) Amortization of software as a service assets is reported in selling, general and administrative expense. (2) Workforce reduction costs for the 13 weeks ended June 28, 2020 were primarily due to employee reductions as part of our cost management actions in response to COVID-19 ($3.0 million in cost of services and $8.0 million in selling, general and administrative expense). (3) Other adjustments for the 13 weeks ended June 27, 2021 primarily include redundant lease expense of $0.8 million incurred while transitioning into our new Chicago office. Other adjustments also include implementation costs for cloud-based systems of $0.1 million for all periods presented. (4) Total tax effect of each of the adjustments to U.S. GAAP net income (loss) using the expected income tax rate of 14 percent for 2021 and the effective income tax rate of 62 percent for Q2 2020. (5) These third-party processing fees are associated with generating the Work Opportunity Tax Credits, which are designed to encourage employers to hire workers from certain targeted groups with higher than average unemployment rates.


 
Investor Roadshow Presentation July 2021


Forward-Looking Statements This document contains forward-looking statements relating to our plans and expectations, all of which are subject to risks and uncertainties. Such statements are based on management’s expectations and assumptions as of the date of this release and involve many risks and uncertainties that could cause actual results to differ materially from those expressed or implied in our forward-looking statements including: (1) national and global economic conditions, (2) the continued impact of COVID-19 and related economic impact and governmental response, (3) our ability to access sufficient capital to finance our operations, including our ability to comply with covenants contained in our revolving credit facility, (4) our ability to attract and retain clients, (5) our ability to attract sufficient qualified candidates and employees to meet the needs of our clients, (6) our ability to maintain profit margins, (7) new laws, regulations, and government incentives that could affect our operations or financial results, (8) our ability to successfully execute on business strategies to further digitalize our business model, and (9) any reduction or change in tax credits we utilize, including the Work Opportunity Tax Credit. Other information regarding factors that could affect our results is included in our Securities Exchange Commission (SEC) filings, including the company’s most recent reports on Forms 10-K and 10-Q, copies of which may be obtained by visiting our website at www.trueblue.com under the Investor Relations section or the SEC’s website at www.sec.gov. We assume no obligation to update or revise any forward-looking statement, whether as a result of new information, future events, or otherwise, except as required by law. Any other references to future financial estimates are included for informational purposes only and subject to risk factors discussed in our most recent filings with the SEC. In addition, we use several non-GAAP financial measures when presenting our financial results in this document. Please refer to the reconciliations between our GAAP and non-GAAP financial measures in the appendix to this presentation and on our website at www.trueblue.com under the Investor Relations section for additional information on both current and historical periods. The presentation of these non-GAAP financial measures is used to enhance the understanding of certain aspects of our financial performance. It is not meant to be considered in isolation, superior to, or as a substitute for the directly comparable financial measures prepared in accordance with U.S. GAAP, and may not be comparable to similarly titled measures of other companies. Any comparisons made herein to other periods are based on a comparison to the same period in the prior year unless otherwise stated.


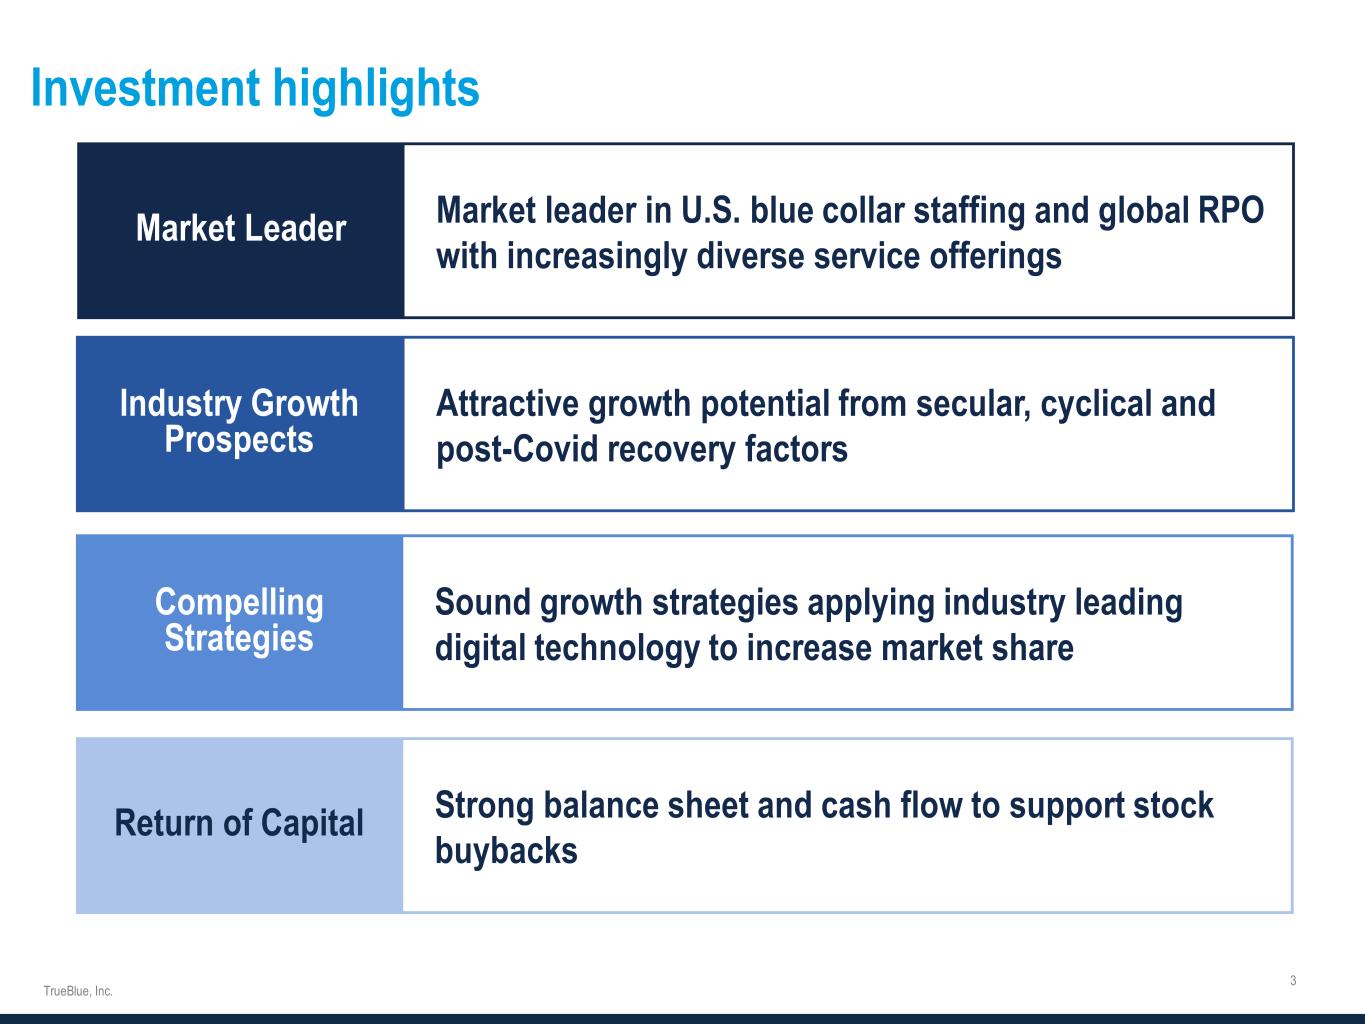
Investment highlights Return of Capital Market leader in U.S. blue collar staffing and global RPO with increasingly diverse service offerings Attractive growth potential from secular, cyclical and post-Covid recovery factors Strong balance sheet and cash flow to support stock buybacks Sound growth strategies applying industry leading digital technology to increase market share


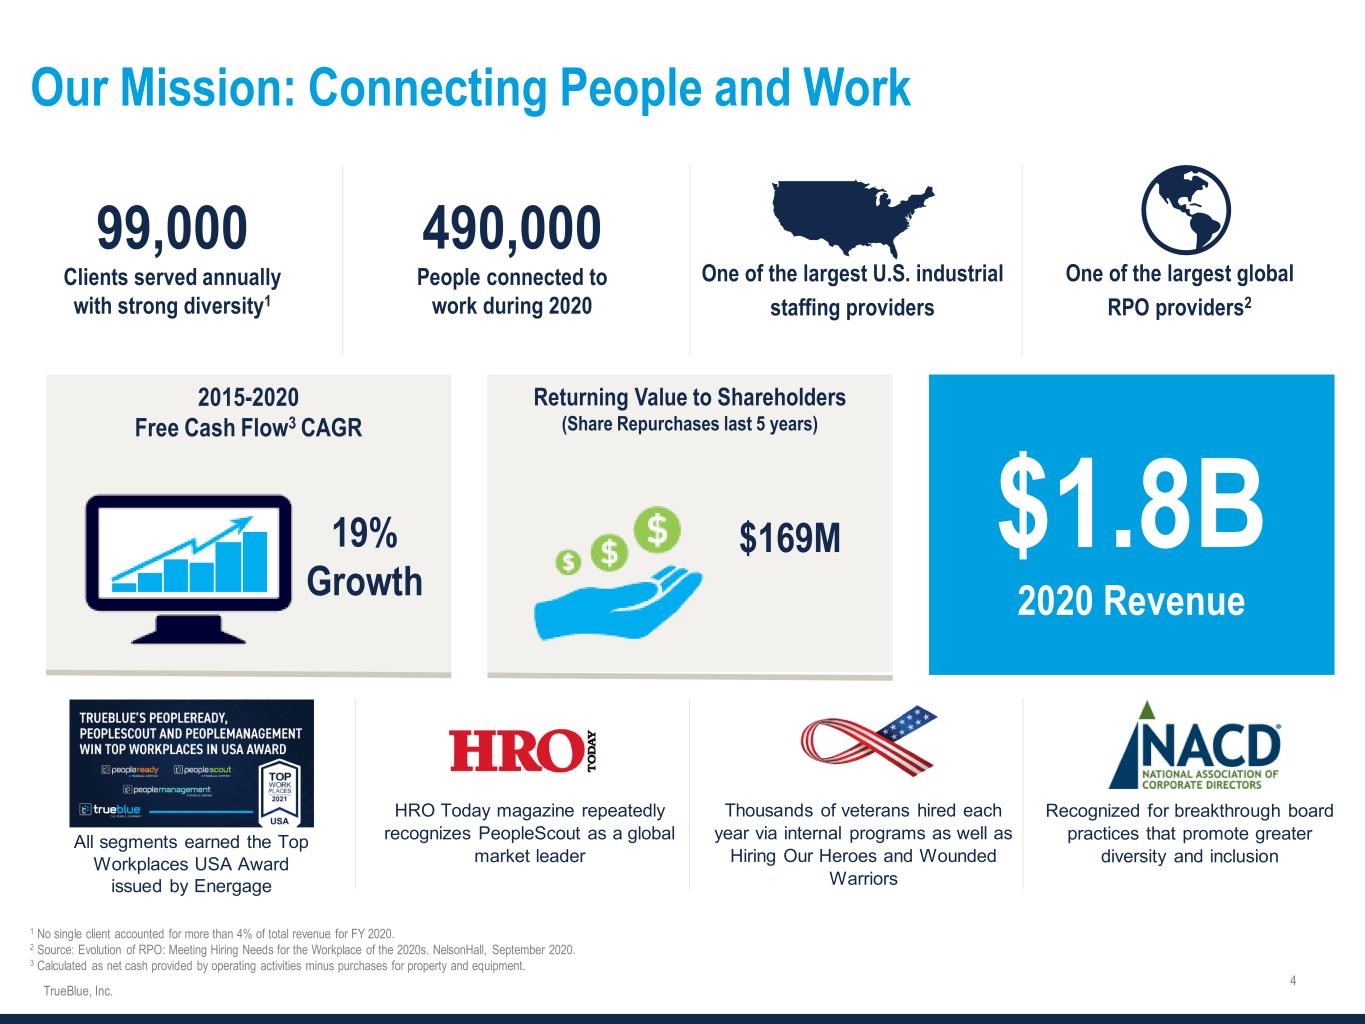
Our Mission: Connecting People and Work 99,000 Clients served annually with strong diversity1 490,000 People connected to work during 2020 One of the largest U.S. industrial staffing providers One of the largest global RPO providers2 Returning Value to Shareholders (Share Repurchases last 5 years) 2015-2020 Free Cash Flow3 CAGR $1.8B 2020 Revenue 19% Growth $169M HRO Today magazine repeatedly recognizes PeopleScout as a global market leader Thousands of veterans hired each year via internal programs as well as Hiring Our Heroes and Wounded Warriors Recognized for breakthrough board practices that promote greater diversity and inclusion 1 No single client accounted for more than 4% of total revenue for FY 2020. 2 Source: Evolution of RPO: Meeting Hiring Needs for the Workplace of the 2020s. NelsonHall, September 2020. 3 Calculated as net cash provided by operating activities minus purchases for property and equipment. All segments earned the Top Workplaces USA Award issued by Energage


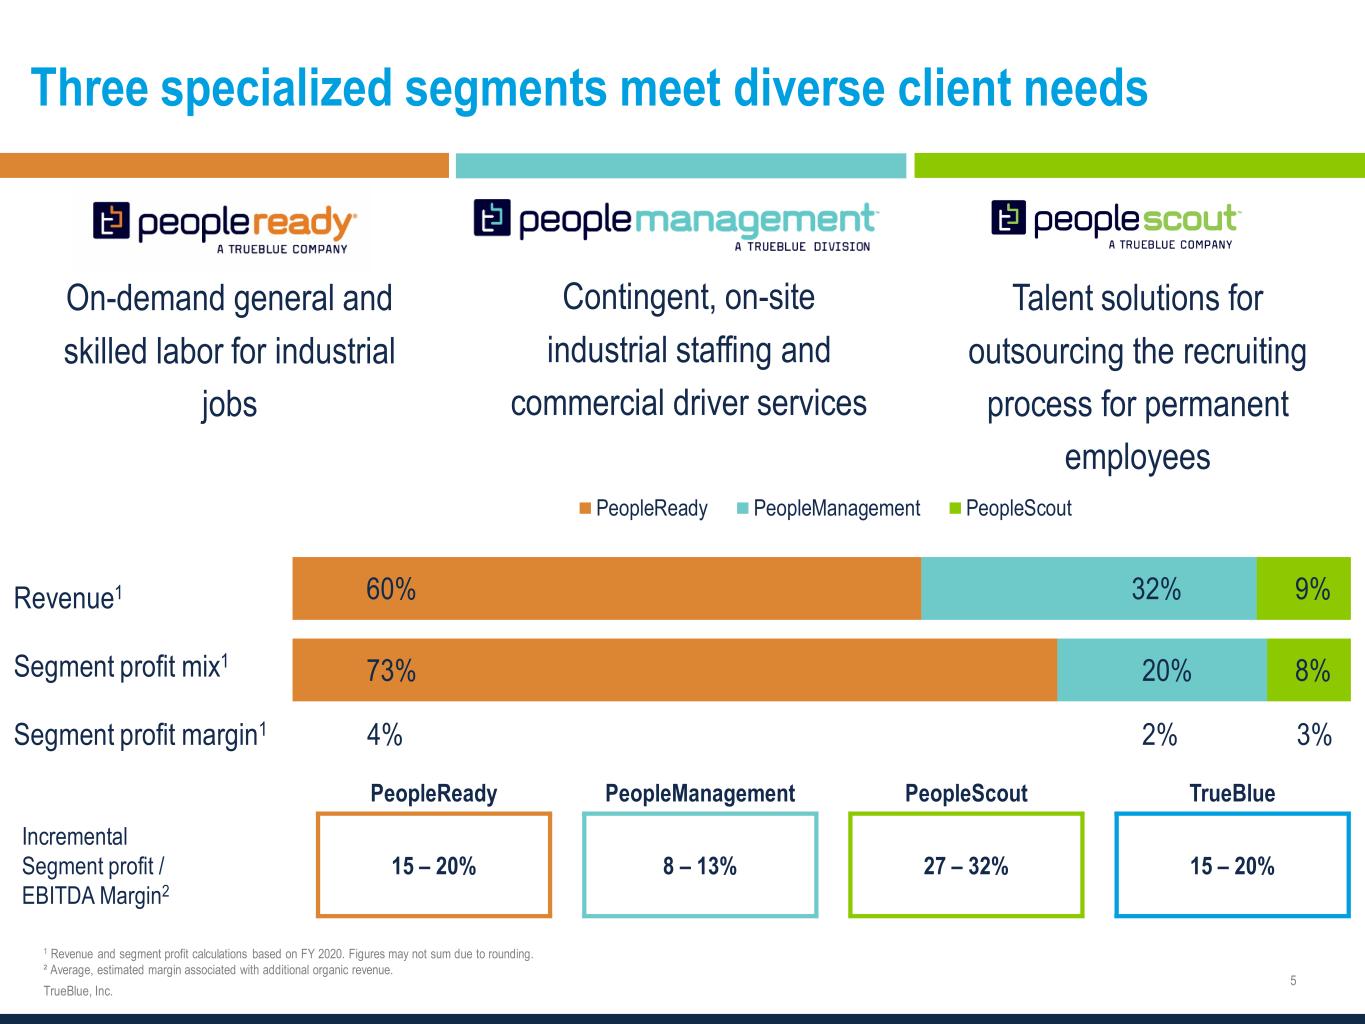
Three specialized segments meet diverse client needs On-demand general and skilled labor for industrial jobs Contingent, on-site industrial staffing and commercial driver services Talent solutions for outsourcing the recruiting process for permanent employees 1 Revenue and segment profit calculations based on FY 2020. Figures may not sum due to rounding. ² Average, estimated margin associated with additional organic revenue. PeopleReady PeopleManagement PeopleScout TrueBlue Incremental Segment profit / EBITDA Margin2 15 – 20% 8 – 13% 27 – 32% 15 – 20% 60% 73% 32% 20% 9% 8% PeopleReady PeopleManagement PeopleScout Revenue1 Segment profit mix1 Segment profit margin1 4% 2% 3%


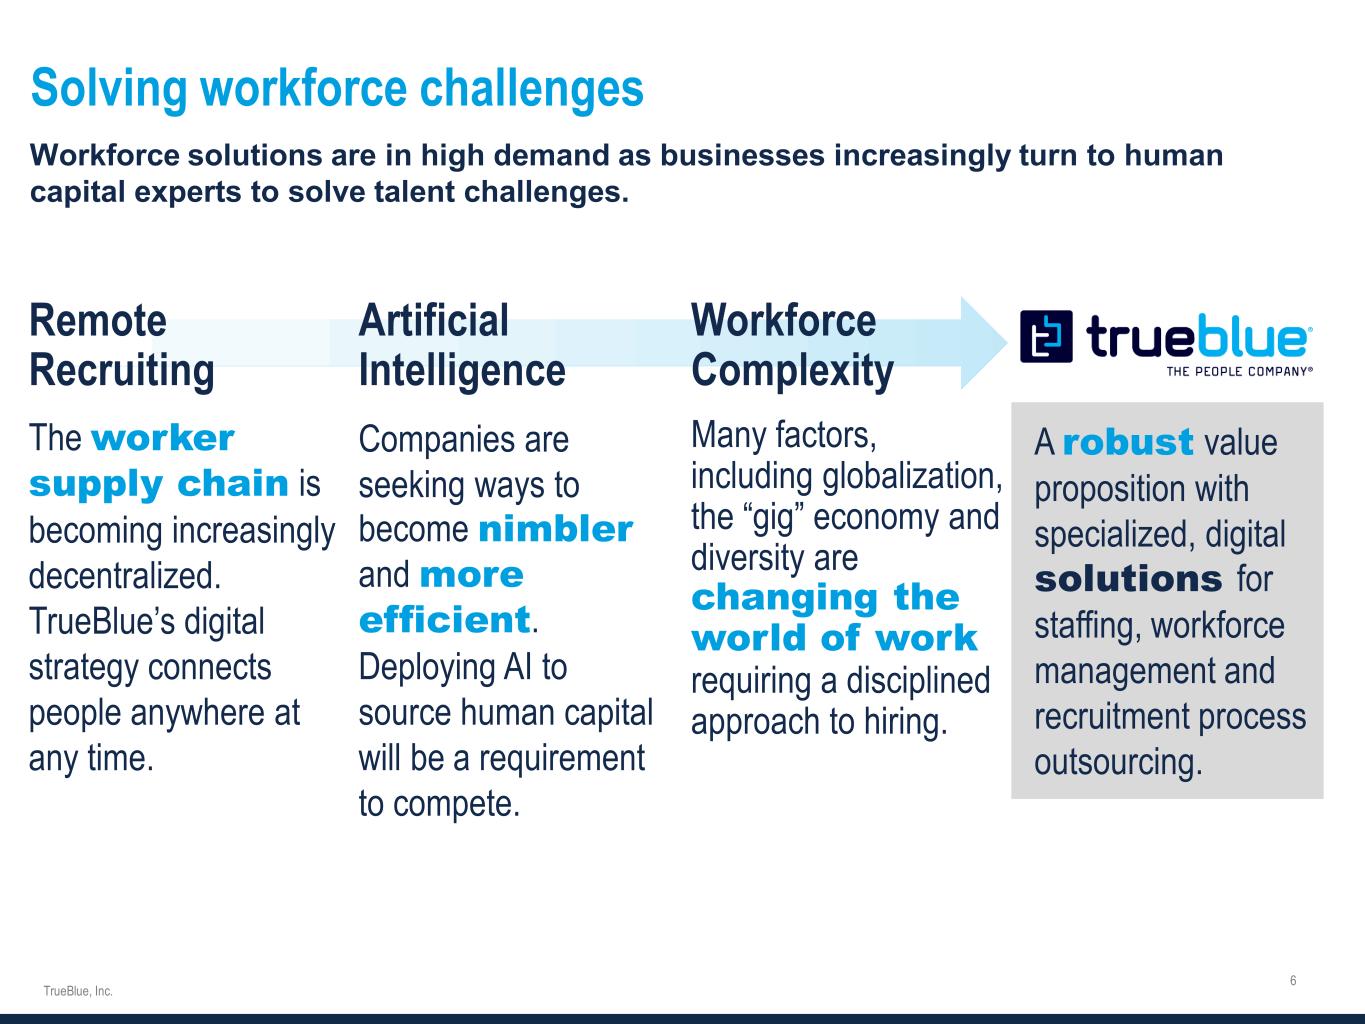
Solving workforce challenges Workforce Complexity Many factors, including globalization, the “gig” economy and diversity are changing the world of work requiring a disciplined approach to hiring. Artificial Intelligence Companies are seeking ways to become nimbler and more efficient Deploying AI to source human capital will be a requirement to compete. Remote Recruiting The worker supply chain is becoming increasingly decentralized. TrueBlue’s digital strategy connects people anywhere at any time. Workforce solutions are in high demand as businesses increasingly turn to human capital experts to solve talent challenges. A robust value proposition with specialized, digital solutions for staffing, workforce management and recruitment process outsourcing.


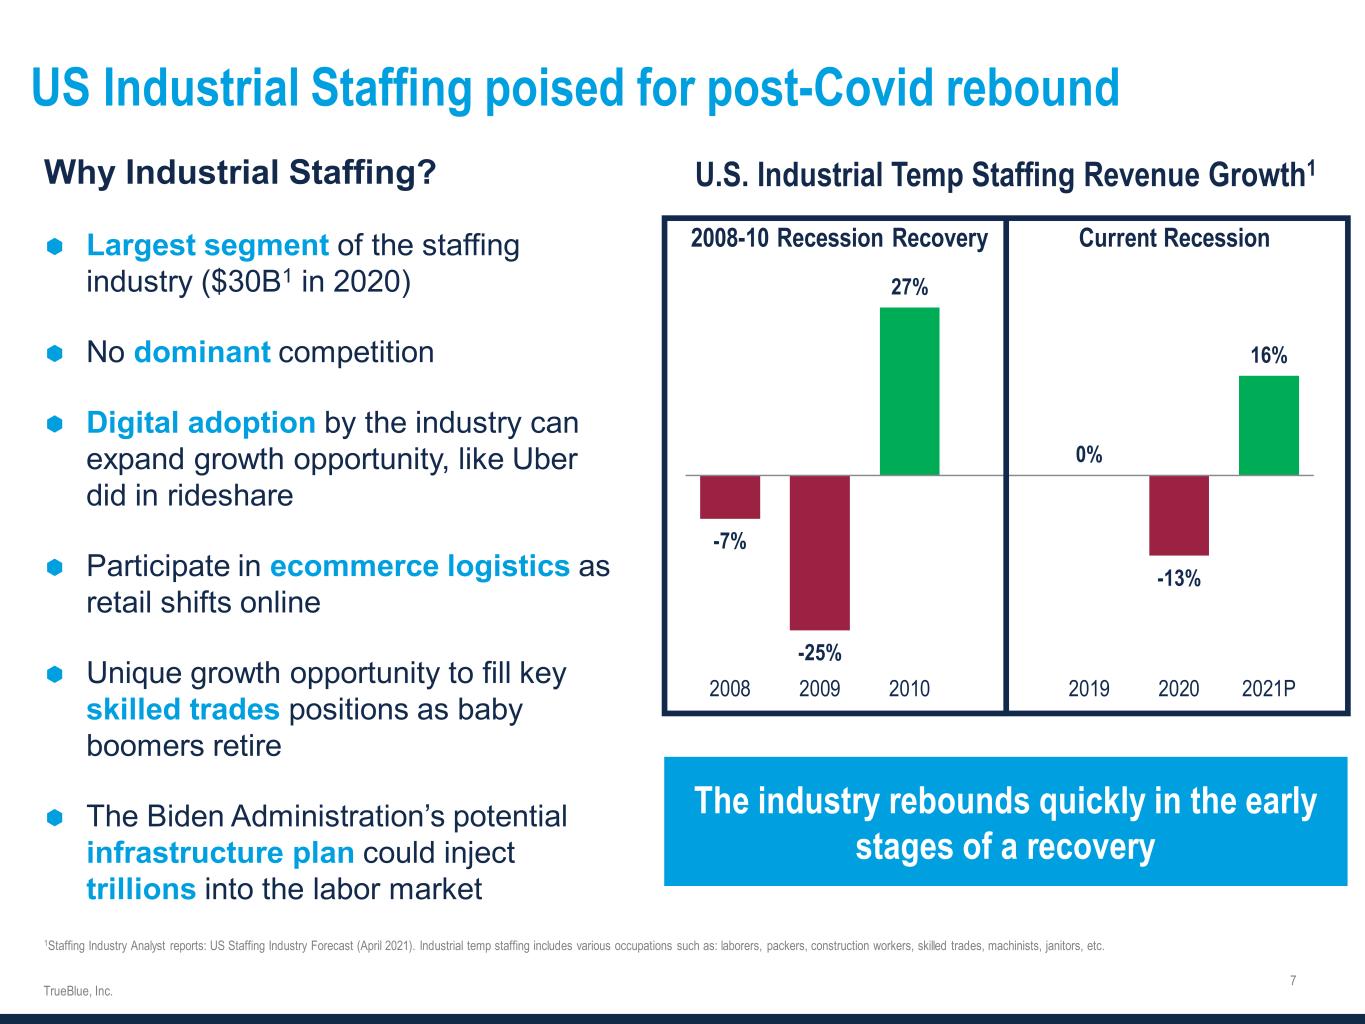
US Industrial Staffing poised for post-Covid rebound Why Industrial Staffing?  Largest segment of the staffing industry ($30B1 in 2020)  No dominant competition  Digital adoption by the industry can expand growth opportunity, like Uber did in rideshare  Participate in ecommerce logistics as retail shifts online  Unique growth opportunity to fill key skilled trades positions as baby boomers retire  The Biden Administration’s potential infrastructure plan could inject trillions into the labor market 1Staffing Industry Analyst reports: US Staffing Industry Forecast (April 2021). Industrial temp staffing includes various occupations such as: laborers, packers, construction workers, skilled trades, machinists, janitors, etc. U.S. Industrial Temp Staffing Revenue Growth1 -7% -25% 27% 0% -13% 16% 2008 2009 2010 2019 2020 2021P 2008-10 Recession Recovery Current Recession The industry rebounds quickly in the early stages of a recovery


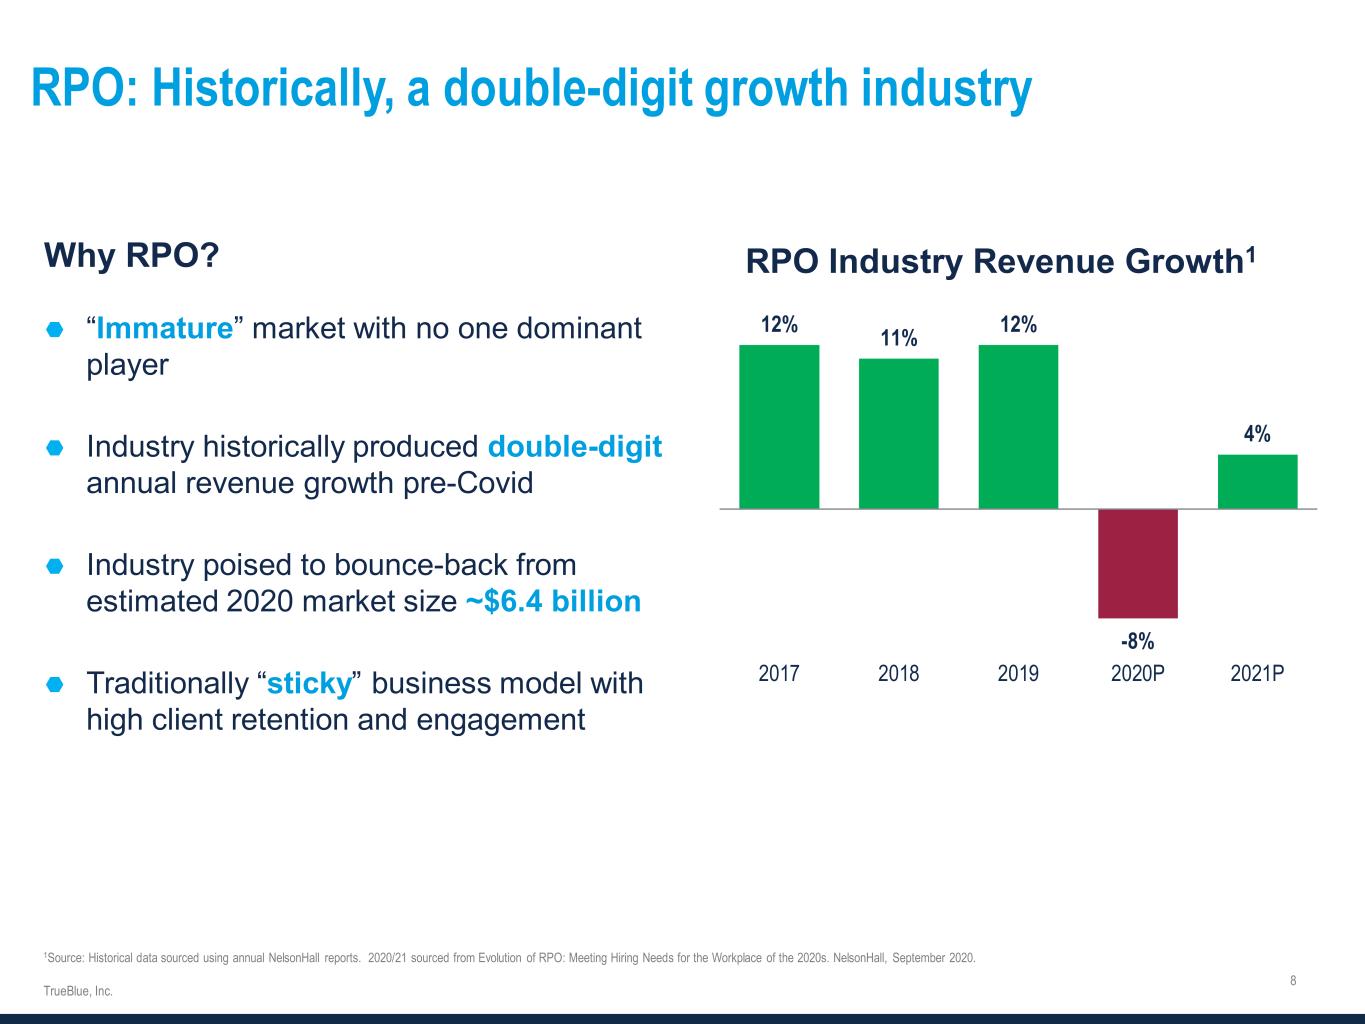
RPO: Historically, a double-digit growth industry Why RPO?  “Immature” market with no one dominant player  Industry historically produced double-digit annual revenue growth pre-Covid  Industry poised to bounce-back from estimated 2020 market size ~$6.4 billion  Traditionally “sticky” business model with high client retention and engagement 1Source: Historical data sourced using annual NelsonHall reports. 2020/21 sourced from Evolution of RPO: Meeting Hiring Needs for the Workplace of the 2020s. NelsonHall, September 2020. 12% 11% 12% -8% 4% 2017 2018 2019 2020P 2021P RPO Industry Revenue Growth1


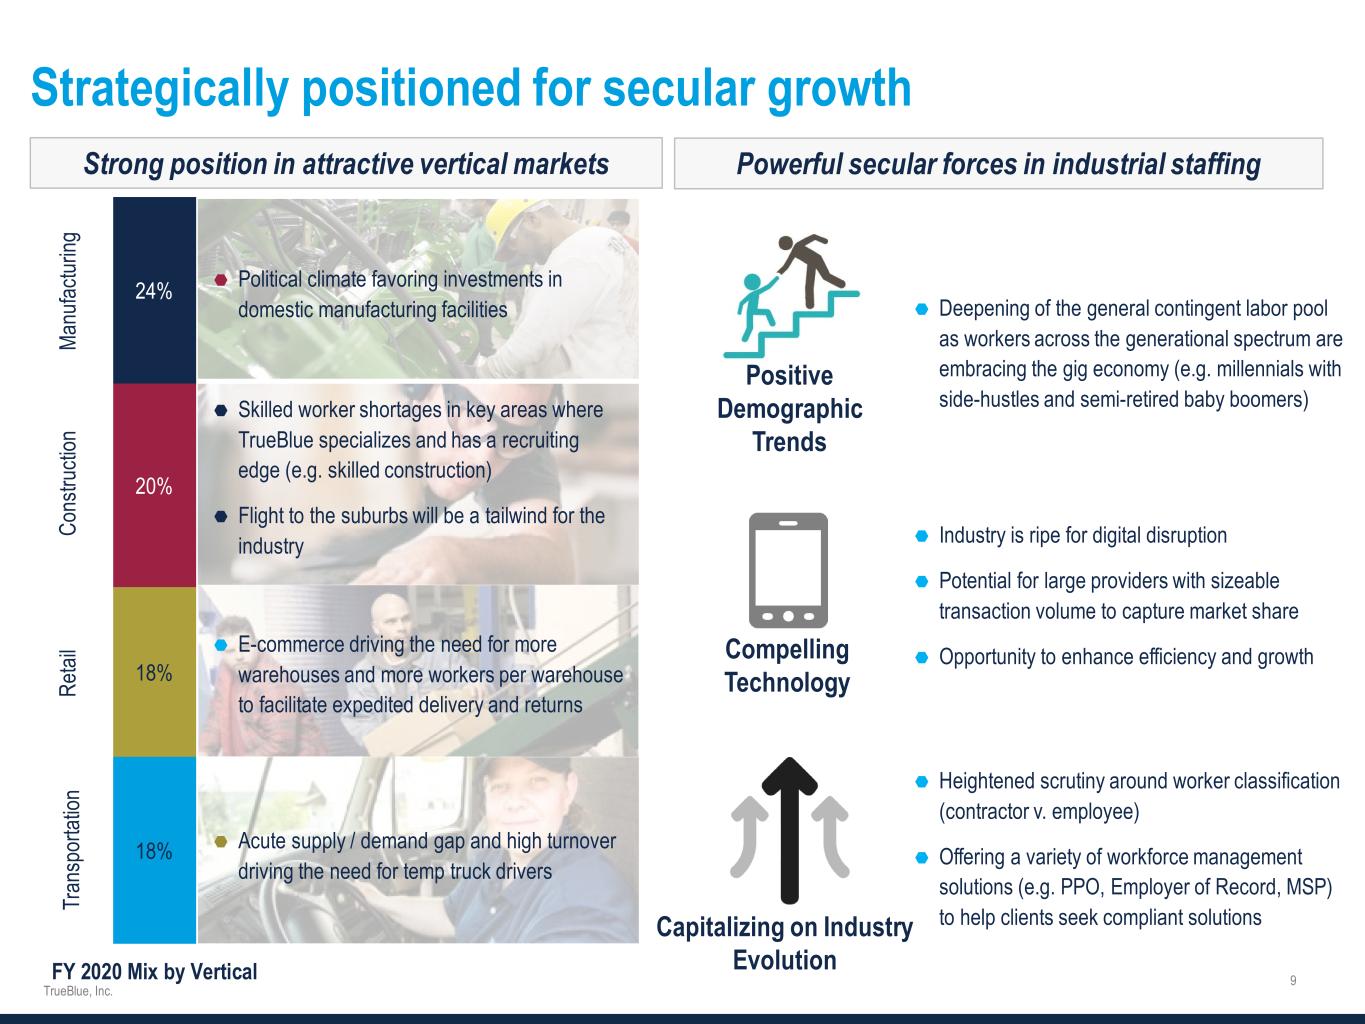
Strategically positioned for secular growth Strong position in attractive vertical markets Powerful secular forces in industrial staffing  Deepening of the general contingent labor pool as workers across the generational spectrum are embracing the gig economy (e.g. millennials with side-hustles and semi-retired baby boomers) Positive Demographic Trends  Industry is ripe for digital disruption  Potential for large providers with sizeable transaction volume to capture market share  Opportunity to enhance efficiency and growthCompelling Technology  Heightened scrutiny around worker classification (contractor v. employee)  Offering a variety of workforce management solutions (e.g. PPO, Employer of Record, MSP) to help clients seek compliant solutionsCapitalizing on Industry Evolution 18% 18% 20% 24% FY 2020 Mix by Vertical Co ns tru cti on Ma nu fac tur ing Tr an sp or tat ion  Skilled worker shortages in key areas where TrueBlue specializes and has a recruiting edge (e.g. skilled construction)  Flight to the suburbs will be a tailwind for the industry  Political climate favoring investments in domestic manufacturing facilities  Acute supply / demand gap and high turnover driving the need for temp truck drivers  E-commerce driving the need for more warehouses and more workers per warehouse to facilitate expedited delivery and returnsRe tai l


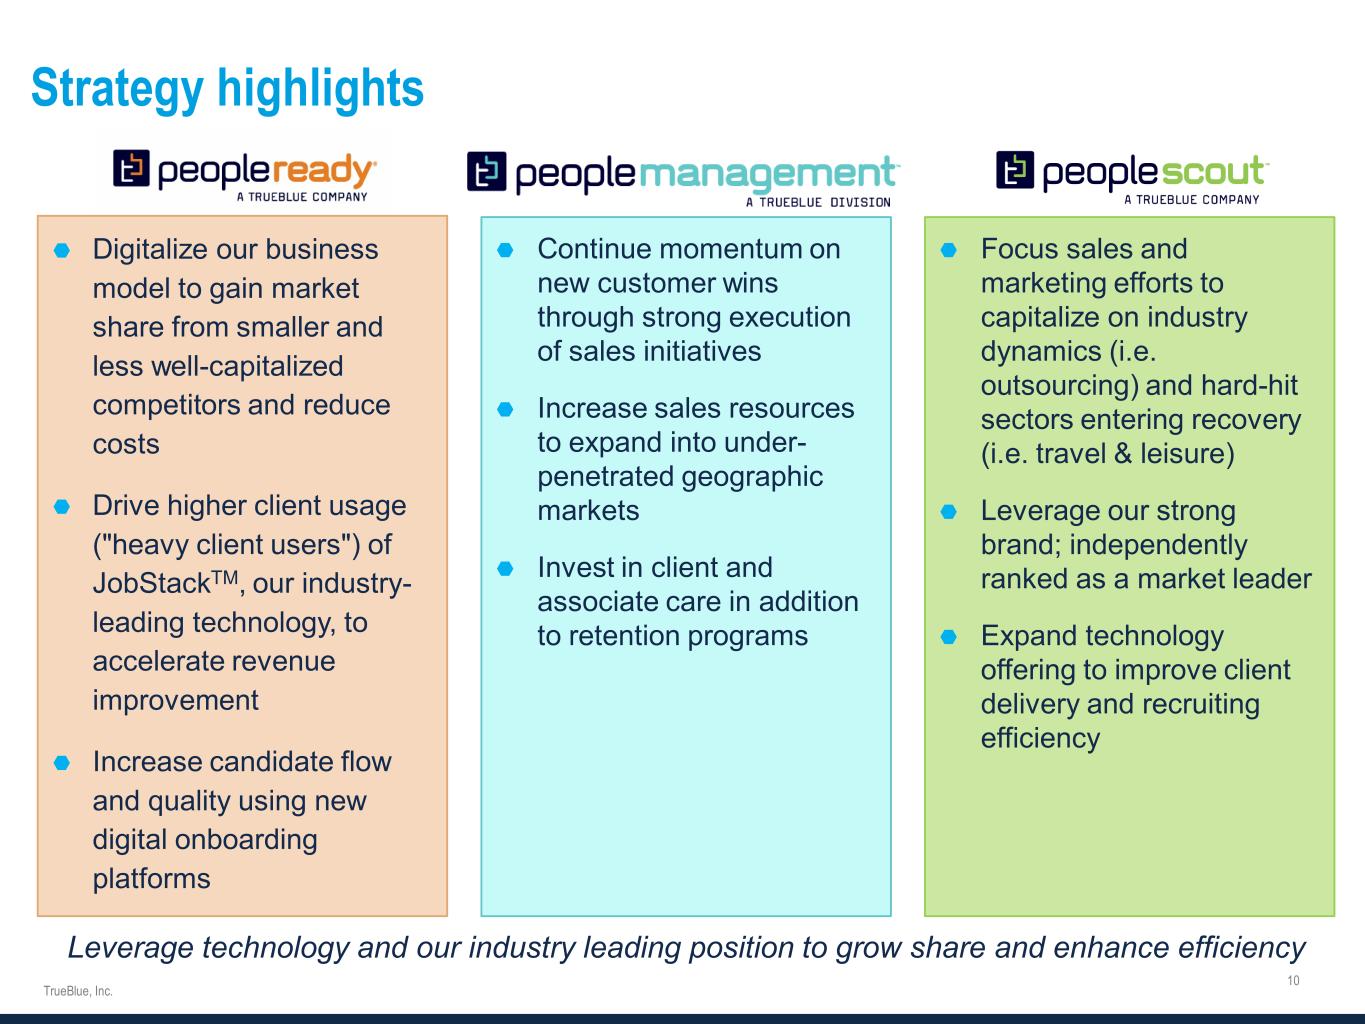
Leverage technology and our industry leading position to grow share and enhance efficiency Strategy highlights  Digitalize our business model to gain market share from smaller and less well-capitalized competitors and reduce costs  Drive higher client usage ("heavy client users") of JobStackTM, our industry- leading technology, to accelerate revenue improvement  Increase candidate flow and quality using new digital onboarding platforms  Continue momentum on new customer wins through strong execution of sales initiatives  Increase sales resources to expand into under- penetrated geographic markets  Invest in client and associate care in addition to retention programs  Focus sales and marketing efforts to capitalize on industry dynamics (i.e. outsourcing) and hard-hit sectors entering recovery (i.e. travel & leisure)  Leverage our strong brand; independently ranked as a market leader  Expand technology offering to improve client delivery and recruiting efficiency


PeopleReady: The digital strategy is working What is JobStack? Initial Focus: Industry leading mobile app that connects our associates with jobs and simplifies ordering Order fulfillment: Digital fills of 58%, up 5 pts YOY Recent achievements: New digital onboarding technology cut application time in half, increasing candidates Heavy client users1 have disproportionately higher growth (+40 pts faster v. non-users) 46% of eligible revenue2 from heavy client users up 16 pts YOY Go-forward focus: Drive revenue growth with heavy client users Significant opportunity exists: over 40% of clients indicated they use 2+ staffing firms Reduce delivery costs • Opportunity to leverage technology, centralize work activities and repurpose job roles • Pilots rolled out in 1H 2021 Gain users: >27,000 clients today Associate adoption: >90% in 2Q21 1 Heavy client users are clients for any given month that have 50+ touches on JobStack (entering an order, rating a worker, etc.). Year-over-year growth rates for heavy client users are calculated on a same customer basis. 2 Eligible revenue includes our U.S. on-demand business. Skilled trades, Canada and Puerto Rico are excluded as non-eligible users.


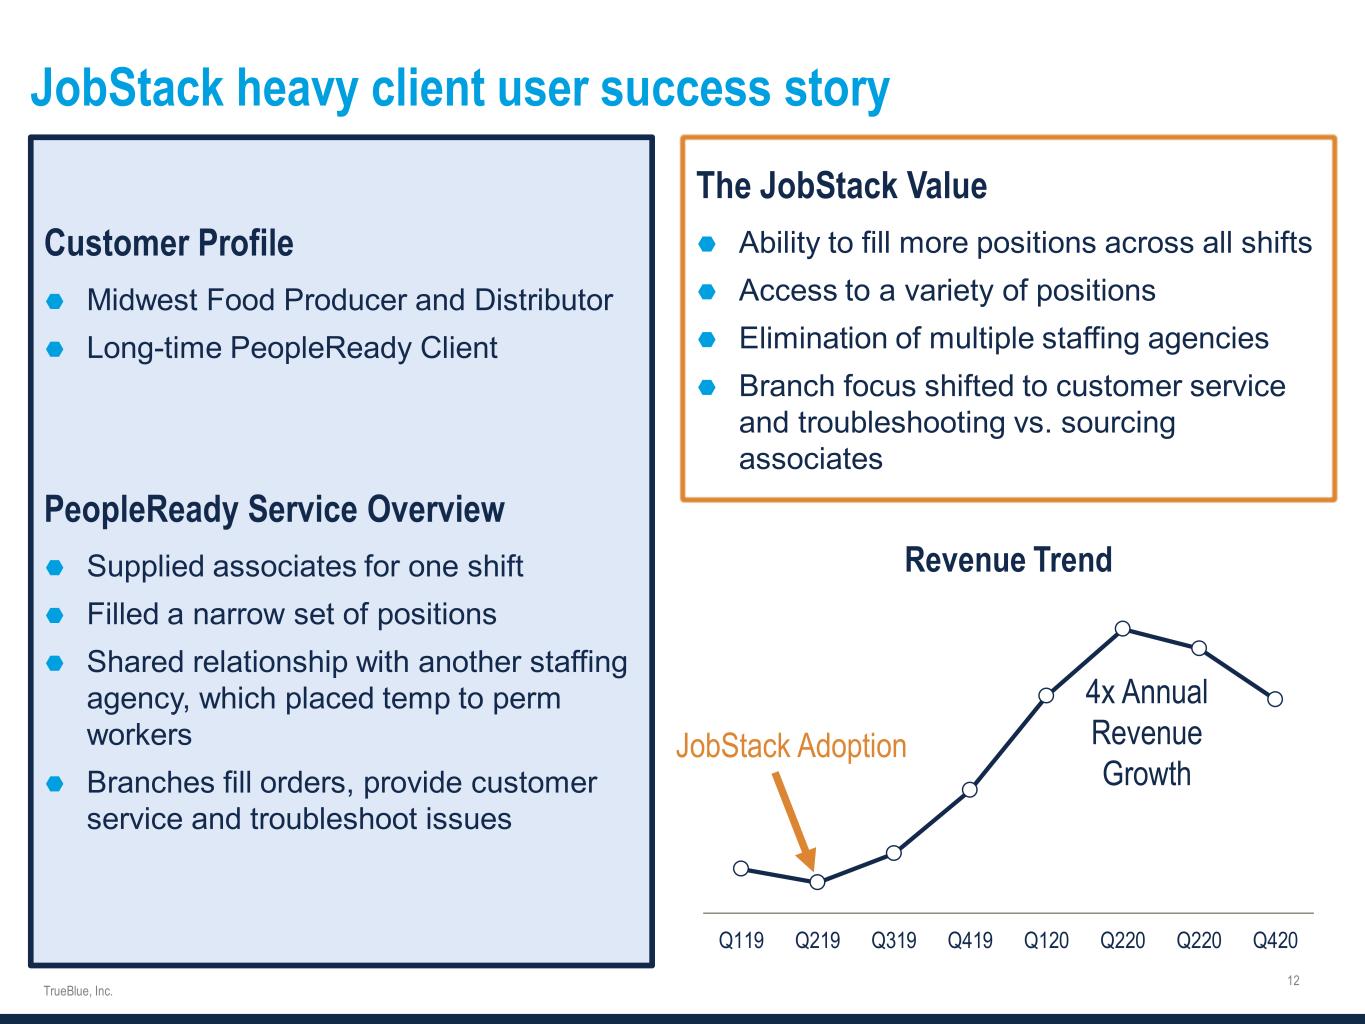
JobStack heavy client user success story Customer Profile  Midwest Food Producer and Distributor  Long-time PeopleReady Client PeopleReady Service Overview  Supplied associates for one shift  Filled a narrow set of positions  Shared relationship with another staffing agency, which placed temp to perm workers  Branches fill orders, provide customer service and troubleshoot issues The JobStack Value  Ability to fill more positions across all shifts  Access to a variety of positions  Elimination of multiple staffing agencies  Branch focus shifted to customer service and troubleshooting vs. sourcing associates Q119 Q219 Q319 Q419 Q120 Q220 Q220 Q420 Revenue Trend JobStack Adoption 4x Annual Revenue Growth


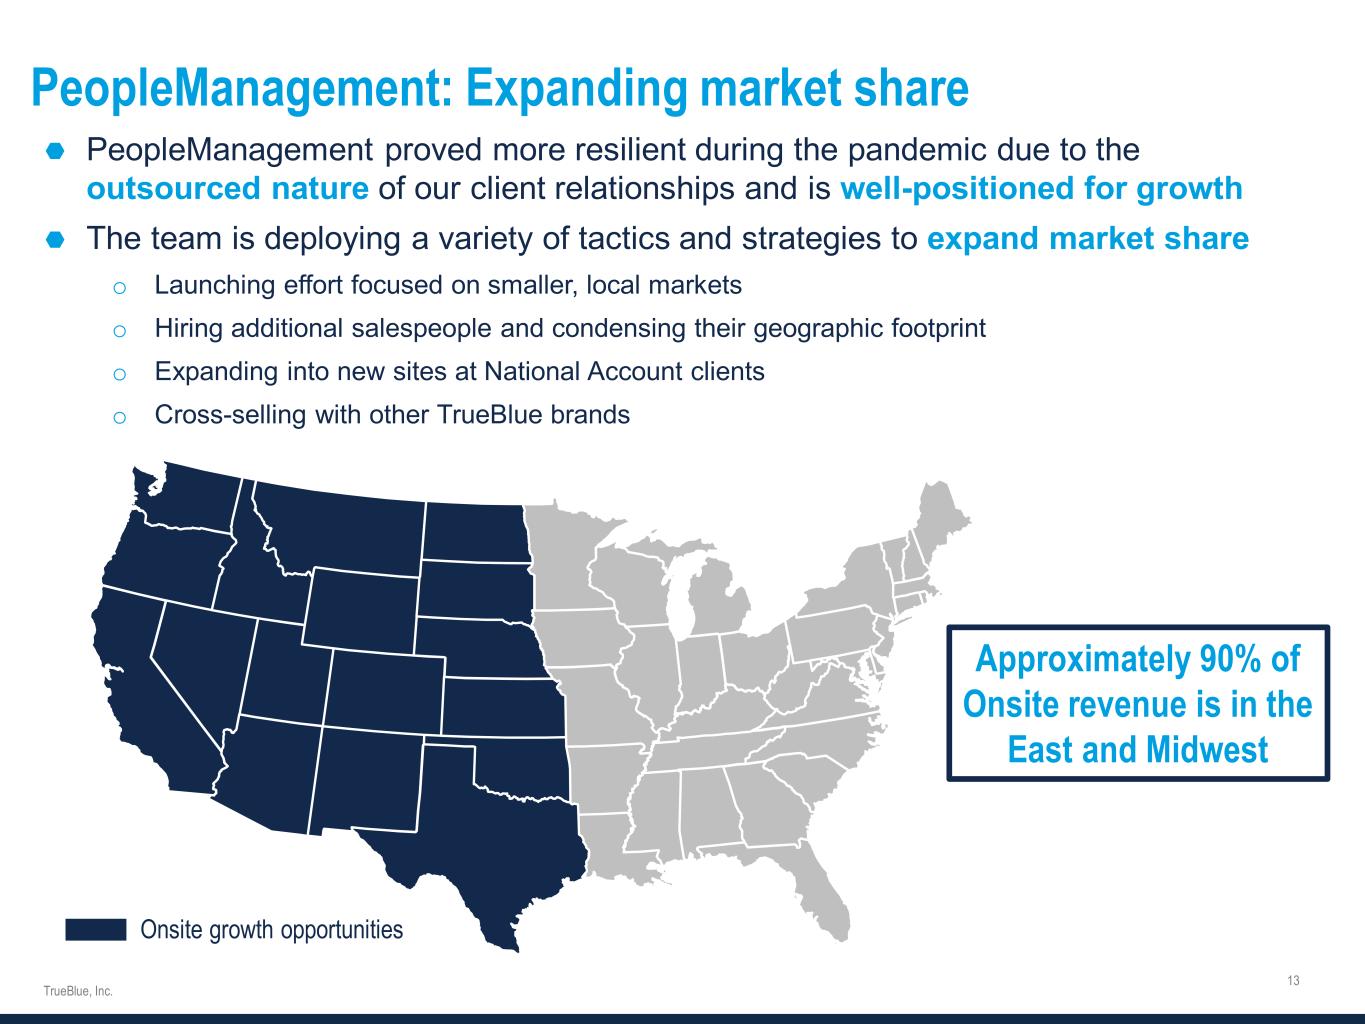
PeopleManagement: Expanding market share  PeopleManagement proved more resilient during the pandemic due to the outsourced nature of our client relationships and is well-positioned for growth  The team is deploying a variety of tactics and strategies to expand market share o Launching effort focused on smaller, local markets o Hiring additional salespeople and condensing their geographic footprint o Expanding into new sites at National Account clients o Cross-selling with other TrueBlue brands Approximately 90% of Onsite revenue is in the East and Midwest Onsite growth opportunities


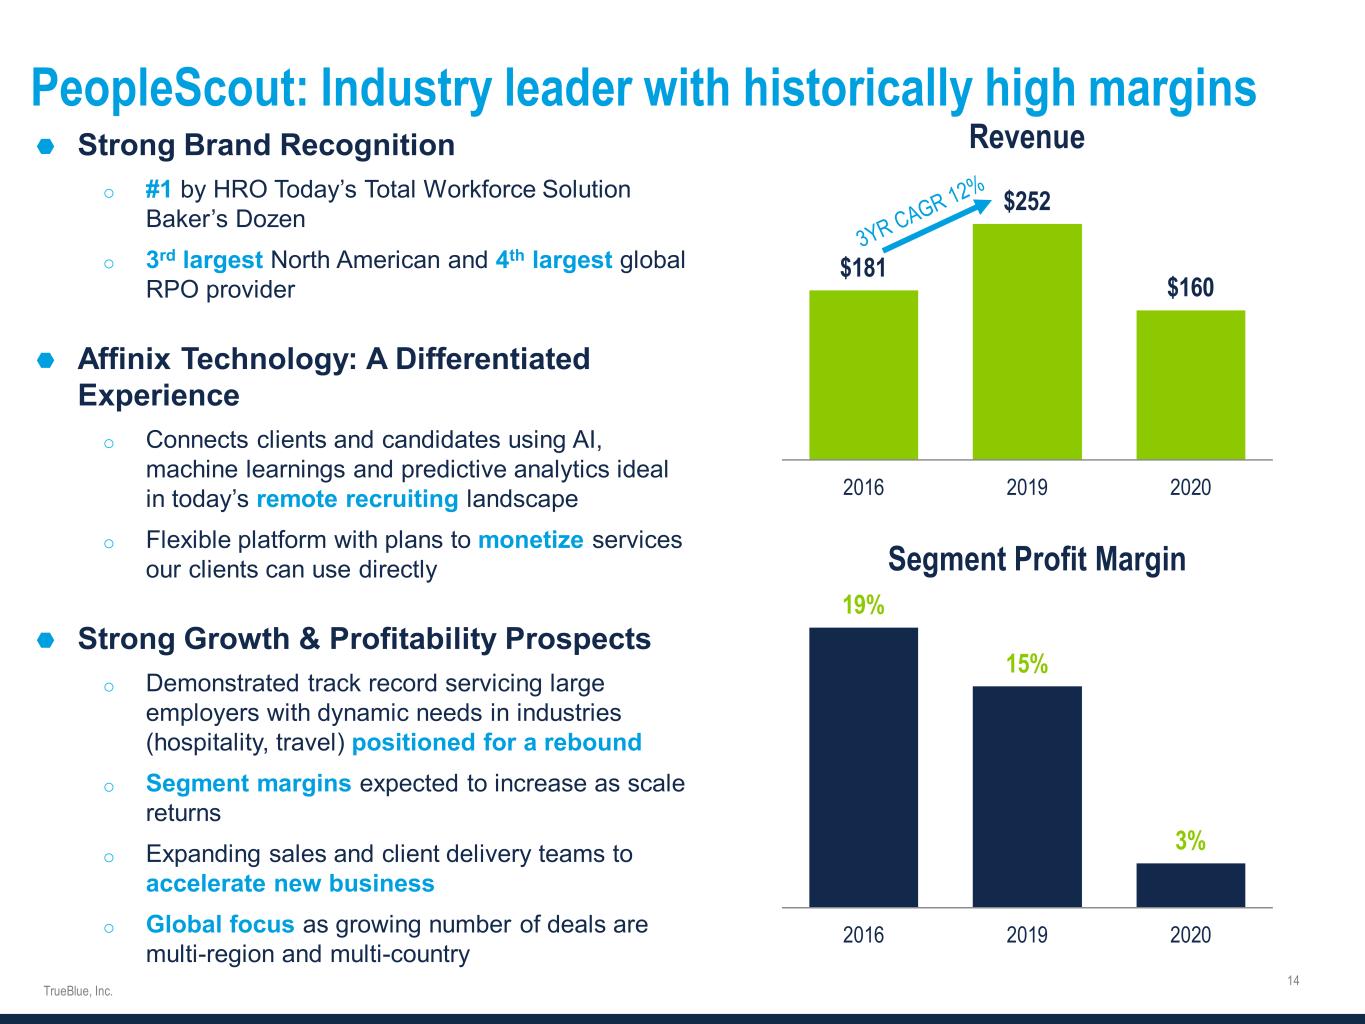
PeopleScout: Industry leader with historically high margins  Strong Brand Recognition o #1 by HRO Today’s Total Workforce Solution Baker’s Dozen o 3rd largest North American and 4th largest global RPO provider  Affinix Technology: A Differentiated Experience o Connects clients and candidates using AI, machine learnings and predictive analytics ideal in today’s remote recruiting landscape o Flexible platform with plans to monetize services our clients can use directly  Strong Growth & Profitability Prospects o Demonstrated track record servicing large employers with dynamic needs in industries (hospitality, travel) positioned for a rebound o Segment margins expected to increase as scale returns o Expanding sales and client delivery teams to accelerate new business o Global focus as growing number of deals are multi-region and multi-country $181 $252 $160 2016 2019 2020 Revenue 19% 15% 3% 2016 2019 2020 Segment Profit Margin


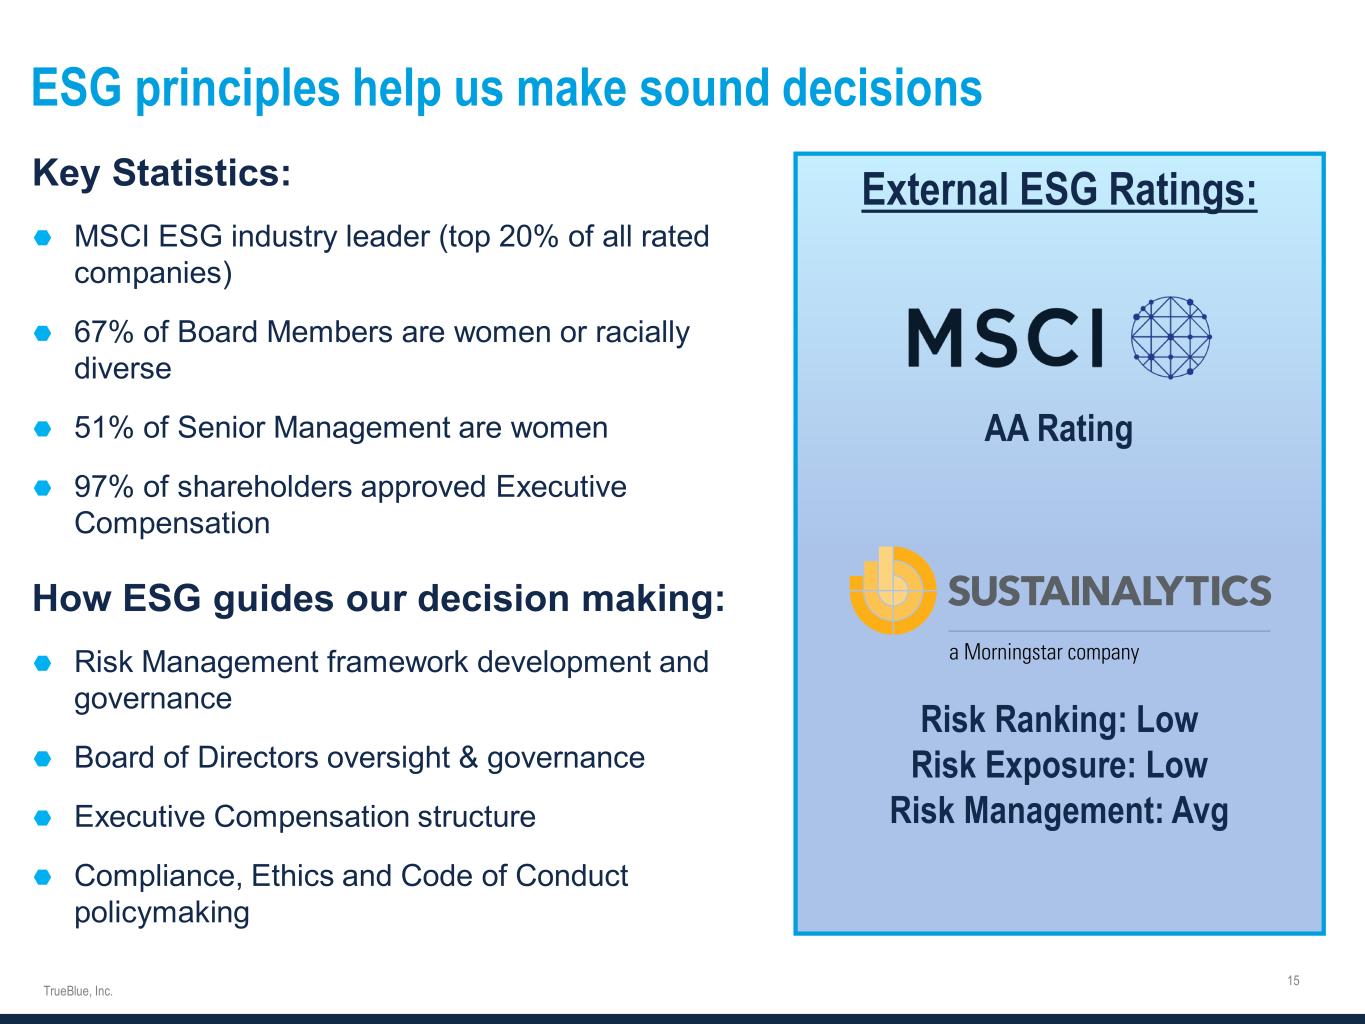
ESG principles help us make sound decisions External ESG Ratings: AA Rating Risk Ranking: Low Risk Exposure: Low Risk Management: Avg Key Statistics:  MSCI ESG industry leader (top 20% of all rated companies)  67% of Board Members are women or racially diverse  51% of Senior Management are women  97% of shareholders approved Executive Compensation How ESG guides our decision making:  Risk Management framework development and governance  Board of Directors oversight & governance  Executive Compensation structure  Compliance, Ethics and Code of Conduct policymaking


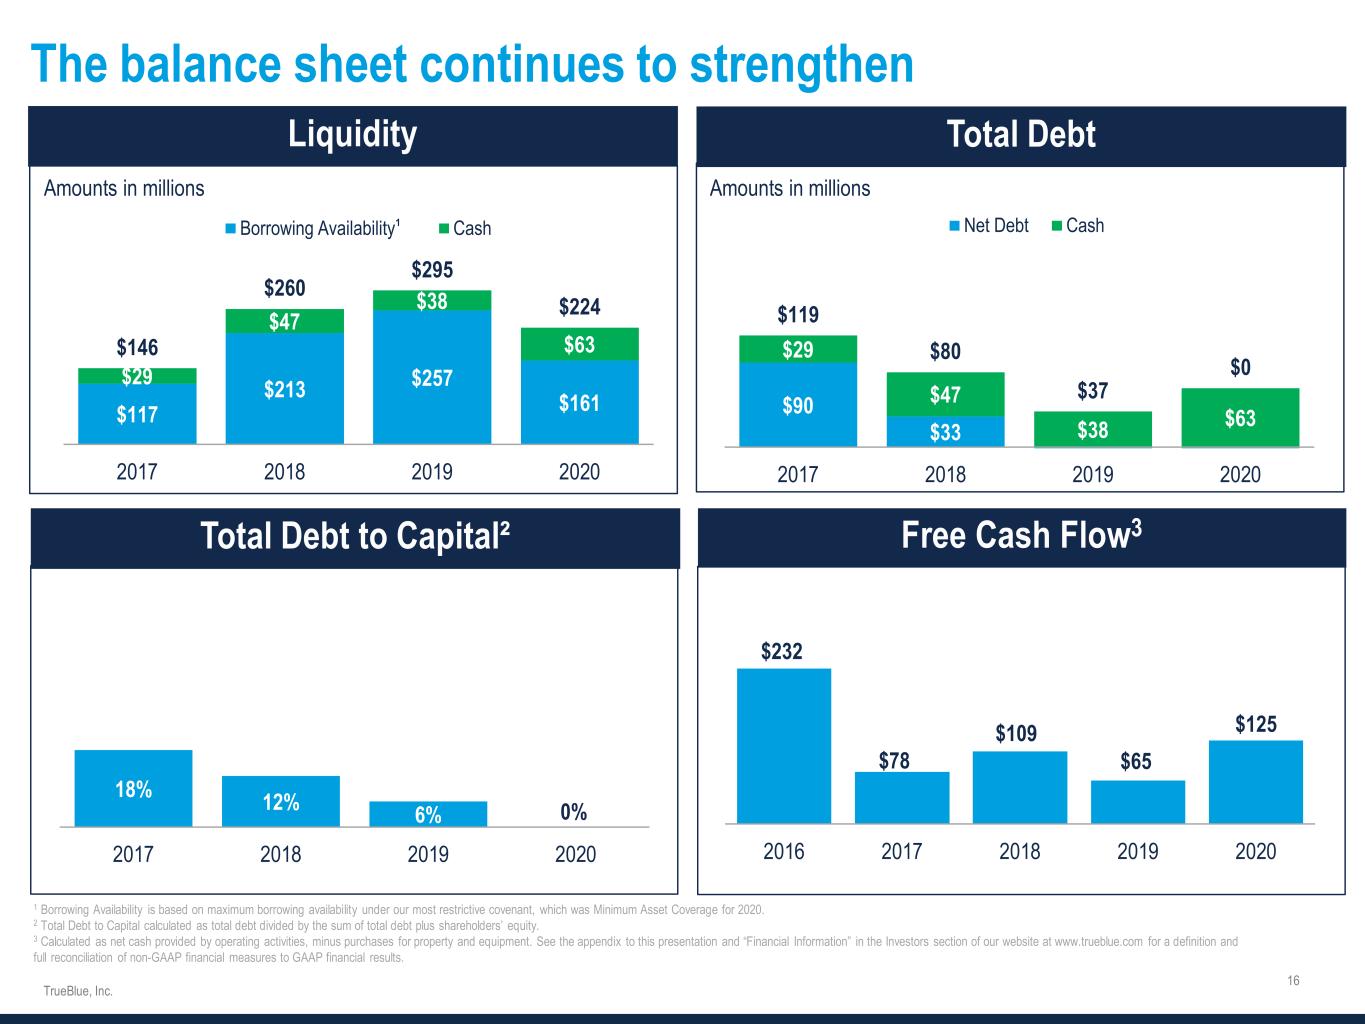
$90 $33 $29 $47 $38 $63 $119 $80 $37 $0 2017 2018 2019 2020 Net Debt Cash $117 $213 $257 $161 $29 $47 $38 $63$146 $260 $295 $224 2017 2018 2019 2020 Borrowing Availability Cash The balance sheet continues to strengthen 1 Borrowing Availability is based on maximum borrowing availability under our most restrictive covenant, which was Minimum Asset Coverage for 2020. 2 Total Debt to Capital calculated as total debt divided by the sum of total debt plus shareholders’ equity. 3 Calculated as net cash provided by operating activities, minus purchases for property and equipment. See the appendix to this presentation and “Financial Information” in the Investors section of our website at www.trueblue.com for a definition and full reconciliation of non-GAAP financial measures to GAAP financial results. 3 Amounts in millions Amounts in millions $232 $78 $109 $65 $125 2016 2017 2018 2019 2020 18% 12% 6% 0% 2017 2018 2019 2020 ¹


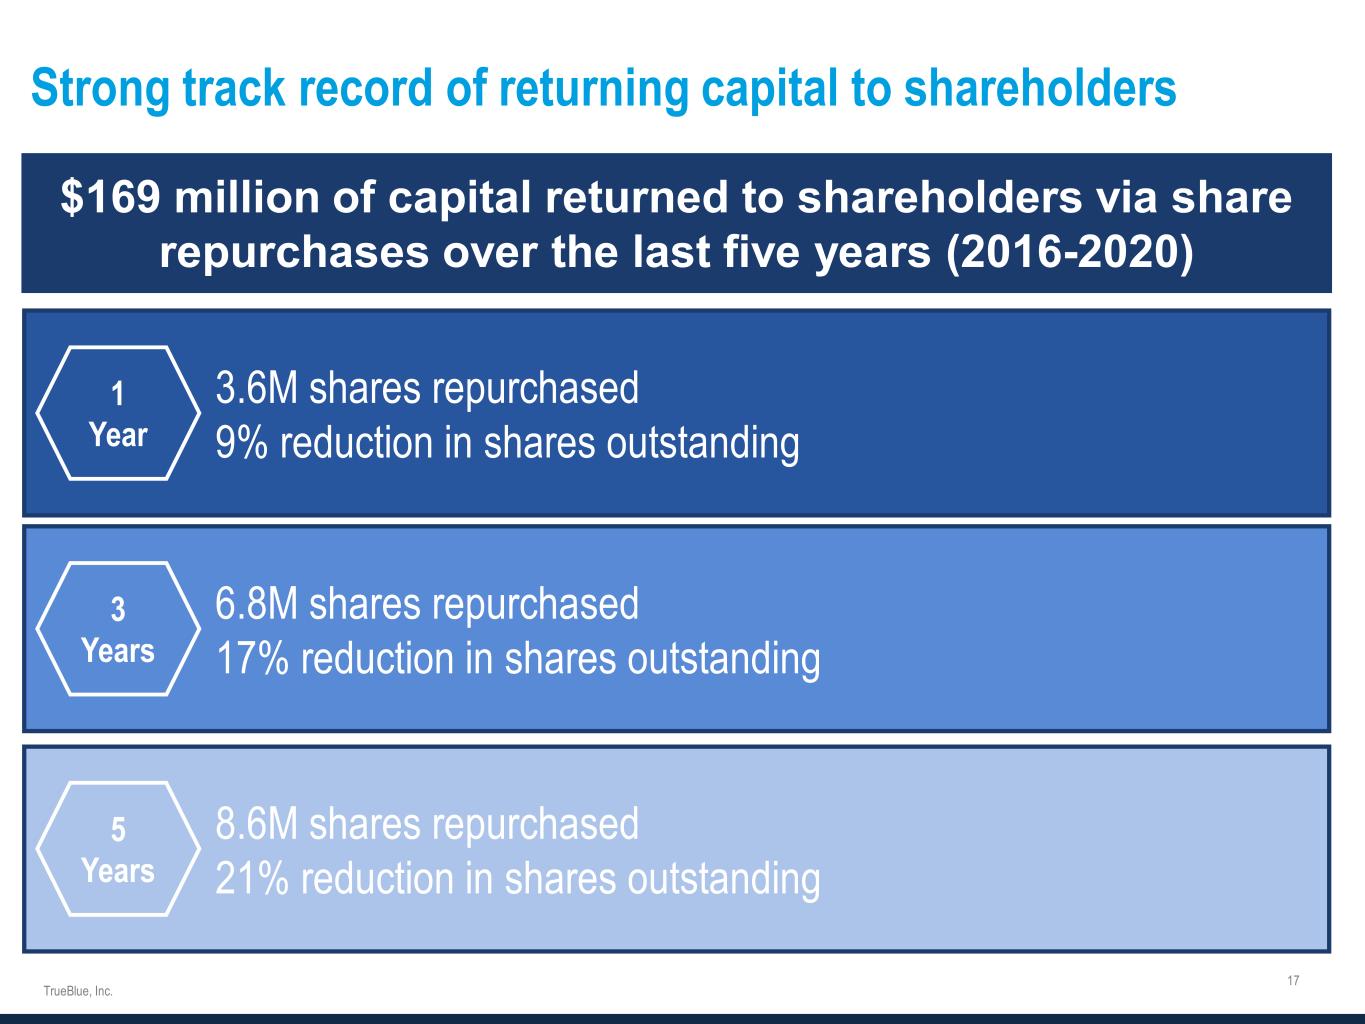
Strong track record of returning capital to shareholders $169 million of capital returned to shareholders via share repurchases over the last five years (2016-2020) 3.6M shares repurchased 9% reduction in shares outstanding 1 Year 6.8M shares repurchased 17% reduction in shares outstanding 8.6M shares repurchased 21% reduction in shares outstanding 3 Years 5 Years


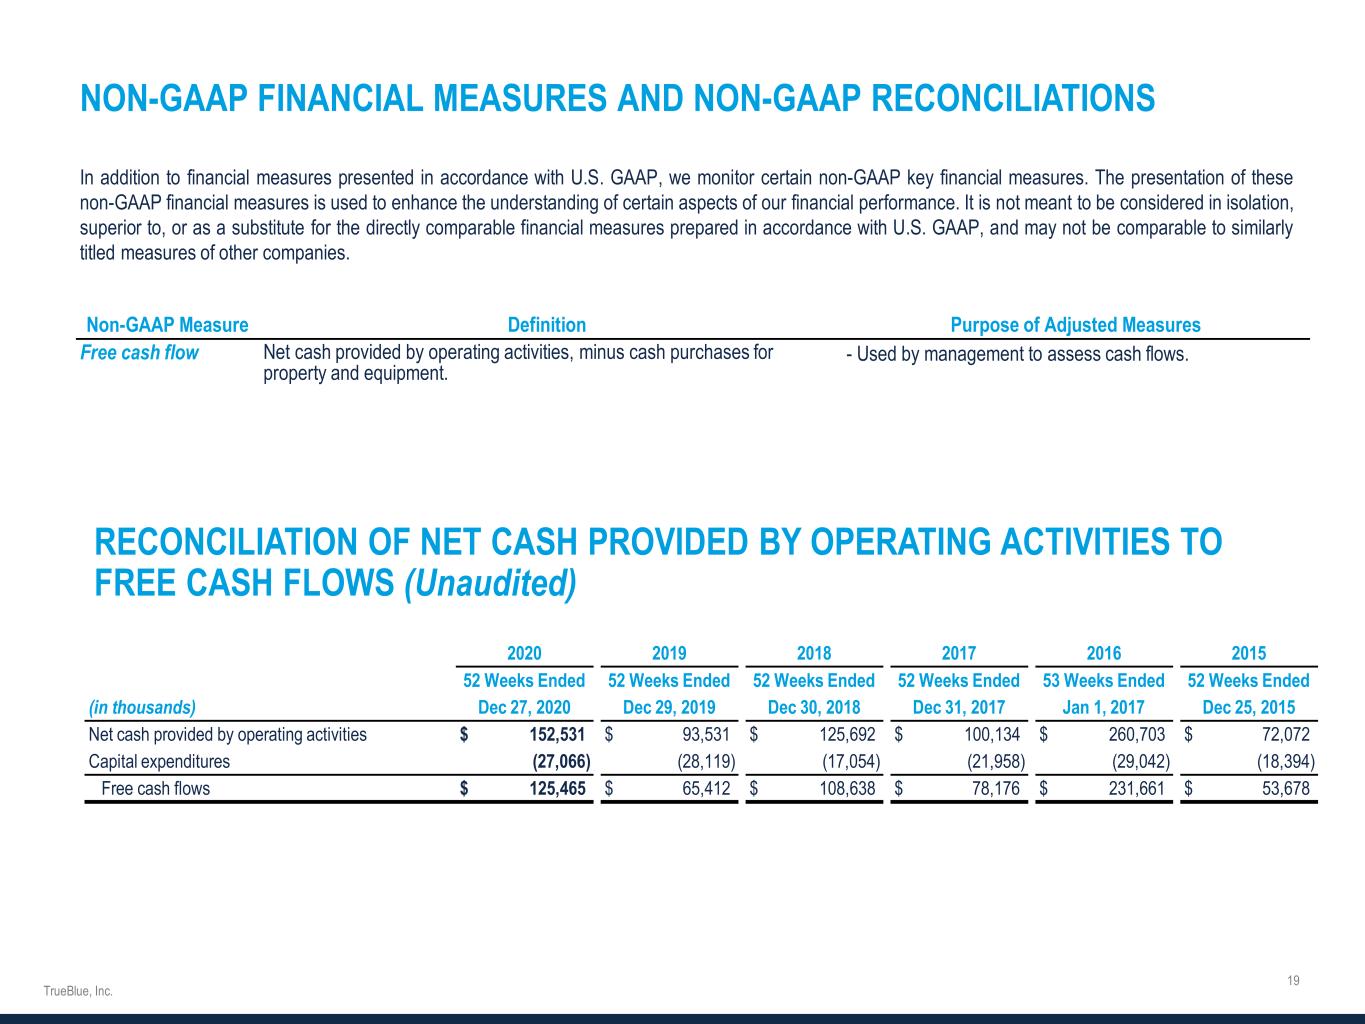
NON-GAAP FINANCIAL MEASURES AND NON-GAAP RECONCILIATIONS In addition to financial measures presented in accordance with U.S. GAAP, we monitor certain non-GAAP key financial measures. The presentation of these non-GAAP financial measures is used to enhance the understanding of certain aspects of our financial performance. It is not meant to be considered in isolation, superior to, or as a substitute for the directly comparable financial measures prepared in accordance with U.S. GAAP, and may not be comparable to similarly titled measures of other companies. Non-GAAP Measure Definition Purpose of Adjusted Measures Free cash flow Net cash provided by operating activities, minus cash purchases for property and equipment. - Used by management to assess cash flows. RECONCILIATION OF NET CASH PROVIDED BY OPERATING ACTIVITIES TO FREE CASH FLOWS (Unaudited) 2020 2019 2018 2017 2016 2015 52 Weeks Ended 52 Weeks Ended 52 Weeks Ended 52 Weeks Ended 53 Weeks Ended 52 Weeks Ended (in thousands) Dec 27, 2020 Dec 29, 2019 Dec 30, 2018 Dec 31, 2017 Jan 1, 2017 Dec 25, 2015 Net cash provided by operating activities $ 152,531 $ 93,531 $ 125,692 $ 100,134 $ 260,703 $ 72,072 Capital expenditures (27,066) (28,119) (17,054) (21,958) (29,042) (18,394) Free cash flows $ 125,465 $ 65,412 $ 108,638 $ 78,176 $ 231,661 $ 53,678