Document
false0000768899 0000768899 2020-02-05 2020-02-05


UNITED STATES
SECURITIES AND EXCHANGE COMMISSION
WASHINGTON, DC 20549
 
FORM 8-K
 
CURRENT REPORT
PURSUANT TO SECTION 13 OR 15(D) OF THE
SECURITIES EXCHANGE ACT OF 1934
Date of report (Date of earliest event reported): February 5, 2020
 
image32.jpg
TrueBlue, Inc.
(Exact Name of Registrant as Specified in Its Charter)
 
Washington
(State or Other Jurisdiction
of Incorporation)
001-14543
 
91-1287341
(Commission
File Number)
 
(IRS Employer
Identification No.)
 
1015 A Street, Tacoma, Washington 98402
(Address of principal executive offices) (Zip Code)
Registrant’s telephone number, including area code:    (253) 383-9101

Not Applicable
(Former Name or Former Address, if Changed Since Last Report)
 
Check the appropriate box below if the Form 8-K filing is intended to simultaneously satisfy the filing obligation of the registrant under any of the following provisions (see General Instruction A.2. below):
☐
Written communications pursuant to Rule 425 under the Securities Act (17 CFR 230.425)
☐
Soliciting material pursuant to Rule 14a-12 under the Exchange Act (17 CFR 240.14a-12)
☐
Pre-commencement communications pursuant to Rule 14d-2(b) under the Exchange Act (17 CFR 240.14d-2(b))
☐
Pre-commencement communications pursuant to Rule 13e-4(c) under the Exchange Act (17 CFR 240.13e-4(c))
Securities registered pursuant to Section 12(b) of the Act:
Title of each class
Trading Symbol(s)
Name of each exchange on which registered
Common stock, no par value
TBI
New York Stock Exchange


Indicate by check mark whether the registrant is an emerging growth company as defined in as defined in Rule 405 of the Securities Act of 1933 (§230.405 of this chapter) or Rule 12b-2 of the Securities Exchange Act of 1934 (§240.12b-2 of this chapter).

Emerging growth company ☐

If an emerging growth company, indicate by check mark if the registrant has elected not to use the extended transition period for complying with any new or revised financial accounting standards provided pursuant to Section 13(a) of the Exchange Act. ☐


Item 2.02.
Results of Operations and Financial Condition.

On February 5, 2020, TrueBlue, Inc. (the “company”) issued a press release (the “Press Release”) reporting its financial results for the fourth quarter ended December 29, 2019, and revenue and earnings outlook for the first quarter of 2020, a copy of which is attached hereto as Exhibit 99.1 and the contents of which are incorporated herein by this reference. Also attached to this report as Exhibit 99.2 is a slide presentation relating to the financial results for the fourth quarter ended December 29, 2019 (the “Earnings Results Presentation”), which will be discussed by management of the company on a live conference call at 2:00 p.m. Pacific Time (5:00 p.m. Eastern Time) on Monday, February 5, 2020. The Earnings Results Presentation is also available on the company’s website at www.trueblue.com.

In accordance with General Instruction B.2. of Form 8-K, the information contained above in this report (including the Press Release and the Earnings Results Presentation) shall not be deemed “Filed” for purposes of Section 18 of the Securities Exchange Act of 1934, as amended, or otherwise subject to the liabilities of that section, nor shall the Press Release or the Earnings Results Presentation be deemed incorporated by reference in any filing under the Securities Act of 1933, as amended, except as shall be expressly set forth by specific reference in such a filing. This report will not be deemed a determination or an admission as to the materiality of any information in the report that is required to be disclosed solely by Regulation FD.

Item 7.01.
Regulation FD Disclosure.
    
We are also attaching our Investor Roadshow Presentation to this report as Exhibit 99.3, which we will reference in our Q4 2019 earnings results discussion and which may be used in future investor conferences. The Investor Roadshow Presentation is also available on the company’s website at www.trueblue.com.
In accordance with General Instruction B.2. of Form 8-K, the information contained above in this report (including the Investor Roadshow Presentation) shall not be deemed “Filed” for purposes of Section 18 of the Securities Exchange Act of 1934, as amended, or otherwise subject to the liabilities of that section, nor shall the Investor Roadshow Presentation be deemed incorporated by reference in any filing under the Securities Act of 1933, as amended, except as shall be expressly set forth by specific reference in such a filing. This report will not be deemed a determination or an admission as to the materiality of any information in the report that is required to be disclosed solely by Regulation FD.

Item 9.01.
Financial Statements and Exhibits.
(d)
Exhibits

Exhibit
Number
Exhibit Description
Filed Herewith
99.1
X
99.2
X
99.3
X
104
Cover page interactive data file - The cover page from this Current Report on Form 8-K is formatted as Inline XBRL

X


SIGNATURE
Pursuant to the requirements of the Securities Exchange Act of 1934, the registrant has duly caused this report to be signed on its behalf by the undersigned hereunto duly authorized.


TRUEBLUE, INC.
 
 
(Registrant)


Date:
February 5, 2020
By:
 
/s/ Derrek L. Gafford


Derrek L. Gafford


Chief Financial Officer and Executive Vice President


TRUEBLUE REPORTS FOURTH QUARTER AND FULL-YEAR 2019 RESULTS

TACOMA, WASH. - Feb. 5, 2020 -- TrueBlue (NYSE:TBI) today announced its fourth quarter and full-year results for 2019. Full-year revenue was $2.4 billion, a decrease of 5 percent compared to 2018. Net income per diluted share was $1.61, a decrease of 1 percent compared to 2018. Adjusted net income per diluted share1 was $2.05, a decrease of 10 percent compared to 2018.

Fourth quarter revenue was $591 million, a decrease of 9 percent compared to revenue of $650 million in the fourth quarter of 2018. Net income per diluted share was $0.23, a decrease of 38 percent compared to the fourth quarter of 2018. Adjusted net income per diluted share was $0.39, a decrease of 36 percent compared to the fourth quarter of 2018.

“Clients were conservative in the use of our services during the fourth quarter in light of softness in their own business volumes and continued economic uncertainty, particularly in industries associated with physical goods,” said Patrick Beharelle, CEO of TrueBlue. “I’m pleased with our disciplined focus on cost management and the savings it delivered this quarter. Over the near term, we expect continued challenges in the industrial markets we serve, but we are encouraged by recent improvements in the demand trend for PeopleReady services.

“When I look at TrueBlue’s digital strategy and competitive position, I am pleased by what we have accomplished.  We have more clients and workers using our technology than ever before,” Mr. Beharelle continued. “PeopleReady’s JobStack app has filled more than six million shifts since its inception and is currently filling a job every nine seconds. PeopleScout’s Affinix is helping clients improve time to fill, candidate flow and candidate satisfaction. As we move into a new year and decade, I believe our digital strategies provide further opportunity to differentiate our services, capture additional market share and deliver industry-leading growth.”

2020 Outlook

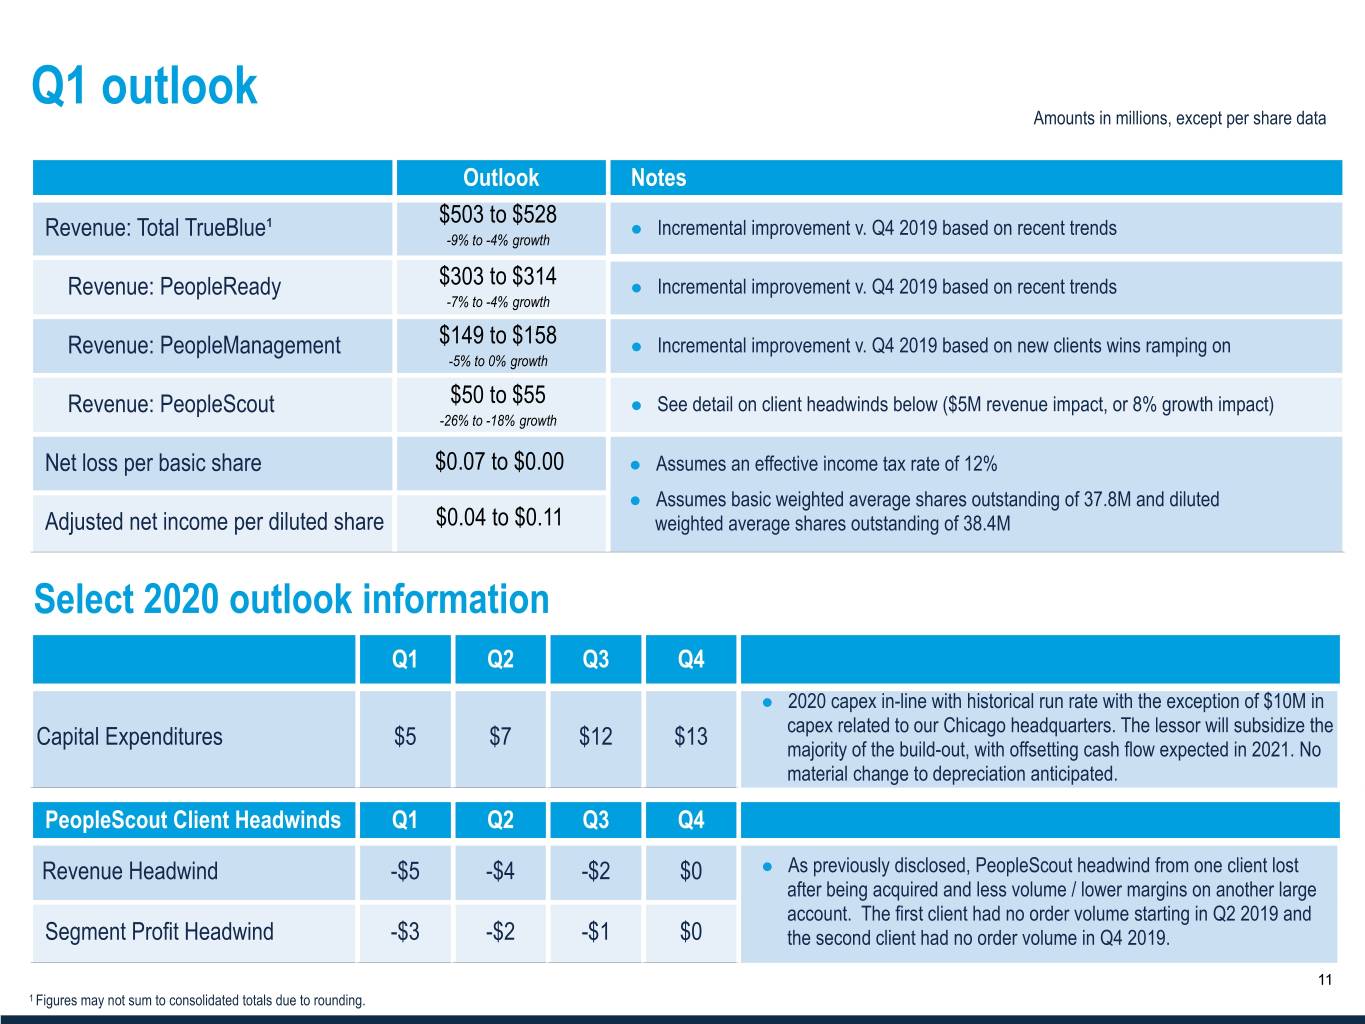
TrueBlue estimates revenue for the first quarter of 2020 will range from $503 million to $528 million. The company also estimates net loss per basic share will range from $0.07 to $0.00 and adjusted net income per diluted share will range from $0.04 to $0.11.

Management will discuss fourth quarter and full-year 2019 results on a webcast at 2 p.m. PDT (5 p.m. EDT), today, Wednesday, Feb. 5, 2020. The webcast can be accessed on TrueBlue’s website: www.trueblue.com.

About TrueBlue

TrueBlue (NYSE: TBI) is a leading provider of specialized workforce solutions that help clients achieve business growth and improve productivity. In 2019, TrueBlue connected approximately 724,000 people with work. Its PeopleReady segment offers on-demand, industrial staffing, PeopleManagement offers contingent, on-site industrial staffing and commercial driver services, and PeopleScout offers recruitment process outsourcing (RPO) and managed service provider (MSP) solutions to a wide variety of industries. Learn more at www.trueblue.com.

1 See the financial statements accompanying the release and the company’s website for more information on non-GAAP terms.

Forward-looking statements

This document contains forward-looking statements relating to our plans and expectations, all of which are subject to risks and uncertainties. Such statements are based on management’s expectations and assumptions as of the date of this release and involve many risks and uncertainties that could cause actual results to differ materially from those expressed or implied in our forward-looking statements including: (1) national and global economic conditions, (2) our ability to attract and retain clients, (3) our ability to attract sufficient qualified candidates and employees to meet the needs of our clients, (4) our ability to maintain profit margins, (5) new laws and regulations that could affect our operations or financial results, (6) our ability to successfully complete and integrate acquisitions, (7) our ability to successfully execute on business strategies to further digitize our business model, and (8) any reduction or change in tax credits we utilize, including the Work Opportunity Tax Credit. Other information regarding factors that could affect our results is included in our Securities Exchange Commission (SEC) filings, including the company’s most recent reports on Forms 10-K and 10-Q, copies of which may be obtained by visiting our website at www.trueblue.com under the Investor Relations section or the SEC’s website at www.sec.gov. We assume no obligation to update or revise any forward-looking statement, whether as a result of new information, future events, or otherwise, except as required by law. Any other reference to future financial estimates are included for informational purposes only and subject to risk factors discussed in our most recent filings with the SEC.
In addition, we use several non-GAAP financial measures when presenting our financial results in this document. Please refer to the reconciliations between our GAAP and non-GAAP financial measures in the appendix to this document and on our website at www.trueblue.com under the Investor Relations section for additional information on both current and historical periods. The presentation of these non-GAAP financial measures is used to enhance the understanding of certain aspects of our financial performance. It is not meant to be considered in isolation,


superior to, or as a substitute for the directly comparable financial measures prepared in accordance with U.S. GAAP, and may not be comparable to similarly titled measures of other companies.

Contact:
Derrek Gafford, Executive Vice President and CFO
253-680-8214


TRUEBLUE, INC.
SUMMARY CONSOLIDATED STATEMENTS OF OPERATIONS
(Unaudited)

 
13 Weeks Ended
 
52 Weeks Ended
(in thousands, except per share data)
Dec 29, 2019
Dec 30, 2018
 
Dec 29, 2019
Dec 30, 2018
Revenue from services
$
591,040

$
650,147

 
$
2,368,779

$
2,499,207

Cost of services
440,697

477,717

 
1,742,621

1,833,607

Gross profit
150,343

172,430

 
626,158

665,600

Selling, general and administrative expense
133,983

145,280

 
522,430

550,632

Depreciation and amortization
9,021

10,272

 
37,549

41,049

Income from operations
7,339

16,878

 
66,179

73,919

Interest and other income (expense), net
2,014

848

 
3,865

1,744

Income before tax expense
9,353

17,726

 
70,044

75,663

Income tax expense
638

2,839

 
6,971

9,909

Net income
$
8,715

$
14,887

 
$
63,073

$
65,754


Net income per common share:


Basic
$
0.23

$
0.38

 
$
1.63

$
1.64

Diluted
$
0.23

$
0.37

 
$
1.61

$
1.63


Weighted average shares outstanding:


Basic
37,843

39,528

 
38,778

39,985

Diluted
38,348

39,926

 
39,179

40,275


TRUEBLUE, INC.
SUMMARY CONSOLIDATED BALANCE SHEETS
(Unaudited)

(in thousands)
Dec 29, 2019
Dec 30, 2018
ASSETS
 
 
Cash and cash equivalents
$
37,608

$
46,988

Accounts receivable, net
342,303

355,373

Other current assets
41,822

27,466

Total current assets
421,733

429,827

Property and equipment, net
66,150

57,671

Restricted cash and investments
230,932

235,443

Goodwill and intangible assets, net
311,171

328,695

Operating lease right-of-use assets
41,082

—

Other assets, net
65,087

63,208

Total assets
$
1,136,155

$
1,114,844


LIABILITIES AND SHAREHOLDERS’ EQUITY
 
 
Current liabilities
$
230,806

$
225,526

Long-term debt
37,100

80,000

Operating lease long-term liabilities
28,849

—

Other long-term liabilities
213,427

217,879

Total liabilities
510,182

523,405

Shareholders’ equity
625,973

591,439

Total liabilities and shareholders’ equity
$
1,136,155

$
1,114,844


TRUEBLUE, INC.
CONSOLIDATED STATEMENTS OF CASH FLOWS
(Unaudited)
 
52 Weeks Ended
(in thousands)
Dec 29, 2019
Dec 30, 2018
Cash flows from operating activities:
 
 
Net income
$
63,073

$
65,754

Adjustments to reconcile net income to net cash provided by operating activities:
 
 
Depreciation and amortization
37,549

41,049

Provision for doubtful accounts
7,661

10,042

Stock-based compensation
9,769

13,876

Deferred income taxes
1,263

(1,929
)
Non-cash lease expense
14,823

—

Other operating activities
(1,511
)
5,154

Changes in operating assets and liabilities:
 
 
Accounts receivable
5,450

11,640

Income tax receivable
(6,480
)
(996
)
Other assets
(11,642
)
(12,928
)
Accounts payable and other accrued expenses
6,921

3,029

Accrued wages and benefits
(9,494
)
(1,613
)
Workers’ compensation claims reserve
(10,828
)
(7,877
)
Operating lease liabilities
(15,178
)
—

Other liabilities
3,166

491

Net cash provided by operating activities
94,542

125,692

Cash flows from investing activities:
 
 
Capital expenditures
(28,119
)
(17,054
)
Acquisition of business
—

(22,742
)
Divestiture of business
215

10,587

Purchases of restricted investments
(28,659
)
(12,941
)
Maturities of restricted investments
31,481

21,635

Net cash used in investing activities
(25,082
)
(20,515
)
Cash flows from financing activities:
 
 
Purchases and retirement of common stock
(38,826
)
(34,818
)
Net proceeds from employee stock purchase plans
1,329

1,503

Common stock repurchases for taxes upon vesting of restricted stock
(2,222
)
(3,404
)
Net change in revolving credit facility
(42,900
)
(15,900
)
Payments on debt
—

(22,397
)
Other
(296
)
—

Net cash used in financing activities
(82,915
)
(75,016
)
Effect of exchange rate changes on cash, cash equivalents and restricted cash
935

(1,542
)
Net change in cash, cash equivalents, and restricted cash
(12,520
)
28,619

Cash, cash equivalents and restricted cash, beginning of period
102,450

73,831

Cash, cash equivalents and restricted cash, end of period
$
89,930

$
102,450


TRUEBLUE, INC.
SEGMENT DATA
(Unaudited)


13 Weeks Ended
 
52 Weeks Ended
(in thousands)
Dec 29, 2019
 
Dec 30, 2018
 
Dec 29, 2019
 
Dec 30, 2018
Revenue from services:


PeopleReady
$
364,801

 
$
399,116

 
$
1,474,062

 
$
1,522,076

PeopleManagement
171,344

 
184,324

 
642,233

 
728,254

PeopleScout
54,895

 
66,707

 
252,484

 
248,877

Total company
$
591,040

 
$
650,147

 
$
2,368,779

 
$
2,499,207


Segment profit (1):


PeopleReady
$
17,963

 
$
22,045

 
$
82,106

 
$
85,998

PeopleManagement
2,778

 
5,097

 
12,593

 
21,627

PeopleScout
5,407

 
11,680

 
37,831

 
47,383


26,148

 
38,822

 
132,530

 
155,008

Corporate unallocated expense
(5,190
)
 
(6,065
)
 
(21,870
)
 
(26,066
)
Total company Adjusted EBITDA (2)
20,958

 
32,757

 
110,660

 
128,942

Work Opportunity Tax Credit processing fees (3)
(240
)
 
(285
)
 
(960
)
 
(985
)
Acquisition/integration costs (4)
50

 
(989
)
 
(1,562
)
 
(2,672
)
Gain on deferred compensation assets (5)
(495
)
 
—

 
(495
)
 
—

Other adjustments (6)
(3,913
)
 
(4,333
)
 
(3,915
)
 
(10,317
)
EBITDA (2)
16,360

 
27,150

 
103,728

 
114,968

Depreciation and amortization
(9,021
)
 
(10,272
)
 
(37,549
)
 
(41,049
)
Interest and other income (expense), net
2,014

 
848

 
3,865

 
1,744

Income before tax expense
9,353

 
17,726

 
70,044

 
75,663

Income tax expense
(638
)
 
(2,839
)
 
(6,971
)
 
(9,909
)
Net income
$
8,715

 
$
14,887

 
$
63,073

 
$
65,754

(1)
We evaluate performance based on segment revenue and segment profit. Segment profit includes revenue, related cost of services, and ongoing operating expenses directly attributable to the reportable segment. Segment profit excludes goodwill and intangible impairment charges, depreciation and amortization expense, unallocated corporate general and administrative expense, interest, other income and expense, income taxes, and other adjustments not considered to be ongoing.
(2)
See the Non-GAAP Financial Measures table on the next page for definitions of EBITDA and Adjusted EBITDA.

(3)
These third-party processing fees are associated with generating the Work Opportunity Tax Credits, which are designed to encourage employers to hire workers from certain targeted groups with higher than average unemployment rates.

(4)
Acquisition/integration costs relate to the acquisition of TMP Holdings LTD completed on June 12, 2018.

(5)
Gain realized on sale of deferred compensation mutual funds to purchase corporate owned life insurance policies during the 13 weeks ended December 29, 2019.

(6)
Other adjustments for the 13 weeks and 52 weeks ended December 29, 2019 primarily include implementation costs for cloud-based systems of $0.6 million and $3.2 million, respectively, workforce reduction costs primarily associated with employee reductions in the PeopleReady business of $2.9 million and $3.3 million, respectively and amortization of software as a service assets of $0.5 million and $1.6 million, respectively, which is reported in selling, general and administrative expense. These other cost adjustments for the 52 weeks ended December 29, 2019 were slightly offset by $3.9 million of workers’ compensation benefit related to additional insurance coverage associated with former workers’ compensation carriers that are in liquidation. Other adjustments for the 13 weeks and 52 weeks ended December 30, 2018 include implementation costs for cloud-based systems of $2.2 million and $6.7 million, respectively, and accelerated vesting of stock associated with the CEO transition of $2.1 million and $3.6 million, respectively.


TRUEBLUE, INC.
NON-GAAP FINANCIAL MEASURES AND NON-GAAP RECONCILIATIONS

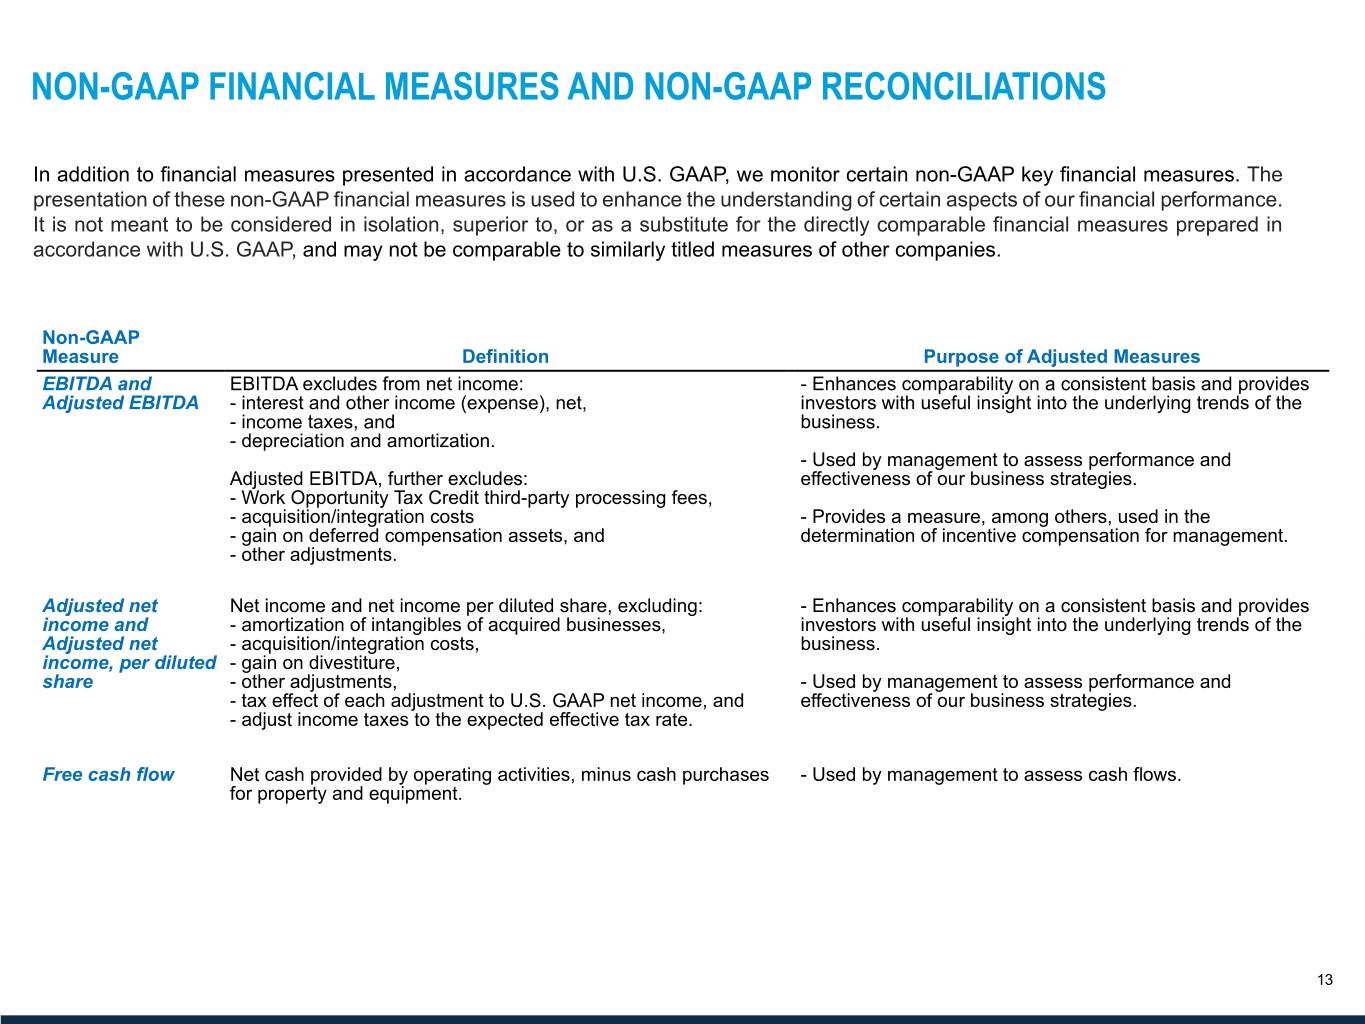
In addition to financial measures presented in accordance with U.S. GAAP, we monitor certain non-GAAP key financial measures. The presentation of these non-GAAP financial measures is used to enhance the understanding of certain aspects of our financial performance. It is not meant to be considered in isolation, superior to, or as a substitute for the directly comparable financial measures prepared in accordance with U.S. GAAP, and may not be comparable to similarly titled measures of other companies.
Non-GAAP Measure
Definition
 
Purpose of Adjusted Measures
EBITDA and
Adjusted EBITDA
EBITDA excludes from net income:
- interest and other income (expense), net,
- income taxes, and
- depreciation and amortization.

Adjusted EBITDA, further excludes:
- Work Opportunity Tax Credit third-party processing fees,
- acquisition/integration costs
- gain on deferred compensation assets, and
- other adjustments.
 
- Enhances comparability on a consistent basis and provides investors with useful insight into the underlying trends of the business.

- Used by management to assess performance and effectiveness of our business strategies.

- Provides a measure, among others, used in the determination of incentive compensation for management.
Adjusted net income and Adjusted net income, per diluted share
Net income and net income per diluted share, excluding:
- amortization of intangibles of acquired businesses,
- acquisition/integration costs,
- gain on divestiture,
- other adjustments,
- tax effect of each adjustment to U.S. GAAP net income, and
- adjust income taxes to the expected effective tax rate.
 
- Enhances comparability on a consistent basis and provides investors with useful insight into the underlying trends of the business.

- Used by management to assess performance and effectiveness of our business strategies.
Free cash flow
Net cash provided by operating activities, minus cash purchases for property and equipment.
 
- Used by management to assess cash flows.


1.
RECONCILIATION OF U.S. GAAP NET INCOME (LOSS) TO ADJUSTED NET INCOME AND ADJUSTED NET INCOME, PER DILUTED SHARE
(Unaudited)
 
Q4 2019
 
Q4 2018
 
Q1 2020 Outlook*
 
13 Weeks Ended
 
13 Weeks Ended
 
13 Weeks Ended
(in thousands, except for per share data)
Dec 29, 2019
 
Dec 30, 2018
 
Mar 29, 2020
Net income (loss)
$
8,715

 
$
14,887

 
$
(2,500
)
—
$
100

Amortization of intangible assets of acquired businesses (2)
4,003

 
5,162

 
4,000
Acquisition/integration costs (3)
(50
)
 
989

 
—
Other adjustments (4)
3,913

 
4,333

 
600
Tax effect of adjustments to net income (5)
(1,102
)
 
(1,468
)
 
(600)
Adjustment of income taxes to normalized effective rate (6)
(671
)
 
357

 
—
Adjusted net income
$
14,808

 
$
24,260

 
$
1,500

—
$
4,000


Adjusted net income, per diluted share
$
0.39

 
$
0.61

 
$
0.04

—
$
0.11


Basic weighted average shares outstanding
37,843

 
39,528

 
37,800
Diluted weighted average shares outstanding
38,348

 
39,926

 
38,400
*Totals may not sum due to rounding


2019
 
2018
 
52 Weeks Ended
 
52 Weeks Ended
(in thousands, except for per share data)
Dec 29, 2019
 
Dec 30, 2018
Net income
$
63,073

 
$
65,754

Gain on divestiture (1)
—

 
(718
)
Amortization of intangible assets of acquired businesses (2)
17,899

 
20,750

Acquisition/integration costs (3)
1,562

 
2,672

Other adjustments (4)
3,915

 
10,317

Tax effect of adjustments to net income (5)
(3,273
)
 
(5,074
)
Adjustment of income taxes to normalized effective rate (6)
(2,835
)
 
(1,843
)
Adjusted net income
$
80,341

 
$
91,858


Adjusted net income, per diluted share
$
2.05

 
$
2.28


Diluted weighted average shares outstanding
39,179

 
40,275


2.
RECONCILIATION OF U.S. GAAP NET INCOME (LOSS) TO EBITDA AND ADJUSTED EBITDA
(Unaudited)
 
Q4 2019
 
Q4 2018
 
Q1 2020 Outlook*
 
13 Weeks Ended
 
13 Weeks Ended
 
13 Weeks Ended
(in thousands)
Dec 29, 2019
 
Dec 30, 2018
 
Mar 29, 2020
Net income (loss)
$
8,715

 
$
14,887

 
$
(2,500
)
—
$
100

Income tax expense
638

 
2,839

 
(300
)
—
—

Interest and other (income) expense, net
(2,014
)
 
(848
)
 
(900)
Depreciation and amortization
9,021

 
10,272

 
9,000
EBITDA
16,360

 
27,150

 
5,200

—
8,200

Work Opportunity Tax Credit processing fees (7)
240

 
285

 
200
Acquisition/integration costs (3)
(50
)
 
989

 
—
Gain on deferred compensation assets (8)
495

 
—

 
—
Other adjustments (4)
3,913

 
4,333

 
600
Adjusted EBITDA
$
20,958

 
$
32,757

 
$
6,000

—
$
9,000

* Totals may not sum due to rounding


2019
 
2018
 
52 Weeks Ended
 
52 Weeks Ended
(in thousands)
Dec 29, 2019
 
Dec 30, 2018
Net income
$
63,073

 
$
65,754

Income tax expense
6,971

 
9,909

Interest and other (income) expense, net
(3,865
)
 
(1,744
)
Depreciation and amortization
37,549

 
41,049

EBITDA
103,728

 
114,968

Work Opportunity Tax Credit processing fees (7)
960

 
985

Acquisition/integration costs (3)
1,562

 
2,672

Gain on deferred compensation assets (8)
495

 
—

Other adjustments (4)
3,915

 
10,317

Adjusted EBITDA
$
110,660

 
$
128,942

3.
RECONCILIATION OF NET CASH PROVIDED BY OPERATING ACTIVITIES TO FREE CASH FLOWS
(Unaudited)
 
2019
 
2018
 
2017
 
2016
 
52 Weeks Ended
 
52 Weeks Ended
 
52 Weeks Ended
 
53 Weeks Ended
(in thousands)
Dec 29, 2019
 
Dec 30, 2018
 
Dec 31, 2017
 
Jan 1, 2017
Net cash provided by operating activities
$
94,542

 
$
125,692

 
$
100,134

 
$
260,703

Capital expenditures
(28,119
)
 
(17,054
)
 
(21,958
)
 
(29,042
)
Free cash flows
$
66,423

 
$
108,638

 
$
78,176

 
$
231,661


(1)
Gain on the divestiture of our PlaneTechs business sold mid-March 2018.

(2)
Amortization of intangible assets of acquired businesses.

(3)
Acquisition/integration costs for the acquisition of TMP Holding LTD completed on June 12, 2018.

(4)
Other adjustments for the 13 weeks and 52 weeks ended December 29, 2019 primarily include implementation costs for cloud-based systems of $0.6 million and $3.2 million, respectively, workforce reduction costs primarily associated with employee reductions in the PeopleReady business of $2.9 million and $3.3 million, respectively and amortization of software as a service assets of $0.5 million and $1.6 million, respectively, which is reported in selling, general and administrative expense. These other cost adjustments for the 52 weeks ended December 29, 2019 were slightly offset by $3.9 million of workers’ compensation benefit related to additional insurance coverage associated with former workers’ compensation carriers that are in liquidation. Other adjustments for the 13 weeks and 52


weeks ended December 30, 2018 include implementation costs for cloud-based systems of $2.2 million and $6.7 million, respectively, and accelerated vesting of stock associated with the CEO transition of $2.1 million and $3.6 million, respectively. Other adjustments for the 13 weeks ended March 29, 2020 include implementation costs for cloud-based systems of $0.3 million and amortization of software as a service assets of $0.3 million.

(5)
Total tax effect of each of the adjustments to U.S. GAAP net income using the expected ongoing rate of 12 percent for 2020 and 14 percent for all other periods presented.

(6)
Adjustment of the effective income tax rate to the expected ongoing rate of 12 percent for 2020 and 14 percent for all other periods presented.

(7)
These third-party processing fees are associated with generating the Work Opportunity Tax Credits, which are designed to encourage employers to hire workers from certain targeted groups with higher than average unemployment rates.

(8)
Gain realized on sale of deferred compensation mutual funds to purchase corporate owned life insurance policies during the 13 weeks ended December 29, 2019.


Q4 2019 Earnings February 2020


Forward-looking statements This document contains forward-looking statements relating to our plans and expectations, all of which are subject to risks and uncertainties. Such statements are based on management’s expectations and assumptions as of the date of this release and involve many risks and uncertainties that could cause actual results to differ materially from those expressed or implied in our forward-looking statements including: (1) national and global economic conditions, (2) our ability to attract and retain clients, (3) our ability to attract sufficient qualified candidates and employees to meet the needs of our clients, (4) our ability to maintain profit margins, (5) new laws and regulations that could affect our operations or financial results, (6) our ability to successfully complete and integrate acquisitions, (7) our ability to successfully execute on business strategies to further digitize our business model, and (8) any reduction or change in tax credits we utilize, including the Work Opportunity Tax Credit. Other information regarding factors that could affect our results is included in our Securities Exchange Commission (SEC) filings, including the company's most recent reports on Forms 10-K and 10- Q, copies of which may be obtained by visiting our website at www.trueblue.com under the Investor Relations section or the SEC's website at www.sec.gov. We assume no obligation to update or revise any forward-looking statement, whether as a result of new information, future events, or otherwise, except as required by law. Any other reference to future financial estimates are included for informational purposes only and subject to risk factors discussed in our most recent filings with the SEC. In addition, we use several non-GAAP financial measures when presenting our financial results in this document. Please refer to the reconciliations between our GAAP and non-GAAP financial measures in the appendix to this presentation and on our website at www.trueblue.com under the Investor Relations section for additional information on both current and historical periods. The presentation of these non-GAAP financial measures is used to enhance the understanding of certain aspects of our financial performance. It is not meant to be considered in isolation, superior to, or as a substitute for the directly comparable financial measures prepared in accordance with U.S. GAAP, and may not be comparable to similarly titled measures of other companies. Any comparisons made herein to other periods are based on a comparison to the same period in the prior year unless otherwise stated. www.TrueBlue.com 2


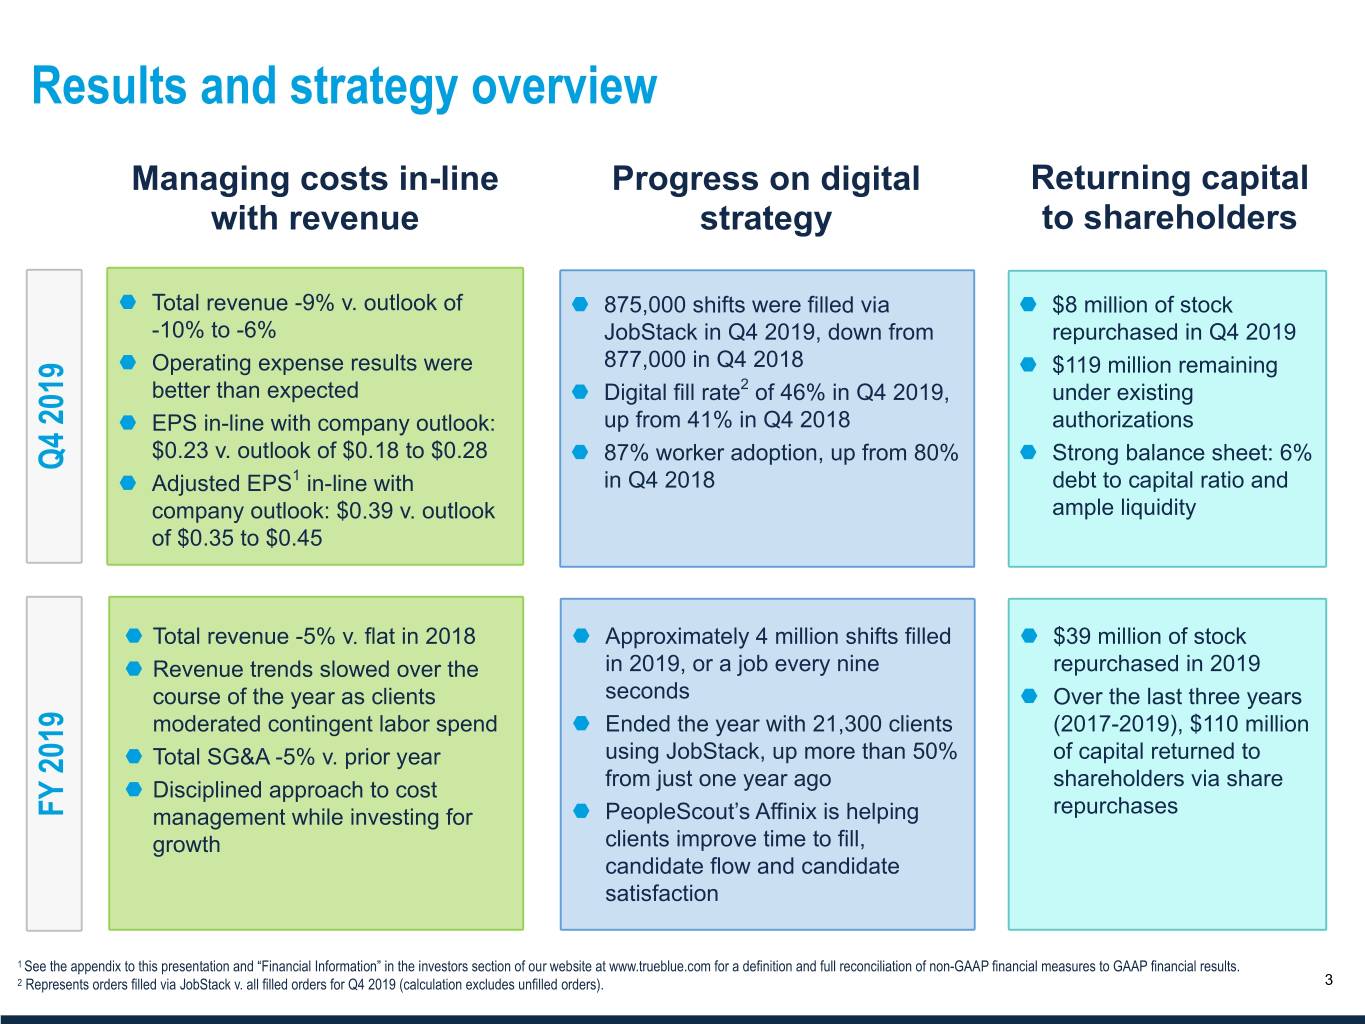
Results and strategy overview Managing costs in-line Progress on digital Returning capital with revenue strategy to shareholders ¬ Total revenue -9% v. outlook of ¬ 875,000 shifts were filled via ¬ $8 million of stock -10% to -6% JobStack in Q4 2019, down from repurchased in Q4 2019 ¬ Operating expense results were 877,000 in Q4 2018 ¬ $119 million remaining better than expected ¬ Digital fill rate2 of 46% in Q4 2019, under existing 2019 ¬ EPS in-line with company outlook: up from 41% in Q4 2018 authorizations $0.23 v. outlook of $0.18 to $0.28 ¬ 87% worker adoption, up from 80% ¬ Strong balance sheet: 6% Q4 ¬ Adjusted EPS1 in-line with in Q4 2018 debt to capital ratio and company outlook: $0.39 v. outlook ample liquidity of $0.35 to $0.45 ¬ Total revenue -5% v. flat in 2018 ¬ Approximately 4 million shifts filled ¬ $39 million of stock ¬ Revenue trends slowed over the in 2019, or a job every nine repurchased in 2019 course of the year as clients seconds ¬ Over the last three years moderated contingent labor spend ¬ Ended the year with 21,300 clients (2017-2019), $110 million ¬ Total SG&A -5% v. prior year using JobStack, up more than 50% of capital returned to 2019 ¬ Disciplined approach to cost from just one year ago shareholders via share ¬ FY FY management while investing for PeopleScout’s Affinix is helping repurchases growth clients improve time to fill, candidate flow and candidate satisfaction 1 See the appendix to this presentation and “Financial Information” in the investors section of our website at www.trueblue.com for a definition and full reconciliation of non-GAAP financial measures to GAAP financial results. 2 Representswww.TrueBlue.com orders filled via JobStack v. all filled orders for Q4 2019 (calculation excludes unfilled orders). 3


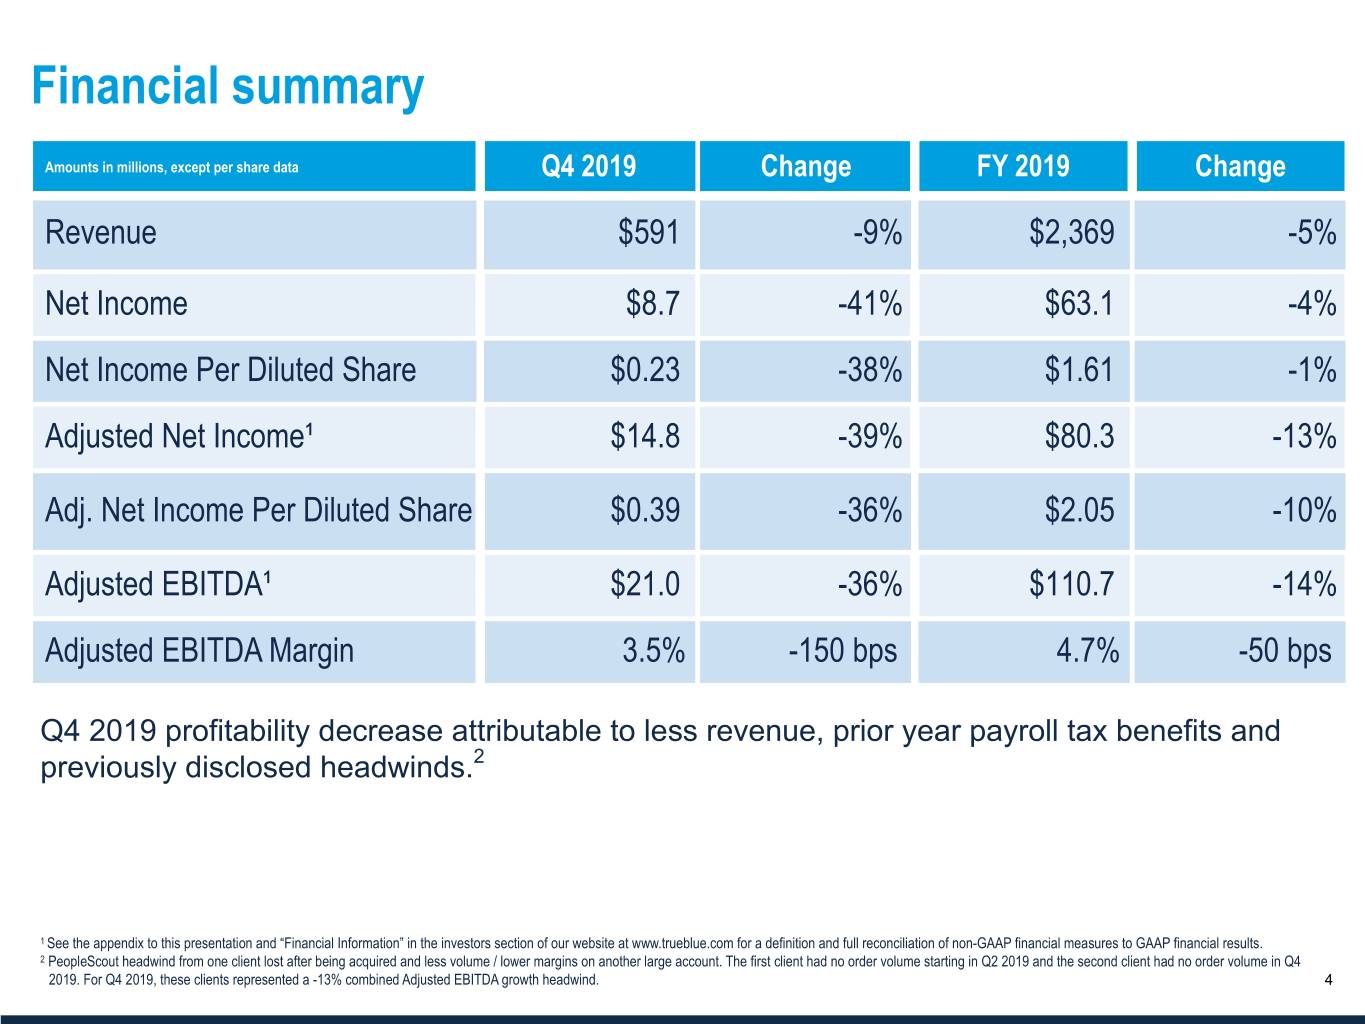
Financial summary Amounts in millions, except per share data Q4 2019 Change FY 2019 Change Revenue $591 -9% $2,369 -5% Net Income $8.7 -41% $63.1 -4% Net Income Per Diluted Share $0.23 -38% $1.61 -1% Adjusted Net Income¹ $14.8 -39% $80.3 -13% Adj. Net Income Per Diluted Share $0.39 -36% $2.05 -10% Adjusted EBITDA¹ $21.0 -36% $110.7 -14% Adjusted EBITDA Margin 3.5% -150 bps 4.7% -50 bps Q4 2019 profitability decrease attributable to less revenue, prior year payroll tax benefits and previously disclosed headwinds.2 1 See the appendix to this presentation and “Financial Information” in the investors section of our website at www.trueblue.com for a definition and full reconciliation of non-GAAP financial measures to GAAP financial results. 2 PeopleScout headwind from one client lost after being acquired and less volume / lower margins on another large account. The first client had no order volume starting in Q2 2019 and the second client had no order volume in Q4 www.TrueBlue.com2019. For Q4 2019, these clients represented a -13% combined Adjusted EBITDA growth headwind. 4


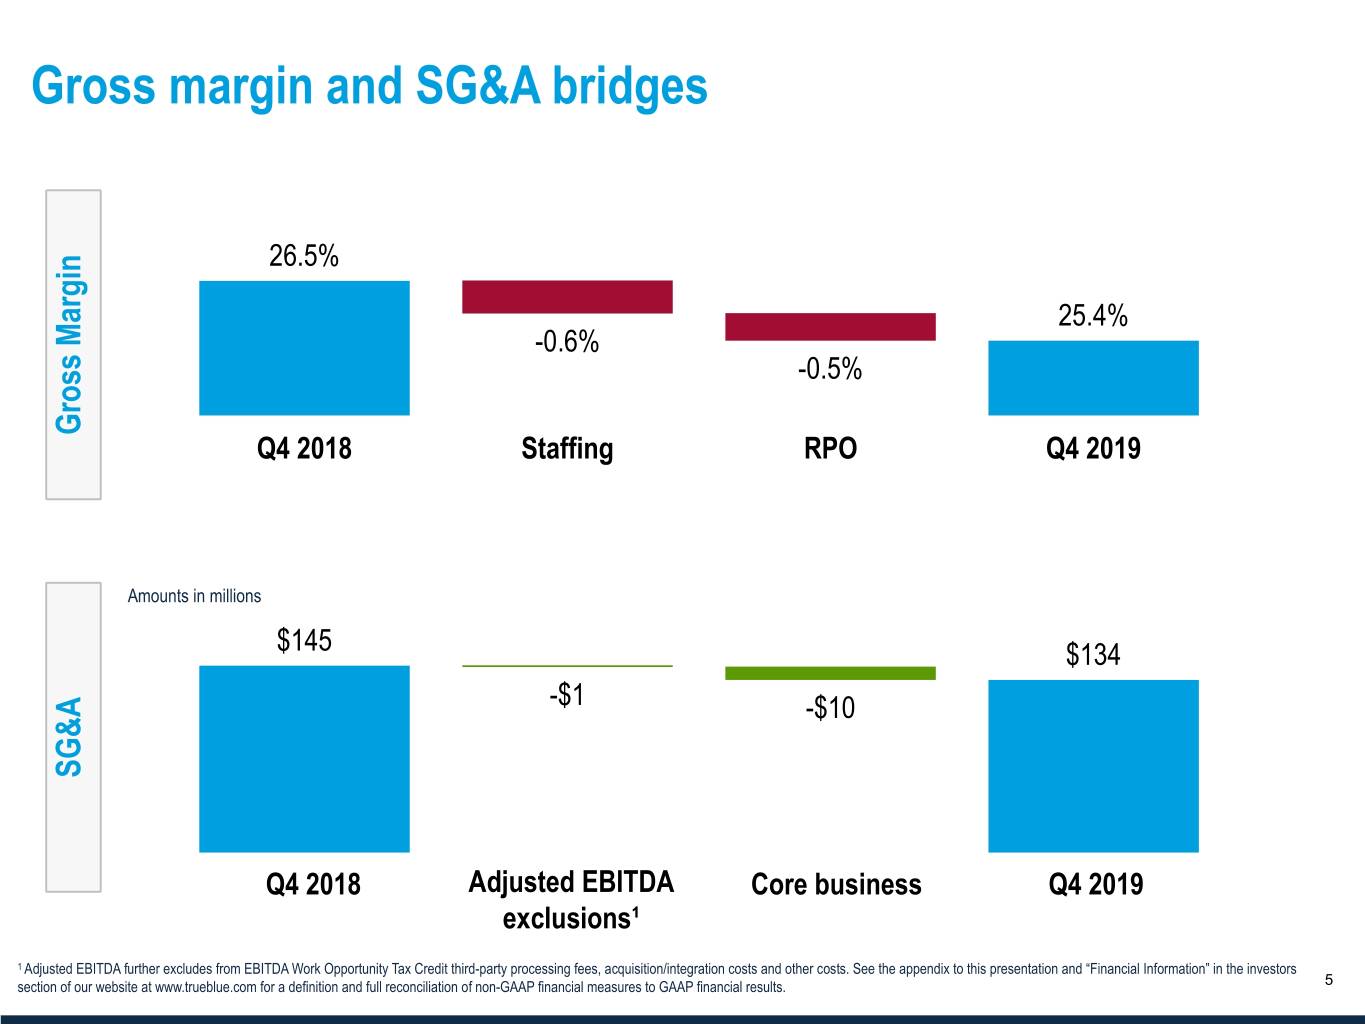
Gross margin and SG&A bridges 26.5% 25.4% -0.6% -0.5% Gross Margin Q4 2018 Staffing RPO Q4 2019 Amounts in millions $145 $134 -$1 -$10 SG&A Q4 2018 Adjusted EBITDA Core business Q4 2019 exclusions¹ 1 Adjusted EBITDA further excludes from EBITDA Work Opportunity Tax Credit third-party processing fees, acquisition/integration costs and other costs. See the appendix to this presentation and “Financial Information” in the investors sectionwww.TrueBlue.com of our website at www.trueblue.com for a definition and full reconciliation of non-GAAP financial measures to GAAP financial results. 5


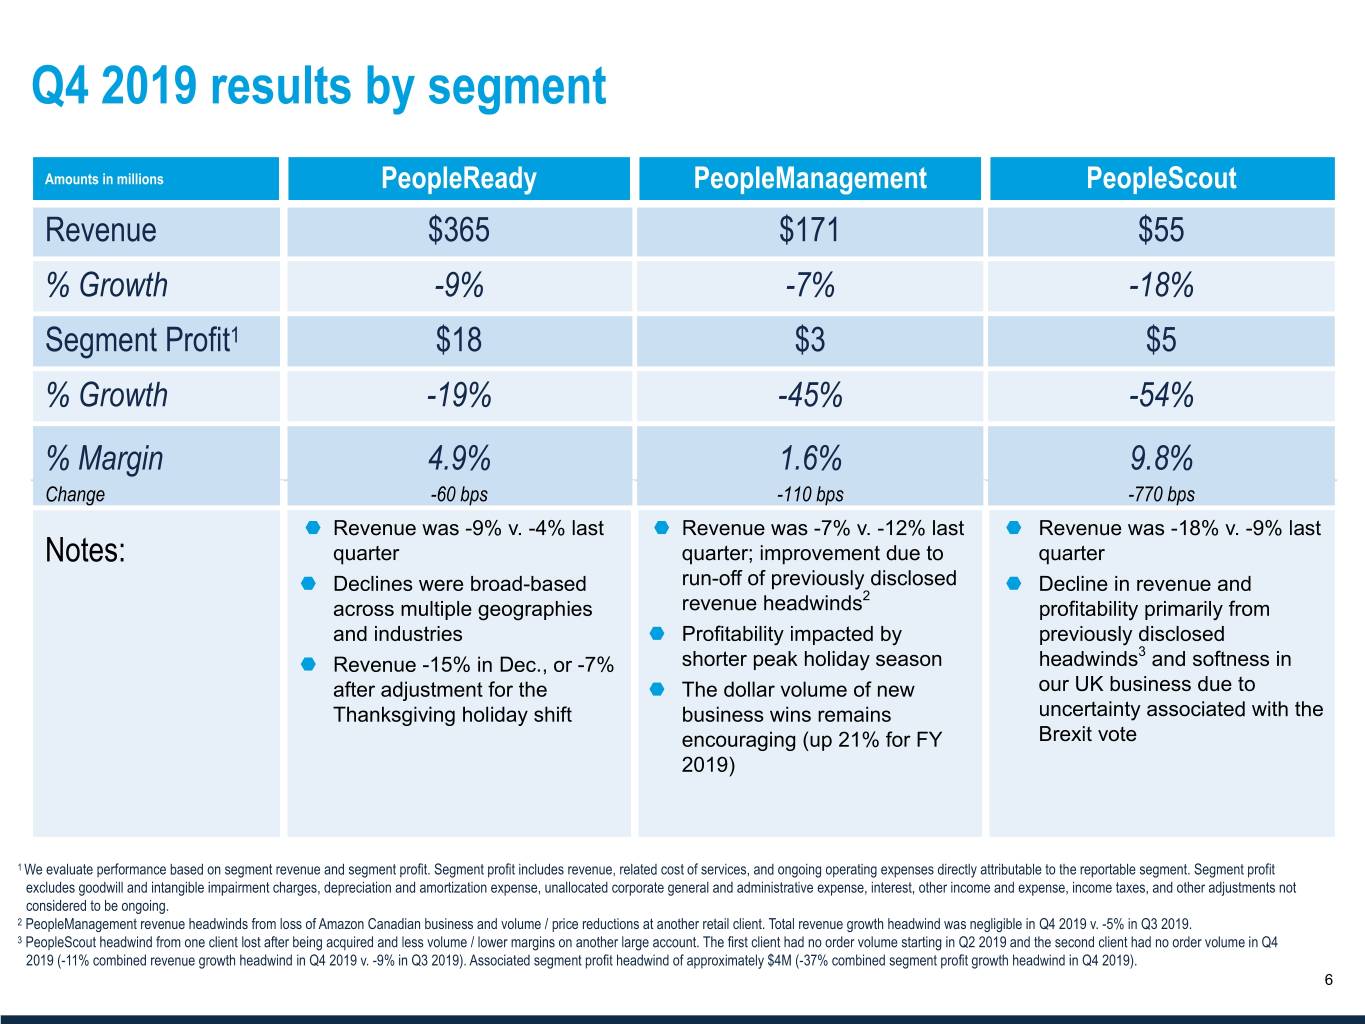
Q4 2019 results by segment Amounts in millions PeopleReady PeopleManagement PeopleScout Revenue $365 $171 $55 % Growth -9% -7% -18% Segment Profit1 $18 $3 $5 % Growth -19% -45% -54% % Margin 4.9% 1.6% 9.8% Change -60 bps -110 bps -770 bps ¬ Revenue was -9% v. -4% last ¬ Revenue was -7% v. -12% last ¬ Revenue was -18% v. -9% last Notes: quarter quarter; improvement due to quarter ¬ Declines were broad-based run-off of previously disclosed ¬ Decline in revenue and 2 across multiple geographies revenue headwinds profitability primarily from and industries ¬ Profitability impacted by previously disclosed 3 ¬ Revenue -15% in Dec., or -7% shorter peak holiday season headwinds and softness in after adjustment for the ¬ The dollar volume of new our UK business due to Thanksgiving holiday shift business wins remains uncertainty associated with the encouraging (up 21% for FY Brexit vote 2019) 1 We evaluate performance based on segment revenue and segment profit. Segment profit includes revenue, related cost of services, and ongoing operating expenses directly attributable to the reportable segment. Segment profit excludes goodwill and intangible impairment charges, depreciation and amortization expense, unallocated corporate general and administrative expense, interest, other income and expense, income taxes, and other adjustments not considered to be ongoing. 2 PeopleManagement revenue headwinds from loss of Amazon Canadian business and volume / price reductions at another retail client. Total revenue growth headwind was negligible in Q4 2019 v. -5% in Q3 2019. 3 PeopleScout headwind from one client lost after being acquired and less volume / lower margins on another large account. The first client had no order volume starting in Q2 2019 and the second client had no order volume in Q4 2019 (-11% combined revenue growth headwind in Q4 2019 v. -9% in Q3 2019). Associated segment profit headwind of approximately $4M (-37% combined segment profit growth headwind in Q4 2019). www.TrueBlue.com 6


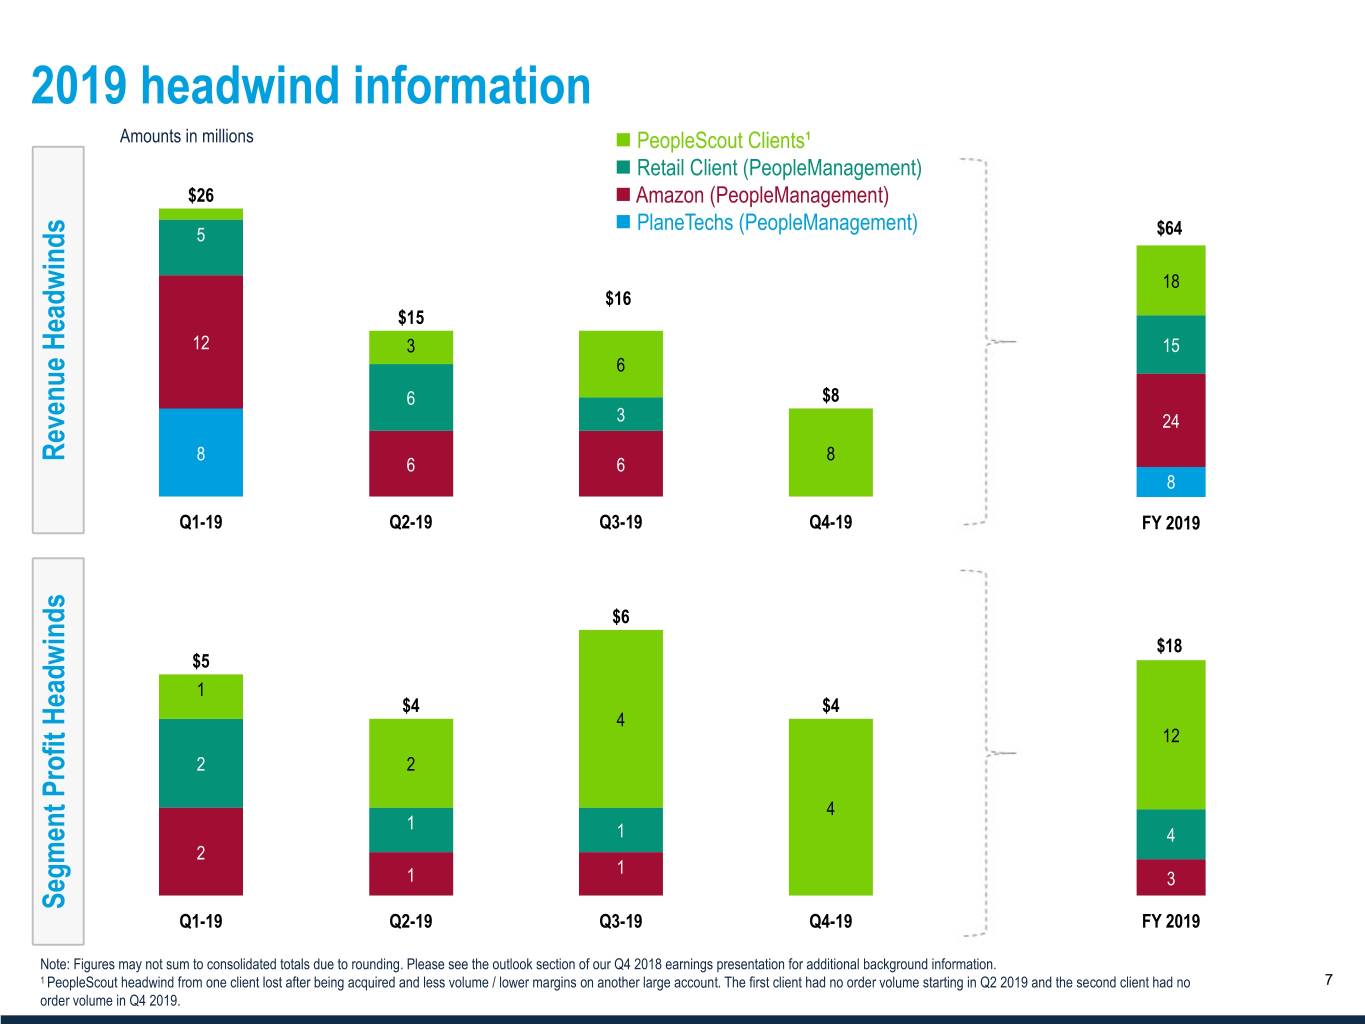
2019 headwind information Amounts in millions n PeopleScout Clients¹ n Retail Client (PeopleManagement) $26 n Amazon (PeopleManagement) n PlaneTechs (PeopleManagement) 5 $64 18 $16 $15 12 3 15 6 6 $8 3 24 Revenue Headwinds 8 8 6 6 8 Q1-19 Q2-19 Q3-19 Q4-19 FY 2019 $6 $18 $5 1 $4 $4 4 12 2 2 4 1 1 4 2 1 1 3 Segment Profit Headwinds Q1-19 Q2-19 Q3-19 Q4-19 FY 2019 Note: Figures may not sum to consolidated totals due to rounding. Please see the outlook section of our Q4 2018 earnings presentation for additional background information. www.TrueBlue.com1 PeopleScout headwind from one client lost after being acquired and less volume / lower margins on another large account. The first client had no order volume starting in Q2 2019 and the second client had no 7 order volume in Q4 2019.


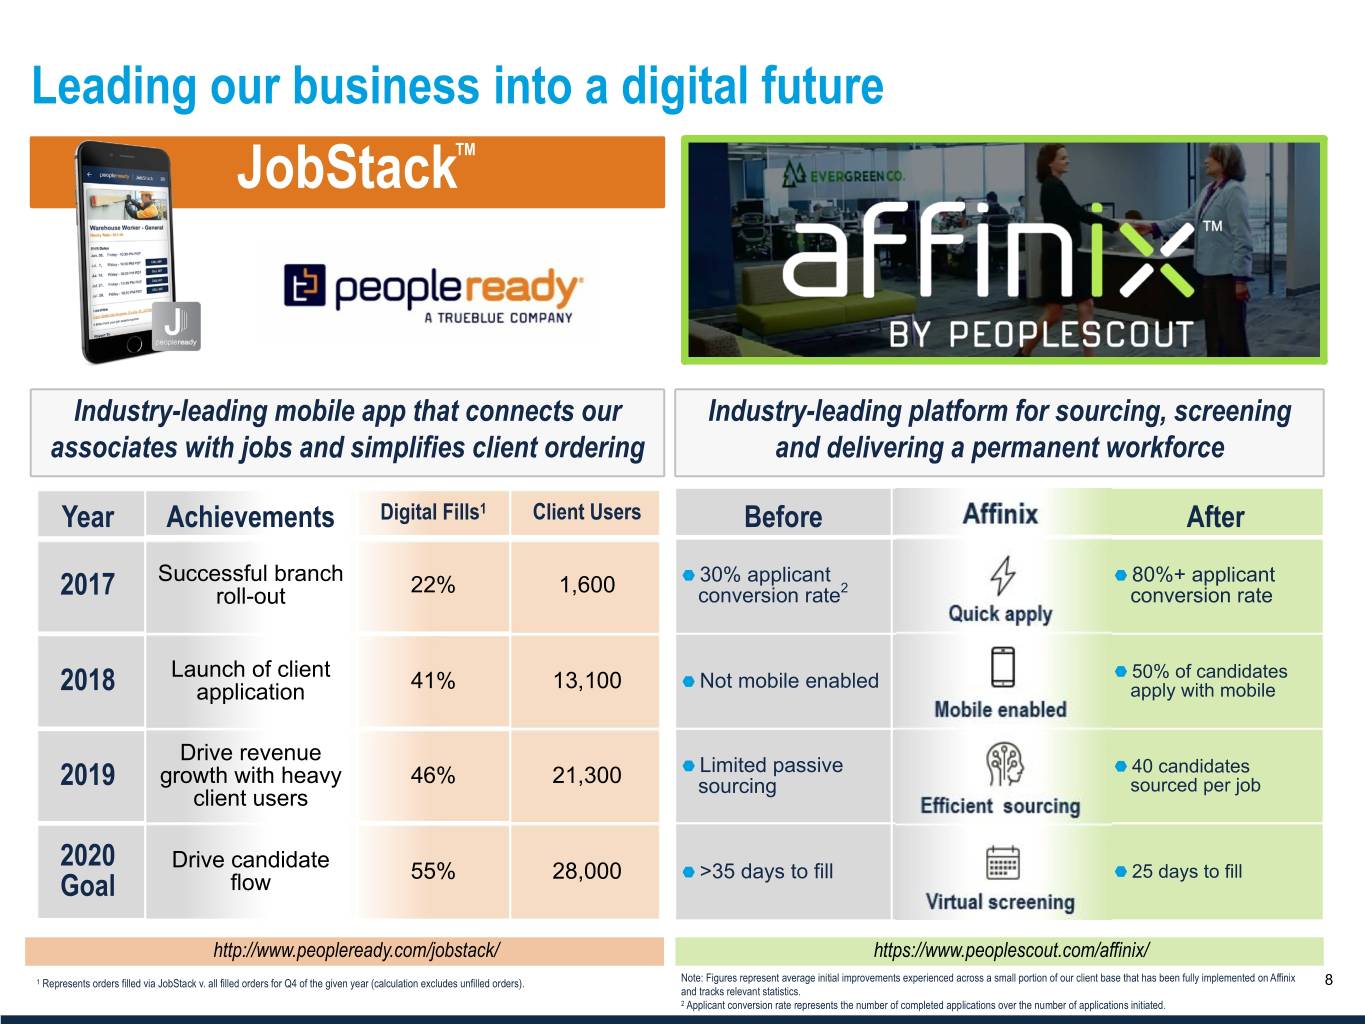
Leading our business into a digital future JobStackTM Industry-leading mobile app that connects our Industry-leading platform for sourcing, screening associates with jobs and simplifies client ordering and delivering a permanent workforce Year Achievements Digital Fills1 Client Users Before After Successful branch ¬ 30% applicant ¬ 80%+ applicant 22% 1,600 2 2017 roll-out conversion rate conversion rate ¬ Launch of client ¬ 50% of candidates 41% 13,100 Not mobile enabled 2018 application apply with mobile Drive revenue ¬ Limited passive ¬ 40 candidates 2019 growth with heavy 46% 21,300 sourcing sourced per job client users 2020 Drive candidate ¬ ¬ Goal flow 55% 28,000 >35 days to fill 25 days to fill http://www.peopleready.com/jobstack/ https://www.peoplescout.com/affinix/ Note: Figures represent average initial improvements experienced across a small portion of our client base that has been fully implemented on Affinix www.TrueBlue.com1 Represents orders filled via JobStack v. all filled orders for Q4 of the given year (calculation excludes unfilled orders). 8 and tracks relevant statistics. 2 Applicant conversion rate represents the number of completed applications over the number of applications initiated.


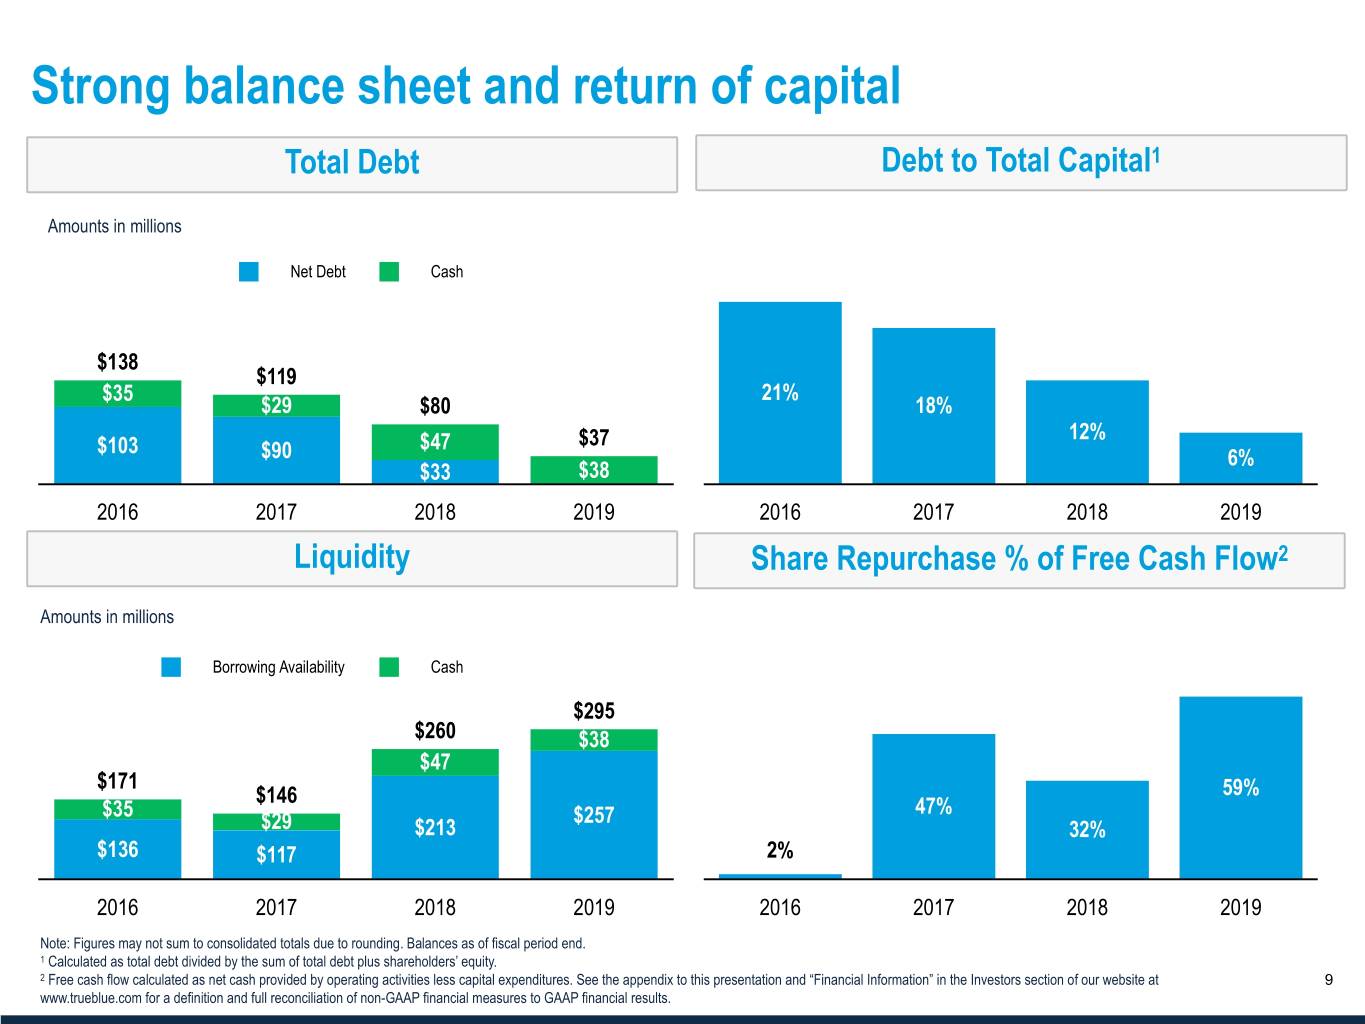
Strong balance sheet and return of capital Total Debt Debt to Total Capital1 Amounts in millions Net Debt Cash $138 $119 $35 21% $29 $80 18% 12% $103 $47 $37 $90 6% $33 $38 2016 2017 2018 2019 2016 2017 2018 2019 Liquidity Share Repurchase % of Free Cash Flow2 Amounts in millions Borrowing Availability Cash $295 $260 $38 $47 $171 $146 59% $35 $257 47% $29 $213 32% $136 $117 2% 2016 2017 2018 2019 2016 2017 2018 2019 Note: Figures may not sum to consolidated totals due to rounding. Balances as of fiscal period end. 1 Calculated as total debt divided by the sum of total debt plus shareholders’ equity. www.TrueBlue.com2 Free cash flow calculated as net cash provided by operating activities less capital expenditures. See the appendix to this presentation and “Financial Information” in the Investors section of our website at 9 www.trueblue.com for a definition and full reconciliation of non-GAAP financial measures to GAAP financial results.


Outlook


Q1 outlook Amounts in millions, except per share data Outlook Notes $503 to $528 Revenue: Total TrueBlue¹ l Incremental improvement v. Q4 2019 based on recent trends -9% to -4% growth Revenue: PeopleReady $303 to $314 l Incremental improvement v. Q4 2019 based on recent trends -7% to -4% growth Revenue: PeopleManagement $149 to $158 l Incremental improvement v. Q4 2019 based on new clients wins ramping on -5% to 0% growth Revenue: PeopleScout $50 to $55 l See detail on client headwinds below ($5M revenue impact, or 8% growth impact) -26% to -18% growth Net loss per basic share $0.07 to $0.00 l Assumes an effective income tax rate of 12% l Assumes basic weighted average shares outstanding of 37.8M and diluted Adjusted net income per diluted share $0.04 to $0.11 weighted average shares outstanding of 38.4M Select 2020 outlook information Q1 Q2 Q3 Q4 l 2020 capex in-line with historical run rate with the exception of $10M in Capital Expenditures $5 $7 $12 $13 capex related to our Chicago headquarters. The lessor will subsidize the majority of the build-out, with offsetting cash flow expected in 2021. No material change to depreciation anticipated. PeopleScout Client Headwinds Q1 Q2 Q3 Q4 Revenue Headwind -$5 -$4 -$2 $0 l As previously disclosed, PeopleScout headwind from one client lost after being acquired and less volume / lower margins on another large account. The first client had no order volume starting in Q2 2019 and Segment Profit Headwind -$3 -$2 -$1 $0 the second client had no order volume in Q4 2019. www.TrueBlue.com 11 1 Figures may not sum to consolidated totals due to rounding.


Appendix


NON-GAAP FINANCIAL MEASURES AND NON-GAAP RECONCILIATIONS In addition to financial measures presented in accordance with U.S. GAAP, we monitor certain non-GAAP key financial measures. The presentation of these non-GAAP financial measures is used to enhance the understanding of certain aspects of our financial performance. It is not meant to be considered in isolation, superior to, or as a substitute for the directly comparable financial measures prepared in accordance with U.S. GAAP, and may not be comparable to similarly titled measures of other companies. Non-GAAP Measure Definition Purpose of Adjusted Measures EBITDA and EBITDA excludes from net income: - Enhances comparability on a consistent basis and provides Adjusted EBITDA - interest and other income (expense), net, investors with useful insight into the underlying trends of the - income taxes, and business. - depreciation and amortization. - Used by management to assess performance and Adjusted EBITDA, further excludes: effectiveness of our business strategies. - Work Opportunity Tax Credit third-party processing fees, - acquisition/integration costs - Provides a measure, among others, used in the - gain on deferred compensation assets, and determination of incentive compensation for management. - other adjustments. Adjusted net Net income and net income per diluted share, excluding: - Enhances comparability on a consistent basis and provides income and - amortization of intangibles of acquired businesses, investors with useful insight into the underlying trends of the Adjusted net - acquisition/integration costs, business. income, per diluted - gain on divestiture, share - other adjustments, - Used by management to assess performance and - tax effect of each adjustment to U.S. GAAP net income, and effectiveness of our business strategies. - adjust income taxes to the expected effective tax rate. Free cash flow Net cash provided by operating activities, minus cash purchases - Used by management to assess cash flows. for property and equipment. www.TrueBlue.com 13


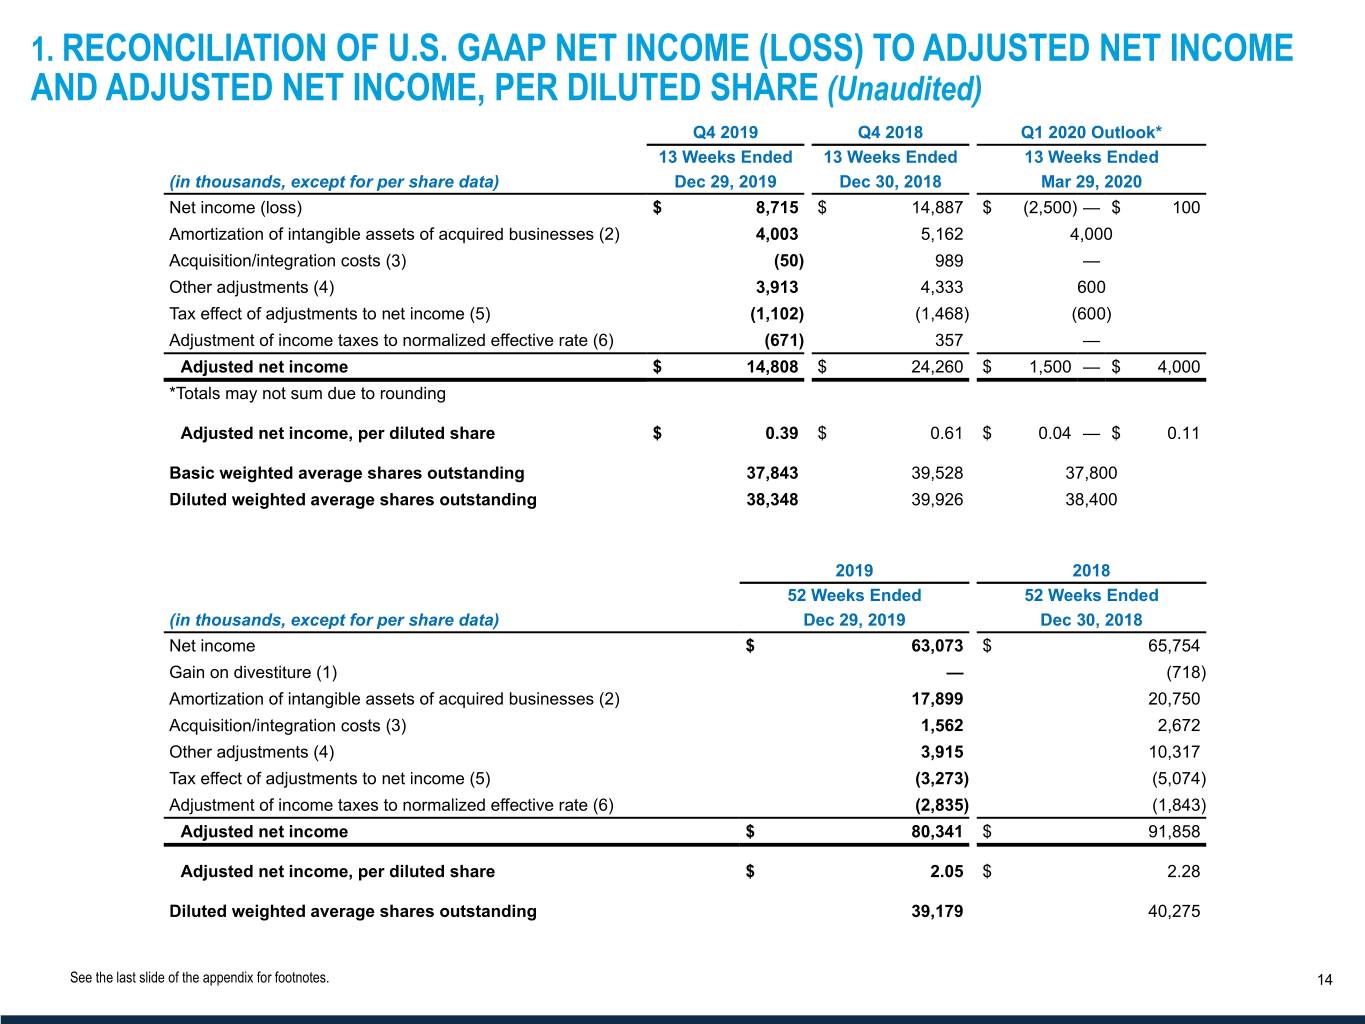
1. RECONCILIATION OF U.S. GAAP NET INCOME (LOSS) TO ADJUSTED NET INCOME AND ADJUSTED NET INCOME, PER DILUTED SHARE (Unaudited) Q4 2019 Q4 2018 Q1 2020 Outlook* 13 Weeks Ended 13 Weeks Ended 13 Weeks Ended (in thousands, except for per share data) Dec 29, 2019 Dec 30, 2018 Mar 29, 2020 Net income (loss) $ 8,715 $ 14,887 $ (2,500) — $ 100 Amortization of intangible assets of acquired businesses (2) 4,003 5,162 4,000 Acquisition/integration costs (3) (50) 989 — Other adjustments (4) 3,913 4,333 600 Tax effect of adjustments to net income (5) (1,102) (1,468) (600) Adjustment of income taxes to normalized effective rate (6) (671) 357 — Adjusted net income $ 14,808 $ 24,260 $ 1,500 — $ 4,000 *Totals may not sum due to rounding Adjusted net income, per diluted share $ 0.39 $ 0.61 $ 0.04 — $ 0.11 Basic weighted average shares outstanding 37,843 39,528 37,800 Diluted weighted average shares outstanding 38,348 39,926 38,400 2019 2018 52 Weeks Ended 52 Weeks Ended (in thousands, except for per share data) Dec 29, 2019 Dec 30, 2018 Net income $ 63,073 $ 65,754 Gain on divestiture (1) — (718) Amortization of intangible assets of acquired businesses (2) 17,899 20,750 Acquisition/integration costs (3) 1,562 2,672 Other adjustments (4) 3,915 10,317 Tax effect of adjustments to net income (5) (3,273) (5,074) Adjustment of income taxes to normalized effective rate (6) (2,835) (1,843) Adjusted net income $ 80,341 $ 91,858 Adjusted net income, per diluted share $ 2.05 $ 2.28 Diluted weighted average shares outstanding 39,179 40,275 www.TrueBlue.comSee the last slide of the appendix for footnotes. 14


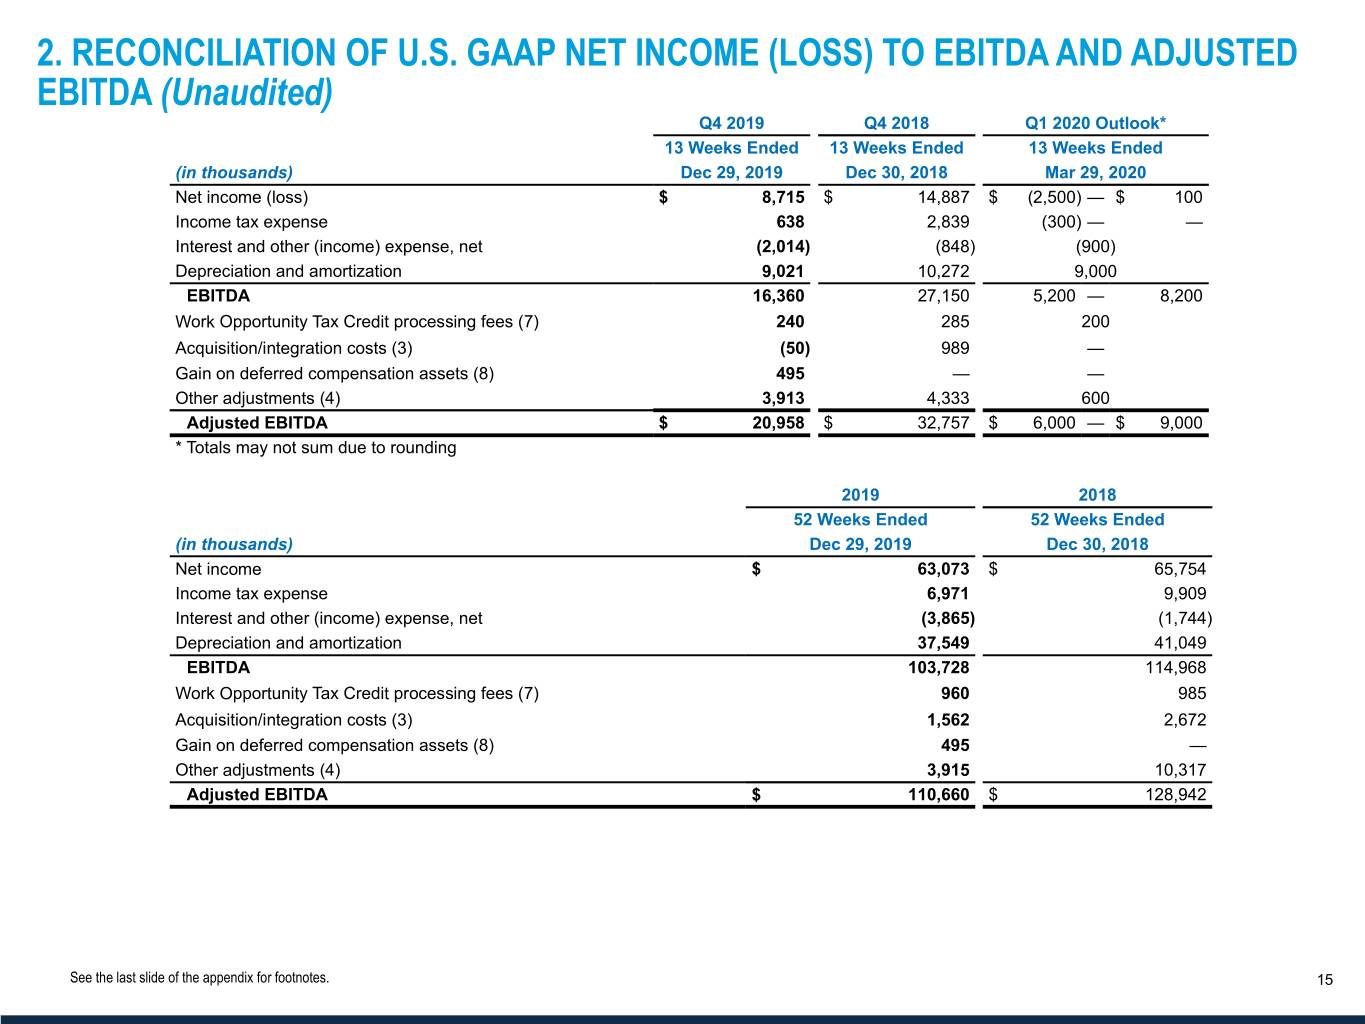
2. RECONCILIATION OF U.S. GAAP NET INCOME (LOSS) TO EBITDA AND ADJUSTED EBITDA (Unaudited) Q4 2019 Q4 2018 Q1 2020 Outlook* 13 Weeks Ended 13 Weeks Ended 13 Weeks Ended (in thousands) Dec 29, 2019 Dec 30, 2018 Mar 29, 2020 Net income (loss) $ 8,715 $ 14,887 $ (2,500) — $ 100 Income tax expense 638 2,839 (300) — — Interest and other (income) expense, net (2,014) (848) (900) Depreciation and amortization 9,021 10,272 9,000 EBITDA 16,360 27,150 5,200 — 8,200 Work Opportunity Tax Credit processing fees (7) 240 285 200 Acquisition/integration costs (3) (50) 989 — Gain on deferred compensation assets (8) 495 — — Other adjustments (4) 3,913 4,333 600 Adjusted EBITDA $ 20,958 $ 32,757 $ 6,000 — $ 9,000 * Totals may not sum due to rounding 2019 2018 52 Weeks Ended 52 Weeks Ended (in thousands) Dec 29, 2019 Dec 30, 2018 Net income $ 63,073 $ 65,754 Income tax expense 6,971 9,909 Interest and other (income) expense, net (3,865) (1,744) Depreciation and amortization 37,549 41,049 EBITDA 103,728 114,968 Work Opportunity Tax Credit processing fees (7) 960 985 Acquisition/integration costs (3) 1,562 2,672 Gain on deferred compensation assets (8) 495 — Other adjustments (4) 3,915 10,317 Adjusted EBITDA $ 110,660 $ 128,942 www.TrueBlue.comSee the last slide of the appendix for footnotes. 15


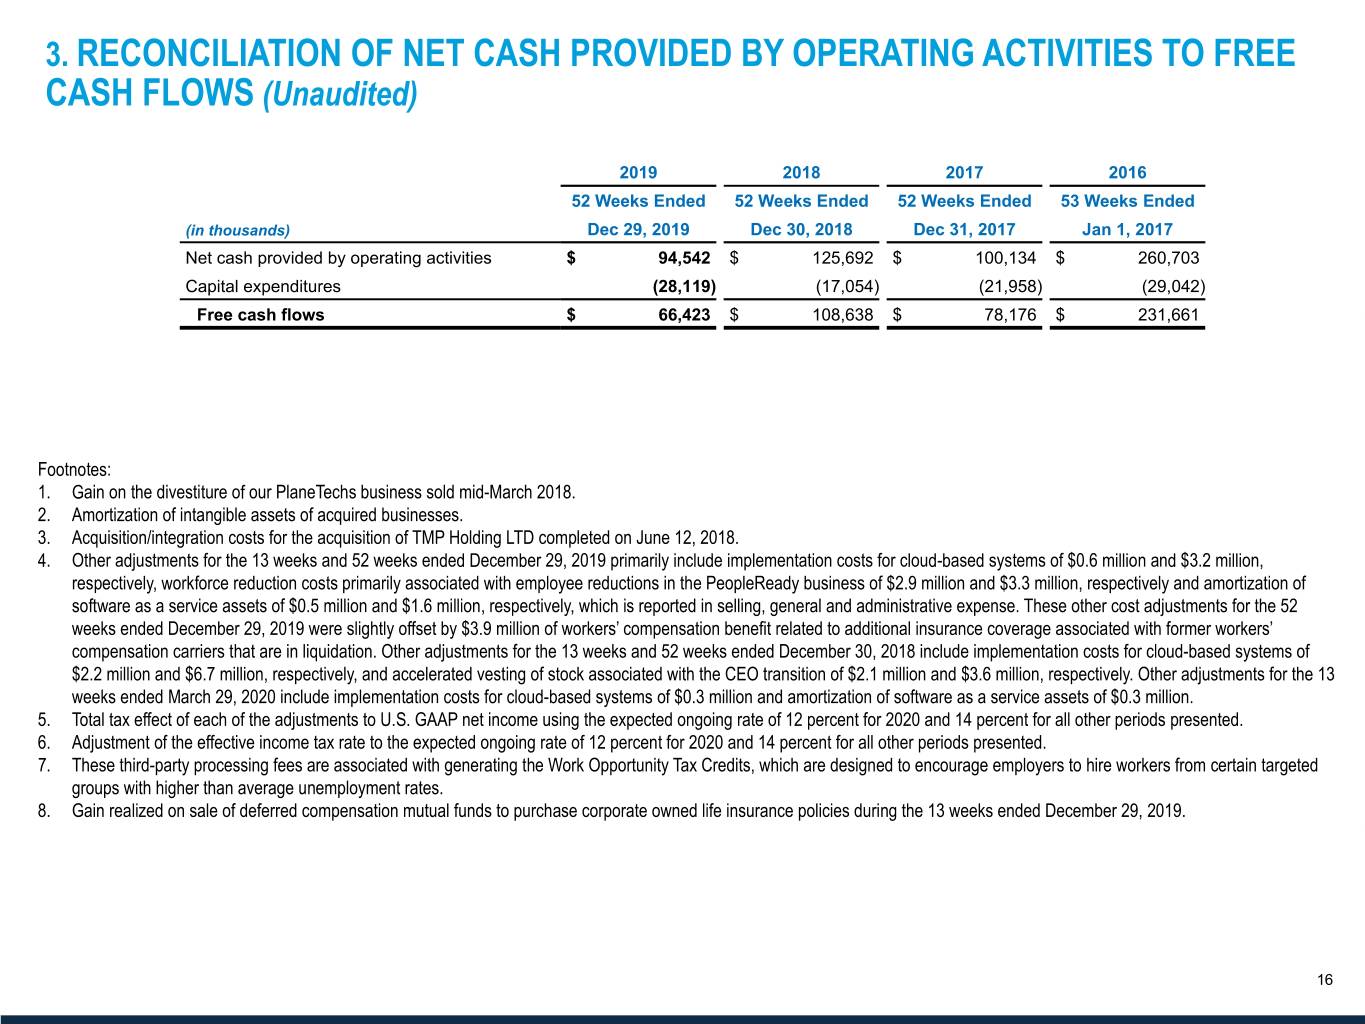
3. RECONCILIATION OF NET CASH PROVIDED BY OPERATING ACTIVITIES TO FREE CASH FLOWS (Unaudited) 2019 2018 2017 2016 52 Weeks Ended 52 Weeks Ended 52 Weeks Ended 53 Weeks Ended (in thousands) Dec 29, 2019 Dec 30, 2018 Dec 31, 2017 Jan 1, 2017 Net cash provided by operating activities $ 94,542 $ 125,692 $ 100,134 $ 260,703 Capital expenditures (28,119) (17,054) (21,958) (29,042) Free cash flows $ 66,423 $ 108,638 $ 78,176 $ 231,661 Footnotes: 1. Gain on the divestiture of our PlaneTechs business sold mid-March 2018. 2. Amortization of intangible assets of acquired businesses. 3. Acquisition/integration costs for the acquisition of TMP Holding LTD completed on June 12, 2018. 4. Other adjustments for the 13 weeks and 52 weeks ended December 29, 2019 primarily include implementation costs for cloud-based systems of $0.6 million and $3.2 million, respectively, workforce reduction costs primarily associated with employee reductions in the PeopleReady business of $2.9 million and $3.3 million, respectively and amortization of software as a service assets of $0.5 million and $1.6 million, respectively, which is reported in selling, general and administrative expense. These other cost adjustments for the 52 weeks ended December 29, 2019 were slightly offset by $3.9 million of workers’ compensation benefit related to additional insurance coverage associated with former workers’ compensation carriers that are in liquidation. Other adjustments for the 13 weeks and 52 weeks ended December 30, 2018 include implementation costs for cloud-based systems of $2.2 million and $6.7 million, respectively, and accelerated vesting of stock associated with the CEO transition of $2.1 million and $3.6 million, respectively. Other adjustments for the 13 weeks ended March 29, 2020 include implementation costs for cloud-based systems of $0.3 million and amortization of software as a service assets of $0.3 million. 5. Total tax effect of each of the adjustments to U.S. GAAP net income using the expected ongoing rate of 12 percent for 2020 and 14 percent for all other periods presented. 6. Adjustment of the effective income tax rate to the expected ongoing rate of 12 percent for 2020 and 14 percent for all other periods presented. 7. These third-party processing fees are associated with generating the Work Opportunity Tax Credits, which are designed to encourage employers to hire workers from certain targeted groups with higher than average unemployment rates. 8. Gain realized on sale of deferred compensation mutual funds to purchase corporate owned life insurance policies during the 13 weeks ended December 29, 2019. www.TrueBlue.com 16


Investor Roadshow Presentation February 2020 www.TrueBlue.com
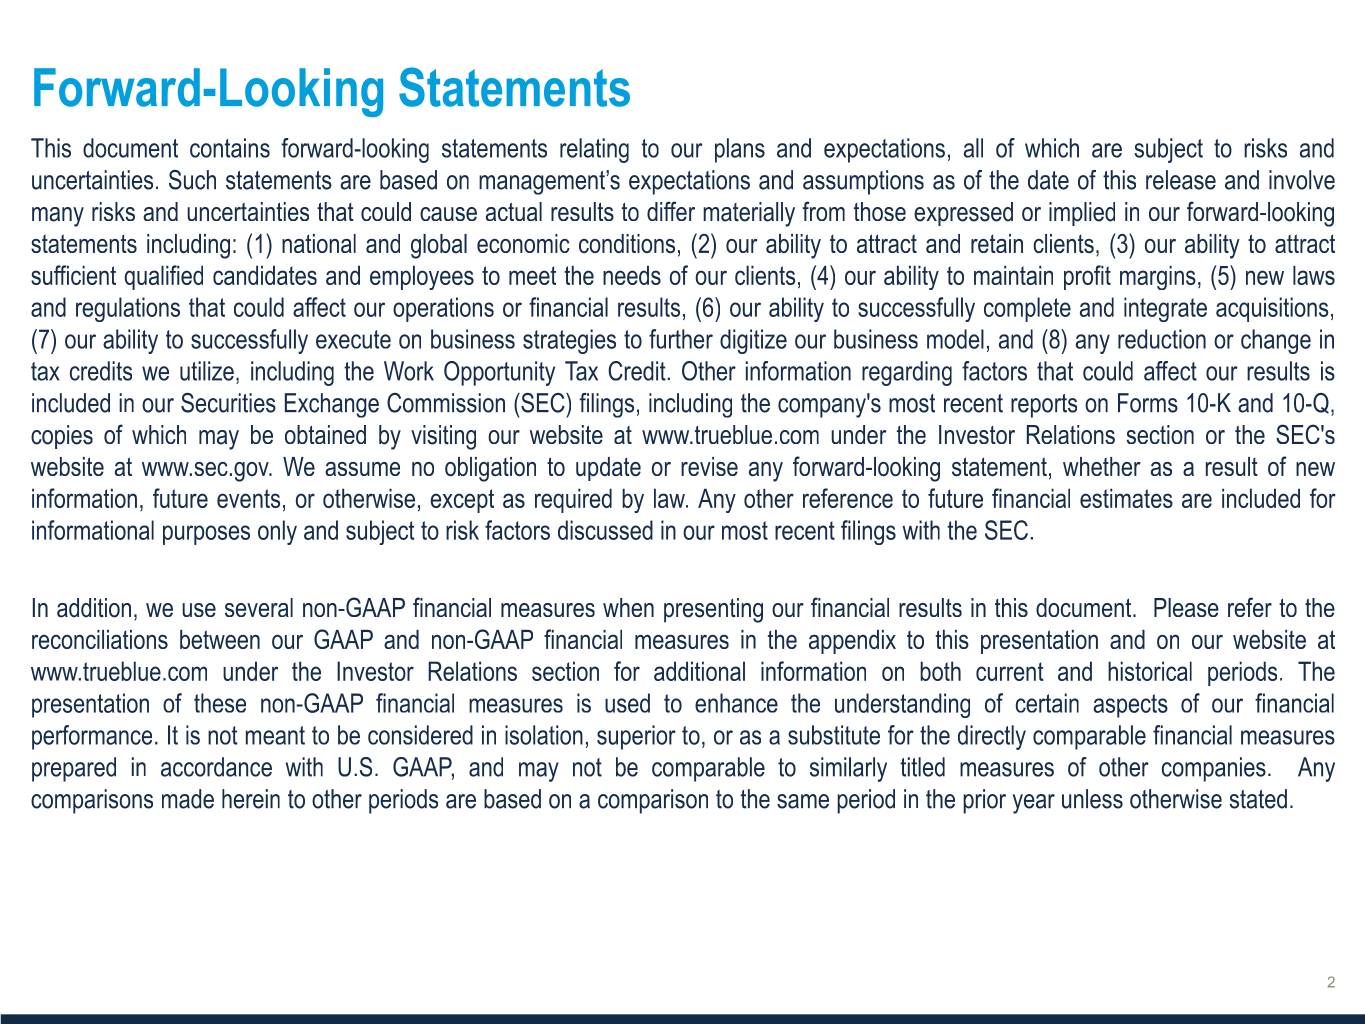

 
Forward-Looking Statements
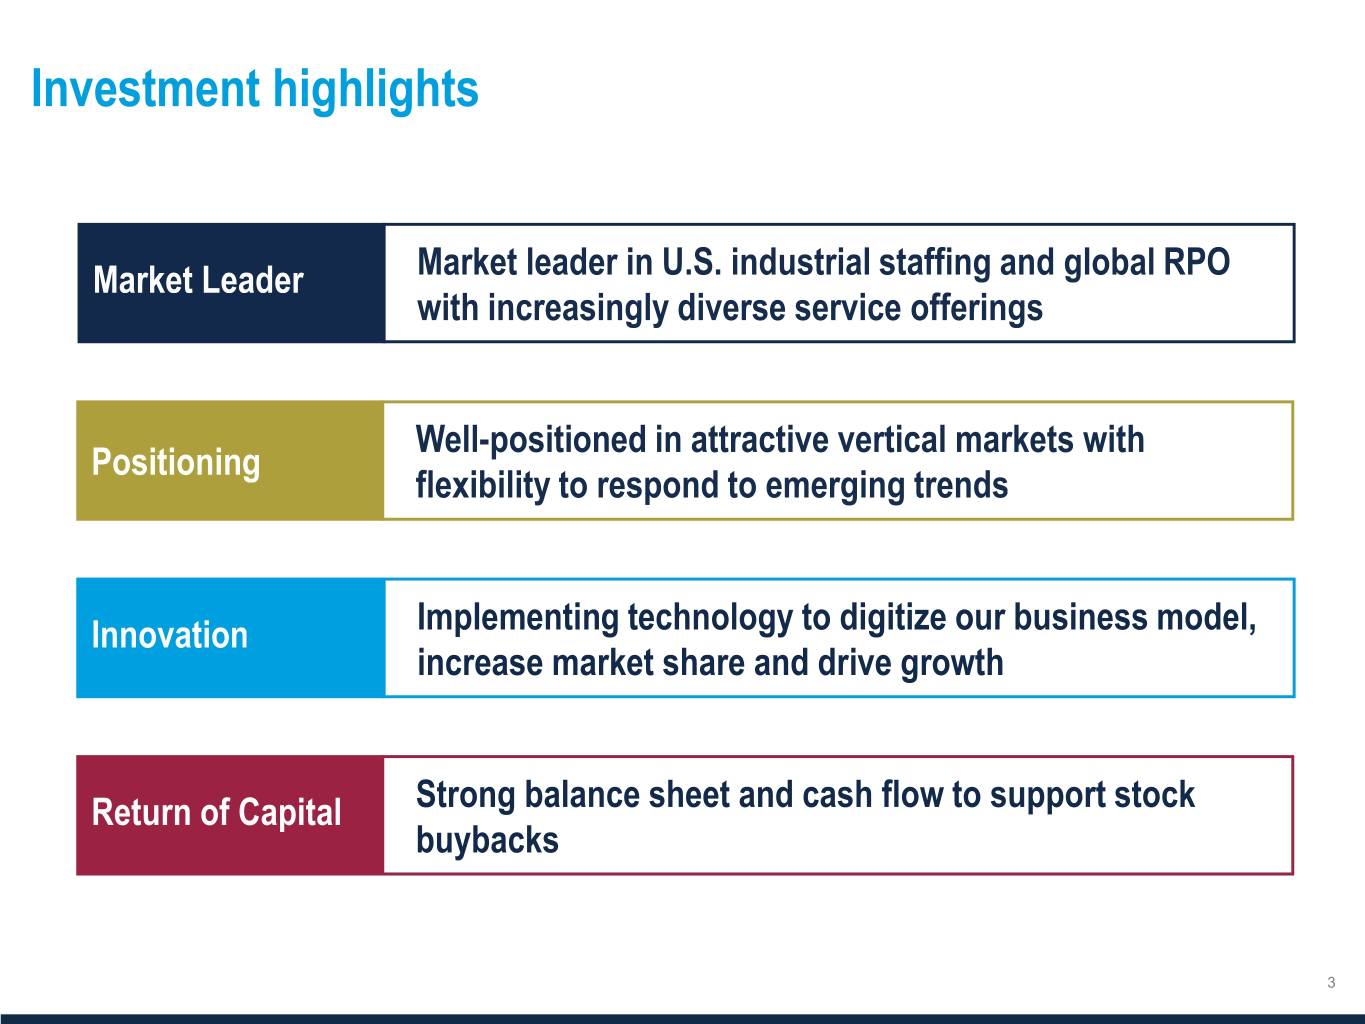

 
Investment highlights Implementing technology to digitize our business model, increase market share and drive growth Strong balance sheet and cash flow to support stock buybacks 3
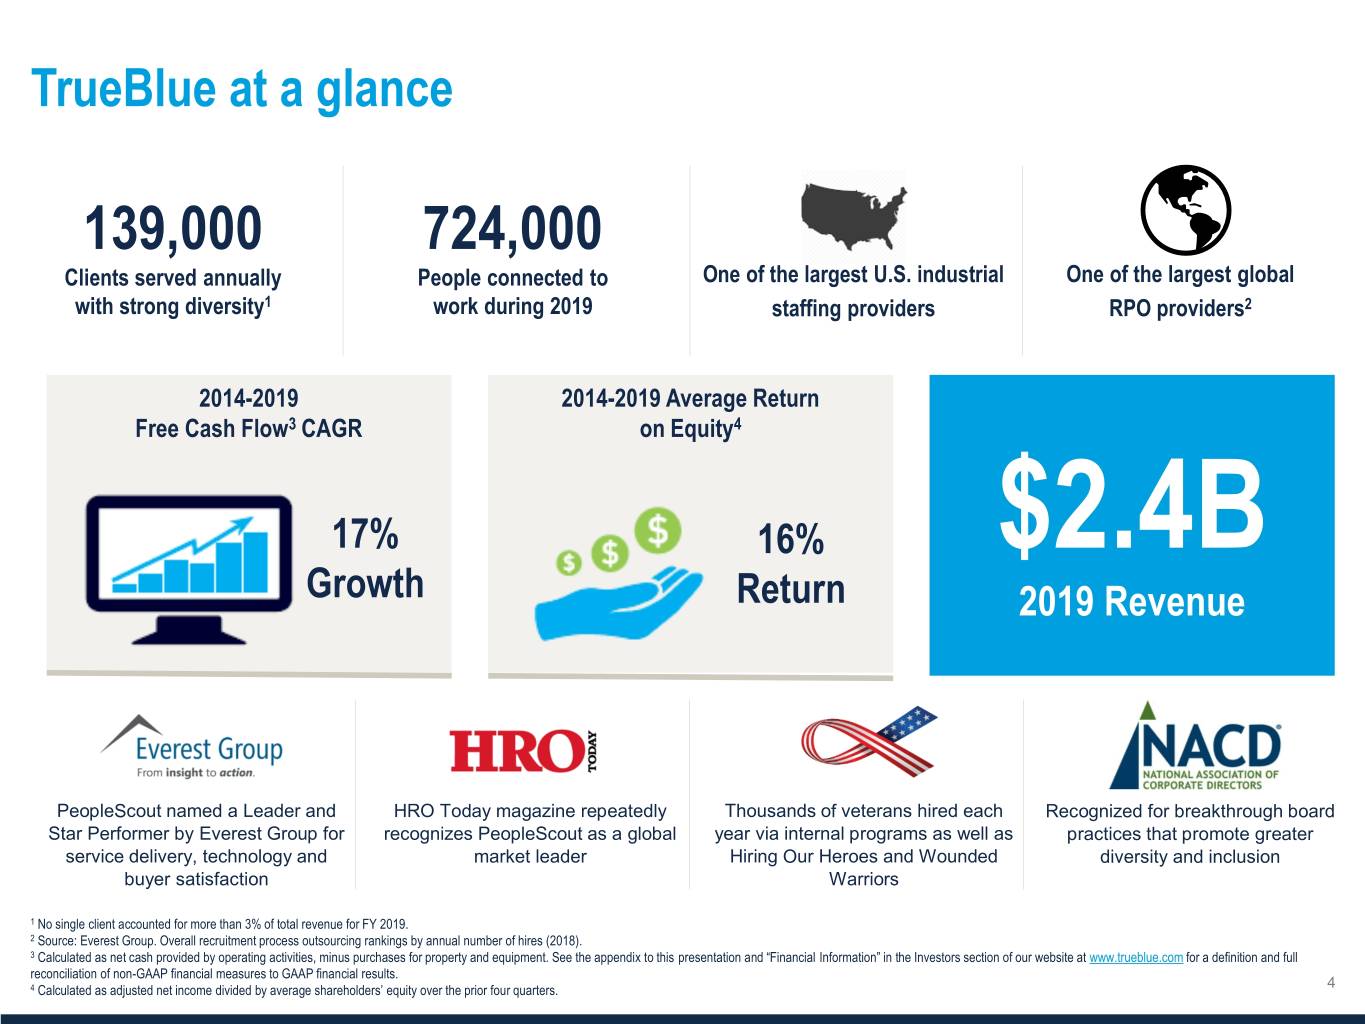

 
TrueBlue at a glance 139,000 724,000 Clients served annually People connected to One of the largest U.S. industrial One of the largest global with strong diversity1 work during 2019 staffing providers RPO providers2 2014-2019 2014-2019 Average Return Free Cash Flow3 CAGR on Equity4 17% 16% $2.4B Growth Return 2019 Revenue PeopleScout named a Leader and HRO Today magazine repeatedly Thousands of veterans hired each Recognized for breakthrough board Star Performer by Everest Group for recognizes PeopleScout as a global year via internal programs as well as practices that promote greater service delivery, technology and market leader Hiring Our Heroes and Wounded diversity and inclusion buyer satisfaction Warriors 1 No single client accounted for more than 3% of total revenue for FY 2019. 2 Source: Everest Group. Overall recruitment process outsourcing rankings by annual number of hires (2018). 3 Calculated as net cash provided by operating activities, minus purchases for property and equipment. See the appendix to this presentation and “Financial Information” in the Investors section of our website at www.trueblue.com for a definition and full reconciliation of non-GAAP financial measures to GAAP financial results. 4 4 Calculated as adjusted net income divided by average shareholders’ equity over the prior four quarters.
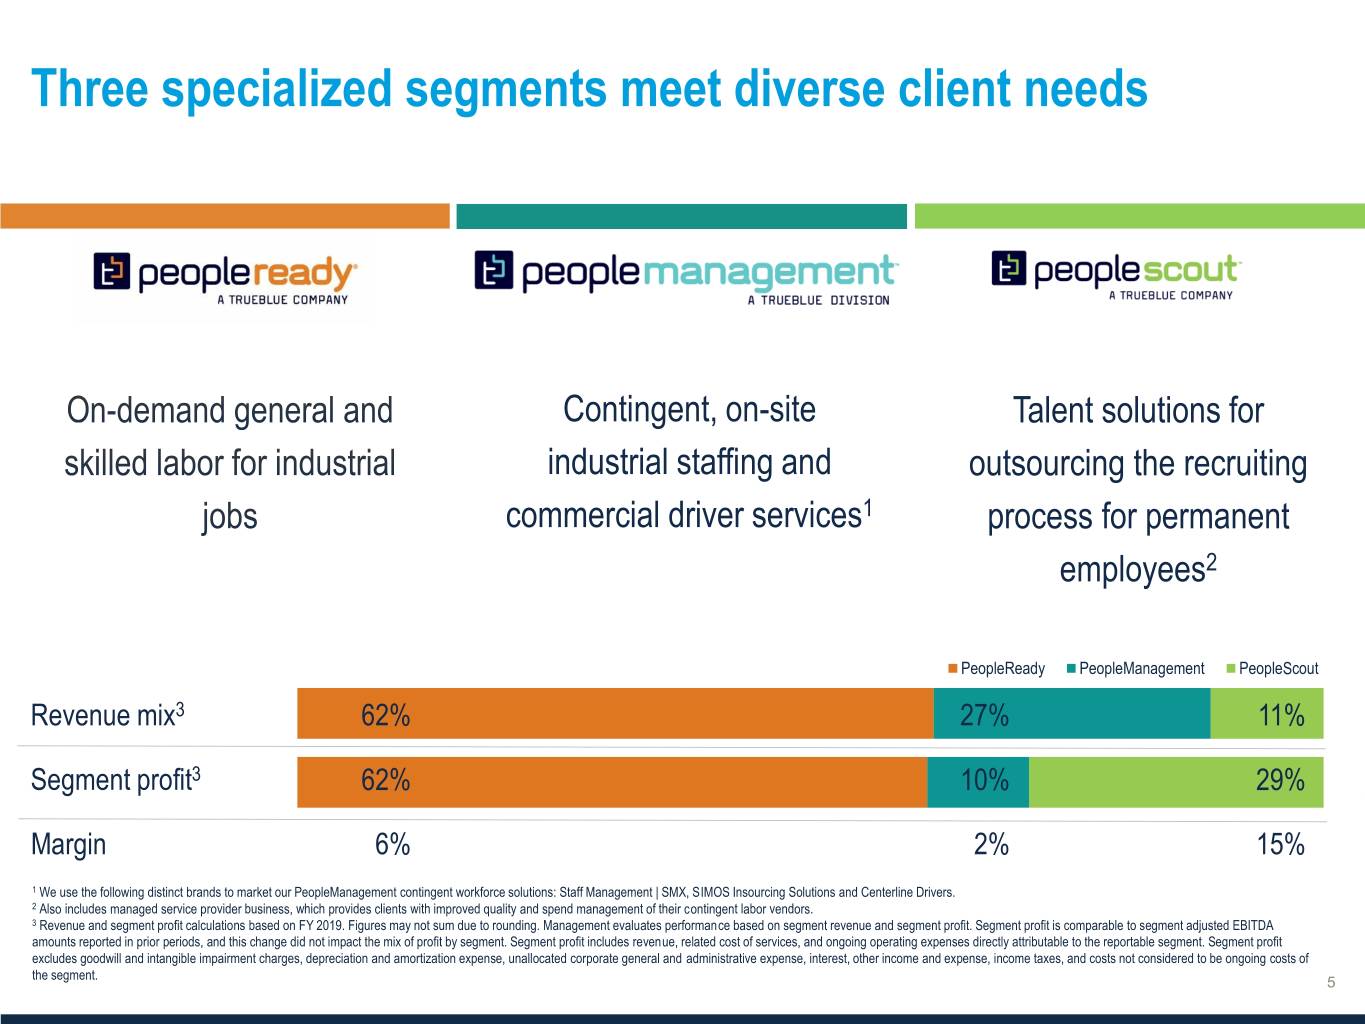

 
Three specialized segments meet diverse client needs Contingent, on-site Talent solutions for industrial staffing and outsourcing the recruiting commercial driver services1 process for permanent employees2 PeopleReady PeopleManagement PeopleScout Revenue mix3 62% 27% 11% Segment profit3 62% 10% 29% Margin 6% 2% 15% 1 We use the following distinct brands to market our PeopleManagement contingent workforce solutions: Staff Management | SMX, SIMOS Insourcing Solutions and Centerline Drivers. 2 Also includes managed service provider business, which provides clients with improved quality and spend management of their contingent labor vendors. 3 Revenue and segment profit calculations based on FY 2019. Figures may not sum due to rounding. Management evaluates performance based on segment revenue and segment profit. Segment profit is comparable to segment adjusted EBITDA amounts reported in prior periods, and this change did not impact the mix of profit by segment. Segment profit includes revenue, related cost of services, and ongoing operating expenses directly attributable to the reportable segment. Segment profit excludes goodwill and intangible impairment charges, depreciation and amortization expense, unallocated corporate general and administrative expense, interest, other income and expense, income taxes, and costs not considered to be ongoing costs of the segment.
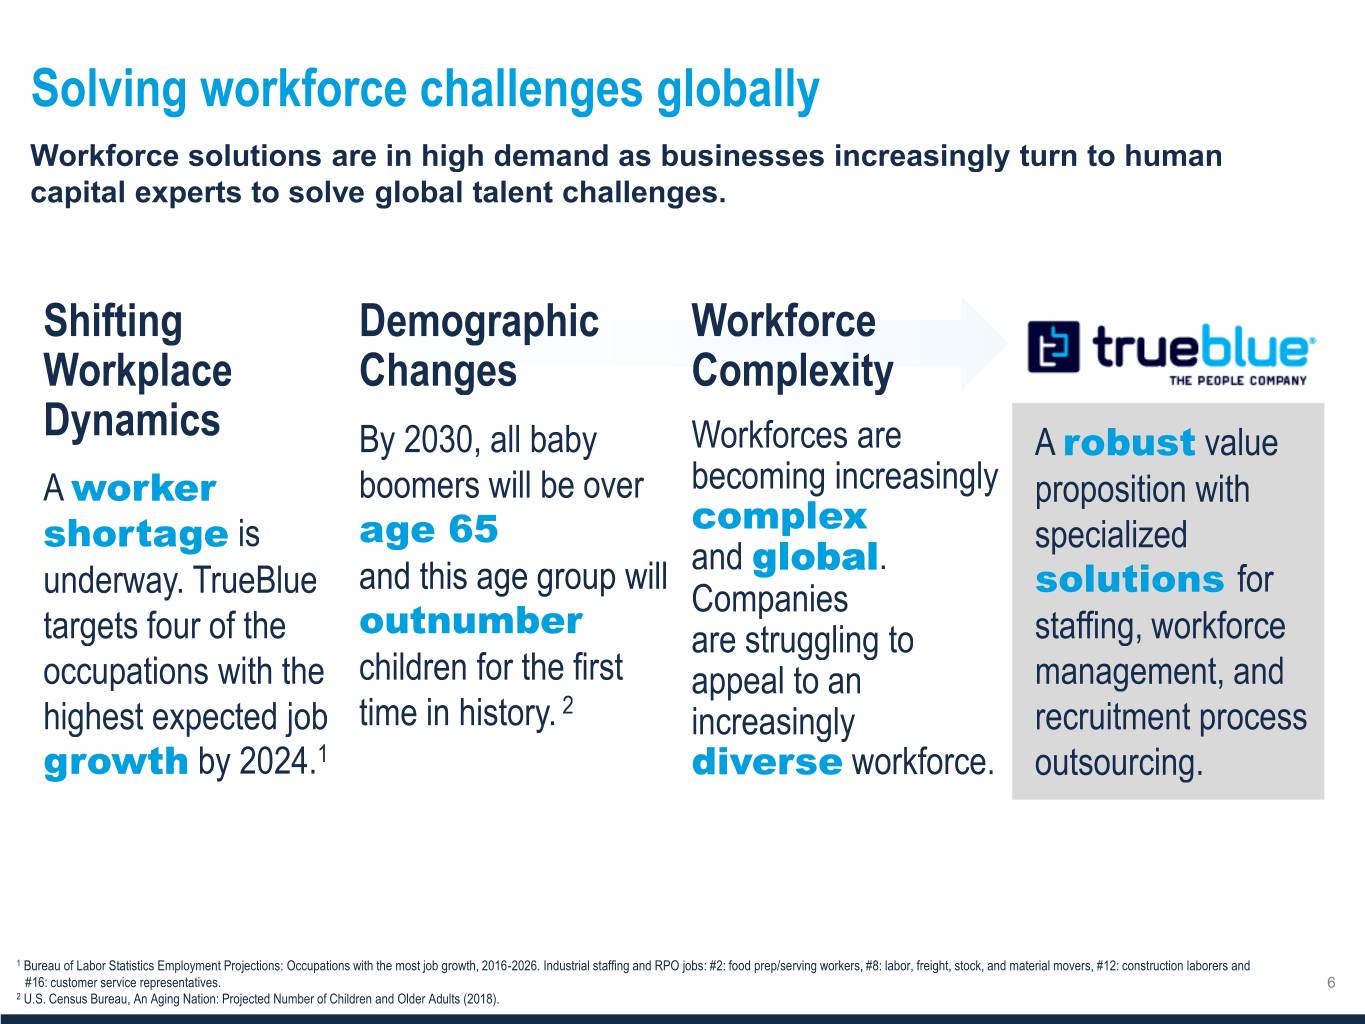

 
Solving workforce challenges globally robust worker shortage age 65 complex global and this age group will solutions outnumber growth diverse 1 Bureau of Labor Statistics Employment Projections: Occupations with the most job growth, 2016-2026. Industrial staffing and RPO jobs: #2: food prep/serving workers, #8: labor, freight, stock, and material movers, #12: construction laborers and #16: customer service representatives. 6 2 U.S. Census Bureau, An Aging Nation: Projected Number of Children and Older Adults (2018).
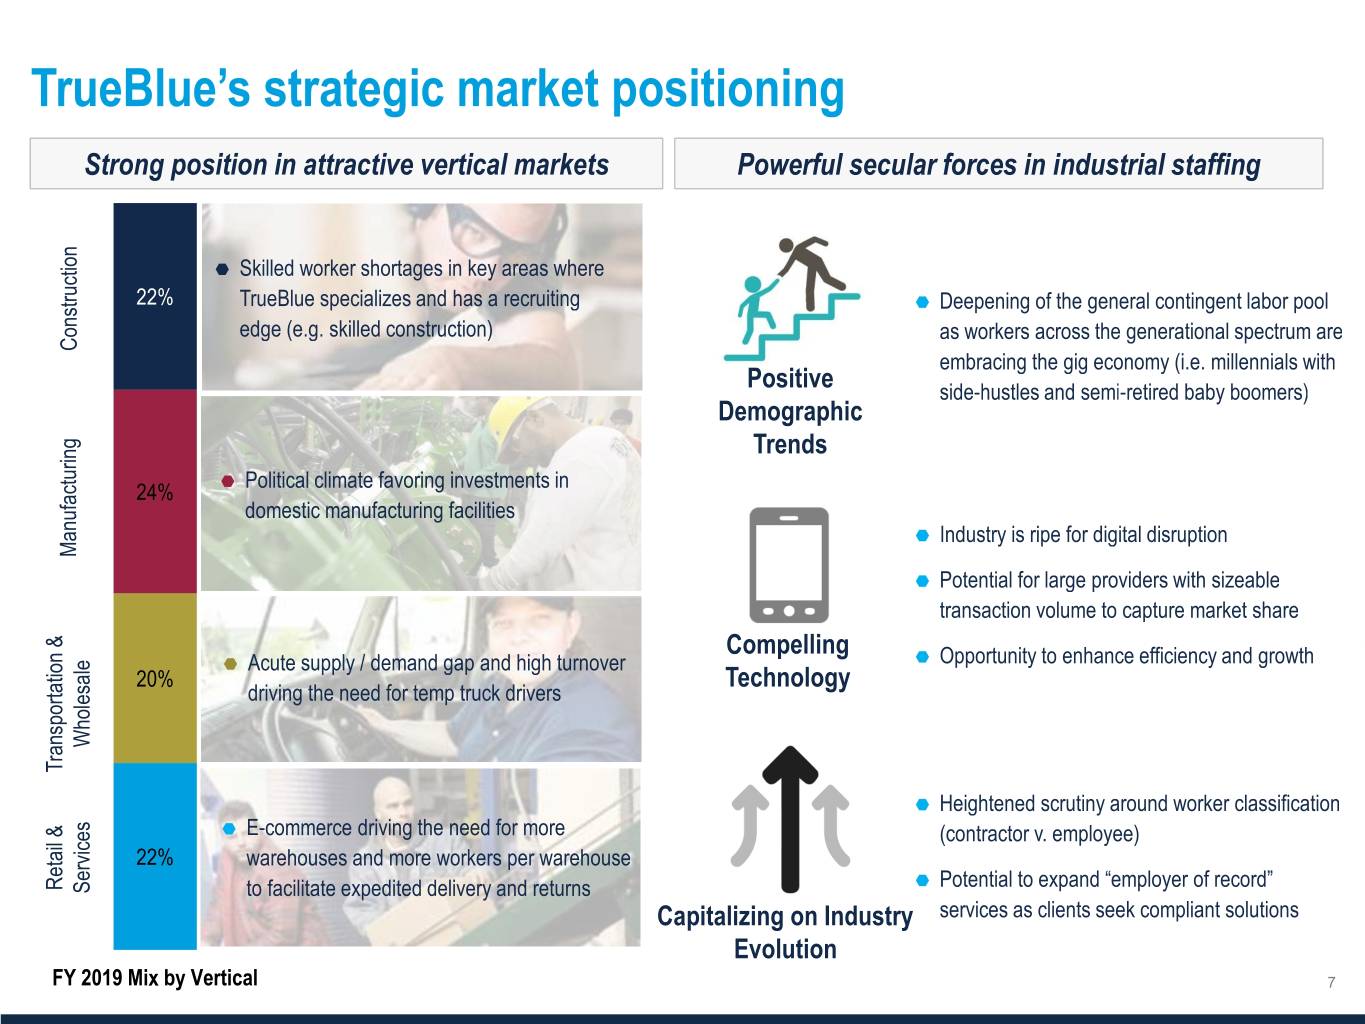

 
TrueBlue’s strategic market positioning Strong position in attractive vertical markets Powerful secular forces in industrial staffing  22%  Construction Positive Demographic Trends 24%   Manufacturing  Compelling   20% Technology Wholesale Transportation & Transportation   22% Retail &Retail  Services Capitalizing on Industry Evolution FY 2019 Mix by Vertical 7
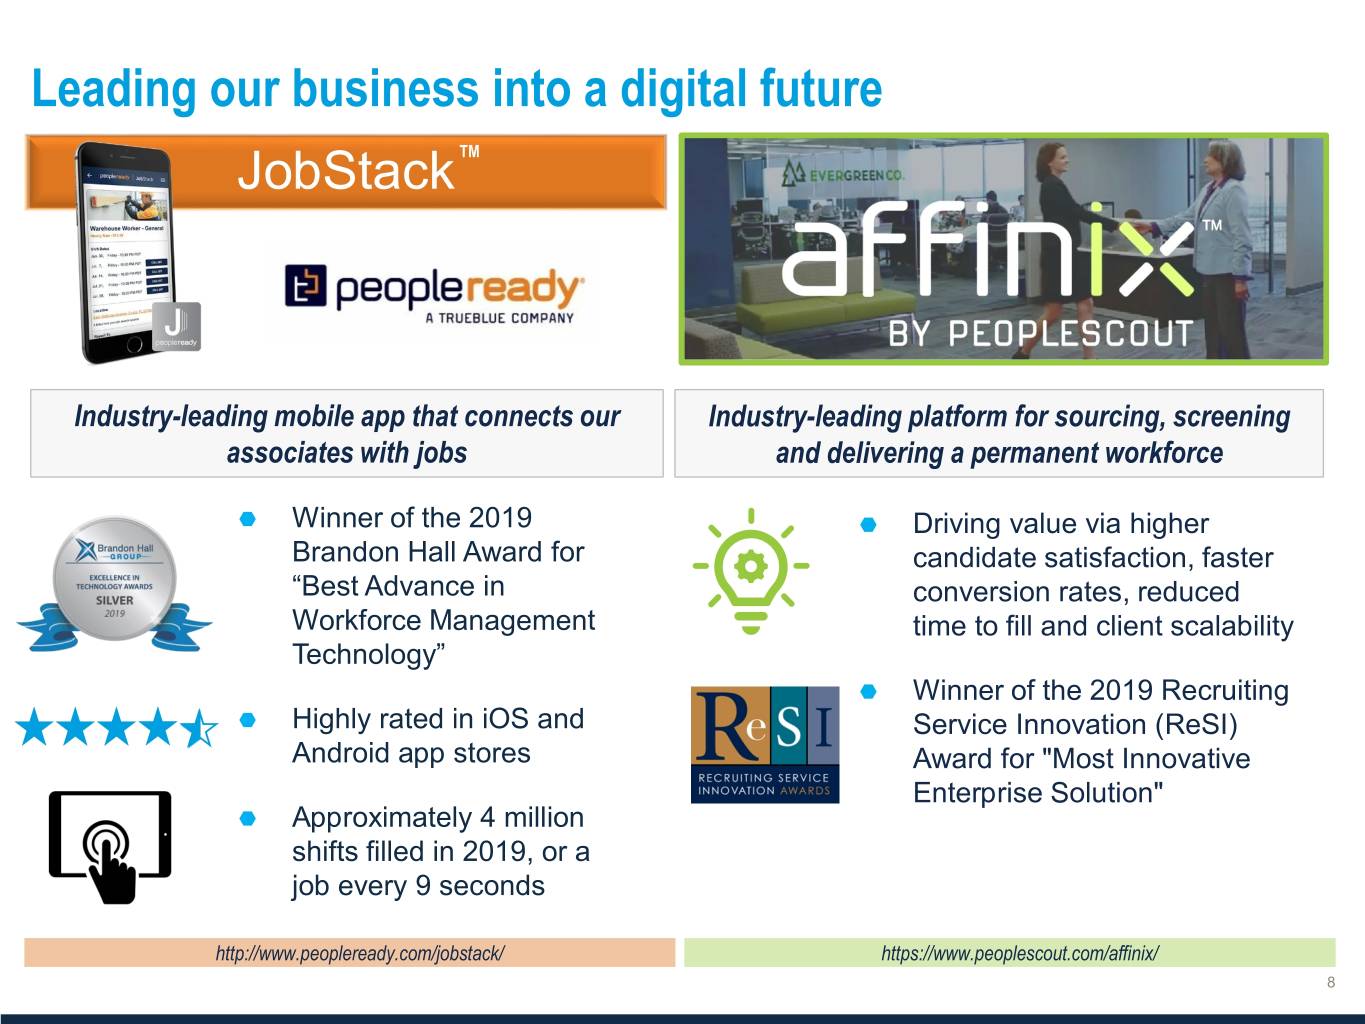

 
Leading our business into a digital future JobStack TM Industry-leading mobile app that connects our Industry-leading platform for sourcing, screening associates with jobs and delivering a permanent workforce  Winner of the 2019  Driving value via higher Brandon Hall Award for candidate satisfaction, faster “Best Advance in conversion rates, reduced Workforce Management time to fill and client scalability Technology”  Winner of the 2019 Recruiting  Highly rated in iOS and Service Innovation (ReSI) Android app stores Award for "Most Innovative Enterprise Solution"  Approximately 4 million shifts filled in 2019, or a job every 9 seconds
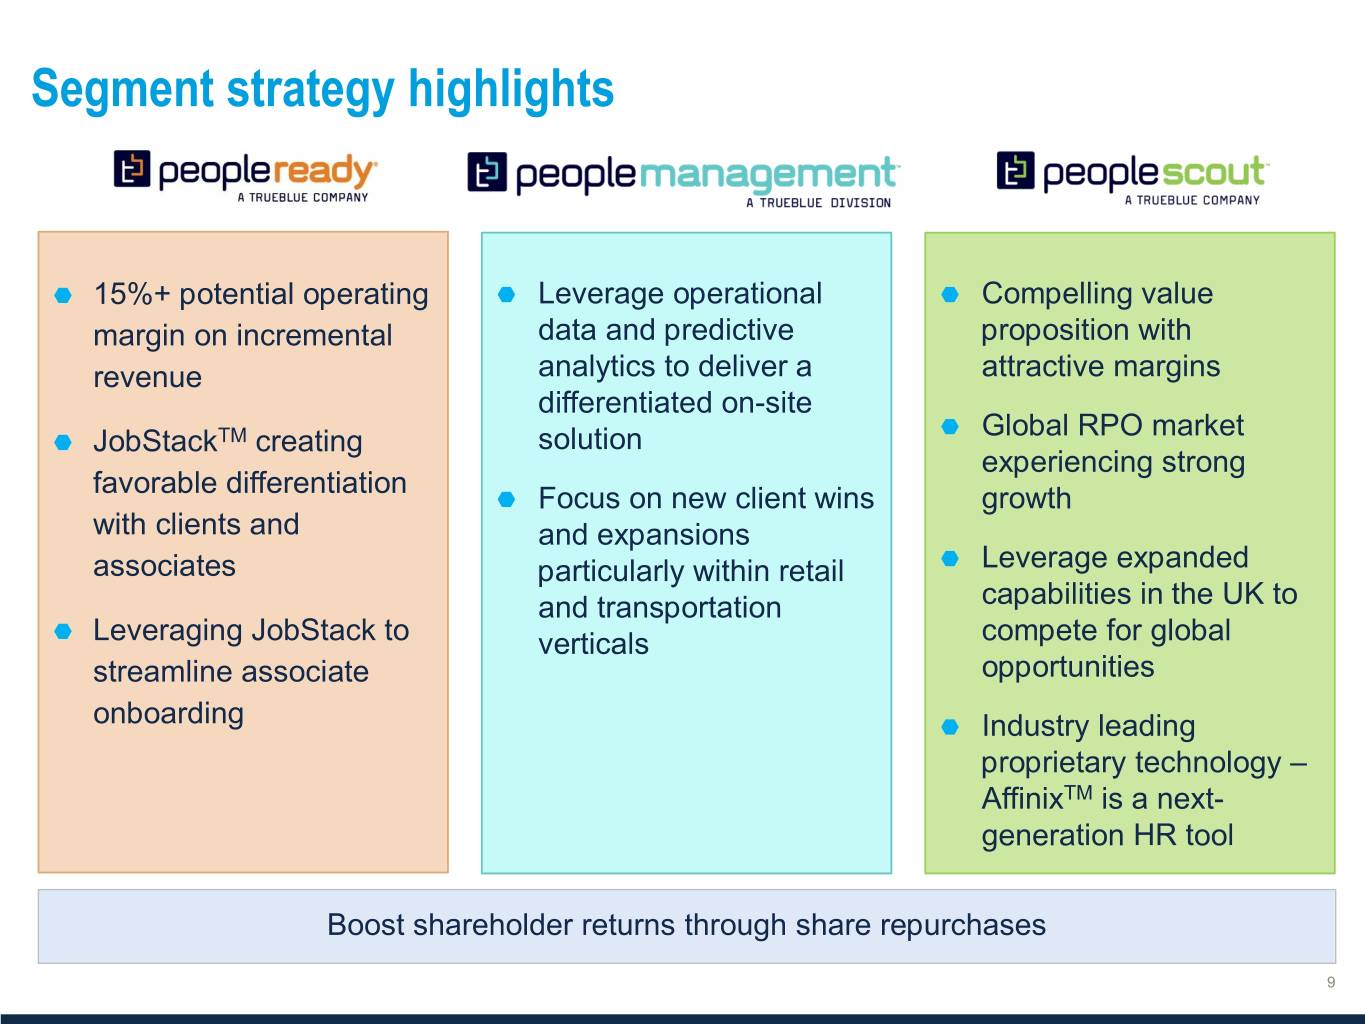

 
Segment strategy highlights  15%+ potential operating  Leverage operational  Compelling value margin on incremental data and predictive proposition with revenue analytics to deliver a attractive margins differentiated on-site  Global RPO market  JobStackTM creating solution experiencing strong favorable differentiation  Focus on new client wins growth with clients and and expansions associates particularly within retail  Leverage expanded and transportation capabilities in the UK to  Leveraging JobStack to verticals compete for global streamline associate opportunities onboarding  Industry leading proprietary technology – AffinixTM is a next- generation HR tool Boost shareholder returns through share repurchases
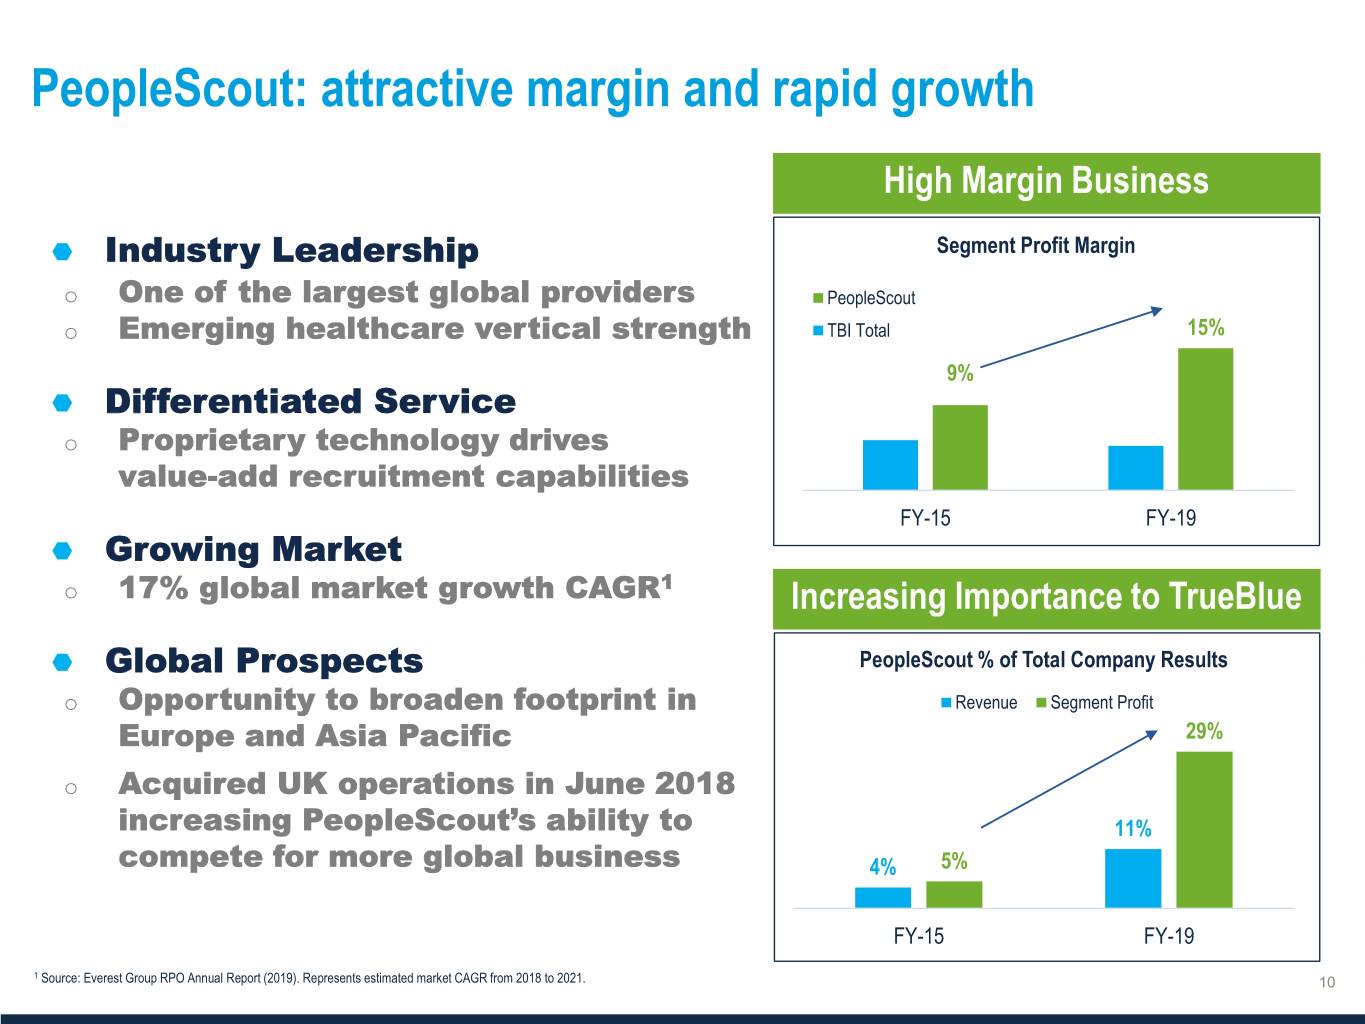

 
PeopleScout: attractive margin and rapid growth  Industry Leadership Segment Profit Margin o One of the largest global providers PeopleScout o Emerging healthcare vertical strength TBI Total 15% 9%  Differentiated Service o Proprietary technology drives value-add recruitment capabilities FY-15 FY-19  Growing Market o 17% global market growth CAGR1  Global Prospects PeopleScout % of Total Company Results o Opportunity to broaden footprint in Revenue Segment Profit Europe and Asia Pacific 29% o Acquired UK operations in June 2018 increasing PeopleScout’s ability to 11% compete for more global business 4% 5% FY-15 FY-19 1 Source: Everest Group RPO Annual Report (2019). Represents estimated market CAGR from 2018 to 2021.
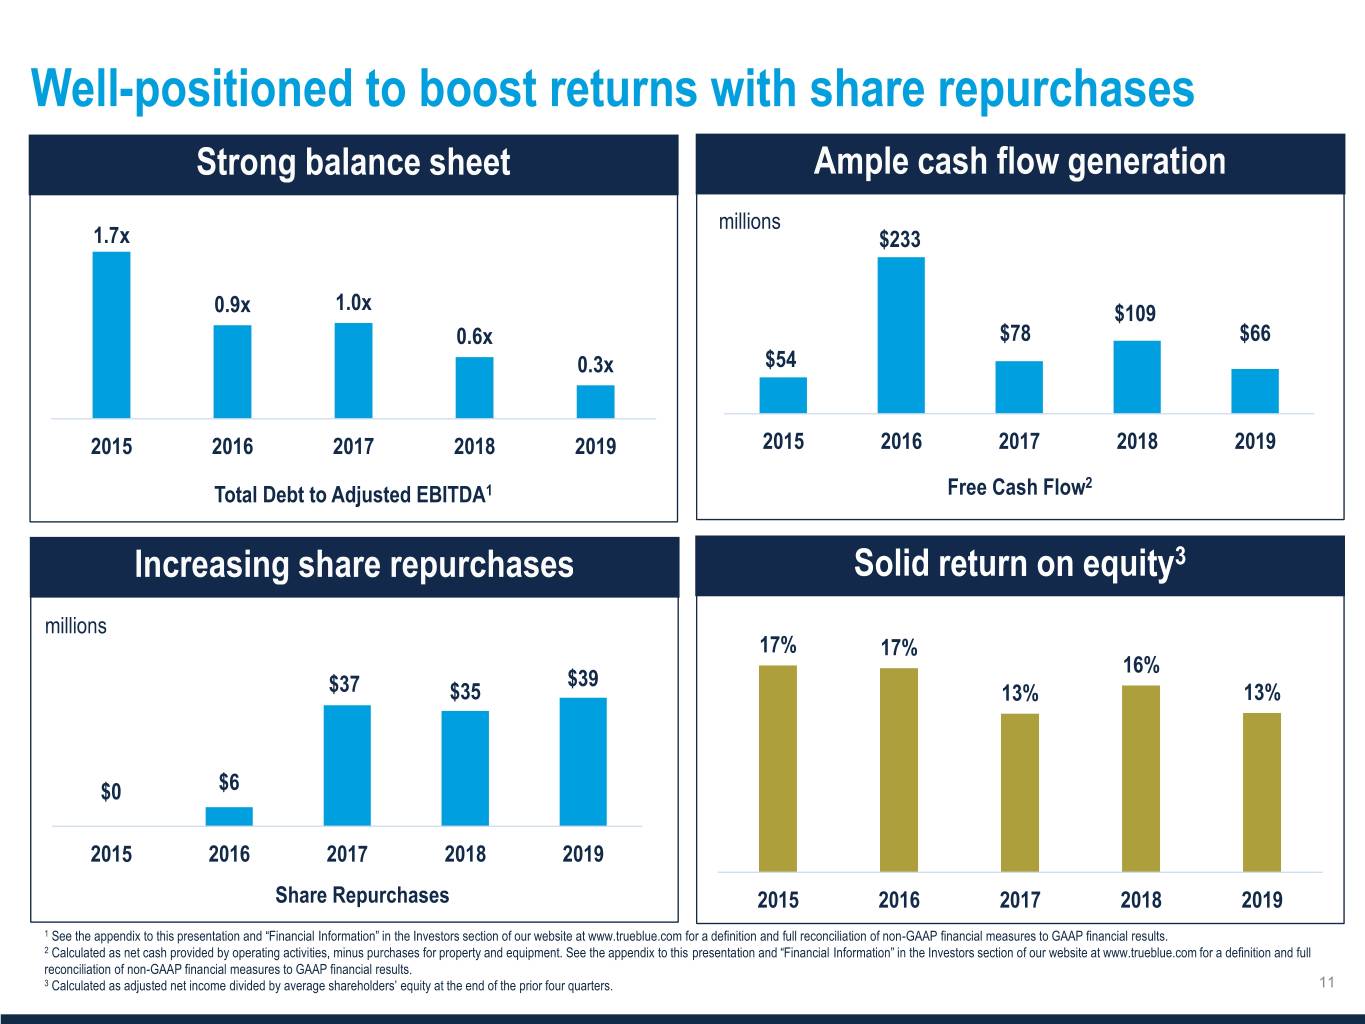

 
Well-positioned to boost returns with share repurchases millions 1.7x $233 0.9x 1.0x $109 0.6x $78 $66 0.3x $54 2015 2016 2017 2018 2019 2015 2016 2017 2018 2019 2 Total Debt to Adjusted EBITDA1 Free Cash Flow Solid return on equity3 millions 17% 17% 16% $39 $37 $35 13% 13% $0 $6 2015 2016 2017 2018 2019 Share Repurchases 2015 2016 2017 2018 2019 1 See the appendix to this presentation and “Financial Information” in the Investors section of our website at www.trueblue.com for a definition and full reconciliation of non-GAAP financial measures to GAAP financial results. 2 Calculated as net cash provided by operating activities, minus purchases for property and equipment. See the appendix to this presentation and “Financial Information” in the Investors section of our website at www.trueblue.com for a definition and full reconciliation of non-GAAP financial measures to GAAP financial results. 3 Calculated as adjusted net income divided by average shareholders’ equity at the end of the prior four quarters.

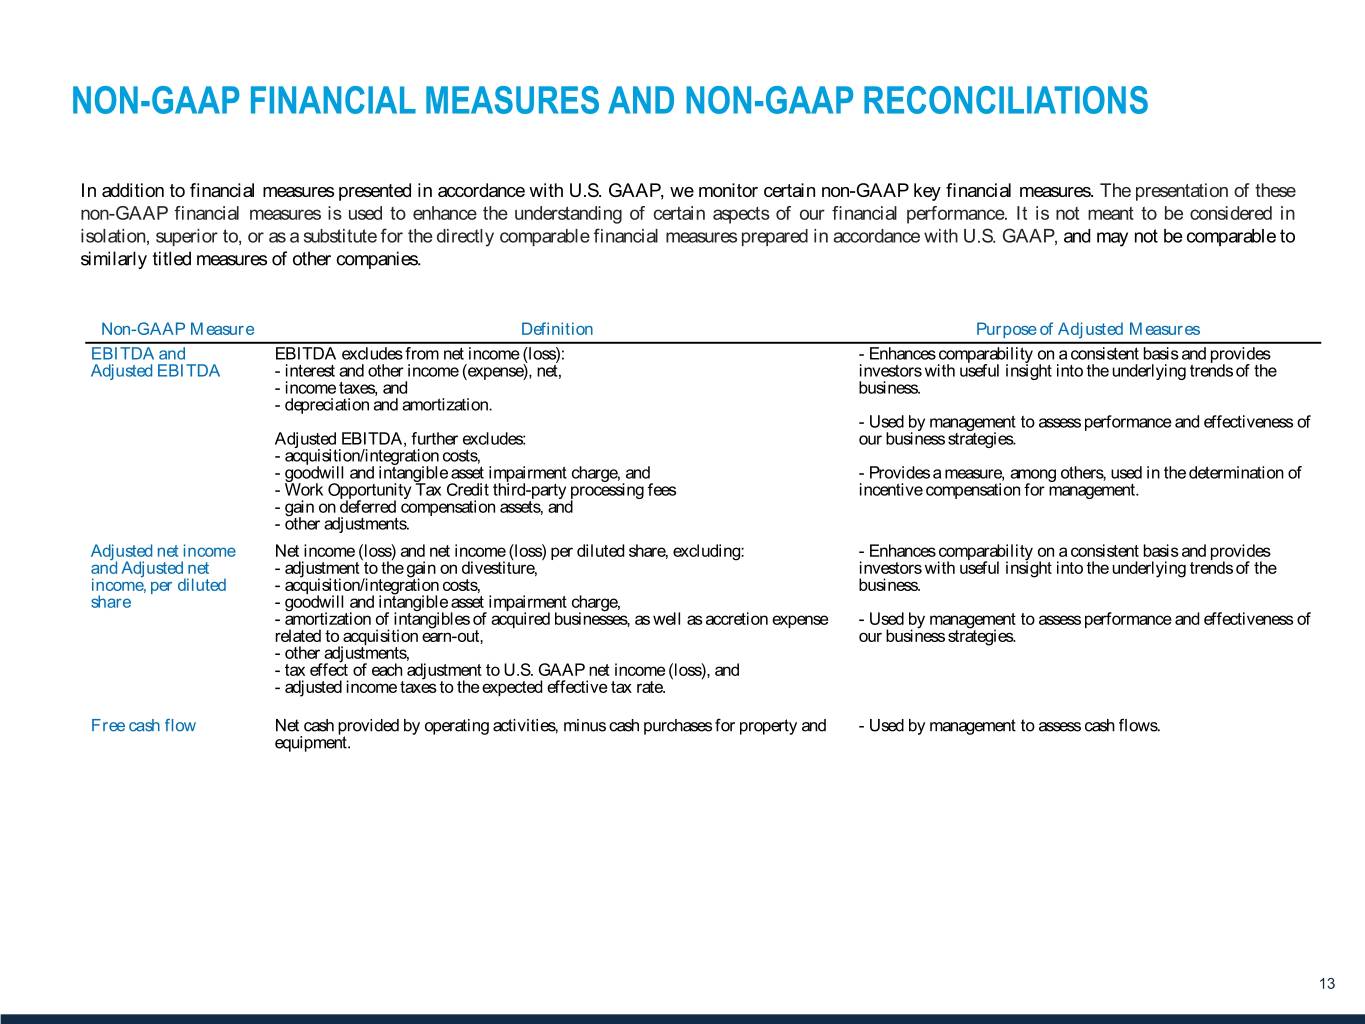


NON-GAAP FINANCIAL MEASURES AND NON-GAAP RECONCILIATIONS In addition to financial measures presented in accordance with U.S. GAAP, we monitor certain non-GAAP key financial measures. The presentation of these non-GAAP financial measures is used to enhance the understanding of certain aspects of our financial performance. It is not meant to be considered in isolation, superior to, or as a substitute for the directly comparable financial measures prepared in accordance with U.S. GAAP, and may not be comparable to similarly titled measures of other companies. Non-GAAP Measure Definition Purpose of Adjusted Measures EBITDA and EBITDA excludes from net income (loss): - Enhances comparability on a consistent basis and provides Adjusted EBITDA - interest and other income (expense), net, investors with useful insight into the underlying trends of the - income taxes, and business. - depreciation and amortization. - Used by management to assess performance and effectiveness of Adjusted EBITDA, further excludes: our business strategies. - acquisition/integration costs, - goodwill and intangible asset impairment charge, and - Provides a measure, among others, used in the determination of - Work Opportunity Tax Credit third-party processing fees incentive compensation for management. - gain on deferred compensation assets, and - other adjustments. Adjusted net income Net income (loss) and net income (loss) per diluted share, excluding: - Enhances comparability on a consistent basis and provides and Adjusted net - adjustment to the gain on divestiture, investors with useful insight into the underlying trends of the income, per diluted - acquisition/integration costs, business. share - goodwill and intangible asset impairment charge, - amortization of intangibles of acquired businesses, as well as accretion expense - Used by management to assess performance and effectiveness of related to acquisition earn-out, our business strategies. - other adjustments, - tax effect of each adjustment to U.S. GAAP net income (loss), and - adjusted income taxes to the expected effective tax rate. Free cash flow Net cash provided by operating activities, minus cash purchases for property and - Used by management to assess cash flows. equipment. 13
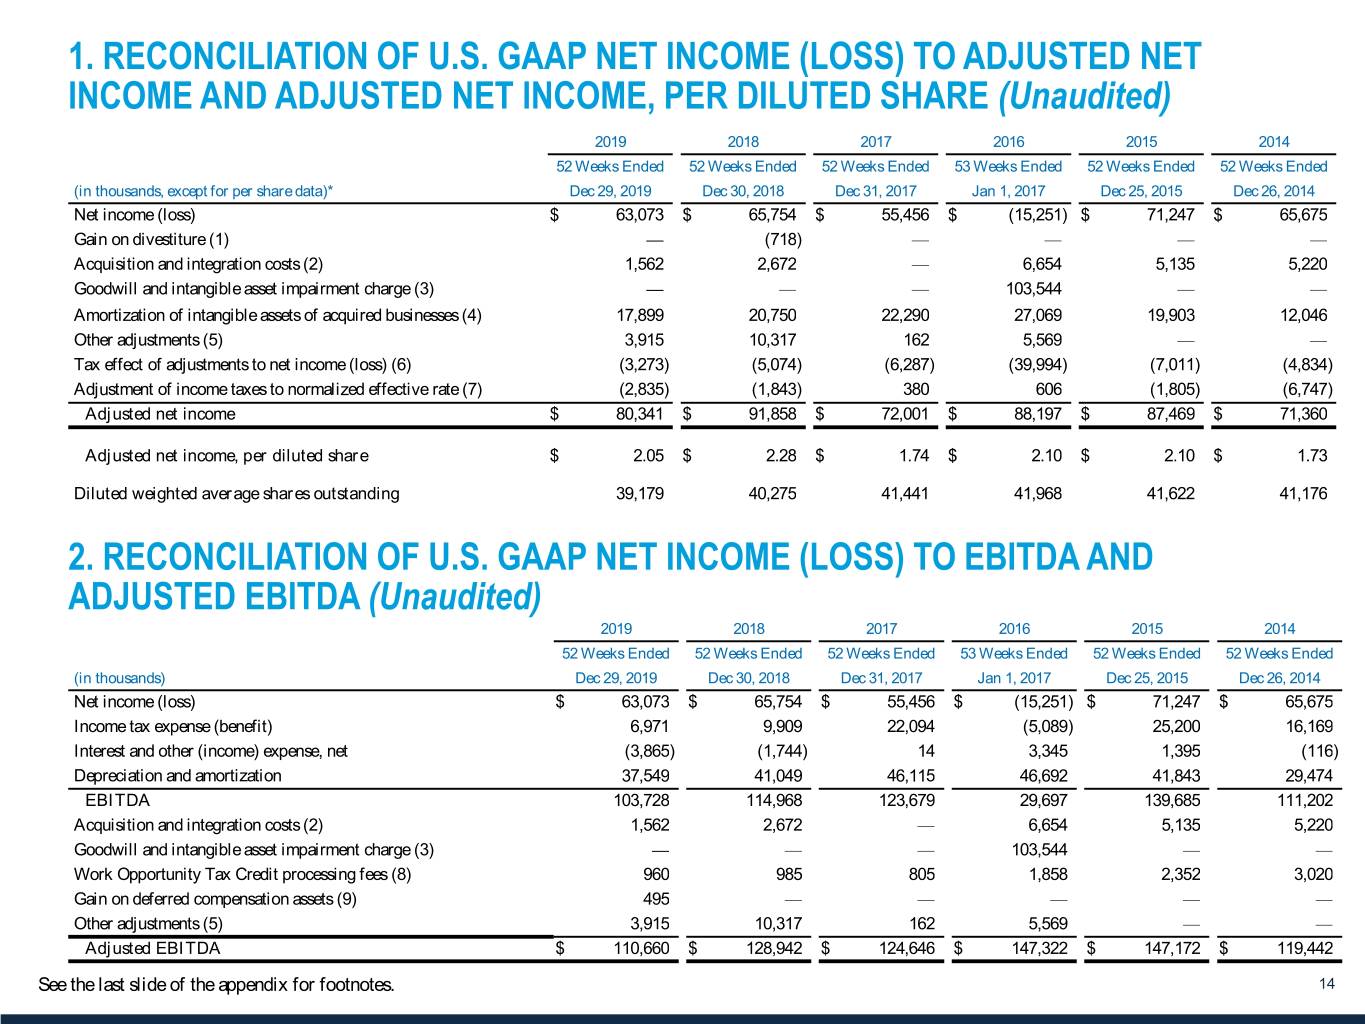

 
1. RECONCILIATION OF U.S. GAAP NET INCOME (LOSS) TO ADJUSTED NET INCOME AND ADJUSTED NET INCOME, PER DILUTED SHARE (Unaudited) 2019 2018 2017 2016 2015 2014 52 Weeks Ended 52 Weeks Ended 52 Weeks Ended 53 Weeks Ended 52 Weeks Ended 52 Weeks Ended (in thousands, except for per share data)* Dec 29, 2019 Dec 30, 2018 Dec 31, 2017 Jan 1, 2017 Dec 25, 2015 Dec 26, 2014 Net income (loss) $ 63,073 $ 65,754 $ 55,456 $ (15,251) $ 71,247 $ 65,675 Gain on divestiture (1) — (718) — — — — Acquisition and integration costs (2) 1,562 2,672 — 6,654 5,135 5,220 Goodwill and intangible asset impairment charge (3) — — — 103,544 — — Amortization of intangible assets of acquired businesses (4) 17,899 20,750 22,290 27,069 19,903 12,046 Other adjustments (5) 3,915 10,317 162 5,569 — — Tax effect of adjustments to net income (loss) (6) (3,273) (5,074) (6,287) (39,994) (7,011) (4,834) Adjustment of income taxes to normalized effective rate (7) (2,835) (1,843) 380 606 (1,805) (6,747) Adjusted net income $ 80,341 $ 91,858 $ 72,001 $ 88,197 $ 87,469 $ 71,360 Adjusted net income, per diluted share $ 2.05 $ 2.28 $ 1.74 $ 2.10 $ 2.10 $ 1.73 Diluted weighted average shares outstanding 39,179 40,275 41,441 41,968 41,622 41,176 2. RECONCILIATION OF U.S. GAAP NET INCOME (LOSS) TO EBITDA AND ADJUSTED EBITDA (Unaudited) 2019 2018 2017 2016 2015 2014 52 Weeks Ended 52 Weeks Ended 52 Weeks Ended 53 Weeks Ended 52 Weeks Ended 52 Weeks Ended (in thousands) Dec 29, 2019 Dec 30, 2018 Dec 31, 2017 Jan 1, 2017 Dec 25, 2015 Dec 26, 2014 Net income (loss) $ 63,073 $ 65,754 $ 55,456 $ (15,251) $ 71,247 $ 65,675 Income tax expense (benefit) 6,971 9,909 22,094 (5,089) 25,200 16,169 Interest and other (income) expense, net (3,865) (1,744) 14 3,345 1,395 (116) Depreciation and amortization 37,549 41,049 46,115 46,692 41,843 29,474 EBITDA 103,728 114,968 123,679 29,697 139,685 111,202 Acquisition and integration costs (2) 1,562 2,672 — 6,654 5,135 5,220 Goodwill and intangible asset impairment charge (3) — — — 103,544 — — Work Opportunity Tax Credit processing fees (8) 960 985 805 1,858 2,352 3,020 Gain on deferred compensation assets (9) 495 — — — — — Other adjustments (5) 3,915 10,317 162 5,569 — — Adjusted EBITDA $ 110,660 $ 128,942 $ 124,646 $ 147,322 $ 147,172 $ 119,442 See the last slide of the appendix for footnotes. 14
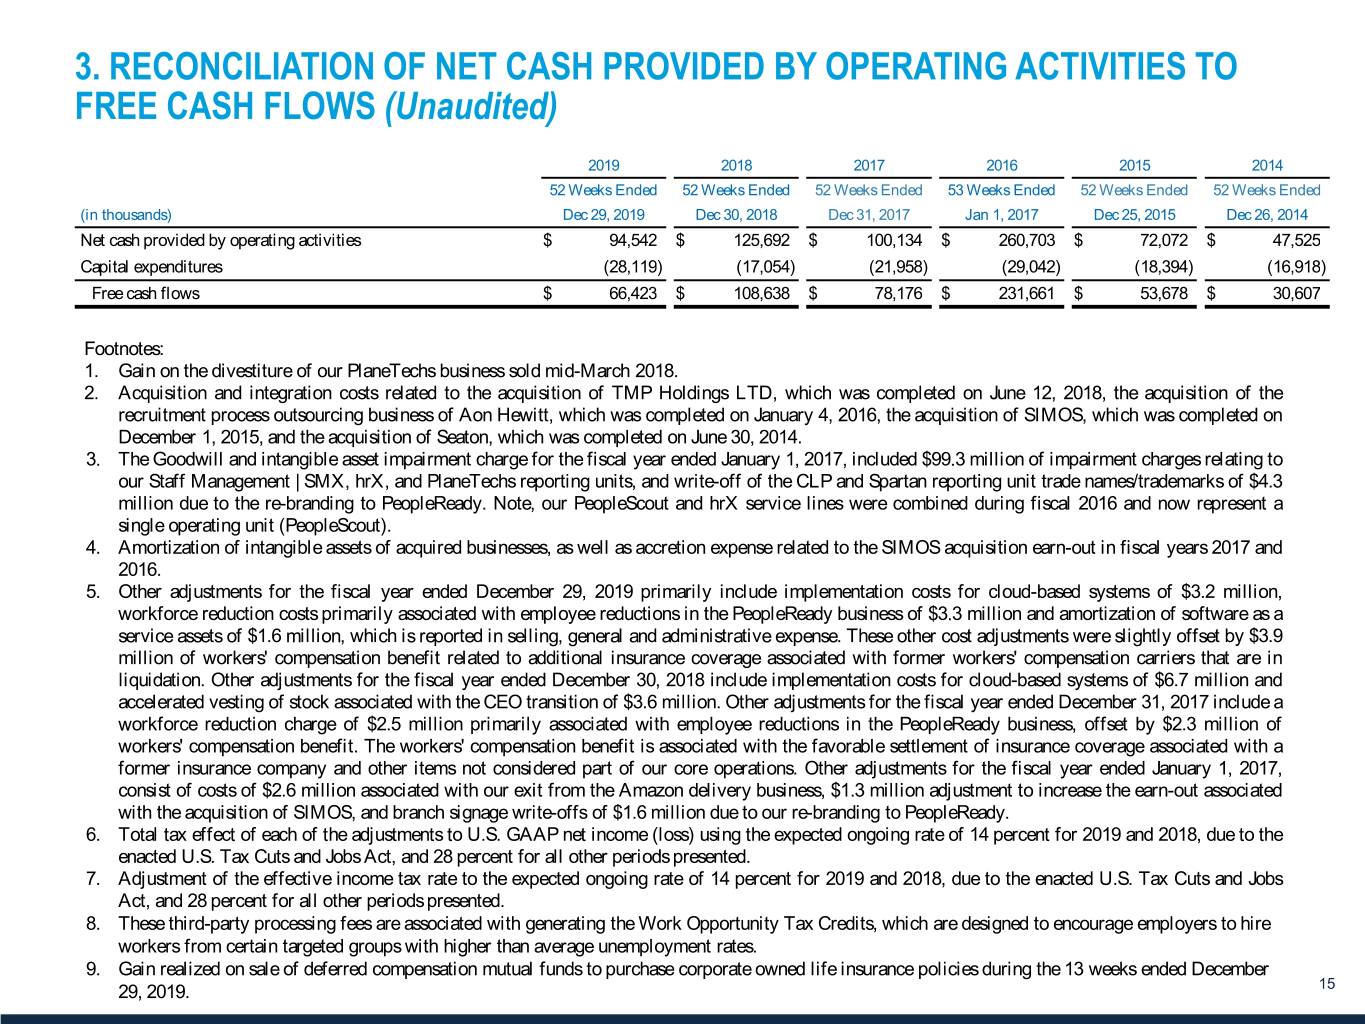

 
3. RECONCILIATION OF NET CASH PROVIDED BY OPERATING ACTIVITIES TO FREE CASH FLOWS (Unaudited) 2019 2018 2017 2016 2015 2014 52 Weeks Ended 52 Weeks Ended 52 Weeks Ended 53 Weeks Ended 52 Weeks Ended 52 Weeks Ended (in thousands) Dec 29, 2019 Dec 30, 2018 Dec 31, 2017 Jan 1, 2017 Dec 25, 2015 Dec 26, 2014 Net cash provided by operating activities $ 94,542 $ 125,692 $ 100,134 $ 260,703 $ 72,072 $ 47,525 Capital expenditures (28,119) (17,054) (21,958) (29,042) (18,394) (16,918) Free cash flows $ 66,423 $ 108,638 $ 78,176 $ 231,661 $ 53,678 $ 30,607 Footnotes: 1. Gain on the divestiture of our PlaneTechs business sold mid-March 2018. 2. Acquisition and integration costs related to the acquisition of TMP Holdings LTD, which was completed on June 12, 2018, the acquisition of the recruitment process outsourcing business of Aon Hewitt, which was completed on January 4, 2016, the acquisition of SIMOS, which was completed on December 1, 2015, and the acquisition of Seaton, which was completed on June 30, 2014. 3. The Goodwill and intangible asset impairment charge for the fiscal year ended January 1, 2017, included $99.3 million of impairment charges relating to our Staff Management | SMX, hrX, and PlaneTechs reporting units, and write-off of the CLP and Spartan reporting unit trade names/trademarks of $4.3 million due to the re-branding to PeopleReady. Note, our PeopleScout and hrX service lines were combined during fiscal 2016 and now represent a single operating unit (PeopleScout). 4. Amortization of intangible assets of acquired businesses, as well as accretion expense related to the SIMOS acquisition earn-out in fiscal years 2017 and 2016. 5. Other adjustments for the fiscal year ended December 29, 2019 primarily include implementation costs for cloud-based systems of $3.2 million, workforce reduction costs primarily associated with employee reductions in the PeopleReady business of $3.3 million and amortization of software as a service assets of $1.6 million, which is reported in selling, general and administrative expense. These other cost adjustments were slightly offset by $3.9 million of workers' compensation benefit related to additional insurance coverage associated with former workers' compensation carriers that are in liquidation. Other adjustments for the fiscal year ended December 30, 2018 include implementation costs for cloud-based systems of $6.7 million and accelerated vesting of stock associated with the CEO transition of $3.6 million. Other adjustments for the fiscal year ended December 31, 2017 include a workforce reduction charge of $2.5 million primarily associated with employee reductions in the PeopleReady business, offset by $2.3 million of workers' compensation benefit. The workers' compensation benefit is associated with the favorable settlement of insurance coverage associated with a former insurance company and other items not considered part of our core operations. Other adjustments for the fiscal year ended January 1, 2017, consist of costs of $2.6 million associated with our exit from the Amazon delivery business, $1.3 million adjustment to increase the earn-out associated with the acquisition of SIMOS, and branch signage write-offs of $1.6 million due to our re-branding to PeopleReady. 6. Total tax effect of each of the adjustments to U.S. GAAP net income (loss) using the expected ongoing rate of 14 percent for 2019 and 2018, due to the enacted U.S. Tax Cuts and Jobs Act, and 28 percent for all other periods presented. 7. Adjustment of the effective income tax rate to the expected ongoing rate of 14 percent for 2019 and 2018, due to the enacted U.S. Tax Cuts and Jobs Act, and 28 percent for all other periods presented. 8. These third-party processing fees are associated with generating the Work Opportunity Tax Credits, which are designed to encourage employers to hire workers from certain targeted groups with higher than average unemployment rates. 9. Gain realized on sale of deferred compensation mutual funds to purchase corporate owned life insurance policies during the 13 weeks ended December 29, 2019. 15