Document
false0000768899 0000768899 2020-07-27 2020-07-27


UNITED STATES
SECURITIES AND EXCHANGE COMMISSION
WASHINGTON, DC 20549
 
FORM 8-K
 
CURRENT REPORT
PURSUANT TO SECTION 13 OR 15(D) OF THE
SECURITIES EXCHANGE ACT OF 1934
Date of report (Date of earliest event reported): July 27, 2020
 
image34.jpg
TrueBlue, Inc.
(Exact Name of Registrant as Specified in Its Charter)
 
Washington
(State or Other Jurisdiction
of Incorporation)
001-14543
 
91-1287341
(Commission
File Number)
 
(IRS Employer
Identification No.)
 
1015 A Street, Tacoma, Washington 98402
(Address of principal executive offices) (Zip Code)
Registrant’s telephone number, including area code:    (253383-9101

Not Applicable
(Former Name or Former Address, if Changed Since Last Report)
 
Check the appropriate box below if the Form 8-K filing is intended to simultaneously satisfy the filing obligation of the registrant under any of the following provisions (see General Instruction A.2. below):
Written communications pursuant to Rule 425 under the Securities Act (17 CFR 230.425)
Soliciting material pursuant to Rule 14a-12 under the Exchange Act (17 CFR 240.14a-12)
Pre-commencement communications pursuant to Rule 14d-2(b) under the Exchange Act (17 CFR 240.14d-2(b))
Pre-commencement communications pursuant to Rule 13e-4(c) under the Exchange Act (17 CFR 240.13e-4(c))
Securities registered pursuant to Section 12(b) of the Act:
Title of each class
Trading Symbol(s)
Name of each exchange on which registered
Common stock, no par value
TBI
New York Stock Exchange


Indicate by check mark whether the registrant is an emerging growth company as defined in as defined in Rule 405 of the Securities Act of 1933 (§230.405 of this chapter) or Rule 12b-2 of the Securities Exchange Act of 1934 (§240.12b-2 of this chapter).

Emerging growth company

If an emerging growth company, indicate by check mark if the registrant has elected not to use the extended transition period for complying with any new or revised financial accounting standards provided pursuant to Section 13(a) of the Exchange Act.


Item 2.02.
Results of Operations and Financial Condition.

On July 27, 2020, TrueBlue, Inc. (the “company”) issued a press release (the “Press Release”) reporting its financial results for the second quarter ended June 28, 2020, a copy of which is attached hereto as Exhibit 99.1 and the contents of which are incorporated herein by this reference. Also attached to this report as Exhibit 99.2 is a slide presentation relating to the financial results for the second quarter ended June 28, 2020 (the “Earnings Results Presentation”), which will be discussed by management of the company on a live conference call at 2:00 p.m. Pacific Time (5:00 p.m. Eastern Time) on Monday, July 27, 2020. The Earnings Results Presentation is also available on the company’s website at www.trueblue.com.

In accordance with General Instruction B.2. of Form 8-K, the information contained above in this report (including the Press Release and the Earnings Results Presentation) shall not be deemed “Filed” for purposes of Section 18 of the Securities Exchange Act of 1934, as amended, or otherwise subject to the liabilities of that section, nor shall the Press Release or the Earnings Results Presentation be deemed incorporated by reference in any filing under the Securities Act of 1933, as amended, except as shall be expressly set forth by specific reference in such a filing. This report will not be deemed a determination or an admission as to the materiality of any information in the report that is required to be disclosed solely by Regulation FD.

Item 9.01.
Financial Statements and Exhibits.
(d)
Exhibits

Exhibit
Number
Exhibit Description
Filed Herewith
99.1
X
99.2
X
104
Cover page interactive data file - The cover page from this Current Report on Form 8-K is formatted as Inline XBRL
X


SIGNATURE
Pursuant to the requirements of the Securities Exchange Act of 1934, the registrant has duly caused this report to be signed on its behalf by the undersigned hereunto duly authorized.


TRUEBLUE, INC.
 
 
(Registrant)


Date:
July 27, 2020
By:
 
/s/ Derrek L. Gafford


Derrek L. Gafford


Chief Financial Officer and Executive Vice President


TRUEBLUE REPORTS SECOND QUARTER 2020 RESULTS

TACOMA, WASH. - Jul. 27, 2020 -- TrueBlue (NYSE:TBI) today announced its second quarter results for 2020.

Second quarter revenue was $359 million, a decrease of 39 percent compared to revenue of $589 million in the second quarter of 2019. Net loss per diluted share was $0.23 compared to net income per diluted share of $0.49 in the second quarter of 2019. Adjusted net loss1 per diluted share was $0.12 compared to adjusted net income per diluted share of $0.64 in the second quarter of 2019.

“I want to thank our employees, associates, and clients for their outstanding efforts to safely serve the needs of our communities and essential businesses over the past several months,” said Patrick Beharelle, CEO of TrueBlue. “We will continue to face revenue challenges until the economic recovery from COVID-19 gains greater momentum and clients are back on their feet.”

“We experienced a significant decline in the demand for our services during the quarter,” Mr. Beharelle continued. “We saw moderate demand improvement toward the end of the quarter which continued into July. Our actions to reduce expenses while maintaining our operational strengths are paying off. These actions not only help preserve profitability, but also help maintain our balance sheet strength and allow us to continue to invest in our digital strategies.”

2020 Outlook

Due to the uncertainty surrounding COVID-19 and its impact on the business environment, TrueBlue is not providing customary quarterly guidance. However, the company is providing certain forward-looking information to help investors form their own estimates, which can be found in the quarterly earnings presentation filed today.

Management will discuss second quarter 2020 results on a webcast at 2 p.m. PDT (5 p.m. EDT), today, Monday, Jul. 27, 2020. The webcast can be accessed on TrueBlue’s website: www.trueblue.com.

About TrueBlue

TrueBlue (NYSE: TBI) is a leading provider of specialized workforce solutions that help clients achieve business growth and improve productivity. In 2019, TrueBlue connected approximately 724,000 people with work. Its PeopleReady segment offers on-demand, industrial staffing, PeopleManagement offers contingent, on-site industrial staffing and commercial driver services, and PeopleScout offers recruitment process outsourcing (RPO) and managed service provider (MSP) solutions to a wide variety of industries. Learn more at www.trueblue.com.

1 See the financial statements accompanying the release and the company’s website for more information on non-GAAP terms.

Forward-looking statements

This document contains forward-looking statements relating to our plans and expectations, all of which are subject to risks and uncertainties. Such statements are based on management’s expectations and assumptions as of the date of this release and involve many risks and uncertainties that could cause actual results to differ materially from those expressed or implied in our forward-looking statements including: (1) national and global economic conditions, (2) the continued impact of COVID-19 and related economic impact and governmental response, (3) our ability to successfully reduce operating expenses and otherwise adapt to the changing economic environment caused by COVID–19, (4) our ability to access sufficient capital to finance our operations, including our ability to comply with or obtain waivers for covenants contained in our revolving credit facility, (5) our ability to attract and retain clients, (6) our ability to attract sufficient qualified candidates and employees to meet the needs of our clients, (7) our ability to maintain profit margins, (8) new laws and regulations that could affect our operations or financial results, (9) our


ability to successfully execute on business strategies to further digitize our business model, and (10) any reduction or change in tax credits we utilize, including the Work Opportunity Tax Credit. Other information regarding factors that could affect our results is included in our Securities Exchange Commission (SEC) filings, including the company’s most recent reports on Forms 10-K and 10-Q, copies of which may be obtained by visiting our website at www.trueblue.com under the Investor Relations section or the SEC’s website at www.sec.gov. We assume no obligation to update or revise any forward-looking statement, whether as a result of new information, future events, or otherwise, except as required by law. Any other references to future financial estimates are included for informational purposes only and subject to risk factors discussed in our most recent filings with the SEC.
In addition, we use several non-GAAP financial measures when presenting our financial results in this document. Please refer to the reconciliations between our GAAP and non-GAAP financial measures in the appendix to this document and on our website at www.trueblue.com under the Investor Relations section for additional information on both current and historical periods. The presentation of these non-GAAP financial measures is used to enhance the understanding of certain aspects of our financial performance. It is not meant to be considered in isolation, superior to, or as a substitute for the directly comparable financial measures prepared in accordance with U.S. GAAP, and may not be comparable to similarly titled measures of other companies.

Contact:
Derrek Gafford, Executive Vice President and CFO
253-680-8214


TRUEBLUE, INC.
SUMMARY CONSOLIDATED STATEMENTS OF OPERATIONS
(Unaudited)

 
13 Weeks Ended
 
26 Weeks Ended
(in thousands, except per share data)
Jun 28, 2020
 
Jun 30, 2019
 
Jun 28, 2020
Jun 30, 2019
Revenue from services
$
358,944

 
$
588,594

 
$
853,196

$
1,140,946

Cost of services
275,719

 
431,911

 
643,812

837,568

Gross profit
83,225

 
156,683

 
209,384

303,378

Selling, general and administrative expense
97,200

 
125,965

 
214,581

253,945

Depreciation and amortization
7,256

 
9,827

 
16,350

19,779

Goodwill and intangible asset impairment charge


175,189


Income (loss) from operations
(21,231
)
 
20,891

 
(196,736
)
29,654

Interest and other income (expense), net
(412
)
 
827

 
(149
)
1,380

Income (loss) before tax expense (benefit)
(21,643
)
 
21,718

 
(196,885
)
31,034

Income tax expense (benefit)
(13,475
)
 
2,312

 
(38,223
)
3,352

Net income (loss)
$
(8,168
)
 
$
19,406

 
$
(158,662
)
$
27,682


Net income (loss) per common share:


Basic
$
(0.23
)
 
$
0.50

 
$
(4.39
)
$
0.71

Diluted
$
(0.23
)
 
$
0.49

 
$
(4.39
)
$
0.70


Weighted average shares outstanding:


Basic
35,077

 
39,163

 
36,166

39,264

Diluted
35,077

 
39,554

 
36,166

39,619


TRUEBLUE, INC.
SUMMARY CONSOLIDATED BALANCE SHEETS
(Unaudited)

(in thousands)
Jun 28, 2020
 
Dec 29, 2019
ASSETS


Cash and cash equivalents
$
92,051

 
$
37,608

Accounts receivable, net
224,078

 
342,303

Other current assets
43,772

 
41,822

Total current assets
359,901

 
421,733

Property and equipment, net
67,447

 
66,150

Restricted cash and investments
217,844

 
230,932

Goodwill and intangible assets, net
126,617

 
311,171

Other assets, net
131,192

 
106,169

Total assets
$
903,001

 
$
1,136,155


LIABILITIES AND SHAREHOLDERS’ EQUITY


Current liabilities
$
220,025

 
$
230,806

Long-term debt, less current portion
17,949

 
37,100

Other long-term liabilities
252,266

 
242,276

Total liabilities
490,240

 
510,182

Shareholders’ equity
412,761

 
625,973

Total liabilities and shareholders’ equity
$
903,001

 
$
1,136,155


TRUEBLUE, INC.
CONSOLIDATED STATEMENTS OF CASH FLOWS
(Unaudited)
 
26 Weeks Ended
(in thousands)
Jun 28, 2020
 
Jun 30, 2019
Cash flows from operating activities:


Net income (loss)
$
(158,662
)
 
$
27,682

Adjustments to reconcile net income (loss) to net cash provided by operating activities:


Depreciation and amortization
16,350

 
19,779

Goodwill and intangible asset impairment charge
175,189


Provision for doubtful accounts
5,923

 
3,761

Stock-based compensation
4,345

 
5,260

Deferred income taxes
(27,049
)
 
2,393

Non-cash lease expense
7,454

 
6,934

Other operating activities
2,669

 
(2,072
)
Changes in operating assets and liabilities:


Accounts receivable
111,803

 
16,162

Income tax receivable
(7,291
)
 
(6,347
)
Other assets
4,682

 
(4,472
)
Accounts payable and other accrued expenses
(22,197
)
 
(16,542
)
Accrued wages and benefits
4,921

 
(4,667
)
Workers’ compensation claims reserve
(5,668
)
 
(7,109
)
Operating lease liabilities
(7,643
)
 
(6,957
)
Other liabilities
(1,344
)
 
3,174

Net cash provided by operating activities
103,482

 
36,979

Cash flows from investing activities:


Capital expenditures
(11,641
)
 
(11,064
)
Purchases of restricted available-for-sale investments
(1,739
)
 
(4,295
)
Sales of restricted available-for-sale investments
2,581

 
2,435

Purchases of restricted held-to-maturity investments
(11,458
)
 
(7,020
)
Maturities of restricted held-to-maturity investments
16,190

 
17,250

Net cash used in investing activities
(6,067
)
 
(2,694
)
Cash flows from financing activities:


Purchases and retirement of common stock
(52,346
)
 
(9,077
)
Net proceeds from employee stock purchase plans
536

 
700

Common stock repurchases for taxes upon vesting of restricted stock
(1,956
)
 
(1,631
)
Net change in Revolving Credit Facility
7,900

 
(55,300
)
Other
(1,344
)
 
(119
)
Net cash used in financing activities
(47,210
)
 
(65,427
)
Effect of exchange rate changes on cash, cash equivalents and restricted cash
(736
)
 
560

Net change in cash, cash equivalents, and restricted cash
49,469

 
(30,582
)
Cash, cash equivalents and restricted cash, beginning of period
92,371

 
102,450

Cash, cash equivalents and restricted cash, end of period
$
141,840

 
$
71,868


TRUEBLUE, INC.
SEGMENT DATA
(Unaudited)


13 Weeks Ended
(in thousands)
Jun 28, 2020
 
Jun 30, 2019
Revenue from services:


PeopleReady
$
209,151

 
$
369,261

PeopleManagement
118,661

 
153,530

PeopleScout
31,132

 
65,803

Total company
$
358,944

 
$
588,594


Segment profit (loss) (1):


PeopleReady
$
633

 
$
21,795

PeopleManagement
1,803

 
4,128

PeopleScout
(2,782
)
 
11,223

Total segment profit (loss)
(346
)
 
37,146

Corporate unallocated expense
(4,929
)
 
(3,634
)
Total company Adjusted EBITDA (2)
(5,275
)
 
33,512

Work Opportunity Tax Credit processing fees (3)

 
(240
)
Acquisition/integration costs (4)

 
(673
)
Other adjustments (5)
(8,700
)
 
(1,881
)
EBITDA (2)
(13,975
)
 
30,718

Depreciation and amortization
(7,256
)
 
(9,827
)
Interest and other income (expense), net
(412
)
 
827

Income (loss) before tax expense (benefit)
(21,643
)
 
21,718

Income tax benefit (expense)
13,475

 
(2,312
)
Net income (loss)
$
(8,168
)
 
$
19,406

(1)
We evaluate performance based on segment revenue and segment profit. Segment profit (loss) includes revenue, related cost of services, and ongoing operating expenses directly attributable to the reportable segment. Segment profit (loss) excludes depreciation and amortization expense, unallocated corporate general and administrative expense, interest, other income and expense, income taxes, and other adjustments not considered to be ongoing.
(2)
See the Non-GAAP Financial Measures table on the next page for definitions of EBITDA and Adjusted EBITDA.

(3)
These third-party processing fees are associated with generating the Work Opportunity Tax Credits, which are designed to encourage employers to hire workers from certain targeted groups with higher than average unemployment rates.

(4)
Acquisition/integration costs relate to the acquisition of TMP Holdings LTD completed on June 12, 2018.

(5)
Other adjustments for the 13 weeks ended June 28, 2020 and June 30, 2019 primarily include workforce reduction costs of $11.0 million ($3.0 million in cost of services and $8.0 million in selling, general and administrative expense) and $0.5 million (in selling, general and administrative expense), respectively, implementation costs for cloud-based systems of $0.1 million and $1.1 million, respectively and amortization of software as a service assets of $0.6 million and $0.5 million, respectively, which is reported in selling, general and administrative expense. For the 13 weeks ended June 28, 2020, these costs were slightly offset by $3.1 million in COVID-19 government subsidies.


TRUEBLUE, INC.
NON-GAAP FINANCIAL MEASURES AND NON-GAAP RECONCILIATIONS

In addition to financial measures presented in accordance with U.S. GAAP, we monitor certain non-GAAP key financial measures. The presentation of these non-GAAP financial measures is used to enhance the understanding of certain aspects of our financial performance. It is not meant to be considered in isolation, superior to, or as a substitute for the directly comparable financial measures prepared in accordance with U.S. GAAP, and may not be comparable to similarly titled measures of other companies.
Non-GAAP Measure
Definition
 
Purpose of Adjusted Measures
EBITDA and
Adjusted EBITDA
EBITDA excludes from net income (loss):
- interest and other income (expense), net,
- income taxes, and
- depreciation and amortization.

Adjusted EBITDA, further excludes:
- Work Opportunity Tax Credit third-party processing fees,
- acquisition/integration costs,
- other adjustments.
 
- Enhances comparability on a consistent basis and provides investors with useful insight into the underlying trends of the business.

- Used by management to assess performance and effectiveness of our business strategies.

- Provides a measure, among others, used in the determination of incentive compensation for management.
Adjusted net income (loss) and Adjusted net income (loss) per diluted share
Net income (loss) and net income (loss) per diluted share, excluding:
- amortization of intangibles of acquired businesses,
- acquisition/integration costs,
- other adjustments,
- tax effect of each adjustment to U.S. GAAP net income (loss), and
- adjustment of income taxes to our normalized long-term expected tax rate for periods prior to Q2 2020.
 
- Enhances comparability on a consistent basis and provides investors with useful insight into the underlying trends of the business.

- Used by management to assess performance and effectiveness of our business strategies.
1.
RECONCILIATION OF U.S. GAAP NET INCOME (LOSS) TO ADJUSTED NET INCOME (LOSS) AND ADJUSTED NET INCOME (LOSS) PER DILUTED SHARE
(Unaudited)
 
13 Weeks Ended
(in thousands, except for per share data)
Jun 28, 2020
 
Jun 30, 2019
Net income (loss)
$
(8,168
)
 
$
19,406

Amortization of intangible assets of acquired businesses (1)
2,071

 
4,957

Acquisition/integration costs (2)

 
673

Other adjustments (3)
8,700

 
1,881

Tax effect of adjustments to net income (loss) (4)
(6,706
)
 
(1,052
)
Adjustment of income taxes to normalized effective rate (5)

 
(729
)
Adjusted net income (loss)
$
(4,103
)
 
$
25,136


Adjusted net income (loss) per diluted share
$
(0.12
)
 
$
0.64


Diluted weighted average shares outstanding
35,077

 
39,554


2.
RECONCILIATION OF U.S. GAAP NET INCOME (LOSS) TO EBITDA AND ADJUSTED EBITDA
(Unaudited)
 
13 Weeks Ended
(in thousands)
Jun 28, 2020
 
Jun 30, 2019
Net income (loss)
$
(8,168
)
 
$
19,406

Income tax expense (benefit)
(13,475
)
 
2,312

Interest and other (income) expense, net
412

 
(827
)
Depreciation and amortization
7,256

 
9,827

EBITDA
(13,975
)
 
30,718

Work Opportunity Tax Credit processing fees (6)

 
240

Acquisition/integration costs (2)

 
673

Other adjustments (3)
8,700

 
1,881

Adjusted EBITDA
$
(5,275
)
 
$
33,512


(1)
Amortization of intangible assets of acquired businesses.

(2)
Acquisition/integration costs for the acquisition of TMP Holding LTD completed on June 12, 2018.

(3)
Other adjustments for the 13 weeks ended June 28, 2020 and June 30, 2019 primarily include workforce reduction costs of $11.0 million ($3.0 million in cost of services and $8.0 million in selling, general and administrative expense) and $0.5 million (in selling, general and administrative expense), respectively, implementation costs for cloud-based systems of $0.1 million and $1.1 million, respectively and amortization of software as a service assets of $0.6 million and $0.5 million, respectively, which is reported in selling, general and administrative expense. For the 13 weeks ended June 28, 2020, these costs were slightly offset by $3.1 million in COVID-19 government subsidies.

(4)
Total tax effect of each of the adjustments to U.S. GAAP net income (loss) using the effective rate of 62 percent for Q2 2020 relative to the expected long-term ongoing rate of 14 percent for Q2 2019.

(5)
Adjustment of the effective income tax rate to the expected long-term ongoing rate of 14 percent for Q2 2019. Beginning in Q2 2020, we will not be adjusting our GAAP tax rate in our adjusted net income calculation until our profitability rises to a more substantial level.

(6)
These third-party processing fees are associated with generating the Work Opportunity Tax Credits, which are designed to encourage employers to hire workers from certain targeted groups with higher than average unemployment rates.


Q2 2020 Earnings July 2020


Forward-looking statements This document contains forward-looking statements relating to our plans and expectations, all of which are subject to risks and uncertainties. Such statements are based on management’s expectations and assumptions as of the date of this release and involve many risks and uncertainties that could cause actual results to differ materially from those expressed or implied in our forward-looking statements including: (1) national and global economic conditions, (2) the continued impact of COVID-19 and related economic impact and governmental response, (3) our ability to successfully reduce operating expenses and otherwise adapt to the changing economic environment caused by COVID-19, (4) our ability to access sufficient capital to finance our operations, including our ability to comply with or obtain waivers for covenants contained in our revolving credit facility, (5) our ability to attract and retain clients, (6) our ability to attract sufficient qualified candidates and employees to meet the needs of our clients, (7) our ability to maintain profit margins, (8) new laws and regulations that could affect our operations or financial results, (9) our ability to successfully execute on business strategies to further digitize our business model, and (10) any reduction or change in tax credits we utilize, including the Work Opportunity Tax Credit. Other information regarding factors that could affect our results is included in our Securities Exchange Commission (SEC) filings, including the company’s most recent reports on Forms 10-K and 10-Q, copies of which may be obtained by visiting our website at www.trueblue.com under the Investor Relations section or the SEC’s website at www.sec.gov. We assume no obligation to update or revise any forward-looking statement, whether as a result of new information, future events, or otherwise, except as required by law. Any other references to future financial estimates are included for informational purposes only and subject to risk factors discussed in our most recent filings with the SEC. In addition, we use several non-GAAP financial measures when presenting our financial results in this document. Please refer to the reconciliations between our GAAP and non-GAAP financial measures in the appendix to this presentation and on our website at www.trueblue.com under the Investor Relations section for additional information on both current and historical periods. The presentation of these non-GAAP financial measures is used to enhance the understanding of certain aspects of our financial performance. It is not meant to be considered in isolation, superior to, or as a substitute for the directly comparable financial measures prepared in accordance with U.S. GAAP, and may not be comparable to similarly titled measures of other companies. Any comparisons made herein to other periods are based on a comparison to the same period in the prior year unless otherwise stated. www.TrueBlue.com 2


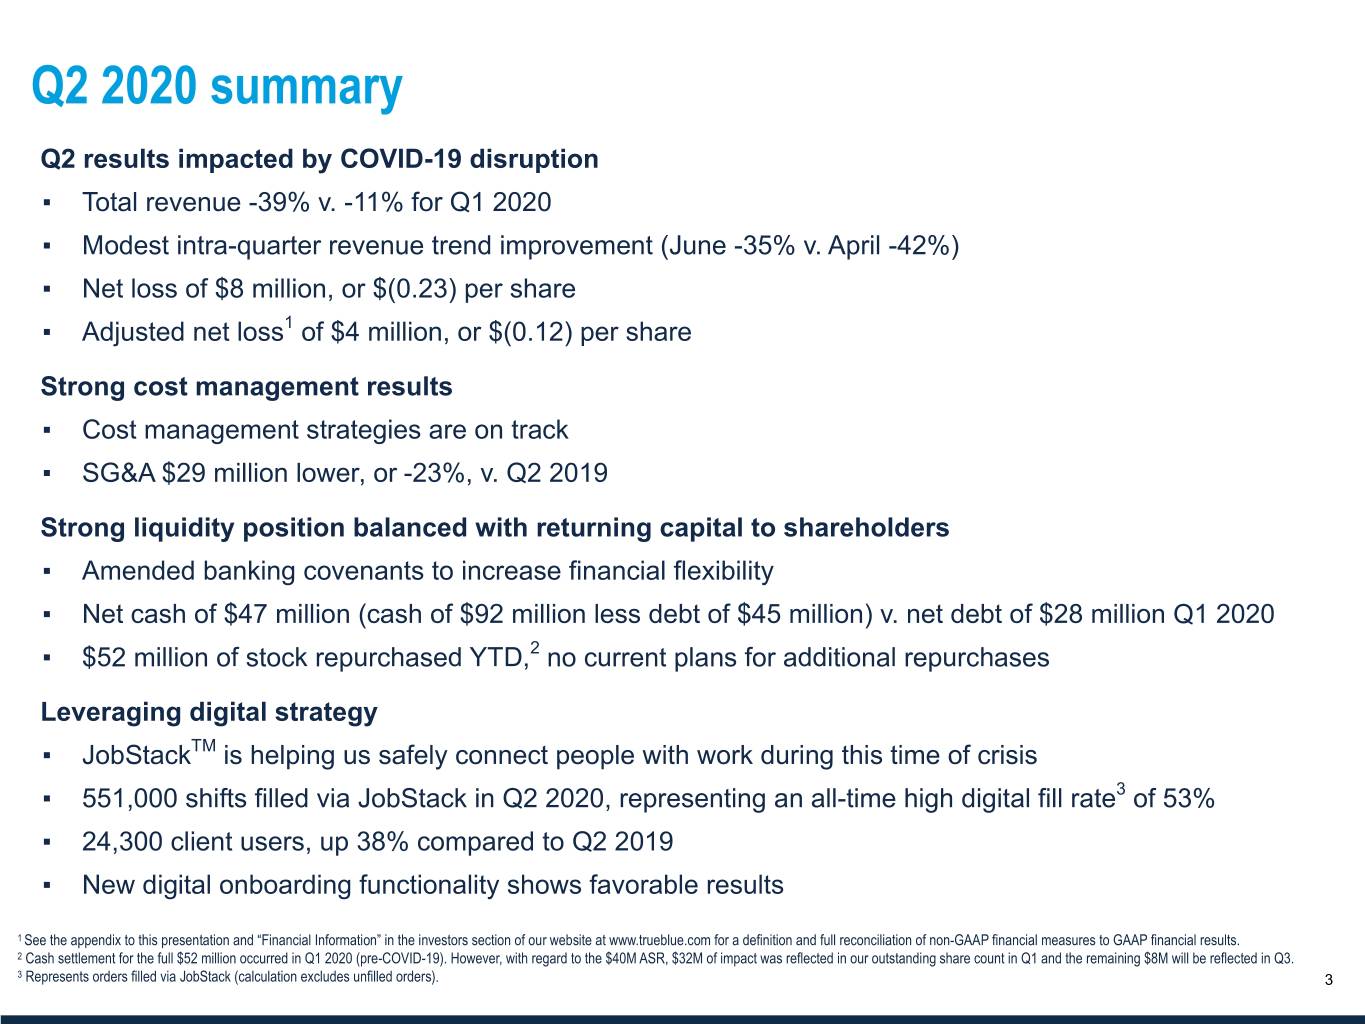
Q2 2020 summary Q2 results impacted by COVID-19 disruption ▪ Total revenue -39% v. -11% for Q1 2020 ▪ Modest intra-quarter revenue trend improvement (June -35% v. April -42%) ▪ Net loss of $8 million, or $(0.23) per share ▪ Adjusted net loss1 of $4 million, or $(0.12) per share Strong cost management results ▪ Cost management strategies are on track ▪ SG&A $29 million lower, or -23%, v. Q2 2019 Strong liquidity position balanced with returning capital to shareholders ▪ Amended banking covenants to increase financial flexibility ▪ Net cash of $47 million (cash of $92 million less debt of $45 million) v. net debt of $28 million Q1 2020 ▪ $52 million of stock repurchased YTD,2 no current plans for additional repurchases Leveraging digital strategy ▪ JobStackTM is helping us safely connect people with work during this time of crisis ▪ 551,000 shifts filled via JobStack in Q2 2020, representing an all-time high digital fill rate3 of 53% ▪ 24,300 client users, up 38% compared to Q2 2019 ▪ New digital onboarding functionality shows favorable results 1 See the appendix to this presentation and “Financial Information” in the investors section of our website at www.trueblue.com for a definition and full reconciliation of non-GAAP financial measures to GAAP financial results. 2 Cash settlement for the full $52 million occurred in Q1 2020 (pre-COVID-19). However, with regard to the $40M ASR, $32M of impact was reflected in our outstanding share count in Q1 and the remaining $8M will be reflected in Q3. 3 Representswww.TrueBlue.com orders filled via JobStack (calculation excludes unfilled orders). 3


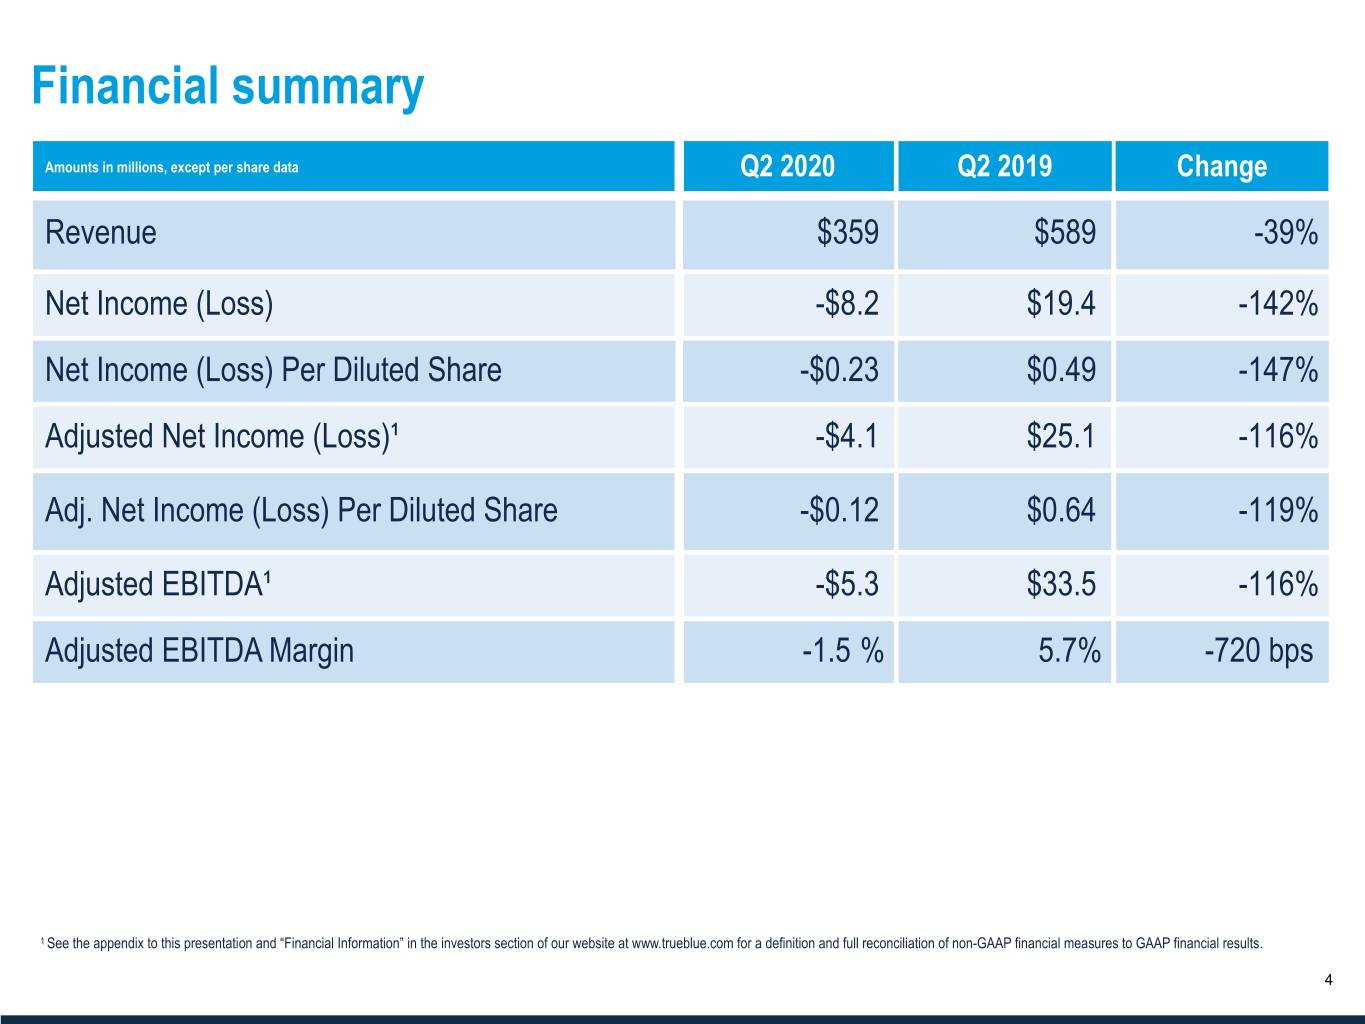
Financial summary Amounts in millions, except per share data Q2 2020 Q2 2019 Change Revenue $359 $589 -39% Net Income (Loss) -$8.2 $19.4 -142% Net Income (Loss) Per Diluted Share -$0.23 $0.49 -147% Adjusted Net Income (Loss)¹ -$4.1 $25.1 -116% Adj. Net Income (Loss) Per Diluted Share -$0.12 $0.64 -119% Adjusted EBITDA¹ -$5.3 $33.5 -116% Adjusted EBITDA Margin -1.5 % 5.7% -720 bps 1 See the appendix to this presentation and “Financial Information” in the investors section of our website at www.trueblue.com for a definition and full reconciliation of non-GAAP financial measures to GAAP financial results. www.TrueBlue.com 4


Monthly revenue trends Total TrueBlue (35)% (41)% (42)% April May June PeopleReady PeopleManagement PeopleScout (15)% (11)% (25)% (30)% (31)% (39)% (46)% (46)% (50)% (54)% (54)% April May June July MTD* www.TrueBlue.com*MTD results reflect the three weeks ended Jul. 19. Excluding the benefit from 4th of July falling on Saturday this year versus Thursday last year, PeopleReady was down 33% and Peoplemanagment was down 12%. 5 Weekly data is not available for PeopleScout which bills clients monthly.


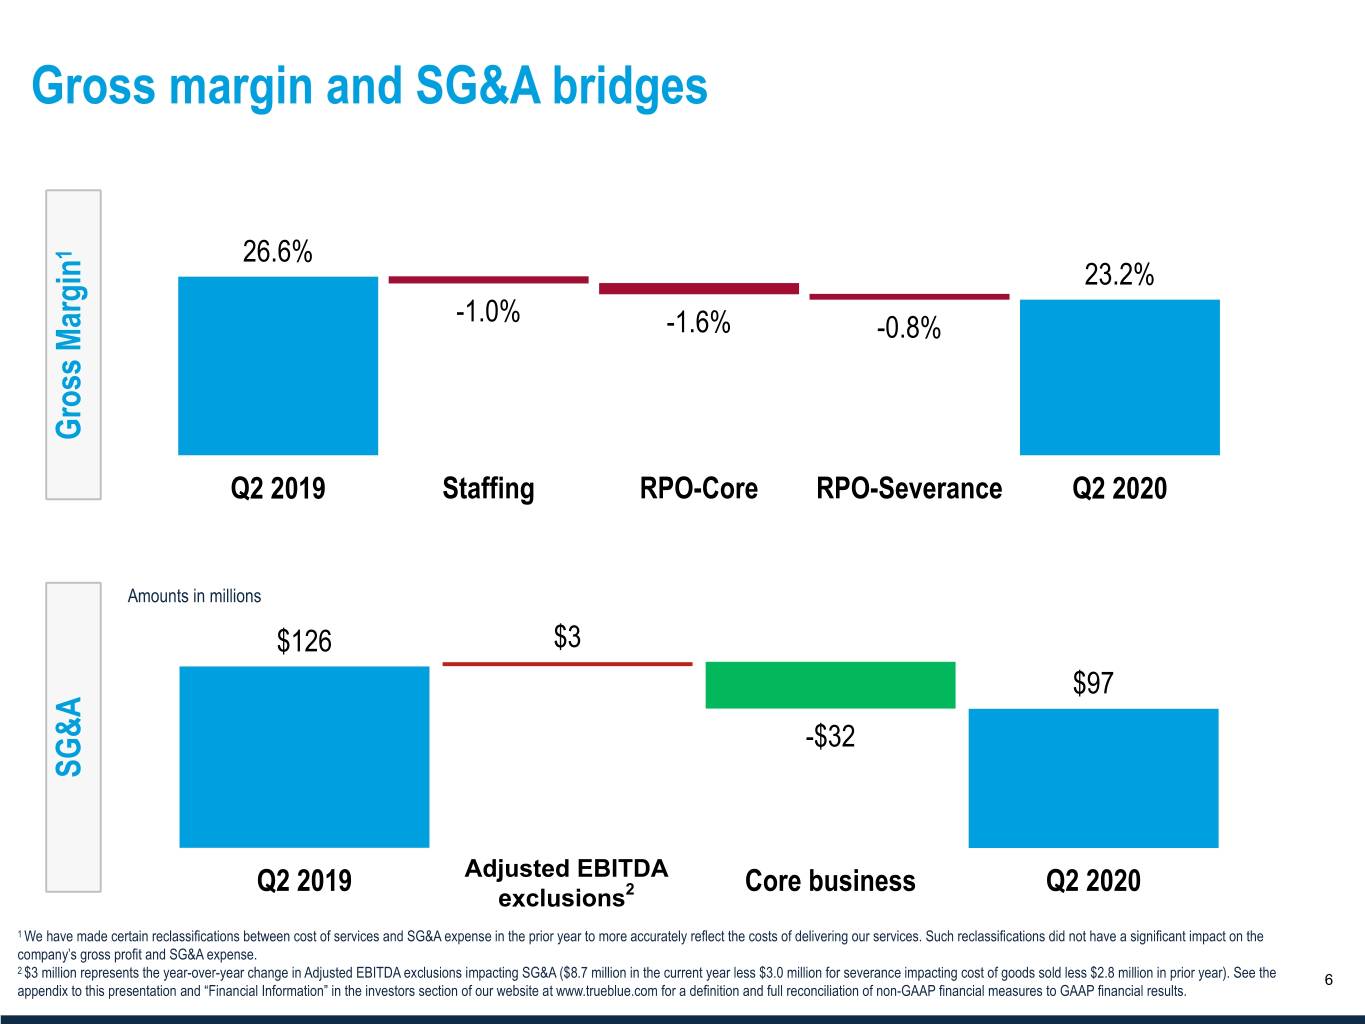
Gross margin and SG&A bridges 1 26.6% 23.2% -1.0% -1.6% -0.8% Gross Margin Q2 2019 Staffing RPO-Core RPO-Severance Q2 2020 Amounts in millions $126 $3 $97 -$32 SG&A Q2 2019 Adjusted EBITDA Core business Q2 2020 exclusions2 1 We have made certain reclassifications between cost of services and SG&A expense in the prior year to more accurately reflect the costs of delivering our services. Such reclassifications did not have a significant impact on the company’s gross profit and SG&A expense. 2 $3www.TrueBlue.com million represents the year-over-year change in Adjusted EBITDA exclusions impacting SG&A ($8.7 million in the current year less $3.0 million for severance impacting cost of goods sold less $2.8 million in prior year). See the 6 appendix to this presentation and “Financial Information” in the investors section of our website at www.trueblue.com for a definition and full reconciliation of non-GAAP financial measures to GAAP financial results.


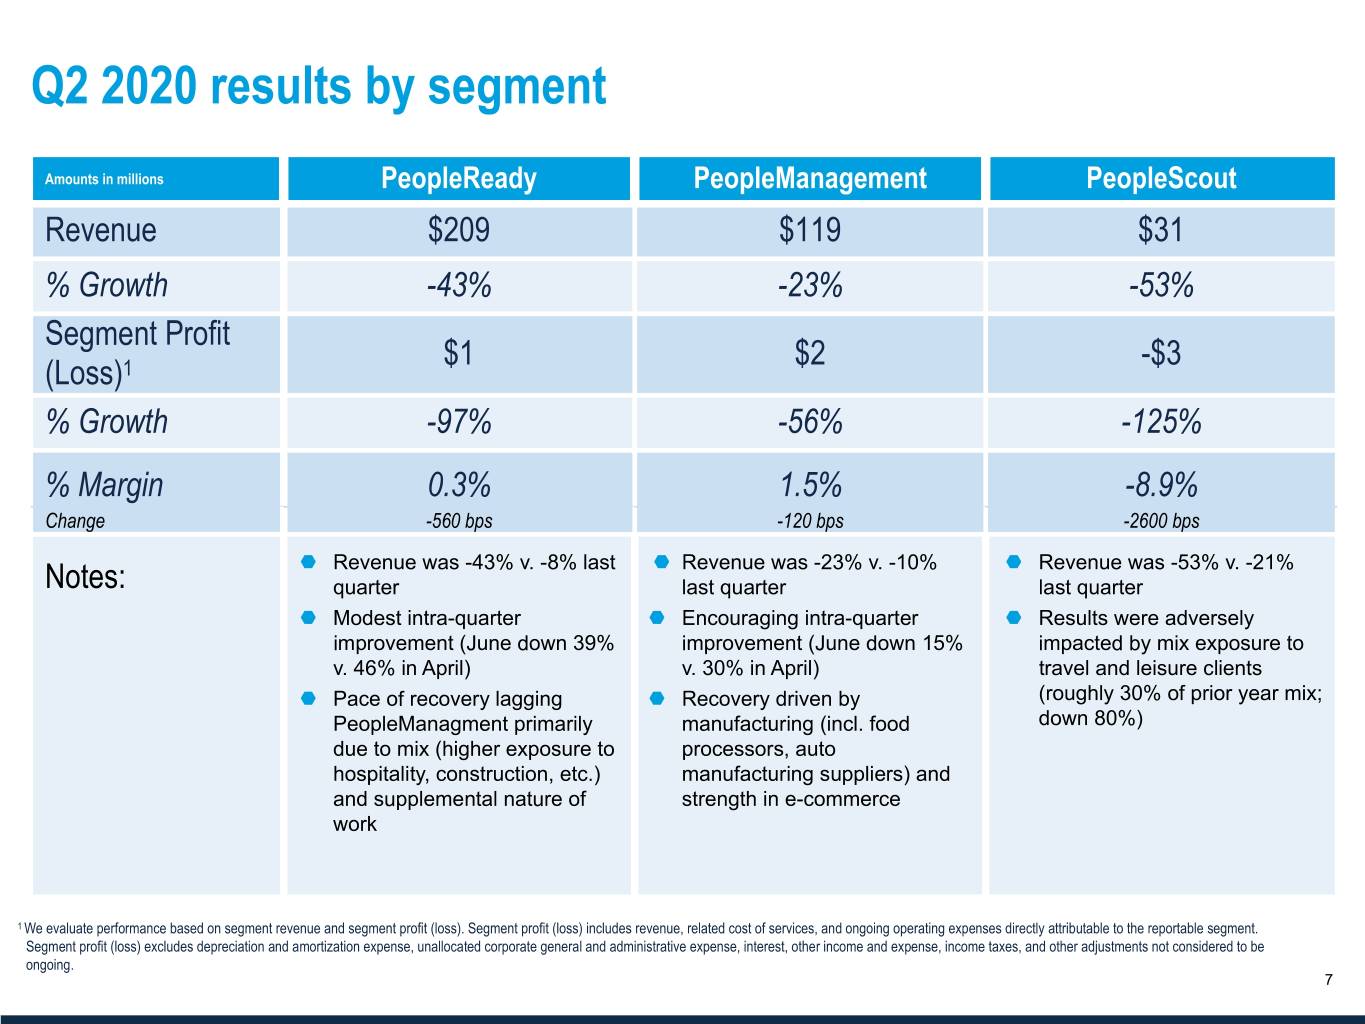
Q2 2020 results by segment Amounts in millions PeopleReady PeopleManagement PeopleScout Revenue $209 $119 $31 % Growth -43% -23% -53% Segment Profit $1 $2 -$3 (Loss)1 % Growth -97% -56% -125% % Margin 0.3% 1.5% -8.9% Change -560 bps -120 bps -2600 bps ¬ Revenue was -43% v. -8% last ¬ Revenue was -23% v. -10% ¬ Revenue was -53% v. -21% Notes: quarter last quarter last quarter ¬ Modest intra-quarter ¬ Encouraging intra-quarter ¬ Results were adversely improvement (June down 39% improvement (June down 15% impacted by mix exposure to v. 46% in April) v. 30% in April) travel and leisure clients ¬ Pace of recovery lagging ¬ Recovery driven by (roughly 30% of prior year mix; PeopleManagment primarily manufacturing (incl. food down 80%) due to mix (higher exposure to processors, auto hospitality, construction, etc.) manufacturing suppliers) and and supplemental nature of strength in e-commerce work 1 We evaluate performance based on segment revenue and segment profit (loss). Segment profit (loss) includes revenue, related cost of services, and ongoing operating expenses directly attributable to the reportable segment. Segment profit (loss) excludes depreciation and amortization expense, unallocated corporate general and administrative expense, interest, other income and expense, income taxes, and other adjustments not considered to be ongoing. www.TrueBlue.com 7


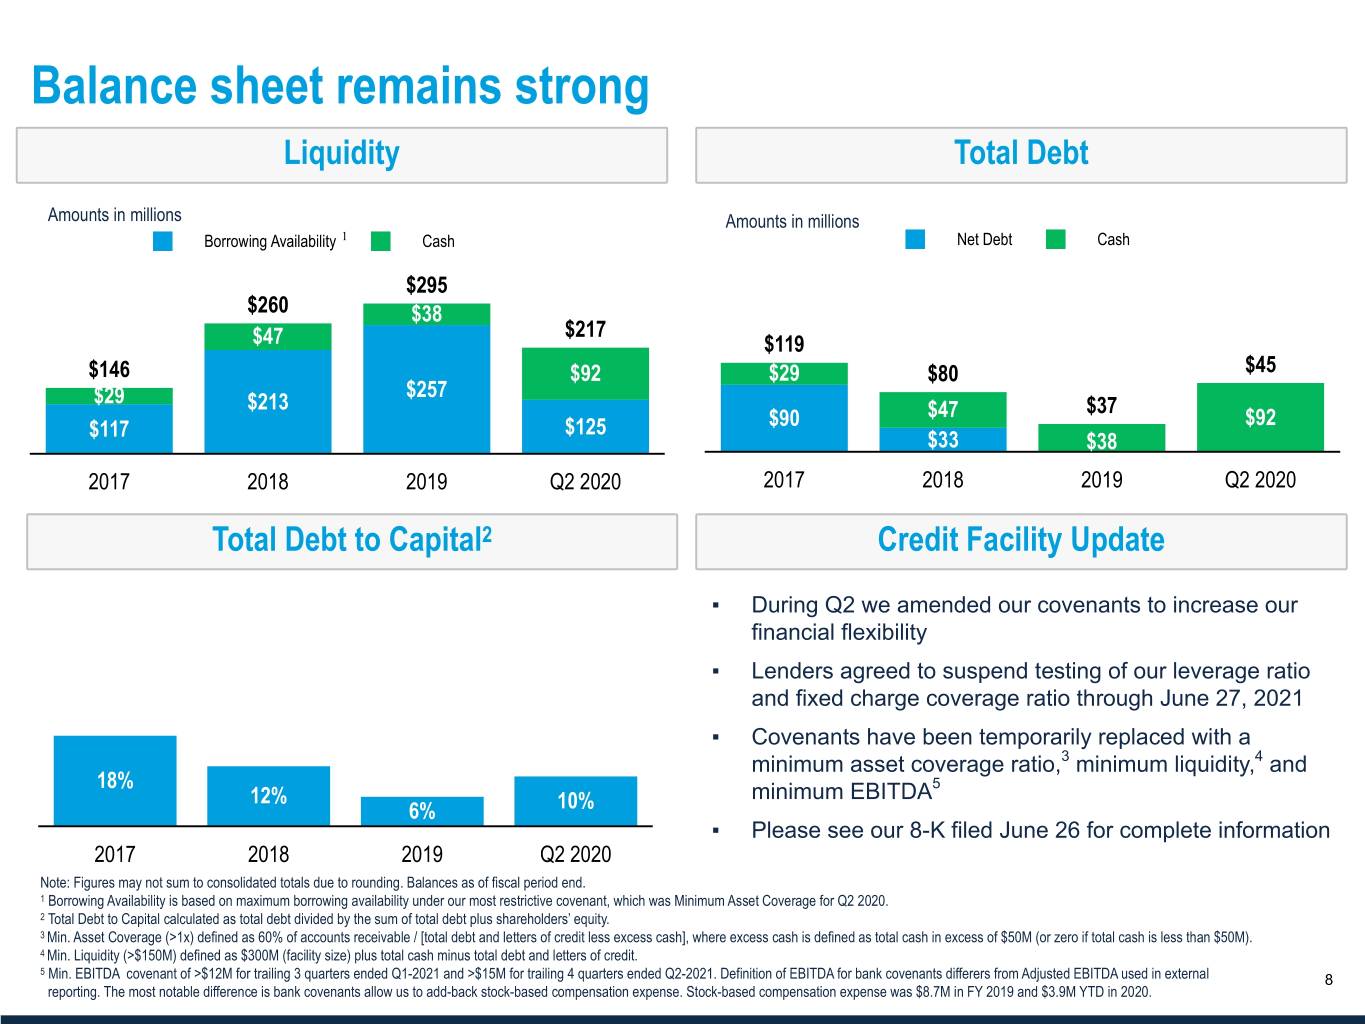
Balance sheet remains strong Liquidity Total Debt Amounts in millions Amounts in millions Borrowing Availability 1 Cash Net Debt Cash $295 $260 $38 $217 $47 $119 $146 $92 $29 $80 $45 $257 $29 $213 $37 $47 $92 $117 $125 $90 $33 $38 2017 2018 2019 Q2 2020 2017 2018 2019 Q2 2020 Total Debt to Capital2 Credit Facility Update ▪ During Q2 we amended our covenants to increase our financial flexibility ▪ Lenders agreed to suspend testing of our leverage ratio and fixed charge coverage ratio through June 27, 2021 ▪ Covenants have been temporarily replaced with a minimum asset coverage ratio,3 minimum liquidity,4 and 18% 5 12% minimum EBITDA 6% 10% ▪ Please see our 8-K filed June 26 for complete information 2017 2018 2019 Q2 2020 Note: Figures may not sum to consolidated totals due to rounding. Balances as of fiscal period end. 1 Borrowing Availability is based on maximum borrowing availability under our most restrictive covenant, which was Minimum Asset Coverage for Q2 2020. 2 Total Debt to Capital calculated as total debt divided by the sum of total debt plus shareholders’ equity. 3 Min. Asset Coverage (>1x) defined as 60% of accounts receivable / [total debt and letters of credit less excess cash], where excess cash is defined as total cash in excess of $50M (or zero if total cash is less than $50M). 4 Min. Liquidity (>$150M) defined as $300M (facility size) plus total cash minus total debt and letters of credit. 5 www.TrueBlue.com Min. EBITDA covenant of >$12M for trailing 3 quarters ended Q1-2021 and >$15M for trailing 4 quarters ended Q2-2021. Definition of EBITDA for bank covenants differers from Adjusted EBITDA used in external 8 reporting. The most notable difference is bank covenants allow us to add-back stock-based compensation expense. Stock-based compensation expense was $8.7M in FY 2019 and $3.9M YTD in 2020.


Strategic highlights Safety remains our top priority. Key elements of our plan include: • Communication: established a resource center for staff; safety specialists Employee and regularly meet with operational teams and clients client safety • Protective equipment: implemented social distancing measures at all our locations and provided PPE (masks) and hand sanitizer • Wellness checks: For all associates/staff at on-sites, symptom checking prior to entering building (e.g. temperature checks, questioning, etc.) • Adapting our business: drive-in job fairs/interviews for associates and staff working from home wherever possible • PeopleReady: Targeting high need areas, tracking competitor closures and Businesses tapping a broader worker pool. • PeopleManagement: Targeting essential businesses, e-commerce, etc. executing on Focus on consolidating client wallet share. recovery plans • PeopleScout: Supporting clients that laid off in-house recruitment teams and focus on project/burst hiring. • PeopleReady's new digital onboarding functionality shows favorable results: JobStack ◦ Recently deployed in 50 states digital ◦ Applicant time cut in half strategy ◦ Application completion rate 20 percentage points higher www.TrueBlue.com 9


Outlook


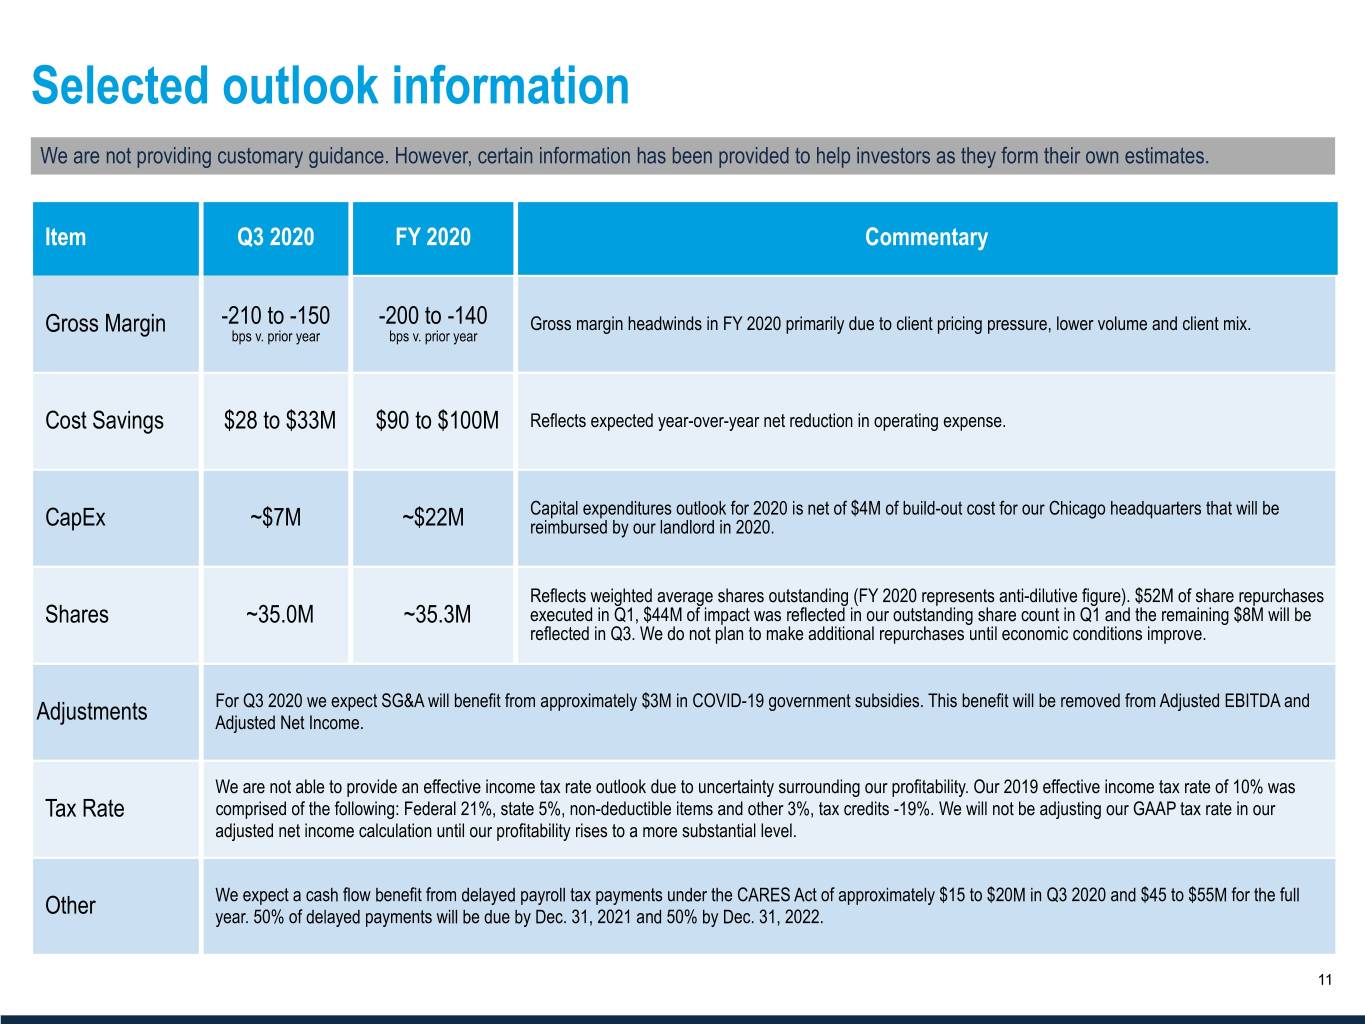
Selected outlook information We are not providing customary guidance. However, certain information has been provided to help investors as they form their own estimates. Item Q3 2020 FY 2020 Commentary Gross Margin -210 to -150 -200 to -140 Gross margin headwinds in FY 2020 primarily due to client pricing pressure, lower volume and client mix. bps v. prior year bps v. prior year Cost Savings $28 to $33M $90 to $100M Reflects expected year-over-year net reduction in operating expense. Capital expenditures outlook for 2020 is net of $4M of build-out cost for our Chicago headquarters that will be CapEx ~$7M ~$22M reimbursed by our landlord in 2020. Reflects weighted average shares outstanding (FY 2020 represents anti-dilutive figure). $52M of share repurchases Shares ~35.0M ~35.3M executed in Q1, $44M of impact was reflected in our outstanding share count in Q1 and the remaining $8M will be reflected in Q3. We do not plan to make additional repurchases until economic conditions improve. For Q3 2020 we expect SG&A will benefit from approximately $3M in COVID-19 government subsidies. This benefit will be removed from Adjusted EBITDA and Adjustments Adjusted Net Income. We are not able to provide an effective income tax rate outlook due to uncertainty surrounding our profitability. Our 2019 effective income tax rate of 10% was Tax Rate comprised of the following: Federal 21%, state 5%, non-deductible items and other 3%, tax credits -19%. We will not be adjusting our GAAP tax rate in our adjusted net income calculation until our profitability rises to a more substantial level. We expect a cash flow benefit from delayed payroll tax payments under the CARES Act of approximately $15 to $20M in Q3 2020 and $45 to $55M for the full Other year. 50% of delayed payments will be due by Dec. 31, 2021 and 50% by Dec. 31, 2022. www.TrueBlue.com 11 ¬ TrueBlue revenue has historically tracked with gross domestic product (GDP) ¬ Regression analysis suggests that TrueBlue revenue would be down approximately 9% if GDP was flat, and would decline approximately 7 percentage points for every additional point of year-over-year GDP decline YoY GDP Growth1 0% -1% -2% -3% -4% -5% Revenue Implied TBI Growth2 -9% -16% -23% -30% -37% -44%


Appendix


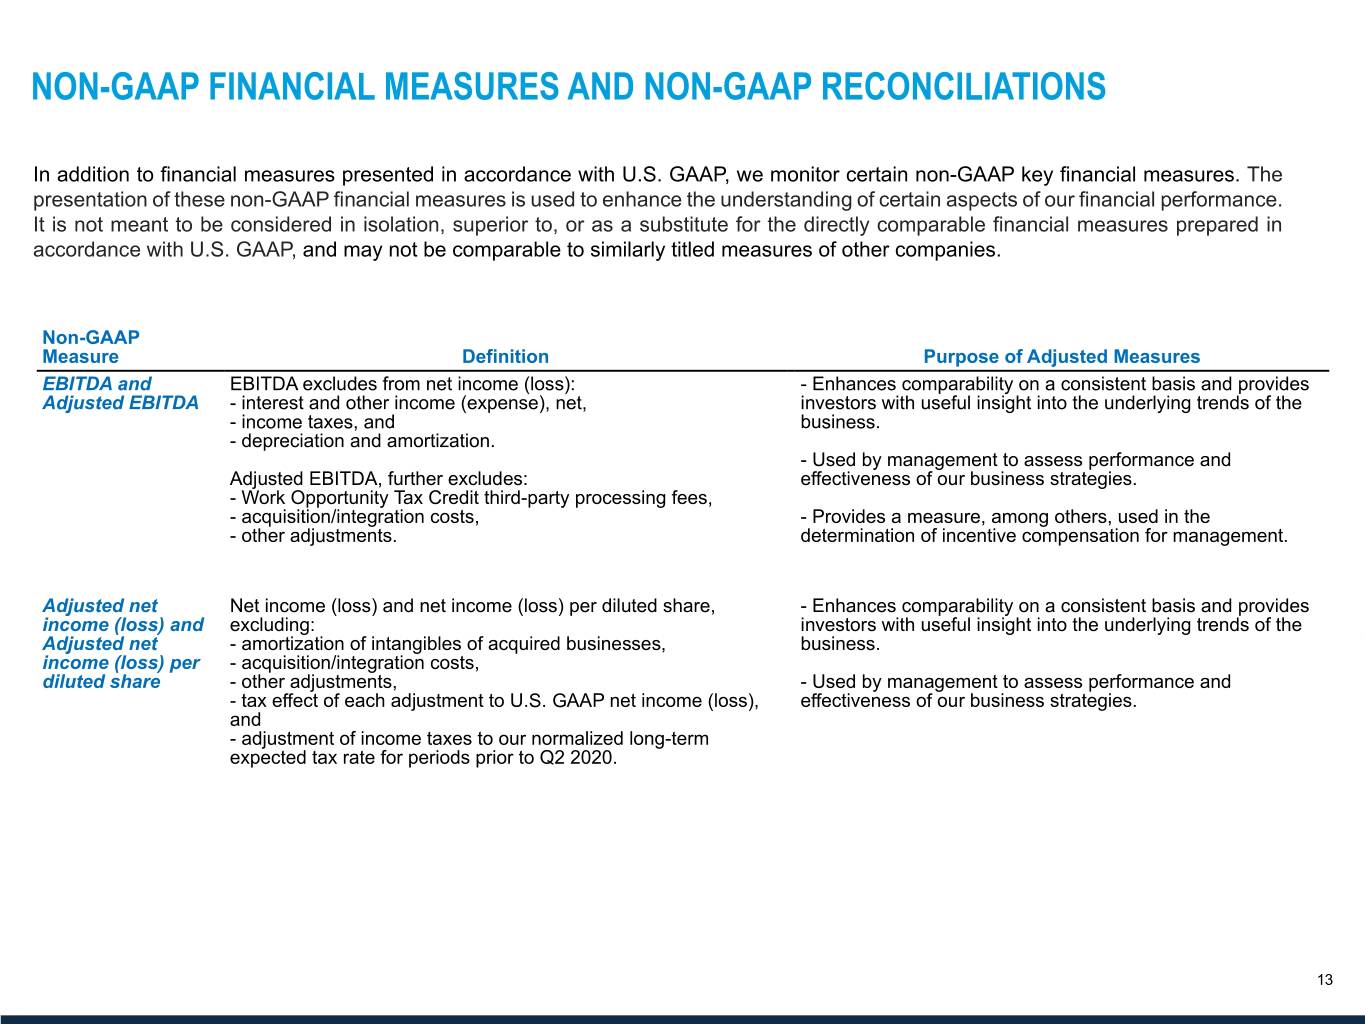
NON-GAAP FINANCIAL MEASURES AND NON-GAAP RECONCILIATIONS In addition to financial measures presented in accordance with U.S. GAAP, we monitor certain non-GAAP key financial measures. The presentation of these non-GAAP financial measures is used to enhance the understanding of certain aspects of our financial performance. It is not meant to be considered in isolation, superior to, or as a substitute for the directly comparable financial measures prepared in accordance with U.S. GAAP, and may not be comparable to similarly titled measures of other companies. Non-GAAP Measure Definition Purpose of Adjusted Measures EBITDA and EBITDA excludes from net income (loss): - Enhances comparability on a consistent basis and provides Adjusted EBITDA - interest and other income (expense), net, investors with useful insight into the underlying trends of the - income taxes, and business. - depreciation and amortization. - Used by management to assess performance and Adjusted EBITDA, further excludes: effectiveness of our business strategies. - Work Opportunity Tax Credit third-party processing fees, - acquisition/integration costs, - Provides a measure, among others, used in the - other adjustments. determination of incentive compensation for management. Adjusted net Net income (loss) and net income (loss) per diluted share, - Enhances comparability on a consistent basis and provides income (loss) and excluding: investors with useful insight into the underlying trends of the Adjusted net - amortization of intangibles of acquired businesses, business. income (loss) per - acquisition/integration costs, diluted share - other adjustments, - Used by management to assess performance and - tax effect of each adjustment to U.S. GAAP net income (loss), effectiveness of our business strategies. and - adjustment of income taxes to our normalized long-term expected tax rate for periods prior to Q2 2020. www.TrueBlue.com 13


1. RECONCILIATION OF U.S. GAAP NET INCOME (LOSS) TO ADJUSTED NET INCOME (LOSS) AND ADJUSTED NET INCOME (LOSS) PER DILUTED SHARE (Unaudited) 13 Weeks Ended (in thousands, except for per share data) Jun 28, 2020 Jun 30, 2019 Net income (loss) $ (8,168) $ 19,406 Amortization of intangible assets of acquired businesses (1) 2,071 4,957 Acquisition/integration costs (2) — 673 Other adjustments (3) 8,700 1,881 Tax effect of adjustments to net income (loss) (4) (6,706) (1,052) Adjustment of income taxes to normalized effective rate (5) — (729) Adjusted net income (loss) $ (4,103) $ 25,136 Adjusted net income (loss) per diluted share $ (0.12) $ 0.64 Diluted weighted average shares outstanding 35,077 39,554 2. RECONCILIATION OF U.S. GAAP NET INCOME (LOSS) TO EBITDA AND ADJUSTED EBITDA (Unaudited) 13 Weeks Ended (in thousands) Jun 28, 2020 Jun 30, 2019 Net income (loss) $ (8,168) $ 19,406 Income tax expense (benefit) (13,475) 2,312 Interest and other (income) expense, net 412 (827) Depreciation and amortization 7,256 9,827 EBITDA (13,975) 30,718 Work Opportunity Tax Credit processing fees (6) — 240 Acquisition/integration costs (2) — 673 Other adjustments (3) 8,700 1,881 Adjusted EBITDA $ (5,275) $ 33,512 www.TrueBlue.comSee the last slide of the appendix for footnotes. 14


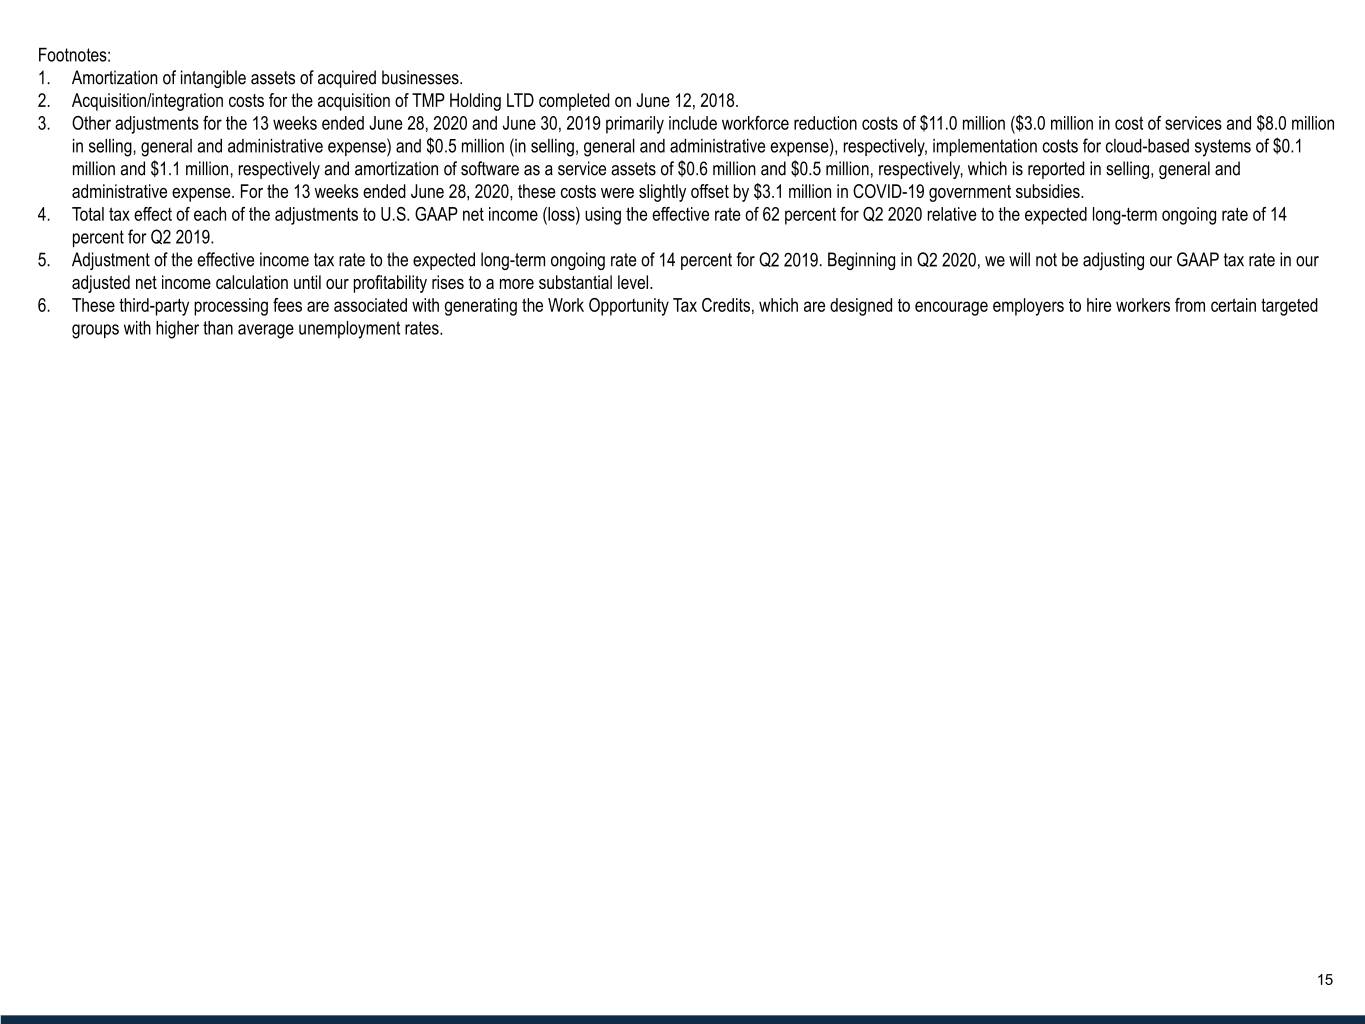
Footnotes: 1. Amortization of intangible assets of acquired businesses. 2. Acquisition/integration costs for the acquisition of TMP Holding LTD completed on June 12, 2018. 3. Other adjustments for the 13 weeks ended June 28, 2020 and June 30, 2019 primarily include workforce reduction costs of $11.0 million ($3.0 million in cost of services and $8.0 million in selling, general and administrative expense) and $0.5 million (in selling, general and administrative expense), respectively, implementation costs for cloud-based systems of $0.1 million and $1.1 million, respectively and amortization of software as a service assets of $0.6 million and $0.5 million, respectively, which is reported in selling, general and administrative expense. For the 13 weeks ended June 28, 2020, these costs were slightly offset by $3.1 million in COVID-19 government subsidies. 4. Total tax effect of each of the adjustments to U.S. GAAP net income (loss) using the effective rate of 62 percent for Q2 2020 relative to the expected long-term ongoing rate of 14 percent for Q2 2019. 5. Adjustment of the effective income tax rate to the expected long-term ongoing rate of 14 percent for Q2 2019. Beginning in Q2 2020, we will not be adjusting our GAAP tax rate in our adjusted net income calculation until our profitability rises to a more substantial level. 6. These third-party processing fees are associated with generating the Work Opportunity Tax Credits, which are designed to encourage employers to hire workers from certain targeted groups with higher than average unemployment rates. www.TrueBlue.com 15