Exhibit 99.1

INVESTOR CONTACT | MEDIA CONTACT | |
Julie Anderson, 214.932.6673 | Shannon Wherry, 469.399.8527 | |
TEXAS CAPITAL BANCSHARES, INC. ANNOUNCES OPERATING RESULTS FOR Q2 2020
DALLAS - July 22, 2020 - Texas Capital Bancshares, Inc. (NASDAQ: TCBI), the parent company of Texas Capital Bank, announced operating results for the second quarter of 2020.
"As we navigate these unprecedented times with a focus on protecting our employees and our clients, we continue to position the Company for long-term, sustainable earnings growth," said Larry Helm, Executive Chairman and CEO. "Our significant investments in infrastructure and technology over the past few years enabled meaningful cost realignment during the second quarter. We remain vigilant in managing credit, while continuing to selectively recruit and acquire frontline talent."
• | In response to pressures of the current economic environment and a refinement of our strategy, we took actions during the second quarter of 2020 which are expected to decrease our non-interest expenses, including a workforce reduction and write-offs of certain software assets. |
• | We reported a net loss of $34.3 million, or $0.73 per diluted share, for the second quarter of 2020, a $17.6 million decline from the first quarter of 2020, resulting from a $40.3 million increase in revenue, comprised of a $58.7 million increase in non-interest income and an $18.4 million decrease in net interest income, offset by a $56.9 million increase to non-interest expense. Significant transactions affecting our income statement during the second quarter of 2020 included: |
• | $100.0 million ($1.55 per share) provision for credit losses; driven by an increase in charge-offs and reserve build related to higher criticized loan levels and continued economic uncertainty from the COVID-19 pandemic, |
• | $26.6 million ($0.41 per share) in non-recurring software expenses; including $20.7 million in write-offs of certain software assets and $5.9 million in technology expense related to the roll-out of our Paycheck Protection Program capabilities, |
• | $18.0 million ($0.28 per share) in severance accruals related to the workforce reduction referenced above, |
• | $10.5 million ($0.16 per share) in final merger-related expenses, and |
• | $9.1 million ($0.14 per share) in mortgage servicing rights ("MSR") impairment. |
While these expenses had a significant impact on our second quarter operating results, we believe that we are better positioned to improve our core profitability going forward as the non-interest expense items are not expected to recur in future periods.
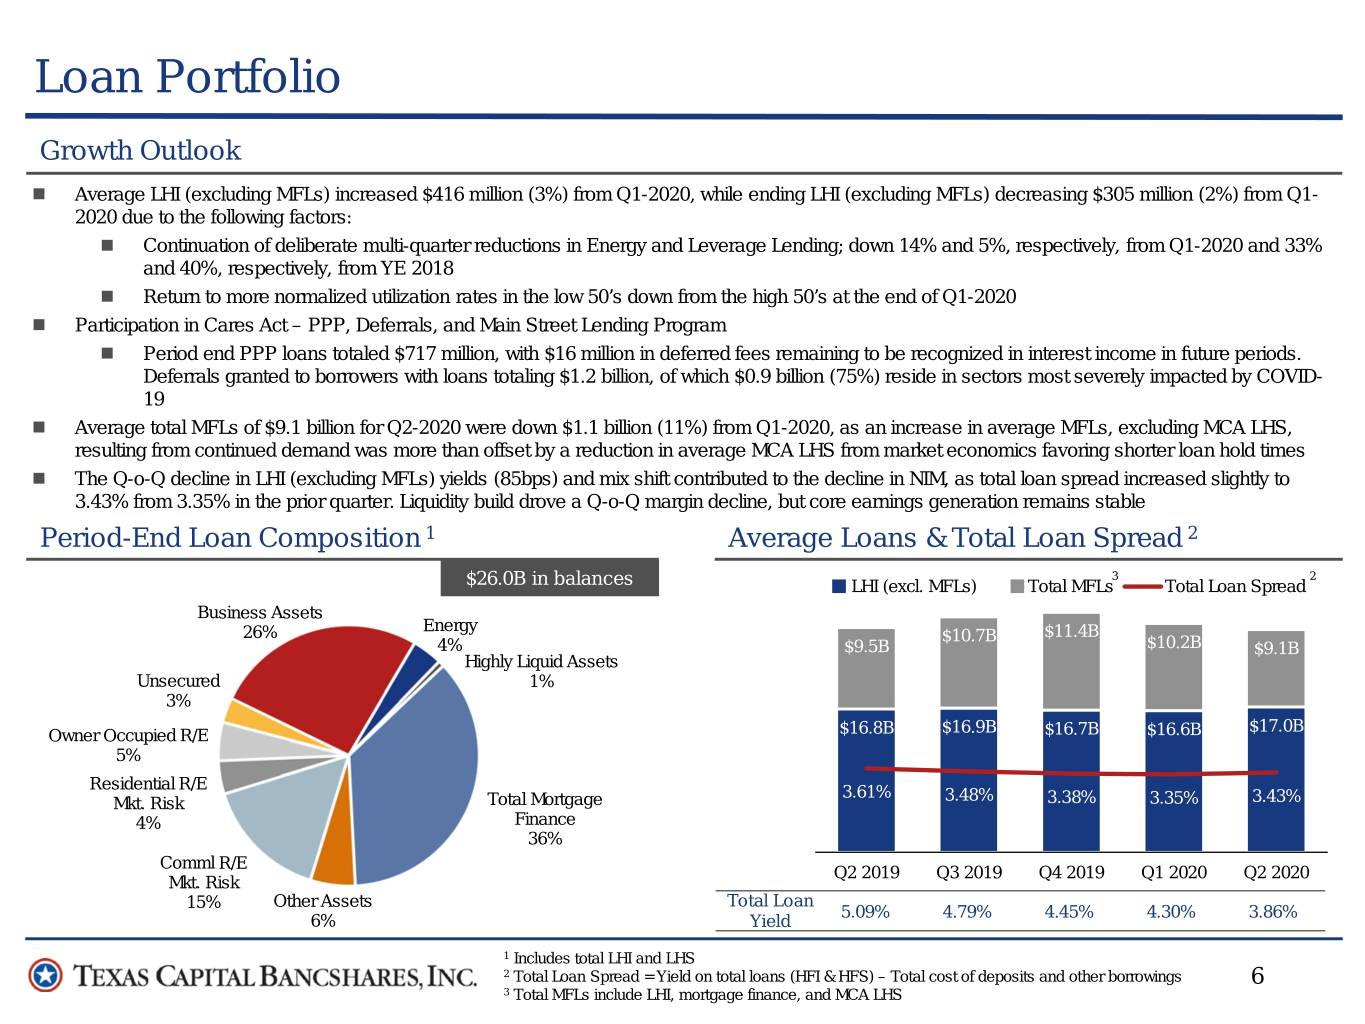
• | In response to the COVID-19 pandemic over 90% of employees have been working virtually since early March with limited impact on the execution of our business and client experience. Additionally, we funded $717.5 million in loans under the Paycheck Protection Program and implemented a short-term loan modification program that complies with the CARES act to provide temporary relief to certain borrowers who meet the program's qualifications. |
FINANCIAL SUMMARY
(Dollars and shares in thousands) | Q2 2020 | Q2 2019 | % Change | |||||||
QUARTERLY OPERATING RESULTS | ||||||||||
Net income/(loss) | $ | (34,316 | ) | $ | 77,812 | (144 | )% | |||
Net income/(loss) available to common stockholders | $ | (36,753 | ) | $ | 75,375 | (149 | )% | |||
Diluted earnings/(loss) per common share | $ | (0.73 | ) | $ | 1.50 | (149 | )% | |||
Diluted common shares | 50,416 | 50,384 | — | % | ||||||
ROA | (0.36 | )% | 1.05 | % | ||||||
ROE | (5.48 | )% | 12.20 | % | ||||||
BALANCE SHEET | ||||||||||
Loans held for sale ("LHS") | $ | 454,581 | $ | 1,057,586 | (57 | )% | ||||
Loans held for investment ("LHI"), mortgage finance | 8,972,626 | 7,415,363 | 21 | % | ||||||
LHI | 16,552,203 | 16,924,535 | (2 | )% | ||||||
Total LHI | 25,524,829 | 24,339,898 | 5 | % | ||||||
Total assets | 36,613,127 | 29,970,384 | 22 | % | ||||||
Demand deposits | 10,835,911 | 7,685,340 | 41 | % | ||||||
Total deposits | 30,187,695 | 22,999,077 | 31 | % | ||||||
Stockholders’ equity | 2,734,755 | 2,647,071 | 3 | % | ||||||
DETAILED FINANCIALS
During the second quarter of 2020, we have continued to face unprecedented challenges as our country grapples with the continuing impact of the COVID-19 pandemic. Actions by U.S. federal, state and foreign governments to address the pandemic, including travel bans, business and entertainment venue closures and rapid changes in business and consumer behavior, have resulted in continuing high levels of uncertainty. economic weakness and market volatility. Due to these events, on May 22, 2020, we and Independent Bank Group, Inc. ("IBTX"), agreed to mutually terminate our merger agreement. The termination was approved by each company's board of directors after careful consideration of the significant impact of the COVID-19 pandemic on global markets and on the companies' ability to fully realize the benefits expected to be achieved through the merger.
We continue to focus on balance sheet strength and while we intend to operate with above-average liquidity in response to this uncertain economic environment, we believe opportunities exist to improve core earnings by reducing or replacing higher-cost funding sources and improving the earning asset mix. In the first few weeks of July 2020, we began to utilize low-yielding liquidity assets to increase the balance of our securities portfolio in an effort to improve yields during the second half of 2020.
For the second quarter of 2020, we reported a net loss of $34.3 million and net loss available to common stockholders of $36.8 million, compared to net income of $77.8 million and net income available to common stockholders of $75.4 million for the same period in 2019. On a fully diluted basis, earnings/(loss) per common share were $(0.73) for the quarter ended June 30, 2020 compared to $1.50 for the same period of 2019. The decline in net income for the second quarter of 2020 as compared to the same period in 2019 resulted primarily from a $73.0 million increase in the provision for credit losses, as well as an $80.6 million increase in non-interest expense, driven by the significant second quarter 2020 expenses described below, offset by a $46.1 million increase in non-interest income resulting primarily from a $45.0 million increase in net gain/(loss) on sale of loans held for sale.
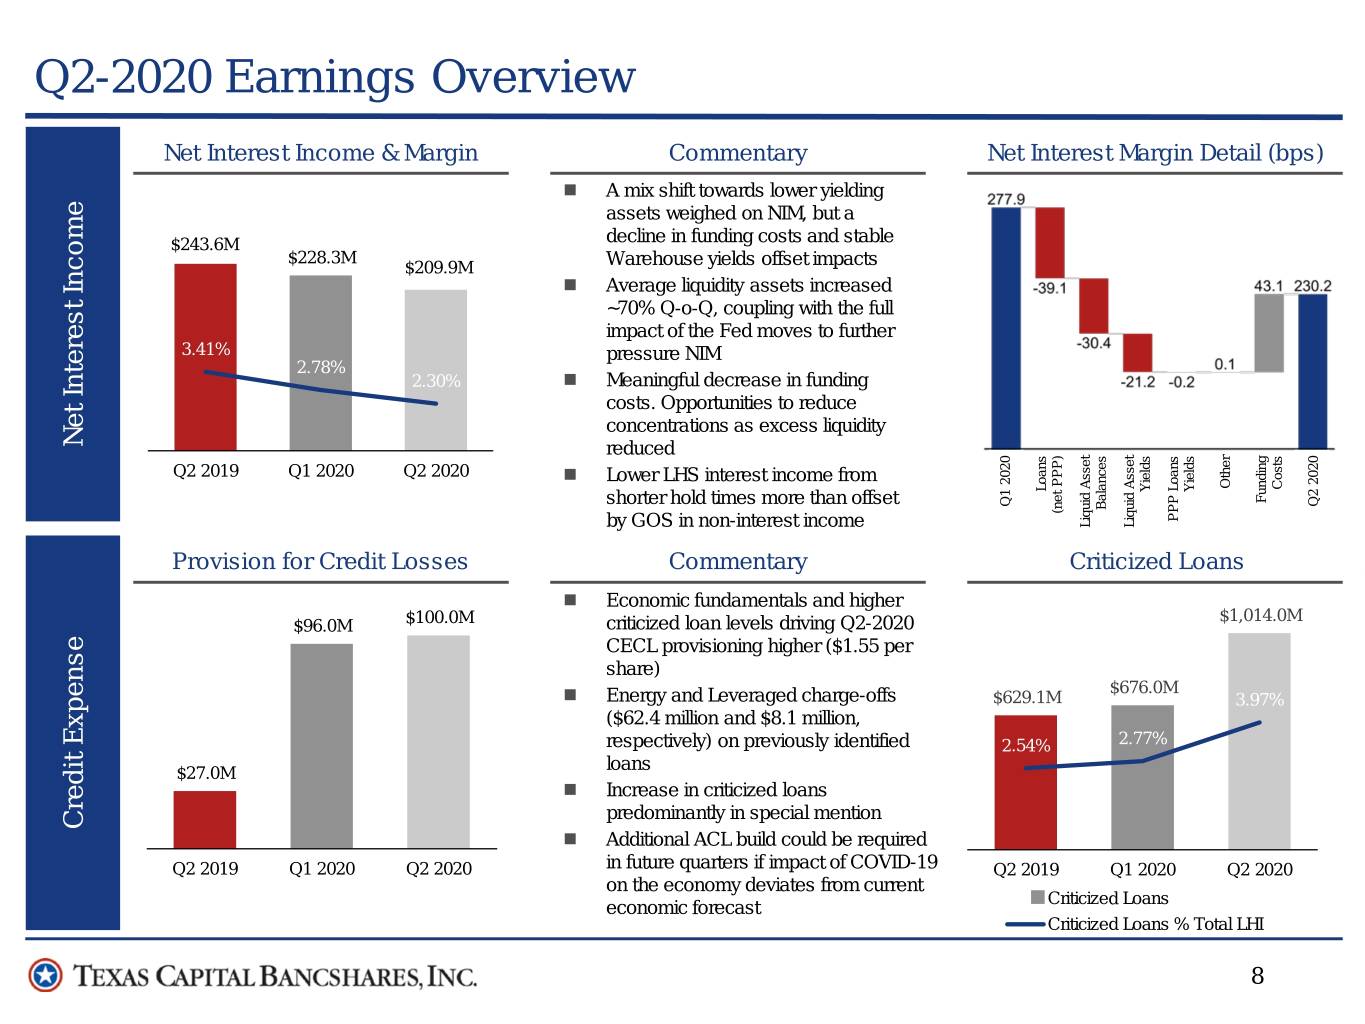
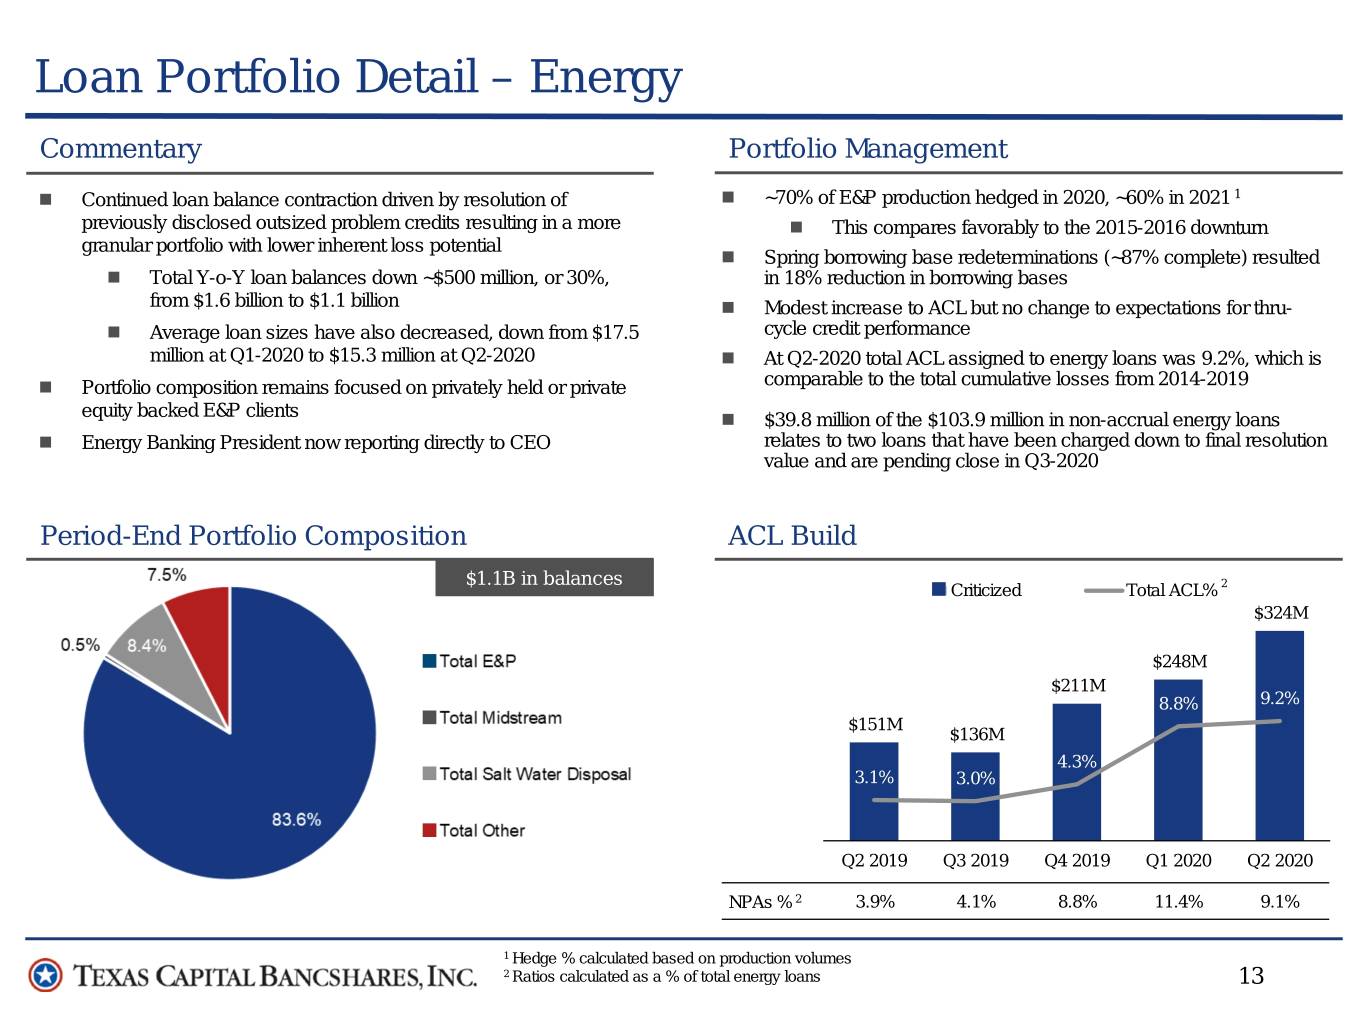
We recorded a $100.0 million provision for credit losses for the second quarter of 2020 utilizing the Current Expected Credit Loss ("CECL") methodology adopted in the first quarter of 2020, compared to $96.0 million for the first quarter of 2020 and $27.0 million for the second quarter of 2019. The increase in provision for credit losses resulted primarily from an increase in charge-offs and reserve build related to higher criticized loan levels and continued economic uncertainty from the COVID-19 pandemic. We recorded $74.1 million in net charge-offs during the second quarter of 2020, including $62.4 million in energy net charge-offs and $8.1 million in leveraged lending net charge-offs, all of which were loans that had been previously identified as problem loans, compared to $57.7 million during the first quarter of 2020 and $20.0 million during the second quarter of 2019. Criticized loans totaled $1.0 billion at June 30, 2020, compared to $675.9 million at March 31, 2020 and $629.1 million at June 30, 2019. The increase in criticized loans was predominantly in special mention and was primarily due to the continued downgrade of loans that have been impacted by the COVID-19 pandemic or that are in categories that are expected to be more significantly impacted by COVID-19.
Non-performing assets ("NPAs") totaled $174.0 million at June 30, 2020, a decrease of $45.1 million compared to the first quarter of 2020 and an increase of $59.9 million compared to the second quarter of 2019. The linked quarter decrease is primarily related to charge-offs of energy and leveraged lending loans in the second quarter of 2020. Non-accrual energy loans totaled $103.9 million (60% of total NPAs) at June 30, 2020, $39.8 million of which relates to two loans that have been charged down to final resolution value and are expected to close in the third quarter of 2020, compared to $151.9 million at March 31, 2020. Non-accrual leveraged lending loans totaled $24.8 million (14% of total NPAs) at June 30, 2020, compared to $50.0 million at March 31, 2020. The ratio of NPAs to total LHI plus other real estate owned ("OREO") for the second quarter of 2020 was 0.68 percent, compared to 0.90 percent for the first quarter of 2020 and 0.47 percent for the second quarter of 2019.
In response to the COVID-19 pandemic, we implemented a short-term loan modification program in late March 2020 to provide temporary payment relief to borrowers who meet the program's qualifications. This program allows for a deferral of payments for 90 days, which we may extend for an additional 90 days, for a maximum of 180 days on a cumulative basis. The deferred payments along with interest accrued during the deferral period are due and payable on the maturity date of the existing loan. As of June 30, 2020, we have granted temporary modifications on 482 loans (336 during the second quarter of 2020) with a total outstanding loan balance of $1.2 billion, resulting in the deferral of $10.8 million ($7.1 million in the second quarter of 2020) in interest payments.
Net interest income was $209.9 million for the second quarter of 2020, compared to $228.3 million for the first quarter of 2020 and $243.6 million for the second quarter of 2019. The linked quarter decrease in net interest income was due primarily to a decrease in average LHS, as a result of holding purchased loans for shorter durations, as well as decreases in yields on LHI, excluding mortgage finance, and liquidity assets offset by an increase in yields on LHI, mortgage finance, and a decrease in funding costs. The decline in net interest income on LHS resulting from shorter hold times was offset by an increase in non-interest income as noted below. Net interest margin for the second quarter of 2020 was 2.30 percent, a decrease of 48 basis points from the first quarter of 2020 and a decrease of 111 basis points from the second quarter of 2019. The shift in earning assets, primarily the increase in liquidity assets and decrease in loans held for sale, significantly contributed to the decrease in net interest margin. LHI yields, excluding mortgage finance loans, decreased 85 basis points from the first quarter of 2020, and decreased 169 basis points compared to the second quarter of 2019. LHI, mortgage finance yields for the second quarter of 2020 increased 30 basis
2
points compared to the first quarter of 2020 as a result of decreases in incentive pricing in the second quarter of 2020, and decreased 17 basis points compared to the second quarter of 2019. Additionally, total cost of deposits for the second quarter of 2020 decreased 48 basis points to 0.42 percent compared to 0.90 percent for the first quarter of 2020, and decreased 87 basis points from 1.29 percent for the second quarter of 2019.
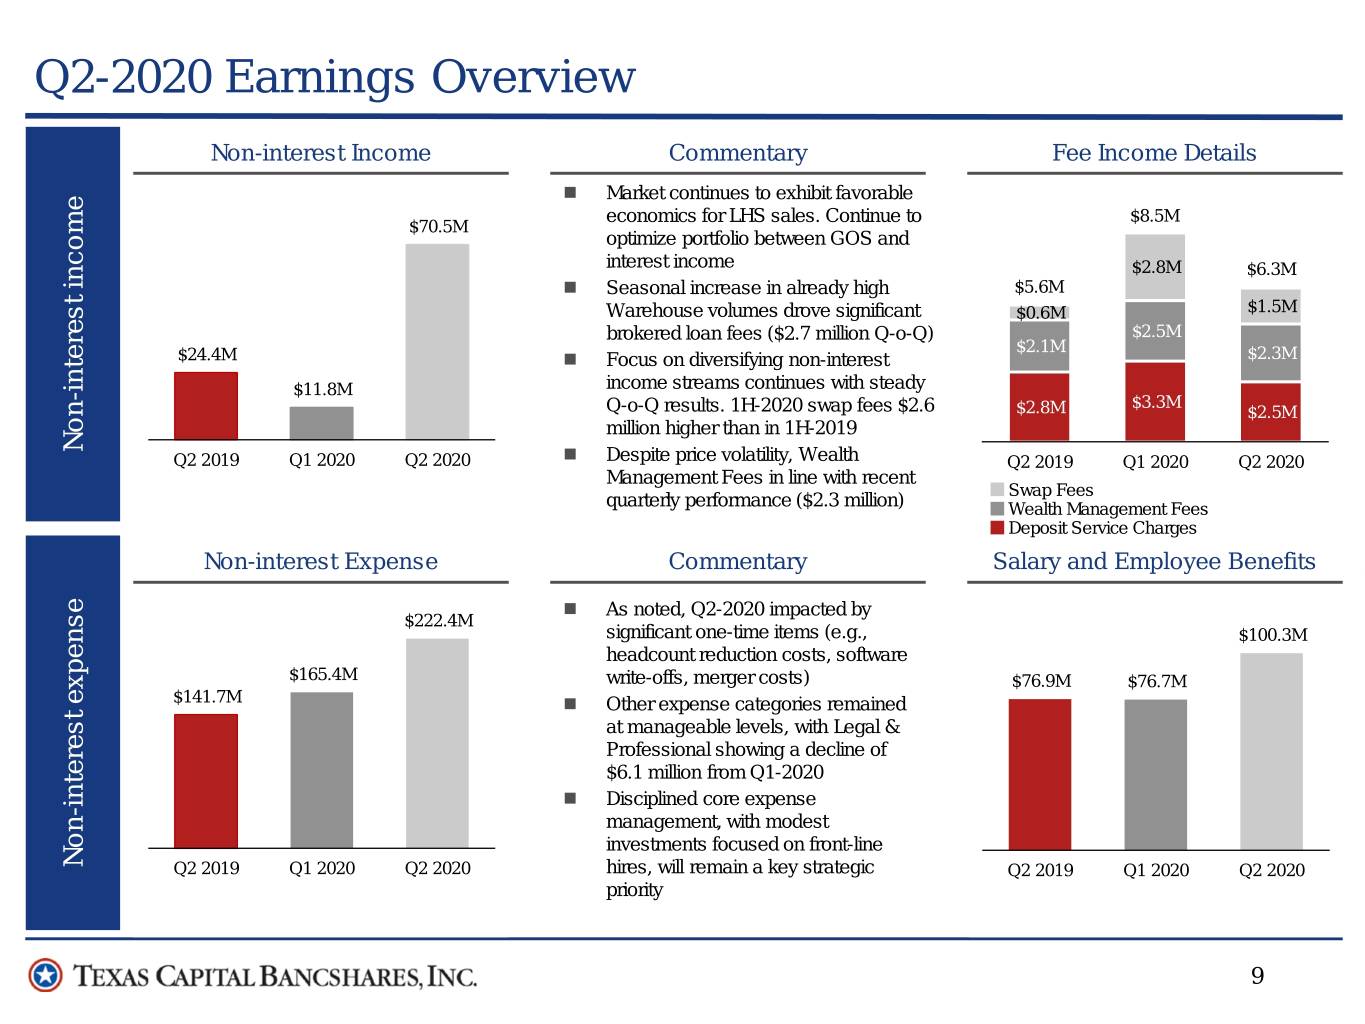
Non-interest income increased $58.7 million during the second quarter of 2020 compared to the first quarter of 2020, and increased $46.1 million compared to the second quarter of 2019. The linked quarter increase was primarily related to an increase in net gain/(loss) on sale of LHS, as well as increases in brokered loans fees and other non-interest income. The year-over-year increase was primarily related to an increase in net gain/(loss) on sale of LHS, as well as increases in brokered loan fees and servicing income, partially offset by a decrease in other non-interest income. The linked quarter and year-over-year increase in net gain/(loss) on sale of LHS was due to lower hedge costs in the second quarter of 2020 as a result of holding purchased loans for shorter durations than in prior periods, and is offset by the decline in net interest income on LHS noted above.
Non-interest expense for the second quarter of 2020 increased $56.9 million, or 34 percent, compared to the first quarter of 2020, and increased $80.6 million, or 57 percent, compared to the second quarter of 2019. The linked quarter increase was primarily related to increases in salaries and employee benefits and communications and technology expense. The year-over-year increase was primarily due to increases in salaries and employee benefits, communications and technology expense, servicing-related expenses and merger-related expenses. The year-over-year and linked quarter increases in salaries and employee benefits and communication and technology expense were primarily due to the severance accruals and non-recurring software expenses, respectively, discussed above. The year-over-year increase in servicing-related expenses was primarily due to an increase in MSR amortization, resulting primarily from an increase in the cost basis of our MSR asset as well as from higher mortgage prepayment rates, and an increase in impairment expense.
Texas Capital Bank is well capitalized under regulatory guidelines as of June 30, 2020. Our CET 1, tier 1 capital, total capital and leverage ratios were 8.9%, 9.8%, 11.6% and 7.5%, respectively, at June 30, 2020, compared to 9.3%, 10.2%, 12.0% and 8.5%, respectively, at March 31, 2020. At June 30, 2020, our ratio of tangible common equity to total tangible assets was 7.0% percent compared to 7.3% at March 31, 2020.
About Texas Capital Bancshares, Inc.
Texas Capital Bancshares, Inc. (NASDAQ®: TCBI), a member of the Russell 2000® Index and the S&P MidCap 400®, is the parent company of Texas Capital Bank, a commercial bank that delivers highly personalized financial services to businesses and entrepreneurs. Headquartered in Dallas, the bank has full-service locations in Austin, Dallas, Fort Worth, Houston and San Antonio.
Forward Looking Statements
This communication may be deemed to include “forward-looking statements” within the meaning of the Private Securities Litigation Reform Act of 1995 regarding our financial condition, results of operations, business plans and future performance. These statements are not historical in nature and can generally be identified by such words as “believe,” “expect,” “estimate,” “anticipate,” “plan,” “may,” “will,” “forecast,” “could,” “projects,” “intend” and similar expressions. Because forward-looking statements relate to future results and occurrences, they are subject to inherent uncertainties, risks, and changes in circumstances that are difficult to predict. A number of factors, many of which are beyond our control, could cause actual results to differ materially from future results expressed or implied by such forward-looking statements. These risks and uncertainties include, but are not limited to, the credit quality of our loan portfolio, general economic conditions in the United States and in our markets, including the continued impact on our customers from volatility in oil and gas prices, the material risks and uncertainties for the U.S. and world economies, and for our business, resulting from the COVID-19 pandemic, expectations regarding rates of default and credit losses, volatility in the mortgage industry, our business strategies, our expectations about future financial performance, future growth and earnings, the appropriateness of our allowance for credit losses and provision for credit losses, our ability to identify, employ and retain a successor chief executive officer, the impact of changing regulatory requirements and legislative changes on our business, increased competition, interest rate risk, new lines of business, new product or service offerings and new technologies. These and other factors that could cause results to differ materially from those described in the forward-looking statements, as well as a discussion of the risks and uncertainties that may affect our business, can be found in our Annual Report on Form 10-K, our Quarterly Reports on Form 10-Q and in other filings we make with the Securities and Exchange Commission. The information contained in this communication speaks only as of its date. Except to the extent required by applicable law or regulation, we disclaim any obligation to update such factors or to publicly announce the results of any revisions to any of the forward-looking statements included herein to reflect future events or developments.
3
TEXAS CAPITAL BANCSHARES, INC. | |||||||||||||||
SELECTED FINANCIAL HIGHLIGHTS (UNAUDITED) | |||||||||||||||
(Dollars in thousands except per share data) | |||||||||||||||
2nd Quarter | 1st Quarter | 4th Quarter | 3rd Quarter | 2nd Quarter | |||||||||||
2020 | 2020 | 2019 | 2019 | 2019 | |||||||||||
CONSOLIDATED STATEMENTS OF INCOME | |||||||||||||||
Interest income | $ | 252,010 | $ | 306,008 | $ | 337,757 | $ | 355,101 | $ | 346,893 | |||||
Interest expense | 42,082 | 77,689 | 89,372 | 102,933 | 103,340 | ||||||||||
Net interest income | 209,928 | 228,319 | 248,385 | 252,168 | 243,553 | ||||||||||
Provision for credit losses | 100,000 | 96,000 | 17,000 | 11,000 | 27,000 | ||||||||||
Net interest income after provision for credit losses | 109,928 | 132,319 | 231,385 | 241,168 | 216,553 | ||||||||||
Non-interest income | 70,502 | 11,780 | 17,761 | 20,301 | 24,364 | ||||||||||
Non-interest expense | 222,352 | 165,417 | 168,187 | 149,429 | 141,718 | ||||||||||
Income/(loss) before income taxes | (41,922 | ) | (21,318 | ) | 80,959 | 112,040 | 99,199 | ||||||||
Income tax expense/(benefit) | (7,606 | ) | (4,631 | ) | 16,539 | 23,958 | 21,387 | ||||||||
Net income/(loss) | (34,316 | ) | (16,687 | ) | 64,420 | 88,082 | 77,812 | ||||||||
Preferred stock dividends | 2,437 | 2,438 | 2,437 | 2,438 | 2,437 | ||||||||||
Net income/(loss) available to common stockholders | $ | (36,753 | ) | $ | (19,125 | ) | $ | 61,983 | $ | 85,644 | $ | 75,375 | |||
Diluted earnings/(loss) per common share | $ | (0.73 | ) | $ | (0.38 | ) | $ | 1.23 | $ | 1.70 | $ | 1.50 | |||
Diluted common shares | 50,416,331 | 50,474,802 | 50,461,723 | 50,416,402 | 50,383,870 | ||||||||||
CONSOLIDATED BALANCE SHEET DATA | |||||||||||||||
Total assets | $ | 36,613,127 | $ | 35,879,416 | $ | 32,548,069 | $ | 33,526,437 | $ | 29,970,384 | |||||
LHI | 16,552,203 | 16,857,579 | 16,476,413 | 16,772,824 | 16,924,535 | ||||||||||
LHI, mortgage finance | 8,972,626 | 7,588,803 | 8,169,849 | 7,951,432 | 7,415,363 | ||||||||||
LHS | 454,581 | 774,064 | 2,577,134 | 2,674,225 | 1,057,586 | ||||||||||
Liquidity assets(1) | 9,540,044 | 9,498,189 | 4,263,766 | 4,993,185 | 3,480,902 | ||||||||||
Investment securities | 234,969 | 228,784 | 239,871 | 238,022 | 240,851 | ||||||||||
Demand deposits | 10,835,911 | 9,420,303 | 9,438,459 | 10,289,572 | 7,685,340 | ||||||||||
Total deposits | 30,187,695 | 27,134,263 | 26,478,593 | 27,413,303 | 22,999,077 | ||||||||||
Other borrowings | 2,895,790 | 5,195,267 | 2,541,766 | 2,639,967 | 3,607,234 | ||||||||||
Subordinated notes | 282,309 | 282,219 | 282,129 | 282,038 | 281,948 | ||||||||||
Long-term debt | 113,406 | 113,406 | 113,406 | 113,406 | 113,406 | ||||||||||
Stockholders’ equity | 2,734,755 | 2,803,533 | 2,801,321 | 2,735,993 | 2,647,071 | ||||||||||
End of period shares outstanding | 50,435,672 | 50,407,778 | 50,337,741 | 50,317,654 | 50,297,552 | ||||||||||
Book value | $ | 51.25 | $ | 52.64 | $ | 52.67 | $ | 51.39 | $ | 49.65 | |||||
Tangible book value(2) | $ | 50.89 | $ | 52.28 | $ | 52.31 | $ | 51.03 | $ | 49.28 | |||||
SELECTED FINANCIAL RATIOS | |||||||||||||||
Net interest margin | 2.30 | % | 2.78 | % | 2.95 | % | 3.16 | % | 3.41 | % | |||||
Return on average assets | (0.36 | )% | (0.20 | )% | 0.85 | % | 1.06 | % | 1.05 | % | |||||
Return on average common equity | (5.48 | )% | (2.85 | )% | 10.68 | % | 13.22 | % | 12.20 | % | |||||
Non-interest income to average earning assets | 0.77 | % | 0.14 | % | 0.21 | % | 0.25 | % | 0.34 | % | |||||
Efficiency ratio(3) | 79.3 | % | 68.9 | % | 63.2 | % | 54.8 | % | 52.9 | % | |||||
Efficiency ratio, adjusted(4) | 77.5 | % | 65.8 | % | 61.4 | % | 51.3 | % | 49.6 | % | |||||
Non-interest expense to average earning assets | 2.43 | % | 2.00 | % | 1.98 | % | 1.86 | % | 1.98 | % | |||||
Tangible common equity to total tangible assets(5) | 7.0 | % | 7.3 | % | 8.1 | % | 7.6 | % | 8.3 | % | |||||
Common Equity Tier 1 | 8.9 | % | 9.3 | % | 8.9 | % | 8.6 | % | 8.7 | % | |||||
Tier 1 capital | 9.8 | % | 10.2 | % | 9.7 | % | 9.4 | % | 9.6 | % | |||||
Total capital | 11.6 | % | 12.0 | % | 11.4 | % | 11.0 | % | 11.3 | % | |||||
Leverage | 7.5 | % | 8.5 | % | 8.4 | % | 8.6 | % | 9.2 | % | |||||
(1) | Liquidity assets include Federal funds sold and interest-bearing deposits in other banks. |
(2) | Stockholders’ equity excluding preferred stock, less goodwill and intangibles, divided by shares outstanding at period end. |
(3) | Non-interest expense divided by the sum of net interest income and non-interest income. |
(4) | Non-interest expense, excluding deposit-related marketing fees and servicing related expenses, divided by the sum of net interest income and non-interest income, net of deposit-related marketing fees and servicing related expenses. Deposit-related marketing fees totaled $1.7 million, $5.2 million, $9.4 million, $11.9 million and $11.6 million for the second and first quarters of 2020, as well as the fourth, third and second quarters of 2019, respectively. |
(5) | Stockholders’ equity excluding preferred stock and accumulated other comprehensive income, less goodwill and intangibles, divided by total assets, less accumulated other comprehensive income and goodwill and intangibles. |
4
TEXAS CAPITAL BANCSHARES, INC. | ||||||||
CONSOLIDATED BALANCE SHEETS (UNAUDITED) | ||||||||
(Dollars in thousands) | ||||||||
June 30, 2020 | June 30, 2019 | % Change | ||||||
Assets | ||||||||
Cash and due from banks | $ | 176,540 | $ | 163,675 | 8 | % | ||
Interest-bearing deposits | 9,490,044 | 3,446,902 | 175 | % | ||||
Federal funds sold and securities purchased under resale agreements | 50,000 | 34,000 | 47 | % | ||||
Securities, available-for-sale | 234,969 | 240,851 | (2 | )% | ||||
LHS, at fair value ($454.6 million at June 30, 2020 and $1,056.5 million at June 30, 2019) | 454,581 | 1,057,586 | (57 | )% | ||||
LHI, mortgage finance | 8,972,626 | 7,415,363 | 21 | % | ||||
LHI (net of unearned income) | 16,552,203 | 16,924,535 | (2 | )% | ||||
Less: Allowance for credit losses on loans | 264,722 | 214,572 | 23 | % | ||||
LHI, net | 25,260,107 | 24,125,326 | 5 | % | ||||
Mortgage servicing rights, net | 75,451 | 47,785 | 58 | % | ||||
Premises and equipment, net | 28,603 | 28,197 | 1 | % | ||||
Accrued interest receivable and other assets | 824,963 | 807,728 | 2 | % | ||||
Goodwill and intangibles, net | 17,869 | 18,334 | (3 | )% | ||||
Total assets | $ | 36,613,127 | $ | 29,970,384 | 22 | % | ||
Liabilities and Stockholders’ Equity | ||||||||
Liabilities: | ||||||||
Deposits: | ||||||||
Non-interest bearing | $ | 10,835,911 | $ | 7,685,340 | 41 | % | ||
Interest bearing | 19,351,784 | 15,313,737 | 26 | % | ||||
Total deposits | 30,187,695 | 22,999,077 | 31 | % | ||||
Accrued interest payable | 20,314 | 23,115 | (12 | )% | ||||
Other liabilities | 372,145 | 276,432 | 35 | % | ||||
Federal funds purchased and repurchase agreements | 195,790 | 507,234 | (61 | )% | ||||
Other borrowings | 2,700,000 | 3,100,000 | (13 | )% | ||||
Subordinated notes, net | 282,309 | 281,948 | — | % | ||||
Trust preferred subordinated debentures | 113,406 | 113,406 | — | % | ||||
Total liabilities | 33,871,659 | 27,301,212 | 24 | % | ||||
Redeemable non-controlling interest | 6,713 | 22,101 | (70 | )% | ||||
Stockholders’ equity: | ||||||||
Preferred stock, $.01 par value, $1,000 liquidation value: | ||||||||
Authorized shares - 10,000,000 | ||||||||
Issued shares - 6,000,000 shares issued at June 30, 2020 and 2019 | 150,000 | 150,000 | — | % | ||||
Common stock, $.01 par value: | ||||||||
Authorized shares - 100,000,000 | ||||||||
Issued shares - 50,436,089 and 50,297,969 at June 30, 2020 and 2019, respectively | 504 | 503 | — | % | ||||
Additional paid-in capital | 983,144 | 972,219 | 1 | % | ||||
Retained earnings | 1,600,639 | 1,516,044 | 6 | % | ||||
Treasury stock (shares at cost: 417 at June 30, 2020 and 2019) | (8 | ) | (8 | ) | — | % | ||
Accumulated other comprehensive income, net of taxes | 476 | 8,313 | N/M | |||||
Total stockholders’ equity | 2,734,755 | 2,647,071 | 3 | % | ||||
Total liabilities and stockholders’ equity | $ | 36,613,127 | $ | 29,970,384 | 22 | % | ||
5
TEXAS CAPITAL BANCSHARES, INC. | ||||||||||||
CONSOLIDATED STATEMENTS OF INCOME (UNAUDITED) | ||||||||||||
(Dollars in thousands except per share data) | ||||||||||||
Three Months Ended June 30, | Six Months Ended June 30, | |||||||||||
2020 | 2019 | 2020 | 2019 | |||||||||
Interest income | ||||||||||||
Interest and fees on loans | $ | 247,595 | $ | 329,842 | $ | 531,220 | $ | 642,545 | ||||
Investment securities | 2,024 | 2,260 | 4,207 | 3,720 | ||||||||
Federal funds sold and securities purchased under resale agreements | 77 | 157 | 691 | 536 | ||||||||
Interest-bearing deposits in other banks | 2,314 | 14,634 | 21,900 | 25,653 | ||||||||
Total interest income | 252,010 | 346,893 | 558,018 | 672,454 | ||||||||
Interest expense | ||||||||||||
Deposits | 32,294 | 72,529 | 94,468 | 141,583 | ||||||||
Federal funds purchased | 176 | 5,202 | 845 | 8,718 | ||||||||
Other borrowings | 4,569 | 20,124 | 14,151 | 31,978 | ||||||||
Subordinated notes | 4,191 | 4,191 | 8,382 | 8,382 | ||||||||
Trust preferred subordinated debentures | 852 | 1,294 | 1,925 | 2,626 | ||||||||
Total interest expense | 42,082 | 103,340 | 119,771 | 193,287 | ||||||||
Net interest income | 209,928 | 243,553 | 438,247 | 479,167 | ||||||||
Provision for credit losses | 100,000 | 27,000 | 196,000 | 47,000 | ||||||||
Net interest income after provision for credit losses | 109,928 | 216,553 | 242,247 | 432,167 | ||||||||
Non-interest income | ||||||||||||
Service charges on deposit accounts | 2,459 | 2,849 | 5,752 | 5,828 | ||||||||
Wealth management and trust fee income | 2,348 | 2,129 | 4,815 | 4,138 | ||||||||
Brokered loan fees | 10,764 | 7,336 | 18,779 | 12,402 | ||||||||
Servicing income | 6,120 | 3,126 | 10,866 | 5,860 | ||||||||
Swap fees | 1,468 | 601 | 4,225 | 1,632 | ||||||||
Net gain/(loss) on sale of LHS | 39,023 | (5,986 | ) | 26,023 | (6,491 | ) | ||||||
Other | 8,320 | 14,309 | 11,822 | 31,009 | ||||||||
Total non-interest income | 70,502 | 24,364 | 82,282 | 54,378 | ||||||||
Non-interest expense | ||||||||||||
Salaries and employee benefits | 100,255 | 76,889 | 176,922 | 154,712 | ||||||||
Net occupancy expense | 9,134 | 7,910 | 17,846 | 15,789 | ||||||||
Marketing | 7,988 | 14,087 | 16,510 | 25,795 | ||||||||
Legal and professional | 11,330 | 10,004 | 28,796 | 20,034 | ||||||||
Communications and technology | 42,760 | 11,022 | 56,551 | 20,220 | ||||||||
FDIC insurance assessment | 7,140 | 4,138 | 12,989 | 9,260 | ||||||||
Servicing-related expenses | 20,117 | 6,066 | 36,471 | 11,448 | ||||||||
Merger-related expenses | 10,486 | — | 17,756 | — | ||||||||
Other | 13,142 | 11,602 | 23,928 | 25,976 | ||||||||
Total non-interest expense | 222,352 | 141,718 | 387,769 | 283,234 | ||||||||
Income/(loss) before income taxes | (41,922 | ) | 99,199 | (63,240 | ) | 203,311 | ||||||
Income tax expense/(benefit) | (7,606 | ) | 21,387 | (12,237 | ) | 43,798 | ||||||
Net income/(loss) | (34,316 | ) | 77,812 | (51,003 | ) | 159,513 | ||||||
Preferred stock dividends | 2,437 | 2,437 | 4,875 | 4,875 | ||||||||
Net income/(loss) available to common stockholders | $ | (36,753 | ) | $ | 75,375 | $ | (55,878 | ) | $ | 154,638 | ||
Basic earnings/(loss) per common share | $ | (0.73 | ) | $ | 1.50 | $ | (1.11 | ) | $ | 3.07 | ||
Diluted earnings/(loss) per common share | $ | (0.73 | ) | $ | 1.50 | $ | (1.11 | ) | $ | 3.07 | ||
6
TEXAS CAPITAL BANCSHARES, INC. | |||||||||||||||
SUMMARY OF CREDIT LOSS EXPERIENCE | |||||||||||||||
(Dollars in thousands) | |||||||||||||||
2nd Quarter | 1st Quarter | 4th Quarter | 3rd Quarter | 2nd Quarter | |||||||||||
2020 | 2020 | 2019 | 2019 | 2019 | |||||||||||
Allowance for credit losses on loans: | |||||||||||||||
Beginning balance | $ | 240,958 | $ | 195,047 | $ | 190,138 | $ | 214,572 | $ | 208,573 | |||||
Impact of CECL adoption | — | 8,585 | — | — | — | ||||||||||
Loans charged-off: | |||||||||||||||
Commercial | 12,287 | 20,653 | 13,968 | 21,124 | 4,880 | ||||||||||
Energy | 62,368 | 37,730 | 797 | 16,655 | 15,173 | ||||||||||
Real estate | — | — | — | — | 177 | ||||||||||
Total charge-offs | 74,655 | 58,383 | 14,765 | 37,779 | 20,230 | ||||||||||
Recoveries: | |||||||||||||||
Commercial | 513 | 257 | 1,754 | 799 | 224 | ||||||||||
Energy | — | 423 | 209 | 107 | — | ||||||||||
Total recoveries | 513 | 680 | 1,963 | 906 | 224 | ||||||||||
Net charge-offs | 74,142 | 57,703 | 12,802 | 36,873 | 20,006 | ||||||||||
Provision for credit losses on loans | 97,906 | 95,029 | 17,711 | 12,439 | 26,005 | ||||||||||
Ending balance | $ | 264,722 | $ | 240,958 | $ | 195,047 | $ | 190,138 | $ | 214,572 | |||||
Allowance for off-balance sheet credit losses: | |||||||||||||||
Beginning balance | $ | 10,174 | $ | 8,640 | $ | 9,351 | $ | 10,790 | $ | 9,795 | |||||
Impact of CECL adoption | — | 563 | — | — | — | ||||||||||
Provision for off-balance sheet credit losses | 2,094 | 971 | (711 | ) | (1,439 | ) | 995 | ||||||||
Ending balance | $ | 12,268 | $ | 10,174 | $ | 8,640 | $ | 9,351 | $ | 10,790 | |||||
Total allowance for credit losses | $ | 276,990 | $ | 251,132 | $ | 203,687 | $ | 199,489 | $ | 225,362 | |||||
Total provision for credit losses | $ | 100,000 | $ | 96,000 | $ | 17,000 | $ | 11,000 | $ | 27,000 | |||||
Allowance for credit losses on loans to LHI | 1.04 | % | 0.99 | % | 0.79 | % | 0.77 | % | 0.88 | % | |||||
Allowance for credit losses on loans to average LHI | 1.03 | % | 1.02 | % | 0.79 | % | 0.76 | % | 0.90 | % | |||||
Net charge-offs to average LHI(1) | 1.16 | % | 0.98 | % | 0.21 | % | 0.58 | % | 0.34 | % | |||||
Net charge-offs to average LHI for last twelve months(1) | 0.73 | % | 0.53 | % | 0.31 | % | 0.41 | % | 0.27 | % | |||||
Total provision for credit losses to average LHI(1) | 1.57 | % | 1.63 | % | 0.27 | % | 0.17 | % | 0.45 | % | |||||
Total allowance for credit losses to LHI | 1.09 | % | 1.03 | % | 0.83 | % | 0.81 | % | 0.93 | % | |||||
(1) | Interim period ratios are annualized. |
7
TEXAS CAPITAL BANCSHARES, INC. | |||||||||||||||
SUMMARY OF NON-PERFORMING ASSETS AND PAST DUE LOANS | |||||||||||||||
(Dollars in thousands) | |||||||||||||||
2nd Quarter | 1st Quarter | 4th Quarter | 3rd Quarter | 2nd Quarter | |||||||||||
2020 | 2020 | 2019 | 2019 | 2019 | |||||||||||
Non-performing assets (NPAs): | |||||||||||||||
Non-accrual loans | $ | 174,031 | $ | 219,165 | $ | 225,384 | $ | 120,686 | $ | 114,084 | |||||
Other real estate owned (OREO) | — | — | — | — | — | ||||||||||
Total LHI NPAs | $ | 174,031 | $ | 219,165 | $ | 225,384 | $ | 120,686 | $ | 114,084 | |||||
Non-accrual loans to LHI | 0.68 | % | 0.90 | % | 0.91 | % | 0.49 | % | 0.47 | % | |||||
Total LHI NPAs to LHI plus OREO | 0.68 | % | 0.90 | % | 0.91 | % | 0.49 | % | 0.47 | % | |||||
Total LHI NPAs to earning assets | 0.49 | % | 0.63 | % | 0.71 | % | 0.37 | % | 0.39 | % | |||||
Allowance for credit losses on loans to non-accrual loans | 1.5x | 1.1x | .9x | 1.6x | 1.9x | ||||||||||
LHI past due 90 days and still accruing(1) | $ | 21,079 | $ | 21,274 | $ | 17,584 | $ | 29,648 | $ | 15,212 | |||||
LHI past due 90 days to LHI | 0.08 | % | 0.09 | % | 0.07 | % | 0.12 | % | 0.06 | % | |||||
LHS past due 90 days and still accruing(2) | $ | 10,152 | $ | 9,014 | $ | 8,207 | $ | 9,187 | $ | 11,665 | |||||
(1) | At June 30, 2020, loans past due 90 days and still accruing includes premium finance loans of $14.8 million. These loans are primarily secured by obligations of insurance carriers to refund premiums on canceled insurance policies. The refund of premiums from the insurance carriers can take 180 days or longer from the cancellation date. |
(2) | Includes loans guaranteed by U.S. government agencies that were repurchased out of Ginnie Mae securities. Loans are recorded as LHS and carried at fair value on the balance sheet. Interest on these past due loans accrues at the debenture rate guaranteed by the U.S. government. Also includes loans that, pursuant to Ginnie Mae servicing guidelines, we have the unilateral right, but not obligation, to repurchase and thus must record as LHS on our balance sheet regardless of whether the repurchase option has been exercised. |
8
TEXAS CAPITAL BANCSHARES, INC. | |||||||||||||||
CONSOLIDATED STATEMENTS OF INCOME (UNAUDITED) | |||||||||||||||
(Dollars in thousands) | |||||||||||||||
2nd Quarter | 1st Quarter | 4th Quarter | 3rd Quarter | 2nd Quarter | |||||||||||
2020 | 2020 | 2019 | 2019 | 2019 | |||||||||||
Interest income | |||||||||||||||
Interest and fees on loans | $ | 247,595 | $ | 283,625 | $ | 312,147 | $ | 329,344 | $ | 329,842 | |||||
Investment securities | 2,024 | 2,183 | 2,618 | 2,316 | 2,260 | ||||||||||
Federal funds sold and securities purchased under resale agreements | 77 | 614 | 439 | 554 | 157 | ||||||||||
Interest-bearing deposits in other banks | 2,314 | 19,586 | 22,553 | 22,887 | 14,634 | ||||||||||
Total interest income | 252,010 | 306,008 | 337,757 | 355,101 | 346,893 | ||||||||||
Interest expense | |||||||||||||||
Deposits | 32,294 | 62,174 | 70,987 | 80,967 | 72,529 | ||||||||||
Federal funds purchased | 176 | 669 | 1,319 | 1,835 | 5,202 | ||||||||||
Other borrowings | 4,569 | 9,582 | 11,712 | 14,703 | 20,124 | ||||||||||
Subordinated notes | 4,191 | 4,191 | 4,191 | 4,191 | 4,191 | ||||||||||
Trust preferred subordinated debentures | 852 | 1,073 | 1,163 | 1,237 | 1,294 | ||||||||||
Total interest expense | 42,082 | 77,689 | 89,372 | 102,933 | 103,340 | ||||||||||
Net interest income | 209,928 | 228,319 | 248,385 | 252,168 | 243,553 | ||||||||||
Provision for credit losses | 100,000 | 96,000 | 17,000 | 11,000 | 27,000 | ||||||||||
Net interest income after provision for credit losses | 109,928 | 132,319 | 231,385 | 241,168 | 216,553 | ||||||||||
Non-interest income | |||||||||||||||
Service charges on deposit accounts | 2,459 | 3,293 | 2,785 | 2,707 | 2,849 | ||||||||||
Wealth management and trust fee income | 2,348 | 2,467 | 2,342 | 2,330 | 2,129 | ||||||||||
Brokered loan fees | 10,764 | 8,015 | 8,645 | 8,691 | 7,336 | ||||||||||
Servicing income | 6,120 | 4,746 | 4,030 | 3,549 | 3,126 | ||||||||||
Swap fees | 1,468 | 2,757 | 1,559 | 1,196 | 601 | ||||||||||
Net gain/(loss) on sale of LHS | 39,023 | (13,000 | ) | (7,757 | ) | (6,011 | ) | (5,986 | ) | ||||||
Other | 8,320 | 3,502 | 6,157 | 7,839 | 14,309 | ||||||||||
Total non-interest income | 70,502 | 11,780 | 17,761 | 20,301 | 24,364 | ||||||||||
Non-interest expense | |||||||||||||||
Salaries and employee benefits | 100,255 | 76,667 | 80,262 | 80,106 | 76,889 | ||||||||||
Net occupancy expense | 9,134 | 8,712 | 9,075 | 8,125 | 7,910 | ||||||||||
Marketing | 7,988 | 8,522 | 12,807 | 14,753 | 14,087 | ||||||||||
Legal and professional | 11,330 | 17,466 | 21,032 | 11,394 | 10,004 | ||||||||||
Communications and technology | 42,760 | 13,791 | 13,801 | 10,805 | 11,022 | ||||||||||
FDIC insurance assessment | 7,140 | 5,849 | 5,613 | 5,220 | 4,138 | ||||||||||
Servicing-related expenses | 20,117 | 16,354 | 2,960 | 8,165 | 6,066 | ||||||||||
Merger-related expenses | 10,486 | 7,270 | 1,370 | — | — | ||||||||||
Other | 13,142 | 10,786 | 21,267 | 10,861 | 11,602 | ||||||||||
Total non-interest expense | 222,352 | 165,417 | 168,187 | 149,429 | 141,718 | ||||||||||
Income/(loss) before income taxes | (41,922 | ) | (21,318 | ) | 80,959 | 112,040 | 99,199 | ||||||||
Income tax expense/(benefit) | (7,606 | ) | (4,631 | ) | 16,539 | 23,958 | 21,387 | ||||||||
Net income/(loss) | (34,316 | ) | (16,687 | ) | 64,420 | 88,082 | 77,812 | ||||||||
Preferred stock dividends | 2,437 | 2,438 | 2,437 | 2,438 | 2,437 | ||||||||||
Net income/(loss) available to common shareholders | $ | (36,753 | ) | $ | (19,125 | ) | $ | 61,983 | $ | 85,644 | $ | 75,375 | |||
9
TEXAS CAPITAL BANCSHARES, INC. | ||||||||||||||||||||||||||||||||||||||||||||
QUARTERLY FINANCIAL SUMMARY - UNAUDITED | ||||||||||||||||||||||||||||||||||||||||||||
Consolidated Daily Average Balances, Average Yields and Rates | ||||||||||||||||||||||||||||||||||||||||||||
(Dollars in thousands) | ||||||||||||||||||||||||||||||||||||||||||||
2nd Quarter 2020 | 1st Quarter 2020 | 4th Quarter 2019 | 3rd Quarter 2019 | 2nd Quarter 2019 | ||||||||||||||||||||||||||||||||||||||||
Average Balance | Revenue/ Expense | Yield/ Rate | Average Balance | Revenue/ Expense | Yield/ Rate | Average Balance | Revenue/ Expense | Yield/ Rate | Average Balance | Revenue/ Expense | Yield/ Rate | Average Balance | Revenue/ Expense | Yield/ Rate | ||||||||||||||||||||||||||||||
Assets | ||||||||||||||||||||||||||||||||||||||||||||
Investment securities - Taxable | $ | 38,829 | $ | 185 | 1.92 | % | $ | 42,799 | $ | 274 | 2.57 | % | $ | 40,904 | $ | 693 | 6.72 | % | $ | 39,744 | $ | 357 | 3.56 | % | $ | 38,887 | $ | 287 | 2.96 | % | ||||||||||||||
Investment securities - Non-taxable(2) | 195,806 | 2,327 | 4.78 | % | 195,578 | 2,417 | 4.97 | % | 197,591 | 2,437 | 4.89 | % | 200,090 | 2,480 | 4.92 | % | 192,115 | 2,498 | 5.21 | % | ||||||||||||||||||||||||
Federal funds sold and securities purchased under resale agreements | 245,434 | 77 | 0.13 | % | 199,727 | 614 | 1.24 | % | 102,320 | 439 | 1.70 | % | 100,657 | 554 | 2.18 | % | 28,436 | 157 | 2.22 | % | ||||||||||||||||||||||||
Interest-bearing deposits in other banks | 10,521,240 | 2,314 | 0.09 | % | 6,225,948 | 19,586 | 1.27 | % | 5,387,000 | 22,553 | 1.66 | % | 4,184,217 | 22,887 | 2.17 | % | 2,491,827 | 14,634 | 2.36 | % | ||||||||||||||||||||||||
LHS, at fair value | 380,624 | 2,547 | 2.69 | % | 3,136,381 | 27,480 | 3.52 | % | 3,567,836 | 33,411 | 3.72 | % | 2,555,269 | 26,206 | 4.07 | % | 2,494,883 | 27,607 | 4.44 | % | ||||||||||||||||||||||||
LHI, mortgage finance loans | 8,676,521 | 74,518 | 3.45 | % | 7,054,682 | 55,324 | 3.15 | % | 7,870,888 | 63,114 | 3.18 | % | 8,118,025 | 68,660 | 3.36 | % | 7,032,963 | 63,523 | 3.62 | % | ||||||||||||||||||||||||
LHI(1)(2) | 17,015,041 | 170,970 | 4.04 | % | 16,598,775 | 201,781 | 4.89 | % | 16,667,259 | 216,686 | 5.16 | % | 16,901,391 | 235,557 | 5.53 | % | 16,781,733 | 239,829 | 5.73 | % | ||||||||||||||||||||||||
Less allowance for credit losses on loans | 236,823 | — | — | 201,837 | — | — | 189,353 | — | — | 212,898 | — | — | 206,654 | — | — | |||||||||||||||||||||||||||||
LHI, net of allowance | 25,454,739 | 245,488 | 3.88 | % | 23,451,620 | 257,105 | 4.41 | % | 24,348,794 | 279,800 | 4.56 | % | 24,806,518 | 304,217 | 4.87 | % | 23,608,042 | 303,352 | 5.15 | % | ||||||||||||||||||||||||
Total earning assets | 36,836,672 | 252,938 | 2.76 | % | 33,252,053 | 307,476 | 3.72 | % | 33,644,445 | 339,333 | 4.00 | % | 31,886,495 | 356,701 | 4.44 | % | 28,854,190 | 348,535 | 4.84 | % | ||||||||||||||||||||||||
Cash and other assets | 1,075,864 | 976,520 | 974,866 | 1,000,117 | 940,793 | |||||||||||||||||||||||||||||||||||||||
Total assets | $ | 37,912,536 | $ | 34,228,573 | $ | 34,619,311 | $ | 32,886,612 | $ | 29,794,983 | ||||||||||||||||||||||||||||||||||
Liabilities and Stockholders’ Equity | ||||||||||||||||||||||||||||||||||||||||||||
Transaction deposits | $ | 3,923,966 | $ | 5,998 | 0.61 | % | $ | 3,773,067 | $ | 13,582 | 1.45 | % | $ | 3,817,294 | $ | 16,428 | 1.71 | % | $ | 3,577,905 | $ | 18,442 | 2.04 | % | $ | 3,475,404 | $ | 18,037 | 2.08 | % | ||||||||||||||
Savings deposits | 12,537,467 | 13,510 | 0.43 | % | 11,069,429 | 35,961 | 1.31 | % | 11,111,326 | 40,603 | 1.45 | % | 10,331,078 | 45,586 | 1.75 | % | 8,896,537 | 40,994 | 1.85 | % | ||||||||||||||||||||||||
Time deposits | 3,434,388 | 12,786 | 1.50 | % | 2,842,535 | 12,631 | 1.79 | % | 2,453,655 | 13,956 | 2.26 | % | 2,706,434 | 16,939 | 2.48 | % | 2,227,460 | 13,498 | 2.43 | % | ||||||||||||||||||||||||
Total interest bearing deposits | 19,895,821 | 32,294 | 0.65 | % | 17,685,031 | 62,174 | 1.41 | % | 17,382,275 | 70,987 | 1.62 | % | 16,615,417 | 80,967 | 1.93 | % | 14,599,401 | 72,529 | 1.99 | % | ||||||||||||||||||||||||
Other borrowings | 3,612,263 | 4,745 | 0.53 | % | 3,020,255 | 10,251 | 1.37 | % | 2,822,465 | 13,031 | 1.83 | % | 2,896,477 | 16,538 | 2.27 | % | 4,018,231 | 25,326 | 2.53 | % | ||||||||||||||||||||||||
Subordinated notes | 282,252 | 4,191 | 5.97 | % | 282,165 | 4,191 | 5.97 | % | 282,074 | 4,191 | 5.89 | % | 281,979 | 4,191 | 5.90 | % | 281,889 | 4,191 | 5.96 | % | ||||||||||||||||||||||||
Trust preferred subordinated debentures | 113,406 | 852 | 3.02 | % | 113,406 | 1,073 | 3.80 | % | 113,406 | 1,163 | 4.07 | % | 113,406 | 1,237 | 4.33 | % | 113,406 | 1,294 | 4.58 | % | ||||||||||||||||||||||||
Total interest bearing liabilities | 23,903,742 | 42,082 | 0.71 | % | 21,100,857 | 77,689 | 1.48 | % | 20,600,220 | 89,372 | 1.72 | % | 19,907,279 | 102,933 | 2.05 | % | 19,012,927 | 103,340 | 2.18 | % | ||||||||||||||||||||||||
Demand deposits | 10,865,896 | 10,003,495 | 10,933,887 | 9,992,406 | 7,929,266 | |||||||||||||||||||||||||||||||||||||||
Other liabilities | 293,698 | 270,868 | 278,964 | 264,506 | 220,305 | |||||||||||||||||||||||||||||||||||||||
Stockholders’ equity | 2,849,200 | 2,853,353 | 2,806,240 | 2,722,421 | 2,632,485 | |||||||||||||||||||||||||||||||||||||||
Total liabilities and stockholders’ equity | $ | 37,912,536 | $ | 34,228,573 | $ | 34,619,311 | $ | 32,886,612 | $ | 29,794,983 | ||||||||||||||||||||||||||||||||||
Net interest income(2) | $ | 210,856 | $ | 229,787 | $ | 249,961 | $ | 253,768 | $ | 245,195 | ||||||||||||||||||||||||||||||||||
Net interest margin | 2.30 | % | 2.78 | % | 2.95 | % | 3.16 | % | 3.41 | % | ||||||||||||||||||||||||||||||||||
(1) | The loan averages include loans on which the accrual of interest has been discontinued and are stated net of unearned income. |
(2) | Taxable equivalent rates used where applicable. |
10