TC Energy Corporation
2025 Annual Information Form
February 12, 2026
Contents
| | | | | |
| |
| |
| |
| |
| |
| BUSINESS OF TC ENERGY | |
| |
| |
| Power and Energy Solutions | |
Discontinued Operations | |
| |
| |
Health, safety, sustainability and environmental protection governance and social policies | |
| |
| |
| |
| |
| |
| |
| |
| Fitch | |
DBRS | |
| |
| |
| |
| |
| |
| |
| |
| |
| |
| |
| |
| |
| |
| |
| |
| |
| |
| |
| |
| |
| |
TC Energy Annual Information Form 2025 | 1
Presentation of information
Throughout this Annual Information Form (AIF), the terms, we, us, our, the Company and TC Energy mean TC Energy Corporation and its subsidiaries. In particular, TC Energy includes references to TransCanada PipeLines Limited (TCPL). The term subsidiary, when referred to in this AIF, with reference to TC Energy means direct and indirect wholly-owned subsidiaries of, and legal entities controlled by, TC Energy or TCPL, as applicable.
Unless otherwise noted, the information contained in this AIF is given at or for the year ended December 31, 2025 (Year End). Amounts are expressed in Canadian dollars, unless otherwise indicated. Information in relation to metric conversion can
be found at Schedule A to this AIF. The Glossary found at the end of this AIF contains certain terms defined throughout this
AIF and abbreviations and acronyms that may not otherwise be defined in this document.
Certain portions of TC Energy's Management's Discussion and Analysis dated February 12, 2026 (MD&A) are incorporated by reference into this AIF as stated below and noted elsewhere in this AIF. The MD&A can be found on SEDAR+ (www.sedarplus.ca) under TC Energy's profile.
Financial information is presented in accordance with United States (U.S.) generally accepted accounting principles (GAAP).
2 | TC Energy Annual Information Form 2025
Forward-looking information
This AIF, including the MD&A disclosure incorporated by reference herein, contains certain information that is forward-looking and is subject to important risks and uncertainties. We disclose forward-looking information to help the reader understand management’s assessment of our future plans and financial outlook and our future prospects overall.
Statements that are forward looking are based on certain assumptions and on what we know and expect today and generally include words like anticipate, expect, believe, may, will, should, estimate or other similar words.
Forward-looking statements included or incorporated by reference in this AIF include information about the following,
among other things:
•our financial and operational performance, including the performance of our subsidiaries
•expectations about strategies and goals for growth and expansion, including acquisitions
•expected cash flows and future financing options available along with portfolio management
•expectations regarding the size, structure, timing, conditions and outcome of ongoing and future transactions
•expected dividend growth
•expected access to and cost of capital
•expected energy demand levels
•expected costs and schedules for planned projects, including projects under construction and in development
•expected capital expenditures, contractual obligations, commitments and contingent liabilities, including
environmental remediation costs
•expected regulatory processes and outcomes
•expected outcomes with respect to legal proceedings, including arbitration and insurance claims
•expected impact of future tax and accounting changes
•commitments and targets contained in our Report on Sustainability, including statements related to our GHG emissions reduction targets, such as our methane emissions intensity target
•expected industry, market and economic conditions, and ongoing trade negotiations, including their impact
on our customers and suppliers.
Forward-looking statements do not guarantee future performance. Actual events and results could be significantly different because of assumptions, risks or uncertainties related to our business or events that happen after the date of this AIF.
Our forward-looking information is based on the following key assumptions and subject to the following risks and uncertainties:
Assumptions
•realization of expected impacts from acquisitions and divestitures
•regulatory decisions and outcomes
•planned and unplanned outages and the utilization of our pipelines, power and storage assets
•integrity and reliability of our assets
•anticipated construction costs, schedules and completion dates
•access to capital markets, including portfolio management
•expected industry, market and economic conditions, including the impact of these on our
customers and suppliers
•inflation rates, commodity and labour prices
•interest, tax and foreign exchange rates
•nature and scope of hedging.
TC Energy Annual Information Form 2025 | 3
Risks and uncertainties
•realization of expected impacts from acquisitions and divestitures
•our ability to successfully implement our strategic priorities, and whether they will yield the expected benefits
•our ability to implement a capital allocation strategy aligned with maximizing shareholder value
•operating performance of our pipelines, power generation and storage assets
•amount of capacity sold and rates achieved in our pipeline businesses
•amount of capacity payments and revenues from power generation assets due to plant availability
•production levels within supply basins
•construction and completion of capital projects
•cost, availability of, and inflationary pressures on, labour, equipment and materials
•availability and market prices of commodities
•access to capital markets on competitive terms
•interest, tax and foreign exchange rates
•performance and credit risk of our counterparties
•regulatory decisions and outcomes of legal proceedings, including arbitration and insurance claims
•our ability to effectively anticipate and assess changes to government policies and regulations,
including those related to the environment
•our ability to realize the value of tangible assets and contractual recoveries
•competition in the businesses in which we operate
•unexpected or unusual weather
•acts of civil disobedience
•cybersecurity and technological developments
•sustainability-related risks including climate-related risks and the impact of energy transition on our business
•economic and political conditions, and ongoing trade negotiations in North America, as well as globally
•global health crises, such as pandemics and epidemics, and the impacts related thereto.
You can read more about these factors and others in the MD&A and in other reports we have filed with Canadian securities regulators and the SEC.
As actual results could vary significantly from the forward-looking information, you should not put undue reliance
on forward-looking information and should not use future-oriented information or financial outlooks for anything other
than their intended purpose. We do not update our forward-looking statements due to new information or future events
unless we are required to by law.
4 | TC Energy Annual Information Form 2025
TC Energy Corporation
CORPORATE STRUCTURE
Our head office and registered office are located at 450 – 1 Street S.W., Calgary, Alberta, T2P 5H1. TC Energy was incorporated pursuant to the provisions of the Canada Business Corporations Act (CBCA) on February 25, 2003 in connection with a plan of arrangement with TCPL (Arrangement), which established TC Energy as the parent company of TCPL. The Arrangement was approved by TCPL common shareholders on April 25, 2003 and, following court approval and the filing of Articles of Arrangement, the Arrangement became effective on May 15, 2003. TCPL continues to carry on business as the principal operating subsidiary of TC Energy. TC Energy does not hold any material assets directly other than the common shares of TCPL and receivables from certain of TC Energy's subsidiaries.
On October 1, 2024, TC Energy separated into two independent, publicly listed companies through the spinoff of its Liquids Pipelines business into South Bow Corporation (South Bow) by way of a plan of arrangement under the CBCA (the Spinoff Transaction). In connection with the Spinoff Transaction, TC Energy restated its Articles of Incorporation on October 1, 2024 to effectively consolidate previous amendments made to its articles which provided for the issuance of various series of preferred shares.
INTERCORPORATE RELATIONSHIPS
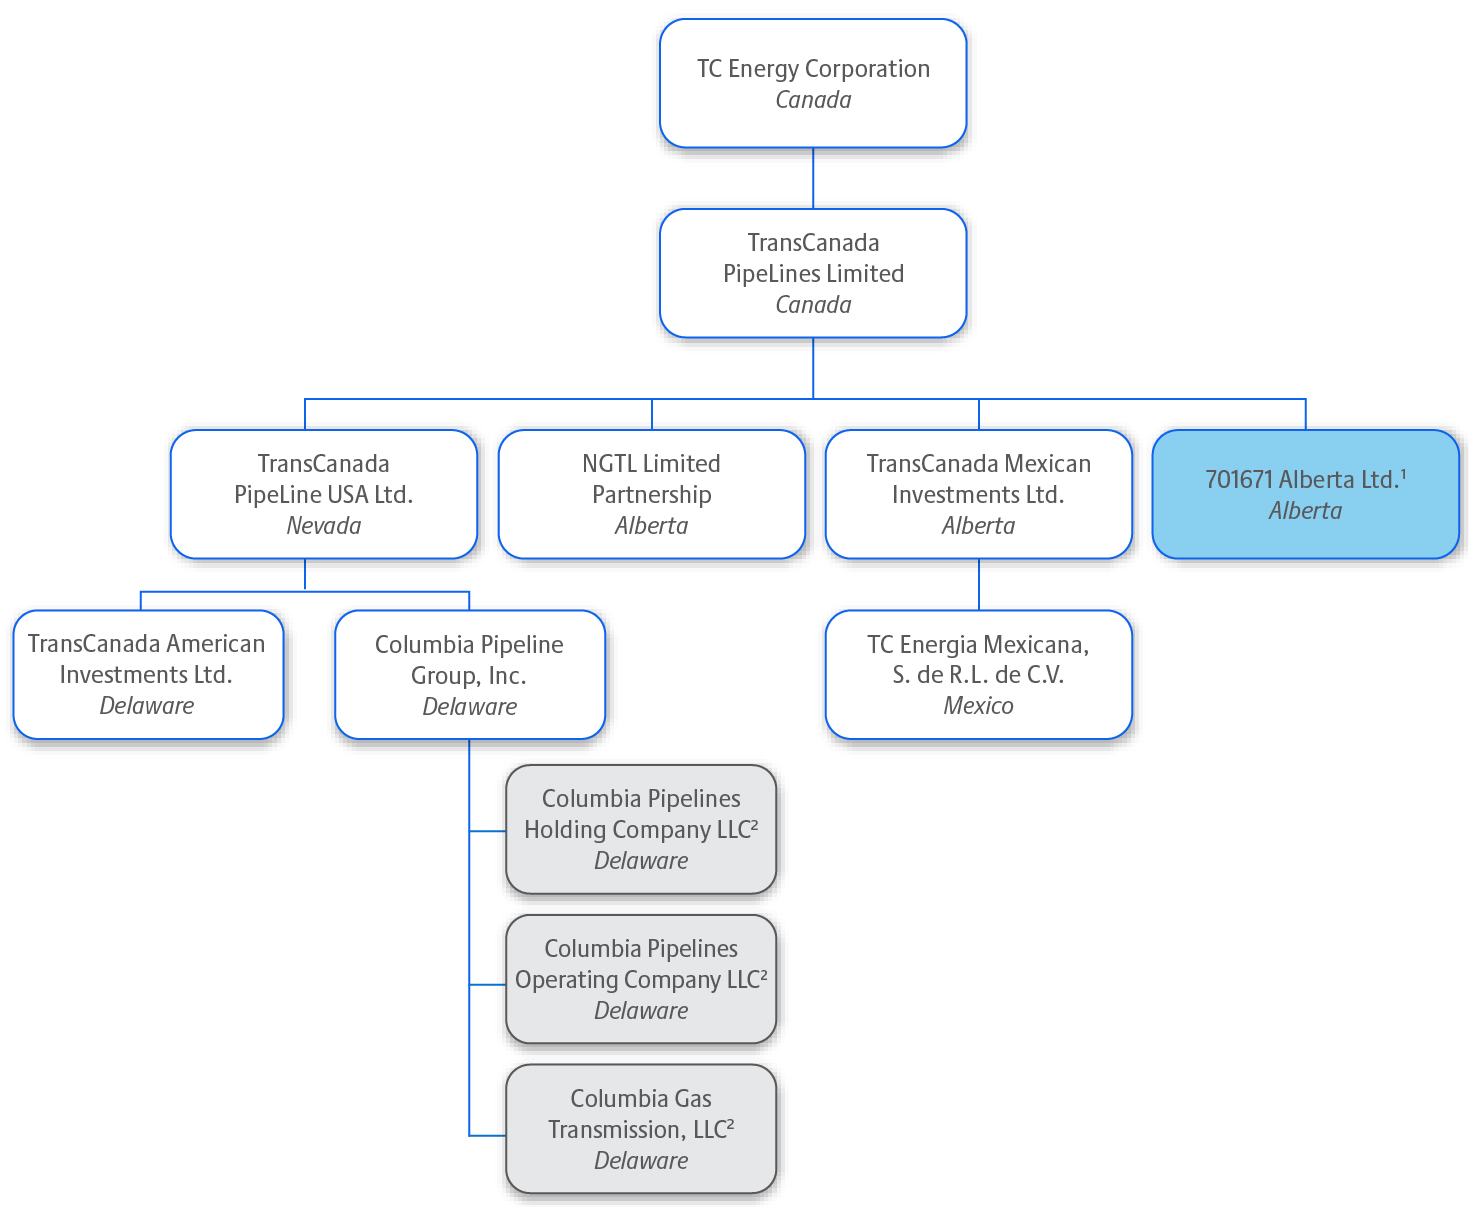
The following diagram presents the name and jurisdiction of incorporation, continuance or formation of TC Energy’s principal subsidiaries as at Year End. Each of the subsidiaries shown has total assets that exceeded 10 per cent of the consolidated assets
of TC Energy as at Year End or revenues that exceeded 10 per cent of the consolidated revenues of TC Energy as at Year End. Except as otherwise indicated below, TC Energy beneficially owns, controls or directs, directly or indirectly, 100 per cent of the voting shares or units in each of these subsidiaries.
| | |
TC Energy Corporation Canada TransCanada PipeLines Limited Canada TransCanada PipeLine USA Ltd. Nevada TransCanada American Investments Ltd. Delaware Columbia Pipeline Group, Inc. Delaware Columbia Pipelines Holding Company, LLC2 Delaware Columbia Pipelines Operating Company, LLC2 Delaware Columbia Gas Transmission, LLC2 Delaware 15142083 Canada Ltd. Canada 6297782 LLC Delaware TransCanada Oil Pipelines Inc. Delaware 701671 Alberta Ltd.1 Alberta TransCanada Mexican Investments Ltd.1 Alberta |
The above diagram does not include all of the subsidiaries of TC Energy. The total assets and revenues of excluded subsidiaries
in the aggregate did not exceed 20 per cent of the consolidated assets of TC Energy as at Year End or consolidated revenues
of TC Energy as at Year End.
| | | | | |
| |
| |
1 701671 Alberta Ltd. assets and revenues do not exceed 10 per cent of the total consolidated assets or revenues of TC Energy but have been included to meet the total consolidated revenues and assets criteria of excluded subsidiaries threshold of less than 20 per cent. |
2 TC Energy beneficially owns, controls or directs, directly or indirectly, 60 per cent of the voting shares or units in each of these subsidiaries. |
TC Energy Annual Information Form 2025 | 5
Business of TC Energy
We operate in two core businesses – Natural Gas Pipelines and Power and Energy Solutions. In order to provide information that is aligned with how management decisions about our businesses are made and how performance of our businesses is assessed, our results are reflected in four operating segments: Canadian Natural Gas Pipelines, U.S. Natural Gas Pipelines, Mexico Natural Gas Pipelines and Power and Energy Solutions. We also have a Corporate segment consisting of corporate and administrative functions that provide governance, financing and other support to TC Energy's business segments.
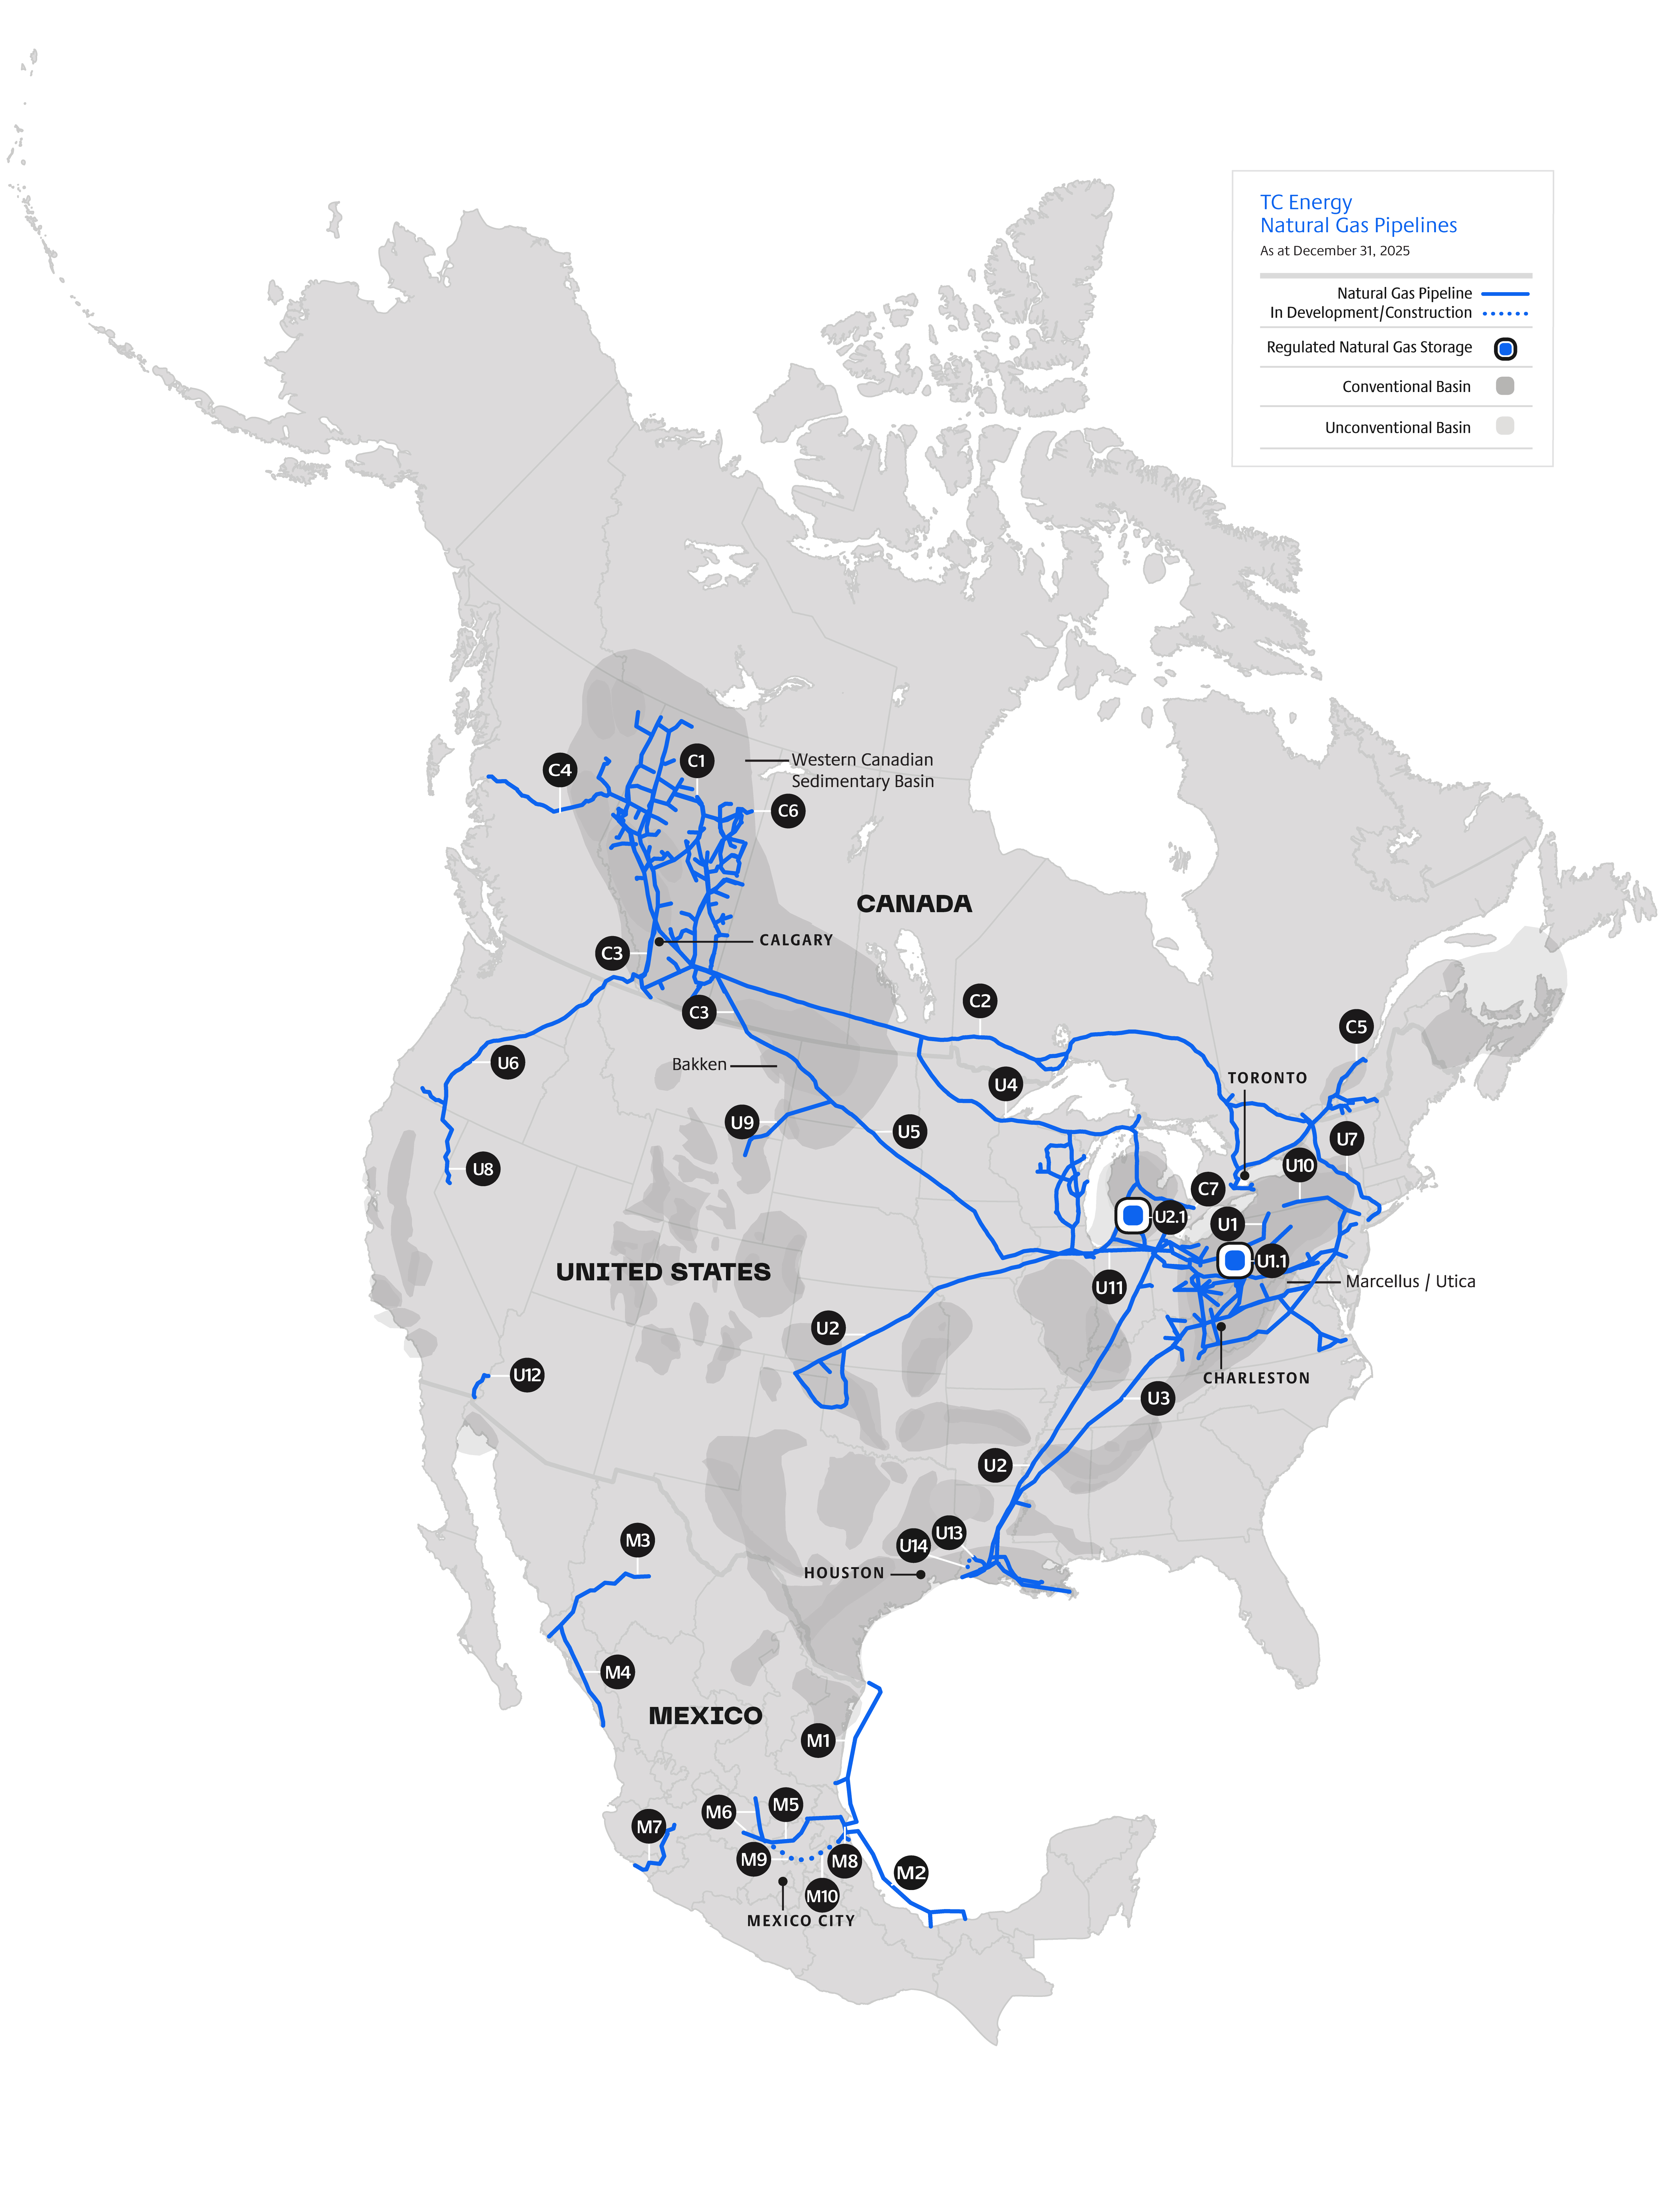
For information regarding our Natural Gas Pipelines business, including pipeline holdings, developments, opportunities, regulation and competitive position refer to the Natural Gas Pipelines Business, Canadian Natural Gas Pipelines, U.S. Natural Gas Pipelines and Mexico Natural Gas Pipelines sections of the MD&A, which sections are incorporated by reference herein.
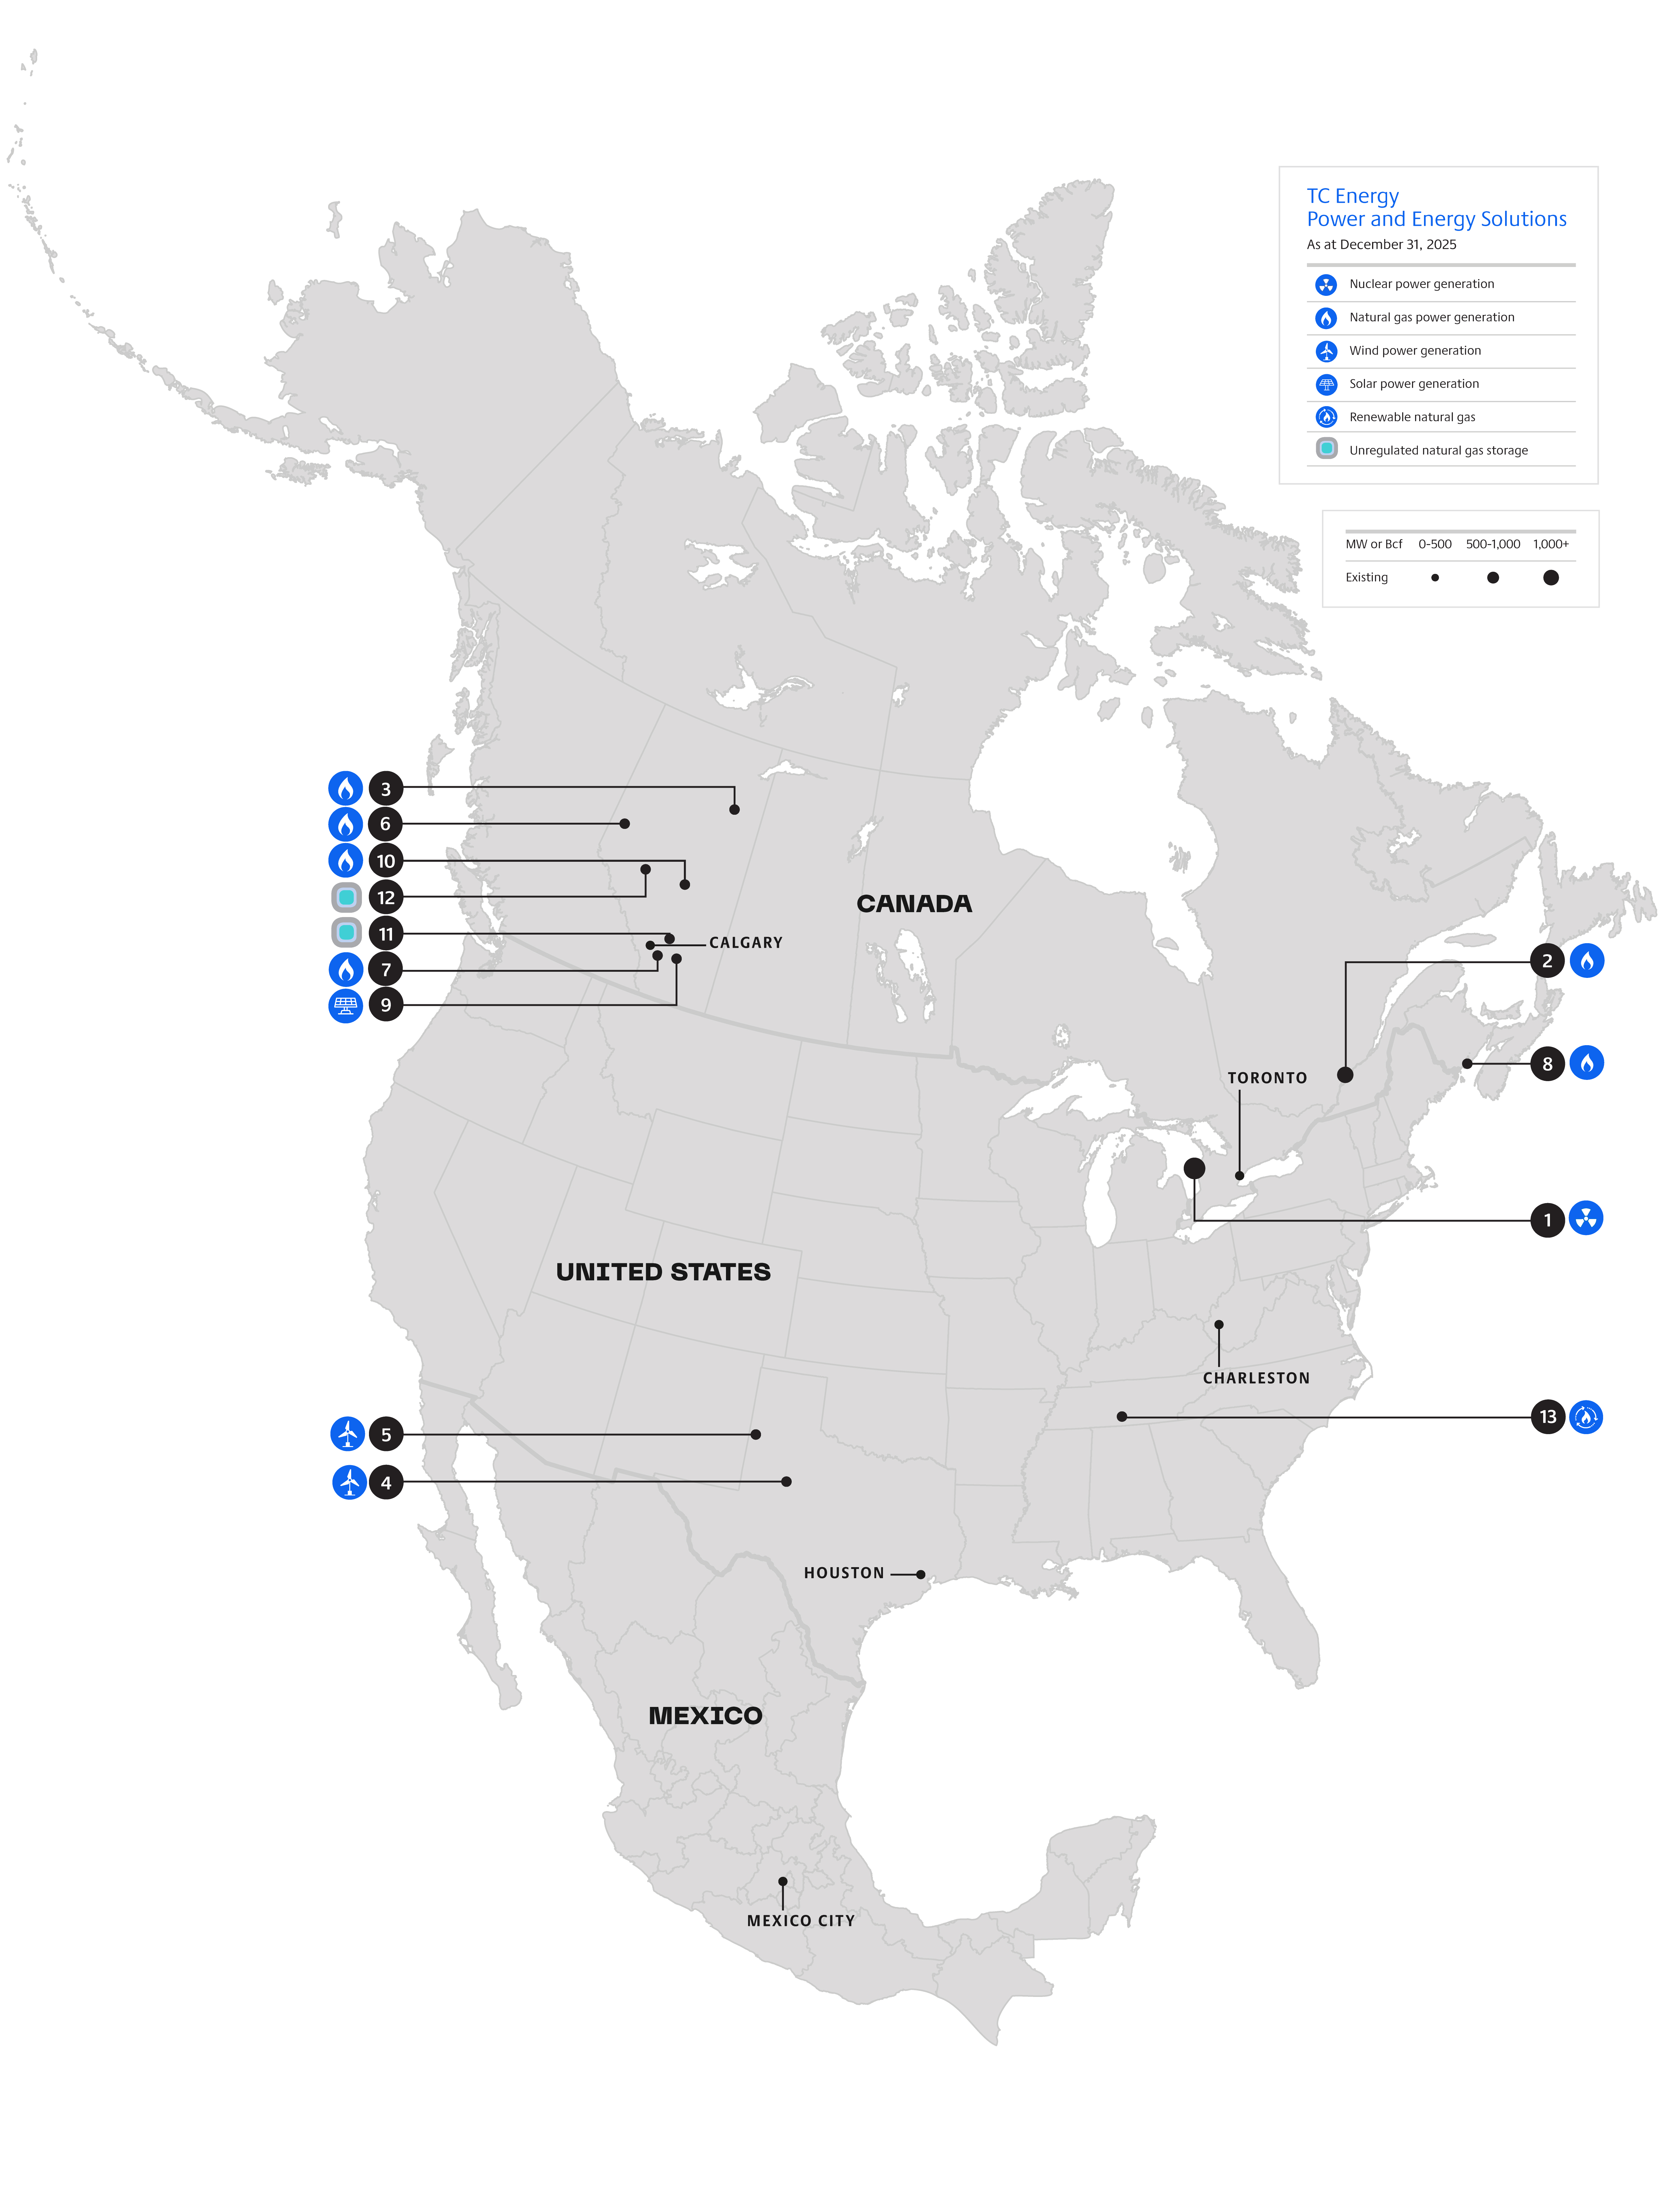
For information regarding our Power and Energy Solutions business, including holdings, developments, opportunities, regulation and competitive position refer to the Power and Energy Solutions section of the MD&A, which section is incorporated by reference herein.
Refer to the About our business – 2025 Financial highlights - Consolidated results section of the MD&A for our revenues from operations by segment, for the years ended December 31, 2025, 2024 and 2023, which section is incorporated by reference herein.
General development of the business
Summarized below are significant developments that have occurred in our Natural Gas Pipelines, Liquids Pipelines and
Power and Energy Solutions businesses, respectively, and certain acquisitions, dispositions, events or conditions which have
had an influence on those developments, during the last three financial years and year to date in 2026. Further information about developments in our business, including changes that we expect will occur in 2026, can be found in the Natural Gas Pipelines Business, Canadian Natural Gas Pipelines, U.S. Natural Gas Pipelines, Mexico Natural Gas Pipelines, Power and Energy Solutions, About our business - Capital program - Secured projects, and Discontinued operations sections of the MD&A, which sections are incorporated by reference herein.
6 | TC Energy Annual Information Form 2025
NATURAL GAS PIPELINES
Developments in the Canadian Natural Gas Pipelines Segment
| | |
| CANADIAN REGULATED PIPELINES |
2021 NGTL System Expansion Program |
| The 2021 NGTL System Expansion Program was completed in 2024 and consists of 344 km (214 miles) of new pipeline, three new compressor units and associated facilities and added approximately 1.59 PJ/d (1.45 Bcf/d) of incremental capacity to the NGTL System. The capital cost of the program was $3.6 billion. |
2022 NGTL System Expansion Program |
| The 2022 NGTL System Expansion Program was completed in 2023 and consists of approximately 166 km (103 miles) of new pipeline, one compressor unit and associated facilities and provides incremental capacity of approximately 773 TJ/d (722 MMcf/d) to meet firm-receipt and intra-basin delivery requirements with eight-year minimum terms. The capital cost of the program was $1.4 billion. |
| 2023 NGTL System Intra-Basin Expansion |
| The NGTL System Intra-Basin Expansion was completed in 2024 and consists of 23 km (14 miles) of new pipeline and two new compressor stations and is underpinned by approximately 255 TJ/d (238 MMcf/d) of new firm-service contracts with 15-year terms. The capital cost of the expansion was $0.5 billion. |
NGTL System/Foothills West Path Delivery Program |
| The NGTL System/Foothills West Path Delivery Program was completed in 2023 and consisted of a multi-year expansion of the NGTL System and Foothills system to facilitate incremental contracted export capacity connecting to the GTN pipeline system. The combined NGTL System and Foothills program consists of approximately 107 km (66 miles) of pipeline and associated facilities and is underpinned by 275 TJ/d (258 MMcf/d) of new firm-service contracts with terms that exceed 30 years. The capital cost of the program was $1.6 billion. |
Valhalla North and Berland River Project |
In November 2022, we sanctioned the Valhalla North and Berland River (VNBR) Project to serve aggregate system requirements and connect migrating supply to key demand markets, designed to provide incremental capacity on the NGTL System of approximately 428 TJ/d (400 MMcf/d). On December 21, 2023, we received approval from the CER to construct, own and operate the VNBR Project. The Valhalla section, which consists of approximately 33 km (21 miles) of new pipeline, was placed in-service in third quarter 2025, with a capital cost of approximately $0.2 billion. The Berland River section, which includes a new non-emitting electric compressor unit and associated facilities, has a target in-service date in the second half of 2026 and an estimated capital cost of $0.3 billion. |
| NGTL Ownership Transfer |
On April 1, 2024, ownership of the NGTL System was transferred from Nova Gas Transmission Ltd. to NGTL GP Ltd. on behalf of NGTL Limited Partnership as part of an ordinary course corporate reorganization to support business optimization. |
NGTL System - Revenue Requirement Settlement and Multi-Year Growth Plan |
On September 26, 2024, the CER approved a five-year negotiated revenue requirement settlement commencing on January 1, 2025. The settlement enables an investment framework that supports our Board of Directors' approval to allocate up to $3.3 billion of capital towards progression of the Multi-Year Growth Plan (MYGP) for expansion facilities to meet commitments on the NGTL System. It is comprised of multiple distinct projects with various targeted in-service dates, subject to final company and regulatory approvals. To date, approximately $1.1 billion of MYGP expansion facilities have received FID, with various in-service dates starting in 2026. Completion of the MYGP is expected to enable approximately 1.0 Bcf/d of incremental system throughput. The settlement maintains an ROE of 10.1 per cent on 40 per cent deemed common equity while increasing NGTL System depreciation rates, with an incentive that allows the NGTL System the opportunity to further increase depreciation rates if tolls fall below specified levels, or if growth projects are undertaken. The settlement introduces a new incentive mechanism to reduce both physical emissions and emissions compliance costs, which builds on the incentive mechanism for certain operating costs where variances from projected amounts and emissions savings are shared with our customers. A provision for review by customers exists in the settlement if tolls exceed a pre-determined level or if final company approvals of the multi-year growth plan are not obtained. |
TC Energy Annual Information Form 2025 | 7
| | |
| LNG PIPELINE PROJECTS |
Coastal GasLink Pipeline |
The Coastal GasLink pipeline is a 671 km (417 mile) pipeline that transports natural gas from a receipt point in the Dawson Creek area of British Columbia to LNG Canada's (LNGC) natural gas liquefaction facility near Kitimat, British Columbia. Transportation service on the pipeline is underpinned by 25-year TSAs (with renewal provisions) with each of the five LNGC joint venture participants (LNGC Participants). We hold a 35 per cent ownership interest in Coastal GasLink Limited Partnership (CGL LP), the entity that owns the Coastal GasLink pipeline. Additionally, we hold a 100 percent ownership interest in the general partner of CGL LP, the entity that operates the pipeline. Throughout construction, the project faced material cost pressures driven by the pandemic, labour, contractor and weather challenges, which ultimately increased the estimated cost of the project to approximately $14.5 billion, excluding potential cost recoveries and after accounting for certain factors that may be outside the control of CGL LP. In connection with the revised cost estimate, we announced our expectation that additional equity contributions required to fund the incremental project costs would be predominantly funded by us, with our share of total equity contributions expected to be up to $5.5 billion and no anticipated change to our 35 per cent ownership interest. This expectation resulted in the recording of cumulative pre-tax impairment charges of $5,148 million ($4,586 million after tax) between December 2022 and September 2023. No further impairment charges have been recorded since September 2023. In 2023, the Coastal GasLink pipeline project achieved mechanical completion, completed pipeline commissioning activities and was ready to deliver gas to the LNGC facility. These milestones entitled CGL LP to receive a $200 million readiness incentive payment from LNGC. The payment, which accrued entirely to TC Energy under the contractual terms between the CGL LP partners, was recognized as revenue by TC Energy in December 2023 and was received in February 2024. In June 2024, CGL LP successfully completed a $7.15 billion refinancing of its existing construction credit facility through a private placement bond offering of senior secured notes to Canadian and U.S. investors. Proceeds from the offering were used to repay the majority of the outstanding $8.0 billion balance on CGL LP's construction credit facility. The remaining balance on the construction credit facility was settled through the use of proceeds from the unwinding of certain hedging arrangements associated with the construction credit facility. In November 2024, CGL LP executed a commercial agreement with LNGC and each of the five LNGC Participants that retroactively declared commercial in-service for the Coastal GasLink pipeline effective October 1, 2024, and provided for a one-time payment of $199 million from LNGC Participants to TC Energy in recognition of completed work and final cost settlement. The payment, which accrued entirely to TC Energy under the contractual arrangements between the CGL LP partners, was recognized as an in-substance distribution from CGL LP in 2024 and was received in October 2025. In December 2024, following the commercial in-service of the Coastal GasLink pipeline, CGL LP repaid the $3,147 million balance owing under its subordinated loan agreement with TC Energy. Our share of equity contributions required by CGL LP to fund repayment of the subordinated loan amounted to $3,137 million. At December 31, 2025, our share of total partner equity contributions to fund the capital cost of the project was $5.3 billion. Reclamation activities associated with post-construction work were completed in 2025. In addition, CGL LP has resolved all material claims with a net positive recovery overall to CGL LP. Unused capacity of $163 million remains available under the subordinated loan agreement with TC Energy, though it is not anticipated that CGL LP will draw on a significant portion of the remaining availability. |
Coastal GasLink - Cedar Link Expansion |
In June 2024, CGL LP sanctioned the Cedar Link project following a positive FID for the construction of the Cedar LNG facility by the Cedar LNG joint venture partners, Haisla Nation and Pembina Pipeline Corporation. The Cedar LNG facility is a proposed floating liquefied natural gas facility to be constructed in Kitimat, British Columbia. The Cedar Link project is an expansion of the Coastal GasLink pipeline that is expected to enable delivery of up to 0.4 Bcf/d of natural gas to the Cedar LNG facility. With an estimated cost of $1.2 billion at FID, the expansion project includes the addition of a new compressor station, connector pipeline and meter station to the existing Coastal GasLink pipeline infrastructure. Funding for the expansion will be provided through project-level credit facilities of up to $1.4 billion secured by CGL LP in June 2024, equity funding to be provided by the CGL LP partners, including us, and the recovery of construction carrying costs from LNGC Participants who have elected to make payments on a quarterly basis throughout construction. The incremental funds available through the project-level credit facilities and cash AFUDC payments provide additional contingency to mitigate future funding requirements for CGL LP should costs exceed initial estimates of $1.2 billion. TC Energy has entered into an equity contribution agreement to fund up to a maximum of $37 million for its proportionate share of the equity requirements related to the Cedar Link project. All major regulatory permits have been received and construction began in July 2024. The planned in-service date for the Cedar Link project is 2028, subject to the completion of plant commissioning activities at the Cedar LNG facility. |
Coastal GasLink - Indigenous Equity Option |
In March 2022, we announced the signing of option agreements to sell up to a 10 per cent equity interest in CGL LP, to Indigenous communities across the project corridor, from our current 35 per cent equity ownership. In January 2026, prospective investors entered into a binding window for these options, which is expected to remain in effect through the end of 2026. Closing of the equity sale is subject to customary regulatory approvals and consents, including the consent of LNGC. |
8 | TC Energy Annual Information Form 2025
Developments in the U.S. Natural Gas Pipelines Segment
| | |
| U.S. NATURAL GAS PIPELINES - COLUMBIA PIPELINE GROUP |
Columbia Gas and Columbia Gulf Monetization |
| On October 4, 2023, we completed the sale of a 40 per cent equity interest in Columbia Gas and Columbia Gulf to Global Infrastructure Partners (GIP) for proceeds of $5.3 billion (US$3.9 billion). Columbia Gas and Columbia Gulf are held by a newly formed entity with GIP. Preceding the close of the equity sale, on August 8, 2023, Columbia Pipelines Operating Company LLC and Columbia Pipelines Holding Company LLC issued US$4.6 billion and US$1.0 billion of long-term, senior unsecured debt, respectively. The net proceeds from the offerings were used to repay existing intercompany indebtedness with TC Energy entities and were directed towards reducing leverage. We continue to have a controlling interest in Columbia Gas and Columbia Gulf and we remain the operator of these pipelines. TC Energy and GIP each fund their proportionate share of annual maintenance, modernization and sanctioned growth capital expenditures through internally generated cash flows, debt financing within the Columbia entities, or from proportionate contributions from TC Energy and GIP. |
Columbia Gas Rate Case Settlement |
Columbia Gas reached a settlement with its customers effective April 2025 and received FERC approval in October 2025. As part of the settlement, there is a moratorium on any further rate changes until March 31, 2028. Columbia Gas must file for new rates with an effective date no later than April 1, 2031. The settlement also included additional rate step ups in April 2026 and April 2027 to reflect anticipated modernization-related spend. In fourth quarter 2025, previously accrued rate refund liabilities, including interest, were refunded to customers. |
Columbia Gas - VR Project |
In November 2025, the VR Project, a delivery market project on Columbia Gas designed to replace and upgrade certain facilities while improving reliability and reducing emissions, was placed in-service with a total project cost of approximately US$0.5 billion. |
|
|
Columbia Gas - KO Transmission Enhancement Acquisition |
| On April 28, 2022, we approved the approximately US$80 million acquisition of KO Transmission assets to be integrated into our Columbia Gas pipeline to provide additional last-mile connectivity of Columbia Gas into northern Kentucky and southern Ohio to growing LDC markets and a platform for future capital investments including future conversions of coal-fueled power plants in the region. FERC approval for the acquisition was received in November 2022 and the transaction closed in February 2023. |
| Columbia Gas - Virginia Electrification Project |
In February 2024, the Virginia Electrification Project, an expansion project that replaced and upgraded certain facilities through conversion to electric compression, was placed in-service. |
Columbia Gas - TCO Connector |
In October 2025, we approved the US$0.3 billion TCO Connector on our Columbia Gas system. This project is designed to provide capacity to serve new natural gas-fired power generation supporting forecasted electric generation growth, including expected data centre growth across our system. The TCO Connector project has an anticipated in-service date of 2030. |
| Columbia Gulf Rate Settlement |
| On July 7, 2023, Columbia Gulf filed an uncontested rate settlement, which set new recourse rates for Columbia Gulf effective March 1, 2024 and instituted a rate moratorium through February 28, 2027. Columbia Gulf must file for new rates no later than March 1, 2029. |
Columbia Gulf - Pulaski and Maysville Projects |
In November 2024, we approved two projects on our Columbia Gulf System: the Pulaski and Maysville Projects. These mainline extension projects off Columbia Gulf will facilitate full coal-to-gas conversion at two existing power plants and are expected to provide 0.2 Bcf/d of capacity for incremental gas-fired generation. The projects have anticipated in-service dates in 2029 and total estimated costs of US$0.8 billion. |
Columbia Gulf - Southeast Virginia Energy Storage Project |
| In November 2024, we approved the US$0.3 billion Southeast Virginia Energy Storage Project. This is an LNG peaking facility in southeast Virginia that will serve an existing LDC's growing winter peak day load and mitigate its peak day pricing exposure, as well as increase operational flexibility on the Columbia Gas system. The project has an anticipated in-service date of 2030. |
Columbia Gulf - East Lateral XPress |
The East Lateral XPress Project, an expansion project on the Columbia Gulf system that connects supply to U.S. Gulf Coast LNG export markets, was placed in-service in May 2025, with a total project cost of approximately US$0.3 billion. |
TC Energy Annual Information Form 2025 | 9
| | |
| OTHER U.S. NATURAL GAS PIPELINES |
ANR Section 4 Rate Case 2022 |
ANR reached a settlement with its customers effective August 2022 and received FERC approval in April 2023. As part of the settlement, there was a moratorium on any further rate changes until November 1, 2025. ANR was required to file for new rates with an effective date no later than August 1, 2028, which was filed in April 2025. The settlement also included an additional rate step up which became effective in August 2024 related to certain modernization projects. In second quarter 2023, previously accrued rate refund liabilities, including interest, were refunded to customers. |
ANR Section 4 Rate Case 2025 |
In April 2025, ANR filed a Section 4 Rate Case with FERC requesting an increase to its respective maximum transportation rates effective November 1, 2025, subject to refund. We intend to pursue a collaborative process to find a mutually beneficial outcome with our customers through settlement. |
ANR Pipeline - Alberta XPress Project |
The Alberta XPress Project, an expansion project on ANR which utilizes existing capacity on the Great Lakes and Canadian Mainline systems to connect growing supply from the WCSB to U.S. Gulf Coast LNG export markets, was placed in-service January 2023. |
ANR Pipeline - WR Project |
In November 2025, the WR Project, a delivery market project on ANR designed to replace and upgrade certain facilities while improving reliability and reducing emissions along portions of the ANR pipeline system in principal delivery markets, was placed in-service with a total project cost of US$0.7 billion. |
ANR Pipeline - Ventura XPress Project |
The Ventura XPress Project, a set of ANR projects designed to improve base system reliability and allow for additional long-term contracted transportation services to a point of delivery on the Northern Border pipeline at Ventura, Iowa, was placed in-service in October 2025 with a total project cost of approximately US$0.2 billion. |
ANR Pipeline - Heartland Project |
| In February 2024, we approved the US$0.9 billion Heartland Project, an expansion project on our ANR system that is expected to increase capacity and improve system reliability. The Heartland Project involves pipeline looping, compressor facility additions as well as upgrades and is expected to increase ANR’s overall market share in the Midwest region. The anticipated in-service date is late 2027. |
ANR Pipeline - Northwoods Project |
In April 2025, we approved the Northwoods Project, an expansion project on our ANR system designed to provide 0.4 Bcf/d of capacity to serve natural gas-fired electric generation demand in the U.S. Midwest, including expected data centres and overall economic growth. The project involves pipeline looping, compressor facility additions as well as other system updates, with an anticipated in-service date of late 2029 and an estimated project cost of approximately US$0.9 billion. |
Gas Transmission Northwest LLC (GTN) - GTN XPress |
In December 2024, the GTN XPress Project, an expansion of the GTN system that will provide for the transport of incremental contracted export capacity facilitated by the NGTL System/Foothills West Path Delivery Program, was placed in-service. The capital cost of this project was approximately US$0.1 billion. |
Great Lakes (GLGT) Rate Settlement |
In April 2025, GLGT filed a Section 4 Rate Case with FERC requesting an increase to its respective maximum transportation rates effective November 1, 2025, subject to refund. We intend to pursue a collaborative process to find a mutually beneficial outcome with our customers through settlement. |
| Gillis Access Project |
In March 2024, the Gillis Access Project, a 68 km (42 mile) greenfield pipeline system that connects gas production sourced from the Gillis hub to downstream markets in southeast Louisiana, was placed in-service. The capital cost of this project was approximately US$0.3 billion. |
| Gillis Access Project - Extension |
In February 2023, we approved a 63 km (39 mile), 1.4 Bcf/d extension of the Gillis Access Project to further connect supplies from the Haynesville basin at Gillis. Effective September 1, 2024, all remaining shipper conditions expired and the project was expanded to 1.9 Bcf/d. The project has anticipated in-service dates starting in fourth quarter 2026 and total estimated costs of US$0.4 billion. |
| North Baja - North Baja XPress Project |
In June 2023, the North Baja XPress Project, an expansion project designed to expand capacity and meet increased customer demand on our North Baja pipeline, was placed in-service. |
10 | TC Energy Annual Information Form 2025
| | |
| Portland Natural Gas Transmission System (PNGTS) |
On August 15, 2024, we completed the sale of PNGTS for a gross purchase price of approximately $1.6 billion (US$1.1 billion), which included US$250 million of senior notes outstanding held at PNGTS and assumed by the purchaser, BlackRock, through a fund managed by its Diversified Infrastructure business and investment funds managed by Morgan Stanley Infrastructure Partners (Purchaser). We provided customary transition services and worked jointly with the Purchaser to facilitate the safe and orderly transition of this natural gas system, which was completed in third quarter 2025. |
Bison XPress Project |
In third quarter 2023, we approved the Bison XPress Project, an expansion project on our Northern Border and Bison systems that will replace and upgrade certain facilities and provide much needed production egress from the Bakken basin to a delivery point at the Cheyenne Hub. In October 2024, FERC provided a certificate order approving the project that has an anticipated in-service date in 2026. |
TC Energy Annual Information Form 2025 | 11
Developments in the Mexico Natural Gas Pipelines Segment
| | |
| MEXICO NATURAL GAS PIPELINES |
| TGNH Strategic Alliance with the CFE |
In August 2022, we announced a strategic alliance with Mexico’s state-owned electric utility, the CFE, for the development of new natural gas infrastructure in central and southeast Mexico. In connection with the strategic alliance, we reached an FID to develop and construct the Southeast Gateway pipeline, a 1.3 Bcf/d, 715 km (444 mile) offshore natural gas pipeline to serve the southeast region of Mexico. The Southeast Gateway pipeline is in service and we commenced the collection of tolls beginning May 2025. In July 2025, the newly constituted CNE approved our regulated rates required to provide service to potential future interruptible service users on the Southeast Gateway pipeline other than the CFE. In 2024, the CFE became an equity partner in TGNH with a 13.01 per cent equity interest. The CFE's equity in TGNH is expected to increase to a maximum of 15 per cent, subject to regulatory approvals, and will increase to approximately 35 per cent upon expiry of the contract in 2055. |
| Villa de Reyes |
We placed the lateral section of the Villa de Reyes pipeline into commercial service in third quarter 2023. We continue to work with our partner, the CFE, to complete the south section of the Villa de Reyes pipeline. The in-service date will be determined upon resolution of outstanding stakeholder issues. |
12 | TC Energy Annual Information Form 2025
POWER AND ENERGY SOLUTIONS
Developments in the Power and Energy Solutions Segment
| | |
| CANADIAN POWER |
| Canadian Cogeneration Plants |
| In 2024, we executed contract extensions of 5-years at Mackay River, a natural gas cogeneration plant located in Alberta, and 10-years at Grandview, a natural gas cogeneration plant located in New Brunswick. |
| Saddlebrook Solar |
In October 2023, we completed construction of the 81 MW Saddlebrook Solar Project near Aldersyde, Alberta and began commissioning activities, including supplying generation to the Alberta market. Full commercial operation was achieved on January 5, 2024. The project was partially supported with funding from Emissions Reduction Alberta and Lockheed Martin. |
Renewable Energy Contracts and/or Investment Opportunities |
In November 2023, a majority of the 297 MW Sharp Hills Wind Farm achieved commercial operation resulting in the commencement of our 15-year Power Purchase Agreement for 100 per cent of the power produced and the rights to all environmental attributes from the facility. In second quarter 2023, we finalized contracts to sell 50 MW under our 24-by-7 carbon-free power offering in Alberta, which provides customers power and carbon credits for the decarbonization of the customers’ Scope 2 emissions. Contract terms range from 15 to 20 years and commenced in January 2025. |
Bruce Power |
The Unit 6 MCR, the first of the six-unit MCR life extension program, was completed in third quarter 2023. The Unit 3 MCR and Unit 4 MCR, which are the second and third units in the MCR life extension program, commenced in first quarter 2023 and 2025 respectively, with expected completion dates in 2026 and 2028, respectively. The Unit 5 MCR final cost and schedule estimate was verified by the IESO on April 2, 2025. The Unit 5 MCR is expected to commence in fourth quarter 2026 with an expected return to service in early 2030. Investments in the remaining two units' MCR life extension programs are expected to continue through 2033. Future MCR investments will be subject to discrete decisions for each unit with specified off-ramps available for Bruce Power and the IESO. Along with the MCR life extension program, Bruce Power's Project 2030 has a goal of achieving a site peak output of 7,000 MW by 2033 in support of the province of Ontario's climate change targets and future clean energy needs. Project 2030 is focused on continued asset optimization, innovation and leveraging new technology, to increase site capability. Project 2030 is being implemented in three stages with Stage 1, 2 and 3a fully approved for execution. The program commenced in 2019 with a site capability of 6,430 MW and closed out 2025 at approximately 6,580 MW; a net gain of approximately 150 MW. Upon completion of Stages 1, 2 and 3a, the site is projected to reach an output of 6,840 MW. All three stages are being implemented in parallel to the MCR life extension program. Bruce Power's contract price increased in April 2022, in accordance with contract terms, reflecting capital to be invested under the Unit 3 MCR program and the 2022 to 2024 Asset Management program plus normal annual inflation adjustments. The contract price was then increased again in April 2024 as a result of the IESO approving the Unit 4 MCR program and increased again in April 2025 to reflect the 2025 to 2027 Asset Management program plus normal annual inflation adjustments and the 9-year reset for salaries and pensions. |
TC Energy Annual Information Form 2025 | 13
DISCONTINUED OPERATIONS
| | |
| Spinoff Transaction |
On July 27, 2023, we announced plans to separate into two independent, investment-grade, publicly listed companies through the spinoff of our Liquids Pipelines business into its own entity, South Bow. TC Energy shareholders voted to approve the Spinoff Transaction at our 2024 Annual and Special Meeting of shareholders held on June 4, 2024. The Spinoff Transaction received final approval from the Court of King’s Bench of Alberta on June 4, 2024 and was completed on October 1, 2024. The Spinoff Transaction was effected by way of a plan of arrangement under the CBCA pursuant to which, among other things, holders of TC Energy common shares retained their interest in TC Energy and received a pro rata allocation of South Bow’s common shares. On October 1, 2024, TC Energy and South Bow entered into a separation agreement setting forth the terms of the separation of the Liquids Pipelines business from the business of TC Energy, including the transfer of certain assets related to the Liquids Pipelines business from TC Energy to South Bow and the allocation of certain liabilities and obligations related to the Liquids Pipelines business between TC Energy and South Bow. During 2025, we reached an agreement with South Bow with respect to liabilities we indemnified South Bow for under the Separation Agreement, releasing us from those liabilities. |
14 | TC Energy Annual Information Form 2025
General
EMPLOYEES
At Year End, TC Energy's principal operating subsidiary, TCPL, had 6,574 employees, substantially all of whom were employed
in Canada and the U.S., as set forth in the following table.
| | | | | |
| Calgary | 2,185 | |
| Western Canada (excluding Calgary) | 592 | |
| Eastern Canada | 275 | |
| Houston | 749 | |
| U.S. Midwest | 769 | |
| U.S. Northeast | 203 | |
| U.S. Southeast/Gulf Coast (excluding Houston) | 1,184 | |
| U.S. West Coast | 96 | |
| Mexico | 521 | |
| Total | 6,574 | |
HEALTH, SAFETY, SUSTAINABILITY AND ENVIRONMENTAL PROTECTION GOVERNANCE AND SOCIAL POLICIES
A discussion of our health, safety, sustainability and environmental protection governance can be found in the MD&A in the Other information – Health, safety, sustainability and environmental matters section, which section is incorporated by reference herein.
Social Policies
We have a number of corporate governance documents, such as policies and standards, including a Commitment Statement,
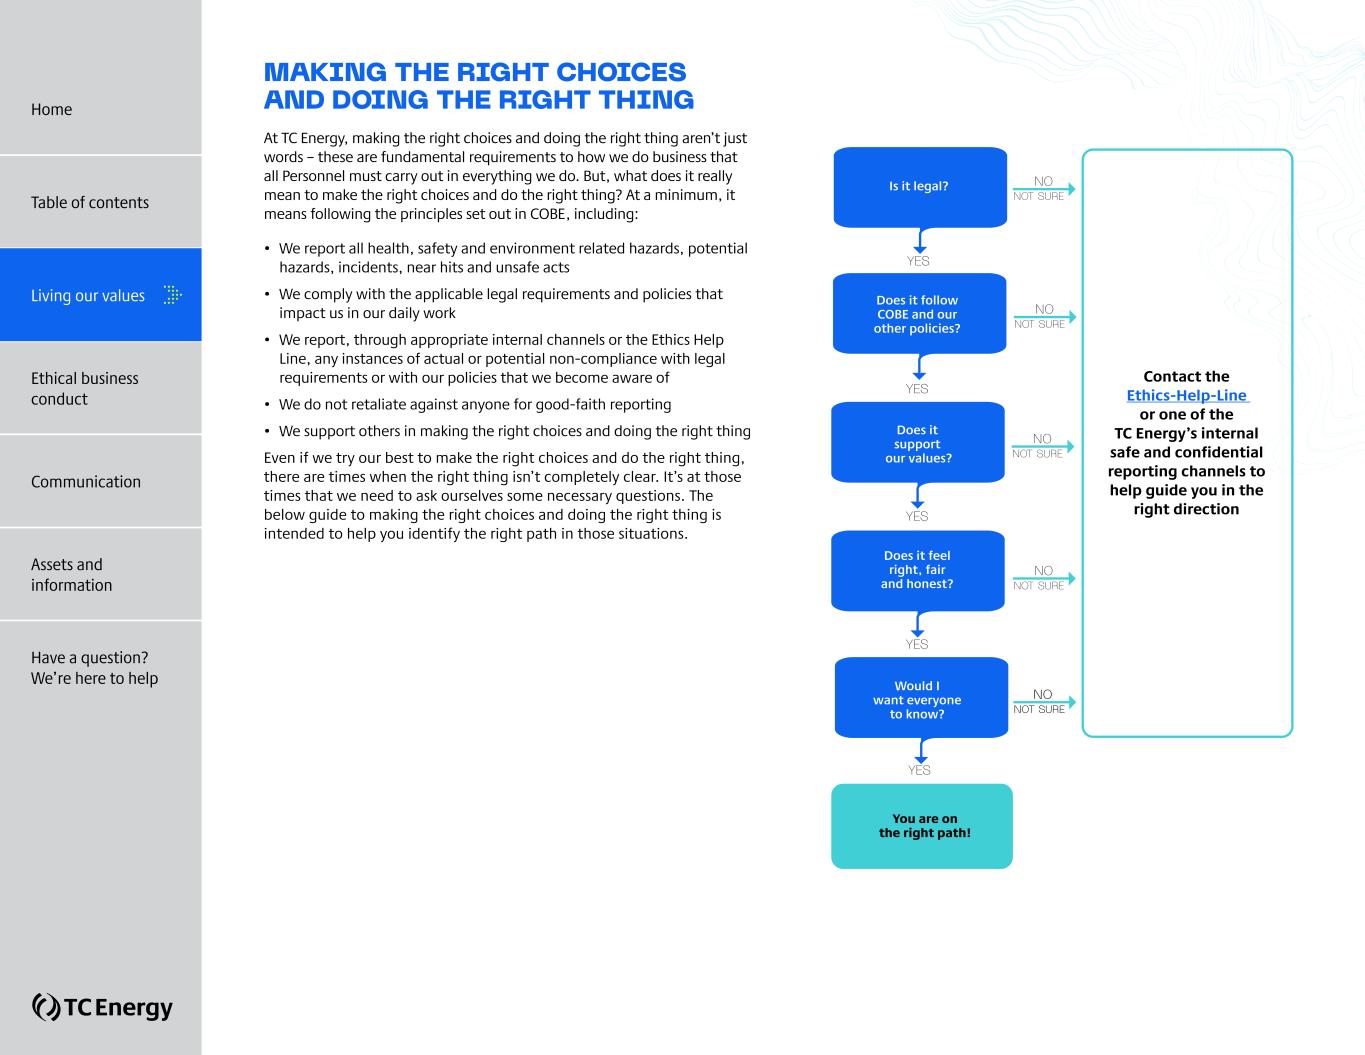
to help guide our teams’ behavior and actions with respect to our core values as well as legal and compliance obligations so they understand their responsibilities and extend respect and courtesy to Indigenous groups and other stakeholders. We have a Code of Business Ethics (COBE) Policy which functions together with TC Energy's other policies and applies to all employees, officers and directors, and contingent workforce contractors of TC Energy and its wholly-owned subsidiaries and/or operated entities
in all countries where we conduct business, with the exception of independently operated entities whose corporate governance documents meet or exceed TC Energy’s requirements. Annual online COBE training is provided to all employees and contingent workforce contractors, and all employees and contingent workforce contractors (including executive officers) and directors must certify their compliance with COBE annually. In addition, TC Energy has a Contractor COBE Policy which imposes the same requirements as the COBE Policy on Contractors, as applicable.
We also have an Avoiding Bribery and Corruption (ABC) Program which includes an ABC Policy, annual online training included
as part of annual online COBE training, instructor-led training provided to personnel in higher risk locations of our business,
a supplier and contractor due diligence review process, and auditing of certain types of transactions.
Our Indigenous Relations Policy is informed by our guiding principles and core values to ensure we build and sustain support through early and honest communication, by mitigating impacts, and through mutually beneficial partnerships. We seek
to listen to Indigenous peoples and incorporate their traditional and local knowledge in project design and planning. We strive
to work with Indigenous communities to mitigate negative impacts and maximize benefits through hiring and buying locally.
We aim to build mutually beneficial, partnership-oriented relationships with Indigenous communities who are most impacted
by our activities. In Canada, we will seek to expand benefits for equity participation in our projects because the best way to align interests from the start is to sit at the table together as partners/owners. Through all these efforts, we strive to be considered
as a partner of choice for Indigenous groups and play a meaningful role in reconciliation.
Consistent with our four core values, safety in every step, personal accountability, one team and active learning, Commitment Statement and as outlined in our COBE Policy, TC Energy does not tolerate human rights abuses. In our business activities, including engaging with Indigenous groups and other stakeholders across Canada, the U.S and Mexico, we are committed
to respecting human rights and will not be complicit with, or engage in, any activity that supports or facilitates abuse of
human rights such as forced labour, child labour, or physical or mental abuses.
TC Energy Annual Information Form 2025 | 15
Risk factors
A discussion of our risk factors can be found in the MD&A in the Natural Gas Pipelines Business, Natural Gas Pipelines - Business risks, Power and Energy Solutions – Business risks and Other information – Risk oversight and enterprise risk management sections, which sections are incorporated by reference herein.
Dividends
Our Board has not adopted a formal dividend policy. The Board reviews the financial performance of TC Energy quarterly and makes a determination of the appropriate level of dividends to be declared in the following quarter. Currently, our payment of dividends is primarily funded from dividends TC Energy receives as the sole common shareholder of TCPL.
Provisions of various trust indentures and credit arrangements with certain of our subsidiaries can restrict those subsidiaries’ ability and, in certain cases, our ability to declare and pay dividends or make distributions under certain circumstances. In the opinion of management, these provisions do not currently restrict our ability to declare or pay dividends.
Additionally, the terms of the hybrid notes issued by TCPL and trust notes issued by TransCanada Trust (a financing trust subsidiary wholly-owned by TCPL), and the respective related agreements, contain dividend stopper provisions which, among other things, are generally triggered if TCPL elects to defer interest payable on the applicable notes. When such provisions are triggered, they prohibit TC Energy and TCPL from declaring or paying dividends, among other prohibitive measures. The dividend stopper provisions have not been triggered for either the hybrid notes or the trust notes.
Dividends on our preferred shares are payable quarterly, as and when declared by the Board. The dividends declared on our common and preferred shares during the past three completed financial years, and the quarterly dividend per common share
on our outstanding common shares for the quarter ending March 31, 2026, are set out in the MD&A under the heading
About our business – 2025 Financial highlights – Dividends section, which section is incorporated by reference herein.
16 | TC Energy Annual Information Form 2025
Description of capital structure
SHARE CAPITAL
TC Energy’s authorized share capital consists of an unlimited number of common shares and an unlimited number of first preferred shares and second preferred shares, issuable in series. The number of common shares and preferred shares issued and outstanding as at Year End are set out in the MD&A in the Financial Condition – Share information section, which section is incorporated by reference herein. The following is a description of the material characteristics of each of these classes of shares.
Common shares
The common shares entitle the holders thereof to one vote per share at all meetings of shareholders, except meetings at which only holders of another specified class of shares are entitled to vote, and, subject to the rights, privileges, restrictions and conditions attaching to the first preferred shares and the second preferred shares, whether as a class or a series, and to any other class or series of shares of TC Energy which rank prior to the common shares, entitle the holders thereof to receive (i) dividends if, as and when declared by the Board out of the assets of TC Energy properly applicable to the payment of the dividends in such amount and payable at such times and at such place or places as the Board may from time to time determine, and (ii) the remaining property of TC Energy upon a liquidation, dissolution or winding up of the Company.
We have a shareholder rights plan (the Plan) that is designed to protect the rights of our shareholders, ensure they are treated fairly and provide the Board with adequate time to identify, develop and negotiate alternative value maximizing transactions if there is a take-over bid for TC Energy. The Plan creates a right attaching to each common share outstanding and to each common share subsequently issued. Each right becomes exercisable 10 trading days after a person has acquired (an acquiring person), or commences a take-over bid to acquire, 20 per cent or more of the common shares, other than by an acquisition pursuant to a take-over bid permitted under the terms of the Plan (a permitted bid). Prior to a flip-in event (as described below), each right permits registered holders to purchase from the Company common shares of TC Energy at an exercise price equal to three times the market price of such shares, subject to adjustments and anti-dilution provisions (the exercise price). The beneficial acquisition by any person of 20 per cent or more of the common shares, other than by way of a permitted bid, is referred to as a flip-in event. Ten trading days after a flip-in event, each right will permit registered holders other than an acquiring person to receive, upon payment of the exercise price, the number of common shares with an aggregate market price equal to twice the exercise price. The Plan was reconfirmed at the 2025 annual meeting of TC Energy shareholders and must be reconfirmed at every third annual meeting thereafter.
A discussion of our dividend reinvestment and share purchase plan can be found in the MD&A in the About our business - 2025 Financial highlights – Dividends – Dividend reinvestment and share purchase plan and the Financial condition - Dividend reinvestment plan sections, which sections are incorporated by reference herein.
TC Energy Annual Information Form 2025 | 17
First preferred shares
Subject to certain limitations, the Board may, from time to time, issue first preferred shares in one or more series and determine for any such series, its designation, number of shares and respective rights, privileges, restrictions and conditions. The first preferred shares as a class have, among others, the provisions described below.
The first preferred shares of each series rank on a parity with the first preferred shares of every other series, and are entitled
to preference over the common shares, the second preferred shares and any other shares ranking junior to the first preferred shares with respect to the payment of dividends, the repayment of capital and the distribution of assets of TC Energy in the event of its liquidation, dissolution or winding up.
Except as provided by the CBCA, the holders of the first preferred shares will not have any voting rights nor will they be entitled to receive notice of or to attend shareholders' meetings. The holders of any particular series of first preferred shares will, if the directors so determine prior to the issuance of such series, be entitled to such voting rights as may be determined by the Board
if TC Energy fails to pay dividends on that series of preferred shares for any period as may be so determined by the Board.
TC Energy currently does not intend to issue any first preferred shares with voting rights, and any issuances of first preferred shares are expected to be made only in connection with corporate financings.
The provisions attaching to the first preferred shares as a class may be modified, amended or varied only with the approval
of the holders of the first preferred shares as a class. Any such approval to be given by the holders of the first preferred shares may be given by the affirmative vote of the holders of not less than 66 2/3 per cent of the first preferred shares represented
and voted at a meeting or adjourned meeting of such holders.
The holders of Series 1, 3, 5, 7 and 9 preferred shares will be entitled to receive quarterly fixed rate cumulative preferential cash dividends, as and when declared by the Board, to be reset periodically on prescribed dates to an annualized rate equal to the sum of the then five-year Government of Canada bond yield, calculated at the start of the applicable five-year period, and a spread as set forth in the table below and have the right to convert their shares into cumulative redeemable Series 2, 4, 6, 8
and 10 preferred shares, respectively, subject to certain conditions, on such conversion dates as set forth in the table below.
The Series 1, 3, 5, 7 and 9 preferred shares are redeemable by TC Energy in whole or in part on such redemption dates as set forth in the table below, by the payment of an amount in cash for each share to be redeemed equal to $25.00 plus all accrued and unpaid dividends thereon.
The holders of Series 2, 4, 6, 8 and 10 preferred shares will be entitled to receive quarterly floating rate cumulative preferential cash dividends, as and when declared by the Board, at an annualized rate equal to the sum of the then 90-day Government of Canada treasury bill rate, recalculated quarterly, and a spread as set forth in the table below and have the right to convert their shares into Series 1, 3, 5, 7 and 9 preferred shares, respectively, subject to certain conditions, on such conversion dates as set forth in the table below. The Series 2, 4, 6, 8 and 10 preferred shares are redeemable by TC Energy in whole or in part after their respective initial redemption date as set forth in the table below, by the payment of an amount in cash for each share to be redeemed equal to (i) $25.00 in the case of redemptions on such redemption dates as set out in the table below, or (ii) $25.50
in the case of redemptions on any other date, in each case plus all accrued and unpaid dividends thereon.
18 | TC Energy Annual Information Form 2025
In the event of liquidation, dissolution or winding up of TC Energy, the holders of Series 1, 2, 3, 4, 5, 6, 7, 8, 9 and 10 preferred shares shall be entitled to receive $25.00 per preferred share plus all accrued and unpaid dividends thereon in preference over the common shares or any other shares ranking junior to the first preferred shares.
| | | | | | | | | | | |
| Series of first preferred shares | Initial redemption/conversion date | Redemption/conversion dates | Spread (%) |
| Series 1 preferred shares | December 31, 2014 | December 31, 2029 and every fifth year thereafter | 1.92 | |
| Series 2 preferred shares | — | December 31, 2029 and every fifth year thereafter | 1.92 | |
| Series 3 preferred shares | June 30, 2015 | June 30, 2030 and every fifth year thereafter1 | 1.28 | |
| Series 4 preferred shares | — | June 30, 2030 and every fifth year thereafter1 | 1.28 | |
| Series 5 preferred shares | January 30, 2016 | January 30, 2031 and every fifth year thereafter | 1.54 | |
| Series 6 preferred shares | — | January 30, 2031 and every fifth year thereafter | 1.54 | |
| Series 7 preferred shares | April 30, 2019 | April 30, 2029 and every fifth year thereafter | 2.38 | |
| Series 8 preferred shares | — | April 30, 2029 and every fifth year thereafter | 2.38 | |
| Series 9 preferred shares | October 30, 2019 | October 30, 2029 and every fifth year thereafter | 2.35 | |
| Series 10 preferred shares | — | October 30, 2029 and every fifth year thereafter | 2.35 | |
| Series 11 preferred shares2 | November 30, 2020 | November 28, 2025 | — | |
| Series 12 preferred shares3 | — | — | — | |
Except as provided by the CBCA, the respective holders of the first preferred shares of each outstanding series are not entitled
to receive notice of, attend at, nor vote at any meeting of shareholders unless and until TC Energy shall have failed to pay eight quarterly dividends on such series of preferred shares, whether or not consecutive, in which case the holders of the first preferred shares of such series shall have the right to receive notice of and to attend each meeting of shareholders at which directors are to be elected and which take place more than 60 days after the date on which the failure first occurs, and to one vote with respect to resolutions to elect directors for each of the first preferred share of such series, until all arrears of dividends have been paid. Subject to the CBCA, the series provisions attaching to the first preferred shares may be amended with the written approval of all the holders of such series of shares outstanding or by at least two thirds of the votes cast at a meeting
of the holders of such shares duly called for that purpose and at which a quorum is present.
Second preferred shares
The rights, privileges, restrictions and conditions attaching to the second preferred shares are substantially identical to those attaching to the first preferred shares, except that the second preferred shares rank junior to the first preferred shares with respect to the payment of dividends, repayment of capital and the distribution of assets of TC Energy in the event of a liquidation, dissolution or winding up of TC Energy.
1 Adjusted to July 2, 2030 to account for applicable business days.
2 On November 28, 2025, TC Energy redeemed all of its issued and outstanding Series 11 preferred shares. Subsequent to the redemption, the Series 11 preferred shares ceased to be listed on the TSX and were cancelled.
3 Prior to the redemption of the Series 11 preferred shares, Series 12 preferred shares were issuable upon conversion of the Series 11 preferred shares, subject to certain conditions, on previously set conversion dates. At the time of the redemption and cancellation of the Series 11 preferred shares, there were no Series 12 preferred shares outstanding.
TC Energy Annual Information Form 2025 | 19
Credit ratings
Although TC Energy has not issued debt to the public, it has been assigned credit ratings by Moody's Investors Service, Inc. (Moody's), S&P Global Ratings (S&P) and Fitch Ratings Inc. (Fitch), and its outstanding preferred shares have also been assigned credit ratings by S&P, Fitch and DBRS Limited (DBRS). Moody's has assigned TC Energy an issuer rating of Baa3 with a stable outlook, S&P has assigned an issuer credit rating of BBB+ with a stable outlook, and Fitch has assigned a long-term issuer default rating of BBB+ with a stable outlook. TC Energy does not presently intend to issue debt securities to the public in its own name and any future debt financing requirements are expected to continue to be funded primarily through its subsidiary, TCPL.
The following table sets out the current credit ratings assigned to those outstanding classes of securities of the Company,
TCPL and TransCanada Trust, and certain related subsidiaries which have been rated by Moody's, S&P, Fitch and DBRS:
| | | | | | | | | | | | | | |
| Moody's | S&P | Fitch | DBRS |
TCPL - Senior unsecured debt | Baa2 | BBB+ | BBB+ | BBB (high) |
TCPL - Junior subordinated notes | Baa3 | BBB- | BBB-1 | BBB (low)1 |
TransCanada Trust - Subordinated trust notes | Ba1 | BBB- | BBB- | Not rated |
TC Energy Corporation - Preferred shares | Not rated | P-2 (Low) | BBB- | Pfd-3 (high) |
Commercial paper (TCPL and TCPL guaranteed) | P-2 | A-2 | F2 | R-2 (high) |
Rating outlook/status | Stable | Stable | Stable | Stable |
Credit ratings are intended to provide investors with an independent measure of credit quality of an issue of securities.
Credit ratings are not recommendations to purchase, hold or sell securities and do not address the market price or suitability
of a specific security for a particular investor. There is no assurance that any rating will remain in effect for any given period
of time or that any rating will not be revised or withdrawn entirely by a rating agency in the future if, in its judgment, circumstances so warrant.
Each of the Company, TCPL, TransCanada Trust and certain of our other subsidiaries paid fees to each of Moody's, S&P, Fitch
and DBRS for the credit ratings rendered in respect of their outstanding classes of securities noted above. In addition to annual monitoring fees for the Company and TCPL and their rated securities, additional payments are made in respect of other services provided in connection with various rating advisory services.
The information concerning our credit ratings relates to our financing costs, liquidity and operations. The availability and cost
of our funding options may be affected by certain factors, including the global capital markets environment and outlook as well as our financial performance. Our access to capital markets for required capital at competitive rates is influenced by our credit rating and rating outlook, as determined by credit rating agencies such as Moody's, S&P, Fitch and DBRS. If our ratings were downgraded, TC Energy's financing costs and future debt issuances could be unfavourably impacted. A description of the rating agencies' credit ratings listed in the table above is set out below.
MOODY’S
Moody's has different rating scales for short- and long-term obligations. Numerical modifiers 1, 2 and 3 are appended to each rating classification from Aa through Caa. The modifier 1 indicates that the obligation ranks in the higher end of its generic rating category; the modifier 2 indicates a mid-range ranking; and a modifier 3 indicates a ranking in the lower end of that generic rating category. The Baa2 rating assigned to TCPL's senior unsecured debt and the Baa3 rating assigned to TCPL's junior subordinated notes are in the fourth highest of nine rating categories for long-term obligations. Obligations rated Baa are judged to be medium-grade and are subject to moderate credit risk, and as such, may possess certain speculative characteristics. The Ba1 rating assigned to the TransCanada Trust subordinated trust notes, is in the fifth highest of nine rating categories for long-term obligations. Obligations rated Ba are judged to have speculative elements and are subject to substantial credit risk. The P-2 rating assigned to TCPL's and TCPL guaranteed U.S. commercial paper programs is the second highest of four rating categories for short-term debt issuers. Issuers rated P-2 have a strong ability to repay short-term debt obligations. Outlooks may be assigned at the issuer level or at the rating level. A Moody’s rating outlook is an opinion regarding the likely rating direction over the medium term. A stable outlook indicates a low likelihood of a rating change over the medium term. A negative, positive or developing outlook indicates a higher likelihood of a rating change over the medium term.
1 The assigned rating applies to only certain classes of the securities noted, further details are set out below.
20 | TC Energy Annual Information Form 2025
S&P
S&P has different rating scales for short- and long-term obligations and Canadian preferred shares. Ratings from AA through CCC may be modified by the addition of a plus (+) or minus (-) sign to show the relative standing within a particular rating category. The BBB+ rating assigned to TCPL's senior unsecured debt is in the fourth highest of 10 rating categories for long-term obligations. A BBB rating indicates the obligor's capacity to meet its financial commitment is adequate; however, adverse economic conditions or changing circumstances are more likely to weaken the obligor's capacity to meet its financial commitments on the obligation. The BBB- ratings assigned to TCPL’s junior subordinated notes and to the TransCanada Trust subordinated trust notes, is in the fourth highest of 10 rating categories for long-term debt obligations and the P-2 (Low) rating assigned to TC Energy’s preferred shares is the second highest of eight rating categories for Canadian preferred shares. The BBB- ratings assigned to TCPL's junior subordinated notes and the TransCanada Trust subordinated trust notes, and the P-2 (Low) rating assigned to TC Energy's preferred shares indicate these obligations exhibit adequate protection parameters. However, adverse economic conditions or changing circumstances are more likely to weaken the obligor’s capacity to meet its financial commitment on the obligation. TCPL's and TCPL guaranteed U.S. commercial paper programs are each rated A-2 which is the second highest of six rating categories for short-term debt issuers. Short-term debt issuers rated A-2 have satisfactory capacity to meet their financial commitments, however they are somewhat more susceptible to adverse effects of changes in circumstances and economic conditions than obligors in the highest rating category. S&P assigns outlooks to issuers and not to individual debt securities. An S&P outlook assesses the potential direction of a long-term credit rating over the intermediate term, which is generally up to two years for investment grade issuers. S&P has assigned a stable outlook to the Company, indicating its ratings are not likely to change over the intermediate term.
FITCH
Fitch has different rating scales for short- and long-term obligations. Ratings from AA through CCC may be modified by the addition of a plus (+) or minus (-) sign to show the relative status within a particular rating category. The BBB+ rating assigned
to TCPL's senior unsecured debt, and the BBB- ratings assigned to all series of TCPL's junior subordinated notes, with the exception of the series due 2067 which are not rated by Fitch, the TransCanada Trust subordinated trust notes and TC Energy's preferred shares are in the fourth highest of 11 rating categories for long-term obligations. A BBB rating indicates that expectations of default risk are currently low and that the capacity for payment of financial commitments is considered adequate, but adverse business or economic conditions are more likely to impair this capacity. The F2 rating assigned to TCPL's and TCPL guaranteed U.S. commercial paper program is the second highest of seven rating categories for short-term debt issuers. Issuers rated F2 have good intrinsic capacity for timely payment of financial commitments. Ratings outlooks by Fitch indicate the direction a rating is likely to move over a one-to-two year period and reflect financial or other trends that have
not yet reached or been sustained to the level that would cause a rating action, but which may do so if such trends continue.
TC Energy Annual Information Form 2025 | 21
DBRS
DBRS has different rating scales for short- and long-term obligations and Canadian preferred shares. High or low grades are used to indicate the relative standing within all rating categories other than AAA and D and other than in respect of DBRS’ ratings
of commercial paper and short-term debt, which utilize high, middle and low subcategories for its R-1 and R-2 rating categories.
In respect of long-term debt and preferred share ratings, the absence of either a high or low designation indicates the rating
is in the middle of the category. The BBB (high) rating assigned to TCPL's senior unsecured debt and the BBB (low) rating assigned to TCPL's junior subordinated notes due 2067 are in the fourth highest of 10 categories for long-term debt and indicate adequate credit quality. The capacity for the payment of financial obligations is considered acceptable. Long-term debt rated BBB may be vulnerable to future events. The Pfd-3 (high) rating assigned to TC Energy's preferred shares is in the third highest
of six rating categories for preferred shares. Preferred shares rated Pfd-3 are generally of adequate credit quality. While protection of dividends and principal is still considered acceptable, the issuing entity is more susceptible to adverse changes
in financial and economic conditions, and there may be other adverse conditions present which detract from debt protection. Pfd-3 ratings generally correspond with issuers with a BBB category or higher reference point. The R-2 (high) rating assigned
to TCPL's Canadian commercial paper program is in the fourth highest of 10 rating categories for short-term debt issuers and indicates the upper end of adequate credit quality. The capacity for payment of short-term financial obligations as they fall due is acceptable. Short-term debt rated R-2 (high) may be vulnerable to future events. Rating trends provide guidance in respect
of DBRS' opinion regarding the outlook for a credit rating. The rating trend indicates the direction in which DBRS considers the credit rating may move if present circumstances continue.
Market for securities
TC Energy's common shares are listed on the TSX and the NYSE under the symbol TRP. The following table sets out our preferred shares listed on the TSX as of February 12, 2026.
| | | | | | | | |
| Type | Issue Date | Stock Symbol |
| Series 1 preferred shares | September 30, 2009 | TRP.PR.A |
| Series 2 preferred shares | December 31, 2014 | TRP.PR.F |
| Series 3 preferred shares | March 11, 2010 | TRP.PR.B |
| Series 4 preferred shares | June 30, 2015 | TRP.PR.H |
| Series 5 preferred shares | June 29, 2010 | TRP.PR.C |
| Series 7 preferred shares | March 4, 2013 | TRP.PR.D |
| Series 9 preferred shares | January 20, 2014 | TRP.PR.E |
| Series 10 preferred shares | October 30, 2024 | TRP.PR.L |
22 | TC Energy Annual Information Form 2025
The following tables set out the reported monthly high, low, and month end closing trading prices and monthly trading volumes of the common shares of TC Energy on the TSX and the NYSE, and the respective Series 1, 2, 3, 4, 5, 6, 7, 9, 10 and 11 preferred shares on the TSX, for the periods indicated:
COMMON SHARES
| | | | | | | | | | | | | | | | | | | | | | | | | | | | | |
| Month | TSX (TRP) | | NYSE (TRP) |
High
($) | Low
($) | Close
($) | Volume traded | | High
(US$) | Low
(US$) | Close
(US$) | Volume traded |
December 2025 | $77.13 | $73.47 | $75.58 | 135,417,416 | | | $56.34 | $53.29 | $55.01 | 41,845,330 | |
November 2025 | $77.73 | $69.41 | $75.50 | 61,399,157 | | | $55.34 | $49.27 | $54.72 | 41,655,751 | |
October 2025 | $77.26 | $69.79 | $70.38 | 130,458,322 | | | $55.37 | $49.84 | $50.16 | 53,521,212 | |
September 2025 | $75.72 | $70.69 | $75.67 | 130,669,258 | | | $54.41 | $51.08 | $54.41 | 42,740,936 | |
August 2025 | $72.26 | $65.74 | $71.52 | 61,652,740 | | | $52.26 | $47.76 | $52.06 | 30,495,956 | |
July 2025 | $66.99 | $63.34 | $66.16 | 155,628,759 | | | $48.91 | $46.29 | $47.88 | 52,376,366 | |
June 2025 | $71.12 | $63.99 | $66.48 | 196,248,816 | | | $51.99 | $46.53 | $48.79 | 65,419,664 | |
May 2025 | $70.88 | $66.89 | $69.54 | 48,067,304 | | | $51.34 | $47.92 | $50.64 | 33,773,035 | |
April 2025 | $70.33 | $62.17 | $69.65 | 177,046,397 | | | $50.50 | $43.59 | $50.41 | 69,452,348 | |
March 2025 | $70.97 | $64.31 | $67.96 | 201,361,199 | | | $49.70 | $44.40 | $47.21 | 48,195,155 | |
February 2025 | $67.94 | $62.55 | $64.75 | 63,507,626 | | | $47.51 | $43.51 | $44.74 | 36,662,346 | |
January 2025 | $70.05 | $64.65 | $65.49 | 111,508,044 | | | $48.64 | $44.86 | $45.05 | 44,082,793 | |
TC Energy Annual Information Form 2025 | 23
PREFERRED SHARES | | | | | | | | | | | | | | | | | | | | | | | | | | | | | | | | |
| Month | Series 1 | Series 2 | Series 3 | Series 4 | Series 5 | Series 61 | Series 7 | Series 9 | Series 10 | Series 112 |
December 2025 | | | | | | | | | | |
High | $21.39 | $19.95 | $18.32 | $17.00 | $19.46 | $19.96 | $24.64 | $23.60 | $23.38 | — |
Low | $20.69 | $18.92 | $17.74 | $16.40 | $18.25 | $18.20 | $23.70 | $22.61 | $20.60 | — |
Close | $21.39 | $19.75 | $18.15 | $16.89 | $19.42 | $19.61 | $24.39 | $23.47 | $21.68 | — |
| Volume Traded | 292,289 | 39,356 | 337,291 | 45,779 | 307,494 | 15,130 | 156,477 | 74,783 | 1,000 | — |
November 2025 | | | | | | | | | | |
High | $21.43 | $19.50 | $18.25 | $17.01 | $18.30 | $19.50 | $24.48 | $23.40 | $22.68 | $25.21 |
Low | $20.40 | $18.56 | $17.22 | $16.11 | $17.71 | $17.75 | $22.98 | $22.07 | $20.00 | $24.97 |
Close | $21.43 | $19.40 | $18.25 | $16.65 | $18.30 | $18.85 | $24.25 | $22.95 | $21.64 | $25.00 |
| Volume Traded | 144,604 | 56,626 | 309,410 | 15,282 | 407,861 | 15,352 | 161,768 | 166,682 | 2,158 | 317,135 |
October 2025 | | | | | | | | | | |
High | $20.50 | $18.95 | $17.50 | $16.54 | $17.74 | $17.99 | $24.21 | $23.16 | $21.75 | $25.25 |
Low | $19.93 | $18.44 | $16.91 | $15.96 | $17.45 | $16.70 | $23.19 | $21.70 | $19.95 | $24.80 |
Close | $20.50 | $18.61 | $17.49 | $16.12 | $17.74 | $17.80 | $24.21 | $23.14 | $21.38 | $25.17 |
| Volume Traded | 337,443 | 32,789 | 309,082 | 11,892 | 431,465 | 10,270 | 351,287 | 235,850 | 900 | 1,924,989 |
| | | | | | | | | | |
September 2025 | | | | | | | | | | |
High | $20.38 | $19.05 | $18.89 | $16.77 | $17.89 | $18.11 | $23.70 | $22.10 | $22.00 | $25.02 |
Low | $19.47 | $18.37 | $16.49 | $15.90 | $17.29 | $17.50 | $23.14 | $21.48 | $20.27 | $24.70 |
Close | $19.98 | $18.66 | $17.12 | $16.09 | $17.59 | $17.75 | $23.70 | $22.10 | $20.89 | $24.93 |
| Volume Traded | 756,487 | 25,412 | 292,785 | 52,963 | 63,032 | 9,820 | 544,082 | 310,960 | 7,325 | 273,236 |
August 2025 | | | | | | | | | | |
High | $20.91 | $19.50 | $17.42 | $16.90 | $17.96 | $18.12 | $23.60 | $22.46 | $22.00 | $24.95 |
Low | $20.06 | $18.63 | $15.62 | $15.99 | $17.55 | $16.70 | $22.86 | $21.34 | $20.25 | $24.34 |
Close | $20.19 | $19.29 | $17.31 | $16.79 | $17.79 | $18.09 | $23.45 | $22.00 | $21.15 | $24.95 |
| Volume Traded | 511,810 | 19,641 | 431,829 | 21,506 | 193,009 | 9,100 | 104,462 | 198,491 | 1,700 | 178,547 |
July 2025 | | | | | | | | | | |
High | $21.04 | $19.49 | $17.58 | $17.38 | $18.01 | $18.01 | $23.45 | $22.70 | $22.70 | $24.79 |
Low | $19.40 | $17.65 | $16.90 | $15.50 | $16.85 | $16.56 | $22.61 | $20.69 | $18.95 | $24.19 |
Close | $20.90 | $19.49 | $17.35 | $16.38 | $18.01 | $18.00 | $23.40 | $22.60 | $21.50 | $24.65 |
| Volume Traded | 447,238 | 79,713 | 832,684 | 36,414 | 617,227 | 18,677 | 270,239 | 150,387 | 3,402 | 298,652 |
June 2025 | | | | | | | | | | |
High | $19.48 | $17.90 | $17.10 | $15.95 | $17.32 | $17.05 | $22.91 | $20.95 | $20.30 | $24.20 |
Low | $18.47 | $16.85 | $15.02 | $14.99 | $15.21 | $15.16 | $21.87 | $19.86 | $18.00 | $22.70 |
Close | $19.48 | $17.86 | $17.10 | $15.92 | $16.91 | $16.75 | $22.62 | $20.83 | $19.75 | $24.15 |
| Volume Traded | 211,947 | 60,751 | 439,289 | 83,340 | 323,297 | 45,231 | 255,167 | 218,330 | 9,931 | 127,345 |
May 2025 | | | | | | | | | | |
High | $19.05 | $17.50 | $15.14 | $15.15 | $15.50 | $15.50 | $21.87 | $19.94 | $19.80 | $23.44 |
Low | $17.43 | $16.26 | $14.10 | $13.88 | $14.27 | $14.50 | $20.52 | $18.57 | $17.25 | $21.90 |
Close | $18.81 | $17.00 | $15.10 | $15.15 | $15.25 | $15.50 | $21.78 | $19.80 | $18.54 | $22.97 |
| Volume Traded | 217,650 | 154,003 | 463,983 | 28,008 | 643,789 | 35,955 | 380,863 | 251,042 | 2,800 | 270,472 |
April 2025 | | | | | | | | | | |
High | $18.50 | $17.92 | $14.85 | $14.90 | $15.11 | $15.55 | $21.44 | $19.61 | $19.40 | $23.00 |
Low | $16.47 | $15.80 | $13.45 | $13.36 | $13.41 | $14.15 | $19.26 | $17.13 | $16.55 | $20.80 |
Close | $17.36 | $16.10 | $14.08 | $14.08 | $14.18 | $14.75 | $20.48 | $18.49 | $17.50 | $21.77 |
| Volume Traded | 236,476 | 315,144 | 110,274 | 35,364 | 92,967 | 23,668 | 320,589 | 115,975 | 18,119 | 202,403 |
March 2025 | | | | | | | | | | |
High | $18.59 | $17.94 | $15.28 | $15.18 | $15.75 | $16.04 | $21.85 | $20.10 | $19.85 | $23.10 |
Low | $17.80 | $17.01 | $14.33 | $14.39 | $14.74 | $15.20 | $21.20 | $19.32 | $18.01 | $22.00 |
Close | $18.59 | $17.86 | $14.85 | $14.82 | $15.16 | $15.60 | $21.28 | $19.60 | $19.50 | $22.99 |
| Volume Traded | 432,891 | 30,318 | 165,621 | 28,700 | 402,604 | 18,902 | 442,303 | 110,932 | 2,903 | 213,490 |
February 2025 | | | | | | | | | | |
High | $18.81 | $18.35 | $15.70 | $15.64 | $16.02 | $16.20 | $21.80 | $20.20 | $22.20 | $23.41 |
Low | $18.29 | $17.70 | $15.15 | $14.87 | $15.55 | $15.73 | $21.01 | $19.41 | $19.00 | $22.50 |
Close | $18.32 | $17.75 | $15.23 | $15.07 | $15.76 | $15.89 | $21.80 | $19.84 | $19.45 | $23.10 |
| Volume Traded | 171,169 | 36,102 | 289,291 | 46,217 | 424,675 | 25,816 | 307,095 | 314,624 | 880 | 297,015 |
January 2025 | | | | | | | | | | |
High | $18.86 | $18.69 | $16.00 | $16.60 | $16.44 | $16.48 | $21.58 | $20.18 | $22.20 | $23.91 |
Low | $18.02 | $17.65 | $14.50 | $14.50 | $14.83 | $15.30 | $20.86 | $19.19 | $18.60 | $22.19 |
Close | $18.84 | $18.32 | $15.80 | $15.51 | $16.04 | $16.11 | $21.50 | $20.18 | $19.25 | $23.25 |
| Volume Traded | 545,144 | 319,340 | 216,777 | 64,613 | 153,320 | 30,739 | 444,395 | 476,345 | 3,160 | 113,966 |
1 TC Energy's cumulative redeemable first preferred shares, Series 6, were listed on the TSX under the symbol TRP.PR.I until their conversion into cumulative redeemable first preferred shares, Series 5 on January 30, 2026.
2 TC Energy's cumulative redeemable first preferred shares, Series 11, were listed on the TSX under the symbol TRP.PR.G until their redemption on November 28, 2025.
24 | TC Energy Annual Information Form 2025
Directors and officers
As of February 12, 2026, the directors and executive officers of TC Energy as a group beneficially owned, or exercised control
or direction over, directly or indirectly, an aggregate of 426,525 common shares, constituting 0.04 per cent of the common shares of TC Energy. The Company collects this information from our directors and executive officers but otherwise we have
no direct knowledge of individual holdings of TC Energy's securities.
DIRECTORS
The following table sets forth the names of the directors who serve on the Board as of February 12, 2026, together with
their jurisdictions of residence, all positions and offices held by them with TC Energy, unless otherwise stated, their principal occupations or employment during the past five years and the year from which each director has continually served as a director of TC Energy. Positions and offices held with TC Energy are also held by such person at TCPL. Each director holds office until the next annual meeting or until his or her successor is earlier elected or appointed.
| | | | | | | | | | | |
Name and place of residence | | Principal occupation during the five preceding years | Director since |
| Scott Bonham Atherton, California U.S.A. | | Corporate director. Co-founder of Intentional Capital Real Estate (Canada) (real estate asset management) since October 2014. Director, Loblaw Companies Limited (retail grocery) since October 2016. Advisor to the CEO, Magna International Inc. (Magna) (automotive manufacturing) from May 2021 to December 2025. Director, The Bank of Nova Scotia (Scotiabank) (chartered bank) from January 2016 to April 2025, and Magna from May 2012 to May 2021. | 2024 |
| Cheryl F. Campbell Monument, Colorado U.S.A. | | Corporate director. Director, Pacific Gas & Electric Corporation (PGE) (utilities) since April 2019, Summit Utilities (Summit) (natural gas distribution) since September 2020 and Board Chair of Summit since January 2024, JANA Corporation (engineering) since January 2020, and National Underground Group (infrastructure service provider) from March 2018 to December 2023. | 2022 |
| Michael R. Culbert Calgary, Alberta Canada | | Corporate director. Director, ARC Resources Ltd. (ARC) (oil and gas, exploration and production) since May 2024, Humble Midstream II LLC (oil and gas) from December 2023 to February 2025, Precision Drilling Corporation (Precision) (oil and gas services) from December 2017 to June 2024, Komfort IQ Canada (HVAC controls company) from June 2022 to December 2023, Reserve Royalty Income Trust (private oil and gas royalty trust) from May 2017 to June 2021, and Enerplus Corporation (Enerplus) (oil and gas, exploration and production) from March 2014 to August 2020. Vice-Chair (Non-Executive) and Director, PETRONAS Canada Ltd. (PETRONAS) (oil and natural gas) from November 2016 to March 2020. | 2020 |
| William D. Johnson Knoxville, Tennessee U.S.A. | | Corporate director. Director, Strata Clean Energy (renewable power) since January 2025, Terrestrial Energy Inc. (nuclear power) since February 2023, NiSource Inc. (utilities) since March 2022, and BrightNight LLC (renewable energy) since December 2021. President and CEO, PGE (utilities) from May 2019 to June 2020. | 2021 |
| Susan C. Jones Calgary, Alberta Canada | | Corporate director. Director, Canadian National Railway Limited (freight railway) since May 2022, Piedmont Lithium Inc. (Piedmont) (emerging lithium company) from June 2021 to June 2023, ARC from April 2020 to February 2023, and Gibson Energy Inc. (Gibson) (mid-stream oil-focused infrastructure company) from December 2018 to February 2020. | 2020 |
| John E. Lowe Houston, Texas U.S.A. | | Corporate director. Chair of the Board, TC Energy since January 2024. Member, International Board of Advisors, Horizon Engage (global intelligence platform) since February 2025. Director, Phillips 66 Company (energy infrastructure) from May 2012 to May 2025. Non-executive Chair of the Board, Apache Corporation (Apache) (oil and gas) from May 2015 to September 2022. Senior Executive Advisor at Tudor, Pickering, Holt & Co. LLC (energy investment and merchant banking) from September 2012 to August 2021. | 2015 |
TC Energy Annual Information Form 2025 | 25
| | | | | | | | | | | |
Name and place of residence | | Principal occupation during the five preceding years | Director since |
Dawn Madahbee Leach Little Current, Ontario Canada | | General Manager, Waubetek Business Corporation (Indigenous financial institution) since 1988 and Founder, President and CEO of Indigenous Business International (strategic advisor) since 2016. Director, Peace Hills Trust (financial institution) since 2012, English River First Nation’s Des Nedhe Group (Indigenous business investment) since 2024 and Chairperson of The National Indigenous Economic Development Board (federally appointed advisory board) since 2000. Director, Niobay Metals Inc. (mining) from May 2018 to June 2025. | 2024 |
| François L. Poirier Calgary, Alberta Canada | | President and CEO since January 2021. Chief Operating Officer (COO) and President, Power and Storage from September 2020 to December 2020. COO and President, Power and Storage and Mexico from January 2020 to September 2020. Executive Vice-President, Corporate Development and Strategy, and President, Power & Storage and Mexico from May 2019 to January 2020. Director, Canadian Imperial Bank of Commerce (chartered bank) since September 2024. | 2021 |
| Una Power Vancouver, British Columbia Canada | | Corporate director. Director, Teck Resources Limited (Teck) (diversified mining) since April 2017 and Scotiabank (chartered bank) since April 2016. | 2019 |
| Mary Pat Salomone Naples, Florida U.S.A. | | Corporate director. Director, South Bow Corporation (energy infrastructure) since October 2024, Intertape Polymer Group (manufacturing) from November 2015 to June 2022, and Herc Rentals (equipment rental) from July 2016 to December 2021. | 2013 |
| Siim A. Vanaselja Toronto, Ontario Canada | | Corporate director. Chair of the Board, TC Energy from May 2017 to December 2023. Director, Power Corporation (financial services) since May 2020, Power Financial Corporation (financial services) since May 2018, RioCan Real Estate Investment Trust (real estate) since May 2017, and Great-West Lifeco Inc. (financial services) since May 2014. | 2014 |
| Thierry Vandal Mamaroneck, New York U.S.A. | | President, Axium Infrastructure U.S., Inc. (independent infrastructure fund management firm) and Director, Axium Infrastructure Inc. (independent infrastructure fund management firm) since 2015. Director, Royal Bank of Canada (chartered bank) since 2015. | 2017 |
| Dheeraj "D" Verma Houston, Texas U.S.A. | | Senior Advisor, Quantum Energy Partners (Quantum) (private equity firm) since November 2021. President, Quantum Energy Partners from November 2016 to November 2021. Director, Jagged Peak Energy Inc. (oil and gas) from January 2017 to January 2020. | 2022 |
Cease Trade Orders, Bankruptcies, Penalties or Sanctions
As of the date hereof, except as indicated below, no other director or executive officer of the Company is or was a director
or officer of another company in the past 10 years that:
•was the subject of a cease trade or similar order, or an order denying that company access to any exemption under securities legislation, that was in effect for a period of more than 30 consecutive days
•was involved in an event that resulted in the company being subject to one of the above orders after the director or executive officer no longer held that role with the company, which resulted from an event that occurred while that person was acting
in the capacity as director, chief executive officer or chief financial officer
•while acting in that capacity, or within a year of ceasing to act in that capacity, became bankrupt, made a proposal under any legislation relating to bankruptcy or insolvency or was subject to or instituted any proceedings, arrangement or compromise with creditors or had a receiver, receiver manager or trustee appointed to hold the assets of that company.
In January 2019, PGE filed for bankruptcy under Chapter 11 of the United States Bankruptcy Code as a result of claims arising from fires caused by PGE’s electrical equipment. Following discussions initiated by the PGE board of directors, Mr. Johnson agreed to serve as President and CEO throughout PGE’s bankruptcy process, beginning May 2, 2019, with the understanding that upon PGE’s emergence from bankruptcy he would resign from PGE. On July 1, 2020, PGE emerged from Chapter 11 bankruptcy, upon completing a restructuring process that was confirmed by the United States Bankruptcy Court on June 20, 2020. Mr. Johnson resigned as President and CEO of PGE on June 30, 2020.
Ms. Campbell joined the board of directors of PGE in April 2019, after PGE filed for bankruptcy under Chapter 11 of the United States Bankruptcy Code in January 2019 and prior to its emergence from Chapter 11 bankruptcy in July 2020. Ms. Campbell continues to be a director of PGE.
26 | TC Energy Annual Information Form 2025
No director or executive officer of the Company has within the past 10 years:
•become bankrupt
•made a proposal under any legislation relating to bankruptcy or insolvency
•become subject to or launched any proceedings, arrangement or compromise with any creditors, or
•had a receiver, receiver manager or trustee appointed to hold any of their assets.
No director or executive officer of the Company has been subject to:
•any penalties or sanctions imposed by a court relating to securities legislation or by a securities regulatory authority
or has entered into a settlement agreement with a securities regulatory authority, or
•any other penalties or sanctions imposed by a court or regulatory body that would likely be considered important
to a reasonable investor in making an investment decision.
BOARD COMMITTEES
TC Energy has four standing committees of the Board: the Audit Committee, the Governance Committee, the Health, Safety, Sustainability and Environment Committee and the Human Resources Committee. As President and CEO of TC Energy, Mr. Poirier is not a member of any Board committees, but is invited to attend committee meetings as required.
The voting members of each of these committees, as of February 12, 2026, are identified below. Information about the Audit Committee can be found in this AIF under the heading Audit Committee.
| | | | | | | | | | | | | | |
Director | Audit Committee | Governance Committee | Health, Safety, Sustainability and Environment Committee | Human Resources Committee |
Scott Bonham | ü | | | ü |
Cheryl F. Campbell | ü | | ü | |
| Michael R. Culbert | ü | | ü | |
| William D. Johnson | | ü | | Chair |
Susan C. Jones | ü | | | ü |
John E. Lowe (Chair) | | ü | | ü |
Dawn Madahbee Leach | ü | | ü | |
| Una Power | Chair | | ü | |
| Mary Pat Salomone | | ü | Chair | |
Siim A. Vanaselja | | ü | | ü |
| Thierry Vandal | | Chair | ü | |
| Dheeraj "D" Verma | | ü | | ü |
TC Energy Annual Information Form 2025 | 27
OFFICERS
With the exception of Tina V. Faraca, Patrick C. Muttart, Sean P. O'Donnell and Alisa M. Williams, all of the executive officers and corporate officers of TC Energy reside in Alberta, Canada. Positions and offices held with TC Energy are also held by such person at TCPL. As of the date hereof, the officers of TC Energy, their present positions within TC Energy, unless otherwise stated, and their principal occupations during the five preceding years are as follows:
Executive officers
| | | | | | | | |
| Name | Present position held | Principal occupation during the five preceding years |
François L. Poirier
| President and Chief Executive Officer | Prior to January 2021, COO and President, Power and Storage. Prior to September 2020, COO and President, Power and Storage and Mexico. Prior to January 2020, Executive Vice-President, Corporate Development and Strategy, and President, Power & Storage and Mexico. |
| Dawn E. de Lima | Executive Vice-President, Corporate Services | Prior to December 2020, Chief Shared Services Officer, TransAlta Corporation (electricity service provider). |
Anita Dusevic Oliva | Executive Vice-President and General Counsel | Prior to April 1, 2025, Operating Partner, Brookfield Infrastructure (infrastructure). Prior to February 2023, COO, Inter Pipeline Ltd. (Inter Pipeline) (oil and natural gas). Prior to April 2022, Senior Vice President, Corporate Services, Inter Pipeline. Prior to November 2020, Vice President, Legal, Inter Pipeline. |
Tina V. Faraca Texas, U.S.A. | Executive Vice-President and Chief Operating Officer, Natural Gas Pipelines | Prior to February 2025, Executive Vice-President and President, U.S. Natural Gas Pipelines. Prior to August 2023, President, U.S. Natural Gas Pipelines. Prior to September 2022, Senior Vice-President, Operations, Projects and Technical Operational Services. Prior to December 2021, Senior Vice-President, Commercial. Prior to April 2020, Chief Commercial Officer, Enable Midstream (oil and natural gas). |
| Gregory D. Grant | Executive Vice-President and President, Power and Energy Solutions | Prior to February 2025, President, Canadian Natural Gas Pipelines. Prior to January 2022, Senior Vice-President, Commercial. Prior to March 2020, Senior Vice-President, Strategy and Corporate Development. |
Patrick C. Muttart Illinois, U.S.A. | Senior Vice-President, External Relations | Prior to December 2022, Senior Vice-President, Stakeholder Relations. Prior to September 2021, Director External Affairs, PMI Global Services (tobacco manufacturing). |
Sean P. O'Donnell Texas, U.S.A. | Executive Vice-President, Strategy and Corporate Development and Chief Financial Officer | Prior to February 2025, Executive Vice-President and Chief Financial Officer (CFO). Prior to May 2024, Senior Vice-President, Capital Markets and Corporate Planning. Prior to November 2023, Executive Vice-President and CFO, Mexico Pacific Holdings LLC (energy infrastructure). Prior to November 2023, Operating Partner, Partner and Managing Director, Quantum Capital Group, LLC (formerly known as Quantum Energy Partners, LLC) (private equity firm). |
28 | TC Energy Annual Information Form 2025
Corporate officers
| | | | | | | | |
Name | Present position held | Principal occupation during the five preceding years |
Jane M. Brindle
| Vice-President, Law and Corporate Secretary | Prior to December 2024, Director, Corporate Secretarial and Finance Law. |
Yvonne Frame-Zawalykut | Vice-President, Corporate Controller | Prior to February 2023, Vice-President and Assistant Controller. Prior to November 2022, Director, Corporate Planning. Prior to December 2020, Director, Internal Group Finance. |
David R. Marchand | Vice-President, Finance and Treasurer | Prior to December 2024, Vice-President, Finance. Prior to November 2024, Director, Finance. Prior to October 2021, Manager, Finance. |
Michele L. Waters | Vice-President, Risk Management | Prior to November 2024, Director, Risk and Insurance, Cenovus Energy Inc. |
Alisa M. Williams Texas, U.S.A. | Vice-President, Tax | Prior to August 2023, Director, Income Tax, U.S. and Mexico. |
CONFLICTS OF INTEREST
Directors and officers of TC Energy and its subsidiaries are required to disclose any existing or potential conflicts in accordance with TC Energy's policies governing directors and officers and in accordance with the CBCA.
COBE covers potential conflicts of interest and requires that all employees, officers, directors and contract workers of TC Energy avoid situations that may result in a potential conflict.
In the event an employee, officer, director or contract worker finds themselves in a potential conflict situation, COBE stipulates that:
•the conflict should be reported; and
•the person should refrain from participation in any decision or action where there is a real or perceived conflict.
COBE also notes that employees and officers of TC Energy may not engage in outside business activities that are in conflict
with or detrimental to the interests of TC Energy. The CEO and the executive leadership team must receive consent from
the Chair of the Governance Committee for all outside business activities.
Under COBE, directors must also declare any material interest that they may have in a material contract or transaction
and recuse themselves from related deliberations and approvals.
In addition to COBE, the directors and corporate officers of TC Energy are required to disclose any related parties and related party transactions in their annual directors and officers questionnaires. These questionnaires assist TC Energy in identifying
and monitoring material related party transactions.
The Governance Committee reviews and approves any material related party transactions prior to the transaction occurring,
and maintains oversight over material related party transactions following such approval.
There were no material conflicts of interests or related party transactions reported by the Board, CEO or the corporate officers, including the executive leadership team, in 2025.
TC Energy Annual Information Form 2025 | 29
Serving on other boards
The Board believes that it is important for it to be composed of qualified and knowledgeable directors. As a result, due to
the specialized nature of the energy infrastructure business, some of the directors are associated with or sit on the boards
of companies that ship natural gas through our pipeline systems. Transmission services on most of TC Energy’s pipeline systems in Canada and the U.S. are subject to regulation and, accordingly, we generally cannot deny transportation services to a creditworthy shipper. The Governance Committee monitors relationships among directors to ensure that business associations do not affect the Board’s performance.
The Board considers whether directors serving on the boards of, or acting as officers or in another similar capacity, for other entities including public and private companies, Crown corporations and other state-owned entities, and non-profit organizations pose any potential conflict. The Board reviews these relationships annually to determine that they do not interfere with any of our director’s ability to act in our best interests. If a director declares a material interest in any material contract
or material transaction being considered at a meeting, the director is not present during the discussion and does not vote
on the matter.
COBE requires employees to receive consent before accepting a directorship with an entity that is not an affiliate. The CEO
and executive vice-presidents must receive the consent of the Chair of the Governance Committee. All other employees must receive the consent of the Corporate Secretary or their delegate.
Affiliates
The Board oversees relationships between TC Energy and any affiliates to avoid any potential conflicts of interest.
Corporate governance
Our Board and management are committed to the highest standards of ethical conduct and corporate governance.
TC Energy is a public company listed on the TSX and the NYSE, and we recognize and respect rules and regulations in both Canada and the U.S.
Our corporate governance practices comply with the Canadian governance guidelines, which include the governance rules
of the CBCA, TSX and Canadian Securities Administrators, including:
•National Instrument 52-110, Audit Committees,
•National Policy 58-201, Corporate Governance Guidelines, and
•National Instrument 58-101, Disclosure of Corporate Governance Practices.
We also comply with the governance listing standards of the NYSE and the governance rules of the SEC that apply, in each case, to foreign private issuers.
Our governance practices comply with the NYSE standards for U.S. companies in all significant respects. As a non-U.S. company, we are not required to comply with most of the governance listing standards of the NYSE. As a foreign private issuer, however, we must disclose how our governance practices differ from those followed by U.S. companies that are subject to the NYSE standards. Our corporate governance practices do not significantly differ from those required to be followed by U.S. domestic issuers under the NYSE's listing standards. A summary of our governance practices compared to U.S. standards can be found on our website (www.tcenergy.com).
We benchmark our policies and procedures against major North American companies to assess our standards and we adopt best practices as appropriate. Some of our best practices are derived from the NYSE rules and comply with applicable rules adopted
by the SEC to meet the requirements of the Sarbanes-Oxley Act of 2002 and the Dodd-Frank Wall Street Reform and Consumer Protection Act.
30 | TC Energy Annual Information Form 2025
Audit Committee
The Audit Committee is responsible for assisting the Board in overseeing the integrity of our financial statements and our compliance with legal and regulatory requirements. It is also responsible for overseeing and monitoring the accounting and reporting process and the process, performance and independence of our internal and external auditors. The charter of the
Audit Committee can be found in Schedule B of this AIF.
RELEVANT EDUCATION AND EXPERIENCE OF MEMBERS
The members of the Audit Committee as of February 12, 2026 are Una Power (Chair), Scott Bonham, Cheryl F. Campbell, Michael R. Culbert, Susan C. Jones and Dawn Madahbee Leach.
The Board believes that the composition of the Audit Committee reflects a high level of financial literacy and expertise.
Each member of the Audit Committee has been determined by the Board to be independent and financially literate within the meaning of the definitions under Canadian and U.S. securities laws and the NYSE rules. In addition, the Board has determined that Ms. Power is an Audit Committee Financial Expert as that term is defined under U.S. securities laws. The Board has made
this determination based on the education and breadth and depth of experience of each member of the Audit Committee.
The following is a description of the education and experience, apart from their respective roles as directors of TC Energy,
of each member of the Audit Committee that is relevant to the performance of his or her responsibilities as a member of
the Audit Committee.
Una Power (Chair)
Ms. Power earned a Bachelor of Commerce (Honours) degree from Memorial University and holds Chartered Professional Accountant, Chartered Accountant and Chartered Financial Analyst designations. She serves on the board of directors for Teck where she currently serves as Audit Committee Chair and also serves on the board of directors for Scotiabank, where she previously served as a member and Chair of its Audit Committee. Ms. Power was previously the Chief Financial Officer of Nexen Energy ULC, a former publicly traded oil and gas company that is now a wholly-owned subsidiary of CNOOC Limited, where she held various executive positions with responsibility for financial and risk management, strategic planning, budgeting, business development, energy marketing and trading, information technology and capital investment.
Scott Bonham
Mr. Bonham holds a Bachelor of Science degree in electrical engineering from Queen’s University and a Master of Business Administration from Harvard Business School. He currently serves on the board of directors for Loblaw Companies Limited, where he is a member of the Audit Committee and the Risk and Compliance Committee. He previously served on the board of directors for Scotiabank, where he was a member of the Audit and Conduct Review and Corporate Governance Committees. He has
an extensive background in venture capital and from 2000 to 2015, he was co-founder of GGV Capital. He is also the co-founder
of Intentional Capital Real Estate (Canada) and previously served as a director of Magna.
Cheryl F. Campbell
Ms. Campbell holds a Master of Science degree in finance, with a minor in management, from the University of Colorado, Denver, as well as Bachelor of Science degrees in chemical engineering and business from the University of Colorado, Boulder. She currently serves on the board of directors of PGE, where she is Chair of the Safety & Nuclear Oversight Committee as well
as a member of the Sustainability & Governance Committee. She also serves as the Chair of the board of Summit, as well as serving on the board of JANA Corporation. She previously served as a director and Audit Committee member of National Underground Group and, for 13 years, as Senior Vice President, Gas, with Xcel Energy, Inc.
Michael R. Culbert
Mr. Culbert holds a Bachelor of Science degree in Business Administration from Emmanuel College in Boston, Massachusetts.
He currently serves on the board of directors of ARC and is a member of the Human Resources and Compensation and Safety Reserves and Operational Excellence Committees. He previously served as a director of Precision, Reserve Royalty Income Trust, Enerplus and PETRONAS, and was a member of each of their Audit Committees, as well as the Vice-Chair of PETRONAS. Mr. Culbert was also a director and President of PNW LNG LP and former co-founder, director, President and Chief Executive Officer of Progress Energy Ltd.
TC Energy Annual Information Form 2025 | 31
Susan C. Jones
Ms. Jones earned a Bachelor of Arts degree in Political Science and Hispanic Studies from the University of Victoria. She also
holds a Bachelor of Laws degree from the University of Ottawa. She earned a Leadership Diploma from the University of Oxford and holds a Director Certificate from Harvard University. Ms. Jones serves as a director of Canadian National Railway Company and is a member of its Audit, Finance and Risk Committee and Chair of its Safety & Environment Committee. Ms. Jones previously served as a director of ARC and was a member of the Audit and Finance Committee of Seven Generations Energy Ltd. prior to
its merger with ARC. She also served as a director of Piedmont. She previously served on the boards and as a member of the Audit Committees of Gibson and Canpotex Limited, where she also served as Chair of the board. Ms. Jones held an executive leadership role at Nutrien Ltd. for 15 years, most recently as Executive Vice-President and Chief Executive Officer of the Potash Business Unit.
Dawn Madahbee Leach
Ms. Madahbee Leach graduated from the University of Waterloo’s Economic Development Program and holds a degree
in Political Science and Law from York and Laurentian Universities. She is the General Manager for the Waubetek Business Development Corporation since she helped create and start the organization in 1988. Waubetek is a leading Indigenous Financial Institution that provides financial services to Indigenous entrepreneurs across Canada. She is also the founder, President and Chief Executive Officer of Indigenous Business International, which assists Indigenous people and companies internationally with various economic sector strategies and project reviews. She is the Chair of the National Indigenous Economic Development Board and has been part of this federally appointed board since 2000, providing advice and guidance to the federal government on issues related to Indigenous economic policies and programming. She also serves on the board of Peace Hills Trust where she is
a member of the Executive, Loans and Trust Committees and is Chair of the Investment Committee. She also previously served as a board member of Niobay Metals Inc.
PRE-APPROVAL POLICIES AND PROCEDURES
TC Energy's Audit Committee maintains a pre-approval policy with respect to permitted non-audit services and audit services. For non-audit service engagements of up to $250,000, approval of the Audit Committee Chair is required, and the Audit Committee is to be informed of the engagement at the next scheduled Audit Committee meeting. For all non-audit service engagements of $250,000 or more, pre-approval of the Audit Committee is required.
To date, all non-audit services have been pre-approved by the Audit Committee in accordance with the pre-approval policy described above.
EXTERNAL AUDITOR SERVICE FEES
The table below shows the services KPMG LLP provided during the last two fiscal years and the fees they invoiced us:
| | | | | | | | |
| ($ millions) | 2025 | 2024 |
| | |
Audit fees | | |
•audit of the annual consolidated financial statements | 18.7 | 19.4 |
•services related to statutory and regulatory filings or engagements | | |
•review of interim consolidated financial statements and information contained in various prospectuses and other securities offering documents | | |
Audit-related fees | 0.1 | 1.4 |
•services related to the audit of the financial statements of TC Energy pipeline abandonment trusts and certain post-retirement plans, and certain special purpose audits | | |
Tax fees | 1.0 | 1.5 |
•Canadian and international tax planning and tax compliance matters, including the review of income tax returns and other tax filings | | |
| All other fees | 0.4 | 0.5 |
•fees for other products and services provided by the auditors and not described above, which included fees related to advice and assistance with ESG services, and French and Spanish translation services | | |
Total fees | 20.2 | 22.8 |
Note
•2025 total fees are lower than 2024 primarily due to the Spinoff Transaction work included in 2024.
32 | TC Energy Annual Information Form 2025
Legal proceedings and regulatory actions
Except as described below, there are no legal proceedings in respect of which the Company is or was a party, or in respect
of which any of the Company’s property is or was the subject during the year ended December 31, 2025, nor are there any such proceedings known by the Company to be contemplated, that involve a claim for damages exceeding 10% of the Company’s current assets. In addition, there have not been any (a) penalties or sanctions imposed against the Company by a court relating to securities legislation or by a securities regulatory authority during the year ended December 31, 2025, (b) any other penalties or sanctions imposed by a court or regulatory body against the Company that would likely be considered important to a reasonable investor in making an investment decision, or (c) settlement agreements entered into by the Company before
a court relating to securities legislation or with a securities regulatory authority during the year ended December 31, 2025.
Pacific Atlantic Pipeline Construction Ltd.
CGL LP and Pacific Atlantic Pipeline Construction Ltd., one of the prime contractors on the Coastal GasLink pipeline, and their parent company Bonatti S.p.A, reached a mutually acceptable resolution to their disputes in third quarter 2025. The settlement was not an admission of liability by either party and the parties mutually released their respective claims in arbitration.
Details of the arbitration and the settlement are confidential, but did include the retention by CGL LP of the letter of credit
funds drawn in 2024 and the settlement did not have a material impact on the Company's financial statements.
TC Energy Annual Information Form 2025 | 33
Transfer agent and registrar
TC Energy's transfer agent and registrar is Computershare Investor Services, Inc. with its Canadian transfer facilities in the cities of Calgary, Montréal, Toronto and Vancouver.
Material contracts
TC Energy did not enter into any material contracts outside the ordinary course of business during the year ended December 31, 2025, nor has it entered into any material contracts outside the ordinary course of business prior to the year ended December 31, 2025 which are still in effect as at the date of this AIF.
Interest of experts
KPMG LLP are the auditors of TC Energy and have confirmed with respect to TC Energy that they are independent within the meaning of the relevant rules and related interpretations prescribed by the relevant professional bodies in Canada and any applicable legislation or regulations and also that they are independent accountants with respect to TC Energy under all relevant U.S. professional and regulatory standards.
Additional information
1.Additional information in relation to TC Energy may be found under TC Energy's profile on SEDAR+ (www.sedarplus.ca).
2.Additional information including directors' and officers' remuneration and indebtedness, principal holders of TC Energy's securities and securities authorized for issuance under equity compensation plans (all where applicable), is contained in TC Energy's Management Information Circular for its most recent annual meeting of shareholders that involved the election of directors and can be obtained upon request from the Corporate Secretary of TC Energy.
3.Additional financial information is provided in TC Energy's audited consolidated financial statements and MD&A for its most recently completed financial year.
34 | TC Energy Annual Information Form 2025
Glossary
Capitalized terms used throughout this AIF but not otherwise defined herein have the meanings given to such terms in the MD&A and are incorporated by reference into this AIF.
| | | | | | | | |
| Units of measure |
| Bcf | | Billion cubic feet |
| hp | | Horsepower |
| km | | Kilometres |
| MMcf/d | | Million cubic feet per day |
| MW | | Megawatt(s) |
| MWh | | Megawatt hours |
| TJ/d | | Terajoules per day |
| | |
| General terms and terms related to our operations |
| B.C. | | British Columbia |
| ESG | | Environmental, social and governance |
FID | | Final investment decision |
| force majeure | | Unforeseeable circumstances that prevent a party to a contract from fulfilling it |
| GHG | | Greenhouse gas |
| investment base | | Includes rate base as well as assets under construction |
| LNG | | Liquefied natural gas |
| MCR | | Major component replacement |
| rate base | | Average assets in service, working capital and deferred amounts used in setting of regulated rates |
| WCSB | | Western Canada Sedimentary Basin |
| Year End | | Year ended December 31, 2025 |
| | | | | | | | |
| Accounting terms |
AFUDC | | Allowance for funds used during construction |
| GAAP | | U.S. generally accepted accounting principles |
| ROE | | Return on common equity |
| | |
| Government and regulatory bodies terms |
| AER | | Alberta Energy Regulator |
| BCEAO | | Environmental Assessment Office (British Columbia) |
| BCER | | B.C. Energy Regulator (formerly B.C. Oil and Gas Commission) |
| CBCA | | Canada Business Corporations Act |
| CER | | Canada Energy Regulator (formerly the National Energy Board (Canada)) |
| CFE | | Comisión Federal de Electricidad (Mexico) |
CNE | | Comisión Nacional de Energía (Mexico) |
| DOS | | U.S. Department of State |
| FERC | | Federal Energy Regulatory Commission (U.S.) |
| IESO | | Independent Electricity System Operator (Ontario) |
| NYSE | | New York Stock Exchange |
| PHMSA | | Pipeline and Hazardous Materials Safety and Administration |
| SEC | | U.S. Securities and Exchange Commission |
| TSX | | Toronto Stock Exchange |
TC Energy Annual Information Form 2025 | 35
Schedule A
METRIC CONVERSION TABLE
The conversion factors set out below are approximate factors. To convert from Metric to Imperial multiply by the factor indicated. To convert from Imperial to Metric divide by the factor indicated.
| | | | | | | | |
| Metric | Imperial | Factor |
Kilometres | Miles | 0.62 |
Millimetres | Inches | 0.04 |
Gigajoules | Million British thermal units | 0.95 |
Cubic metres* | Cubic feet | 35.3 |
Kilopascals | Pounds per square inch | 0.15 |
Degrees Celsius | Degrees Fahrenheit | to convert to Fahrenheit multiply by 1.8, then add 32 degrees; to convert to Celsius subtract 32 degrees, then divide by 1.8 |
*The conversion is based on natural gas at a base pressure of 101.325 kilopascals and at a base temperature of 15 degrees Celsius.
36 | TC Energy Annual Information Form 2025
Schedule B
CHARTER OF THE AUDIT COMMITTEE
1. PURPOSE
The Audit Committee shall assist the Board of Directors (the Board) in overseeing and monitoring, among other things, the:
•Company’s financial accounting and reporting process;
•integrity of the financial statements;
•Company’s internal control over financial reporting;
•external financial audit process;
•compliance by the Company with legal and regulatory requirements; and
•independence and performance of the Company’s internal and external auditor.
To fulfill its purpose, the Audit Committee has been delegated certain authorities by the Board that it may exercise on behalf of the Board.
2. ROLES AND RESPONSIBILITIES
I. Appointment of the Company’s External Auditor
Subject to confirmation by the external auditor of their compliance with Canadian and U.S. regulatory registration requirements, the Audit Committee shall recommend to the Board the appointment of the external auditor, such appointment to be confirmed by the Company’s shareholders at each annual meeting. The Audit Committee shall also recommend to the Board the compensation to be paid to the external auditor for audit services. The Audit Committee shall also be directly responsible for the oversight of the work of the external auditor (including resolution of disagreements between management and the external auditor regarding financial reporting) for the purpose of preparing or issuing an audit report or related work. The external auditor shall report directly to the Audit Committee.
The Audit Committee shall review and approve the audit plan of the external auditor. The Audit Committee shall also receive periodic reports from the external auditor regarding the auditor’s independence, discuss such reports with the auditor, consider whether the provision of non‑audit services is compatible with maintaining the auditor’s independence and take appropriate action to satisfy itself of the independence of the external auditor. In addition, to further satisfy itself of audit quality and the independence of the external auditor, the Audit Committee shall undertake a Periodic Comprehensive Review of the External Auditor at least once every five years.
II. Oversight in Respect of Financial Disclosure
The Audit Committee shall, to the extent it deems it necessary or appropriate:
(a) review, discuss with management and the external auditor and recommend to the Board for approval, the Company’s audited annual consolidated financial statements, annual information form, management’s discussion and analysis (MD&A), all financial information in prospectuses and other offering memoranda, financial statements required by securities regulators, all prospectuses and all documents which may be incorporated by reference into a prospectus, including, without limitation, the annual management information circular, but excluding any pricing or prospectus supplement relating to the issuance of debt securities of the Company;
(b) review, discuss with management and the external auditor and approve, the release to the public of the Company’s interim reports, including the consolidated financial statements, MD&A and news releases on quarterly financial results;
(c) review and discuss with management and the external auditor the use of non-GAAP information and the applicable reconciliation;
TC Energy Annual Information Form 2025 | 37
(d) review and discuss with management any financial outlook or future-oriented financial information disclosure in advance of its public release; provided, however, that such discussion may be done generally (consisting of discussing the types of information to be disclosed and the types of presentations to be made). The Audit Committee need not discuss in advance each instance in which the Company may provide financial projections or presentations to credit rating agencies;
(e) review with management and the external auditor major issues regarding accounting policies and auditing practices, including any significant changes in the Company’s selection or application of accounting policies, as well as major issues as to the adequacy of the Company’s internal controls and any special audit steps adopted in light of material control deficiencies that could significantly affect the Company’s financial statements;
(f) review and discuss quarterly findings reports from the external auditor on:
(i) all critical accounting policies and practices to be used;
(ii) all alternative treatments of financial information within generally accepted accounting principles that have been discussed with management, ramifications of the use of such alternative disclosures and treatments, and the treatment preferred by the external auditor;
(iii) other material written communications between the external auditor and management, such as any management letter or schedule of unadjusted differences;
(g) review with management and the external auditor the effect of regulatory and accounting developments on the Company’s financial statements;
(h) review with management and the external auditor the effect of any off-balance sheet structures on the Company’s financial statements;
(i) review with management, the external auditor and, if necessary, legal counsel, any litigation, claim or contingency, including arbitration and tax assessments, that could have a material effect upon the financial position of the Company, and the manner in which these matters have been disclosed in the financial statements;
(j) review disclosures made to the Audit Committee by the Company’s Chief Executive Officer (CEO) and Chief Financial Officer (CFO) during their certification process for the periodic reports filed with securities regulators about any significant deficiencies in the design or operation of internal controls or material weaknesses therein and any fraud involving management or other employees who have a significant role in the Company’s internal controls;
(k) discuss with management the Company’s material financial risk exposures and the steps management has taken to monitor and control such exposures, including the Company’s risk assessment and risk management policies;
III. Oversight in Respect of Legal and Regulatory Matters
(a) review with the Company’s General Counsel legal matters that may have a material impact on the financial statements, the Company’s compliance policies and any material reports or inquiries received from regulators or governmental agencies;
IV. Oversight in Respect of Internal Audit
(a) review and approve the audit plans of the internal auditor of the Company including the degree of coordination between such plans and those of the external auditor and the extent to which the planned audit scope can be relied upon to detect weaknesses in internal control, fraud or other illegal acts;
(b) review the significant findings prepared by the internal audit department and recommendations issued by it or by any external party relating to internal audit issues, together with management’s response thereto;
(c) review compliance with the Company’s policies and avoidance of conflicts of interest;
(d) review the report prepared by the internal auditor on officers’ expenses and aircraft usage;
38 | TC Energy Annual Information Form 2025
(e) review the adequacy of the resources of the internal auditor to ensure the objectivity and independence of the internal audit function, including
(i) receive reports from the internal audit department on its audit process with subsidiaries and affiliates; and
(ii) review the Internal Audit Charter and as needed, approve any substantive changes.
(f) ensure the internal auditor has access to the Chair of the Audit Committee, the Board and the CEO and meet separately with the internal auditor to review with him or her any problems or difficulties he or she may have encountered and specifically:
(i) any difficulties which were encountered in the course of the audit work, including restrictions on the scope of activities or access to required information, and any disagreements with management;
(ii) any changes required in the planned scope of the internal audit;
(iii) the internal audit department responsibilities, budget and staffing;
and to report to the Board on such meetings;
V. Oversight in Respect of the External Auditor
(a) review any letter, report or other communication from the external auditor in respect of any identified weakness in internal control or unadjusted difference and management’s response and follow‑up, inquire regularly of management and the external auditor of any significant issues between them and how they have been resolved, and intervene in the resolution if required;
(b) receive and review annually the external auditor’s formal written statement of independence delineating all relationships between itself and the Company;
(c) meet separately with the external auditor to review any problems or difficulties the external auditor may have encountered and specifically:
(i) any difficulties which were encountered in the course of the audit work, including any restrictions on the scope of activities or access to required information, and any disagreements with management;
(ii) any changes required in the planned scope of the audit;
and to report to the Board on such meetings;
(d) meet with the external auditor prior to the audit to review the planning and staffing of the audit;
(e) receive and review annually the external auditor's written report on their own internal quality control procedures; any material issues raised by the most recent internal quality control review, or peer review, of the external auditor, or by any inquiry or investigation by governmental or professional authorities, within the preceding five years, and any steps taken to deal with such issues;
(f) review and evaluate the external auditor, including the lead partner of the external auditor team;
(g) ensure the rotation of the lead (or coordinating) audit partner having primary responsibility for the audit and the audit partner responsible for reviewing the audit as required by law, but at least every five years;
VI. Oversight in Respect of Audit and Non‑Audit Services
(a) pre-approve all audit services (which may entail providing comfort letters in connection with securities underwritings) and all permitted non‑audit services, other than non‑audit services where:
(i) the aggregate amount of all such non‑audit services provided to the Company that were not pre-approved constitutes not more than five percent of the total fees paid by the Company and its subsidiaries to the external auditor during the fiscal year in which the non‑audit services are provided;
(ii) such services were not recognized by the Company at the time of the engagement to be non‑audit services;
TC Energy Annual Information Form 2025 | 39
(iii) such services are promptly brought to the attention of the Audit Committee and approved, prior to the completion of the audit, by the Audit Committee or by one or more members of the Audit Committee to whom authority to grant such approvals has been delegated by the Audit Committee;
(b) approval by the Audit Committee of a non‑audit service to be performed by the external auditor shall be disclosed as required under securities laws and regulations;
(c) the Audit Committee may delegate to one or more designated members of the Audit Committee the authority to grant pre-approvals required by this subsection. The decisions of any member to whom authority is delegated to pre-approve an activity shall be presented to the Audit Committee at its first scheduled meeting following such pre-approval;
(d) if the Audit Committee approves an audit service within the scope of the engagement of the external auditor, such audit service shall be deemed to have been pre-approved for purposes of this subsection;
VII. Oversight in Respect of Certain Policies
(a) review and recommend to the Board for approval the implementation of, and significant amendments to, policies and program initiatives deemed advisable by management or the Audit Committee with respect to the Company’s code of business ethics (COBE), risk management and financial reporting policies;
(b) obtain reports from management, the Company’s senior internal auditing executive and the external auditor and report to the Board on the status and adequacy of the Company’s efforts to ensure its businesses are conducted and its facilities are operated in an ethical, legally compliant and socially responsible manner, in accordance with the Company’s COBE;
(c) establish a non‑traceable, confidential and anonymous system by which callers may ask for advice or report any ethical or financial concern, ensure that procedures for the receipt, retention and treatment of complaints in respect of accounting, internal controls and auditing matters are in place, and receive reports on such matters as necessary;
(d) annually review and assess the adequacy of the Company’s public disclosure policy;
(e) review and approve the Company’s hiring policy for partners, employees and former partners and employees of the present and former external auditor (recognizing the Sarbanes-Oxley Act of 2002 does not permit the CEO, controller, CFO or chief accounting officer to have participated in the Company’s audit as an employee of the external auditor during the preceding one-year period) and monitor the Company’s adherence to the policy;
VIII. Oversight in Respect of Financial Aspects of the Company’s Canadian Pension Plans (the Company’s pension plans), specifically:
(a)review and approve as needed the Statement of Investment Beliefs for the Company’s pension plans;
(b)delegate the ongoing administration and management of the financial aspects of the Canadian pension plans to the Pension Committee comprised of members of the Company’s management team appointed by the Human Resources Committee, in accordance with the Pension Committee Charter, which terms shall be approved by both the Audit Committee and the Human Resources Committee, and the terms of the Statement of Investment Beliefs;
(c)monitor the financial management activities of the Pension Committee and receive updates at least annually from the Pension Committee on the investment of the Plan assets to ensure compliance with the Statement of Investment Beliefs;
(d) provide advice to the Human Resources Committee on any proposed changes in the Company’s pension plans in respect of any significant effect such changes may have on pension financial matters;
(e) review and consider financial and investment reports and the funded status relating to the Company’s pension plans and recommend to the Board on pension contributions;
40 | TC Energy Annual Information Form 2025
(f) receive, review and report to the Board on the actuarial valuation and funding requirements for the Company’s pension plans;
(g) approve the initial selection or change of actuary for the Company’s pension plans;
(h) approve the appointment or termination of the pension plans’ auditor;
IX. U.S. Stock Plans
(a) review and approve the engagement and related fees of the auditor for any plan of a U.S. subsidiary that offers Company stock to employees as an investment option under the plan;
X. Oversight in Respect of Internal Administration
(a) review annually the reports of the Company’s representatives on certain audit committees of subsidiaries and affiliates of the Company and any significant issues and auditor recommendations concerning such subsidiaries and affiliates;
(b) oversee succession planning for the senior management in finance, treasury, tax, risk, internal audit and the controllers’ group;
XI. Information Security
(a)review quarterly, the report of the Chief Information Officer (or such other appropriate Company representative) on information security controls, education and awareness.
XII. Oversight Function
While the Audit Committee has the responsibilities and powers set forth in this Charter, it is not the duty of the Audit Committee to plan or conduct audits or to determine that the Company’s financial statements and disclosures are complete and accurate or are in accordance with generally accepted accounting principles and applicable rules and regulations. These are the responsibilities of management and the external auditor. The Audit Committee, its Chair and any of its members who have accounting or related financial management experience or expertise, are members of the Board, appointed to the Audit Committee to provide broad oversight of the financial disclosure, financial risk and control related activities of the Company, and are specifically not accountable nor responsible for the day to day operation of such activities. Although designation of a member or members as an “audit committee financial expert” is based on that individual’s education and experience, which that individual will bring to bear in carrying out his or her duties on the Audit Committee, designation as an “audit committee financial expert” does not impose on such person any duties, obligations or liability that are greater than the duties, obligations and liability imposed on such person as a member of the Audit Committee and Board in the absence of such designation. Rather, the role of any audit committee financial expert, like the role of all Audit Committee members, is to oversee the process and not to certify or guarantee the internal or external audit of the Company’s financial information or public disclosure.
3. COMPOSITION OF AUDIT COMMITTEE
The Audit Committee shall consist of three or more directors, a majority of whom are resident Canadians (as defined in the Canada Business Corporations Act), and all of whom are unrelated and/or independent for the purposes of applicable Canadian and United States securities law and applicable rules of any stock exchange on which the Company's securities are listed. Each member of the Audit Committee shall be financially literate and at least one member shall have accounting or related financial management expertise (as those terms are defined from time to time under the requirements or guidelines for audit committee service under securities laws and the applicable rules of any stock exchange on which the Company’s securities are listed for trading or, if it is not so defined, as that term is interpreted by the Board in its business judgment).
4. APPOINTMENT OF AUDIT COMMITTEE MEMBERS
The members of the Audit Committee shall be appointed by the Board from time to time on the recommendation of the Governance Committee and shall hold office until the next annual meeting of shareholders or until their successors are earlier appointed or until they cease to be directors of the Company.
TC Energy Annual Information Form 2025 | 41
5. VACANCIES
Where a vacancy occurs at any time in the membership of the Audit Committee, it may be filled by the Board on the recommendation of the Governance Committee.
6. AUDIT COMMITTEE CHAIR
The Board shall appoint a Chair of the Audit Committee who shall:
(a) review and approve the agenda for each meeting of the Audit Committee and, as appropriate, consult with members of management;
(b) preside over meetings of the Audit Committee;
(c) make suggestions and provide feedback from the Audit Committee to management regarding information that is or should be provided to the Audit Committee;
(d) report to the Board on the activities of the Audit Committee relative to its recommendations, resolutions, actions and concerns; and
(e) meet as necessary with the internal and external auditor.
7. ABSENCE OF AUDIT COMMITTEE CHAIR
If the Chair of the Audit Committee is not present at any meeting of the Audit Committee, one of the other members of the Audit Committee present at the meeting shall be chosen by the Audit Committee to preside at the meeting.
8. SECRETARY OF AUDIT COMMITTEE
The Corporate Secretary shall act as Secretary to the Audit Committee.
9. MEETINGS
The Chair, or any two members of the Audit Committee, or the internal auditor, or the external auditor, may call a meeting of the Audit Committee. The Audit Committee shall meet at least quarterly. The Audit Committee shall meet periodically with management, the internal auditor and the external auditor in separate executive sessions.
10. QUORUM
A majority of the members of the Audit Committee, present in person or by telephone or other telecommunication device that permit all persons participating in the meeting to speak to each other, shall constitute a quorum.
11. NOTICE OF MEETINGS
Notice of the time and place of every meeting shall be given in writing, facsimile communication or by other electronic means to each member of the Audit Committee at least 24 hours prior to the time fixed for such meeting; provided, however, that a member may in any manner waive a notice of a meeting. Attendance of a member at a meeting is a waiver of notice of the meeting, except where a member attends a meeting for the express purpose of objecting to the transaction of any business on the grounds that the meeting is not lawfully called.
12. ATTENDANCE OF COMPANY OFFICERS AND EMPLOYEES AT MEETING
At the invitation of the Chair of the Audit Committee, one or more officers or employees of the Company may attend any meeting of the Audit Committee.
13. PROCEDURE, RECORDS AND REPORTING
The Audit Committee shall fix its own procedure at meetings, keep records of its proceedings and report to the Board when the Audit Committee may deem appropriate but not later than the next meeting of the Board.
14. REVIEW OF CHARTER AND EVALUATION OF AUDIT COMMITTEE
The Audit Committee shall review its Charter annually or otherwise, as it deems appropriate and, if necessary, propose changes to the Governance Committee and the Board. The Audit Committee shall annually review the Audit Committee’s own performance.
42 | TC Energy Annual Information Form 2025
15. OUTSIDE EXPERTS AND ADVISORS
The Audit Committee is authorized, when deemed necessary or desirable, to retain and set and pay the compensation for independent counsel, outside experts and other advisors, at the Company’s expense, to advise the Audit Committee or its members independently on any matter.
16. RELIANCE
Absent actual knowledge to the contrary (which shall be promptly reported to the Board), each member of the Audit Committee shall be entitled to rely on (i) the integrity of those persons or organizations within and outside the Company from which it receives information, (ii) the accuracy of the financial and other information provided to the Audit Committee by such persons or organizations and (iii) representations made by management and the external auditor, as to any information technology, internal audit and other non-audit services provided by the external auditor to the Company and its subsidiaries.
TC Energy Annual Information Form 2025 | 43
Management's discussion and analysis
February 12, 2026
This management's discussion and analysis (MD&A) contains information to help the reader make investment decisions about TC Energy Corporation (TC Energy). It discusses our business, operations, financial position, risks and other factors for the year ended December 31, 2025.
This MD&A should also be read in conjunction with our December 31, 2025 audited Consolidated financial statements and notes for the same period, which have been prepared in accordance with U.S. GAAP.
Contents
| | | | | | | | |
| ABOUT THIS DOCUMENT | |
| ABOUT OUR BUSINESS | |
| | • Our core businesses | |
| | • Our strategy | |
| • 2025 Financial highlights | |
| •Non-GAAP measures | |
| •Supplementary financial measure | |
| • Outlook | |
| • Capital program | |
| NATURAL GAS PIPELINES BUSINESS | |
| CANADIAN NATURAL GAS PIPELINES | |
| U.S. NATURAL GAS PIPELINES | |
| MEXICO NATURAL GAS PIPELINES | |
| POWER AND ENERGY SOLUTIONS | |
| CORPORATE | |
| FOREIGN EXCHANGE | |
| FINANCIAL CONDITION | |
| DISCONTINUED OPERATIONS | |
| • Non-GAAP measures | |
| OTHER INFORMATION | |
| | • Risk oversight and enterprise risk management | |
| | • Controls and procedures | |
| | • Critical accounting estimates | |
| | • Financial instruments | |
| • Related party transactions | |
| | • Accounting changes | |
| | • Quarterly results | |
| GLOSSARY | |
TC Energy Management's discussion and analysis 2025 | 9
About this document
Throughout this MD&A, the terms we, us, our and TC Energy mean TC Energy Corporation and its subsidiaries. Abbreviations and acronyms that are not defined in the document are defined in the glossary on page 128. All information is as of February 12, 2026 and all amounts are in Canadian dollars, unless noted otherwise.
On October 1, 2024, TC Energy completed the spinoff of its Liquids Pipelines business into a new public company, South Bow Corporation (South Bow)(the Spinoff Transaction). Upon completion of the Spinoff Transaction, the Liquids Pipelines business was accounted for as a discontinued operation. To allow for a meaningful comparison, discussions throughout this MD&A are based on continuing operations unless otherwise noted. Refer to Note 4, Discontinued operations, of our 2025 Consolidated financial statements for additional information.
FORWARD-LOOKING INFORMATION
We disclose forward-looking information to help the reader understand management's assessment of our future plans and financial outlook and our future prospects overall.
Statements that are forward looking are based on certain assumptions and on what we know and expect today and generally include words like anticipate, expect, believe, may, will, should, estimate or other similar words.
Forward-looking statements in this MD&A include information about the following, among other things:
•our financial and operational performance, including the performance of our subsidiaries
•expectations about strategies and goals for growth and expansion, including acquisitions
•expected cash flows and future financing options available along with portfolio management
•expectations regarding the size, structure, timing, conditions and outcome of ongoing and future transactions
•expected dividend growth
•expected access to and cost of capital
•expected energy demand levels
•expected costs and schedules for planned projects, including projects under construction and in development
•expected capital expenditures, contractual obligations, commitments and contingent liabilities, including environmental remediation costs
•expected regulatory processes and outcomes
•expected outcomes with respect to legal proceedings, including arbitration and insurance claims
•expected impact of future tax and accounting changes
•commitments and targets contained in our Report on Sustainability, including statements related to our GHG emissions reduction targets, such as our methane emissions intensity target
•expected industry, market and economic conditions, and ongoing trade negotiations, including their impact on our customers and suppliers.
Forward-looking statements do not guarantee future performance. Actual events and results could be significantly different because of assumptions, risks or uncertainties related to our business or events that happen after the date of this MD&A.
10 | TC Energy Management's discussion and analysis 2025
Our forward-looking information is based on the following key assumptions and subject to the following risks and uncertainties:
Assumptions
•realization of expected impacts from acquisitions and divestitures
•regulatory decisions and outcomes
•planned and unplanned outages and the utilization of our pipelines, power and storage assets
•integrity and reliability of our assets
•anticipated construction costs, schedules and completion dates
•access to capital markets, including portfolio management
•expected industry, market and economic conditions, including the impact of these on our customers and suppliers
•inflation rates, commodity and labour prices
•interest, tax and foreign exchange rates
•nature and scope of hedging.
Risks and uncertainties
•realization of expected impacts from acquisitions and divestitures
•our ability to successfully implement our strategic priorities, and whether they will yield the expected benefits
•our ability to implement a capital allocation strategy aligned with maximizing shareholder value
•operating performance of our pipelines, power generation and storage assets
•amount of capacity sold and rates achieved in our pipeline businesses
•amount of capacity payments and revenues from power generation assets due to plant availability
•production levels within supply basins
•construction and completion of capital projects
•cost, availability of, and inflationary pressures on, labour, equipment and materials
•availability and market prices of commodities
•access to capital markets on competitive terms
•interest, tax and foreign exchange rates
•performance and credit risk of our counterparties
•regulatory decisions and outcomes of legal proceedings, including arbitration and insurance claims
•our ability to effectively anticipate and assess changes to government policies and regulations, including those related
to the environment
•our ability to realize the value of tangible assets and contractual recoveries
•competition in the businesses in which we operate
•unexpected or unusual weather
•acts of civil disobedience
•cybersecurity and technological developments
•sustainability-related risks including climate-related risks and the impact of energy transition on our business
•economic and political conditions, and ongoing trade negotiations in North America, as well as globally
•global health crises, such as pandemics and epidemics, and the impacts related thereto.
You can read more about these factors and others in this MD&A and in other reports we have filed with Canadian securities regulators and the SEC.
As actual results could vary significantly from the forward-looking information, you should not put undue reliance on forward-looking information and should not use future-oriented information or financial outlooks for anything other than their intended purpose. We do not update our forward-looking statements due to new information or future events unless we are required to by law.
FOR MORE INFORMATION
You can find more information about TC Energy in our Annual Information Form and other disclosure documents, which are available on SEDAR+ (www.sedarplus.ca).
TC Energy Management's discussion and analysis 2025 | 11
About our business
With over 70 years of experience, TC Energy is a leader in the responsible development and reliable operation of North American energy infrastructure, including natural gas pipelines, power generation and natural gas storage facilities.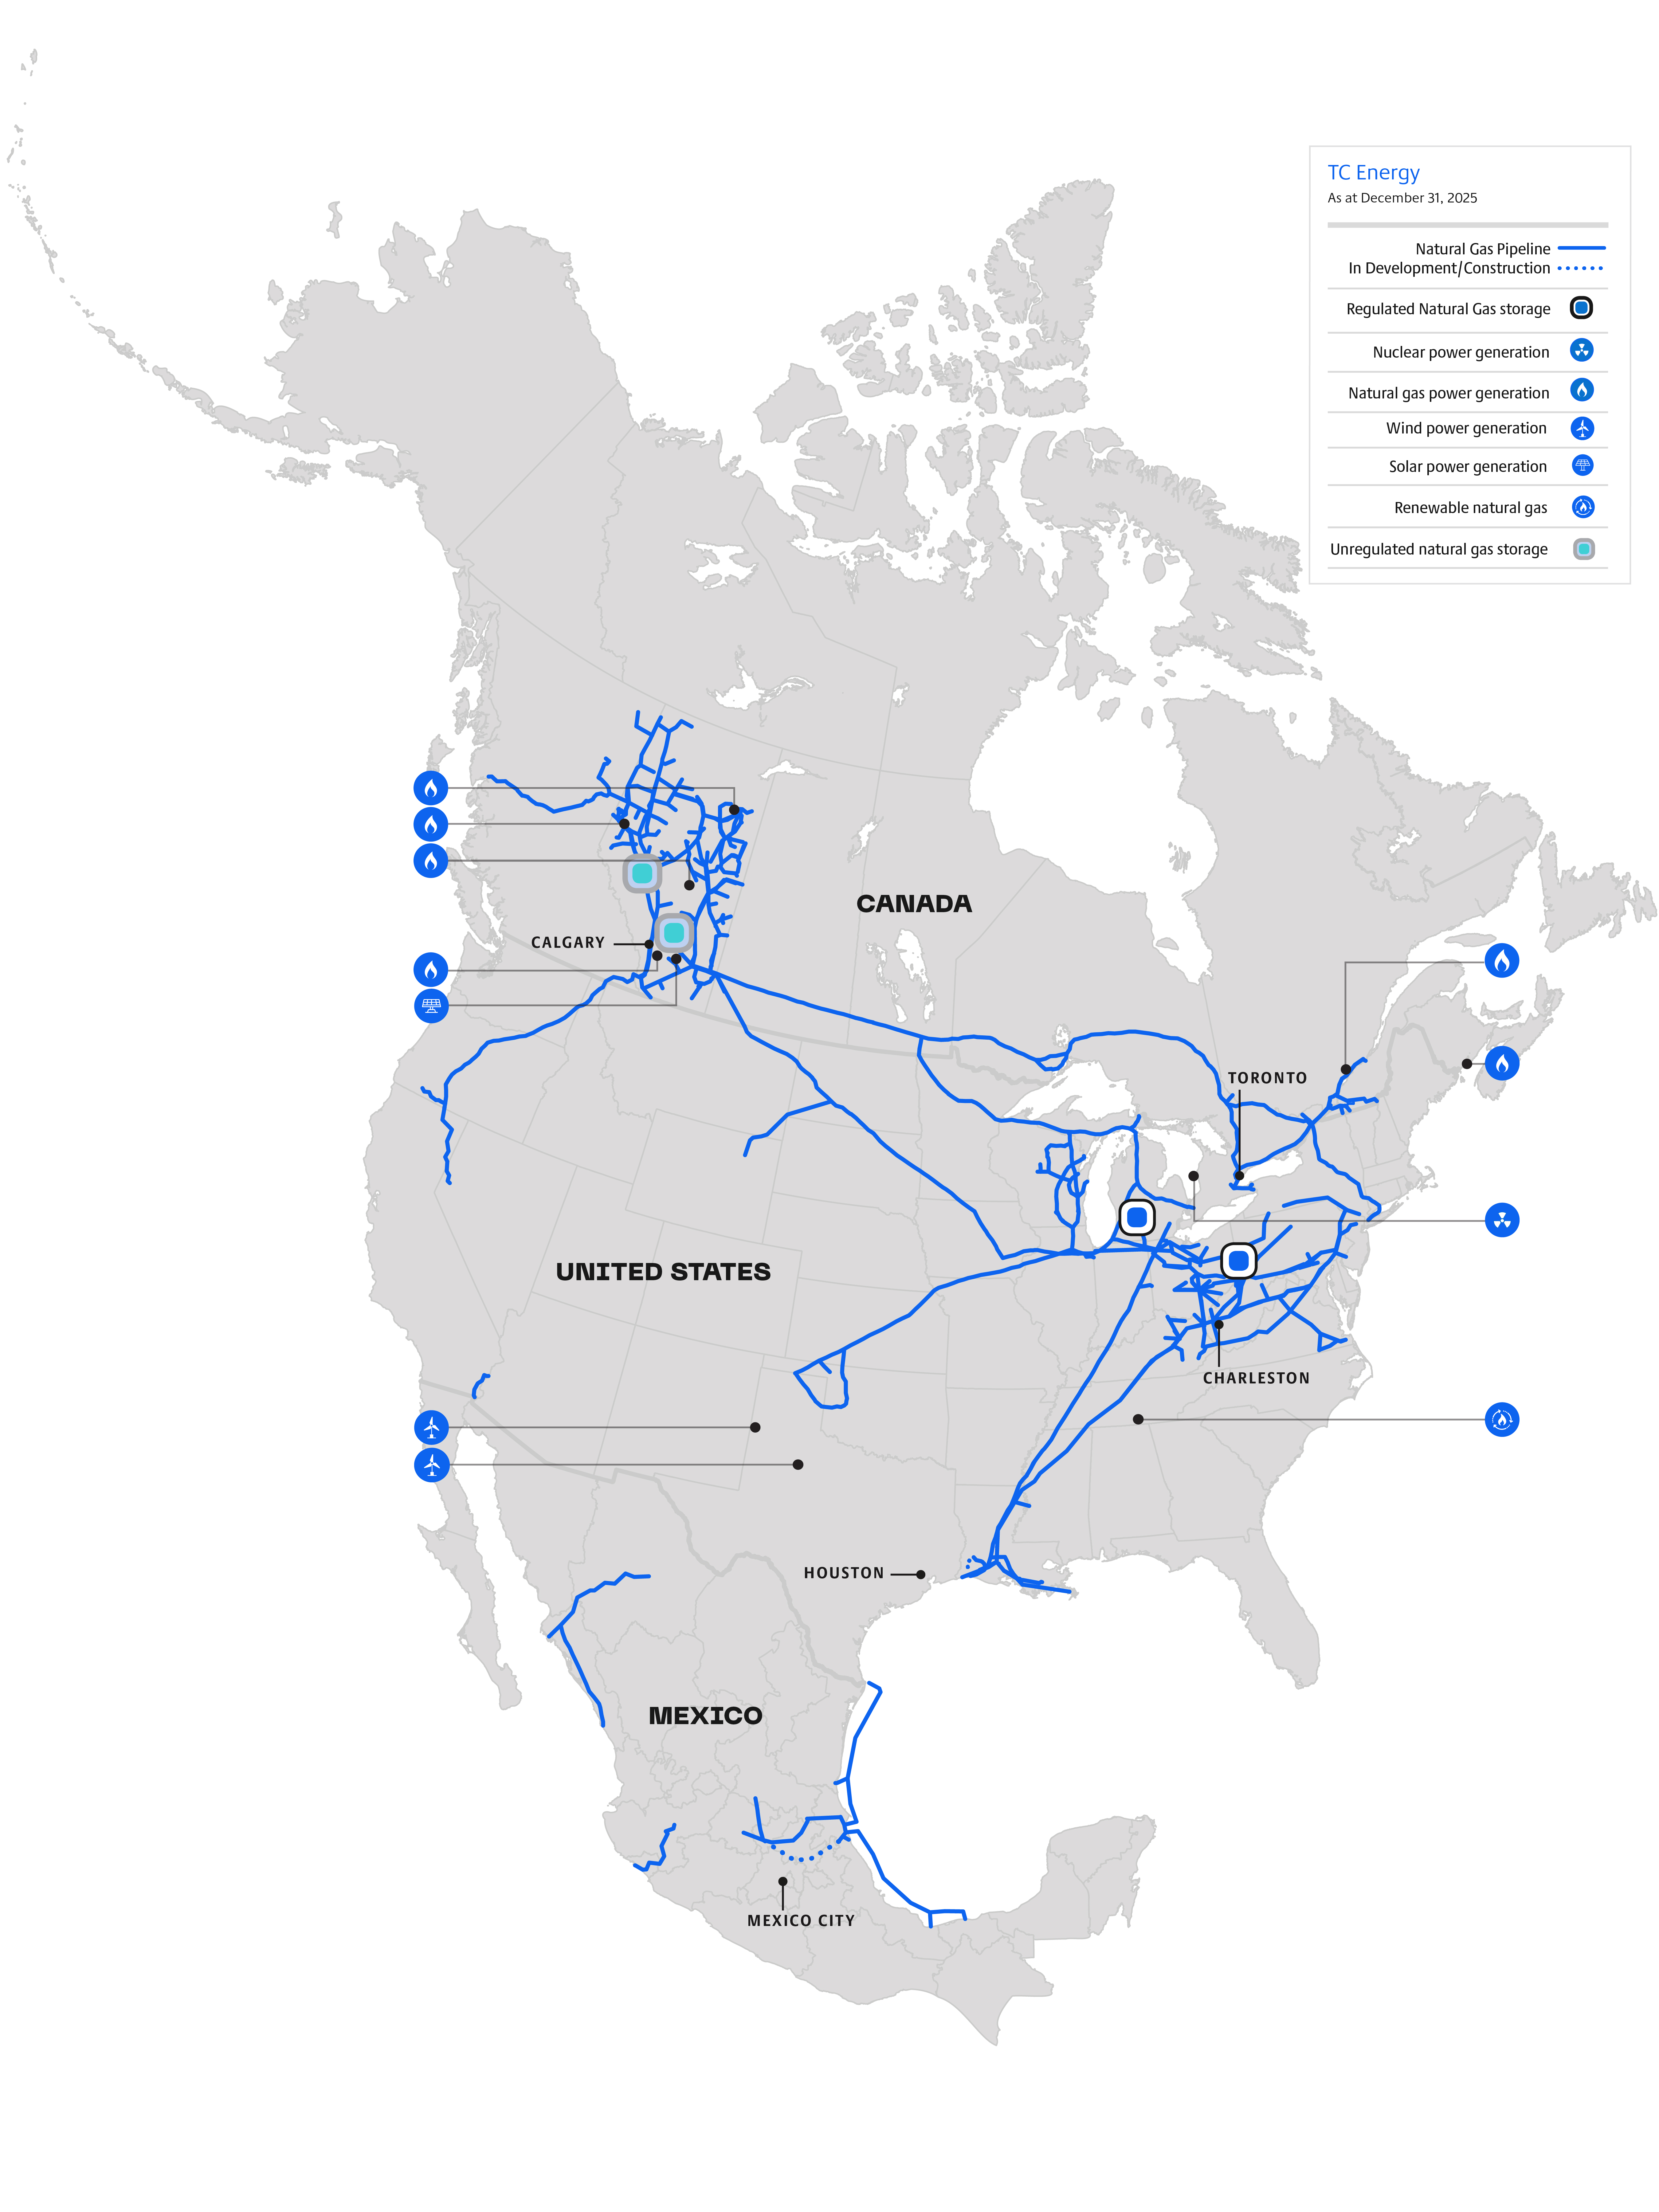
12 | TC Energy Management's discussion and analysis 2025
OUR CORE BUSINESSES
We operate in two core businesses – Natural Gas Pipelines and Power and Energy Solutions. In order to provide information that is aligned with how management decisions about our businesses are made and how performance of our businesses is assessed, our results are reflected in four operating segments: Canadian Natural Gas Pipelines, U.S. Natural Gas Pipelines, Mexico Natural Gas Pipelines and Power and Energy Solutions. We also have a Corporate segment consisting of corporate and administrative functions that provide governance, financing and other support to TC Energy's business segments.
TC Energy completed the Spinoff Transaction on October 1, 2024 and subsequently accounted for the Liquids Pipelines business as a discontinued operation. Refer to the Discontinued operations section on page 88 for additional information.
Year at-a-glance
| | | | | | | | | | | | | | |
| at December 31 | | |
| (millions of $) | 2025 | | 2024 |
| | | | |
| Total assets by segment | | | | |
| Canadian Natural Gas Pipelines | | 31,371 | | | 31,167 | |
| U.S. Natural Gas Pipelines | | 56,617 | | | 56,304 | |
| Mexico Natural Gas Pipelines | | 16,342 | | | 15,995 | |
| Power and Energy Solutions | | 10,764 | | | 10,217 | |
| Corporate | | 3,460 | | | 4,189 | |
| | 118,554 | | | 117,872 | |
Discontinued Operations | | 197 | | | 371 | |
| | 118,751 | | | 118,243 | |
| | | | | | | | | | | | | | |
| year ended December 31 | | | | |
| (millions of $) | 2025 | | 2024¹ |
| | | | |
Total revenues from continuing operations by segment | | | | |
| Canadian Natural Gas Pipelines | | 5,785 | | | 5,600 | |
| U.S. Natural Gas Pipelines | | 7,145 | | | 6,339 | |
Mexico Natural Gas Pipelines | | 1,450 | | | 870 | |
| Power and Energy Solutions | | 845 | | | 954 | |
Corporate | | 14 | | | 8 | |
| | 15,239 | | | 13,771 | |
1 Excludes revenues of $2,217 million related to discontinued operations, which represents nine months of Liquids Pipelines earnings in 2024.
TC Energy Management's discussion and analysis 2025 | 13
| | | | | | | | | | | | | | |
| year ended December 31 | | | | |
| (millions of $) | | 2025 | | 2024¹ |
| | | | |
Comparable EBITDA from continuing operations by segment2 | | | | |
| Canadian Natural Gas Pipelines | | 3,687 | | | 3,388 | |
| U.S. Natural Gas Pipelines | | 4,906 | | | 4,511 | |
| Mexico Natural Gas Pipelines | | 1,365 | | | 999 | |
| Power and Energy Solutions | | 1,008 | | | 1,214 | |
| Corporate | | (14) | | | (63) | |
| | 10,952 | | | 10,049 | |
1 Excludes Comparable EBITDA from discontinued operations of $1,145 million, which represents nine months of Liquids Pipelines earnings in 2024.
2 Comparable EBITDA is a non-GAAP measure and does not have any standardized meaning as prescribed by U.S. GAAP and therefore may not be comparable to similar measures presented by other companies. The most directly comparable GAAP measure is segmented earnings (losses). Refer to the Financial results sections for each business segment for a reconciliation to comparable EBITDA as well as the About our business - Non-GAAP measures section for additional information.
14 | TC Energy Management's discussion and analysis 2025
OUR STRATEGY
Our vision is to be the trusted leader in North America’s energy infrastructure, committed to excellence in safety, performance and stakeholder relationships. Our mission is to safely and efficiently move, generate and store the critical energy that North America and the world rely on. Our value proposition: to deliver solid growth with low risk and repeatable performance, year after year.
Our business consists of natural gas transportation and storage, as well as power generation assets:
•we deliver natural gas to Canada, the U.S. and Mexico, including to export terminals that ship LNG globally
•we generate electricity in Canada and the U.S., primarily from nuclear energy, but also from natural gas, wind and solar assets
•we store natural gas in Canada and the U.S. through regulated and non-regulated businesses.
These long-life infrastructure assets are anchored by our conservative risk preferences and are generally supported by long-term commercial arrangements and/or rate regulation. We believe that our assets will generate predictable and sustainable cash flows and earnings, providing the cornerstones of our low-risk value proposition. Our long-term strategy is driven by the following key beliefs:
•natural gas will continue to play a pivotal role in North America's energy future and support global GHG emissions reduction
•the need for reliable, on-demand energy sources will continue to grow
•energy assets will become increasingly valuable in a world with growing energy demand and existing challenges in developing new infrastructure.
Allocation of comparable EBITDA from continuing operations1
| | | | | | | | | | | | | | | | |
| year ended December 31 | | 2025 | | 2024 | | |
| | | | | | |
Comparable EBITDA from continuing operations by segment2 | | | | | | |
| Canadian Natural Gas Pipelines | | 34 | % | | 33 | % | | |
| U.S. Natural Gas Pipelines | | 45 | % | | 45 | % | | |
| Mexico Natural Gas Pipelines | | 12 | % | | 10 | % | | |
| Power and Energy Solutions | | 9 | % | | 12 | % | | |
| | 100 | % | | 100 | % | | |
1 Refer to the Financial highlights section for an allocation of segmented earnings by business segment.
2 Excludes losses from Corporate comparable EBITDA from continuing operations of $14 million and $63 million for the years ended December 31, 2025 and 2024, respectively.
Our asset mix will continue to evolve with the North American energy mix. We anticipate the following trends in capital allocation over the next several years:
•Natural Gas Pipelines will continue to attract capital to meet growing customer demand, driven by coal-to-gas conversion, LNG exports and data centre buildouts
•Power and Energy Solutions' capital will primarily be allocated to extending the life and increasing the capacity of the nuclear business. We will make measured investment in emerging technologies to develop capabilities that are complementary to our Natural Gas Pipelines business, without taking significant commodity price risk, volumetric risk or utilizing unproven technologies
•additional discretionary investment will fund select high-grade opportunities in our development projects portfolio and incremental opportunities around existing assets across our businesses.
TC Energy Management's discussion and analysis 2025 | 15
Key components of our strategy
Maximize the value of our assets through safety and operational excellence
Maintaining safe and reliable operations by maximizing asset availability and integrity while minimizing environmental impacts remains the foundation of our business. Our extensive natural gas pipeline network connects long-life, low-cost supply basins with premium North American and export markets, generating predictable and sustainable cash flows and earnings, while our power and non-regulated storage assets, primarily under long-term contracts, provide stable returns. We continually seek to enhance and protect asset value through operational, commercial and marketing initiatives.
Execute our selective portfolio of growth projects
Safety, executability, profitability, and reliability are fundamental to our investments, which focus on developing high-quality, long-life assets largely underpinned by long-term contracts or rate regulation. Leveraging our incumbent positions in regions with growing natural gas and power demand, we manage costs and construction risk in a disciplined manner to maximize capital efficiency and shareholder returns. We also look to advance select lower-carbon growth initiatives in emerging sub-sectors where technology is proven, risks and returns are acceptable and we can build a strong competitive position.
Ensure financial strength and agility
Disciplined capital allocation supports our ability to maximize asset value over the short, medium and long term while improving cost competitiveness, extending asset life and remaining within annual net capital spend targets. We assess opportunities to develop or acquire complementary energy infrastructure that protects and grows our business, enhances resilience under a changing energy mix and diversifies access to attractive supply and market regions within our risk preferences. Supported by our high-quality, diversified portfolio and core competencies in safety, operational excellence, and project execution, we aim to deliver predictable, low-risk cash flows and shareholder value across various economic cycles and energy transition scenarios.
Our risk preferences
The following is an overview of our risk philosophy:
•financial strength and flexibility: rely on internally generated cash flows, existing debt capacity, partnerships and portfolio management to finance new initiatives
•known and acceptable project risks: select investments with known, acceptable and manageable project execution risk, including stakeholder considerations, partnership agreements, human capital and capability constraints
•business underpinned by strong fundamentals and policy support: invest in assets with stable cash flows supported by strong underlying macroeconomic fundamentals, conducive policy and regulations and/or long-term contracts with creditworthy counterparties
•manage credit metrics to ensure strong investment-grade ratings: investment-grade ratings are an important competitive advantage and we manage leverage to ensure that strong access to capital on competitive terms is maintained while balancing the interests of equity and fixed income investors
•prudent management of counterparty exposure: limit counterparty concentration and sovereign risk; seek diversification and solid commercial arrangements underpinned by strong fundamentals.
16 | TC Energy Management's discussion and analysis 2025
2025 FINANCIAL HIGHLIGHTS
We use certain financial measures that do not have a standardized meaning under GAAP because we believe they improve our ability to compare results between reporting periods and enhance understanding of our operating performance. Known as non-GAAP measures, they may not be comparable to similar measures provided by other companies.
Comparable EBITDA, comparable earnings and comparable earnings per common share from continuing and discontinued operations and comparable funds generated from operations are all non-GAAP measures. Refer to page 22 for more information about the non-GAAP measures we use, as well as the Financial results section in each business segment and Discontinued operations section for reconciliations to the most directly comparable GAAP measures.
As discussed on page 10 of the About this document section, TC Energy completed the Spinoff Transaction on October 1, 2024. To allow for a meaningful comparison, discussions throughout this MD&A are based on continuing operations unless otherwise noted. Refer to the Discontinued operations section for additional information.
| | | | | | | | | | | | | | | | | | | | |
| year ended December 31 | | | | | | |
| (millions of $, except per share amounts) | | 2025 | | 2024 | | 2023 |
| | | | | | |
| Income | | | | | | |
Revenues | | 15,239 | | | 13,771 | | | 13,267 | |
| | | | | | |
| Net income (loss) attributable to common shares | | 3,400 | | | 4,594 | | | 2,829 | |
from continuing operations | | 3,612 | | | 4,199 | | | 2,217 | |
from discontinued operations1 | | (212) | | | 395 | | | 612 | |
| | | | | | |
| Net income (loss) per common share – basic | | $3.27 | | | $4.43 | | | $2.75 | |
from continuing operations | | $3.47 | | | $4.05 | | | $2.15 | |
from discontinued operations1 | | ($0.20) | | | $0.38 | | | $0.60 | |
| | | | | | |
Comparable EBITDA2 | | 10,952 | | | 11,194 | | | 10,988 | |
| from continuing operations | | 10,952 | | | 10,049 | | | 9,472 | |
from discontinued operations1 | | — | | | 1,145 | | | 1,516 | |
| | | | | | |
Comparable earnings2 | | 3,654 | | | 4,430 | | | 4,652 | |
from continuing operations | | 3,654 | | | 3,865 | | | 3,896 | |
from discontinued operations1 | | — | | | 565 | | | 756 | |
| | | | | | |
Comparable earnings per common share2 | | $3.51 | | | $4.27 | | | $4.52 | |
from continuing operations | | $3.51 | | | $3.73 | | | $3.78 | |
from discontinued operations1 | | — | | | $0.54 | | | $0.74 | |
| | | | | | |
| | | | | | |
| | | | | | |
| | | | | | |
| | | | | | |
| | | | | | |
| | | | | | |
| | | | | | |
| | | | | | |
| | | | | | |
| | | | | | |
| | | | | | |
| | | | | | |
| | | | | | |
| | | | | | |
| | | | | | |
| | | | | | |
| | | | | | |
| | | | | | |
| | | | | | |
| | | | | | |
| | | | | | |
| | | | | | |
| | | | | | |
| | | | | | |
| | | | | | |
| | | | | | |
| | | | | | |
| | | | | | |
1Represents nine months of Liquids Pipelines earnings in 2024 and a full year of earnings in 2023. Refer to the Discontinued operations section for additional information.
2Additional information on the most directly comparable GAAP measure can be found on page 22.
TC Energy Management's discussion and analysis 2025 | 17
| | | | | | | | | | | | | | | | | | | | |
| year ended December 31 | | | | | | |
(millions of $) | | 2025 | | 2024 | | 2023 |
| | | | | | |
Cash flows1 | | | | | | |
Net cash provided by operations2 | | 7,346 | | | 7,696 | | | 7,268 | |
| | | | | | |
Comparable funds generated from operations2,3 | | 7,996 | | | 7,890 | | | 7,980 | |
| | | | | | |
Capital spending4 | | 6,337 | | | 7,904 | | | 12,298 | |
| Acquisitions, net of cash acquired | | — | | | — | | | (307) | |
| Proceeds from sales of assets, net of transaction costs | | — | | | 791 | | | 33 | |
Disposition of equity interest, net of transaction costs5 | | — | | | 419 | | | 5,328 | |
1Includes continuing and discontinued operations.
2Includes nine months of Liquids Pipelines earnings in 2024 and a full year of earnings in 2023. Refer to the Discontinued operations section for additional information.
3Additional information on the most directly comparable GAAP measure can be found on page 22.
4Capital spending reflects cash flows associated with our Capital expenditures, Capital projects in development and Contributions to equity investments. For the year ended December 31, 2024, Contributions to equity investments was net of Other distributions from equity investments of $3.1 billion in the Canadian Natural Gas Pipelines segment. Refer to Note 5, Segmented information, Note 10, Equity investments and Note 11, Loans with affiliates, of our 2025 Consolidated financial statements for additional information.
5Included in the Financing activities section of the Consolidated statement of cash flows, of our 2025 Consolidated financial statements.
| | | | | | | | | | | | | | | | | | | | |
at December 31 | | | | | | |
| (millions of $, except per share amounts) | | 2025 | | 2024 | | 2023 |
| | | | | | |
| Balance sheet | | | | | | |
Total assets1 | | 118,751 | | | 118,243 | | | 125,034 | |
| Long-term debt, including current portion | | 46,792 | | | 47,931 | | | 52,914 | |
| Junior subordinated notes | | 12,094 | | | 11,048 | | | 10,287 | |
| Preferred shares | | 2,255 | | | 2,499 | | | 2,499 | |
| Non-controlling interests | | 9,604 | | | 10,768 | | | 9,455 | |
| Common shareholders' equity | | 25,040 | | | 25,093 | | | 27,054 | |
| | | | | | |
Dividends declared2 | | | | | | |
per common share3 | | $3.40 | | | $3.7025 | | | $3.72 | |
| | | | | | |
Basic common shares (millions) | | | | | | |
– weighted average for the year ended | | 1,040 | | | 1,038 | | | 1,030 | |
| – issued and outstanding at end of year | | 1,041 | | | 1,039 | | | 1,037 | |
1At December 31, 2025, includes assets of $197 million (2024 - $371 million; 2023 - $15,510 million), related to discontinued operations. Refer to Note 4, Discontinued operations, of our 2025 Consolidated financial statements for additional information.
2For the year ended.
3Dividends declared in fourth quarter 2024 and thereafter reflect TC Energy’s proportionate allocation following the Spinoff Transaction.
18 | TC Energy Management's discussion and analysis 2025
Consolidated results
| | | | | | | | | | | | | | | | | | | | |
| year ended December 31 | | | | | | |
| (millions of $, except per share amounts) | | 2025 | | 2024 | | 2023 |
| | | | | | |
| | | | | | |
| Canadian Natural Gas Pipelines | | 2,164 | | | 2,016 | | | (90) | |
| U.S. Natural Gas Pipelines | | 3,927 | | | 4,053 | | | 3,531 | |
| Mexico Natural Gas Pipelines | | 1,186 | | | 929 | | | 796 | |
| Power and Energy Solutions | | 773 | | | 1,102 | | | 1,004 | |
| Corporate | | (14) | | | (136) | | | (144) | |
| Total segmented earnings (losses) | | 8,036 | | | 7,964 | | | 5,097 | |
Interest expense | | (3,407) | | | (3,019) | | | (2,966) | |
| Allowance for funds used during construction | | 453 | | | 784 | | | 575 | |
Foreign exchange gains (losses), net | | 157 | | | (147) | | | 320 | |
| Interest income and other | | 205 | | | 324 | | | 272 | |
| Income (loss) from continuing operations before income taxes | | 5,444 | | | 5,906 | | | 3,298 | |
Income tax (expense) recovery from continuing operations | | (1,138) | | | (922) | | | (842) | |
| Net income (loss) from continuing operations | | 4,306 | | | 4,984 | | | 2,456 | |
Net income (loss) from discontinued operations, net of tax1 | | (212) | | | 395 | | | 612 | |
| Net income (loss) | | 4,094 | | | 5,379 | | | 3,068 | |
Net (income) loss attributable to non-controlling interests | | (575) | | | (681) | | | (146) | |
| Net income (loss) attributable to controlling interests | | 3,519 | | | 4,698 | | | 2,922 | |
| Preferred share dividends | | (119) | | | (104) | | | (93) | |
| Net income (loss) attributable to common shares | | 3,400 | | | 4,594 | | | 2,829 | |
| | | | | | |
| | | | | | |
| | | | | | |
| | | | | | |
| | | | | | |
| | | | | | |
| | | | | | |
| | | | | | |
| | | | | | |
| | | | | | |
| | | | | | |
| | | | | | |
| Net income (loss) per common share – basic | | $3.27 | | | $4.43 | | | $2.75 | |
from continuing operations | | $3.47 | | | $4.05 | | | $2.15 | |
from discontinued operations1 | | ($0.20) | | | $0.38 | | | $0.60 | |
1Represents nine months of Liquids Pipelines earnings in 2024 and a full year of earnings in 2023. Refer to the Discontinued operations section for additional information.
| | | | | | | | | | | | | | | | | | | | |
| year ended December 31 | | | | | | |
(millions of $) | | 2025 | | 2024 | | 2023 |
| | | | | | |
| Amounts attributable to common shares | | | | | | |
Net income (loss) from continuing operations | | 4,306 | | | 4,984 | | | 2,456 | |
Net (income) loss attributable to non-controlling interests | | (575) | | | (681) | | | (146) | |
Net income (loss) attributable to controlling interests from continuing operations | | 3,731 | | | 4,303 | | | 2,310 | |
Preferred share dividends | | (119) | | | (104) | | | (93) | |
Net income (loss) attributable to common shares from continuing operations | | 3,612 | | | 4,199 | | | 2,217 | |
Net income (loss) from discontinued operations, net of tax1 | | (212) | | | 395 | | | 612 | |
| Net income (loss) attributable to common shares | | 3,400 | | | 4,594 | | | 2,829 | |
1Represents nine months of Liquids Pipelines earnings in 2024 and a full year of earnings in 2023. Refer to the Discontinued operations section for additional information.
Net income attributable to common shares from continuing operations in 2025 was $3.6 billion or $3.47 per common share (2024 – $4.2 billion or $4.05 per common share; 2023 – $2.2 billion or $2.15 per common share), a decrease of $0.6 billion or $0.58 per common share in 2025 compared to 2024 and an increase of $2.0 billion or $1.90 per common share in 2024 compared to 2023. Refer to the About our business - Non-GAAP measures section for a listing of specific items included in Net income attributable to common shares from continuing operations, which have been excluded from our calculation of comparable measures.
Refer to the Discontinued operations - Non-GAAP measures section for a listing of specific items included in Net income (loss) from discontinued operations, net of tax, which have been excluded from our calculation of comparable measures.
TC Energy Management's discussion and analysis 2025 | 19
Cash flows
Net cash provided by operations of $7.3 billion in 2025 was five per cent lower than 2024 primarily due to the timing of working capital changes, partially offset by higher funds generated from operations. Comparable funds generated from operations of $8.0 billion in 2025 were one per cent higher than 2024 primarily due to higher comparable EBITDA and risk management activities used to manage our foreign exchange exposure to net liabilities in Mexico and to U.S. dollar‑denominated income, partially offset by lower distributions from our equity investments.
Funds used in investing activities
Capital spending1
| | | | | | | | | | | | | | | | | | | | |
| year ended December 31 | | | | | | |
| (millions of $) | | 2025 | | 2024 | | 2023 |
| | | | | | |
| Canadian Natural Gas Pipelines | | 1,405 | | | 2,100 | | | 6,184 | |
| U.S. Natural Gas Pipelines | | 3,457 | | | 2,575 | | | 2,660 | |
| Mexico Natural Gas Pipelines | | 522 | | | 2,228 | | | 2,292 | |
| Power and Energy Solutions | | 922 | | | 824 | | | 1,080 | |
| Corporate | | 31 | | | 50 | | | 33 | |
| | 6,337 | | | 7,777 | | | 12,249 | |
| Discontinued operations | | — | | | 127 | | | 49 | |
| | 6,337 | | | 7,904 | | | 12,298 | |
1Capital spending reflects cash flows associated with our Capital expenditures, Capital projects in development and Contributions to equity investments. For the year ended December 31, 2024, Contributions to equity investments were net of Other distributions from equity investments of $3.1 billion in the Canadian Natural Gas Pipelines segment. Refer to Note 5, Segmented information, Note 10, Equity investments and Note 11, Loans with affiliates, of our 2025 Consolidated financial statements for additional information.
In 2025 and 2024, we invested $6.3 billion and $7.9 billion, respectively, in capital projects to maintain and optimize the value of our existing assets and to develop new, complementary assets in high-demand areas. Our total capital spending in 2025 and 2024 included contributions of $1.1 billion and $1.5 billion (net of distributions), respectively, to our equity investments, predominantly related to Bruce Power and Coastal GasLink Limited Partnership (Coastal GasLink LP).
Proceeds from sales of assets
In 2024, TC Energy and its partner, Northern New England Investment Company, Inc., a subsidiary of Énergir L.P. (Énergir), completed the sale of Portland Natural Gas Transmission System (PNGTS) to a third party. Our share of the proceeds was $743 million (US$546 million), net of transaction costs.
In 2024, we also completed the sale of other non-core assets for gross proceeds of $48 million.
In 2023, we completed the sale of a 20.1 per cent equity interest in Port Neches Link LLC to its joint venture partner, Motiva Enterprises, for gross proceeds of $33 million (US$25 million). As part of the Spinoff Transaction on October 1, 2024, our remaining interest in Port Neches Link LLC was transferred to South Bow.
Acquisitions
In 2023, we acquired 100 per cent of the Class B Membership Interests in Fluvanna Wind Farm and Blue Cloud Wind Farm (Texas Wind Farms) for US$224 million, before post-closing adjustments.
Balance sheet
We continue to maintain a solid financial position while growing our total assets, excluding discontinued operations, by $0.7 billion in 2025. At December 31, 2025, common shareholders' equity and non-controlling interests represented 36 per cent (2024 – 37 per cent) of our capital structure, while other subordinated capital, in the form of junior subordinated notes and preferred shares, represented an additional 14 per cent (2024 – 14 per cent). Refer to the Financial condition section for additional information.
20 | TC Energy Management's discussion and analysis 2025
Dividends
Commencing with the dividends payable on January 31, 2025 to shareholders of record at the close of business on December 31, 2024, the amounts reflect TC Energy’s proportionate allocation following the Spinoff Transaction. Refer to our 2024 Annual Report for additional information.
Our Board of Directors have declared a quarterly dividend on our outstanding common shares of $0.8775 per common share for the quarter ending March 31, 2026, which equates to an annual dividend of $3.51 per common share.
Dividend reinvestment and share purchase plan
Under the DRP, eligible holders of common and preferred shares of TC Energy can reinvest their dividends and make optional cash payments to obtain additional TC Energy common shares. From August 31, 2022 to July 31, 2023, common shares were issued from treasury at a discount of two per cent to market prices over a specified period.
Commencing with the dividends declared on July 27, 2023, common shares purchased under TC Energy's DRP are acquired on the open market at 100 per cent of the weighted average purchase price.
Cash dividends paid
| | | | | | | | | | | | | | | | | | | | |
| year ended December 31 | | | | | | |
| (millions of $) | | 2025 | | 2024 | | 2023 |
| | | | | | |
| Common shares | | 3,507 | | | 3,953 | | | 2,787 | |
| Preferred shares | | 114 | | | 99 | | | 92 | |
TC Energy Management's discussion and analysis 2025 | 21
NON-GAAP MEASURES
This MD&A references non-GAAP measures, which are identified in the table below. These measures do not have any standardized meaning as prescribed by GAAP and therefore may not be comparable to similar measures presented by other entities. These measures are reviewed regularly by our President and Chief Executive Officer, management and the Board of Directors in assessing our performance and making decisions regarding the ongoing operations of our business and its ability to generate cash flows. Some or all of these measures may also be used by investors and other external users of our financial statements as a supplemental measure to provide decision-useful information regarding our period-over-period performance and ability to generate earnings that are core to our ongoing operations. Discussions throughout this MD&A on the factors impacting comparable earnings before interest, taxes, depreciation and amortization (comparable EBITDA) and comparable earnings before interest and taxes (comparable EBIT) are consistent with the factors that impact segmented earnings, except where noted otherwise.
Comparable measures
We calculate comparable measures by adjusting certain GAAP measures for specific items we believe are significant but not reflective of our underlying operations in the period. Except as otherwise described herein, these comparable measures are calculated on a consistent basis from period to period and are adjusted for specific items in each period, as applicable.
Our decision to adjust for a specific item in reporting comparable measures is subjective and made after careful consideration. We maintain a consistent approach to adjustments, which generally fall into the categories described below:
•by their nature are unusual, infrequent and separately identifiable from our normal business operations and in our view are not reflective of our underlying operations in the period and generally include the following:
◦gains or losses on sales of assets or assets held for sale; impairment of goodwill, plant, property and equipment, equity investments and other assets; legal, contractual and other infrequent settlements; acquisition, integration and restructuring costs; expected credit loss provisions on net investment in leases and certain contract assets in Mexico; impacts resulting from changes in legislation and enacted tax rates and unusual tax refunds/payments and valuation allowance adjustments
•unrealized gains and losses related to fair value adjustments that do not reflect realized earnings or losses or cash impacts incurred in the current period from our underlying operations and generally include the following:
◦unrealized gains and losses from changes in the fair value of derivatives related to financial and commodity price risk management activities; unrealized fair value adjustments related to our proportionate share of Bruce Power’s risk management activities and its funds invested for post-retirement benefits; unrealized foreign exchange gains and losses on intercompany loans that impact consolidated earnings.
The following table identifies our non-GAAP measures against their most directly comparable GAAP measures. These measures are applicable to our continuing and discontinued operations. Quantitative reconciliations of our comparable measures to their GAAP measures and a discussion of specific adjustments made for 2025 and comparative periods can be found on pages 24 and 25, the Financial results section in each business segment, and the Financial condition section. Non-GAAP measures for discontinued operations are found in the Discontinued operations section on page 89.
| | | | | |
| Non-GAAP measure | GAAP measure |
| |
| comparable EBITDA | segmented earnings (losses) |
| comparable EBIT | segmented earnings (losses) |
| comparable earnings | net income (loss) attributable to common shares |
| comparable earnings per common share | net income (loss) per common share |
| funds generated from operations | net cash provided by operations |
| comparable funds generated from operations | net cash provided by operations |
22 | TC Energy Management's discussion and analysis 2025
Comparable EBITDA and comparable EBIT
Comparable EBITDA represents segmented earnings (losses) adjusted for specific items described in the Comparable measures section, excluding charges for depreciation and amortization. We use comparable EBITDA as a measure of our earnings from ongoing operations as it is a useful indicator of our performance and is also presented on a consolidated basis. Comparable EBIT represents segmented earnings (losses) adjusted for specific items and is an effective tool for evaluating trends in each segment. Refer to each business segment and the Discontinued operations section for a reconciliation to segmented earnings (losses).
Funds generated from operations and comparable funds generated from operations
Funds generated from operations reflects net cash provided by operations before changes in operating working capital. The components of changes in working capital are disclosed in Note 28, Changes in operating working capital, of our 2025 Consolidated financial statements. Comparable funds generated from operations is adjusted for the cash impact of specific items described in the Comparable measures section. We believe funds generated from operations and comparable funds generated from operations are useful measures of our consolidated operating cash flows because they exclude fluctuations from working capital balances, which do not necessarily reflect underlying operations in the same period, and are used to provide a consistent measure of the cash-generating ability of our businesses. Refer to the Financial condition section for a reconciliation to Net cash provided by operations.
Comparable earnings and comparable earnings per common share
Comparable earnings represents earnings attributable to common shareholders on a consolidated basis, adjusted for specific items described in the Comparable measures section. Comparable earnings is comprised of segmented earnings (losses), Interest expense, AFUDC, Foreign exchange (gains) losses, net, Interest income and other, Income tax expense (recovery), Net income (loss) attributable to non-controlling interests and Preferred share dividends on our Consolidated statement of income, adjusted for specific items. We use comparable earnings as a measure of our earnings from ongoing operations as it is a useful indicator of our performance and is also presented on a consolidated basis. Refer to page 25 and the Discontinued operations section for reconciliations to Net income (loss) attributable to common shares and Net income (loss) per common share for our continuing operations and discontinued operations.
TC Energy Management's discussion and analysis 2025 | 23
Comparable earnings and comparable earnings per common share - from continuing operations
The following specific items were recognized in Net income (loss) attributable to common shares from continuing operations and were excluded from comparable earnings from continuing operations:
2025
•a pre-tax impairment charge of $110 million for certain Power and Energy Solutions projects following our decision to discontinue development along with updated forecast assumptions as we refocus our Power and Energy Solutions strategy
•pre-tax unrealized foreign exchange losses, net, of $89 million on the peso-denominated intercompany loan between TransCanada PipeLines Limited (TCPL) and Transportadora de Gas Natural de la Huasteca (TGNH), net of non-controlling interest
•a pre-tax expense of $75 million on the expected credit loss provision related to TGNH net investment in leases, net of non-controlling interest as well as certain contract assets in Mexico.
2024
•a pre-tax gain of $572 million related to the sale of PNGTS which was completed on August 15, 2024
•a pre-tax net gain on debt extinguishment of $228 million related to the purchase and cancellation of certain senior unsecured notes and medium term notes and the retirement of outstanding callable notes in October 2024
•pre-tax unrealized foreign exchange gains, net, of $143 million on the peso-denominated intercompany loan between TCPL and TGNH, net of non-controlling interest
•a pre-tax gain of $48 million related to the sale of non-core assets in U.S. Natural Gas Pipelines and Canadian Natural Gas Pipelines
•a pre-tax recovery of $22 million on the expected credit loss provision related to TGNH net investment in leases, net of non-controlling interest as well as certain contract assets in Mexico
•a deferred income tax expense of $96 million resulting from the revaluation of remaining deferred tax balances following the Spinoff Transaction
•a pre-tax impairment charge of $36 million for a Power and Energy Solutions project following our decision to discontinue development as we refocus our Power and Energy Solutions strategy
•a pre-tax expense of $34 million related to a non-recurring third-party settlement
•a pre-tax expense of $24 million related to Focus Project costs
•pre-tax costs of $10 million related to the NGTL System ownership transfer.
2023
•a pre-tax impairment charge of $2.1 billion related to our equity investment in Coastal GasLink LP
•a pre-tax expense of $65 million related to Focus Project costs
•pre-tax unrealized foreign exchange losses, net, of $44 million on the peso-denominated intercompany loan between TCPL and TGNH
•a pre-tax recovery of $80 million on the expected credit loss provision related to TGNH net investment in leases and certain contract assets in Mexico.
Refer to the Financial results section in each business segment and the Financial condition section of this MD&A for additional information.
24 | TC Energy Management's discussion and analysis 2025
Reconciliation of net income (loss) attributable to common shares to comparable earnings - from continuing operations
| | | | | | | | | | | | | | | | | | | | |
| year ended December 31 | | | | | | |
| (millions of $, except per share amounts) | | 2025 | | 2024 | | 2023 |
| | | | | | |
| | | | | | |
| | | | | | |
| Net income (loss) attributable to common shares from continuing operations | | 3,612 | | | 4,199 | | | 2,217 | |
| Specific items (pre tax): | | | | | | |
| Power and Energy Solutions impairment charges | | 110 | | | 36 | | | — | |
Foreign exchange (gains) losses, net – intercompany loan1 | | 89 | | | (143) | | | 44 | |
Expected credit loss provision on net investment in leases and certain contract assets in Mexico2 | | 75 | | | (22) | | | (80) | |
| Gain on sale of PNGTS | | — | | | (572) | | | — | |
Net gain on debt extinguishment3 | | — | | | (228) | | | — | |
| Gain on sale of non-core assets | | — | | | (48) | | | — | |
| Third-party settlement | | — | | | 34 | | | — | |
Focus Project costs4 | | — | | | 24 | | | 65 | |
| NGTL System ownership transfer costs | | — | | | 10 | | | — | |
| Coastal GasLink impairment charge | | — | | | — | | | 2,100 | |
| | | | | | |
Bruce Power unrealized fair value adjustments | | (30) | | | (8) | | | (7) | |
Risk management activities5 | | (228) | | | 433 | | | (395) | |
Taxes on specific items6 | | 26 | | | 150 | | | (48) | |
| Comparable earnings from continuing operations | | 3,654 | | | 3,865 | | | 3,896 | |
| Net income (loss) per common share from continuing operations | | $3.47 | | | $4.05 | | | $2.15 | |
Specific items (net of tax) | | 0.04 | | | (0.32) | | | 1.63 | |
| Comparable earnings per common share from continuing operations | | $3.51 | | | $3.73 | | | $3.78 | |
1In 2023, TCPL and TGNH entered into an unsecured revolving credit facility. While the loan receivable and payable eliminate on consolidation, differences in each entity’s reporting currency create a net income impact from revaluing and translating these balances into TC Energy’s reporting currency. As the resulting unrealized foreign exchange gains and losses do not reflect amounts expected to be realized at settlement, we exclude them from comparable measures, net of non‑controlling interest.
2We have recognized an expected credit loss provision related to net investment in leases and certain contract assets in Mexico, which will fluctuate from period to period based on changing economic assumptions and forward-looking information. This provision is an estimate of losses that may occur over the duration of the TSA through 2055. This provision does not reflect losses or cash outflows that were incurred under this lease arrangement in the current period or from our underlying operations, and therefore, we have excluded any unrealized changes, net of non-controlling interest, from comparable measures. Refer to Note 27, Risk management and financial instruments, of our 2025 Consolidated financial statements for additional information.
3In October 2024, TCPL commenced and completed our cash tender offers to purchase and cancel certain senior unsecured notes and medium term notes
at a 7.73 per cent weighted average discount. In addition, we retired outstanding callable notes at par. These extinguishments of debt resulted in a pre-tax
net gain of $228 million, primarily due to fair value discounts and unamortized debt issue costs. The net gain on debt extinguishment was recorded in Interest expense in the Consolidated statement of income. Refer to Note 19, Long-term debt, of our 2025 Consolidated financial statements for additional information.
4In 2023 and 2024, we recognized expenses related to the Focus Project for external consulting and severance, some of which are not recoverable through regulatory and commercial tolling structures.
| | | | | | | | | | | | | | | | | | | | | | | | | | |
5 | | year ended December 31 | | | | | | |
| | (millions of $) | | 2025 | | 2024 | | 2023 |
| | | | | | | | |
| | U.S. Natural Gas Pipelines | | 58 | | | (113) | | | 80 | |
| | Canadian Power | | (16) | | | 84 | | | (31) | |
| | U.S. Power | | 9 | | | (10) | | | 9 | |
| | Natural Gas Storage | | (35) | | | (57) | | | 91 | |
| | Interest rate | | 2 | | | (71) | | | — | |
| | Foreign exchange | | 210 | | | (266) | | | 246 | |
| | | | 228 | | | (433) | | | 395 | |
| | Income tax attributable to risk management activities | | (56) | | | 105 | | | (99) | |
| | Total unrealized gains (losses) from risk management activities | | 172 | | | (328) | | | 296 | |
| | | | | | | | |
6 | | Refer to the Corporate - Financial results section for additional information. |
TC Energy Management's discussion and analysis 2025 | 25
Comparable EBITDA to comparable earnings - from continuing operations
Comparable EBITDA from continuing operations represents segmented earnings (losses) from continuing operations adjusted
for the specific items described above and excludes charges for depreciation and amortization. For further information on our reconciliation to comparable EBITDA, refer to the Financial results sections for each business segment.
| | | | | | | | | | | | | | | | | | | | |
| year ended December 31 | | | | | | |
| (millions of $, except per share amounts) | | 2025 | | 2024 | | 2023 |
| | | | | | |
| Comparable EBITDA from continuing operations | | | | | | |
| Canadian Natural Gas Pipelines | | 3,687 | | | 3,388 | | | 3,335 | |
| U.S. Natural Gas Pipelines | | 4,906 | | | 4,511 | | | 4,385 | |
| Mexico Natural Gas Pipelines | | 1,365 | | | 999 | | | 805 | |
| Power and Energy Solutions | | 1,008 | | | 1,214 | | | 1,020 | |
Corporate | | (14) | | | (63) | | | (73) | |
| Comparable EBITDA from continuing operations | | 10,952 | | | 10,049 | | | 9,472 | |
| Depreciation and amortization | | (2,769) | | | (2,535) | | | (2,446) | |
| Interest expense included in comparable earnings | | (3,409) | | | (3,176) | | | (2,966) | |
| Allowance for funds used during construction | | 453 | | | 784 | | | 575 | |
Foreign exchange gains (losses), net included in comparable earnings | | 96 | | | (85) | | | 118 | |
Interest income and other | | 205 | | | 324 | | | 272 | |
Income tax (expense) recovery included in comparable earnings | | (1,112) | | | (772) | | | (890) | |
Net (income) loss attributable to non-controlling interests included in comparable earnings | | (643) | | | (620) | | | (146) | |
| Preferred share dividends | | (119) | | | (104) | | | (93) | |
| Comparable earnings from continuing operations | | 3,654 | | | 3,865 | | | 3,896 | |
| Comparable earnings per common share from continuing operations | | $3.51 | | | $3.73 | | | $3.78 | |
26 | TC Energy Management's discussion and analysis 2025
Comparable EBITDA from continuing operations
2025 versus 2024
Comparable EBITDA from continuing operations in 2025 increased by $903 million compared to 2024 primarily due to the net result of the following:
•increased EBITDA from Canadian Natural Gas Pipelines primarily due to higher flow-through costs and incentive earnings on the NGTL System and Mainline and higher contributions from Coastal GasLink mainly resulting from the declared commercial in-service of the pipeline in fourth quarter 2024
•higher U.S. dollar-denominated EBITDA from Mexico Natural Gas Pipelines mainly due to higher earnings in TGNH primarily related to the completion of the Southeast Gateway pipeline in second quarter 2025, partially offset by lower equity earnings from Sur de Texas as a result of peso-denominated financial exposure and higher income tax expense mainly related to foreign exchange impacts of U.S dollar-denominated liabilities
•higher U.S. dollar-denominated EBITDA from U.S. Natural Gas Pipelines due to an increase in earnings from Columbia Gas as a result of higher transportation rates effective April 1, 2025, incremental earnings from projects placed in service and additional contract sales, partially offset by lower earnings from our equity investments and higher operational costs
•increased EBITDA from Corporate primarily due to costs in 2024 related to TC Energy's corporate services and governance functions that were not allocated to discontinued operations
•decreased Power and Energy Solutions EBITDA resulting from lower contributions from Bruce Power mainly due to the Unit 4 Major Component Replacement (MCR), higher operating costs, partially offset by a higher contract price; decreased Canadian Power earnings primarily due to lower realized power prices, partially offset by Natural Gas Storage and other contributions reflecting the net impact of lower business development costs and lower realized Alberta natural gas storage spreads
•the positive foreign exchange impact of a stronger U.S. dollar on the Canadian dollar equivalent comparable EBITDA in our U.S. dollar-denominated operations. As detailed on page 72, U.S. dollar-denominated comparable EBITDA from continuing operations increased by US$463 million compared to 2024, which was translated to Canadian dollars at an average rate of
1.40 in 2025 versus 1.37 in 2024. Refer to the Foreign exchange section for additional information.
2024 versus 2023
Comparable EBITDA from continuing operations in 2024 increased by $577 million compared to 2023 primarily due to the net result of the following:
•increased Power and Energy Solutions EBITDA primarily attributable to higher contributions from Bruce Power due to higher generation and a higher contract price, and Natural Gas Storage and other due to higher realized Alberta natural gas storage spreads, partially offset by decreased Canadian Power earnings primarily due to lower realized power prices net of lower natural gas fuel costs
•higher U.S. dollar-denominated EBITDA from Mexico Natural Gas Pipelines mainly due to increased equity earnings from Sur de Texas as a result of peso-denominated financial exposure and lower income tax expense
•increased EBITDA from Canadian Natural Gas Pipelines primarily due to higher flow-through costs and increased rate-base earnings on the NGTL System and Foothills, partially offset by lower earnings from Coastal GasLink related to the recognition
of a $200 million incentive payment in 2023
•higher U.S. dollar-denominated EBITDA from U.S. Natural Gas Pipelines due to incremental earnings from growth projects placed in service and additional contract sales, partially offset by higher operational costs and decreased earnings as a result of the sale of PNGTS, which was completed on August 15, 2024
•the positive foreign exchange impact of a stronger U.S. dollar on the Canadian dollar equivalent comparable EBITDA in our U.S. dollar-denominated operations. As detailed on page 72,U.S. dollar-denominated comparable EBITDA from continuing operations increased by US$180 million compared to 2023, which was translated to Canadian dollars at an average rate of
1.37 in 2024 versus 1.35 in 2023. Refer to the Foreign exchange section for additional information.
Due to the flow-through treatment of certain costs including income taxes, financial charges and depreciation in our
Canadian rate-regulated pipelines, changes in these costs impact our comparable EBITDA despite having no significant effect
on net income.
TC Energy Management's discussion and analysis 2025 | 27
Comparable earnings from continuing operations
2025 versus 2024
Comparable earnings from continuing operations in 2025 were $211 million or $0.22 per common share lower than in 2024, and were primarily the net result of:
•changes in comparable EBITDA from continuing operations described above
•higher income tax expense primarily due to Mexico foreign exchange exposure and higher flow-through income taxes
•lower AFUDC primarily due to the completion of the Southeast Gateway pipeline project
•higher depreciation and amortization primarily due to higher depreciation rates on the NGTL System under the 2025-2029 NGTL Settlement and depreciation rate changes as a result of the Columbia Gas Settlement
•higher interest expense primarily due to lower capitalized interest resulting from the declared commercial in-service of the Coastal GasLink pipeline in fourth quarter 2024 and increased levels of short-term borrowing
•lower interest income and other due to lower interest earned on short-term investments and an increase in insurance-related provisions
•higher net income attributable to non-controlling interests primarily due to the net effect of higher net income recognized from Columbia Gas Transmission, LLC (Columbia Gas) and Columbia Gulf Transmission, LLC (Columbia Gulf) assets, the completion of the Southeast Gateway pipeline in second quarter 2025 and the full year impact of the sale of a 13.01 per cent non-controlling equity interest in TGNH to the CFE, completed in second quarter 2024
•risk management activities used to manage our foreign exchange exposure to net liabilities in Mexico and to U.S. dollar‑denominated income and the revaluation of our peso-denominated net monetary liabilities to U.S. dollars.
2024 versus 2023
Comparable earnings from continuing operations in 2024 were $31 million or $0.05 per common share lower than in 2023, and were primarily the net result of:
•changes in comparable EBITDA from continuing operations described above
•higher depreciation and amortization reflecting expansion facilities and new projects placed in service
•higher interest expense primarily due to long-term debt issuances, net of maturities, the foreign exchange impact of a stronger U.S. dollar in 2024 compared to 2023, higher interest rates on short-term borrowings in 2024 and the impact of interest expense allocated to discontinued operations for nine months in 2024 compared to a full year in 2023
•higher AFUDC predominantly due to spending on the Southeast Gateway pipeline project, partially offset by projects placed in service and the cessation of AFUDC on Tula in fourth quarter 2023
•risk management activities used to manage our foreign exchange exposure to net liabilities in Mexico and to U.S. dollar‑denominated income and the revaluation of our peso-denominated net monetary liabilities to U.S. dollars
•higher interest income and other due to higher interest earned on short-term investments and a reduction in insurance-related provisions
•decreased income tax expense due to the impact of Mexico foreign exchange exposure and lower comparable earnings subject to income tax, partially offset by lower foreign income tax rate differentials and higher flow-through income taxes
•higher net income attributable to non-controlling interests primarily due to the net effect of the sale of a 40 per cent non-controlling equity interest in Columbia Gas and Columbia Gulf in fourth quarter 2023 and the full year impact of the 13.01 per cent non-controlling equity interest in TGNH to the CFE, completed in second quarter 2024, partially offset by the divestiture of PNGTS in third quarter 2024.
Comparable earnings per common share reflect the dilutive effect of common shares issued. Refer to the Financial condition section for additional information.
28 | TC Energy Management's discussion and analysis 2025
SUPPLEMENTARY FINANCIAL MEASURE
Net capital expenditures
Net capital expenditures represents capital costs incurred for growth projects, maintenance capital expenditures, contributions to equity investments and projects under development, adjusted for the portion attributed to non-controlling interests in the entities we control. Net capital expenditures reflect capital costs incurred during the period, excluding the impact of timing of cash payments. We use net capital expenditures as a key measure in evaluating our performance in managing our capital spending activities in comparison to our capital plan.
Net capital expenditures does not include an adjustment related to the CFE’s minority interest in TGNH capital expenditures until after the in-service of the projects included as part of the 2022 strategic alliance between TGNH and the CFE. The CFE’s contribution in second quarter 2024 to obtain a 13.01 per cent equity interest in TGNH included consideration of its proportionate share of required capital contributions for approved projects. Net capital expenditures will be adjusted for any new capital projects approved in TGNH going forward.
OUTLOOK
Comparable EBITDA and comparable earnings
We expect our 2026 comparable EBITDA and our 2026 comparable earnings per common share to be higher than 2025 due to the net impact of the following:
•new projects anticipated to be placed in service in 2026, along with the full-year impact of projects placed in service in 2025
•higher revenue from the Columbia Gas settlement
•higher net generation from Bruce Power due to the return to service of Unit 3 from the MCR outage, partially offset by the commencement of the Unit 5 MCR outage
•higher depreciation due to the in-service of Canadian Natural Gas Pipelines and U.S. Natural Gas Pipelines projects
•lower AFUDC primarily due to Southeast Gateway pipeline in-service in 2025.
Consolidated capital expenditures
In 2025, we incurred approximately $5.9 billion in gross capital expenditures on our secured capital program and projects under development, as well as capitalized interest and AFUDC, where applicable. Net capital expenditures after adjusting for the capital expenditures attributable to the non-controlling interests of entities we control were approximately $5.3 billion.
Prior to adjustments for non-controlling interests, we expect to incur gross capital expenditures of approximately $6.0 to $6.5 billion in 2026. We anticipate our net capital expenditures in 2026 to be approximately $5.5 to $6.0 billion.
The majority of our 2026 capital program is focused on the advancement of secured projects including U.S. Natural Gas Pipelines projects, NGTL System expansions, pipeline projects in Mexico, Bruce Power MCR programs and normal course maintenance capital expenditures.
Refer to the Outlook section in each business segment for additional details on expected earnings and capital expenditures
for 2026.
TC Energy Management's discussion and analysis 2025 | 29
CAPITAL PROGRAM
We are developing quality projects under our capital program. These long-life infrastructure assets are supported by long-term commercial arrangements with creditworthy counterparties and/or regulated business models and are expected to generate growth in earnings and cash flows.
Our capital program consists of approximately $21 billion of secured projects that represent commercially supported, committed projects that are either under construction or are in, or preparing to commence the permitting stage.
Three years of maintenance capital expenditures for our businesses are included in the Secured projects table. Maintenance capital expenditures on our regulated Canadian and U.S. natural gas pipelines are added to rate base on which we have the opportunity to earn a return and recover these expenditures through current or future tolls, which is similar to our capacity capital projects on these pipelines.
During 2025, we placed approximately $8.3 billion of projects into service, which included natural gas pipeline capacity projects along our extensive North American asset footprint, including the Southeast Gateway pipeline, as well as progress on the Bruce Power life extension program. In addition, approximately $2.2 billion of maintenance capital expenditures were incurred in the period.
All projects are subject to cost and timing adjustments due to factors including weather, market conditions, route refinement, land acquisition, permitting conditions, scheduling and timing of regulatory permits, as well as other potential restrictions and uncertainties, including inflationary pressures on labour and materials. Amounts exclude capitalized interest and AFUDC, where applicable.
30 | TC Energy Management's discussion and analysis 2025
Secured projects
Estimated and incurred project costs referred to in the following table include 100 per cent of the capital expenditures related to projects within entities that we own or partially own and fully consolidate, as well as our share of equity contributions to fund projects within our equity investments.
| | | | | | | | | | | | | | | | | | | | | | |
(billions of Canadian $, unless otherwise noted) | | Expected in-service date | | Estimated project cost | | Project costs incurred at December 31, 2025 | | |
| | | | | | | | |
Canadian Natural Gas Pipelines1 | | | | | | | | |
NGTL System | | 2026 | | 0.5 | | 2 | 0.4 | | | |
| | 2027 | | 0.4 | | 2 | — | | | |
| | 2028+ | | 0.6 | | 2 | — | | | |
| Regulated maintenance capital expenditures | | 2026-2028 | | 2.6 | | | — | | | |
| U.S. Natural Gas Pipelines | | | | | | | | |
Gillis Access – Extension | | 2026-2027 | | US 0.4 | | | US 0.1 | | | |
Heartland project | | 2027 | | US 0.9 | | | US 0.1 | | | |
| Northwoods project | | 2029 | | US 0.9 | | | — | | | |
Pulaski and Maysville projects | | 2029 | | US 0.8 | | | — | | | |
Southeast Virginia Energy Storage project | | 2030 | | US 0.3 | | | — | | | |
TCO Connector project | | 2030 | | US 0.3 | | | — | | | |
Other capital3 | | 2026-2031 | | US 1.9 | | | US 0.4 | | | |
| Regulated maintenance capital expenditures | | 2026-2028 | | US 2.6 | | | — | | | |
| Mexico Natural Gas Pipelines | | | | | | | | |
Villa de Reyes – South section4 | | — | | | US 0.4 | | | US 0.3 | | | |
Tula5 | | — | | | US 0.4 | | | US 0.3 | | | |
| Power and Energy Solutions | | | | | | | | |
Bruce Power – Unit 3 MCR | | 2026 | | 1.1 | | | 1.1 | | | |
Bruce Power – Unit 4 MCR6 | | 2028 | | 0.9 | | | 0.4 | | | |
Bruce Power – Unit 5 MCR6 | | 2030 | | 1.1 | | | 0.2 | | | |
Bruce Power – life extension7 |
| 2026-2031 | | 1.5 | | | 0.7 | | | |
| Other | | | | | | | | |
Non-recoverable maintenance capital expenditures8 | | 2026-2028 | | 0.5 | | | — | | | |
| | | | 18.1 | | | 4.0 | | | |
Foreign exchange impact on secured projects9 | | | | 3.3 | | | 0.4 | | | |
Total secured projects | | | | 21.4 | | | 4.4 | | | |
1Our share of committed equity to fund the estimated cost of the Coastal GasLink - Cedar Link project is $37 million.
2Includes amounts related to projects within the Multi-Year Growth Plan (MYGP) that have received FID.
3Includes capital expenditures related to certain large-scope maintenance projects across our U.S. natural gas footprint due to their discrete nature for regulatory recovery.
4We are working with the CFE on completing the remaining section of the Villa de Reyes pipeline. The in-service date will be determined upon resolution of outstanding stakeholder issues.
5Estimated project cost as per contracts signed in 2022 as part of the TGNH strategic alliance between TC Energy and the CFE. We continue to evaluate the development and completion of the Tula pipeline with the CFE, subject to a future FID and an updated cost estimate.
6Amounts are net of expected investment tax credits.
7Reflects amounts to be invested under the Asset Management program to 2027, other life extension projects and the incremental uprate initiative.
8Includes non-recoverable maintenance capital expenditures from all segments and is primarily related to our Power and Energy Solutions and Corporate assets.
9Reflects U.S./Canada foreign exchange rate of 1.37 at December 31, 2025.
TC Energy Management's discussion and analysis 2025 | 31
Projects under development
In addition to our secured projects, we are pursuing a portfolio of quality projects in various stages of development across each of our business units. Projects under development have greater uncertainty with respect to timing and estimated project costs and are subject to company and regulatory approvals, unless otherwise noted. New growth opportunities will be assessed within our disciplined capital allocation framework in order to fit within our annual capital expenditure parameters. As these new opportunities advance and reach required milestones, they will be included in the Secured projects table.
Canadian Natural Gas Pipelines
We continue to focus on optimizing the utilization and value of our existing Canadian Natural Gas Pipelines assets, including sanctioned in-corridor expansions, providing connectivity to LNG export terminals, connecting growing WCSB gas supplies to domestic and export markets and other opportunities, including progressing our Multi-Year Growth Plan (MYGP). The MYGP is comprised of multiple distinct projects with various targeted in-service dates, subject to final company and regulatory approvals.
U.S. Natural Gas Pipelines
We are currently pursuing a variety of projects that are expected to replace, upgrade, expand and extend our U.S. Natural Gas Pipelines footprint. The enhanced facilities associated with these projects are expected to improve the reliability of our systems and provide additional transportation capacity under long-term contracts. We continue to see growing demand across multiple segments, driving potential expansion projects to support new natural gas-fired power generation, coal to natural gas conversions, LDC growth and data centres. Our footprint is well positioned to deliver natural gas supply through our existing utility customer base or by way of direct connections. Additional opportunities include direct and indirect interconnects to deliver natural gas to power generation for data centres, continued LNG development in proximity to our footprint and LDC peak day growth.
Power and Energy Solutions
Bruce Power
Life Extension Program
The continuation of Bruce Power’s life extension program will require the investment of our proportionate share of both the MCR program costs on Units 7 and 8 and the remaining Asset Management program costs, which continue beyond the completion of the MCR program in 2033, extending the life of Units 3 to 8 and the Bruce Power site to 2064. Preparation work for the Unit 7 and 8 MCRs is underway and future MCR investments will be subject to discrete decisions for each unit with specified off-ramps available to Bruce Power and the IESO. Refer to the Power and Energy Solutions – Significant events section for additional information.
Energy Solutions
Ontario Pumped Storage
With our prospective partners, Saugeen Ojibway Nation, we continue to advance the Ontario Pumped Storage Project, an energy storage facility located in Meaford, Ontario. The 1,000 MW project is expected to provide enough electricity to power one million homes for up to 11 hours, while enhancing the reliability and efficiency of Ontario's electricity system.
Using water and gravity, the project is like a natural battery that will store surplus electricity when demand is low and later redeploy it during periods of high demand. The project will support the planned buildout of Ontario’s nuclear fleet and can deliver Ontario’s clean nuclear power on demand.
In January 2025, the Ontario Government announced it was investing up to $285 million to advance pre-development work on the project. With this investment, the project is advancing critical development work, including the completion of a detailed cost estimate, the commencement of federal and provincial environmental assessments, advanced design and engineering and continued community engagement. It is expected that our Board of Directors, Saugeen Ojibway Nation and the Ontario Government will each make a final investment decision on the project following this pre-development work.
32 | TC Energy Management's discussion and analysis 2025
NATURAL GAS PIPELINES BUSINESS
Our natural gas pipeline network transports natural gas from supply basins to LDCs, power generation plants, industrial facilities, interconnecting pipelines, LNG export terminals and other businesses across Canada, the U.S. and Mexico. Our network of pipelines taps into most major supply basins and transports over 30 per cent of continental daily natural gas needs through:
•wholly-owned natural gas pipelines – 63,185 km (39,260 miles)
•partially-owned natural gas pipelines – 30,986 km (19,253 miles).
In addition to our natural gas pipelines, we have regulated natural gas storage facilities in the U.S. with a total working gas capacity of 532 Bcf, making us one of the largest providers of natural gas storage and related services to key markets in North America.
Our Natural Gas Pipelines business is split into three operating segments representing its geographic diversity: Canadian Natural Gas Pipelines, U.S. Natural Gas Pipelines and Mexico Natural Gas Pipelines.
Strategy
Our strategy is to maximize the value of our existing natural gas pipeline systems in a safe and reliable manner while responding to the changing flow patterns of natural gas in North America. We also pursue new pipeline opportunities to add incremental value to our business.
Our key areas of focus include:
•primarily in-corridor expansion and extension of our existing significant North American natural gas pipeline footprint
•connections to new and growing industrial and electric power generation markets and LDCs
•expanding our systems in key locations in North America and developing new projects to provide connectivity to LNG export terminals, both operating and proposed
•connections to growing Canadian and U.S. shale gas and other supplies
•minimizing our GHG and methane emissions through operational excellence.
Each of these areas plays a critical role in meeting the transportation requirements for supply of and demand for natural gas in North America.
Our natural gas pipeline systems are helping solve the energy trilemma - energy security, affordability and sustainability. We believe natural gas provides a reliable, high-efficiency energy source that is helping to support the displacement of coal-fired power while backstopping the intermittency of renewable power sources across North America. We continue to improve operational efficiencies and factor sustainability-related considerations into our decision making around new projects, modernization, maintenance, electrification and enhanced leak detection. Our business model provides socioeconomic benefits as we work closely with Indigenous communities, community-based organizations, landowners and other stakeholders in alignment with our values and sustainability commitments.
Recent highlights
Canadian Natural Gas Pipelines
•placed approximately $0.2 billion of capacity capital projects into service in 2025 primarily related to the Valhalla section of NGTL's Valhalla North and Berland River (VNBR) project
•approximately $1.1 billion of MYGP expansion facilities have received FID at December 31, 2025, with in-service dates starting in 2026
•NGTL System achieved record inflows
•continued strong throughput on the Canadian Mainline.
TC Energy Management's discussion and analysis 2025 | 33
U.S. Natural Gas Pipelines
•placed approximately US$2.7 billion of capital projects in service in 2025, including the East Lateral XPress, VR Project, WR Project, Eastern Panhandle, Ventura XPress and maintenance capital
•sanctioned approximately US$2.3 billion of capital projects including the Northwoods and TCO Connector projects
•Columbia Gas filed a Section 4 Rate Case with FERC in September 2024 requesting an increase to maximum transportation rates effective April 1, 2025 and on October 30, 2025, FERC approved the settlement filing (Columbia Gas Settlement). Previously accrued rate refund liabilities were refunded to customers, including interest, in fourth quarter 2025
•ANR and Great Lakes each filed a Section 4 Rate Case with FERC in April 2025 requesting an increase to their maximum transportation rates effective November 1, 2025, subject to refund. The rate cases are progressing as expected as we continue to pursue a collaborative process through settlement negotiations
•achieved record throughput volumes on a number of our pipelines.
Mexico Natural Gas Pipelines
•the Southeast Gateway Pipeline was completed in May 2025. In July 2025, the newly constituted CNE approved our regulated rates required to provide service to potential future interruptible service users on the Southeast Gateway pipeline other than the CFE
•overall pipeline utilization continued to increase.
34 | TC Energy Management's discussion and analysis 2025
UNDERSTANDING OUR NATURAL GAS PIPELINES BUSINESS
Natural gas pipelines move natural gas from major sources of supply to locations or markets that use natural gas to meet their energy needs.
Our natural gas pipelines business builds, owns and operates a network of natural gas pipelines across North America that connects gas production to interconnects, end-use markets and LNG export terminals. The network includes underground pipelines that transport natural gas predominantly under high pressure, compressor stations that act like pumps to move large volumes of natural gas along the pipeline, meter stations that record the amount of natural gas coming on the network at receipt locations and leaving the network at delivery locations and regulated natural gas storage facilities that provide services to customers and help maintain the overall balance of the pipeline systems.
Regulation of tolls and cost recovery
Our natural gas pipelines are generally regulated by the CER in Canada and FERC in the U.S. During March 2025, Mexico natural gas pipeline regulation transitioned from the CRE to the newly constituted CNE under the SENER.
These entities regulate the construction, operation and requested abandonment of pipeline infrastructure. For our rate regulated assets in Canada and the U.S., these regulators allow us to recover costs to operate the network by collecting tolls for services. These tolls generally include a return on our capital invested in the assets or rate base, as well as recovery of the rate base over time through depreciation. Other costs generally recovered through tolls include OM&A, taxes and interest on debt. The regulators generally review our costs to ensure they are reasonable and prudently incurred and approve tolls that provide a reasonable opportunity to recover those costs. In Mexico, while the majority of our capacity is subscribed under a long-term contractual rate, the regulator sets rates for interruptible services.
Business environment and strategic priorities
The North American natural gas pipeline network has been developed to connect diverse supply regions to domestic markets and to meet demand from LNG export facilities. Use and growth of this infrastructure is affected by changes in the location and relative cost of natural gas supplies, as well as changes in the location of markets and level of demand.
We have significant pipeline footprints that serve two of the most prolific supply regions of North America – the WCSB and the Appalachian basin. Our pipelines also source natural gas from other significant basins including the Rockies, Williston, Haynesville, Fayetteville and Anadarko basins. We expect continued growth in North American natural gas production to meet demand within growing domestic markets, particularly in the electric generation and industrial sectors which benefit from a relatively low natural gas price. In addition, North American supply is expected to benefit from increased natural gas demand in Mexico and growing access to international markets via LNG exports. We expect North American natural gas demand, including LNG exports, of approximately 155 Bcf/d by 2029, reflecting an increase of approximately 30 Bcf/d from 2024 levels.
As the world shifts toward a lower-carbon economy, we believe that further retirements of coal-fired power generation as well as export demand growth over the next five to 10 years will offer growth opportunities for base-load power from natural gas-fired generation. We expect that this projected growth in demand for natural gas, coupled with the anticipated increases in key producing areas like WCSB, onshore Gulf Coast, Appalachian and the Permian basin, will provide investment opportunities for pipeline infrastructure companies to build new facilities or increase utilization of their existing footprint. Modernizing our existing systems and assets and decarbonizing our energy consumption along our natural gas pipeline systems is expected to provide ongoing additional capital investment opportunities that will meet our risk preferences while supporting our GHG emissions reduction targets.
TC Energy Management's discussion and analysis 2025 | 35
Changing demand
The abundant supply of natural gas has supported increased demand, particularly in the following areas:
•natural gas-fired power generation, including for use in emerging data centres
•global LNG exports
•petrochemical and industrial facilities
•Alberta oil sands.
Natural gas producers continue to progress opportunities to sell natural gas to global markets which involves connecting natural gas supplies to LNG export terminals, both operating and proposed, along the U.S. Gulf Coast and the east and west coasts of Canada, the U.S. and Mexico. The increasing export of natural gas to Mexico is driven by the CFE’s need to serve existing markets and requires pipelines to serve new regions. We believe that natural gas is a key energy transition fuel for Mexico.
Overall, we are forecasting significant natural gas demand growth in the future to support economic expansion and industrial load growth, conversion to lower GHG emission-intensive fuels for industrial and power generation use and LNG export prospects. The demand created by these new markets provides additional opportunities for us to build new pipeline infrastructure and to increase throughput on our existing pipelines.
Commodity prices
The profitability of our natural gas pipelines business is not directly tied to commodity prices given we are a transporter of the commodity and the transportation tolls are not tied to the price of natural gas. However, the cyclical supply and demand nature of commodities and related pricing can have an indirect impact on our business where producers may choose to accelerate or delay development of gas reserves or, similarly on the demand side, projects requiring natural gas may be accelerated or delayed depending on market or price conditions.
More competition
Changes in supply and demand levels and locations have resulted in increased competition to provide transportation services throughout North America. Our well-distributed footprint of natural gas pipelines, particularly in the low-cost WCSB and the Appalachian basin, both of which are connected to North American demand centres, has placed us in a strong competitive position. Incumbent pipelines benefit from the connectivity and economies of scale afforded by the base infrastructure, as well as existing right-of-way and operational synergies given the increasing challenges of siting and permitting new pipeline construction and expansions. We have and will continue to offer competitive services to capture growing supply and North American demand that now includes access to global markets through LNG exports.
Strategic priorities
Our pipelines deliver the natural gas that millions of individuals and businesses across North America rely on for their energy needs. We are focused on capturing opportunities resulting from growing natural gas supply and connecting new markets while satisfying increasing demand for natural gas within existing markets. We are also focused on adapting our existing assets to changing natural gas flow dynamics and supporting our corporate-level sustainability commitments and targets.
Our goal is to place all of our projects into service on time and on budget while ensuring the safety of our people, the environment and the general public impacted by the construction and operation of these facilities. In 2026, we will continue to focus on the execution of our existing capital program, which includes initiating and advancing a suite of U.S. pipeline projects as well as investment in Canada, which includes the NGTL System and the Cedar Link project and investment in our Mexico gas pipelines. We will remain focused on capital discipline as we continue to pursue the next wave of growth opportunities.
Our marketing entities will complement our natural gas pipeline operations and generate non-regulated revenues by managing the procurement of natural gas supply and pipeline transportation capacity for natural gas customers within our pipeline corridors.
36 | TC Energy Management's discussion and analysis 2025
TC Energy Management's discussion and analysis 2025 | 37
We are the operator of all of the following natural gas pipelines and regulated natural gas storage assets except for Iroquois.
| | | | | | | | | | | | | | | | | | | | | | | |
| | Length | | Description | |
Ownership |
|
| Canadian pipelines | | | | | | |
|
C1 | NGTL System | | 24,096 km (14,973 miles) | | Receives, transports and delivers natural gas within Alberta and British Columbia, and connects with Canadian Mainline, Coastal GasLink, Foothills and third-party pipelines. This is our natural gas gathering and transportation system for the WCSB, connecting most of the natural gas production in western Canada to domestic and export markets and is well positioned to connect growing supply in northeast British Columbia and northwest Alberta. Our capital program for new pipeline facilities is driven by these two supply areas, along with growing demand for intra-Alberta firm transportation for electric power generation, oil sands development and petro-chemical feedstock, as well as to our major export points at the Empress and Alberta/British Columbia delivery locations. The NGTL System is also well positioned to connect WCSB supply to LNG export facilities on the Canadian west coast through future extensions or expansions of the system or future connections to other pipelines serving that area. | | 100 | % |
|
C2 | Canadian Mainline | | 14,087 km (8,753 miles) | | Transports natural gas from the Alberta/Saskatchewan border and the Ontario/U.S. border to serve Canadian and U.S. markets. This pipeline supplies markets in the Canadian Prairies, Ontario, Québec, the Canadian Maritimes, as well as to U.S. markets including the Midwest, Gulf Coast and U.S. Northeast from the WCSB and, through interconnects, from the Appalachian basin. | | 100 | % |
|
C3 | Foothills | | 1,289 km (801 miles) | | Transports natural gas from central Alberta to the U.S. border for export to the U.S. Midwest, Pacific Northwest, California and Nevada. | | 100 | % |
| | | | | | | |
C4 | Coastal GasLink | | 671 km (417 miles) | | Transports natural gas from the Montney region to LNG Canada's liquefaction facility near Kitimat, British Columbia, supplied via connections with the NGTL System and other pipelines. | | 35 | % |
|
C5 | Trans Québec & Maritimes (TQM) | | 648 km (403 miles) | | Connects with the Canadian Mainline near the Ontario/Québec border to transport natural gas to the Montréal to Québec City corridor and interconnects with a third-party pipeline at the U.S. border. | | 50 | % |
| | | | | | | |
C6 | Ventures LP | | 133 km (83 miles) | | Transports natural gas to the oil sands region near Fort McMurray, Alberta. | | 100 | % |
| | | | | | | |
C7 | Great Lakes Canada | | 60 km (37 miles) | | Transports natural gas from the Great Lakes system in the U.S. to a point near Dawn, Ontario through a connection at the U.S. border underneath the St. Clair River. | | 100 | % |
|
| U.S. pipelines and gas storage assets | | | | | | |
|
U1 | Columbia Gas | | 18,598 km
(11,556 miles) | | Transports natural gas primarily from the Appalachian basin, which contains the Marcellus and Utica shale plays, two of the largest natural gas shale plays in North America, to markets and pipeline interconnects throughout the U.S. Northeast, Midwest and Atlantic regions and is well positioned to connect growing supply to markets in this area. This system also interconnects with other pipelines that provide access to key markets in the U.S. Northeast, the Midwest, the Atlantic coast and south to the Gulf of Mexico and its growing demand for natural gas to serve LNG exports. | | 60 | % |
| | | | | | | |
U1.1 | Columbia Storage | | 285 Bcf | | Provides regulated underground natural gas storage service from several facilities (not all shown) to customers in key eastern markets. We own a 60 per cent interest in the 273 Bcf Columbia Storage facility and a 50 per cent interest in the 12 Bcf Hardy Storage facility. | | Various |
| | | | | | | |
38 | TC Energy Management's discussion and analysis 2025
| | | | | | | | | | | | | | | | | | | | | | | |
| | Length | | Description | |
Ownership |
|
U2 | ANR1 | | 15,075 km
(9,367 miles) | | Transports natural gas from various supply basins to markets throughout the U.S. Midwest and U.S. Gulf Coast. This pipeline system connects supply basins and markets throughout the U.S. Midwest and south to the Gulf of Mexico. This includes connecting supply in Texas, Oklahoma, the Appalachian basin and the Gulf of Mexico to markets in Wisconsin, Michigan, Illinois and Ohio. In addition, ANR has bidirectional capability on its Southeast Mainline and delivers gas produced from the Appalachian basin to customers throughout the U.S. Gulf Coast region. | | 100 | % |
| | | | | | | |
U2.1 | ANR Storage | | 247 Bcf | | Provides regulated underground natural gas storage service from several facilities (not all shown) to customers in key mid-western markets. | | 100 | % |
| | | | | | | |
U3 | Columbia Gulf | | 5,419 km
(3,367 miles) | | Transports natural gas to various markets and pipeline interconnects in the southern U.S. and U.S. Gulf Coast. This pipeline system transports growing Appalachian basin supplies to various U.S. Gulf Coast markets and LNG export terminals from its interconnections with Columbia Gas and other pipelines. | | 60 | % |
| | | | | | | |
U4 | Great Lakes | | 3,404 km
(2,115 miles) | | Connects with the Canadian Mainline near Emerson, Manitoba and to Great Lakes Canada near St Clair, Ontario, plus interconnects with ANR at Crystal Falls and Farwell in Michigan, to transport natural gas to eastern Canada and the U.S. Midwest. | | 100 | % |
| | | | | | | |
U5 | Northern Border | | 2,272 km
(1,412 miles) | | Transports WCSB, Bakken and Rockies natural gas from connections with Foothills and Bison to U.S. Midwest markets. | | 50 | % |
| | | | | | | |
U6 | GTN | | 2,216 km (1,377 miles) | | Transports WCSB and Rockies natural gas to Washington, Oregon and California. Connects with Tuscarora and Foothills. | | 100 | % |
| | | | | | | |
U7 | Iroquois | | 669 km
(416 miles) | | Connects with the Canadian Mainline and serves markets in New York. | | 50 | % |
| | | | | | | |
U8 | Tuscarora | | 491 km
(305 miles) | | Transports natural gas from GTN at Malin, Oregon to markets in northeastern California and northwestern Nevada. | | 100 | % |
| | | | | | | |
U9 | Bison | | 488 km
(303 miles) | | Transports natural gas from the Powder River basin in Wyoming to Northern Border in North Dakota. | | 100 | % |
| | | | | | | |
U10 | Millennium | | 424 km
(263 miles) | | Transports natural gas primarily sourced from the Marcellus shale play to markets across southern New York and the lower Hudson Valley, as well as to New York City through its pipeline interconnections. | | 47.5 | % |
| | | | | | | |
U11 | Crossroads | | 325 km
(202 miles) | | Interstate natural gas pipeline operating in Indiana and Ohio with multiple interconnects to other pipelines. | | 100 | % |
| | | | | | | |
U12 | North Baja1 | | 138 km
(86 miles) | | Transports natural gas between Arizona and California and connects with a third-party pipeline on the California/Mexico border. | | 100 | % |
| | | | | | | |
U13 | Gillis Access | | 68 km (42 miles) | | A pipeline system that connects supplies from the Haynesville basin at Gillis, Louisiana to markets elsewhere in Louisiana. | | 100 | % |
| | | | | | | |
| | | | | | | |
| | | | | | | |
| | | | | | | |
| | | | | | | |
| | | | | | | |
| | | | | | | |
TC Energy Management's discussion and analysis 2025 | 39
| | | | | | | | | | | | | | | | | | | | | | | |
| | Length | | Description | |
Ownership |
|
| Mexico pipelines | | | | | | |
|
M1 | Sur de Texas | | 770 km
(478 miles) | | Offshore pipeline that transports natural gas from the U.S./ Mexican border near Brownsville, Texas, to Mexican power plants in Altamira, Tamaulipas and Tuxpan, Veracruz, where it interconnects with the Tamazunchale and Tula pipelines and other third-party facilities. This offshore pipeline transports natural gas from the Texas border to power and industrial markets in the eastern and central regions of Mexico. | | 60 | % |
| | | | | | | |
M2 | Southeast Gateway | | 715 km
(444 miles) | | Offshore pipeline that connects to the Tula pipeline and transports gas to delivery points in Coatzacoalcos, Veracruz and Paraíso, Tabasco in Mexico’s southeast region. | | 86.99 | % |
| | | | | | | |
M3 | Topolobampo | | 572 km
(355 miles) | | Transports natural gas to El Oro and Topolobampo, Sinaloa, from interconnects with third-party pipelines in El Encino, Chihuahua and El Oro. The system supplies power plants and industrial facilities. | | 100 | % |
| | | | | | | |
M4 | Mazatlán | | 430 km
(267 miles) | | Transports natural gas from El Oro to Mazatlán, Sinaloa, interconnects with third-party pipelines and connects to the Topolobampo pipeline at El Oro. The system supplies power plants and industrial facilities. | | 100 | % |
| | | | | | | |
M5 | Tamazunchale | | 370 km
(230 miles) | | Transports natural gas from Naranjos, Veracruz and Higueros (Sur de Texas-Tuxpan System) to Tamazunchale, San Luis Potosi and on to El Sauz, Querétaro in central Mexico. The system supplies power plants and industrial facilities. | | 86.99 | % |
| | | | | | | |
M6 | Villa de Reyes – North and Lateral sections | | 316 km (196 miles) | | The north and lateral sections of the Villa de Reyes pipeline are interconnected to our Tamazunchale pipeline and third-party systems, supporting gas deliveries to power plants in Villa de Reyes, San Luis Potosí and Salamanca, Guanajuato. | | 86.99 | % |
| | | | | | | |
M7 | Guadalajara | | 313 km
(194 miles) | | Bidirectional pipeline that connects imported LNG supply near Manzanillo and continental gas supply near Guadalajara to power plants and industrial customers in the states of Colima and Jalisco. | | 100 | % |
| | | | | | | |
M8 | Tula – East section | | 114 km
(71 miles) | | The east section of the Tula pipeline transports natural gas from Sur de Texas to power plants in Tuxpan, Veracruz. | | 86.99 | % |
| Under construction | | | | | | |
| | | | | | | |
| Canadian pipelines | | | | | | |
| | | | | | | |
| NGTL System2,3,4 | | 35 km (22 miles) | | Includes expansion facilities, the Berland River compressor unit of the VNBR project and portions of the MYGP, with targeted in-service dates beginning in 2026. | | 100 | % |
| | NGTL System – MYGP2,3,4 | | n/a | | A plan of multiple distinct projects for expansion facilities on the NGTL System with targeted in-service dates between 2027 and 2030. | |
| Coastal GasLink – Cedar Link project2,3 | | n/a | | The Cedar Link project is an expansion of the Coastal GasLink pipeline that is expected to enable delivery of up to 0.4 Bcf/d of natural gas to the Cedar LNG facility. This includes the addition of a new compressor station, connector pipeline and meter station to Coastal GasLink's existing pipeline infrastructure, which is expected to be placed in service in 2028. | | 35 | % |
| | | |
| | | | | | | |
| | | | | | |
| | | | | | | |
| | | | | | | |
| | | | | | | |
| | | | | | |
| | | | | | | |
| | | | | | | |
| | | | | | | |
40 | TC Energy Management's discussion and analysis 2025
| | | | | | | | | | | | | | | | | | | | | | | |
| Under construction (continued) | | Length | | Description | | Ownership |
| | | | | | | |
| U.S. pipelines | | | | | | |
| | | | | | | |
U14 | Gillis Access – Extension2,3 | | 63 km
(39 miles) | | An extension of Gillis Access to further connect supplies from Haynesville basin at Gillis with anticipated in-service dates starting in late 2026. | | 100 | % |
| | | | | | | |
| Bison XPress Project1,2 | | n/a | | A project with Northern Border, a 50 per cent owned subsidiary, and Bison, a wholly-owned subsidiary, that will replace and upgrade certain facilities while improving reliability, which is expected to be placed in service in 2026. | | Various |
| | | | | | | |
| Mexico pipelines | | | | | | |
| | | | | | | |
| | | | | | | |
| | | | | | | |
M9 | Villa de Reyes – South section | | 110 km (68 miles) | | This pipeline section will connect to the operational north and lateral sections of the Villa de Reyes pipeline and to the Tula pipeline. | | 86.99 | % |
| Permitting and pre-construction phase | | | | |
| | | | | | | |
| Canadian pipelines | | | | | | |
| | | | | | | |
| NGTL System – MYGP2,3,4 | | 54 km (34 miles) | | Includes portions of the MYGP expansion facilities with targeted in-service dates beginning in 2027. | | 100 | % |
| | | | | | | |
| U.S. pipelines | | | | | | |
| | | | | | | |
| Pulaski Project2,3 | | 64 km (40 miles) | | A pipeline extension project on our Columbia Gulf system designed to serve existing power plants. The project is expected to be placed in service in 2029. | | 60 | % |
| | | | | | | |
| Maysville Project2,3 | | 64 km (40 miles) | | A pipeline extension project on our Columbia Gulf system designed to serve existing power plants. The project is expected to be placed in service in 2029. | | 60 | % |
| | | | | | | |
| TCO Connector | | 45 km (28 miles) | | A pipeline extension project on our Columbia Gas system designed to service a new gas-fired power plant. The project is expected to be placed in service 2030. | | 60 | % |
| | | | | | | |
| Southeast Virginia Energy Storage Project2 | | 1.1 Bcf | | An LNG storage facility located on our Columbia Gas system in southeast Virginia designed to serve an existing LDC's growing market. The project is expected to be placed in service in 2030. | | 60 | % |
| | | | | | | |
| Heartland Project1,2 | | n/a | | An expansion project on our ANR system that is designed to increase capacity and improve system reliability with upgrades to compression facilities, expected to be placed in service in 2027. | | 100 | % |
| | | | | | | |
| Northwoods Project1,2 | | n/a | | An expansion project on our ANR system that is designed to increase capacity to serve natural gas-fired electric generation demand in the U.S. Midwest, including data centres and overall economic growth. The project is expected to be placed in service in 2029. | | 100 | % |
| | | | | | | |
| Mexico pipelines | | | | | | |
| | | | | | | |
M10 | Tula3 | | 100 km (62 miles) | | TC Energy and the CFE are assessing options to complete the remaining sections of the pipeline, which are subject to FID. | | 86.99 | % |
1Includes compressor station modifications, additions and/or expansion projects with no additional pipe length.
2Facilities and some pipelines are not shown on the map.
3Final pipe lengths are subject to change during construction and/or final design considerations.
4Includes projects within the MYGP that have received FID.
TC Energy Management's discussion and analysis 2025 | 41
Canadian Natural Gas Pipelines
UNDERSTANDING OUR CANADIAN NATURAL GAS PIPELINES SEGMENT
The Canadian Natural Gas Pipelines business is subject to regulation by various federal and provincial governmental agencies. The CER has jurisdiction over our regulated Canadian natural gas interprovincial pipeline systems, while provincial regulators have jurisdiction over pipeline systems operating entirely within a single province. All of our major Canadian natural gas pipeline assets are regulated by the CER with the exception of the Coastal GasLink pipeline, which is regulated by the BC Energy Regulator.
For the interprovincial natural gas pipelines it regulates, the CER approves tolls, facilities and services that are in the public interest and provide a reasonable opportunity for the pipeline to recover its costs to operate the pipeline. Included in the overall toll is a return on the investment we have made in the assets, referred to as the return on equity. Generally, the CER has approved a deemed capital structure of 40 per cent equity and 60 per cent debt. Typically, tolls are based on the cost of providing service, including the cost of financing, divided by a forecast of volumes. Any variance in either costs or the actual volumes transported can result in an over-collection or under-collection of revenues that is normally trued up the following year in the calculation of the tolls for that period. The return on equity, however, would continue to be earned at the rate approved by the CER.
Subject to approval by the CER, we and our customers can also establish settlement arrangements that may have elements that vary from the typical toll-setting process. Settlements can include longer terms and mechanisms such as incentive agreements that can have an impact on the actual return on equity achieved. Examples include fixing the OM&A component in determining revenue requirements where variances are to the pipeline's account or shared between the pipeline and shippers.
The NGTL System is operating under the CER approved five-year negotiated revenue requirement settlement for 2025-2029 (the 2025-2029 NGTL Settlement), which commenced on January 1, 2025 and includes an approved ROE of 10.1 per cent on 40 per cent deemed common equity. This settlement provides the NGTL System with higher depreciation rates and the opportunity to further increase depreciation rates with an incentive if tolls fall below specified levels, or if growth projects are undertaken. It also includes incentive mechanisms to reduce both physical emissions and emission compliance costs, while also providing incentive for certain operating costs where variances from projected amounts and emissions savings are shared with customers. The Canadian Mainline is operating under the 2021-2026 Mainline settlement, which includes an incentive to decrease costs and increase revenues.
SIGNIFICANT EVENTS
NGTL System
In the year ended December 31, 2025, the NGTL System placed approximately $0.2 billion of capacity projects in service.
Multi-Year Growth Plan
The 2025-2029 NGTL Settlement enables an investment framework that supports our Board of Directors' approval to allocate up to $3.3 billion of capital towards progression of the MYGP for expansion facilities to meet commitments on the NGTL System. It is comprised of multiple distinct projects with various targeted in-service dates, subject to final company and regulatory approvals. To date, approximately $1.1 billion of MYGP expansion facilities have received FID, with various in-service dates starting in 2026. We continue to evaluate plans for each MYGP facility to optimize cost and schedule. Completion of the MYGP is expected to enable approximately 1.0 Bcf/d of incremental system throughput.
Valhalla North and Berland River Project
We continue to advance construction of the Valhalla North and Berland River project. The Valhalla section, which consists of approximately 33 km (21 miles) of new pipeline, was placed in service in third quarter 2025, with a capital cost of approximately $0.2 billion. The Berland River section, which includes a new non-emitting electric compressor unit and associated facilities, has a target in-service date in the second half of 2026 and an estimated capital cost of $0.3 billion. The project is designed to provide incremental capacity on the NGTL System of approximately 428 TJ/d (400 MMcf/d).
42 | TC Energy Management's discussion and analysis 2025
Coastal GasLink
Coastal GasLink Pipeline
In October 2025, pursuant to the November 2024 commercial agreement executed with LNG Canada (LNGC) and each of the five LNGC participants, TC Energy received a one-time payment of $199 million in recognition of completed work and final cost settlement. This payment was recognized by TC Energy as an in-substance distribution from Coastal GasLink LP in our 2024 Consolidated financial statements.
Reclamation activities associated with post-construction work were completed in 2025. In addition, Coastal GasLink LP has resolved all material claims with a net positive recovery overall to Coastal GasLink LP. Refer to Note 30, Commitments, contingencies and guarantees, of our 2025 Consolidated financial statements for additional information.
Indigenous Equity Option
In March 2022, we announced the signing of option agreements to sell up to a 10 per cent equity interest in Coastal GasLink LP to Indigenous communities across the project corridor, from our current 35 per cent equity ownership. In January 2026, prospective investors entered into a binding window for these options, which is expected to remain in effect through to the end of 2026. Closing of the equity sale is subject to customary regulatory approvals and consents, including the consent of LNGC.
TC Energy Management's discussion and analysis 2025 | 43
FINANCIAL RESULTS
The following is a reconciliation of comparable EBITDA and comparable EBIT (our non-GAAP measures) to segmented earnings (losses)(the most directly comparable GAAP measure). Refer to page 22 for more information on non-GAAP measures we use.
| | | | | | | | | | | | | | | | | | | | |
| year ended December 31 | | | | | | |
| (millions of $) | | 2025 | | 2024 | | 2023 |
| | | | | | |
| NGTL System | | 2,586 | | | 2,393 | | | 2,201 | |
| Canadian Mainline | | 817 | | | 787 | | | 789 | |
| | | | | | |
Other Canadian pipelines1 | | 284 | | | 208 | | | 345 | |
| Comparable EBITDA | | 3,687 | | | 3,388 | | | 3,335 | |
| Depreciation and amortization | | (1,523) | | | (1,382) | | | (1,325) | |
| Comparable EBIT | | 2,164 | | | 2,006 | | | 2,010 | |
Specific items: | | | | | | |
| Gain on sale of non-core assets | | — | | | 10 | | | — | |
| Coastal GasLink impairment charge | | — | | | — | | | (2,100) | |
| | | | | | |
| Segmented earnings (losses) | | 2,164 | | | 2,016 | | | (90) | |
1Includes results from Foothills, Ventures LP, Great Lakes Canada and our proportionate share of income related to investments in TQM and Coastal GasLink, as well as general and administrative and business development costs related to our Canadian natural gas pipelines.
Canadian Natural Gas Pipelines segmented earnings were $2.2 billion in 2025 compared to $2.0 billion in 2024 and segmented losses of $0.1 billion in 2023, and included the following specific items, which have been excluded from our calculation of comparable EBITDA and comparable EBIT:
•a pre-tax gain on sale of non-core assets of $10 million in second quarter 2024
•a pre-tax impairment charge in 2023 of $2.1 billion related to our equity investment in Coastal GasLink LP.
Net income for our rate-regulated Canadian natural gas pipelines is primarily affected by our approved ROE, investment base, the level of deemed common equity and incentive earnings. Comparable EBITDA is impacted by these factors, as well as changes in depreciation, financial charges and income taxes. These additional items do not have a significant impact on net income as they are almost entirely recovered in revenues on a flow-through basis.
Net income and average investment base
| | | | | | | | | | | | | | | | | | | | |
| year ended December 31 | | | | | | |
| (millions of $) | | 2025 | | 2024 | | 2023 |
| | | | | | |
| Net income | | | | | | |
NGTL System | | 804 | | | 775 | | | 770 | |
Canadian Mainline | | 258 | | | 244 | | | 230 | |
| Average investment base | | | | | | |
NGTL System | | 19,277 | | | 19,334 | | | 19,008 | |
Canadian Mainline | | 3,762 | | | 3,697 | | | 3,709 | |
Net income for the NGTL System increased by $29 million in 2025 compared to 2024 primarily due to higher incentive earnings and increased by $5 million in 2024 compared to 2023 mainly due to a higher average investment base resulting from continued system expansions, partially offset by an incentive loss. The NGTL System is currently operating under the 2025-2029 NGTL Settlement, which commenced on January 1, 2025 and includes an approved ROE of 10.1 per cent on 40 per cent deemed common equity. This settlement provides the NGTL System with higher depreciation rates and the opportunity to further increase depreciation rates with an incentive if tolls fall below specified levels, or if growth projects are undertaken. It also includes incentive mechanisms to reduce both physical emissions and emission compliance costs, while also providing an incentive for certain operating costs where variances from projected amounts and emissions savings are shared with customers. Refer to the Canadian Natural Gas Pipelines - Significant events section for additional information.
44 | TC Energy Management's discussion and analysis 2025
Net income for the Canadian Mainline increased by $14 million in 2025 compared to 2024 and by $14 million in 2024 compared to 2023 mainly as a result of higher incentive earnings. The Canadian Mainline is operating under the 2021-2026 Mainline Settlement, which includes an approved ROE of 10.1 per cent on 40 per cent deemed common equity and an incentive to decrease costs and increase revenues on the pipeline under a beneficial sharing mechanism with our customers.
Comparable EBITDA
Comparable EBITDA for Canadian Natural Gas Pipelines was $299 million higher in 2025 compared to 2024 primarily due to:
•higher flow-through depreciation and income taxes as well as higher incentive earnings, partially offset by lower flow-through financial charges and lower rate base earnings on the NGTL System
•higher contributions from Coastal GasLink mainly resulting from the declared commercial in-service of the pipeline in fourth quarter 2024
•higher incentive earnings, flow-through depreciation and income taxes on the Canadian Mainline.
Comparable EBITDA for Canadian Natural Gas Pipelines in 2024 was $53 million higher than 2023 primarily due to the
net effect of:
•higher flow-through income taxes, depreciation and financial charges, as well as higher rate-base earnings on the
NGTL System due to continued system expansions
•higher flow-through income taxes, financial charges and depreciation, as well as higher rate-base earnings on Foothills primarily due to the NGTL System/Foothills West Path Delivery Program completed in 2023
•earnings from Coastal GasLink in 2023 related to the recognition of a $200 million incentive payment upon meeting certain milestones.
Depreciation and amortization
Depreciation and amortization was $141 million higher in 2025 compared to 2024, primarily reflecting higher depreciation rates on the NGTL System under the 2025-2029 NGTL Settlement. Depreciation and amortization was $57 million higher in 2024 compared to 2023, mainly due to incremental depreciation on the NGTL System from expansion facilities that were placed in service.
OUTLOOK
Comparable EBITDA and comparable earnings
Net income for Canadian rate-regulated pipelines is affected by changes in investment base, ROE and deemed capital structure, as well as by the terms of toll settlements approved by the CER. Under the current regulatory model, return on rate base from Canadian rate-regulated natural gas pipelines is not materially affected by short-term fluctuations in the commodity price of natural gas, changes in throughput volumes or changes in contracted capacity levels.
Canadian Natural Gas Pipelines comparable EBITDA in 2026 is expected to be higher than 2025 mainly due to higher contributions from the NGTL System. Due to the flow-through treatment of certain costs on our Canadian rate-regulated pipelines, changes in these costs can impact our comparable EBITDA despite having no significant effect on comparable earnings. We expect our comparable earnings in 2026 for the NGTL System and the Canadian Mainline to be consistent with 2025.
Capital expenditures
We incurred $1.3 billion of capital expenditures in 2025 in our Canadian Natural Gas Pipelines business on growth projects and maintenance capital expenditures. We expect to incur approximately $1.5 billion in 2026, primarily on NGTL System expansion projects and maintenance capital expenditures, all of which are immediately reflected in investment base and related earnings.
TC Energy Management's discussion and analysis 2025 | 45
U.S. Natural Gas Pipelines
UNDERSTANDING OUR U.S. NATURAL GAS PIPELINES SEGMENT
The U.S. interstate natural gas pipeline business is subject to regulation by various federal, state and local governmental agencies. FERC, however, has comprehensive jurisdiction over our U.S. interstate natural gas business. FERC approves maximum transportation rates that are cost-based and are designed to recover the pipeline's investment, operating expenses and a reasonable return for our investors. In the U.S., we have the ability to contract for negotiated or discounted rates with shippers.
FERC does not require U.S. interstate pipelines to calculate rates annually, nor do they generally allow for the collection or refund of the variance between actual and expected revenues and costs into future years. This difference in U.S. regulation from the Canadian regulatory environment puts our U.S. pipelines at risk for the difference in expected and actual costs and revenues between rate cases. If revenues no longer provide a reasonable opportunity to recover our costs, we can file with FERC for a new determination of rates, subject to any moratorium in effect. Similarly, FERC or our shippers may institute proceedings to lower rates if they consider the return on capital invested to be unjust or unreasonable.
Similar to Canada, we can also establish settlement arrangements with our U.S. shippers that are ultimately subject to approval by FERC. Rate case moratoriums for a period of time, before either we or the shippers can file for a rate review, are common for a settlement in that they provide some certainty for shippers in terms of rates, eliminate the costs associated with frequent rate proceedings for all parties and can provide an incentive for pipelines to lower costs.
PHMSA Pipeline Safety Regulations
Most of our U.S. natural gas pipeline systems are subject to federal pipeline safety statutes and regulations enacted and administered by PHMSA. PHMSA will continue to produce new rules affecting numerous aspects of operation and maintenance of our pipeline system. PHMSA’s priorities are generally dictated by legislation which is influenced by numerous stakeholders and informed by learnings from recent industry incidents and stakeholder priorities. When PHMSA implements new rules, TC Energy seeks recovery of additional expenditures driven by such rules in future rate cases and modernization settlements.
SIGNIFICANT EVENTS
Columbia Gas Section 4 Rate Case
Columbia Gas reached a settlement with its customers effective April 2025 and received FERC approval in October 2025. As part of the settlement, there is a moratorium on any further rate changes until March 31, 2028. Columbia Gas must file for new rates with an effective date no later than April 1, 2031. The settlement also included additional rate step ups in April 2026 and April 2027 to reflect anticipated modernization-related spend. In fourth quarter 2025, previously accrued rate refund liabilities, including interest, were refunded to customers.
ANR and Great Lakes Section 4 Rate Cases
In April 2025, ANR and Great Lakes each filed Section 4 Rate Cases with FERC requesting an increase to their respective maximum transportation rates effective November 1, 2025, subject to refund. We will pursue a collaborative process to find a mutually beneficial outcome with our customers through settlement.
Northwoods Project
In April 2025, we approved the Northwoods project, an expansion project on our ANR system designed to provide 0.4 Bcf/d of capacity to serve natural gas-fired electric generation demand in the U.S. Midwest, including data centres and overall economic growth. The project involves pipeline looping, compressor facility additions as well as other system updates, with an anticipated in-service date of late 2029 and an estimated project cost of approximately US$0.9 billion.
East Lateral XPress
The East Lateral XPress project, an expansion project on the Columbia Gulf system that connects supply to U.S. Gulf Coast LNG export markets, was placed in service in May 2025, with a total project cost of approximately US$0.3 billion.
Ventura XPress Project
The Ventura XPress project, a set of ANR projects designed to improve base system reliability and allow for additional long-term contracted transportation services to a point of delivery on the Northern Border pipeline at Ventura, Iowa, was placed in service in October 2025 with a total project cost of approximately US$0.2 billion.
46 | TC Energy Management's discussion and analysis 2025
TCO Connector Project
In October 2025, we approved the TCO Connector project on our Columbia Gas system. This project is designed to provide approximately 0.5 Bcf/d of capacity to serve new natural gas-fired power generation supporting forecasted electric generation growth, including expected data centre growth across our system. The project has an anticipated in-service date of 2030 and an estimated project cost of approximately US$0.3 billion.
VR and WR Projects
In November 2025, we placed the VR and WR projects into service. The VR project, provides incremental capacity from Greensville County, Virginia to delivery points in Norfolk, Virginia, with a total project cost of approximately US$0.5 billion. The WR project, provides mainline capacity to multiple points of delivery on our ANR System in Wisconsin with a total project cost of approximately US$0.7 billion.
TC Energy Management's discussion and analysis 2025 | 47
FINANCIAL RESULTS
The following is a reconciliation of comparable EBITDA and comparable EBIT (our non-GAAP measures) to segmented earnings (losses) (the most directly comparable GAAP measure). Refer to page 22 for more information on non-GAAP measures we use.
| | | | | | | | | | | | | | | | | | | | |
| year ended December 31 | | | | | | |
| (millions of US$, unless otherwise noted) | | 2025 | | 2024 | | 2023 |
| | | | | | |
Columbia Gas1 | | 1,803 | | | 1,600 | | | 1,530 | |
| ANR | | 651 | | | 642 | | | 650 | |
Columbia Gulf1 | | 235 | | | 235 | | | 208 | |
Great Lakes | | 191 | | | 204 | | | 183 | |
GTN | | 263 | | | 188 | | | 202 | |
PNGTS1,2 | | — | | | 66 | | | 104 | |
Other U.S. pipelines3 | | 363 | | | 359 | | | 371 | |
| | | | | | |
| | | | | | |
| Comparable EBITDA | | 3,506 | | | 3,294 | | | 3,248 | |
| Depreciation and amortization | | (743) | | | (697) | | | (692) | |
| Comparable EBIT | | 2,763 | | | 2,597 | | | 2,556 | |
| Foreign exchange impact | | 1,106 | | | 959 | | | 895 | |
Comparable EBIT (Cdn$) | | 3,869 | | | 3,556 | | | 3,451 | |
| Specific items: | | | | | | |
| Gain on sale of PNGTS | | — | | | 572 | | | — | |
| Gain on sale of non-core assets | | — | | | 38 | | | — | |
| Risk management activities | | 58 | | | (113) | | | 80 | |
Segmented earnings (losses) (Cdn$) | | 3,927 | | | 4,053 | | | 3,531 | |
1Includes non-controlling interest. Refer to the Corporate - Financial results section for additional information.
2The sale of PNGTS was completed in August 2024.
3Reflects comparable EBITDA from our ownership in our mineral rights business (CEVCO), North Baja, Gillis Access, Tuscarora, Bison, Crossroads and our share of equity income from Northern Border, Iroquois, Millennium and Hardy Storage, our U.S. natural gas marketing business, as well as general and administrative and business development costs related to our U.S. natural gas pipelines.
U.S. Natural Gas Pipelines segmented earnings in 2025 decreased by $126 million compared to 2024 and increased by $522 million in 2024 compared to 2023 and included the following specific items, which have been excluded from our calculation of comparable EBITDA and comparable EBIT:
•a pre-tax gain of $572 million related to the sale of PNGTS in August 2024
•a pre-tax gain on sale of a non-core asset of $38 million in second quarter 2024
•unrealized gains and losses from changes in the fair value of derivatives used in our U.S. natural gas marketing business.
A stronger U.S. dollar in 2025 and 2024 had a positive impact on the Canadian dollar equivalent segmented earnings from our U.S. dollar-denominated operations. Refer to the Foreign exchange section for additional information.
Earnings from our U.S. Natural Gas Pipelines operations are generally affected by contracted volume levels, volumes delivered and the rates charged, as well as by the cost of providing services. Columbia Gas and ANR results are also affected by the contracting and pricing of their natural gas storage capacity and incidental commodity sales. Natural gas pipeline and storage volumes and revenues are generally higher in the winter months because of the seasonal nature of the business.
48 | TC Energy Management's discussion and analysis 2025
Comparable EBITDA for U.S. Natural Gas Pipelines was US$212 million higher in 2025 than 2024 primarily due to the net effect of:
•a net increase in earnings from Columbia Gas as a result of higher transportation rates effective April 1, 2025, pursuant to the Columbia Gas Settlement. Refer to the U.S. Natural Gas Pipelines – Significant events section for additional information
•incremental earnings from projects placed in service, as well as increased earnings from additional contract sales on GTN
•increased earnings from our mineral rights business due to higher commodity prices
•decreased earnings as a result of the sale of our 61.7 per cent equity interest in PNGTS, which was completed in August 2024
•decreased equity earnings from Iroquois and Millennium
•decreased earnings due to higher operational costs, reflective of system utilization and projects placed in service across our footprint.
Comparable EBITDA for U.S. Natural Gas Pipelines was US$46 million higher in 2024 than 2023 primarily due to the net effect of:
•incremental earnings from growth and modernization projects placed in service, as well as increased earnings from additional contract sales on ANR and Great Lakes
•increased equity earnings from Northern Border
•decreased earnings due to higher operational costs, reflective of increased system utilization across our footprint
•decreased earnings as a result of the sale of our 61.7 per cent equity interest in PNGTS, which was completed in August 2024
•lower realized earnings related to our U.S. natural gas marketing business primarily due to lower margins
•reduced earnings from our mineral rights business due to lower commodity prices.
Depreciation and amortization
Depreciation and amortization was US$46 million higher in 2025 compared to 2024 and US$5 million higher in 2024 compared to 2023. The increase in depreciation is primarily due to new projects placed in service and depreciation rate changes as a result of the Columbia Gas Settlement, partially offset by the impact of the sale of PNGTS in 2024.
OUTLOOK
Comparable EBITDA
Our U.S. natural gas pipelines are largely backed by long-term take-or-pay contracts that are expected to deliver stable and consistent financial performance. Our ability to retain customers and recontract or sell capacity at favourable rates is influenced by prevailing market conditions and competitive factors, including alternatives available to end-use customers in the form of competing natural gas pipelines and supply sources, as well as broader conditions that impact demand from certain customers or market segments. Comparable EBITDA is also affected by operational and other costs, which can be impacted by safety, environmental and other regulatory decisions, as well as customer credit risk.
U.S. Natural Gas Pipelines comparable EBITDA in 2026 is expected to be higher than 2025 primarily due to full year in-service of the East Lateral XPress, Ventura XPress, VR and WR projects, as well as a full year of increased rates on Columbia Gas as a result of the Columbia Gas Settlement. Our pipeline systems continue to see historically strong demand for service and we anticipate that during 2026, our assets will maintain the high utilization levels experienced in 2025. These positive results are expected to be partially offset by higher operational costs, reflective of continued increases to system utilization across our footprint and an anticipated increase in property taxes from capital projects placed in service.
Capital expenditures
We incurred a total of US$2.4 billion of capital expenditures in 2025 on our U.S. natural gas pipelines and expect to incur approximately US$2.4 billion in 2026 primarily on our Columbia Gas and ANR expansion projects and Gillis Access expansion project, as well as Columbia Gas and ANR maintenance capital expenditures, the return on and recovery of which, is expected to be reflected in future tolls. We expect net capital expenditures in 2026 to be approximately US$2.0 billion after considering capital expenditures attributable to the non-controlling interests of entities we control.
TC Energy Management's discussion and analysis 2025 | 49
Mexico Natural Gas Pipelines
UNDERSTANDING OUR MEXICO NATURAL GAS PIPELINES SEGMENT
For over a decade, Mexico has been undergoing a significant transition from fuel oil and diesel as its primary energy sources for electric generation to using natural gas. As a result, new natural gas pipeline infrastructure has been and continues to be required to meet the growing demand for natural gas. The CFE, Mexico's state-owned electric utility, is the primary counterparty on all of our existing pipelines under long-term contracts, which are predominately denominated in U.S. dollars. These fixed-rate contracts are generally designed to recover the cost of service and provide a return on and of invested capital. As the pipeline developer and operator, we are generally at risk for operating and construction costs. Our Mexico pipelines also have regulatory approved tariffs, services and related rates for other potential users.
SIGNIFICANT EVENTS
TGNH Strategic Alliance with the CFE
The Southeast Gateway pipeline is in service and we commenced the collection of tolls beginning May 2025. In July 2025, the newly constituted CNE approved our regulated rates required to provide service to potential future interruptible service users on the Southeast Gateway pipeline other than the CFE.
In 2024, the CFE became an equity partner in TGNH with a 13.01 per cent equity interest. The CFE's equity in TGNH is expected to increase to a maximum of 15 per cent, subject to regulatory approvals, and will increase to approximately 35 per cent upon expiry of the contract in 2055.
50 | TC Energy Management's discussion and analysis 2025
FINANCIAL RESULTS
The following is a reconciliation of comparable EBITDA and comparable EBIT (our non-GAAP measures) to segmented earnings (losses) (the most directly comparable GAAP measure). Refer to page 22 for more information on non-GAAP measures we use.
| | | | | | | | | | | | | | | | | | | | |
| year ended December 31 | | | | | | |
| (millions of US$, unless otherwise noted) | | 2025 | | 2024 | | 2023 |
| | | | | | |
TGNH1,2 | | 625 | | | 231 | | | 232 | |
Sur de Texas3 | | 79 | | | 220 | | | 75 | |
| Topolobampo | | 154 | | | 156 | | | 157 | |
| Guadalajara | | 57 | | | 56 | | | 61 | |
| Mazatlán | | 66 | | | 67 | | | 71 | |
| Comparable EBITDA | | 981 | | | 730 | | | 596 | |
| Depreciation and amortization | | (69) | | | (67) | | | (66) | |
| Comparable EBIT | | 912 | | | 663 | | | 530 | |
| Foreign exchange impact | | 357 | | | 244 | | | 186 | |
Comparable EBIT (Cdn$) | | 1,269 | | | 907 | | | 716 | |
| Specific item: | | | | | | |
Expected credit loss provision on net investment in leases and certain contract assets in Mexico2 | | (83) | | | 22 | | | 80 | |
Segmented earnings (losses) (Cdn$) | | 1,186 | | | 929 | | | 796 | |
1Includes the operating sections of the Tamazunchale, Villa de Reyes, Tula and Southeast Gateway pipelines.
2Includes non-controlling interest. Refer to the Corporate - Financial results section for additional information.
3Represents equity income from our 60 per cent interest and fees earned from the construction and operation of the pipeline.
Mexico Natural Gas Pipelines segmented earnings in 2025 increased by $257 million compared to 2024 and increased by $133 million in 2024 compared to 2023 and included an expense of $83 million in 2025 (2024 – $22 million recovery; 2023 – $80 million recovery) on the expected credit loss provision related to the TGNH net investment in leases and certain contract assets in Mexico, which we have excluded from our calculation of comparable EBITDA and comparable EBIT. Refer to Note 27, Risk management and financial instruments, of our 2025 Consolidated financial statements for additional information.
A stronger U.S. dollar in 2025 and 2024 had a positive impact on the Canadian dollar equivalent segmented earnings from our U.S. dollar-denominated operations in Mexico. Refer to the Foreign exchange section for additional information.
Comparable EBITDA for Mexico Natural Gas Pipelines increased by US$251 million in 2025 compared to 2024 mainly due to the net effect of:
•higher earnings in TGNH due to the completion of the Southeast Gateway pipeline in second quarter 2025
•lower equity earnings from Sur de Texas primarily due to the foreign exchange impacts on the revaluation of peso‑denominated liabilities as a result of a stronger Mexican peso and higher income tax expense mainly related to the foreign exchange impacts of U.S. dollar-denominated liabilities.
Comparable EBITDA for Mexico Natural Gas Pipelines increased by US$134 million in 2024 compared to 2023 primarily due to:
•higher equity earnings in Sur de Texas primarily due to the foreign exchange impacts on the revaluation of peso-denominated liabilities as a result of a weaker Mexican peso and lower income tax expense mainly related to the foreign exchange impacts of U.S. dollar-denominated liabilities
•lower earnings from Guadalajara primarily due to lower fixed revenue in accordance with the transportation contract and higher operating costs.
Depreciation and amortization
Depreciation and amortization was generally consistent between 2025 and 2024 and between 2024 and 2023. Under sales-type lease accounting, our in-service TGNH pipeline assets are derecognized from Plant, property and equipment and recorded as a net investment in lease on our Consolidated balance sheet with no depreciation expense being recognized.
TC Energy Management's discussion and analysis 2025 | 51
Sur de Texas results
Sur de Texas results reflect equity income from our 60 per cent interest and fees earned from the construction and operation of the pipeline. We use foreign exchange derivatives to manage Sur de Texas' foreign exchange exposures, and the impact of these derivatives is recognized in Foreign exchange (gains) losses, net in the Consolidated statement of income. Refer to the Foreign exchange section for additional information.
The following table details our proportionate share of equity income and the foreign exchange impact on Sur de Texas equity earnings from changes in the value of the Mexican peso against the U.S. dollar:
| | | | | | | | | | | | | | | | | | | | |
| year ended December 31 | | | | | | |
| (millions of US$) | | 2025 | | 2024 | | 2023 |
| | | | | | |
| Equity income before foreign exchange impact | | 136 | | | 137 | | | 137 | |
| Foreign exchange impact included in equity earnings | | (57) | | | 83 | | | (62) | |
| Comparable EBITDA - Sur de Texas | | 79 | | | 220 | | | 75 | |
| | | | | | |
OUTLOOK
Comparable EBITDA
Mexico Natural Gas Pipelines comparable EBITDA reflects long-term, stable, principally U.S. dollar-denominated transportation contracts that are affected by the cost of providing service and includes our share of equity income from our 60 per cent equity interest in the Sur de Texas pipeline. Due to the long-term nature of the underlying transportation contracts, comparable EBITDA is generally consistent year-over-year except when new assets are placed in service. Comparable EBITDA for 2026 is expected to be higher than 2025 due to the Southeast Gateway project, which was completed in second quarter 2025.
Capital expenditures
We incurred US$0.2 billion of capital expenditures in 2025 primarily related to the construction of the Southeast Gateway pipeline and maintenance capital expenditures. We expect to incur approximately US$0.2 billion in 2026 to finalize construction of pipeline projects in Mexico.
52 | TC Energy Management's discussion and analysis 2025
NATURAL GAS PIPELINES – BUSINESS RISKS
The following are risks specific to our Natural Gas Pipelines business. Refer to page 94 for information about general risks related to TC Energy as a whole, including other operational, safety and financial risks, as well as our approach to risk management.
Production levels within supply basins
The NGTL System and our pipelines downstream depend largely on supply from the WCSB. Columbia Gas and its connecting pipelines largely depend on Appalachian supply. We continue to monitor any changes in our customers' natural gas production plans and how these may impact our existing assets and new project schedules. There is competition amongst pipelines to connect to major basins. An overall decrease in production and/or increased competition for supply could reduce throughput on our connected pipelines that, in turn, could negatively impact overall revenues generated. The WCSB and Appalachian basins are two of the most prolific and cost-competitive basins in North America and have considerable natural gas reserves. However, the amount actually produced depends on many variables including the price of natural gas and natural gas liquids, basin-on-basin competition, pipeline and gas-processing tolls, demand within the basin, changes in policy and regulations and the overall value of the reserves, including liquids content.
Market access
We compete for market share with other natural gas pipelines. New supply basins are being developed closer to markets we have historically served and may reduce the throughput and/or distance of haul on our existing pipelines and impact revenues. New markets, including those created by LNG export facilities developed to access global natural gas demand, can lead to increased revenues through higher utilization of existing facilities and/or demand for new infrastructure. The long-term competitiveness of our pipeline systems and the avoidance of bypass pipelines will depend on our ability to adapt to changing flow patterns by offering competitive transportation services to the market. As part of our annual strategic planning process, we evaluate the resilience of our asset portfolio over a range of potential energy supply and demand outcomes.
Competition for greenfield pipeline expansion
We face competition from other pipeline companies seeking to invest in greenfield natural gas pipeline development opportunities. This competition could result in fewer available projects that meet our investment hurdles or projects that proceed with lower overall financial returns. While renewable deployments are expected to garner an increasing portion of future energy needs, including in the power generation sector, aggregate natural gas demand across all sectors, including LNG exports, is still projected to grow under the most aggressive renewable deployment forecasts. The reliability of natural gas is an important factor in the successful wide-scale deployment of renewables with more intermittent capabilities.
Demand for pipeline capacity
Demand for pipeline capacity ultimately drives the sale of pipeline transportation services and is impacted by supply and market competition, variations in economic activity, weather variability, natural gas pipeline and storage competition, energy conservation, as well as demand for and prices of alternative sources of energy. Renewal of expiring contracts and the opportunity to charge a competitive toll depends on the overall demand for transportation service. A decrease in the level of demand for our pipeline transportation services could adversely impact revenues, although overall utilization of our pipeline capacity continues to grow and warrant further investment and expansion.
Commodity prices
The cyclical supply and demand nature of commodities and related pricing can have a secondary impact on our business where our shippers may choose to accelerate or delay certain projects. This can impact the timing of demand for transportation services and/or new natural gas pipeline infrastructure. Disruptions in the energy supply chain can result in price volatility and a decline in natural gas prices that could impact our shippers' financial condition and their ability to meet their transportation service cost obligations.
TC Energy Management's discussion and analysis 2025 | 53
Regulatory risk
Decisions and evolving policies by regulators and other government authorities, including changes in regulation, can impact the approval, timing, construction, operation and financial performance of our natural gas pipelines. There is a risk that decisions are delayed or are not favourable and could therefore adversely impact construction costs, in-service dates, anticipated revenues and the opportunity to further invest in our systems. There is also risk of a regulator disallowing recovery of a portion of our costs, now or at some point in the future.
The regulatory approval process for larger infrastructure projects, including the time it takes to receive a decision, could be delayed or lead to an unfavourable decision due to evolving public opinion and government policy related to natural gas pipeline infrastructure development. If regulatory decisions are subsequently challenged in courts, this could result in further impacts to project costs and schedule delays.
Increased scrutiny of construction and operations processes by the regulator or other enforcing agencies has the potential to delay construction, increase operating costs or require additional capital investment. There is a risk of an adverse impact to income if these costs are not fully recoverable and/or reduce the competitiveness of tolls charged to customers.
We continuously manage these risks by monitoring legislative and regulatory developments and decisions to determine the possible impact on our natural gas pipelines business and developing rate, facility and tariff applications that account for and mitigate these risks where possible.
Governmental risk
Shifts in government policy or changes in government can impact our business. More complex regulatory processes, broader consultation requirements, more restrictive emissions and/or carbon pricing policies and changes to environmental regulations can impact our operations and opportunities for continued growth. We are committed to working with all levels of government to ensure our business benefits and risks are understood and mitigation strategies are implemented.
Construction and operations
Constructing and operating our pipelines to ensure transportation services are provided safely and reliably is essential to the success of our business. Interruptions in our pipeline operations impacting throughput capacity may result in reduced revenues and can affect corporate reputation, as well as customer and public confidence in our operations. We manage this by investing in a highly skilled workforce, hiring third-party inspectors during construction, operating prudently, monitoring our pipeline systems continuously, using risk-based preventive maintenance programs and making effective capital investments. We use pipeline inspection equipment to regularly check the integrity of our pipelines and repair or replace sections when necessary. We also calibrate meters regularly to ensure accuracy and employ robust reliability and integrity programs to maintain compression equipment and safe and reliable operations.
54 | TC Energy Management's discussion and analysis 2025
Power and Energy Solutions
The Power and Energy Solutions business consists of power generation, non-regulated natural gas storage assets, as well as emerging technologies that can provide lower-carbon solutions for our customers and industry.
Our Power and Energy Solutions business includes approximately 4,650 MW of generation powered by nuclear, natural gas, wind and solar. These generation assets are generally supported by long-term contracts. Our Canadian power infrastructure assets are located in Alberta, Ontario, Québec and New Brunswick while our U.S. power infrastructure assets are located in Texas. Additionally, we have approximately 400 MW of PPAs in Canada and approximately 350 MW of PPAs in the U.S. from wind and solar facilities.
We also own and operate approximately 118 Bcf of non-regulated natural gas storage capacity in Alberta.
Strategy
Our strategy is to maximize the value of our existing portfolio through maintaining safety and operational excellence while enhancing the life cycle and reliability of our assets and expanding profit margins through cost efficiency and revenue enhancement. Our business is anchored by nuclear generation and designed for scalable, low-risk growth that adapts to evolving energy needs. By leveraging our expertise across natural gas and power, we capture additional value through commercial marketing and system optimization, while maximizing availability of our cogeneration fleet. In the long term, we believe there will be a growing need for a reliable supply of resources as the energy mix evolves. We are positioning ourselves to play an important role in decarbonizing energy sources and will continue to build expertise and capabilities in emerging technologies and markets that offer commercial frameworks consistent with TC Energy’s value proposition of low risk, solid growth and repeatable performance.
Recent highlights
•Bruce Power completed planned outages on Units 2 and 5 in 2025
•Bruce Power received verification of the Unit 5 MCR final cost and schedule estimate from the IESO on April 2, 2025.
TC Energy Management's discussion and analysis 2025 | 55
UNDERSTANDING OUR POWER AND ENERGY SOLUTIONS BUSINESS
Canadian Power
Canadian Power Generation & Marketing
We own and operate approximately 1,200 MW of power supply in Canada, excluding our investment in Bruce Power. In Alberta we own five facilities: four natural gas-fired cogeneration and one solar. We exercise a disciplined operating strategy to maximize revenues. Our marketing group sells uncommitted power while also buying and selling power and natural gas to maximize earnings. To reduce commodity price exposure associated with uncontracted power, we sell a portion of this output in forward sales markets when acceptable contract terms are available while the remainder is retained to be sold in the spot market or under short-term forward arrangements. The objective of this strategy is to maintain adequate power supply to fulfill our sales obligations if we have unexpected plant outages and enable us to capture opportunities to increase earnings in periods of high spot prices.
Bruce Power
Bruce Power is a nuclear power generation facility located near Tiverton, Ontario and is comprised of eight nuclear units with a combined capacity of approximately 6,580 MW. Bruce Power leases the facilities from OPG, has no spent fuel risk and will return the facilities to OPG for decommissioning at the end of the lease. We have a 48.3 per cent equity interest in Bruce Power.
Results from Bruce Power will fluctuate primarily due to units being offline for the MCR program and the frequency, scope and duration of planned and unplanned maintenance outages.
Through a long-term agreement with the IESO, Bruce Power is progressing a series of incremental life-extension investments to extend the operating life of the facility to 2064. This agreement represents an extension and material amendment to the earlier agreement that led to the refurbishment of Units 1 and 2 at the site. Under the amended agreement, which took economic effect in 2016, Bruce Power began investing in life extension activities for Units 3 through 8 to support the long-term refurbishment programs, known as the Asset Management program. Investment in the Asset Management program is designed to result in near-term life extensions of each of the six units up to the planned major refurbishment outages and beyond. The Asset Management program includes the one-time refurbishment or replacement of systems, structures or components that are not within the scope of the MCR program, which focuses on the actual replacement of the key, life-limiting reactor components. The MCR program is designed to add at least 35 years of operational life to each of the six units.
The Unit 6 MCR, the first of the six-unit MCR life extension program, was completed in third quarter 2023. The Unit 3 MCR and Unit 4 MCR, which are the second and third unit in the MCR program, commenced in first quarter 2023 and 2025, with expected completion dates in 2026 and 2028, respectively. The Unit 5 MCR final cost and schedule estimate was verified by the IESO on April 2, 2025. The Unit 5 MCR is expected to commence in fourth quarter 2026 with a return to service in early 2030. Investments in the remaining two units' MCR programs are expected to continue through 2033. Future MCR investments will be subject to discrete decisions for each unit with specified off-ramps available for Bruce Power and the IESO.
Along with the MCR life extension program, Bruce Power’s Project 2030 has a goal of achieving site peak output (capability) of 7,000 MW by 2033 in support of the province of Ontario's climate change targets and future clean energy needs. Project 2030 is focused on continued asset optimization, innovation and leveraging new technology to increase site capability. Project 2030 is being implemented in three stages with the first two stages and Stage 3a fully approved for execution. The program commenced in 2019 with a site capability of 6,430 MW and closed out 2025 at approximately 6,580 MW; a net gain of approximately 150 MW. Upon completion of Stage 1, 2 and 3a, the site is projected to reach 6,840 MW. All three stages are being implemented in parallel to the MCR program.
As part of the life extension and refurbishment agreement, Bruce Power receives a uniform contract price for all units which includes certain flow-through items such as fuel and lease expense recovery. The contract also provides for payment if the IESO requests a reduction in Bruce Power’s generation to balance the supply of and demand for, electricity and/or manage other operating conditions of the Ontario power grid. The amount of the reduction is considered deemed generation, for which Bruce Power is paid the contract price.
56 | TC Energy Management's discussion and analysis 2025
The contract price is subject to adjustments for the return of and on capital invested at Bruce Power under the Asset Management and MCR programs, along with various other pricing adjustments that allow for a better matching of revenues and costs over the long term. As part of the amended agreement, Bruce Power is also required to share operating cost efficiencies with the IESO for better than planned performance. These efficiencies are reviewed every three years and paid out on a monthly basis over the subsequent three-year period. No operating cost efficiencies for the 2025 to 2027 period have been provided for at December 31, 2025 and no operating cost efficiencies were realized for the 2019 to 2024 period.
Bruce Power is a global supplier of Cobalt-60, a medical isotope used in the sterilization of medical equipment and to treat certain types of cancer. Cobalt-60 is produced during Bruce Power’s generation of electricity, harvested during certain planned maintenance outages and provided for medical use in the treatment of brain tumours and breast cancer. In addition, Bruce Power harvests Lutetium-177, a medical isotope used in the treatment of prostate cancer and neuroendocrine tumours. Lutetium-177 is generated and harvested while Bruce Power is generating electricity. Isotope production includes a partnership with the Saugeen Ojibway Nation, on whose traditional territory the Bruce Power facilities are located. Furthermore, Bruce Power has committed to building a hot cell facility in Bruce County, for the purposes of streamlining the supply chain for the short-lived Lutetium-177 to ensure it reaches cancer patients around the world in a timely fashion.
Power Purchase Agreements
We have approximately 400 MW of wind and solar generation PPAs and associated environmental attributes in Alberta. These PPAs allow us to generate incremental earnings by offering renewable power products to our customers.
U.S. Power
Power Generation & Marketing
We own approximately 300 MW of wind generation located in Texas which operate in the Electric Reliability Council of Texas (ERCOT) and Southwest Power Pool (SPP) markets. A portion of this power generation is sold under a long-term, fixed price contract.
Our U.S. Power and emissions commercial trading and marketing business optimizes the value of our assets and leverages physical and financial products in the power and environmental markets with a focus on risk management.
Power Purchase Agreements
We have approximately 350 MW of wind generation PPAs and associated environmental attributes in the U.S. These PPAs allow us to generate incremental earnings by offering renewable power products to our customers.
Other Energy Solutions
Canadian Natural Gas Storage
Our Canadian natural gas storage business helps balance seasonal and short-term supply and demand while also adding flexibility to the delivery of natural gas to markets in Alberta and the rest of North America. Market volatility creates arbitrage opportunities and our natural gas storage facilities also give us and our customers the ability to capture value from short-term price movements. The natural gas storage business is affected by changes in seasonal natural gas price spreads which are generally determined by the differential in natural gas prices between the traditional summer injection and winter withdrawal seasons. In addition, the business may be affected by pipeline restrictions in Alberta which limit the ability to capture price differentials.
Our natural gas storage business contracts with third parties, typically participants in the Alberta and interconnected gas markets, for a fixed fee to provide natural gas storage services on a short, medium and/or long-term basis.
We also enter proprietary natural gas storage transactions which include a forward purchase of our own natural gas to be injected into storage and a simultaneous forward sale of natural gas for withdrawal at a later period, typically during the winter withdrawal season. By matching purchase and sales volumes on a back-to-back basis, we lock in future positive margins, effectively eliminating our exposure to changes in natural gas prices for these transactions.
TC Energy Management's discussion and analysis 2025 | 57
58 | TC Energy Management's discussion and analysis 2025
Power and Energy Solutions assets currently have a combined power generation capacity, net to TC Energy, of 4,652 MW. We operate each facility except for Bruce Power.
| | | | | | | | | | | | | | | | | | | | | | | | | | | | | | | | |
| | | Generating
capacity (MW) | | Type of fuel | | Description | | Ownership |
| | |
| Power assets | | |
| | | | | | | | | | |
| 1 | | | Bruce Power1 | | 3,180 | | nuclear | | Eight operating reactors in Tiverton, Ontario. Bruce Power leases the nuclear facilities from OPG. | | 48.3 | % |
| | | | | | | | | | |
| 2 | | | Bécancour | | 550 | | | natural gas | | Cogeneration plant in Trois-Rivières, Québec. Power generation has been suspended since 2008 although we continue to receive PPA capacity payments while generation is suspended. | | 100 | % |
| | | | | | | | | | |
| 3 | | | Mackay River | | 207 | | | natural gas | | Cogeneration plant in Fort McMurray, Alberta. | | 100 | % |
| | | | | | | | | | |
| 4 | | | Fluvanna2 | | 155 | | | wind | | Wind farm located near Scurry County, Texas. | | 100 | % |
| | | | | | | | | | |
| 5 | | | Blue Cloud2 | | 148 | | | wind | | Wind farm located near Bailey County, Texas. | | 100 | % |
| | | | | | | | | | |
| 6 | | | Bear Creek | | 100 | | | natural gas | | Cogeneration plant in Grande Prairie, Alberta. | | 100 | % |
| | | | | | | | | | |
| 7 | | | Carseland | | 95 | | | natural gas | | Cogeneration plant in Carseland, Alberta. | | 100 | % |
| | | | | | | | | | |
| 8 | | | Grandview | | 90 | | | natural gas | | Cogeneration plant in Saint John, New Brunswick. | | 100 | % |
| | | | | | | | | | |
| 9 | | | Saddlebrook Solar | | 81 | | | solar | | Hybrid solar generation facility near Aldersyde, Alberta. | | 100 | % |
| | | | | | | | | | |
| 10 | | | Redwater | | 46 | | | natural gas | | Cogeneration plant in Redwater, Alberta. | | 100 | % |
| | | | | | | | | | |
| Canadian non-regulated natural gas storage | | |
| | | | | | | | | | |
| 11 | | | Crossfield | | 68 Bcf | | | | Underground facility connected to the NGTL System near Crossfield, Alberta. | | 100 | % |
| | | | | | | | | | |
| 12 | | | Edson | | 50 Bcf | | | | Underground facility connected to the NGTL System near Edson, Alberta. | | 100 | % |
| | | | | | | | | | |
| Under construction | |
| | | | | | | | | | |
| Other energy solutions | | |
| | | | | | | | | | |
| 13 | | | Lynchburg | | | | RNG | | RNG production facility in Lynchburg, Tennessee. | | 30 | % |
1Our share of power generation capacity.
2TC Energy owns 100 per cent of the Class B Membership Interests and has a tax equity investor that owns 100 per cent of the Class A Membership Interests, to which a percentage of earnings, tax attributes and cash flows are allocated under the provisions of each tax equity agreement.
TC Energy Management's discussion and analysis 2025 | 59
SIGNIFICANT EVENTS
Bruce Power Life Extension
Bruce Power received verification of the Unit 5 MCR final cost and schedule estimate from the IESO on April 2, 2025. The Unit 5 MCR is expected to commence in fourth quarter 2026 with a return to service in early 2030.
60 | TC Energy Management's discussion and analysis 2025
FINANCIAL RESULTS
The following is a reconciliation of comparable EBITDA and comparable EBIT (our non-GAAP measures) to segmented earnings (losses) (the most directly comparable GAAP measure). Refer to page 22 for more information on non-GAAP measures we use.
| | | | | | | | | | | | | | | | | | | | |
| year ended December 31 | | | | | | |
| (millions of $) | | 2025 | | 2024 | | 2023 |
| | | | | | |
Bruce Power1 | | 733 | | | 890 | | | 680 | |
Canadian Power | | 181 | | | 273 | | | 334 | |
Natural Gas Storage and other2 | | 94 | | | 51 | | | 6 | |
| Comparable EBITDA | | 1,008 | | | 1,214 | | | 1,020 | |
| Depreciation and amortization | | (113) | | | (101) | | | (92) | |
| Comparable EBIT | | 895 | | | 1,113 | | | 928 | |
| Specific items: | | | | | | |
| Power and Energy Solutions impairment charges | | (110) | | | (36) | | | — | |
| Bruce Power unrealized fair value adjustments | | 30 | | | 8 | | | 7 | |
| Risk management activities | | (42) | | | 17 | | | 69 | |
| Segmented earnings (losses) | | 773 | | | 1,102 | | | 1,004 | |
1Includes our share of equity income from Bruce Power.
2Includes non-controlling interest in the Texas Wind Farms, which comprises Class A Membership Interests. Refer to the Corporate - Financial results section for additional information.
Power and Energy Solutions segmented earnings decreased by $329 million in 2025 compared to 2024 and increased by
$98 million in 2024 compared to 2023 and included the following specific items, which have been excluded from our calculation of comparable EBITDA and comparable EBIT:
•a pre-tax impairment charge in 2025 of $110 million (2024 – $36 million) for certain Power and Energy Solutions projects following our decision to discontinue development along with updated forecast assumptions as we refocus our Power and Energy Solutions strategy
•our proportionate share of Bruce Power's unrealized gains and losses on funds invested for post-retirement benefits and risk management activities
•unrealized gains and losses from changes in the fair value of derivatives used to reduce commodity exposures.
Comparable EBITDA for Power and Energy Solutions decreased by $206 million in 2025 compared to 2024 primarily due to the net effect of:
•lower Bruce Power contributions from reduced generation, mainly attributable to the Unit 4 MCR and higher operating costs, partially offset by a higher contract price. Refer to the Bruce Power section for additional information
•decreased Canadian Power results primarily from lower realized power prices
•increased Natural Gas Storage and other contributions reflecting lower business development costs, partially offset by decreased realized Alberta natural gas storage spreads in first quarter 2025 and reduced contributions from our U.S. marketing business.
Comparable EBITDA for Power and Energy Solutions increased by $194 million in 2024 compared to 2023 primarily due to the net effect of:
•higher contributions from Bruce Power primarily due to higher generation resulting from fewer outage days in 2024 and a higher contract price, partially offset by increased operating expenses and higher depreciation expense. Additional financial and operating information on Bruce Power is provided below
•increased Natural Gas Storage and other results primarily due to higher realized Alberta natural gas storage spreads and higher contributions from our U.S. marketing business, partially offset by increased business development costs in 2024
•decreased Canadian Power financial results primarily from lower realized power prices, partially offset by lower natural gas fuel costs.
TC Energy Management's discussion and analysis 2025 | 61
Depreciation and amortization
Depreciation and amortization increased by $12 million in 2025 compared to 2024 following the in-service of maintenance projects and increased by $9 million in 2024 compared to 2023 primarily due to the acquisition of the Texas Wind Farms in the first half of 2023.
Bruce Power results
Bruce Power results reflect our proportionate share. Comparable EBITDA and comparable EBIT are non-GAAP measures. Refer to page 22 for more information on non-GAAP measures we use. The following is our proportionate share of the components of comparable EBITDA and comparable EBIT.
| | | | | | | | | | | | | | | | | | | | |
| year ended December 31 | | | | | | |
| (millions of $, unless otherwise noted) | | 2025 | | 2024 | | 2023 |
| | | | | | |
Items included in comparable EBITDA and comparable EBIT are comprised of: | | | | | | |
Revenues1 | | 2,112 | | | 2,242 | | | 1,941 | |
| Operating expenses | | (1,000) | | | (984) | | | (917) | |
| Depreciation and other | | (379) | | | (368) | | | (344) | |
Comparable EBITDA and comparable EBIT2 | | 733 | | | 890 | | | 680 | |
| | | | | | |
| Bruce Power – other information | | | | | | |
Plant availability3,4 | | 91 | % | | 92 | % | | 92 | % |
Planned outage days4 | | 152 | | | 160 | | | 106 | |
| Unplanned outage days | | 44 | | | 32 | | | 62 | |
Sales volumes (GWh)5 | | 19,126 | | | 22,209 | | | 20,447 | |
Realized power price per MWh6 | | $109 | | | $100 | | | $94 | |
1Net of amounts recorded to reflect operating cost efficiencies shared with the IESO, if applicable.
2Represents our 48.3 per cent ownership interest and internal costs supporting our investment in Bruce Power. Excludes unrealized gains and losses on funds invested for post-retirement benefits and risk management activities.
3The percentage of time the plant was available to generate power, regardless of whether it was running.
4Excludes MCR outage days.
5Sales volumes include deemed generation, if applicable.
6Calculation based on actual and deemed generation. Realized power price per MWh includes realized gains and losses from contracting activities and cost flow-through items. Excludes unrealized gains and losses on contracting activities and non-electricity revenues.
Planned maintenance in 2025 was completed on Unit 5 in first quarter and on Unit 2 in fourth quarter. Planned maintenance in 2024 was completed in second quarter on Units 5 to 8. A planned outage on Unit 4 was completed in second quarter 2023 and on Unit 8 in fourth quarter 2023.
On January 31, 2025, Unit 4 was removed from service to commence its MCR program, with a return to service expected in 2028.
62 | TC Energy Management's discussion and analysis 2025
OUTLOOK
Comparable EBITDA
Power and Energy Solutions comparable EBITDA in 2026 is expected to be higher than 2025 primarily due to increased Bruce Power equity income with the expected return to service of Unit 3 in early third quarter 2026 following its MCR outage, a higher contract price, and a reduction in non-MCR planned outage days. These positive factors are expected to be partially offset by the commencement of the Unit 5 MCR outage in fourth quarter 2026. Contributions from Canadian Power are expected to be lower due to decreased generation and higher natural gas prices, partially offset by increased Alberta power prices. Natural Gas Storage and other earnings are expected to be consistent with 2025.
Planned maintenance at Bruce Power in 2026 is scheduled on Unit 8 in the first quarter and on Unit 1 in the third quarter. Excluding the MCR programs for Units 3, 4, and 5, average plant availability for 2026 is expected to be in the low-90 per cent range.
Capital expenditures
We incurred $0.9 billion of capital expenditures in 2025, primarily for our share of Bruce Power's Unit 3 and 4 MCR and Asset Management programs, along with maintenance capital projects across the segment. For 2026, we expect a similar level of capital investment, approximately $1.0 billion, mainly allocated to our share of Bruce Power's Unit 4 and Unit 5 MCR and Asset Management programs.
TC Energy Management's discussion and analysis 2025 | 63
BUSINESS RISKS
The following are risks specific to our Power and Energy Solutions business. Refer to page 94 for information about general risks related to TC Energy as a whole, including other operational, safety and financial risks, as well as our approach to risk management.
Fluctuating power and natural gas market prices
Much of the physical power generation and fuel used in our power operations is currently exposed to commodity price volatility. These exposures are partially mitigated through long-term contracts and hedging activities including selling and purchasing power and natural gas in forward markets. As contracts expire, new contracts are entered into at prevailing market prices.
Our two eastern Canadian natural gas-fired assets are fully contracted and not materially impacted by fluctuating spot power and natural gas prices. As the contracts on these assets expire it is uncertain if we will be able to re-contract on similar terms and may face future commodity exposure.
Our natural gas storage business is subject to fluctuating seasonal natural gas price spreads which are generally determined by the differential in natural gas prices between the traditional summer injection and winter withdrawal seasons. In addition, the business may be affected by pipeline restrictions in Alberta which limit the ability to capture price differentials.
Plant availability
Operating our plants to ensure services are provided safely and reliably as well as optimizing and maintaining their availability are essential to the continued success of our Power and Energy Solutions business. Unexpected outages or extended planned outages at our power plants can increase maintenance costs as well as lower plant output, revenues and margins. We may also have to buy power or natural gas on the spot market to meet our delivery obligations. We manage this risk by investing in a highly skilled workforce, operating prudently, running comprehensive risk-based preventive maintenance programs and making effective capital investments.
Regulatory
We operate in Canada and the U.S. in both regulated and deregulated power markets. These markets are subject to various federal, provincial and state regulations. As power markets evolve, there is the potential for regulatory bodies to implement new rules that could negatively affect us as a generator and marketer of electricity. These may be in the form of market rule or market design changes, changes in the interpretation and application of market rules by regulators, price caps, emission controls, emissions costs, cost allocations to generators and out-of-market actions taken by others to build excess generation, all of which may negatively affect the price of power. In addition, our development projects rely on an orderly permitting process and any disruption to that process can have negative effects on project schedules and costs. We are an active participant in formal and informal regulatory proceedings and take legal action where required.
Compliance
Market rules, regulations and operating standards apply to our power business based on the jurisdictions in which they operate. Our trading and marketing activities may be subject to fair competition and market conduct requirements as well as specific rules that apply to physical and financial transactions in deregulated markets. Similarly, our generators may be subject to specific operating and technical standards relating to maintenance activities, generator availability and delivery of power and power-related products. While significant efforts are made to ensure we comply with all applicable statutory requirements, situations including unforeseen operational challenges, lack of rule clarity and the ambiguous and unpredictable application of requirements by regulators and market monitors occasionally arise and create compliance risk. Deemed contravention of these requirements may result in mandatory mitigation activities, monetary penalties, imposition of operational limitations, or
even prosecution.
Weather
Significant changes in temperature and weather, including the potential impacts of climate change, have many effects on our business, ranging from the impact on demand, availability and commodity prices, to efficiency and output capability. Extreme temperature and weather can affect market demand for power and natural gas and can lead to significant price volatility, as well as restrict the availability of natural gas and power if demand is higher than supply. Fluctuations in seasonal weather patterns or temperature can affect the efficiency and production of our natural gas-fired power plants.
64 | TC Energy Management's discussion and analysis 2025
Competition
We face various competitive forces that impact our existing assets and prospects for growth. For instance, our existing power plants will compete over time with new power capacity. New supply could come in several forms including supply that employs more efficient power generation technologies or additional supply from regional power transmission interconnections. We also face competition from other power companies in Canada and the U.S., as well as in the development of greenfield power plants. Traditional and non-traditional participants are entering the growing lower-carbon economy in North America and, as a result, we face competition in building lower-carbon energy solutions.
Execution and capital costs
We make substantial capital commitments developing power generation infrastructure based on the assumption that these assets will deliver an attractive return on investment. While we carefully consider the scope and expected costs of our capital projects, we are exposed to execution and capital cost overrun risk which may impact our return on these projects. We mitigate this risk by implementing comprehensive project governance and oversight processes and through the structuring of engineering, procurement and construction contracts with reputable counterparties.
TC Energy Management's discussion and analysis 2025 | 65
Corporate
SIGNIFICANT EVENTS
2016 Columbia Pipeline Acquisition Lawsuit
In 2018, former shareholders of Columbia Pipeline Group Inc. (CPG) commenced a class action lawsuit related to the acquisition of CPG by TC Energy in 2016. In 2023, the Delaware Chancery Court (the Court) found that the former CPG executives breached their fiduciary duties, that the former CPG Board breached its duty of care in overseeing the sale process and that TC Energy aided and abetted those breaches. TC Energy’s allocated share of damages was an estimated US$350 million, plus post-judgment interest. TC Energy appealed the decision to the Delaware Supreme Court and on June 17, 2025, the Supreme Court issued its decision reversing the Court’s finding of liability against TC Energy. On July 10, 2025, the Court granted the final order vacating its prior judgment and dismissing plaintiffs’ claims against TC Energy. As a result, this matter is now concluded in TC Energy’s favour with no liability. There is no further right of appeal.
66 | TC Energy Management's discussion and analysis 2025
FINANCIAL RESULTS
The following is a reconciliation of comparable EBITDA and comparable EBIT (our non-GAAP measures) to segmented earnings (losses) (the most directly comparable GAAP measure). Refer to page 22 for more information on non-GAAP measures we use.
| | | | | | | | | | | | | | | | | | | | |
| year ended December 31 | | | | | | |
| (millions of $) | | 2025 | | 2024 | | 2023 |
| | | | | | |
| Comparable EBITDA | | (14) | | | (63) | | | (73) | |
| Depreciation and amortization | | — | | | (5) | | | (6) | |
| Comparable EBIT | | (14) | | | (68) | | | (79) | |
| Specific items: | | | | | | |
| Third-party settlement | | — | | | (34) | | | — | |
| | | | | | |
| Focus Project costs | | — | | | (24) | | | (65) | |
| NGTL System ownership transfer costs | | — | | | (10) | | | — | |
| Segmented earnings (losses) | | (14) | | | (136) | | | (144) | |
In 2025, Corporate segmented losses were $14 million compared to $136 million and $144 million in 2024 and 2023, respectively, and included the following specific items which have been excluded from our calculation of comparable EBITDA and comparable EBIT:
•a pre-tax expense of $34 million (US$25 million) in 2024 related to a non-recurring third-party settlement
•a pre-tax charge of $24 million recorded in 2024 (2023 – $65 million) related to Focus Project costs
•a pre-tax charge of $10 million in 2024 related to the NGTL System ownership transfer.
Comparable EBITDA for Corporate included shared costs in 2024 and 2023 related to TC Energy's corporate services and governance functions that were not allocated to discontinued operations in accordance with U.S. GAAP.
Depreciation and amortization
Depreciation and amortization for 2024 and 2023 included depreciation related to TC Energy's corporate services and governance functions that were not allocated to discontinued operations in accordance with U.S. GAAP.
OTHER INCOME STATEMENT ITEMS
Interest expense
| | | | | | | | | | | | | | | | | |
| year ended December 31 | | | | | |
| (millions of $) | 2025 | | 2024 | | 2023 |
| | | | | |
| Interest expense on long-term debt and junior subordinated notes | | | | | |
| Canadian dollar-denominated | (816) | | | (856) | | | (895) | |
| U.S. dollar-denominated | (1,716) | | | (1,855) | | | (1,692) | |
| Foreign exchange impact | (683) | | | (685) | | | (592) | |
| | (3,215) | | | (3,396) | | | (3,179) | |
| Other interest and amortization expense | (204) | | | (147) | | | (261) | |
| Capitalized interest | 10 | | | 191 | | | 187 | |
Interest expense allocated to discontinued operations | — | | | 176 | | | 287 | |
| Interest expense included in comparable earnings | (3,409) | | | (3,176) | | | (2,966) | |
Specific items: | | | | | |
| Net gain on debt extinguishment | — | | | 228 | | | — | |
Risk management activities | 2 | | | (71) | | | — | |
| | | | | |
| | | | | |
| Interest expense | (3,407) | | | (3,019) | | | (2,966) | |
TC Energy Management's discussion and analysis 2025 | 67
Interest expense increased by $388 million in 2025 compared to 2024 and increased by $53 million in 2024 compared to 2023. The following specific items have been removed from our calculation of interest expense included in comparable earnings:
•pre-tax net gain on debt extinguishment of $228 million was recorded related to the purchase and cancellation of certain senior unsecured notes and medium term notes and the retirement of outstanding callable notes in October 2024
•unrealized gains and losses on derivatives used to manage our interest rate risk. Refer to the Other information - Financial risks and financial instruments sections for additional information.
Interest expense included in comparable earnings in 2025 increased by $233 million compared to 2024 primarily due to the net effect of:
•lower capitalized interest due to the declared commercial in-service of the Coastal GasLink pipeline in fourth quarter 2024
•no interest expense allocated to discontinued operations in 2025
•long-term debt issuances and maturities, including lower interest expense resulting from TCPL’s cash tender offers completed in fourth quarter 2024
•increased levels of short-term borrowing.
Interest expense included in comparable earnings in 2024 increased by $210 million compared to 2023 mainly due to the net effect of:
•long-term debt issuances and maturities
•interest expense allocated to discontinued operations for nine months in 2024 compared to a full year in 2023. Refer to the Discontinued operations section for additional information
•the foreign exchange impact from a weaker U.S. dollar on translation of U.S. dollar-denominated interest expense
•reduced levels of short-term borrowing.
Refer to the Financial condition section for additional information.
Allowance for funds used during construction
| | | | | | | | | | | | | | | | | | | | |
| year ended December 31 | | | | | | |
| (millions of $) | | 2025 | | 2024 | | 2023 |
| | | | | | |
| Canadian dollar-denominated | | 51 | | | 34 | | | 102 | |
| U.S. dollar-denominated | | 284 | | | 546 | | | 350 | |
| Foreign exchange impact | | 118 | | | 204 | | | 123 | |
| Allowance for funds used during construction | | 453 | | | 784 | | | 575 | |
AFUDC decreased by $331 million in 2025 compared to 2024. The increase in Canadian dollar-denominated AFUDC is primarily related to NGTL System expansion projects. The decrease in U.S. dollar-denominated AFUDC is primarily due to the completion of the Southeast Gateway pipeline in second quarter 2025 and the suspension of AFUDC on the south section of the Villa de Reyes pipeline in first quarter 2025 due to ongoing construction delays on the project pending the resolution of outstanding stakeholder issues, partially offset by capital expenditures on our U.S. natural gas pipeline projects.
AFUDC increased by $209 million in 2024 compared to 2023. The decrease in Canadian dollar-denominated AFUDC is primarily related to NGTL System expansion projects placed in service in 2024. The increase in U.S. dollar-denominated AFUDC is primarily due to capital expenditures on the Southeast Gateway pipeline project and U.S. natural gas pipeline projects in 2024, partially offset by the suspension of AFUDC on the assets under construction for the Tula pipeline project due to the delay of an FID and placing the lateral section of Villa de Reyes pipeline in service in August 2023.
68 | TC Energy Management's discussion and analysis 2025
Foreign exchange gains (losses), net
| | | | | | | | | | | | | | | | | | | | |
| year ended December 31 | | | | | | |
| (millions of $) | | 2025 | | 2024 | | 2023 |
| | | | | | |
| Foreign exchange gains (losses), net included in comparable earnings | | 96 | | | (85) | | | 118 | |
| Specific items: | | | | | | |
Foreign exchange gains (losses), net – intercompany loan1 | | (149) | | | 204 | | | (44) | |
| | | | | | |
| Risk management activities | | 210 | | | (266) | | | 246 | |
| Foreign exchange gains (losses), net | | 157 | | | (147) | | | 320 | |
1 Includes non-controlling interest. Refer to Net (income) loss attributable to non-controlling interests for additional information.
Foreign exchange gains (losses), net, in 2025 changed by $304 million compared to 2024 and changed by $467 million in 2024 compared to 2023. The following specific items have been removed from our calculation of Foreign exchange gains (losses), net included in comparable earnings:
•unrealized foreign exchange gains and losses on the peso-denominated intercompany loan between TCPL and TGNH beginning in second quarter 2023
•unrealized gains and losses from changes in the fair value of derivatives used to manage our foreign exchange risk. Refer to the Other information – Financial risks and Financial instruments sections for additional information.
Foreign exchange gains (losses), net included in comparable earnings in 2025 changed by $181 million compared to 2024. The change was primarily due to the net effect of:
•risk management activities used to manage our foreign exchange exposure to net liabilities in Mexico and to U.S. dollar‑denominated income
•foreign exchange losses in 2025 compared to foreign exchange gains in 2024 on the revaluation of our peso-denominated net monetary liabilities to U.S. dollars
•a net realized gain in second quarter 2024 on the partial repayment of the peso-denominated intercompany loan between TCPL and TGNH.
Foreign exchange gains (losses), net included in comparable earnings in 2024 changed by $203 million compared to 2023. The change was primarily due to the net effect of:
•risk management activities used to manage our foreign exchange exposure to net liabilities in Mexico and to U.S. dollar‑denominated income
•foreign exchange gains in 2024 compared to foreign exchange losses in 2023 on the revaluation of our peso-denominated net monetary liabilities to U.S. dollars
•a net realized gain in second quarter 2024 on the partial repayment of the peso-denominated intercompany loan between TCPL and TGNH.
Interest income and other
| | | | | | | | | | | | | | | | | | | | |
| year ended December 31 | | | | | | |
| (millions of $) | | 2025 | | 2024 | | 2023 |
| | | | | | |
| Canadian dollar-denominated | | 49 | | | 87 | | | 62 | |
| U.S. dollar-denominated | | 112 | | | 172 | | | 156 | |
| Foreign exchange impact | | 44 | | | 65 | | | 54 | |
| Interest income and other | | 205 | | | 324 | | | 272 | |
Interest income and other decreased by $119 million in 2025 compared to 2024 primarily due to the net effect of:
•lower interest earned on Canadian and U.S. dollar-denominated short-term investments
•increased insurance-related provisions
•higher investment income and the change in fair value of other restricted investments.
Interest income and other increased by $52 million in 2024 compared to 2023 primarily due to the net effect of:
•higher interest earned on Canadian dollar‑denominated short-term investments
•decreased insurance-related provisions.
TC Energy Management's discussion and analysis 2025 | 69
Income tax (expense) recovery
| | | | | | | | | | | | | | | | | | | | |
| year ended December 31 | | | | | | |
| (millions of $) | | 2025 | | 2024 | | 2023 |
| | | | | | |
| Income tax (expense) recovery included in comparable earnings | | (1,112) | | | (772) | | | (890) | |
| Specific items: | | | | | | |
| Power and Energy Solutions impairment charges | | 25 | | | 9 | | | — | |
| Foreign exchange gains (losses), net – intercompany loan | | (13) | | | 10 | | | — | |
Expected credit loss provision on net investment in leases
and certain contract assets in Mexico | | 24 | | | (7) | | | (25) | |
| Gain on sale of PNGTS | | — | | | (116) | | | — | |
| Revaluation of deferred tax balances | | — | | | (96) | | | — | |
| Net gain on debt extinguishment | | — | | | (50) | | | — | |
| Gain on sale of non-core assets | | — | | | 15 | | | — | |
| Third-party settlement | | — | | | 8 | | | — | |
| Focus Project costs | | — | | | 6 | | | 17 | |
| NGTL System ownership transfer costs | | — | | | (32) | | | — | |
| Coastal GasLink impairment charge | | — | | | — | | | 157 | |
| Bruce Power unrealized fair value adjustments | | (7) | | | (2) | | | (2) | |
| Risk management activities | | (55) | | | 105 | | | (99) | |
| Income tax (expense) recovery | | (1,138) | | | (922) | | | (842) | |
Income tax expense in 2025 increased by $216 million compared to 2024 and increased by $80 million in 2024 compared to 2023.
In addition to the income tax impacts on other specific items referenced elsewhere in this MD&A, Income tax (expense) recovery also includes the following specific items, which have been removed from our calculation of Income tax (expense) recovery included in comparable earnings:
2024
•a deferred income tax expense of $96 million resulting from the revaluation of remaining deferred tax balances following the Spinoff Transaction.
2023
•a $157 million income tax recovery related to the impairment of our equity investment in Coastal GasLink LP.
Income tax expense included in comparable earnings in 2025 increased by $340 million compared to 2024 primarily due to Mexico foreign exchange exposure and higher flow-through income taxes.
Income tax expense included in comparable earnings in 2024 decreased by $118 million compared to 2023 primarily due to Mexico foreign exchange exposure and lower earnings subject to income tax, partially offset by lower foreign income tax rate differentials and higher flow-through income taxes.
Refer to the Foreign exchange section for additional information on our Mexico foreign exchange exposure.
70 | TC Energy Management's discussion and analysis 2025
Net (income) loss attributable to non-controlling interests
| | | | | | | | | | | | | | | | | | | | | | | |
| year ended December 31 | Non-Controlling Interests Ownership at December 31, 2025 | | 2025 | | 2024 | | 2023 |
(millions of $) |
|
| | | | | | | |
Columbia Gas and Columbia Gulf1 | 40 | % | | (631) | | | (571) | | | (143) | |
TGNH2 | 13.01 | % | | (50) | | | (48) | | | — | |
Texas Wind Farms3 | 100 | % | | 38 | | | 29 | | | 38 | |
PNGTS4 | nil | | — | | | (30) | | | (41) | |
| Net (income) loss attributable to non-controlling interests included in comparable earnings | | | (643) | | | (620) | | | (146) | |
Specific item: | | | | | | | |
| Foreign exchange (gains) losses, net – intercompany loan | | | 60 | | | (61) | | | — | |
| Expected credit loss provision on net investment in leases | | | 8 | | | — | | | — | |
| Net (income) loss attributable to non-controlling interests | | | (575) | | | (681) | | | (146) | |
1In October 2023, we completed the sale of a 40 per cent non-controlling equity interest in Columbia Gas and Columbia Gulf to Global Infrastructure Partners.
2In second quarter 2024, the CFE became a partner in TGNH with a 13.01 per cent equity interest in TGNH. Refer to the Mexico Natural Gas Pipelines – Significant events section for additional information.
3Tax equity investors own 100 per cent of the Class A Membership Interests, to which a percentage of earnings, tax attributes and cash flows are allocated. We own 100 per cent of the Class B Membership Interests.
4The sale of PNGTS was completed in August 2024.
Net income attributable to non-controlling interests decreased by $106 million in 2025 compared to 2024 and increased by $535 million in 2024 compared to 2023 and included the following specific items which have been excluded from our calculation of Net (income) loss attributable to non-controlling interests included in comparable earnings:
•the non-controlling interest portion of the unrealized foreign exchange gains and losses on the TGNH peso-denominated intercompany loan payable to TCPL
•the expected credit loss provision related to the TGNH net investment in leases.
Net income attributable to non-controlling interests included in comparable earnings increased by $23 million in 2025 compared to 2024. The increase is primarily due to higher net income recognized from the Columbia Gas and Columbia Gulf assets, the net impact of higher EBITDA and lower AFUDC in TGNH following the Southeast Gateway pipeline's completion in second quarter 2025, the full year impact of the 13.01 per cent TGNH non-controlling equity interest sale to the CFE, which was completed in second quarter 2024 and the overall impact of foreign exchange. This was partially offset by the divestiture of PNGTS in third quarter 2024.
Net income attributable to non-controlling interests included in comparable earnings increased by $474 million in 2024 compared to 2023 primarily due to the sale of a 40 per cent non-controlling equity interest in Columbia Gas and Columbia Gulf to Global Infrastructure Partners in fourth quarter 2023 and the 13.01 per cent non-controlling equity interest in TGNH to the CFE, which was completed in second quarter 2024.
Preferred share dividends
| | | | | | | | | | | | | | | | | | | | |
| year ended December 31 | | | | | | |
| (millions of $) | | 2025 | | 2024 | | 2023 |
| | | | | | |
| Preferred share dividends | | (119) | | | (104) | | | (93) | |
Preferred share dividends increased by $15 million in 2025 compared to 2024 and increased by $11 million in 2024 compared to 2023 primarily due to the redemption of preferred shares in 2025, dividend rate resets on and conversions of certain series of preferred shares in 2025 and 2024. Refer to Note 24, Preferred shares, of our 2025 Consolidated financial statements for additional information.
TC Energy Management's discussion and analysis 2025 | 71
Foreign exchange
Foreign exchange related to U.S. dollar-denominated operations
Certain of our businesses generate all or most of their earnings in U.S. dollars and since we report our financial results in Canadian dollars, changes in the value of the U.S. dollar against the Canadian dollar directly affect our comparable EBITDA and may also impact comparable earnings. As our U.S. dollar-denominated operations continue to grow, this exposure increases.
A portion of the U.S. dollar-denominated comparable EBITDA exposure is naturally offset by U.S. dollar-denominated amounts below comparable EBITDA within Depreciation and amortization, Interest expense and other income statement line items.
A portion of the remaining exposure is actively managed on a rolling forward basis up to three years using foreign exchange derivatives; however, the natural exposure beyond that period remains. The net impact of the U.S. dollar movements on comparable earnings during the year ended December 31, 2025, after considering natural offsets and economic hedges, was not significant.
The components of our financial results denominated in U.S. dollars are set out in the table below, including our U.S. Natural Gas Pipelines and Mexico Natural Gas Pipelines operations. Comparable EBITDA is a non-GAAP measure.
Pre-tax U.S. dollar-denominated income and expense items - from continuing operations
| | | | | | | | | | | | | | | | | | | | |
| year ended December 31 | | | | | | |
| (millions of US$) | | 2025 | | 2024 | | 2023 |
| | | | | | |
| Comparable EBITDA | | | | | | |
| U.S. Natural Gas Pipelines | | 3,506 | | | 3,294 | | | 3,248 | |
| Mexico Natural Gas Pipelines | | 981 | | | 730 | | | 596 | |
| | | | | | |
| | 4,487 | | | 4,024 | | | 3,844 | |
| Depreciation and amortization | | (812) | | | (764) | | | (758) | |
| Interest expense on long-term debt and junior subordinated notes | | (1,716) | | | (1,855) | | | (1,692) | |
Interest income and other | | 112 | | | 172 | | | 156 | |
Interest expense allocated to discontinued operations | | — | | | 125 | | | 189 | |
| Allowance for funds used during construction | | 284 | | | 546 | | | 350 | |
| Net (income) loss attributable to non-controlling interests included in comparable earnings and other | | (466) | | | (481) | | | (156) | |
| | 1,889 | | | 1,767 | | | 1,933 | |
Average exchange rate – U.S. to Canadian dollars | | 1.40 | | | 1.37 | | | 1.35 | |
Foreign exchange related to Mexico Natural Gas Pipelines
Changes in the value of the Mexican peso against the U.S. dollar can affect our comparable earnings as a portion of our Mexico Natural Gas Pipelines' monetary assets and liabilities are peso-denominated, while our financial results are denominated in U.S. dollars for our Mexico operations. These peso-denominated balances are revalued to U.S. dollars, creating foreign exchange gains and losses that are included in Income (loss) from equity investments, Foreign exchange (gains) losses, net and Net income (loss) attributable to non-controlling interests in the Consolidated statement of income.
In addition, foreign exchange gains or losses calculated for Mexico income tax purposes on the revaluation of U.S. dollar‑denominated monetary assets and liabilities result in a peso‑denominated income tax exposure for these entities, leading to fluctuations in Income from equity investments and Income tax expense. This exposure increases as our U.S. dollar‑denominated net monetary liabilities grow.
The above exposures are managed using foreign exchange derivatives, although some unhedged exposure remains. The impacts of the foreign exchange derivatives are recorded in Foreign exchange (gains) losses, net in the Consolidated statement of income. Refer to the Other information – Financial risks and Financial instruments sections for additional information.
72 | TC Energy Management's discussion and analysis 2025
The period end exchange rates for one U.S. dollar to Mexican pesos were as follows:
| | | | | | | | |
| December 31, 2025 | | 18.00 | |
| December 31, 2024 | | 20.87 | |
| December 31, 2023 | | 16.91 | |
| | |
A summary of the impacts of transactional foreign exchange gains and losses from changes in the value of the Mexican peso against the U.S. dollar and associated derivatives is set out in the table below:
| | | | | | | | | | | | | | | | | | | | |
| year ended December 31 | | | | | | |
| (millions of $) | | 2025 | | 2024 | | 2023 |
| | | | | | |
Comparable EBITDA – Mexico Natural Gas Pipelines1 | | (80) | | | 115 | | | (83) | |
| Foreign exchange gains (losses), net included in comparable earnings | | 140 | | | (53) | | | 224 | |
| Income tax (expense) recovery included in comparable earnings | | (89) | | | 110 | | | (133) | |
Net (income) loss attributable to non-controlling interests included in comparable earnings2 | | 7 | | | (11) | | | — | |
| | (22) | | | 161 | | | 8 | |
| | | | | | |
1Includes the foreign exchange impacts from the Sur de Texas joint venture recorded in Income (loss) from equity investments in the Consolidated statement
of income.
2Represents the non-controlling interest portion related to TGNH. Refer to the Corporate - Financial results section for additional information.
TC Energy Management's discussion and analysis 2025 | 73
Financial condition
We strive to maintain financial strength and flexibility in all parts of the economic cycle. We rely on our operating cash flows to sustain our business, pay dividends and fund a portion of our growth. In addition, we access capital markets and engage in portfolio management activities to meet our financing needs and to manage our capital structure and credit ratings. More information on how our credit ratings can impact our financing costs, liquidity and operations is available in our Annual Information Form available on SEDAR+ (www.sedarplus.ca).
We believe we have the financial capacity to fund our existing capital program through predictable and growing cash flows from continuing operations, access to capital markets, portfolio management activities, joint ventures, asset-level financing, cash
on hand and substantial committed credit facilities. Annually, in the fourth quarter, we renew and extend our credit facilities as required.
Financial Plan
Our capital program is comprised of approximately $21 billion of secured projects, as well as our projects under development, which are subject to key corporate and regulatory approvals. As discussed throughout this Financial condition section, our capital program is expected to be financed through our growing internally-generated cash flows and a combination of other funding options which may include:
•senior debt
•hybrid securities
•preferred shares
•asset divestitures and capital rotation
•project financing
•potential involvement of strategic or financial partners.
In addition, we may access additional funding options, as deemed appropriate, including common shares issued from treasury under our DRP and discrete common equity issuances.
Balance sheet analysis - from continuing operations
At December 31, 2025, excluding discontinued operations, our current assets totaled $6.1 billion and current liabilities amounted to $9.8 billion, leaving us with a working capital deficit of $3.7 billion compared to $4.8 billion at December 31, 2024. Our working capital deficiency is considered to be in the normal course of business and is managed through:
•our ability to generate predictable and growing cash flows from operations
•a total of $7.8 billion of TCPL committed revolving credit facilities, of which $7.2 billion of short-term borrowing capacity remains available, net of $0.6 billion backstopping outstanding commercial paper balances, and arrangements for a further $2.0 billion of demand credit facilities, of which $1.3 billion remains available as of December 31, 2025
•additional $2.1 billion committed revolving credit facilities at certain of our subsidiaries and affiliates, of which $1.5 billion of short-term borrowing capacity remains available as of December 31, 2025, net of $0.6 billion backstopping outstanding commercial paper balances
•our access to capital markets, including through securities issuances, incremental credit facilities, capital rotation and DRP, if deemed appropriate.
Our total assets from continuing operations at December 31, 2025 were $118.6 billion compared to $117.9 billion at December 31, 2024 reflecting our 2025 capital spending program, equity investments and working capital, partially offset by a weaker U.S. dollar at December 31, 2025 compared to December 31, 2024 on translation of our U.S. dollar-denominated assets.
At December 31, 2025 our total liabilities from continuing operations were $81.7 billion, compared to $79.6 billion at December 31, 2024 due to the net effect of movements in debt, working capital and a weaker U.S. dollar at December 31, 2025 compared to December 31, 2024 on translation of our U.S. dollar-denominated liabilities.
74 | TC Energy Management's discussion and analysis 2025
Consolidated capital structure - from continuing operations
The following table summarizes the components of our capital structure for continuing operations.
| | | | | | | | | | | | | | | | | | | | | | | | | | |
| at December 31 | | | | Percentage of total | | | | Percentage of total |
| (millions of $, unless otherwise noted) | | 2025 | | | 2024 | |
| | | | | | | | |
| Notes payable | | 1,200 | | | 2 | % | | 387 | | | 1 | % |
| | | | | | | | |
| Long-term debt, including current portion | | 46,792 | | | 48 | % | | 47,931 | | | 49 | % |
| Cash and cash equivalents | | (168) | | | — | | | (801) | | | (1) | % |
| | 47,824 | | | 50 | % | | 47,517 | | | 49 | % |
| Junior subordinated notes | | 12,094 | | | 12 | % | | 11,048 | | | 11 | % |
| | | | | | | | |
| Preferred shares | | 2,255 | | | 2 | % | | 2,499 | | | 3 | % |
| Common shareholders' equity | | 25,040 | | | 26 | % | | 25,093 | | | 26 | % |
| Non-controlling interests | | 9,604 | | | 10 | % | | 10,768 | | | 11 | % |
| | 96,817 | | | 100 | % | | 96,925 | | | 100 | % |
Provisions of various trust indentures, credit arrangements and other agreements with certain of our subsidiaries can restrict those subsidiaries' ability and, in certain cases, our ability to declare and pay dividends or make distributions under certain circumstances. In the opinion of management, these provisions do not currently restrict our ability to declare or pay dividends. These trust indentures and credit arrangements also require us to comply with various affirmative and negative covenants and maintain certain financial ratios. We were in compliance with all of our financial covenants at December 31, 2025.
Cash flows1,2
The following tables summarize our consolidated cash flows.
| | | | | | | | | | | | | | | | | | | | |
| year ended December 31 | | | | | | |
| (millions of $) | | 2025 | | 2024 | | 2023 |
| | | | | | |
| Net cash provided by operations | | 7,346 | | | 7,696 | | | 7,268 | |
| Net cash (used in) provided by investing activities | | (6,458) | | | (6,909) | | | (12,287) | |
| Net cash (used in) provided by financing activities | | (1,516) | | | (3,874) | | | 8,093 | |
| | (628) | | | (3,087) | | | 3,074 | |
| Effect of foreign exchange rate changes on cash and cash equivalents | | (5) | | | 210 | | | (16) | |
| Increase (decrease) in cash and cash equivalents | | (633) | | | (2,877) | | | 3,058 | |
1 Includes continuing and discontinued operations.
2 Includes nine months of Liquids Pipelines earnings in 2024 and a full year of earnings in 2023. Refer to the Discontinued operations section for additional information.
TC Energy Management's discussion and analysis 2025 | 75
Cash provided by operating activities1,2
| | | | | | | | | | | | | | | | | | | | |
| year ended December 31 | | | | | | |
| (millions of $) | | 2025 | | 2024 | | 2023 |
| | | | | | |
| Net cash provided by operations | | 7,346 | | | 7,696 | | | 7,268 | |
Increase (decrease) in operating working capital | | 503 | | | (199) | | | (207) | |
Funds generated from operations | | 7,849 | | | 7,497 | | | 7,061 | |
| Specific items: | | | | | | |
| South Bow settlement | | 147 | | | — | | | — | |
| Liquids Pipelines business separation costs, net of current income tax | | — | | | 185 | | | 40 | |
| Current income tax (recovery) expense on sale of PNGTS and non-core assets | | — | | | 148 | | | — | |
| Third-party settlement, net of current income tax | | — | | | 26 | | | — | |
| Focus Project costs, net of current income tax | | — | | | 21 | | | 54 | |
| NGTL System ownership transfer costs | | — | | | 10 | | | — | |
| Current income tax (recovery) expense on risk management activities | | — | | | 9 | | | — | |
| Current income tax (recovery) expense on Keystone XL asset impairment charge and other | | — | | | (3) | | | (14) | |
| Current income tax (recovery) expense on Keystone regulatory decisions | | — | | | (3) | | | 53 | |
Current income tax (recovery) expense on disposition of equity interest3 | | — | | | — | | | 736 | |
| Milepost 14 insurance expense | | — | | | — | | | 36 | |
| Keystone XL preservation and other, net of current income tax | | — | | | — | | | 14 | |
| | | | | | |
| | | | | | |
| Comparable funds generated from operations | | 7,996 | | | 7,890 | | | 7,980 | |
1 Includes continuing and discontinued operations.
2 Includes nine months of Liquids Pipelines earnings in 2024 and a full year of earnings in 2023. Refer to the Discontinued operations section for additional information.
3 Current income tax expense related to applying an approximate 24 per cent tax rate to the tax gain on sale of a 40 per cent non-controlling equity interest in Columbia Gas and Columbia Gulf. This is offset by a corresponding deferred tax recovery resulting in no net impact to tax expense.
Net cash provided by operations
Net cash provided by operations decreased by $350 million in 2025 compared to 2024 primarily due to the timing of working capital changes, partially offset by higher funds generated from operations.
Net cash provided by operations increased by $428 million in 2024 compared to 2023 primarily due to higher funds generated from operations.
Comparable funds generated from operations
Comparable funds generated from operations, a non-GAAP measure, helps us assess the cash generating ability of our businesses by excluding the timing effects of working capital changes, as well as the cash impact of our specific items.
Comparable funds generated from operations increased by $106 million in 2025 compared to 2024 primarily due to higher comparable EBITDA and risk management activities used to manage our foreign exchange exposure to net liabilities in Mexico and to U.S. dollar‑denominated income, partially offset by lower distributions from our equity investments.
Comparable funds generated from operations decreased by $90 million in 2024 compared to 2023 primarily due to lower comparable earnings, partially offset by increased distributions from our equity investments.
76 | TC Energy Management's discussion and analysis 2025
Cash (used in) provided by investing activities1
| | | | | | | | | | | | | | | | | | | | |
| year ended December 31 | | | | | | |
| (millions of $) | | 2025 | | 2024 | | 2023 |
| | | | | | |
Capital spending2 | | | | | | |
| Capital expenditures | | (5,270) | | | (6,308) | | | (8,007) | |
| Capital projects in development | | (16) | | | (50) | | | (142) | |
Contributions to equity investments | | (1,051) | | | (1,546) | | | (4,149) | |
| | (6,337) | | | (7,904) | | | (12,298) | |
Other distributions from equity investments | | 5 | | | 549 | | | 23 | |
| | | | | | |
| Proceeds from sales of assets, net of transaction costs | | — | | | 791 | | | 33 | |
| Acquisitions, net of cash acquired | | — | | | — | | | (307) | |
| Loans to affiliate (issued) repaid, net | | — | | | — | | | 250 | |
| Deferred amounts and other | | (126) | | | (345) | | | 12 | |
| | | | | | |
| Net cash (used in) provided by investing activities | | (6,458) | | | (6,909) | | | (12,287) | |
1 Includes continuing and discontinued operations.
2 Capital spending reflects cash flows associated with our Capital expenditures, Capital projects in development and Contributions to equity investments. For the year ended December 31, 2024, Contributions to equity investments were net of Other distributions from equity investments of $3.1 billion in the Canadian Natural Gas Pipelines segment. Refer to Note 5, Segmented information, Note 10, Equity investments and Note 11, Loans with affiliates, of our 2025 Consolidated financial statements for additional information.
Net cash used in investing activities decreased from $6.9 billion in 2024 to $6.5 billion in 2025 primarily as a result of decreased capital spending in 2025, partially offset by proceeds from sale of assets in 2024.
Net cash used in investing activities decreased from $12.3 billion in 2023 to $6.9 billion in 2024 primarily as a result of decreased capital spending and lower contributions to equity investments primarily related to Coastal GasLink LP and in part by higher proceeds from the sales of assets and distributions from equity investments.
Capital spending1
The following table summarizes capital spending by segment.
| | | | | | | | | | | | | | | | | | | | |
| year ended December 31 | | | | | | |
| (millions of $) | | 2025 | | 2024 | | 2023 |
| | | | | | |
| Canadian Natural Gas Pipelines | | 1,405 | | | 2,100 | | | 6,184 | |
| U.S. Natural Gas Pipelines | | 3,457 | | | 2,575 | | | 2,660 | |
| Mexico Natural Gas Pipelines | | 522 | | | 2,228 | | | 2,292 | |
| Power and Energy Solutions | | 922 | | | 824 | | | 1,080 | |
| Corporate | | 31 | | | 50 | | | 33 | |
| | 6,337 | | | 7,777 | | | 12,249 | |
Discontinued operations | | — | | | 127 | | | 49 | |
| | 6,337 | | | 7,904 | | | 12,298 | |
1Capital spending reflects cash flows associated with our Capital expenditures, Capital projects in development and Contributions to equity investments. For the year ended December 31, 2024, Contributions to equity investments were net of Other distributions from equity investments of $3.1 billion in the Canadian Natural Gas Pipelines segment. Refer to Note 5, Segmented information, Note 10, Equity investments and Note 11, Loans with affiliates, of our 2025 Consolidated financial statements for additional information.
TC Energy Management's discussion and analysis 2025 | 77
Capital expenditures
Capital expenditures in 2025 were incurred primarily for the advancement of the Columbia Gas and ANR projects, the NGTL System expansion as well as maintenance capital expenditures. Lower capital expenditures in 2025 compared to 2024 reflect the completion of the Southeast Gateway pipeline in second quarter 2025, partially offset by increased spending on ANR projects.
Capital projects in development
Costs incurred during 2025 on Capital projects in development were attributable to spending on projects in the Power and Energy Solutions segment.
Contributions to equity investments
Contributions to equity investments decreased in 2025 compared to 2024 mainly due to lower funds advanced to Coastal GasLink LP through the subordinated loan agreement.
Contributions to equity investments decreased in 2024 compared to 2023 mainly due to lower funds advanced to Coastal GasLink LP through the subordinated loan agreement.
On December 17, 2024, following the declared commercial in-service of the pipeline, Coastal GasLink LP repaid the $3,147 million balance owing to us under the subordinated loan agreement. Our share of equity contributions required to fund Coastal GasLink LP's repayment of the outstanding loan balance amounted to $3,137 million. The Contributions to equity investments and Other distributions from equity investments with respect to these activities are presented above on a net basis, although they are reported on a gross basis in our Consolidated statement of cash flows. Refer to Note 11, Loans with affiliates, of our 2025 Consolidated financial statements for additional information.
Other distributions from equity investments
Other distributions from equity investments decreased in 2025 compared to 2024 mainly due to distributions from Millennium as a result of its debt financing program in 2024, as well as lower return of capital from our equity investment in Iroquois.
Other distributions from equity investments increased in 2024 compared to 2023 mainly due to distributions from Millennium as a result of its debt financing program in 2024.
Proceeds from sales of assets
In 2024, TC Energy and its partner, Northern New England Investment Company, Inc., a subsidiary of Énergir, completed the sale of PNGTS to a third party. Our share of the proceeds was $743 million (US$546 million), net of transaction costs.
In 2024, we also completed the sale of other non-core assets for gross proceeds of $48 million.
In 2023, we completed the sale of a 20.1 per cent equity interest in Port Neches Link LLC to its joint venture partner, Motiva Enterprises, for gross proceeds of $33 million (US$25 million). As part of the Spinoff Transaction on October 1, 2024, our remaining interest in Port Neches Link LLC was transferred to South Bow.
Acquisitions
In 2023, we acquired 100 per cent of the Class B Membership Interests in the Fluvanna Wind Farm located in Scurry County, Texas for US$99 million, before post-closing adjustments. We also acquired 100 per cent of the Class B Membership Interests in the Blue Cloud Wind Farm located in Bailey County, Texas for US$125 million, before post-closing adjustments.
Loans to affiliate
In 2023, loans to affiliate (issued) repaid, net, represent issuances and repayments on the subordinated demand revolving credit facility and the subordinated loan agreement that we entered with Coastal GasLink LP to provide additional liquidity and funding to the Coastal GasLink project.
78 | TC Energy Management's discussion and analysis 2025
Cash (used in) provided by financing activities1
| | | | | | | | | | | | | | | | | | | | |
| year ended December 31 | | | | | | |
| (millions of $) | | 2025 | | 2024 | | 2023 |
| | | | | | |
Notes payable issued (repaid), net | | 876 | | | 341 | | | (6,299) | |
| Long-term debt issued, net of issue costs | | 5,413 | | | 8,089 | | | 15,884 | |
| Long-term debt repaid | | (6,116) | | | (9,273) | | | (3,772) | |
| Junior subordinated notes issued, net of issue costs | | 2,545 | | | 1,465 | | | — | |
| | | | | | |
| | | | | | |
| Dividends and distributions paid | | (4,550) | | | (4,807) | | | (3,052) | |
| Common shares issued, net of issue costs | | 104 | | | 88 | | | 4 | |
| Preferred shares redeemed | | (250) | | | — | | | — | |
Contributions from non-controlling interests | | — | | | 21 | | | — | |
| Cash received from factoring arrangement | | 351 | | | — | | | — | |
| Loan from affiliate | | 111 | | | — | | | — | |
| Disposition of equity interest, net of transaction costs | | — | | | 419 | | | 5,328 | |
Cash transferred to South Bow, net of debt settlements | | — | | | (244) | | | — | |
| Gains (losses) on settlement of financial instruments | | — | | | 27 | | | — | |
| | | | | | |
| Net cash (used in) provided by financing activities | | (1,516) | | | (3,874) | | | 8,093 | |
1 Includes continuing and discontinued operations.
Net cash used in financing activities decreased by $2.4 billion in 2025 compared to 2024 primarily due to lower repayments of long-term debt and higher issuances of junior subordinated notes and notes payable, as well as lower dividends and distributions paid in 2025, partially offset by lower issuances of long-term debt.
Net cash provided by financing activities decreased by $12.0 billion in 2024 compared to 2023 primarily due to lower issuances and higher repayments of long-term debt, the receipt of the $5.3 billion (US$3.9 billion) proceeds in 2023 upon sale of a 40 per cent non-controlling equity interest in Columbia Gas and Columbia Gulf, as well as higher dividends and distributions paid in 2024, partially offset by net issuances of notes payable in 2024 compared to net repayments in 2023 and junior subordinated notes issued in 2024.
The principal transactions reflected in our financing activities are discussed in further detail below.
TC Energy Management's discussion and analysis 2025 | 79
Long-term debt issued
The following table outlines significant long-term debt issuances in 2025.
| | | | | | | | | | | | | | | | | | | | | | | | | | | | | | |
| (millions of Canadian $, unless otherwise noted) | | | | | | | |
| Company | | Issue date | Type | | Maturity date | | Amount | | Interest rate | |
| | | | | | | | | | |
TRANSCANADA PIPELINES LIMITED |
| | November 2025 | Medium Term Notes | | November 2055 | | 850 | | | 5.13 | % | |
| | February 2025 | Medium Term Notes | | February 2035 | | 1,000 | | | 4.58 | % | |
COLUMBIA PIPELINES HOLDING COMPANY LLC |
| | November 2025 | Senior Unsecured Notes | | November 2032 | | US 750 | | 5.00 | % | |
| GREAT LAKES GAS TRANSMISSION LIMITED PARTNERSHIP |
| | October 2025 | Unsecured Term Loan | | October 2028 | | US 205 | | | Floating | |
| ANR PIPELINE COMPANY |
| | September 2025 | Senior Unsecured Notes | | September 2031 | | US 250 | | | 5.23 | % | |
| | September 2025 | Senior Unsecured Notes | | September 2035 | | US 350 | | | 5.69 | % | |
COLUMBIA PIPELINES OPERATING COMPANY LLC |
| | March 2025 | Senior Unsecured Notes | | February 2035 | | US 550 | | | 5.44 | % | |
| | March 2025 | Senior Unsecured Notes | | February 2055 | | US 450 | | 5.96 | % | |
| | | | | | | | | | |
|
| | | | | | | | | | |
|
| | | | | | | | | | |
| | | | | | | | | | |
|
| | | | | | | | | | |
| | | | | | | | | | |
| | | | | | | | | | |
| | | | | | | | | | |
| | | | | | | | | | |
| | | | | | | |
| | | | | | | | | | |
| | | | | | | |
| | | | | | | | | | |
| | | | | | | | | | |
Long-term debt retired/repaid
The following table outlines significant long-term debt retired/repaid in 2025.
| | | | | | | | | | | | | | | | | | | | | | | | | | |
| (millions of Canadian $, unless otherwise noted) | | | | |
| Company | | Retirement/repayment date | | Type | | Amount | | Interest rate |
| | | | | | | | |
TRANSCANADA PIPELINES LIMITED |
| | November 2025 | | Senior Unsecured Notes | | US 850 | | | 4.88 | % |
| | October 2025 | | Senior Unsecured Notes | | US 92 | | | 7.06 | % |
| | July 2025 | | Medium Term Notes | | 750 | | | 3.30 | % |
NOVA GAS TRANSMISSION LTD. | | | | | | | | |
| | May 2025 | | Medium Term Notes | | 87 | | | 8.90 | % |
COLUMBIA PIPELINES OPERATING COMPANY LLC |
| | March 2025 | | Senior Unsecured Notes | | US 1,000 | | | 4.50 | % |
TC PIPELINES, LP | | | | | | |
| | March 2025 | | Senior Unsecured Notes | | US 350 | | | 4.38 | % |
| TC ENERGÍA MEXICANA, S. DE R.L. DE C.V. | | | | |
| | Various | | Senior Unsecured Term Loan | | US 677 | | Floating |
On February 5, 2026, TCPL retired $241 million of medium term notes bearing interest at a fixed rate of 8.29 per cent.
80 | TC Energy Management's discussion and analysis 2025
Junior subordinated notes issued
The following table outlines significant junior subordinated notes issued in 2025:
| | | | | | | | | | | | | | | | | | | | | | | | | | | | | | | | | | | |
(millions of Canadian $, unless otherwise noted) | | | | | | | |
| Company | | Issue date | | Type | | Maturity date | | Amount | | Interest rate |
| | | | | | | | | | | |
| TRANSCANADA PIPELINES LIMITED | | | | | | | | | |
| | October 2025 | | Junior Subordinated Notes | | November 2085 | | US 370 | | | 6.25 | % | |
| | August 2025 | | Junior Subordinated Notes | | February 2056 | | | 1,000 | | | 5.20 | % | 1 |
| | February 2025 | | Junior Subordinated Notes | | June 2065 | | US 750 | | 7.00 | % | 2 |
| | | | | | | | | |
| | | | | | | | | | | |
| | | | | | | | | | | |
| | | | | | | | | |
| | | | | | | | | | | |
| | | | | | | | | | | |
1 Fixed rate of interest per year until February 15, 2031, and resetting every five years thereafter, subject to a rate-reset minimum.
2 Fixed rate of interest per year until June 1, 2030, and resetting every five years thereafter.
Junior subordinated notes repaid/retired
In May 2025, TCPL exercised its option to fully repay and retire the US$750 million junior subordinated notes that had a maturity date of 2075, bearing interest at 5.88 per cent to TransCanada Trust (the Trust). All of the proceeds from the repayment were used by the Trust to fund the redemption price of the US$750 million in aggregate principal amount of outstanding Trust Notes - Series 2015-A, in May 2025 pursuant to their terms. Refer to Note 20, Junior subordinated notes, of our 2025 Consolidated financial statements for additional information.
For more information about long-term debt and junior subordinated notes issued and long-term debt repaid in 2025, 2024 and 2023, refer to Note 19, Long-term debt and Note 20, Junior subordinated notes, of our 2025 Consolidated financial statements.
Dividend reinvestment plan
Under the DRP, eligible holders of common and preferred shares of TC Energy can reinvest their dividends and make optional cash payments to obtain additional TC Energy common shares. From August 31, 2022 to July 31, 2023, common shares were issued from treasury at a discount of two per cent to market prices over a specified period.
Commencing with the dividends declared on July 27, 2023, common shares purchased under TC Energy's DRP are acquired on the open market at 100 per cent of the weighted average purchase price.
TC Energy Management's discussion and analysis 2025 | 81
Share information
| | | | | | | | |
| at February 6, 2026 | | |
| | |
| Common Shares | issued and outstanding | |
| | 1.0 billion | |
| | |
| Preferred Shares | issued and outstanding | convertible to |
| | |
| Series 1 | 18.4 million | Series 2 preferred shares |
| Series 2 | 3.6 million | Series 1 preferred shares |
| Series 3 | 11.7 million | Series 4 preferred shares |
| Series 4 | 2.3 million | Series 3 preferred shares |
| Series 5 | 14.0 | million | Series 6 preferred shares |
| | |
| Series 7 | 24 million | Series 8 preferred shares |
| Series 9 | 16.7 million | Series 10 preferred shares |
| Series 10 | 1.3 million | Series 9 preferred shares |
| | |
| Options to buy common shares | outstanding | exercisable |
| 1.9 million | 1.4 million |
On January 16, 2026, 109,800 Series 5 preferred shares were elected for conversion, on a one-for-one basis, into Series 6 preferred shares and 1,089,726 Series 6 preferred shares were elected for conversion, on a one-for-one basis, into Series 5 preferred shares. As the total number of Series 6 preferred shares tendered for conversion would have resulted in less than one million Series 6 preferred shares outstanding on the conversion date, all remaining outstanding Series 6 preferred shares were automatically converted into Series 5 preferred shares and no Series 5 preferred shares were converted into Series 6 preferred shares. As a result, on January 30, 2026, 1,929,407 Series 6 preferred shares were converted, on a one-for-one basis, into 1,929,407 Series 5 preferred shares and Series 6 preferred shares were delisted from the TSX at the close of markets on January 30, 2026.
On November 28, 2025, we redeemed all 10 million issued and outstanding Series 11 preferred shares at a redemption price of $25.00 per share and paid the final quarterly dividend of $0.2094375 per Series 11 preferred share for the period up to but excluding November 28, 2025, as previously declared on November 4, 2025.
On June 30, 2025, 104,778 Series 3 preferred shares were converted, on a one-for-one basis, into Series 4 preferred shares and 1,822,829 Series 4 preferred shares were converted, on a one-for-one basis, into Series 3 preferred shares.
For more information on preferred shares, refer to Note 24, Preferred shares, of our 2025 Consolidated financial statements.
82 | TC Energy Management's discussion and analysis 2025
Dividends
| | | | | | | | | | | | | | | | | | | | |
| year ended December 31 | | 2025 | | 2024 | | 2023 |
| | | | | | |
| Dividends declared | | | | | | |
per common share1 | | $3.40 | | | $3.7025 | | | $3.72 | |
| per Series 1 preferred share | | $1.23475 | | | $0.86975 | | | $0.86975 | |
| per Series 2 preferred share | | $1.20576 | | | $1.68134 | | | $1.62659 | |
| per Series 3 preferred share | | $0.7245 | | | $0.4235 | | | $0.4235 | |
| per Series 4 preferred share | | $1.04576 | | | $1.52046 | | | $1.46703 | |
| per Series 5 preferred share | | $0.48725 | | | $0.48725 | | | $0.48725 | |
| per Series 6 preferred share | | $1.06655 | | | $1.55132 | | | $1.55993 | |
| per Series 7 preferred share | | $1.49625 | | | $1.36613 | | | $0.97575 | |
| per Series 9 preferred share | | $1.27 | | | $1.02288 | | | $0.9405 | |
per Series 10 preferred share | | $1.26905 | | | $0.39807 | | | — | |
| per Series 11 preferred share | | $0.62831 | | | $0.83775 | | | $0.83775 | |
1Dividends declared in fourth quarter 2024 and thereafter reflect TC Energy's proportionate allocation following the Spinoff Transaction.
Commencing with the dividends payable on January 31, 2025 to shareholders of record at the close of business on December 31, 2024, the amounts reflect TC Energy’s proportionate allocation following the Spinoff Transaction. Refer to our 2024 Annual Report for additional information.
Our Board of Directors have declared a quarterly dividend on our outstanding common shares of $0.8775 per common share for the quarter ending March 31, 2026, which equates to an annual dividend of $3.51 per common share.
Credit facilities
We have several committed credit facilities that support our commercial paper programs and provide short-term liquidity for general corporate purposes. In addition, we have demand credit facilities that are also used for general corporate purposes, including issuing letters of credit and providing additional liquidity.
At February 6, 2026, total committed revolving and demand credit facilities were $11.8 billion. These unsecured credit facilities included the following:
| | | | | | | | | | | | | | | | | | | | | | | | | | | | | |
| (billions of Canadian $, unless otherwise noted) | | | | | | | |
| Borrower | | Description | | Matures | | Total facilities | | Unused
capacity | 1 |
| | | | | | | | | |
| Committed, syndicated, revolving, extendible, senior unsecured credit facilities: | | | |
| TCPL | | Supports commercial paper program and for general corporate purposes | | December 2030 | | 3.0 | | | 2.3 | | |
TCPL / TCPL USA | | Supports commercial paper programs and for general corporate purposes of the borrowers, guaranteed by TCPL | | December 2026 | | US 1.0 | | | US 0.7 | | |
TCPL / TCPL USA | | Supports commercial paper programs and for general corporate purposes of the borrowers, guaranteed by TCPL | | December 2028 | | US 2.5 | | | US 2.2 | | |
Columbia Pipelines Holding Company LLC2 | | Supports commercial paper program and general corporate purposes of the borrower | | December 2028 | | US 1.5 | | | US 1.1 | | |
| Demand senior unsecured revolving credit facilities: | | | | | |
| TCPL / TCPL USA | | Supports the issuance of letters of credit and provides additional liquidity; TCPL USA facility guaranteed by TCPL | | Demand | | 2.0 | | 3 | 1.2 | | 3 |
| | | | | | | | | |
1Unused capacity is net of commercial paper outstanding and facility draws.
2Columbia Pipelines Holding Company LLC is a partially owned subsidiary of TC Energy with 40 per cent non-controlling interest.
3Or the U.S. dollar equivalent.
TC Energy Management's discussion and analysis 2025 | 83
Contractual obligations
Our contractual obligations include our notes payable, long-term debt and junior subordinated notes, operating leases, purchase obligations and other liabilities incurred in our business such as cash contributions to the employee pension and post-retirement benefit plans.
Payments due (by period)
| | | | | | | | | | | | | | | | | | | | | | | | | | | | | |
| at December 31, 2025 | Total | | < 1 year | | 1 - 3 years | | 4 - 5 years | | > 5 years |
| (millions of $) |
| | | | | | | | | |
| Notes payable | 1,200 | | | 1,200 | | | — | | | — | | | — | |
Long-term debt and junior subordinated notes1 | 59,145 | | | 1,545 | | | 8,318 | | | 5,882 | | | 43,400 | |
Operating leases2 | 509 | | | 73 | | | 129 | | | 122 | | | 185 | |
Purchase obligations and other3 | 4,650 | | | 1,091 | | | 976 | | | 564 | | | 2,019 | |
| | 65,504 | | | 3,909 | | | 9,423 | | | 6,568 | | | 45,604 | |
1Excludes issuance costs and fair value adjustments.
2Includes future payments for corporate offices, various premises, services, equipment, land and lease commitments from corporate restructuring. Some of our operating leases include the option to renew the agreement for one to 25 years.
3Includes $17 million related to the transfer of pension assets to South Bow. Refer to the Obligations - pension and other post-retirement benefit plans section for additional information.
Notes payable
Total notes payable outstanding at December 31, 2025 was $1.2 billion (2024 – $387 million).
Long-term debt and junior subordinated notes
At December 31, 2025, we had $46.8 billion (2024 – $47.9 billion) of long-term debt and $12.1 billion (2024 – $11.0 billion) of junior subordinated notes.
We attempt to ladder the maturity profile of our debt. The weighted-average maturity of our long‑term debt and junior subordinated notes, excluding call features is approximately 19 years.
At December 31, 2025, scheduled interest payments related to our long-term debt and junior subordinated notes were as follows:
| | | | | | | | | | | | | | | | | | | | | | | | | | | | | |
| at December 31, 2025 | Total | | < 1 year | | 1 - 3 years | | 4 - 5 years | | > 5 years |
| (millions of $) |
| | | | | | | | | |
| Long-term debt | 29,434 | | | 2,387 | | | 4,496 | | | 3,875 | | | 18,676 | |
| Junior subordinated notes | 44,193 | | | 742 | | | 1,618 | | | 1,677 | | | 40,156 | |
| | 73,627 | | | 3,129 | | | 6,114 | | | 5,552 | | | 58,832 | |
Purchase obligations
We have purchase obligations that are transacted at market prices and in the normal course of business, including long-term natural gas transportation and purchase arrangements.
Capital expenditure commitments include obligations related to the construction of growth projects and are based on the projects proceeding as planned. Changes to these projects, including cancellation, would reduce or possibly eliminate these commitments as a result of cost mitigation efforts.
We have entered into PPAs with solar and wind-power generating facilities ranging from 2026 to 2038, that require the purchase of generated energy and associated environmental attributes. At December 31, 2025, the total planned capacity secured under the PPAs is approximately 750 MW with the generation subject to operating availability and capacity factors. These PPAs do not meet the definition of a lease or derivative. Future payments and their timing cannot be reasonably estimated as they are dependent on when certain underlying facilities are placed in service and the amount of energy generated. Certain of these purchase commitments have offsetting sale PPAs for all or a portion of the related output from the facility.
84 | TC Energy Management's discussion and analysis 2025
At December 31, 2025, payments for purchase obligations and other were as follows:
| | | | | | | | | | | | | | | | | | | | | | | | | | | | | |
| at December 31, 2025 | Total | | < 1 year | | 1 - 3 years | | 4 - 5 years | | > 5 years |
| (millions of $) |
| | | | | | | | | |
| Canadian Natural Gas Pipelines | | | | | | | | | |
Transportation by others1 | 181 | | | 41 | | | 77 | | | 45 | | | 18 | |
Transportation by others - TQM1,2 | 2,574 | | | 152 | | | 317 | | | 316 | | | 1,789 | |
Capital spending3 | 115 | | | 115 | | | — | | | — | | | — | |
| U.S. Natural Gas Pipelines | | | | | | | | | |
Transportation by others1 | 598 | | | 144 | | | 249 | | | 91 | | | 114 | |
Capital spending3 | 569 | | | 311 | | | 180 | | | 78 | | | — | |
| Mexico Natural Gas Pipelines | | | | | | | | | |
Capital spending3 | 36 | | | 36 | | | — | | | — | | | — | |
| Power and Energy Solutions | | | | | | | | | |
Capital spending3 | 114 | | | 78 | | | 28 | | | 6 | | | 2 | |
Other | 190 | | | 26 | | | 40 | | | 28 | | | 96 | |
| Corporate | | | | | | | | | |
Capital spending3 | 3 | | | 3 | | | — | | | — | | | — | |
South Bow pension plan assets held in trust4 | 17 | | | 17 | | | — | | | — | | | — | |
Other | 253 | | | 168 | | | 85 | | | — | | | — | |
| | 4,650 | | | 1,091 | | | 976 | | | 564 | | | 2,019 | |
1Demand rates are subject to change. The contractual obligations in the table are based on demand volumes only and exclude variable charges incurred when volumes flow.
2Includes 100 per cent of the contracted obligation for the Canadian Mainline to transport volumes for its shippers utilizing the TQM pipeline to 2042, which we have a 50 per cent ownership interest in. The cost of the contracts flow through to the Canadian Mainline shippers and is determined based on the revenue requirement outlined in the TQM settlement agreement.
3 Amounts are primarily for expenditures for capital projects. Amounts are estimates and are subject to variability based on timing of construction and project requirements.
4 Related to the transfer of pension assets to South Bow. Refer to the Obligations - pension and other post-retirement benefit plans section for additional information.
TC Energy Management's discussion and analysis 2025 | 85
GUARANTEES
Sur de Texas
We and our partner on the Sur de Texas pipeline, IEnova Infraestructura Marina Holding B.V. (IEnova), have jointly guaranteed the financial performance of the entity which owns the pipeline. Such agreements include a guarantee and a letter of credit which are primarily related to the delivery of natural gas. The guarantee has terms that can be renewed in June 2026, with the annual option to extend for one year periods ending in 2053.
At December 31, 2025, our share of potential exposure under the Sur de Texas pipeline guarantees was estimated to be $78 million with a carrying amount of less than $1 million.
Bruce Power
We and our joint venture partner on Bruce Power, BPC Generation Infrastructure Trust, have each severally guaranteed certain contingent financial obligations of Bruce Power related to a lease agreement. The Bruce Power guarantee has a term that can be renewed in December 2027 and is extendable for any number of successive two-year periods, with a final renewal period of three years ending in 2065.
At December 31, 2025, our share of the potential exposure under the Bruce Power guarantee was estimated to be $88 million with no carrying amount.
Other jointly-owned entities
We and our partners in certain other jointly-owned entities have also guaranteed (jointly, severally, jointly and severally, or exclusively) the financial performance of these entities. Such agreements include guarantees and letters of credit which are primarily related to delivery of natural gas. The guarantees have terms ranging to 2032.
Our share of the potential exposure under these assurances was estimated at December 31, 2025 to be approximately $54 million with a carrying amount of $1 million. In certain cases, if we make a payment that exceeds our ownership interest, the additional amount must be reimbursed by our partners.
OBLIGATIONS – PENSION AND OTHER POST-RETIREMENT BENEFIT PLANS
In 2025, we made no funding contributions to our defined benefit pension plans (DB Plans), $8 million for other post-retirement benefit plans and $72 million for the savings plan and defined contribution plans. Total letters of credit provided for the funding of solvency requirements to the Canadian DB plan at December 31, 2025 was nil (2024 – $111 million; 2023 – $244 million).
In 2026, we do not expect to make any contributions to the DB Plans, $8 million of funding contributions for other post-retirement benefit plans and $76 million for the savings plans and defined contribution pension plans. We do not expect to issue additional letters of credit to the Canadian DB Plan for the funding of solvency requirements.
The net benefit cost for our DB Plans and other post-retirement plans decreased to $11 million in 2025 from $19 million in 2024 primarily due to decrease service costs in the Canadian retirement plan.
South Bow - transition of pension assets
As part of the Spinoff Transaction, certain TC Energy employees became employees of South Bow. Prior to the Spinoff Transaction, these employees in Canada and the U.S. participated in DB Plans, DC Plans and savings plans, as applicable. Effective October 1, 2024, the benefit obligations under the DB Plans in respect of the employees moving from TC Energy to South Bow were transferred to South Bow. An asset transfer application related to the Canadian DB Plan outlining the proposed transfer of assets from TC Energy to South Bow has received regulatory approval. During the year ended December 31, 2025, $105 million was transferred to South Bow. As at December 31, 2025, $17 million of assets in the Canadian DB Plan remain in the TC Energy DB Plan trust and are reflected as Current assets of discontinued operations with a corresponding obligation to South Bow reflected as Current liabilities of discontinued operations on our Consolidated balance sheet. The remaining South Bow pension assets will be adjusted to fair value on the date of transfer, which is expected mid-2026. As at December 31, 2024, the assets related to the U.S. DB Plan were fully transferred to South Bow.
86 | TC Energy Management's discussion and analysis 2025
Future net benefit costs and the amount we will need to contribute to fund our plans will depend on a range of factors including:
•interest rates
•actual returns on plan assets
•changes to actuarial assumptions and plan design
•actual plan experience versus projections
•amendments to pension plan regulations and legislation.
We do not expect future increases in the level of funding needed to maintain our plans to have a material impact on our liquidity or financial condition.
TC Energy Management's discussion and analysis 2025 | 87
Discontinued operations
On October 1, 2024, TC Energy completed the spinoff of its Liquids Pipelines business into the new public company, South Bow. Upon completion of the Spinoff Transaction, the Liquids Pipelines business was accounted for as a discontinued operation.
Agreements
Pursuant to the Spinoff Transaction, TC Energy and South Bow have executed a series of agreements to outline the parameters and guidelines that govern their ongoing relationship, including a Transition Services Agreement, Tax Matters Agreement and a Separation Agreement.
The Transition Services Agreement was established to specify certain services that TC Energy will provide to South Bow for a period of up to two years.
The Tax Matters Agreement imposes certain restrictions on both TC Energy and South Bow in order to preserve the tax-free status of the spinoff and allocates tax liabilities in the event the Spinoff Transaction is not tax-free.
The Separation Agreement sets forth the terms of the separation of the Liquids Pipelines business from the business of TC Energy, including the transfer of certain assets related to the Liquids Pipelines business from TC Energy to South Bow and the allocation of certain liabilities and obligations related to the Liquids Pipelines business between TC Energy and South Bow.
In September 2025, we reached an agreement with South Bow with respect to liabilities we indemnified South Bow for under the Separation Agreement, releasing us from those liabilities. Inclusive of the recognition of the settlement, a net after-tax loss from discontinued operations of $183 million was recorded for the year ended December 31, 2025 and has been excluded from our calculation of comparable measures from discontinued operations. Payments related to the settlement commenced in fourth quarter 2025 and will be completed in 2026.
In June 2025, we received $24 million related to certain recoveries under the Separation Agreement with South Bow. At this time, we also revised our estimate of our share of future recoveries, resulting in a $29 million impairment charge, which has been included in Net income (loss) from discontinued operations, net of tax in the Consolidated statement of income and excluded from our calculation of comparable measures from discontinued operations.
For additional information regarding the agreement, incidents occurring prior to the Spinoff Transaction and separation costs, refer to Note 4, Discontinued operations, of our 2025 Consolidated financial statements and our 2024 Annual Report.
Presentation of Discontinued Operations
Upon completion of the Spinoff Transaction, the Liquids Pipelines business was accounted for as discontinued operations. Our presentation of discontinued operations includes revenues and expenses directly attributable to the Liquids Pipelines business.
Prior years' amounts present the Liquids Pipelines business as discontinued operations.
88 | TC Energy Management's discussion and analysis 2025
RESULTS FROM DISCONTINUED OPERATIONS1
| | | | | | | | | | | | | | | | | | | | |
| year ended December 31 | | | | | | |
| (millions of $, except per share amounts) | | 2025 | | 2024 | | 2023 |
| | | | | | |
| | | | | | |
| Segmented earnings (losses) from discontinued operations | | (245) | | | 716 | | | 1,039 | |
Interest expense | | — | | | (218) | | | (297) | |
| Interest income and other | | 28 | | | 21 | | | (30) | |
| Income (loss) from discontinued operations before income taxes | | (217) | | | 519 | | | 712 | |
Income tax (expense) recovery | | 5 | | | (124) | | | (100) | |
| Net income (loss) from discontinued operations, net of tax | | (212) | | | 395 | | | 612 | |
Net income (loss) per common share from discontinued operations – basic | | ($0.20) | | | $0.38 | | | $0.60 | |
1 Represents nine months of Liquids Pipelines earnings in 2024 and a full year of earnings in 2023.
Net loss from discontinued operations, net of tax in 2025 was $212 million or $0.20 per common share (2024 – net income of $395 million or $0.38 per common share; 2023 – net income of $612 million or $0.60 per common share), a decrease of $607 million or $0.58 per common share compared to 2024 and a decrease of $217 million or $0.22 per common share in 2024 compared to 2023.
NON-GAAP MEASURES
This MD&A references non-GAAP measures, which are described on page 22. These measures do not have any standardized meaning as prescribed by GAAP and therefore may not be comparable to similar measures presented by other entities.
The following specific items were recognized in Net income (loss) from discontinued operations, net of tax and were excluded from comparable earnings from discontinued operations:
2025
•a pre-tax charge of $188 million primarily related to the liabilities we indemnified South Bow for under the Separation Agreement
•a pre-tax impairment charge of $29 million related to our estimate of Keystone XL contractual recoveries.
2024
•a pre-tax charge of $197 million from Liquids Pipelines business separation costs related to the Spinoff Transaction, of which $173 million was recognized in segmented earnings (losses) from discontinued operations, $42 million was recorded in interest expense and $18 million was recorded in interest income
•a pre-tax expense of $37 million related to our estimate of potential incremental costs resulting from the Milepost 14 incident. This amount represents our 86 per cent share pursuant to the indemnity provisions in the Separation Agreement
•a pre-tax expense of $21 million related to Keystone XL asset disposition and termination activities
•a pre-tax charge of $12 million as a result of the FERC Administrative Law Judge decision on Keystone in respect of a tolling-related complaint pertaining to amounts recognized in prior periods.
2023
•a pre-tax charge of $67 million as a result of the FERC Administrative Law Judge decision on Keystone in respect of a tolling-related complaint pertaining to amounts recognized in prior periods, which consists of a one-time pre-tax charge of $57 million and included accrued pre-tax carrying charges of $10 million
•a pre-tax charge of $40 million from Liquids Pipelines business separation costs related to the Spinoff Transaction
•a pre-tax accrued insurance expense of $36 million related to the Milepost 14 incident
•pre-tax preservation and other costs of $18 million related to the preservation and storage of the Keystone XL pipeline project assets
•a pre-tax recovery of $4 million related to the net impact of a U.S. minimum tax recovery on the 2021 Keystone XL asset impairment charge and other and a gain on the sale of Keystone XL project assets, offset partially by adjustments to the estimate for contractual and legal obligations related to termination activities.
TC Energy Management's discussion and analysis 2025 | 89
Reconciliation of net income (loss) from discontinued operations, net of tax to comparable earnings from discontinued operations1
| | | | | | | | | | | | | | | | | | | | |
| year ended December 31 | | | | | | |
| (millions of $, except per share amounts) | | 2025 | | 2024 | | 2023 |
| | | | | | |
| | | | | | |
| | | | | | |
| Net income (loss) from discontinued operations, net of tax | | (212) | | | 395 | | | 612 | |
| Specific items (pre tax): | | | | | | |
South Bow settlement2 | | 188 | | | — | | | — | |
| Keystone XL asset impairment charge and other | | 29 | | | 21 | | | (4) | |
| Liquids Pipelines business separation costs | | — | | | 197 | | | 40 | |
Milepost 14 incremental costs | | — | | | 37 | | | — | |
| Keystone regulatory decisions | | — | | | 12 | | | 67 | |
Milepost 14 insurance expense | | — | | | — | | | 36 | |
| Keystone XL preservation and other | | — | | | — | | | 18 | |
Risk management activities | | — | | | (67) | | | 34 | |
Taxes on specific items | | (5) | | | (30) | | | (47) | |
| Comparable earnings from discontinued operations | | — | | | 565 | | | 756 | |
| Net income (loss) per common share from discontinued operations | | ($0.20) | | | $0.38 | | | $0.60 | |
Specific items (net of tax) | | 0.20 | | | 0.16 | | | 0.14 | |
| Comparable earnings per common share from discontinued operations | | — | | | $0.54 | | | $0.74 | |
1 Represents nine months of Liquids Pipelines earnings in 2024 and a full year of earnings in 2023.
2 A pre-tax charge of $188 million for the year ended December 31, 2025 primarily resulting from the resolution reached in September 2025 under the Separation Agreement with South Bow.
90 | TC Energy Management's discussion and analysis 2025
Comparable EBITDA to comparable earnings - from discontinued operations1
Comparable EBITDA from discontinued operations represents segmented earnings (losses) from discontinued operations adjusted for the specific items described above and excludes charges for depreciation and amortization.
| | | | | | | | | | | | | | | | |
year ended December 31 | | | | | | |
| (millions of $, except per share amounts) | | | | 2024 | | 2023 |
| | | | | | |
| Comparable EBITDA from discontinued operations | | | | 1,145 | | | 1,516 | |
| Depreciation and amortization | | | | (253) | | | (332) | |
Interest expense included in comparable earnings2 | | | | (176) | | | (287) | |
Interest income and other included in comparable earnings3 | | | | 3 | | | 6 | |
Income tax (expense) recovery included in comparable earnings4 | | | | (154) | | | (147) | |
| Comparable earnings from discontinued operations | | | | 565 | | | 756 | |
| Comparable earnings per common share from discontinued operations | | | | $0.54 | | | $0.74 | |
1 Represents nine months of Liquids Pipelines earnings in 2024 and a full year of earnings in 2023.
2 Excludes pre-tax Liquids Pipelines business separation costs of $42 million related to interest expense on the South Bow debt issuance in third quarter 2024 and carrying charges of $10 million for the year ended December 31, 2023 as a result of a pre-tax charge related to the FERC Administrative Law Judge decision on Keystone in respect of a tolling-related complaint pertaining to amounts recognized in prior periods.
3 Excludes pre-tax income of $18 million for the year ended December 31, 2024 related to the net impact of interest income on proceeds from the South Bow debt issuance on August 28, 2024, which were held in escrow and insurance provisions as well as a $36 million pre-tax insurance expense recorded in 2023 related to the Milepost 14 incident.
4 Excludes the impact of income taxes related to the specific items mentioned above as well as a $14 million U.S. minimum tax recovery in 2023 on the Keystone XL asset impairment charge and other related to the termination of the Keystone XL pipeline project.
Comparable EBITDA from discontinued operations
Comparable EBITDA from discontinued operations was $371 million lower in 2024 compared to 2023 primarily due to the net effect of:
•nine months of Liquids Pipelines earnings included in 2024 compared to a full year of Liquids Pipelines earnings in 2023
•higher contracted and uncontracted volumes across the Keystone Pipeline System in 2024
•lower contributions from the liquids marketing business due to lower realized margins.
Comparable earnings from discontinued operations
Comparable earnings from discontinued operations in 2024 were $191 million or $0.20 per common share lower than in 2023, and were primarily due to the impact of nine months of Liquids Pipelines business earnings in 2024 compared to a full year
in 2023.
TC Energy Management's discussion and analysis 2025 | 91
FINANCIAL RESULTS - 2024 and 20231
The following is a reconciliation of comparable EBITDA from discontinued operations and comparable EBIT from discontinued operations (our non-GAAP measures) to segmented earnings (losses) from discontinued operations (the most directly comparable GAAP measure). Refer to page 22 for more information on non-GAAP measures we use.
For information on 2025 comparable measures from discontinued operations refer to page 89.
| | | | | | | | | | | | | | | | |
year ended December 31 | | | | | | |
| (millions of $) | | | | 2024 | | 2023 |
| | | | | | |
Keystone Pipeline System | | | | 1,098 | | | 1,453 | |
Intra-Alberta pipelines2 | | | | 52 | | | 70 | |
Other | | | | (5) | | | (7) | |
| Comparable EBITDA from discontinued operations | | | | 1,145 | | | 1,516 | |
| Depreciation and amortization | | | | (253) | | | (332) | |
| Comparable EBIT from discontinued operations | | | | 892 | | | 1,184 | |
Specific items (pre tax): | | | | | | |
| Liquids Pipelines business separation costs | | | | (173) | | | (40) | |
| Milepost 14 incremental costs | | | | (37) | | | — | |
| Keystone XL asset impairment charge and other | | | | (21) | | | 4 | |
| Keystone regulatory decisions | | | | (12) | | | (57) | |
| Keystone XL preservation and other | | | | — | | | (18) | |
| Risk management activities | | | | 67 | | | (34) | |
| Segmented earnings (losses) from discontinued operations | | | | 716 | | | 1,039 | |
1 Represents nine months of Liquids Pipelines earnings in 2024 and a full year of earnings in 2023.
2 Intra-Alberta pipelines includes Grand Rapids and White Spruce.
Segmented earnings from discontinued operations decreased by $323 million in 2024 compared to 2023 and included the specific items mentioned in the table above, which have been excluded from our calculation of comparable EBITDA from discontinued operations and comparable EBIT from discontinued operation. Refer to page 89 for additional information.
A stronger U.S. dollar in 2024 and 2023 had a positive impact on the Canadian dollar equivalent segmented earnings from our U.S. operations.
Depreciation and amortization
Depreciation and amortization was $79 million lower in 2024 compared to 2023 due to nine months of Liquids Pipelines operations in 2024 compared to a full year of Liquids Pipelines operations in 2023.
92 | TC Energy Management's discussion and analysis 2025
Interest expense1
| | | | | | | | | | | | | | | | |
year ended December 31 | | | | | | |
| (millions of $) | | | | 2024 | | 2023 |
| | | | | | |
| Interest expense included in comparable earnings from discontinued operations | | | | (176) | | | (287) | |
Specific items: | | | | | | |
| Liquids Pipelines business separation costs | | | | (42) | | | — | |
| Keystone regulatory decisions | | | | — | | | (10) | |
Interest expense from discontinued operations2 | | | | (218) | | | (297) | |
1 Represents nine months of Liquids Pipelines allocated interest expense in 2024 and a full year of allocated interest expense in 2023.
2 We have elected to allocate a portion of the interest expense incurred at the corporate level to discontinued operations. Refer to our 2024 Annual Report for
additional information.
Interest expense included in comparable earnings from discontinued operations decreased by $111 million in 2024 compared to 2023 due to nine months of interest expense included in 2024 compared to a full year in 2023.
Interest income and other1
| | | | | | | | | | | | | | | | |
year ended December 31 | | | | | | |
| (millions of $) | | | | 2024 | | 2023 |
| | | | | | |
Interest income and other included in comparable earnings from discontinued operations | | | | 3 | | 6 |
Specific items: | | | | | | |
| Liquids Pipelines business separation costs | | | | 18 | | | — | |
Milepost 14 insurance expense | | | | — | | | (36) | |
| Interest income and other from discontinued operations | | | | 21 | | | (30) | |
1 Represents nine months of Liquids Pipelines earnings in 2024 and a full year of earnings in 2023.
Interest income and other included in comparable earnings from discontinued operations was generally consistent 2024 compared to 2023.
Income tax (expense) recovery1
| | | | | | | | | | | | | | | | |
year ended December 31 | | | | | | |
| (millions of $) | | | | 2024 | | 2023 |
| | | | | | |
Income tax (expense) recovery included in comparable earnings from discontinued operations | | | | (154) | | | (147) | |
Specific items: | | | | | | |
| Liquids Pipelines business separation costs | | | | 30 | | | 6 | |
| Milepost 14 incremental costs | | | | 9 | | | — | |
| Keystone XL asset impairment charge and other | | | | 5 | | | 14 | |
| Keystone regulatory decisions | | | | 2 | | | 15 | |
| Keystone XL preservation and other | | | | — | | | 4 | |
| Risk management activities | | | | (16) | | | 8 | |
| Income tax (expense) recovery from discontinued operations | | | | (124) | | | (100) | |
1 Represents nine months of Liquids Pipelines earnings in 2024 and a full year of earnings in 2023.
Income tax expense included in comparable earnings from discontinued operations increased by $7 million in 2024 compared to 2023 primarily due to lower foreign income tax rate differentials largely offset by lower earnings.
TC Energy Management's discussion and analysis 2025 | 93
Other information
RISK OVERSIGHT AND ENTERPRISE RISK MANAGEMENT
Risk management is embedded in all activities at TC Energy and is integral to the successful operation of our business. Our strategy ensures that risks and related exposures are aligned with our business objectives and risk tolerances. We achieve this through a centralized Enterprise Risk Management (ERM) program, which systematically identifies and assesses risks that could materially impact our strategic objectives.
The ERM program addresses risks related to executing our business strategies and supports practices for identifying and monitoring emerging risks. Specifically, the ERM framework offers a comprehensive process for risk identification, analysis, evaluation and mitigation. It also ensures ongoing monitoring and reporting to the Board of Directors, CEO, Executive Vice-Presidents and the Chief Risk Officer.
Board and Committee Oversight
Our Board of Directors retains general oversight over all enterprise risks. Annually, the Board reviews the enterprise risk register and receives quarterly updates on emerging risks and their management and mitigation in accordance with TC Energy’s risk appetite and tolerances. Additionally, the Board receives detailed presentations on enterprise risks quarterly, with specific themes addressed during regular financial updates and strategic meetings. Special presentations are also delivered as needed or upon request.
The Governance Committee of our Board oversees the ERM program, ensuring comprehensive oversight of our risk management activities. In addition, other Board committees oversee specific risk types within their mandates:
•the Human Resources Committee oversees executive resourcing, organizational capabilities and compensation risk to ensure human and labour policies and remuneration practices align with our overall business strategy
•the HSSE Committee oversees operational, major project execution, health, safety, sustainability and environmental risks, including climate-related risks
•the Audit Committee oversees management's role in mitigating financial risk, including market risk, insurance risk, counterparty credit risk and cybersecurity risk.
Executive Leadership and Risk Management
Our Executive Leadership team is responsible for developing and implementing risk management plans and actions, with effective risk management reflected in their compensation. Each identified enterprise risk has a governance owner from the executive leadership team. Risk execution is overseen by an accountable business unit President or Senior Vice-President. These risk owners provide in-depth risk reviews to the Board annually.
Segment-Specific Risks
Key segment-specific financial, health, safety and environment-related risks are covered in their respective sections of this MD&A. Further, our Report on Sustainability provides information on our approach to sustainability, including the oversight of sustainability-related risks and opportunities.
Enterprise Risk Monitoring and Key Risk Indicators
Risks related to our key enterprise risk themes are continuously monitored through our ERM program. The program includes a network of emerging risk liaisons strategically positioned across the organization, responsible for identifying potential enterprise-level risks and reporting them quarterly to the Board of Directors.
Additionally, as part of our ongoing commitment to enhancing the ERM program, we employ Key Risk and Performance Indicators (KRIs) to monitor risk events that could impact our strategic objectives. These KRIs provide quantifiable metrics, objective rationale and meaningful trends for each enterprise risk, helping to inform the annual in-depth review of enterprise risks conducted by the Board.
94 | TC Energy Management's discussion and analysis 2025
Operational risk
Across North America, TC Energy manages a vast natural gas transmission network that includes numerous facilities, gas storage reservoirs and power-generation plants. Operational risks include the potential for significant ruptures or failures, especially in regions where pipelines traverse populated areas. Key factors contributing to these risks include integrity threats such as corrosion, cracking and manufacturing defects and third-party damage. Additionally, aging infrastructure and the potential for extreme weather conditions and other external forces further increase the likelihood of significant ruptures or operational failures.
The consequences of a significant rupture or operational failure can be severe and multifaceted. Potential impacts include loss of human life or severe injuries, environmental damage and extensive operational disruptions. Financial repercussions are also considerable, encompassing costs related to incident response, repairs, fines and penalties. Furthermore, such incidents can lead to incremental regulatory enforcement and reputational harm, which may strain customer relationships and jeopardize future projects.
To ensure the safe and reliable operation of its assets, TC Energy employs a robust Operational Management System, TOMS, that integrates comprehensive risk management and asset integrity practices. Current measures include a quantitative operational risk assessment process, integrity management programs and advanced inline inspection technologies. We also conduct failure investigations and root cause analyses to drive continuous improvement. Governance and oversight by senior management, along with an Emergency Management Program, ensure preparedness and effective response to potential incidents. TOMS standards, processes and procedures are continually improved based on lessons learned from internal and external incidents, as well as collaborative work with industry peers and regulators.
Regulatory risk
TC Energy operates in a highly regulated industry across North America, requiring various permits and approvals from federal, state, provincial and local government agencies. The regulatory landscape is highly complex, with overlapping and sometimes conflicting requirements from various levels of government. Changes in government can further introduce uncertainty and delays in obtaining necessary permits. Additionally, opposition groups can influence regulatory decisions through organized protests, legal challenges and negative media campaigns.
Failure to obtain or maintain regulatory approvals for energy infrastructure projects can lead to substantial financial and operational consequences. These include delays or cancellations of critical projects, increased operating costs due to additional compliance requirements and disruptions to existing infrastructure. Financial impacts also encompass lost development costs, reduced investor confidence and higher capital costs. Moreover, negative publicity and public opposition can damage our reputation, erode public trust and hinder our ability to operate effectively. These challenges can ultimately affect our competitive position and ability to meet growth objectives.
To address this risk, we have implemented several monitoring and mitigation strategies. These include proactive efforts to monitor the evolving regulatory environment, engage in strategic advocacy across all levels of government, cultivate enduring trust and alignment with stakeholders and respond promptly to emerging issues and concerns. These activities are designed to secure necessary approvals to support our growth objectives and mitigate potential delays and disruptions.
Access to capital at a competitive cost
We require significant capital in the form of debt and equity to finance our growth projects and manage maturing debt obligations. It is essential that we secure this capital at costs lower than the returns on our investments. Deterioration in market conditions, changes in investor and lender sentiment, geopolitical instability, higher interest rates and persistent inflation could adversely affect our access to and cost of capital. Additionally, factors such as investor ESG exclusionary screening, capacity limitations in capital markets and economic uncertainties can further compound these risks, potentially leading to higher borrowing costs and constrained growth.
A higher cost of capital can negatively impact our ability to deliver attractive returns on investments and inhibit both
short- and long-term growth. This could adversely affect our earnings and undermine the viability of capital projects. Additionally, higher costs can negatively impact investor confidence, the reported value of assets and liabilities and our overall financial performance.
TC Energy Management's discussion and analysis 2025 | 95
TC Energy employs a comprehensive strategy to monitor and mitigate these risks. Current mitigations include maintaining a high-quality and diversified banking syndicate, proactive engagement with lenders and credit rating agencies and balancing issuance strategies across multiple capital markets. We also actively manage our foreign exchange risk through hedging strategies and maintain a balanced debt portfolio to manage interest rate exposure. Ongoing mitigations involve developing new lending relationships and enhancing engagement with ESG-focused investors. Additionally, TC Energy continuously monitors government policies and industry developments to proactively address potential influences on capital flows.
Capital allocation
To remain competitive, TC Energy must provide essential energy infrastructure services in both supply and demand areas, offering solutions that appeal to our customers, while maintaining alignment with our strategic objectives. Capital allocation challenges include balancing investments to defend our existing footprint and service our customer base, investing in the highest-return, lowest-risk opportunities within our discretionary annual net capital limit and shaping the capital program to optimally utilize available capital.
Inefficient capital allocation can lead to the misallocation of financial resources to projects that do not align with our strategic objectives, increase exposure to high-risk projects and reduce financial performance. Additionally, failure to adapt to changing energy supply and demand fundamentals, including those related to lower-carbon forms of energy, may result in reputational damage, regulatory risks and the potential for stranded assets. Diversifying capital into emerging or alternative energy businesses before technologies, commercial models, and regulatory frameworks have matured also poses risk. Overall, these risks can cause strategic misalignment and diminish shareholder value.
We have a rigorous governance process to maintain capital allocation discipline. We limit annual net capital expenditures and high-grade our project development pipeline for purposes of pursuing lower risk and higher value opportunities. We also conduct analyses to confirm the resilience of the supply and demand markets we serve as part of our strategic reviews and regularly monitor industry trends and regulatory developments. Continuous improvements to the capital allocation process include enhanced investment review and due diligence, as well as conducting long-term scenario analyses to understand the portfolio effects of capital allocation choices.
Capital recovery risk
Capital recovery risk pertains to the challenge of both earning an acceptable return on invested capital and recovering the initial investment. This risk arises from potential misalignment between deal structures and our risk preferences, leading to capital exposure. Key contributors include inadequate risk assessments, difficulties in stakeholder collaboration, unforeseen changes in project scope or environment, financial constraints, macroeconomic volatility, counterparty risk, regulatory risk and evolving public policy. Collectively, these factors threaten our financial stability and strategic objectives.
The inability to recover a return on capital can lead to unexpected capital expenditures, significant financial losses and reduced returns. It can erode trust and credibility with partners, investors, regulators and other key stakeholders. Additionally, poorly structured deals may divert management’s focus from core business activities to address arising issues, further impacting operational efficiency. The broader consequences include potential damage to our reputation and investor confidence, which are crucial for sustaining long-term growth and stability and preserving shareholder value.
TC Energy employs a robust due diligence process that includes comprehensive risk assessments and detailed contract negotiations. Continuous monitoring of risk exposures and mitigation measures is conducted throughout the lifecycle of each deal, high-grading our project development pipeline to the lowest-risk, highest-value opportunities. Proactive engagement with counterparties and strategic partnerships helps manage and share risks effectively. Depreciation is recovered through regulated pipeline rates, allowing us to accelerate or decelerate the return of capital from our assets. Additionally, we leverage our diversified asset base and long-term contracts to stabilize cash flows and reduce exposure to market volatility.
96 | TC Energy Management's discussion and analysis 2025
Project execution
Investing in large infrastructure projects requires significant capital commitments and carries considerable project execution risks. Potential shortages of skilled labour and expertise, supply chain lead times and disruptions and increasing project and regulatory complexity are among these risks. Collectively, these factors can lead to cost overruns, schedule delays, suboptimal project performance and increased safety vulnerabilities, ultimately impacting our financial performance, reputation and strategic growth.
Failure to effectively manage these risks can result in significant financial and operational consequences. Cost overruns and schedule delays can undermine the profitability and feasibility of projects, leading to increased contractual claims and disputes. Additionally, inadequate project execution can damage our reputation, reduce investor confidence and hinder future growth opportunities.
To help mitigate these risks, our Project Delivery System is integrated with our capital allocation process and is aligned with TOMS, optimizing project execution for safe, timely and on-budget performance. We develop projects to a sufficient maturity level to fully understand scope, cost, schedule and execution risk prior to sanctioning. This approach enables us to identify and consult stakeholders and proactively address project-specific constraints and risks. Commercial contracts are structured to recover development costs and minimize the impact of potential cost overruns, explicitly sharing execution risk where warranted. Additionally, we leverage project financing and partner involvement to manage capital at risk.
Talent risk
TC Energy's success hinges on attracting, retaining and developing a talented workforce with a deep understanding of the energy industry, geopolitical environment and various regulatory regimes across North America. Key talent-related risks include the loss of critical personnel, difficulties in securing and retaining talent in a highly competitive market and health and wellness issues that could impact workforce productivity.
Failure to manage talent-related risk can lead to several adverse outcomes, including a decline in employee morale and engagement, resulting in reduced productivity, efficiency and quality of work. High resignation rates, particularly among top talent, can disrupt operations and continuity, leading to increased recruitment and training costs. The organization may also face reputational damage if perceived as failing to address employee concerns, impacting its ability to attract and retain future talent. Furthermore, operational disruptions and a disengaged workforce can pose health and safety risks, ultimately affecting our overall performance and strategic execution.
To mitigate these risks, TC Energy employs a comprehensive talent risk management framework to assess needs and prioritize initiatives. We focus on employee development, engagement and well-being to foster a positive work environment and retain top talent. Our competitive approach to pay for performance promotes fairness and transparency in compensation practices, while our succession planning process ensures a steady pipeline of talented individuals are prepared to assume critical roles. Regular employee engagement surveys help us translate employee input into meaningful action and improvements. Additionally, we have integrated inclusion and equal opportunity initiatives into our talent management strategies and implemented a hybrid work schedule to offer greater flexibility. Collectively, this approach promotes employee retention, minimizes the impact of potential talent losses and guides targeted development actions.
Enterprise security
Ensuring the security of our stakeholders, staff and our assets is paramount to maintaining the safety and reliability of our operations. Security risks encompass potential cyberattacks on industrial control systems and corporate digital assets, unauthorized data disclosures and physical attacks on our infrastructure. These risks are heightened by the increasing sophistication of cyber tactics, rising geopolitical tensions and the critical nature of our business.
A security incident can result in the misuse or disruption of critical information and functions, cause damage to our assets and potentially lead to safety and/or environmental incidents. Resulting service interruptions may have cascading effects on supply chains, customer relationships and strategic goals. Additionally, such incidents can harm our reputation and trigger regulatory enforcement actions or litigation, negatively impacting our operations and/or financial position.
TC Energy Management's discussion and analysis 2025 | 97
TC Energy maintains an enterprise security program that encompasses both cyber and physical security. Our program is based on standards, assurance and risk management combining prevention and mitigation activities. Our preventative efforts include deploying advanced security technology, defining secure processes, implementing enhanced security measures for high-risk staff or facilities and delivering cyber and physical security awareness programs. Our mitigative activities include proactive monitoring and response to potential security incidents. We also maintain and regularly test incident response plans to manage and mitigate the impact of potential security incidents, including cyberattacks. To further mitigate potential risks, we maintain insurance coverage against cyber and physical security incidents. To mitigate risks associated with third-party vendors and suppliers, we conduct vendor risk assessments, which includes evaluations of security standards, contractual safeguards and ongoing monitoring.
We collaborate with government security agencies, law enforcement and industry to stay informed and be proactive on evolving threats. Our prevention and mitigation strategies for both cyber and physical security are regularly reviewed and updated to align with regulatory and industry standards. The status of our enterprise security program is reported to the Audit Committee quarterly.
TC Energy remains committed to continually improving our security posture and adapting to the ever-evolving threat landscape. By prioritizing security and investing in technologies and practices, we strive to protect our stakeholders, staff, assets, operations and ensure the long-term sustainability of our business.
Climate-related risks
Our business, operations, financial condition and performance may be impacted by both the physical risks associated with climate change and the transition risks arising from the global transition to a lower-carbon economy. Climate-related risks, including changes to climate policy and related developments, may intersect with and influence the enterprise risks outlined above. Therefore, these risks are systematically considered and assessed as part of our risk management framework.
We periodically conduct climate scenario analysis to support our strategic planning and risk management processes. This allows us to assess the resiliency of our business strategy and strengthen our understanding of potential climate-related risks and opportunities across various energy transition pathways. We do not assign probabilities to these scenarios, nor do we consider them to be forecasts or expected outcomes.
Physical Risks
Physical climate hazards caused by climate change can be either event-driven (acute), with immediate, severe impacts, or gradual (chronic), resulting from persistent, long-term shifts in climate patterns. The frequency and severity of climate hazards, particularly acute weather events, are difficult to predict. Climate hazards vary greatly across different geographical regions depending on weather patterns, topography and proximity to bodies of water. Many of our natural gas pipeline assets are underground, inherently reducing the exposure to certain types of climate hazards. Exposure to physical climate hazards could have significant financial implications, such as unexpected costs resulting from direct damage to our assets, additional costs for preventative measures, loss of revenues due to business interruption, or indirect effects such as value chain disruption.
If our exposure to climate hazards intensifies, we can implement preventative measures to enhance the resilience of our assets, tailoring these measures to the nature of the hazard and the characteristics of each asset. Additionally, our emergency response plans focus on quickly and effectively responding to severe weather events to minimize impacts. As a further risk mitigation measure, we maintain insurance coverage to reduce the financial impact associated with damage to our assets due to extreme weather events. However, insurance does not cover all events in all circumstances and we may experience an increase in insurance premiums and deductibles, or a decrease in available coverage for our assets in areas subject to severe weather.
Transition Risks
Transition risks arise from the global shift toward a lower-carbon economy, and include policy, legal, technological, market and reputational risks. These risks may involve changes in energy supply and demand trajectories, the pace and reliability of technological advancements, changes in decarbonization policies and regulations and stakeholder perceptions of our role in the transition to a lower-carbon economy.
Financial implications could include asset impairments due to new or amended climate-related regulations, reduced demand for fossil fuels, challenges in permitting projects and limited access to and/or increased cost of capital. Our financial performance could also be impacted by shifting consumer demands, insolvency of our significant customers and the development and deployment of new technologies.
98 | TC Energy Management's discussion and analysis 2025
In the medium term, these risks would be partially mitigated through our low-risk business model, whereby much of our earnings are underpinned by regulated cost-of-service arrangements and/or long-term contracts with credit-worthy counterparties. Regulators also often permit accelerated depreciation of regulated assets, allowing faster recovery of asset value and helping offset potential terminal value risk if climate policies shorten asset life.
A shift to a lower-carbon economy could also present substantial investment opportunities in emerging energy markets and technologies. Our existing capabilities in lower-carbon energy generation, including nuclear power and energy storage technologies, could enable us to capitalize on new lower-carbon energy opportunities. Our pipeline network across North America also provides an extensive footprint of linear infrastructure that could be leveraged to transport emerging clean fuels like hydrogen and renewable natural gas, as well as to facilitate the transportation of captured carbon emissions for sequestration.
Additional information on our climate strategy and climate-related risks and opportunities can be found in the climate-related disclosures section of our annual Report on Sustainability.
TC Energy Management's discussion and analysis 2025 | 99
Health, safety, sustainability and environmental matters
The Board's HSSE Committee oversees operational risk, major project execution risk, occupational and process safety, sustainability, security of personnel, environmental and climate change-related risks, as well as monitoring development and implementation of systems, programs and policies relating to HSSE matters through regular reporting from management. We use an integrated management system that establishes a framework for managing these risks and is used to capture, organize, document, monitor and improve our related policies, standards and procedures.
TC Energy's Operational Management System, TOMS, leverages industry best practices and standards and incorporates applicable regulatory requirements. TOMS governs health, safety, environment and operational integrity matters at TC Energy. It is applicable across Canada, the U.S. and Mexico throughout the lifecycle of our assets and employs a continuous improvement cycle. The TOMS framework leverages continuous improvement through an annual management review process. This ensures the ongoing effectiveness of our overarching management system and supports a tiered assurance structure across all business units. The TC Energy assurance model is designed to provide effective management of health, safety, environmental and operational integrity risks. Lessons learned are consistently shared and applied across our system where applicable. Additionally, any findings or insights from periodic audits conducted by our external regulators are also shared across the elements of our management system to ensure continuous improvement.
The HSSE Committee reviews performance and operational risk management. It receives updates and reports on:
•overall HSSE corporate governance
•operational performance
•asset integrity
•significant occupational safety and process safety incidents
•occupational and process safety performance metrics
•occupational health, safety and industrial hygiene, which includes physical and mental health, as well as psychological safety
•emergency preparedness, incident response and evaluation
•environment, including biodiversity and land reclamation
•developments in and compliance with, applicable legislation and regulations, including those related to climate and the environment
•prevention, mitigation and management of risks related to HSSE matters, including climate policy or business interruption risks, such as pandemics, which may adversely impact TC Energy
•sustainability matters, including social, environmental and climate-related risks and opportunities, as well as related non-regulatory public disclosures such as our annual Report on Sustainability, our Reconciliation Action Plan and updates on the progression of our commitments.
There are two separate committees that report to the Board HSSE Committee:
•a Sustainability Management Committee, comprised of senior leaders and heads of business units from across the company, that provides strategic direction on sustainability-related matters and fosters cross-functional collaboration across the organization
•Safety and TOMS Advisory Committee (STAC), comprised of senior project and operations leaders, oversees governance and decision-making for TOMS and safety initiatives, while assuming an enterprise-wide role to oversee and guide health, safety, environment and operational integrity. In 2025, governance accountability transitioned from the Operating Committee to the relevant business leadership teams, business unit-specific operating committees and STAC.
100 | TC Energy Management's discussion and analysis 2025
Health, safety and asset integrity
The safety of our employees, contractors and the public, the integrity of our pipelines and our power and energy solutions infrastructure, are a top priority. All assets are designed, constructed, commissioned, operated and maintained with full consideration given to safety and integrity and are placed in service only after all necessary requirements, both regulatory and internal, have been satisfied.
In 2025, we spent approximately $2.0 billion (2024 – $2.0 billion) for pipeline integrity on the natural gas pipelines we operate, which includes expenditures related to our modernization program within our U.S. Natural Gas Pipelines business. Pipeline integrity spending will fluctuate based on the results of on-going risk assessments conducted on our pipeline systems and evaluations of information obtained from recent inspections, incidents and maintenance activities.
Under the approved regulatory models in Canada, non-capital pipeline integrity expenditures on CER-regulated natural gas pipelines are generally treated on a flow-through basis and, as a result, fluctuations in these expenditures generally have no impact on our earnings. Non-capital pipeline integrity expenditures on our U.S. natural gas pipelines are primarily treated as operations and maintenance expenditures and are typically recoverable through tolls approved by FERC. Under regulatory rules in Mexico, non-capital pipeline integrity expenditures and those under lease accounting are treated primarily as operating and maintenance expenses and are generally recovered through our tolls.
Spending associated with process safety and integrity is used to minimize risk to employees, contractors, the public, equipment and the surrounding environment and also prevent disruptions to serving the energy needs of our customers.
As described in the Risk oversight and enterprise risk management section above, we have a set of procedures in place to manage our response to natural disasters, which include catastrophic events such as forest fires, tornadoes, earthquakes, floods, volcanic eruptions and hurricanes. The procedures, which are included in our Emergency, Business Continuity and Security element of TOMS, are designed to help protect the health and safety of our employees and contractors, minimize risk to the public and limit the potential for adverse effects on the environment. We are committed to protecting the health and safety of all individuals involved in our activities. Occupational health, safety and industrial hygiene provides comprehensive strategies for health promotion and protection. We are committed to delivering effective programs that:
•reduce the human and financial impact of illness and injury
•ensure fitness for work
•strengthen worker resiliency
•build organizational capacity by focusing on individual wellbeing, health education, leader support and improved working conditions to sustain a productive workforce
•increase mental wellbeing awareness, provide various health and wellness supports and training to employees and leaders, measure the success of programs and improve psychological safety
•foster a strong safety culture by building human and organizational performance to strengthen our cultural defenses and develop error-tolerant systems to better protect our people.
Environmental risk, compliance and liabilities
Through the implementation of TOMS, TC Energy proactively and systematically manages environmental hazards and risks throughout the lifecycle of our assets. Project plans are communicated with stakeholders and Indigenous communities, as applicable and engagement with these groups informs the environmental assessments and protection plans. Project environmental assessments include field studies that examine existing natural resources, biodiversity and land use along our proposed project footprint, such as vegetation, soils, wildlife, water resources, wetland and protected areas. We consider the information collected during environmental assessments and where sensitive habitats or areas of high biodiversity value are identified, we apply the biodiversity mitigation hierarchy and avoid those areas, as practicable. Where those areas cannot be avoided, we minimize our disturbance, restore and reclaim the disturbed area and provide offsets where required. To conserve and protect the environment during construction, information gathered for an environmental impact assessment is used to develop project-specific environmental protection plans. Whenever the potential exists for a proposed facility or pipeline to interact with water resources, we conduct evaluations to understand the full nature and extent of the interactions. When we temporarily use water to test the integrity of our pipelines, we adhere to strict regulatory requirements and ensure water meets applicable water quality standards before it is discharged or disposed of and when our construction activities involve crossing waterbodies, we implement protection measures to avoid or minimize potential adverse effects.
TC Energy Management's discussion and analysis 2025 | 101
Our primary sources of risk related to the environment include:
•evolving regulations and compliance requirements, alongside rising costs associated with environmental impacts
•product releases with potential environmental impact
•use, storage and disposal of chemicals and hazardous materials
•natural disasters and other catastrophic events, including those related to climate change, which may impact our operations.
Our assets are subject to federal, state, provincial and local environmental statutes and regulations governing environmental protection, including air and GHG emissions, water quality, species at risk, wastewater discharges and waste management. Operating our assets requires obtaining and complying with a wide variety of environmental registrations, licenses, permits and other approvals and requirements. Failure to comply could result in administrative, civil or criminal penalties, remedial requirements, or orders affecting future operations.
TOMS includes requirements for us to continually monitor our facilities for compliance with all material legal and regulatory environmental requirements across all jurisdictions where we operate. We also comply with all material legal and regulatory permitting requirements in our project routing and development. We routinely monitor proposed changes to environmental policy, legislation and regulation. Where the risks are uncertain or have the potential to affect our ability to effectively operate our business, we comment on proposals independently or through industry associations.
We are not aware of any material outstanding orders, claims or lawsuits against us related to releasing or discharging any material into the environment.
Compliance obligations can result in significant costs associated with installing and maintaining pollution controls, fines and penalties resulting from any failure to comply and potential limitations on operations. Remediation obligations can result in significant costs associated with the investigation and remediation of contaminated properties and with damage claims arising from the contamination of properties.
The timing and complete extent of future expenditures related to environmental matters is difficult to estimate
accurately because:
•environmental laws and regulations and their interpretations and enforcement change
•new claims can be brought against our existing or discontinued assets
•our pollution control and clean-up cost estimates may change, especially when our current estimates are based on preliminary site investigations or agreements
•new contaminated sites may be found or what we know about existing sites could change
•where there is potentially more than one responsible party involved in litigation, we cannot estimate our joint and several liability with certainty.
At December 31, 2025, accruals related to these obligations totaled $6 million (2024 – $8 million) representing the estimated amount we will need to manage our currently known material environmental liabilities. We believe we have considered all necessary contingencies and established appropriate reserves for environmental liabilities; however, a risk exists that unforeseen matters may arise requiring us to set aside additional amounts. We adjust reserves regularly to account for changes in liabilities.
Climate policy and related regulation
We own assets and have business interests in a number of regions subject to GHG emissions regulations, including GHG emissions management and carbon pricing policies. In 2025, we incurred $194 million (2024 – $141 million) of expenses under existing carbon pricing programs. Across North America, there are a variety of new and evolving climate policy developments at the federal, regional, state and provincial levels. We actively monitor, participate in the regulatory review process as appropriate and submit formal comments to regulators as initiatives are undertaken and as policies are implemented. We support transparent, investment-conducive climate policies that promote environmentally and economically responsible natural resource development through market-driven and economically efficient outcomes. Our assets in certain geographies are currently subject to GHG regulations. While near-term government policy objectives may influence the pace of GHG regulations, we expect that the number of our assets subject to GHG regulations will continue to increase over time and across our footprint. Changes in regulations may often result in higher operating costs, other expenses or capital expenditures, which are generally recoverable through established cost-recovery mechanisms.
102 | TC Energy Management's discussion and analysis 2025
Jurisdictional policies
This section describes the most relevant existing and emerging policies affecting our business, emphasizing legislative and regulatory impacts.
In the U.S., we have seen significant policy shifts under the current administration. In January 2025, several Executive Orders directed agency heads to use all available legal authority to enhance U.S. energy production, transportation and consumption, and to focus on energy production and utilization (“energy dominance”). Additionally, in March 2025, the U.S. Environmental Protection Agency (USEPA) outlined a list of plans, including changes to some USEPA programs, and the intent for administrative reconsideration of many rules promulgated under the previous administration that have now started to advance through the regulatory process. Substantial uncertainty exists with respect to future implementation of these rules and the scope of the USEPA’s jurisdiction more generally. Depending upon the outcome of certain rulemakings and associated litigation challenging new rules, TC Energy could face increased project delays. We continue to monitor these potential regulatory changes to determine our compliance obligations and potential costs.
Existing policies
•Carbon pricing policies (multi-jurisdictional): While carbon pricing exists in several jurisdictions where we operate, its applicability to our assets and associated compliance costs vary substantially. Carbon pricing policies with significant impact on our business include the following:
◦Canada – Alberta’s Technology Innovation and Emissions Reduction (TIER) program represents our largest compliance costs in Canada. For our regulated Canadian natural gas pipelines within the province, we recover these costs through tolls. For our Power and Energy Solutions assets, we recover a portion of these costs through market pricing and hedging activities
◦U.S. – certain GTN compressor facilities are subject to the Washington Cap-and-Invest Program. GTN’s compliance costs are driven by total facility emissions, and GTN is authorized to recover these costs through its rates over time
•Clean Electricity Regulations (Canada): In 2024, Environment and Climate Change Canada (ECCC) published the final Clean Electricity Regulations (CERs) to transition Canada’s electricity system to net-zero electricity by 2050. The CERs mandate an annual GHG emissions limit based on 65 tonnes CO2/GWh for fossil fuel power generation units with a capacity of 25 MW or more starting in 2035 and zero tonnes CO2/GWh in 2050. Concerns persist on the CERs’ potential effect on energy affordability and reliability in certain provinces given the regulations limited compliance flexibilities. We continue to evaluate the operational and financial impact on TC Energy cogeneration plants. The Canada-Alberta Memorandum of Understanding (MOU), signed in November 2025, signals the CERs would be suspended in Alberta pending a new carbon pricing agreement. If a regulatory exemption is reached for the province, this would remove the requirement to comply with the CERs for most of TC Energy’s cogeneration facilities
•Endangerment Finding (U.S.): In July 2025, the USEPA released a proposal to rescind the 2009 Endangerment Finding (the Finding), which found that GHG emissions pose a threat to public health and welfare. The Finding has been the basis for subsequent GHG regulations. While rescinding the Finding would not automatically invalidate existing GHG regulations for the oil and gas sector, the USEPA has indicated that it plans to separately review related current standards. TC Energy has consistently complied with various regulations stemming from the Finding. We continue to monitor the USEPA’s proposed regulatory changes; however, the impacts of these proposed changes cannot be determined at this time
•Greenhouse Gas Reporting Program (GHGRP) (U.S.): In 2024, the USEPA finalized changes to the GHGRP for how oil and gas sources tally and report their methane emissions (Subpart W). These changes add new reporting sources, modify calculation and reporting methodologies, and drive more granular data collection. Subsequently, in September 2025, USEPA issued a draft rule that announced it found no obligation under the Clean Air Act to collect GHG data and no statutory benefit. In the proposal, USEPA proposes to eliminate reporting obligations for all GHGRP subparts, except Subpart W (non-combustion GHG emissions from the Petroleum & Natural Gas Systems), which would be suspended until the Reporting Year 2034. The potential elimination or significant overhaul of the GHGRP could potentially have indirect implications for state-level reporting frameworks, voluntary industry reporting and compliance strategies and overall transparency of emissions data. Certain states may elect to implement GHG reporting programs in the absence of a federal framework, which could increase administrative burden and complicate cross-jurisdictional reporting for our industry. TC Energy supported industry group comments advocating for retention of the GHGRP. Additionally, in November 2024, USEPA finalized its rule to implement the Inflation Reduction Act’s Waste Emission Charge, which would apply a fee to certain oil and gas facilities that report methane emissions of more than 25,000 metric tons of carbon dioxide equivalent per year to the GHGRP. However, in March 2025, Congress prohibited USEPA from collecting the Waste Emissions Charge until 2034. As a result of the pending changes to the GHGRP, substantial uncertainty exists with respect to future implementation of the Waste Emissions Charge
TC Energy Management's discussion and analysis 2025 | 103
•Good Neighbor Rule (U.S.): The USEPA “Good Neighbor Rule” (the Rule) as finalized in March 2023, set new limits for emissions of nitrogen oxides (NOx) from reciprocating internal combustion engines by May 2026. The Rule was stayed in its entirety by the U.S. Supreme Court in June 2024 pending a complete review by the U.S. Circuit Court of Appeals for the D.C. Circuit (the “D.C. Circuit Court”). In March 2025, the USEPA Administrator announced the intention to reconsider numerous pending, proposed and final rules and policies, including “ending” the Rule. The USEPA subsequently stated it plans to reconsider the Rule and conduct a new rulemaking process in 2026. As a result, the D.C. Circuit has placed the litigation challenging the existing Rule in abeyance to allow the USEPA to reconsider and propose the new rule. On January 28, 2026, the USEPA announced the first of a two-step plan to reconsider the Rule, issuing a proposal to reverse prior State Implementation Plan disapprovals in the eight states that were subject to the Rule. If finalized as proposed, the Rule would no longer apply in several states where TC Energy operates assets subject to the Rule. The USEPA indicated that it will take secondary action in the near term to address the states that remain subject to the Rule. We continue to monitor and assess the USEPA’s proposed regulatory changes
•Methane-specific regulations (multi-jurisdictional): In all three countries where TC Energy operates, there are regulations to reduce methane emissions from the oil and gas industry. Though requirements vary by jurisdiction, they generally focus on eliminating fugitive emissions through leak detection and repair programs and reducing vented emissions from equipment. The regulations in each country is discussed below:
◦Canada – The ECCC Regulations Respecting Reduction in the Release of Methane and Certain Volatile Organic Compounds took effect in 2020 and aimed to reduce the oil and gas sector’s methane emission by 40 to 45 per cent below 2012 levels by 2025. Several provinces enacted their own methane regulations that took the place of the federal regulations for provincially regulated assets through equivalency agreements. Our Canadian natural gas pipeline assets are subject to either the federal or British Columbia requirements, while our Alberta natural gas storage assets are subject to the Alberta requirements. In December 2025, ECCC published amendments to strengthen these regulations. This is part of Canada’s newest commitment to reduce the oil and gas sector methane emissions by at least 75 per cent below 2012 levels by 2030. The amendments introduce a risk-based approach for the detection and repair of fugitive emissions, prohibit all venting with specific exceptions, and offer an alternative performance-based approach using continuous monitoring. The amendments take effect on January 1, 2028, with phased requirements through 2030. While our Canadian natural gas pipeline assets have a mature leak detection and repair program and vent management approach to meet current regulations, compliance with these amendments will impose additional costs to our operations. We will continue to refine our internal emissions management strategies and update our compliance plans for our Canadian natural gas pipeline assets to align with the regulatory changes
◦U.S. – In 2023, the USEPA finalized a rule that amended and supplemented the New Source Performance Standards – Subpart OOOO series of volatile organic compound and methane emissions regulations for the oil and natural gas industry. The rule, collectively referred to as the “Methane Rule,” set performance standards for new, modified, or reconstructed sources after December 6, 2022 (OOOOb) and established emission guidelines (EGs) for existing sources prior to December 6, 2022 (OOOOc). Affected U.S. natural gas compressor stations would be required to comply with the Methane Rule, and the costs of compliance are anticipated to be incorporated into new and modified facilities moving forward. The OOOOc standards would apply to a larger number of existing facilities, but impacts will be subject to the requirements of state EG proposals and actual compliance deadlines, which will vary based on state and/or location and have not yet been issued. In July 2025, USEPA issued an interim final rule (IFR) that extends several compliance deadlines under both OOOOb and OOOOc. The IFR also indicates that the USEPA may introduce further substantive changes to the Methane Rule through a separate reconsideration process. These extensions give operators and states more practical timelines for associated implementation and planning but also provide USEPA with time to proceed with announced plans for reconsideration of the Methane Rule. Certain states, such as New York, Pennsylvania, Maryland and California, have independently enacted their own methane emissions regulations. TC Energy is closely monitoring these developments as applicable to our business
◦Mexico – In 2018, the Agencia de Seguridad, Energía y Ambiente (ASEA) released the Guidelines for the Prevention and Control of Methane Emissions from the Hydrocarbon Sector to reduce the sector’s methane emissions by 40 to 45 per cent by 2025. Per the guidelines’ requirements, TC Energy developed and has implemented a Program for the Comprehensive Prevention and Control of Methane Emissions (PPCIEM) for our Mexican facilities since 2020
104 | TC Energy Management's discussion and analysis 2025
•Onshore Natural Gas Pipelines Standard (Mexico): In September 2025, ASEA replaced NOM-007-ASEA-2016 with NOM-020-ASEA-2024 to regulate the design, construction, operation and maintenance of onshore natural gas transmission pipelines. The standard, which will take effect February 28, 2026, adds incremental requirements with respect to operations, maintenance, inspections, documentation and audits to renew and maintain permits. We are currently updating our pipeline design and construction processes accordingly. We do not anticipate this standard to have a material impact on our business in Mexico
•Sustainability-related disclosure requirements (multi-jurisdictional): Various sustainability disclosure requirements (including climate-related topics) are being issued in jurisdictions in which we operate. We continue to monitor these developments and progress our sustainability-related disclosures to reflect new and anticipated requirements. Our enterprise-wide sustainability-related disclosures, including a dedicated Climate-related disclosures section, can be found in our annual Report on Sustainability
◦U.S. – California's senate bill (SB) -253 and SB-261 require certain U.S. companies doing business in California to disclose their GHG emissions and climate-related financial risks, respectively. Entities within the scope of SB-261 must prepare a climate-related financial risk report by January 1, 2026; however, enforcement of SB-261 has been halted while litigation is ongoing in federal court. Applicability to TC Energy is under evaluation
◦Mexico – the Normas de Información de Sostenibilidad (NIS) requires the disclosure of 30 sustainability indicators across environmental, social and governance topics for fiscal years beginning on or after January 1, 2025. These requirements will apply to certain TC Energy Mexican entities as part of compliance with financial standards.
Anticipated policies
•Carbon Pricing (Canada): In December 2025, ECCC released a discussion paper on potential updates to strengthen the federal carbon pricing benchmark on industrial emissions, which sets the minimum requirements for provincial systems. In general, these systems require regulated facilities to reduce their emissions below an intensity baseline which leads to credit generation or compliance obligations. The proposed updates include changes to coverage and scope, certain compliance pathways and public reporting requirements. They are intended to ensure industrial carbon pricing systems are more consistent, efficient and effective across the country. TC Energy currently operates under several carbon pricing systems subject to the federal backstop. We will monitor these developments, evaluate potential impacts and engage with ECCC, as appropriate
•New Energy Policy Considerations (Mexico): In late 2025, Mexico published the New Energy Policy Considerations as part of its broader energy policy framework, which includes the Energy Sector Program 2025-2030 (PROSENER) and other official documents. The energy policy framework influences the country’s implementation of climate policies, long-term view of natural gas, and integration of social objectives. It also signals the development of additional regulations. PROSENER specifically proposes additional emission reductions (including methane) through greater energy efficiency, technological innovation, and the construction and modernization of new energy infrastructure. We will continue monitoring these policy developments and provide feedback to the respective government departments, as appropriate
•Oil and Gas Emissions Cap (Canada): In 2024, ECCC published the draft Oil and Gas Sector Greenhouse Gas Emissions Cap Regulations. The draft regulations introduce a cap-and-trade system as of 2030 to reduce GHG emissions from the oil and gas sector, covering upstream activities and LNG production. Although transmission pipelines are excluded from the draft regulations, there is a possibility of cascading effects and unintended consequences to our Canadian natural gas pipelines business. The draft regulations were set to be finalized in 2025, but under the Canada-Alberta MOU signed in November 2025, the Government of Canada has committed to not implementing them
•TIER Updates (Alberta, Canada): In December 2025, the Government of Alberta issued an Order in Council introducing an additional compliance pathway that will recognize certain on-site emissions reduction investments for up to 90 per cent of compliance obligations and allowing facilities that are below the regulatory emissions threshold and currently participate in the TIER emission program to opt-out of paying into the TIER fund or retire TIER compliance instruments. The Canada-Alberta MOU signed in November 2025 signals additional changes may be proposed to TIER's carbon price, price escalation, and performance benchmarks. Since these changes are likely to impact the carbon credit market, their effects may have different impacts on our Alberta-based Canadian natural gas pipelines and Power and Energy Solutions assets. We will continue to monitor and evaluate the operational and financial impacts as details of the new carbon pricing agreement with the Government of Canada are made available.
TC Energy Management's discussion and analysis 2025 | 105
Financial risks
We are exposed to various financial risks and have strategies, policies and limits in place to manage the impact of these risks on our earnings, cash flows and, ultimately, shareholder value.
Risk management strategies, policies and limits are designed to ensure our risks and related exposures are in line with our business objectives and risk tolerance. Our risks are managed within limits that are established by our Board of Directors, implemented by senior management and monitored by our risk management, internal audit and business segment groups. Our Board of Directors' Audit Committee oversees how management monitors compliance with risk management policies and procedures and oversees management's review of the adequacy of the risk management framework.
Market risk
We construct and invest in energy infrastructure projects, purchase and sell commodities, issue short- and long-term debt, including amounts in foreign currencies and invest in foreign operations. Certain of these activities expose us to market risk from changes in commodity prices, foreign exchange rates and interest rates, which may affect our earnings, cash flows and the value of our financial assets and liabilities. We assess contracts used to manage market risk to determine whether all, or a portion, meet the definition of a derivative.
Derivative contracts used to assist in managing exposure to market risk may include the following:
•forwards and futures contracts – agreements to purchase or sell a specific financial instrument or commodity at a specified price and date in the future
•swaps – agreements between two parties to exchange streams of payments over time according to specified terms
•options – agreements that convey the right, but not the obligation of the purchaser, to buy or sell a specific amount of a financial instrument or commodity at a fixed price, either at a fixed date or at any time within a specified period.
Commodity price risk
The following strategies may be used to manage our exposure to market risk resulting from commodity price risk management activities in our non-regulated businesses:
•in our natural gas marketing business, we enter into natural gas transportation and storage contracts, as well as natural gas purchase and sale agreements. We manage our exposure on these contracts using financial instruments and hedging activities to offset market price volatility
•in our power business, we manage the exposure to fluctuating commodity prices through long-term contracts and hedging activities including selling and purchasing electricity and natural gas in forward markets
•in our non-regulated natural gas storage business, our exposure to seasonal natural gas price spreads is managed with a portfolio of third-party storage capacity contracts and through offsetting purchases and sales of natural gas in forward markets to lock in future positive margins.
Lower natural gas or electricity prices could lead to reduced investment in the development, expansion and production of these commodities. A reduction in the demand for these commodities could negatively impact opportunities to expand our asset base and/or re-contract with our shippers and customers as contractual agreements expire.
Interest rate risk
We utilize both short- and long-term debt to finance our operations which exposes us to interest rate risk. We typically pay fixed rates of interest on our long-term debt and floating rates on short-term debt including our commercial paper programs and amounts drawn on our credit facilities. A small portion of our long-term debt bears interest at floating rates. In addition, we are exposed to interest rate risk on financial instruments and contractual obligations containing variable interest rate components. We actively manage our interest rate risk using interest rate derivatives.
106 | TC Energy Management's discussion and analysis 2025
Foreign exchange risk
Certain of our businesses generate all or most of their earnings in U.S. dollars and since we report our financial results in Canadian dollars, changes in the value of the U.S. dollar against the Canadian dollar directly affect our comparable EBITDA and may also impact comparable earnings.
A portion of our Mexico Natural Gas Pipelines' monetary assets and liabilities are peso-denominated, while our Mexico operations' financial results are denominated in U.S. dollars. Therefore, changes in the value of the Mexican peso against the U.S. dollar can affect our comparable earnings. In addition, foreign exchange gains or losses calculated for Mexico income tax purposes on the revaluation of U.S. dollar-denominated monetary assets and liabilities result in a peso-denominated income tax exposure for these entities, leading to fluctuations in Income (loss) from equity investments and Income tax expense (recovery) in the Consolidated statement of income.
We actively manage a portion of our foreign exchange risk using foreign exchange derivatives. Refer to the Foreign exchange section for additional information.
We hedge a portion of our net investment in foreign operations (on an after-tax basis) with U.S. dollar-denominated debt and cross-currency interest rate swaps as appropriate.
Counterparty credit risk
We have exposure to counterparty credit risk in a number of areas including:
•cash and cash equivalents
•accounts receivable
•available-for-sale assets
•fair value of derivative assets
•net investment in leases and certain contract assets in Mexico.
At times, our counterparties may endure financial challenges resulting from commodity price and market volatility, economic instability and political or regulatory changes. In addition to actively monitoring these situations, there are a number of factors that reduce our counterparty credit risk exposure in the event of default, including:
•contractual rights and remedies together with the utilization of contractually-based financial assurances
•current regulatory frameworks governing certain of our operations
•the competitive position of our assets and the demand for our services
•potential recovery of unpaid amounts through bankruptcy and similar proceedings.
We review financial assets carried at amortized cost for impairment using the lifetime expected loss of the financial asset at initial recognition and throughout the life of the financial asset. We use historical credit loss and recovery data, adjusted for our judgment regarding current economic and credit conditions, along with reasonable and supportable forecasts to determine if any impairment should be recognized in Plant operating costs and other. At December 31, 2025 and 2024, we had no significant credit risk concentrations, with the exception of the CFE, which represents approximately 33 per cent of gross exposure. Gross exposure is measured as the unmitigated full-term contract revenue exposure discounted in accordance with each contract’s discount rate, as applicable. At this time, there were no significant amounts past due or impaired. We recorded a pre-tax expense of $83 million for the year ended December 31, 2025 on the expected credit loss provision before tax recognized on TGNH net investment in leases and certain contract assets in Mexico (2024 – $22 million recovery). During 2025, we completed the Southeast Gateway pipeline and recognized a net investment in sales-type lease. Other than the expected credit loss provision noted above, we had no significant credit losses at December 31, 2025 and 2024. Refer to Note 27, Risk management and financial instruments, of our 2025 Consolidated financial statements for additional information.
We have significant credit and performance exposure to financial institutions that hold cash deposits and provide committed credit lines and letters of credit that help manage our exposure to counterparties and provide liquidity in commodity, foreign exchange and interest rate derivative markets. Our portfolio of financial sector exposure consists primarily of highly-rated investment grade, systemically important financial institutions.
TC Energy Management's discussion and analysis 2025 | 107
Liquidity risk
Liquidity risk is the risk that we will not be able to meet our financial obligations as they come due. We manage our liquidity risk by continuously forecasting our cash flows and ensuring we have adequate cash balances, cash flows from operations, committed and demand credit facilities and access to capital markets to meet our operating, financing and capital expenditure obligations under both normal and stressed economic conditions. Refer to the Financial Condition section for additional information.
Legal proceedings
TC Energy and its subsidiaries are subject to various legal proceedings, arbitrations and actions arising in the normal course of business. We assess all legal matters on an ongoing basis, including those of our equity investments to determine if they meet the requirements for disclosure or accrual of a contingent loss. Refer to Note 30, Commitments, contingencies and guarantees, of our 2025 Consolidated financial statements for additional information.
108 | TC Energy Management's discussion and analysis 2025
CONTROLS AND PROCEDURES
We meet Canadian and U.S. regulatory requirements for disclosure controls and procedures, internal control over financial reporting and related CEO and CFO certifications.
Disclosure controls and procedures
Under the supervision and with the participation of management, including our President and CEO and our CFO, we carried out quarterly evaluations of the effectiveness of our disclosure controls and procedures, including for the year ended December 31, 2025, as required by the Canadian securities regulatory authorities and by the SEC. Based on this evaluation, our President and CEO and our CFO have concluded that the disclosure controls and procedures are effective in that they are designed to ensure that the information we are required to disclose in reports we file with or send to securities regulatory authorities is recorded, processed, summarized and reported accurately within the time periods specified under Canadian and U.S. securities laws.
Management’s report on internal control over financial reporting
We are responsible for establishing and maintaining adequate internal control over financial reporting, which is a process designed by, or under the supervision of, our President and CEO and our CFO and effected by our Board of Directors, management and other personnel, to provide reasonable assurance regarding the reliability of financial reporting and the preparation of financial statements for external purposes in accordance with GAAP.
Under the supervision and with the participation of management, including our President and CEO and our CFO, an evaluation of the effectiveness of the internal control over financial reporting was conducted as of December 31, 2025, based on the criteria described in “Internal Control – Integrated Framework” issued in 2013 by the Committee of Sponsoring Organizations of the Treadway Commission. Based on this assessment, management determined that, as of December 31, 2025, the internal control over financial reporting was effective.
Our internal control over financial reporting as of December 31, 2025 has been audited by KPMG LLP, an independent registered public accounting firm, as stated in their attestation report which is included in our 2025 Consolidated financial statements.
CEO and CFO certifications
Our President and CEO and our CFO have attested to the quality of the public disclosure in our fiscal 2025 reports filed with Canadian securities regulators and the SEC and have filed certifications with them.
Changes in internal control over financial reporting
There were no changes during the year covered by this annual report that had or are reasonably likely to have a material impact on our internal control over financial reporting.
TC Energy Management's discussion and analysis 2025 | 109
CRITICAL ACCOUNTING ESTIMATES
In preparing our Consolidated financial statements, we are required to make estimates and assumptions that affect both the amount and timing of recording assets, liabilities, revenues and expenses since the determination of these items may be dependent on future events. We use the most current information available and exercise careful judgment in making these estimates and assumptions.
Certain estimates and judgments have a material impact where the assumptions underlying these accounting estimates relate to matters that are highly uncertain at the time the estimate or judgment is made or are subjective. Refer to Note 2, Accounting policies, of our 2025 Consolidated financial statements for additional information.
Sales-type leases
We determined that the Southeast Gateway pipeline is classified as a sales-type lease between TGNH and the CFE. Under a sales-type lease, we derecognize the underlying asset and record a net investment in lease equal to the present value of both the future lease payments and the estimated residual value of the leased asset.
To record the net investment in lease, we were required to prepare an estimate of the fair value of the Southeast Gateway pipeline on the lease commencement date. The TGNH pipelines, which includes the Southeast Gateway pipeline, are rate-regulated and the tolls are designed to recover the cost of providing service. On this basis, we applied judgment to determine that, at the inception of the lease arrangement, the fair value of the underlying assets approximated the carrying value and the residual value approximated the remaining carrying value at the end of the lease term. We estimated that if the assets were purchased at their carrying value, they would yield a return to the purchaser that is in line with current market participant expectations.
Impairment of goodwill
We test goodwill for impairment annually or more frequently if events or changes in circumstances lead us to believe it might be impaired. We can initially assess qualitative factors which include, but are not limited to, macroeconomic conditions, industry and market considerations, cost factors, historical and forecasted financial results, or events specific to that reporting unit. If we conclude that it is not more likely than not that the fair value of the reporting unit is greater than its carrying value, we will then perform a quantitative goodwill impairment test. We can elect to proceed directly to the quantitative goodwill impairment test for any reporting unit. If the quantitative goodwill impairment test is performed, we compare the fair value of the reporting unit to its carrying value, including its goodwill. If the carrying value of a reporting unit exceeds its fair value, goodwill impairment is measured at the amount by which the reporting unit’s carrying value exceeds its fair value.
When a portion of a reporting unit that constitutes a business is disposed, goodwill associated with that business is included in the carrying amount of the business in determining the gain or loss on disposal. The amount of goodwill disposed is determined based on the relative fair values of the business to be disposed and the portion of the reporting unit that will be retained.
We determine the fair value of a reporting unit based on our projections of future cash flows, which involves making estimates and assumptions about transportation rates, market supply and demand, growth opportunities, output levels, competition from other companies, operating costs, regulatory changes, discount rates and earnings and other multiples.
The estimated fair value in excess of the carrying value was less than 10 per cent on our Great Lakes reporting unit at the date of our last quantitative goodwill impairment test. Any future reductions in cash flow forecasts or adverse changes in other key assumptions could result in a future impairment of our goodwill balance.
Qualitative goodwill impairment indicators
As part of the annual goodwill impairment assessment at December 31, 2025, we evaluated qualitative factors impacting the fair value of the underlying reporting units for all reporting units other than the Columbia reporting unit, which is described below. It was determined that it was more likely than not that the fair value of these reporting units exceeded their carrying amounts, including goodwill.
110 | TC Energy Management's discussion and analysis 2025
Columbia
We elected to proceed directly to a quantitative annual impairment test at December 31, 2025 for the $10,082 million (US$7,351 million) of goodwill related to the Columbia reporting unit following the Columbia Gas Settlement. To determine fair value, we used a discounted cash flow model incorporating projections of our future cash flows as well as a valuation multiple and applied a risk-adjusted discount rate which involved significant estimates and judgments. The fair value measurement is classified as Level III in the fair value hierarchy. It was determined that the fair value of the Columbia reporting unit exceeded its carrying value, including goodwill, at December 31, 2025.
TC Energy Management's discussion and analysis 2025 | 111
FINANCIAL INSTRUMENTS
With the exception of Long-term debt and Junior subordinated notes, our derivative and non-derivative financial instruments are recorded on the balance sheet at fair value unless they were entered into and continue to be held for the purpose of receipt or delivery in accordance with our normal purchase and sales exemptions and are documented as such. In addition, fair value accounting is not required for other financial instruments that qualify for certain accounting exemptions.
Derivative instruments
We use derivative instruments to reduce volatility associated with fluctuations in commodity prices, interest rates and foreign exchange rates. Derivative instruments, including those that qualify and are designated for hedge accounting treatment, are recorded at fair value.
The majority of derivative instruments that are not designated or do not qualify for hedge accounting treatment have been entered into as economic hedges to manage our exposure to market risk and are classified as held-for-trading. Changes in the fair value of held-for-trading derivative instruments are recorded in net income in the period of change. This may expose us to increased variability in reported operating results since the fair value of the held-for-trading derivative instruments can fluctuate significantly from period to period.
The recognition of gains and losses on derivatives for Canadian natural gas regulated pipeline exposures is determined through the regulatory process. Gains and losses arising from changes in the fair value of derivatives accounted for as part of RRA, including those that qualify for hedge accounting treatment, are expected to be refunded or recovered through the tolls charged by us. As a result, these gains and losses are deferred as regulatory liabilities or regulatory assets and are refunded to or collected from the rate payers in subsequent years when the derivative settles.
Balance sheet presentation of derivative instruments
The balance sheet presentation of the fair value of derivative instruments is as follows:
| | | | | | | | | | | | | | |
| at December 31 | | | | |
| (millions of $) | | 2025 | | 2024 |
| | | | |
| Other current assets | | 438 | | | 347 | |
| Other long-term assets | | 161 | | | 122 | |
| Accounts payable and other | | (380) | | | (507) | |
| Other long-term liabilities | | (149) | | | (209) | |
| | 70 | | | (247) | |
Anticipated timing of settlement of derivative instruments
The anticipated timing of settlement of derivative instruments assumes constant commodity prices, interest rates and foreign exchange rates. Settlements will vary based on the actual value of these factors at the date of settlement.
| | | | | | | | | | | | | | | | | | | | | | | | | | | | | | | | |
| at December 31, 2025 | | Total fair value | | < 1 year | | 1 - 3 years | | 4 - 5 years | | > 5 years |
| (millions of $) | |
| | | | | | | | | | |
Derivative instruments held for trading | | 116 | | | 41 | | | 64 | | | 31 | | | (20) | |
| Derivative instruments in hedging relationships | | (46) | | | 16 | | | 30 | | | (76) | | | (16) | |
| | | 70 | | | 57 | | | 94 | | | (45) | | | (36) | |
112 | TC Energy Management's discussion and analysis 2025
Unrealized and realized gains (losses) on derivative instruments
The following summary does not include hedges of our net investment in foreign operations.
| | | | | | | | | | | | | | | | | | | | |
| year ended December 31 | | | | | | |
| (millions of $) | | 2025 | | 2024 | | 2023 |
| | | | | | |
Derivative Instruments Held for Trading1 | | | | | | |
| Unrealized gains (losses) in the year | | | | | | |
Commodities | | 25 | | | (71) | | | 132 | |
Foreign exchange | | 210 | | | (266) | | | 246 | |
Interest rate | | — | | | (71) | | | — | |
| Realized gains (losses) in the year | | | | | | |
Commodities | | (10) | | | 199 | | | 192 | |
Foreign exchange | | 142 | | | (152) | | | 155 | |
Interest rate | | 8 | | | 29 | | | — | |
Derivative Instruments in Hedging Relationships2 | | | | | | |
| Realized gains (losses) in the year | | | | | | |
Commodities | | 24 | | | 33 | | | (2) | |
Foreign exchange | | 10 | | | — | | | — | |
Interest rate | | (30) | | | (52) | | | (43) | |
1Realized and unrealized gains (losses) on held-for-trading derivative instruments used to purchase and sell commodities are included on a net basis in Revenues in the Consolidated statement of income. Realized and unrealized gains (losses) on foreign exchange and interest rate held-for-trading derivative instruments are included on a net basis in Foreign exchange (gains) losses, net and Interest expense, respectively in the Consolidated statement of income.
2In 2025, unrealized gains of $2 million were reclassified to Net Income (loss) from AOCI related to discontinued cash flow hedges (2024 – unrealized gains of $6 million; 2023 – nil).
For further details on our non-derivative and derivative financial instruments, including classification assumptions made in the calculation of fair value and additional discussion of exposure to risks and mitigation activities, refer to Note 27, Risk management and financial instruments, of our 2025 Consolidated financial statements.
TC Energy Management's discussion and analysis 2025 | 113
RELATED PARTY TRANSACTIONS
Related party transactions are conducted in the normal course of business and are measured at the exchange amount, which is
the amount of consideration established and agreed to by the related parties.
Coastal GasLink LP
We hold a 35 per cent equity interest in Coastal GasLink LP and operate the Coastal GasLink pipeline.
We have a subordinated loan agreement with Coastal GasLink LP under which we advance non-revolving interest-bearing loans subject to floating market-based rates. In December 2024, following the commercial in-service of the pipeline, Coastal GasLink LP repaid the $3,147 million balance outstanding to TC Energy under the subordinated loan agreement. Unused committed capacity available for use by Coastal GasLink LP at December 31, 2025 was $163 million (December 31, 2024 – $228 million).
We also have a subordinated demand revolving credit facility agreement with Coastal GasLink LP to provide additional short-term liquidity and funding flexibility to projects under construction.
Sur de Texas
We hold a 60 per cent equity interest in a joint venture with IEnova to own the Sur de Texas pipeline, operated by TC Energy. On December 15, 2025, TC Energía Mexicana, S. de R.L. de C.V. (TCEM) entered into a subordinated demand revolving credit facility to borrow funds from the joint venture at a floating interest rate. The facility has a capacity of US$270 million, maturing in December 2028. At December 31, 2025, the unused capacity available for use by TCEM was $259 million (US$189 million) and the outstanding balance of the loan was $111 million (US$81 million).
ACCOUNTING CHANGES
For a description of our significant accounting policies and a summary of changes in accounting policies and standards impacting our business, refer to Note 2, Accounting policies, and Note 3, Accounting changes, of our 2025 Consolidated financial statements.
114 | TC Energy Management's discussion and analysis 2025
QUARTERLY RESULTS
Selected quarterly consolidated financial data
| | | | | | | | | | | | | | | | | | | | | | | | | | |
| 2025 | | | | | | | | |
| (millions of $, except per share amounts) | | Fourth | | Third | | Second | | First |
| | | | | | | | |
| Revenues from continuing operations | | 4,168 | | | 3,704 | | | 3,744 | | | 3,623 | |
| | | | | | | | |
| Net income (loss) attributable to common shares | | 980 | | | 609 | | | 833 | | | 978 | |
from continuing operations | | 959 | | | 813 | | | 862 | | | 978 | |
| from discontinued operations | | 21 | | | (204) | | | (29) | | | — | |
| | | | | | | | |
Comparable earnings1 | | 1,018 | | | 805 | | | 848 | | | 983 | |
from continuing operations | | 1,018 | | | 805 | | | 848 | | | 983 | |
| from discontinued operations | | — | | | — | | | — | | | — | |
| | | | | | | | |
| Share statistics: | | | | | | | | |
| Net income (loss) per common share – basic | | $0.94 | | | $0.58 | | | $0.80 | | | $0.94 | |
from continuing operations | | $0.92 | | | $0.78 | | | $0.83 | | | $0.94 | |
| from discontinued operations | | $0.02 | | | ($0.20) | | | ($0.03) | | | — | |
| | | | | | | | |
Comparable earnings per common share1 | | $0.98 | | | $0.77 | | | $0.82 | | | $0.95 | |
| from continuing operations | | $0.98 | | | $0.77 | | | $0.82 | | | $0.95 | |
| from discontinued operations | | — | | | — | | | — | | | — | |
| | | | | | | | |
| Dividends declared per common share | | $0.85 | | | $0.85 | | | $0.85 | | | $0.85 | |
1Additional information on the most directly comparable GAAP measure can be found on page 22.
| | | | | | | | | | | | | | | | | | | | | | | | | | |
| 2024 | | | | | | | | |
| (millions of $, except per share amounts) | | Fourth | | Third | | Second | | First |
| | | | | | | | |
| Revenues from continuing operations | | 3,577 | | | 3,358 | | | 3,327 | | | 3,509 | |
| | | | | | | | |
| Net income (loss) attributable to common shares | | 971 | | | 1,457 | | | 963 | | | 1,203 | |
from continuing operations | | 1,069 | | | 1,338 | | | 804 | | | 988 | |
from discontinued operations1 | | (98) | | | 119 | | | 159 | | | 215 | |
| | | | | | | | |
Comparable earnings2 | | 1,094 | | | 1,074 | | | 978 | | | 1,284 | |
from continuing operations | | 1,094 | | | 894 | | | 822 | | | 1,055 | |
from discontinued operations1 | | — | | | 180 | | | 156 | | | 229 | |
| | | | | | | | |
| Share statistics: | | | | | | | | |
| Net income (loss) per common share – basic | | $0.94 | | | $1.40 | | | $0.93 | | | $1.16 | |
from continuing operations | | $1.03 | | | $1.29 | | | $0.78 | | | $0.95 | |
from discontinued operations1 | | ($0.09) | | | $0.11 | | | $0.15 | | | $0.21 | |
| | | | | | | | |
Comparable earnings per common share2 | | $1.05 | | | $1.03 | | | $0.94 | | | $1.24 | |
| from continuing operations | | $1.05 | | | $0.86 | | | $0.79 | | | $1.02 | |
from discontinued operations1 | | — | | | $0.17 | | | $0.15 | | | $0.22 | |
| | | | | | | | |
Dividends declared per common share3 | | $0.8225 | | | $0.96 | | | $0.96 | | | $0.96 | |
1Represents nine months of Liquids Pipelines earnings in 2024.
2Additional information on the most directly comparable GAAP measure can be found on page 22.
3Dividends declared in fourth quarter 2024 and thereafter reflect TC Energy’s proportionate allocation following the Spinoff Transaction. Refer to the Discontinued operations section for additional information.
TC Energy Management's discussion and analysis 2025 | 115
Factors affecting quarterly financial information by business segment
Quarter-over-quarter revenues and net income fluctuate for reasons that vary across our business segments. In addition to the factors below, our revenues and segmented earnings (losses) are impacted by fluctuations in foreign exchange rates, mainly related to our U.S. dollar-denominated operations and our peso-denominated exposure.
As discussed on page 10 of the About this document section, results of the Liquids Pipelines business were accounted for as a discontinued operation starting October 1, 2024. To allow for a meaningful comparison, discussions throughout the Quarterly results section are based on continuing operations unless otherwise noted. Refer to the Discontinued operations section for additional information.
In our Natural Gas Pipelines business, except for seasonal fluctuations in short-term throughput volumes on U.S. pipelines, quarter-over-quarter revenues and segmented earnings (losses) generally remain relatively stable during any fiscal year. Over the long term, however, they fluctuate because of:
•regulatory decisions
•negotiated settlements with customers
•newly constructed assets being placed in service
•acquisitions and divestitures
•natural gas marketing activities and commodity prices
•developments outside of the normal course of operations
•certain fair value adjustments
•provisions for expected credit losses on net investment in leases and certain contract assets in Mexico.
In Power and Energy Solutions, quarter-over-quarter revenues and segmented earnings are affected by:
•weather
•customer demand
•newly constructed assets being placed in service
•acquisitions and divestitures
•market prices for natural gas and power
•capacity prices and payments
•power marketing and trading activities
•planned and unplanned plant outages
•developments outside of the normal course of operations
•certain fair value adjustments.
Factors affecting financial information by quarter
We calculate comparable measures by adjusting certain GAAP measures for specific items we believe are significant but not reflective of our underlying operations in the period. Except as otherwise described herein, these comparable measures are calculated on a consistent basis from period to period and are adjusted for specific items in each period, as applicable. Refer to page 22 for more information on non-GAAP measures we use.
In fourth quarter 2025, comparable earnings from continuing operations also excluded:
•a pre-tax impairment charge of $110 million for certain Power and Energy Solutions projects following our decision to discontinue development along with updated forecast assumptions as we refocus our Power and Energy Solutions strategy
•pre-tax unrealized foreign exchange losses, net, of $47 million on the peso-denominated intercompany loan between TCPL and TGNH, net of non-controlling interest
•a pre-tax recovery of $4 million on the expected credit loss provision related to TGNH net investment in leases, net of non-controlling interest as well as certain contract assets in Mexico.
116 | TC Energy Management's discussion and analysis 2025
In third quarter 2025, comparable earnings from continuing operations also excluded:
•pre-tax unrealized foreign exchange gains, net, of $87 million on the peso-denominated intercompany loan between TCPL and TGNH, net of non-controlling interest
•a pre-tax recovery of $12 million on the expected credit loss provision related to TGNH net investment in leases, net of non-controlling interest as well as certain contract assets in Mexico.
In second quarter 2025, comparable earnings from continuing operations also excluded:
•pre-tax unrealized foreign exchange losses, net, of $132 million on the peso-denominated intercompany loan between TCPL and TGNH, net of non-controlling interest
•a pre-tax expense of $93 million on the expected credit loss provision related to TGNH net investment in leases, net of non-controlling interest as well as certain contract assets in Mexico.
In first quarter 2025, comparable earnings from continuing operations also excluded:
•pre-tax unrealized foreign exchange gains, net, of $3 million on the peso-denominated intercompany loan between TCPL and TGNH, net of non-controlling interest
•a pre-tax recovery of $2 million on the expected credit loss provision related to TGNH net investment in leases, net of non-controlling interest as well as certain contract assets in Mexico.
In fourth quarter 2024, comparable earnings from continuing operations also excluded:
•a pre-tax net gain on debt extinguishment of $228 million related to the purchase and cancellation of certain senior unsecured notes and medium term notes and the retirement of outstanding callable notes in October 2024
•pre-tax unrealized foreign exchange gains, net, of $143 million on the peso-denominated intercompany loan between TCPL and TGNH, net of non-controlling interest
•a pre-tax recovery of $3 million on the expected credit loss provision related to TGNH net investment in leases, net of non-controlling interest as well as certain contract assets in Mexico
•a deferred income tax expense of $96 million resulting from the revaluation of remaining deferred tax balances following the Spinoff Transaction
•a pre-tax impairment charge of $36 million for a Power and Energy Solutions project following our decision to discontinue development as we refocus our Power and Energy Solutions strategy
•a pre-tax expense of $9 million related to Focus Project costs.
In third quarter 2024, comparable earnings from continuing operations also excluded:
•a pre-tax gain of $572 million related to the sale of PNGTS which was completed on August 2024
•pre-tax unrealized foreign exchange losses, net, of $52 million on the peso-denominated intercompany loan between TCPL and TGNH, net of non-controlling interest
•a pre-tax expense of $5 million on the expected credit loss provision related to TGNH net investment in leases, net of non-controlling interest as well as certain contract assets in Mexico
•a pre-tax expense of $5 million related to Focus Project costs.
In second quarter 2024, comparable earnings from continuing operations also excluded:
•a pre-tax gain of $48 million related to the sale of non-core assets in U.S. Natural Gas Pipelines and Canadian Natural Gas Pipelines
•pre-tax unrealized foreign exchange losses, net of $3 million on the peso-denominated intercompany loan between TCPL and TGNH, net of non-controlling interest
•a pre-tax recovery of $3 million on the expected credit loss provision related to TGNH net investment in leases, net of non-controlling interest as well as certain contract assets in Mexico
•pre-tax costs of $10 million related to the NGTL System ownership transfer.
In first quarter 2024, comparable earnings from continuing operations also excluded:
•pre-tax unrealized foreign exchange gains, net of $55 million on the peso-denominated intercompany loan between TCPL and TGNH
•a pre-tax recovery of $21 million on the expected credit loss provision related to TGNH net investment in leases and certain contract assets in Mexico
•a pre-tax expense of $34 million related to a non-recurring third-party settlement
•a pre-tax expense of $10 million related to Focus Project costs.
TC Energy Management's discussion and analysis 2025 | 117
FOURTH QUARTER 2025 HIGHLIGHTS
Consolidated results
| | | | | | | | | | | | | | |
| three months ended December 31 | | 2025 | | 2024 |
| (millions of $, except per share amounts) | |
| | | | |
| Canadian Natural Gas Pipelines | | 564 | | | 506 | |
| U.S. Natural Gas Pipelines | | 1,110 | | | 918 | |
| Mexico Natural Gas Pipelines | | 377 | | | 214 | |
| Power and Energy Solutions | | 136 | | | 276 | |
| Corporate | | 1 | | | (16) | |
| Total segmented earnings (losses) | | 2,188 | | | 1,898 | |
| Interest expense | | (873) | | | (679) | |
| Allowance for funds used during construction | | 36 | | | 233 | |
Foreign exchange gains (losses), net | | 15 | | | (69) | |
| Interest income and other | | 58 | | | 120 | |
| Income (loss) from continuing operations before income taxes | | 1,424 | | | 1,503 | |
Income tax (expense) recovery from continuing operations | | (263) | | | (223) | |
| Net income (loss) from continuing operations | | 1,161 | | | 1,280 | |
Net income (loss) from discontinued operations, net of tax | | 21 | | | (98) | |
| Net income (loss) | | 1,182 | | | 1,182 | |
Net (income) loss attributable to non-controlling interests | | (167) | | | (183) | |
| Net income (loss) attributable to controlling interests | | 1,015 | | | 999 | |
| Preferred share dividends | | (35) | | | (28) | |
| Net income (loss) attributable to common shares | | 980 | | | 971 | |
| Net income (loss) per common share – basic | | $0.94 | | | $0.94 | |
from continuing operations | | $0.92 | | | $1.03 | |
from discontinued operations | | $0.02 | | | ($0.09) | |
| | | | | | | | | | | | | | |
| three months ended December 31 | | 2025 | | 2024 |
(millions of $) | |
| | | | |
| Amounts attributable to common shares | | | | |
Net income (loss) from continuing operations | | 1,161 | | | 1,280 | |
Net income (loss) attributable to non-controlling interest | | (167) | | | (183) | |
Net income (loss) attributable to controlling interests from continuing operations | | 994 | | | 1,097 | |
| Preferred share dividends | | (35) | | | (28) | |
Net income (loss) attributable to common shares from continuing operations | | 959 | | | 1,069 | |
Net income (loss) from discontinued operations, net of tax | | 21 | | | (98) | |
| Net income (loss) attributable to common shares | | 980 | | | 971 | |
Net income (loss) attributable to common shares from continuing operations decreased by $110 million or $0.11 per common share for the three months ended December 31, 2025 compared to the same period in 2024.
118 | TC Energy Management's discussion and analysis 2025
Reconciliation of net income (loss) attributable to common shares to comparable earnings - from continuing operations
| | | | | | | | | | | | | | | | |
| three months ended December 31 | | 2025 | | 2024 | | |
| (millions of $, except per share amounts) | | | |
| | | | | | |
| Net income (loss) attributable to common shares from continuing operations | | 959 | | | 1,069 | | | |
| Specific items (pre tax): | | | | | | |
Power and Energy Solutions impairment charges | | 110 | | | 36 | | | |
Foreign exchange (gains) losses, net – intercompany loan1 | | 47 | | | (143) | | | |
Expected credit loss provision on net investment in leases and certain contract assets in Mexico2 | | (4) | | | (3) | | | |
| | | | | | |
Net gain on debt extinguishment3 | | — | | | (228) | | | |
| | | | | | |
| | | | | | |
Focus Project costs4 | | — | | | 9 | | | |
| | | | | | |
| Bruce Power unrealized fair value adjustments | | (4) | | | (2) | | | |
Risk management activities5 | | (87) | | | 301 | | | |
| | | | | | |
| | | | | | |
Taxes on specific items6 | | (3) | | | 55 | | | |
| Comparable earnings from continuing operations | | 1,018 | | | 1,094 | | | |
| Net income (loss) per common share from continuing operations | | $0.92 | | | $1.03 | | | |
| Specific items (net of tax) | | 0.06 | | | 0.02 | | | |
| Comparable earnings per common share from continuing operations | | $0.98 | | | $1.05 | | | |
1In 2023, TCPL and TGNH entered into an unsecured revolving credit facility. While the loan receivable and payable eliminate on consolidation, differences in each entity’s reporting currency create a net income impact from revaluing and translating these balances into TC Energy’s reporting currency. As the resulting unrealized foreign exchange gains and losses do not reflect amounts expected to be realized at settlement, we exclude them from comparable measures, net of non‑controlling interest.
2We have recognized an expected credit loss provision related to net investment in leases and certain contract assets in Mexico, which will fluctuate from period to period based on changing economic assumptions and forward-looking information. This provision is an estimate of losses that may occur over the duration of the TSA through 2055. This provision does not reflect losses or cash outflows that were incurred under this lease arrangement in the current period or from our underlying operations, and therefore, we have excluded any unrealized changes, net of non-controlling interest, from comparable measures. Refer to Note 27, Risk management and financial instruments, of our 2025 Consolidated financial statements for additional information.
3In October 2024, TCPL commenced and completed our cash tender offers to purchase and cancel certain senior unsecured notes and medium term notes
at a 7.73 per cent weighted average discount. In addition, we retired outstanding callable notes at par. These extinguishments of debt resulted in a pre-tax
net gain of $228 million, primarily due to fair value discounts and unamortized debt issue costs. The net gain on debt extinguishment was recorded in Interest expense in the Consolidated statement of income. Refer to Note 19, Long-term debt, of our 2025 Consolidated financial statements for additional information.
4In 2024 we recognized expenses related to the Focus Project for external consulting and severance, some of which are not recoverable through regulatory and commercial tolling structures.
| | | | | | | | | | | | | | | | | | | | |
5 | | three months ended December 31 | | 2025 | | 2024 |
| | (millions of $) | |
| | | | | | |
| | U.S. Natural Gas Pipelines | | (8) | | | (37) | |
| | | Canadian Power | | 56 | | | 17 | |
| | U.S. Power | | 5 | | | (2) | |
| | | Natural Gas Storage | | (8) | | | (20) | |
| | Interest rate | | 1 | | | (71) | |
| | | Foreign exchange | | 41 | | | (188) | |
| | | | 87 | | | (301) | |
| | | Income tax attributable to risk management activities | | (21) | | | 72 | |
| | | Total unrealized gains (losses) from risk management activities | | 66 | | | (229) | |
| | | | | | |
6 | | Refer to the Corporate - Financial results section for additional information. |
TC Energy Management's discussion and analysis 2025 | 119
Comparable EBITDA to comparable earnings - from continuing operations
Comparable EBITDA from continuing operations represents segmented earnings (losses) adjusted for the specific items described above and excludes charges for depreciation and amortization.
| | | | | | | | | | | | | | |
| three months ended December 31 | | 2025 | | 2024 |
| (millions of $, except per share amounts) | |
| | | | |
| Comparable EBITDA from continuing operations | | | | |
| Canadian Natural Gas Pipelines | | 961 | | | 851 | |
| U.S. Natural Gas Pipelines | | 1,388 | | | 1,200 | |
| Mexico Natural Gas Pipelines | | 397 | | | 234 | |
| Power and Energy Solutions | | 217 | | | 341 | |
| Corporate | | 1 | | | (7) | |
| Comparable EBITDA from continuing operations | | 2,964 | | | 2,619 | |
| Depreciation and amortization | | (719) | | | (639) | |
| Interest expense included in comparable earnings | | (874) | | | (836) | |
| Allowance for funds used during construction | | 36 | | | 233 | |
| Foreign exchange gains (losses), net included in comparable earnings | | 29 | | | (44) | |
Interest income and other | | 58 | | | 120 | |
| Income tax (expense) recovery included in comparable earnings | | (266) | | | (168) | |
Net (income) loss attributable to non-controlling interests included in comparable earnings | | (175) | | | (163) | |
| Preferred share dividends | | (35) | | | (28) | |
| Comparable earnings from continuing operations | | 1,018 | | | 1,094 | |
| Comparable earnings per common share from continuing operations | | $0.98 | | | $1.05 | |
120 | TC Energy Management's discussion and analysis 2025
Comparable EBITDA from continuing operations
Fourth quarter 2025 versus fourth quarter 2024
Comparable EBITDA from continuing operations increased by $345 million for the three months ended December 31, 2025 compared to the same period in 2024 primarily due to the net result of the following:
•increased U.S. dollar-denominated EBITDA from U.S. Natural Gas Pipelines due to an increase in earnings from Columbia Gas as a result of higher transportation rates effective April 1, 2025, incremental earnings from projects placed in service, additional contract sales and higher realized earnings related to our U.S. natural gas marketing business
•increased U.S. dollar-denominated EBITDA from Mexico Natural Gas Pipelines mainly due to higher earnings in TGNH primarily related to the completion of the Southeast Gateway pipeline in second quarter 2025, partially offset by lower equity earnings from Sur de Texas as a result of peso-denominated financial exposure and higher income tax expense mainly related to foreign exchange impacts of U.S dollar-denominated liabilities
•increased EBITDA in Canadian Natural Gas Pipelines mainly due to higher flow-through depreciation and incentive earnings on the NGTL System and Mainline
•decreased Power and Energy Solutions EBITDA mainly attributable to lower net contributions from Bruce Power due to reduced generation primarily resulting from the Unit 4 MCR, partially offset by a higher contract price; and lower realized power prices in Canadian Power, partially offset by lower business development costs
•a negative foreign exchange impact of a weaker U.S. dollar on the Canadian dollar equivalent comparable EBITDA in our U.S. dollar-denominated operations, which was translated at a rate of 1.39 in 2025 versus 1.40 in 2024. Refer to the Foreign exchange section for additional information.
Due to the flow-through treatment of certain costs including depreciation, financial charges and income taxes in our Canadian rate-regulated pipelines, changes in these costs impact our comparable EBITDA despite having no significant effect on net income.
Comparable earnings from continuing operations
Fourth quarter 2025 versus fourth quarter 2024
Comparable earnings decreased by $76 million or $0.07 per common share for the three months ended December 31, 2025 compared to the same period in 2024 primarily due to the net effect of the following:
•changes in comparable EBITDA described above
•lower AFUDC primarily due to the completion of the Southeast Gateway pipeline
•higher income tax expense primarily due to the impact of Mexico foreign exchange exposure and higher flow-through income taxes
•higher depreciation and amortization primarily due to higher depreciation rates on the NGTL System under the 2025-2029 NGTL Settlement and from Columbia Gas as a result of the Columbia Gas Settlement
•lower interest income and other due to an increase in insurance-related provisions and lower interest earned on short-term investments
•higher interest expense due to lower realized gains on derivatives used to manage our interest rate risk, increased levels of short-term borrowing and long-term debt issuances and maturities
•higher net income attributable to non-controlling interests is primarily the result of higher net income recognized from the Columbia Gas and Columbia Gulf assets, partially offset by the net effect of higher tax expense, higher EBITDA and lower AFUDC in TGNH following Southeast Gateway pipeline's completion in second quarter 2025 and the overall impact of foreign exchange
•risk management activities used to manage our foreign exchange exposure to net liabilities in Mexico and to U.S. dollar-denominated income and the revaluation of our peso-denominated net monetary liabilities to U.S. dollars.
TC Energy Management's discussion and analysis 2025 | 121
Foreign exchange
Certain of our businesses generate all or most of their earnings in U.S. dollars and, since we report our financial results in Canadian dollars, changes in the value of the U.S. dollar against the Canadian dollar directly affect our comparable EBITDA and may also impact comparable earnings. As our U.S. dollar-denominated operations continue to grow, this exposure increases. A portion of the U.S. dollar-denominated comparable EBITDA exposure is naturally offset by U.S. dollar-denominated amounts below comparable EBITDA within Depreciation and amortization, Interest expense and other income statement line items. A portion of the remaining exposure is actively managed on a rolling forward basis up to three years using foreign exchange derivatives; however, the natural exposure beyond that period remains. The net impact of the U.S. dollar movements on comparable earnings during the three months ended December 31, 2025 after considering natural offsets and economic hedges was not significant.
The components of our financial results denominated in U.S. dollars are set out in the table below, including our U.S. Natural Gas Pipelines and Mexico Natural Gas Pipelines operations. Comparable EBITDA is a non-GAAP measure.
Pre-tax U.S. dollar-denominated income and expense items - from continuing operations
| | | | | | | | | | | | | | |
| three months ended December 31 | | 2025 | | 2024 |
| (millions of US$) | |
| | | | |
| Comparable EBITDA | | | | |
| U.S. Natural Gas Pipelines | | 996 | | | 859 | |
Mexico Natural Gas Pipelines | | 285 | | | 167 | |
| | 1,281 | | | 1,026 | |
| Depreciation and amortization | | (211) | | | (191) | |
Interest expense on long-term debt and junior subordinated notes | | (434) | | | (440) | |
| Interest income and other | | 22 | | | 51 | |
| | | | |
| Allowance for funds used during construction | | 16 | | | 159 | |
Net (income) loss attributable to non-controlling interests included in comparable earnings and other | | (127) | | | (125) | |
| | | 547 | | | 480 | |
| Average exchange rate - U.S. to Canadian dollars | | 1.39 | | | 1.40 | |
Foreign exchange related to Mexico Natural Gas Pipelines
Changes in the value of the Mexican peso against the U.S. dollar can affect our comparable earnings as a portion of our Mexico Natural Gas Pipelines monetary assets and liabilities are peso-denominated, while our financial results are denominated in U.S. dollars for our Mexico operations. These peso-denominated balances are revalued to U.S. dollars, creating foreign exchange gains and losses that are included in Income (loss) from equity investments, Foreign exchange (gains) losses, net and Net income (loss) attributable to non-controlling interests in the Consolidated statement of income.
In addition, foreign exchange gains or losses calculated for Mexico income tax purposes on the revaluation of U.S. dollar‑denominated monetary assets and liabilities result in a peso-denominated income tax exposure for these entities, leading to fluctuations in Income from equity investments and Income tax expense. This exposure increases as our U.S. dollar‑denominated net monetary liabilities grow.
The above exposures are managed using foreign exchange derivatives, although some unhedged exposure remains. The impacts of the foreign exchange derivatives are recorded in Foreign exchange (gains) losses, net in the Consolidated statement of income. Refer to the Financial risks and financial instruments section for additional information.
122 | TC Energy Management's discussion and analysis 2025
The period end exchange rates for one U.S. dollar to Mexican pesos were as follows:
| | | | | | | | |
| December 31, 2025 | | 18.00 | |
| December 31, 2024 | | 20.87 | |
| | |
| | |
| | |
| December 31, 2023 | | 16.91 |
A summary of the impacts of transactional foreign exchange gains and losses from changes in the value of the Mexican peso against the U.S. dollar and associated derivatives is set out in the table below:
| | | | | | | | | | | | | | |
| three months ended December 31 | | |
| (millions of $) | | 2025 | | 2024 |
| | | | |
Comparable EBITDA - Mexico Natural Gas Pipelines1 | | (12) | | | 30 | |
| Foreign exchange gains (losses), net included in comparable earnings | | 36 | | | (21) | |
| Income tax (expense) recovery included in comparable earnings | | (13) | | | 27 | |
Net (income) loss attributable to non-controlling interests included in comparable earnings2 | | — | | | (3) | |
| | 11 | | | 33 | |
| | | | |
| | | | |
| | | | |
| | | | |
| | | | |
| | | | |
| | | | |
| | | | |
1Includes the foreign exchange impacts from the Sur de Texas joint venture recorded in Income (loss) from equity investments in the Consolidated statement
of income.
2Represents the non-controlling interest portion related to TGNH. Refer to the Corporate section for additional information.
TC Energy Management's discussion and analysis 2025 | 123
Highlights by business segment
Canadian Natural Gas Pipelines
Canadian Natural Gas Pipelines segmented earnings increased by $58 million for the three months ended December 31, 2025 compared to the same period in 2024.
Net income for the NGTL System increased by $17 million for the three months ended December 31, 2025 compared to the same period in 2024 primarily due to higher incentive earnings. The NGTL System is currently operating under the 2025-2029 NGTL Settlement, which commenced on January 1, 2025 and includes an approved ROE of 10.1 per cent on 40 per cent deemed common equity. This settlement provides the NGTL System with higher depreciation rates and the opportunity to further increase depreciation rates with an incentive if tolls fall below specified levels, or if growth projects are undertaken. It also includes incentive mechanisms to reduce both physical emissions and emission compliance costs, while also providing incentive for certain operating costs where variances from projected amounts and emissions savings are shared with customers.
Net income for the Canadian Mainline increased by $5 million for the three months ended December 31, 2025 compared to the same period in 2024 mainly due to higher incentive earnings. The Canadian Mainline is operating under the 2021-2026 Mainline Settlement which includes an approved ROE of 10.1 per cent on 40 per cent deemed common equity and an incentive to decrease costs and increase revenues on the pipeline under a beneficial sharing mechanism with our customers.
Comparable EBITDA for Canadian Natural Gas Pipelines increased by $110 million for the three months ended December 31, 2025 compared to the same period in 2024 due to:
•higher flow-through depreciation and income taxes as well as higher incentive earnings on the NGTL System and the Canadian Mainline.
Depreciation and amortization increased by $52 million for the three months ended December 31, 2025 compared to the same period in 2024 primarily reflecting higher depreciation rates on the NGTL System under the 2025-2029 NGTL Settlement and an increase in assets placed in service on the Canadian Mainline.
U.S. Natural Gas Pipelines
U.S. Natural Gas Pipelines segmented earnings increased by $192 million for the three months ended December 31, 2025 compared to the same period in 2024 and included unrealized gains and losses from changes in the fair value of derivatives used in our U.S. natural gas marketing business which has been excluded from our calculation of comparable EBITDA and comparable EBIT.
A weaker U.S. dollar for the three months ended December 31, 2025 had a negative impact on the Canadian dollar equivalent segmented earnings from our U.S. dollar-denominated operations compared to the same period in 2024. Refer to the Foreign exchange section for additional information.
Comparable EBITDA for U.S. Natural Gas Pipelines increased by US$137 million for the three months ended December 31, 2025 compared to the same period in 2024 and was primarily due to the net effect of:
•a net increase in earnings from Columbia Gas as a result of higher transportation rates effective April 1, 2025, pursuant to the Columbia Gas Settlement. Refer to the U.S. Natural Gas Pipelines - Significant events section for additional information
•incremental earnings from projects placed in service, as well as increased earnings from additional contract sales on GTN
•higher realized earnings related to our U.S. natural gas marketing business primarily due to higher margins
•decreased earnings due to higher operational costs, reflective of increased system utilization across our footprint.
Depreciation and amortization increased by US$19 million for the three months ended December 31, 2025 compared to the same period in 2024 primarily due to new projects placed in service and depreciation rate changes as a result of the Columbia Gas Settlement.
124 | TC Energy Management's discussion and analysis 2025
Mexico Natural Gas Pipelines
Mexico Natural Gas Pipelines segmented earnings increased by $163 million for the three months ended December 31, 2025 compared to the same period in 2024 and included a recovery of $4 million (2024 – recovery of $3 million), on the expected credit loss provision related to the TGNH net investment in leases and certain contract assets in Mexico, which has been excluded from our calculation of comparable EBITDA and comparable EBIT.
A weaker U.S. dollar for the three months and year ended December 31, 2025 had a negative impact on the Canadian dollar equivalent segmented earnings from our U.S. dollar-denominated operations in Mexico compared to the same period in 2024. Refer to the Foreign exchange section for additional information.
Comparable EBITDA for Mexico Natural Gas Pipelines increased by US$118 million for the three months ended December 31, 2025 compared with the same period in 2024, due to the net effect of:
•higher earnings in TGNH due to the completion of the Southeast Gateway pipeline in second quarter 2025
•lower equity earnings from Sur de Texas primarily due to the foreign exchange impacts on the revaluation of
peso-denominated liabilities as a result of a stronger Mexican peso and higher income tax expense mainly related to foreign exchange impacts of U.S. dollar-denominated liabilities. Refer to the Sur de Texas results section for additional information.
Depreciation and amortization was generally consistent for the three months ended December 31, 2025 compared to the same period in 2024. Under sales-type lease accounting, our in-service TGNH pipeline assets are derecognized from Plant, property and equipment and recorded as a net investment in lease on our Condensed consolidated balance sheet with no depreciation expense being recognized.
Power and Energy Solutions
Power and Energy Solutions segmented earnings decreased by $140 million for the three months ended December 31, 2025 compared to the same period in 2024 and included the following specific items which have been excluded from our calculation of comparable EBITDA and comparable EBIT:
•a pre-tax impairment charge in 2025 of $110 million (2024 - $36 million) for certain Power and Energy Solutions projects following our decision to discontinue development along with updated forecast assumptions as we refocus our Power and Energy Solutions strategy
•our proportionate share of Bruce Power's unrealized gains and losses on funds invested for post-retirement benefits and risk management activities
•unrealized gains and losses from changes in the fair value of derivatives used to reduce commodity exposures.
Comparable EBITDA for Power and Energy Solutions decreased by $124 million for the three months ended December 31, 2025 compared to the same period in 2024 primarily due to the net effect of:
•lower Bruce Power contributions from reduced generation due to the Unit 4 MCR, planned Unit 2 outage in fourth quarter 2025 and increased operating costs, partially offset by a higher contract price. Refer to the Bruce Power results section for additional information
•decreased Canadian Power financial results primarily from lower realized power prices
•increased Natural Gas Storage and other is primarily due to lower business development costs.
Depreciation and amortization generally consistent for the three months ended December 31, 2025 compared to the same period in 2024.
Corporate
Corporate segmented earnings increased by $17 million for the three months ended December 31, 2025 compared to the same period in 2024. Corporate segmented losses included a pre-tax charge of $9 million for the three months ended December 31, 2024 related to Focus Project costs, which has been excluded from our calculation of comparable EBITDA and comparable EBIT.
Comparable EBITDA and EBIT for Corporate increased by $8 million for the three months ended December 31, 2025 compared to the same period in 2024.
TC Energy Management's discussion and analysis 2025 | 125
QUARTERLY RESULTS - FROM DISCONTINUED OPERATIONS
Factors affecting financial information by quarter
The quarterly results section references non-GAAP measures, which are described on page 22. These measures do not have
any standardized meaning as prescribed by GAAP and therefore may not be comparable to similar measures presented by
other entities.
In fourth quarter 2025, comparable earnings from discontinued operations also excluded:
•a pre-tax recovery of $8 million primarily resulting from the resolution reached in September 2025 under the Separation Agreement with South Bow.
In third quarter 2025, comparable earnings from discontinued operations also excluded:
•a pre-tax charge of $196 million primarily resulting from the resolution reached in September 2025 under the Separation Agreement with South Bow.
In second quarter 2025, comparable earnings from discontinued operations also excluded:
•a pre-tax impairment charge of $29 million related to our estimate of Keystone XL contractual recoveries.
In fourth quarter 2024, comparable earnings from discontinued operations also excluded:
•a pre-tax charge of $85 million from Liquids Pipelines business separation costs related to the Spinoff Transaction, of which $75 million was recognized in segmented earnings and $10 million in interest income
•a pre-tax expense of $37 million related to our estimate of potential incremental costs resulting from the Milepost 14 incident. This amount represents our 86 per cent share pursuant to the indemnity provisions in the Separation Agreement
•a pre-tax recovery of $3 million as a result of the FERC Administrative Law Judge decision on Keystone in respect of a tolling-related complaint pertaining to amounts recognized in prior periods.
In third quarter 2024, comparable earnings from discontinued operations also excluded:
•a pre-tax charge of $67 million due to Liquids Pipelines business separation costs related to the Spinoff Transaction
•a pre-tax expense of $21 million related to Keystone XL asset disposition and termination activities
•a pre-tax charge of $15 million related to the FERC Administrative Law Judge decision on Keystone in respect of a tolling-related complaint pertaining to amounts recognized in prior periods.
In second quarter 2024, comparable earnings from discontinued operations also excluded:
•a pre-tax charge of $29 million due to Liquids Pipelines business separation costs related to the Spinoff Transaction.
In first quarter 2024, comparable earnings from discontinued operations also excluded:
•a pre-tax charge of $16 million due to Liquids Pipelines business separation costs related to the Spinoff Transaction.
Results from discontinued operations
| | | | | | | | | | | | | | |
| three months ended December 31 | | 2025 | | 2024 |
| (millions of $, except per share amounts) | | |
| | | | |
| Segmented earnings (losses) from discontinued operations | | (6) | | | (109) | |
| | | | |
Interest income and other | | 14 | | | (10) | |
| Income (loss) from discontinued operations before income taxes | | 8 | | | (119) | |
Income tax (expense) recovery | | 13 | | | 21 | |
| Net income (loss) from discontinued operations, net of tax | | 21 | | | (98) | |
| Net income (loss) per common share from discontinued operations - basic | | $0.02 | | | ($0.09) | |
Net income from discontinued operations, net of tax in the three months ended in December 31, 2025 was $21 million or $0.02 per common share (2024 - net loss of $98 million or loss of $0.09 per common share), an increase of $119 million or $0.11 per common share.
126 | TC Energy Management's discussion and analysis 2025
Reconciliation of net income (loss) from discontinued operations, net of tax to comparable earnings from discontinued operations
| | | | | | | | | | | | | | | | |
| three months ended December 31 | | 2025 | | 2024 | | |
| (millions of $, except per share amounts) | | | | |
| | | | | | |
| Net income (loss) from discontinued operations, net of tax | | 21 | | | (98) | | | |
| Specific items (pre tax): | | | | | | |
South Bow settlement1 | | (8) | | | — | | | |
| | | | | | |
| Liquids Pipelines business separation costs | | — | | | 85 | | | |
| Milepost 14 incremental costs | | — | | | 37 | | | |
| Keystone regulatory decisions | | — | | | (3) | | | |
| | | | | | |
| | | | | | |
Taxes on specific items | | (13) | | | (21) | | | |
| Comparable earnings from discontinued operations | | — | | | — | | | |
| Net income (loss) per common share from discontinued operations | | $0.02 | | | ($0.09) | | | |
Specific items (net of tax) | | (0.02) | | | 0.09 | | | |
| Comparable earnings per common share from discontinued operations | | — | | | — | | | |
1A pre-tax recovery of $8 million for the three months ended December 31, 2025 resulting from the resolution reached in September 2025 under the Separation Agreement with South Bow.
TC Energy Management's discussion and analysis 2025 | 127
Glossary
| | | | | | | | |
| Units of measure |
| Bcf | | Billion cubic feet |
| Bcf/d | | Billion cubic feet per day |
| GWh | | Gigawatt hours |
| km | | Kilometres |
| MMcf/d | | Million cubic feet per day |
| MW | | Megawatt(s) |
| MWh | | Megawatt hours |
| TJ/d | | Terajoule per day |
| | |
General terms and terms related to our operations |
| CEO | | Chief Executive Officer |
| CFO | | Chief Financial Officer |
| cogeneration facilities | | Facilities that produce both electricity and useful heat at the same time |
| DRP | | Dividend Reinvestment and Share Purchase Plan |
| Empress | | A major delivery/receipt point for natural gas near the Alberta/Saskatchewan border |
ESG | | Environmental, social and governance |
| FID | | Final investment decision |
| force majeure | | Unforeseeable circumstances that prevent a party to a contract from fulfilling it |
| GHG | | Greenhouse gas |
| HCAs | | High-consequence areas |
| HSSE | | Health, safety, sustainability and environment |
| investment base | | Includes rate base, as well as assets under construction |
| LDC | | Local distribution company |
| LNG | | Liquefied natural gas |
| OM&A | | Operating, maintenance and administration |
| PPA | | Power purchase arrangement |
| rate base | | Average assets in service, working capital and deferred amounts used in setting of regulated rates |
| RNG | | Renewable natural gas |
| TSA | | Transportation Service Agreement |
| TOMS | | TC Energy's Operational Management System |
| WCSB | | Western Canadian Sedimentary basin |
| | | | | | | | |
| | |
| | |
Accounting terms |
| AFUDC | | Allowance for funds used during construction |
U.S. GAAP / GAAP | | U.S. generally accepted accounting principles |
RRA | | Rate-regulated accounting |
| ROE | | Return on common equity |
| | |
| Government and regulatory bodies terms |
| AER | | Alberta Energy Regulator |
| CER | | Canada Energy Regulator |
| CFE | | Comisión Federal de Electricidad (Mexico) |
CNE | | Comisión Nacional de Energía (Mexico) |
| CRE | | Comisión Reguladora de Energía, or Energy Regulatory Commission (Mexico) |
| ECCC | | Environment and Climate Change Canada |
| FERC | | Federal Energy Regulatory Commission (U.S.) |
| IESO | | Independent Electricity System Operator (Ontario) |
IFRS S2 | | International Financial Reporting Standards S2 Climate-related Disclosures |
| NYSE | | New York Stock Exchange |
| OBPS | | Output Based Pricing System |
| OPG | | Ontario Power Generation |
| PHMSA | | Pipeline and Hazardous Materials Safety Administration |
| SEC | | U.S. Securities and Exchange Commission |
SENER | | Secretaría de Energía or Mexican Ministry of Energy |
| TCFD | | Task Force on Climate-Related Financial Disclosures |
TNFD | | Task Force on Nature-related Financial Disclosures |
| TSX | | Toronto Stock Exchange |
128 | TC Energy Management's discussion and analysis 2025