UNITED STATES
SECURITIES AND EXCHANGE COMMISSION
Washington, D.C. 20549
FORM
CURRENT REPORT
Pursuant to Section 13 or 15(d) of the Securities Exchange Act of 1934
Date of Report (Date of earliest event reported):

(Exact name of registrant as specified in its charter)
(Jurisdiction of Incorporation) | (IRS Employer Identification Number) |
(Commission File Number)
(Address of Principal Executive Offices, including Zip Code)
(Registrant’s telephone number, including Area Code)
Check the appropriate box below if the Form 8-K filing is intended to simultaneously satisfy the filing obligation of the registrant under any of the following provisions (see General Instruction A.2. below):
Securities registered pursuant to Section 12(b) of the Act:
Title of each class | Trading symbol | Name of each exchange on which registered | ||
Indicate by check mark whether the registrant is an emerging growth company as defined in Rule 405 of the Securities Act of 1933 (§230.405 of this chapter) or Rule 12b-2 of the Securities Exchange Act of 1934 (§240.12b-2 of this chapter).
Emerging growth company
If an emerging growth company, indicate by check mark if the registrant has elected not to use the extended transition period for complying with any new or revised financial accounting standards provided pursuant to Section 13(a) of the Exchange Act. ☐
Item 2.02. Results of Operations and Financial Condition
On April 28, 2020, TE Connectivity Ltd. (the “Company”) issued a press release reporting the Company’s second quarter results for fiscal 2020. A copy of the press release is furnished as Exhibit 99.1 to this report and incorporated by reference in this Item 2.02.
Item 7.01. Regulation FD Disclosure
The Company will hold a conference call and webcast on April 28, 2020 (see information in the press release attached hereto as Exhibit 99.1 under “Conference Call and Webcast”). A copy of the slide materials to be discussed at the conference call and webcast is being furnished pursuant to Regulation FD as Exhibit 99.2 and is incorporated herein by reference, and the slide materials also can be accessed at the “Investors” section of the Company’s website (www.te.com).
Item 9.01. Financial Statements and Exhibits
(d) Exhibits
Exhibit |
| Description |
|
|
|
99.1 |
| |
|
|
|
99.2 |
| Presentation - TE Connectivity Q2 2020 Earnings Call (April 28, 2020) |
104 | Cover Page Interactive Data File (embedded within the Inline XBRL document) |
SIGNATURES
Pursuant to the requirements of the Securities Exchange Act of 1934, the Registrant has duly caused this report to be signed on its behalf by the undersigned hereunto duly authorized.
Exhibit 99.1
|
|
|
|
|
|
TE Connectivity announces second quarter results for fiscal year 2020
Year to date free cash flow up 34% year-over-year; Company has excess of $2 billion in available liquidity
SCHAFFHAUSEN, Switzerland – April 28, 2020 – TE Connectivity Ltd. (NYSE: TEL) today reported results for the fiscal second quarter ended March 27, 2020.
Second Quarter Highlights
|
· |
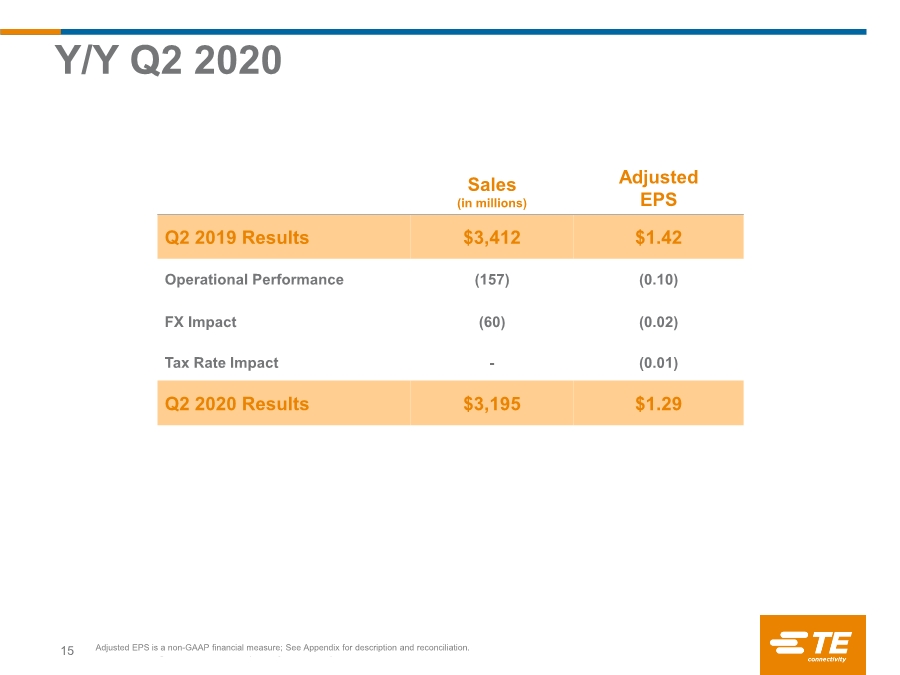
Net sales were $3.2 billion, in line with the company’s guidance, down 6% on a reported and down 5% on an organic basis over the second quarter of 2019. |
|
· |
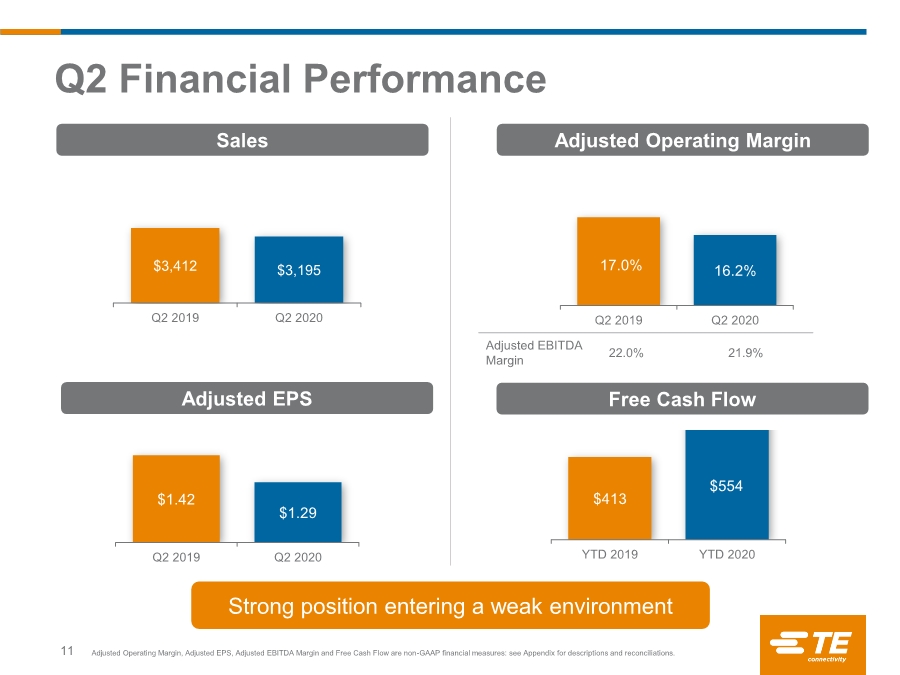
Diluted earnings per share (EPS) from continuing operations were a loss of $1.35. Adjusting for one-time impairment charge, adjusted EPS were $1.29, exceeding the high end of the company’s guidance. |
|
· |
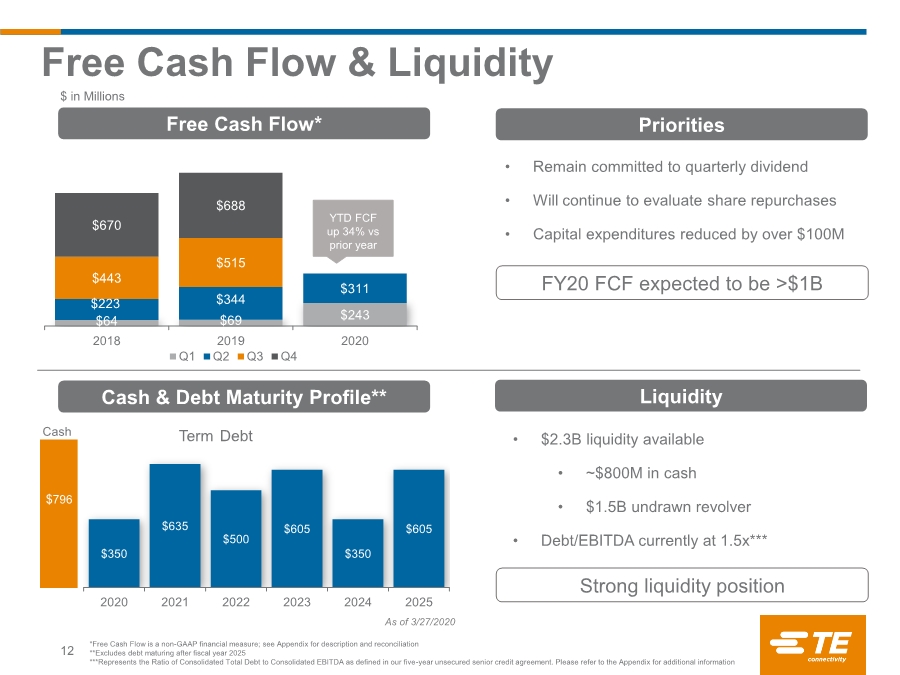
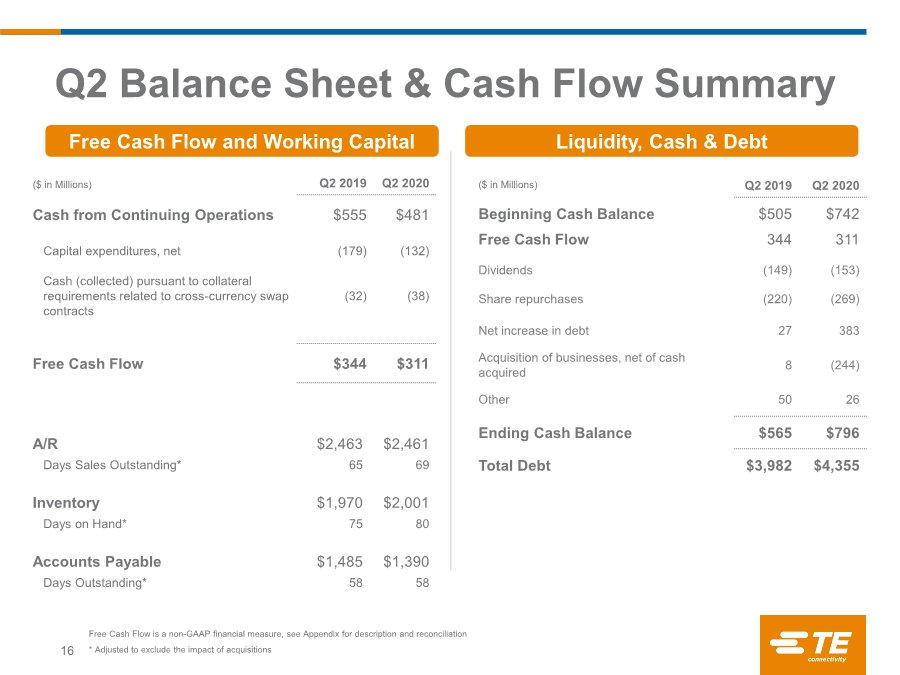
Cash flow from continuing operating activities was $481 million and free cash flow was $311 million. Year to date free cash flow up 34% versus prior year. During the quarter the company returned $433 million returned to shareholders. |
|
· |
Strong liquidity position with more than $2 billion available liquidity. |
“The market environment we guided to last quarter changed dramatically, and I’m pleased that we still delivered sales in line with our guidance and adjusted earnings per share above our expectations,” said TE Connectivity Chief Executive Officer Terrence Curtin. “Despite the impact of COVID-19, we were able to maintain adjusted operating margins above 16% due to the diversity of our portfolio, our global manufacturing strategy and our early execution of cost reduction actions. We continue to successfully prioritize the safety of our employees while keeping our commitments to our customers, and I want to thank our employees for their strong execution in what has been an unprecedented time for our global community. We expect to see COVID-related demand impacts in the second half of the year particularly in the transportation and commercial aerospace markets, but our strong free cash flow and liquidity allows us to continue to invest in long-term global growth trends and position us for further content growth when demand returns.”
2020 Outlook
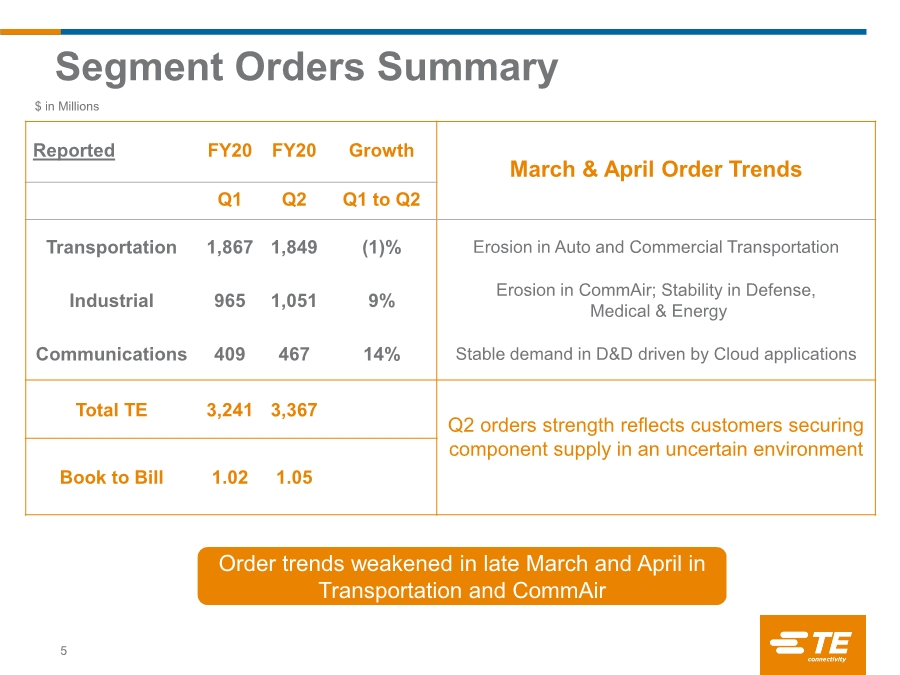
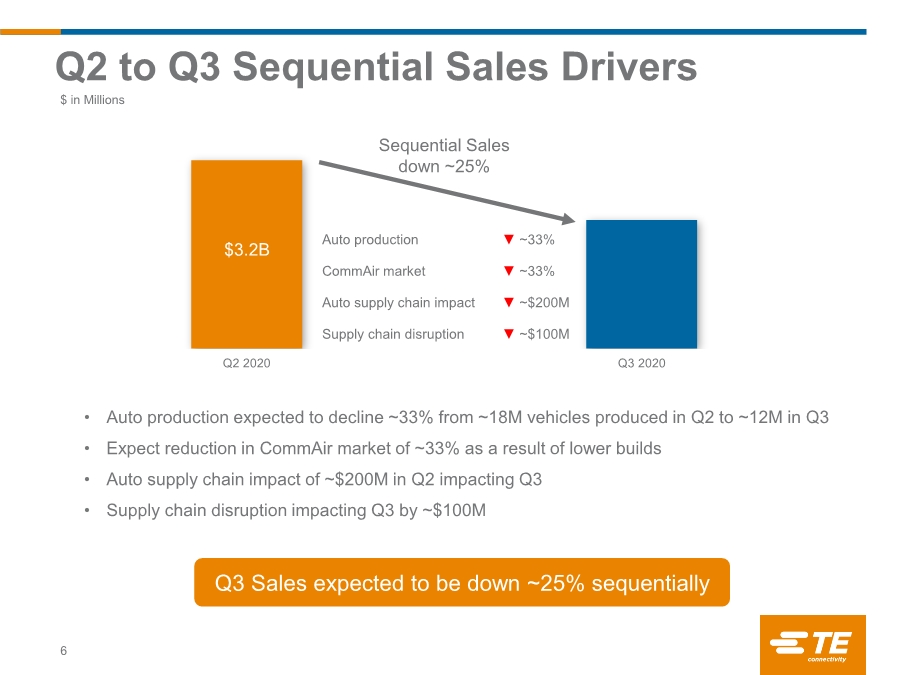
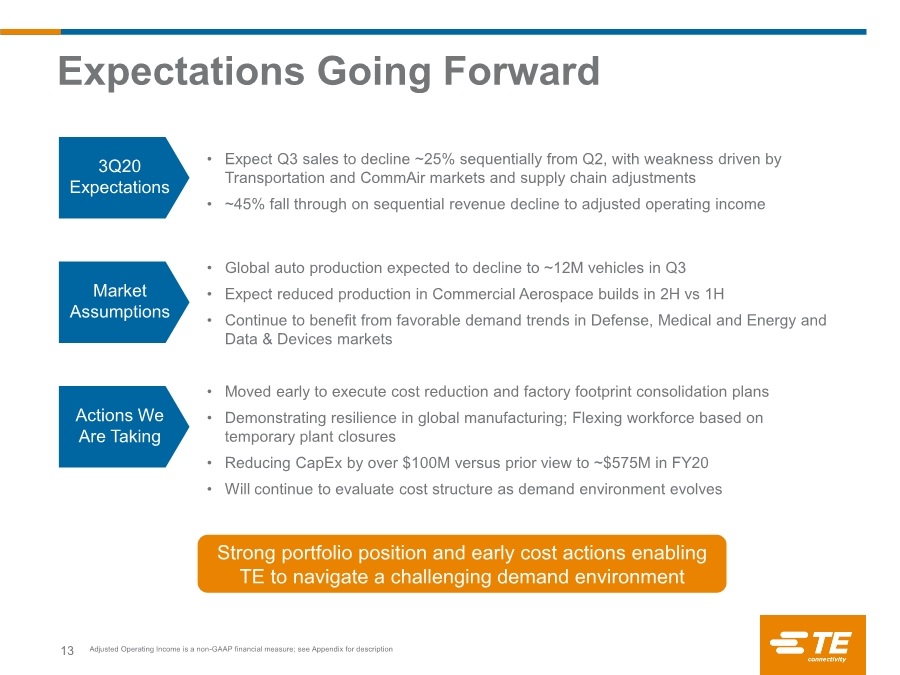
For the fiscal third quarter of 2020, the company expects net sales to be down approximately 25% sequentially, reflecting the impact of COVID-19 on the end demand environment, especially in the transportation and
1
commercial aerospace markets. The company is withdrawing its full year guidance due to limited visibility of COVID-19 impact on future demand.
Information about TE Connectivity’s use of non-GAAP financial measures is provided below. For reconciliations of these non-GAAP financial measures to the most directly comparable GAAP financial measures, see the attached tables.
Conference Call and Webcast
The company will hold a conference call today beginning at 8:30 a.m. ET. The dial-in information is provided here:
•At TE Connectivity's website: investors.te.com
•By telephone: For both "listen-only" participants and those participants who wish to take part in the question-and-answer portion of the call, the dial-in number in the United States is (866) 211-4092, and for international callers, the dial-in number is (647) 689-6620.
|
· |
A replay of the conference call will be available on TE Connectivity’s investor website at investors.te.com at 11:30 a.m. ET on April 28, 2020. |
About TE Connectivity
TE Connectivity Ltd. (NYSE: TEL) is a $13 billion global industrial technology leader creating a safer, sustainable, productive, and connected future. Our broad range of connectivity and sensor solutions, proven in the harshest environments, enable advancements in transportation, industrial applications, medical technology, energy, data communications, and the home. With nearly 80,000 employees, including more than 8,000 engineers, working alongside customers in approximately 150 countries, TE ensures that EVERY CONNECTION COUNTS. Learn more at www.te.com and on LinkedIn, Facebook, WeChat and Twitter.
Non-GAAP Financial Measures
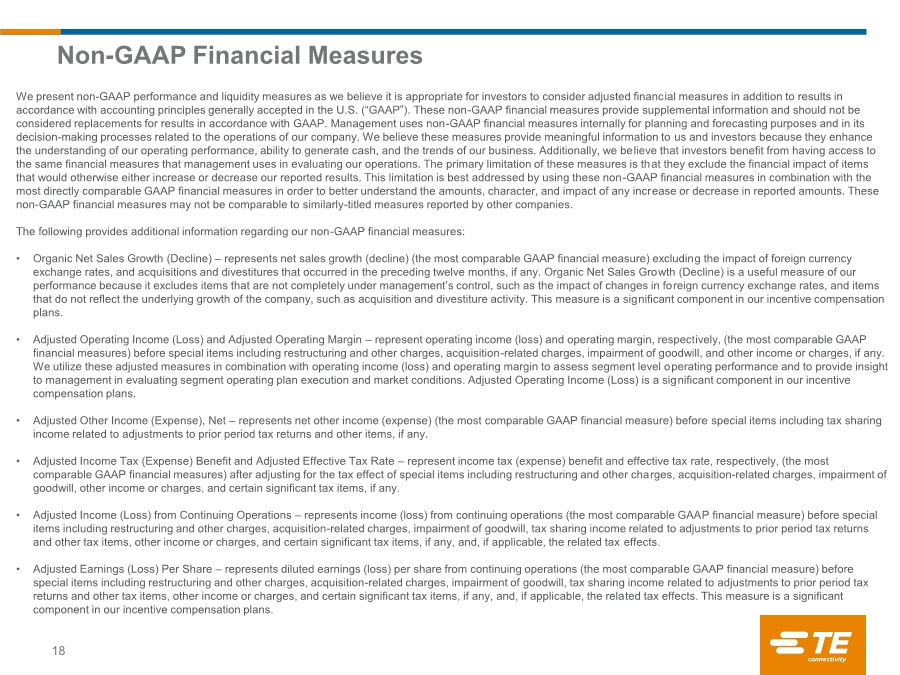
We present non-GAAP performance and liquidity measures as we believe it is appropriate for investors to consider adjusted financial measures in addition to results in accordance with accounting principles generally accepted in the U.S. (“GAAP”). These non-GAAP financial measures provide supplemental information and should not be considered replacements for results in accordance with GAAP. Management uses non-GAAP financial measures internally for planning and forecasting purposes and in its decision-making processes related to the operations of our company. We believe these measures provide meaningful information to us and investors because they enhance the understanding of our operating performance, ability to generate cash, and the trends of our business. Additionally, we believe that investors benefit from having access to the same financial measures that management uses in evaluating our operations. The primary limitation of these measures is that they exclude the financial impact of items that would otherwise either increase or decrease our reported results. This limitation is
2
best addressed by using these non-GAAP financial measures in combination with the most directly comparable GAAP financial measures in order to better understand the amounts, character, and impact of any increase or decrease in reported amounts. These non-GAAP financial measures may not be comparable to similarly-titled measures reported by other companies.
The following provides additional information regarding our non-GAAP financial measures:
•Organic Net Sales Growth (Decline) – represents net sales growth (decline) (the most comparable GAAP financial measure) excluding the impact of foreign currency exchange rates, and acquisitions and divestitures that occurred in the preceding twelve months, if any. Organic Net Sales Growth (Decline) is a useful measure of our performance because it excludes items that are not completely under management’s control, such as the impact of changes in foreign currency exchange rates, and items that do not reflect the underlying growth of the company, such as acquisition and divestiture activity. This measure is a significant component in our incentive compensation plans.
•Adjusted Operating Income (Loss) and Adjusted Operating Margin – represent operating income (loss) and operating margin, respectively, (the most comparable GAAP financial measures) before special items including restructuring and other charges, acquisition-related charges, impairment of goodwill, and other income or charges, if any. We utilize these adjusted measures in combination with operating income (loss) and operating margin to assess segment level operating performance and to provide insight to management in evaluating segment operating plan execution and market conditions. Adjusted Operating Income (Loss) is a significant component in our incentive compensation plans.
•Adjusted Other Income (Expense), Net – represents net other income (expense) (the most comparable GAAP financial measure) before special items including tax sharing income related to adjustments to prior period tax returns and other items, if any.
•Adjusted Income Tax (Expense) Benefit and Adjusted Effective Tax Rate – represent income tax (expense) benefit and effective tax rate, respectively, (the most comparable GAAP financial measures) after adjusting for the tax effect of special items including restructuring and other charges, acquisition-related charges, impairment of goodwill, other income or charges, and certain significant tax items, if any.
•Adjusted Income (Loss) from Continuing Operations – represents income (loss) from continuing operations (the most comparable GAAP financial measure) before special items including restructuring and other charges, acquisition-related charges, impairment of goodwill, tax sharing income related to adjustments to prior period tax returns and other tax items, other income or charges, and certain significant tax items, if any, and, if applicable, the related tax effects.
•Adjusted Earnings (Loss) Per Share – represents diluted earnings (loss) per share from continuing operations (the most comparable GAAP financial measure) before special items including restructuring and other charges, acquisition-related charges, impairment of goodwill, tax sharing income related to adjustments to prior period tax returns and other tax items, other income or charges, and certain significant tax items, if any, and, if applicable, the related tax effects. This measure is a significant component in our incentive compensation plans.
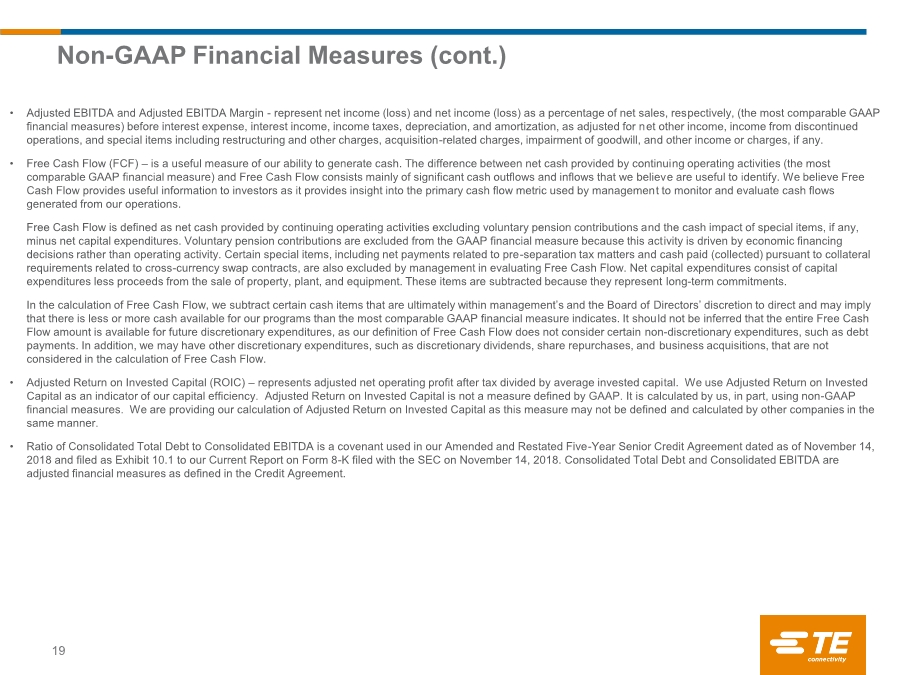
•Free Cash Flow (FCF) – is a useful measure of our ability to generate cash. The difference between net cash provided by continuing operating activities (the most comparable GAAP financial measure) and Free Cash Flow consists mainly of significant cash outflows and inflows that we believe are useful to identify. We believe Free
3
Cash Flow provides useful information to investors as it provides insight into the primary cash flow metric used by management to monitor and evaluate cash flows generated from our operations.
Free Cash Flow is defined as net cash provided by continuing operating activities excluding voluntary pension contributions and the cash impact of special items, if any, minus net capital expenditures. Voluntary pension contributions are excluded from the GAAP financial measure because this activity is driven by economic financing decisions rather than operating activity. Certain special items, including net payments related to pre-separation tax matters and cash paid (collected) pursuant to collateral requirements related to cross-currency swap contracts, are also excluded by management in evaluating Free Cash Flow. Net capital expenditures consist of capital expenditures less proceeds from the sale of property, plant, and equipment. These items are subtracted because they represent long-term commitments.
In the calculation of Free Cash Flow, we subtract certain cash items that are ultimately within management’s and the Board of Directors’ discretion to direct and may imply that there is less or more cash available for our programs than the most comparable GAAP financial measure indicates. It should not be inferred that the entire Free Cash Flow amount is available for future discretionary expenditures, as our definition of Free Cash Flow does not consider certain non-discretionary expenditures, such as debt payments. In addition, we may have other discretionary expenditures, such as discretionary dividends, share repurchases, and business acquisitions, that are not considered in the calculation of Free Cash Flow.
Forward-Looking Statements
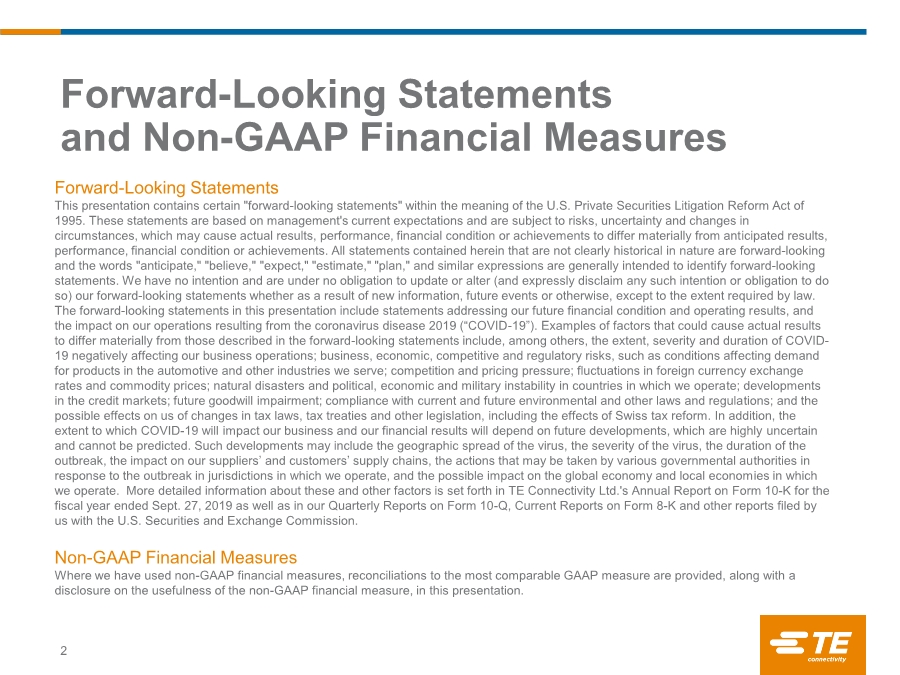
This release contains certain "forward-looking statements" within the meaning of the U.S. Private Securities Litigation Reform Act of 1995. These statements are based on management's current expectations and are subject to risks, uncertainty and changes in circumstances, which may cause actual results, performance, financial condition or achievements to differ materially from anticipated results, performance, financial condition or achievements. All statements contained herein that are not clearly historical in nature are forward-looking and the words "anticipate," "believe," "expect," "estimate," "plan," and similar expressions are generally intended to identify forward-looking statements. We have no intention and are under no obligation to update or alter (and expressly disclaim any such intention or obligation to do so) our forward-looking statements whether as a result of new information, future events or otherwise, except to the extent required by law. The forward-looking statements in this release include statements addressing our future financial condition and operating results, and the impact on our operations resulting from the coronavirus disease 2019 (“COVID-19”). Examples of factors that could cause actual results to differ materially from those described in the forward-looking statements include, among others, the extent, severity and duration of COVID-19 negatively affecting our business operations; business, economic, competitive and regulatory risks, such as conditions affecting demand for products in the automotive and other industries we serve; competition and pricing pressure; fluctuations in foreign currency exchange rates and commodity prices; natural disasters and political, economic and military instability in countries in which we operate; developments in the credit markets; future goodwill impairment; compliance with current and future environmental and other laws and regulations; and the possible effects on us of changes in tax laws, tax treaties and other legislation, including the effects of Swiss tax reform. In addition, the extent to which COVID-19 will impact our business and our financial results will depend on future developments, which are highly uncertain and cannot be predicted. Such developments may include the geographic spread of the virus, the severity of the virus, the duration of the outbreak, the impact on our suppliers’ and customers’ supply chains, the actions that may be taken by various governmental authorities in response to the outbreak in jurisdictions in which we operate, and the possible impact on the global economy and local economies in which we operate. More detailed information about
4
these and other factors is set forth in TE Connectivity Ltd.'s Annual Report on Form 10-K for the fiscal year ended Sept. 27, 2019 as well as in our Quarterly Reports on Form 10-Q, Current Reports on Form 8-K and other reports filed by us with the U.S. Securities and Exchange Commission.
# # #
|
Contacts: |
Media Relations: Fernando Vivanco TE Connectivity 610-893-9756 |
Investor Relations: Sujal Shah TE Connectivity 610-893-9790 |
5
TE CONNECTIVITY LTD.
CONSOLIDATED STATEMENTS OF OPERATIONS (UNAUDITED)
|
|
For the Quarters Ended |
|
For the Six Months Ended |
||||||||
|
|
March 27, |
|
March 29, |
|
March 27, |
|
March 29, |
||||
|
|
2020 |
|
2019 |
|
2020 |
|
2019 |
||||
|
|
(in millions, except per share data) |
||||||||||
|
Net sales |
$ |
3,195 |
|
$ |
3,412 |
|
$ |
6,363 |
|
$ |
6,759 |
|
Cost of sales |
|
2,166 |
|
|
2,294 |
|
|
4,304 |
|
|
4,527 |
|
Gross margin |
|
1,029 |
|
|
1,118 |
|
|
2,059 |
|
|
2,232 |
|
Selling, general, and administrative expenses |
|
352 |
|
|
373 |
|
|
719 |
|
|
762 |
|
Research, development, and engineering expenses |
|
158 |
|
|
166 |
|
|
319 |
|
|
327 |
|
Acquisition and integration costs |
|
12 |
|
|
7 |
|
|
19 |
|
|
12 |
|
Restructuring and other charges, net |
|
22 |
|
|
42 |
|
|
46 |
|
|
117 |
|
Impairment of goodwill |
|
900 |
|
|
- |
|
|
900 |
|
|
- |
|
Operating income (loss) |
|
(415) |
|
|
530 |
|
|
56 |
|
|
1,014 |
|
Interest income |
|
5 |
|
|
4 |
|
|
11 |
|
|
9 |
|
Interest expense |
|
(11) |
|
|
(15) |
|
|
(23) |
|
|
(42) |
|
Other income, net |
|
11 |
|
|
1 |
|
|
16 |
|
|
- |
|
Income (loss) from continuing operations before income taxes |
|
(410) |
|
|
520 |
|
|
60 |
|
|
981 |
|
Income tax expense |
|
(42) |
|
|
(91) |
|
|
(489) |
|
|
(169) |
|
Income (loss) from continuing operations |
|
(452) |
|
|
429 |
|
|
(429) |
|
|
812 |
|
Income (loss) from discontinued operations, net of income taxes |
|
(4) |
|
|
10 |
|
|
(1) |
|
|
(97) |
|
Net income (loss) |
$ |
(456) |
|
$ |
439 |
|
$ |
(430) |
|
$ |
715 |
|
|
|
|
|
|
|
|
|
|
|
|
|
|
Basic earnings (loss) per share: |
|
|
|
|
|
|
|
|
|
|
|
|
Income (loss) from continuing operations |
$ |
(1.35) |
|
$ |
1.27 |
|
$ |
(1.28) |
|
$ |
2.39 |
|
Income (loss) from discontinued operations |
|
(0.01) |
|
|
0.03 |
|
|
- |
|
|
(0.29) |
|
Net income (loss) |
|
(1.37) |
|
|
1.30 |
|
|
(1.29) |
|
|
2.10 |
|
|
|
|
|
|
|
|
|
|
|
|
|
|
Diluted earnings (loss) per share: |
|
|
|
|
|
|
|
|
|
|
|
|
Income (loss) from continuing operations |
$ |
(1.35) |
|
$ |
1.26 |
|
$ |
(1.28) |
|
$ |
2.37 |
|
Income (loss) from discontinued operations |
|
(0.01) |
|
|
0.03 |
|
|
- |
|
|
(0.28) |
|
Net income (loss) |
|
(1.37) |
|
|
1.29 |
|
|
(1.29) |
|
|
2.09 |
|
|
|
|
|
|
|
|
|
|
|
|
|
|
Weighted-average number of shares outstanding: |
|
|
|
|
|
|
|
|
|
|
|
|
Basic |
|
334 |
|
|
338 |
|
|
334 |
|
|
340 |
|
Diluted |
|
334 |
|
|
340 |
|
|
334 |
|
|
342 |
6
TE CONNECTIVITY LTD.
CONSOLIDATED BALANCE SHEETS (UNAUDITED)
|
|
March 27, |
|
September 27, |
||
|
|
2020 |
|
2019 |
||
|
|
(in millions, except share data) |
||||
|
Assets |
|
|
|
|
|
|
Current assets: |
|
|
|
|
|
|
Cash and cash equivalents |
$ |
796 |
|
$ |
927 |
|
Accounts receivable, net of allowance for doubtful accounts of $32 and $25, respectively |
|
2,461 |
|
|
2,320 |
|
Inventories |
|
2,001 |
|
|
1,836 |
|
Prepaid expenses and other current assets |
|
457 |
|
|
471 |
|
Total current assets |
|
5,715 |
|
|
5,554 |
|
Property, plant, and equipment, net |
|
3,558 |
|
|
3,574 |
|
Goodwill |
|
5,235 |
|
|
5,740 |
|
Intangible assets, net |
|
1,547 |
|
|
1,596 |
|
Deferred income taxes |
|
2,382 |
|
|
2,776 |
|
Other assets |
|
930 |
|
|
454 |
|
Total assets |
$ |
19,367 |
|
$ |
19,694 |
|
|
|
|
|
|
|
|
Liabilities and equity |
|
|
|
|
|
|
Current liabilities: |
|
|
|
|
|
|
Short-term debt |
$ |
603 |
|
$ |
570 |
|
Accounts payable |
|
1,390 |
|
|
1,357 |
|
Accrued and other current liabilities |
|
1,966 |
|
|
1,613 |
|
Total current liabilities |
|
3,959 |
|
|
3,540 |
|
Long-term debt |
|
3,752 |
|
|
3,395 |
|
Long-term pension and postretirement liabilities |
|
1,359 |
|
|
1,367 |
|
Deferred income taxes |
|
126 |
|
|
156 |
|
Income taxes |
|
228 |
|
|
239 |
|
Other liabilities |
|
772 |
|
|
427 |
|
Total liabilities |
|
10,196 |
|
|
9,124 |
|
Commitments and contingencies |
|
|
|
|
|
|
Equity: |
|
|
|
|
|
|
TE Connectivity Ltd. shareholders' equity: |
|
|
|
|
|
|
Common shares, CHF 0.57 par value, 350,951,381 shares authorized and issued |
|
154 |
|
|
154 |
|
Accumulated earnings |
|
11,122 |
|
|
12,256 |
|
Treasury shares, at cost, 19,877,795 and 15,862,337 shares, respectively |
|
(1,639) |
|
|
(1,337) |
|
Accumulated other comprehensive loss |
|
(571) |
|
|
(503) |
|
Total TE Connectivity Ltd. shareholders' equity |
|
9,066 |
|
|
10,570 |
|
Noncontrolling interests |
|
105 |
|
|
- |
|
Total equity |
|
9,171 |
|
|
10,570 |
|
Total liabilities and equity |
$ |
19,367 |
|
$ |
19,694 |
7
TE CONNECTIVITY LTD.
CONSOLIDATED STATEMENTS OF CASH FLOWS (UNAUDITED)
|
|
For the Quarters Ended |
|
For the Six Months Ended |
||||||||
|
|
March 27, |
|
March 29, |
|
March 27, |
|
March 29, |
||||
|
|
2020 |
|
2019 |
|
2020 |
|
2019 |
||||
|
|
(in millions) |
||||||||||
|
Cash flows from operating activities: |
|
|
|
|
|
|
|
|
|
|
|
|
Net income (loss) |
$ |
(456) |
|
$ |
439 |
|
$ |
(430) |
|
$ |
715 |
|
(Income) loss from discontinued operations, net of income taxes |
|
4 |
|
|
(10) |
|
|
1 |
|
|
97 |
|
Income (loss) from continuing operations |
|
(452) |
|
|
429 |
|
|
(429) |
|
|
812 |
|
Adjustments to reconcile income (loss) from continuing operations to net cash provided by operating activities: |
|
|
|
|
|
|
|
|
|
|
|
|
Impairment of goodwill |
|
900 |
|
|
- |
|
|
900 |
|
|
- |
|
Depreciation and amortization |
|
180 |
|
|
173 |
|
|
354 |
|
|
341 |
|
Deferred income taxes |
|
(49) |
|
|
(17) |
|
|
345 |
|
|
(28) |
|
Non-cash lease cost |
|
25 |
|
|
- |
|
|
52 |
|
|
- |
|
Provision for losses on accounts receivable and inventories |
|
(2) |
|
|
5 |
|
|
18 |
|
|
28 |
|
Share-based compensation expense |
|
15 |
|
|
15 |
|
|
37 |
|
|
38 |
|
Other |
|
1 |
|
|
14 |
|
|
11 |
|
|
32 |
|
Changes in assets and liabilities, net of the effects of acquisitions and divestitures: |
|
|
|
|
|
|
|
|
|
|
|
|
Accounts receivable, net |
|
(116) |
|
|
(81) |
|
|
(140) |
|
|
(107) |
|
Inventories |
|
25 |
|
|
49 |
|
|
(151) |
|
|
(70) |
|
Prepaid expenses and other current assets |
|
48 |
|
|
24 |
|
|
25 |
|
|
91 |
|
Accounts payable |
|
(45) |
|
|
(35) |
|
|
49 |
|
|
(44) |
|
Accrued and other current liabilities |
|
5 |
|
|
(16) |
|
|
(180) |
|
|
(206) |
|
Income taxes |
|
(9) |
|
|
6 |
|
|
1 |
|
|
21 |
|
Other |
|
(45) |
|
|
(11) |
|
|
- |
|
|
(25) |
|
Net cash provided by continuing operating activities |
|
481 |
|
|
555 |
|
|
892 |
|
|
883 |
|
Net cash provided by (used in) discontinued operating activities |
|
- |
|
|
1 |
|
|
- |
|
|
(30) |
|
Net cash provided by operating activities |
|
481 |
|
|
556 |
|
|
892 |
|
|
853 |
|
Cash flows from investing activities: |
|
|
|
|
|
|
|
|
|
|
|
|
Capital expenditures |
|
(133) |
|
|
(191) |
|
|
(309) |
|
|
(401) |
|
Proceeds from sale of property, plant, and equipment |
|
1 |
|
|
12 |
|
|
3 |
|
|
13 |
|
Acquisition of businesses, net of cash acquired |
|
(244) |
|
|
8 |
|
|
(359) |
|
|
8 |
|
Proceeds from divestiture of discontinued operation, net of cash retained by sold operation |
|
- |
|
|
9 |
|
|
- |
|
|
297 |
|
Other |
|
(2) |
|
|
(3) |
|
|
(2) |
|
|
- |
|
Net cash used in continuing investing activities |
|
(378) |
|
|
(165) |
|
|
(667) |
|
|
(83) |
|
Net cash used in discontinued investing activities |
|
- |
|
|
- |
|
|
- |
|
|
(2) |
|
Net cash used in investing activities |
|
(378) |
|
|
(165) |
|
|
(667) |
|
|
(85) |
|
Cash flows from financing activities: |
|
|
|
|
|
|
|
|
|
|
|
|
Net increase (decrease) in commercial paper |
|
(210) |
|
|
27 |
|
|
(219) |
|
|
90 |
|
Proceeds from issuance of debt |
|
593 |
|
|
- |
|
|
593 |
|
|
350 |
|
Repayment of debt |
|
- |
|
|
- |
|
|
- |
|
|
(441) |
|
Proceeds from exercise of share options |
|
13 |
|
|
10 |
|
|
27 |
|
|
17 |
|
Repurchase of common shares |
|
(269) |
|
|
(220) |
|
|
(408) |
|
|
(739) |
|
Payment of common share dividends to shareholders |
|
(153) |
|
|
(149) |
|
|
(307) |
|
|
(299) |
|
Transfers (to) from discontinued operations |
|
- |
|
|
1 |
|
|
- |
|
|
(32) |
|
Other |
|
(5) |
|
|
(1) |
|
|
(31) |
|
|
(30) |
|
Net cash used in continuing financing activities |
|
(31) |
|
|
(332) |
|
|
(345) |
|
|
(1,084) |
|
Net cash provided by (used in) discontinued financing activities |
|
- |
|
|
(1) |
|
|
- |
|
|
32 |
|
Net cash used in financing activities |
|
(31) |
|
|
(333) |
|
|
(345) |
|
|
(1,052) |
|
Effect of currency translation on cash |
|
(18) |
|
|
2 |
|
|
(11) |
|
|
1 |
|
Net increase (decrease) in cash, cash equivalents, and restricted cash |
|
54 |
|
|
60 |
|
|
(131) |
|
|
(283) |
|
Cash, cash equivalents, and restricted cash at beginning of period |
|
742 |
|
|
505 |
|
|
927 |
|
|
848 |
|
Cash, cash equivalents, and restricted cash at end of period |
$ |
796 |
|
$ |
565 |
|
$ |
796 |
|
$ |
565 |
|
|
|
|
|
|
|
|
|
|
|
|
|
|
Supplemental cash flow information: |
|
|
|
|
|
|
|
|
|
|
|
|
Interest paid on debt, net |
$ |
20 |
|
$ |
33 |
|
$ |
24 |
|
$ |
52 |
|
Income taxes paid, net of refunds |
|
101 |
|
|
102 |
|
|
144 |
|
|
177 |
8
TE CONNECTIVITY LTD.
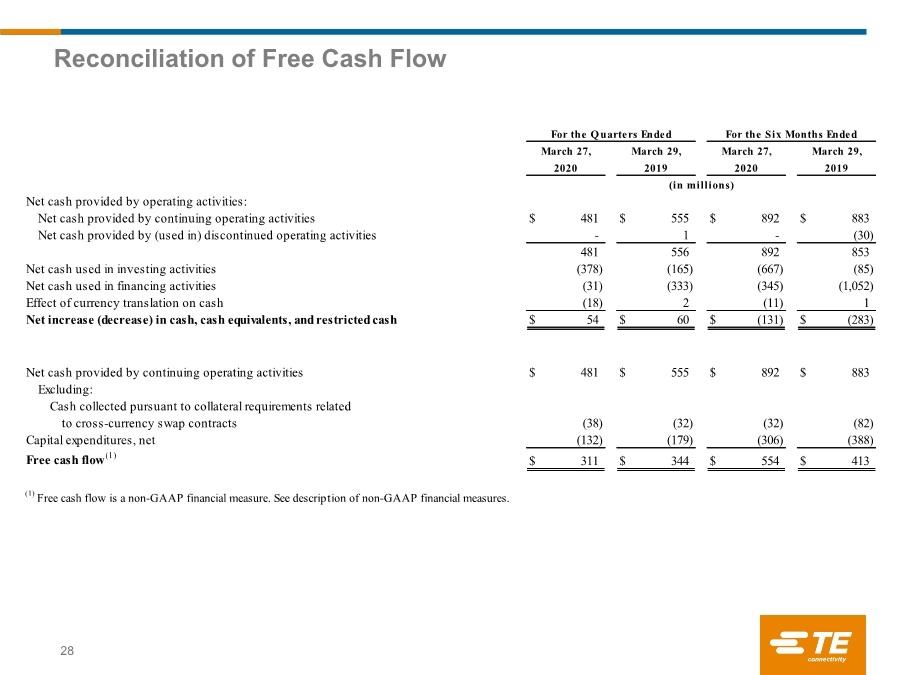
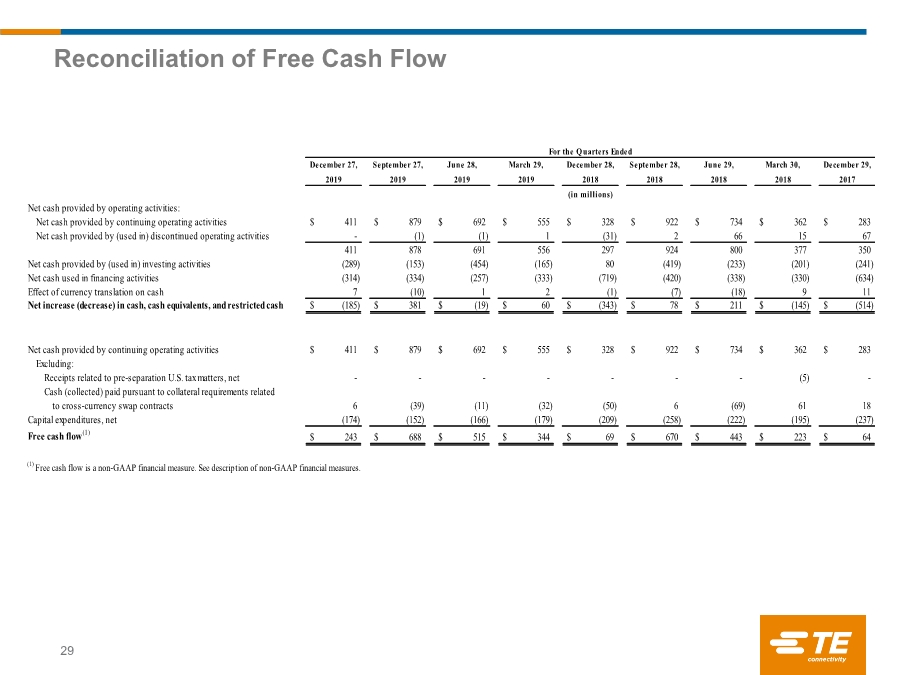
RECONCILIATION OF FREE CASH FLOW (UNAUDITED)
|
|
For the Quarters Ended |
|
For the Six Months Ended |
||||||||
|
|
March 27, |
|
March 29, |
|
March 27, |
|
March 29, |
||||
|
|
2020 |
|
2019 |
|
2020 |
|
2019 |
||||
|
|
(in millions) |
||||||||||
|
Net cash provided by continuing operating activities |
$ |
481 |
|
$ |
555 |
|
$ |
892 |
|
$ |
883 |
|
Excluding: |
|
|
|
|
|
|
|
|
|
|
|
|
Cash collected pursuant to collateral requirements related to cross-currency swap contracts |
|
(38) |
|
|
(32) |
|
|
(32) |
|
|
(82) |
|
Capital expenditures, net |
|
(132) |
|
|
(179) |
|
|
(306) |
|
|
(388) |
|
Free cash flow (1) |
$ |
311 |
|
$ |
344 |
|
$ |
554 |
|
$ |
413 |
|
|
|
|
|
|
|
|
|
|
|
|
|
|
(1) Free cash flow is a non-GAAP financial measure. See description of non-GAAP financial measures. |
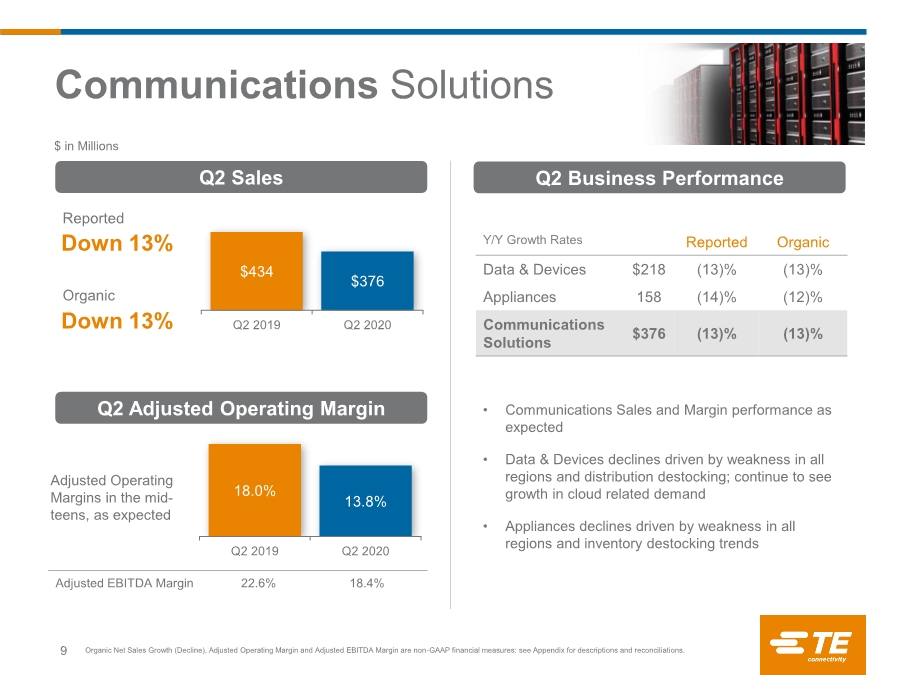
|||||||||||
9
TE CONNECTIVITY LTD.
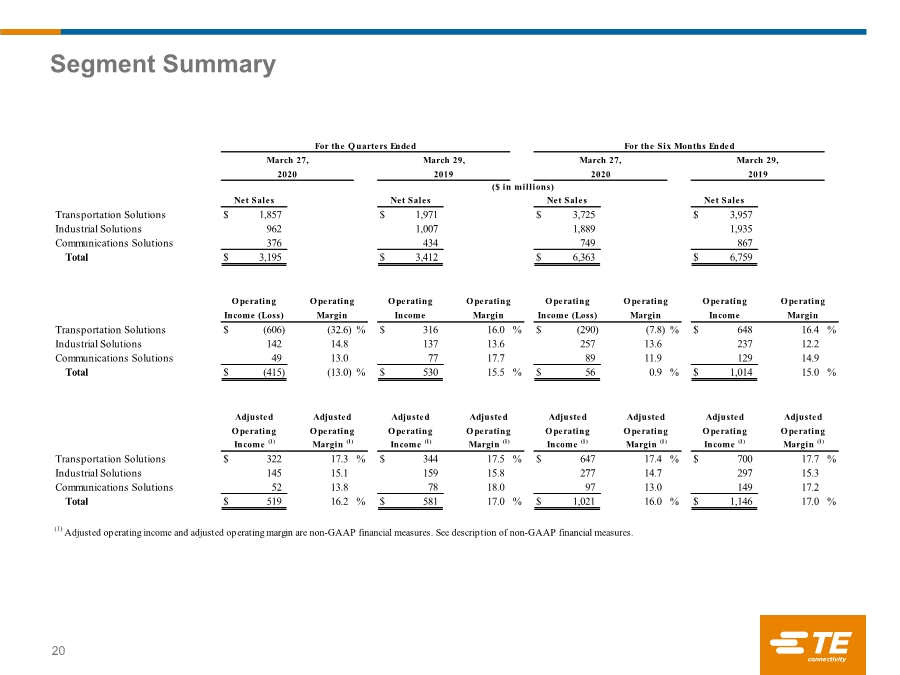
CONSOLIDATED SEGMENT DATA (UNAUDITED)
|
|
For the Quarters Ended |
|
|
For the Six Months Ended |
|
||||||||||||||||||
|
|
March 27, |
|
|
March 29, |
|
|
March 27, |
|
|
March 29, |
|
||||||||||||
|
|
2020 |
|
|
2019 |
|
|
2020 |
|
|
2019 |
|
||||||||||||
|
|
($ in millions) |
|
|||||||||||||||||||||
|
|
Net Sales |
|
|
|
|
Net Sales |
|
|
|
|
Net Sales |
|
|
|
|
Net Sales |
|
|
|
||||
|
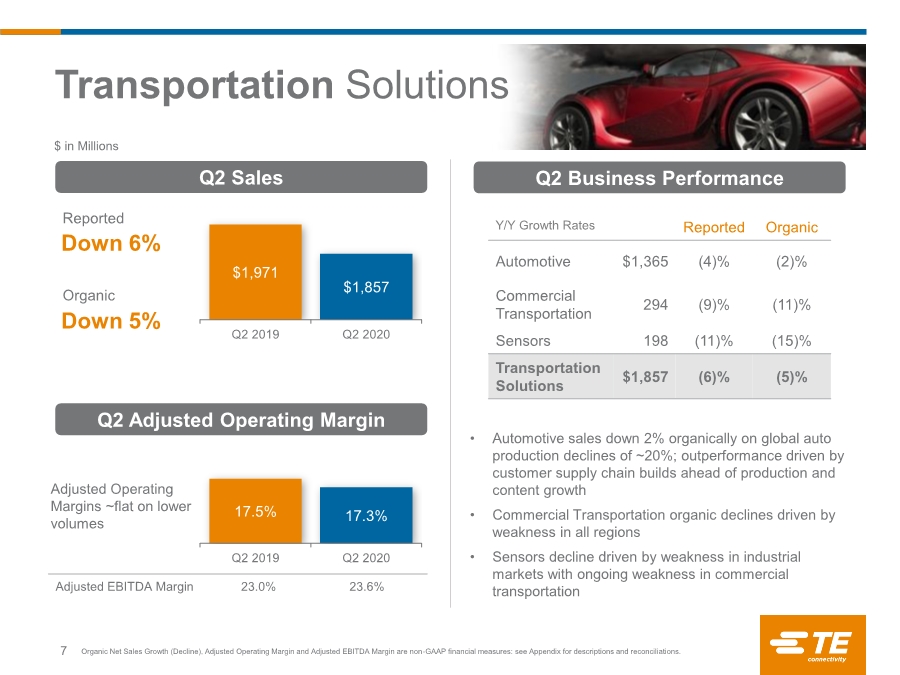
Transportation Solutions |
$ |
1,857 |
|
|
|
|
$ |
1,971 |
|
|
|
|
$ |
3,725 |
|
|
|
|
$ |
3,957 |
|
|
|
|
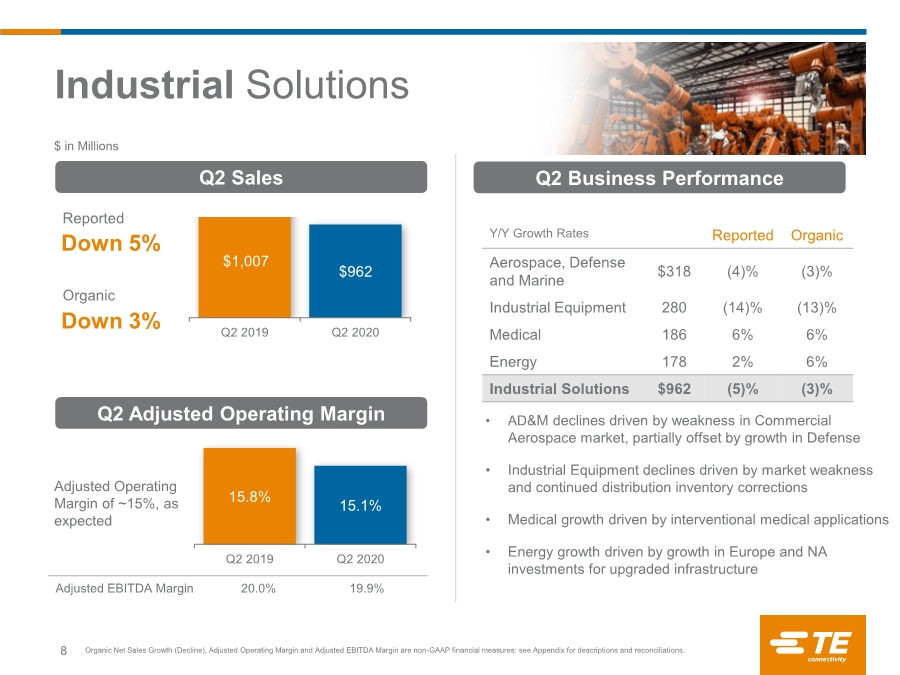
Industrial Solutions |
|
962 |
|
|
|
|
|
1,007 |
|
|
|
|
|
1,889 |
|
|
|
|
|
1,935 |
|
|
|
|
Communications Solutions |
|
376 |
|
|
|
|
|
434 |
|
|
|
|
|
749 |
|
|
|
|
|
867 |
|
|
|
|
Total |
$ |
3,195 |
|
|
|
|
$ |
3,412 |
|
|
|
|
$ |
6,363 |
|
|
|
|
$ |
6,759 |
|
|
|
|
|
|
|
|
|
|
|
|
|
|
|
|
|
|
|
|
|
|
|
|
|
|
|
|
|
|
|
|
|
|
|
|
|
|
|
|
|
|
|
|
|
|
|
|
|
|
|
|
|
|
|
Operating |
|
Operating |
|
Operating |
|
Operating |
|
Operating |
|
Operating |
|
Operating |
|
Operating |
||||||||
|
|
Income (Loss) |
|
Margin |
|
Income |
|
Margin |
|
Income (Loss) |
|
Margin |
|
Income |
|
Margin |
||||||||
|
Transportation Solutions |
$ |
(606) |
|
(32.6) |
% |
|
$ |
316 |
|
16.0 |
% |
|
$ |
(290) |
|
(7.8) |
% |
|
$ |
648 |
|
16.4 |
% |
|
Industrial Solutions |
|
142 |
|
14.8 |
|
|
|
137 |
|
13.6 |
|
|
|
257 |
|
13.6 |
|
|
|
237 |
|
12.2 |
|
|
Communications Solutions |
|
49 |
|
13.0 |
|
|
|
77 |
|
17.7 |
|
|
|
89 |
|
11.9 |
|
|
|
129 |
|
14.9 |
|
|
Total |
$ |
(415) |
|
(13.0) |
% |
|
$ |
530 |
|
15.5 |
% |
|
$ |
56 |
|
0.9 |
% |
|
$ |
1,014 |
|
15.0 |
% |
|
|
|
|
|
|
|
|
|
|
|
|
|
|
|
|
|
|
|
|
|
|
|
|
|
|
|
|
|
|
|
|
|
|
|
|
|
|
|
|
|
|
|
|
|
|
|
|
|
|
|
|
Adjusted |
|
Adjusted |
|
Adjusted |
|
Adjusted |
|
Adjusted |
|
Adjusted |
|
Adjusted |
|
Adjusted |
||||||||
|
|
Operating |
|
Operating |
|
Operating |
|
Operating |
|
Operating |
|
Operating |
|
Operating |
|
Operating |
||||||||
|
|
Income (1) |
|
Margin (1) |
|
Income (1) |
|
Margin (1) |
|
Income (1) |
|
Margin (1) |
|
Income (1) |
|
Margin (1) |
||||||||
|
Transportation Solutions |
$ |
322 |
|
17.3 |
% |
|
$ |
344 |
|
17.5 |
% |
|
$ |
647 |
|
17.4 |
% |
|
$ |
700 |
|
17.7 |
% |
|
Industrial Solutions |
|
145 |
|
15.1 |
|
|
|
159 |
|
15.8 |
|
|
|
277 |
|
14.7 |
|
|
|
297 |
|
15.3 |
|
|
Communications Solutions |
|
52 |
|
13.8 |
|
|
|
78 |
|
18.0 |
|
|
|
97 |
|
13.0 |
|
|
|
149 |
|
17.2 |
|
|
Total |
$ |
519 |
|
16.2 |
% |
|
$ |
581 |
|
17.0 |
% |
|
$ |
1,021 |
|
16.0 |
% |
|
$ |
1,146 |
|
17.0 |
% |
|
|
|
|
|
|
|
|
|
|
|
|
|
|
|
|
|
|
|
|
|
|
|
|
|
|
(1) Adjusted operating income and adjusted operating margin are non-GAAP financial measures. See description of non-GAAP financial measures. |
|

||||||||||||||||||||||
10
TE CONNECTIVITY LTD.
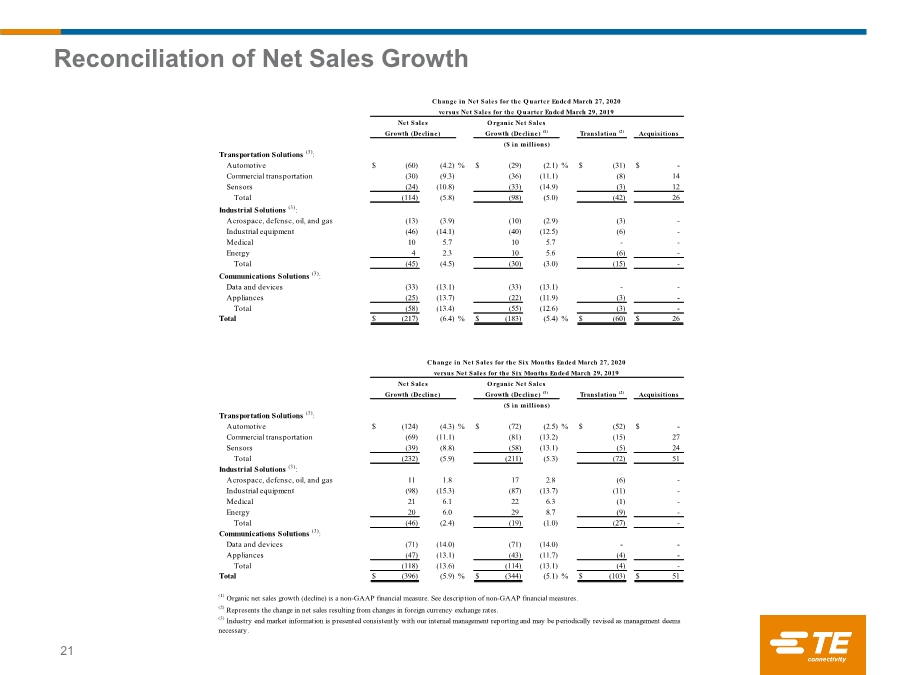
RECONCILIATION OF NET SALES GROWTH (DECLINE) (UNAUDITED)
|
|
Change in Net Sales for the Quarter Ended March 27, 2020 |
||||||||||||||||
|
|
versus Net Sales for the Quarter Ended March 29, 2019 |
||||||||||||||||
|
|
Net Sales |
|
|
Organic Net Sales |
|
|
|
|
|
||||||||
|
|
Growth (Decline) |
|
|
Growth (Decline) (1) |
|
|
Translation (2) |
|
Acquisitions |
||||||||
|
|
($ in millions) |
||||||||||||||||
|
Transportation Solutions (3): |
|
|
|
|
|
|
|
|
|
|
|
|
|
|
|
|
|
|
Automotive |
$ |
(60) |
|
(4.2) |
% |
|
$ |
(29) |
|
(2.1) |
% |
|
$ |
(31) |
|
$ |
- |
|
Commercial transportation |
|
(30) |
|
(9.3) |
|
|
|
(36) |
|
(11.1) |
|
|
|
(8) |
|
|
14 |
|
Sensors |
|
(24) |
|
(10.8) |
|
|
|
(33) |
|
(14.9) |
|
|
|
(3) |
|
|
12 |
|
Total |
|
(114) |
|
(5.8) |
|
|
|
(98) |
|
(5.0) |
|
|
|
(42) |
|
|
26 |
|
Industrial Solutions (3): |
|
|
|
|
|
|
|
|
|
|
|
|
|
|
|
|
|
|
Aerospace, defense, oil, and gas |
|
(13) |
|
(3.9) |
|
|
|
(10) |
|
(2.9) |
|
|
|
(3) |
|
|
- |
|
Industrial equipment |
|
(46) |
|
(14.1) |
|
|
|
(40) |
|
(12.5) |
|
|
|
(6) |
|
|
- |
|
Medical |
|
10 |
|
5.7 |
|
|
|
10 |
|
5.7 |
|
|
|
- |
|
|
- |
|
Energy |
|
4 |
|
2.3 |
|
|
|
10 |
|
5.6 |
|
|
|
(6) |
|
|
- |
|
Total |
|
(45) |
|
(4.5) |
|
|
|
(30) |
|
(3.0) |
|
|
|
(15) |
|
|
- |
|
Communications Solutions (3): |
|
|
|
|
|
|
|
|
|
|
|
|
|
|
|
|
|
|
Data and devices |
|
(33) |
|
(13.1) |
|
|
|
(33) |
|
(13.1) |
|
|
|
- |
|
|
- |
|
Appliances |
|
(25) |
|
(13.7) |
|
|
|
(22) |
|
(11.9) |
|
|
|
(3) |
|
|
- |
|
Total |
|
(58) |
|
(13.4) |
|
|
|
(55) |
|
(12.6) |
|
|
|
(3) |
|
|
- |
|
Total |
$ |
(217) |
|
(6.4) |
% |
|
$ |
(183) |
|
(5.4) |
% |
|
$ |
(60) |
|
$ |
26 |
|
|
Change in Net Sales for the Six Months Ended March 27, 2020 |
||||||||||||||||
|
|
versus Net Sales for the Six Months Ended March 29, 2019 |
||||||||||||||||
|
|
Net Sales |
|
|
Organic Net Sales |
|
|
|
|
|
||||||||
|
|
Growth (Decline) |
|
|
Growth (Decline) (1) |
|
|
Translation (2) |
|
Acquisitions |
||||||||
|
|
($ in millions) |
||||||||||||||||
|
Transportation Solutions (3): |
|
|
|
|
|
|
|
|
|
|
|
|
|
|
|
|
|
|
Automotive |
$ |
(124) |
|
(4.3) |
% |
|
$ |
(72) |
|
(2.5) |
% |
|
$ |
(52) |
|
$ |
- |
|
Commercial transportation |
|
(69) |
|
(11.1) |
|
|
|
(81) |
|
(13.2) |
|
|
|
(15) |
|
|
27 |
|
Sensors |
|
(39) |
|
(8.8) |
|
|
|
(58) |
|
(13.1) |
|
|
|
(5) |
|
|
24 |
|
Total |
|
(232) |
|
(5.9) |
|
|
|
(211) |
|
(5.3) |
|
|
|
(72) |
|
|
51 |
|
Industrial Solutions (3): |
|
|
|
|
|
|
|
|
|
|
|
|
|
|
|
|
|
|
Aerospace, defense, oil, and gas |
|
11 |
|
1.8 |
|
|
|
17 |
|
2.8 |
|
|
|
(6) |
|
|
- |
|
Industrial equipment |
|
(98) |
|
(15.3) |
|
|
|
(87) |
|
(13.7) |
|
|
|
(11) |
|
|
- |
|
Medical |
|
21 |
|
6.1 |
|
|
|
22 |
|
6.3 |
|
|
|
(1) |
|
|
- |
|
Energy |
|
20 |
|
6.0 |
|
|
|
29 |
|
8.7 |
|
|
|
(9) |
|
|
- |
|
Total |
|
(46) |
|
(2.4) |
|
|
|
(19) |
|
(1.0) |
|
|
|
(27) |
|
|
- |
|
Communications Solutions (3): |
|
|
|
|
|
|
|
|
|
|
|
|
|
|
|
|
|
|
Data and devices |
|
(71) |
|
(14.0) |
|
|
|
(71) |
|
(14.0) |
|
|
|
- |
|
|
- |
|
Appliances |
|
(47) |
|
(13.1) |
|
|
|
(43) |
|
(11.7) |
|
|
|
(4) |
|
|
- |
|
Total |
|
(118) |
|
(13.6) |
|
|
|
(114) |
|
(13.1) |
|
|
|
(4) |
|
|
- |
|
Total |
$ |
(396) |
|
(5.9) |
% |
|
$ |
(344) |
|
(5.1) |
% |
|
$ |
(103) |
|
$ |
51 |
|
|
|
|
|
|
|
|
|
|
|
|
|
|
|
|
|
|
|
|
(1) Organic net sales growth (decline) is a non-GAAP financial measure. See description of non-GAAP financial measures. |
|||||||||||||||||
|
(2) Represents the change in net sales resulting from changes in foreign currency exchange rates. |
|||||||||||||||||
|
(3) Industry end market information is presented consistently with our internal management reporting and may be periodically revised as management deems necessary. |
|||||||||||||||||
11
TE CONNECTIVITY LTD.
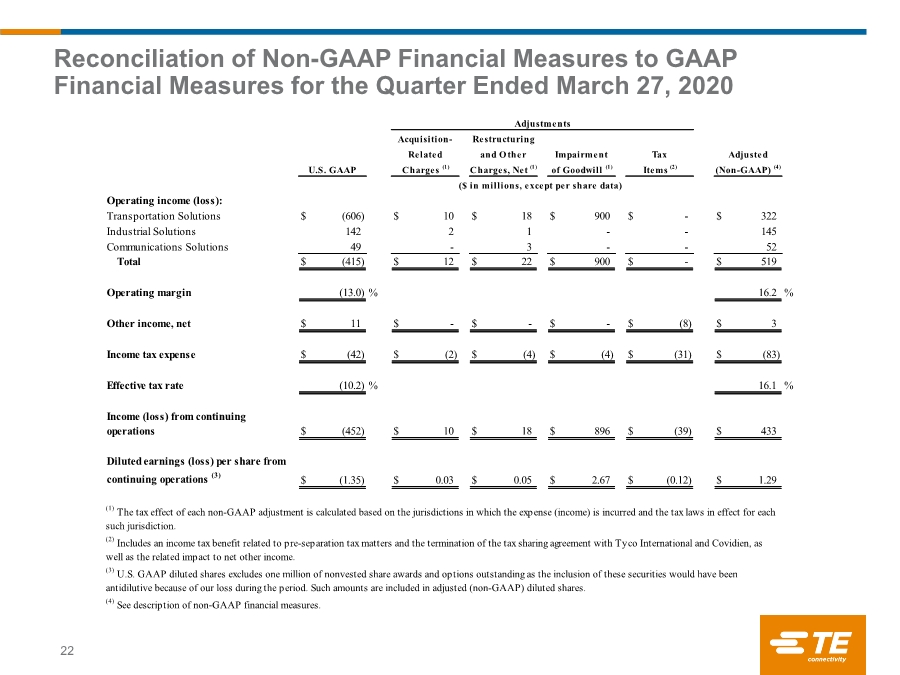
RECONCILIATION OF NON-GAAP FINANCIAL MEASURES TO GAAP FINANCIAL MEASURES
For the Quarter Ended March 27, 2020
(UNAUDITED)
|
|
|
|
|
|
Adjustments |
|
|
|
|
||||||||||
|
|
|
|
|
Acquisition- |
|
Restructuring |
|
|
|
|
|
|
|
||||||
|
|
|
|
|
Related |
|
and Other |
|
Impairment |
|
Tax |
|
Adjusted |
|
||||||
|
|
U.S. GAAP |
|
|
Charges (1) |
|
Charges, Net (1) |
|
of Goodwill (1) |
|
Items (2) |
|
(Non-GAAP) (4) |
|
||||||
|
|
($ in millions, except per share data) |
|
|||||||||||||||||
|
Operating income (loss): |
|
|
|
|
|
|
|
|
|
|
|
|
|
|
|
|
|
|
|
|
Transportation Solutions |
$ |
(606) |
|
|
$ |
10 |
|
$ |
18 |
|
$ |
900 |
|
$ |
- |
|
$ |
322 |
|
|
Industrial Solutions |
|
142 |
|
|
|
2 |
|
|
1 |
|
|
- |
|
|
- |
|
|
145 |
|
|
Communications Solutions |
|
49 |
|
|
|
- |
|
|
3 |
|
|
- |
|
|
- |
|
|
52 |
|
|
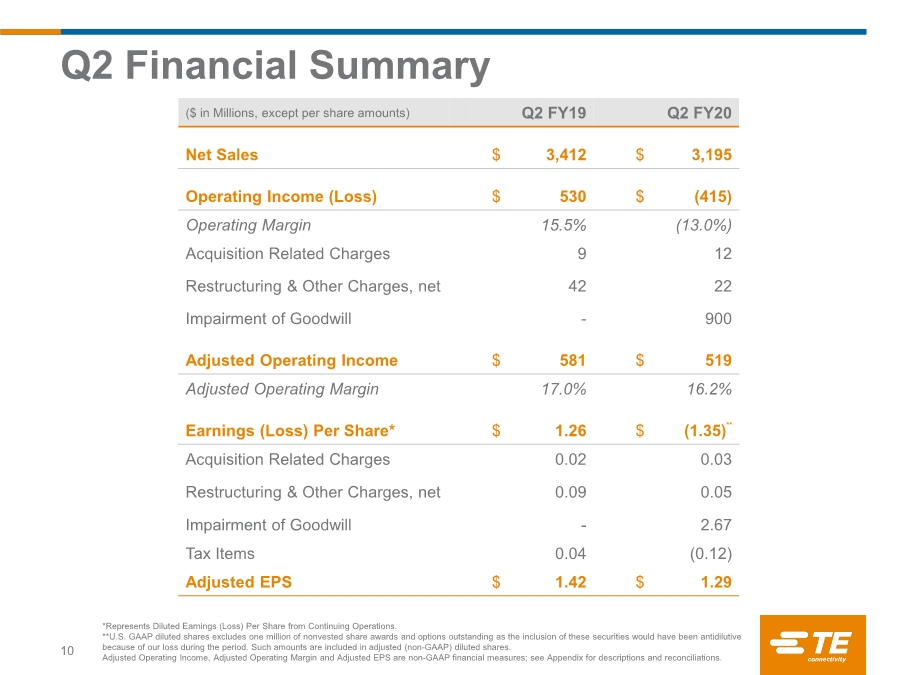
Total |
$ |
(415) |
|
|
$ |
12 |
|
$ |
22 |
|
$ |
900 |
|
$ |
- |
|
$ |
519 |
|
|
|
|
|
|
|
|
|
|
|
|
|
|
|
|
|
|
|
|
|
|
|
Operating margin |
|
(13.0) |
% |
|
|
|
|
|
|
|
|
|
|
|
|
|
|
16.2 |
% |
|
|
|
|
|
|
|
|
|
|
|
|
|
|
|
|
|
|
|
|
|
|
Other income, net |
$ |
11 |
|
|
$ |
- |
|
$ |
- |
|
$ |
- |
|
$ |
(8) |
|
$ |
3 |
|
|
|
|
|
|
|
|
|
|
|
|
|
|
|
|
|
|
|
|
|
|
|
Income tax expense |
$ |
(42) |
|
|
$ |
(2) |
|
$ |
(4) |
|
$ |
(4) |
|
$ |
(31) |
|
$ |
(83) |
|
|
|
|
|
|
|
|
|
|
|
|
|
|
|
|
|
|
|
|
|
|
|
Effective tax rate |
|
(10.2) |
% |
|
|
|
|
|
|
|
|
|
|
|
|
|
|
16.1 |
% |
|
|
|
|
|
|
|
|
|
|
|
|
|
|
|
|
|
|
|
|
|
|
Income (loss) from continuing operations |
$ |
(452) |
|
|
$ |
10 |
|
$ |
18 |
|
$ |
896 |
|
$ |
(39) |
|
$ |
433 |
|
|
|
|
|
|
|
|
|
|
|
|
|
|
|
|
|
|
|
|
|
|
|
Diluted earnings (loss) per share from continuing operations (3) |
$ |
(1.35) |
|
|
$ |
0.03 |
|
$ |
0.05 |
|
$ |
2.67 |
|
$ |
(0.12) |
|
$ |
1.29 |
|
|
|
|
|
|
|
|
|
|
|
|
|
|
|
|
|
|
|
|
|
|
|
(1) The tax effect of each non-GAAP adjustment is calculated based on the jurisdictions in which the expense (income) is incurred and the tax laws in effect for each such jurisdiction. |
|
||||||||||||||||||
|
(2) Includes an income tax benefit related to pre-separation tax matters and the termination of the tax sharing agreement with Tyco International and Covidien, as well as the related impact to net other income. |
|
||||||||||||||||||
|
(3) U.S. GAAP diluted shares excludes one million of nonvested share awards and options outstanding as the inclusion of these securities would have been antidilutive because of our loss during the period. Such amounts are included in adjusted (non-GAAP) diluted shares. |
|
||||||||||||||||||
|
(4) See description of non-GAAP financial measures. |
|

||||||||||||||||||
12
TE CONNECTIVITY LTD.
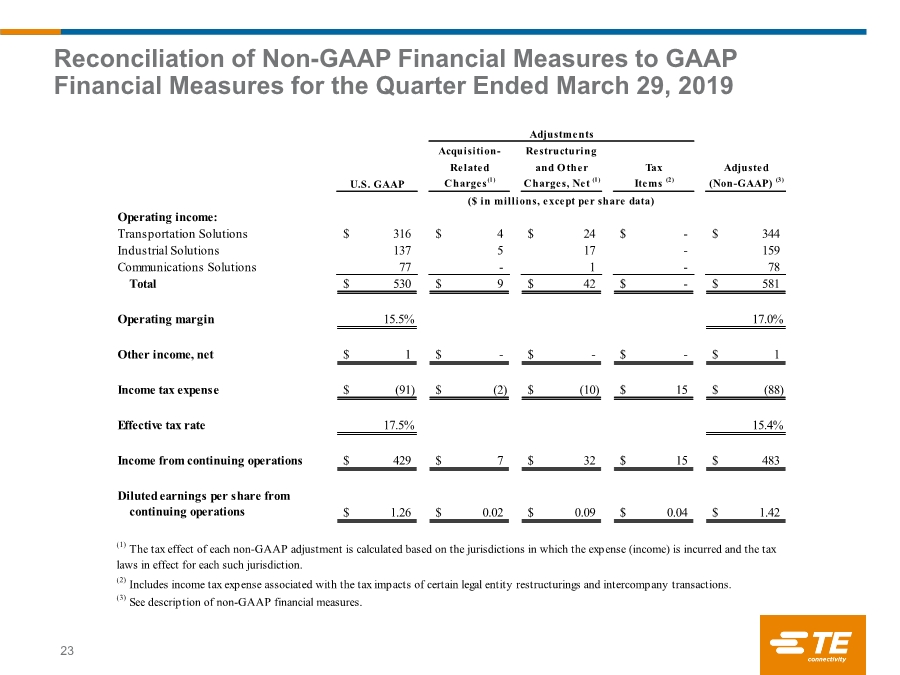
RECONCILIATION OF NON-GAAP FINANCIAL MEASURES TO GAAP FINANCIAL MEASURES
For the Quarter Ended March 29, 2019
(UNAUDITED)
|
|
|
|
|
|
Adjustments |
|
|
|
|
|||||||
|
|
|
|
|
Acquisition- |
|
Restructuring |
|
|
|
|
|
|||||
|
|
|
|
|
Related |
|
and Other |
|
Tax |
|
Adjusted |
|
|||||
|
|
U.S. GAAP |
|
|
Charges (1) |
|
Charges, Net (1) |
|
Items (2) |
|
(Non-GAAP) (3) |
|
|||||
|
|
($ in millions, except per share data) |
|
||||||||||||||
|
Operating income: |
|
|
|
|
|
|
|
|
|
|
|
|
|
|
|
|
|
Transportation Solutions |
$ |
316 |
|
|
$ |
4 |
|
$ |
24 |
|
$ |
- |
|
$ |
344 |
|
|
Industrial Solutions |
|
137 |
|
|
|
5 |
|
|
17 |
|
|
- |
|
|
159 |
|
|
Communications Solutions |
|
77 |
|
|
|
- |
|
|
1 |
|
|
- |
|
|
78 |
|
|
Total |
$ |
530 |
|
|
$ |
9 |
|
$ |
42 |
|
$ |
- |
|
$ |
581 |
|
|
|
|
|
|
|
|
|
|
|
|
|
|
|
|
|
|
|
|
Operating margin |
|
15.5 |
% |
|
|
|
|
|
|
|
|
|
|
|
17.0 |
% |
|
|
|
|
|
|
|
|
|
|
|
|
|
|
|
|
|
|
|
Other income, net |
$ |
1 |
|
|
$ |
- |
|
$ |
- |
|
$ |
- |
|
$ |
1 |
|
|
|
|
|
|
|
|
|
|
|
|
|
|
|
|
|
|
|
|
Income tax expense |
$ |
(91) |
|
|
$ |
(2) |
|
$ |
(10) |
|
$ |
15 |
|
$ |
(88) |
|
|
|
|
|
|
|
|
|
|
|
|
|
|
|
|
|
|
|
|
Effective tax rate |
|
17.5 |
% |
|
|
|
|
|
|
|
|
|
|
|
15.4 |
% |
|
|
|
|
|
|
|
|
|
|
|
|
|
|
|
|
|
|
|
Income from continuing operations |
$ |
429 |
|
|
$ |
7 |
|
$ |
32 |
|
$ |
15 |
|
$ |
483 |
|
|
|
|
|
|
|
|
|
|
|
|
|
|
|
|
|
|
|
|
Diluted earnings per share from continuing operations |
$ |
1.26 |
|
|
$ |
0.02 |
|
$ |
0.09 |
|
$ |
0.04 |
|
$ |
1.42 |
|
|
|
|
|
|
|
|
|
|
|
|
|
|
|
|
|
|
|
|
(1) The tax effect of each non-GAAP adjustment is calculated based on the jurisdictions in which the expense (income) is incurred and the tax laws in effect for each such jurisdiction. |
|
|||||||||||||||
|
(2) Includes income tax expense associated with the tax impacts of certain legal entity restructurings and intercompany transactions. |
|
|||||||||||||||
|
(3) See description of non-GAAP financial measures. |
|

|||||||||||||||
13
TE CONNECTIVITY LTD.
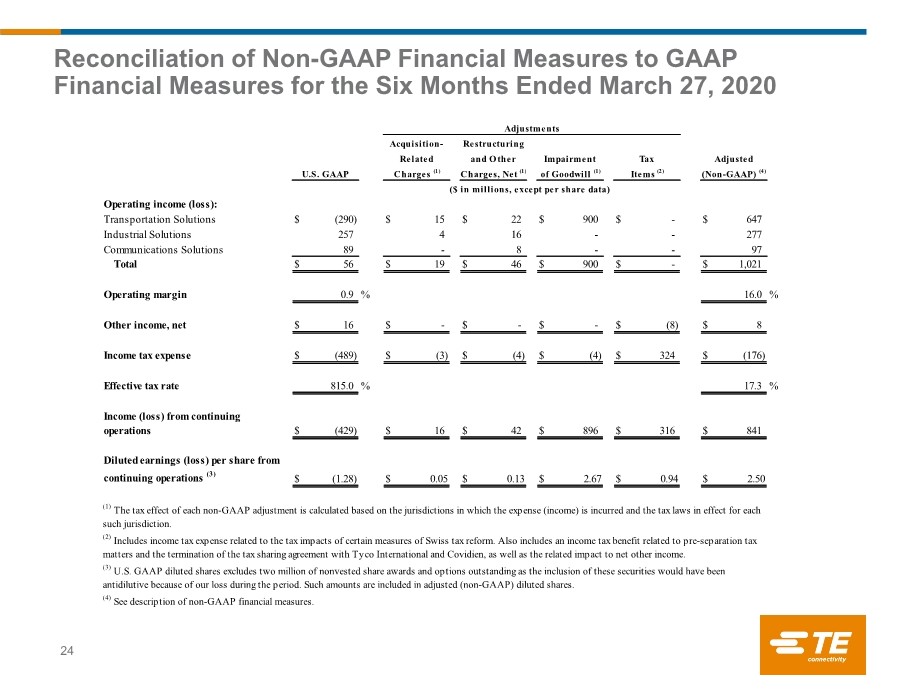
RECONCILIATION OF NON-GAAP FINANCIAL MEASURES TO GAAP FINANCIAL MEASURES
For the Six Months Ended March 27, 2020
(UNAUDITED)
|
|
|
|
|
|
Adjustments |
|
|
|
|
||||||||||
|
|
|
|
|
Acquisition- |
|
Restructuring |
|
|
|
|
|
|
|
||||||
|
|
|
|
|
Related |
|
and Other |
|
Impairment |
|
Tax |
|
Adjusted |
|
||||||
|
|
U.S. GAAP |
|
|
Charges (1) |
|
Charges, Net (1) |
|
of Goodwill (1) |
|
Items (2) |
|
(Non-GAAP) (4) |
|
||||||
|
|
($ in millions, except per share data) |
|
|||||||||||||||||
|
Operating income (loss): |
|
|
|
|
|
|
|
|
|
|
|
|
|
|
|
|
|
|
|
|
Transportation Solutions |
$ |
(290) |
|
|
$ |
15 |
|
$ |
22 |
|
$ |
900 |
|
$ |
- |
|
$ |
647 |
|
|
Industrial Solutions |
|
257 |
|
|
|
4 |
|
|
16 |
|
|
- |
|
|
- |
|
|
277 |
|
|
Communications Solutions |
|
89 |
|
|
|
- |
|
|
8 |
|
|
- |
|
|
- |
|
|
97 |
|
|
Total |
$ |
56 |
|
|
$ |
19 |
|
$ |
46 |
|
$ |
900 |
|
$ |
- |
|
$ |
1,021 |
|
|
|
|
|
|
|
|
|
|
|
|
|
|
|
|
|
|
|
|
|
|
|
Operating margin |
|
0.9 |
% |
|
|
|
|
|
|
|
|
|
|
|
|
|
|
16.0 |
% |
|
|
|
|
|
|
|
|
|
|
|
|
|
|
|
|
|
|
|
|
|
|
Other income, net |
$ |
16 |
|
|
$ |
- |
|
$ |
- |
|
$ |
- |
|
$ |
(8) |
|
$ |
8 |
|
|
|
|
|
|
|
|
|
|
|
|
|
|
|
|
|
|
|
|
|
|
|
Income tax expense |
$ |
(489) |
|
|
$ |
(3) |
|
$ |
(4) |
|
$ |
(4) |
|
$ |
324 |
|
$ |
(176) |
|
|
|
|
|
|
|
|
|
|
|
|
|
|
|
|
|
|
|
|
|
|
|
Effective tax rate |
|
815.0 |
% |
|
|
|
|
|
|
|
|
|
|
|
|
|
|
17.3 |
% |
|
|
|
|
|
|
|
|
|
|
|
|
|
|
|
|
|
|
|
|
|
|
Income (loss) from continuing operations |
$ |
(429) |
|
|
$ |
16 |
|
$ |
42 |
|
$ |
896 |
|
$ |
316 |
|
$ |
841 |
|
|
|
|
|
|
|
|
|
|
|
|
|
|
|
|
|
|
|
|
|
|
|
Diluted earnings (loss) per share from continuing operations (3) |
$ |
(1.28) |
|
|
$ |
0.05 |
|
$ |
0.13 |
|
$ |
2.67 |
|
$ |
0.94 |
|
$ |
2.50 |
|
|
|
|
|
|
|
|
|
|
|
|
|
|
|
|
|
|
|
|
|
|
|
(1) The tax effect of each non-GAAP adjustment is calculated based on the jurisdictions in which the expense (income) is incurred and the tax laws in effect for each such jurisdiction. |
|
||||||||||||||||||
|
(2) Includes income tax expense related to the tax impacts of certain measures of Swiss tax reform. Also includes an income tax benefit related to pre-separation tax matters and the termination of the tax sharing agreement with Tyco International and Covidien, as well as the related impact to net other income. |
|
||||||||||||||||||
|
(3) U.S. GAAP diluted shares excludes two million of nonvested share awards and options outstanding as the inclusion of these securities would have been antidilutive because of our loss during the period. Such amounts are included in adjusted (non-GAAP) diluted shares. |
|
||||||||||||||||||
|
(4) See description of non-GAAP financial measures. |
|

||||||||||||||||||
14
TE CONNECTIVITY LTD.
RECONCILIATION OF NON-GAAP FINANCIAL MEASURES TO GAAP FINANCIAL MEASURES
For the Six Months Ended March 29, 2019
(UNAUDITED)
|
|
|
|
|
|
|
Adjustments |
|
|
|
|
||||||
|
|
|
|
|
Acquisition- |
|
Restructuring |
|
|
|
|
|
|||||
|
|
|
|
|
Related |
|
and Other |
|
Tax |
|
Adjusted |
|
|||||
|
|
U.S. GAAP |
|
|
Charges (1) |
|
Charges, Net (1) |
|
Items (2) |
|
(Non-GAAP) (3) |
|
|||||
|
|
($ in millions, except per share data) |
|
||||||||||||||
|
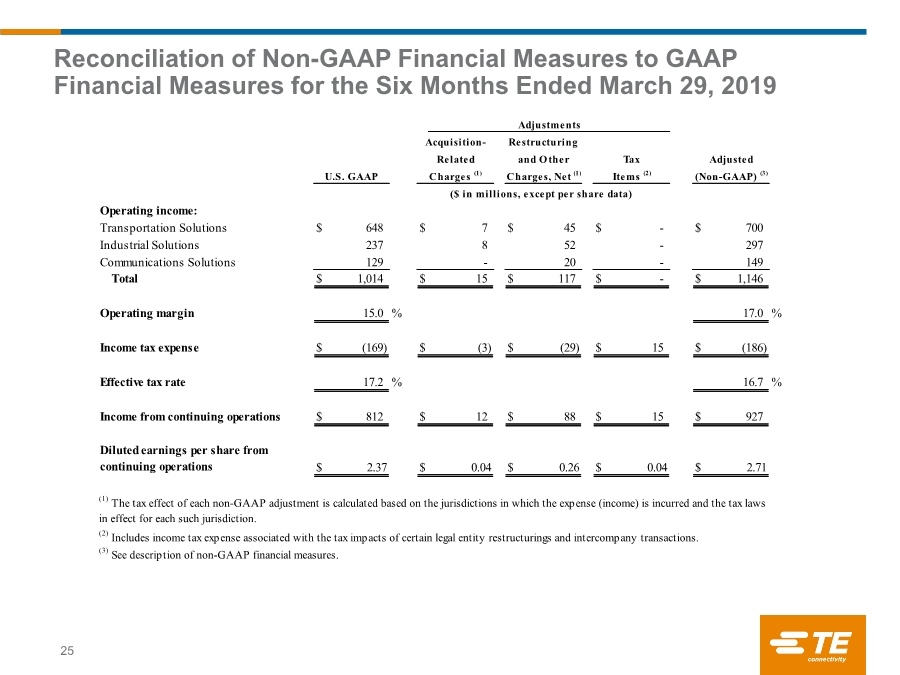
Operating income: |
|
|
|
|
|
|
|
|
|
|
|
|
|
|
|
|
|
Transportation Solutions |
$ |
648 |
|
|
$ |
7 |
|
$ |
45 |
|
$ |
- |
|
$ |
700 |
|
|
Industrial Solutions |
|
237 |
|
|
|
8 |
|
|
52 |
|
|
- |
|
|
297 |
|
|
Communications Solutions |
|
129 |
|
|
|
- |
|
|
20 |
|
|
- |
|
|
149 |
|
|
Total |
$ |
1,014 |
|
|
$ |
15 |
|
$ |
117 |
|
$ |
- |
|
$ |
1,146 |
|
|
|
|
|
|
|
|
|
|
|
|
|
|
|
|
|
|
|
|
Operating margin |
|
15.0 |
% |
|
|
|
|
|
|
|
|
|
|
|
17.0 |
% |
|
|
|
|
|
|
|
|
|
|
|
|
|
|
|
|
|
|
|
Income tax expense |
$ |
(169) |
|
|
$ |
(3) |
|
$ |
(29) |
|
$ |
15 |
|
$ |
(186) |
|
|
|
|
|
|
|
|
|
|
|
|
|
|
|
|
|
|
|
|
Effective tax rate |
|
17.2 |
% |
|
|
|
|
|
|
|
|
|
|
|
16.7 |
% |
|
|
|
|
|
|
|
|
|
|
|
|
|
|
|
|
|
|
|
Income from continuing operations |
$ |
812 |
|
|
$ |
12 |
|
$ |
88 |
|
$ |
15 |
|
$ |
927 |
|
|
|
|
|
|
|
|
|
|
|
|
|
|
|
|
|
|
|
|
Diluted earnings per share from continuing operations |
$ |
2.37 |
|
|
$ |
0.04 |
|
$ |
0.26 |
|
$ |
0.04 |
|
$ |
2.71 |
|
|
|
|
|
|
|
|
|
|
|
|
|
|
|
|
|
|
|
|
(1) The tax effect of each non-GAAP adjustment is calculated based on the jurisdictions in which the expense (income) is incurred and the tax laws in effect for each such jurisdiction. |
|
|||||||||||||||
|
(2) Includes income tax expense associated with the tax impacts of certain legal entity restructurings and intercompany transactions. |
|
|||||||||||||||
|
(3) See description of non-GAAP financial measures. |
|

|||||||||||||||
15
TE CONNECTIVITY LTD.
RECONCILIATION OF NON-GAAP FINANCIAL MEASURES TO GAAP FINANCIAL MEASURES
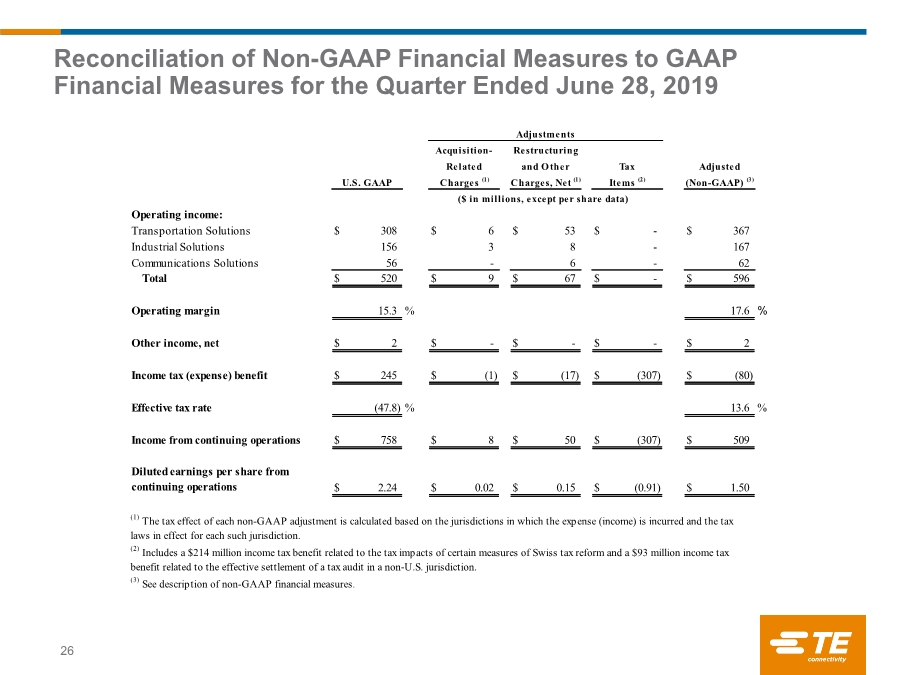
For the Quarter Ended June 28, 2019
(UNAUDITED)
|
|
|
|
|
|
Adjustments |
|
|
|
|
|||||||
|
|
|
|
|
Acquisition- |
|
Restructuring |
|
|
|
|
|
|||||
|
|
|
|
|
Related |
|
and Other |
|
Tax |
|
Adjusted |
|
|||||
|
|
U.S. GAAP |
|
|
Charges (1) |
|
Charges, Net (1) |
|
Items (2) |
|
(Non-GAAP) (3) |
|
|||||
|
|
($ in millions, except per share data) |
|
||||||||||||||
|
Operating income: |
|
|
|
|
|
|
|
|
|
|
|
|
|
|
|
|
|
Transportation Solutions |
$ |
308 |
|
|
$ |
6 |
|
$ |
53 |
|
$ |
- |
|
$ |
367 |
|
|
Industrial Solutions |
|
156 |
|
|
|
3 |
|
|
8 |
|
|
- |
|
|
167 |
|
|
Communications Solutions |
|
56 |
|
|
|
- |
|
|
6 |
|
|
- |
|
|
62 |
|
|
Total |
$ |
520 |
|
|
$ |
9 |
|
$ |
67 |
|
$ |
- |
|
$ |
596 |
|
|
|
|
|
|
|
|
|
|
|
|
|
|
|
|
|
|
|
|
Operating margin |
|
15.3 |
% |
|
|
|
|
|
|
|
|
|
|
|
17.6 |
% |
|
|
|
|
|
|
|
|
|
|
|
|
|
|
|
|
|
|
|
Other income, net |
$ |
2 |
|
|
$ |
- |
|
$ |
- |
|
$ |
- |
|
$ |
2 |
|
|
|
|
|
|
|
|
|
|
|
|
|
|
|
|
|
|
|
|
Income tax (expense) benefit |
$ |
245 |
|
|
$ |
(1) |
|
$ |
(17) |
|
$ |
(307) |
|
$ |
(80) |
|
|
|
|
|
|
|
|
|
|
|
|
|
|
|
|
|
|
|
|
Effective tax rate |
|
(47.8) |
% |
|
|
|
|
|
|
|
|
|
|
|
13.6 |
% |
|
|
|
|
|
|
|
|
|
|
|
|
|
|
|
|
|
|
|
Income from continuing operations |
$ |
758 |
|
|
$ |
8 |
|
$ |
50 |
|
$ |
(307) |
|
$ |
509 |
|
|
|
|
|
|
|
|
|
|
|
|
|
|
|
|
|
|
|
|
Diluted earnings per share from continuing operations |
$ |
2.24 |
|
|
$ |
0.02 |
|
$ |
0.15 |
|
$ |
(0.91) |
|
$ |
1.50 |
|
|
|
|
|
|
|
|
|
|
|
|
|
|
|
|
|
|
|
|
(1) The tax effect of each non-GAAP adjustment is calculated based on the jurisdictions in which the expense (income) is incurred and the tax laws in effect for each such jurisdiction. |
|
|||||||||||||||
|
(2) Includes a $214 million income tax benefit related to the tax impacts of certain measures of Swiss tax reform and a $93 million income tax benefit related to the effective settlement of a tax audit in a non-U.S. jurisdiction. |
|
|||||||||||||||
|
(3) See description of non-GAAP financial measures. |
|
|||||||||||||||
16
TE CONNECTIVITY LTD.
RECONCILIATION OF NON-GAAP FINANCIAL MEASURES TO GAAP FINANCIAL MEASURES
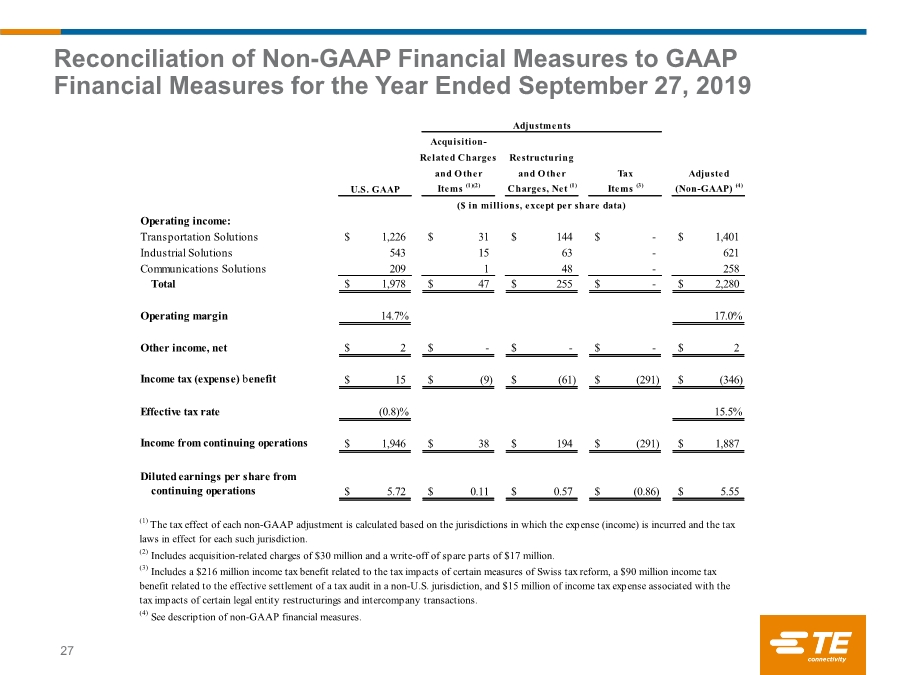
For the Year Ended September 27, 2019
(UNAUDITED)
|
|
|
|
|
|
Adjustments |
|
|
|
|
|||||||
|
|
|
|
|
Acquisition- |
|
|
|
|
|
|
|
|||||
|
|
|
|
|
Related Charges |
|
Restructuring |
|
|
|
|
|
|||||
|
|
|
|
|
and Other |
|
and Other |
|
Tax |
|
Adjusted |
|
|||||
|
|
U.S. GAAP |
|
|
Items (1)(2) |
|
Charges, Net (1) |
|
Items (3) |
|
(Non-GAAP) (4) |
|
|||||
|
|
($ in millions, except per share data) |
|
||||||||||||||
|
Operating income: |
|
|
|
|
|
|
|
|
|
|
|
|
|
|
|
|
|
Transportation Solutions |
$ |
1,226 |
|
|
$ |
31 |
|
$ |
144 |
|
$ |
- |
|
$ |
1,401 |
|
|
Industrial Solutions |
|
543 |
|
|
|
15 |
|
|
63 |
|
|
- |
|
|
621 |
|
|
Communications Solutions |
|
209 |
|
|
|
1 |
|
|
48 |
|
|
- |
|
|
258 |
|
|
Total |
$ |
1,978 |
|
|
$ |
47 |
|
$ |
255 |
|
$ |
- |
|
$ |
2,280 |
|
|
|
|
|
|
|
|
|
|
|
|
|
|
|
|
|
|
|
|
Operating margin |
|
14.7 |
% |
|
|
|
|
|
|
|
|
|
|
|
17.0 |
% |
|
|
|
|
|
|
|
|
|
|
|
|
|
|
|
|
|
|
|
Other income, net |
$ |
2 |
|
|
$ |
- |
|
$ |
- |
|
$ |
- |
|
$ |
2 |
|
|
|
|
|
|
|
|
|
|
|
|
|
|
|
|
|
|
|
|
Income tax (expense) benefit |
$ |
15 |
|
|
$ |
(9) |
|
$ |
(61) |
|
$ |
(291) |
|
$ |
(346) |
|
|
|
|
|
|
|
|
|
|
|
|
|
|
|
|
|
|
|
|
Effective tax rate |
|
(0.8) |
% |
|
|
|
|
|
|
|
|
|
|
|
15.5 |
% |
|
|
|
|
|
|
|
|
|
|
|
|
|
|
|
|
|
|
|
Income from continuing operations |
$ |
1,946 |
|
|
$ |
38 |
|
$ |
194 |
|
$ |
(291) |
|
$ |
1,887 |
|
|
|
|
|
|
|
|
|
|
|
|
|
|
|
|
|
|
|
|
Diluted earnings per share from continuing operations |
$ |
5.72 |
|
|
$ |
0.11 |
|
$ |
0.57 |
|
$ |
(0.86) |
|
$ |
5.55 |
|
|
|
|
|
|
|
|
|
|
|
|
|
|
|
|
|
|
|
|
(1) The tax effect of each non-GAAP adjustment is calculated based on the jurisdictions in which the expense (income) is incurred and the tax laws in effect for each such jurisdiction. |
|
|||||||||||||||
|
(2) Includes acquisition-related charges of $30 million and a write-off of spare parts of $17 million. |
|
|||||||||||||||
|
(3) Includes a $216 million income tax benefit related to the tax impacts of certain measures of Swiss tax reform, a $90 million income tax benefit related to the effective settlement of a tax audit in a non-U.S. jurisdiction, and $15 million of income tax expense associated with the tax impacts of certain legal entity restructurings and intercompany transactions. |
|
|||||||||||||||
|
(4) See description of non-GAAP financial measures. |
|
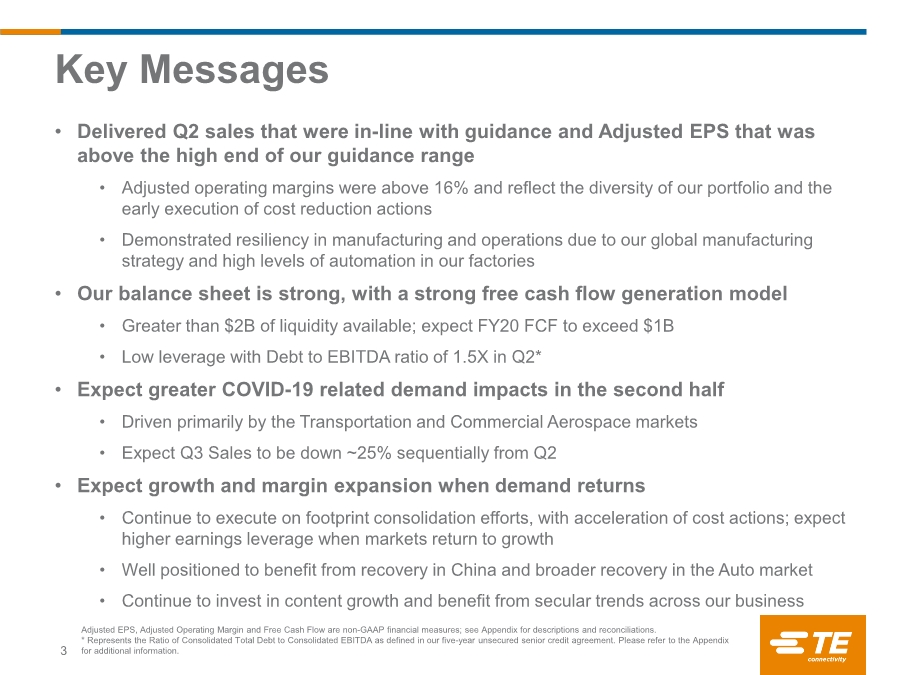
|||||||||||||||
17
Exhibit 99.2
| Q2 2020 Earnings April 28, 2020 |
| TE Connectivity Confidential & Proprietary. Do not reproduce or distribute. Forward-Looking Statements and Non-GAAP Financial Measures 2 Forward-Looking Statements This presentation contains certain "forward-looking statements" within the meaning of the U.S. Private Securities Litigation Reform Act of 1995. These statements are based on management's current expectations and are subject to risks, uncertainty and changes in circumstances, which may cause actual results, performance, financial condition or achievements to differ materially from anticipated results, performance, financial condition or achievements. All statements contained herein that are not clearly historical in nature are forward-looking and the words "anticipate," "believe," "expect," "estimate," "plan," and similar expressions are generally intended to identify forward-looking statements. We have no intention and are under no obligation to update or alter (and expressly disclaim any such intention or obligation to do so) our forward-looking statements whether as a result of new information, future events or otherwise, except to the extent required by law. The forward-looking statements in this presentation include statements addressing our future financial condition and operating results, and the impact on our operations resulting from the coronavirus disease 2019 (“COVID-19”). Examples of factors that could cause actual results to differ materially from those described in the forward-looking statements include, among others, the extent, severity and duration of COVID- 19 negatively affecting our business operations; business, economic, competitive and regulatory risks, such as conditions affecting demand for products in the automotive and other industries we serve; competition and pricing pressure; fluctuations in foreign currency exchange rates and commodity prices; natural disasters and political, economic and military instability in countries in which we operate; developments in the credit markets; future goodwill impairment; compliance with current and future environmental and other laws and regulations; and the possible effects on us of changes in tax laws, tax treaties and other legislation, including the effects of Swiss tax reform. In addition, the extent to which COVID-19 will impact our business and our financial results will depend on future developments, which are highly uncertain and cannot be predicted. Such developments may include the geographic spread of the virus, the severity of the virus, the duration of the outbreak, the impact on our suppliers’ and customers’ supply chains, the actions that may be taken by various governmental authorities in response to the outbreak in jurisdictions in which we operate, and the possible impact on the global economy and local economies in which we operate. More detailed information about these and other factors is set forth in TE Connectivity Ltd.'s Annual Report on Form 10-K for the fiscal year ended Sept. 27, 2019 as well as in our Quarterly Reports on Form 10-Q, Current Reports on Form 8-K and other reports filed by us with the U.S. Securities and Exchange Commission. Non-GAAP Financial Measures Where we have used non-GAAP financial measures, reconciliations to the most comparable GAAP measure are provided, along with a disclosure on the usefulness of the non-GAAP financial measure, in this presentation. |
| TE Connectivity Confidential & Proprietary. Do not reproduce or distribute. • Delivered Q2 sales that were in-line with guidance and Adjusted EPS that was above the high end of our guidance range • Adjusted operating margins were above 16% and reflect the diversity of our portfolio and the early execution of cost reduction actions • Demonstrated resiliency in manufacturing and operations due to our global manufacturing strategy and high levels of automation in our factories • Our balance sheet is strong, with a strong free cash flow generation model • Greater than $2B of liquidity available; expect FY20 FCF to exceed $1B • Low leverage with Debt to EBITDA ratio of 1.5X in Q2* • Expect greater COVID-19 related demand impacts in the second half • Driven primarily by the Transportation and Commercial Aerospace markets • Expect Q3 Sales to be down ~25% sequentially from Q2 • Expect growth and margin expansion when demand returns • Continue to execute on footprint consolidation efforts, with acceleration of cost actions; expect higher earnings leverage when markets return to growth • Well positioned to benefit from recovery in China and broader recovery in the Auto market • Continue to invest in content growth and benefit from secular trends across our business Key Messages 3 Adjusted EPS, Adjusted Operating Margin and Free Cash Flow are non-GAAP financial measures; see Appendix for descriptions and reconciliations. * Represents the Ratio of Consolidated Total Debt to Consolidated EBITDA as defined in our five-year unsecured senior credit agreement. Please refer to the Appendix for additional information. |
| TE Connectivity Confidential & Proprietary. Do not reproduce or distribute. Sales at midpoint of guidance and Adjusted EPS above the high end of guidance • Sales of $3.2B, down 6% on a reported basis and down 5% organically Y/Y; FX headwind of $60M • Transportation down 5% organically, with weakness in all businesses • Industrial down 3% organically, with declines in Comm Air and Industrial Equipment • Communications down 13% organically, with declines in D&D and Appliances • Orders grew sequentially, with a book to bill of 1.05 • Adjusted Operating Margins of 16.2%; Adjusted EPS of $1.29, exceeding the high end of guidance • YTD Free Cash Flow up 34% vs prior year; Q2 FCF of ~ $310M with ~$430M returned to shareholders Due to limited visibility of future demand, withdrawing full year guidance • Recent orders have slowed as a result of COVID-19 impacts • Expect Q3 Sales to be down ~25% sequentially from Q2 • Adjusted Operating Income fall through of ~45% on sequential revenue decline • Expect second half weakness to be driven by the Transportation and CommAir markets • Strong balance sheet with ample liquidity; expect FCF to exceed $1B in FY20 Q2 Highlights 4 Organic Net Sales Growth (Decline), Adjusted Operating Margin, Adjusted EPS, and Free Cash Flow are non-GAAP financial measures; see Appendix for descriptions and reconciliations. |
| TE Connectivity Confidential & Proprietary. Do not reproduce or distribute. Reported FY20 FY20 Growth March & April Order Trends Q1 Q2 Q1 to Q2 Transportation 1,867 1,849 (1)% Erosion in Auto and Commercial Transportation Industrial 965 1,051 9% Erosion in CommAir; Stability in Defense, Medical & Energy Communications 409 467 14% Stable demand in D&D driven by Cloud applications Total TE 3,241 3,367 Q2 orders strength reflects customers securing component supply in an uncertain environment Book to Bill 1.02 1.05 Segment Orders Summary $ in Millions Order trends weakened in late March and April in Transportation and CommAir 5 |
| TE Connectivity Confidential & Proprietary. Do not reproduce or distribute. $3,195 Q2 2020 Q3 2020 Q2 to Q3 Sequential Sales Drivers 6 $ in Millions • Auto production expected to decline ~33% from ~18M vehicles produced in Q2 to ~12M in Q3 • Expect reduction in CommAir market of ~33% as a result of lower builds • Auto supply chain impact of ~$200M in Q2 impacting Q3 • Supply chain disruption impacting Q3 by ~$100M Sequential Sales down ~25% Auto production ▼ ~33% CommAir market ▼ ~33% Auto supply chain impact ▼ ~$200M Supply chain disruption ▼ ~$100M Q3 Sales expected to be down ~25% sequentially $3.2B |
| TE Connectivity Confidential & Proprietary. Do not reproduce or distribute. Y/Y Growth Rates Reported Organic Automotive $1,365 (4)% (2)% Commercial Transportation 294 (9)% (11)% Sensors 198 (11)% (15)% Transportation Solutions $1,857 (6)% (5)% $ in Millions Q2 Sales Q2 Business Performance Reported Down 6% Organic Down 5% Q2 Adjusted Operating Margin Transportation Solutions 7 Adjusted EBITDA Margin 23.0% 23.6% • Automotive sales down 2% organically on global auto production declines of ~20%; outperformance driven by customer supply chain builds ahead of production and content growth • Commercial Transportation organic declines driven by weakness in all regions • Sensors decline driven by weakness in industrial markets with ongoing weakness in commercial transportation Organic Net Sales Growth (Decline), Adjusted Operating Margin and Adjusted EBITDA Margin are non-GAAP financial measures: see Appendix for descriptions and reconciliations. Adjusted Operating Margins ~flat on lower volumes $1,971 $1,857 Q2 2019 Q2 2020 17.5% 17.3% Q2 2019 Q2 2020 |
| TE Connectivity Confidential & Proprietary. Do not reproduce or distribute. Y/Y Growth Rates Reported Organic Aerospace, Defense and Marine $318 (4)% (3)% Industrial Equipment 280 (14)% (13)% Medical 186 6% 6% Energy 178 2% 6% Industrial Solutions $962 (5)% (3)% $ in Millions Q2 Sales • AD&M declines driven by weakness in Commercial Aerospace market, partially offset by growth in Defense • Industrial Equipment declines driven by market weakness and continued distribution inventory corrections • Medical growth driven by interventional medical applications • Energy growth driven by growth in Europe and NA investments for upgraded infrastructure Q2 Business Performance Reported Down 5% Organic Down 3% Q2 Adjusted Operating Margin Industrial Solutions 8 $1,007 $962 Q2 2019 Q2 2020 15.8% 15.1% Q2 2019 Q2 2020 Adjusted Operating Margin of ~15%, as expected Adjusted EBITDA Margin 20.0% 19.9% Organic Net Sales Growth (Decline), Adjusted Operating Margin and Adjusted EBITDA Margin are non-GAAP financial measures: see Appendix for descriptions and reconciliations. |
| TE Connectivity Confidential & Proprietary. Do not reproduce or distribute. 18.0% 13.8% Q2 2019 Q2 2020 $434 $376 Q2 2019 Q2 2020 Y/Y Growth Rates Reported Organic Data & Devices $218 (13)% (13)% Appliances 158 (14)% (12)% Communications Solutions $376 (13)% (13)% $ in Millions Q2 Sales • Communications Sales and Margin performance as expected • Data & Devices declines driven by weakness in all regions and distribution destocking; continue to see growth in cloud related demand • Appliances declines driven by weakness in all regions and inventory destocking trends Q2 Business Performance Reported Down 13% Organic Down 13% Q2 Adjusted Operating Margin Adjusted Operating Margins in the mid- teens, as expected 9 Communications Solutions Adjusted EBITDA Margin 22.6% 18.4% Organic Net Sales Growth (Decline), Adjusted Operating Margin and Adjusted EBITDA Margin are non-GAAP financial measures: see Appendix for descriptions and reconciliations. |
| TE Connectivity Confidential & Proprietary. Do not reproduce or distribute. ($ in Millions, except per share amounts) Q2 FY19 Q2 FY20 Net Sales $ 3,412 $ 3,195 Operating Income (Loss) $ 530 $ (415) Operating Margin 15.5% (13.0%) Acquisition Related Charges 9 12 Restructuring & Other Charges, net 42 22 Impairment of Goodwill - 900 Adjusted Operating Income $ 581 $ 519 Adjusted Operating Margin 17.0% 16.2% Earnings (Loss) Per Share* $ 1.26 $ (1.35)** Acquisition Related Charges 0.02 0.03 Restructuring & Other Charges, net 0.09 0.05 Impairment of Goodwill - 2.67 Tax Items 0.04 (0.12) Adjusted EPS $ 1.42 $ 1.29 Q2 Financial Summary 10 *Represents Diluted Earnings (Loss) Per Share from Continuing Operations. **U.S. GAAP diluted shares excludes one million of nonvested share awards and options outstanding as the inclusion of these securities would have been antidilutive because of our loss during the period. Such amounts are included in adjusted (non-GAAP) diluted shares. Adjusted Operating Income, Adjusted Operating Margin and Adjusted EPS are non-GAAP financial measures; see Appendix for descriptions and reconciliations. |
| TE Connectivity Confidential & Proprietary. Do not reproduce or distribute. Q2 Financial Performance 11 Adjusted Operating Margin Free Cash Flow $413 $554 YTD 2019 YTD 2020 $3,412 $3,195 Q2 2019 Q2 2020 Sales Adjusted EPS $1.42 $1.29 Q2 2019 Q2 2020 Adjusted EBITDA Margin 22.0% 21.9% 17.0% 16.2% Q2 2019 Q2 2020 Strong position entering a weak environment Adjusted Operating Margin, Adjusted EPS, Adjusted EBITDA Margin and Free Cash Flow are non-GAAP financial measures: see Appendix for descriptions and reconciliations. |
| TE Connectivity Confidential & Proprietary. Do not reproduce or distribute. $64 $69 $243 $223 $344 $311 $443 $515 $670 $688 2018 2019 2020 Q1 Q2 Q3 Q4 $350 $635 $500 $605 $350 $605 2020 2021 2022 2023 2024 2025 As of 3/27/2020 12 Free Cash Flow & Liquidity • Remain committed to quarterly dividend • Will continue to evaluate share repurchases • Capital expenditures reduced by over $100M • $2.3B liquidity available • ~$800M in cash • $1.5B undrawn revolver • Debt/EBITDA currently at 1.5x*** Liquidity Cash & Debt Maturity Profile Priorities Cash & Debt Maturity Profile** Free Cash Flow* Liquidity Cash Term Debt $ in Millions $796 YTD FCF up 34% vs prior year FY20 FCF expected to be >$1B Strong liquidity position *Free Cash Flow is a non-GAAP financial measure; see Appendix for description and reconciliation **Excludes debt maturing after fiscal year 2025 ***Represents the Ratio of Consolidated Total Debt to Consolidated EBITDA as defined in our five-year unsecured senior credit agreement. Please refer to the Appendix for additional information |
| TE Connectivity Confidential & Proprietary. Do not reproduce or distribute. Strong portfolio position and early cost actions enabling TE to navigate a challenging demand environment Expectations Going Forward 3Q20 Expectations Market Assumptions 13 Actions We Are Taking • Expect Q3 sales to decline ~25% sequentially from Q2, with weakness driven by Transportation and CommAir markets and supply chain adjustments • ~45% fall through on sequential revenue decline to adjusted operating income • Global auto production expected to decline to ~12M vehicles in Q3 • Expect reduced production in Commercial Aerospace builds in 2H vs 1H • Continue to benefit from favorable demand trends in Defense, Medical and Energy and Data & Devices markets • Moved early to execute cost reduction and factory footprint consolidation plans • Demonstrating resilience in global manufacturing; Flexing workforce based on temporary plant closures • Reducing CapEx by over $100M versus prior view to ~$575M in FY20 • Will continue to evaluate cost structure as demand environment evolves Adjusted Operating Income is a non-GAAP financial measure; see Appendix for description |
| TE Connectivity Confidential & Proprietary. Do not reproduce or distribute. Additional Information 14 |
| TE Connectivity Confidential & Proprietary. Do not reproduce or distribute. Y/Y Q2 2020 15 Sales (in millions) Adjusted EPS Q2 2019 Results $3,412 $1.42 Operational Performance (157) (0.10) FX Impact (60) (0.02) Tax Rate Impact -(0.01) Q2 2020 Results $3,195 $1.29 Adjusted EPS is a non-GAAP financial measure; See Appendix for description and reconciliation. |
| TE Connectivity Confidential & Proprietary. Do not reproduce or distribute. ($ in Millions) Q2 2019 Q2 2020 Beginning Cash Balance $505 $742 Free Cash Flow 344 311 Dividends (149) (153) Share repurchases (220) (269) Net increase in debt 27 383 Acquisition of businesses, net of cash acquired 8 (244) Other 50 26 Ending Cash Balance $565 $796 Total Debt $3,982 $4,355 A/R $2,463 $2,461 Days Sales Outstanding* 65 69 Inventory $1,970 $2,001 Days on Hand* 75 80 Accounts Payable $1,485 $1,390 Days Outstanding* 58 58 Free Cash Flow and Working Capital Liquidity, Cash & Debt Q2 Balance Sheet & Cash Flow Summary 16 ($ in Millions) Q2 2019 Q2 2020 Cash from Continuing Operations $555 $481 Capital expenditures, net Cash (collected) pursuant to collateral requirements related to cross-currency swap contracts (179) (32) (132) (38) Free Cash Flow $344 $311 Free Cash Flow is a non-GAAP financial measure, see Appendix for description and reconciliation * Adjusted to exclude the impact of acquisitions |
| TE Connectivity Confidential & Proprietary. Do not reproduce or distribute. Appendix 17 |
| TE Connectivity Confidential & Proprietary. Do not reproduce or distribute. 18 Non-GAAP Financial Measures We present non-GAAP performance and liquidity measures as we believe it is appropriate for investors to consider adjusted financial measures in addition to results in accordance with accounting principles generally accepted in the U.S. (“GAAP”). These non-GAAP financial measures provide supplemental information and should not be considered replacements for results in accordance with GAAP. Management uses non-GAAP financial measures internally for planning and forecasting purposes and in its decision-making processes related to the operations of our company. We believe these measures provide meaningful information to us and investors because they enhance the understanding of our operating performance, ability to generate cash, and the trends of our business. Additionally, we believe that investors benefit from having access to the same financial measures that management uses in evaluating our operations. The primary limitation of these measures is that they exclude the financial impact of items that would otherwise either increase or decrease our reported results. This limitation is best addressed by using these non-GAAP financial measures in combination with the most directly comparable GAAP financial measures in order to better understand the amounts, character, and impact of any increase or decrease in reported amounts. These non-GAAP financial measures may not be comparable to similarly-titled measures reported by other companies. The following provides additional information regarding our non-GAAP financial measures: • Organic Net Sales Growth (Decline) – represents net sales growth (decline) (the most comparable GAAP financial measure) excluding the impact of foreign currency exchange rates, and acquisitions and divestitures that occurred in the preceding twelve months, if any. Organic Net Sales Growth (Decline) is a useful measure of our performance because it excludes items that are not completely under management’s control, such as the impact of changes in foreign currency exchange rates, and items that do not reflect the underlying growth of the company, such as acquisition and divestiture activity. This measure is a significant component in our incentive compensation plans. • Adjusted Operating Income (Loss) and Adjusted Operating Margin – represent operating income (loss) and operating margin, respectively, (the most comparable GAAP financial measures) before special items including restructuring and other charges, acquisition-related charges, impairment of goodwill, and other income or charges, if any. We utilize these adjusted measures in combination with operating income (loss) and operating margin to assess segment level operating performance and to provide insight to management in evaluating segment operating plan execution and market conditions. Adjusted Operating Income (Loss) is a significant component in our incentive compensation plans. • Adjusted Other Income (Expense), Net – represents net other income (expense) (the most comparable GAAP financial measure) before special items including tax sharing income related to adjustments to prior period tax returns and other items, if any. • Adjusted Income Tax (Expense) Benefit and Adjusted Effective Tax Rate – represent income tax (expense) benefit and effective tax rate, respectively, (the most comparable GAAP financial measures) after adjusting for the tax effect of special items including restructuring and other charges, acquisition-related charges, impairment of goodwill, other income or charges, and certain significant tax items, if any. • Adjusted Income (Loss) from Continuing Operations – represents income (loss) from continuing operations (the most comparable GAAP financial measure) before special items including restructuring and other charges, acquisition-related charges, impairment of goodwill, tax sharing income related to adjustments to prior period tax returns and other tax items, other income or charges, and certain significant tax items, if any, and, if applicable, the related tax effects. • Adjusted Earnings (Loss) Per Share – represents diluted earnings (loss) per share from continuing operations (the most comparable GAAP financial measure) before special items including restructuring and other charges, acquisition-related charges, impairment of goodwill, tax sharing income related to adjustments to prior period tax returns and other tax items, other income or charges, and certain significant tax items, if any, and, if applicable, the related tax effects. This measure is a significant component in our incentive compensation plans. |
| TE Connectivity Confidential & Proprietary. Do not reproduce or distribute. 19 • Adjusted EBITDA and Adjusted EBITDA Margin - represent net income (loss) and net income (loss) as a percentage of net sales, respectively, (the most comparable GAAP financial measures) before interest expense, interest income, income taxes, depreciation, and amortization, as adjusted for net other income, income from discontinued operations, and special items including restructuring and other charges, acquisition-related charges, impairment of goodwill, and other income or charges, if any. • Free Cash Flow (FCF) – is a useful measure of our ability to generate cash. The difference between net cash provided by continuing operating activities (the most comparable GAAP financial measure) and Free Cash Flow consists mainly of significant cash outflows and inflows that we believe are useful to identify. We believe Free Cash Flow provides useful information to investors as it provides insight into the primary cash flow metric used by management to monitor and evaluate cash flows generated from our operations. Free Cash Flow is defined as net cash provided by continuing operating activities excluding voluntary pension contributions and the cash impact of special items, if any, minus net capital expenditures. Voluntary pension contributions are excluded from the GAAP financial measure because this activity is driven by economic financing decisions rather than operating activity. Certain special items, including net payments related to pre-separation tax matters and cash paid (collected) pursuant to collateral requirements related to cross-currency swap contracts, are also excluded by management in evaluating Free Cash Flow. Net capital expenditures consist of capital expenditures less proceeds from the sale of property, plant, and equipment. These items are subtracted because they represent long-term commitments. In the calculation of Free Cash Flow, we subtract certain cash items that are ultimately within management’s and the Board of Directors’ discretion to direct and may imply that there is less or more cash available for our programs than the most comparable GAAP financial measure indicates. It should not be inferred that the entire Free Cash Flow amount is available for future discretionary expenditures, as our definition of Free Cash Flow does not consider certain non-discretionary expenditures, such as debt payments. In addition, we may have other discretionary expenditures, such as discretionary dividends, share repurchases, and business acquisitions, that are not considered in the calculation of Free Cash Flow. • Adjusted Return on Invested Capital (ROIC) – represents adjusted net operating profit after tax divided by average invested capital. We use Adjusted Return on Invested Capital as an indicator of our capital efficiency. Adjusted Return on Invested Capital is not a measure defined by GAAP. It is calculated by us, in part, using non-GAAP financial measures. We are providing our calculation of Adjusted Return on Invested Capital as this measure may not be defined and calculated by other companies in the same manner. • Ratio of Consolidated Total Debt to Consolidated EBITDA is a covenant used in our Amended and Restated Five-Year Senior Credit Agreement dated as of November 14, 2018 and filed as Exhibit 10.1 to our Current Report on Form 8-K filed with the SEC on November 14, 2018. Consolidated Total Debt and Consolidated EBITDA are adjusted financial measures as defined in the Credit Agreement. Non-GAAP Financial Measures (cont.) |
| TE Connectivity Confidential & Proprietary. Do not reproduce or distribute. 20 Segment Summary Transportation Solutions $ 1,857 $ 1,971 $ 3,725 $ 3,957 Industrial Solutions 962 1,007 1,889 1,935 Communications Solutions 376 434 749 867 Total $ 3,195 $ 3,412 $ 6,363 $ 6,759 Transportation Solutions $ (606) (32.6) % $ 316 16.0 % $ (290) (7.8) % $ 648 16.4 % Industrial Solutions 142 14.8 137 13.6 257 13.6 237 12.2 Communications Solutions 49 13.0 77 17.7 89 11.9 129 14.9 Total $ (415) (13.0) % $ 530 15.5 % $ 56 0.9 % $ 1,014 15.0 % Transportation Solutions $ 322 17.3 % $ 344 17.5 % $ 647 17.4 % $ 700 17.7 % Industrial Solutions 145 15.1 159 15.8 277 14.7 297 15.3 Communications Solutions 52 13.8 78 18.0 97 13.0 149 17.2 Total $ 519 16.2 % $ 581 17.0 % $ 1,021 16.0 % $ 1,146 17.0 % Operating Margin Operating Margin Operating Margin Operating Margin Adjusted Operating Margin (1) Adjusted Operating Margin (1) Adjusted Income (1) (1) Adjusted operating income and adjusted operating margin are non-GAAP financial measures. See description of non-GAAP financial measures. 2020 2019 ($ in millions) Operating Margin (1) Adjusted Operating Margin (1) Adjusted Operating Income (1) Adjusted Operating Adjusted Operating Net Sales Net Sales Net Sales Income (1) Adjusted Operating Income (1) Income (Loss) Operating Operating Income Operating Income (Loss) Net Sales Operating Income For the Quarters Ended March 27, March 29, March 27, March 29, 2020 For the Six Months Ended 2019 |
| TE Connectivity Confidential & Proprietary. Do not reproduce or distribute. Reconciliation of Net Sales Growth 21 Transportation Solutions (3): Automotive $ (60) (4.2) % $ (29) (2.1) % $ (31) $ - Commercial transportation (30) (9.3) (36) (11.1) (8) 14 Sensors (24) (10.8) (33) (14.9) (3) 12 Total (114) (5.8) (98) (5.0) (42) 26 Industrial Solutions (3): Aerospace, defense, oil, and gas (13) (3.9) (10) (2.9) (3) - Industrial equipment (46) (14.1) (40) (12.5) (6) - Medical 10 5.7 10 5.7 - - Energy 4 2.3 10 5.6 (6) - Total (45) (4.5) (30) (3.0) (15) - Communications Solutions (3): Data and devices (33) (13.1) (33) (13.1) - - Appliances (25) (13.7) (22) (11.9) (3) - Total (58) (13.4) (55) (12.6) (3) - Total $ (217) (6.4) % $ (183) (5.4) % $ (60) $ 26 Transportation Solutions (3): Automotive $ (124) (4.3) % $ (72) (2.5) % $ (52) $ - Commercial transportation (69) (11.1) (81) (13.2) (15) 27 Sensors (39) (8.8) (58) (13.1) (5) 24 Total (232) (5.9) (211) (5.3) (72) 51 Industrial Solutions (3): Aerospace, defense, oil, and gas 11 1.8 17 2.8 (6) - Industrial equipment (98) (15.3) (87) (13.7) (11) - Medical 21 6.1 22 6.3 (1) - Energy 20 6.0 29 8.7 (9) - Total (46) (2.4) (19) (1.0) (27) - Communications Solutions (3): Data and devices (71) (14.0) (71) (14.0) - - Appliances (47) (13.1) (43) (11.7) (4) - Total (118) (13.6) (114) (13.1) (4) - Total $ (396) (5.9) % $ (344) (5.1) % $ (103) $ 51 ($ in millions) Translation (2) Acquisitions Growth (Decline) Growth (Decline) (1) Translation (2) Acquisitions Change in Net Sales for the Six Months Ended March 27, 2020 versus Net Sales for the Six Months Ended March 29, 2019 (1) Organic net sales growth (decline) is a non-GAAP financial measure. See description of non-GAAP financial measures. (2) Represents the change in net sales resulting from changes in foreign currency exchange rates. (3) Industry end market information is presented consistently with our internal management reporting and may be periodically revised as management deems necessary. ($ in millions) Net Sales Growth (Decline) Organic Net Sales Growth (Decline) (1) Change in Net Sales for the Quarter Ended March 27, 2020 versus Net Sales for the Quarter Ended March 29, 2019 Net Sales Organic Net Sales |
| TE Connectivity Confidential & Proprietary. Do not reproduce or distribute. Reconciliation of Non-GAAP Financial Measures to GAAP Financial Measures for the Quarter Ended March 27, 2020 22 Operating income (loss): Transportation Solutions $ (606) $ 10 $ 18 $ 900 $ - $ 322 Industrial Solutions 142 2 1 - - 145 Communications Solutions 49 - 3 - - 52 Total $ (415) $ 12 $ 22 $ 900 $ - $ 519 Operating margin (13.0) % 16.2 % Other income, net $ 11 $ - $ - $ - $ (8) $ 3 Income tax expense $ (42) $ (2) $ (4) $ (4) $ (31) $ (83) Effective tax rate (10.2) % 16.1 % Income (loss) from continuing operations $ (452) $ 10 $ 18 $ 896 $ (39) $ 433 Diluted earnings (loss) per share from continuing operations (3) $ (1.35) $ 0.03 $ 0.05 $ 2.67 $ (0.12) $ 1.29 and Other Adjusted Tax Related Impairment Acquisition- Restructuring Adjustments (4) See description of non-GAAP financial measures. (1) The tax effect of each non-GAAP adjustment is calculated based on the jurisdictions in which the expense (income) is incurred and the tax laws in effect for each such jurisdiction. (2) Includes an income tax benefit related to pre-separation tax matters and the termination of the tax sharing agreement with Tyco International and Covidien, as well as the related impact to net other income. U.S. GAAP Charges (1) (Non-GAAP) (4) Charges, Net (1) Items (2) (3) U.S. GAAP diluted shares excludes one million of nonvested share awards and options outstanding as the inclusion of these securities would have been antidilutive because of our loss during the period. Such amounts are included in adjusted (non-GAAP) diluted shares. ($ in millions, except per share data) of Goodwill (1) |
| TE Connectivity Confidential & Proprietary. Do not reproduce or distribute. Reconciliation of Non-GAAP Financial Measures to GAAP Financial Measures for the Quarter Ended March 29, 2019 23 Acquisition- Restructuring Related and Other Tax Adjusted U.S. GAAP Charges(1) Charges, Net (1) Items (2) (Non-GAAP) (3) Operating income: Transportation Solutions 316 $ 4 $ 24 $ - $ 344 $ Industrial Solutions 137 5 17 - 159 Communications Solutions 77 - 1 - 78 Total 530 $ 9 $ 42 $ - $ 581 $ Operating margin 15.5% 17.0% Other income, net 1 $ - $ - $ - $ 1 $ Income tax expense (91) $ (2) $ (10) $ 15 $ (88) $ Effective tax rate 17.5% 15.4% Income from continuing operations 429 $ 7 $ 32 $ 15 $ 483 $ Diluted earnings per share from continuing operations 1.26 $ 0.02 $ 0.09 $ 0.04 $ 1.42 $ (3) See description of non-GAAP financial measures. Adjustments ($ in millions, except per share data) (1) The tax effect of each non-GAAP adjustment is calculated based on the jurisdictions in which the expense (income) is incurred and the tax laws in effect for each such jurisdiction. (2) Includes income tax expense associated with the tax impacts of certain legal entity restructurings and intercompany transactions. |
| TE Connectivity Confidential & Proprietary. Do not reproduce or distribute. Reconciliation of Non-GAAP Financial Measures to GAAP Financial Measures for the Six Months Ended March 27, 2020 24 Operating income (loss): Transportation Solutions $ (290) $ 15 $ 22 $ 900 $ - $ 647 Industrial Solutions 257 4 16 - - 277 Communications Solutions 89 - 8 - - 97 Total $ 56 $ 19 $ 46 $ 900 $ - $ 1,021 Operating margin 0.9 % 16.0 % Other income, net $ 16 $ - $ - $ - $ (8) $ 8 Income tax expense $ (489) $ (3) $ (4) $ (4) $ 324 $ (176) Effective tax rate 815.0 % 17.3 % Income (loss) from continuing operations $ (429) $ 16 $ 42 $ 896 $ 316 $ 841 Diluted earnings (loss) per share from continuing operations (3) $ (1.28) $ 0.05 $ 0.13 $ 2.67 $ 0.94 $ 2.50 Impairment of Goodwill (1) (3) U.S. GAAP diluted shares excludes two million of nonvested share awards and options outstanding as the inclusion of these securities would have been antidilutive because of our loss during the period. Such amounts are included in adjusted (non-GAAP) diluted shares. (1) The tax effect of each non-GAAP adjustment is calculated based on the jurisdictions in which the expense (income) is incurred and the tax laws in effect for each such jurisdiction. (2) Includes income tax expense related to the tax impacts of certain measures of Swiss tax reform. Also includes an income tax benefit related to pre-separation tax matters and the termination of the tax sharing agreement with Tyco International and Covidien, as well as the related impact to net other income. Acquisition- Charges (1) Restructuring and Other Charges, Net (1) Related Items (2) (Non-GAAP) (4) Adjusted (4) See description of non-GAAP financial measures. U.S. GAAP Adjustments Tax ($ in millions, except per share data) |
| TE Connectivity Confidential & Proprietary. Do not reproduce or distribute. Reconciliation of Non-GAAP Financial Measures to GAAP Financial Measures for the Six Months Ended March 29, 2019 25 Operating income: Transportation Solutions $ 648 $ 7 $ 45 $ - $ 700 Industrial Solutions 237 8 52 - 297 Communications Solutions 129 - 20 - 149 Total $ 1,014 $ 15 $ 117 $ - $ 1,146 Operating margin 15.0 % 17.0 % Income tax expense $ (169) $ (3) $ (29) $ 15 $ (186) Effective tax rate 17.2 % 16.7 % Income from continuing operations $ 812 $ 12 $ 88 $ 15 $ 927 Diluted earnings per share from continuing operations $ 2.37 $ 0.04 $ 0.26 $ 0.04 $ 2.71 Related ($ in millions, except per share data) (Non-GAAP) (3) Charges (1) and Other Charges, Net (1) Restructuring Tax Items (2) Adjusted (3) See description of non-GAAP financial measures. (1) The tax effect of each non-GAAP adjustment is calculated based on the jurisdictions in which the expense (income) is incurred and the tax laws in effect for each such jurisdiction. (2) Includes income tax expense associated with the tax impacts of certain legal entity restructurings and intercompany transactions. Adjustments U.S. GAAP Acquisition- |
| TE Connectivity Confidential & Proprietary. Do not reproduce or distribute. Reconciliation of Non-GAAP Financial Measures to GAAP Financial Measures for the Quarter Ended June 28, 2019 26 Operating income: Transportation Solutions $ 308 $ 6 $ 53 $ - $ 367 Industrial Solutions 156 3 8 - 167 Communications Solutions 56 - 6 - 62 Total $ 520 $ 9 $ 67 $ - $ 596 Operating margin 15.3 % 17.6 % Other income, net $ 2 $ - $ - $ - $ 2 Income tax (expense) benefit $ 245 $ (1) $ (17) $ (307) $ (80) Effective tax rate (47.8) % 13.6 % Income from continuing operations $ 758 $ 8 $ 50 $ (307) $ 509 Diluted earnings per share from continuing operations $ 2.24 $ 0.02 $ 0.15 $ (0.91) $ 1.50 (3) See description of non-GAAP financial measures. (2) Includes a $214 million income tax benefit related to the tax impacts of certain measures of Swiss tax reform and a $93 million income tax benefit related to the effective settlement of a tax audit in a non-U.S. jurisdiction. (1) The tax effect of each non-GAAP adjustment is calculated based on the jurisdictions in which the expense (income) is incurred and the tax laws in effect for each such jurisdiction. U.S. GAAP Adjustments Acquisition- Related Charges (1) Adjusted (Non-GAAP) (3) ($ in millions, except per share data) Charges, Net (1) and Other Restructuring Items (2) Tax |
| TE Connectivity Confidential & Proprietary. Do not reproduce or distribute. Reconciliation of Non-GAAP Financial Measures to GAAP Financial Measures for the Year Ended September 27, 2019 27 Acquisition- Related Charges Restructuring and Other and Other Tax Adjusted U.S. GAAP Items (1)(2) Charges, Net (1) Items (3) (Non-GAAP) (4) Operating income: Transportation Solutions 1,226 $ 31 $ 144 $ - $ 1,401 $ Industrial Solutions 543 15 63 - 621 Communications Solutions 209 1 48 - 258 Total 1,978 $ 47 $ 255 $ - $ 2,280 $ Operating margin 14.7% 17.0% Other income, net 2 $ - $ - $ - $ 2 $ Income tax (expense) benefit 15 $ (9) $ (61) $ (291) $ (346) $ Effective tax rate (0.8)% 15.5% Income from continuing operations 1,946 $ 38 $ 194 $ (291) $ 1,887 $ Diluted earnings per share from continuing operations 5.72 $ 0.11 $ 0.57 $ (0.86) $ 5.55 $ Adjustments (4) See description of non-GAAP financial measures. ($ in millions, except per share data) (1) The tax effect of each non-GAAP adjustment is calculated based on the jurisdictions in which the expense (income) is incurred and the tax laws in effect for each such jurisdiction. (3) Includes a $216 million income tax benefit related to the tax impacts of certain measures of Swiss tax reform, a $90 million income tax benefit related to the effective settlement of a tax audit in a non-U.S. jurisdiction, and $15 million of income tax expense associated with the tax impacts of certain legal entity restructurings and intercompany transactions. (2) Includes acquisition-related charges of $30 million and a write-off of spare parts of $17 million. |
| TE Connectivity Confidential & Proprietary. Do not reproduce or distribute. Reconciliation of Free Cash Flow 28 Net cash provided by operating activities: Net cash provided by continuing operating activities $ 481 $ 555 $ 892 $ 883 Net cash provided by (used in) discontinued operating activities - 1 - (30) 481 556 892 853 Net cash used in investing activities (378) (165) (667) (85) Net cash used in financing activities (31) (333) (345) (1,052) Effect of currency translation on cash (18) 2 (11) 1 Net increase (decrease) in cash, cash equivalents, and restricted cash $ 54 $ 60 $ (131) $ (283) Net cash provided by continuing operating activities $ 481 $ 555 $ 892 $ 883 Excluding: Cash collected pursuant to collateral requirements related to cross-currency swap contracts (38) (32) (32) (82) Capital expenditures, net (132) (179) (306) (388) Free cash flow (1) $ 311 $ 344 $ 554 $ 413 (1) Free cash flow is a non-GAAP financial measure. See description of non-GAAP financial measures. For the Quarters Ended March 27, 2020 March 29, 2019 (in millions) March 27, For the Six Months Ended 2020 2019 March 29, |
| TE Connectivity Confidential & Proprietary. Do not reproduce or distribute. Reconciliation of Free Cash Flow 29 December 27, September 27, June 28, March 29, December 28, September 28, June 29, March 30, December 29, 2019 2019 2019 2019 2018 2018 2018 2018 2017 Net cash provided by operating activities: Net cash provided by continuing operating activities 411 $ 879 $ 692 $ 555 $ 328 $ 922 $ 734 $ 362 $ 283 $ Net cash provided by (used in) discontinued operating activities - (1) (1) 1 (31) 2 66 15 67 411 878 691 556 297 924 800 377 350 Net cash provided by (used in) investing activities (289) (153) (454) (165) 80 (419) (233) (201) (241) Net cash used in financing activities (314) (334) (257) (333) (719) (420) (338) (330) (634) Effect of currency translation on cash 7 (10) 1 2 (1) (7) (18) 9 11 Net increase (decrease) in cash, cash equivalents, and restricted cash (185) $ 381 $ (19) $ 60 $ (343) $ 78 $ 211 $ (145) $ (514) $ Net cash provided by continuing operating activities 411 $ 879 $ 692 $ 555 $ 328 $ 922 $ 734 $ 362 $ 283 $ Excluding: Receipts related to pre-separation U.S. tax matters, net - - - - - - - (5) - Cash (collected) paid pursuant to collateral requirements related to cross-currency swap contracts 6 (39) (11) (32) (50) 6 (69) 61 18 Capital expenditures, net (174) (152) (166) (179) (209) (258) (222) (195) (237) Free cash flow (1) 243 $ 688 $ 515 $ 344 $ 69 $ 670 $ 443 $ 223 $ 64 $ For the Quarters Ended (in millions) (1) Free cash flow is a non-GAAP financial measure. See description of non-GAAP financial measures. |
| TE Connectivity Confidential & Proprietary. Do not reproduce or distribute. Adjusted Return on Invested Capital (ROIC) 30 Operating income (loss) $ (415) $ 471 $ 444 $ 520 $ 530 $ 484 $ 570 $ 554 Acquisition-related charges and other items 12 7 23 9 9 6 5 5 Restructuring and other charges, net 22 24 71 67 42 75 22 64 Impairment of goodwill 900 - - - - - - - Adjusted operating income (1) $ 519 $ 502 $ 538 $ 596 $ 581 $ 565 $ 597 $ 623 Amortization expense $ 46 $ 45 $ 45 $ 45 $ 45 $ 45 $ 45 $ 45 Adjustment (2) - - - - (2) (1) - (1) Adjusted amortization expense $ 46 $ 45 $ 45 $ 45 $ 43 $ 44 $ 45 $ 44 Adjusted operating income plus adjusted amortization expense $ 565 $ 547 $ 583 $ 641 $ 624 $ 609 $ 642 $ 667 Income (loss) from continuing operations before income taxes $ (410) $ 470 $ 437 $ 513 $ 520 $ 461 $ 546 $ 530 Acquisition-related charges and other items 12 7 23 9 9 6 5 5 Restructuring and other charges, net 22 24 71 67 42 75 22 64 Impairment of goodwill 900 - - - - - - - Tax items (8) - - - - - - - Adjusted income from continuing operations before income taxes $ 516 $ 501 $ 531 $ 589 $ 571 $ 542 $ 573 $ 599 Income taxes paid, net of refunds $ 101 $ 43 $ 61 $ 100 $ 102 $ 75 $ 76 $ 109 Adjusted cash tax rate 19.6 % 8.6 % 11.5 % 17.0 % 17.9 % 13.8 % 13.3 % 18.2 % Adjusted net operating profit after taxes $ 454 $ 500 $ 516 $ 532 $ 513 $ 525 $ 557 $ 546 Trailing four quarter adjusted net operating profit after taxes $ 2,002 $ 2,141 Total debt $ 4,355 $ 3,973 $ 3,965 $ 4,036 $ 3,982 $ 3,967 $ 4,000 $ 4,008 Total TE Connectivity Ltd. shareholders' equity 9,066 10,557 10,570 10,622 9,994 10,236 10,831 9,492 Invested capital $ 13,421 $ 14,530 $ 14,535 $ 14,658 $ 13,976 $ 14,203 $ 14,831 $ 13,500 Trailing four quarter average invested capital $ 14,286 $ 14,128 Adjusted ROIC (1) 14.0 % 15.2 % ($ in millions) (1) See description of non-GAAP financial measures. (2) Adjustment for non-cash amortization associated with fair value adjustments related to acquired customer order backlog as these charges are included in the acquisition-related charges and other items line. As of or for the Quarters Ended March 27, 2020 December 27, 2019 September 27, 2019 June 28, 2019 March 29, 2019 December 28, 2018 September 28, 2018 June 29, 2018 |
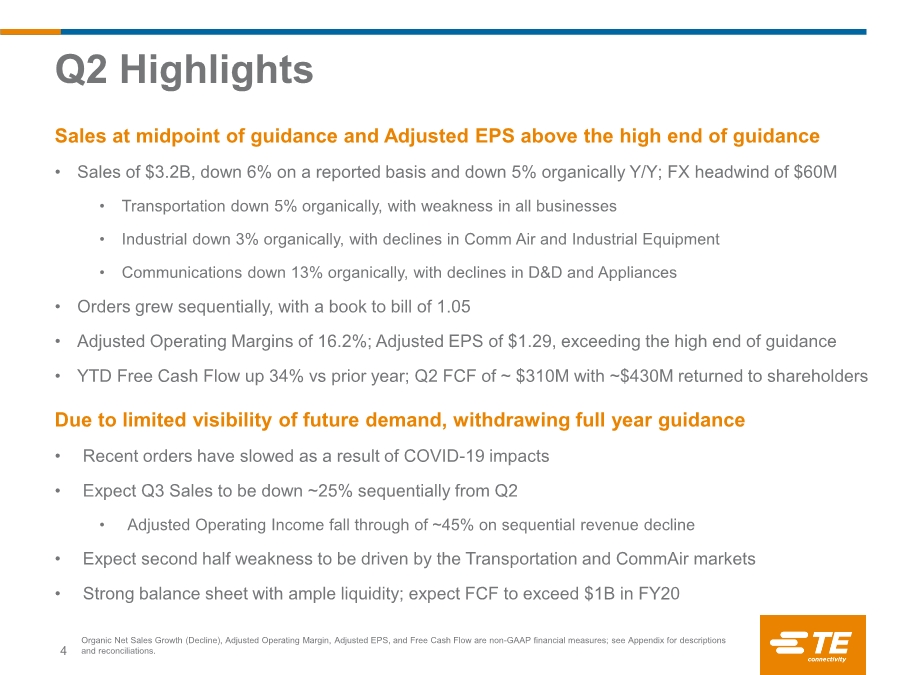
| TE Connectivity Confidential & Proprietary. Do not reproduce or distribute. Reconciliation of Adjusted EBITDA and Adjusted EBITDA Margin 31 Net income (loss) $ (456) $ 439 (Income) loss from discontinued operations 4 (10) Income tax expense 42 91 Other income, net (11) (1) Interest expense 11 15 Interest income (5) (4) Operating income (loss) (415) 530 Acquisition-related charges 12 9 Restructuring and other charges, net 22 42 Impairment of goodwill 900 - Adjusted operating income (1) 519 581 Depreciation and amortization (2) 180 171 Adjusted EBITDA (1) $ 699 $ 752 Net sales $ 3,195 $ 3,412 Net income as a percentage of net sales (14.3) % 12.9 % Adjusted EBITDA margin (1) 21.9 % 22.0 % Operating income (loss) $ (606) $ 142 $ 49 $ (415) $ 316 $ 137 $ 77 $ 530 Acquisition-related charges 10 2 - 12 4 5 - 9 Restructuring and other charges, net 18 1 3 22 24 17 1 42 Impairment of goodwill 900 - - 900 - - - - Adjusted operating income (1) 322 145 52 519 344 159 78 581 Depreciation and amortization (2) 117 46 17 180 109 42 20 171 Adjusted EBITDA (1) $ 439 $ 191 $ 69 $ 699 $ 453 $ 201 $ 98 $ 752 Net sales $ 1,857 $ 962 $ 376 $ 3,195 $ 1,971 $ 1,007 $ 434 $ 3,412 Operating margin (32.6) % 14.8 % 13.0 %(13.0) % 16.0 % 13.6 % 17.7 % 15.5 % Adjusted operating margin (1) 17.3 % 15.1 % 13.8 % 16.2 % 17.5 % 15.8 % 18.0 % 17.0 % Adjusted EBITDA margin (1) 23.6 % 19.9 % 18.4 % 21.9 % 23.0 % 20.0 % 22.6 % 22.0 % (2) Excludes non-cash amortization associated with fair value adjustments related to acquired customer order backlog of $2 million for the quarter March 29, 2019, as these charges are included in the acquisition-related charges line. (1) See description of non-GAAP financial measures. Communications Solutions Total ($ in millions) Total Transportation Solutions Industrial Solutions Solutions Transportation Industrial Solutions Solutions Communications ($ in millions) For the Quarters Ended March 27, 2020 March 29, 2019 For the Quarters Ended March 27, 2020 2019 March 29, |
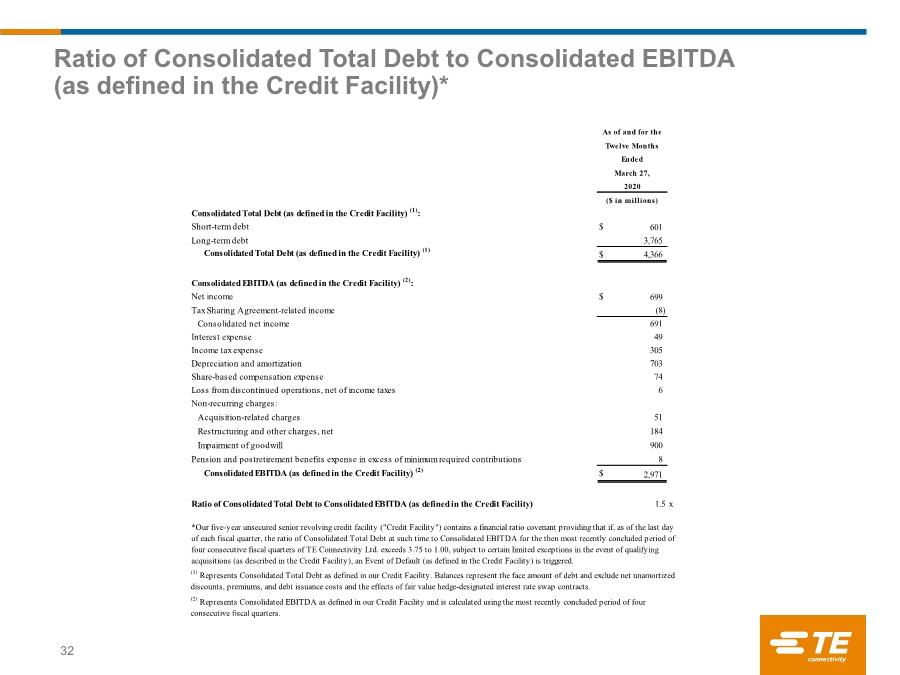
| TE Connectivity Confidential & Proprietary. Do not reproduce or distribute. Ratio of Consolidated Total Debt to Consolidated EBITDA (as defined in the Credit Facility)* 32 Consolidated Total Debt (as defined in the Credit Facility) (1): Short-term debt $ 601 Long-term debt 3,765 Consolidated Total Debt (as defined in the Credit Facility) (1) $ 4,366 Consolidated EBITDA (as defined in the Credit Facility) (2): Net income $ 699 Tax Sharing Agreement-related income (8) Consolidated net income 691 Interest expense 49 Income tax expense 305 Depreciation and amortization 703 Share-based compensation expense 74 Loss from discontinued operations, net of income taxes 6 Non-recurring charges: Acquisition-related charges 51 Restructuring and other charges, net 184 Impairment of goodwill 900 Pension and postretirement benefits expense in excess of minimum required contributions 8 Consolidated EBITDA (as defined in the Credit Facility) (2) $ 2,971 Ratio of Consolidated Total Debt to Consolidated EBITDA (as defined in the Credit Facility) 1.5 x As of and for the Twelve Months Ended ($ in millions) (2) Represents Consolidated EBITDA as defined in our Credit Facility and is calculated using the most recently concluded period of four consecutive fiscal quarters. March 27, 2020 (1) Represents Consolidated Total Debt as defined in our Credit Facility. Balances represent the face amount of debt and exclude net unamortized discounts, premiums, and debt issuance costs and the effects of fair value hedge-designated interest rate swap contracts. *Our five-year unsecured senior revolving credit facility ("Credit Facility") contains a financial ratio covenant providing that if, as of the last day of each fiscal quarter, the ratio of Consolidated Total Debt at such time to Consolidated EBITDA for the then most recently concluded period of four consecutive fiscal quarters of TE Connectivity Ltd. exceeds 3.75 to 1.00, subject to certain limited exceptions in the event of qualifying acquisitions (as described in the Credit Facility), an Event of Default (as defined in the Credit Facility) is triggered. |