`
 | News Release | ||||||||||
Truist reports third quarter 2024 results | |||||||||||
Net income available to common shareholders of $1.3 billion, or $0.99 per share | Solid third quarter results driven by strong revenue growth, expense discipline, and stable asset quality | Repurchased $500 million in common shares; Dividend and total payout ratios of 52% and 90% | |||||||||
3Q24 Key Financial Data | 3Q24 Performance Highlights(4) | ||||||||||
| (Dollars in billions, except per share data) | 3Q24 | 2Q24 | 3Q23 | ||||||||
| Summary Income Statement | |||||||||||
| Net interest income - TE | $ | 3.66 | $ | 3.58 | $ | 3.59 | |||||
| Noninterest income | 1.48 | (5.21) | 1.33 | ||||||||
| Total revenue - TE | 5.14 | (1.63) | 4.93 | ||||||||
| Noninterest expense | 2.93 | 3.09 | 3.06 | ||||||||
| Net income (loss) from continuing operations | 1.44 | (3.91) | 1.11 | ||||||||
| Net income from discontinued operations | 0.00 | 4.83 | 0.07 | ||||||||
| Net income | 1.44 | 0.92 | 1.18 | ||||||||
| Net income available to common shareholders | 1.34 | 0.83 | 1.07 | ||||||||
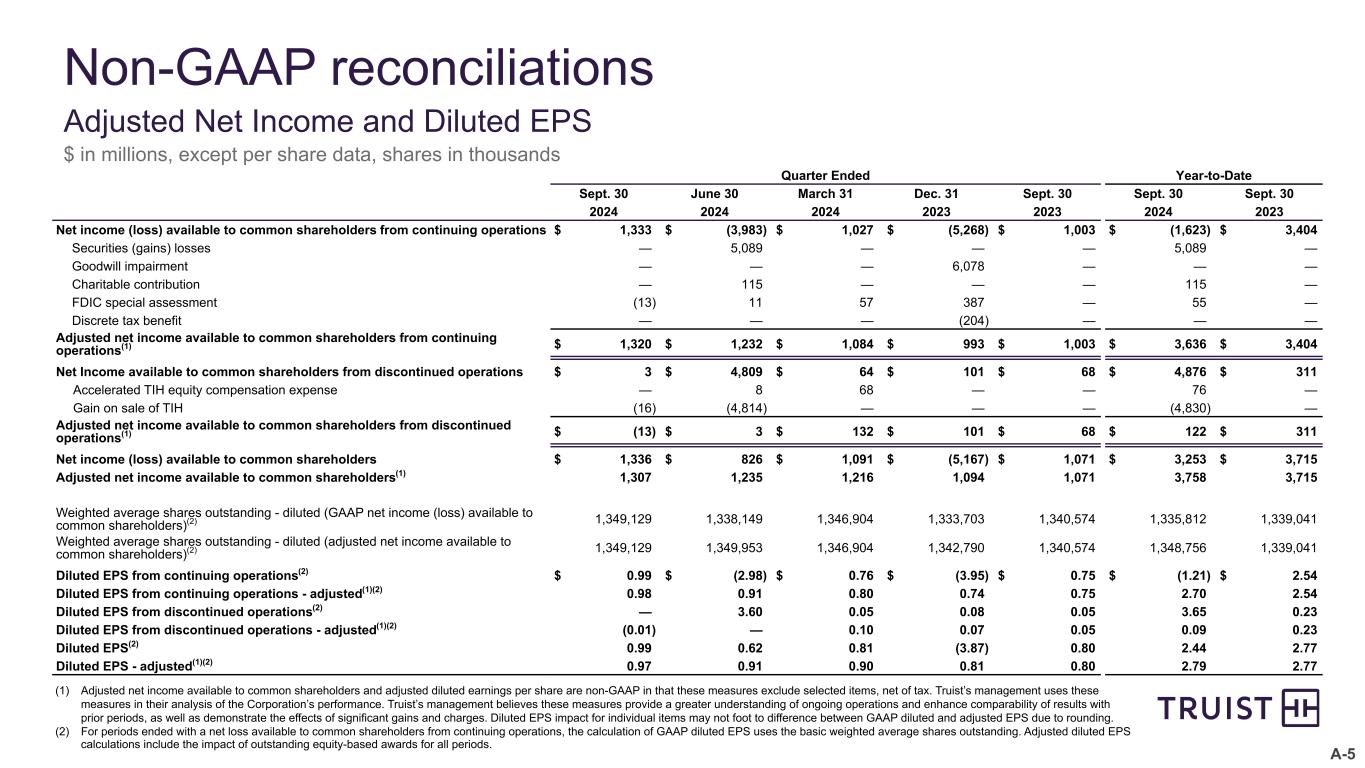
Adjusted net income available to common shareholders(1) | 1.31 | 1.24 | 1.07 | ||||||||
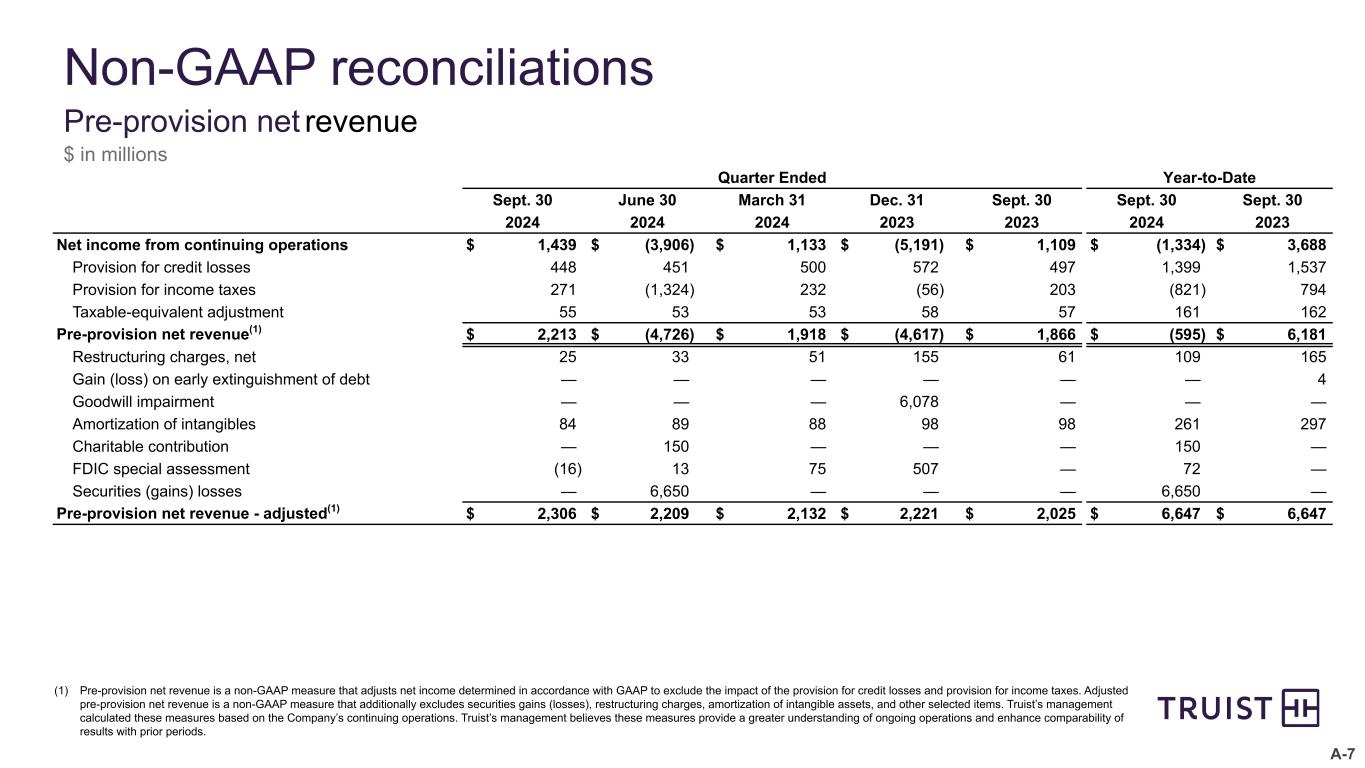
PPNR - unadjusted(1)(2) | 2.21 | (4.73) | 1.87 | ||||||||
PPNR - adjusted(1)(2) | 2.31 | 2.21 | 2.03 | ||||||||
| Key Metrics | |||||||||||
| Diluted EPS | $ | 0.99 | $ | 0.62 | $ | 0.80 | |||||
Adjusted diluted EPS(1) | 0.97 | 0.91 | 0.80 | ||||||||
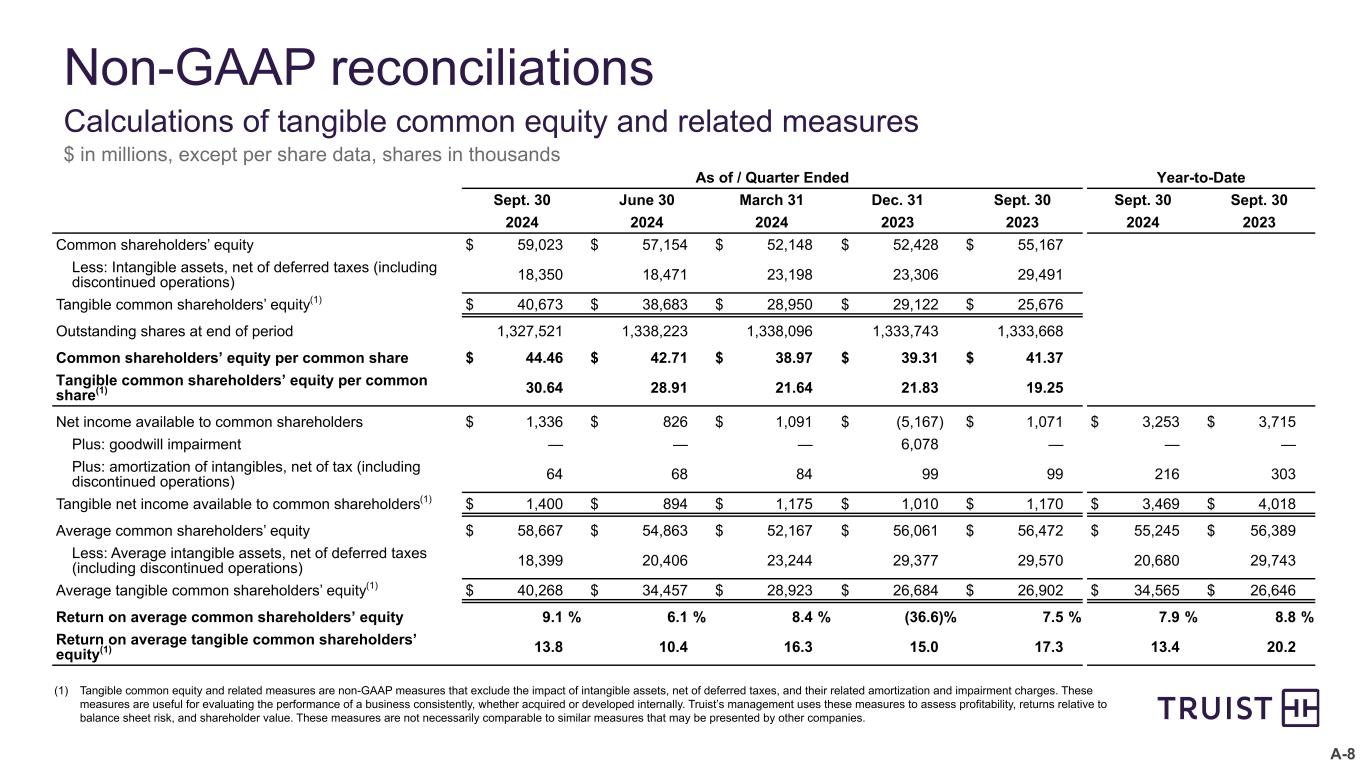
| BVPS | 44.46 | 42.71 | 41.37 | ||||||||
TBVPS(1) | 30.64 | 28.91 | 19.25 | ||||||||
| ROCE | 9.1 | % | 6.1 | % | 7.5 | % | |||||
ROTCE(1) | 13.8 | 10.4 | 17.3 | ||||||||
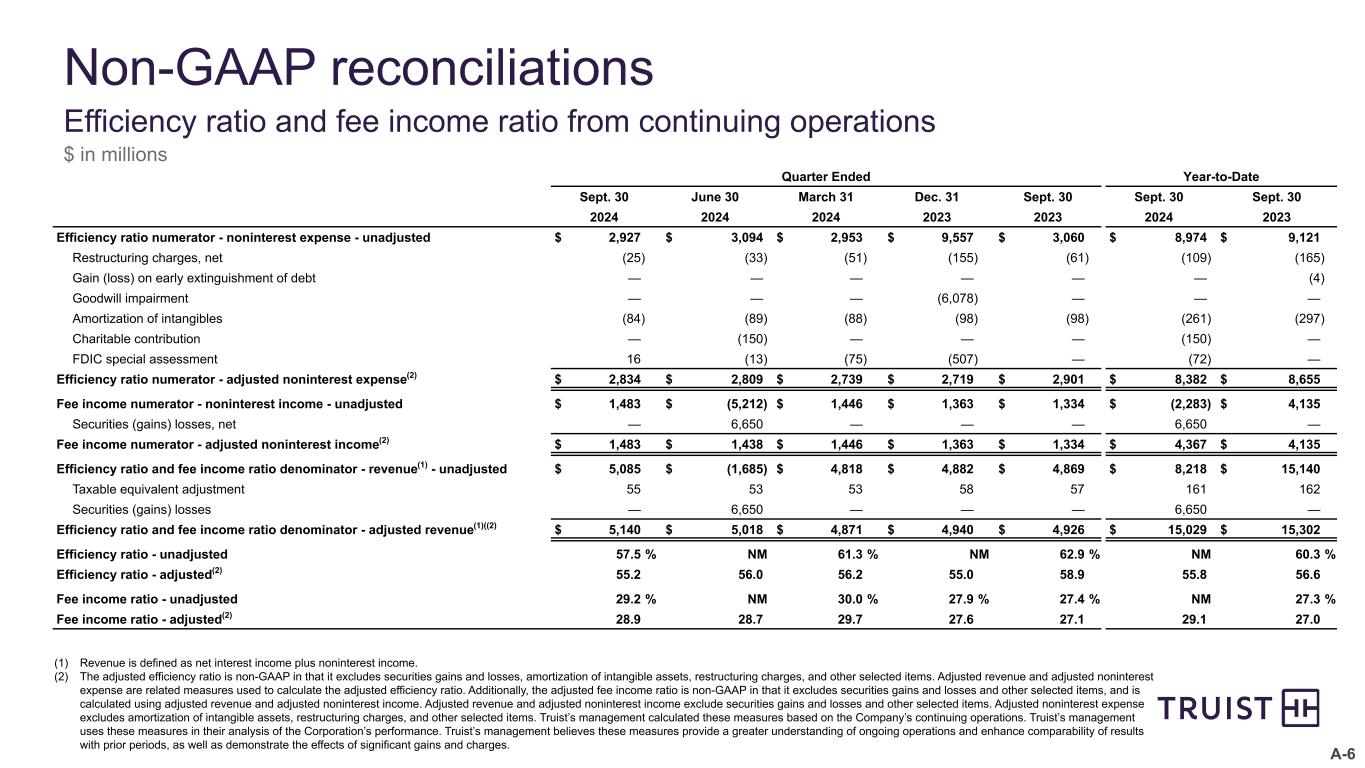
Efficiency ratio - unadjusted(2) | 57.5 | NM | 62.9 | ||||||||
Efficiency ratio - adjusted(1)(2) | 55.2 | 56.0 | 58.9 | ||||||||
Fee income ratio - unadjusted(2) | 29.2 | NM | 27.4 | ||||||||
Fee income ratio - adjusted(1)(2) | 28.9 | 28.7 | 27.1 | ||||||||
NIM - TE(2) | 3.12 | 3.02 | 2.92 | ||||||||
| NCO ratio | 0.55 | 0.58 | 0.51 | ||||||||
| ALLL ratio | 1.60 | 1.57 | 1.49 | ||||||||
CET1 ratio(3) | 11.6 | 11.6 | 9.9 | ||||||||
| Average Balances | |||||||||||
| Assets | $ | 519 | $ | 527 | $ | 548 | |||||
| Securities | 117 | 122 | 136 | ||||||||
| Loans and leases | 305 | 308 | 320 | ||||||||
| Deposits | 384 | 388 | 401 | ||||||||
Amounts may not foot due to rounding.
(1)Represents a non-GAAP measure. A reconciliation of each of these non-GAAP measures to the most directly comparable GAAP measure is included in the appendix to Truist’s Third Quarter 2024 Earnings Presentation.
(2)This metric is calculated based on continuing operations.
(3)Current quarter capital ratios are preliminary.
(4)Comparisons noted in this section summarize changes from third quarter of 2024 compared to second quarter of 2024 on a continuing operations basis, unless otherwise noted.
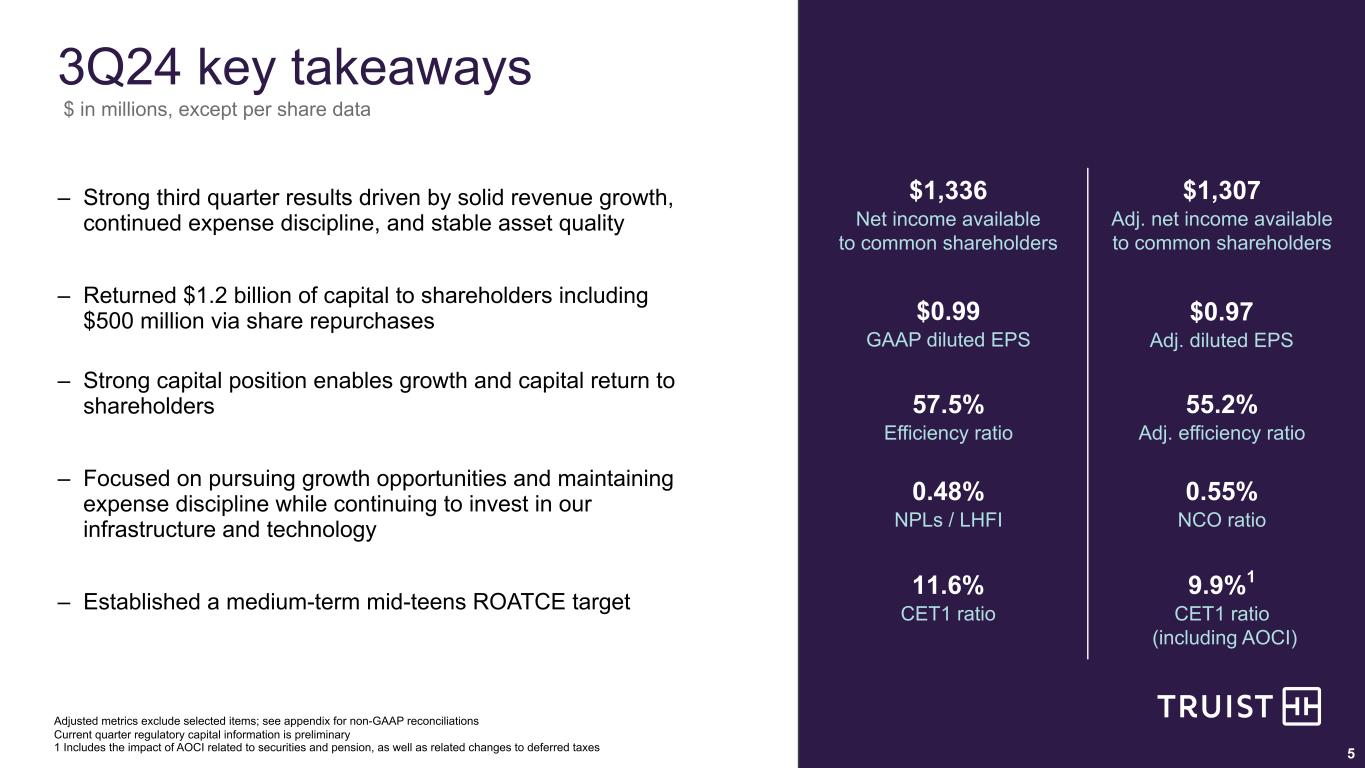
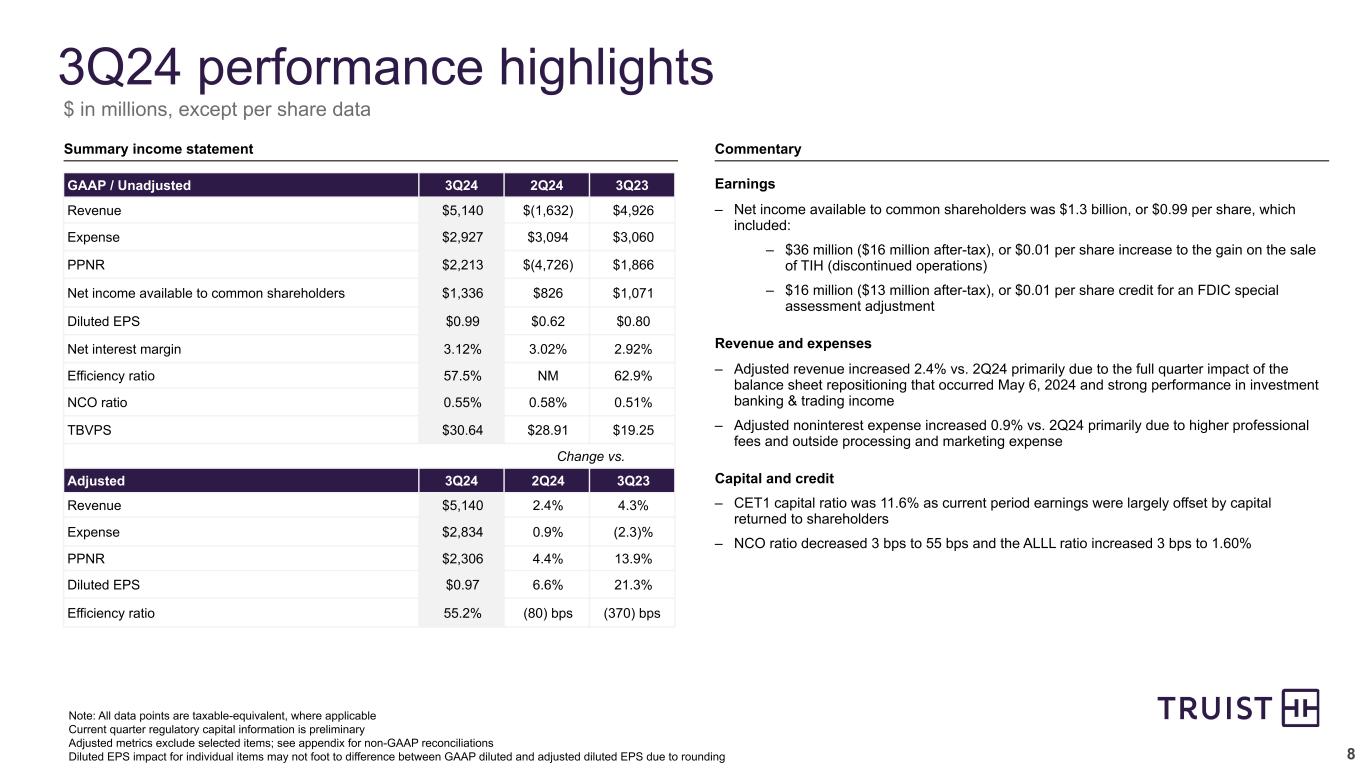
•Net income available to common shareholders was $1.3 billion, or $0.99 per diluted share
•Total revenues were up $6.8 billion due primarily to securities losses in the earlier quarter. Adjusted revenues(1) were up 2.4% due to higher net interest income and noninterest income.
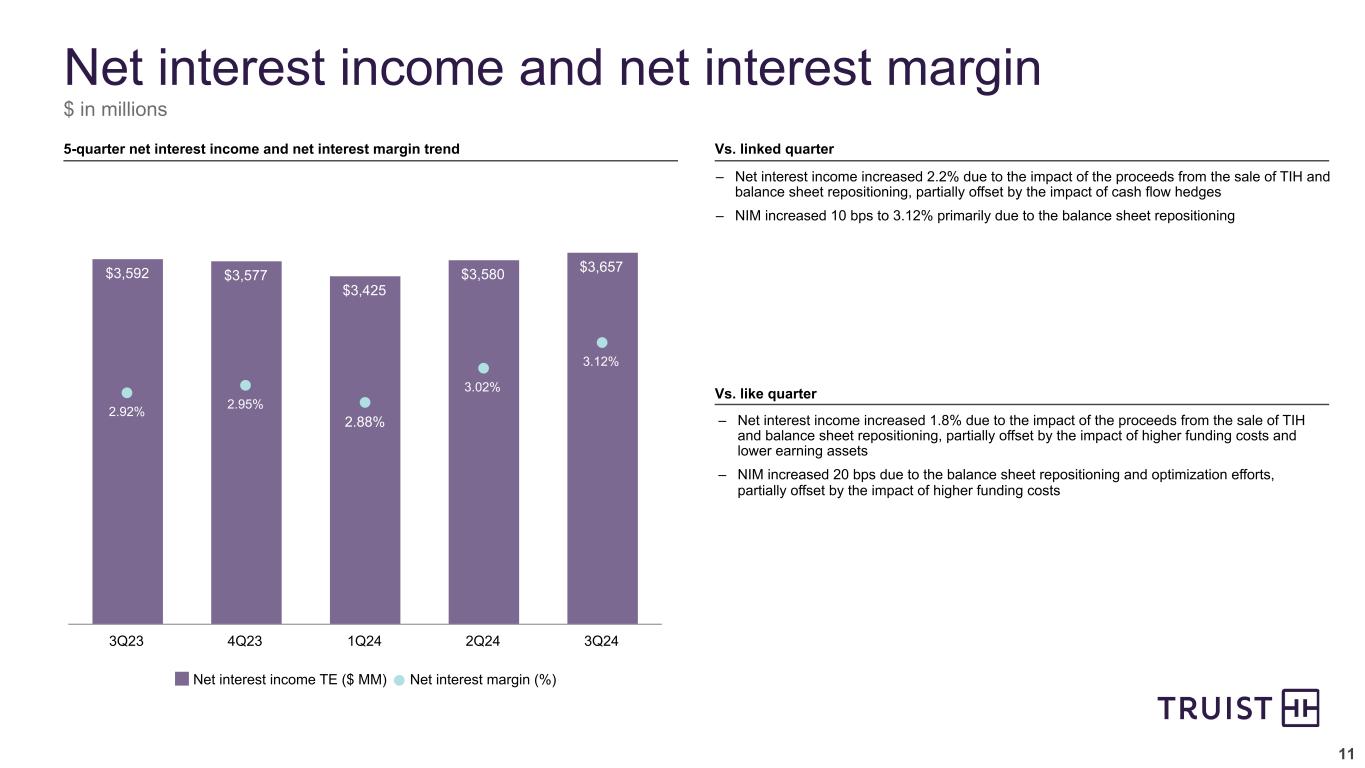
◦Net interest income increased 2.2%; net interest margin was up 10 basis points
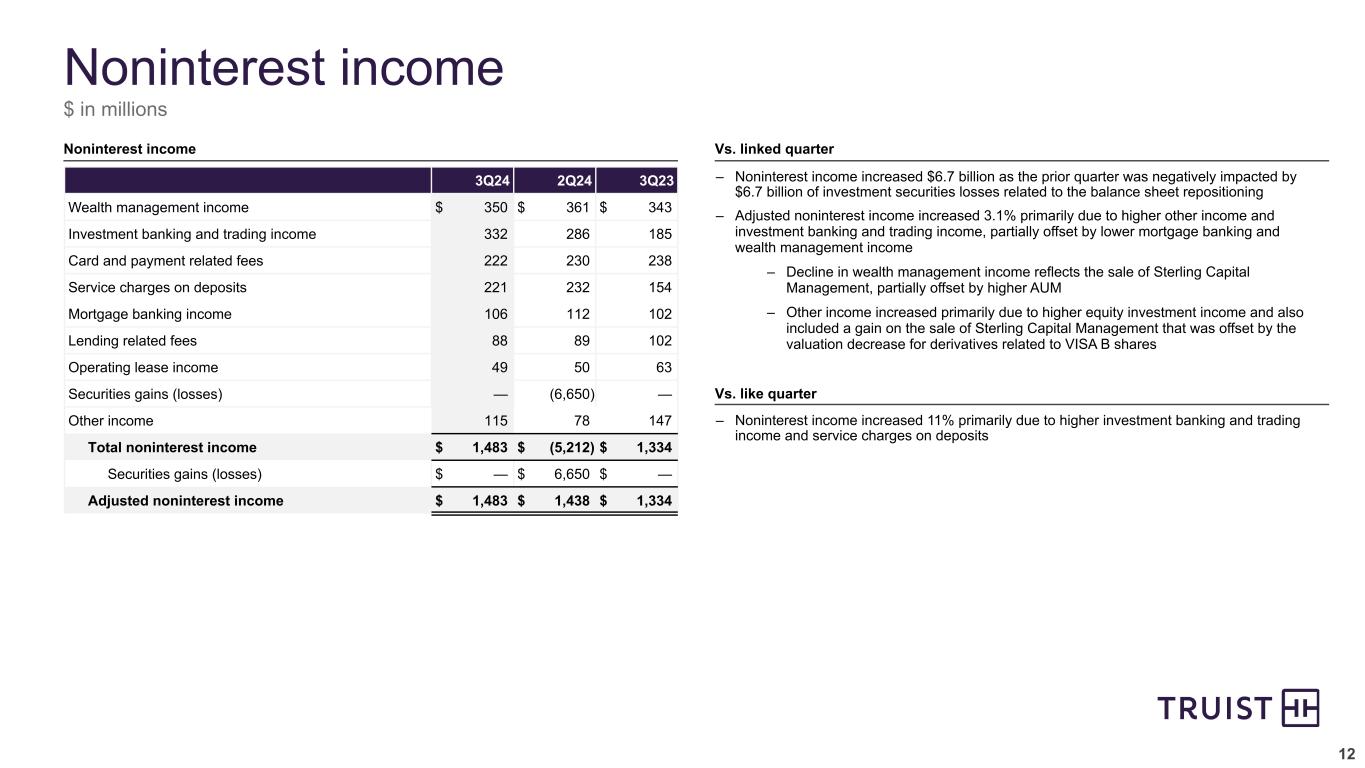
◦Noninterest income was up 3.1% due to higher investment banking and trading income and other income
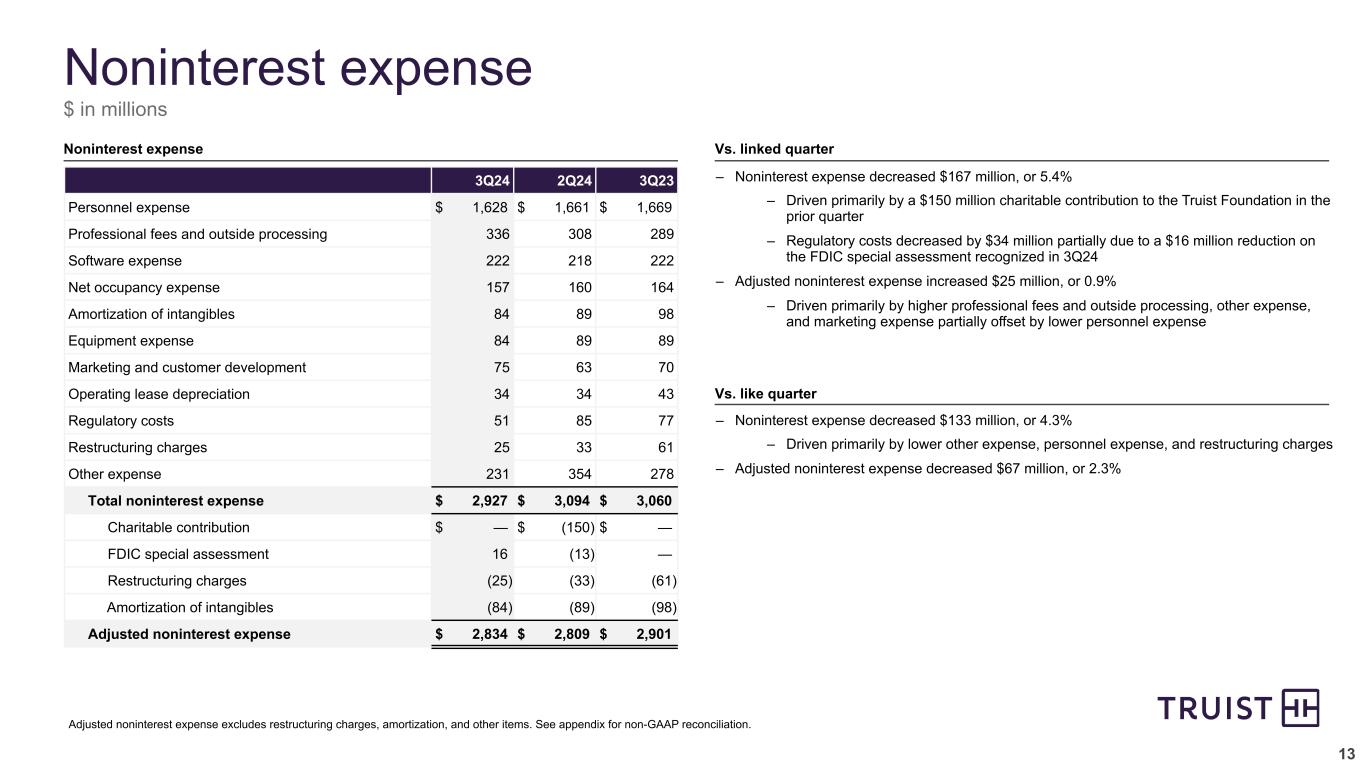
•Noninterest expense was down 5.4%. Adjusted noninterest expense(1) was up 0.9%, reflecting higher professional fees and outside processing expense, partially offset by lower personnel expense.
•Adjusted PPNR(1) was $2.3 billion, up 4.4%
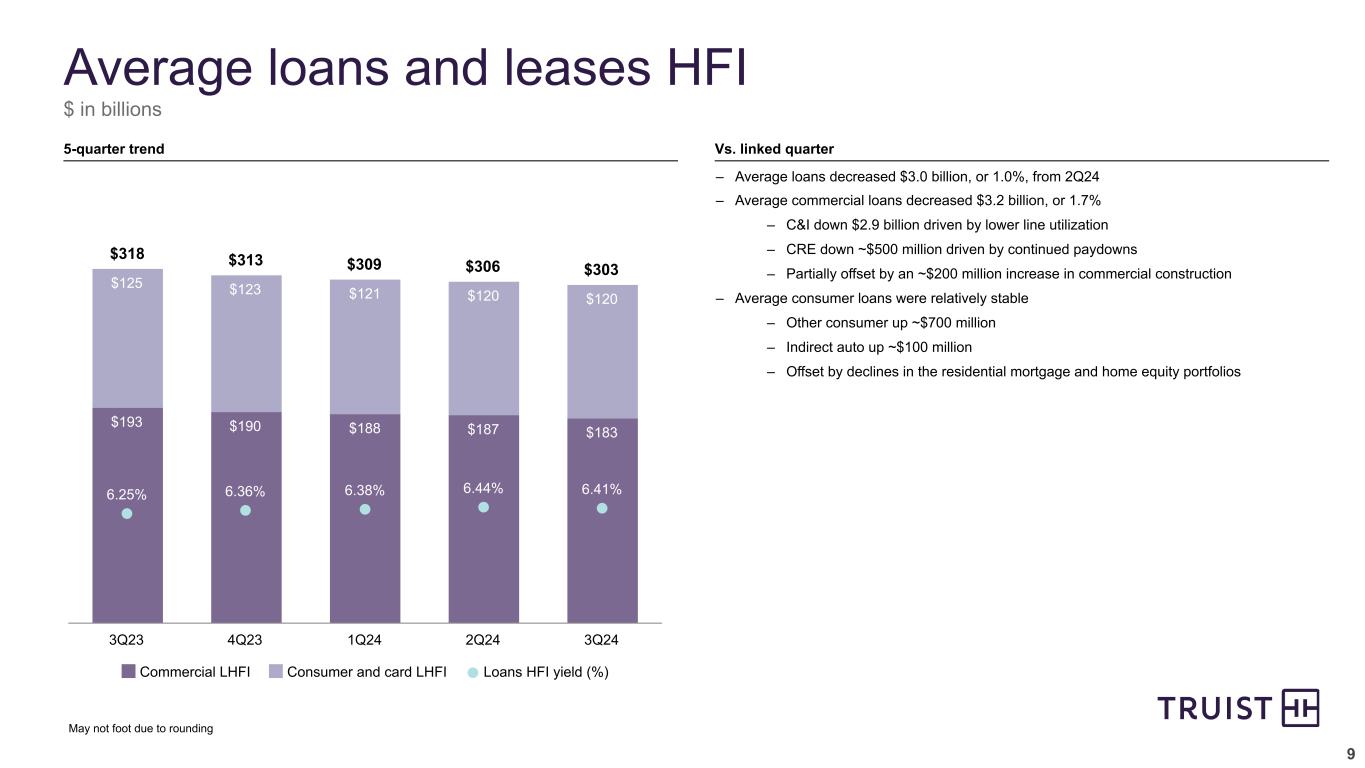
•Average loans and leases HFI decreased 1.0% due to declines in the commercial and industrial and residential mortgage portfolios, partially offset by growth in the other consumer portfolio
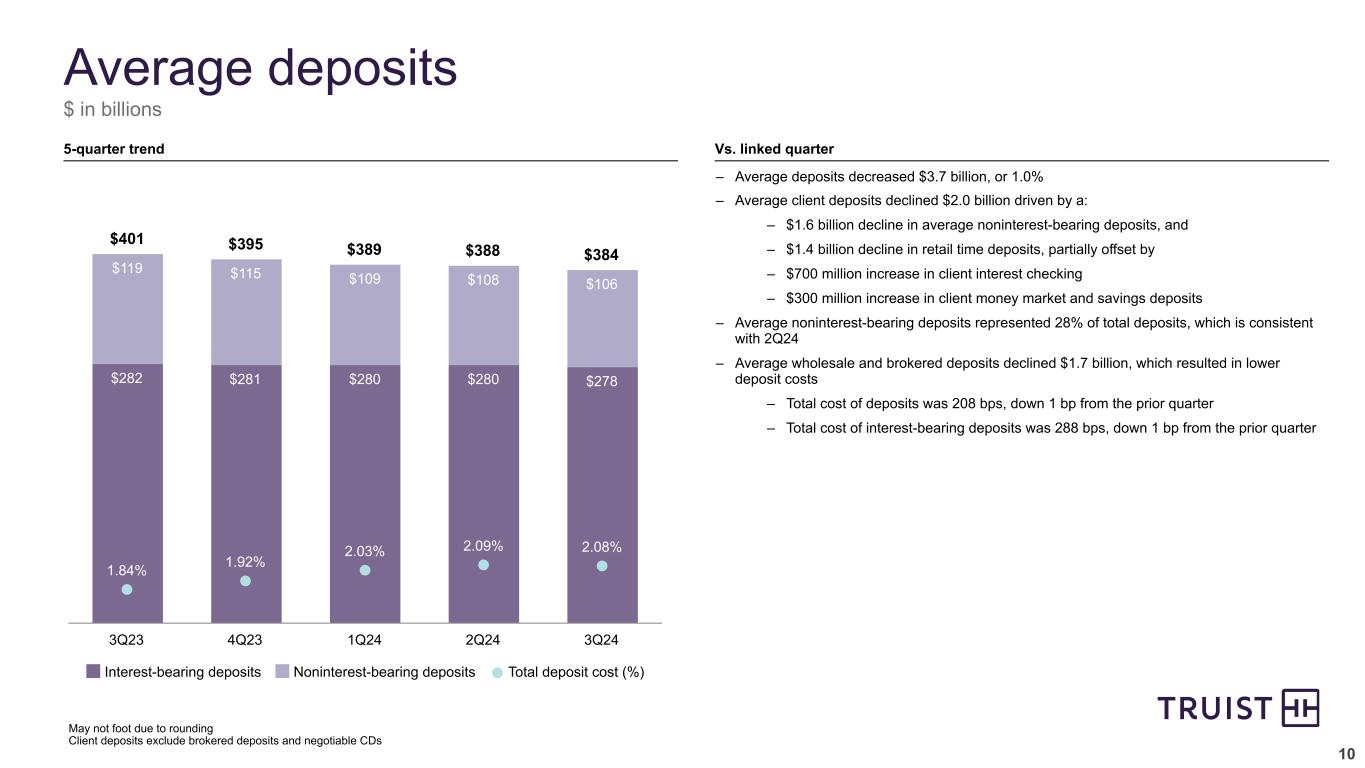
•Average deposits decreased 1.0% due to declines in time and noninterest-bearing deposits, partially offset by an increase in money market and savings deposits
•Asset quality remains solid
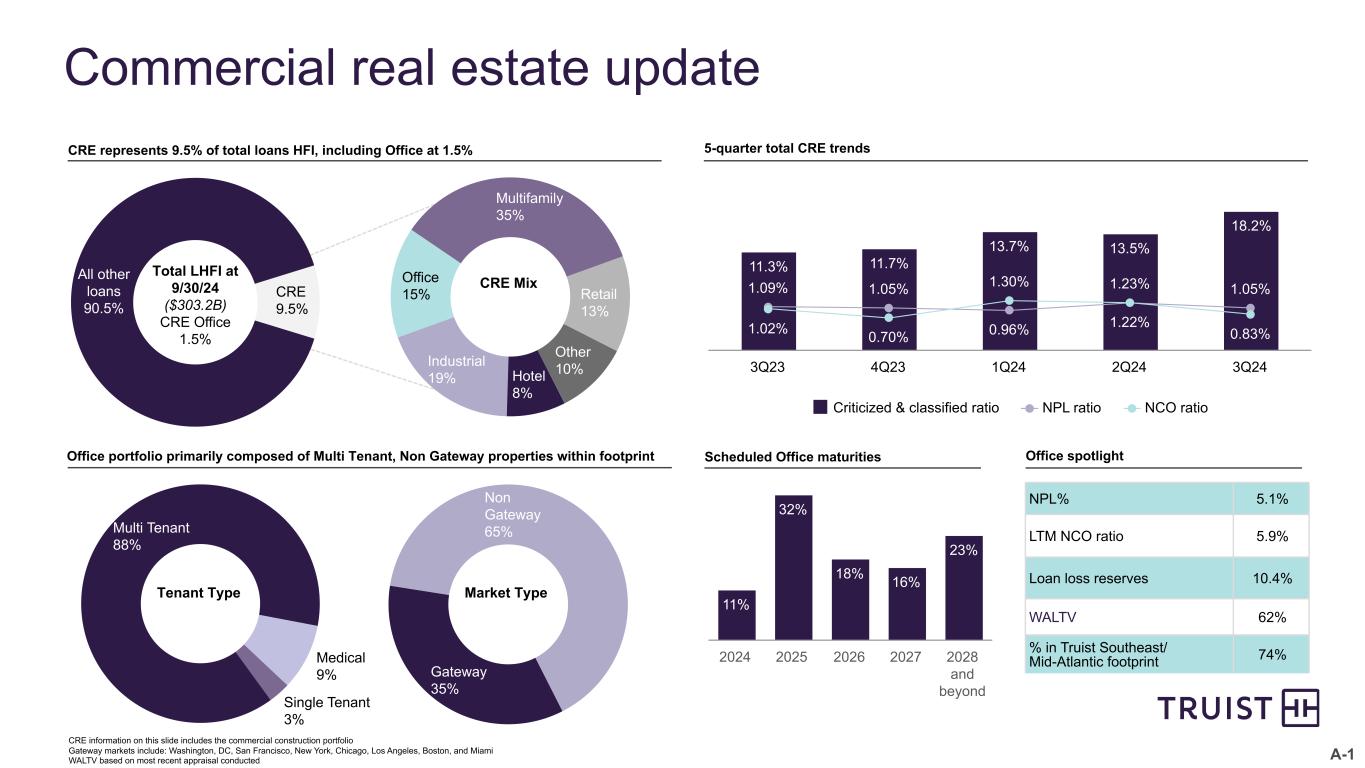
◦Nonperforming loans to total loans were up two basis points due to an increase in the commercial and industrial portfolio, partially offset by a decline in the CRE portfolio
◦Loans 90 days or more past due were up one basis point, or flat excluding government guaranteed loans
◦ALLL ratio increased three basis points
◦Net charge-off ratio of 55 basis points, down three basis points driven by lower net charge-offs in the CRE portfolio
•Capital levels remain strong
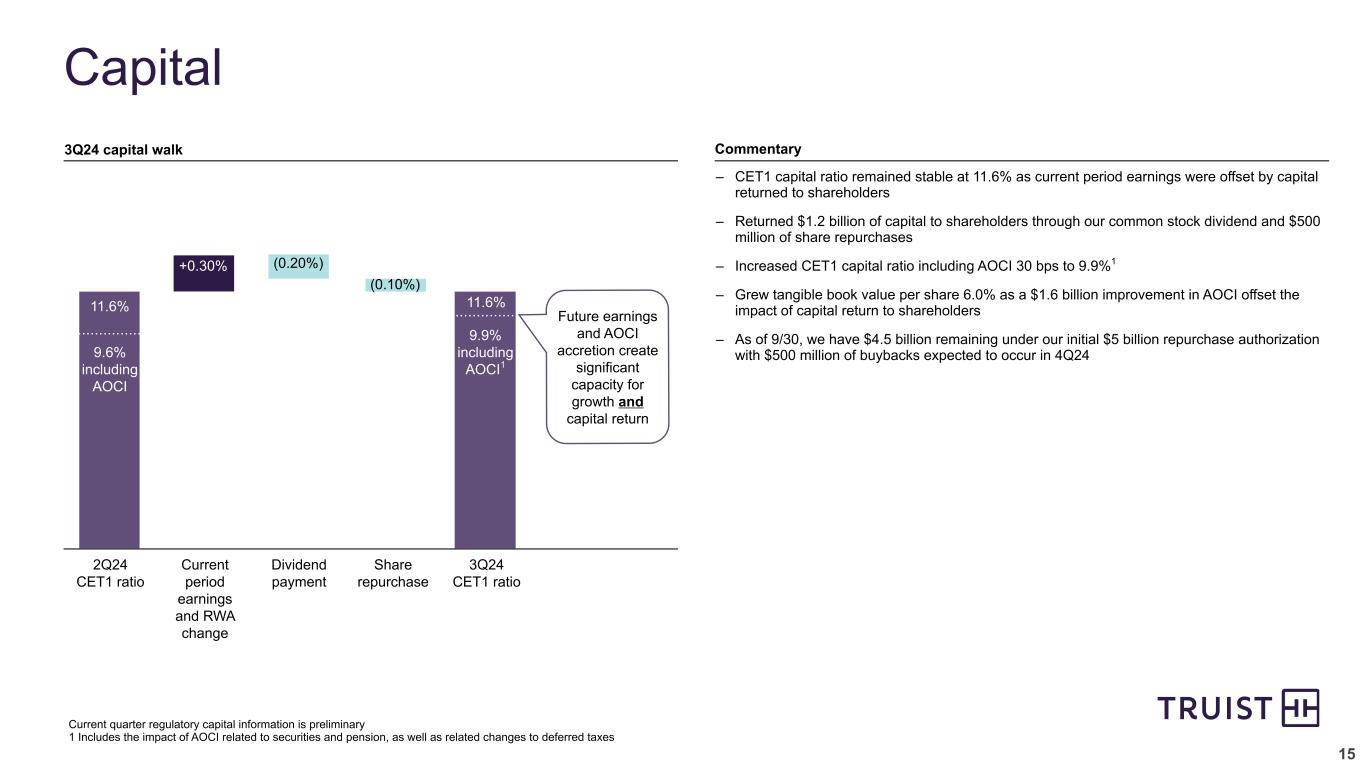
◦Repurchased $500 million in common shares, resulting in a dividend and total payout ratio of 52% and 90%, respectively
◦CET1 ratio(3) was 11.6%
•Liquidity levels remain strong with consolidated average LCR of 112%
| CEO Commentary | ||
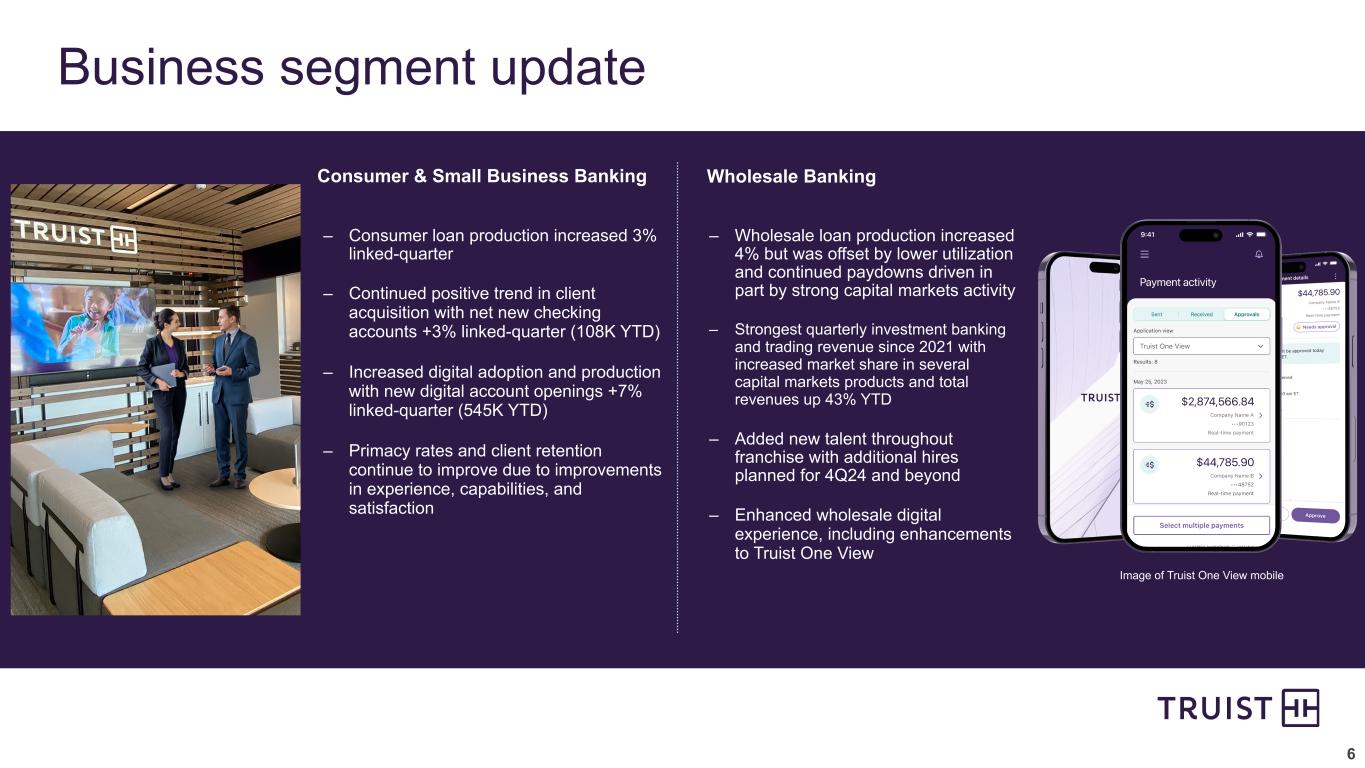
“In the third quarter, we made considerable progress on driving revenue growth through our core banking business by adding new clients, deepening relationships, hiring and developing talented teammates, and investing in technology and infrastructure while maintaining strong expense discipline.
Asset quality metrics were better than our expectations. We also returned $1.2 billion of capital to our shareholders in the form of our common stock dividend and share repurchases completed during the quarter.
Hurricanes Helene and Milton significantly affected teammates and clients in many communities Truist serves. We are working closely with those impacted by these disasters and are committed to help these communities rebuild.
I am particularly proud of Truist teammates living our purpose, which has been on full display these past few weeks. Together, we will continue to deliver on our purpose and care for our clients, which fuel our momentum and growth.”
— Bill Rogers, Truist Chairman & CEO
`
| Contact: | ||||||||
| Investors: | Brad Milsaps | 770.352.5347 | [email protected] | ||||||
| Media: | Shelley Miller | 704.692.1518 | [email protected] | ||||||

| Net Interest Income, Net Interest Margin, and Average Balances | |||||||||||||||||||||||||||||
| Quarter Ended | Change | ||||||||||||||||||||||||||||
| (Dollars in millions) | 3Q24 | 2Q24 | 3Q23 | Link | Like | ||||||||||||||||||||||||
Interest income(1) | $ | 6,407 | $ | 6,404 | $ | 6,284 | $ | 3 | — | % | $ | 123 | 2.0 | % | |||||||||||||||
| Interest expense | 2,750 | 2,824 | 2,692 | (74) | (2.6) | 58 | 2.2 | ||||||||||||||||||||||
Net interest income(1) | $ | 3,657 | $ | 3,580 | $ | 3,592 | $ | 77 | 2.2 | $ | 65 | 1.8 | |||||||||||||||||
Net interest margin(1) | 3.12 | % | 3.02 | % | 2.92 | % | 10 bps | 20 bps | |||||||||||||||||||||
Average Balances(2) | |||||||||||||||||||||||||||||
| Total earning assets | $ | 466,137 | $ | 474,144 | $ | 489,001 | $ | (8,007) | (1.7) | % | $ | (22,864) | (4.7) | % | |||||||||||||||
| Total interest-bearing liabilities | 334,363 | 343,145 | 350,380 | (8,782) | (2.6) | (16,017) | (4.6) | ||||||||||||||||||||||
Yields / Rates(1) | |||||||||||||||||||||||||||||
| Total earning assets | 5.47 | % | 5.42 | % | 5.11 | % | 5 bps | 36 bps | |||||||||||||||||||||
| Total interest-bearing liabilities | 3.27 | 3.31 | 3.05 | (4) bps | 22 bps | ||||||||||||||||||||||||
(1)Amounts are on a taxable-equivalent basis utilizing the federal income tax rate of 21% for the periods presented. Interest income includes certain fees, deferred costs, and dividends.
(2)Represents daily average balances. Unrealized gains and losses on available-for-sale securities are included in nonearning assets. Active hedge basis adjustments for fair value hedges are included in nonearning assets and other liabilities. In the third quarter of 2024, Truist revised its presentation of active hedge basis adjustments for fair value hedges on securities to be included in nonearning assets for all periods presented.
Taxable-equivalent net interest income for the third quarter of 2024 was up $77 million, or 2.2%, compared to the second quarter of 2024. Net interest margin was 3.12%, up ten basis points.
•Average earning assets decreased $8.0 billion, or 1.7%, primarily due to declines in average securities of $4.6 billion, or 3.8%, and total loans of $3.0 billion, or 1.0%.
•The yield on the average total loan portfolio was 6.41%, down three basis points and the yield on the average securities portfolio was 2.97%, up 21 basis points primarily due to investment in higher yielding, shorter duration securities as part of the balance sheet repositioning completed during the second quarter of 2024.
•Average deposits decreased $3.7 billion, or 1.0%, average short-term borrowings decreased $5.2 billion, or 20%, and average long-term debt decreased $1.4 billion, or 3.8%. The declines in short-term borrowings and long-term debt were due to decreased funding needs.
•The average cost of total deposits was 2.08%, down one basis point and the average cost of short-term borrowings was 5.41%, down 17 basis points compared to the prior quarter. The average cost of long-term debt was 5.13%, up 26 basis points primarily due to additional hedge costs in the third quarter of 2024.
Taxable-equivalent net interest income for the third quarter of 2024 was up $65 million, or 1.8%, compared to the third quarter of 2023 primarily due to the balance sheet repositioning. Net interest margin was 3.12%, up 20 basis points.
•Average earning assets decreased $22.9 billion, or 4.7%, primarily due to a decrease in average securities of $19.0 billion, or 14%, and a decline in average total loans of $15.3 billion, or 4.8%, partially offset by growth in other earning assets of $10.4 billion, or 36%. The decrease in average securities and increase in average other earning assets primarily reflects the balance sheet repositioning.
•The yield on the average total loan portfolio was 6.41%, up 16 basis points and the yield on the average securities portfolio was 2.97%, up 72 basis points, reflecting the balance sheet repositioning and higher average market interest rates.
•Average deposits decreased $16.7 billion, or 4.2%, average short-term borrowings decreased $4.1 billion, or 17%, and average long-term debt decreased $8.0 billion, or 19%.
•The average cost of total deposits was 2.08%, up 24 basis points. The average cost of short-term borrowings was 5.41%, down six basis points. The average cost of long-term debt was 5.13%, up 62 basis points. The increase in rates on deposits and other funding sources was largely attributable to the higher rate environment.
- 2 -
| Noninterest Income | |||||||||||||||||||||||||||||
| Quarter Ended | Change | ||||||||||||||||||||||||||||
| (Dollars in millions) | 3Q24 | 2Q24 | 3Q23 | Link | Like | ||||||||||||||||||||||||
| Wealth management income | $ | 350 | $ | 361 | $ | 343 | $ | (11) | (3.0) | % | $ | 7 | 2.0 | % | |||||||||||||||
| Investment banking and trading income | 332 | 286 | 185 | 46 | 16.1 | 147 | 79.5 | ||||||||||||||||||||||
| Card and payment related fees | 222 | 230 | 238 | (8) | (3.5) | (16) | (6.7) | ||||||||||||||||||||||
| Service charges on deposits | 221 | 232 | 154 | (11) | (4.7) | 67 | 43.5 | ||||||||||||||||||||||
| Mortgage banking income | 106 | 112 | 102 | (6) | (5.4) | 4 | 3.9 | ||||||||||||||||||||||
| Lending related fees | 88 | 89 | 102 | (1) | (1.1) | (14) | (13.7) | ||||||||||||||||||||||
| Operating lease income | 49 | 50 | 63 | (1) | (2.0) | (14) | (22.2) | ||||||||||||||||||||||
| Securities gains (losses) | — | (6,650) | — | 6,650 | (100.0) | — | NM | ||||||||||||||||||||||
| Other income | 115 | 78 | 147 | 37 | 47.4 | (32) | (21.8) | ||||||||||||||||||||||
| Total noninterest income | $ | 1,483 | $ | (5,212) | $ | 1,334 | $ | 6,695 | (128.5) | $ | 149 | 11.2 | |||||||||||||||||
Noninterest income was up $6.7 billion compared to the second quarter of 2024 primarily due to $6.7 billion of securities losses in the prior quarter resulting from the balance sheet repositioning, higher investment banking and trading income, and higher other income. Excluding securities losses, noninterest income was up $45 million, or 3.1%, compared to the second quarter of 2024.
•Investment banking and trading income increased due to higher equity originations and merger and acquisition advisory fees.
•Other income increased due to higher equity investment income, the gain on the sale of Sterling Capital Management LLC, an asset management business, partially offset by a valuation decrease for derivatives related to Visa shares.
Noninterest income was up $149 million, or 11%, compared to the third quarter of 2023 primarily due to higher investment banking and trading income and service charges on deposits, partially offset by lower other income.
•Investment banking and trading income increased due to higher bond and equity originations and higher structured real estate income.
•Service charges on deposits increased due to a prior period reduction in deposit service charge fees due to client refund accruals resulting from a revision in deposit service fee protocols, partially offset by a decline as a result of continued growth of Truist One Banking.
•Other income decreased due to lower equity investment income due to gains in the third quarter of 2023, lower income from investments held for certain post-retirement benefits (which is primarily offset by lower personnel expense), and a valuation decrease for derivatives related to Visa shares, partially offset by the gain on the sale of Sterling Capital Management LLC.
- 3 -
Noninterest Expense | |||||||||||||||||||||||||||||
| Quarter Ended | Change | ||||||||||||||||||||||||||||
| (Dollars in millions) | 3Q24 | 2Q24 | 3Q23 | Link | Like | ||||||||||||||||||||||||
| Personnel expense | $ | 1,628 | $ | 1,661 | $ | 1,669 | $ | (33) | (2.0) | % | $ | (41) | (2.5) | % | |||||||||||||||
| Professional fees and outside processing | 336 | 308 | 289 | 28 | 9.1 | 47 | 16.3 | ||||||||||||||||||||||
| Software expense | 222 | 218 | 222 | 4 | 1.8 | — | — | ||||||||||||||||||||||
| Net occupancy expense | 157 | 160 | 164 | (3) | (1.9) | (7) | (4.3) | ||||||||||||||||||||||
| Amortization of intangibles | 84 | 89 | 98 | (5) | (5.6) | (14) | (14.3) | ||||||||||||||||||||||
| Equipment expense | 84 | 89 | 89 | (5) | (5.6) | (5) | (5.6) | ||||||||||||||||||||||
| Marketing and customer development | 75 | 63 | 70 | 12 | 19.0 | 5 | 7.1 | ||||||||||||||||||||||
| Operating lease depreciation | 34 | 34 | 43 | — | — | (9) | (20.9) | ||||||||||||||||||||||
| Regulatory costs | 51 | 85 | 77 | (34) | (40.0) | (26) | (33.8) | ||||||||||||||||||||||
| Restructuring charges | 25 | 33 | 61 | (8) | (24.2) | (36) | (59.0) | ||||||||||||||||||||||
| Other expense | 231 | 354 | 278 | (123) | (34.7) | (47) | (16.9) | ||||||||||||||||||||||
| Total noninterest expense | $ | 2,927 | $ | 3,094 | $ | 3,060 | $ | (167) | (5.4) | $ | (133) | (4.3) | |||||||||||||||||
Noninterest expense was down $167 million, or 5.4%, compared to the second quarter of 2024 due to a $150 million charitable contribution to the Truist Foundation (other expense) in the earlier quarter, lower personnel expense, lower FDIC special assessment (reduction of $16 million in the third quarter of 2024 compared to cost of $13 million in the second quarter of 2024) (regulatory costs), partially offset by higher professional fees and outside processing expense. Restructuring charges for both quarters include severance charges as well as costs associated with continued facilities optimization initiatives. Adjusted noninterest expense, which excludes the charitable contribution, the FDIC special assessment, restructuring charges, and the amortization of intangibles, increased $25 million, or 0.9%, compared to the prior quarter.
•Professional fees and outside processing expense increased due to higher investments in technology.
•Personnel expense decreased primarily due to lower medical claims.
Noninterest expense was down $133 million, or 4.3%, compared to the third quarter of 2023 due to decreases in other expense, personnel expense, restructuring charges, and the FDIC special assessment (reduction of $16 million in the third quarter of 2024) (regulatory costs), partially offset by an increase in professional services and outside processing expense. Restructuring charges decreased $36 million driven by lower severance charges. Adjusted noninterest expense, which excludes the FDIC special assessment adjustment, restructuring charges, and the amortization of intangibles, decreased $67 million, or 2.3%, compared to the earlier quarter.
•Other expense decreased due to the prior period costs associated with a revision in deposit service fee protocols, the prior period resolution of the USAA remote deposit capture patent infringement lawsuit, and lower pension amortization expense.
•Personnel expense decreased due to lower headcount across most lines of business and lower other post-retirement benefit expense (which is almost entirely offset by lower other income), partially offset by higher incentives.
•Professional fees and outside processing expense increased due to higher investments in technology.
- 4 -
| Provision for Income Taxes | |||||||||||||||||||||||||||||
| Quarter Ended | Change | ||||||||||||||||||||||||||||
| (Dollars in millions) | 3Q24 | 2Q24 | 3Q23 | Link | Like | ||||||||||||||||||||||||
| Provision (benefit) for income taxes | $ | 271 | $ | (1,324) | $ | 203 | $ | 1,595 | (120.5)% | $ | 68 | 33.5% | |||||||||||||||||
| Effective tax rate | 15.8 | % | 25.3 | % | 15.5 | % | NM | 30 bps | |||||||||||||||||||||
The third quarter of 2024 reflects a provision for income taxes while the second quarter of 2024 reflects a benefit for income taxes driven by the discrete impact of the balance sheet repositioning of securities.
The higher effective tax rate for the third quarter of 2024 compared to the third quarter of 2023 is due to higher full year forecasted effective tax rate in the current year, excluding the pre-tax loss from the balance sheet repositioning of securities.
Average Loans and Leases | |||||||||||||||||||||||
| (Dollars in millions) | 3Q24 | 2Q24 | Change | % Change | |||||||||||||||||||
| Commercial: | |||||||||||||||||||||||
| Commercial and industrial | $ | 154,102 | $ | 157,043 | $ | (2,941) | (1.9) | % | |||||||||||||||
| CRE | 21,481 | 21,969 | (488) | (2.2) | |||||||||||||||||||
| Commercial construction | 7,870 | 7,645 | 225 | 2.9 | |||||||||||||||||||
| Total commercial | 183,453 | 186,657 | (3,204) | (1.7) | |||||||||||||||||||
| Consumer: | |||||||||||||||||||||||
| Residential mortgage | 53,999 | 54,490 | (491) | (0.9) | |||||||||||||||||||
| Home equity | 9,703 | 9,805 | (102) | (1.0) | |||||||||||||||||||
| Indirect auto | 22,121 | 22,016 | 105 | 0.5 | |||||||||||||||||||
| Other consumer | 29,015 | 28,326 | 689 | 2.4 | |||||||||||||||||||
| Total consumer | 114,838 | 114,637 | 201 | 0.2 | |||||||||||||||||||
| Credit card | 4,874 | 4,905 | (31) | (0.6) | |||||||||||||||||||
| Total loans and leases held for investment | $ | 303,165 | $ | 306,199 | $ | (3,034) | (1.0) | ||||||||||||||||
Average loans held for investment decreased $3.0 billion, or 1.0%, compared to the prior quarter.
•Average commercial loans decreased 1.7% due to a decline in the commercial and industrial portfolio.
•Average consumer loans increased 0.2% due to growth in the other consumer portfolio, partially offset by a decline in the residential mortgage portfolio.
| Average Deposits | |||||||||||||||||||||||
| (Dollars in millions) | 3Q24 | 2Q24 | Change | % Change | |||||||||||||||||||
| Noninterest-bearing deposits | $ | 106,080 | $ | 107,634 | $ | (1,554) | (1.4) | % | |||||||||||||||
| Interest checking | 103,899 | 103,894 | 5 | — | |||||||||||||||||||
| Money market and savings | 136,639 | 135,264 | 1,375 | 1.0 | |||||||||||||||||||
| Time deposits | 37,726 | 41,250 | (3,524) | (8.5) | |||||||||||||||||||
| Total deposits | $ | 384,344 | $ | 388,042 | $ | (3,698) | (1.0) | ||||||||||||||||
Average deposits for the third quarter of 2024 were $384.3 billion, a decrease of $3.7 billion, or 1.0%, compared to the prior quarter.
Average noninterest-bearing deposits decreased 1.4% compared to the prior quarter and represented 27.6% of total deposits for the third quarter of 2024 compared to 27.7% for the second quarter of 2024. Average time deposits decreased 8.5%. Average money market and savings accounts increased 1.0%.
- 5 -
Capital Ratios | |||||||||||||||||||||||||||||
| 3Q24 | 2Q24 | 1Q24 | 4Q23 | 3Q23 | |||||||||||||||||||||||||
| Risk-based: | (preliminary) | ||||||||||||||||||||||||||||
| CET1 | 11.6 | % | 11.6 | % | 10.1 | % | 10.1 | % | 9.9 | % | |||||||||||||||||||
| Tier 1 | 13.2 | 13.2 | 11.7 | 11.6 | 11.4 | ||||||||||||||||||||||||
| Total | 15.3 | 15.4 | 13.9 | 13.7 | 13.5 | ||||||||||||||||||||||||
| Leverage | 10.8 | 10.5 | 9.5 | 9.3 | 9.2 | ||||||||||||||||||||||||
| Supplementary leverage | 9.1 | 8.9 | 8.0 | 7.9 | 7.8 | ||||||||||||||||||||||||
Capital ratios remained strong compared to the regulatory requirements for well capitalized banks. Truist’s CET1 ratio was 11.6% as of September 30, 2024, flat compared to June 30, 2024 as current quarter earnings were partially offset by dividends and share repurchases.
Truist declared common dividends of $0.52 per share during the third quarter of 2024 and repurchased $500 million of common stock. The dividend and total payout ratios for the third quarter of 2024 were 52% and 90%, respectively.
Truist’s average consolidated LCR was 112% for the three months ended September 30, 2024, compared to the regulatory minimum of 100%.
- 6 -
| Asset Quality | |||||||||||||||||||||||||||||
| (Dollars in millions) | 3Q24 | 2Q24 | 1Q24 | 4Q23 | 3Q23 | ||||||||||||||||||||||||
| Total nonperforming assets | $ | 1,528 | $ | 1,476 | $ | 1,476 | $ | 1,488 | $ | 1,584 | |||||||||||||||||||
| Total loans 90 days past due and still accruing | 518 | 489 | 538 | 534 | 574 | ||||||||||||||||||||||||
| Total loans 30-89 days past due and still accruing | 1,769 | 1,791 | 1,716 | 1,971 | 1,636 | ||||||||||||||||||||||||
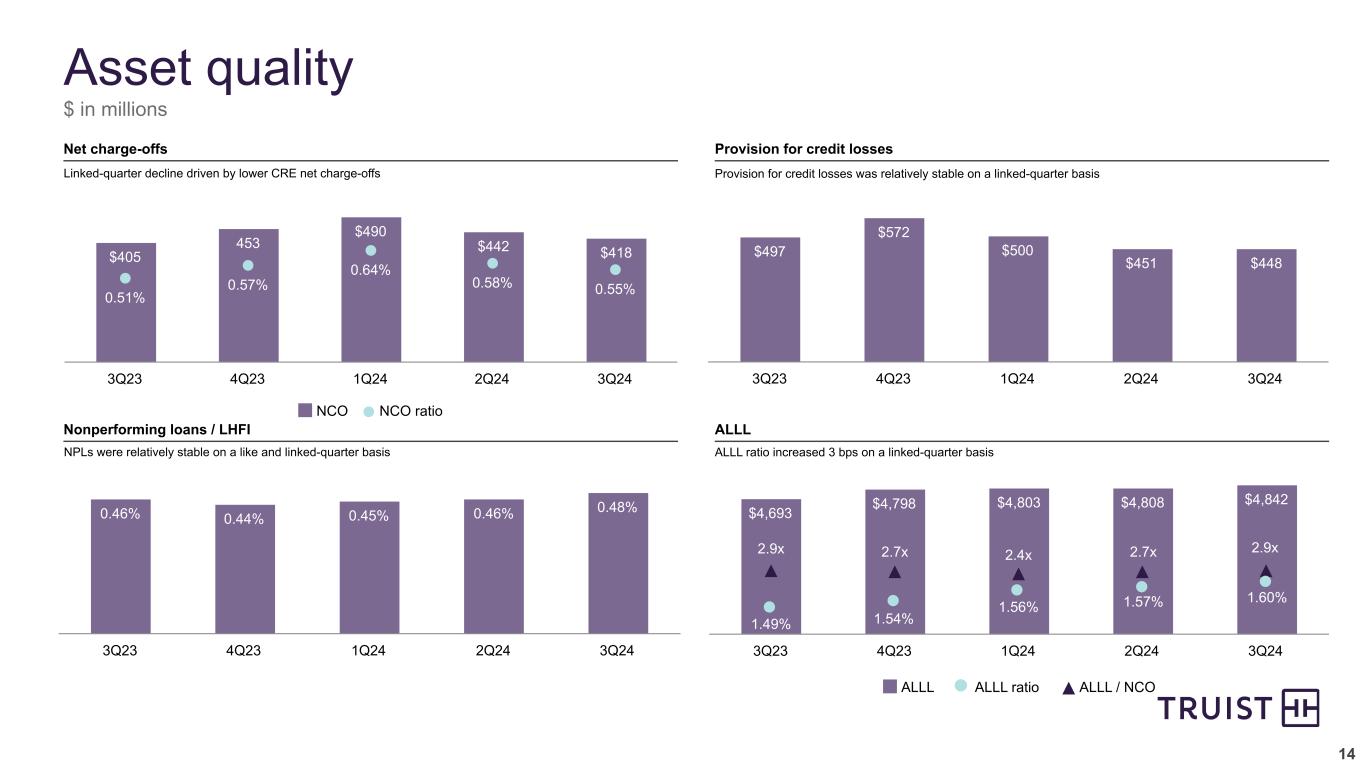
Nonperforming loans and leases as a percentage of loans and leases held for investment | 0.48 | % | 0.46 | % | 0.45 | % | 0.44 | % | 0.46 | % | |||||||||||||||||||
| Loans 30-89 days past due and still accruing as a percentage of loans and leases | 0.58 | 0.59 | 0.56 | 0.63 | 0.52 | ||||||||||||||||||||||||
| Loans 90 days or more past due and still accruing as a percentage of loans and leases | 0.17 | 0.16 | 0.18 | 0.17 | 0.18 | ||||||||||||||||||||||||
| Loans 90 days or more past due and still accruing as a percentage of loans and leases, excluding government guaranteed | 0.04 | 0.04 | 0.04 | 0.04 | 0.04 | ||||||||||||||||||||||||
Allowance for loan and lease losses as a percentage of loans and leases held for investment | 1.60 | 1.57 | 1.56 | 1.54 | 1.49 | ||||||||||||||||||||||||
Ratio of allowance for loan and lease losses to net charge-offs | 2.9x | 2.7x | 2.4x | 2.7x | 2.9x | ||||||||||||||||||||||||
Ratio of allowance for loan and lease losses to nonperforming loans and leases held for investment | 3.3x | 3.4x | 3.4x | 3.5x | 3.2x | ||||||||||||||||||||||||
Applicable ratios are annualized.
Nonperforming assets totaled $1.5 billion at September 30, 2024, up $52 million compared to June 30, 2024, due to an increase in the commercial and industrial portfolio, partially offset by a decline in the CRE portfolio. Nonperforming loans and leases held for investment were 0.48% of loans and leases held for investment at September 30, 2024, up two basis points compared to June 30, 2024.
Loans 90 days or more past due and still accruing totaled $518 million at September 30, 2024, up one basis point as a percentage of loans and leases compared with the prior quarter due primarily to an increase in the government guaranteed residential mortgage portfolio. Excluding government guaranteed loans, the ratio of loans 90 days or more past due and still accruing as a percentage of loans and leases was 0.04% at September 30, 2024, unchanged from June 30, 2024.
Loans 30-89 days past due and still accruing totaled $1.8 billion at September 30, 2024, down $22 million, or one basis point, as a percentage of loans and leases, compared to the prior quarter primarily due to a decrease in the residential mortgage portfolio, partially offset by an increase in the other consumer portfolio.
The allowance for credit losses was $5.1 billion and includes $4.8 billion for the allowance for loan and lease losses and $298 million for the reserve for unfunded commitments. The ALLL ratio was 1.60%, up three basis points compared with June 30, 2024. The ALLL covered nonperforming loans and leases held for investment 3.3X, compared to 3.4x at June 30, 2024. At September 30, 2024, the ALLL was 2.9X annualized net charge-offs, compared to 2.7X at June 30, 2024.
Provision for Credit Losses | |||||||||||||||||||||||||||||
| Quarter Ended | Change | ||||||||||||||||||||||||||||
| (Dollars in millions) | 3Q24 | 2Q24 | 3Q23 | Link | Like | ||||||||||||||||||||||||
| Provision for credit losses | $ | 448 | $ | 451 | $ | 497 | $ | (3) | (0.7) | % | $ | (49) | (9.9) | % | |||||||||||||||
| Net charge-offs | 418 | 442 | 405 | (24) | (5.4) | 13 | 3.2 | ||||||||||||||||||||||
Net charge-offs as a percentage of average loans and leases | 0.55 | % | 0.58 | % | 0.51 | % | (3) bps | 4 bps | |||||||||||||||||||||
Applicable ratios are annualized.
The provision for credit losses was $448 million compared to $451 million for the second quarter of 2024.
•The decrease in the current quarter provision expense primarily reflects a lower allowance build, partially offset by additional reserves related to Hurricane Helene.
•The net charge-off ratio for the current quarter was down compared to the second quarter of 2024 primarily driven by lower net charge-offs in the CRE portfolio.
The provision for credit losses was $448 million compared to $497 million for the third quarter of 2023.
•The decrease in the current quarter provision expense primarily reflects a lower allowance build, partially offset by additional reserves related to Hurricane Helene.
•The net charge-off ratio was up compared to the third quarter of 2023 primarily driven by higher net charge-offs in the other consumer and credit card portfolios, partially offset by lower net charge-offs in the CRE portfolio.
- 7 -
Earnings Presentation and Quarterly Performance Summary | ||
Investors can access the live third quarter 2024 earnings call at 8 a.m. ET today by webcast or dial-in as follows:
Webcast: app.webinar.net/qVga5Y8KdRw
Dial-in: 1-877-883-0383, passcode 1322262
Additional details: The news release and presentation materials will be available at ir.truist.com under “Events & Presentations.” A replay of the call will be available on the website for 30 days.
The presentation, including an appendix reconciling non-GAAP disclosures, and Truist’s Third Quarter 2024 Quarterly Performance Summary, which contains detailed financial schedules, are available at https://ir.truist.com/earnings.
About Truist | ||
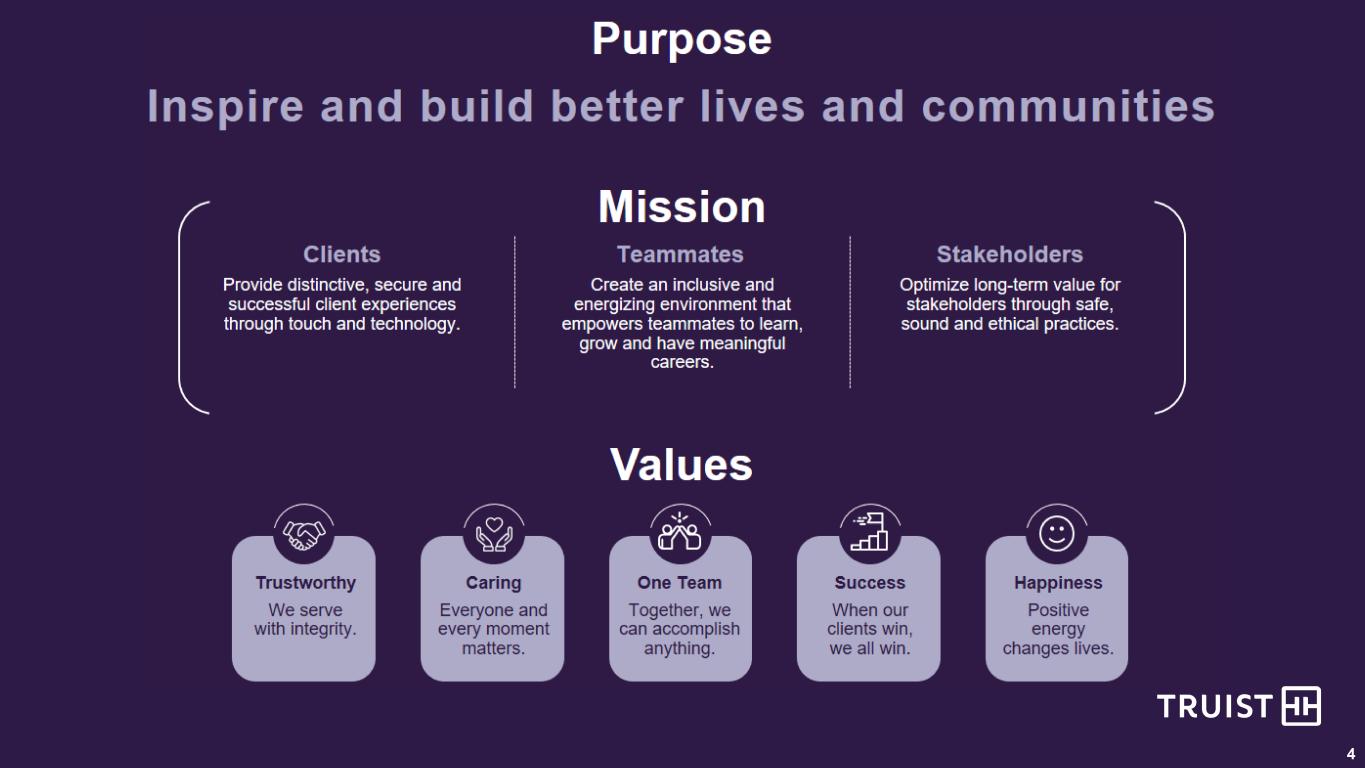
Truist Financial Corporation is a purpose-driven financial services company committed to inspiring and building better lives and communities. As a leading U.S. commercial bank, Truist has leading market share in many of the high-growth markets across the country. Truist offers a wide range of products and services through our wholesale and consumer businesses, including consumer and small business banking, commercial banking, corporate and investment banking, wealth management, payments, and specialized lending businesses. Headquartered in Charlotte, North Carolina, Truist is a top-10 commercial bank with total assets of $523 billion as of September 30, 2024. Truist Bank, Member FDIC. Learn more at Truist.com.
#-#-#
| Glossary of Defined Terms | |||||
| Term | Definition | ||||
ALLL | Allowance for loan and lease losses | ||||
| BVPS | Book value (common equity) per share | ||||
| CEO | Chief Executive Officer | ||||
CET1 | Common equity tier 1 | ||||
| CRE | Commercial real estate | ||||
| FDIC | Federal Deposit Insurance Corporation | ||||
| GAAP | Accounting principles generally accepted in the United States of America | ||||
| HFI | Held for investment | ||||
| LCR | Liquidity Coverage Ratio | ||||
| Like | Compared to third quarter of 2023 | ||||
| Link | Compared to second quarter of 2024 | ||||
NCO | Net charge-offs | ||||
| NIM | Net interest margin, computed on a TE basis | ||||
| NM | Not meaningful | ||||
| PPNR | Pre-provision net revenue | ||||
| ROCE | Return on average common equity | ||||
ROTCE | Return on average tangible common equity | ||||
TBVPS | Tangible book value per common share | ||||
| TE | Taxable-equivalent | ||||
| TIH | Truist Insurance Holdings | ||||
- 8 -
| Non-GAAP Financial Information | ||
This news release contains financial information and performance measures determined by methods other than in accordance with GAAP. Truist’s management uses these “non-GAAP” measures in their analysis of Truist’s performance and the efficiency of its operations. Management believes these non-GAAP measures provide a greater understanding of ongoing operations, enhance comparability of results with prior periods and demonstrate the effects of significant items in the current period. The Corporation believes a meaningful analysis of its financial performance requires an understanding of the factors underlying that performance. These disclosures should not be viewed as a substitute for financial measures determined in accordance with GAAP, nor are they necessarily comparable to non-GAAP performance measures that may be presented by other companies. Below is a listing of the types of non-GAAP measures used in this news release:
•Adjusted net income available to common shareholders and adjusted diluted EPS - Adjusted net income available to common shareholders and adjusted diluted earnings per share are non-GAAP in that these measures exclude selected items, net of tax. Truist’s management uses these measures in their analysis of the Corporation’s performance. Truist’s management believes these measures provide a greater understanding of ongoing operations and enhance comparability of results with prior periods, as well as demonstrate the effects of significant gains and charges.
•Adjusted efficiency ratio, adjusted fee income ratio, and related measures - The adjusted efficiency ratio is non-GAAP in that it excludes securities gains and losses, amortization of intangible assets, restructuring charges, and other selected items. Adjusted revenue and adjusted noninterest expense are related measures used to calculate the adjusted efficiency ratio. Additionally, the adjusted fee income ratio is non-GAAP in that it excludes securities gains and losses and other selected items, and is calculated using adjusted revenue and adjusted noninterest income. Adjusted revenue and adjusted noninterest income exclude securities gains and losses and other selected items. Adjusted noninterest expense excludes amortization of intangible assets, restructuring charges, and other selected items. Truist’s management calculated these measures based on the Company’s continuing operations. Truist’s management uses these measures in their analysis of the Corporation’s performance. Truist’s management believes these measures provide a greater understanding of ongoing operations and enhance comparability of results with prior periods, as well as demonstrate the effects of significant gains and charges.
•PPNR - Pre-provision net revenue is a non-GAAP measure that adjusts net income determined in accordance with GAAP to exclude the impact of the provision for credit losses and provision for income taxes. Adjusted pre-provision net revenue is a non-GAAP measure that additionally excludes securities gains (losses), restructuring charges, amortization of intangible assets, and other selected items. Truist’s management calculated these measures based on the Company’s continuing operations. Truist’s management believes these measures provide a greater understanding of ongoing operations and enhance comparability of results with prior periods.
•Tangible Common Equity and Related Measures - Tangible common equity and related measures are non-GAAP measures that exclude the impact of intangible assets, net of deferred taxes, and their related amortization and impairment charges. These measures are useful for evaluating the performance of a business consistently, whether acquired or developed internally. Truist’s management uses these measures to assess profitability, returns relative to balance sheet risk, and shareholder value.
A reconciliation of each of these non-GAAP measures to the most directly comparable GAAP measure is included in the appendix to Truist’s Third Quarter 2024 Earnings Presentation, which is available at https://ir.truist.com/earnings.
- 9 -
| Forward Looking Statements | ||
From time to time we have made, and in the future will make, forward-looking statements within the meaning of the Private Securities Litigation Reform Act of 1995. These statements can be identified by the fact that they do not relate strictly to historical or current facts. Forward-looking statements often use words such as “believe,” “expect,” “anticipate,” “intend,” “pursue,” “seek,” “continue,” “estimate,” “project,” “outlook,” “forecast,” “potential,” “target,” “objective,” “trend,” “plan,” “goal,” “initiative,” “priorities,” or other words of comparable meaning or future-tense or conditional verbs such as “may,” “will,” “should,” “would,” or “could.” Forward-looking statements convey our expectations, intentions, or forecasts about future events, circumstances, or results.
This news release, including any information incorporated by reference herein, contains forward-looking statements. We also may make forward-looking statements in other documents that are filed or furnished with the SEC. In addition, we may make forward-looking statements orally or in writing to investors, analysts, members of the media, and others. All forward- looking statements, by their nature, are subject to assumptions, risks, and uncertainties, which may change over time and many of which are beyond our control. You should not rely on any forward-looking statement as a prediction or guarantee about the future. Actual future objectives, strategies, plans, prospects, performance, conditions, and results may differ materially from those set forth in any forward-looking statement. While no list of assumptions, risks, and uncertainties could be complete, some of the factors that may cause actual results or other future events or circumstances to differ from those in forward-looking statements include:
•evolving political, business, economic, and market conditions at local, regional, national, and international levels;
•monetary, fiscal, and trade laws or policies, including as a result of actions by governmental agencies, central banks, or supranational authorities;
•the legal, regulatory, and supervisory environment, including changes in financial-services legislation, regulation, policies, or government officials or other personnel;
•our ability to address heightened scrutiny and expectations from supervisory or other governmental authorities and to timely and credibly remediate related concerns or deficiencies;
•judicial, regulatory, and administrative inquiries, examinations, investigations, proceedings, disputes, or rulings that create uncertainty for or are adverse to us or the financial-services industry;
•the outcomes of judicial, regulatory, and administrative inquiries, examinations, investigations, proceedings, or disputes to which we are or may be subject (either directly or indirectly through our ownership interests in joint ventures or other legal entities) and our ability to absorb and address any damages or other remedies that are sought or awarded and any collateral consequences;
•evolving accounting standards and policies;
•the adequacy of our corporate governance, risk-management framework, compliance programs, and internal controls over financial reporting, including our ability to control lapses or deficiencies in financial reporting, to make appropriate estimates, or to effectively mitigate or manage operational risk;
•any instability or breakdown in the financial system, including as a result of the actual or perceived soundness of another financial institution or another participant in the financial system;
•disruptions and shifts in investor sentiment or behavior in the securities, capital, or other financial markets, including financial or systemic shocks and volatility or changes in market liquidity, interest or currency rates, or valuations;
•our ability to cost-effectively fund our businesses and operations, including by accessing long- and short-term funding and liquidity and by retaining and growing client deposits;
•changes in any of our credit ratings;
•our ability to manage any unexpected outflows of uninsured deposits and avoid selling investment securities or other assets at an unfavorable time or at a loss;
•negative market perceptions of our investment portfolio or its value;
•adverse publicity or other reputational harm to us, our service providers, or our senior officers;
•business and consumer sentiment, preferences, or behavior, including spending, borrowing, or saving by businesses or households;
•our ability to execute on strategic and operational plans, including accelerating growth, improving profitability, and returning capital to shareholders;
•changes in our corporate and business strategies, the composition of our assets, or the way in which we fund those assets;
•our ability to successfully make and integrate acquisitions and to effect divestitures, including the ability to perform our obligations under the transition services arrangements supporting TIH in a cost-effective and efficient manner;
•our ability to develop, maintain, and market our products or services or to absorb unanticipated costs or liabilities associated with those products or services;
•our ability to innovate, to anticipate the needs of current or future clients, to successfully compete, to increase or hold market share in changing competitive environments, or to deal with pricing or other competitive pressures;
•our ability to maintain secure and functional financial, accounting, technology, data processing, or other operating systems or infrastructure, including those that safeguard personal and other sensitive information;
•our ability to appropriately underwrite loans that we originate or purchase and to otherwise manage credit risk;
•our ability to satisfactorily and profitably perform loan servicing and similar obligations;
•the credit, liquidity, or other financial condition of our clients, counterparties, service providers, or competitors;
•our ability to effectively deal with economic, business, or market slowdowns or disruptions;
•the efficacy of our methods or models in assessing business strategies or opportunities or in valuing, measuring, estimating, monitoring, or managing positions or risk;
•our ability to keep pace with changes in technology that affect us or our clients, counterparties, service providers, or competitors or to maintain rights or interests in associated intellectual property;
•our ability to attract, hire, and retain key teammates and to engage in adequate succession planning;
•the performance and availability of third-party service providers on whom we rely in delivering products and services to our clients and otherwise in conducting our business and operations;
•our ability to detect, prevent, mitigate, and otherwise manage the risk of fraud or misconduct by internal or external parties; our ability to manage and mitigate physical-security and cybersecurity risks, including denial-of-service attacks, hacking, phishing, social-engineering attacks, malware intrusion, data-corruption attempts, system breaches, identity theft, ransomware attacks, environmental conditions, and intentional acts of destruction;
•natural or other disasters, calamities, and conflicts, including terrorist events, cyber-warfare, and pandemics;
•widespread outages of operational, communication, and other systems;
•our ability to maintain appropriate corporate responsibility practices, oversight, and disclosures;
•policies and other actions of governments to manage and mitigate climate and related environmental risks, and the effects of climate change or the transition to a lower-carbon economy on our business, operations, and reputation; and
•other assumptions, risks, or uncertainties described in the Risk Factors (Item 1A), Management’s Discussion and Analysis of Financial Condition and Results of Operations (Item 7), or the Notes to the Consolidated Financial Statements (Item 8) in our Annual Report on Form 10-K or described in any of the Company’s subsequent quarterly or current reports.
Any forward-looking statement made by us or on our behalf speaks only as of the date that it was made. We do not undertake to update any forward-looking statement to reflect the impact of events, circumstances, or results that arise after the date that the statement was made, except as required by applicable securities laws. You, however, should consult further disclosures (including disclosures of a forward-looking nature) that we may make in any subsequent Annual Report on Form 10-K, Quarterly Report on Form 10-Q, or Current Report on Form 8-K.
- 10 -