tfc-20200420
0000092230FALSE00000922302020-04-202020-04-200000092230us-gaap:CommonStockMember2020-04-202020-04-200000092230us-gaap:SeriesFPreferredStockMember2020-04-202020-04-200000092230us-gaap:SeriesGPreferredStockMember2020-04-202020-04-200000092230us-gaap:SeriesHPreferredStockMember2020-04-202020-04-200000092230tfc:SeriesIPreferredStockMember2020-04-202020-04-200000092230tfc:SeriesJPreferredStockMember2020-04-202020-04-20
UNITED STATES
SECURITIES AND EXCHANGE COMMISSION
Washington, D.C. 20549
_____________________________________________
Form 8-K
Current Report
_____________________________________________
Pursuant to Section 13 or 15(d)
of the Securities Exchange Act of 1934
 
April 20, 2020
Date of Report (Date of earliest event reported)
Truist Financial Corporation
(Exact name of registrant as specified in its charter)
_____________________________
North Carolina1-1085356-0939887
(State or other jurisdiction of incorporation)
(Commission File Number)
(I.R.S. Employer Identification No.)
  
214 North Tryon Street
Charlotte,
North Carolina
28202
(Address of principal executive offices)
(Zip Code)

(336) 733-2000
(Registrant's telephone number, including area code)
_____________________________________________

Check the appropriate box below if the Form 8-K filing is intended to simultaneously satisfy the filing obligation of the registrant under any of the following provisions:
Written communications pursuant to Rule 425 under the Securities Act (17 CFR 230.425)
Soliciting material pursuant to Rule 14a-12 under the Exchange Act (17 CFR 240.14a-12)
Pre-commencement communications pursuant to Rule 14d-2(b) under the Exchange Act (17 CFR 240.14d-2(b))
Pre-commencement communications pursuant to Rule 13e-4(c) under the Exchange Act (17 CFR 240.13e-4(c))
Securities registered pursuant to Section 12(b) of the Act:
Title of each classTrading SymbolName of each exchange on which registered
Common Stock, $5 par valueTFCNew York Stock Exchange
Depositary Shares each representing 1/1,000th interest in a share of Series F Non-Cumulative Perpetual Preferred StockTFC.PFNew York Stock Exchange
Depositary Shares each representing 1/1,000th interest in a share of Series G Non-Cumulative Perpetual Preferred StockTFC.PGNew York Stock Exchange
Depositary Shares each representing 1/1,000th interest in a share of Series H Non-Cumulative Perpetual Preferred StockTFC.PHNew York Stock Exchange
Depositary Shares each representing 1/4,000th interest in a share of Series I Perpetual Preferred StockTFC.PINew York Stock Exchange
5.853% Fixed-to-Floating Rate Normal Preferred Purchase Securities each representing 1/100th interest in a share of Series J Perpetual Preferred StockTFC.PJNew York Stock Exchange
Indicate by check mark whether the registrant is an emerging growth company as defined in Rule 405 of the Securities Act of 1933 (§230.405 of this chapter) or Rule 12b-2 of the Securities Exchange Act of 1934 (§240.12b-2 of this chapter). 
Emerging growth company 

If an emerging growth company, indicate by check mark if the registrant has elected not to use the extended transition period for complying with any new or revised financial accounting standards provided pursuant to Section 13(a) of the Exchange Act. ¨


ITEM 2.02 Results of Operations and Financial Condition

On April 20, 2020, Truist Financial Corporation ("Truist") issued a press release reporting first quarter 2020 results and posted on its website its first quarter 2020 Earnings Release, Quarterly Performance Summary and Earnings Release Presentation. The materials contain forward-looking statements regarding Truist and includes a cautionary note identifying important factors that could cause actual results to differ materially from those anticipated. The Earnings Release, Quarterly Performance Summary and Earnings Release Presentation are furnished as Exhibits 99.1, 99.2 and 99.3, respectively. Consequently, they are not deemed “filed” for purposes of Section 18 of the Securities Exchange Act of 1934 or otherwise subject to the liabilities of that section. Such materials may only be incorporated by reference into another filing under the Exchange Act or Securities Act of 1933 if such subsequent filing specifically references this Form 8-K. All information in the earnings release, quarterly performance summary and presentation materials speak as of the date thereof, and Truist does not assume any obligation to update such information in the future.

ITEM 9.01 Financial Statements and Exhibits
(d) Exhibits
Exhibit No.Description of Exhibit
Earnings Release issued April 20, 2020  
Quarterly Performance Summary issued April 20, 2020  
Earnings Release Presentation issued April 20, 2020  
104  The cover page from this Current Report on Form 8-K, formatted in Inline XBRL  


SIGNATURE
 
Pursuant to the requirements of the Securities Exchange Act of 1934, the registrant has duly caused this report to be signed on its behalf by the undersigned hereunto duly authorized.
 
TRUIST FINANCIAL CORPORATION
(Registrant)
By:/s/ Cynthia B. Powell
Cynthia B. Powell
Executive Vice President and Corporate Controller
(Principal Accounting Officer)
 
Date: April 20, 2020


logo-boxed1.jpg
News Release
Contact:
Investors:Ryan Richards
980.465.5000 | [email protected]
Aaron Reeves
336.733.2874 | [email protected]
Media:Kyle Tarrance
469.396.3555 | [email protected]
Truist Reports First Quarter 2020 Results
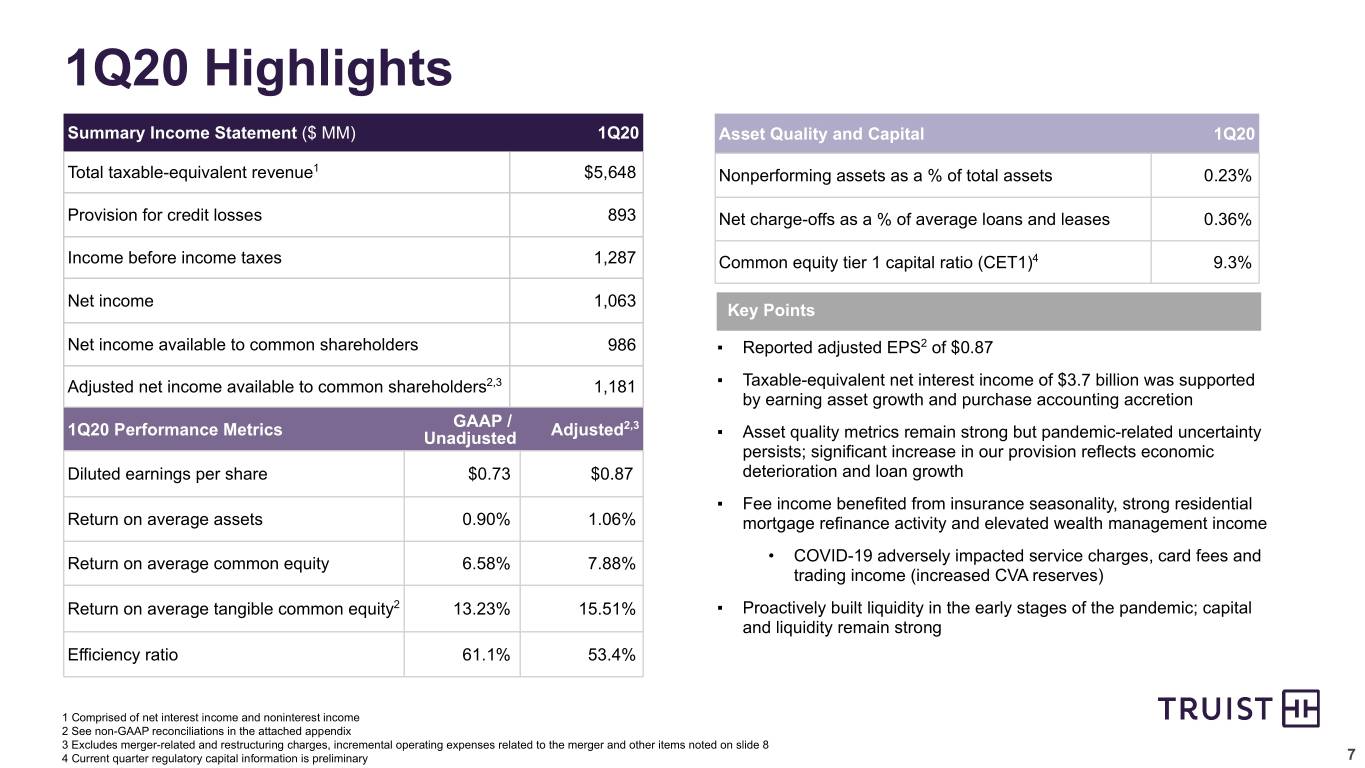
Earnings of $986 million, or $0.73 per diluted share
CHARLOTTE, N.C., (APRIL 20, 2020) — Truist Financial Corporation (NYSE: TFC) today reported earnings for the first quarter of 2020.

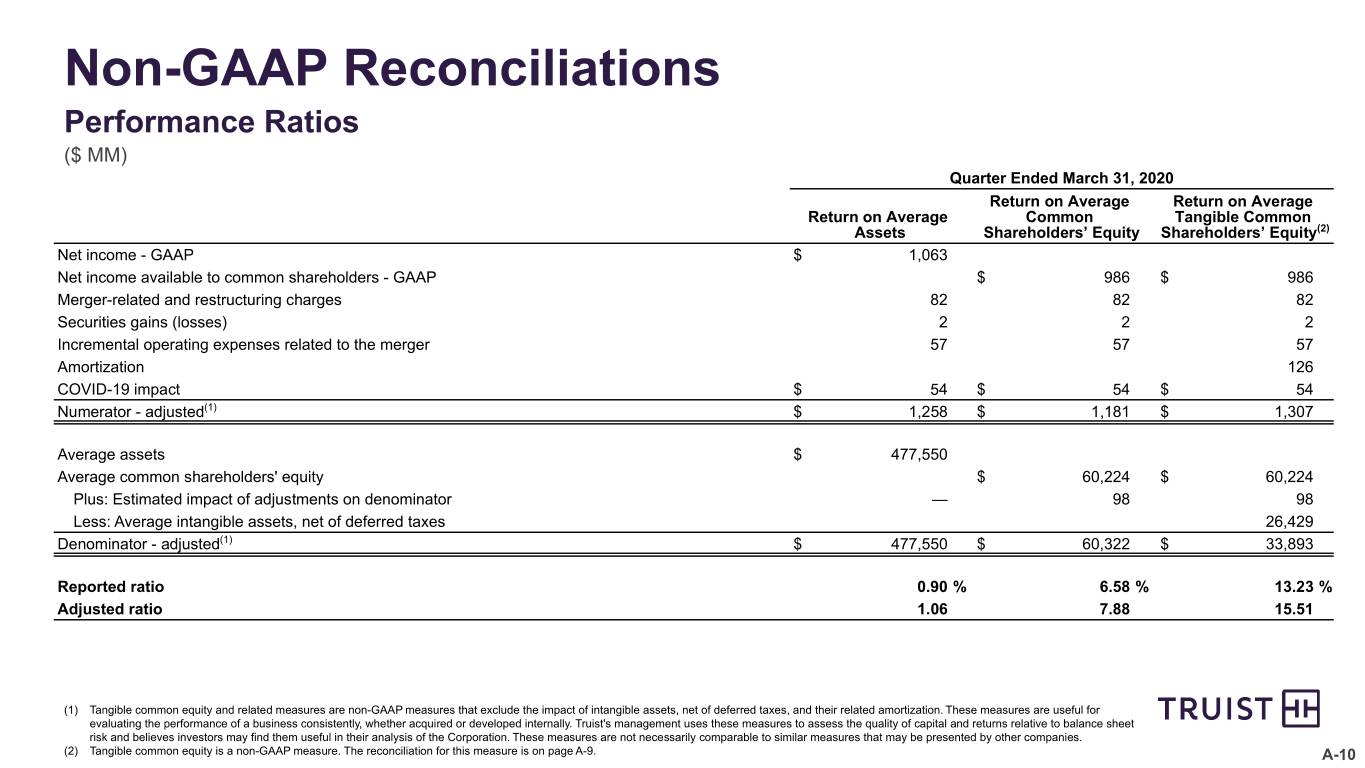
Net income available to common shareholders was $986 million, up 31.6 percent, compared with the first quarter last year. Earnings per diluted common share were $0.73 for the first quarter of 2020, a decrease of 24.7 percent compared with the same period last year. Results for the first quarter produced an annualized return on average assets (ROA) of 0.90 percent, an annualized return on average common shareholders' equity (ROCE) of 6.58 percent, and an annualized return on tangible common shareholders' equity (ROTCE) of 13.23 percent.

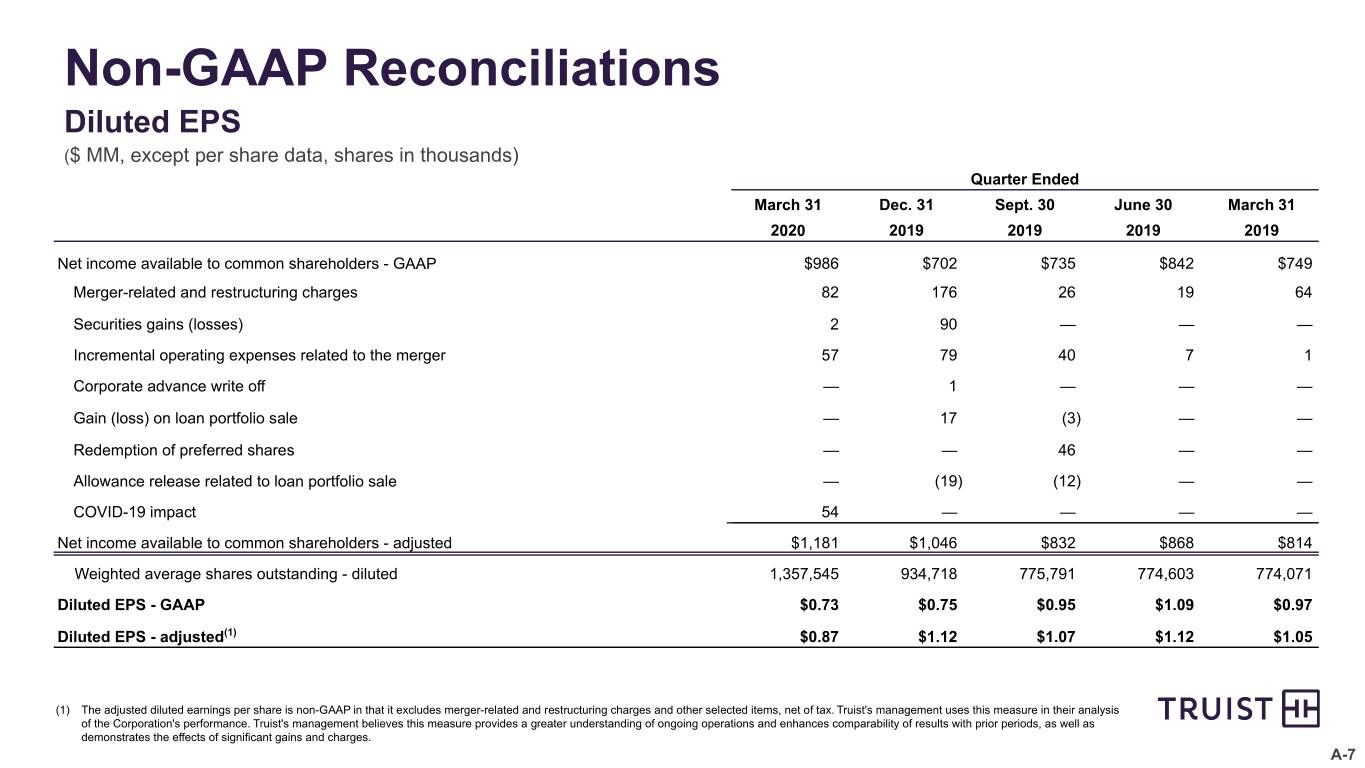
Adjusted net income available to common shareholders was $1.2 billion, or $0.87 per diluted share, excluding merger-related and restructuring charges of $107 million ($82 million after-tax), incremental operating expenses related to the merger of $74 million ($57 million after-tax), and impacts associated with certain discretionary actions undertaken by management related to COVID-19 of $71 million ($54 million after-tax). Adjusted diluted earnings per common share decreased $0.18 compared to the first quarter of 2019. Adjusted results produced an annualized ROA of 1.06 percent, an annualized ROCE of 7.88 percent and an annualized ROTCE of 15.51 percent.

"The COVID-19 pandemic has altered life as we know it, and our hearts go out to everyone affected by this global health crisis," said Chairman and Chief Executive Officer Kelly S. King. "The combination of our two heritage companies positions Truist well to support our clients, communities and teammates in this challenging environment. As a well-capitalized institution with a strong liquidity position, we have seen significant growth in loans as our commercial clients drew down their lines of credit and have also seen a flight to quality as many of our clients move funds out of the financial markets and into deposit accounts.

"Truist earned $986 million in the first quarter, affected significantly by merger-related costs and certain discretionary costs and fee rebates that were necessary to support our teammates, clients and communities during the pandemic. Excluding these costs and fee rebates, Truist earned $1.2 billion, or $0.87 per share for the quarter. While asset quality remained strong at quarter-end, we know credit costs will increase and we provided $893 million in reserves to address expected future losses.

- 1 -


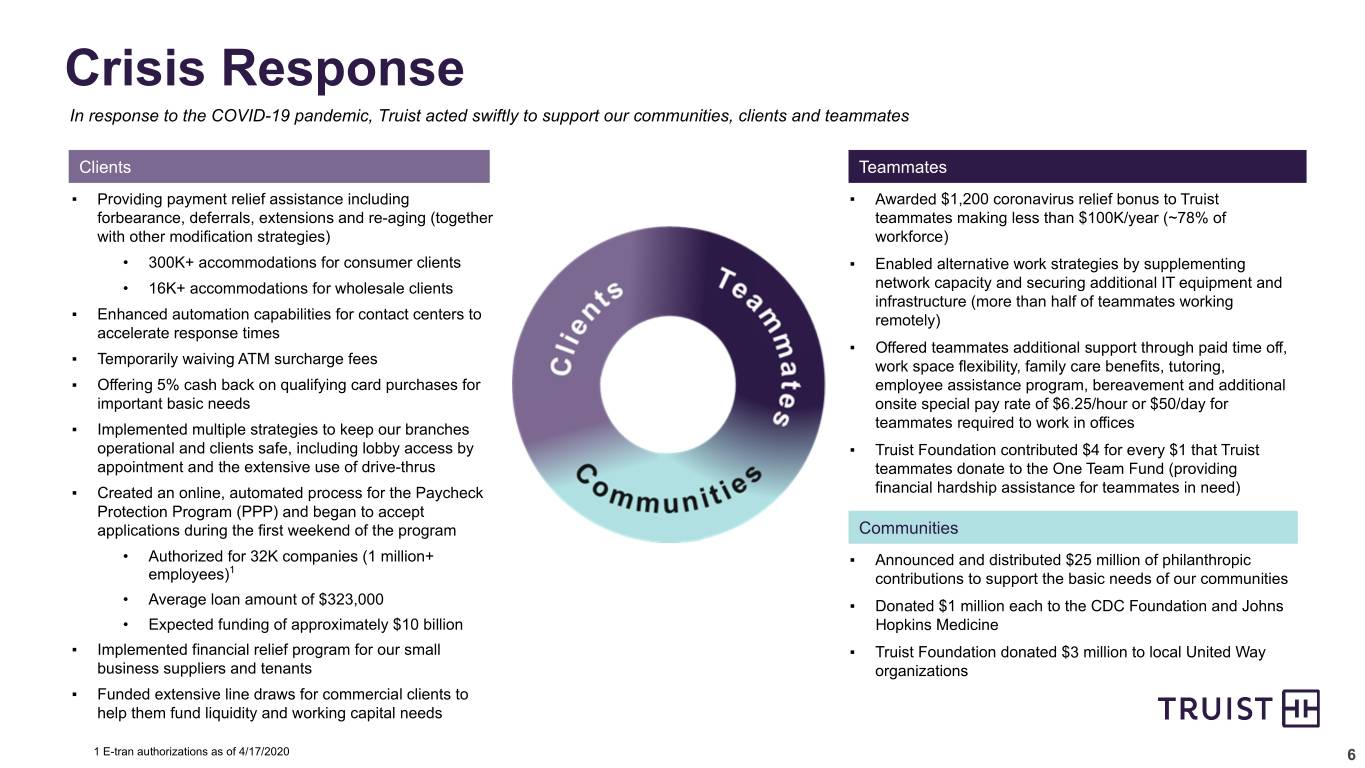
“Truist's purpose is to inspire and build better lives and communities. In this challenging time, we are fortunate to have the ability to fulfill that purpose and support our Truist family and stakeholders, help stabilize the economy and look forward to a recovery in the future. For clients, we’re helping in a number of ways including payment relief for credit card, personal loan, auto loan, home equity line of credit and residential mortgage products. In the past several weeks, we’ve also launched several digital tools to make it easier for our clients to request help.

"I am extremely proud of our teammates, many of whom are working around the clock to deliver solutions to help our clients and communities during this time of need. Our support for teammates includes additional paid time off, flexibility and family care benefits. Additionally, teammates making under $100,000 annually received a one-time pre-tax bonus of $1,200 in March to recognize their ongoing commitment to our clients and help alleviate some of the financial pressures caused by the pandemic. To meet the immediate and long-term needs of our communities, we've launched the Truist Cares initiative, a pledge of $25 million in philanthropic support that is providing aid for basic needs, medical supplies, and financial hardship across the nation. The remaining charitable funds will be given as grants to Truist’s community partners to support and expand technology initiatives and programs for youth, seniors, small businesses and people to rebuild, restore and create thriving communities,” said King.

First Quarter 2020 Performance Highlights
Earnings per diluted common share were $0.73
Adjusted diluted earnings per share were $0.87
ROA was 0.90 percent; adjusted ROA was 1.06 percent
ROCE was 6.58 percent; adjusted ROCE was 7.88 percent
ROTCE was 13.23 percent; adjusted ROTCE was 15.51 percent

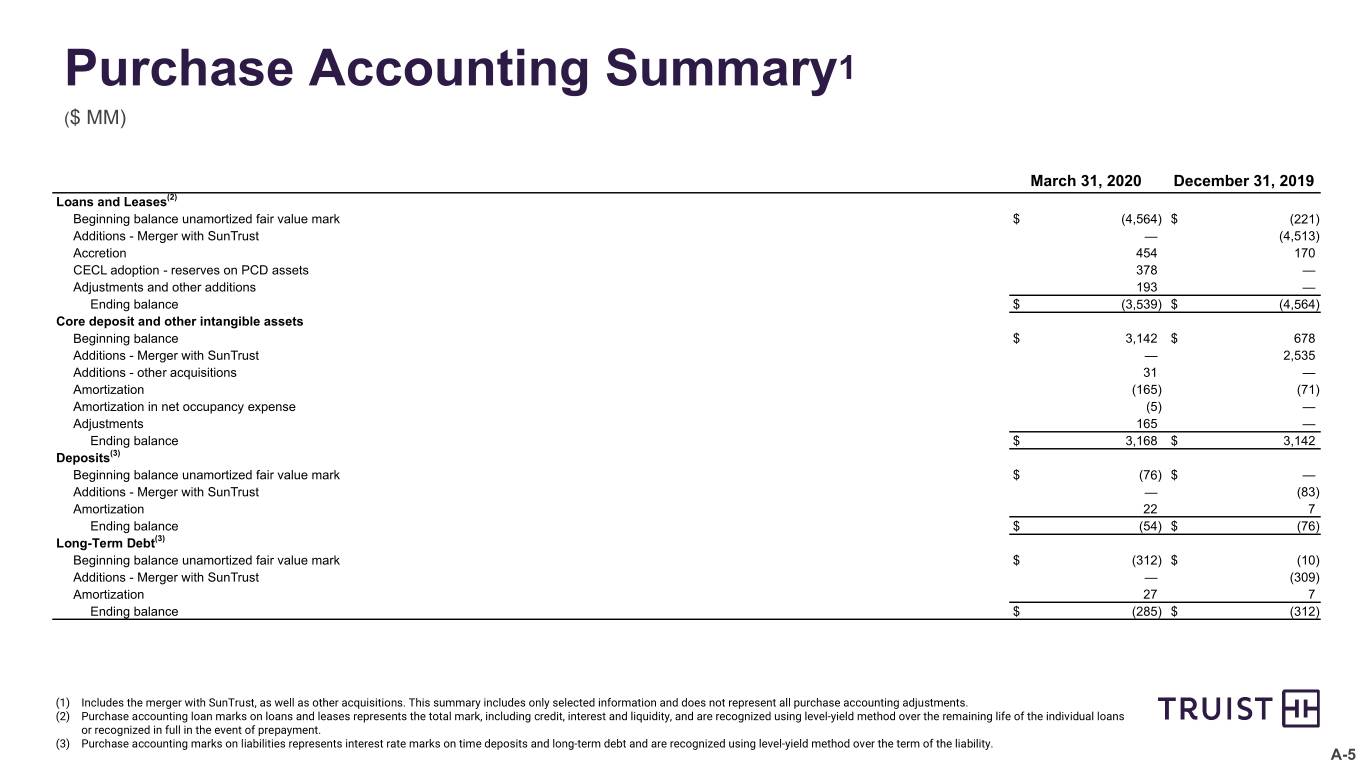
Purchase accounting valuations for loans and intangibles were updated
$193 million reduction in the fair value mark for loans
$165 million increase in CDI and other intangibles
$258 million reduction in goodwill
Valuations remain subject to finalization

Taxable-equivalent revenue was $5.6 billion for the first quarter of 2020
Fee income ratio was 34.9 percent, compared to 38.6 percent for fourth quarter 2019
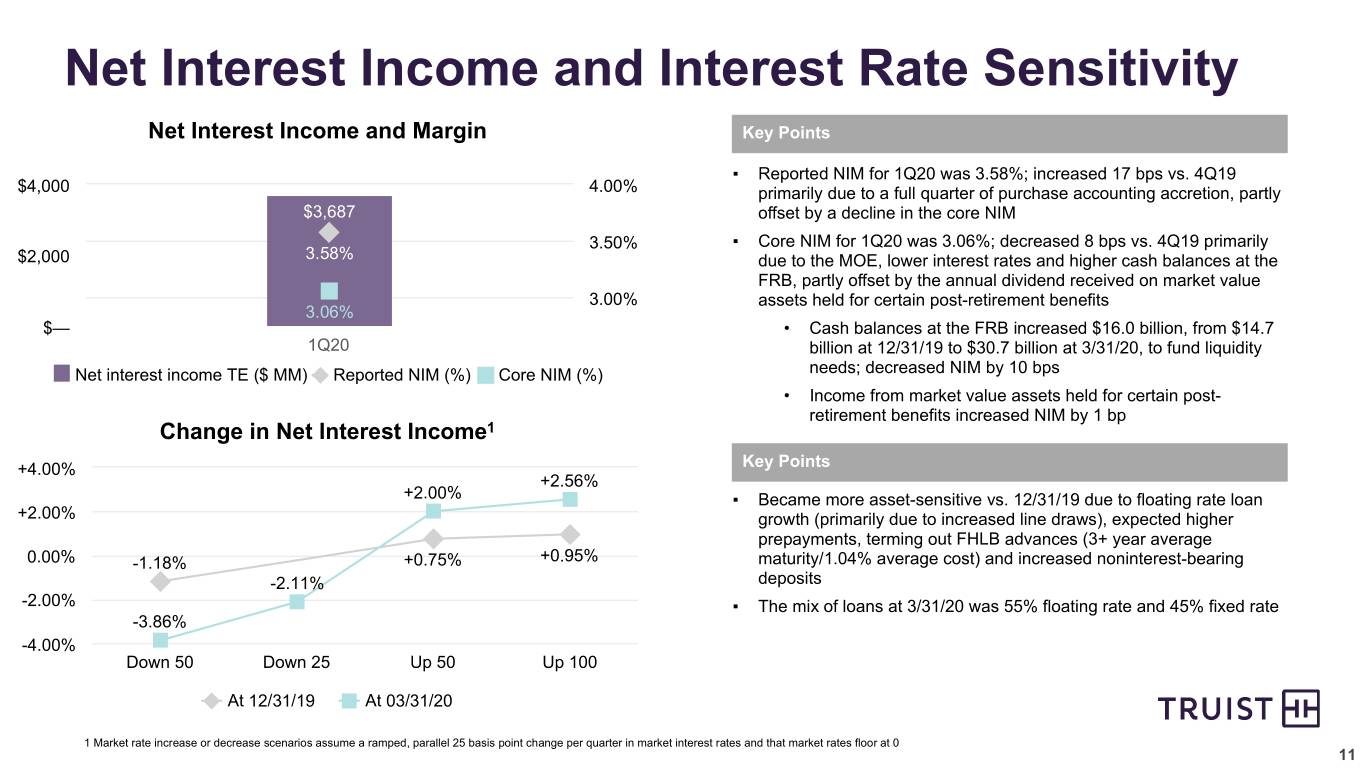
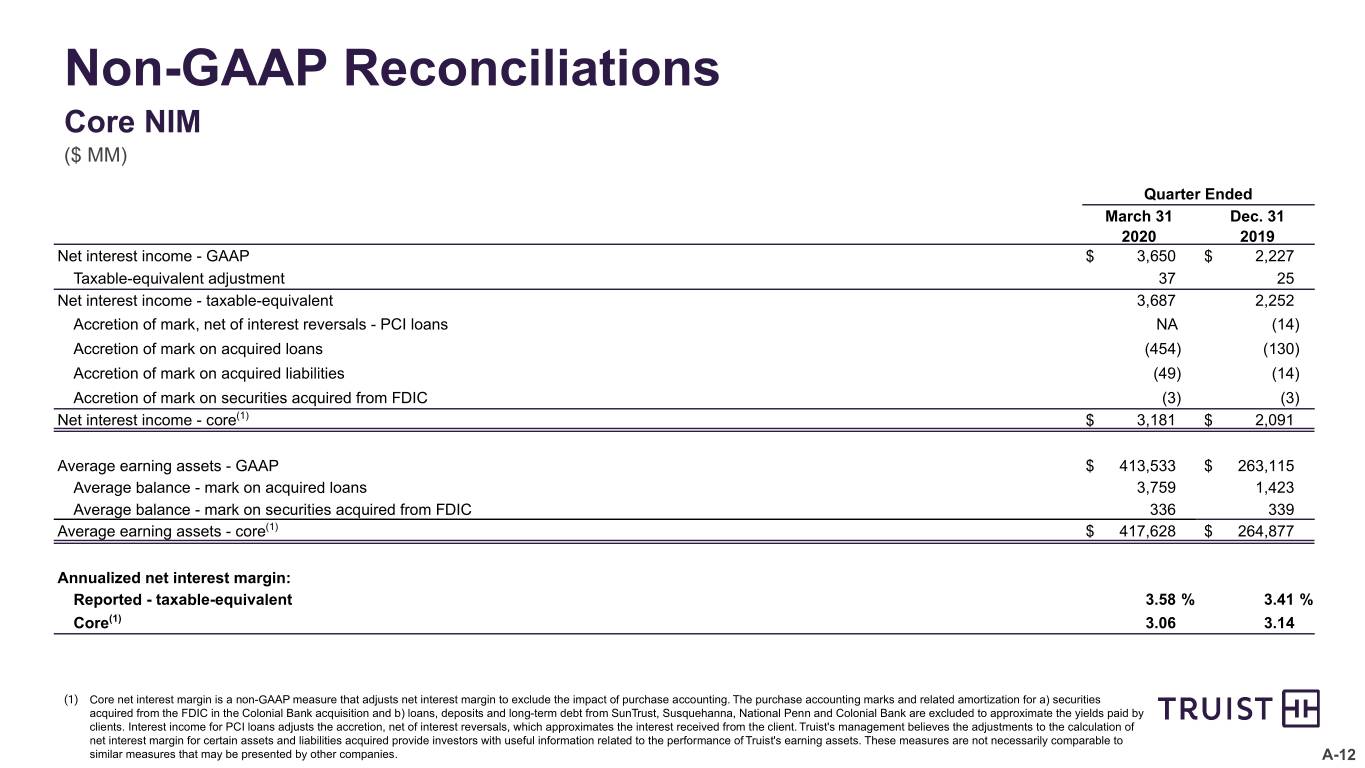
Net interest margin was 3.58 percent, up 17 basis points from the fourth quarter 2019
Core net interest margin was 3.06 percent, down eight basis points from the fourth quarter 2019

Noninterest expense was $3.4 billion for the first quarter of 2020
Noninterest expense includes $107 million of merger-related and restructuring charges, $74 million of incremental operating expenses related to the merger, and $65 million of discretionary management expenses related to COVID-19
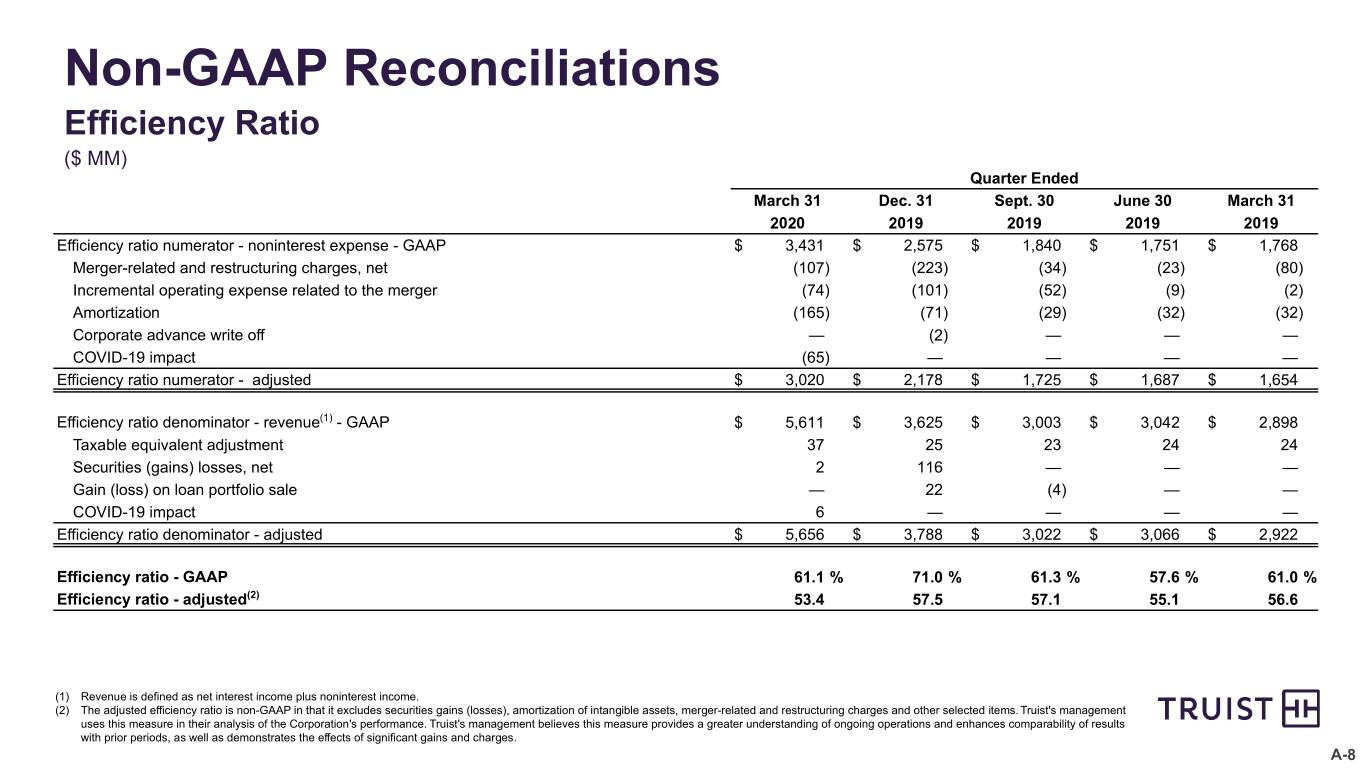
GAAP efficiency ratio was 61.1 percent, compared to 71.0 percent for fourth quarter 2019
Adjusted efficiency ratio was 53.4 percent, compared to 57.5 percent for fourth quarter 2019

- 2 -


Asset quality remains strong; significant economic uncertainty related to COVID-19
Nonperforming assets were 0.23 percent of total assets
Loans 90 days or more past due and still accruing were 0.55 percent of loans held for investment, down from 0.66 percent for the prior quarter
Excluding government guaranteed loans, loans 90 days or more past due and still accruing were 0.04 percent of loans held for investment
Net charge-offs were 0.36 percent of average loans and leases, down four basis points compared to the prior quarter
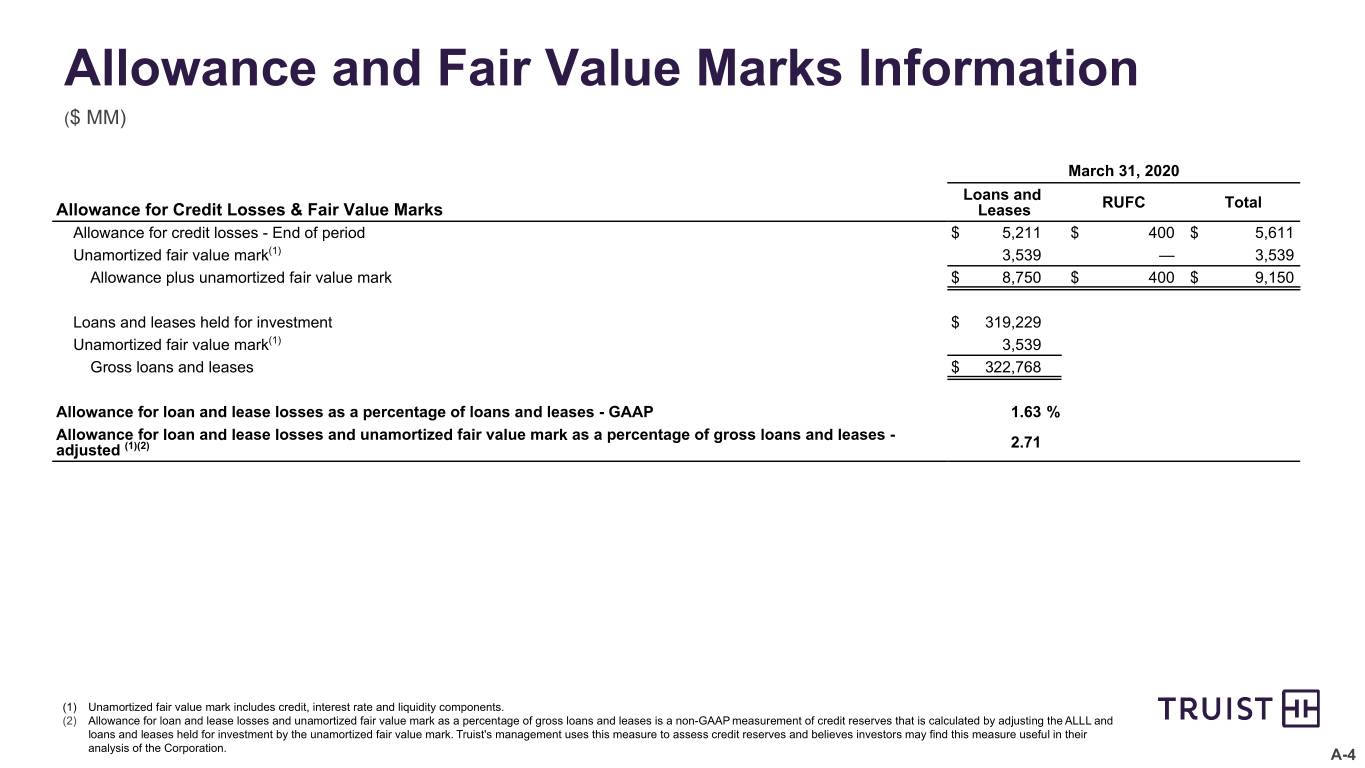
The allowance for loan and lease losses was 1.63 percent of loans and leases held for investment
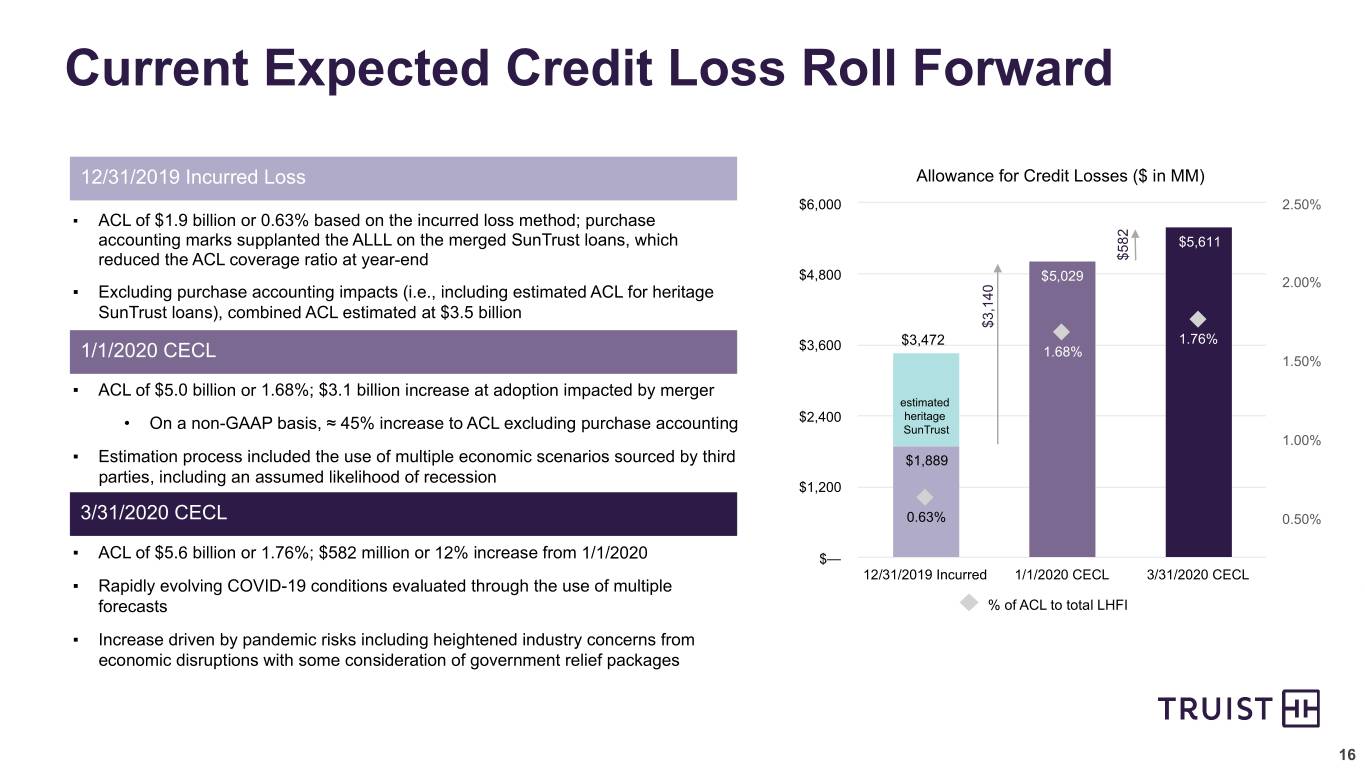
Provision for credit losses was $893 million for the first quarter of 2020; $582 million build compared to the Day 1 CECL
The allowance for loan and lease loss coverage ratio was 5.04 times nonperforming loans and leases held for investment, versus 3.41 times in the prior quarter

Capital and liquidity levels remained strong
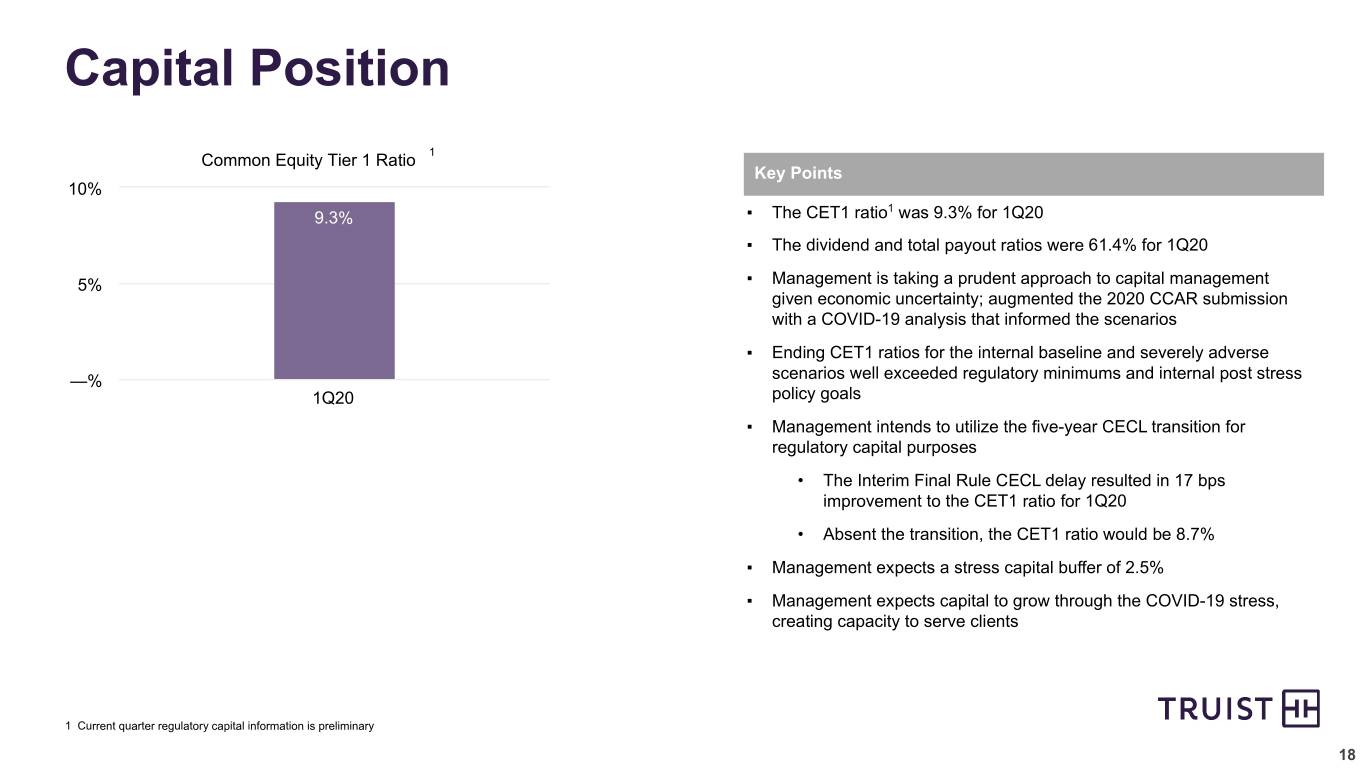
Common equity tier 1 to risk-weighted assets was 9.3 percent
Tier 1 risk-based capital was 10.5 percent
Total capital was 12.6 percent
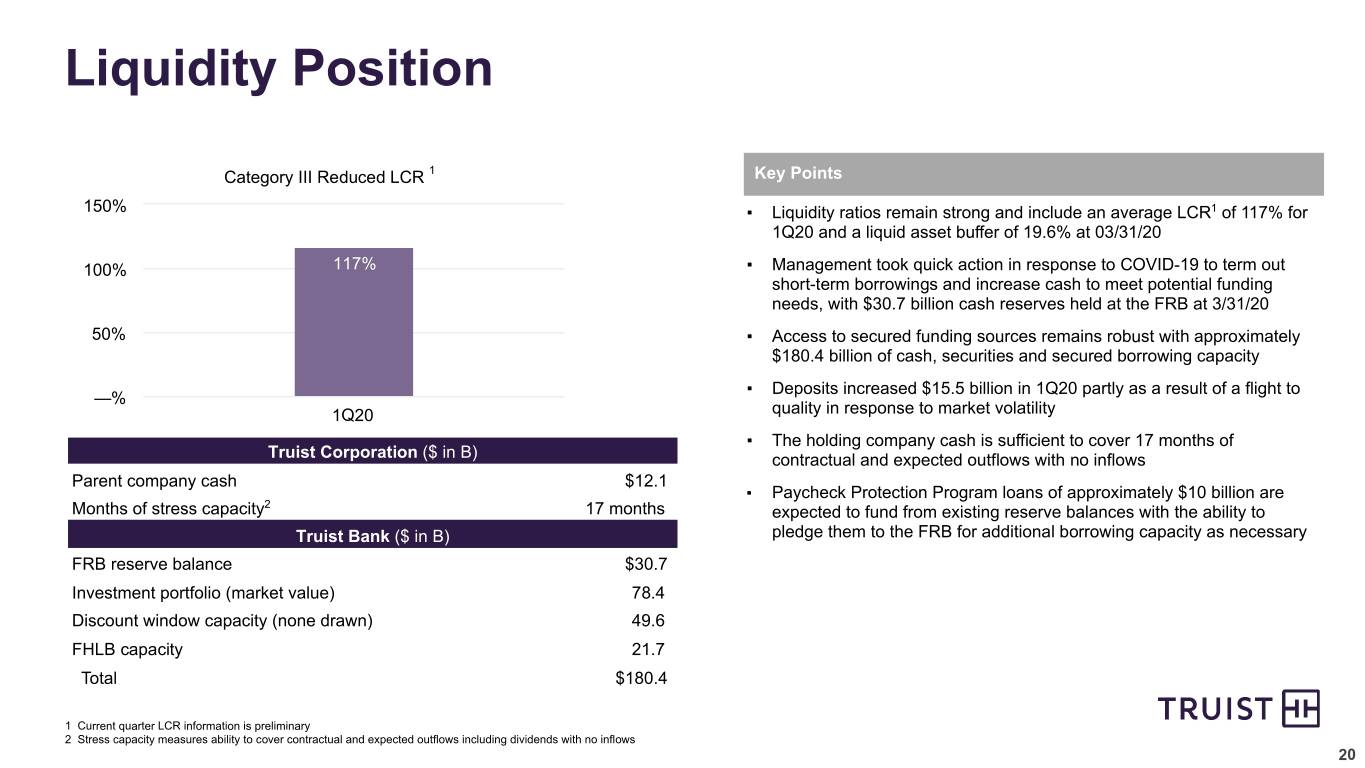
LCR ratio was 117 percent for first quarter 2020

EARNINGS HIGHLIGHTSChange 1Q20 vs.  
(dollars in millions, except per share data)1Q20  4Q19  1Q19  4Q19  1Q19  
Net income available to common shareholders$986  $702  $749  $284  $237  
Diluted earnings per common share0.73  0.75  0.97  (0.02) (0.24) 
Net interest income - taxable equivalent$3,687  $2,252  $1,720  $1,435  $1,967  
Noninterest income1,961  1,398  1,202  563  759  
Total taxable-equivalent revenue$5,648  $3,650  $2,922  $1,998  $2,726  
Less taxable-equivalent adjustment37  25  24  
Total revenue$5,611  $3,625  $2,898  
Return on average assets0.90 %0.95 %1.43 %(0.05)%(0.53)%
Return on average risk-weighted assets (current quarter is preliminary)1.11  1.02  1.78  0.09  (0.67) 
Return on average common shareholders' equity6.58  7.33  11.08  (0.75) (4.50) 
Return on average tangible common shareholders' equity (1)
13.23  12.91  18.36  0.32  (5.13) 
Net interest margin - taxable equivalent3.58  3.41  3.51  0.17  0.07  
(1) Excludes certain items as detailed in the non-GAAP reconciliations in the Quarterly Performance Summary.

First Quarter 2020 compared to Fourth Quarter 2019

Total taxable-equivalent revenue was $5.6 billion for the first quarter of 2020, an increase of $2.0 billion compared to the prior quarter, driven by an increase of $1.4 billion in net interest income and an increase of $563 million in noninterest income.

- 3 -


The net interest margin was 3.58 percent for the first quarter, up 17 basis points compared to the prior quarter. Average earning assets increased $150.4 billion, which primarily reflects a $114.1 billion increase in average total loans and leases, a $15.0 billion increase in average securities and a $17.3 billion increase in average other earning assets. The increase in average other earning assets primarily reflects higher interest-bearing balances at the Federal Reserve. Average interest-bearing liabilities increased $119.4 billion, driven by an increase of $95.3 billion in average interest-bearing deposits, an increase of $16.7 billion in average long-term debt and an increase of $7.4 billion in average short-term borrowings. The increases in balances were primarily due to the merger, as the prior quarter included only a partial impact on average balances, and actions to build liquidity in response to the COVID-19 pandemic.

The yield on the total loan portfolio for the first quarter was 4.98 percent, up seven basis points compared to the prior quarter, primarily due to accretion of the fair value mark on the merged loans, partially offset by lower rates. The yield on the average securities portfolio for the first quarter was 2.62 percent, down three basis points compared to the prior quarter.

The average cost of total deposits was 0.51 percent, down six basis points compared to the prior quarter. The average cost of interest-bearing deposits was 0.70 percent, down 12 basis points compared to the prior quarter. The average rate on long-term debt was 2.34 percent, down 58 basis points compared to the prior quarter. The average rate on short-term borrowings was 1.76 percent, down 39 basis points compared to the prior quarter. The decrease in rates on deposits and other funding was largely attributable to the declines in fed funds and LIBOR rates. The decrease in rates on long-term debt also reflects the amortization of the fair value mark on the assumed debt, as well as the issuance of $4.3 billion of senior and subordinated long-term debt and the issuance of $20.0 billion of long-term FHLB advances in March 2020.

The provision for credit losses was $893 million, and net charge-offs were $272 million for the first quarter, compared to $171 million and $192 million, respectively, for the prior quarter. The increase in the provision for credit losses was primarily due to the recognition of an economic downturn and significant growth in loans related to COVID-19, including the impact of reserving for the lifetime expected losses under CECL. Higher net charge-offs also contributed to the increase in the current quarter as there was a full quarter of activity from the merger.

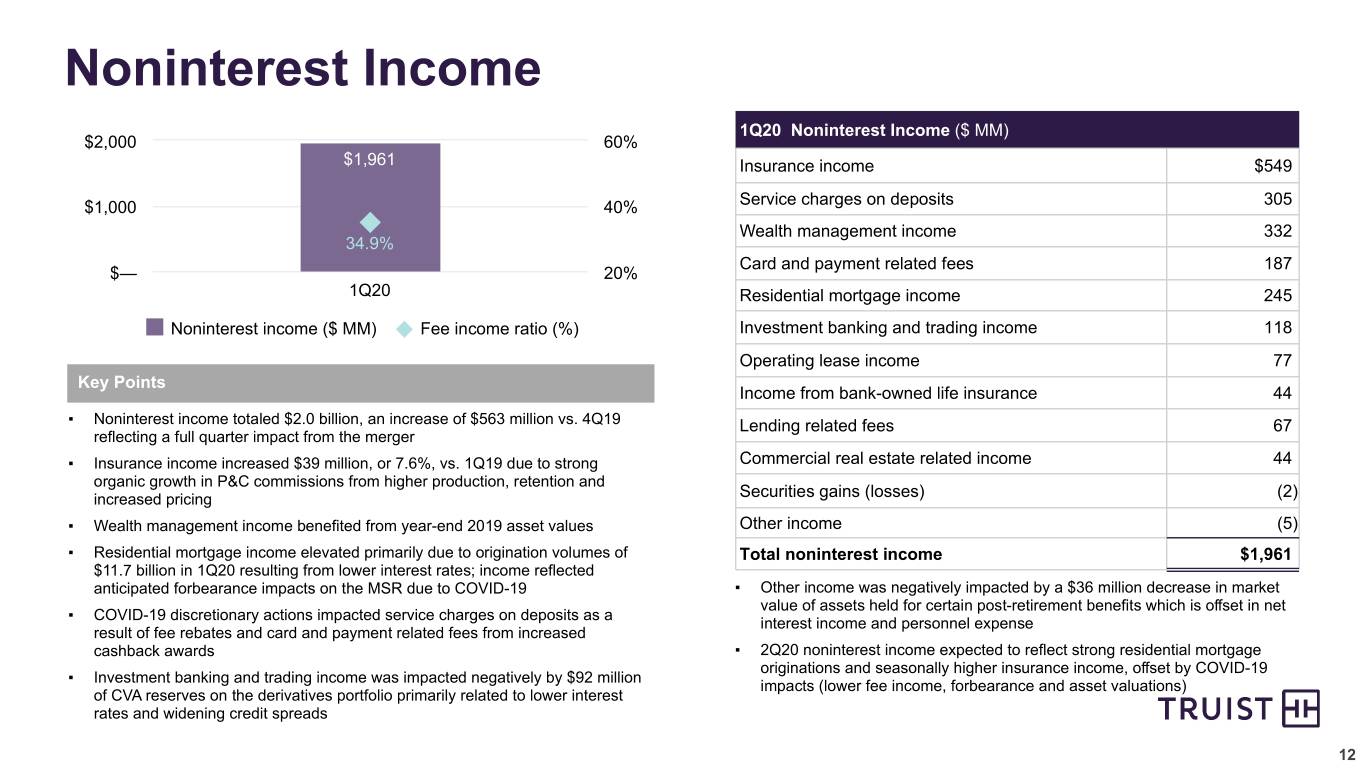
Noninterest income was $2.0 billion, an increase of $563 million compared to the prior quarter. This increase reflects a full quarter of impact from the merger and a $114 million change in securities losses recognized compared to the prior quarter. Insurance income was up $40 million primarily due to seasonality. Residential mortgage income increased $180 million due to the merger, as well as strong production income due to the declining interest rate environment. Investment banking and trading income was up slightly compared to the prior quarter. This category of income was negatively impacted by credit valuation adjustments of $92 million on the derivatives portfolio primarily related to the decline in interest rates and widening of credit spreads. Other income was down $72 million compared to the prior period, primarily as a result of a $58 million change in the market value of assets held for certain post-retirement benefits, which is primarily offset by lower personnel expense.

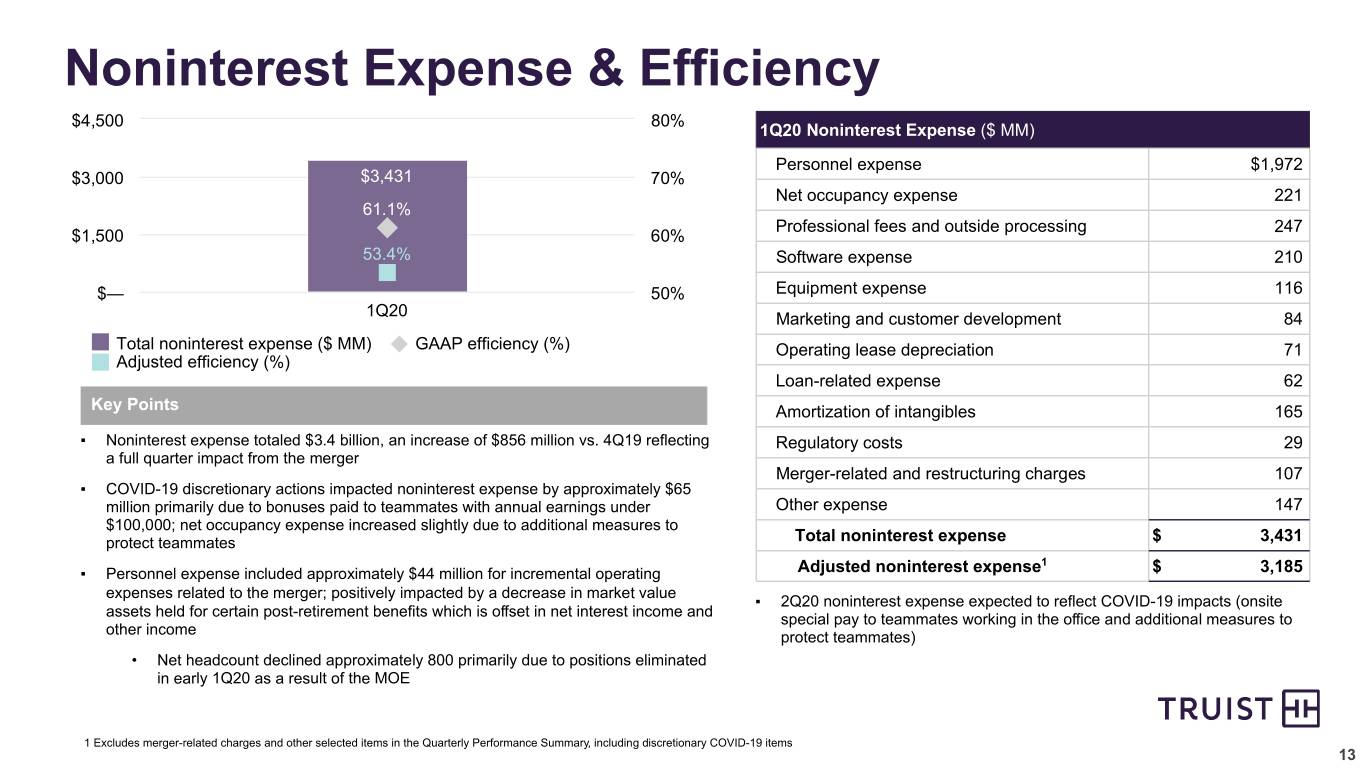
Noninterest expense was $3.4 billion for the first quarter, up $856 million compared to the prior quarter. Merger-related and restructuring charges decreased $116 million primarily due to higher personnel-related expenses incurred in the prior quarter. Incremental operating expenses related to the merger decreased $27 million primarily due to lower personnel-related items. As previously mentioned, additional discretionary expenses were incurred in connection with COVID-19 that amounted to approximately $65 million during the quarter. On an adjusted basis, noninterest expense was up $934 million, primarily due to a full quarter impact from the merger. Marketing and customer development expense reflects higher spend related to the launch of the Truist brand. Amortization of intangibles increased $94 million due to the intangibles recognized in the merger.

- 4 -


The provision for income taxes was $224 million for the first quarter, compared to $153 million for the prior quarter. The effective tax rate for the first quarter was 17.4 percent, unchanged compared to the prior quarter.

First Quarter 2020 compared to First Quarter 2019

Total taxable-equivalent revenues were $5.6 billion for the first quarter of 2020, an increase of $2.7 billion compared to the earlier quarter, which reflects an increase of $2.0 billion in taxable-equivalent net interest income and an increase of $759 million in noninterest income.

Net interest margin was 3.58 percent, up seven basis points compared to the earlier quarter. Average earning assets increased $215.8 billion. The increase in average earning assets reflects a $159.0 billion increase in average total loans and leases and a $29.0 billion increase in average securities. Average interest earning trading assets and other earning assets increased $27.9 billion due to higher trading securities and interest-bearing balances at the Federal Reserve. Average interest-bearing liabilities increased $170.3 billion compared to the earlier quarter. Average interest-bearing deposits increased $133.8 billion, average long-term debt increased $23.3 billion and average short-term borrowings increased $13.3 billion.

The yield on the total loan portfolio for the first quarter of 2020 was 4.98 percent, down eight basis points compared to the earlier quarter, reflecting the impact of rate decreases, partially offset by purchase accounting accretion from merged loans. The yield on the average securities portfolio was 2.62 percent, up two basis points compared to the earlier period.

The average cost of total deposits was 0.51 percent, down 13 basis points compared to the earlier quarter. The average cost of interest-bearing deposits was 0.70 percent, down 25 basis points compared to the earlier quarter. The average rate on short-term borrowings was 1.76 percent, down 56 basis points compared to the earlier quarter. The average rate on long-term debt was 2.34 percent, down 96 basis points compared to the earlier quarter. The lower rates on interest-bearing liabilities reflect declines in fed funds and LIBOR rates. The lower rates on long-term debt also reflect the amortization of the fair value mark on the assumed debt and the recent issuance of new senior and subordinated notes and FHLB long-term debt.

The provision for credit losses was $893 million, compared to $155 million for the earlier quarter. The increase in the provision for credit losses was primarily due to the recognition of an economic downturn and significant growth in loans related to COVID-19, including the impact of reserving for the lifetime expected losses under CECL. Net charge-offs for the first quarter of 2020 totaled $272 million compared to $147 million in the earlier quarter. Higher net charge-offs also contributed to the increase in the provision for credit losses and primarily reflect increases as a result of the merger. The net charge-off rate for the current quarter of 0.36 percent was down four basis points compared to the first quarter of 2019.

Noninterest income for the first quarter of 2020 increased $759 million compared to the earlier quarter. Nearly all categories of noninterest income were impacted by the merger. Insurance income increased $39 million due to higher production. Residential mortgage banking income was up due to strong production and refinance activity driven by the declining rate environment. Investment banking and trading income was up $91 million, but was negatively impacted by credit valuation adjustments of $92 million on the derivatives portfolio primarily related to the decline in interest rates and widening of credit spreads. Other income was worse $58 million, primarily as a result of a $26 million change in the market value of assets held for certain post-retirement benefits, which is primarily offset by lower personnel expense.
- 5 -


Noninterest expense for the first quarter of 2020 was up $1.7 billion compared to the earlier quarter. Merger-related and restructuring charges and other incremental operating expenses related to the merger increased $27 million and $72 million, respectively. In addition, the current quarter was impacted by $65 million of discretionary expenses related to COVID-19. On an adjusted basis, noninterest expense was up $1.5 billion, primarily reflecting the impact of the merger. Marketing and customer development expense reflects higher spend related to the launch of the Truist brand. Amortization of intangibles increased $133 million due to the intangibles recognized in the merger.

The provision for income taxes was $224 million for the first quarter of 2020, compared to $177 million for the earlier quarter. This produced an effective tax rate for the first quarter of 2020 of 17.4 percent, compared to 18.2 percent for the earlier quarter. The lower effective tax rate is primarily due to higher income tax credits in the current year.

LOANS AND LEASES
End of Period  Average Balances  
(dollars in millions)1Q20  4Q19  Change  1Q20  
Commercial:
Commercial and industrial$149,161  $130,180  $18,981  $131,743  
CRE27,532  26,832  700  27,046  
Commercial construction6,630  6,205  425  6,409  
Lease financing5,984  6,122  (138) 6,070  
Total commercial189,307  169,339  19,968  171,268  
Consumer:
Residential mortgage53,096  52,071  1,025  52,993  
Residential home equity and direct27,629  27,044  585  27,564  
Indirect auto25,146  24,442  704  24,975  
Indirect other10,980  11,100  (120) 10,950  
Student7,771  6,743  1,028  7,787  
Total consumer124,622  121,400  3,222  124,269  
Credit card5,300  5,619  (319) 5,534  
PCI—  3,484  (3,484) —  
Total loans and leases held for investment$319,229  $299,842  $19,387  $301,071  

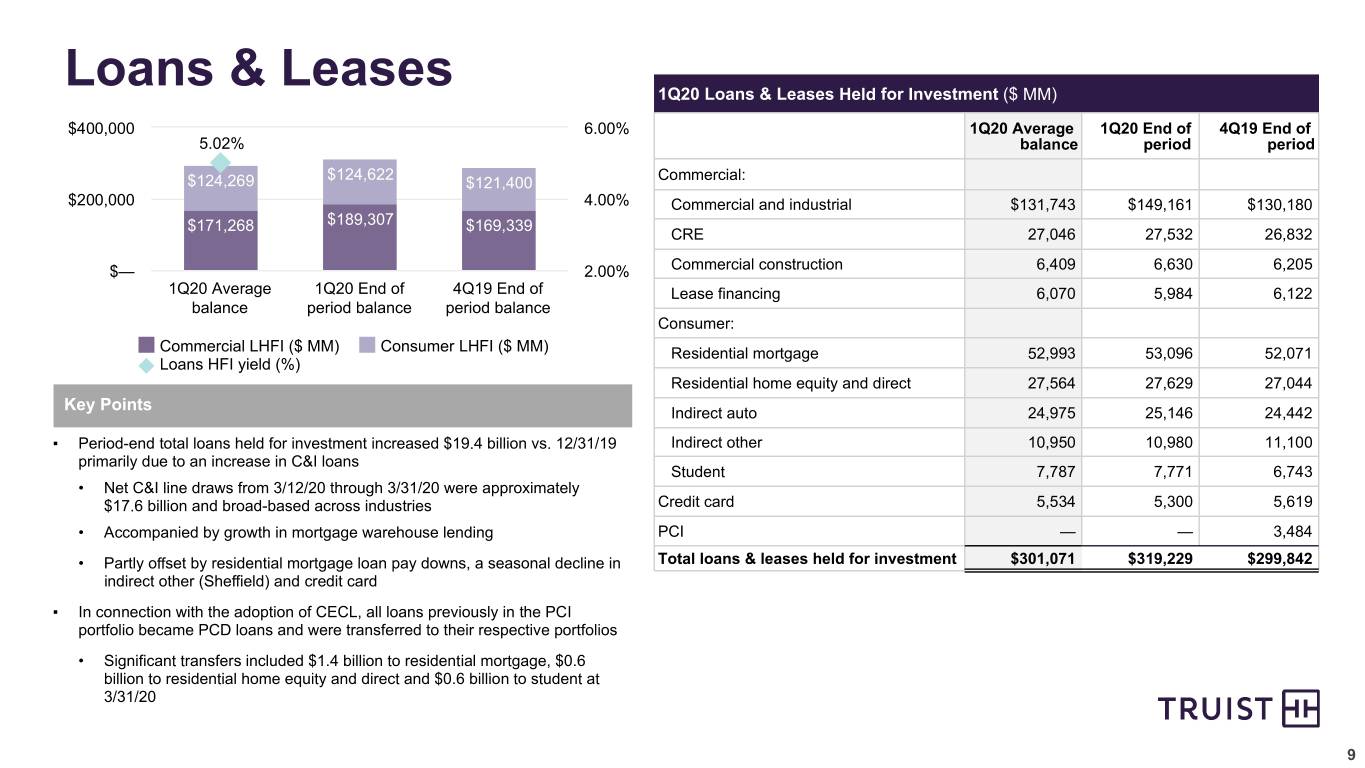
Total loans and leases held for investment were $319.2 billion as of March 31, 2020, compared to $299.8 billion as of December 31, 2019. In connection with the adoption of CECL, all loans previously in the PCI portfolio became PCD loans and were transferred to their respective portfolios. The significant growth in the commercial and industrial portfolio was primarily due to draws on lines of credit by clients building liquidity in response to COVID-19.

Average loans and leases held for investment for the first quarter of 2020 were $301.1 billion, up $110.8 billion compared to the fourth quarter of 2019, primarily due to the merged loans and the line draws in response to COVID-19. Excluding the impact from these items, average loans were down slightly due to residential mortgage as a result of transferring loans to held for sale in the fourth quarter of 2019, partially offset by increases in indirect automobile loans and student loans.

- 6 -


DEPOSITS
End of Period  Average Balances  
(dollars in millions)1Q20  4Q19  Change  1Q20  
Noninterest-bearing deposits$97,618  $92,405  $5,213  $93,135  
Interest checking92,950  85,492  7,458  85,008  
Money market and savings124,072  120,934  3,138  120,936  
Time deposits35,539  35,896  (357) 35,570  
Total deposits$350,179  $334,727  $15,452  $334,649  

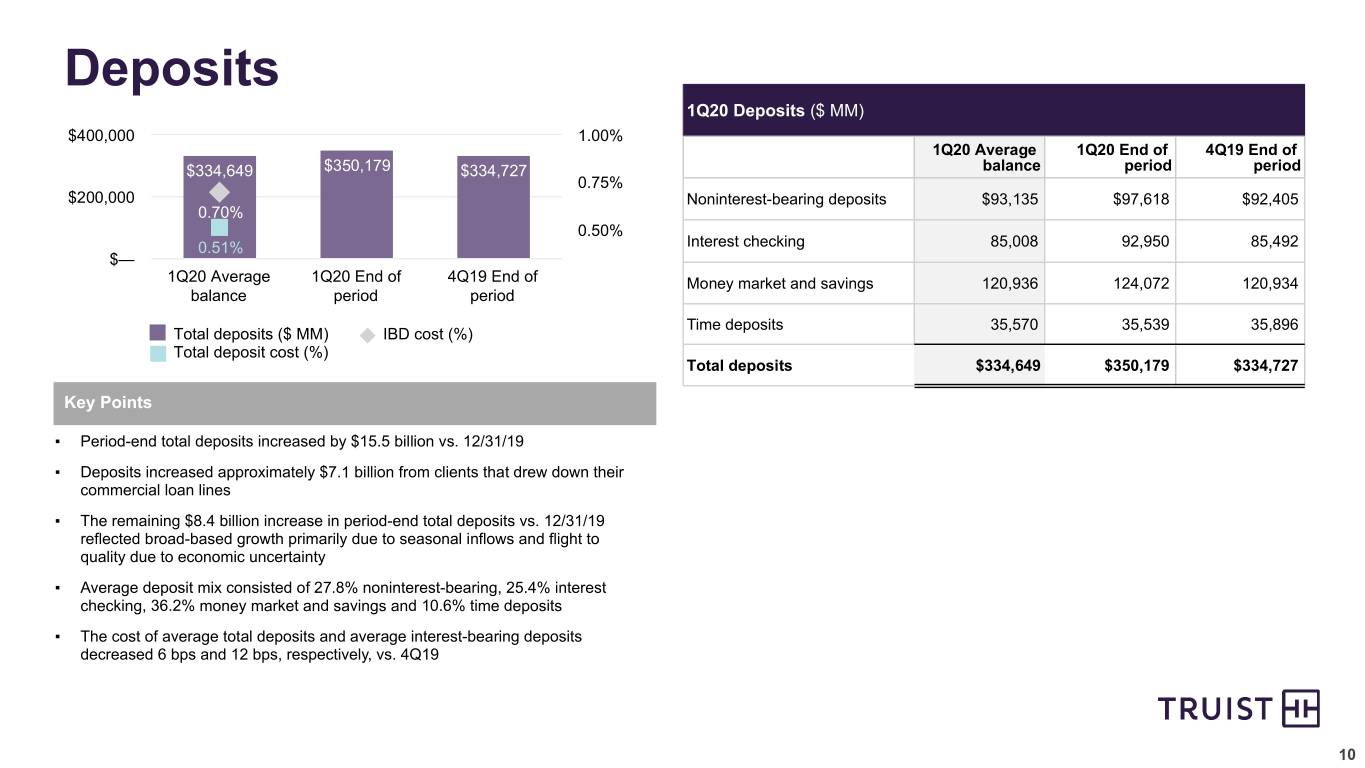
Total deposits were $350.2 billion as of March 31, 2020, compared to $334.7 billion as of December 31, 2019. Growth in deposits reflects clients retaining a portion of their credit line draws in the bank and solid growth in all non-time deposit products. Average deposits for the first quarter were $334.6 billion, up $123.9 billion compared to the prior quarter, primarily due to the merged deposits. Average noninterest-bearing deposits represented 27.8 percent of total deposits for the first quarter of 2020. The cost of average total deposits was 0.51 percent for the first quarter, down six basis points compared to the prior quarter. The cost of average interest-bearing deposits was 0.70 percent for the first quarter, down 12 basis points compared to the prior quarter.

SEGMENT RESULTSChange 1Q20 vs.  
(dollars in millions)
Segment Net Income1Q20  4Q19  1Q19  4Q19  1Q19  
Consumer Banking and Wealth$681  $435  $390  $246  $291  
Corporate and Commercial Banking423  522  430  (99) (7) 
Insurance Holdings105  59  88  46  17  
Other, Treasury & Corporate(146) (290) (110) 144  (36) 
Total net income$1,063  $726  $798  $337  $265  

Effective December 2019, segments were realigned in connection with the SunTrust merger. Results for prior periods have been revised to reflect the new structure.

First Quarter 2020 compared to Fourth Quarter 2019

Consumer Banking and Wealth ("CB&W")

CB&W serves individuals and small business clients by offering a variety of loan and deposit products, payment services, bankcard products and other financial services by connecting clients to a wide range of financial products and services. CB&W includes Dealer Retail Services, which originates loans on an indirect basis to individuals for the purchase of automobiles, boats and recreational vehicles. Additionally, CB&W includes National Consumer Finance & Payments, which provides a comprehensive set of technology-enabled lending solutions to individuals and small businesses through several national channels, as well as merchant services and payment processing solutions to business clients. CB&W also includes Mortgage Banking, which offers residential mortgage products nationally through its retail and correspondent channels, the internet and by telephone. These products are either sold in the secondary market, primarily with servicing rights retained, or held in the Company’s loan portfolio. Mortgage Banking also services loans for other investors, in addition to loans held in the Company’s loan portfolio. Mortgage Banking also includes Mortgage Warehouse Lending, which provides short-term lending solutions to finance first-lien residential mortgage LHFS by independent mortgage companies. Wealth delivers investment management, financial planning, banking, fiduciary services and related solutions to institutions, affluent and high net worth individuals and families, with financial expertise and industry-specific insights in the medical, legal, sports and entertainment industries.

- 7 -


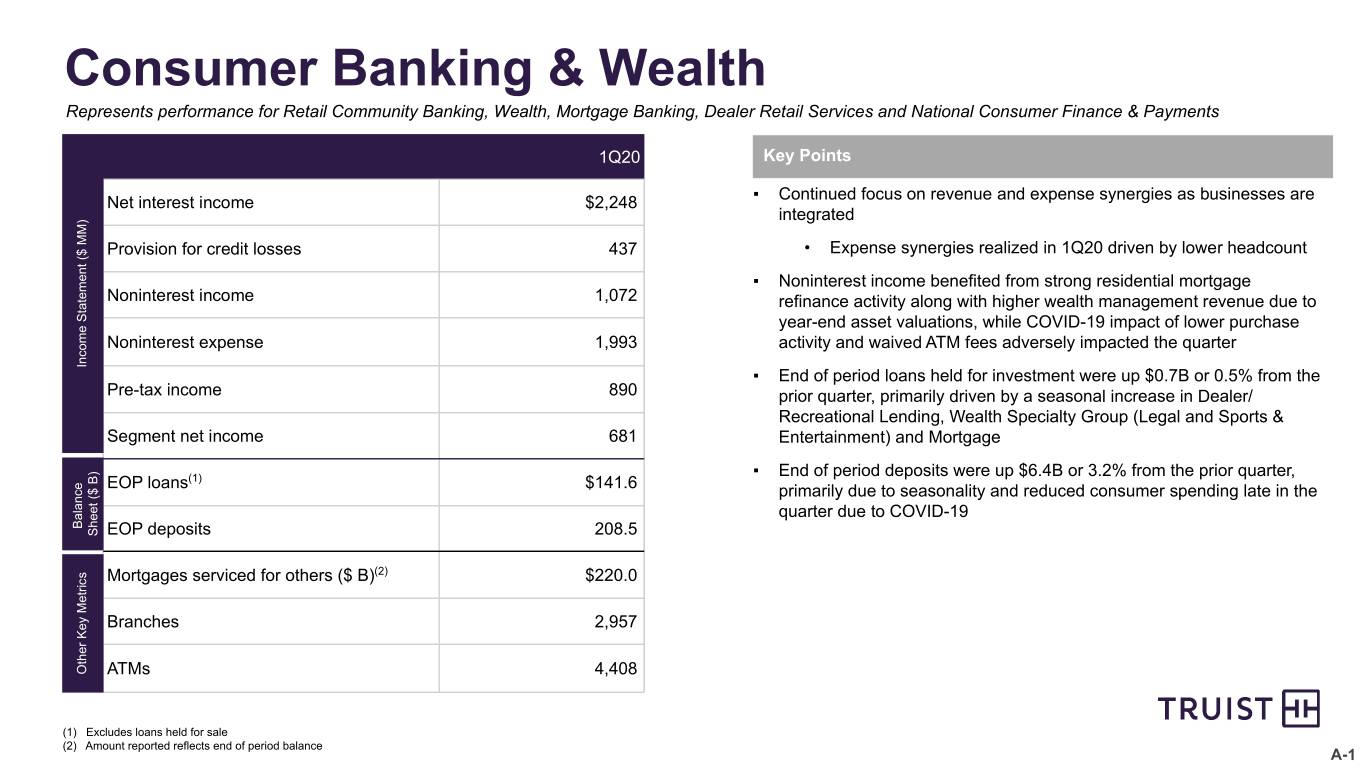
CB&W net income was $681 million for the first quarter of 2020, an increase of $246 million compared to the prior quarter. Segment net interest income increased $856 million primarily due to the merger. Noninterest income increased $426 million due to the merger and higher residential mortgage income as a result of the lower rate environment driving mortgage production through refinance activity. The allocated provision for credit losses increased $292 million primarily due to the recognition of an economic downturn related to COVID-19 and higher net charge-offs in the current quarter as there was a full quarter of activity from the merger. Noninterest expense increased $674 million primarily due to operating expenses and amortization of intangibles related to the merger, as well as discretionary management impacts from COVID-19.

Loans and leases were up $748 million at March 31, 2020, compared to the prior quarter, primarily driven by a seasonal increase in dealer/recreational lending and mortgage. Total deposits were up $6.4 billion at March 31, 2020, compared to the prior quarter, primarily due to seasonality and reduced consumer spending late in the quarter related to COVID-19.

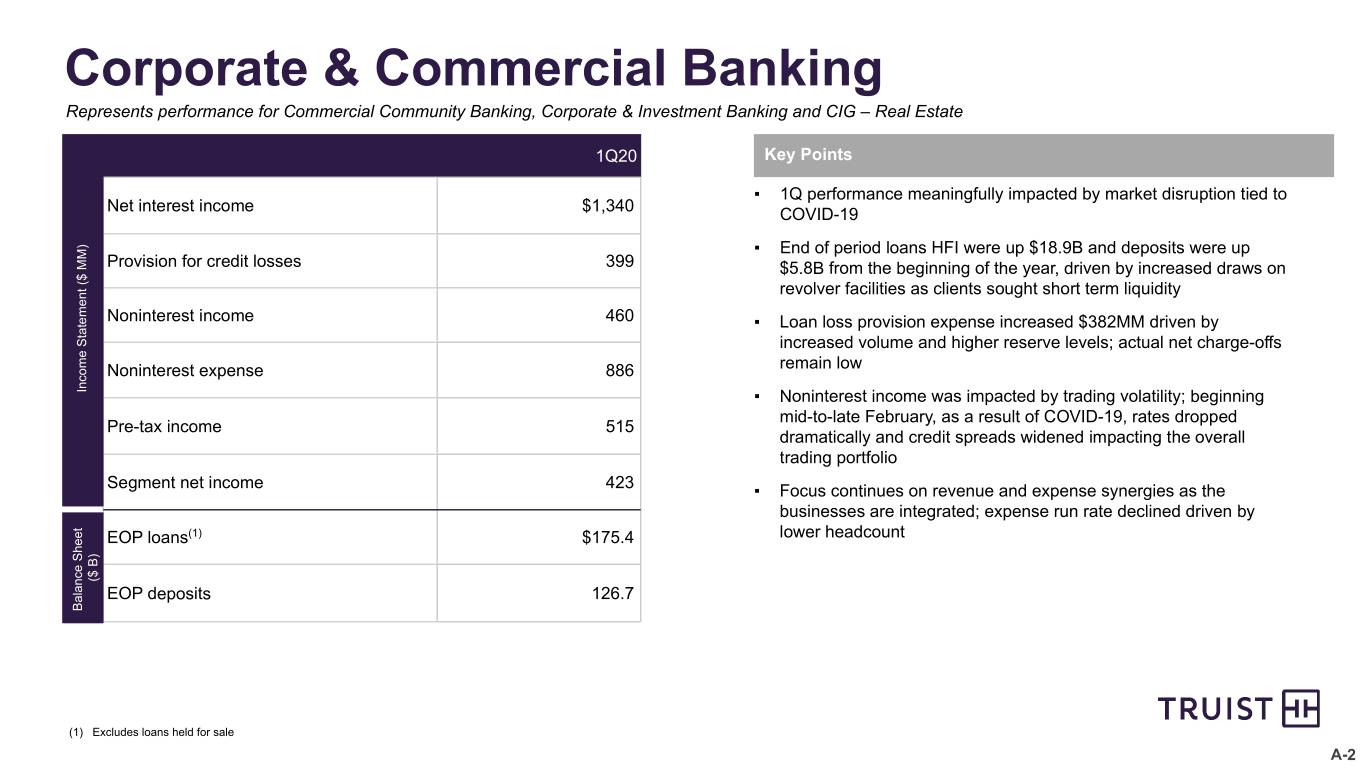
Corporate and Commercial Banking ("C&CB")

C&CB serves large, medium and small business clients by offering a variety of loan and deposit products and connecting clients to the combined organization’s broad array of financial services. C&CB includes Corporate and Investment Banking (“CIB”), which delivers a comprehensive range of strategic advisory, capital raising, risk management, financing, liquidity and investment solutions to both public and private companies in the C&CB segment and Wealth. Additionally, C&CB includes Commercial Community Banking, which offers an array of traditional banking products, including lending, cash management and investment banking to commercial clients via CIB. C&CB also includes Commercial Real Estate, which provides a range of credit and deposit services as well as fee-based product offerings to privately held developers, operators, and investors in commercial real estate properties. C&CB also includes Grandbridge Real Estate Capital, which is a fully integrated commercial mortgage banking company that originates commercial and multi-family real estate loans, services loan portfolios and provides asset and portfolio management as well as real estate brokerage services. Treasury Solutions, within C&CB, provides business clients across the organization with services required to manage their payments and receipts, combined with the ability to manage and optimize their deposits across all aspects of their business.

C&CB net income was $423 million for the first quarter of 2020, a decrease of $99 million compared to the prior quarter. Segment net interest income increased $501 million. Noninterest income increased $41 million due to the merger, partially offset by credit value adjustments primarily related to the decline in interest rates and widening of credit spreads. The allocated provision for credit losses increased $382 million primarily due to the recognition of an economic downturn and significant growth in loans related to COVID-19. Noninterest expense increased $311 million primarily due to operating expenses and amortization of intangibles related to the merger in the current quarter.

Loans and leases were up $18.9 billion compared to the prior quarter due to significant growth in commercial and industrial loans in March related to COVID-19. Total deposits were up $5.8 billion at March 31, 2020, compared to the prior quarter, primarily due to commercial clients retaining a portion of their credit line draws in the bank and solid growth in all non-time deposit products.

- 8 -


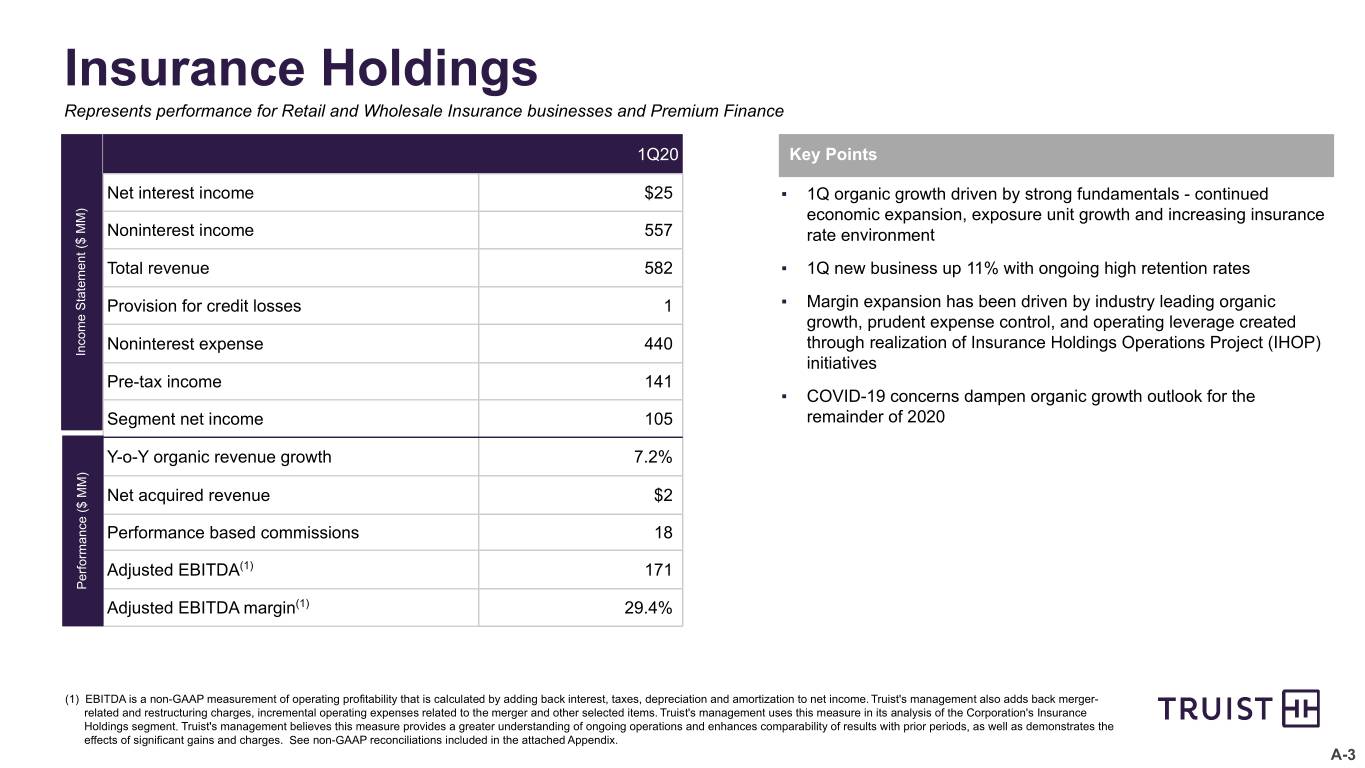
Insurance Holdings ("IH")

Truist’s IH segment is one of the largest insurance agency / brokerage networks in the world, providing property and casualty, employee benefits and life insurance to businesses and individuals. It also provides small business and corporate services, such as workers compensation and professional liability, as well as surety coverage and title insurance. In addition, IH includes commercial and retail insurance premium finance.

IH net income was $105 million for the first quarter of 2020, an increase of $46 million compared to the prior quarter. Noninterest income increased $21 million primarily due to seasonality in employee benefits renewal commissions. Noninterest expense decreased $41 million primarily due to seasonally higher performance-based incentives and restructuring expense in the prior quarter.
Other, Treasury & Corporate ("OT&C")

Net income in OT&C can vary due to the changing needs of the Corporation, including the size of the investment portfolio, the need for wholesale funding and variability associated with derivatives used to hedge the balance sheet.

OT&C generated a net loss of $146 million for the first quarter of 2020, compared to a net loss of $290 million for the prior quarter. Segment net interest income increased $68 million. Noninterest income increased $75 million primarily due to losses on the sale of securities in the prior quarter, partially offset by lower income related to certain post-employment benefits in the current quarter. The allocated provision for credit losses increased $49 million primarily due to the provision for unfunded commitments. Noninterest expense decreased $88 million primarily due to lower merger-related charges and increased corporate expenses allocated to the segments. The benefit for income taxes decreased $38 million primarily due to lower pre-tax losses in the current quarter.

First Quarter 2020 compared to First Quarter 2019

Consumer Banking and Wealth

CB&W net income was $681 million for the first quarter of 2020, an increase of $291 million compared to the earlier quarter. Segment net interest income increased $1.2 billion primarily due to the merger. Noninterest income increased $565 million, due to the merger and higher residential mortgage income as a result of the lower rate environment driving mortgage production through refinance activity. The allocated provision for credit losses increased $306 million primarily due to the recognition of an economic downturn related to COVID-19 and higher net charge-offs in the current quarter as there was a full quarter of activity from the merger. Noninterest expense increased $1.1 billion primarily due to operating expenses and amortization of intangibles related to the merger and discretionary management impacts from COVID-19 in the current quarter.

Corporate and Commercial Banking

C&CB net income was $423 million for the first quarter of 2020, a decrease of $7 million compared to the earlier quarter. Segment net interest income increased $706 million primarily due to the merger. Noninterest income increased $216 million due to the merger, partially offset by losses in trading income primarily related to the decline in interest rates and widening of credit spreads. The allocated provision for credit losses increased $379 million primarily due to the recognition of an economic downturn and significant growth in loans related to COVID-19. Noninterest expense increased $571 million primarily due to operating expenses and amortization of intangibles related to the merger in the current quarter.

- 9 -


Insurance Holdings

IH net income was $105 million for the first quarter of 2020, an increase of $17 million compared to the earlier quarter. Noninterest income increased $42 million primarily due to higher production. Noninterest expense increased $23 million primarily due to commissions on higher production in the current quarter.

Other, Treasury & Corporate

OT&C generated a net loss of $146 million in the first quarter of 2020, compared to a net loss of $110 million in the earlier quarter. Segment net interest income increased $19 million. Noninterest income decreased $64 million primarily due to lower income related to certain post-employment benefits and higher tax credit equivalents allocated to the segments. The allocated provision for credit losses increased $55 million primarily due to the provision for unfunded commitments. Noninterest expense decreased $42 million primarily due to lower merger-related charges and increased corporate expenses allocated to the segments. The benefit for income taxes increased $22 million primarily due to a higher pre-tax loss.

CAPITAL RATIOS1Q20  4Q19  3Q192Q191Q19
Risk-based:(preliminary)
Common equity Tier 19.3 %9.5 %10.6 %10.4 %10.3 %
Tier 110.5  10.8  12.2  12.0  12.0  
Total12.6  12.6  14.8  14.2  14.2  
Leverage (1)9.0  14.7  10.3  10.2  10.1  
Supplementary leverage (2)7.8  7.9  NA  NA  NA  
(1)The leverage ratio is calculated using end of period Tier 1 capital and quarterly average tangible assets. The timing of the merger impacted the result for the fourth quarter of 2019. The estimated leverage ratio for the fourth quarter of 2019 using a full quarterly average tangible assets was 9.3 percent.
(2)Truist became subject to the supplementary leverage ratio as of January 1, 2020. The December 31, 2019 measure was an estimate based on a full quarter of average tangible assets in the denominator.

Capital ratios declined slightly primarily due to the significant balance sheet growth related to commercial clients drawing on lines of credit in response to COVID-19. The leverage and supplementary leverage ratios were also impacted by higher balances held at the Federal Reserve. In March 2020, the company redeemed $500 million of Series K preferred stock and issued $1.25 billion of subordinated debt. Truist's capital levels remain strong compared to the regulatory levels for well capitalized banks at March 31, 2020. Truist declared common dividends of $0.450 per share during the first quarter of 2020. The dividend and total payout ratios for the first quarter of 2020 were 61.4 percent. As previously communicated at the time of the merger announcement, Truist suspended its share repurchase program until capital ratios return to higher levels.

As of January 1, 2020, Truist is subject to Category III reduced LCR requirements (85 percent). Truist's average LCR was approximately 117 percent for the three months ended March 31, 2020, compared to the regulatory minimum of 100 percent. Truist continues to maintain a strong liquidity position and is prepared to meet the funding needs of clients. In addition, the liquid asset buffer, which is defined as high quality unencumbered liquid assets as a percentage of total assets, was 19.6 percent at March 31, 2020.
- 10 -


ASSET QUALITY
(dollars in millions)1Q204Q193Q192Q191Q19
Total nonperforming assets$1,177  $684  $509  $523  $584  
Total performing TDRs1,079  980  1,057  1,070  1,130  
Total loans 90 days past due and still accruing1,748  1,994  403  407  431  
Total loans 30-89 days past due2,374  2,213  992  1,016  948  
Nonperforming loans and leases as a percentage of loans and leases held for investment
0.32 %0.15 %0.30 %0.30 %0.35 %
Nonperforming assets as a percentage of total assets
0.23  0.14  0.22  0.23  0.26  
Loans 30-89 days past due and still accruing as a percentage of loans and leases0.74  0.74  0.66  0.67  0.64  
Loans 90 days or more past due and still accruing as a percentage of loans and leases0.55  0.66  0.27  0.27  0.29  
Loans 90 days or more past due and still accruing as a percentage of loans and leases, excluding government guaranteed and PCI0.04  0.03  0.04  0.04  0.04  
Allowance for loan and lease losses as a percentage of loans and leases held for investment
1.63  0.52  1.05  1.05  1.05  
Net charge-offs as a percentage of average loans and leases, annualized
0.36  0.40  0.41  0.38  0.40  
Ratio of allowance for loan and lease losses to net charge-offs, annualized
4.76x2.03x2.59x2.80x2.62x
Ratio of allowance for loan and lease losses to nonperforming loans and leases held for investment
5.04x3.41x3.52x3.46x2.97x

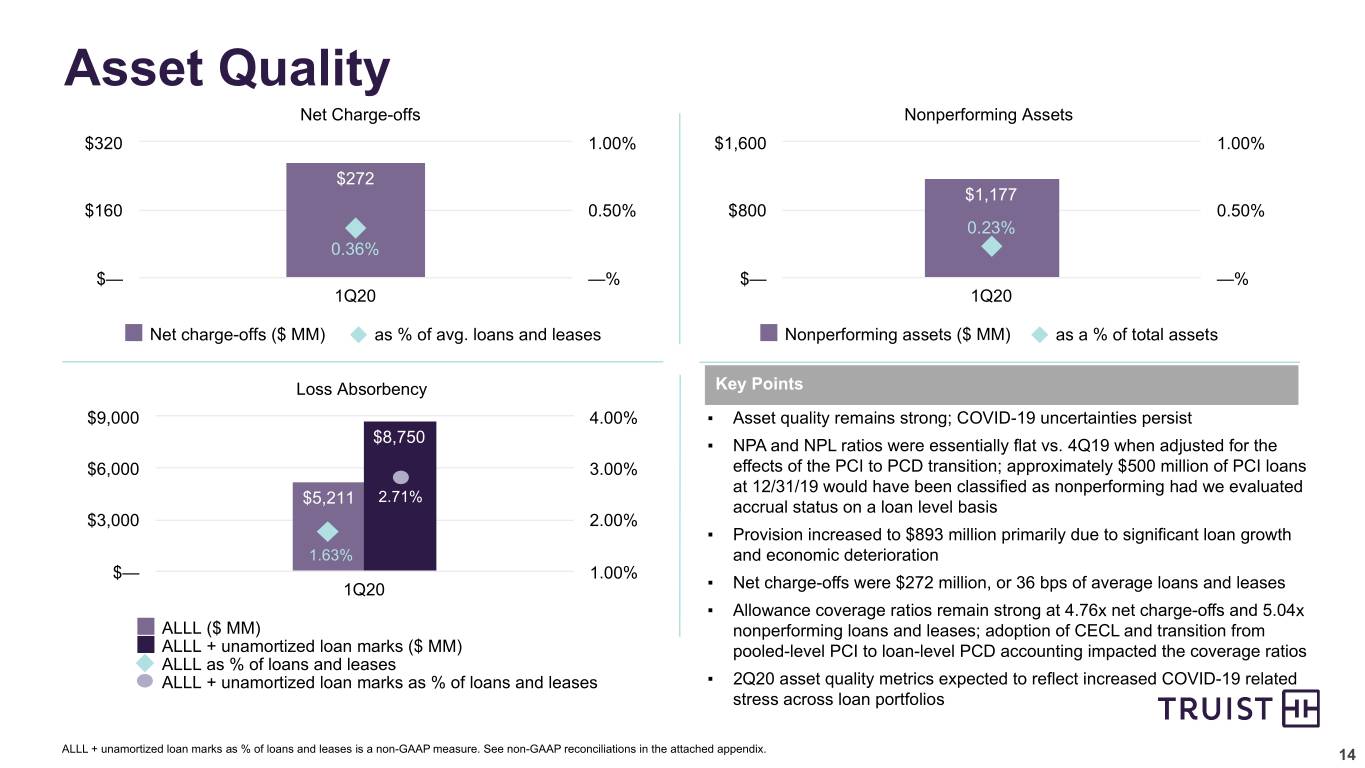
Nonperforming assets totaled $1.2 billion at March 31, 2020, up $493 million compared to December 31, 2019 due primarily to the adoption of CECL, which resulted in the discontinuation of the pool-level accounting for PCI loans and replaced that with a loan-level evaluation for nonaccrual status. As of December 31, 2019, there was approximately $500 million of PCI loans that would have been classified as nonperforming had we evaluated accrual status on a loan level basis. Nonperforming loans and leases held for investment represented 0.32 percent of loans and leases held for investment, up 17 basis points compared to December 31, 2019, but down three basis points from March 31, 2019. Performing TDRs were up $99 million during the first quarter, primarily in residential mortgage loans, commercial and industrial loans and indirect automobile loans.

Loans 90 days or more past due and still accruing totaled $1.7 billion at March 31, 2020, down $246 million compared to the prior quarter. The decline was due to loans that transitioned into nonaccrual as a result of the change in pool level accounting described above, partially offset by an increase in government guaranteed student loans. The ratio of loans 90 days or more past due and still accruing as a percentage of loans and leases was 0.55 percent at March 31, 2020, down 11 basis points from the prior quarter. Excluding government guaranteed and PCI loans, the ratio of loans 90 days or more past due and still accruing as a percentage of loans and leases was 0.04 percent at March 31, 2020, up one basis point from 0.03 percent at December 31, 2019.

Loans 30-89 days past due and still accruing totaled $2.4 billion at March 31, 2020, up $161 million compared to the prior quarter. The increase was largely in commercial and industrial loans and residential mortgage loans, partially offset by a decrease in student loans. The ratio of loans 30-89 days or more past due and still accruing as a percentage of loans and leases was 0.74 percent at March 31, 2020, unchanged from the prior quarter.

Net charge-offs during the first quarter totaled $272 million, up $80 million compared to the prior quarter. The increase was largely due to the impact of a full quarter from the merger. As a percentage of average loans and leases, annualized net charge-offs were 0.36 percent, down four basis points compared to the prior quarter.

- 11 -


The allowance for credit losses was $5.6 billion, up $3.7 billion compared to the prior quarter. The increase in the allowance for credit losses was primarily due the adoption of CECL. Upon adoption, the company recorded a $3.1 billion increase in the allowance for credit losses, including $2.8 billion that was charged to retained earnings net of deferred taxes, and $378 million related to the gross up for PCD loans. The remaining increase in the allowance for credit losses primarily reflects deteriorated economic conditions as well as significant loan growth from clients drawing down their lines of credit to build liquidity in response to COVID-19. The allowance for credit losses includes $5.2 billion for loans and leases and $400 million for the reserve for unfunded commitments. As of March 31, 2020, the allowance for loan and lease losses was 1.63 percent of loans and leases held for investment.

The allowance for loan and lease losses was 5.04 times nonperforming loans and leases held for investment, compared to 3.41 times at December 31, 2019. At March 31, 2020, the allowance for loan and lease losses was 4.76 times annualized net charge-offs, compared to 2.03 times at December 31, 2019.

Earnings Presentation and Quarterly Performance Summary

To listen to Truist's live first quarter 2020 earnings conference call at 8 a.m. ET today, please call 866-519-2796 and enter the participant code 892418. A presentation will be used during the earnings conference call and is available on our website at https://ir.truist.com/events-and-presentation. Replays of the conference call will be available for 30 days by dialing 888-203-1112 (access code 892418).

The presentation, including an appendix reconciling non-GAAP disclosures, and Truist's First Quarter 2020 Quarterly Performance Summary, which contains detailed financial schedules, is available at https://ir.truist.com/earnings.

About Truist

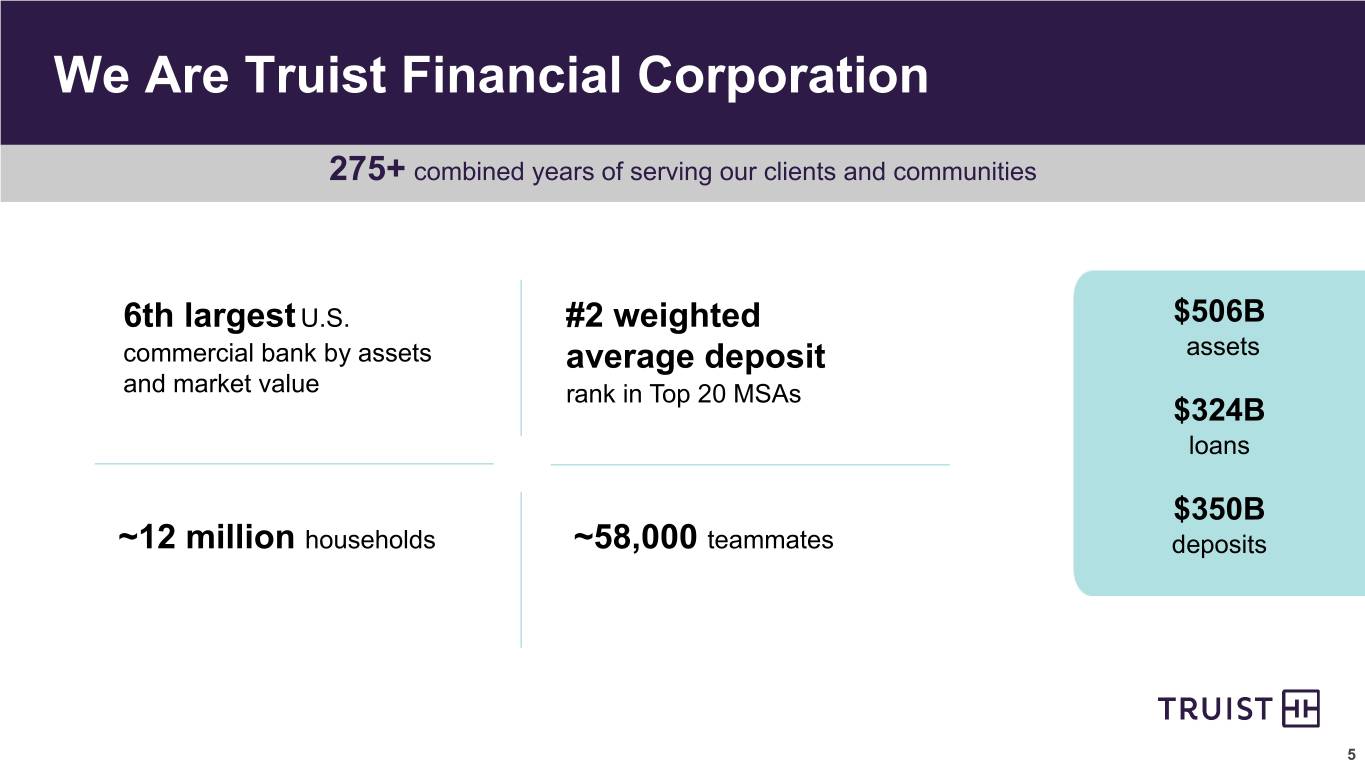
Truist Financial Corporation is a purpose-driven financial services company committed to inspire and build better lives and communities. With 275 years of combined BB&T and SunTrust history, Truist serves approximately 12 million households with leading market share in many high-growth markets in the country. The company offers a wide range of services including retail, small business and commercial banking; asset management; capital markets; commercial real estate; corporate and institutional banking; insurance; mortgage; payments; specialized lending and wealth management. Headquartered in Charlotte, North Carolina, Truist is the sixth-largest commercial bank in the U.S. with total assets of $506 billion as of March 31, 2020. Truist Bank, Member FDIC. Learn more at Truist.com.

#-#-#

Capital ratios and return on risk-weighted assets are preliminary.

This news release contains financial information and performance measures determined by methods other than in accordance with accounting principles generally accepted in the United States of America ("GAAP"). Truist's management uses these "non-GAAP" measures in their analysis of the Corporation's performance and the efficiency of its operations. Management believes these non-GAAP measures provide a greater understanding of ongoing operations, enhance comparability of results with prior periods and demonstrate the effects of significant items in the current period. The Corporation believes a meaningful analysis of its financial performance requires an understanding of the factors underlying that performance. Truist's management believes investors may find these non-GAAP financial measures useful. These disclosures should not be viewed as a substitute for financial measures determined in accordance with GAAP, nor are they necessarily comparable to non-GAAP performance measures that may be presented by other companies. Below is a listing of the types of non-GAAP measures used in this news release:

=
The adjusted efficiency ratio is non-GAAP in that it excludes securities gains (losses), amortization of intangible assets, merger-related and restructuring charges and other selected items. Truist's management uses this measure in their analysis of the Corporation's performance. Truist's management believes this measure provides a greater understanding of ongoing operations and enhances comparability of results with prior periods, as well as demonstrates the effects of significant gains and charges.
- 12 -


=
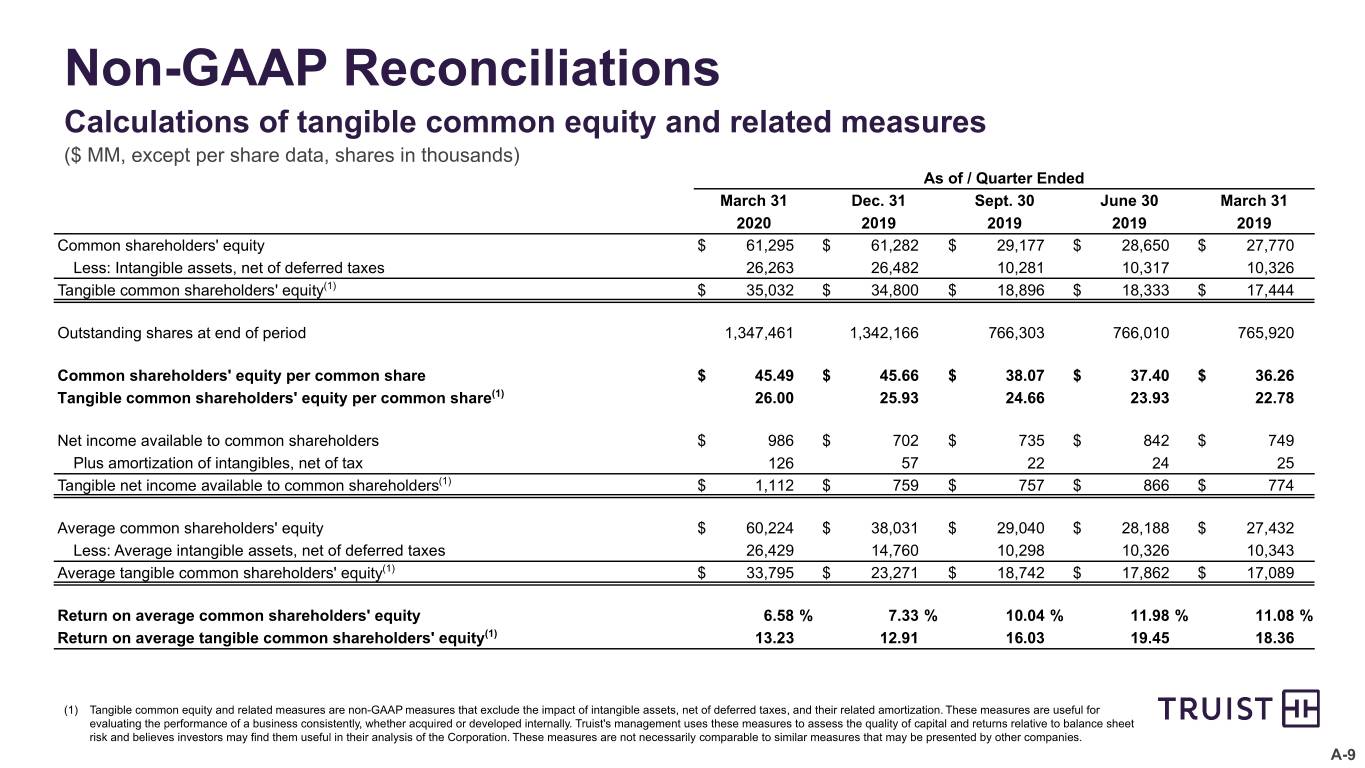
Tangible common equity and related measures are non-GAAP measures that exclude the impact of intangible assets, net of deferred taxes, and their related amortization. These measures are useful for evaluating the performance of a business consistently, whether acquired or developed internally. Truist's management uses these measures to assess the quality of capital and returns relative to balance sheet risk and believes investors may find them useful in their analysis of the Corporation.

=
Core net interest margin is a non-GAAP measure that adjusts net interest margin to exclude the impact of purchase accounting. The purchase accounting marks and related amortization for a) securities acquired from the FDIC in the Colonial Bank acquisition and b) loans, deposits and long-term debt from SunTrust, Susquehanna, National Penn and Colonial Bank are excluded to approximate the yields paid by clients. Interest income for PCI loans adjusts the accretion, net of interest reversals, which approximates the interest received from the client. Truist's management believes the adjustments to the calculation of net interest margin for certain assets and liabilities acquired provide investors with useful information related to the performance of Truist's earning assets.

=
The adjusted diluted earnings per share is non-GAAP in that it excludes merger-related and restructuring charges and other selected items, net of tax. Truist's management uses this measure in their analysis of the Corporation's performance. Truist's management believes this measure provides a greater understanding of ongoing operations and enhances comparability of results with prior periods, as well as demonstrates the effects of significant gains and charges.

=
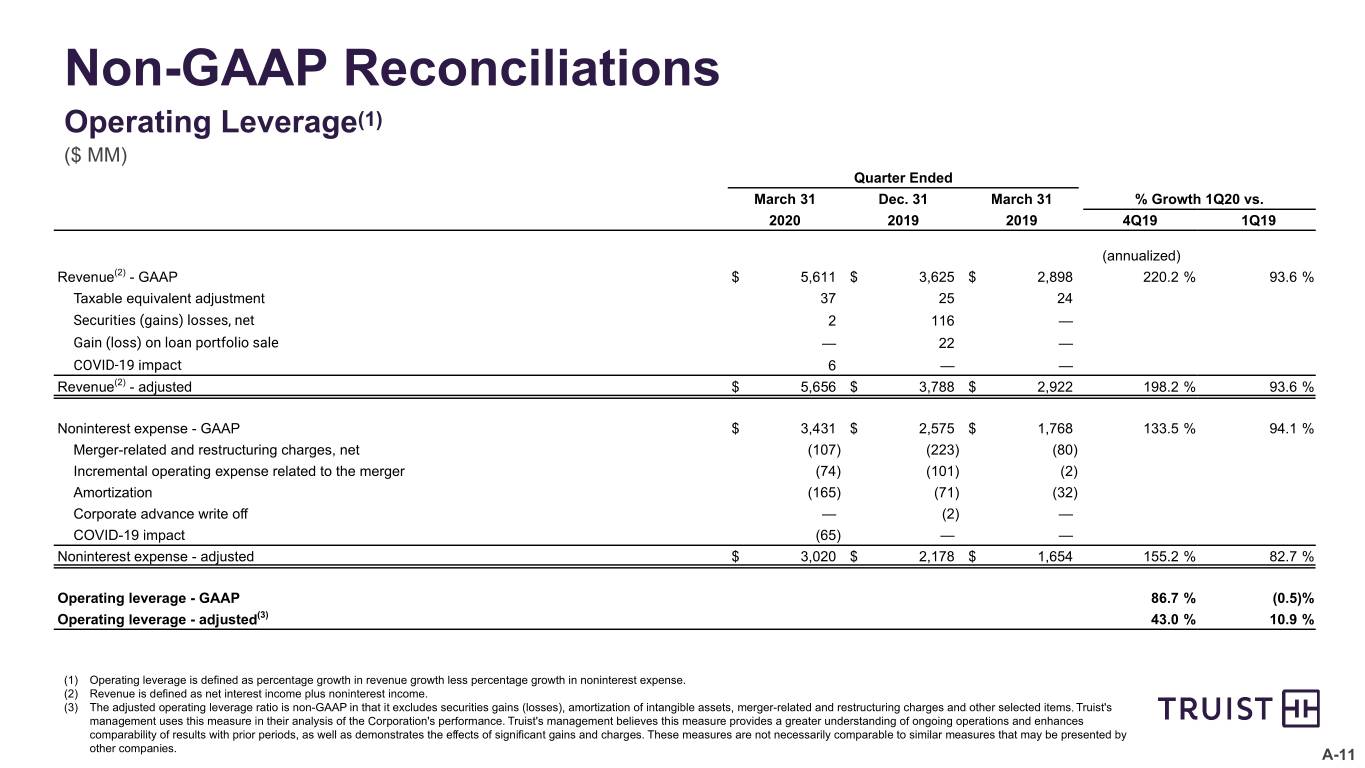
The adjusted operating leverage ratio is non-GAAP in that it excludes securities gains (losses), amortization of intangible assets, merger-related and restructuring charges and other selected items. Truist's management uses this measure in their analysis of the Corporation's performance. Truist's management believes this measure provides a greater understanding of ongoing operations and enhances comparability of results with prior periods, as well as demonstrates the effects of significant gains and charges.

=
The adjusted performance ratios are non-GAAP in that they exclude merger-related and restructuring charges, selected items and, in the case of return on average tangible common shareholders' equity, amortization of intangible assets. Truist's management uses these measures in their analysis of the Corporation's performance. Truist's management believes these measures provide a greater understanding of ongoing operations and enhances comparability of results with prior periods, as well as demonstrates the effects of significant gains and charges.
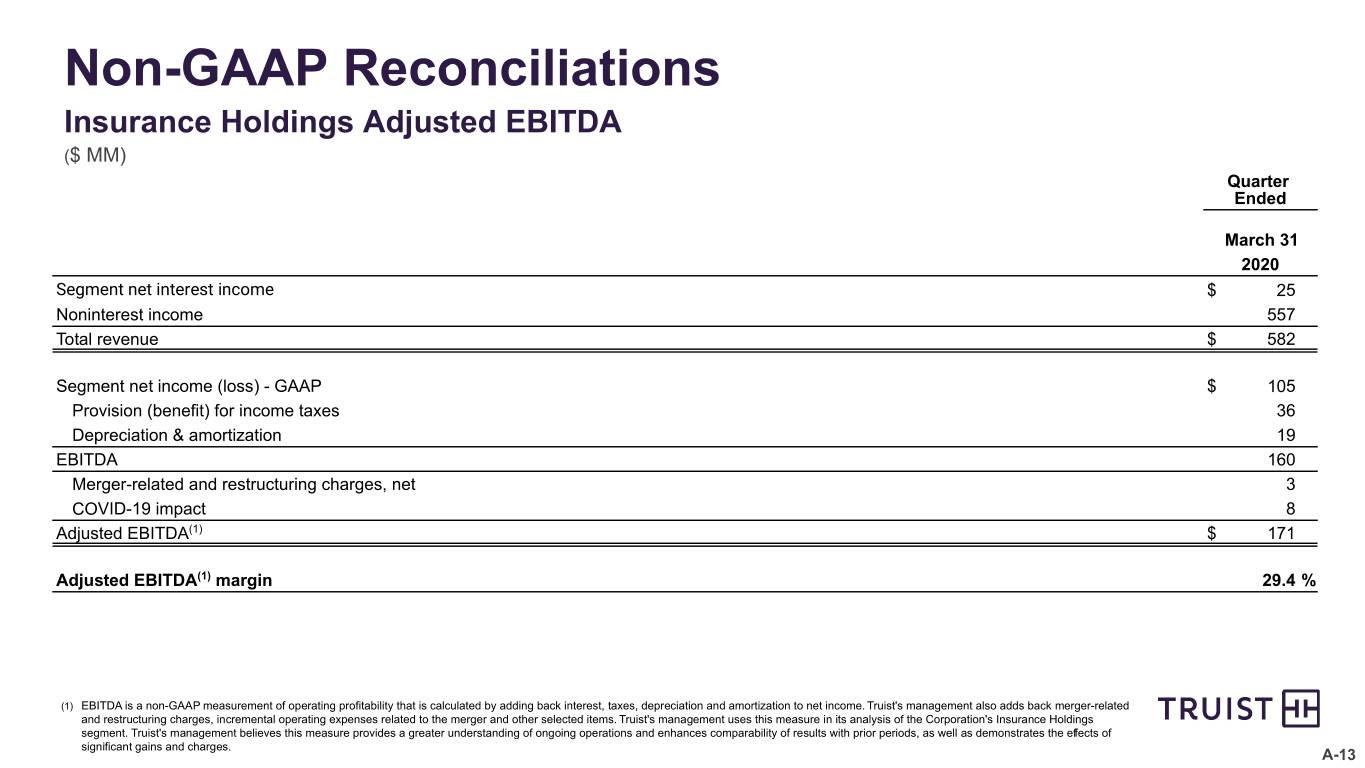
=EBITDA is a non-GAAP measurement of operating profitability that is calculated by adding back interest, taxes, depreciation and amortization to net income. Truist's management also adds back merger-related and restructuring charges, incremental operating expenses related to the merger and other selected items. Truist's management uses this measure in its analysis of the Corporation's Insurance Holdings segment. Truist's management believes this measure provides a greater understanding of ongoing operations and enhances comparability of results with prior periods, as well as demonstrates the effects of significant gains and charges.

=
Allowance for loan and lease losses and unamortized fair value mark as a percentage of gross loans and leases is a non-GAAP measurement of credit reserves that is calculated by adjusting the ALLL and loans and leases held for investment by the unamortized fair value mark. Truist's management uses this measure to assess credit reserves and believes investors may find this measure useful in their analysis of the Corporation.

A reconciliation of these non-GAAP measures to the most directly comparable GAAP measure is included in the appendix to Truist's First Quarter 2020 Earnings Presentation, which is available at https://ir.truist.com/earnings.

This news release contains "forward-looking statements" within the meaning of the Private Securities Litigation Reform Act of 1995, regarding the financial condition, results of operations, business plans and the future performance of Truist. Words such as "anticipates," "believes," "estimates," "expects," "forecasts," "intends," "plans," "projects," "may," "will," "should," “would," "could" and other similar expressions are intended to identify these forward-looking statements.

Forward-looking statements are not based on historical facts but instead represent management's expectations and assumptions regarding Truist's business, the economy and other future conditions. Such statements involve inherent uncertainties, risks and changes in circumstances that are difficult to predict. As such, Truist’s actual results may differ materially from those contemplated by forward-looking statements. While there can be no assurance that any list of risks and uncertainties or risk factors is complete, important factors that could cause actual results to differ materially from those contemplated by forward-looking statements include the following, without limitation, as well as the risks and uncertainties more fully discussed under Item 1A-Risk Factors in our Annual Report on Form 10-K for the year ended December 31, 2019 and in Truist's subsequent filings with the Securities and Exchange Commission:
risks and uncertainties relating to the Merger, including the ability to successfully integrate the companies or to realize the anticipated benefits of the Merger;
expenses relating to the Merger and integration of heritage BB&T and heritage SunTrust;
deposit attrition, client loss or revenue loss following completed mergers or acquisitions may be greater than anticipated;
changes in the interest rate environment, including the replacement of LIBOR as an interest rate benchmark, which could adversely affect Truist’s revenue and expenses, the value of assets and obligations, and the availability and cost of capital, cash flows, and liquidity;
volatility in mortgage production and servicing revenues, and changes in carrying values of Truist’s servicing assets and mortgages held for sale due to changes in interest rates;
management’s ability to effectively manage credit risk;
inability to access short-term funding or liquidity;
loss of client deposits, which could increase Truist’s funding costs;
- 13 -


changes in Truist’s credit ratings, which could increase the cost of funding or limit access to capital markets;
additional capital and liquidity requirements that will result from the Merger;
regulatory matters, litigation or other legal actions, which may result in, among other things, costs, fines, penalties, restrictions on Truist’s business activities, reputational harm, or other adverse consequences;
risks related to originating and selling mortgages, including repurchase and indemnity demands from purchasers related to representations and warranties on loans sold, which could result in an increase in the amount of losses for loan repurchases;
failure to execute on strategic or operational plans, including the ability to successfully complete and/or integrate mergers and acquisitions;
risks relating to Truist’s role as a servicer of loans, including an increase in the scope or costs of the services Truist is required to perform without any corresponding increase in Truist’s servicing fee, or a breach of Truist’s obligations as servicer;
negative public opinion, which could damage Truist’s reputation;
increased scrutiny regarding Truist’s consumer sales practices, training practices, incentive compensation design and governance;
competition from new or existing competitors, including increased competition from products and services offered by non-bank financial technology companies, may reduce Truist’s client base, cause Truist to lower prices for its products and services in order to maintain market share or otherwise adversely impact Truist’s businesses or results of operations;
Truist’s ability to introduce new products and services in response to industry trends or developments in technology that achieve market acceptance and regulatory approval;
Truist’s success depends on the expertise of key personnel, and if these individuals leave or change their roles without effective replacements Truist's operations and integration activities could be adversely impacted. This could be exacerbated as Truist continues to integrate the management teams of heritage BB&T and heritage SunTrust, or if the organization is unable to hire and retain qualified personnel;
legislative, regulatory or accounting changes may adversely affect the businesses in which Truist is engaged;
evolving regulatory standards, including with respect to capital and liquidity requirements, and results of regulatory examinations, may adversely affect Truist's financial condition and results of operations;
accounting policies and processes require management to make estimates about matters that are uncertain;
general economic or business conditions, either nationally or regionally, may be less favorable than expected, resulting in, among other things, slower deposit or asset growth, a deterioration in credit quality or a reduced demand for credit, insurance or other services;
risk management measures and management oversight functions may not identify or address risks adequately;
unfavorable resolution of legal proceedings or other claims or regulatory or other governmental investigations or inquiries could result in negative publicity, protests, fines, penalties, restrictions on Truist's operations or ability to expand its business or other negative consequences, all of which could cause reputational damage and adversely impact Truist's financial condition and results of operations;
competitors of Truist may have greater financial resources or develop products that enable them to compete more successfully than Truist and may be subject to different regulatory standards than Truist;
failure to maintain or enhance Truist’s competitive position with respect to technology, whether it fails to anticipate client expectations or because its technological developments fail to perform as desired or are not rolled out in a timely manner or for other reasons, may cause Truist to lose market share or incur additional expense;
fraud or misconduct by internal or external parties, which Truist may not be able to prevent, detect or mitigate;
operational or communications systems, including systems used by vendors or other external parties, may fail or may be the subject of a breach or cyber-attack that, if successful, could adversely impact Truist's financial condition and results of operations;
security risks, including denial of service attacks, hacking, social engineering attacks targeting Truist’s employees and clients, malware intrusion or data corruption attempts, and identity theft could result in the disclosure of confidential information, adversely affect Truist’s business or reputation or create significant legal or financial exposure;
the COVID-19 pandemic has disrupted the global economy, and continuation of current conditions could affect Truist’s capital and liquidity position, impair the ability of borrowers to repay outstanding loans and increase Truist's allowance for credit losses, impair the collateral values, cause an outflow of deposits, result in lost revenue or additional expenses, result in goodwill impairment charges, and increase Truist’s cost of capital;
natural or other disasters, including acts of terrorism and pandemics, could have an adverse effect on Truist, including a material disruption of Truist's operations or the ability or willingness of clients to access Truist's products and services;
widespread system outages, caused by the failure of critical internal systems or critical services provided by third parties could adversely impact Truist's financial condition and results of operations; and
depressed market values for Truist’s stock and adverse economic conditions sustained over a period of time may require a write down to goodwill.

Readers are cautioned not to place undue reliance on these forward-looking statements, which speak only as of the date they are made. Except to the extent required by applicable law or regulation, Truist undertakes no obligation to revise or update any forward-looking statements.
- 14 -




logo-boxed11.jpg

Quarterly Performance Summary
Truist Financial Corporation
First Quarter 2020


Table of Contents 
Quarterly Performance Summary 
Truist Financial Corporation


  Page
Financial Highlights
Financial Highlights - Five Quarter Trend

Consolidated Statements of Income
Consolidated Statements of Income - Five Quarter Trend
Segment Financial Performance - Five Quarter Trend
Consolidated Ending Balance Sheets - Five Quarter Trend
Average Balance Sheets
Average Balance Sheets - Five Quarter Trend
Average Balances and Rates - Quarters
Credit Quality
Capital Information - Five Quarter Trend
Selected Mortgage Banking Information & Additional Information
Selected Items
Non-GAAP Reconciliations


Financial Highlights 
Quarter Ended 
 March 31%
(Dollars in millions, except per share data, shares in thousands)20202019Change
Summary Income Statement   
Interest income - taxable equivalent$4,463  $2,197  103.1 %
Interest expense776  477  62.7  
Net interest income - taxable equivalent3,687  1,720  114.4  
Less: Taxable-equivalent adjustment37  24  54.2  
Net interest income 3,650  1,696  115.2  
Provision for credit losses893  155  NM  
Net interest income after provision for credit losses2,757  1,541  78.9  
Noninterest income1,961  1,202  63.1  
Noninterest expense3,431  1,768  94.1  
Income before income taxes1,287  975  32.0  
Provision for income taxes224  177  26.6  
Net income1,063  798  33.2  
Noncontrolling interests  (50.0) 
Preferred stock dividends74  43  72.1  
Net income available to common shareholders986  749  31.6  
Per Common Share Data
Earnings per share-basic$0.73  $0.98  (25.5)%
Earnings per share-diluted0.73  0.97  (24.7) 
Earnings per share-adjusted diluted (1)0.87  1.05  (17.1) 
Cash dividends declared0.450  0.405  11.1  
Common shareholders' equity45.49  36.26  25.5  
Tangible common shareholders' equity (1)26.00  22.78  14.1  
End of period shares outstanding1,347,461  765,920  75.9  
Weighted average shares outstanding-basic1,344,372  764,135  75.9  
Weighted average shares outstanding-diluted1,357,545  774,071  75.4  
Performance Ratios
Return on average assets0.90 %1.43 %
Return on average risk-weighted assets (current period is preliminary)1.11  1.78  
Return on average common shareholders' equity6.58  11.08  
Return on average tangible common shareholders' equity (1)13.23  18.36  
Net interest margin - taxable equivalent3.58  3.51  
Fee income ratio34.9  41.5  
Efficiency ratio-GAAP61.1  61.0  
Efficiency ratio-adjusted (1)53.4  56.6  
Credit Quality
Nonperforming assets as a percentage of:
Assets0.23 %0.26 %
Loans and leases plus foreclosed property0.36  0.39  
Net charge-offs as a percentage of average loans and leases 0.36  0.40  
Allowance for loan and lease losses as a percentage of loans and leases held for investment1.63  1.05  
Ratio of allowance for loan and lease losses to nonperforming loans and leases held for investment5.04x2.97x
Average Balances
Assets$477,550  $225,573  111.7 %
Securities (2)75,701  46,734  62.0  
Loans and leases 307,748  148,790  106.8  
Deposits334,649  160,045  109.1  
Common shareholders' equity60,224  27,432  119.5  
Total shareholders' equity65,412  30,541  114.2  
Period-End Balances
Assets$506,229  $227,683  122.3 %
Securities (2)78,398  46,410  68.9  
Loans and leases 324,039  149,891  116.2  
Deposits350,179  159,766  119.2  
Common shareholders' equity61,295  27,770  120.7  
Total shareholders' equity66,061  30,883  113.9  
Capital Ratios (current quarter is preliminary)
Risk-based:
Common equity Tier 19.3 %10.3 %
Tier 110.5  12.0  
Total12.6  14.2  
Leverage9.0  10.1  
Supplementary leverage7.8  NA  
Applicable ratios are annualized.
NM - not meaningful
(1) Represents a non-GAAP measure. See the calculations and management's reasons for using these measures in the Non-GAAP Reconciliations and Preliminary Capital Information - Five Quarter Trend sections of this supplement.
(2) Includes AFS and HTM securities. Average balances reflect both AFS and HTM securities at amortized cost. Period-end balances reflect AFS securities at fair value and HTM securities at amortized cost. In 4Q19, Truist transferred all HTM securities into AFS securities in response to changes in regulatory capital rules.
Truist Financial Corporation 1


Financial Highlights - Five Quarter Trend   
Quarter Ended
 March 31Dec. 31Sept. 30June 30March 31
(Dollars in millions, except per share data, shares in thousands)20202019201920192019
Summary Income Statement
Interest income - taxable equivalent$4,463  $2,837  $2,241  $2,230  $2,197  
Interest expense776  585  518  516  477  
Net interest income - taxable equivalent3,687  2,252  1,723  1,714  1,720  
Less: Taxable-equivalent adjustment37  25  23  24  24  
Net interest income 3,650  2,227  1,700  1,690  1,696  
Provision for credit losses893  171  117  172  155  
Net interest income after provision for credit losses2,757  2,056  1,583  1,518  1,541  
Noninterest income1,961  1,398  1,303  1,352  1,202  
Noninterest expense3,431  2,575  1,840  1,751  1,768  
Income before income taxes1,287  879  1,046  1,119  975  
Provision for income taxes224  153  218  234  177  
Net income1,063  726  828  885  798  
Noncontrolling interests   (1)  
Preferred stock dividends74  19  90  44  43  
Net income available to common shareholders986  702  735  842  749  
Per Common Share Data
Earnings per share-basic$0.73  $0.76  $0.96  $1.10  $0.98  
Earnings per share-diluted0.73  0.75  0.95  1.09  0.97  
Earnings per share-adjusted diluted (1)0.87  1.12  1.07  1.12  1.05  
Cash dividends declared0.450  0.450  0.450  0.405  0.405  
Common shareholders' equity45.49  45.66  38.07  37.40  36.26  
Tangible common shareholders' equity (1)26.00  25.93  24.66  23.93  22.78  
End of period shares outstanding1,347,461  1,342,166  766,303  766,010  765,920  
Weighted average shares outstanding-basic1,344,372  922,840  766,167  765,958  764,135  
Weighted average shares outstanding-diluted1,357,545  934,718  775,791  774,603  774,071  
Performance Ratios
Return on average assets0.90 %0.95 %1.41 %1.55 %1.43 %
Return on average risk-weighted assets (current quarter is preliminary)1.11  1.02  1.75  1.92  1.78  
Return on average common shareholders' equity6.58  7.33  10.04  11.98  11.08  
Return on average tangible common shareholders' equity (1)13.23  12.91  16.03  19.45  18.36  
Net interest margin - taxable equivalent3.58  3.41  3.37  3.42  3.51  
Fee income ratio34.9  38.6  43.4  44.4  41.5  
Efficiency ratio-GAAP61.1  71.0  61.3  57.6  61.0  
Efficiency ratio-adjusted (1)53.4  57.5  57.1  55.1  56.6  
Credit Quality
Nonperforming assets as a percentage of:
Assets0.23 %0.14 %0.22 %0.23 %0.26 %
Loans and leases plus foreclosed property0.36  0.19  0.34  0.34  0.39  
Net charge-offs as a percentage of average loans and leases 0.36  0.40  0.41  0.38  0.40  
Allowance for loan and lease losses as a percentage of loans and leases held for investment1.63  0.52  1.05  1.05  1.05  
Ratio of allowance for loan and lease losses to nonperforming loans and leases held for investment5.04x3.41x3.52x3.46x2.97x
Average Balances
Assets$477,550  $302,059  $232,420  $229,249  $225,573  
Securities (2)75,701  60,699  48,900  46,115  46,734  
Loans and leases 307,748  193,641  152,042  151,557  148,790  
Deposits334,649  210,716  161,992  159,891  160,045  
Common shareholders' equity60,224  38,031  29,040  28,188  27,432  
Total shareholders' equity65,412  41,740  32,744  31,301  30,541  
Period-End Balances
Assets$506,229  $473,078  $236,750  $230,872  $227,683  
Securities (2)78,398  74,727  54,765  45,289  46,410  
Loans and leases 324,039  308,215  150,855  153,823  149,891  
Deposits350,179  334,727  162,280  159,521  159,766  
Common shareholders' equity61,295  61,282  29,177  28,650  27,770  
Total shareholders' equity66,061  66,558  32,303  31,764  30,883  
Capital Ratios (current quarter is preliminary)
Risk-based:
Common equity Tier 19.3 %9.5 %10.6 %10.4 %10.3 %
Tier 110.5  10.8  12.2  12.0  12.0  
Total12.6  12.6  14.8  14.2  14.2  
Leverage (3)9.0  14.7  10.3  10.2  10.1  
Supplementary leverage (4)7.8  7.9  NA  NA  NA  
Applicable ratios are annualized.
(1) Represents a non-GAAP measure. See the calculations and management's reasons for using these measures in the Non-GAAP Reconciliations and Preliminary Capital Information - Five Quarter Trend sections of this supplement.
(2) Includes AFS and HTM securities. Average balances reflect both AFS and HTM securities at amortized cost. Period-end balances reflect AFS securities at fair value and HTM securities at amortized cost. In 4Q19, Truist transferred all HTM securities into AFS securities in response to changes in regulatory capital rules.
(3) The leverage ratio is calculated using end of period Tier 1 capital and quarterly average tangible assets. The timing of the merger impacted the 4Q19 result.
(4) Truist became subject to the supplementary leverage ratio in 2020. The 4Q19 measure was an estimate based on a full quarter of average tangible assets.
Consolidated Statements of Income
 Quarter Ended
 March 31Change
(Dollars in millions, except per share data, shares in thousands)20202019$%
Interest Income
Interest and fees on loans and leases$3,776  $1,839  $1,937  105.3 %
Interest on securities494  302  192  63.6  
Interest on other earning assets156  32  124  NM  
Total interest income4,426  2,173  2,253  103.7  
Interest Expense
Interest on deposits421  253  168  66.4  
Interest on long-term debt272  192  80  41.7  
Interest on other borrowings83  32  51  159.4  
Total interest expense776  477  299  62.7  
Net Interest Income3,650  1,696  1,954  115.2  
Provision for credit losses893  155  738  NM  
Net Interest Income After Provision for Credit Losses2,757  1,541  1,216  78.9  
Noninterest Income
Insurance income549  510  39  7.6  
Service charges on deposits305  171  134  78.4  
Wealth management income332  162  170  104.9  
Card and payment related fees187  128  59  46.1  
Residential mortgage income245  49  196  NM  
Investment banking and trading income118  27  91  NM  
Operating lease income77  35  42  120.0  
Income from bank-owned life insurance44  28  16  57.1  
Lending related fees67  25  42  168.0  
Commercial real estate related income44  14  30  NM  
Securities gains (losses)(2) —  (2) NM  
Other income(5) 53  (58) (109.4) 
Total noninterest income1,961  1,202  759  63.1  
Noninterest Expense
Personnel expense1,972  1,087  885  81.4  
Net occupancy expense221  122  99  81.1  
Professional fees and outside processing247  86  161  187.2  
Software expense210  72  138  191.7  
Equipment expense116  65  51  78.5  
Marketing and customer development84  27  57  NM  
Operating lease depreciation71  29  42  144.8  
Loan-related expense62  25  37  148.0  
Amortization of intangibles165  32  133  NM  
Regulatory costs29  18  11  61.1  
Merger-related and restructuring charges107  80  27  33.8  
Other expense147  125  22  17.6  
Total noninterest expense3,431  1,768  1,663  94.1  
Earnings
Income before income taxes1,287  975  312  32.0  
Provision for income taxes224  177  47  26.6  
Net income1,063  798  265  33.2  
Noncontrolling interests  (3) (50.0) 
Preferred stock dividends74  43  31  72.1  
Net income available to common shareholders$986  $749  $237  31.6 %
Earnings Per Common Share
Basic$0.73  $0.98  $(0.25) (25.5)%
Diluted0.73  0.97  (0.24) (24.7) 
Weighted Average Shares Outstanding
Basic1,344,372  764,135  580,237  75.9  
Diluted1,357,545  774,071  583,474  75.4  
NM - not meaningful

Truist Financial Corporation 2


Consolidated Statements of Income - Five Quarter Trend   
Quarter Ended
March 31Dec. 31Sept. 30June 30March 31
(Dollars in millions, except per share data, shares in thousands)20202019201920192019
Interest Income
Interest and fees on loans and leases$3,776  $2,371  $1,886  $1,886  $1,839  
Interest on securities494  402  315  300  302  
Interest on other earning assets156  39  17  20  32  
Total interest income4,426  2,812  2,218  2,206  2,173  
Interest Expense
Interest on deposits421  304  271  273  253  
Interest on long-term debt272  219  193  193  192  
Interest on other borrowings83  62  54  50  32  
Total interest expense776  585  518  516  477  
Net Interest Income3,650  2,227  1,700  1,690  1,696  
Provision for credit losses893  171  117  172  155  
Net Interest Income After Provision for Credit Losses2,757  2,056  1,583  1,518  1,541  
Noninterest Income
Insurance income549  509  487  566  510  
Service charges on deposits305  222  188  181  171  
Wealth management income332  206  175  172  162  
Card and payment related fees187  156  132  139  128  
Residential mortgage income245  65  80  91  49  
Investment banking and trading income118  109  60  48  27  
Operating lease income77  47  36  35  35  
Income from bank-owned life insurance44  38  29  34  28  
Lending related fees67  47  24  28  25  
Commercial real estate related income44  48  32  22  14  
Securities gains (losses)(2) (116) —  —  —  
Other income(5) 67  60  36  53  
Total noninterest income1,961  1,398  1,303  1,352  1,202  
Noninterest Expense
Personnel expense1,972  1,465  1,161  1,120  1,087  
Net occupancy expense221  147  122  116  122  
Professional fees and outside processing247  161  102  84  86  
Software expense210  118  77  71  72  
Equipment expense116  83  64  68  65  
Marketing and customer development84  45  36  29  27  
Operating lease depreciation71  43  35  29  29  
Loan-related expense62  42  26  30  25  
Amortization of intangibles165  71  29  32  32  
Regulatory costs29  24  20  19  18  
Merger-related and restructuring charges107  223  34  23  80  
Other expense147  153  134  130  125  
Total noninterest expense3,431  2,575  1,840  1,751  1,768  
Earnings
Income before income taxes1,287  879  1,046  1,119  975  
Provision for income taxes224  153  218  234  177  
Net income1,063  726  828  885  798  
Noncontrolling interests   (1)  
Preferred stock dividends74  19  90  44  43  
Net income available to common shareholders$986  $702  $735  $842  $749  
Earnings Per Common Share
Basic$0.73  $0.76  $0.96  $1.10  $0.98  
Diluted0.73  0.75  0.95  1.09  0.97  
Weighted Average Shares Outstanding
Basic1,344,372  922,840  766,167  765,958  764,135  
Diluted1,357,545  934,718  775,791  774,603  774,071  

 
4 Truist Financial Corporation


Segment Financial Performance - Preliminary   
 Quarter Ended
March 31Dec. 31Sept. 30June 30March 31
(Dollars in millions)20202019201920192019
Consumer Banking and Wealth
Net interest income (expense)$1,860  $1,114  $855  $835  $828  
Net intersegment interest income (expense) 388  278  225  210  193  
Segment net interest income2,248  1,392  1,080  1,045  1,021  
Allocated provision for credit losses437  145  115  123  131  
Noninterest income1,072  646  574  580  507  
Noninterest expense1,993  1,319  930  899  882  
Income (loss) before income taxes890  574  609  603  515  
Provision (benefit) for income taxes209  139  147  146  125  
Segment net income (loss)$681  $435  $462  $457  $390  
Corporate and Commercial Banking
Net interest income (expense)$1,534  $934  $729  $751  $739  
Net intersegment interest income (expense) (194) (95) (85) (109) (105) 
Segment net interest income1,340  839  644  642  634  
Allocated provision for credit losses399  17  14  51  20  
Noninterest income460  419  277  251  244  
Noninterest expense886  575  342  325  315  
Income (loss) before income taxes515  666  565  517  543  
Provision (benefit) for income taxes92  144  119  107  113  
Segment net income (loss)$423  $522  $446  $410  $430  
Insurance Holdings
Net interest income (expense)$36  $38  $39  $35  $34  
Net intersegment interest income (expense) (11) (11) (11) (10) (11) 
Segment net interest income25  27  28  25  23  
Allocated provision for credit losses     
Noninterest income557  536  491  570  515  
Noninterest expense440  481  435  444  417  
Income (loss) before income taxes141  80  82  149  118  
Provision (benefit) for income taxes36  21  21  38  30  
Segment net income (loss)$105  $59  $61  $111  $88  
Other, Treasury & Corporate (1)
Net interest income (expense)$220  $141  $77  $69  $95  
Net intersegment interest income (expense) (183) (172) (129) (91) (77) 
Segment net interest income37  (31) (52) (22) 18  
Allocated provision for credit losses56   (14) (4)  
Noninterest income(128) (203) (39) (49) (64) 
Noninterest expense112  200  133  83  154  
Income (loss) before income taxes(259) (441) (210) (150) (201) 
Provision (benefit) for income taxes(113) (151) (69) (57) (91) 
Segment net income (loss)$(146) $(290) $(141) $(93) $(110) 
Total Truist Financial Corporation
Net interest income (expense)$3,650  $2,227  $1,700  $1,690  $1,696  
Net intersegment interest income (expense) —  —  —  —  —  
Segment net interest income3,650  2,227  1,700  1,690  1,696  
Allocated provision for credit losses893  171  117  172  155  
Noninterest income1,961  1,398  1,303  1,352  1,202  
Noninterest expense3,431  2,575  1,840  1,751  1,768  
Income (loss) before income taxes1,287  879  1,046  1,119  975  
Provision (benefit) for income taxes224  153  218  234  177  
Net income$1,063  $726  $828  $885  $798  
Effective December 2019, segments were realigned in connection with the SunTrust merger. Results for prior periods have been revised to reflect the new structure.
(1) Includes financial data from subsidiaries below the quantitative and qualitative thresholds requiring disclosure.

Truist Financial Corporation 5


Consolidated Ending Balance Sheets - Five Quarter Trend   
March 31Dec. 31Sept. 30June 30March 31
(Dollars in millions)20202019201920192019
Assets
Cash and due from banks$5,312  $4,084  $2,027  $1,831  $1,873  
Interest-bearing deposits with banks31,036  14,981  877  722  847  
Federal funds sold and securities purchased under resale agreements or similar arrangements1,796  1,417  114  148  252  
Trading assets3,863  5,733  400  1,429  1,524  
Securities available for sale at fair value78,398  74,727  35,997  25,802  26,315  
Securities held to maturity at amortized cost—  —  18,768  19,487  20,095  
Loans and leases:
Commercial:
Commercial and industrial149,161  130,180  64,324  63,693  61,978  
CRE27,532  26,832  17,080  16,976  16,718  
Commercial construction6,630  6,205  3,804  3,746  4,111  
Lease financing5,984  6,122  2,356  2,203  2,098  
Consumer:
Residential mortgage53,096  52,071  28,297  32,607  31,572  
Residential home equity and direct27,629  27,044  11,646  11,675  11,646  
Indirect auto25,146  24,442  11,871  11,756  11,506  
Indirect other10,980  11,100  6,590  6,453  6,017  
Student7,771  6,743  —  —  —  
Credit card5,300  5,619  3,058  3,056  2,970  
PCI—  3,484  387  421  441  
Total loans and leases held for investment319,229  299,842  149,413  152,586  149,057  
Loans held for sale4,810  8,373  1,442  1,237  834  
Total loans and leases324,039  308,215  150,855  153,823  149,891  
Allowance for loan and lease losses(5,211) (1,549) (1,573) (1,595) (1,561) 
Premises and equipment3,999  3,712  2,022  2,029  2,078  
Goodwill23,927  24,154  9,832  9,830  9,818  
Core deposit and other intangible assets3,168  3,142  678  712  726  
Mortgage servicing rights2,150  2,630  929  982  1,049  
Other assets33,752  31,832  15,824  15,672  14,776  
Total assets$506,229  $473,078  $236,750  $230,872  $227,683  
Liabilities
Deposits:
Noninterest-bearing deposits$97,618  $92,405  $52,667  $52,458  $53,021  
Interest checking92,950  85,492  27,723  28,021  28,028  
Money market and savings124,072  120,934  64,454  63,972  63,739  
Time deposits35,539  35,896  16,526  15,070  14,978  
Foreign office deposits - interest-bearing—  —  910  —  —  
Total deposits350,179  334,727  162,280  159,521  159,766  
Short-term borrowings12,696  18,218  10,405  10,344  6,305  
Long-term debt65,662  41,339  25,520  22,640  24,729  
Other liabilities11,631  12,236  6,242  6,603  6,000  
Total liabilities440,168  406,520  204,447  199,108  196,800  
Shareholders' Equity:
Preferred stock4,599  5,102  3,057  3,053  3,053  
Common stock6,737  6,711  3,832  3,830  3,830  
Additional paid-in capital 35,584  35,609  6,931  6,889  6,843  
Retained earnings18,076  19,806  19,440  19,050  18,518  
Accumulated other comprehensive loss898  (844) (1,026) (1,119) (1,421) 
Noncontrolling interests167  174  69  61  60  
Total shareholders' equity66,061  66,558  32,303  31,764  30,883  
Total liabilities and shareholders' equity$506,229  $473,078  $236,750  $230,872  $227,683  
In 4Q19, Truist transferred all HTM securities into AFS securities in response to changes in regulatory capital rules.   


6 Truist Financial Corporation


Average Balance Sheets 
 Quarter Ended
 March 31Change
(Dollars in millions)20202019$%
Assets    
Securities at amortized cost (1):
U.S. Treasury$2,274  $3,302  $(1,028) (31.1)%
U.S. government-sponsored entities (GSE)1,856  2,418  (562) (23.2) 
Mortgage-backed securities issued by GSE70,816  40,044  30,772  76.8  
States and political subdivisions530  620  (90) (14.5) 
Non-agency mortgage-backed185  315  (130) (41.3) 
Other40  35   14.3  
Total securities75,701  46,734  28,967  62.0  
Loans and leases:
Commercial:
Commercial and industrial131,743  61,370  70,373  114.7  
CRE27,046  16,786  10,260  61.1  
Commercial construction6,409  4,119  2,290  55.6  
Lease financing6,070  2,021  4,049  NM  
Consumer:
Residential mortgage52,993  31,370  21,623  68.9  
Residential home equity and direct27,564  11,681  15,883  136.0  
Indirect auto24,975  11,308  13,667  120.9  
Indirect other10,950  6,029  4,921  81.6  
Student7,787  —  7,787  NM  
Credit card5,534  2,922  2,612  89.4  
PCI—  455  (455) (100.0) 
Total loans and leases held for investment301,071  148,061  153,010  103.3  
Loans held for sale6,677  729  5,948  NM  
Total loans and leases307,748  148,790  158,958  106.8  
Interest earning trading assets6,334  602  5,732  NM  
Other earning assets23,750  1,595  22,155  NM  
Total earning assets413,533  197,721  215,812  109.1  
Nonearning assets64,017  27,852  36,165  129.8  
Total assets$477,550  $225,573  $251,977  111.7 %
Liabilities and Shareholders' Equity
Deposits:
Noninterest-bearing deposits$93,135  $52,283  $40,852  78.1 %
Interest checking85,008  27,622  57,386  NM  
Money market and savings120,936  63,325  57,611  91.0  
Time deposits35,570  16,393  19,177  117.0  
Foreign office deposits - interest-bearing—  422  (422) (100.0) 
Total deposits334,649  160,045  174,604  109.1  
Short-term borrowings18,900  5,624  13,276  NM  
Long-term debt46,547  23,247  23,300  100.2  
Other liabilities12,042  6,116  5,926  96.9  
Total liabilities412,138  195,032  217,106  111.3  
Shareholders' equity65,412  30,541  34,871  114.2  
Total liabilities and shareholders' equity$477,550  $225,573  $251,977  111.7 %
Average balances exclude basis adjustments for fair value hedges.
(1) Includes AFS and HTM securities. 
NM - not meaningful  


Truist Financial Corporation 7


Average Balance Sheets - Five Quarter Trend   
 Quarter Ended
 March 31Dec. 31Sept. 30June 30March 31
(Dollars in millions)20202019201920192019
Assets     
Securities at amortized cost (1):     
U.S. Treasury$2,274  $2,384  $2,240  $2,662  $3,302  
U.S. government-sponsored entities (GSE)1,856  2,301  2,449  2,440  2,418  
Mortgage-backed securities issued by GSE70,816  55,119  43,415  40,112  40,044  
States and political subdivisions530  598  566  566  620  
Non-agency mortgage-backed185  263  198  302  315  
Other40  34  32  33  35  
Total securities75,701  60,699  48,900  46,115  46,734  
Loans and leases:
Commercial:
Commercial and industrial131,743  81,853  63,768  62,563  61,370  
CRE27,046  19,896  17,042  16,854  16,786  
Commercial construction6,409  4,506  3,725  3,894  4,119  
Lease financing6,070  3,357  2,260  2,122  2,021  
Consumer:
Residential mortgage52,993  34,824  28,410  32,066  31,370  
Residential home equity and direct27,564  15,810  11,650  11,687  11,681  
Indirect auto24,975  15,390  11,810  11,633  11,308  
Indirect other10,950  7,772  6,552  6,246  6,029  
Student7,787  1,825  —  —  —  
Credit card5,534  3,788  3,036  2,970  2,922  
PCI—  1,220  411  432  455  
Total loans and leases held for investment301,071  190,241  148,664  150,467  148,061  
Loans held for sale6,677  3,400  3,378  1,090  729  
Total loans and leases307,748  193,641  152,042  151,557  148,790  
Interest earning trading assets6,334  2,370  668  1,456  602  
Other earning assets23,750  6,405  1,798  1,711  1,595  
Total earning assets413,533  263,115  203,408  200,839  197,721  
Nonearning assets64,017  38,944  29,012  28,410  27,852  
Total assets$477,550  $302,059  $232,420  $229,249  $225,573  
Liabilities and Shareholders' Equity
Deposits:
Noninterest-bearing deposits$93,135  $64,485  $52,500  $52,680  $52,283  
Interest checking85,008  43,246  27,664  27,708  27,622  
Money market and savings120,936  79,903  64,920  63,394  63,325  
Time deposits35,570  23,058  16,643  15,730  16,393  
Foreign office deposits - interest-bearing—  24  265  379  422  
Total deposits334,649  210,716  161,992  159,891  160,045  
Short-term borrowings18,900  11,489  8,307  8,367  5,624  
Long-term debt46,547  29,888  22,608  23,233  23,247  
Other liabilities12,042  8,226  6,769  6,457  6,116  
Total liabilities412,138  260,319  199,676  197,948  195,032  
Shareholders' equity65,412  41,740  32,744  31,301  30,541  
Total liabilities and shareholders' equity$477,550  $302,059  $232,420  $229,249  $225,573  
Average balances exclude basis adjustments for fair value hedges.
(1) Includes AFS and HTM securities. 


8 Truist Financial Corporation


Average Balances and Rates - Quarters   
 Quarter Ended
 March 31, 2020December 31, 2019
 (1) (2) Interest(2) (1) (2) Interest(2) 
 AverageIncome/Yields/AverageIncome/Yields/
(Dollars in millions)BalancesExpenseRatesBalancesExpenseRates
Assets      
Securities at amortized cost (3):
U.S. Treasury$2,274  $11  1.93 %$2,384  $12  1.97 %
U.S. government-sponsored entities (GSE)1,856  10  2.33  2,301  12  2.28  
Mortgage-backed securities issued by GSE70,816  461  2.60  55,119  366  2.64  
States and political subdivisions530   3.56  598   3.38  
Non-agency mortgage-backed185   16.72  263   13.15  
Other40  —  3.01  34  —  3.53  
Total securities75,701  495  2.62  60,699  403  2.65  
Loans and leases:
Commercial:
Commercial and industrial131,743  1,419  4.33  81,853  862  4.18  
CRE27,046  287  4.25  19,896  223  4.43  
Commercial construction6,409  76  4.87  4,506  57  5.17  
Lease financing6,070  65  4.27  3,357  32  3.79  
Consumer:
Residential mortgage52,993  594  4.48  34,824  361  4.15  
Residential home equity and direct27,564  452  6.60  15,810  242  6.04  
Indirect auto24,975  428  6.89  15,390  312  8.04  
Indirect other10,950  201  7.37  7,772  133  6.77  
Student7,787  104  5.38  1,825  24  5.20  
Credit card5,534  133  9.68  3,788  85  9.06  
PCI—  —  —  1,220  33  10.63  
Total loans and leases held for investment301,071  3,759  5.02  190,241  2,364  4.94  
Loans held for sale6,677  53  3.14  3,400  31  3.52  
Total loans and leases307,748  3,812  4.98  193,641  2,395  4.91  
Interest earning trading assets6,334  64  4.04  2,370  11  1.84  
Other earning assets23,750  92  1.55  6,405  28  1.78  
Total earning assets413,533  4,463  4.33  263,115  2,837  4.29  
Nonearning assets64,017  38,944  
Total assets$477,550  $302,059  
Liabilities and Shareholders' Equity
Interest-bearing deposits:          
Interest checking$85,008  129  0.61  $43,246  65  0.60  
Money market and savings120,936  178  0.59  79,903  152  0.76  
Time deposits35,570  114  1.29  23,058  87  1.48  
Foreign office deposits - interest-bearing—  —  —  24  —  2.19  
Total interest-bearing deposits (4)241,514  421  0.70  146,231  304  0.82  
Short-term borrowings18,900  83  1.76  11,489  62  2.15  
Long-term debt46,547  272  2.34  29,888  219  2.92  
Total interest-bearing liabilities306,961  776  1.02  187,608  585  1.24  
Noninterest-bearing deposits (4)93,135  64,485  
Other liabilities12,042  8,226  
Shareholders' equity65,412  41,740  
Total liabilities and shareholders' equity$477,550  $302,059  
Average interest-rate spread3.31  3.05  
Net interest income/ net interest margin $3,687  3.58 %$2,252  3.41 %
Taxable-equivalent adjustment$37  $25  
Applicable ratios are annualized.
(1) Excludes basis adjustments for fair value hedges. 
(2) Amounts are on a taxable-equivalent basis utilizing the federal income tax rate of 21% for the periods presented. 
(3) Includes AFS and HTM securities. 
(4) Total deposit costs were 0.51% and 0.57% for the three months ended March 31, 2020 and December 31, 2019, respectively. 


Truist Financial Corporation 9


Average Balances and Rates - Quarters
 Quarter Ended
 September 30, 2019June 30, 2019March 31, 2019
 (1) (2) Interest(2) (1) (2) Interest(2) (1) (2) Interest(2) 
 AverageIncome/Yields/AverageIncome/Yields/AverageIncome/Yields/
(Dollars in millions)BalancesExpenseRatesBalancesExpenseRatesBalancesExpenseRates
Assets         
Securities at amortized cost (3):
U.S. Treasury$2,240  $11  2.04 %$2,662  $14  2.04 %$3,302  $16  2.01 %
U.S. government-sponsored entities (GSE)2,449  14  2.25  2,440  13  2.25  2,418  14  2.24  
Mortgage-backed securities issued by GSE43,415  279  2.57  40,112  258  2.57  40,044  258  2.58  
States and political subdivisions566   3.44  566   4.37  620   3.73  
Non-agency mortgage-backed198   18.77  302  10  13.28  315  10  12.51  
Other32  —  3.67  33   3.85  35  —  3.96  
Total securities48,900  318  2.60  46,115  302  2.62  46,734  304  2.60  
Loans and leases:
Commercial:
Commercial and industrial63,768  671  4.18  62,563  679  4.35  61,370  656  4.33  
CRE17,042  209  4.83  16,854  210  4.97  16,786  207  4.99  
Commercial construction3,725  47  5.11  3,894  50  5.32  4,119  54  5.33  
Lease financing2,260  18  3.17  2,122  17  3.29  2,021  17  3.33  
Consumer:
Residential mortgage28,410  285  4.02  32,066  321  4.00  31,370  324  4.13  
Residential home equity and direct11,650  173  5.92  11,687  173  5.97  11,681  171  5.92  
Indirect auto11,810  262  8.84  11,633  254  8.71  11,308  240  8.62  
Indirect other6,552  110  6.61  6,246  102  6.63  6,029  98  6.57  
Student—  —  —  —  —  —  —  —  —  
Credit card3,036  71  9.18  2,970  67  8.94  2,922  65  9.03  
PCI411  25  24.23  432  24  21.63  455  20  17.99  
Total loans and leases held for investment148,664  1,871  5.00  150,467  1,897  5.05  148,061  1,852  5.06  
Loans held for sale3,378  35  4.16  1,090  11  4.17  729   4.38  
Total loans and leases152,042  1,906  4.98  151,557  1,908  5.05  148,790  1,860  5.06  
Interest earning trading assets668   2.02  1,456   2.25  602   2.27  
Other earning assets1,798  14  2.92  1,711  12  2.88  1,595  29  7.43  
Total earning assets203,408  2,241  4.38  200,839  2,230  4.45  197,721  2,197  4.49  
Nonearning assets29,012  28,410  27,852  
Total assets$232,420  $229,249  $225,573  
Liabilities and Shareholders' Equity                
Interest-bearing deposits:
Interest checking$27,664  47  0.67  $27,708  45  0.65  $27,622  40  0.59  
Money market and savings64,920  156  0.95  63,394  163  1.03  63,325  150  0.96  
Time deposits16,643  67  1.62  15,730  63  1.58  16,393  60  1.50  
Foreign office deposits - interest-bearing265   2.13  379   2.43  422   2.43  
Total interest-bearing deposits (4)109,492  271  0.99  107,211  273  1.02  107,762  253  0.95  
Short-term borrowings8,307  54  2.55  8,367  50  2.40  5,624  32  2.32  
Long-term debt22,608  193  3.42  23,233  193  3.33  23,247  192  3.30  
Total interest-bearing liabilities140,407  518  1.47  138,811  516  1.49  136,633  477  1.41  
Noninterest-bearing deposits (4)52,500  52,680  52,283  
Other liabilities6,769  6,457  6,116  
Shareholders' equity32,744  31,301  30,541  
Total liabilities and shareholders' equity$232,420  $229,249  $225,573  
Average interest-rate spread2.91  2.96  3.08  
Net interest income/ net interest margin $1,723  3.37 %$1,714  3.42 %$1,720  3.51 %
Taxable-equivalent adjustment$23  $24  $24  
Applicable ratios are annualized.
(1) Excludes basis adjustments for fair value hedges. 
(2) Amounts are on a taxable-equivalent basis utilizing the federal income tax rate of 21% for the periods presented. 
(3) Includes AFS and HTM securities. 
(4) Total deposit costs were 0.67%, 0.68% and 0.64% for the three months ended September 30, 2019, June 30, 2019 and March 31, 2019, respectively. 


10 Truist Financial Corporation


Credit Quality   
 March 31Dec. 31Sept. 30June 30March 31
(Dollars in millions)20202019201920192019
Nonperforming Assets     
Nonaccrual loans and leases:     
Commercial:     
Commercial and industrial$443  $212  $172  $193  $196  
CRE18  10  27  31  73  
Commercial construction —     
Lease financing27      
Consumer:
Residential mortgage248  55  106  104  121  
Residential home equity and direct170  67  56  54  53  
Indirect auto125  100  81  74  79  
Indirect other     
Total nonaccrual loans and leases held for investment1,034  454  447  461  526  
Loans held for sale41  107  —  —  —  
Total nonaccrual loans and leases1,075  561  447  461  526  
Foreclosed real estate63  82  33  36  33  
Other foreclosed property39  41  29  26  25  
Total nonperforming assets$1,177  $684  $509  $523  $584  
Troubled Debt Restructurings (TDRs)     
Performing TDRs:
Commercial:     
Commercial and industrial$65  $47  $69  $84  $63  
CRE     
Commercial construction36  37     
Lease financing —  —  —  —  
Consumer:
Residential mortgage513  470  570  581  669  
Residential home equity and direct66  51  54  53  54  
Indirect auto350  333  324  311  302  
Indirect other     
Student —  —  —  —  
Credit card35  31  29  29  29  
Total performing TDRs1,079  980  1,057  1,070  1,130  
Nonperforming TDRs121  82  115  135  178  
Total TDRs$1,200  $1,062  $1,172  $1,205  $1,308  
Loans 90 Days or More Past Due and Still Accruing
Commercial:
Commercial and industrial$ $ $—  $—  $—  
CRE —  —  —  —  
Consumer:
Residential mortgage$610  $543  $347  $350  $377  
Residential home equity and direct10    11   
Indirect auto11  11     
Indirect other  —  —  —  
Student1,068  188  —  —  —  
Credit card41  22  15  13  13  
PCI—  1,218  24  26  28  
Total loans 90 days past due and still accruing$1,748  $1,994  $403  $407  $431  
Loans 30-89 Days Past Due
Commercial:
Commercial and industrial$262  $94  $34  $32  $36  
CRE     
Commercial construction16   —  —  —  
Lease financing     
Consumer:
Residential mortgage679  498  432  480  478  
Residential home equity and direct156  122  56  60  69  
Indirect auto521  560  380  354  281  
Indirect other74  85  43  39  35  
Student593  650  —  —  —  
Credit card57  56  29  26  25  
PCI—  140  16  17  18  
Total loans 30-89 days past due $2,374  $2,213  $992  $1,016  $948  

Truist Financial Corporation 11


As of/For the Quarter Ended
 March 31Dec. 31Sept. 30June 30March 31
(Dollars in millions)20202019201920192019
Allowance for Credit Losses     
Beginning balance$1,889  $1,653  $1,689  $1,659  $1,651  
CECL adoption - impact to retained earnings2,762  —  —  —  —  
CECL adoption - reserves on PCD assets378  —  —  —  —  
Provision for credit losses893  171  117  172  155  
Charge-offs:
Commercial:
Commercial and industrial(39) (23) (28) (22) (17) 
CRE(1) (5) (2) (18) (8) 
Commercial construction(3) —  —  —  —  
Lease financing(2) (9) (1) —  (1) 
Consumer:
Residential mortgage(11) (8) (3) (5) (5) 
Residential home equity and direct(68) (25) (24) (24) (20) 
Indirect auto(142) (107) (92) (79) (92) 
Indirect other(18) (19) (14) (12) (17) 
Student(8) —  —  —  —  
Credit card(53) (37) (25) (23) (24) 
Total charge-offs(345) (233) (189) (183) (184) 
Recoveries:               
Commercial:               
Commercial and industrial17      
CRE—  —    —  
Commercial construction  —    
Lease financing—  —   —  —  
Consumer:
Residential mortgage  —  —   
Residential home equity and direct15  10     
Indirect auto23  13  12  14  13  
Indirect other     
Credit card     
Total recoveries73  41  36  41  37  
Net charge-offs(272) (192) (153) (142) (147) 
Merger related items and other(39) 257  —  —  —  
Ending balance$5,611  $1,889  $1,653  $1,689  $1,659  
Allowance for Credit Losses:     
Allowance for loan and lease losses (excluding PCD / PCI loans)$4,880  $1,541  $1,565  $1,587  $1,552  
Allowance for PCD / PCI loans331      
Reserve for unfunded lending commitments (RUFC)400  340  80  94  98  
Total$5,611  $1,889  $1,653  $1,689  $1,659  

As of/For the Quarter Ended
 March 31Dec. 31Sept. 30June 30March 31
 20202019201920192019
Asset Quality Ratios     
Loans 30-89 days past due and still accruing as a percentage of loans and leases0.74 %0.74 %0.66 %0.67 %0.64 %
Loans 90 days or more past due and still accruing as a percentage of loans and leases0.55  0.66  0.27  0.27  0.29  
Nonperforming loans and leases as a percentage of loans and leases held for investment0.32  0.15  0.30  0.30  0.35  
Nonperforming loans and leases as a percentage of loans and leases (1)0.33  0.18  0.30  0.30  0.35  
Nonperforming assets as a percentage of:
Total assets (1)0.23  0.14  0.22  0.23  0.26  
Loans and leases plus foreclosed property0.36  0.19  0.34  0.34  0.39  
Net charge-offs as a percentage of average loans and leases0.36  0.40  0.41  0.38  0.40  
Allowance for loan and lease losses as a percentage of loans and leases1.63  0.52  1.05  1.05  1.05  
Ratio of allowance for loan and lease losses to:
Net charge-offs4.76X2.03X2.59X2.80X2.62X
Nonperforming loans and leases5.04X3.41X3.52X3.46X2.97X
Asset Quality Ratios (Excluding Government Guaranteed and PCI)
Loans 90 days or more past due and still accruing as a percentage of loans and leases0.04 %0.03 %0.04 %0.04 %0.04 %
Applicable ratios are annualized.
(1)Includes loans held for sale.

12 Truist Financial Corporation


 March 31, 2020
  Past Due 30-89Past Due 90+ 
(Dollars in millions)Current StatusDaysDaysTotal
Troubled Debt Restructurings
Performing TDRs: (1)      
Commercial:      
Commercial and industrial$64  98.5 %$ 1.5 %$—  — %$65  
CRE 100.0  —  —  —  —   
Commercial construction36  100.0  —  —  —  —  36  
Lease financing 100.0  —  —  —  —   
Consumer:
Residential mortgage272  53.0  87  17.0  154  30.0  513  
Residential home equity and direct64  97.0   3.0  —  —  66  
Indirect auto295  84.3  55  15.7  —  —  350  
Indirect other 100.0  —  —  —  —   
Student 100.0  —  —  —  —   
Credit card29  82.9   11.4   5.7  35  
Total performing TDRs (1)774  71.7  149  13.8  156  14.5  1,079  
Nonperforming TDRs (2)75  61.9   5.0  40  33.1  121  
Total TDRs (1)(2)$849  70.8 %$155  12.9 %$196  16.3 %$1,200  
(1)Past due performing TDRs are included in past due disclosures.
(2)Nonperforming TDRs are included in nonaccrual loan disclosures.
Quarter Ended
 March 31Dec. 31Sept. 30June 30March 31
 20202019201920192019
Net Charge-offs as a Percentage of Average Loans and Leases:     
Commercial:     
Commercial and industrial0.07 %0.09 %0.14 %0.09 %0.07 %
CRE0.01  0.09  —  0.41  0.18  
Commercial construction0.13  (0.09) (0.11) (0.19) (0.08) 
Lease financing0.05  1.03  0.11  0.03  0.10  
Consumer:
Residential mortgage0.07  0.09  0.04  0.06  0.05  
Residential home equity and direct0.78  0.39  0.60  0.57  0.47  
Indirect auto1.92  2.41  2.70  2.23  2.88  
Indirect other0.41  0.72  0.60  0.49  0.79  
Student0.38  (0.01) —  —  —  
Credit card3.30  3.32  2.59  2.50  2.58  
Total loans and leases0.36  0.40  0.41  0.38  0.40  
Applicable ratios are annualized.  
 
Credit Quality - Allowance Rollforward with Fair Value Marks
As of/For the Quarter Ended
March 31, 2020
(Dollars in millions)Loans and LeasesRUFCTotal
Beginning balance$1,549  $340  $1,889  
CECL adoption3,071  69  3,140  
Provision (benefit) for credit losses866  27  893  
Net charge offs(272) —  (272) 
Merger related items and other(3) (36) (39) 
Ending balance5,211  400  5,611  
Unamortized fair value mark (1)3,539  —  3,539  
Allowance plus unamortized fair value mark$8,750  $400  $9,150  
Loans and leases held for investment$319,229  
Unamortized fair value mark (1)3,539  
Gross loans and leases$322,768  
Allowance for loan and lease losses as a percentage of loans and leases - GAAP1.63 %
Allowance for loan and lease losses and unamortized fair value mark as a percentage of gross loans and leases - Adjusted (1) (2)2.71  
(1)Unamortized fair value mark includes credit, interest rate and liquidity components.
(2)Allowance for loan and lease losses and unamortized fair value mark as a percentage of gross loans and leases is a non-GAAP measurement of credit reserves that is calculated by adjusting the ALLL and loans and leases held for investment by the unamortized fair value mark. Truist's management uses this measure to assess credit reserves and believes investors may find this measure useful in their analysis of the Corporation.

Truist Financial Corporation 13


Rollforward of Intangible Assets and Selected Fair Value Marks (1)
 As of/For the Quarter Ended
March 31Dec. 31
(Dollars in millions)20202019
Loans and Leases (2)
Beginning balance unamortized fair value mark$(4,564) $(221) 
Additions - Merger with SunTrust—  (4,513) 
Accretion454  170  
CECL adoption - reserves on PCD assets378  —  
Adjustments and other additions193  —  
Ending balance$(3,539) $(4,564) 
Core deposit and other intangible assets
Beginning balance$3,142  $678  
Additions - Merger with SunTrust—  2,535  
Additions - other acquisitions31  —  
Amortization of intangibles(165) (71) 
Amortization in net occupancy expense(5) $—  
Adjustments165  $—  
Ending balance$3,168  $3,142  
Deposits (3)
Beginning balance unamortized fair value mark$(76) $—  
Additions - Merger with SunTrust—  (83) 
Amortization22   
Ending balance$(54) $(76) 
Long-Term Debt (3)
Beginning balance unamortized fair value mark$(312) $(10) 
Additions - Merger with SunTrust—  (309) 
Amortization27   
Ending balance$(285) $(312) 
(1)Includes the merger with SunTrust, as well as other acquisitions. This summary includes only selected information and does not represent all purchase accounting adjustments.
(2)Purchase accounting loan marks on loans and leases represents the total mark, including credit, interest and liquidity, and are recognized using level-yield method over the remaining life of the individual loans or recognized in full in the event of prepayment.
(3)Purchase accounting marks on liabilities represents interest rate marks on time deposits and long-term debt and are recognized using level-yield method over the term of the liability.
14 Truist Financial Corporation


Capital Information - Five Quarter Trend
 As of/For the Quarter Ended
 March 31Dec. 31Sept. 30June 30March 31
(Dollars in millions, except per share data, shares in thousands)20202019201920192019
Selected Capital Information(preliminary)    
Risk-based capital:     
Common equity tier 1$36,381  $35,643  $19,905  $19,435  $18,848  
Tier 140,978  40,743  22,960  22,486  21,899  
Total49,334  47,511  27,666  26,693  26,078  
Risk-weighted assets391,387  376,056  187,503  187,523  183,060  
Average quarterly tangible assets454,361  276,591  223,298  220,514  217,247  
Risk-based capital ratios:
Common equity tier 19.3 %9.5 %10.6 %10.4 %10.3 %
Tier 110.5  10.8  12.2  12.0  12.0  
Total12.6  12.6  14.8  14.2  14.2  
Leverage capital ratio (1)9.0  14.7  10.3  10.2  10.1  
Supplementary leverage (2)7.8  7.9  NA  NA  NA  
Equity as a percentage of total assets13.0  14.1  13.6  13.8  13.6  
Common equity per common share$45.49  $45.66  $38.07  $37.40  $36.26  
(1)The leverage ratio is calculated using end of period Tier 1 capital and quarterly average tangible assets. The timing of the merger impacted the 4Q19 result.
(2)Truist became subject to the supplementary leverage ratio in 2020. The 4Q19 measure was an estimate based on a full quarter of average tangible assets.
March 31Dec. 31Sept. 30June 30March 31
(Dollars in millions, except per share data, shares in thousands)20202019201920192019
Calculations of Tangible Common Equity and Related Measures: (1)
Total shareholders' equity$66,061  $66,558  $32,303  $31,764  $30,883  
Less:
Preferred stock4,599  5,102  3,057  3,053  3,053  
Noncontrolling interests167  174  69  61  60  
Intangible assets, net of deferred taxes26,263  26,482  10,281  10,317  10,326  
Tangible common equity$35,032  $34,800  $18,896  $18,333  $17,444  
Outstanding shares at end of period (in thousands)1,347,461  1,342,166  766,303  766,010  765,920  
Tangible Common Equity Per Common Share$26.00  $25.93  $24.66  $23.93  $22.78  
(1)Tangible common equity and related measures are non-GAAP measures that exclude the impact of intangible assets, net of deferred taxes, and their related amortization. These measures are useful for evaluating the performance of a business consistently, whether acquired or developed internally. Truist's management uses these measures to assess the quality of capital and returns relative to balance sheet risk and believes investors may find them useful in their analysis of the Corporation. These measures are not necessarily comparable to similar measures that may be presented by other companies.
Truist Financial Corporation 15


Selected Mortgage Banking Information & Additional Information
 As of/For the Quarter Ended
March 31Dec. 31Sept. 30June 30March 31
(Dollars in millions, except per share data)20202019201920192019
Residential Mortgage Income
Residential mortgage production revenue$206  $40  $50  $37  $20  
Residential mortgage servicing revenue169  78  64  62  61  
Realization of expected residential MSR cash flows(122) (59) (36) (38) (33) 
Residential mortgage income before MSR valuation253  59  78  61  48  
Income statement impact of mortgage servicing rights valuation:     
MSRs fair value increase (decrease) (503) 80  (79) (47) (51) 
MSRs hedge gains (losses) 495  (74) 81  77  52  
Net MSRs valuation(8)   30   
Total residential mortgage income$245  $65  $80  $91  $49  
Commercial Real Estate Related Income
Commercial mortgage production revenue$36  $44  $26  $20  $11  
Commercial mortgage servicing revenue19  13  10   10  
Realization of expected commercial MSR cash flows(11) (7) (7) (7) (7) 
Commercial real estate related income before MSR valuation44  50  29  22  14  
Income statement impact of mortgage servicing rights valuation:
MSRs fair value increase (decrease) (20)  —  (5) (3) 
MSRs hedge gains (losses) 20  (4)    
Net MSRs valuation—  (2)  —  —  
Commercial real estate related income$44  $48  $32  $22  $14  
Other Mortgage Banking Information
Residential mortgage loan originations$11,708  $7,523  $5,274  $4,735  $2,383  
Residential mortgage servicing portfolio (1):     
Loans serviced for others219,979  219,347  87,147  85,060  86,119  
Bank-owned loans serviced56,325  60,211  29,122  32,852  31,861  
Total servicing portfolio276,304  279,558  116,269  117,912  117,980  
Weighted-average coupon rate on mortgage loans serviced for others4.02 %4.04 %4.09 %4.07 %4.06 %
Weighted-average servicing fee on mortgage loans serviced for others0.313  0.310  0.280  0.279  0.278  
Additional Information
Fair value of derivatives, net3,276  1,687  641  489  158  
Common stock prices:
High56.68  56.92  53.85  51.76  52.45  
Low24.01  50.02  44.98  46.53  42.79  
End of period30.84  56.32  53.37  49.13  46.53  
Banking offices2,957  2,958  1,789  1,787  1,871  
ATMs4,408  4,426  2,376  2,376  2,503  
FTEs (2)56,504  40,691  34,723  34,771  35,334  
(1)Amounts reported are unpaid principal balance.
(2)FTEs represents an average for the quarter. The timing of the merger impacted the 4Q19 result.
16 Truist Financial Corporation


Selected Items (1)
 Favorable (Unfavorable)
(Dollars in millions)After-Tax at
DescriptionPre-TaxMarginal Rate
Selected Items
First Quarter 2020
Incremental operating expenses related to the merger ($44 million in personnel expense, $20 million in professional fees and outside processing, and $10 million in other expense)$(74) $(57) 
COVID-19 impact ($62 million in personnel expense, $4 million in card and payment related fees, $3 million in net occupancy expense, and $2 million in service charges on deposits)(71) (54) 
Fourth Quarter 2019
Incremental operating expenses related to the merger ($80 million in personnel expense, $12 million in professional fees and outside processing, and $9 million in other expense)$(101) $(79) 
Impact of mortgage portfolio sale ($25 million in provision for credit losses, offset by $22 in residential mortgage income, and a $2 million corporate advance write off included in loan-related expense)  
Third Quarter 2019
Incremental operating expenses related to the merger ($39 million in personnel expense, $12 million in professional fees and outside processing, and $1 million in other expense)$(52) $(40) 
Redemption of preferred shares(46) (46) 
Impact of mortgage portfolio sale ($16 million in provision for credit losses and $4 million in residential mortgage income)20  15  
Second Quarter 2019
Incremental operating expenses related to the merger ($4 million in personnel expense, and $5 million in professional fees and outside processing)$(9) $(7) 
First Quarter 2019
Incremental operating expenses related to the merger ($1 million in personnel expense, and $1 million in other expense)$(2) $(1) 
(1)Includes costs not classified as merger-related and restructuring charges that are excluded from adjusted disclosures.


Non-GAAP Reconciliations   
Quarter Ended
 March 31Dec. 31Sept. 30June 30March 31
(Dollars in millions)20202019201920192019
Efficiency Ratio (1)
Efficiency Ratio Numerator - Noninterest Expense - GAAP
$3,431  $2,575  $1,840  $1,751  $1,768  
Merger-related and restructuring charges, net(107) (223) (34) (23) (80) 
Incremental operating expense related to the merger(74) (101) (52) (9) (2) 
Amortization(165) (71) (29) (32) (32) 
Corporate advance write off—  (2) —  —  —  
COVID-19 impact(65) —  —  —  —  
Efficiency Ratio Numerator - Adjusted$3,020  $2,178  $1,725  $1,687  $1,654  
Efficiency Ratio Denominator - Revenue (2) - GAAP
$5,611  $3,625  $3,003  $3,042  $2,898  
Taxable equivalent adjustment37  25  23  24  24  
Securities (gains) losses, net 116  —  —  —  
Gain (loss) on loan portfolio sale—  22  (4) —  —  
COVID-19 impact —  —  —  —  
Efficiency Ratio Denominator - Adjusted$5,656  $3,788  $3,022  $3,066  $2,922  
Efficiency Ratio - GAAP61.1 %71.0 %61.3 %57.6 %61.0 %
Efficiency Ratio - Adjusted53.4  57.5  57.1  55.1  56.6  
(1)The adjusted efficiency ratio is non-GAAP in that it excludes securities gains (losses), amortization of intangible assets, merger-related and restructuring charges and other selected items. Truist's management uses this measure in their analysis of the Corporation's performance. Truist's management believes this measure provides a greater understanding of ongoing operations and enhances comparability of results with prior periods, as well as demonstrates the effects of significant gains and charges. These measures are not necessarily comparable to similar measures that may be presented by other companies.
(2)Revenue is defined as net interest income plus noninterest income.

Truist Financial Corporation 17


 Quarter Ended
 March 31Dec. 31Sept. 30June 30March 31
(Dollars in millions)20202019201920192019
Return on Average Tangible Common Shareholders' Equity (1)
Net income available to common shareholders$986  $702  $735  $842  $749  
Plus: Amortization of intangibles, net of tax126  57  22  24  25  
Tangible net income available to common shareholders$1,112  $759  $757  $866  $774  
Average common shareholders' equity$60,224  $38,031  $29,040  $28,188  $27,432  
Less: Average intangible assets, net of deferred taxes26,429  14,760  10,298  10,326  10,343  
Average tangible common shareholders' equity$33,795  $23,271  $18,742  $17,862  $17,089  
Return on average common shareholders' equity6.58 %7.33 %10.04 %11.98 %11.08 %
Return on average tangible common shareholders' equity13.23  12.91  16.03  19.45  18.36  
(1)Tangible common equity and related measures are non-GAAP measures that exclude the impact of intangible assets, net of deferred taxes, and their related amortization. These measures are useful for evaluating the performance of a business consistently, whether acquired or developed internally. Truist's management uses these measures to assess the quality of capital and returns relative to balance sheet risk and believes investors may find them useful in their analysis of the Corporation. These measures are not necessarily comparable to similar measures that may be presented by other companies.


 Quarter Ended
 March 31Dec. 31Sept. 30June 30March 31
(Dollars in millions, except per share data)20202019201920192019
Diluted EPS (1)
Net income available to common shareholders - GAAP
$986  $702  $735  $842  $749  
Merger-related and restructuring charges82  176  26  19  64  
Securities gains (losses) 90  —  —  —  
Incremental operating expenses related to the merger57  79  40    
Corporate advance write off—   —  —  —  
Gain (loss) on loan portfolio sale—  17  (3) —  —  
Redemption of preferred shares—  —  46  —  —  
Allowance release related to loan portfolio sale—  (19) (12) —  —  
COVID-19 impact54  —  —  —  —  
Net income available to common shareholders - adjusted$1,181  $1,046  $832  $868  $814  
Weighted average shares outstanding - diluted
1,357,545  934,718  775,791  774,603  774,071  
Diluted EPS - GAAP$0.73  $0.75  $0.95  $1.09  $0.97  
Diluted EPS - adjusted0.87  1.12  1.07  1.12  1.05  
(1)The adjusted diluted earnings per share is non-GAAP in that it excludes merger-related and restructuring charges and other selected items, net of tax. Truist's management uses this measure in their analysis of the Corporation's performance. Truist's management believes this measure provides a greater understanding of ongoing operations and enhances comparability of results with prior periods, as well as demonstrates the effects of significant gains and charges.
18 Truist Financial Corporation
First Quarter 2020 Earnings Conference Call Kelly King - Chairman & CEO Daryl Bible - CFO APRIL 20, 2020


Forward-Looking Statement This presentation contains “forward-looking statements” within the meaning of the Private Securities Litigation Reform Act of 1995, regarding the financial condition, results of operations, business plans and the future performance of Truist. Words such as “anticipates,” “believes,” “estimates,” “expects,” “forecasts,” “intends,” “plans,” “projects,” “may,” “will,” “should,” “would,” “could” and other similar expressions are intended to identify these forward-looking statements. Forward-looking statements are not based on historical facts but instead represent management’s expectations and assumptions regarding Truist’s business, the economy and other future conditions. Such statements involve inherent uncertainties, risks and changes in circumstances that are difficult to predict. As such, Truist’s actual results may differ materially from those contemplated by forward-looking statements. While there can be no assurance that any list of risks and uncertainties or risk factors is complete, important factors that could cause actual results to differ materially from those contemplated by forward-looking statements include the following, without limitation, as well as the risks and uncertainties more fully discussed under Item 1A-Risk Factors in our Annual Report on Form 10-K for the year ended December 31, 2019 and in Truist's subsequent filings with the Securities and Exchange Commission: = risks and uncertainties relating to the Merger, including the ability to successfully integrate the companies or to realize the anticipated benefits of = legislative, regulatory or accounting changes may adversely affect the businesses in which Truist is engaged; the Merger; = = evolving regulatory standards, including with respect to capital and liquidity requirements, and results of regulatory examinations, may adversely expenses relating to the Merger and integration of heritage BB&T and heritage SunTrust; affect Truist's financial condition and results of operations; = deposit attrition, client loss or revenue loss following completed mergers or acquisitions may be greater than anticipated; = accounting policies and processes require management to make estimates about matters that are uncertain; = changes in the interest rate environment, including the replacement of LIBOR as an interest rate benchmark, which could adversely affect = general economic or business conditions, either nationally or regionally, may be less favorable than expected, resulting in, among other things, Truist’s revenue and expenses, the value of assets and obligations, and the availability and cost of capital, cash flows, and liquidity; slower deposit or asset growth, a deterioration in credit quality or a reduced demand for credit, insurance or other services; = volatility in mortgage production and servicing revenues, and changes in carrying values of Truist’s servicing assets and mortgages held for sale = due to changes in interest rates; risk management measures and management oversight functions may not identify or address risks adequately; = = management’s ability to effectively manage credit risk; unfavorable resolution of legal proceedings or other claims or regulatory or other governmental investigations or inquiries could result in negative publicity, protests, fines, penalties, restrictions on Truist's operations or ability to expand its business or other negative consequences, all of = inability to access short-term funding or liquidity; which could cause reputational damage and adversely impact Truist's financial condition and results of operations; = loss of client deposits, which could increase Truist’s funding costs; = competitors of Truist may have greater financial resources or develop products that enable them to compete more successfully than Truist and may be subject to different regulatory standards than Truist; = changes in Truist’s credit ratings, which could increase the cost of funding or limit access to capital markets; = failure to maintain or enhance Truist’s competitive position with respect to technology, whether it fails to anticipate client expectations or because = additional capital and liquidity requirements that will result from the Merger; its technological developments fail to perform as desired or are not rolled out in a timely manner or for other reasons, may cause Truist to lose market share or incur additional expense; = regulatory matters, litigation or other legal actions, which may result in, among other things, costs, fines, penalties, restrictions on Truist’s business activities, reputational harm, or other adverse consequences; = fraud or misconduct by internal or external parties, which Truist may not be able to prevent, detect or mitigate; = risks related to originating and selling mortgages, including repurchase and indemnity demands from purchasers related to representations and = operational or communications systems, including systems used by vendors or other external parties, may fail or may be the subject of a breach warranties on loans sold, which could result in an increase in the amount of losses for loan repurchases; or cyber-attack that, if successful, could adversely impact Truist's financial condition and results of operations; = failure to execute on strategic or operational plans, including the ability to successfully complete and/or integrate mergers and acquisitions; = security risks, including denial of service attacks, hacking, social engineering attacks targeting Truist’s employees and clients, malware intrusion = risks relating to Truist’s role as a servicer of loans, including an increase in the scope or costs of the services Truist is required to perform without or data corruption attempts, and identity theft could result in the disclosure of confidential information, adversely affect Truist’s business or any corresponding increase in Truist’s servicing fee, or a breach of Truist’s obligations as servicer; reputation or create significant legal or financial exposure; = = negative public opinion, which could damage Truist’s reputation; the COVID-19 pandemic has disrupted the global economy, and continuation of current conditions could affect Truist’s capital and liquidity position, impair the ability of borrowers to repay outstanding loans and increase Truist's allowance for credit losses, impair the collateral values, = increased scrutiny regarding Truist’s consumer sales practices, training practices, incentive compensation design and governance; cause an outflow of deposits, result in lost revenue or additional expenses, result in goodwill impairment charges, and increase Truist’s cost of = capital; competition from new or existing competitors, including increased competition from products and services offered by non-bank financial technology companies, may reduce Truist’s client base, cause Truist to lower prices for its products and services in order to maintain market = natural or other disasters, including acts of terrorism and pandemics, could have an adverse effect on Truist, including a material disruption of share or otherwise adversely impact Truist’s businesses or results of operations; Truist's operations or the ability or willingness of clients to access Truist's products and services; = Truist’s ability to introduce new products and services in response to industry trends or developments in technology that achieve market = widespread system outages, caused by the failure of critical internal systems or critical services provided by third parties could adversely impact acceptance and regulatory approval; Truist's financial condition and results of operations; and = Truist’s success depends on the expertise of key personnel, and if these individuals leave or change their roles without effective replacements = depressed market values for Truist’s stock and adverse economic conditions sustained over a period of time may require a write down to Truist's operations and integration activities could be adversely impacted. This could be exacerbated as Truist continues to integrate the goodwill. management teams of heritage BB&T and heritage SunTrust, or if the organization is unable to hire and retain qualified personnel; Readers are cautioned not to place undue reliance on these forward-looking statements, which speak only as of the date they are made. Except to the extent required by applicable law or regulation, Truist undertakes no obligation to revise or update any forward-looking statements. 2


Non-GAAP Information This presentation contains financial information and performance measures determined by methods other than in accordance with accounting principles generally accepted in the United States of America ("GAAP"). Truist’s management uses these "non-GAAP" measures in their analysis of the Corporation's performance and the efficiency of its operations. Management believes these non-GAAP measures provide a greater understanding of ongoing operations, enhance comparability of results with prior periods and demonstrate the effects of significant items in the current period. The company believes a meaningful analysis of its financial performance requires an understanding of the factors underlying that performance. Truist’s management believes investors may find these non-GAAP financial measures useful. These disclosures should not be viewed as a substitute for financial measures determined in accordance with GAAP, nor are they necessarily comparable to non- GAAP performance measures that may be presented by other companies. Below is a listing of the types of non-GAAP measures used in this presentation: Adjusted Efficiency Ratio - The adjusted efficiency ratio is non-GAAP in that it excludes securities gains (losses), amortization of intangible assets, merger-related and restructuring charges and other selected items. Truist's management uses this measure in their analysis of the Corporation's performance. Truist's management believes this measure provides a greater understanding of ongoing operations and enhances comparability of results with prior periods, as well as demonstrates the effects of significant gains and charges. Tangible Common Equity and Related Measures - Tangible common equity and related measures are non-GAAP measures that exclude the impact of intangible assets, net of deferred taxes, and their related amortization. These measures are useful for evaluating the performance of a business consistently, whether acquired or developed internally. Truist's management uses these measures to assess the quality of capital and returns relative to balance sheet risk and believes investors may find them useful in their analysis of the Corporation. Core NIM - Core net interest margin is a non-GAAP measure that adjusts net interest margin to exclude the impact of purchase accounting. The purchase accounting marks and related amortization for a) securities acquired from the FDIC in the Colonial Bank acquisition and b) loans, deposits and long-term debt from SunTrust, Susquehanna, National Penn and Colonial Bank are excluded to approximate the yields paid by clients. Interest income for PCI loans adjusts the accretion, net of interest reversals, which approximates the interest received from the client. Truist's management believes the adjustments to the calculation of net interest margin for certain assets and liabilities acquired provide investors with useful information related to the performance of Truist's earning assets. Adjusted Diluted EPS - The adjusted diluted earnings per share is non-GAAP in that it excludes merger-related and restructuring charges and other selected items, net of tax. Truist's management uses this measure in their analysis of the Corporation's performance. Truist's management believes this measure provides a greater understanding of ongoing operations and enhances comparability of results with prior periods, as well as demonstrates the effects of significant gains and charges. Adjusted Operating Leverage - The adjusted operating leverage ratio is non-GAAP in that it excludes securities gains (losses), amortization of intangible assets, merger-related and restructuring charges and other selected items. Truist's management uses this measure in their analysis of the Corporation's performance. Truist's management believes this measure provides a greater understanding of ongoing operations and enhances comparability of results with prior periods, as well as demonstrates the effects of significant gains and charges. Performance Ratios - The adjusted performance ratios are non-GAAP in that they exclude merger-related and restructuring charges, selected items and, in the case of return on average tangible common shareholders' equity, amortization of intangible assets. Truist's management uses these measures in their analysis of the Corporation's performance. Truist's management believes these measures provide a greater understanding of ongoing operations and enhances comparability of results with prior periods, as well as demonstrates the effects of significant gains and charges. Insurance Holdings Adjusted EBITDA - EBITDA is a non-GAAP measurement of operating profitability that is calculated by adding back interest, taxes, depreciation and amortization to net income. Truist's management also adds back merger- related and restructuring charges, incremental operating expenses related to the merger and other selected items. Truist's management uses this measure in its analysis of the Corporation's Insurance Holdings segment. Truist's management believes this measure provides a greater understanding of ongoing operations and enhances comparability of results with prior periods, as well as demonstrates the effects of significant gains and charges. Allowance for loan and lease losses and unamortized fair value mark as a percentage of gross loans and leases - Allowance for loan and lease losses and unamortized fair value mark as a percentage of gross loans and leases is a non- GAAP measurement of credit reserves that is calculated by adjusting the ALLL and loans and leases held for investment by the unamortized fair value mark. Truist's management uses this measure to assess credit reserves and believes investors may find this measure useful in their analysis of the Corporation. Selected items affecting results are included on slide 8. 3


4


We Are Truist Financial Corporation 275+ combined years of serving our clients and communities 6th largest U.S. #2 weighted $506B commercial bank by assets average deposit assets and market value rank in Top 20 MSAs $324B loans $350B ~12 million households ~58,000 teammates deposits 5 6th largest U.S. commercial bank by assets and market value


Crisis Response In response to the COVID-19 pandemic, Truist acted swiftly to support our communities, clients and teammates Clients Teammates ▪ Providing payment relief assistance including ▪ Awarded $1,200 coronavirus relief bonus to Truist forbearance, deferrals, extensions and re-aging (together teammates making less than $100K/year (~78% of with other modification strategies) workforce) • 300K+ accommodations for consumer clients ▪ Enabled alternative work strategies by supplementing • 16K+ accommodations for wholesale clients network capacity and securing additional IT equipment and infrastructure (more than half of teammates working ▪ Enhanced automation capabilities for contact centers to remotely) accelerate response times ▪ Offered teammates additional support through paid time off, ▪ Temporarily waiving ATM surcharge fees work space flexibility, family care benefits, tutoring, ▪ Offering 5% cash back on qualifying card purchases for employee assistance program, bereavement and additional important basic needs onsite special pay rate of $6.25/hour or $50/day for ▪ Implemented multiple strategies to keep our branches teammates required to work in offices operational and clients safe, including lobby access by ▪ Truist Foundation contributed $4 for every $1 that Truist appointment and the extensive use of drive-thrus teammates donate to the One Team Fund (providing ▪ Created an online, automated process for the Paycheck financial hardship assistance for teammates in need) Protection Program (PPP) and began to accept applications during the first weekend of the program Communities • Authorized for 32K companies (1 million+ ▪ Announced and distributed $25 million of philanthropic 1 employees) contributions to support the basic needs of our communities • Average loan amount of $323,000 ▪ Donated $1 million each to the CDC Foundation and Johns • Expected funding of approximately $10 billion Hopkins Medicine ▪ Implemented financial relief program for our small ▪ Truist Foundation donated $3 million to local United Way business suppliers and tenants organizations ▪ Funded extensive line draws for commercial clients to help them fund liquidity and working capital needs 1 E-tran authorizations as of 4/17/2020 6


1Q20 Highlights Summary Income Statement ($ MM) 1Q20 Asset Quality and Capital 1Q20 Total taxable-equivalent revenue1 $5,648 Nonperforming assets as a % of total assets 0.23% Provision for credit losses 893 Net charge-offs as a % of average loans and leases 0.36% Income before income taxes 1,287 Common equity tier 1 capital ratio (CET1)4 9.3% Net income 1,063 Key Points Net income available to common shareholders 986 ▪ Reported adjusted EPS2 of $0.87 Adjusted net income available to common shareholders2,3 1,181 ▪ Taxable-equivalent net interest income of $3.7 billion was supported by earning asset growth and purchase accounting accretion GAAP / 2,3 1Q20 Performance Metrics Unadjusted Adjusted ▪ Asset quality metrics remain strong but pandemic-related uncertainty persists; significant increase in our provision reflects economic Diluted earnings per share $0.73 $0.87 deterioration and loan growth ▪ Fee income benefited from insurance seasonality, strong residential Return on average assets 0.90% 1.06% mortgage refinance activity and elevated wealth management income Return on average common equity 6.58% 7.88% • COVID-19 adversely impacted service charges, card fees and trading income (increased CVA reserves) Return on average tangible common equity2 13.23% 15.51% ▪ Proactively built liquidity in the early stages of the pandemic; capital and liquidity remain strong Efficiency ratio 61.1% 53.4% 1 Comprised of net interest income and noninterest income 2 See non-GAAP reconciliations in the attached appendix 3 Excludes merger-related and restructuring charges, incremental operating expenses related to the merger and other items noted on slide 8 4 Current quarter regulatory capital information is preliminary 7


Selected Items Affecting 1Q20 Results Item Pre-Tax After-Tax Diluted EPS Impact ($ MM, except per share impact) Merger-related and restructuring charges $(107) $(82) $(0.06) Incremental operating expenses related to the merger1 $(74) $(57) $(0.04) COVID-19 impact2 $(71) $(54) $(0.04) 1 Includes costs not classified as merger-related and restructuring charges that are also excluded from adjusted disclosures. Refer to the non-GAAP disclosures in the Appendix. 2 Includes $65MM of pre-tax expense and $6MM of pre-tax fee rebates associated with discretionary actions taken by management in response to the COVID-19 pandemic Refer to the Quarterly Performance Summary for a complete list of selected items 8


Loans & Leases 1Q20 Loans & Leases Held for Investment ($ MM) $400,000 6.00% 1Q20 Average 1Q20 End of 4Q19 End of 5.02% balance period period $124,622 Commercial: $124,269 $121,400 $200,000 4.00% Commercial and industrial $131,743 $149,161 $130,180 $171,268 $189,307 $169,339 CRE 27,046 27,532 26,832 Commercial construction 6,409 6,630 6,205 $— 2.00% 1Q20 Average 1Q20 End of 4Q19 End of Lease financing 6,070 5,984 6,122 balance period balance period balance Consumer: Commercial LHFI ($ MM) Consumer LHFI ($ MM) Residential mortgage 52,993 53,096 52,071 Loans HFI yield (%) Residential home equity and direct 27,564 27,629 27,044 Key Points Indirect auto 24,975 25,146 24,442 ▪ Period-end total loans held for investment increased $19.4 billion vs. 12/31/19 Indirect other 10,950 10,980 11,100 primarily due to an increase in C&I loans Student 7,787 7,771 6,743 • Net C&I line draws from 3/12/20 through 3/31/20 were approximately $17.6 billion and broad-based across industries Credit card 5,534 5,300 5,619 • Accompanied by growth in mortgage warehouse lending PCI — — 3,484 • Partly offset by residential mortgage loan pay downs, a seasonal decline in Total loans & leases held for investment $301,071 $319,229 $299,842 indirect other (Sheffield) and credit card ▪ In connection with the adoption of CECL, all loans previously in the PCI portfolio became PCD loans and were transferred to their respective portfolios • Significant transfers included $1.4 billion to residential mortgage, $0.6 billion to residential home equity and direct and $0.6 billion to student at 3/31/20 9


Deposits 1Q20 Deposits ($ MM) $400,000 1.00% 1Q20 Average 1Q20 End of 4Q19 End of $334,649 $350,179 $334,727 balance period period 0.75% $200,000 Noninterest-bearing deposits $93,135 $97,618 $92,405 0.70% 0.50% 0.51% Interest checking 85,008 92,950 85,492 $— 1Q20 Average 1Q20 End of 4Q19 End of Money market and savings 120,936 124,072 120,934 balance period period Time deposits 35,570 35,539 35,896 Total deposits ($ MM) IBD cost (%) Total deposit cost (%) Total deposits $334,649 $350,179 $334,727 Key Points ▪ Period-end total deposits increased by $15.5 billion vs. 12/31/19 ▪ Deposits increased approximately $7.1 billion from clients that drew down their commercial loan lines ▪ The remaining $8.4 billion increase in period-end total deposits vs. 12/31/19 reflected broad-based growth primarily due to seasonal inflows and flight to quality due to economic uncertainty ▪ Average deposit mix consisted of 27.8% noninterest-bearing, 25.4% interest checking, 36.2% money market and savings and 10.6% time deposits ▪ The cost of average total deposits and average interest-bearing deposits decreased 6 bps and 12 bps, respectively, vs. 4Q19 10


Net Interest Income and Interest Rate Sensitivity Net Interest Income and Margin Key Points ▪ Reported NIM for 1Q20 was 3.58%; increased 17 bps vs. 4Q19 $4,000 4.00% primarily due to a full quarter of purchase accounting accretion, partly $3,687 offset by a decline in the core NIM 3.50% ▪ Core NIM for 1Q20 was 3.06%; decreased 8 bps vs. 4Q19 primarily $2,000 3.58% due to the MOE, lower interest rates and higher cash balances at the FRB, partly offset by the annual dividend received on market value 3.00% assets held for certain post-retirement benefits 3.06% $— • Cash balances at the FRB increased $16.0 billion, from $14.7 1Q20 billion at 12/31/19 to $30.7 billion at 3/31/20, to fund liquidity Net interest income TE ($ MM) Reported NIM (%) Core NIM (%) needs; decreased NIM by 10 bps • Income from market value assets held for certain post- retirement benefits increased NIM by 1 bp Change in Net Interest Income1 +4.00% Key Points +2.56% +2.00% ▪ Became more asset-sensitive vs. 12/31/19 due to floating rate loan +2.00% growth (primarily due to increased line draws), expected higher prepayments, terming out FHLB advances (3+ year average 0.00% -1.18% +0.75% +0.95% maturity/1.04% average cost) and increased noninterest-bearing -2.11% deposits -2.00% ▪ The mix of loans at 3/31/20 was 55% floating rate and 45% fixed rate -3.86% -4.00% Down 50 Down 25 Up 50 Up 100 At 12/31/19 At 03/31/20 1 Market rate increase or decrease scenarios assume a ramped, parallel 25 basis point change per quarter in market interest rates and that market rates floor at 0 11


Noninterest Income 1Q20 Noninterest Income ($ MM) $2,000 60% $1,961 Insurance income $549 $1,000 40% Service charges on deposits 305 Wealth management income 332 34.9% Card and payment related fees 187 $— 20% 1Q20 Residential mortgage income 245 Noninterest income ($ MM) Fee income ratio (%) Investment banking and trading income 118 Operating lease income 77 Key Points Income from bank-owned life insurance 44 ▪ Noninterest income totaled $2.0 billion, an increase of $563 million vs. 4Q19 Lending related fees 67 reflecting a full quarter impact from the merger ▪ Insurance income increased $39 million, or 7.6%, vs. 1Q19 due to strong Commercial real estate related income 44 organic growth in P&C commissions from higher production, retention and increased pricing Securities gains (losses) (2) ▪ Wealth management income benefited from year-end 2019 asset values Other income (5) ▪ Residential mortgage income elevated primarily due to origination volumes of Total noninterest income $1,961 $11.7 billion in 1Q20 resulting from lower interest rates; income reflected anticipated forbearance impacts on the MSR due to COVID-19 ▪ Other income was negatively impacted by a $36 million decrease in market value of assets held for certain post-retirement benefits which is offset in net ▪ COVID-19 discretionary actions impacted service charges on deposits as a interest income and personnel expense result of fee rebates and card and payment related fees from increased cashback awards ▪ 2Q20 noninterest income expected to reflect strong residential mortgage originations and seasonally higher insurance income, offset by COVID-19 ▪ Investment banking and trading income was impacted negatively by $92 million impacts (lower fee income, forbearance and asset valuations) of CVA reserves on the derivatives portfolio primarily related to lower interest rates and widening credit spreads 12


Noninterest Expense & Efficiency $4,500 80% 1Q20 Noninterest Expense ($ MM) Personnel expense $1,972 $3,000 $3,431 70% Net occupancy expense 221 61.1% Professional fees and outside processing 247 $1,500 60% 53.4% Software expense 210 Equipment expense 116 $— 50% 1Q20 Marketing and customer development 84 Total noninterest expense ($ MM) GAAP efficiency (%) Operating lease depreciation 71 Adjusted efficiency (%) Loan-related expense 62 Key Points Amortization of intangibles 165 ▪ Noninterest expense totaled $3.4 billion, an increase of $856 million vs. 4Q19 reflecting Regulatory costs 29 a full quarter impact from the merger Merger-related and restructuring charges 107 ▪ COVID-19 discretionary actions impacted noninterest expense by approximately $65 million primarily due to bonuses paid to teammates with annual earnings under Other expense 147 $100,000; net occupancy expense increased slightly due to additional measures to protect teammates Total noninterest expense $ 3,431 1 ▪ Personnel expense included approximately $44 million for incremental operating Adjusted noninterest expense $ 3,185 expenses related to the merger; positively impacted by a decrease in market value ▪ 2Q20 noninterest expense expected to reflect COVID-19 impacts (onsite assets held for certain post-retirement benefits which is offset in net interest income and special pay to teammates working in the office and additional measures to other income protect teammates) • Net headcount declined approximately 800 primarily due to positions eliminated in early 1Q20 as a result of the MOE 1 Excludes merger-related charges and other selected items in the Quarterly Performance Summary, including discretionary COVID-19 items 13


Asset Quality Net Charge-offs Nonperforming Assets $320 1.00% $1,600 1.00% $272 $1,177 $160 0.50% $800 0.50% 0.23% 0.36% $— —% $— —% 1Q20 1Q20 Net charge-offs ($ MM) as % of avg. loans and leases Nonperforming assets ($ MM) as a % of total assets Loss Absorbency Key Points $9,000 4.00% ▪ Asset quality remains strong; COVID-19 uncertainties persist $8,750 ▪ NPA and NPL ratios were essentially flat vs. 4Q19 when adjusted for the $6,000 3.00% effects of the PCI to PCD transition; approximately $500 million of PCI loans at 12/31/19 would have been classified as nonperforming had we evaluated $5,211 2.71% accrual status on a loan level basis $3,000 2.00% ▪ Provision increased to $893 million primarily due to significant loan growth 1.63% and economic deterioration $— 1.00% 1Q20 ▪ Net charge-offs were $272 million, or 36 bps of average loans and leases ▪ Allowance coverage ratios remain strong at 4.76x net charge-offs and 5.04x ALLL ($ MM) nonperforming loans and leases; adoption of CECL and transition from ALLL + unamortized loan marks ($ MM) pooled-level PCI to loan-level PCD accounting impacted the coverage ratios ALLL as % of loans and leases ALLL + unamortized loan marks as % of loans and leases ▪ 2Q20 asset quality metrics expected to reflect increased COVID-19 related stress across loan portfolios ALLL + unamortized loan marks as % of loans and leases is a non-GAAP measure. See non-GAAP reconciliations in the attached appendix. 14


Selected Credit Exposures A Highly Diversified Portfolio Outstandings % of Key Points as of March 31, 2020 ($ in B) Total Loans HFI ▪ Oil and gas portfolio: Hotels, resorts and cruise lines $6.6 2.1 % ▪ 40% upstream Oil and gas portfolio 5.9 1.8 • 43% midstream Senior care 5.6 1.8 • 9% downstream Acute care facilities 4.9 1.5 • 7% drilling / oil field services Sensitive retail 2.9 0.9 ▪ 42% of leveraged lending is investment grade or equivalent ▪ Performing detailed portfolio reviews and adjusting underwriting / risk Restaurants 2.5 0.8 acceptance criteria as appropriate Total $28.4 8.9 % ▪ Included qualitative overlays in the ALLL for affected industries Leveraged lending (inclusive of above industries) $10.5 3.3 % Note: Industry exposures are based on systemic industry assignments (NAICS) at the borrower level 15


Current Expected Credit Loss Roll Forward 12/31/2019 Incurred Loss Allowance for Credit Losses ($ in MM) $6,000 2.50% ▪ ACL of $1.9 billion or 0.63% based on the incurred loss method; purchase accounting marks supplanted the ALLL on the merged SunTrust loans, which $5,611 reduced the ACL coverage ratio at year-end $582 $4,800 $5,029 2.00% ▪ Excluding purchase accounting impacts (i.e., including estimated ACL for heritage SunTrust loans), combined ACL estimated at $3.5 billion $3,140 $3,472 1.76% 1/1/2020 CECL $3,600 1.68% 1.50% ▪ ACL of $5.0 billion or 1.68%; $3.1 billion increase at adoption impacted by merger estimated $2,400 heritage • On a non-GAAP basis, ≈ 45% increase to ACL excluding purchase accounting SunTrust 1.00% ▪ Estimation process included the use of multiple economic scenarios sourced by third $1,889 parties, including an assumed likelihood of recession $1,200 3/31/2020 CECL 0.63% 0.50% ▪ ACL of $5.6 billion or 1.76%; $582 million or 12% increase from 1/1/2020 $— 12/31/2019 Incurred 1/1/2020 CECL 3/31/2020 CECL ▪ Rapidly evolving COVID-19 conditions evaluated through the use of multiple forecasts % of ACL to total LHFI ▪ Increase driven by pandemic risks including heightened industry concerns from economic disruptions with some consideration of government relief packages 16


CECL Loss Estimation Approach Modeled Approach ▪ Borrower and portfolio-segment level loss forecasting models designed to estimate probability of default, loss given default, payoff/prepayments, etc. ▪ Two year reasonable and supportable period followed by one year reversion to historic loss conditions Quantitative and Qualitative Adjustments ▪ Quantitative and qualitative adjustments capture risks not reflected in modeled results ▪ Includes adjustments for asset quality trends, changes in lending policies and processes and single name borrower concentration (granularity risk) Economic Imprecision ▪ Models evaluate loss estimates under multiple economic forecast scenarios • The primary economic scenario is a third-party sourced baseline adjusted for Truist interest rate outlook • Additional economic forecasts are used to refine and support qualitative adjustments ▪ The final CECL ACL estimate considers the range of economic forecast scenario outcomes to inform an “economic imprecision” adjustment used to reflect the uncertainty around the timing and level of change incorporated in the economic forecasts and additional external risk factors such as economic and political uncertainty 17


Capital Position Common Equity Tier 1 Ratio 1 Key Points 10% 1 9.3% ▪ The CET1 ratio was 9.3% for 1Q20 ▪ The dividend and total payout ratios were 61.4% for 1Q20 ▪ Management is taking a prudent approach to capital management 5% given economic uncertainty; augmented the 2020 CCAR submission with a COVID-19 analysis that informed the scenarios ▪ Ending CET1 ratios for the internal baseline and severely adverse scenarios well exceeded regulatory minimums and internal post stress —% 1Q20 policy goals ▪ Management intends to utilize the five-year CECL transition for regulatory capital purposes • The Interim Final Rule CECL delay resulted in 17 bps improvement to the CET1 ratio for 1Q20 • Absent the transition, the CET1 ratio would be 8.7% ▪ Management expects a stress capital buffer of 2.5% ▪ Management expects capital to grow through the COVID-19 stress, creating capacity to serve clients 1 Current quarter regulatory capital information is preliminary 18


Stressed Loss Resiliency 2018 Stress Test Results - Severely Adverse Scenario Loss Absorbency CCAR (Planned DFAST 1Q20 Capital Actions) (Dividends Only) Reserves Credit Reserves as a Firm Beginning Min Levels Erosion Min Levels Erosion Loan Loss Reserves % of Stress Key Points 4Q17 CET1 CET1 ($ B) ($ B) Losses BAC 11.9% 5.4% 6.5% 7.9% 4.0% $49.7 $17.1 34% ▪ TFC blended stress test erosion 2nd CFG 11.2% 5.4% 5.8% 6.8% 4.4% $6.8 $2.2 33% best among peers (2018) 4 4 FITB 10.6% 5.5% 5.1% 7.5% 3.1% $5.7 NR NR ▪ Significant loss absorbency JPM 12.2% 5.0% 7.2% 7.2% 5.0% $61.8 $25.4 41% represented by a combination of KEY 10.2% 4.8% 5.4% 6.8% 3.4% $5.4 $1.5 28% TFC’s 1Q20 ACL + unamortized loan marks MTB 11.0% 4.9% 6.1% 7.5% 3.5% $6.0 NR4 NR4 PNC 10.4% 5.3% 5.1% 6.4% 4.0% $11.6 $4.4 38% • Totaling $9.150 billion in loss absorbing capacity RF 11.1% 5.2% 5.9% 8.1% 3.0% $5.3 $1.7 31% USB 9.3% 6.0% 3.3% 7.5% 1.8% $18.3 $6.6 36% • Represents 58% of 2018 WFC 12.3% 6.5% 5.8% 8.6% 3.7% $53.6 $12.0 22% DFAST severely adverse stress losses Peer Average 11.0% 5.6% 3.6% $8.9 33% BBT 10.2% 6.0% 4.2% 7.9% 2.3% $8.4 STI 9.7% 4.7% 5.0% 6.6% 3.1% $7.5 TFC (Blend)1 10.0% 5.4% 4.6% 7.3% 2.7% $15.9 $5.62 35% Unamortized Loan Marks $3.5 TFC ACL + Unamortized Loan Marks $9.23 58% 1 TFC (Blend) represents the average of BBT and STI reported percentages 2 Reported TFC ACL as of 3/31/2020 3 Results may not foot due to rounding 4 NR = not reported; FITB and MTB excluded from 1Q20 reserves averages as their 1Q20 earnings releases are not currently available Source: FRB and Company Releases 19


Liquidity Position Category III Reduced LCR 1 Key Points 150% ▪ Liquidity ratios remain strong and include an average LCR1 of 117% for 1Q20 and a liquid asset buffer of 19.6% at 03/31/20 100% 117% ▪ Management took quick action in response to COVID-19 to term out short-term borrowings and increase cash to meet potential funding needs, with $30.7 billion cash reserves held at the FRB at 3/31/20 50% ▪ Access to secured funding sources remains robust with approximately $180.4 billion of cash, securities and secured borrowing capacity ▪ Deposits increased $15.5 billion in 1Q20 partly as a result of a flight to —% 1Q20 quality in response to market volatility ▪ The holding company cash is sufficient to cover 17 months of Truist Corporation ($ in B) contractual and expected outflows with no inflows Parent company cash $12.1 ▪ Paycheck Protection Program loans of approximately $10 billion are Months of stress capacity2 17 months expected to fund from existing reserve balances with the ability to Truist Bank ($ in B) pledge them to the FRB for additional borrowing capacity as necessary FRB reserve balance $30.7 Investment portfolio (market value) 78.4 Discount window capacity (none drawn) 49.6 FHLB capacity 21.7 Total $180.4 1 Current quarter LCR information is preliminary 2 Stress capacity measures ability to cover contractual and expected outflows including dividends with no inflows 20


Merger Update and Medium-Term Targets Accomplishments Performance Net Targets Expense Savings ▪ Introduced the Truist visual identity and logo ▪ Completed 32 culture town hall meetings ROTCE Adjusted Cost Saves ▪ Completed purchase of Truist Center, our corporate HQ building Efficiency ▪ Launched the Truist Foundation Low 20% Low 50% $1.6B ▪ Began consolidating combined real estate portfolio – strategy shift to owned office space when possible Key Points Next Steps ▪ Remain committed to achieving $1.6 billion in net cost saves ▪ Continue to execute on systems integration ▪ Timing of performance target realization conditioned on the duration ▪ Develop plans for teammate readiness and client communications of the pandemic and post-crisis economic conditions, including the related to ongoing integration work normalization of interest rates ▪ Complete previously announced branch divestitures in 3Q20 21


Value Proposition Purpose-driven: Committed to inspire and build better lives and communities Growing earnings stream with less volatility relative to Exceptional franchise with diverse Uniquely positioned to deliver Strong capital and liquidity with resilient peers over the products, services, and markets best-in-class efficiency and returns risk profile enhanced by the merger long-term while investing in the future ▪ Sixth-largest commercial bank in the ▪ Continued confidence in achieving ▪ Prudent and disciplined risk and U.S. $1.6 billion of net cost savings financial management ▪ Strong market share in vibrant, fast- ▪ Highly complementary businesses ▪ Conservative risk culture; leading growing MSAs throughout the and expanded client base combine to credit metrics; among the highest- Southeast and Mid-Atlantic and a yield revenue synergies rated large banks growing national presence ▪ Returns and capital buoyed by ▪ Diversification benefits arising from ▪ Comprehensive business mix with purchase accounting accretion the merger distinct capabilities in traditional ▪ Meaningful investments in tech ▪ Stress test well (separately and banking, capital markets and insurance capabilities, teammates, marketing together) ▪ Better together: “Best of breed” talent, and advertising ▪ Strong capital and liquidity equate to technology, strategy and processes flight to quality ▪ Defensive balance sheet insulated by purchase accounting marks, combined with CECL credit reserves 22


Appendix


Consumer Banking & Wealth Represents performance for Retail Community Banking, Wealth, Mortgage Banking, Dealer Retail Services and National Consumer Finance & Payments 1Q20 Key Points ▪ Continued focus on revenue and expense synergies as businesses are Net interest income $2,248 integrated Provision for credit losses 437 • Expense synergies realized in 1Q20 driven by lower headcount ▪ Noninterest income benefited from strong residential mortgage Noninterest income 1,072 refinance activity along with higher wealth management revenue due to year-end asset valuations, while COVID-19 impact of lower purchase Noninterest expense 1,993 activity and waived ATM fees adversely impacted the quarter Income Statement ($ MM) ▪ End of period loans held for investment were up $0.7B or 0.5% from the Pre-tax income 890 prior quarter, primarily driven by a seasonal increase in Dealer/ Recreational Lending, Wealth Specialty Group (Legal and Sports & Segment net income 681 Entertainment) and Mortgage (1) ▪ End of period deposits were up $6.4B or 3.2% from the prior quarter, EOP loans $141.6 primarily due to seasonality and reduced consumer spending late in the quarter due to COVID-19 Balance Sheet ($ B) EOP deposits 208.5 Mortgages serviced for others ($ B)(2) $220.0 Branches 2,957 Other Key Metrics ATMs 4,408 (1) Excludes loans held for sale (2) Amount reported reflects end of period balance A-1


Corporate & Commercial Banking Represents performance for Commercial Community Banking, Corporate & Investment Banking and CIG – Real Estate 1Q20 Key Points ▪ 1Q performance meaningfully impacted by market disruption tied to Net interest income $1,340 COVID-19 ▪ End of period loans HFI were up $18.9B and deposits were up Provision for credit losses 399 $5.8B from the beginning of the year, driven by increased draws on revolver facilities as clients sought short term liquidity Noninterest income 460 ▪ Loan loss provision expense increased $382MM driven by increased volume and higher reserve levels; actual net charge-offs Noninterest expense 886 remain low Income Statement ($ MM) ▪ Noninterest income was impacted by trading volatility; beginning mid-to-late February, as a result of COVID-19, rates dropped Pre-tax income 515 dramatically and credit spreads widened impacting the overall trading portfolio Segment net income 423 ▪ Focus continues on revenue and expense synergies as the businesses are integrated; expense run rate declined driven by EOP loans(1) $175.4 lower headcount ($ B) EOP deposits 126.7 Balance Sheet (1) Excludes loans held for sale A-2


Insurance Holdings Represents performance for Retail and Wholesale Insurance businesses and Premium Finance 1Q20 Key Points Net interest income $25 ▪ 1Q organic growth driven by strong fundamentals - continued economic expansion, exposure unit growth and increasing insurance Noninterest income 557 rate environment Total revenue 582 ▪ 1Q new business up 11% with ongoing high retention rates Provision for credit losses 1 ▪ Margin expansion has been driven by industry leading organic growth, prudent expense control, and operating leverage created Noninterest expense 440 through realization of Insurance Holdings Operations Project (IHOP) Income Statement ($ MM) initiatives Pre-tax income 141 ▪ COVID-19 concerns dampen organic growth outlook for the Segment net income 105 remainder of 2020 Y-o-Y organic revenue growth 7.2% Net acquired revenue $2 Performance based commissions 18 Adjusted EBITDA(1) 171 Performance ($ MM) Adjusted EBITDA margin(1) 29.4% (1) EBITDA is a non-GAAP measurement of operating profitability that is calculated by adding back interest, taxes, depreciation and amortization to net income. Truist's management also adds back merger- related and restructuring charges, incremental operating expenses related to the merger and other selected items. Truist's management uses this measure in its analysis of the Corporation's Insurance Holdings segment. Truist's management believes this measure provides a greater understanding of ongoing operations and enhances comparability of results with prior periods, as well as demonstrates the effects of significant gains and charges. See non-GAAP reconciliations included in the attached Appendix. A-3


Allowance and Fair Value Marks Information ($ MM) March 31, 2020 Loans and Allowance for Credit Losses & Fair Value Marks Leases RUFC Total Allowance for credit losses - End of period $ 5,211 $ 400 $ 5,611 Unamortized fair value mark(1) 3,539 — 3,539 Allowance plus unamortized fair value mark $ 8,750 $ 400 $ 9,150 Loans and leases held for investment $ 319,229 Unamortized fair value mark(1) 3,539 Gross loans and leases $ 322,768 Allowance for loan and lease losses as a percentage of loans and leases - GAAP 1.63 % Allowance for loan and lease losses and unamortized fair value mark as a percentage of gross loans and leases - adjusted (1)(2) 2.71 (1) Unamortized fair value mark includes credit, interest rate and liquidity components. (2) Allowance for loan and lease losses and unamortized fair value mark as a percentage of gross loans and leases is a non-GAAP measurement of credit reserves that is calculated by adjusting the ALLL and loans and leases held for investment by the unamortized fair value mark. Truist's management uses this measure to assess credit reserves and believes investors may find this measure useful in their analysis of the Corporation. A-4


Purchase Accounting Summary1 ($ MM) March 31, 2020 December 31, 2019 Loans and Leases(2) Beginning balance unamortized fair value mark $ (4,564) $ (221) Additions - Merger with SunTrust — (4,513) Accretion 454 170 CECL adoption - reserves on PCD assets 378 — Adjustments and other additions 193 — Ending balance $ (3,539) $ (4,564) Core deposit and other intangible assets Beginning balance $ 3,142 $ 678 Additions - Merger with SunTrust — 2,535 Additions - other acquisitions 31 — Amortization (165) (71) Amortization in net occupancy expense (5) — Adjustments 165 — Ending balance $ 3,168 $ 3,142 Deposits(3) Beginning balance unamortized fair value mark $ (76) $ — Additions - Merger with SunTrust — (83) Amortization 22 7 Ending balance $ (54) $ (76) Long-Term Debt(3) Beginning balance unamortized fair value mark $ (312) $ (10) Additions - Merger with SunTrust — (309) Amortization 27 7 Ending balance $ (285) $ (312) (1) Includes the merger with SunTrust, as well as other acquisitions. This summary includes only selected information and does not represent all purchase accounting adjustments. (2) Purchase accounting loan marks on loans and leases represents the total mark, including credit, interest and liquidity, and are recognized using level-yield method over the remaining life of the individual loans or recognized in full in the event of prepayment. (3) Purchase accounting marks on liabilities represents interest rate marks on time deposits and long-term debt and are recognized using level-yield method over the term of the liability. A-5


Non-GAAP Reconciliations


Non-GAAP Reconciliations Diluted EPS ($ MM, except per share data, shares in thousands) Quarter Ended March 31 Dec. 31 Sept. 30 June 30 March 31 2020 2019 2019 2019 2019 Net income available to common shareholders - GAAP $986 $702 $735 $842 $749 Merger-related and restructuring charges 82 176 26 19 64 Securities gains (losses) 2 90 — — — Incremental operating expenses related to the merger 57 79 40 7 1 Corporate advance write off — 1 — — — Gain (loss) on loan portfolio sale — 17 (3) — — Redemption of preferred shares — — 46 — — Allowance release related to loan portfolio sale — (19) (12) — — COVID-19 impact 54 — — — — Net income available to common shareholders - adjusted $1,181 $1,046 $832 $868 $814 Weighted average shares outstanding - diluted 1,357,545 934,718 775,791 774,603 774,071 Diluted EPS - GAAP $0.73 $0.75 $0.95 $1.09 $0.97 Diluted EPS - adjusted(1) $0.87 $1.12 $1.07 $1.12 $1.05 (1) The adjusted diluted earnings per share is non-GAAP in that it excludes merger-related and restructuring charges and other selected items, net of tax. Truist's management uses this measure in their analysis of the Corporation's performance. Truist's management believes this measure provides a greater understanding of ongoing operations and enhances comparability of results with prior periods, as well as demonstrates the effects of significant gains and charges. A-7


Non-GAAP Reconciliations Efficiency Ratio ($ MM) Quarter Ended March 31 Dec. 31 Sept. 30 June 30 March 31 2020 2019 2019 2019 2019 Efficiency ratio numerator - noninterest expense - GAAP $ 3,431 $ 2,575 $ 1,840 $ 1,751 $ 1,768 Merger-related and restructuring charges, net (107) (223) (34) (23) (80) Incremental operating expense related to the merger (74) (101) (52) (9) (2) Amortization (165) (71) (29) (32) (32) Corporate advance write off — (2) — — — COVID-19 impact (65) — — — — Efficiency ratio numerator - adjusted $ 3,020 $ 2,178 $ 1,725 $ 1,687 $ 1,654 Efficiency ratio denominator - revenue(1) - GAAP $ 5,611 $ 3,625 $ 3,003 $ 3,042 $ 2,898 Taxable equivalent adjustment 37 25 23 24 24 Securities (gains) losses, net 2 116 — — — Gain (loss) on loan portfolio sale — 22 (4) — — COVID-19 impact 6 — — — — Efficiency ratio denominator - adjusted $ 5,656 $ 3,788 $ 3,022 $ 3,066 $ 2,922 Efficiency ratio - GAAP 61.1 % 71.0 % 61.3 % 57.6 % 61.0 % Efficiency ratio - adjusted(2) 53.4 57.5 57.1 55.1 56.6 (1) Revenue is defined as net interest income plus noninterest income. (2) The adjusted efficiency ratio is non-GAAP in that it excludes securities gains (losses), amortization of intangible assets, merger-related and restructuring charges and other selected items. Truist's management uses this measure in their analysis of the Corporation's performance. Truist's management believes this measure provides a greater understanding of ongoing operations and enhances comparability of results with prior periods, as well as demonstrates the effects of significant gains and charges. A-8


Non-GAAP Reconciliations Calculations of tangible common equity and related measures ($ MM, except per share data, shares in thousands) As of / Quarter Ended March 31 Dec. 31 Sept. 30 June 30 March 31 2020 2019 2019 2019 2019 Common shareholders' equity $ 61,295 $ 61,282 $ 29,177 $ 28,650 $ 27,770 Less: Intangible assets, net of deferred taxes 26,263 26,482 10,281 10,317 10,326 Tangible common shareholders' equity(1) $ 35,032 $ 34,800 $ 18,896 $ 18,333 $ 17,444 Outstanding shares at end of period 1,347,461 1,342,166 766,303 766,010 765,920 Common shareholders' equity per common share $ 45.49 $ 45.66 $ 38.07 $ 37.40 $ 36.26 Tangible common shareholders' equity per common share(1) 26.00 25.93 24.66 23.93 22.78 Net income available to common shareholders $ 986 $ 702 $ 735 $ 842 $ 749 Plus amortization of intangibles, net of tax 126 57 22 24 25 Tangible net income available to common shareholders(1) $ 1,112 $ 759 $ 757 $ 866 $ 774 Average common shareholders' equity $ 60,224 $ 38,031 $ 29,040 $ 28,188 $ 27,432 Less: Average intangible assets, net of deferred taxes 26,429 14,760 10,298 10,326 10,343 Average tangible common shareholders' equity(1) $ 33,795 $ 23,271 $ 18,742 $ 17,862 $ 17,089 Return on average common shareholders' equity 6.58 % 7.33 % 10.04 % 11.98 % 11.08 % Return on average tangible common shareholders' equity(1) 13.23 12.91 16.03 19.45 18.36 (1) Tangible common equity and related measures are non-GAAP measures that exclude the impact of intangible assets, net of deferred taxes, and their related amortization. These measures are useful for evaluating the performance of a business consistently, whether acquired or developed internally. Truist's management uses these measures to assess the quality of capital and returns relative to balance sheet risk and believes investors may find them useful in their analysis of the Corporation. These measures are not necessarily comparable to similar measures that may be presented by other companies. A-9


Non-GAAP Reconciliations Performance Ratios ($ MM) Quarter Ended March 31, 2020 Return on Average Return on Average Return on Average Common Tangible Common Assets Shareholders’ Equity Shareholders’ Equity(2) Net income - GAAP $ 1,063 Net income available to common shareholders - GAAP $ 986 $ 986 Merger-related and restructuring charges 82 82 82 Securities gains (losses) 2 2 2 Incremental operating expenses related to the merger 57 57 57 Amortization 126 COVID-19 impact $ 54 $ 54 $ 54 Numerator - adjusted(1) $ 1,258 $ 1,181 $ 1,307 Average assets $ 477,550 Average common shareholders' equity $ 60,224 $ 60,224 Plus: Estimated impact of adjustments on denominator — 98 98 Less: Average intangible assets, net of deferred taxes 26,429 Denominator - adjusted(1) $ 477,550 $ 60,322 $ 33,893 Reported ratio 0.90 % 6.58 % 13.23 % Adjusted ratio 1.06 7.88 15.51 (1) Tangible common equity and related measures are non-GAAP measures that exclude the impact of intangible assets, net of deferred taxes, and their related amortization. These measures are useful for evaluating the performance of a business consistently, whether acquired or developed internally. Truist's management uses these measures to assess the quality of capital and returns relative to balance sheet risk and believes investors may find them useful in their analysis of the Corporation. These measures are not necessarily comparable to similar measures that may be presented by other companies. (2) Tangible common equity is a non-GAAP measure. The reconciliation for this measure is on page A-9. A-10


Non-GAAP Reconciliations Operating Leverage(1) ($ MM) Quarter Ended March 31 Dec. 31 March 31 % Growth 1Q20 vs. 2020 2019 2019 4Q19 1Q19 (annualized) Revenue(2) - GAAP $ 5,611 $ 3,625 $ 2,898 220.2 % 93.6 % Taxable equivalent adjustment 37 25 24 Securities (gains) losses, net 2 116 — Gain (loss) on loan portfolio sale — 22 — COVID-19 impact 6 — — Revenue(2) - adjusted $ 5,656 $ 3,788 $ 2,922 198.2 % 93.6 % Noninterest expense - GAAP $ 3,431 $ 2,575 $ 1,768 133.5 % 94.1 % Merger-related and restructuring charges, net (107) (223) (80) Incremental operating expense related to the merger (74) (101) (2) Amortization (165) (71) (32) Corporate advance write off — (2) — COVID-19 impact (65) — — Noninterest expense - adjusted $ 3,020 $ 2,178 $ 1,654 155.2 % 82.7 % Operating leverage - GAAP 86.7 % (0.5)% Operating leverage - adjusted(3) 43.0 % 10.9 % (1) Operating leverage is defined as percentage growth in revenue growth less percentage growth in noninterest expense. (2) Revenue is defined as net interest income plus noninterest income. (3) The adjusted operating leverage ratio is non-GAAP in that it excludes securities gains (losses), amortization of intangible assets, merger-related and restructuring charges and other selected items. Truist's management uses this measure in their analysis of the Corporation's performance. Truist's management believes this measure provides a greater understanding of ongoing operations and enhances comparability of results with prior periods, as well as demonstrates the effects of significant gains and charges. These measures are not necessarily comparable to similar measures that may be presented by other companies. A-11


Non-GAAP Reconciliations Core NIM ($ MM) Quarter Ended March 31 Dec. 31 2020 2019 Net interest income - GAAP $ 3,650 $ 2,227 Taxable-equivalent adjustment 37 25 Net interest income - taxable-equivalent 3,687 2,252 Accretion of mark, net of interest reversals - PCI loans NA (14) Accretion of mark on acquired loans (454) (130) Accretion of mark on acquired liabilities (49) (14) Accretion of mark on securities acquired from FDIC (3) (3) Net interest income - core(1) $ 3,181 $ 2,091 Average earning assets - GAAP $ 413,533 $ 263,115 Average balance - mark on acquired loans 3,759 1,423 Average balance - mark on securities acquired from FDIC 336 339 Average earning assets - core(1) $ 417,628 $ 264,877 Annualized net interest margin: Reported - taxable-equivalent 3.58 % 3.41 % Core(1) 3.06 3.14 (1) Core net interest margin is a non-GAAP measure that adjusts net interest margin to exclude the impact of purchase accounting. The purchase accounting marks and related amortization for a) securities acquired from the FDIC in the Colonial Bank acquisition and b) loans, deposits and long-term debt from SunTrust, Susquehanna, National Penn and Colonial Bank are excluded to approximate the yields paid by clients. Interest income for PCI loans adjusts the accretion, net of interest reversals, which approximates the interest received from the client. Truist's management believes the adjustments to the calculation of net interest margin for certain assets and liabilities acquired provide investors with useful information related to the performance of Truist's earning assets. These measures are not necessarily comparable to similar measures that may be presented by other companies. A-12


Non-GAAP Reconciliations Insurance Holdings Adjusted EBITDA ($ MM) Quarter Ended March 31 2020 Segment net interest income $ 25 Noninterest income 557 Total revenue $ 582 Segment net income (loss) - GAAP $ 105 Provision (benefit) for income taxes 36 Depreciation & amortization 19 EBITDA 160 Merger-related and restructuring charges, net 3 COVID-19 impact 8 Adjusted EBITDA(1) $ 171 Adjusted EBITDA(1) margin 29.4 % (1) EBITDA is a non-GAAP measurement of operating profitability that is calculated by adding back interest, taxes, depreciation and amortization to net income. Truist's management also adds back merger-related and restructuring charges, incremental operating expenses related to the merger and other selected items. Truist's management uses this measure in its analysis of the Corporation's Insurance Holdings segment. Truist's management believes this measure provides a greater understanding of ongoing operations and enhances comparability of results with prior periods, as well as demonstrates the effects of significant gains and charges. A-13


To inspire and build better lives and communities