 | News Release | |||||||
| Contact: | ||||||||
| Investors: | Alan Greer 336.733.3021 | [email protected] | Aaron Reeves 336.733.2874 | [email protected] | ||||||
| Media: | Shelley Miller 704.692.1518 | [email protected] | |||||||
Truist Reports First Quarter 2021 Results
Earnings of $1.3 billion, or $0.98 per diluted share
CHARLOTTE, N.C., (April 15, 2021) — Truist Financial Corporation (NYSE: TFC) today reported earnings for the first quarter of 2021.
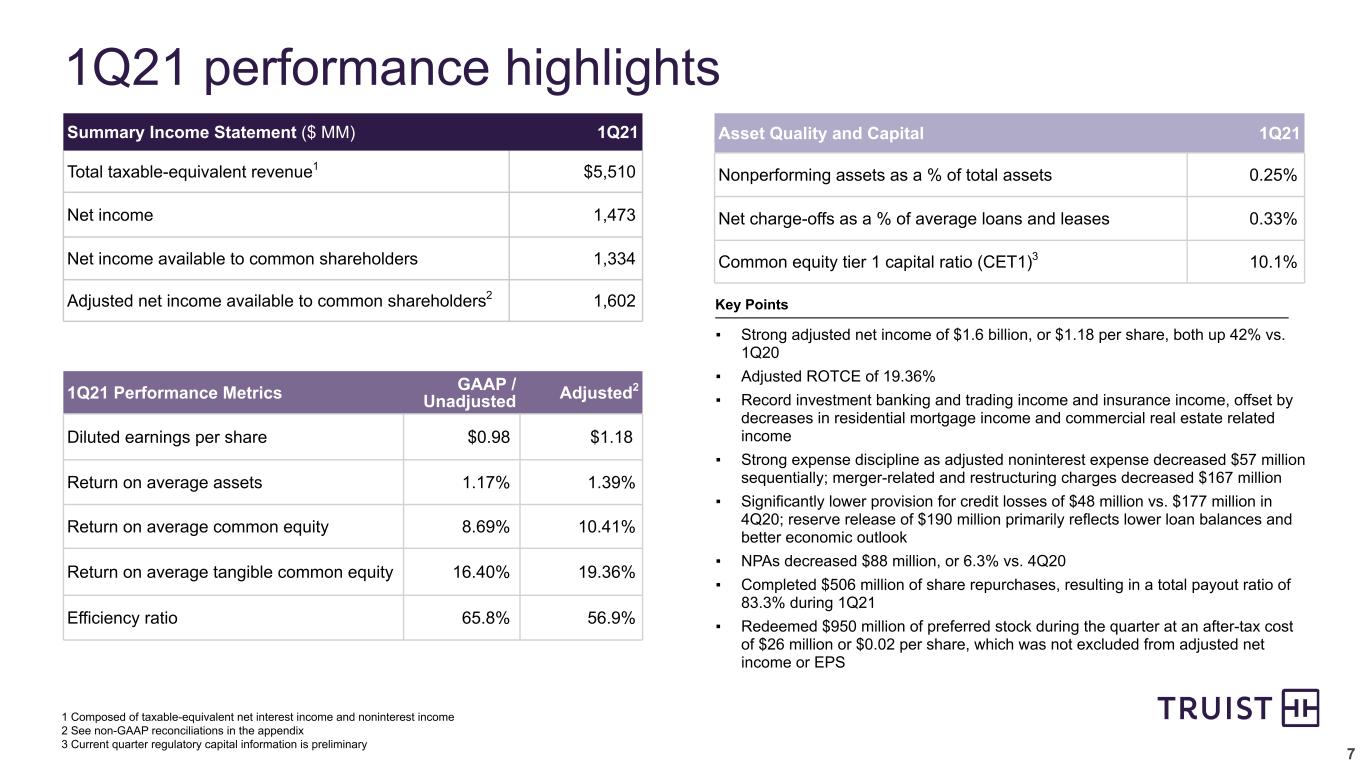
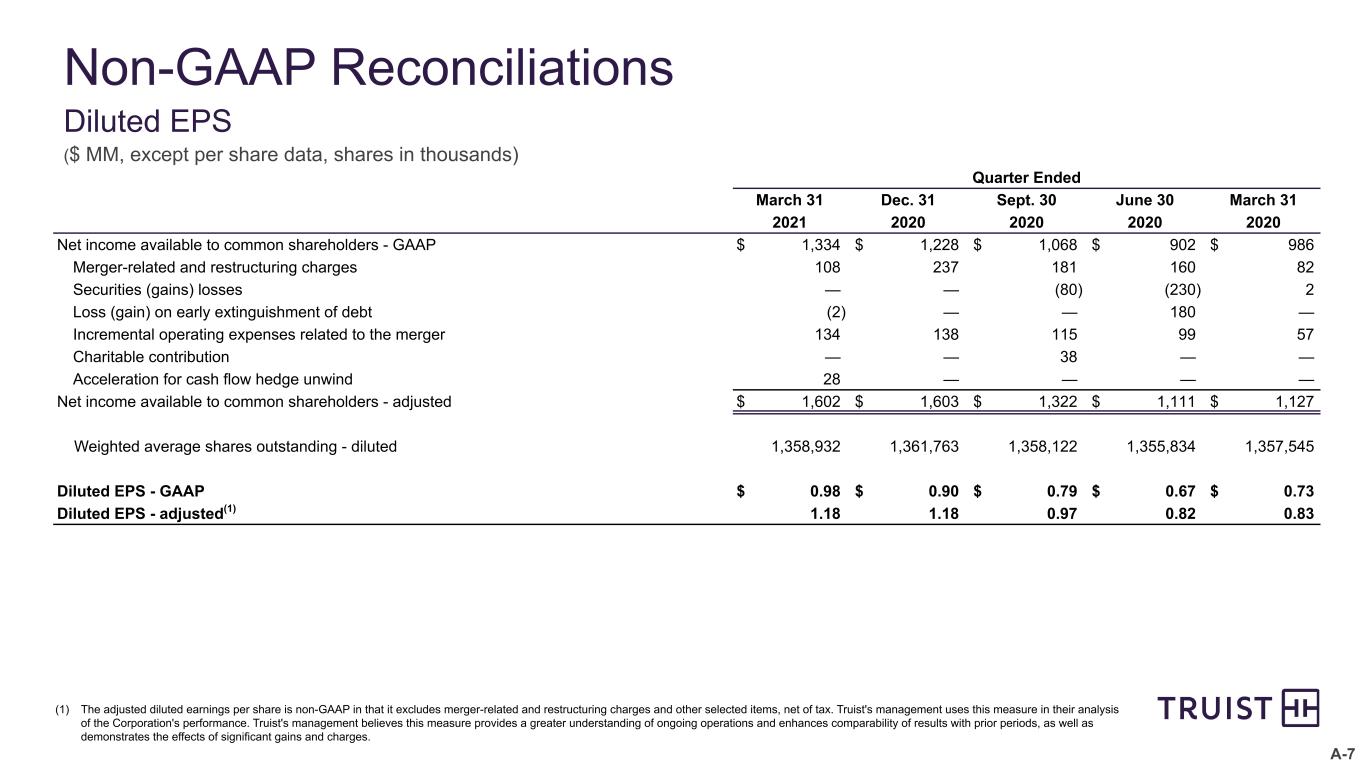
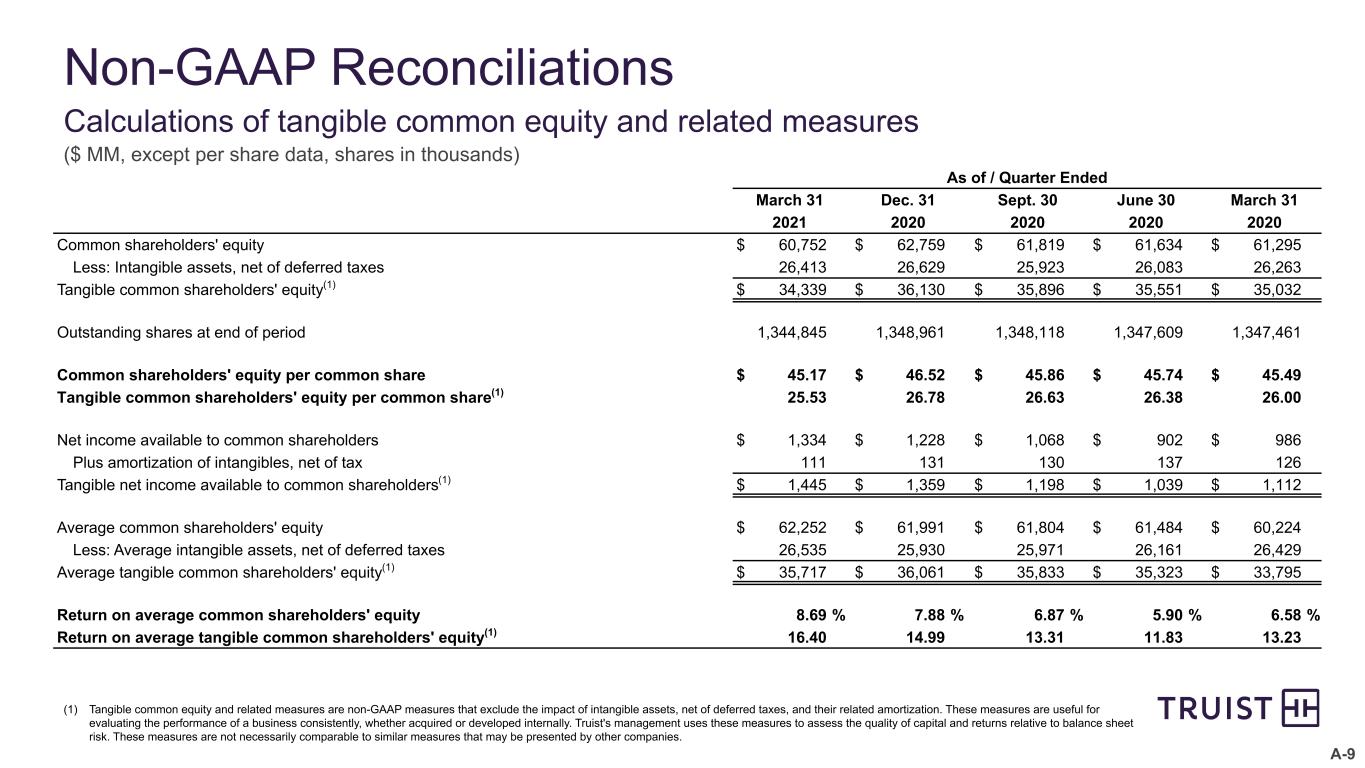
Net income available to common shareholders was $1.3 billion, up 35.3 percent, compared to the first quarter last year. Earnings per diluted common share were $0.98, an increase of 34.2 percent compared with the same period last year. Results for the first quarter produced an annualized return on average assets (ROA) of 1.17 percent, an annualized return on average common shareholders' equity (ROCE) of 8.69 percent and an annualized return on tangible common shareholders' equity (ROTCE) of 16.40 percent.
Adjusted net income available to common shareholders was $1.6 billion, or $1.18 per diluted share, excluding merger-related and restructuring charges of $141 million ($108 million after-tax), incremental operating expenses related to the merger of $175 million ($134 million after-tax) and an acceleration of loss recognition related to certain terminated cash flow hedges of $36 million ($28 million after-tax). Adjusted results produced an annualized ROA of 1.39 percent, an annualized ROCE of 10.41 percent and an annualized ROTCE of 19.36 percent.
"Truist and our teammates have a lot to be proud of in the first quarter, including a strong financial performance and several significant milestones reflective of our purpose in action,” said Chairman and Chief Executive Officer Kelly S. King. “We advanced our ESG strategy with the issuance of our first social bond—becoming the first U.S. regional bank to do so—and became the lead investor for Greenwood, an innovative digital banking platform designed for Black and Latinx consumers and business owners. In addition, we received an ‘Outstanding’ CRA rating for our community development efforts, and continued to make great progress towards our Community Benefits Plan, after ending 2020 at 114 percent of our annual target. These achievements reflect our continued commitment to support and invest in the diverse communities we’re proud to serve.
"Adjusted net income was $1.6 billion, an increase of 42 percent compared with the first quarter last year. On a diluted per share basis, adjusted net income was $1.18 per share, also up 42 percent from last year. This growth resulted from a record performance in our insurance business, record results from investment banking and a significantly lower provision for credit losses. We also demonstrated strong expense discipline by reducing expenses. The adjusted efficiency ratio for the quarter was 56.9 percent and the adjusted return on average tangible common shareholders' equity was a strong 19.36 percent.
- 1 -
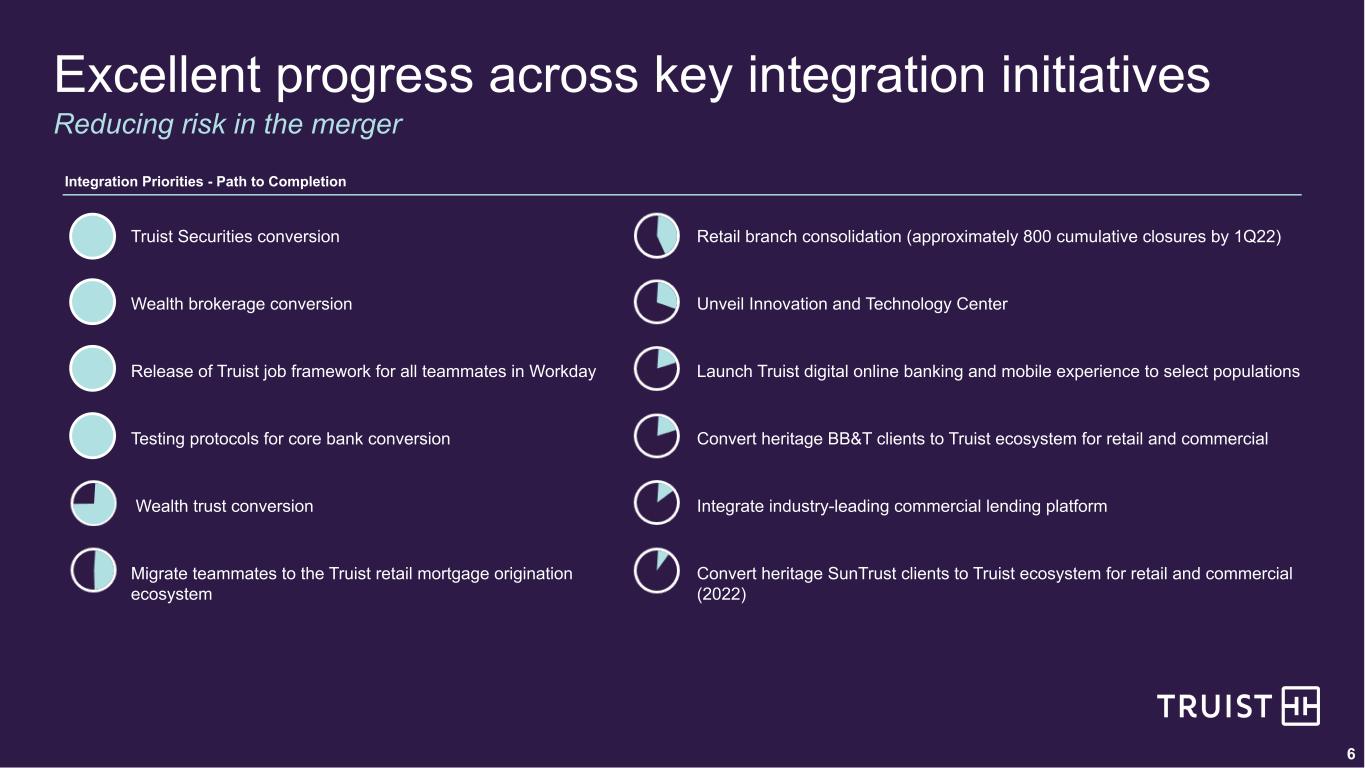
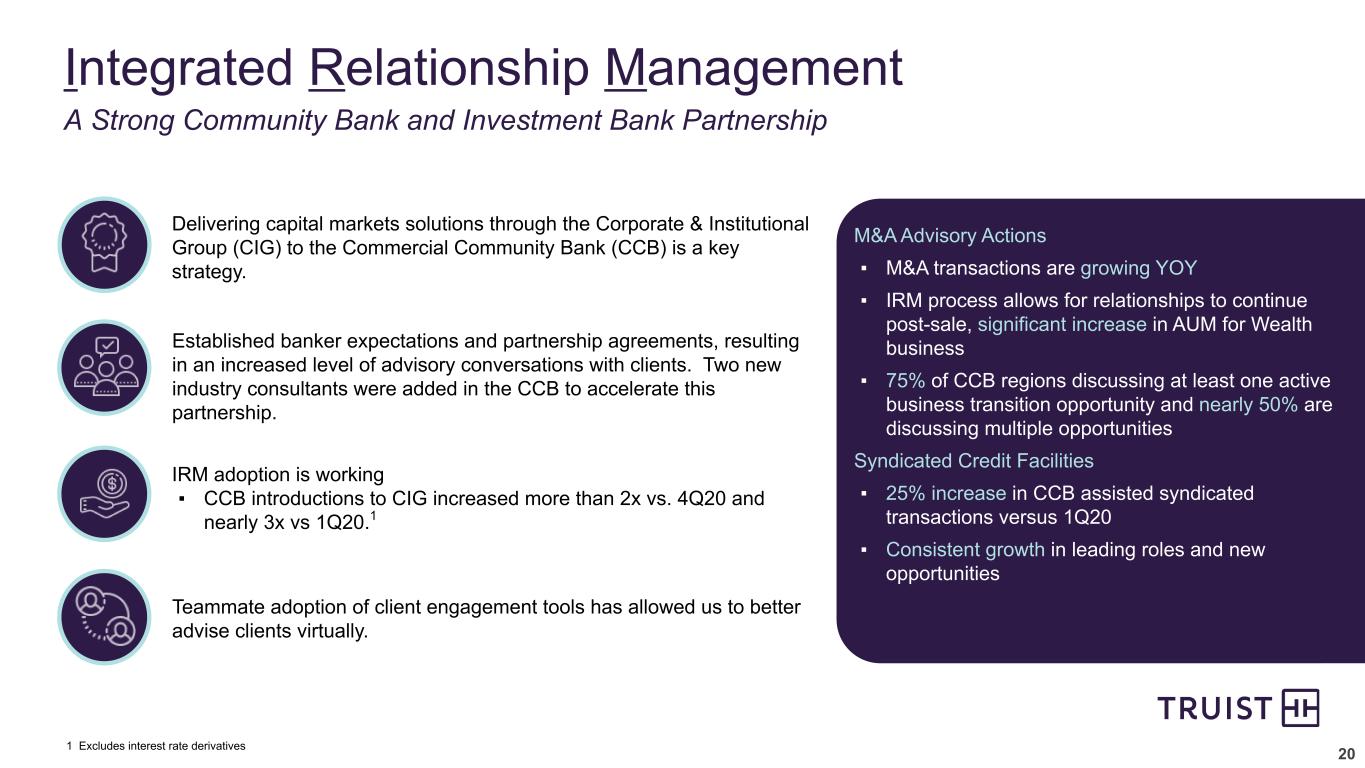
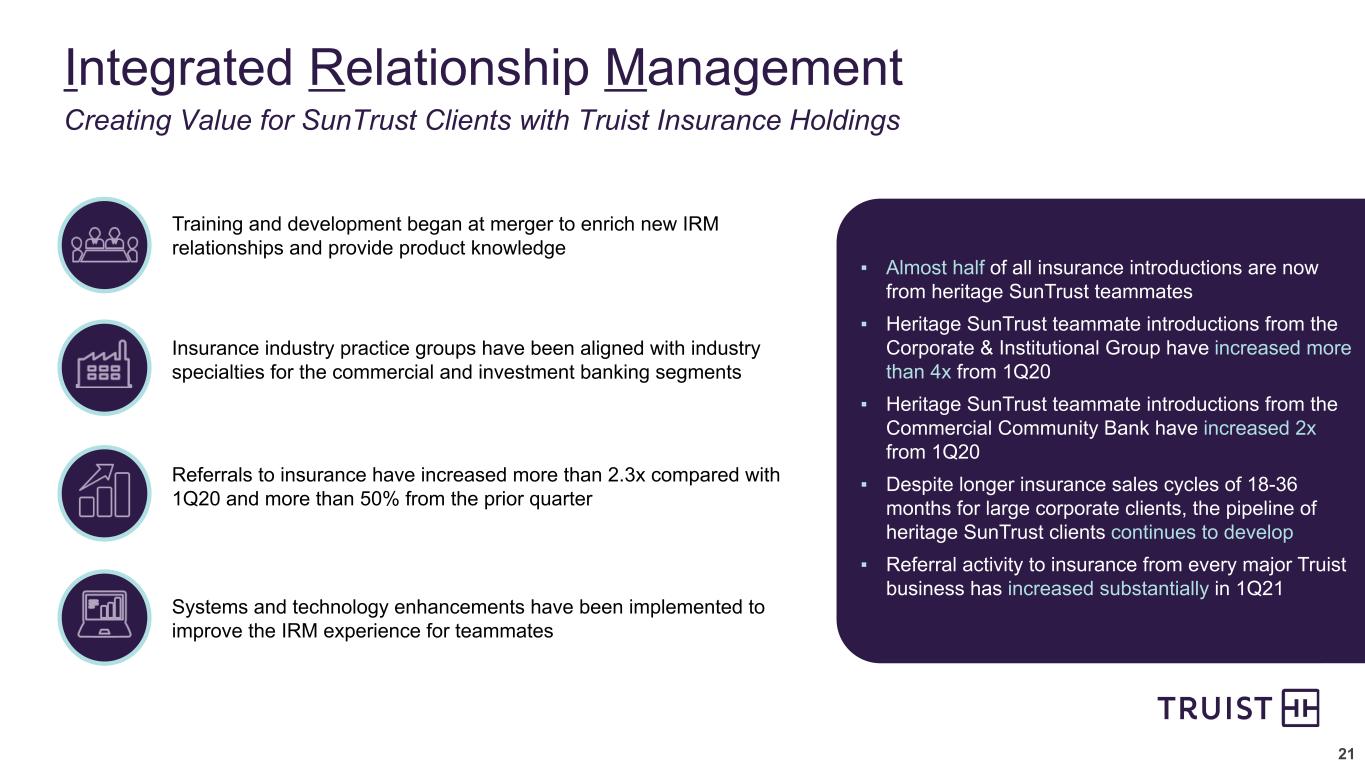
"We continue to make important progress on our integration efforts, including completing the wealth brokerage transition earlier this quarter. Through our unique Integrated Relationship Management approach, we continued to deepen client relationships across our investment banking and insurance businesses, significantly increasing referral volumes.
"We were also honored to be recognized for our commitment to stand for better by the Human Rights Campaign’s Corporate Equality Index with a perfect 100 score, by ‘FORTUNE’ as one of the world’s most admired companies and as a top 50 employer by both ‘Equal Opportunity’ and ‘CAREERS & the disABLED’ magazines.”
First Quarter 2021 Performance Highlights
•Earnings per diluted common share were $0.98
–Adjusted diluted earnings per share were $1.18, up $0.35 per share compared to first quarter 2020
–ROA was 1.17 percent; adjusted ROA was 1.39 percent
–ROCE was 8.69 percent; adjusted ROCE was 10.41 percent
–ROTCE was 16.40 percent; adjusted ROTCE was 19.36 percent
•Taxable-equivalent revenue was $5.5 billion
–Fee income ratio was 40.1 percent, compared to 40.4 percent for fourth quarter 2020
–Record revenues from insurance and investment banking and trading
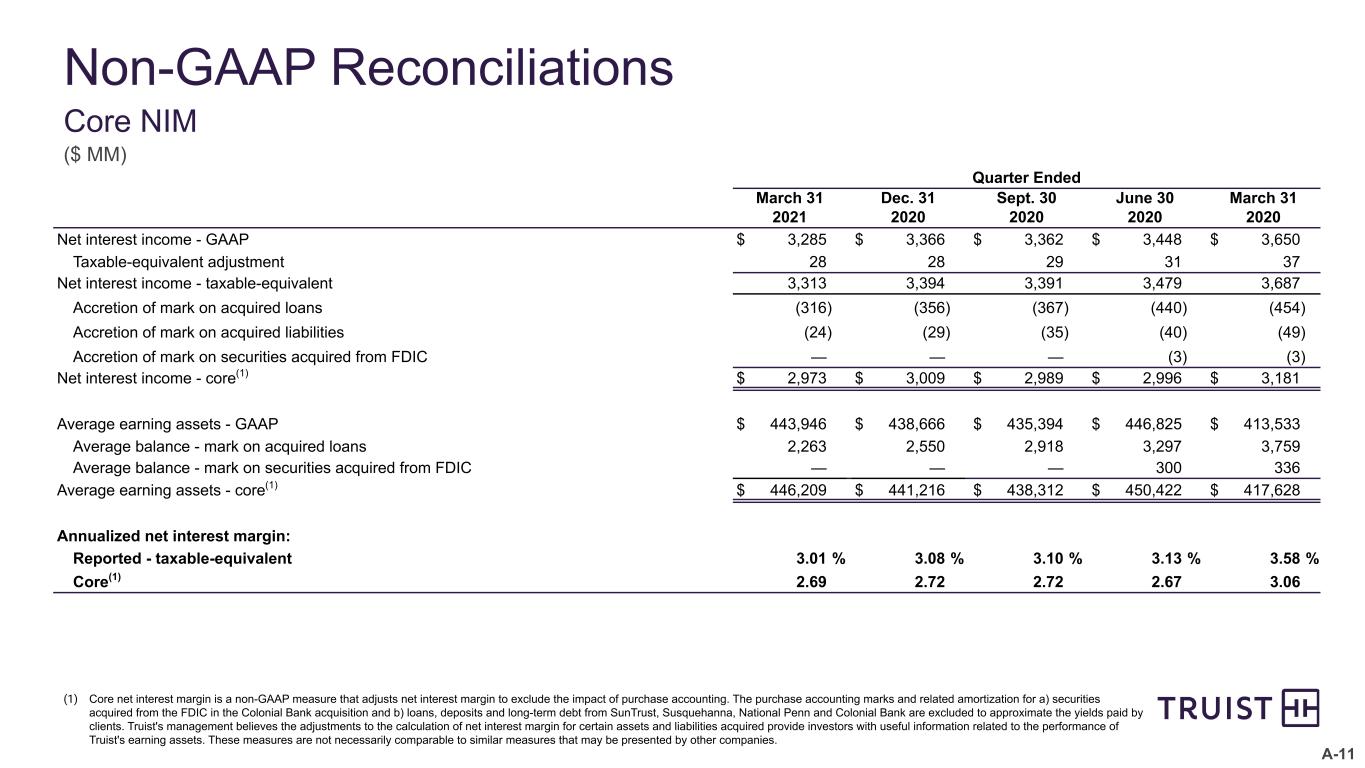
–Net interest margin was 3.01 percent, down seven basis points from fourth quarter 2020
–Core net interest margin was 2.69 percent, down three basis points from fourth quarter 2020
•Noninterest expense was $3.6 billion
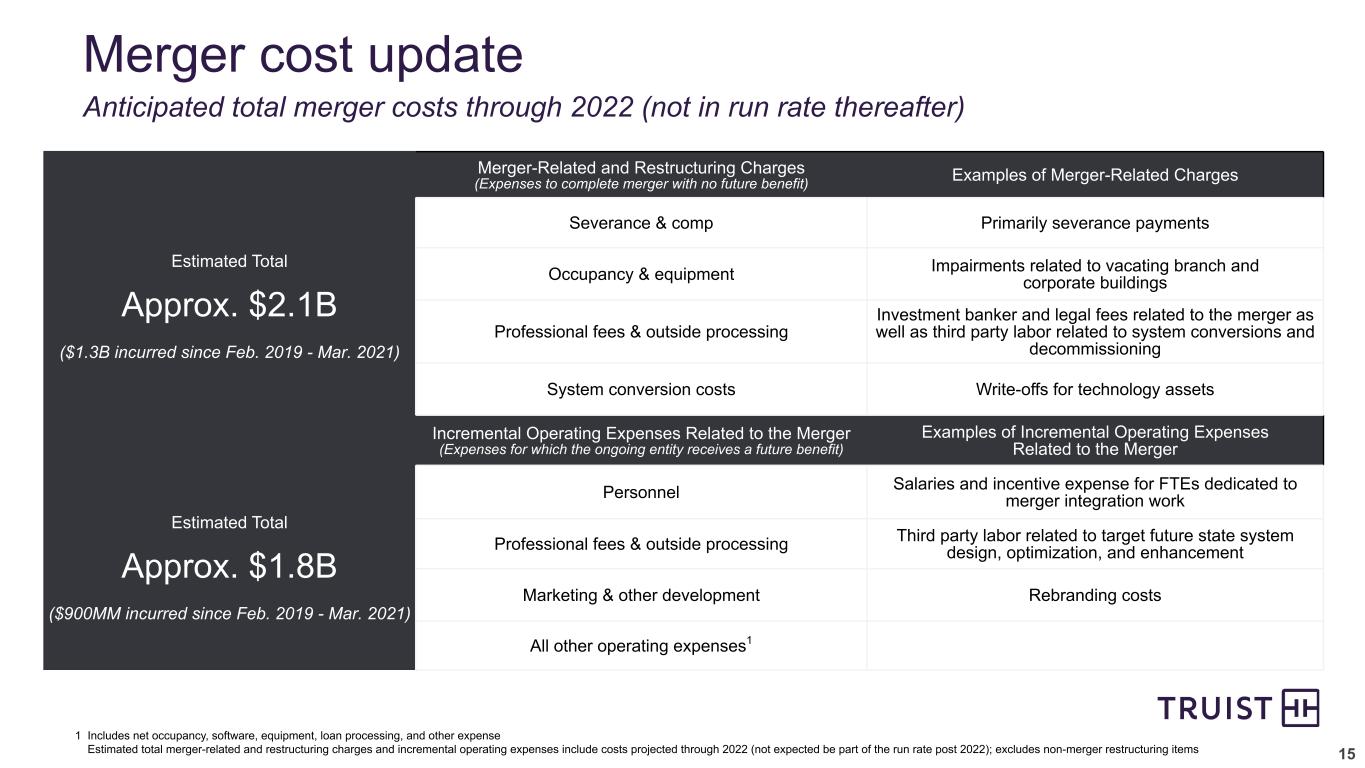
–Noninterest expense includes $141 million of merger-related and restructuring charges and $175 million of incremental operating expenses related to the merger
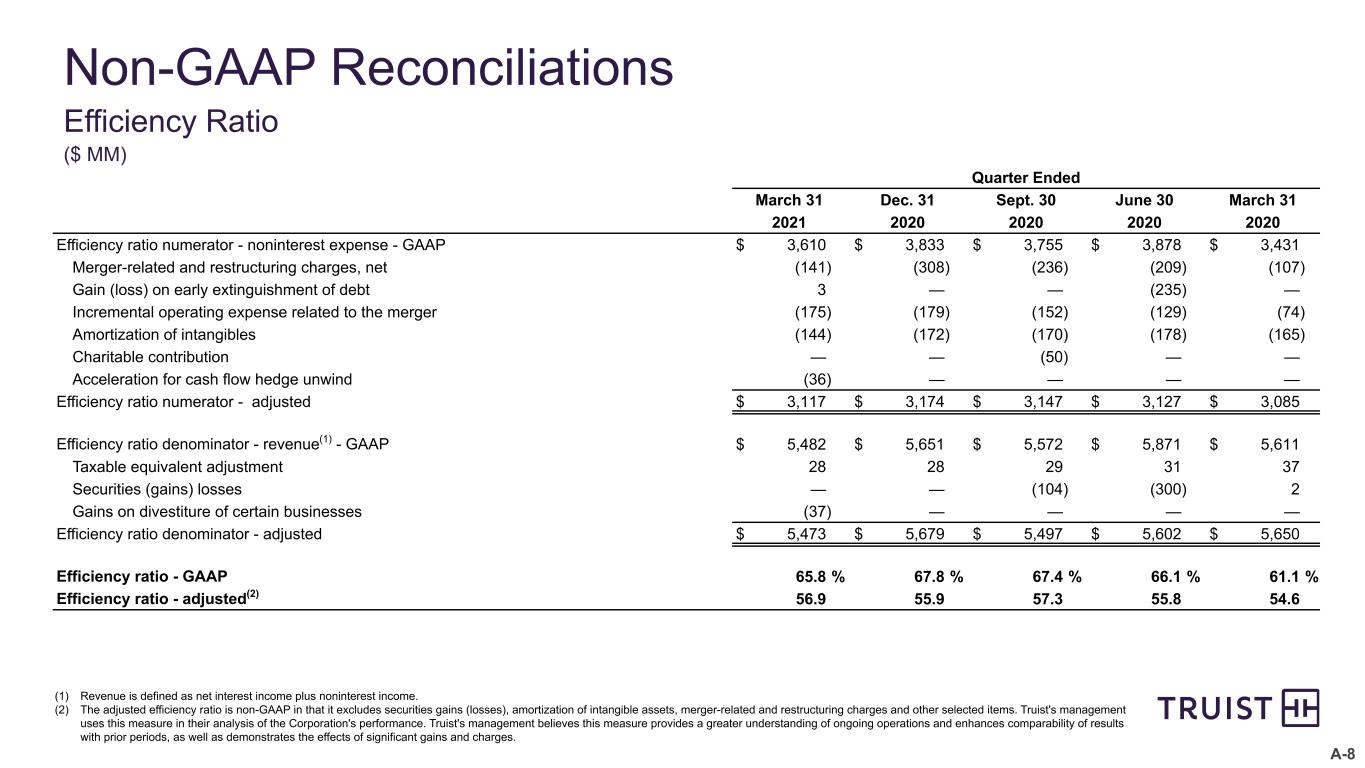
–GAAP efficiency ratio was 65.8 percent, compared to 67.8 percent for fourth quarter 2020
–Adjusted efficiency ratio was 56.9 percent, compared to 55.9 percent for fourth quarter 2020
•Asset quality ratios remain stable reflecting diversification benefits of the merger and effective problem asset resolution
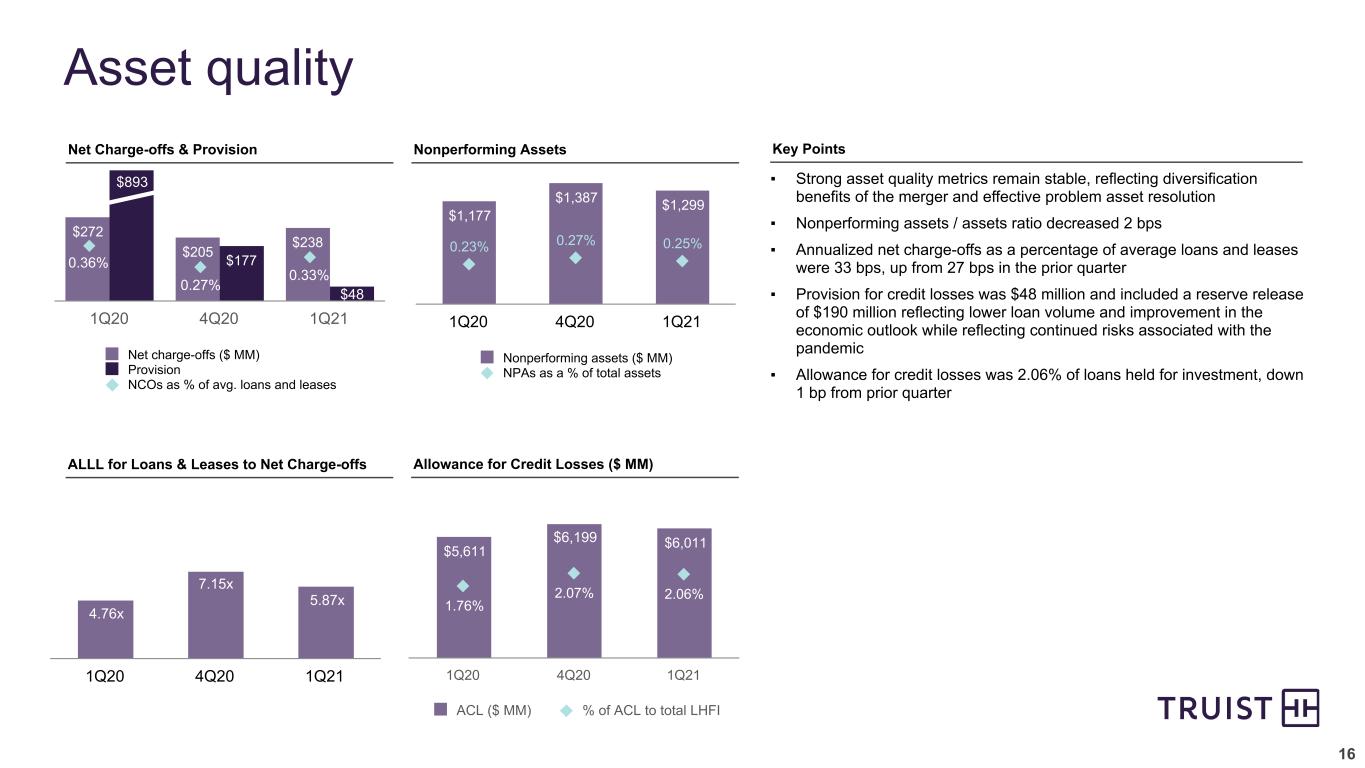
–Nonperforming assets were 0.25 percent of total assets, down two basis points from the fourth quarter of 2020
–Loans 90 days or more past due and still accruing were 0.71 percent of loans held for investment, up from 0.67 percent for the fourth quarter of 2020; the increase was almost entirely in government guaranteed loans
–Excluding government guaranteed loans, loans 90 days or more past due and still accruing were 0.04 percent of loans held for investment
–Net charge-offs were 0.33 percent of average loans and leases, up six basis points compared to the fourth quarter of 2020
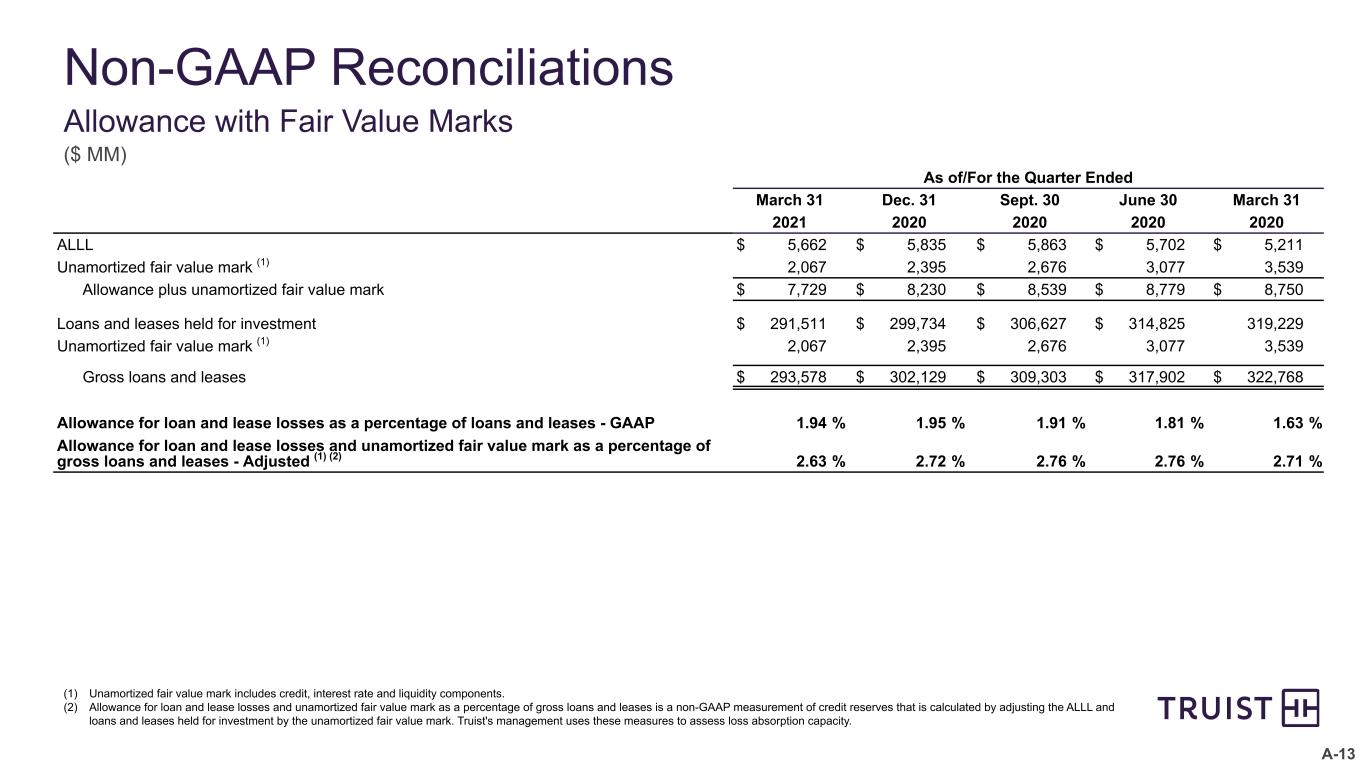
–The allowance for loan and lease losses was 1.94 percent of loans and leases held for investment compared to 1.95 percent for fourth quarter 2020
–Provision for credit losses was $48 million for the first quarter of 2021, which includes a release of $190 million primarily reflecting lower loan balances and improved economic outlook
–The allowance for loan and lease loss coverage ratio was 4.84 times nonperforming loans and leases held for investment, versus 4.39 times in the fourth quarter of 2020
- 2 -
•Capital and liquidity levels remained strong
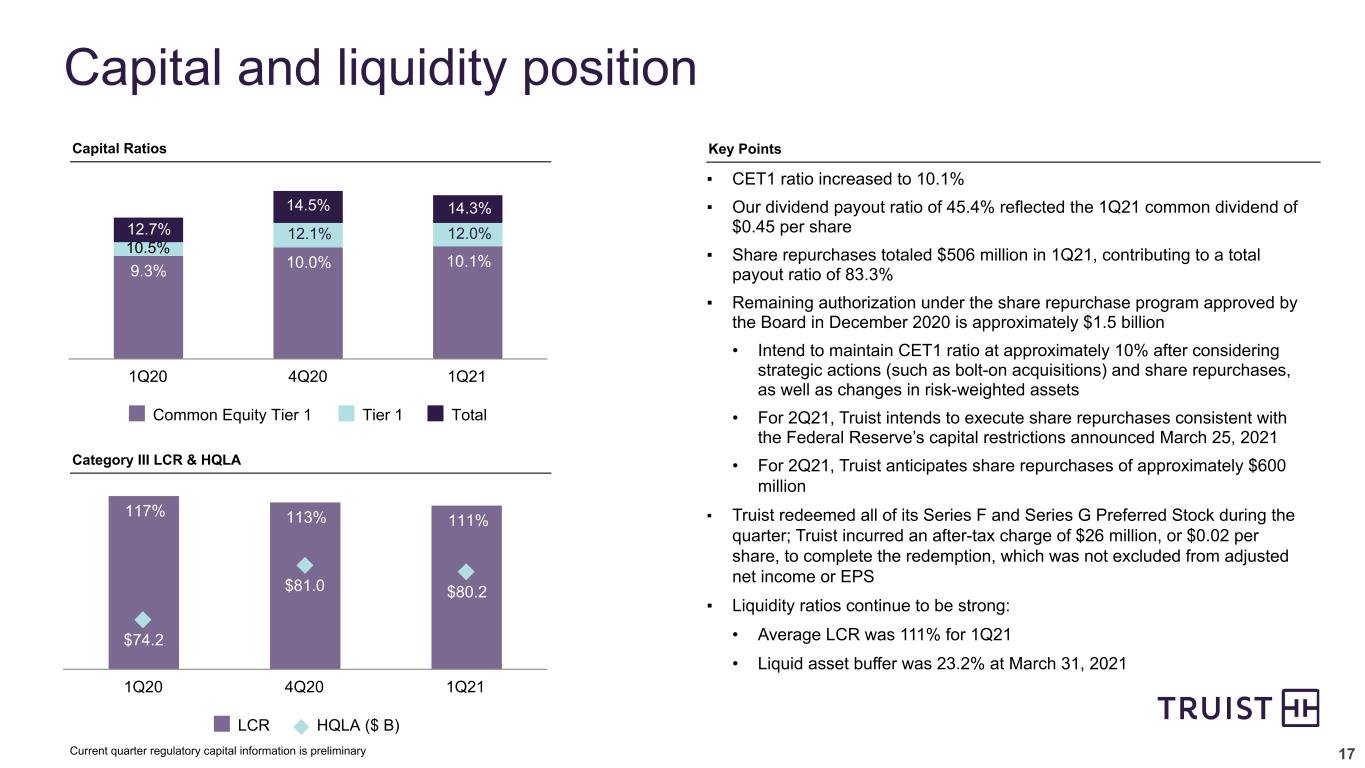
–Common equity tier 1 to risk-weighted assets was 10.1 percent
–Tier 1 risk-based capital was 12.0 percent
–Total risk-based capital was 14.3 percent
–Repurchased $506 million of common shares
–Redeemed $950 million of preferred stock
–Consolidated average LCR ratio was 111 percent
| EARNINGS HIGHLIGHTS | Change 1Q21 vs. | ||||||||||||||||
| (dollars in millions, except per share data) | 1Q21 | 4Q20 | 1Q20 | 4Q20 | 1Q20 | ||||||||||||
| Net income available to common shareholders | $ | 1,334 | $ | 1,228 | $ | 986 | $ | 106 | $ | 348 | |||||||
| Diluted earnings per common share | 0.98 | 0.90 | 0.73 | 0.08 | 0.25 | ||||||||||||
| Net interest income - taxable equivalent | $ | 3,313 | $ | 3,394 | $ | 3,687 | $ | (81) | $ | (374) | |||||||
| Noninterest income | 2,197 | 2,285 | 1,961 | (88) | 236 | ||||||||||||
| Total taxable-equivalent revenue | $ | 5,510 | $ | 5,679 | $ | 5,648 | $ | (169) | $ | (138) | |||||||
| Less taxable-equivalent adjustment | 28 | 28 | 37 | ||||||||||||||
| Total revenue | $ | 5,482 | $ | 5,651 | $ | 5,611 | |||||||||||
| Return on average assets | 1.17 | % | 1.05 | % | 0.90 | % | 0.12 | % | 0.27 | % | |||||||
| Return on average risk-weighted assets (current quarter is preliminary) | 1.58 | 1.40 | 1.12 | 0.18 | 0.46 | ||||||||||||
| Return on average common shareholders' equity | 8.69 | 7.88 | 6.58 | 0.81 | 2.11 | ||||||||||||
Return on average tangible common shareholders' equity (1) | 16.40 | 14.99 | 13.23 | 1.41 | 3.17 | ||||||||||||
| Net interest margin - taxable equivalent | 3.01 | 3.08 | 3.58 | (0.07) | (0.57) | ||||||||||||
(1)Excludes certain items as detailed in the non-GAAP reconciliations in the Quarterly Performance Summary.
First Quarter 2021 compared to Fourth Quarter 2020
Total taxable-equivalent revenue was $5.5 billion for the first quarter of 2021, a decrease of $169 million compared to the prior quarter.
Net interest income for the first quarter of 2021 was down $81 million compared to the prior quarter due to fewer days, lower purchase accounting accretion and lower rates on earning assets. These decreases were partially offset by lower funding costs. Average earning assets increased $5.3 billion compared to the prior quarter. Average securities available for sale increased $20.2 billion, while average other earning assets decreased $6.5 billion and average total loans decreased $8.6 billion. The growth in average earnings assets is a result of an increase in investment securities driven by strong deposit growth resulting from fiscal stimulus. The investment in securities positively impacted net interest income compared to the yields available on excess balances at the Federal Reserve. Average interest-bearing deposits increased $6.4 billion primarily due to clients receiving government stimulus funds, while average long-term debt decreased $2.5 billion primarily due to maturities. In addition, average noninterest-bearing deposits increased $1.5 billion compared to the fourth quarter of 2020.
The net interest margin was 3.01 percent for the first quarter, down seven basis points compared to the prior quarter. The yield on the total loan portfolio for the first quarter was 4.09 percent, down three basis points compared to the prior quarter primarily due to lower accretion of the fair value mark on the merged loans. The yield on the average securities portfolio for the first quarter was 1.45 percent, down 15 basis points compared to the prior quarter primarily due to lower yields on new purchases.
- 3 -
The average cost of total deposits was 0.05 percent, down two basis points compared to the prior quarter, and the average cost of interest-bearing deposits was 0.07 percent, down four basis points compared to the prior quarter. The decrease in rates on deposits was primarily attributable to maturities of higher-cost time deposits. The average rate on long-term debt was 1.57 percent, down seven basis points compared to the prior quarter. The decrease in the rate on long-term debt was primarily due to interest expense associated with the completion of structured real estate transactions in the prior quarter and higher-cost debt that matured.
The provision for credit losses was $48 million and net charge-offs were $238 million for the first quarter, compared to $177 million and $205 million, respectively, for the prior quarter. The decrease in the provision for credit losses was primarily due to lower loan balances and improved economic outlook.
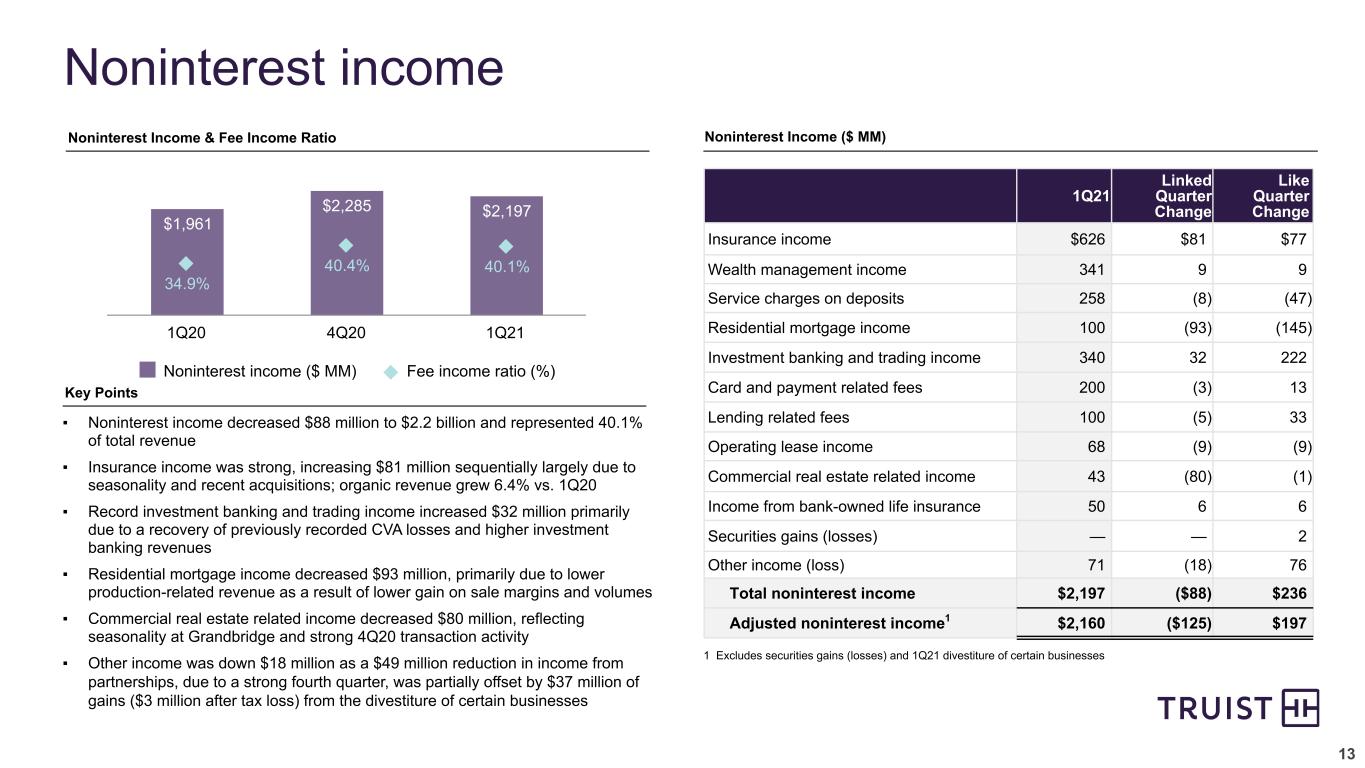
Noninterest income was $2.2 billion, a decrease of $88 million compared to the prior quarter. Insurance income increased $81 million primarily due to seasonality in employee benefits commissions and acquisitions. Investment banking and trading revenues increased $32 million primarily due to a recovery of previously recorded CVA losses, as well as higher investment banking revenues. Residential mortgage income decreased $93 million primarily due to a decrease in production-related revenues resulting from lower gain on sale margins and volumes. Commercial real-estate related income decreased $80 million as the prior record quarter included fees from the completion of structured real estate transactions and seasonality in the commercial mortgage banking business. Other income was down $18 million as partnership income was down $49 million due to a strong fourth quarter, partially offset by gains of $37 million from the divestiture of certain businesses.
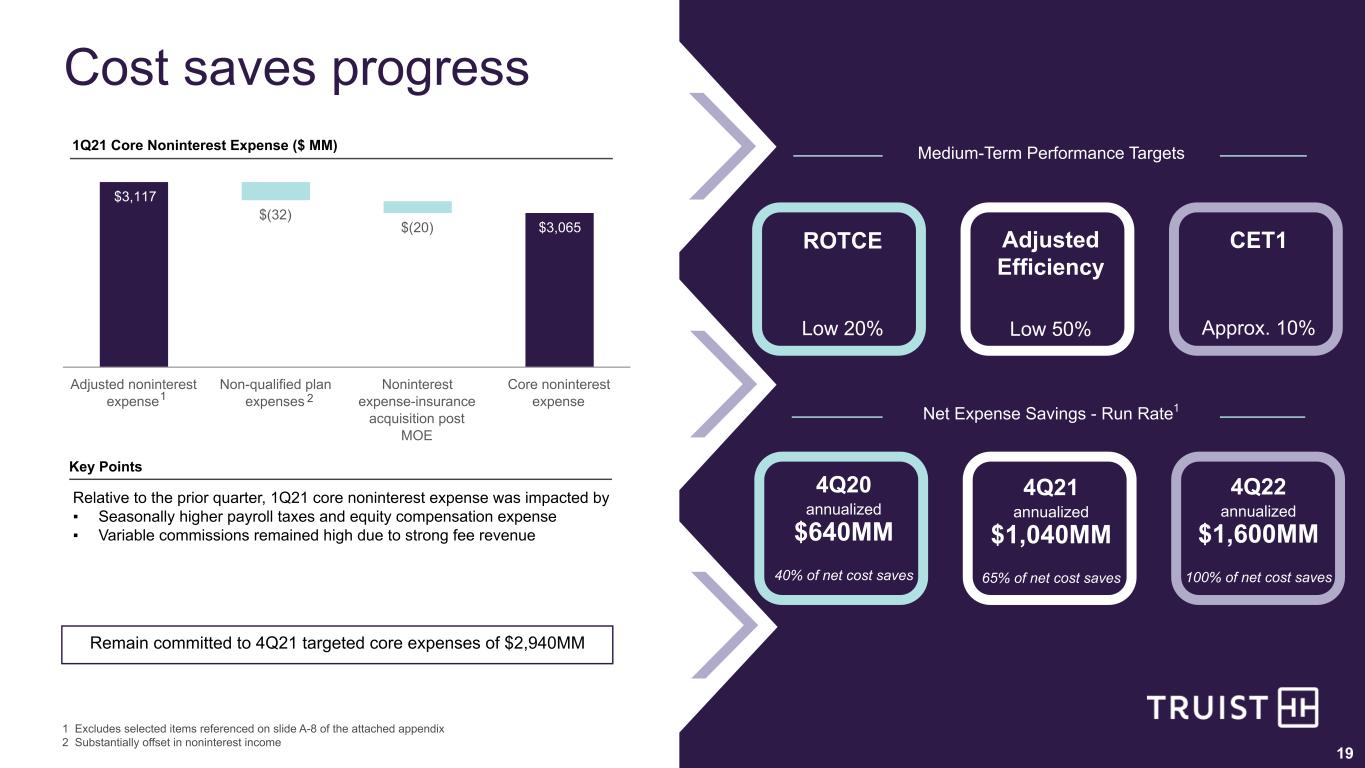
Noninterest expense was $3.6 billion for the first quarter, down $223 million compared to the prior quarter. Merger-related and restructuring charges decreased $167 million primarily due to lower facilities impairments and severance charges. Incremental operating expenses related to the merger decreased $4 million. The current quarter also includes $36 million of expense associated with an acceleration of loss recognition related to certain terminated cash flow hedges. Excluding the items mentioned above and changes in amortization of intangibles and a small gain from debt extinguishment, adjusted noninterest expense was down $57 million. Personnel expense increased $34 million compared to the prior quarter primarily due to higher equity-based compensation due to new grants, payroll taxes due to resetting of limits at the beginning of the year and other employee benefits, partially offset by lower salaries and wages. Incentives expense was relatively flat compared to the prior quarter as increased expense from improved performance in the current period was mostly offset by a decrease resulting from the impact of the job regrading initiative in the prior quarter. Professional fees and outside processing expenses decreased $43 million due to lower spend for professional services for strategic technology projects. Other expense also includes a $42 million decrease due to non-service-related pension cost components.
The provision for income taxes was $351 million for the first quarter of 2021, compared to $311 million for the prior quarter. The effective tax rate for the first quarter of 2021 was 19.2 percent, compared to 19.0 percent for the prior quarter.
First Quarter 2021 compared to First Quarter 2020
Total taxable-equivalent revenues were $5.5 billion for the first quarter of 2021, a decrease of $138 million compared to the earlier quarter.
- 4 -
Net interest income for the first quarter of 2021 was down $374 million compared to the earlier quarter due to lower purchase accounting accretion and lower rates on earning assets. These decreases were partially offset by lower funding costs. Average earning assets increased $30.4 billion compared to the earlier quarter. The increase in average earning assets reflects a $46.5 billion increase in average securities, while average total loans and leases decreased $8.2 billion and average other earning assets decreased $6.3 billion. The growth in average earnings assets is a result of an increase in investment securities driven by strong deposit growth resulting from fiscal stimulus. Average interest-bearing liabilities decreased $7.8 billion compared to the earlier quarter. The decline in average interest-bearing liabilities was offset by significant growth in average noninterest-bearing deposits, which increased $35.4 billion compared to the earlier quarter. Average interest-bearing deposits increased $13.1 billion, while average long-term debt decreased $8.7 billion and average short-term borrowings decreased $12.2 billion.
Net interest margin was 3.01 percent, down 57 basis points compared to the earlier quarter. The yield on the total loan portfolio for the first quarter of 2021 was 4.09 percent, down 89 basis points compared to the earlier quarter, reflecting the impact of rate decreases and lower purchase accounting accretion from merged loans. The yield on the average securities portfolio was 1.45 percent, down 117 basis points compared to the earlier quarter primarily due to lower yields on new purchases.
The average cost of total deposits was 0.05 percent, down 46 basis points compared to the earlier quarter, and the average cost of interest-bearing deposits was 0.07 percent, down 63 basis points compared to the earlier quarter. The average rate on short-term borrowings was 0.82 percent, down 94 basis points compared to the earlier quarter. The average rate on long-term debt was 1.57 percent, down 77 basis points compared to the earlier quarter. The lower rates on interest-bearing liabilities reflect the lower rate environment.
The provision for credit losses was $48 million, compared to $893 million for the earlier quarter. The earlier quarter included the significant uncertainty of the economic impacts resulting from the onset of the pandemic. Net charge-offs for the first quarter of 2021 totaled $238 million compared to $272 million in the earlier quarter. The net charge-off rate for the current quarter of 0.33 percent was down three basis points compared to the first quarter of 2020.
Noninterest income for the first quarter of 2021 increased $236 million compared to the earlier quarter. Investment banking and trading income increased $222 million due to the impact from CVA recoveries in the current period compared to losses in the earlier quarter and strong investment banking income from equity originations, loan syndications and asset securitization transactions. Insurance income increased $77 million due to new business and higher retention, as well as acquisitions. Other income increased $76 million primarily due to income from assets held for certain post-retirement benefits, which is primarily offset by higher personnel expense. Other income also includes a $37 million gain from the divestiture of certain businesses, which was mostly offset by gains from credit default swaps recorded in the earlier quarter. Lending related fees increased $33 million due to gains from the sale of finance leases. Residential mortgage banking income decreased $145 million primarily due to lower production related revenues as a result of lower gain on sale margins and volumes, as well as lower servicing income due to a reduction in the third-party servicing portfolio as a result of prepayments. Service charges on deposits decreased $47 million due to reduced overdraft incident rates.
- 5 -
Noninterest expense for the first quarter of 2021 was up $179 million compared to the earlier quarter. Merger-related and restructuring charges increased $34 million and other incremental operating expenses related to the merger increased $101 million, primarily reflected in professional fees and outside processing. The current quarter also includes $36 million of expense associated with an acceleration of loss recognition related to certain terminated cash flow hedges. Excluding the items mentioned above and changes in amortization of intangibles and a small gain from debt extinguishment, adjusted noninterest expense was up $32 million compared to the earlier quarter. Personnel expense increased $170 million primarily due to higher incentive expenses due to improved performance, higher equity-based compensation expense, higher other employee benefits, partially offset by lower salaries due to fewer FTEs. Other expense also includes decreases of $42 million for non-service-related pension cost components and $20 million for employee travel. There was also a decrease of $51 million from net occupancy expense, marketing and customer development and operating lease depreciation.
The provision for income taxes was $351 million for the first quarter of 2021, compared to $224 million for the earlier quarter. This produced an effective tax rate for the first quarter of 2021 of 19.2 percent, compared to 17.4 percent for the earlier quarter. The higher effective tax rate is primarily due to higher pre-tax income and discrete tax expenses due to the divestiture of certain businesses in the current year.
| LOANS AND LEASES | ||||||||||||||
| (dollars in millions) | ||||||||||||||
| Average balances | 1Q21 | 4Q20 | Change | % Change | ||||||||||
| (annualized) | ||||||||||||||
| Commercial: | ||||||||||||||
| Commercial and industrial | $ | 136,051 | $ | 139,223 | $ | (3,172) | (9.2) | % | ||||||
| CRE | 26,211 | 27,030 | (819) | (12.3) | ||||||||||
| Commercial construction | 6,557 | 6,616 | (59) | (3.6) | ||||||||||
| Lease financing | 4,975 | 5,401 | (426) | (32.0) | ||||||||||
| Total commercial | 173,794 | 178,270 | (4,476) | (10.2) | ||||||||||
| Consumer: | ||||||||||||||
| Residential mortgage | 45,823 | 48,847 | (3,024) | (25.1) | ||||||||||
| Residential home equity and direct | 25,658 | 26,327 | (669) | (10.3) | ||||||||||
| Indirect auto | 26,363 | 25,788 | 575 | 9.0 | ||||||||||
| Indirect other | 10,848 | 11,291 | (443) | (15.9) | ||||||||||
| Student | 7,519 | 7,519 | — | — | ||||||||||
| Total consumer | 116,211 | 119,772 | (3,561) | (12.1) | ||||||||||
| Credit card | 4,645 | 4,818 | (173) | (14.6) | ||||||||||
| Total loans and leases held for investment | $ | 294,650 | $ | 302,860 | $ | (8,210) | (11.0) | |||||||
Average loans and leases held for investment for the first quarter of 2021 were $294.7 billion, down $8.2 billion compared to the fourth quarter of 2020.
Average commercial loans decreased $4.5 billion primarily due to a $1.8 billion decrease in average Paycheck Protection Program loans, an $819 million decrease in average CRE loans and a $647 million decrease due to the transfer of $1.0 billion of certain loans and leases to held for sale late in the fourth quarter of 2020 and continued paydowns on revolving credit lines.
Average consumer loans decreased $3.6 billion primarily due to refinance activity resulting in a decline in residential mortgages and residential home equity and direct loans. This was partially offset by an increase in indirect auto loans.
- 6 -
| DEPOSITS | ||||||||||||||
| (dollars in millions) | ||||||||||||||
| Average balances | 1Q21 | 4Q20 | Change | % Change | ||||||||||
| (annualized) | ||||||||||||||
| Noninterest-bearing deposits | $ | 128,579 | $ | 127,103 | $ | 1,476 | 4.7 | % | ||||||
| Interest checking | 104,744 | 99,866 | 4,878 | 19.8 | ||||||||||
| Money market and savings | 129,303 | 124,692 | 4,611 | 15.0 | ||||||||||
| Time deposits | 20,559 | 23,605 | (3,046) | (52.3) | ||||||||||
| Total deposits | $ | 383,185 | $ | 375,266 | $ | 7,919 | 8.6 | |||||||
Average deposits for the first quarter of 2021 were $383.2 billion, an increase of $7.9 billion compared to the prior quarter. Average interest checking and money market and savings deposit growth was strong for the first quarter of 2021 driven by growth resulting from additional government stimulus programs and pandemic-related client behavior. Average noninterest bearing deposits grew 4.7 percent compared to the prior quarter and represented 33.6 percent of total deposits for the first quarter of 2021, compared to 33.9 percent for the prior quarter.
Average time deposits decreased primarily due to the maturity of wholesale negotiable certificates of deposit and higher-cost personal accounts.
The cost of average total deposits was 0.05 percent for the first quarter, down two basis points compared to the prior quarter. The cost of average interest-bearing deposits was 0.07 percent for the first quarter, down four basis points compared to the prior quarter.
| SEGMENT RESULTS | Change 1Q21 vs. | ||||||||||||||||
| (dollars in millions) | |||||||||||||||||
| Segment Net Income | 1Q21 | 4Q20 | 1Q20 | 4Q20 | 1Q20 | ||||||||||||
| Consumer Banking and Wealth | $ | 803 | $ | 854 | $ | 675 | $ | (51) | $ | 128 | |||||||
| Corporate and Commercial Banking | 908 | 922 | 421 | (14) | 487 | ||||||||||||
| Insurance Holdings | 131 | 99 | 105 | 32 | 26 | ||||||||||||
| Other, Treasury & Corporate | (369) | (545) | (138) | 176 | (231) | ||||||||||||
| Total net income | $ | 1,473 | $ | 1,330 | $ | 1,063 | $ | 143 | $ | 410 | |||||||
- 7 -
First Quarter 2021 compared to Fourth Quarter 2020
Consumer Banking and Wealth ("CB&W")
CB&W serves individuals and small business clients by offering a variety of loan and deposit products, payment services, bankcard products and other financial services by connecting clients to a wide range of financial products and services. CB&W includes Retail Community Bank, which provides banking, borrowing, investing, insurance solutions and advice through Premier Banking to individuals and small business clients through an extensive network of branches and ATMs, digital channels and contact centers. Financial products and services offered include deposits and payments, credit cards, loans, mortgages, brokerage and investment advisory services and insurance solutions. CB&W also includes Dealer Retail Services, which originates loans on an indirect basis to individuals for the purchase of automobiles, boats and recreational vehicles. Additionally, CB&W includes National Consumer Finance & Payments, which provides a comprehensive set of technology-enabled lending solutions to individuals and small businesses through several national channels, as well as merchant services and payment processing solutions to business clients. CB&W also includes Mortgage Banking, which offers residential mortgage products nationally through its retail and correspondent channels, the internet and by telephone. These products are either sold in the secondary market, primarily with servicing rights retained, or held in the Company’s loan portfolio. Mortgage Banking also services loans for other investors, in addition to loans held in the Company’s loan portfolio. Mortgage Banking also includes Mortgage Warehouse Lending, which provides short-term lending solutions to finance first-lien residential mortgage LHFS by independent mortgage companies. Wealth delivers investment management, financial planning, banking, fiduciary services and related solutions to institutions, affluent and high net worth individuals and families, with financial expertise and industry-specific insights in the medical, legal, sports and entertainment industries.
CB&W net income was $803 million for the first quarter of 2021, a decrease of $51 million compared to the prior quarter. Segment net interest income decreased $62 million primarily driven by fewer days, a decline in the funding credit on liabilities and lower purchase accounting accretion. Noninterest income decreased $73 million driven by lower residential mortgage income due to lower gain on sale margins and volumes, partially offset by gains from the divestiture of certain businesses. The allocated provision for credit losses decreased $16 million which reflects an allowance release that was driven by decreasing loan balances and improved economic outlook, partially offset by increased net charge-offs primarily in the auto portfolios. Noninterest expense decreased $50 million primarily due to lower occupancy expense, merger-related expenses, amortization of intangibles, equipment expenses and loan related expenses, partially offset by seasonally higher personnel benefits expenses.
Average loans held for investment decreased $4.4 billion compared to the prior quarter primarily due to lower residential mortgage, home equity lending, divestiture of small ticket loan and lease portfolio and other indirect lending, partially offset by increased indirect auto lending. Average total deposits increased $6.7 billion compared to the prior quarter primarily due to the impact of the government stimulus programs.
- 8 -
Corporate and Commercial Banking ("C&CB")
C&CB serves large, medium and small business clients by offering a variety of loan and deposit products and connecting clients to the combined organization’s broad array of financial services. C&CB includes Corporate and Investment Banking (“CIB”), which delivers a comprehensive range of strategic advisory, capital raising, risk management, financing, liquidity and investment solutions to both public and private companies in the C&CB segment and Wealth. Additionally, C&CB includes Commercial Community Banking, which offers an array of traditional banking products, including lending, cash management and investment banking to commercial clients via CIB. C&CB also includes Commercial Real Estate, which provides a range of credit and deposit services as well as fee-based product offerings to privately held developers, operators and investors in commercial real estate properties. C&CB also includes Grandbridge Real Estate Capital, which is a fully integrated commercial mortgage banking company that originates commercial and multi-family real estate loans, services loan portfolios and provides asset and portfolio management as well as real estate brokerage services. Treasury Solutions, within C&CB, provides business clients across the organization with services required to manage their payments and receipts, combined with the ability to manage and optimize their deposits across all aspects of their business.
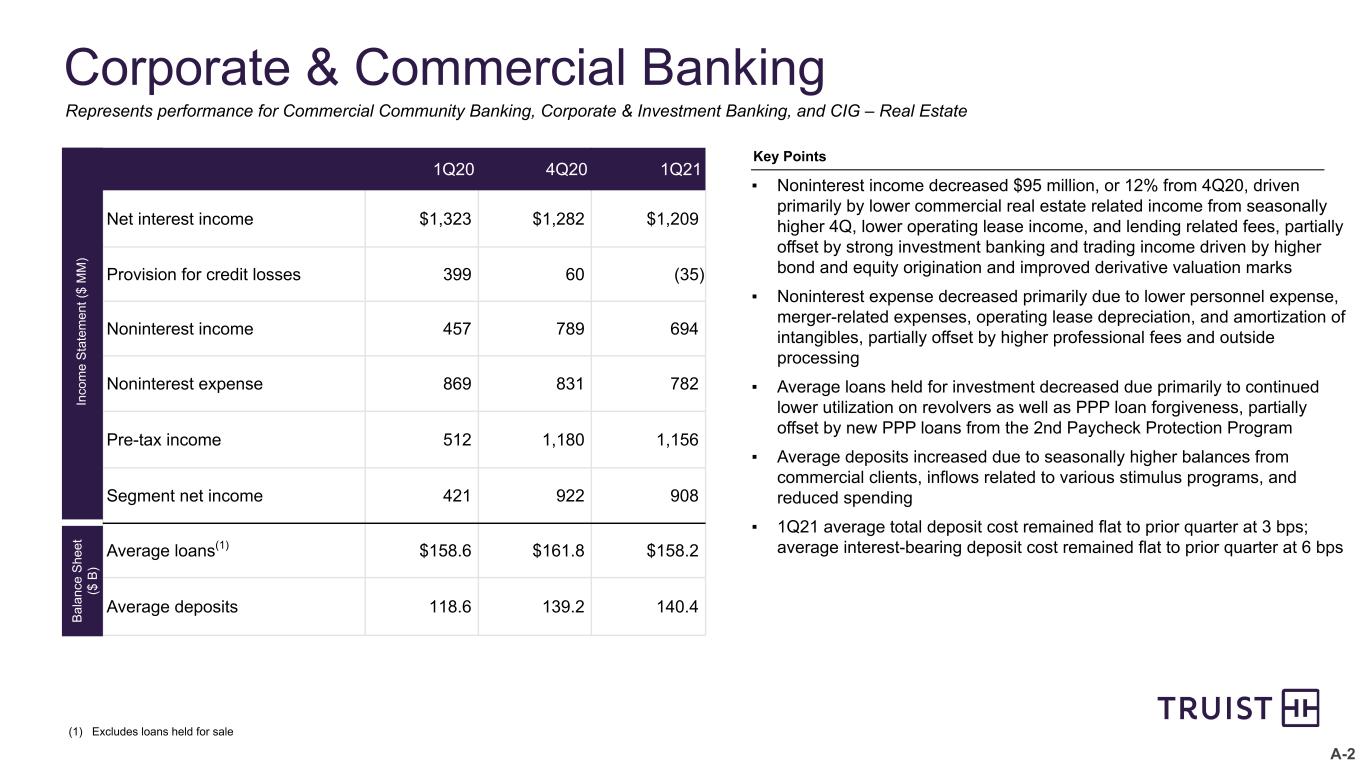
C&CB net income was $908 million for the first quarter of 2021, a decrease of $14 million compared to the prior quarter. Segment net interest income decreased $73 million primarily due to reduced funding credit on liabilities, fewer days and lower purchase accounting accretion. Noninterest income decreased $95 million primarily due to seasonally strong commercial real-estate related income in the prior quarter and lower partnership income, partially offset by higher investment banking and trading revenues. The allocated provision for credit losses decreased $95 million which reflects an allowance release primarily driven by a decline in loan balances and an improved economic outlook, partially offset by a modest decrease in recoveries. Noninterest expense decreased $49 million primarily due to lower incentives and merger-related expenses.
Average loans held for investment decreased $3.6 billion compared to the prior quarter due primarily to pay-downs on drawn revolvers and forgiveness of Paycheck Protection Program loans, partially offset by funding for the second round of Paycheck Protection Program loans. Average total deposits increased $1.2 billion compared to the prior quarter primarily due to seasonally higher balances from commercial clients.
Insurance Holdings ("IH")
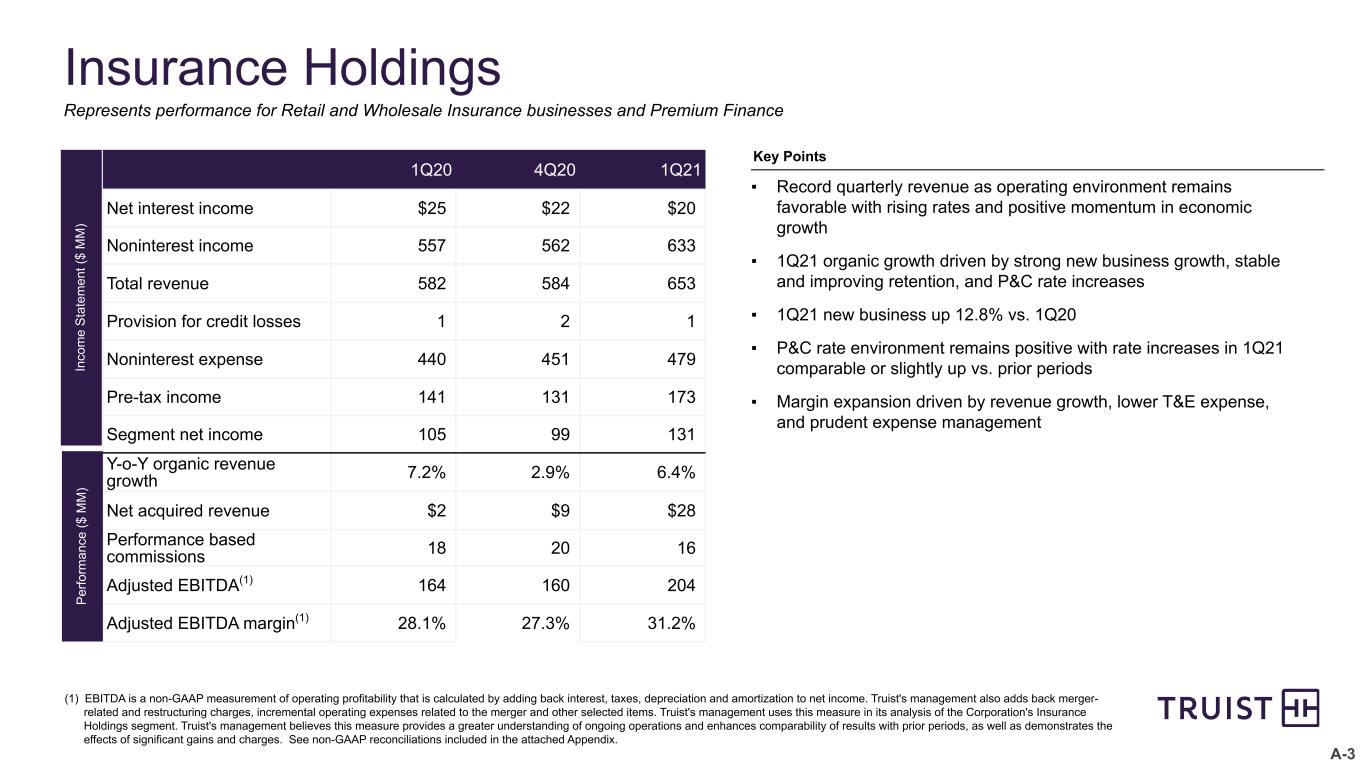
Truist’s IH segment is one of the largest insurance brokers in the world, providing property and casualty, employee benefits and life insurance to businesses and individuals. It also provides small business and corporate services, such as workers compensation and professional liability, as well as surety coverage and title insurance. In addition, IH provides premium financing for property and casualty insurance.
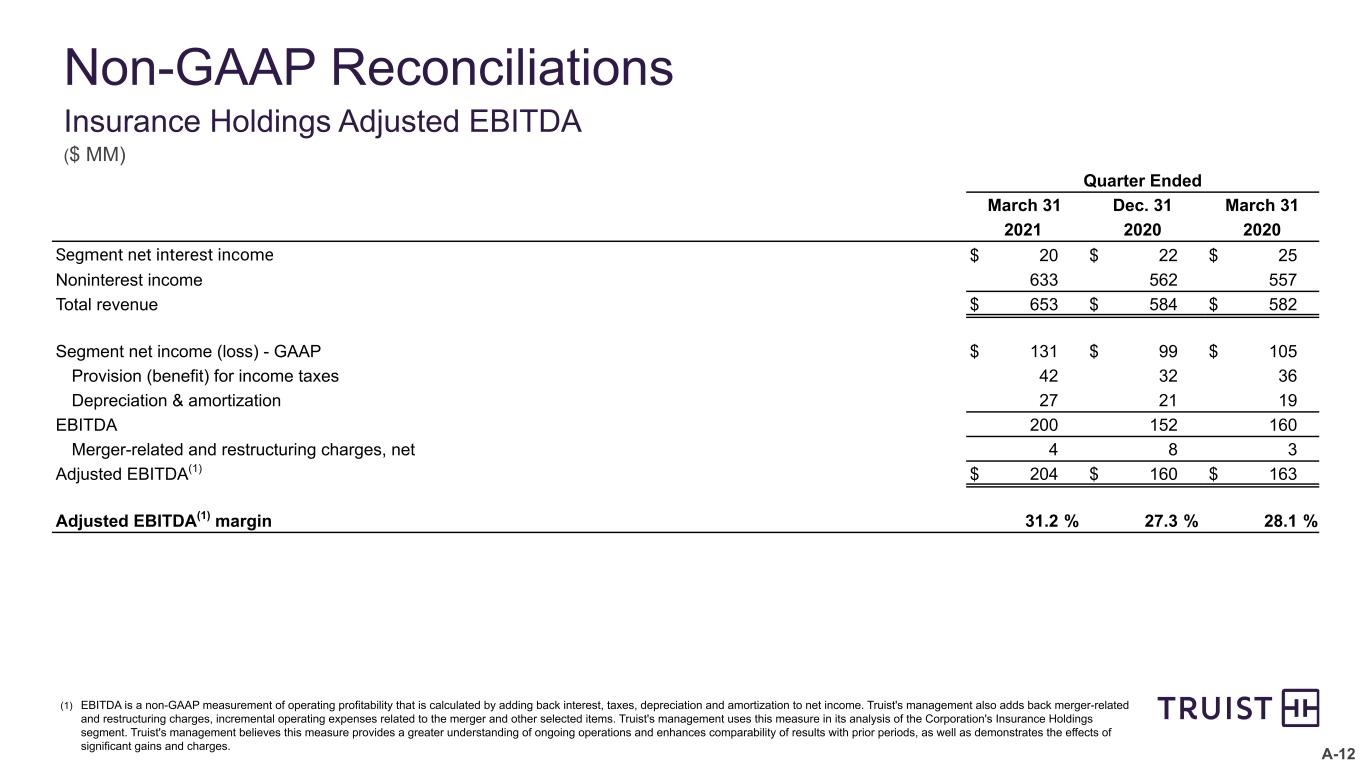
IH net income was $131 million for the first quarter of 2021, an increase of $32 million compared to the prior quarter. Noninterest income increased $71 million primarily due to seasonality in employee benefits insurance commissions as well as acquisitions. Noninterest expense increased $28 million primarily due to seasonally higher performance-based incentives and increased amortization of intangibles, partially offset by lower merger-related charges.
Other, Treasury & Corporate ("OT&C")
Net income in OT&C can vary due to the changing needs of the Corporation, including the size of the investment portfolio, the need for wholesale funding and variability associated with derivatives used to hedge the balance sheet.
- 9 -
OT&C generated a net loss of $369 million for the first quarter of 2021, compared to a net loss of $545 million for the prior quarter. Segment net interest income increased $56 million primarily due to higher earnings in the securities portfolio from purchases to utilize excess liquidity. Noninterest expense decreased $152 million primarily due to lower merger-related expenses, professional service fees and outside processing, as well as employee benefits, partially offset by higher incentives, marketing expenses and licensing fees. The benefit for income taxes decreased $58 million primarily due to a lower pre-tax loss in the current quarter.
First Quarter 2021 compared to First Quarter 2020
Consumer Banking and Wealth
CB&W net income was $803 million for the first quarter of 2021, an increase of $128 million compared to the earlier quarter. Segment net interest income decreased $119 million primarily due to a decline in the funding credit provided on liabilities and lower purchase accounting accretion. Noninterest income decreased $145 million driven by lower residential mortgage income due to lower gain on sale margins and volumes, partially offset by gains from the divestiture of certain businesses. The allocated provision for credit losses decreased $337 million reflecting an allowance build during the first quarter of 2020 resulting from the deteriorating economic outlook caused by the onset of the pandemic, as well as a benefit from lower charge offs in the auto portfolios compared to the prior year. Noninterest expense decreased $94 million primarily due to lower amortization of intangibles, merger related expenses and occupancy expenses in the current quarter.
Corporate and Commercial Banking
C&CB net income was $908 million for the first quarter of 2021, an increase of $487 million compared to the earlier quarter. Segment net interest income decreased $114 million primarily due to reduced funding credit on liabilities and lower purchase accounting accretion. Noninterest income increased $237 million driven by investment banking, recovery of previously recorded CVA losses and lending related fees. The allocated provision for credit losses decreased $434 million primarily reflecting the impact of a significant allowance build in the first quarter of 2020 resulting from the deteriorating economic outlook caused by the onset of the pandemic. Noninterest expense decreased $87 million primarily due to lower personnel related expenses, merger related expenses and operating lease depreciation in the current quarter.
Insurance Holdings
IH net income was $131 million for the first quarter of 2021, an increase of $26 million compared to the earlier quarter. Noninterest income increased $76 million primarily due to higher property and casualty insurance production as well as acquisitions. Noninterest expense increased $39 million primarily due to higher performance-based incentives and amortization of intangibles related to the acquisitions.
Other, Treasury & Corporate
OT&C generated a net loss of $369 million in the first quarter of 2021, compared to a net loss of $138 million in the earlier quarter. Segment net interest income decreased $127 million primarily due to lower net funding charges to other segments due to lower market rates, partially offset by lower interest expense on borrowings. Noninterest income increased $68 million primarily due to income from assets held for certain post-retirement benefits. The allocated provision for credit losses decreased $74 million due to changes in the reserve for unfunded commitments and an allowance build in the earlier quarter resulting from the onset of the pandemic. Noninterest expense increased $321 million primarily due to higher incremental operating expenses related to the merger and higher merger-related charges in the current quarter. The benefit for income taxes increased $75 million primarily due to a higher pre-tax loss in the current quarter.
- 10 -
| CAPITAL RATIOS | 1Q21 | 4Q20 | 3Q20 | 2Q20 | 1Q20 | ||||||||||||
| Risk-based: | (preliminary) | ||||||||||||||||
| Common equity Tier 1 | 10.1 | % | 10.0 | % | 10.0 | % | 9.7 | % | 9.3 | % | |||||||
| Tier 1 | 12.0 | 12.1 | 12.2 | 11.6 | 10.5 | ||||||||||||
| Total | 14.3 | 14.5 | 14.6 | 14.0 | 12.7 | ||||||||||||
| Leverage | 9.4 | 9.6 | 9.6 | 9.0 | 9.0 | ||||||||||||
| Supplementary leverage | 8.3 | 8.7 | 8.9 | 8.5 | 7.8 | ||||||||||||
Capital ratios remained strong compared to the regulatory levels for well capitalized banks. Truist declared common dividends of $0.450 per share during the first quarter of 2021 and completed $506 million of share repurchases. The dividend and total payout ratios for the first quarter of 2021 were 45.4 percent and 83.3 percent, respectively. Truist also redeemed $950 million of preferred stock during the quarter to optimize the Company's capital position. In connection with the redemptions of preferred stock, net income available to common shareholders was reduced by $26 million to recognize the difference between the redemption price and the carrying value.
Truist has approximately $1.5 billion authorization remaining under the share repurchase program approved by the Board of Directors in December 2020. Management’s intention is to maintain an approximate 10 percent Common Equity Tier 1 ratio after considering strategic actions such as non-bank acquisitions or stock repurchases, as well as changes in risk-weighted assets. For the second quarter of 2021, Truist intends to execute share repurchases consistent with the Federal Reserve's capital restrictions announced on March 25, 2021. In addition to these restrictions, any future stock repurchase activity will be informed by economic and regulatory considerations as well as Truist’s capital position, earnings outlook and capital deployment priorities.
Truist's average LCR was 111 percent for the three months ended March 31, 2021, compared to the regulatory minimum of 100 percent. Truist continues to maintain a strong liquidity position and is prepared to meet the funding needs of clients. In addition, the liquid asset buffer, which is defined as high quality unencumbered liquid assets as a percentage of total assets, was 23.2 percent at March 31, 2021.
- 11 -
| ASSET QUALITY | |||||||||||||||||
| (dollars in millions) | 1Q21 | 4Q20 | 3Q20 | 2Q20 | 1Q20 | ||||||||||||
| Total nonperforming assets | $ | 1,299 | $ | 1,387 | $ | 1,314 | $ | 1,252 | $ | 1,177 | |||||||
| Total performing TDRs | 1,539 | 1,361 | 1,217 | 1,107 | 1,079 | ||||||||||||
| Total loans 90 days past due and still accruing | 2,072 | 2,008 | 1,197 | 1,072 | 1,748 | ||||||||||||
| Total loans 30-89 days past due | 1,788 | 2,220 | 2,148 | 1,901 | 2,374 | ||||||||||||
Nonperforming loans and leases as a percentage of loans and leases held for investment | 0.40 | % | 0.44 | % | 0.37 | % | 0.35 | % | 0.32 | % | |||||||
| Nonperforming loans and leases as a percentage of loans and leases, including loans held for sale | 0.42 | 0.44 | 0.40 | 0.37 | 0.33 | ||||||||||||
Nonperforming assets as a percentage of total assets | 0.25 | 0.27 | 0.26 | 0.25 | 0.23 | ||||||||||||
Loans 30-89 days past due and still accruing as a percentage of loans and leases | 0.61 | 0.74 | 0.70 | 0.60 | 0.74 | ||||||||||||
Loans 90 days or more past due and still accruing as a percentage of loans and leases | 0.71 | 0.67 | 0.39 | 0.34 | 0.55 | ||||||||||||
| Loans 90 days or more past due and still accruing as a percentage of loans and leases, excluding PPP and other government guaranteed | 0.04 | 0.04 | 0.03 | 0.04 | 0.04 | ||||||||||||
Allowance for loan and lease losses as a percentage of loans and leases held for investment | 1.94 | 1.95 | 1.91 | 1.81 | 1.63 | ||||||||||||
Net charge-offs as a percentage of average loans and leases, annualized | 0.33 | 0.27 | 0.42 | 0.39 | 0.36 | ||||||||||||
Ratio of allowance for loan and lease losses to net charge-offs, annualized | 5.87x | 7.15x | 4.52x | 4.49x | 4.76x | ||||||||||||
Ratio of allowance for loan and lease losses to nonperforming loans and leases held for investment | 4.84x | 4.39x | 5.22x | 5.24x | 5.04x | ||||||||||||
Nonperforming assets totaled $1.3 billion at March 31, 2021, down $88 million compared to December 31, 2020. Nonperforming loans and leases represented 0.42 percent of total loans and leases, down two basis points compared to December 31, 2020. Nonperforming loans and leases held for investment decreased $159 million, primarily in the commercial and industrial portfolio, while nonperforming loans held for sale increased $67 million as a portfolio of residential mortgage loans was transferred to held for sale during the quarter.
Performing TDRs were up $178 million during the first quarter primarily in the residential mortgage and commercial and industrial portfolios. The increase in residential mortgage was driven by modifications of loans that were not eligible for relief in accordance with the provisions of the CARES Act. The increase in commercial and industrial loan modifications was driven by an increase in the volume of loans entering workout agreements.
Loans 90 days or more past due and still accruing totaled $2.1 billion at March 31, 2021, up $64 million compared to the prior quarter. The increase was primarily in residential mortgage loans due to the repurchase of delinquent government guaranteed loans. The ratio of loans 90 days or more past due and still accruing as a percentage of loans and leases was 0.71 percent at March 31, 2021, up four basis points from the prior quarter. Excluding government guaranteed loans, the ratio of loans 90 days or more past due and still accruing as a percentage of loans and leases was 0.04 percent at March 31, 2021, unchanged from December 31, 2020.
Loans 30-89 days past due and still accruing totaled $1.8 billion at March 31, 2021, down $432 million compared to the prior quarter. The decrease was primarily in consumer loans for residential mortgage and indirect automobile due to seasonality and consumers receiving stimulus funds. The ratio of loans 30-89 days past due and still accruing as a percentage of loans and leases was 0.61 percent at March 31, 2021 down 13 basis points from the prior quarter.
- 12 -
Net charge-offs during the first quarter totaled $238 million, up $33 million compared to the prior quarter. As a percentage of average loans and leases, annualized net charge-offs were 0.33 percent, up six basis points compared to the prior quarter. The increase in net charge-offs was primarily in the indirect auto portfolio due to seasonality.
The allowance for credit losses was $6.0 billion and includes $5.7 billion for loans and leases and $349 million for the reserve for unfunded commitments. The allowance for loan and lease losses represented 1.94 percent of loans and leases held for investment compared to 1.95 percent at December 31, 2020. The allowance for loan and lease losses covered nonperforming loans and leases held for investment 4.84 times compared to 4.39 times at December 31, 2020. At March 31, 2021, the allowance for loan and lease losses was 5.87 times annualized net charge-offs, compared to 7.15 times at December 31, 2020.
Earnings Presentation and Quarterly Performance Summary
To listen to Truist's live first quarter 2021 earnings conference call at 8 a.m. ET today, please call 866-519-2796 and enter the participant code 391805. A presentation will be used during the earnings conference call and is available on our website at https://ir.truist.com/events-and-presentation. Replays of the conference call will be available for 30 days by dialing 888-203-1112 (access code 391805).
The presentation, including an appendix reconciling non-GAAP disclosures, and Truist's First Quarter 2021 Quarterly Performance Summary, which contains detailed financial schedules, are available at https://ir.truist.com/earnings.
About Truist
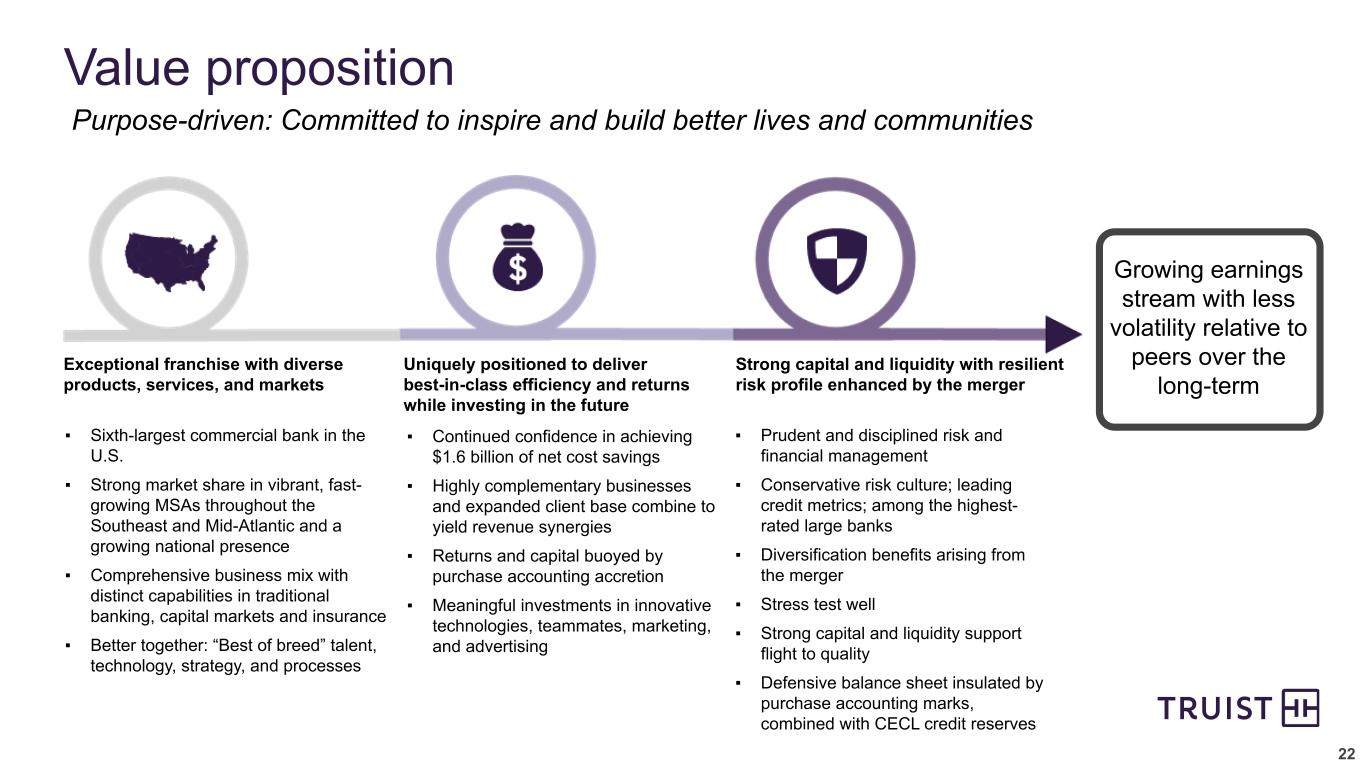
Truist Financial Corporation is a purpose-driven financial services company committed to inspiring and building better lives and communities. Formed by the historic merger of equals of BB&T and SunTrust, Truist has leading market share in many high-growth markets in the country. The company offers a wide range of services including retail, small business and commercial banking; asset management; capital markets; commercial real estate; corporate and institutional banking; insurance; mortgage; payments; specialized lending; and wealth management. Headquartered in Charlotte, North Carolina, Truist is the sixth-largest commercial bank in the U.S. with total assets of $518 billion as of March 31, 2021. Truist Bank, Member FDIC. Learn more at Truist.com.
#-#-#
Capital ratios and return on risk-weighted assets are preliminary.
This news release contains financial information and performance measures determined by methods other than in accordance with accounting principles generally accepted in the United States of America ("GAAP"). Truist's management uses these "non-GAAP" measures in their analysis of the Corporation's performance and the efficiency of its operations. Management believes these non-GAAP measures provide a greater understanding of ongoing operations, enhance comparability of results with prior periods and demonstrate the effects of significant items in the current period. The Corporation believes a meaningful analysis of its financial performance requires an understanding of the factors underlying that performance. Truist's management believes investors may find these non-GAAP financial measures useful. These disclosures should not be viewed as a substitute for financial measures determined in accordance with GAAP, nor are they necessarily comparable to non-GAAP performance measures that may be presented by other companies. Below is a listing of the types of non-GAAP measures used in this news release:
•Adjusted Efficiency Ratio - The adjusted efficiency ratio is non-GAAP in that it excludes securities gains (losses), amortization of intangible assets, merger-related and restructuring charges and other selected items. Truist's management uses this measure in their analysis of the Corporation's performance. Truist's management believes this measure provides a greater understanding of ongoing operations and enhances comparability of results with prior periods, as well as demonstrates the effects of significant gains and charges.
- 13 -
•Tangible Common Equity and Related Measures - Tangible common equity and related measures are non-GAAP measures that exclude the impact of intangible assets, net of deferred taxes, and their related amortization. These measures are useful for evaluating the performance of a business consistently, whether acquired or developed internally. Truist's management uses these measures to assess the quality of capital and returns relative to balance sheet risk.
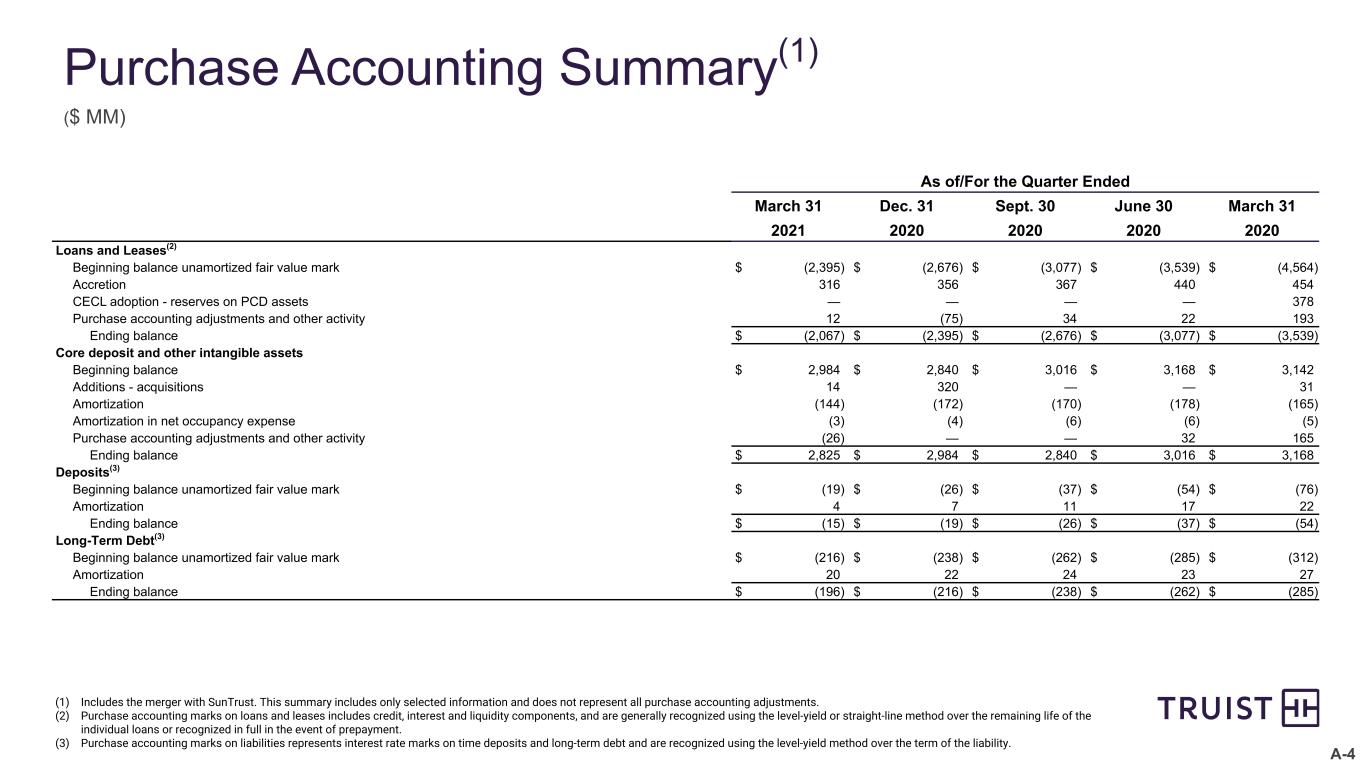
•Core NIM - Core net interest margin is a non-GAAP measure that adjusts net interest margin to exclude the impact of purchase accounting. The purchase accounting marks and related amortization for a) securities acquired from the FDIC in the Colonial Bank acquisition and b) loans, deposits and long-term debt from SunTrust, Susquehanna, National Penn and Colonial Bank are excluded to approximate the yields paid by clients. Truist's management believes the adjustments to the calculation of net interest margin for certain assets and liabilities acquired provide investors with useful information related to the performance of Truist's earning assets.
•Adjusted Diluted EPS - The adjusted diluted earnings per share is non-GAAP in that it excludes merger-related and restructuring charges and other selected items, net of tax. Truist's management uses this measure in their analysis of the Corporation's performance. Truist's management believes this measure provides a greater understanding of ongoing operations and enhances comparability of results with prior periods, as well as demonstrates the effects of significant gains and charges.
•Performance Ratios - The adjusted performance ratios, including adjusted return on average assets, adjusted return on average common shareholders’ equity and adjusted return on average tangible common shareholders’ equity, are non-GAAP in that they exclude merger-related and restructuring charges, selected items and, in the case of return on average tangible common shareholders' equity, amortization of intangible assets. Truist's management uses these measures in their analysis of the Corporation's performance. Truist's management believes these measures provide a greater understanding of ongoing operations and enhances comparability of results with prior periods, as well as demonstrates the effects of significant gains and charges.
•Insurance Holdings Adjusted EBITDA - EBITDA is a non-GAAP measurement of operating profitability that is calculated by adding back interest, taxes, depreciation and amortization to net income. Truist's management also adds back merger-related and restructuring charges, incremental operating expenses related to the merger and other selected items. Truist's management uses this measure in its analysis of the Corporation's Insurance Holdings segment. Truist's management believes this measure provides a greater understanding of ongoing operations and enhances comparability of results with prior periods, as well as demonstrates the effects of significant gains and charges.
•Allowance for Loan and Lease Losses and Unamortized Fair Value Mark as a Percentage of Gross Loans and Leases - Allowance for loan and lease losses and unamortized fair value mark as a percentage of gross loans and leases is a non-GAAP measurement of credit reserves that is calculated by adjusting the ALLL and loans and leases held for investment by the unamortized fair value mark. Truist's management uses these measures to assess loss absorption capacity.
A reconciliation of these non-GAAP measures to the most directly comparable GAAP measure is included in the appendix to Truist's First Quarter 2021 Earnings Presentation, which is available at https://ir.truist.com/earnings.
This news release contains "forward-looking statements" within the meaning of the Private Securities Litigation Reform Act of 1995, regarding the financial condition, results of operations, business plans and the future performance of Truist. Words such as "anticipates," "believes," "estimates," "expects," "forecasts," "intends," "plans," "projects," "may," "will," "should," “would," "could" and other similar expressions are intended to identify these forward-looking statements.
Forward-looking statements are not based on historical facts but instead represent management's expectations and assumptions regarding Truist's business, the economy and other future conditions. Such statements involve inherent uncertainties, risks and changes in circumstances that are difficult to predict. As such, Truist’s actual results may differ materially from those contemplated by forward-looking statements. While there can be no assurance that any list of risks and uncertainties or risk factors is complete, important factors that could cause actual results to differ materially from those contemplated by forward-looking statements include the following, without limitation, as well as the risks and uncertainties more fully discussed under Item 1A-Risk Factors in our Annual Report on Form 10-K for the year ended December 31, 2020 and in Truist's subsequent filings with the Securities and Exchange Commission:
•risks and uncertainties relating to the Merger of heritage BB&T and heritage SunTrust, including the ability to successfully integrate the companies or to realize the anticipated benefits of the Merger;
•expenses relating to the Merger and integration of heritage BB&T and heritage SunTrust;
•deposit attrition, client loss or revenue loss following completed mergers or acquisitions may be greater than anticipated;
•the COVID-19 pandemic has disrupted the global economy, adversely impacted Truist's financial condition and results of operations, including through increased expenses, reduced fee income and net interest margin and increases in the allowance for credit losses, and continuation of current conditions could worsen these impacts and also adversely affect Truist's capital and liquidity position or cost of capital, impair the ability of borrowers to repay outstanding loans, cause an outflow of deposits, and impair goodwill or other assets;
•Truist is subject to credit risk by lending or committing to lend money and may have more credit risk and higher credit losses to the extent that loans are concentrated by loan type, industry segment, borrower type or location of the borrower or collateral;
•changes in the interest rate environment, including the replacement of LIBOR as an interest rate benchmark and potentially negative interest rates, which could adversely affect Truist's revenue and expenses, the value of assets and obligations, and the availability and cost of capital, cash flows, and liquidity;
- 14 -
•inability to access short-term funding or liquidity, loss of client deposits or changes in Truist's credit ratings, which could increase the cost of funding or limit access to capital markets;
•risk management oversight functions may not identify or address risks adequately, and management may not be able to effectively manage credit risk;
•risks resulting from the extensive use of models in Truist's business, which may impact decisions made by management and regulators;
•failure to execute on strategic or operational plans, including the ability to successfully complete or integrate mergers and acquisitions;
•increased competition, including from new or existing competitors that could have greater financial resources or be subject to different regulatory standards, for products and services offered by non-bank financial technology companies may reduce Truist's client base, cause Truist to lower prices for its products and services in order to maintain market share or otherwise adversely impact Truist's businesses or results of operations;
•failure to maintain or enhance Truist's competitive position with respect to new products, services and technology, whether it fails to anticipate client expectations or because its technological developments fail to perform as desired or do not achieve market acceptance or regulatory approval or for other reasons, may cause Truist to lose market share or incur additional expense;
•negative public opinion, which could damage Truist's reputation;
•increased scrutiny regarding Truist's consumer sales practices, training practices, incentive compensation design and governance;
•regulatory matters, litigation or other legal actions, which may result in, among other things, costs, fines, penalties, restrictions on Truist's business activities, reputational harm, negative publicity or other adverse consequences;
•evolving legislative, accounting and regulatory standards, including with respect to capital and liquidity requirements, and results of regulatory examinations, may adversely affect Truist's financial condition and results of operations;
•the monetary and fiscal policies of the federal government and its agencies could have a material adverse effect on profitability;
•accounting policies and processes require management to make estimates about matters that are uncertain, including the potential write down to goodwill if there is an elongated period of decline in market value for Truist's stock and adverse economic conditions are sustained over a period of time;
•general economic or business conditions, either globally, nationally or regionally, may be less favorable than expected, and instability in global geopolitical matters or volatility in financial markets could result in, among other things, slower deposit or asset growth, a deterioration in credit quality or a reduced demand for credit, insurance or other services;
•risks related to originating and selling mortgages, including repurchase and indemnity demands from purchasers related to representations and warranties on loans sold, which could result in an increase in the amount of losses for loan repurchases;
•risks relating to Truist's role as a loan servicer, including an increase in the scope or costs of the services Truist is required to perform without any corresponding increase in servicing fees, or a breach of Truist’s obligations as servicer;
•Truist's success depends on hiring and retaining key personnel, and if these individuals leave or change roles without effective replacements, Truist's operations and integration activities could be adversely impacted, which could be exacerbated as Truist continues to integrate the management teams of heritage BB&T and heritage SunTrust;
•fraud or misconduct by internal or external parties, which Truist may not be able to prevent, detect or mitigate;
•security risks, including denial of service attacks, hacking, social engineering attacks targeting Truist's teammates and clients, malware intrusion, data corruption attempts, system breaches, cyber attacks and identity theft, could result in the disclosure of confidential information, adversely affect Truist's business or reputation or create significant legal or financial exposure; and
•widespread outages of operational, communication or other systems, whether internal or provided by third parties, natural or other disasters (including acts of terrorism and pandemics), and the effects of climate change could have an adverse effect on Truist's financial condition and results of operations, or lead to material disruption of Truist's operations or the ability or willingness of clients to access Truist's products and services.
Readers are cautioned not to place undue reliance on these forward-looking statements, which speak only as of the date they are made. Except to the extent required by applicable law or regulation, Truist undertakes no obligation to revise or update any forward-looking statements.
- 15 -