tfc-20230720
0000092230FALSE00000922302023-07-202023-07-200000092230us-gaap:CommonStockMember2023-07-202023-07-200000092230tfc:SeriesIPreferredStockMember2023-07-202023-07-200000092230tfc:SeriesJPreferredStockMember2023-07-202023-07-200000092230tfc:SeriesOPreferredStockMember2023-07-202023-07-200000092230tfc:SeriesRPreferredStockMember2023-07-202023-07-20
UNITED STATES
SECURITIES AND EXCHANGE COMMISSION
Washington, D.C. 20549
_____________________________________________
Form 8-K
Current Report
_____________________________________________

Pursuant to Section 13 or 15(d)
of the Securities Exchange Act of 1934

July 20, 2023
Date of Report (Date of earliest event reported)

Truist Financial Corporation
(Exact name of registrant as specified in its charter)
_____________________________________________
North Carolina1-1085356-0939887
(State or other jurisdiction of incorporation)
(Commission File Number)
(I.R.S. Employer Identification No.)
214 North Tryon Street
Charlotte,
North Carolina
28202
(Address of principal executive offices)
(Zip Code)

(336) 733-2000
(Registrant’s telephone number, including area code)
_____________________________________________

Check the appropriate box below if the Form 8-K filing is intended to simultaneously satisfy the filing obligation of the registrant under any of the following provisions:
Written communications pursuant to Rule 425 under the Securities Act (17 CFR 230.425)
Soliciting material pursuant to Rule 14a-12 under the Exchange Act (17 CFR 240.14a-12)
Pre-commencement communications pursuant to Rule 14d-2(b) under the Exchange Act (17 CFR 240.14d-2(b))
Pre-commencement communications pursuant to Rule 13e-4(c) under the Exchange Act (17 CFR 240.13e-4(c))

Securities registered pursuant to Section 12(b) of the Act:
Title of each classTrading SymbolName of each exchange on which registered
Common Stock, $5 par valueTFCNew York Stock Exchange
Depositary Shares each representing 1/4,000th interest in a share of Series I Perpetual Preferred StockTFC.PINew York Stock Exchange
5.853% Fixed-to-Floating Rate Normal Preferred Purchase Securities each representing 1/100th interest in a share of Series J Perpetual Preferred StockTFC.PJNew York Stock Exchange
Depositary Shares each representing 1/1,000th interest in a share of Series O Non-Cumulative Perpetual Preferred StockTFC.PONew York Stock Exchange
Depositary Shares each representing 1/1,000th interest in a share of Series R Non-Cumulative Perpetual Preferred StockTFC.PRNew York Stock Exchange

Indicate by check mark whether the registrant is an emerging growth company as defined in Rule 405 of the Securities Act of 1933 (§230.405 of this chapter) or Rule 12b-2 of the Securities Exchange Act of 1934 (§240.12b-2 of this chapter).
Emerging growth company 

If an emerging growth company, indicate by check mark if the registrant has elected not to use the extended transition period for complying with any new or revised financial accounting standards provided pursuant to Section 13(a) of the Exchange Act. ¨


ITEM 2.02    Results of Operations and Financial Condition.

On July 20, 2023, Truist Financial Corporation (“Truist”) issued a press release announcing its reporting of second quarter 2023 results and posted on its website its second quarter 2023 Earnings Release, Quarterly Performance Summary, and Earnings Release Presentation. The materials contain forward-looking statements regarding Truist and include cautionary language identifying important factors that could cause actual results to differ materially from those anticipated. The Earnings Release, Quarterly Performance Summary, and Earnings Release Presentation are furnished as Exhibits 99.1, 99.2, and 99.3, respectively. Consequently, they are not deemed “filed” for purposes of Section 18 of the Securities Exchange Act of 1934 or otherwise subject to the liabilities of that section. Such materials may only be incorporated by reference into another filing under the Exchange Act or Securities Act of 1933 if such subsequent filing specifically references this Form 8-K. All information in the Earnings Release, Quarterly Performance Summary, and Earnings Release Presentation speaks as of the date thereof, and Truist does not assume any obligation to update such information in the future.

ITEM 9.01    Financial Statements and Exhibits.
(d)    Exhibits
Exhibit No.Description of Exhibit
Earnings Release issued July 20, 2023.
Quarterly Performance Summary issued July 20, 2023.
Earnings Release Presentation issued July 20, 2023.
104The cover page from this Current Report on Form 8-K, formatted in Inline XBRL.


SIGNATURE

Pursuant to the requirements of the Securities Exchange Act of 1934, the registrant has duly caused this report to be signed on its behalf by the undersigned hereunto duly authorized.
TRUIST FINANCIAL CORPORATION
(Registrant)
By:/s/ Cynthia B. Powell
Cynthia B. Powell
Executive Vice President and Corporate Controller
(Principal Accounting Officer)

Date: July 20, 2023


`
truistlogo-whitea.jpg
News Release
Truist reports second quarter 2023 results
GAAP earnings of $1.2 billion, or $0.92 per share
PPNR(1) up 5.8% and adjusted PPNR(1) down 1.3% compared to 2Q22
2Q23 actions further strengthen balance sheet; CET1 increased 50 basis points to 9.6%
2Q23 Key Financial Data
2Q23 Performance Highlights(4)
(Dollars in billions, except per share data)2Q231Q232Q22
Summary Income Statement
Net interest income - TE$3.68 $3.92 $3.44 
Noninterest income2.29 2.23 2.25 
Total revenue - TE5.97 6.15 5.68 
Noninterest expense3.75 3.69 3.58 
Net income available to common shareholders1.23 1.41 1.45 
PPNR - unadjusted(1)
2.22 2.46 2.10 
PPNR - adjusted(1)
2.41 2.66 2.45 
Per Share Metrics
Diluted earnings per common share$0.92 $1.05 $1.09 
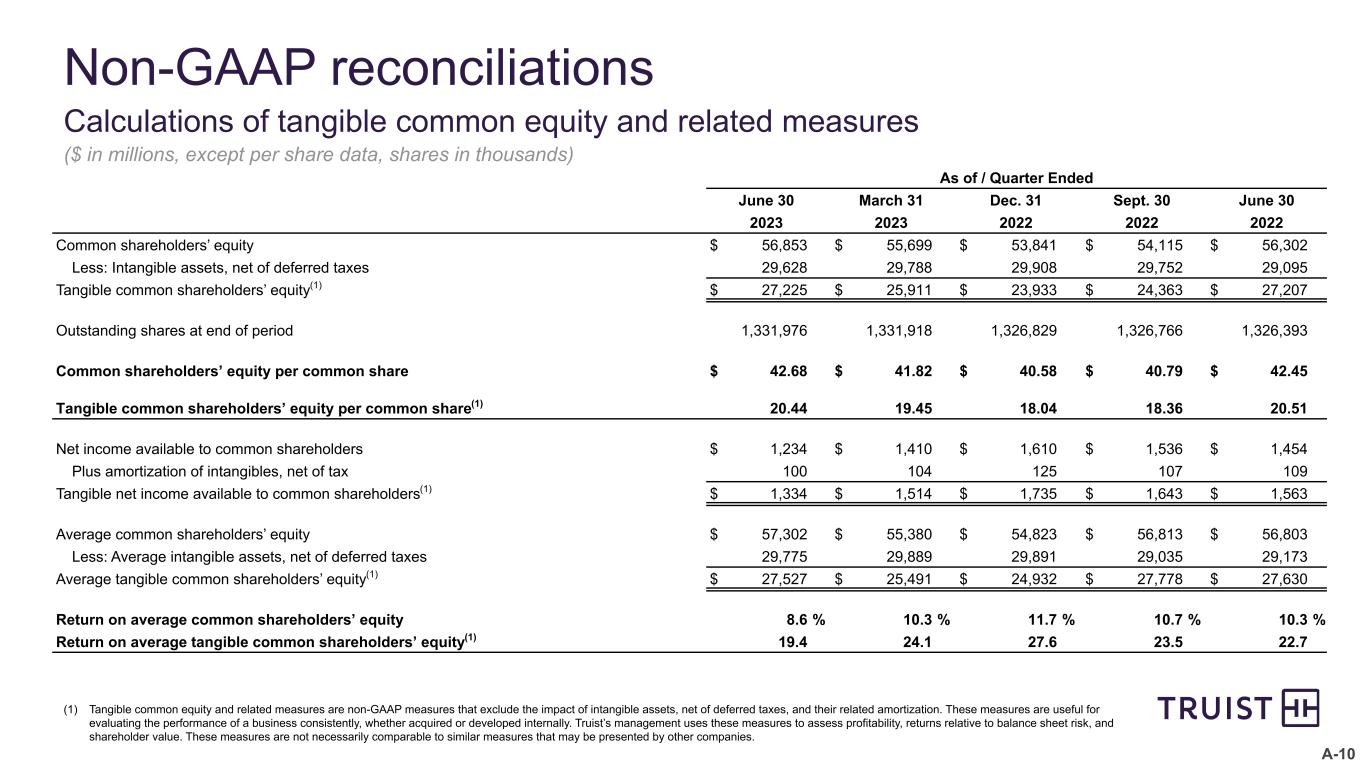
BVPS42.68 41.82 42.45 
TBVPS(1)
20.44 19.45 20.51 
Key Ratios
ROCE8.6 %10.3 %10.3 %
ROTCE(1)
19.4 24.1 22.7 
Efficiency ratio - GAAP63.3 60.5 63.3 
Efficiency ratio - adjusted(1)
59.6 56.8 57.0 
NIM - TE2.91 3.17 2.89 
NCO ratio(2)
0.54 0.37 0.22 
ALLL ratio1.43 1.37 1.38 
CET1(3)
9.6 9.1 9.2 
Average Balances
Assets$566 $560 $541 
Securities138 141 149 
Loans and leases 328 328 300 
Deposits400 408 424 
Amounts may not foot due to rounding.
(1)Represents a non-GAAP measure. A reconciliation of each of these non-GAAP measures to the most directly comparable GAAP measure is included in the appendix to Truist’s Second Quarter 2023 Earnings Presentation.
(2)2Q23 includes 12 basis point impact from student loan portfolio sale.
(3)Current quarter capital ratios are preliminary.
(4)Comparisons noted in this section summarize changes from second quarter of 2023 compared to first quarter of 2023, unless otherwise noted.
Net income was $1.2 billion, or $0.92 per diluted share
Includes $54 million ($41 million after-tax), or $0.03 per share, of merger-related and restructuring charges
Record insurance income

Adjusted PPNR was $2.4 billion, down 9.3% compared to prior quarter due to lower net interest income and higher noninterest expense, partially offset by higher noninterest income
Down 1.3% from the year ago quarter due to higher noninterest expense, partially offset by higher net interest income and higher noninterest income

Average loans and leases were stable compared to the prior quarter as growth within the commercial and industrial portfolio was partially offset by a decrease in indirect auto in alignment with the company’s strategic focus
Sold non-core student loan portfolio at end of 2Q23 with no impact to net income; net charge-off of $98 million, or 12 basis points, was previously provided for in ALLL

Average deposits decreased 2.1% compared to the prior quarter primarily due to the impact of client tax payments and prior quarter activity

Asset quality reflects normalization and modest deterioration in commercial portfolios
Net charge-off ratio of 54 basis points, which includes a 12 basis point impact from student loan sale
Nonperforming assets increased modestly in the commercial portfolios

Capital and liquidity levels strengthened
CET1 ratio was 9.6% as of June 30, up 50 basis points
TIH minority stake sale added 31 basis points
TBVPS increased 5.1% to $20.44
Consolidated LCR was 112%
$178 billion of available liquidity sources

CEO Commentary
“During the second quarter, we made significant progress adapting to the new operating environment by strengthening our balance sheet, sharpening our strategic focus on our core businesses, and intensifying our focus on disciplined expense management.

Second quarter financial results were mixed as revenue headwinds from higher funding costs and lower-than-anticipated capital markets activity were partially offset by record insurance income. We prudently increased our provision and allowance amid the uncertain economic backdrop. Adjusted expenses were within our guidance range, though we are accelerating our plans to adjust our cost base to reflect efficiency opportunities and changing conditions.

Our CET1 capital ratio increased 50 basis points driven by the investment in Truist Insurance Holdings and organic capital generation. The most recent Federal Reserve stress test highlighted our capacity to respond to all scenarios and we announced plans to maintain our strong quarterly common stock dividend at $0.52 per share, subject to board approval.

We are executing swiftly on our strategy to optimize our core businesses exemplified by the sale of our non-core student loan portfolio at net carrying value with no P&L impact. We also made solid progress towards shifting our loan mix towards higher-return assets.

Our unwavering foundation of purpose to inspire and build better lives and communities, the dedication of our talented teammates, the momentum created by maximizing our diverse business model, and key leadership positions in growth markets are competitive advantages that are propelling Truist to reach its full potential.”

— Bill Rogers, Truist Chairman & CEO
`
Contact:
Investors:Brad Milsaps770.352.5347 | [email protected]
Media:Shelley Miller704.692.1518 | [email protected]

truistlogopurplenobackgroua.jpg
Net Interest Income, Net Interest Margin, and Average Balances
Quarter EndedChange
(Dollars in millions)2Q231Q232Q22LinkLike
Interest income(1)
$6,230 $5,836 $3,701 $394 6.8 %$2,529 68.3 %
Interest expense2,551 1,917 266 634 33.1 2,285 NM
Net interest income(1)
$3,679 $3,919 $3,435 $(240)(6.1)$244 7.1 
Net interest margin(1)
2.91 %3.17 %2.89 %(26) bps2 bps
Core net interest margin(1)(2)
2.85 3.10 2.72 (25) bps13 bps
Average Balances(3)
Total earning assets$506,084 $499,149 $475,818 $6,935 1.4 %$30,266 6.4 %
Total interest-bearing liabilities363,754 352,472 316,021 11,282 3.2 47,733 15.1 
Yields / Rates(1)
Total earning assets4.93 %4.72 %3.12 %21 bps181 bps
Total interest-bearing liabilities2.81 2.20 0.34 61 bps247 bps
(1)Amounts are on a taxable-equivalent basis utilizing the federal income tax rate of 21% for the periods presented. Interest income includes certain fees, deferred costs, and dividends.
(2)Represents a non-GAAP measure. A reconciliation of each of these non-GAAP measures to the most directly comparable GAAP measure is included in the appendix to Truist’s Second Quarter 2023 Earnings Presentation.
(3)Excludes basis adjustments for fair value hedges.

Taxable-equivalent net interest income for the second quarter of 2023 was down $240 million, or 6.1%, compared to the first quarter of 2023 driven by higher funding costs, partially offset by higher rates on earning assets. The net interest margin was 2.91%, down 26 basis points.

Average earning assets increased primarily due to growth in average other earning assets of $9.4 billion, or 37%, as balances held at the Federal Reserve were increased late in the first quarter to support liquidity build, partially offset by a decline in average securities of $2.2 billion, or 1.5%.
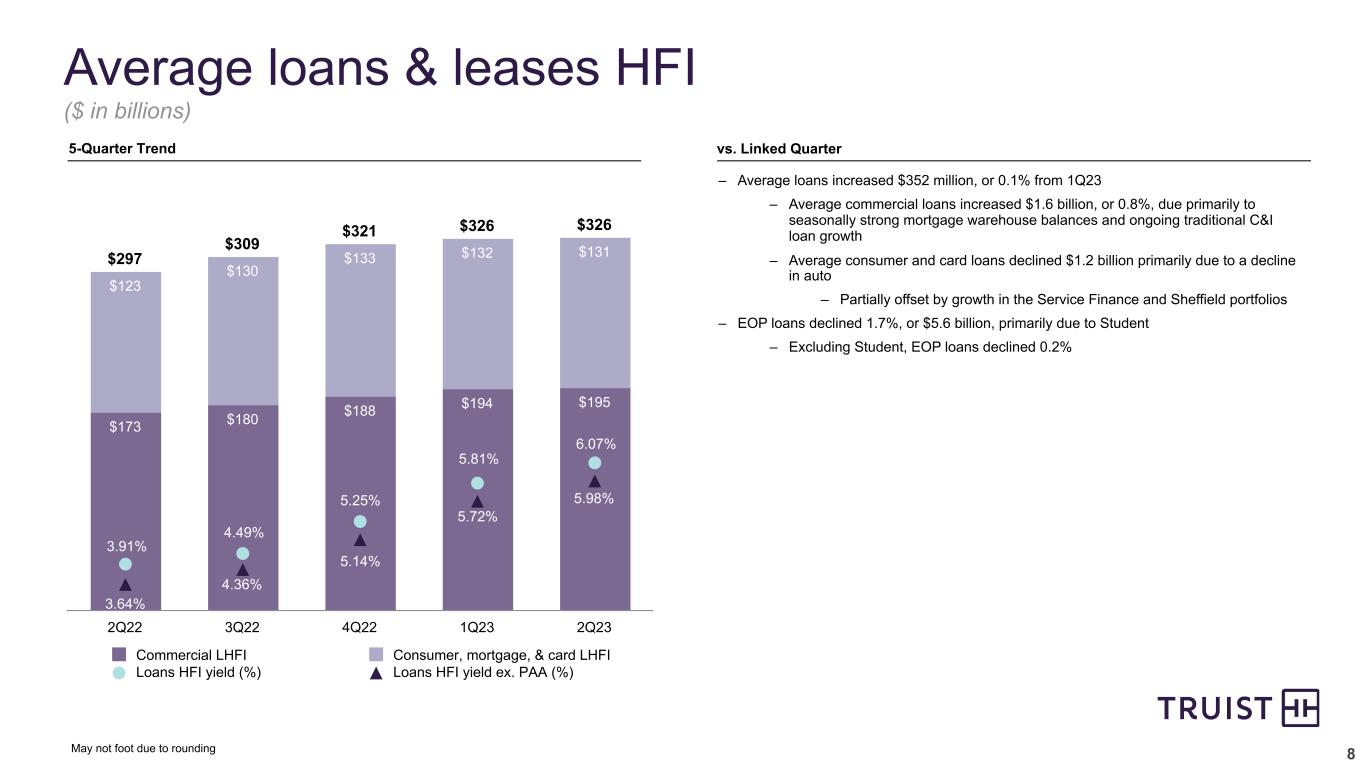
The yield on the total loan portfolio was 6.07%, up 26 basis points primarily due to higher market interest rates. The yield on the average securities portfolio for the second quarter was 2.17%, up three basis points.
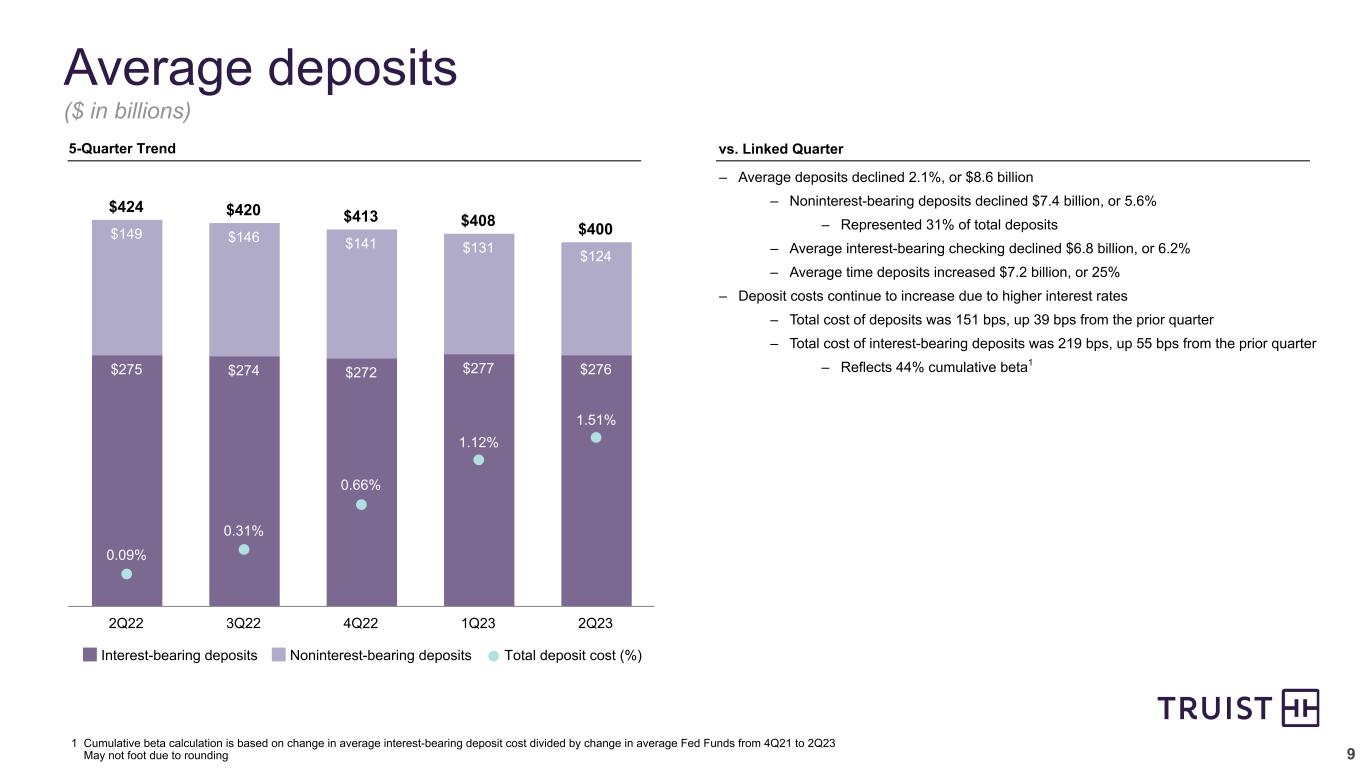
Average deposits decreased $8.6 billion, or 2.1%, while average long-term debt increased $12.6 billion, or 25%. The decrease in average deposits was primarily due to the impact of client tax payments and prior quarter activity. The increase in average long-term debt was driven by the increased liquidity build late in the first quarter and the decline in deposits.
The average cost of total deposits was 1.51%, up 39 basis points. The average cost of short-term borrowings was 5.19%, up 50 basis points. The average cost of long-term debt was 4.62%, up 57 basis points. The increase in rates on deposits and other funding sources was largely attributable to the higher rate environment.

Taxable-equivalent net interest income for the second quarter of 2023 was up $244 million, or 7.1%, compared to the second quarter of 2022 primarily due to higher market interest rates and strong loan growth. These increases were partially offset by lower purchase accounting accretion. Net interest margin was 2.91%, up two basis points.

Average earning assets increased $30.3 billion, or 6.4%, primarily due to growth in average total loans of $28.4 billion, or 9.5%, and growth in other earning assets of $13.8 billion, or 65%, primarily due to an increase in balances held at the Federal Reserve to support liquidity build, partially offset by a decrease in average securities of $10.3 billion, or 6.9%.
The yield on the total loan portfolio was 6.07%, up 216 basis points, primarily reflecting higher market interest rates, partially offset by lower purchase accounting accretion. The yield on the average securities portfolio was 2.17%, up 35 basis points primarily due to the higher rate environment.
Average deposits decreased $23.9 billion, or 5.6%, average short-term borrowings increased $14.4 billion, and average long-term debt increased $32.4 billion.
The average cost of total deposits was 1.51%, up 142 basis points. The average cost of short-term borrowings was 5.19%, up 393 basis points. The average cost of long-term debt was 4.62%, up 287 basis points. The increase in rates on deposits and other funding sources was largely attributable to the higher rate environment.

- 2 -

truistlogopurplenobackgroua.jpg
Noninterest Income
Quarter EndedChange
(Dollars in millions)2Q231Q232Q22LinkLike
Insurance income$935 $813 $825 $122 15.0 %$110 13.3 %
Wealth management income330 339 337 (9)(2.7)(7)(2.1)
Investment banking and trading income211 261 255 (50)(19.2)(44)(17.3)
Service charges on deposits240 249 254 (9)(3.6)(14)(5.5)
Card and payment related fees236 230 246 2.6 (10)(4.1)
Mortgage banking income99 142 100 (43)(30.3)(1)(1.0)
Lending related fees86 106 100 (20)(18.9)(14)(14.0)
Operating lease income64 67 66 (3)(4.5)(2)(3.0)
Securities gains (losses)— — (1)— — (100.0)
Other income92 27 66 65 NM26 39.4 
Total noninterest income$2,293 $2,234 $2,248 $59 2.6 $45 2.0 

Noninterest income was up $59 million, or 2.6%, compared to the first quarter of 2023 due to record insurance income and higher other income, partially offset by lower investment banking and trading income and mortgage banking income.

Insurance income increased primarily due to increased production and seasonally higher property and casualty commissions, partially offset by seasonally lower employee benefit plan commissions.
Other income increased primarily due to higher income from investments held for certain post-retirement benefits (which is primarily offset by higher personnel expense) and higher other investment income.
Investment banking and trading income decreased due to lower bond originations, loan syndications, and asset securitizations.
Mortgage banking income decreased due to a gain on the sale of a servicing portfolio in the prior quarter, partially offset by mortgage servicing rights valuation adjustments in the prior quarter.

Noninterest income was up $45 million, or 2.0%, compared to the second quarter of 2022 due to higher insurance income and other income, partially offset by lower investment banking and trading income.

Insurance income increased primarily due to strong 9.1% organic growth and acquisitions.
Investment banking and trading income decreased due to lower structured real estate income and lower trading income.
Other income increased primarily due to higher income from investments held for certain post-retirement benefits (which is primarily offset by higher personnel expense), partially offset by derivative collateral related costs.

- 3 -

truistlogopurplenobackgroua.jpg
Noninterest Expense
Quarter EndedChange
(Dollars in millions)2Q231Q232Q22LinkLike
Personnel expense$2,256 $2,181 $2,102 $75 3.4 %$154 7.3 %
Professional fees and outside processing352 314 349 38 12.1 0.9 
Software expense237 214 234 23 10.7 1.3 
Net occupancy expense180 183 181 (3)(1.6)(1)(0.6)
Amortization of intangibles131 136 143 (5)(3.7)(12)(8.4)
Equipment expense92 110 114 (18)(16.4)(22)(19.3)
Marketing and customer development79 78 93 1.3 (14)(15.1)
Operating lease depreciation44 46 47 (2)(4.3)(3)(6.4)
Regulatory costs73 75 44 (2)(2.7)29 65.9 
Merger-related and restructuring charges54 63 121 (9)(14.3)(67)(55.4)
Other expense250 291 152 (41)(14.1)98 64.5 
Total noninterest expense$3,748 $3,691 $3,580 $57 1.5 $168 4.7 

Noninterest expense was up $57 million, or 1.5%, compared to the first quarter of 2023 due to higher personnel expense and professional fees and outside processing expenses, partially offset by lower other expenses. Merger-related and restructuring charges decreased $9 million. Merger-related and restructuring charges for both quarters in 2023 includes costs for personnel and facilities optimization. Adjusted noninterest expenses, which exclude merger-related costs, the amortization of intangibles, and a small loss on the early extinguishment of debt, increased $67 million, or 1.9%, compared to the prior quarter.

Personnel expense increased due to higher variable incentives and higher other post-retirement benefit expense (which is almost entirely offset by higher other income), partially offset by seasonally lower payroll taxes.
Professional fees and outside processing expenses increased due to enterprise technology and other investments.
Other expense decreased primarily due to lower operating losses.

Noninterest expense was up $168 million, or 4.7%, compared to the second quarter of 2022 due to higher personnel expense, other expense, and regulatory costs, partially offset by lower merger-related and restructuring charges. Merger-related and restructuring charges and incremental operating expenses related to the merger decreased $67 million and $117 million, respectively, due to the completion of integration-related activities. The second quarter of 2022 included a gain on the redemption of FHLB advances of $39 million. Adjusted noninterest expenses, which exclude merger-related costs, the amortization of intangibles, and gains and losses on the early extinguishment of debt increased $321 million, or 9.9%.

Personnel expense increased due to investments in teammates by increasing Truist’s minimum wage, the impact from acquisitions, investments in revenue producing businesses and enterprise technology, and higher other post-retirement benefit expense (which is almost entirely offset by higher other income), partially offset by lower pension expenses.
Other expense increased primarily due to higher pension expense (driven primarily by lower plan assets), partially offset by lower operating losses.
Regulatory costs increased primarily due to an increase in the FDIC’s deposit insurance assessment rate.

- 4 -

truistlogopurplenobackgroua.jpg
Provision for Income Taxes
Quarter EndedChange
(Dollars in millions)2Q231Q232Q22LinkLike
Provision for income taxes$287 $394 $372 $(107)(27.2)%$(85)(22.8)%
Effective tax rate17.6 %20.6 %19.5 %(300) bps(190) bps

The effective tax rate decreased compared to the first quarter of 2023 primarily driven by a decrease in the full year forecasted effective tax rate and changes in discrete tax items.

The effective tax rate decreased compared to the second quarter of 2022 primarily driven by lower income before taxes.

Average Loans and Leases
(Dollars in millions)2Q231Q23Change% Change
Commercial:
Commercial and industrial$166,588 $165,095 $1,493 0.9 %
CRE22,706 22,689 17 0.1 
Commercial construction5,921 5,863 58 1.0 
Total commercial195,215 193,647 1,568 0.8 
Consumer:
Residential mortgage56,320 56,422 (102)(0.2)
Home equity10,478 10,735 (257)(2.4)
Indirect auto26,558 27,743 (1,185)(4.3)
Other consumer28,189 27,559 630 2.3 
Student4,766 5,129 (363)(7.1)
Total consumer126,311 127,588 (1,277)(1.0)
Credit card4,846 4,785 61 1.3 
Total loans and leases held for investment$326,372 $326,020 $352 0.1 

Average loans held for investment increased $352 million, or 0.1%, compared to the prior quarter, while period-end loans held for investment were $322.1 billion, down $5.6 billion compared to March 31, 2023, primarily due to the sale of the student loan portfolio at the end of the second quarter of 2023 and loan growth moderation in lower return portfolios.

Average commercial loans increased 0.8% due to a seasonal increase in mortgage warehouse lending and growth within the core commercial and industrial portfolio.

Average consumer loans decreased 1.0% due to lower indirect auto production, the continued run-off of the student loan portfolio (prior to the sale at the end of the period), and lower home equity balances, partially offset by growth in higher-return point-of-sale lending in the other consumer portfolio (Service Finance and Sheffield).

- 5 -

truistlogopurplenobackgroua.jpg
Average Deposits
(Dollars in millions)2Q231Q23Change% Change
Noninterest-bearing deposits$123,728 $131,099 $(7,371)(5.6)%
Interest checking102,105 108,886 (6,781)(6.2)
Money market and savings138,149 139,802 (1,653)(1.2)
Time deposits35,844 28,671 7,173 25.0 
Total deposits$399,826 $408,458 $(8,632)(2.1)

Average deposits for the second quarter of 2023 were $399.8 billion, a decrease of $8.6 billion, or 2.1%, compared to the prior quarter. The decrease in deposits was primarily due to the impact of client tax payments and prior quarter activity.

Average noninterest-bearing deposits decreased 5.6% compared to the prior quarter and represented 30.9% of total deposits for the second quarter of 2023 compared to 32.1% for the first quarter of 2023 and 35.1% compared to the year ago quarter. Average interest checking and money market and savings declined 6.2% and 1.2%, respectively, compared to the prior quarter. Average time deposits increased 25% due to an increase in retail client time deposits primarily due to migration from other deposit products and brokered time deposits.

Capital Ratios
2Q231Q234Q223Q222Q22
Risk-based:(preliminary)
CET19.6 %9.1 %9.0 %9.1 %9.2 %
Tier 111.1 10.6 10.5 10.7 10.8 
Total13.2 12.7 12.4 12.6 12.6 
Leverage8.8 8.5 8.5 8.5 8.6 
Supplementary leverage7.5 7.3 7.3 7.3 7.3 

Capital ratios remained strong compared to the regulatory requirements for well capitalized banks. Truist declared common dividends of $0.52 per share during the second quarter of 2023. The dividend payout ratio for the second quarter of 2023 was 56%. Truist did not repurchase any shares in the second quarter of 2023.

Truist CET1 ratio was 9.6% as of June 30, 2023. The increase since March 31, 2023 resulted from the minority stake sale in TIH and organic capital generation. Truist closed the sale of the minority stake in TIH on April 3, 2023, which added 31 basis points to the risk-based regulatory capital ratios.

Truist completed the 2023 CCAR process and received the preliminary SCB requirement of 2.9% for the period October 1, 2023 to September 30, 2024. The Federal Reserve will provide Truist with its final SCB requirement by August 31, 2023.

Truist’s average consolidated LCR was 112% for the three months ended June 30, 2023, compared to the regulatory minimum of 100%. Truist has significant and strong access to liquidity with $178 billion of available liquidity as of June 30, 2023 compared to $166 billion as of March 31, 2023.

- 6 -

truistlogopurplenobackgroua.jpg
Asset Quality
(Dollars in millions)2Q231Q234Q223Q222Q22
Total nonperforming assets$1,583 $1,261 $1,250 $1,240 $1,173 
Total loans 90 days past due and still accruing662 1,361 1,605 1,709 1,787 
Total loans 30-89 days past due1,550 1,805 2,267 1,957 2,091 
Nonperforming loans and leases as a percentage of loans and leases held for investment
0.47 %0.36 %0.36 %0.35 %0.36 %
Loans 30-89 days past due and still accruing as a percentage of loans and leases0.48 0.55 0.70 0.62 0.69 
Loans 90 days or more past due and still accruing as a percentage of loans and leases0.21 0.42 0.49 0.54 0.59 
Loans 90 days or more past due and still accruing as a percentage of loans and leases, excluding government guaranteed0.04 0.04 0.04 0.04 0.04 
Allowance for loan and lease losses as a percentage of loans and leases held for investment
1.43 1.37 1.34 1.34 1.38 
Ratio of allowance for loan and lease losses to net charge-offs(1)
2.6x3.7x4.1x5.0x6.5x
Ratio of allowance for loan and lease losses to nonperforming loans and leases held for investment
3.0x3.8x3.7x3.8x3.8x
Applicable ratios are annualized.
(1)Excluding the impact from the student loan charge-offs, the ALLL to annualized net charge-offs was 3.4X at June 30, 2023.

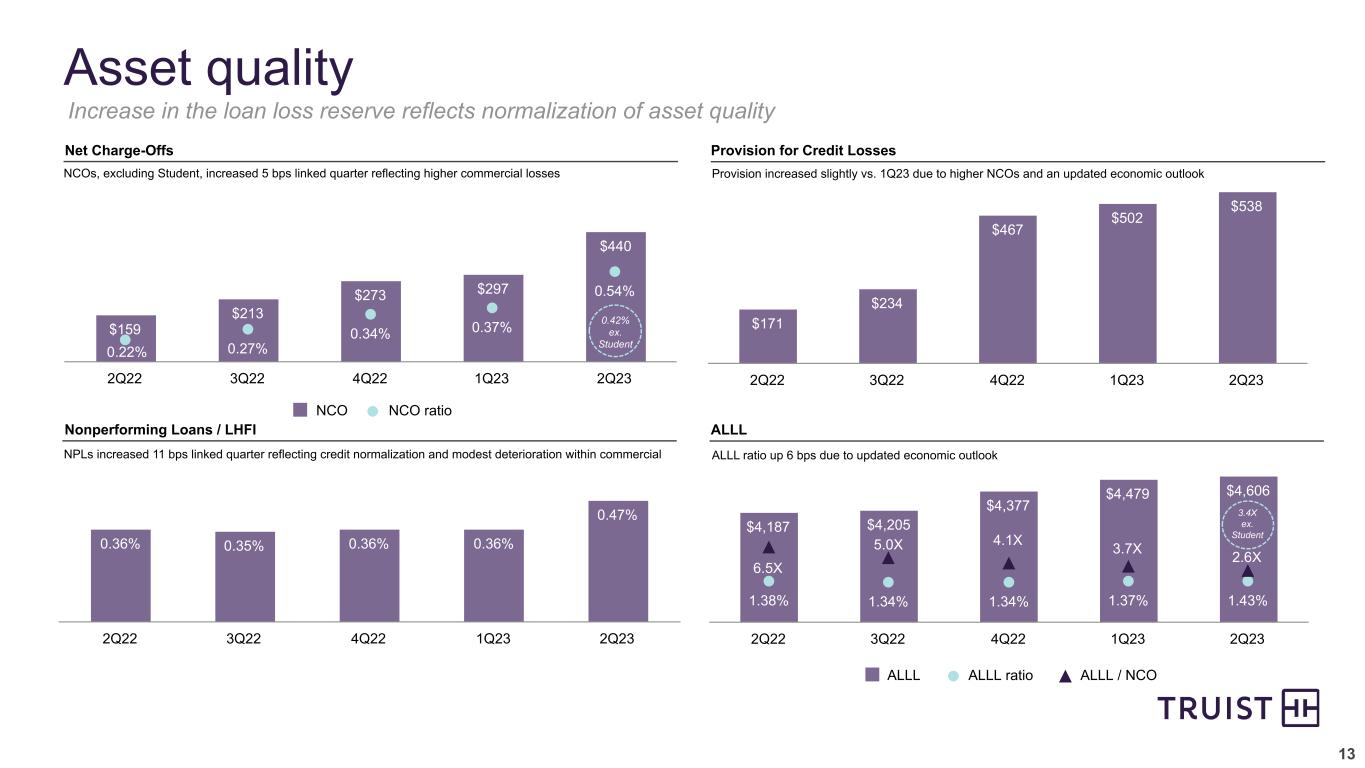
Nonperforming assets totaled $1.6 billion at June 30, 2023, up $322 million compared to March 31, 2023. Nonperforming loans and leases held for investment were 0.47% of loans and leases held for investment at June 30, 2023, up 11 basis points compared to March 31, 2023. The increase in nonperforming assets was concentrated in the CRE and commercial and industrial portfolios.

Loans 90 days or more past due and still accruing totaled $662 million at June 30, 2023, down $699 million, or twenty-one basis points as a percentage of loans and leases, compared with the prior quarter primarily due to the sale of government guaranteed student loans and a decline in government guaranteed residential mortgages. Excluding government guaranteed loans, the ratio of loans 90 days or more past due and still accruing as a percentage of loans and leases was 0.04% at June 30, 2023, unchanged from March 31, 2023.

Loans 30-89 days past due and still accruing of $1.6 billion at June 30, 2023 were down $255 million, or 7 basis points as a percentage of loans and leases, compared to the prior quarter primarily due to declines in government guaranteed student loans as a result of exiting that portfolio.

The allowance for credit losses was $4.9 billion and includes $4.6 billion for the allowance for loan and lease losses and $273 million for the reserve for unfunded commitments. The ALLL ratio was 1.43%, up six basis points compared with March 31, 2023 primarily due to an updated economic outlook. The ALLL covered nonperforming loans and leases held for investment 3.0X compared to 3.8X at March 31, 2023. At June 30, 2023, the ALLL was 2.6X annualized net charge-offs, compared to 3.7X at March 31, 2023. The ALLL to annualized net charge-offs for the current quarter was impacted by the charge-off related to the sale of the student loan portfolio. Excluding the impact from the student loan charge-offs, the ALLL to annualized net charge-offs was 3.4X at June 30, 2023.

Provision for Credit Losses
Quarter EndedChange
(Dollars in millions)2Q231Q232Q22LinkLike
Provision for credit losses$538 $502 $171 $36 7.2 %$367 NM
Net charge-offs440 297 159 143 48.1 281 176.7 
Net charge-offs as a percentage of average loans and leases(1)
0.54 %0.37 %0.22 %17 bps32 bps
Applicable ratios are annualized.
(1)2Q23 includes 12 basis point impact from student loan portfolio sale.

The provision for credit losses was $538 million compared to $502 million for the first quarter of 2023. The current quarter includes $98 million of charge-offs related to the sale of the student loan portfolio, which was previously provided for in the allowance.

The increase in the current quarter provision expense primarily reflects higher net charge-offs and an updated economic outlook.
The net charge-off ratio for the current quarter was up compared to the first quarter of 2023 primarily driven by the sale of the student loan portfolio as well as higher charge-offs in the commercial and industrial and CRE portfolios.

- 7 -

truistlogopurplenobackgroua.jpg
The provision for credit losses was $538 million compared to $171 million for the second quarter of 2022.

The increase in the current quarter provision expense primarily reflects higher net charge-offs and an updated economic outlook.
The net charge-off ratio was up compared to the second quarter of 2022 driven by the sale of the student loan portfolio as well as higher charge-offs in the commercial and industrial, CRE, and indirect auto portfolios.

Earnings Presentation and Quarterly Performance Summary
Investors can access the live second quarter 2023 earnings call at 8 a.m. ET today by webcast or dial-in as follows:

Webcast: https://app.webinar.net/ao9lg3ZzQDX

Dial-in: 855-303-0072, passcode 100038

Additional details: The news release and presentation materials will be available at ir.truist.com under “Events & Presentations.” A replay of the call will be available on the website for 30 days.

The presentation, including an appendix reconciling non-GAAP disclosures, and Truist’s Second Quarter 2023 Quarterly Performance Summary, which contains detailed financial schedules, are available at https://ir.truist.com/earnings.

About Truist
Truist Financial Corporation is a purpose-driven financial services company committed to inspiring and building better lives and communities. Truist has leading market share in many high-growth markets in the country and offers a wide range of products and services through our retail and small business banking, commercial banking, corporate and investment banking, insurance, wealth management, and specialized lending businesses. Headquartered in Charlotte, North Carolina, Truist is a top 10 U.S. commercial bank with total assets of $555 billion as of June 30, 2023. Truist Bank, Member FDIC. Learn more at Truist.com.

#-#-#

Glossary of Defined Terms
TermDefinition
ACL
Allowance for credit losses
ALLL
Allowance for loan and lease losses
BVPSBook value (common equity) per share
CCARComprehensive Capital Analysis and Review
CEOChief Executive Officer
CET1
Common equity tier 1
CRECommercial real estate
EBITDAEarnings before interest, taxes, depreciation, and amortization
FDICFederal Deposit Insurance Corporation
GAAPAccounting principles generally accepted in the United States of America
LCRLiquidity Coverage Ratio
LIBOR
London Interbank Offered Rate
Like
Compared to Second quarter of 2022
Link
Compared to First quarter of 2023
NCO
Net charge-offs
NIMNet interest margin, computed on a TE basis
NMNot meaningful
PPNRPre-provision net revenue
ROCEReturn on average common equity
ROTCE
Return on average tangible common equity
SBICSmall Business Investment Company
SCBStress Capital Buffer
TBVPS
Tangible book value per common share
TETaxable-equivalent
TIHTruist Insurance Holdings
- 8 -

truistlogopurplenobackgroua.jpg
Non-GAAP Financial Information
This news release contains financial information and performance measures determined by methods other than in accordance with GAAP. Truist’s management uses these “non-GAAP” measures in their analysis of the Corporation’s performance and the efficiency of its operations. Management believes these non-GAAP measures provide a greater understanding of ongoing operations, enhance comparability of results with prior periods and demonstrate the effects of significant items in the current period. The Corporation believes a meaningful analysis of its financial performance requires an understanding of the factors underlying that performance. Truist’s management believes investors may find these non-GAAP financial measures useful. These disclosures should not be viewed as a substitute for financial measures determined in accordance with GAAP, nor are they necessarily comparable to non-GAAP performance measures that may be presented by other companies. Below is a listing of the types of non-GAAP measures used in this news release:

Adjusted Performance Measures -The adjusted performance measures, including adjusted diluted earnings per share, return on average tangible common shareholders’ equity, adjusted efficiency ratio, and adjusted noninterest expense, are non-GAAP in that they exclude merger-related and restructuring charges, other selected items, and amortization of intangible assets, as applicable to tangible measures. Truist’s management uses these measures in their analysis of the Corporation’s performance. Truist’s management believes these measures provide a greater understanding of ongoing operations and enhance comparability of results with prior periods, as well as demonstrate the effects of significant gains and charges.
PPNR - Pre-provision net revenue is a non-GAAP measure that adjusts net income determined in accordance with GAAP to exclude the impact of the provision for credit losses and provision for income taxes. Adjusted pre-provision net revenue is a non-GAAP measure that additionally excludes securities gains (losses), merger-related and restructuring charges, amortization of intangible assets, and other selected items. Truist’s management believes these measures provide a greater understanding of ongoing operations and enhances comparability of results with prior periods.
Tangible Common Equity and Related Measures - Tangible common equity and related measures are non-GAAP measures that exclude the impact of intangible assets, net of deferred taxes, and their related amortization. These measures are useful for evaluating the performance of a business consistently, whether acquired or developed internally. Truist’s management uses these measures to assess profitability, returns relative to balance sheet risk, and shareholder value.
Core NIM - Core net interest margin is a non-GAAP measure that adjusts net interest margin to exclude the impact of purchase accounting. The purchase accounting marks and related amortization for loans, deposits, and long-term debt from mergers and acquisitions are excluded to approximate the yields paid by clients. Truist’s management believes the adjustments to the calculation of net interest margin for certain assets and liabilities acquired provide investors with useful information related to the performance of Truist’s earning assets.

A reconciliation of each of these non-GAAP measures to the most directly comparable GAAP measure is included in the appendix to Truist’s Second Quarter 2023 Earnings Presentation, which is available at https://ir.truist.com/earnings.
- 9 -

truistlogopurplenobackgroua.jpg
Forward Looking Statements
This news release contains “forward-looking statements” within the meaning of the Private Securities Litigation Reform Act of 1995, regarding the financial condition, results of operations, business plans and the future performance of Truist. Words such as “anticipates,” “believes,” “estimates,” “expects,” “forecasts,” “intends,” “plans,” “projects,” “may,” “will,” “should,” “would,” “could” and other similar expressions are intended to identify these forward-looking statements.

Forward-looking statements are not based on historical facts but instead represent management’s expectations and assumptions regarding Truist’s business, the economy, and other future conditions. Such statements involve inherent uncertainties, risks, and changes in circumstances that are difficult to predict. As such, Truist’s actual results may differ materially from those contemplated by forward-looking statements. While there can be no assurance that any list of risks and uncertainties or risk factors is complete, important factors that could cause actual results to differ materially from those contemplated by forward-looking statements include the following, without limitation, as well as the risks and uncertainties more fully discussed under Part I, Item 1A-Risk Factors in our Annual Report on Form 10-K for the year ended December 31, 2022 and in Truist’s subsequent filings with the Securities and Exchange Commission:

changes in the interest rate environment, including the replacement of LIBOR as an interest rate benchmark, could adversely affect Truist’s revenue and expenses, the value of assets and obligations, including our portfolio of investment securities, and the availability and cost of capital, cash flows, and liquidity;
Truist is subject to credit risk by lending or committing to lend money, may have more credit risk and higher credit losses to the extent that loans are concentrated by loan type, industry segment, borrower type or location of the borrower or collateral, and may suffer losses if the value of collateral declines in stressed market conditions;
inability to access short-term funding or liquidity, loss of client deposits or changes in Truist’s credit ratings could increase the cost of funding, limit access to capital markets, or negatively affect Truist’s overall liquidity or capitalization;
Truist may be impacted by actual or perceived soundness of other financial institutions, including as a result of the financial or operational failure of a major financial institution, or concerns about the creditworthiness of such a financial institution or its ability to fulfill its obligations, which can cause substantial and cascading disruption within the financial markets and increased expenses, including FDIC insurance premiums, and could affect our ability to attract and retain depositors and to borrow or raise capital;
general economic or business conditions, either globally, nationally or regionally, may be less favorable than expected, including as a result of supply chain disruptions, inflationary pressures and labor shortages, and instability in global geopolitical matters, including due to an outbreak or escalation of hostilities, or volatility in financial markets could result in, among other things, slower deposit or asset growth, a deterioration in credit quality, or a reduced demand for credit, insurance, or other services;
the monetary and fiscal policies of the federal government and its agencies, including in response to higher inflation, could have a material adverse effect on the economy and Truist’s profitability;
unexpected outflows of uninsured deposits may require us to sell investment securities at a loss;
a loss of value of our investment portfolio could negatively impact market perceptions of Truist and could lead to deposit withdrawals;
the effects of COVID-19 adversely impacted the Company’s operations and financial performance and similar adverse impacts resulting from pandemics could occur in future periods;
risk management oversight functions may not identify or address risks adequately, and management may not be able to effectively manage credit risk;
there are risks resulting from the extensive use of models in Truist’s business, which may impact decisions made by management and regulators;
deposit attrition, client loss or revenue loss following completed mergers or acquisitions may be greater than anticipated;
Truist could fail to execute on strategic or operational plans, including the ability to successfully complete or integrate mergers and acquisitions;
increased competition, including from (i) new or existing competitors that could have greater financial resources or be subject to different regulatory standards or compliance costs, and (ii) products and services offered by non-bank financial technology companies, may reduce Truist’s client base, cause Truist to lower prices for its products and services in order to maintain market share or otherwise adversely impact Truist’s businesses or results of operations;
failure to maintain or enhance Truist’s competitive position with respect to new products, services, and technology, whether it fails to anticipate client expectations or because its technological developments fail to perform as desired or do not achieve market acceptance or regulatory approval or for other reasons, may cause Truist to lose market share or incur additional expense;
negative public opinion could damage Truist’s reputation and adversely impact business and revenues, including the effects of social media on market perceptions of Truist and banks generally;
regulatory matters, litigation or other legal actions may result in, among other things, costs, fines, penalties, restrictions on Truist’s business activities, reputational harm, negative publicity, or other adverse consequences;
Truist faces substantial legal and operational risks in safeguarding personal information;
evolving legislative, accounting and regulatory standards, including with respect to climate, capital, and liquidity requirements, which may become more stringent in light of recent market events, and results of regulatory examinations may adversely affect Truist’s financial condition and results of operations;
increased scrutiny regarding Truist’s consumer sales practices, training practices, incentive compensation design, and governance could damage its reputation and adversely impact business and revenues;
accounting policies and processes require management to make estimates about matters that are uncertain, including the potential write down to goodwill if there is an elongated period of decline in market value for Truist’s stock and adverse economic conditions are sustained over a period of time;
Truist faces risks related to originating and selling mortgages, including repurchase and indemnity demands from purchasers related to representations and warranties on loans sold, which could result in an increase in the amount of losses for loan repurchases;
there are risks relating to Truist’s role as a loan servicer, including an increase in the scope or costs of the services Truist is required to perform without any corresponding increase in servicing fees or a breach of Truist’s obligations as servicer;
Truist’s success depends on hiring and retaining key teammates, and if these individuals leave or change roles without effective replacements, Truist’s operations could be adversely impacted, which could be exacerbated in the increased work-from-home environment as job markets may be less constrained by physical geography;
Truist’s operations rely on its ability, and the ability of key external parties, to maintain appropriate-staffed workforces, and on the competence, trustworthiness, health and safety of teammates;
Truist faces the risk of fraud or misconduct by internal or external parties, which Truist may not be able to prevent, detect, or mitigate;
security risks, including denial of service attacks, hacking, social engineering attacks targeting Truist’s teammates and clients, malware intrusion, data corruption attempts, system breaches, cyberattacks, which have increased in frequency with geopolitical tensions, identity theft, ransomware attacks, and physical security risks, such as natural disasters, environmental conditions, and intentional acts of destruction, could result in the disclosure of confidential information, adversely affect Truist’s business or reputation or create significant legal or financial exposure; and
widespread outages of operational, communication, or other systems, whether internal or provided by third parties, natural or other disasters (including acts of terrorism and pandemics), and the effects of climate change, including physical risks, such as more frequent and intense weather events, and risks related to the transition to a lower carbon economy, such as regulatory or technological changes or shifts in market dynamics or consumer preferences, could have an adverse effect on Truist’s financial condition and results of operations, lead to material disruption of Truist’s operations or the ability or willingness of clients to access Truist’s products and services.

Readers are cautioned not to place undue reliance on these forward-looking statements, which speak only as of the date they are made. Except to the extent required by applicable law or regulation, Truist undertakes no obligation to revise or update any forward-looking statements.
- 10 -









logo-boxeda.jpg

Quarterly Performance Summary
Truist Financial Corporation
Second Quarter 2023


Table of Contents 
Quarterly Performance Summary 
Truist Financial Corporation


  Page
Financial Highlights
Consolidated Statements of Income
Consolidated Ending Balance Sheets
Average Balances and Rates - Quarters
Average Balances and Rates - Year-To-Date
Credit Quality
Segment Financial Performance
Capital Information
Selected Mortgage Banking Information & Additional Information
Selected Items


Financial Highlights
Quarter EndedYear-to-Date
 (Dollars in millions, except per share data, shares in thousands)June 30March 31Dec. 31Sept. 30June 30June 30June 30
2023202320222022202220232022
Summary Income Statement
Interest income - taxable equivalent(1)
$6,230 $5,836 $5,288 $4,407 $3,701 $12,066 $7,084 
Interest expense2,551 1,917 1,257 624 266 4,468 440 
Net interest income - taxable equivalent3,679 3,919 4,031 3,783 3,435 7,598 6,644 
Less: Taxable-equivalent adjustment54 51 50 38 28 105 54 
Net interest income3,625 3,868 3,981 3,745 3,407 7,493 6,590 
Provision for credit losses538 502 467 234 171 1,040 76 
Net interest income after provision for credit losses3,087 3,366 3,514 3,511 3,236 6,453 6,514 
Noninterest income2,293 2,234 2,227 2,102 2,248 4,527 4,390 
Noninterest expense3,748 3,691 3,722 3,613 3,580 7,439 7,254 
Income before income taxes1,632 1,909 2,019 2,000 1,904 3,541 3,650 
Provision for income taxes287 394 337 363 372 681 702 
Net income1,345 1,515 1,682 1,637 1,532 2,860 2,948 
Noncontrolling interests36 38 
Preferred stock dividends and other75 103 71 97 77 178 165 
Net income available to common shareholders1,234 1,410 1,610 1,536 1,454 2,644 2,781 
Additional Income Statement Information
Revenue - taxable equivalent5,972 6,153 6,258 5,885 5,683 12,125 11,034 
Pre-provision net revenue - unadjusted(2)
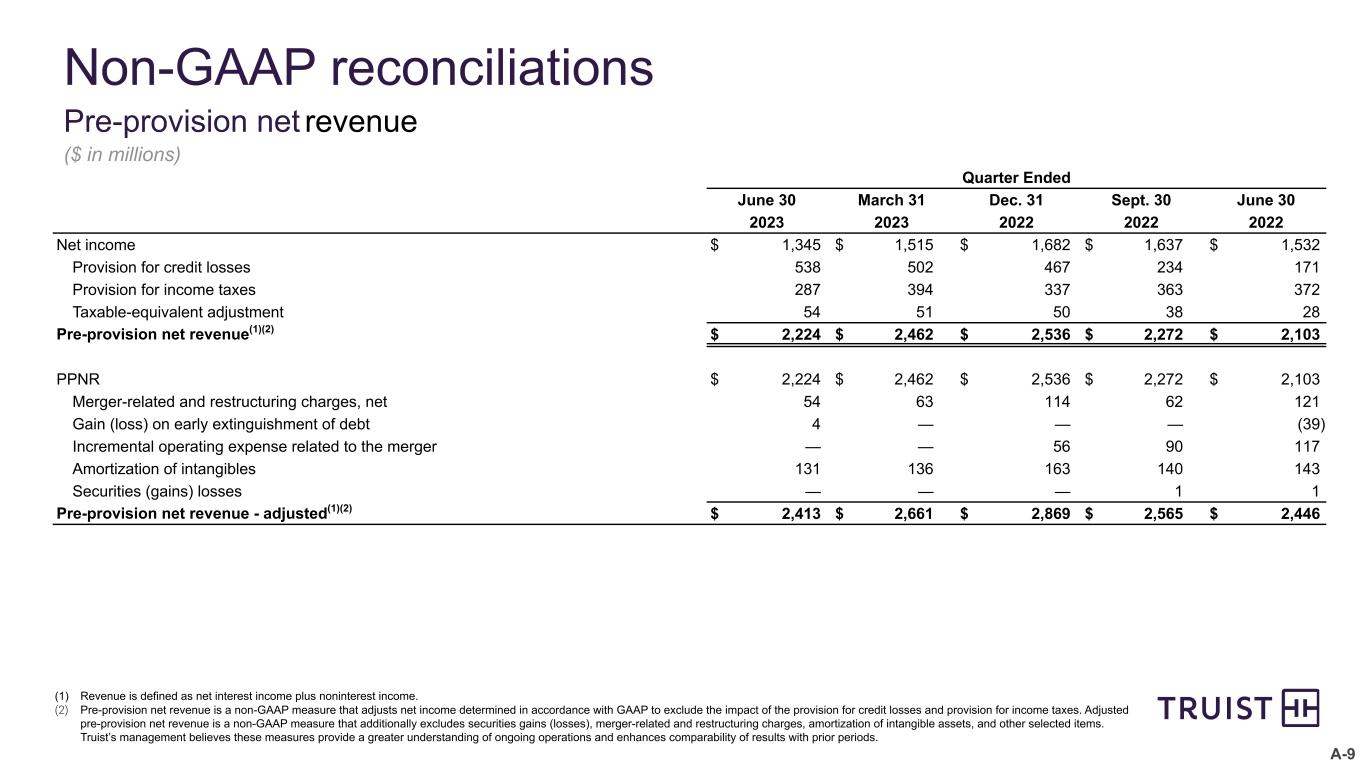
2,224 2,462 2,536 2,272 2,103 4,686 3,780 
Pre-provision net revenue - adjusted(2)
2,413 2,661 2,869 2,565 2,446 5,074 4,673 
Per Common Share Data
Earnings:
Earnings per share-basic$0.93 $1.06 $1.21 $1.16 $1.09 $1.99 $2.09 
Earnings per share-diluted0.92 1.05 1.20 1.15 1.09 1.98 2.08 
Earnings per share-adjusted diluted(2)
NANA1.30 1.24 1.20 NA2.43 
Cash dividends declared0.52 0.52 0.52 0.52 0.48 1.04 0.96 
Common shareholders’ equity42.68 41.82 40.58 40.79 42.45 42.68 42.45 
Tangible common shareholders’ equity(2)
20.44 19.45 18.04 18.36 20.51 20.44 20.51 
End of period shares outstanding1,331,976 1,331,918 1,326,829 1,326,766 1,326,393 1,331,976 1,326,393 
Weighted average shares outstanding-basic1,331,953 1,328,602 1,326,787 1,326,539 1,330,160 1,330,286 1,329,601 
Weighted average shares outstanding-diluted1,337,307 1,339,480 1,337,338 1,336,659 1,338,864 1,338,346 1,340,225 
Performance Ratios
Return on average assets0.95 %1.10 %1.21 %1.19 %1.14 %1.02 %1.10 %
Return on average common shareholders’ equity8.6 10.3 11.7 10.7 10.3 9.5 9.6 
Return on average tangible common shareholders’ equity(2)
19.4 24.1 27.6 23.5 22.7 21.7 20.5 
Net interest margin - taxable equivalent2.91 3.17 3.25 3.12 2.89 3.04 2.83 
Fee income ratio38.8 36.6 35.9 36.0 39.7 37.7 40.0 
Efficiency ratio-GAAP63.3 60.5 60.0 61.8 63.3 61.9 66.1 
Efficiency ratio-adjusted(2)
59.6 56.8 54.2 56.4 57.0 58.2 57.6 
Credit Quality
Nonperforming loans and leases as a percentage of loans and leases held for investment0.47 %0.36 %0.36 %0.35 %0.36 %
Net charge-offs as a percentage of average loans and leases(3)
0.54 0.37 0.34 0.27 0.22 0.46 %0.23 %
Allowance for loan and lease losses as a percentage of LHFI1.43 1.37 1.34 1.34 1.38 1.43 1.38 
Ratio of allowance for loan and lease losses to nonperforming LHFI3.0x3.8x3.7x3.8x3.8x3.0x3.8x
Average Balances
Assets$565,822 $559,627 $552,959 $545,606 $540,568 $562,741 $538,287 
Securities(4)
138,393 140,551 142,433 145,396 148,681 139,466 150,673 
Loans and leases 328,258 327,547 322,733 311,876 299,861 327,905 296,193 
Deposits399,826 408,458 413,276 420,096 423,750 404,118 419,517 
Common shareholders’ equity57,302 55,380 54,823 56,813 56,803 56,346 58,451 
Total shareholders’ equity64,101 62,077 61,519 63,510 63,500 63,095 65,140 
Period-End Balances
Assets$554,549 $574,354 $555,255 $548,438 $545,123 
Securities(4)
124,923 128,790 129,514 131,732 139,359 
Loans and leases 324,015 329,833 327,435 316,639 307,300 
Deposits406,043 404,997 413,495 415,992 424,759 
Common shareholders’ equity56,853 55,699 53,841 54,115 56,302 
Total shareholders’ equity63,681 62,394 60,537 60,811 62,999 
Capital and Liquidity Ratios(preliminary)
Common equity Tier 19.6 %9.1 %9.0 %9.1 %9.2 %
Tier 111.1 10.6 10.5 10.7 10.8 
Total 13.2 12.7 12.4 12.6 12.6 
Leverage8.8 8.5 8.5 8.5 8.6 
Supplementary leverage7.5 7.3 7.3 7.3 7.3 
Liquidity coverage ratio112 113 112 111 110 
Net stable funding ratio(5)
127 127NANANA
Applicable ratios are annualized.
(1)Interest income includes certain fees, deferred costs, fair value mark accretion, and dividends.
(2)Represents a non-GAAP measure. A reconciliation of each of these non-GAAP measures to the most directly comparable GAAP measure is included in the appendix to Truist’s Second Quarter 2023 Earnings Presentation.
(3)2Q23 includes 12 basis point impact from student loan portfolio sale.
(4)Includes AFS and HTM securities. Average balances reflect both AFS and HTM securities at amortized cost. Period-end balances reflect AFS securities at fair value and HTM securities at amortized cost.
(5)Beginning in the second quarter of 2023, the net stable funding ratio disclosure is required semi-annually for the two most recent quarters.
- 1 -


Consolidated Statements of Income
Quarter EndedYear-to-Date
June 30March 31Dec. 31Sept. 30June 30June 30June 30
(Dollars in millions, except per share data, shares in thousands)2023202320222022202220232022
Interest Income
Interest and fees on loans and leases$4,915 $4,656 $4,220 $3,490 $2,898 $9,571 $5,542 
Interest on securities749 752 739 709 675 1,501 1,315 
Interest on other earning assets512 377 279 170 100 889 173 
Total interest income6,176 5,785 5,238 4,369 3,673 11,961 7,030 
Interest Expense
Interest on deposits1,506 1,125 683 331 99 2,631 131 
Interest on long-term debt734 514 332 190 137 1,248 269 
Interest on other borrowings311 278 242 103 30 589 40 
Total interest expense2,551 1,917 1,257 624 266 4,468 440 
Net Interest Income3,625 3,868 3,981 3,745 3,407 7,493 6,590 
Provision for credit losses538 502 467 234 171 1,040 76 
Net Interest Income After Provision for Credit Losses3,087 3,366 3,514 3,511 3,236 6,453 6,514 
Noninterest Income
Insurance income935 813 766 725 825 1,748 1,552 
Wealth management income330 339 324 334 337 669 680 
Investment banking and trading income211 261 257 222 255 472 516 
Service charges on deposits240 249 257 263 254 489 506 
Card and payment related fees236 230 245 241 246 466 458 
Mortgage banking income99 142 117 122 100 241 221 
Lending related fees86 106 110 80 100 192 185 
Operating lease income64 67 68 66 66 131 124 
Securities gains (losses)— — — (1)(1)— (70)
Other income92 27 83 50 66 119 218 
Total noninterest income2,293 2,234 2,227 2,102 2,248 4,527 4,390 
Noninterest Expense
Personnel expense2,256 2,181 2,198 2,116 2,102 4,437 4,153 
Professional fees and outside processing352 314 347 352 349 666 712 
Software expense237 214 241 225 234 451 466 
Net occupancy expense180 183 179 176 181 363 389 
Amortization of intangibles131 136 163 140 143 267 280 
Equipment expense92 110 124 122 114 202 232 
Marketing and customer development79 78 70 105 93 157 177 
Operating lease depreciation44 46 44 45 47 90 95 
Regulatory costs73 75 52 52 44 148 79 
Merger-related and restructuring charges54 63 114 62 121 117 337 
Other expense250 291 190 218 152 541 334 
Total noninterest expense3,748 3,691 3,722 3,613 3,580 7,439 7,254 
Earnings
Income before income taxes1,632 1,909 2,019 2,000 1,904 3,541 3,650 
Provision for income taxes287 394 337 363 372 681 702 
Net income1,345 1,515 1,682 1,637 1,532 2,860 2,948 
Noncontrolling interests36 38 
Preferred stock dividends and other75 103 71 97 77 178 165 
Net income available to common shareholders$1,234 $1,410 $1,610 $1,536 $1,454 $2,644 $2,781 
Earnings Per Common Share
Basic$0.93 $1.06 $1.21 $1.16 $1.09 $1.99 $2.09 
Diluted0.92 1.05 1.20 1.15 1.09 1.98 2.08 
Weighted Average Shares Outstanding
Basic1,331,953 1,328,602 1,326,787 1,326,539 1,330,160 1,330,286 1,329,601 
Diluted1,337,307 1,339,480 1,337,338 1,336,659 1,338,864 1,338,346 1,340,225 
- 2 -


Consolidated Ending Balance Sheets - Five Quarter Trend
June 30March 31Dec. 31Sept. 30June 30
(Dollars in millions)20232023202220222022
Assets
Cash and due from banks$4,782 $4,629 $5,379 $5,031 $5,511 
Interest-bearing deposits with banks25,228 32,967 16,042 17,194 17,602 
Securities borrowed or purchased under resale agreements 2,315 3,637 3,181 2,568 2,650 
Trading assets at fair value4,097 4,601 4,905 5,864 5,230 
Securities available for sale at fair value68,965 71,858 71,801 72,978 79,278 
Securities held to maturity at amortized cost55,958 56,932 57,713 58,754 60,081 
Loans and leases:
Commercial:
Commercial and industrial167,153 167,217 164,307 153,615 149,840 
CRE22,825 22,670 22,676 22,493 22,149 
Commercial construction5,943 5,951 5,849 5,568 5,157 
Consumer:
Residential mortgage56,476 56,455 56,645 55,529 50,903 
Home equity(1)
10,348 10,577 10,876 10,883 10,689 
Indirect auto25,759 27,279 27,951 28,239 27,419 
Other consumer(1)
28,755 27,742 27,533 27,457 26,617 
Student— 4,996 5,287 5,780 6,144 
Credit card4,833 4,786 4,867 4,771 4,744 
Total loans and leases held for investment322,092 327,673 325,991 314,335 303,662 
Loans held for sale1,923 2,160 1,444 2,304 3,638 
Total loans and leases324,015 329,833 327,435 316,639 307,300 
Allowance for loan and lease losses(4,606)(4,479)(4,377)(4,205)(4,187)
Premises and equipment3,453 3,519 3,605 3,585 3,682 
Goodwill27,013 27,014 27,013 26,810 26,299 
Core deposit and other intangible assets3,403 3,535 3,672 3,726 3,535 
Loan servicing rights at fair value3,497 3,303 3,758 3,797 3,466 
Other assets36,429 37,005 35,128 35,697 34,676 
Total assets$554,549 $574,354 $555,255 $548,438 $545,123 
Liabilities
Deposits:
Noninterest-bearing deposits$121,831 $128,719 $135,742 $144,826 $147,752 
Interest checking106,471 107,116 110,464 110,397 114,143 
Money market and savings135,514 136,836 143,815 146,315 149,302 
Time deposits42,227 32,326 23,474 14,454 13,562 
Total deposits406,043 404,997 413,495 415,992 424,759 
Short-term borrowings24,456 23,678 23,422 25,687 13,736 
Long-term debt44,749 69,895 43,203 31,172 30,319 
Other liabilities15,620 13,390 14,598 14,776 13,310 
Total liabilities490,868 511,960 494,718 487,627 482,124 
Shareholders’ Equity:
Preferred stock6,673 6,673 6,673 6,673 6,673 
Common stock6,660 6,660 6,634 6,634 6,632 
Additional paid-in capital 35,990 34,582 34,544 34,487 34,410 
Retained earnings27,577 27,038 26,264 25,344 24,500 
Accumulated other comprehensive loss(13,374)(12,581)(13,601)(12,350)(9,240)
Noncontrolling interests155 22 23 23 24 
Total shareholders’ equity63,681 62,394 60,537 60,811 62,999 
Total liabilities and shareholders’ equity$554,549 $574,354 $555,255 $548,438 $545,123 
(1)In the first quarter of 2023, the Company reclassified certain portfolios within the consumer portfolio segment to delineate home equity from other consumer portfolios. Prior periods were revised to conform to the current presentation.
- 3 -


Average Balances and Rates - Quarters
 Quarter Ended
 June 30, 2023March 31, 2023December 31, 2022September 30, 2022June 30, 2022
(Dollars in millions)
Average Balances(1)
Income/Expense(2)
Yields/ Rates(2)
Average Balances(1)
Income/Expense(2)
Yields/ Rates(2)
Average Balances(1)
Income/Expense(2)
Yields/ Rates(2)
Average Balances(1)
Income/Expense(2)
Yields/ Rates(2)
Average Balances(1)
Income/Expense(2)
Yields/ Rates(2)
Assets               
AFS and HTM securities at amortized cost:
U.S. Treasury$11,115 $30 1.10 %$11,117 $30 1.07 %$10,989 $27 0.98 %$10,925 $26 0.93 %$10,544 $22 0.86 %
U.S. government-sponsored entities (GSE)329 2.70 335 2.86 325 2.47 305 2.56 255 1.96 
Mortgage-backed securities issued by GSE122,647 690 2.25 124,746 694 2.23 126,718 682 2.16 129,703 655 2.02 133,339 625 1.88 
States and political subdivisions425 4.18 425 4.07 426 4.03 395 3.92 371 3.83 
Non-agency mortgage-backed3,852 22 2.32 3,907 23 2.34 3,953 23 2.33 4,016 24 2.32 4,097 23 2.30 
Other25 — 5.20 21 — 5.30 22 4.44 52 — 3.94 75 3.66 
Total securities138,393 750 2.17 140,551 753 2.14 142,433 740 2.08 145,396 710 1.95 148,681 676 1.82 
Loans and leases:
Commercial:
Commercial and industrial166,588 2,610 6.28 165,095 2,436 5.98 159,308 2,098 5.23 152,123 1,564 4.08 145,558 1,174 3.24 
CRE22,706 384 6.73 22,689 355 6.32 22,497 314 5.51 22,245 245 4.32 22,508 193 3.41 
Commercial construction5,921 111 7.64 5,863 101 7.14 5,711 88 6.25 5,284 62 4.83 5,256 43 3.46 
Consumer:
Residential mortgage56,320 531 3.77 56,422 526 3.73 56,292 514 3.65 53,271 478 3.59 49,237 440 3.58 
Home equity(3)
10,478 190 7.26 10,735 180 6.80 10,887 164 6.02 10,767 142 5.17 10,677 118 4.52 
Indirect auto26,558 398 6.01 27,743 398 5.82 28,117 396 5.59 28,057 382 5.40 26,496 362 5.47 
Other consumer(3)
28,189 499 7.10 27,559 459 6.76 27,479 447 6.44 26,927 419 6.21 25,918 391 6.00 
Student4,766 80 6.76 5,129 89 7.04 5,533 90 6.42 5,958 85 5.64 6,331 66 4.20 
Credit card4,846 137 11.48 4,785 136 11.43 4,842 127 10.38 4,755 119 9.97 4,728 105 8.91 
Total loans and leases held for investment326,372 4,940 6.07 326,020 4,680 5.81 320,666 4,238 5.25 309,387 3,496 4.49 296,709 2,892 3.91 
Loans held for sale1,886 28 5.94 1,527 25 6.71 2,067 31 6.08 2,489 30 4.81 3,152 33 4.20 
Total loans and leases328,258 4,968 6.07 327,547 4,705 5.81 322,733 4,269 5.26 311,876 3,526 4.49 299,861 2,925 3.91 
Interest earning trading assets4,445 75 6.73 5,462 83 6.09 5,717 79 5.60 5,446 62 4.49 6,073 55 3.55 
Other earning assets34,988 437 5.02 25,589 295 4.67 21,922 200 3.60 19,631 109 2.24 21,203 45 0.85 
Total earning assets506,084 6,230 4.93 499,149 5,836 4.72 492,805 5,288 4.27 482,349 4,407 3.63 475,818 3,701 3.12 
Nonearning assets59,738 60,478 60,154 63,257 64,750 
Total assets$565,822 $559,627 $552,959 $545,606 $540,568 
Liabilities and Shareholders’ Equity        
Interest-bearing deposits:      
Interest checking$102,105 487 1.91 $108,886 430 1.60 $110,001 304 1.10 $111,645 158 0.56 $112,375 43 0.15 
Money market and savings138,149 686 1.99 139,802 476 1.38 144,730 316 0.87 147,659 159 0.43 148,632 50 0.13 
Time deposits35,844 333 3.73 28,671 219 3.10 17,513 63 1.42 14,751 14 0.40 14,133 0.17 
Total interest-bearing deposits276,098 1,506 2.19 277,359 1,125 1.64 272,244 683 1.00 274,055 331 0.48 275,140 99 0.14 
Short-term borrowings23,991 311 5.19 24,056 278 4.69 25,640 242 3.75 17,392 103 2.34 9,618 30 1.26 
Long-term debt63,665 734 4.62 51,057 514 4.05 38,700 332 3.42 31,381 190 2.43 31,263 137 1.75 
Total interest-bearing liabilities363,754 2,551 2.81 352,472 1,917 2.20 336,584 1,257 1.48 322,828 624 0.77 316,021 266 0.34 
Noninterest-bearing deposits123,728 131,099 141,032 146,041 148,610 
Other liabilities14,239 13,979 13,824 13,227 12,437 
Shareholders’ equity64,101 62,077 61,519 63,510 63,500 
Total liabilities and shareholders’ equity$565,822 $559,627 $552,959 $545,606 $540,568 
Average interest-rate spread2.12 2.52 2.79 2.86 2.78 
Net interest income/ net interest margin$3,679 2.91 %$3,919 3.17 %$4,031 3.25 %$3,783 3.12 %$3,435 2.89 %
Taxable-equivalent adjustment54 51 50 38 28 
Memo: Total deposits$399,826 1,506 1.51 %$408,458 1,125 1.12 %$413,276 683 0.66 %$420,096 331 0.31 %$423,750 99 0.09 %
(1)Excludes basis adjustments for fair value hedges.
(2)Amounts are on a taxable-equivalent basis utilizing the federal income tax rate of 21% for the periods presented. Interest income includes certain fees, deferred costs, and dividends.
(3)In the first quarter of 2023, the Company reclassified certain portfolios within the consumer portfolio segment to delineate home equity from other consumer portfolios. Prior periods were revised to conform to the current presentation.
- 4 -


Average Balances and Rates - Year-To-Date
 Year-to-Date
 June 30, 2023June 30, 2022
(Dollars in millions)
Average Balances(1)
Income/Expense(2)
Yields/ Rates(2)
Average Balances(1)
Income/Expense(2)
Yields/ Rates(2)
Assets      
AFS and HTM securities at amortized cost:
U.S. Treasury$11,116 $60 1.08 %$10,219 $40 0.79 %
U.S. government-sponsored entities (GSE)332 2.78 685 2.11 
Mortgage-backed securities issued by GSE123,692 1,384 2.24 135,185 1,215 1.80 
States and political subdivisions425 4.12 372 3.77 
Non-agency mortgage-backed3,879 45 2.33 4,161 47 2.27 
Other22 — 5.24 51 3.22 
Total securities139,466 1,503 2.16 150,673 1,317 1.75 
Loans and leases:
Commercial:
Commercial and industrial165,846 5,046 6.13 142,233 2,161 3.06 
CRE22,698 739 6.52 23,029 361 3.12 
Commercial construction5,892 212 7.39 5,152 78 3.26 
Consumer:
Residential mortgage56,370 1,057 3.75 48,610 868 3.57 
Home equity(3)
10,606 370 7.03 10,747 234 4.43 
Indirect auto27,147 796 5.91 26,293 719 5.51 
Other consumer(3)
27,876 958 6.93 25,424 774 6.12 
Student4,947 169 6.91 6,489 129 4.02 
Credit card4,815 273 11.45 4,705 209 8.94 
Total loans and leases held for investment326,197 9,620 5.94 292,682 5,533 3.81 
Loans held for sale1,708 53 6.28 3,511 61 3.47 
Total loans and leases327,905 9,673 5.94 296,193 5,594 3.80 
Interest earning trading assets4,951 158 6.38 5,956 98 3.30 
Other earning assets30,314 732 4.87 20,074 75 0.75 
Total earning assets502,636 12,066 4.83 472,896 7,084 3.01 
Nonearning assets60,105 65,391 
Total assets$562,741 $538,287 
Liabilities and Shareholders’ Equity    
Interest-bearing deposits:
Interest checking$105,477 917 1.75 $112,268 57 0.10 
Money market and savings138,972 1,162 1.69 145,085 61 0.08 
Time deposits32,276 552 3.45 14,885 13 0.18 
Total interest-bearing deposits276,725 2,631 1.92 272,238 131 0.10 
Short-term borrowings24,023 589 4.94 8,289 40 0.98 
Long-term debt57,396 1,248 4.37 33,289 269 1.61 
Total interest-bearing liabilities358,144 4,468 2.51 313,816 440 0.28 
Noninterest-bearing deposits127,393 147,279 
Other liabilities14,109 12,052 
Shareholders’ equity63,095 65,140 
Total liabilities and shareholders’ equity$562,741 $538,287 
Average interest-rate spread2.32 2.73 
Net interest income/ net interest margin$7,598 3.04 %$6,644 2.83 %
Taxable-equivalent adjustment105 54 
Memo: Total deposits$404,118 2,631 1.31 %$419,517 131 0.06 %
(1)Excludes basis adjustments for fair value hedges.
(2)Amounts are on a taxable-equivalent basis utilizing the federal income tax rate of 21% for the periods presented. Interest income includes certain fees, deferred costs, and dividends.
(3)In the first quarter of 2023, the Company reclassified certain portfolios within the consumer portfolio segment to delineate home equity from other consumer portfolios. Prior periods were revised to conform to the current presentation.
- 5 -


Credit Quality
 June 30March 31Dec. 31Sept. 30June 30
(Dollars in millions)20232023202220222022
Nonperforming Assets     
Nonaccrual loans and leases:     
Commercial:     
Commercial and industrial$562 $394 $398 $443 $393 
CRE275 117 82 19 
Commercial construction16 — — — 
Consumer:
Residential mortgage221 233 240 227 269 
Home equity(1)
129 132 135 132 133 
Indirect auto262 270 289 260 244 
Other consumer(1)
46 45 44 39 32 
Total nonaccrual loans and leases held for investment1,511 1,192 1,188 1,106 1,090 
Loans held for sale13 — — 72 33 
Total nonaccrual loans and leases1,524 1,192 1,188 1,178 1,123 
Foreclosed real estate
Other foreclosed property56 66 58 58 47 
Total nonperforming assets$1,583 $1,261 $1,250 $1,240 $1,173 
Loans 90 Days or More Past Due and Still Accruing
Commercial:
Commercial and industrial$36 $35 $49 $44 $27 
CRE— — 
Commercial construction— — — 
Consumer:
Residential mortgage - government guaranteed541 649 759 808 884 
Residential mortgage - nonguaranteed23 25 27 26 27 
Home equity(1)
10 12 
Indirect auto— — 
Other consumer(1)
12 10 13 
Student - government guaranteed— 590 702 770 796 
Student - nonguaranteed— 
Credit card38 38 37 36 28 
Total loans 90 days past due and still accruing$662 $1,361 $1,605 $1,709 $1,787 
Loans 30-89 Days Past Due
Commercial:
Commercial and industrial$142 $125 $256 $162 $223 
CRE38 34 25 15 10 
Commercial construction
Consumer:
Residential mortgage - government guaranteed267 232 268 234 233 
Residential mortgage - nonguaranteed254 259 346 300 302 
Home equity(1)
56 65 68 67 68 
Indirect auto549 511 646 591 584 
Other consumer(1)
175 164 187 152 166 
Student - government guaranteed— 350 396 375 447 
Student - nonguaranteed— 
Credit card63 56 64 52 48 
Total loans 30-89 days past due $1,550 $1,805 $2,267 $1,957 $2,091 
(1)In the first quarter of 2023, the Company reclassified certain portfolios within the consumer portfolio segment to delineate home equity from other consumer portfolios. Prior periods were revised to conform to the current presentation.
- 6 -


As of/For the Quarter Ended
 June 30March 31Dec. 31Sept. 30June 30
 20232023202220222022
Asset Quality Ratios     
Loans 30-89 days past due and still accruing as a percentage of loans and leases0.48 %0.55 %0.70 %0.62 %0.69 %
Loans 90 days or more past due and still accruing as a percentage of loans and leases0.21 0.42 0.49 0.54 0.59 
Nonperforming loans and leases as a percentage of loans and leases held for investment0.47 0.36 0.36 0.35 0.36 
Nonperforming loans and leases as a percentage of loans and leases(1)
0.47 0.36 0.36 0.37 0.37 
Nonperforming assets as a percentage of:
Total assets(1)
0.29 0.22 0.23 0.23 0.22 
Loans and leases plus foreclosed property0.49 0.38 0.38 0.37 0.38 
Net charge-offs as a percentage of average loans and leases(2)
0.54 0.37 0.34 0.27 0.22 
Allowance for loan and lease losses as a percentage of loans and leases1.43 1.37 1.34 1.34 1.38 
Ratio of allowance for loan and lease losses to:
Net charge-offs(3)
2.6X3.7X4.1X5.0X6.5X
Nonperforming loans and leases3.0X3.8X3.7X3.8X3.8X
Asset Quality Ratios (Excluding Government Guaranteed)
Loans 90 days or more past due and still accruing as a percentage of loans and leases0.04 %0.04 %0.04 %0.04 %0.04 %
    As of/For the Year-to-Date
    Period Ended June 30
    20232022
Asset Quality Ratios     
Net charge-offs as a percentage of average loans and leases   0.46 %0.23 %
Ratio of allowance for loan and lease losses to net charge-offs   3.1X6.2X
Applicable ratios are annualized.
(1)Includes loans held for sale.
(2)2Q23 includes 12 basis point impact from student loan portfolio sale.
(3)Excluding the impact from the student loan charge-offs, the ALLL to annualized net charge-offs was 3.4X at June 30, 2023.
- 7 -


As of/For the Quarter EndedAs of/For the Year-to-Date
 June 30March 31Dec. 31Sept. 30June 30Period Ended June 30
(Dollars in millions)2023202320222022202220232022
Allowance for Credit Losses(1)
     
Beginning balance$4,761 $4,649 $4,455 $4,434 $4,423 $4,649 $4,695 
Provision for credit losses558 482 467 234 171 1,040 76 
Charge-offs:
Commercial:
Commercial and industrial(107)(75)(44)(51)(17)(182)(48)
CRE(35)(6)(11)— (1)(41)(2)
Commercial construction— — — — — — (1)
Consumer:
Residential mortgage(1)(1)(1)(4)(2)(2)(4)
Home equity(2)
(2)(2)(6)(3)(3)(4)(4)
Indirect auto(115)(127)(129)(103)(77)(242)(179)
Other consumer(2)
(104)(105)(96)(109)(100)(209)(176)
Student(103)(5)(5)(7)(4)(108)(10)
Credit card(53)(51)(53)(42)(40)(104)(81)
Total charge-offs(520)(372)(345)(319)(244)(892)(505)
Recoveries:       
Commercial:       
Commercial and industrial13 13 14 43 13 26 30 
CRE— — 
Commercial construction— 
Consumer:
Residential mortgage10 
Home equity(2)
11 11 
Indirect auto31 26 21 21 26 57 49 
Other consumer(2)
20 17 17 21 20 37 41 
Student— — — — — — 
Credit card18 18 
Total recoveries80 75 72 106 85 155 168 
Net charge-offs(440)(297)(273)(213)(159)(737)(337)
Other(3)
— (73)— — (1)(73)— 
Ending balance$4,879 $4,761 $4,649 $4,455 $4,434 $4,879 $4,434 
Allowance for Credit Losses:(1)
     
Allowance for loan and lease losses$4,606 $4,479 $4,377 $4,205 $4,187 
Reserve for unfunded lending commitments (RUFC)273 282 272 250 247 
Allowance for credit losses$4,879 $4,761 $4,649 $4,455 $4,434 
(1)Excludes provision for credit losses and allowances related to other financial assets at amortized cost.
(2)In the first quarter of 2023, the Company reclassified certain portfolios within the consumer portfolio segment to delineate home equity from other consumer portfolios. Prior periods were revised to conform to the current presentation.
(3)The first quarter of 2023 includes the impact from the adoption of the Troubled Debt Restructurings and Vintage Disclosures accounting standard.

Quarter EndedAs of/For the Year-to-Date
 June 30March 31Dec. 31Sept. 30June 30Period Ended June 30
 2023202320222022202220232022
Net Charge-offs as a Percentage of Average Loans and Leases:
Commercial:     
Commercial and industrial0.23 %0.15 %0.08 %0.02 %0.01 %0.19 %0.03 %
CRE0.62 0.09 0.19 (0.01)(0.10)0.35 (0.04)
Commercial construction(0.02)(0.04)(0.06)(0.10)(0.08)(0.03)(0.05)
Consumer:
Residential mortgage(0.01)— (0.02)0.01 (0.02)(0.01)(0.02)
Home equity(0.12)(0.15)(0.01)(0.13)(0.17)(0.14)(0.14)
Indirect auto1.28 1.47 1.52 1.15 0.77 1.38 1.00 
Other consumer1.20 1.29 1.11 1.31 1.27 1.25 1.07 
Student8.67 0.42 0.34 0.40 0.30 4.42 0.31 
Credit card3.66 3.54 3.68 2.80 2.63 3.60 2.70 
Total loans and leases0.54 0.37 0.34 0.27 0.22 0.46 0.23 
Applicable ratios are annualized. 

- 8 -


Rollforward of Intangible Assets and Selected Fair Value Marks(1)
 As of/For the Quarter Ended
June 30March 31Dec. 31Sept. 30June 30
(Dollars in millions)20232023202220222022
Loans and Leases(2)
Beginning balance unamortized fair value mark$(673)$(741)$(826)$(924)$(1,119)
Accretion63 64 80 96 189 
Purchase accounting adjustments and other activity31 
Ending balance$(579)$(673)$(741)$(826)$(924)
Core deposit and other intangible assets
Beginning balance$3,535 $3,672 $3,726 $3,535 $3,693 
Additions - acquisitions— — 111 336 — 
Amortization of intangibles(3)
(131)(136)(163)(140)(143)
Amortization in net occupancy expense(1)(1)(3)(5)(5)
Purchase accounting adjustments and other activity— — — (10)
Ending balance$3,403 $3,535 $3,672 $3,726 $3,535 
Deposits(4)
Beginning balance unamortized fair value mark$— $— $(1)$(3)$(5)
Amortization— — 
Ending balance$— $— $— $(1)$(3)
Long-Term Debt(4)
Beginning balance unamortized fair value mark$(69)$(81)$(94)$(109)$(122)
Amortization12 12 13 15 13 
Adjustments(2)— — $— $— 
Ending balance$(59)$(69)$(81)$(94)$(109)
(1)Includes only selected information and does not represent all purchase accounting adjustments.
(2)Purchase accounting marks on loans and leases includes credit, interest and liquidity components, and are generally recognized using the level-yield or straight-line method over the remaining life of the individual loans or recognized in full in the event of prepayment.
(3)4Q22 amortization expense includes $16 million partial write-down of an investment advisory intangible asset from a prior acquisition.
(4)Purchase accounting marks on liabilities represents interest rate marks on time deposits and long-term debt and are recognized using the level-yield method over the term of the liability.

- 9 -


Segment Financial Performance - Preliminary
   
Quarter Ended
June 30March 31Dec. 31Sept. 30June 30
(Dollars in millions)20232023202220222022
Consumer Banking and Wealth
Net interest income (expense)$1,454 $1,603 $1,730 $1,686 $1,568 
Net intersegment interest income (expense) 1,214 1,145 1,234 980 725 
Segment net interest income2,668 2,748 2,964 2,666 2,293 
Allocated provision for credit losses224 274 311 283 199 
Noninterest income828 873 846 836 831 
Noninterest expense2,048 2,057 1,924 1,930 1,927 
Income (loss) before income taxes1,224 1,290 1,575 1,289 998 
Provision (benefit) for income taxes293 308 373 305 238 
Segment net income (loss)$931 $982 $1,202 $984 $760 
Corporate and Commercial Banking(1)
Net interest income (expense)$2,420 $2,306 $2,087 $1,640 $1,305 
Net intersegment interest income (expense) (720)(559)(227)(2)54 
Segment net interest income1,700 1,747 1,860 1,638 1,359 
Allocated provision for credit losses312 232 139 (49)(27)
Noninterest income576 630 678 645 688 
Noninterest expense872 883 853 828 815 
Income (loss) before income taxes1,092 1,262 1,546 1,504 1,259 
Provision (benefit) for income taxes212 262 326 323 273 
Segment net income (loss)$880 $1,000 $1,220 $1,181 $986 
Insurance Holdings(1)
Net interest income (expense)$$$$$
Net intersegment interest income (expense)(2)
(85)13 11 10 
Segment net interest income(84)14 12 11 
Allocated provision for credit losses— — — — — 
Noninterest income944 817 792 731 830 
Noninterest expense705 686 662 628 610 
Income (loss) before income taxes(3)
155 145 142 114 226 
Provision (benefit) for income taxes(3)
— 36 35 29 55 
Segment net income (loss)$155 $109 $107 $85 $171 
Other, Treasury & Corporate(4)
Net interest income (expense)$(250)$(42)$163 $418 $533 
Net intersegment interest income (expense) (409)(599)(1,018)(988)(784)
Segment net interest income(659)(641)(855)(570)(251)
Allocated provision for credit losses(4)17 — (1)
Noninterest income(55)(86)(89)(110)(101)
Noninterest expense123 65 283 227 228 
Income (loss) before income taxes(3)
(839)(788)(1,244)(907)(579)
Provision (benefit) for income taxes(3)
(218)(212)(397)(294)(194)
Segment net income (loss)$(621)$(576)$(847)$(613)$(385)
Total Truist Financial Corporation
Net interest income (expense)$3,625 $3,868 $3,981 $3,745 $3,407 
Net intersegment interest income (expense) — — — — — 
Segment net interest income3,625 3,868 3,981 3,745 3,407 
Allocated provision for credit losses538 502 467 234 171 
Noninterest income2,293 2,234 2,227 2,102 2,248 
Noninterest expense3,748 3,691 3,722 3,613 3,580 
Income (loss) before income taxes1,632 1,909 2,019 2,000 1,904 
Provision (benefit) for income taxes287 394 337 363 372 
Net income$1,345 $1,515 $1,682 $1,637 $1,532 
(1)During the first quarter of 2023, Truist reorganized Prime Rate Premium Finance Corporation, which includes AFCO Credit Corporation and CAFO Holding Company, into the C&CB segment. Prior period results have been revised to conform to the current presentation. During the second quarter of 2023, Truist updated its cost allocation methodology. Results for the first quarter of 2023 have been revised to conform to the current presentation. Management concluded the impact to 2022 was not material.
(2)In conjunction with the Company’s April 3, 2023 sale of a 20% stake of the common equity in Truist Insurance Holdings, LLC (“Insurance Holdings”), Insurance Holdings issued $5 billion of 8.25% mandatorily redeemable preferred units to the Company, with the related interest expense, which is fully allocable to the Company, reported in Net intersegment interest income (expense).
(3)Also related to the same transaction, Insurance Holding’s recapitalized from a corporate entity to an LLC, such that each partner is allocated its share of Insurance Holding’s income before taxes, and beginning in the second quarter of 2023 the Company recognizes its associated income tax provision through Other, Treasury & Corporate. The Company elected not to restate prior periods for this change based on Insurance Holding’s previous status as a corporate entity. The Company recognized $54 million for the second quarter 2023 tax provision related to Insurance Holdings in Other, Treasury & Corporate.
(4)Includes financial data from subsidiaries below the quantitative and qualitative thresholds requiring disclosure.
- 10 -


Capital Information - Five Quarter Trend
 As of/For the Quarter Ended
 June 30March 31Dec. 31Sept. 30June 30
(Dollars in millions, except per share data, shares in thousands)20232023202220222022
Selected Capital Information(preliminary)    
Risk-based capital:     
Common equity tier 1$41,643 $39,533 $39,098 $38,277 $38,016 
Tier 148,313 46,203 45,768 44,947 44,686 
Total57,237 55,237 54,072 53,223 52,186 
Risk-weighted assets434,985 436,381 434,413 421,489 413,384 
Average quarterly assets for leverage ratio550,734 544,334 539,689 526,454 521,113 
Average quarterly assets for supplementary leverage ratio643,666 635,656 629,960 616,368 608,770 
Risk-based capital ratios:
Common equity tier 19.6 %9.1 %9.0 %9.1 %9.2 %
Tier 111.1 10.6 10.5 10.7 10.8 
Total13.2 12.7 12.4 12.6 12.6 
Leverage capital ratio8.8 8.5 8.5 8.5 8.6 
Supplementary leverage7.5 7.3 7.3 7.3 7.3 
Common equity per common share$42.68 $41.82 $40.58 $40.79 $42.45 
June 30March 31Dec. 31Sept. 30June 30
(Dollars in millions, except per share data, shares in thousands)20232023202220222022
Calculations of Tangible Common Equity and Related Measures:(1)
Total shareholders’ equity$63,681 $62,394 $60,537 $60,811 $62,999 
Less:
Preferred stock6,673 6,673 6,673 6,673 6,673 
Noncontrolling interests155 22 23 23 24 
Intangible assets, net of deferred taxes29,628 29,788 29,908 29,752 29,095 
Tangible common equity$27,225 $25,911 $23,933 $24,363 $27,207 
Outstanding shares at end of period (in thousands)1,331,976 1,331,918 1,326,829 1,326,766 1,326,393 
Tangible common equity per common share$20.44 $19.45 $18.04 $18.36 $20.51 
Total assets$554,549 $574,354 $555,255 $548,438 $545,123 
Less: Intangible assets, net of deferred taxes29,628 29,788 29,908 29,752 29,095 
Tangible assets$524,921 $544,566 $525,347 $518,686 $516,028 
Equity as a percentage of total assets11.5 %10.9 %10.9 %11.1 %11.6 %
Tangible common equity as a percentage of tangible assets5.2 4.8 4.6 4.7 5.3 
(1)Tangible common equity and related measures are non-GAAP measures that exclude the impact of intangible assets, net of deferred taxes, and their related amortization. These measures are useful for evaluating the performance of a business consistently, whether acquired or developed internally. Truist’s management uses these measures to assess profitability, returns relative to balance sheet risk, and shareholder value. These measures are not necessarily comparable to similar measures that may be presented by other companies.

- 11 -


Selected Mortgage Banking Information & Additional Information
 As of/For the Quarter Ended
June 30March 31Dec. 31Sept. 30June 30
(Dollars in millions, except per share data)20232023202220222022
Mortgage Banking Income
Residential mortgage income:
Residential mortgage production revenue$22 $17 $$$36 
Residential mortgage servicing income:
Residential mortgage income before MSR valuation77 155 88 80 49 
Net MSRs valuation(19)(50)(10)(9)(11)
Total residential mortgage servicing income58 105 78 71 38 
Total residential mortgage income80 122 85 72 74 
Commercial mortgage income:
Commercial mortgage production revenue16 14 28 30 21 
Commercial mortgage servicing income:
Commercial mortgage income before MSR valuation
Net MSRs valuation(1)(1)— 15 
Total commercial mortgage servicing income20 
Total commercial mortgage income19 20 32 50 26 
Total mortgage banking income99 142 117 122 100 
Other Mortgage Banking Information
Residential mortgage loan originations$5,558 $4,022 $4,868 $11,746 $11,330 
Residential mortgage servicing portfolio:(1)
     
Loans serviced for others222,917 214,830 217,046 218,740 209,504 
Bank-owned loans serviced57,147 57,493 56,982 56,786 53,341 
Total servicing portfolio280,064 272,323 274,028 275,526 262,845 
Weighted-average coupon rate on mortgage loans serviced for others3.54 %3.52 %3.48 %3.45 %3.42 %
Weighted-average servicing fee on mortgage loans serviced for others0.27 0.27 0.31 0.30 0.30 
Additional Information
Brokered deposits(2)
$32,307 $23,816 $22,353 $20,239 $22,926 
NQDCP income (expense):
Interest income$$11 $$$
Other income(18)20 (28)(30)
Personnel expense(12)(22)26 28 
Total NQDCP income (expense) $— $— $— $— $— 
Common stock prices:
High$35.39 $51.26 $47.47 $52.22 $57.50 
Low25.56 28.70 40.01 42.56 44.75 
End of period30.35 34.10 43.03 43.54 47.43 
Banking offices2,002 2,006 2,123 2,119 2,117 
ATMs3,041 3,041 3,227 3,185 3,194 
FTEs(3)
52,564 53,653 53,999 52,648 51,349 
(1)Amounts reported are unpaid principal balance.
(2)Amounts represented in interest checking, money market and savings, and time deposits.
(3)FTEs represents an average for the quarter.
- 12 -


Selected Items(1)
 Favorable (Unfavorable)
(Dollars in millions)After-Tax at
DescriptionPre-TaxMarginal Rate
Selected Items
Second Quarter 2023
None$— $— 
First Quarter 2023
None$— $— 
Fourth Quarter 2022
Incremental operating expenses related to the merger ($51 million professional fees and outside processing and $5 million other line items)$(56)$(43)
Third Quarter 2022
Incremental operating expenses related to the merger ($72 million professional fees and outside processing and $18 million other line items)$(90)$(69)
Second Quarter 2022
Incremental operating expenses related to the merger ($103 million professional fees and outside processing, $11 million personnel expense, and $3 million other line items)$(117)$(89)
Gain (loss) on early extinguishment of debt (other expense)39 30 
First Quarter 2022
Incremental operating expenses related to the merger ($133 million professional fees and outside processing, $24 million personnel expense, $20 million net occupancy expense, and $25 million other line items)$(202)$(155)
Gain on redemption of noncontrolling equity interest related to the acquisition of certain merchant services relationships (other income)
74 57 
(1)Includes selected items representing a part of line items within the consolidated statements of income. Excludes line items adjusted in their entirety, such as securities gains and losses and costs classified as merger-related and restructuring charges as well as immaterial adjustments made for gains and losses on the early extinguishment of debt.

- 13 -
Second Quarter 2023 Earnings Conference Call Bill Rogers – Chairman & CEO Mike Maguire – CFO July 20, 2023


2 This presentation contains “forward-looking statements” within the meaning of the Private Securities Litigation Reform Act of 1995, regarding the financial condition, results of operations, business plans and the future performance of Truist. Words such as “anticipates,” “believes,” “estimates,” “expects,” “forecasts,” “intends,” “plans,” “projects,” “may,” “will,” “should,” “would,” “could” and other similar expressions are intended to identify these forward-looking statements. In particular, forward looking statements include, but are not limited to, statements we make about: (i) the benefits of Truist’s shift from integrating to operating and being “One Truist”, (ii) guidance with respect to financial performance metrics in future periods, including future levels of GAAP revenues, GAAP and adjusted expenses, adjusted operating leverage and net charge-off ratio, (iii) Truist’s ability to perform well through a range of economic scenarios, (iv) Truist’s effective tax rate in future periods, (v) projections of preferred stock dividends in 2023, (vi) loan growth in future periods, (vii) the effects of purchase accounting accretion in future periods, (viii) expected declines in overdraft fees through 2024, (ix) anticipated restructuring costs and expense rationalization efforts, (x) expectations for organic capital generation in 2023, (xi) Truist’s goal to produce strong growth and profitability with less volatility than peers, (xii) Truist’s potential to generate value through Integrated Relationship Management, and (xiii) Truist’s expected CET1 ratio in future periods, as well as the estimation impact of including AOCI in the calculation of the CET1 ratio. Forward-looking statements are not based on historical facts but instead represent management’s expectations and assumptions regarding Truist’s business, the economy and other future conditions. Such statements involve inherent uncertainties, risks and changes in circumstances that are difficult to predict. As such, Truist’s actual results may differ materially from those contemplated by forward-looking statements. While there can be no assurance that any list of risks and uncertainties or risk factors is complete, important factors that could cause actual results to differ materially from those contemplated by forward-looking statements include the following, without limitation, as well as the risks and uncertainties more fully discussed under Part I, Item 1A-Risk Factors in our Annual Report on Form 10-K for the year ended December 31, 2022 and in Truist’s subsequent filings with the Securities and Exchange Commission: • changes in the interest rate environment, including the replacement of LIBOR as an interest rate benchmark, could adversely affect Truist’s revenue and expenses, the value of assets and obligations, including our portfolio of investment securities, and the availability and cost of capital, cash flows, and liquidity; • Truist is subject to credit risk by lending or committing to lend money, may have more credit risk and higher credit losses to the extent that loans are concentrated by loan type, industry segment, borrower type or location of the borrower or collateral, and may suffer losses if the value of collateral declines in stressed market conditions; • inability to access short-term funding or liquidity, loss of client deposits or changes in Truist’s credit ratings could increase the cost of funding, limit access to capital markets, or negatively affect Truist’s overall liquidity or capitalization; • Truist may be impacted by actual or perceived soundness of other financial institutions, including as a result of the financial or operational failure of a major financial institution, or concerns about the creditworthiness of such a financial institution or its ability to fulfill its obligations, which can cause substantial and cascading disruption within the financial markets and increased expenses, including FDIC insurance premiums, and could affect our ability to attract and retain depositors and to borrow or raise capital; • general economic or business conditions, either globally, nationally or regionally, may be less favorable than expected, including as a result of supply chain disruptions, inflationary pressures and labor shortages, and instability in global geopolitical matters, including due to an outbreak or escalation of hostilities, or volatility in financial markets could result in, among other things, slower deposit or asset growth, a deterioration in credit quality, or a reduced demand for credit, insurance, or other services; • the monetary and fiscal policies of the federal government and its agencies, including in response to higher inflation, could have a material adverse effect on the economy and Truist’s profitability; • unexpected outflows of uninsured deposits may require us to sell investment securities at a loss; • a loss of value of our investment portfolio could negatively impact market perceptions of Truist and could lead to deposit withdrawals; • the effects of COVID-19 adversely impacted the Company’s operations and financial performance and similar adverse impacts resulting from pandemics could occur in future periods; • risk management oversight functions may not identify or address risks adequately, and management may not be able to effectively manage credit risk; • there are risks resulting from the extensive use of models in Truist’s business, which may impact decisions made by management and regulators; • deposit attrition, client loss or revenue loss following completed mergers or acquisitions may be greater than anticipated; • Truist could fail to execute on strategic or operational plans, including the ability to successfully complete or integrate mergers and acquisitions; • increased competition, including from (i) new or existing competitors that could have greater financial resources or be subject to different regulatory standards or compliance costs, and (ii) products and services offered by non-bank financial technology companies, may reduce Truist’s client base, cause Truist to lower prices for its products and services in order to maintain market share or otherwise adversely impact Truist’s businesses or results of operations; • failure to maintain or enhance Truist’s competitive position with respect to new products, services, and technology, whether it fails to anticipate client expectations or because its technological developments fail to perform as desired or do not achieve market acceptance or regulatory approval or for other reasons, may cause Truist to lose market share or incur additional expense; • negative public opinion could damage Truist’s reputation and adversely impact business and revenues, including the effects of social media on market perceptions of Truist and banks generally; • regulatory matters, litigation or other legal actions may result in, among other things, costs, fines, penalties, restrictions on Truist’s business activities, reputational harm, negative publicity, or other adverse consequences; • Truist faces substantial legal and operational risks in safeguarding personal information; • evolving legislative, accounting and regulatory standards, including with respect to climate, capital, and liquidity requirements, which may become more stringent in light of recent market events, and results of regulatory examinations may adversely affect Truist’s financial condition and results of operations; • increased scrutiny regarding Truist’s consumer sales practices, training practices, incentive compensation design, and governance could damage its reputation and adversely impact business and revenues; • accounting policies and processes require management to make estimates about matters that are uncertain, including the potential write down to goodwill if there is an elongated period of decline in market value for Truist’s stock and adverse economic conditions are sustained over a period of time; • Truist faces risks related to originating and selling mortgages, including repurchase and indemnity demands from purchasers related to representations and warranties on loans sold, which could result in an increase in the amount of losses for loan repurchases; • there are risks relating to Truist’s role as a loan servicer, including an increase in the scope or costs of the services Truist is required to perform without any corresponding increase in servicing fees or a breach of Truist’s obligations as servicer; • Truist’s success depends on hiring and retaining key teammates, and if these individuals leave or change roles without effective replacements, Truist’s operations could be adversely impacted, which could be exacerbated in the increased work-from-home environment as job markets may be less constrained by physical geography; • Truist’s operations rely on its ability, and the ability of key external parties, to maintain appropriate-staffed workforces, and on the competence, trustworthiness, health and safety of teammates; • Truist faces the risk of fraud or misconduct by internal or external parties, which Truist may not be able to prevent, detect, or mitigate; • security risks, including denial of service attacks, hacking, social engineering attacks targeting Truist’s teammates and clients, malware intrusion, data corruption attempts, system breaches, cyberattacks, which have increased in frequency with geopolitical tensions, identity theft, ransomware attacks, and physical security risks, such as natural disasters, environmental conditions, and intentional acts of destruction, could result in the disclosure of confidential information, adversely affect Truist’s business or reputation or create significant legal or financial exposure; and • widespread outages of operational, communication, or other systems, whether internal or provided by third parties, natural or other disasters (including acts of terrorism and pandemics), and the effects of climate change, including physical risks, such as more frequent and intense weather events, and risks related to the transition to a lower carbon economy, such as regulatory or technological changes or shifts in market dynamics or consumer preferences, could have an adverse effect on Truist’s financial condition and results of operations, lead to material disruption of Truist’s operations or the ability or willingness of clients to access Truist’s products and services. Readers are cautioned not to place undue reliance on these forward-looking statements, which speak only as of the date they are made. Except to the extent required by applicable law or regulation, Truist undertakes no obligation to revise or update any forward-looking statements. Forward-Looking Statements


3 Non-GAAP Information This presentation contains financial information and performance measures determined by methods other than in accordance with accounting principles generally accepted in the United States of America ("GAAP"). Truist’s management uses these “non-GAAP” measures in their analysis of the Corporation's performance and the efficiency of its operations. Management believes these non-GAAP measures provide a greater understanding of ongoing operations, enhance comparability of results with prior periods and demonstrate the effects of significant items in the current period. The Company believes a meaningful analysis of its financial performance requires an understanding of the factors underlying that performance. Truist’s management believes investors may find these non-GAAP financial measures useful. These disclosures should not be viewed as a substitute for financial measures determined in accordance with GAAP, nor are they necessarily comparable to non-GAAP performance measures that may be presented by other companies. Below is a listing of the types of non-GAAP measures used in this presentation: Adjusted Performance Measures - The adjusted performance measures, including adjusted diluted earnings per share, return on average tangible common shareholders’ equity, adjusted efficiency ratio, and adjusted noninterest expense, are non-GAAP in that they exclude merger- related and restructuring charges, other selected items, and amortization of intangible assets, as applicable to tangible measures. Truist’s management uses these measures in their analysis of the Corporation’s performance. Truist’s management believes these measures provide a greater understanding of ongoing operations and enhance comparability of results with prior periods, as well as demonstrate the effects of significant gains and charges. Pre-Provision Net Revenue (PPNR) - Pre-provision net revenue is a non-GAAP measure that adjusts net income determined in accordance with GAAP to exclude the impact of the provision for credit losses and provision for income taxes. Adjusted pre-provision net revenue is a non- GAAP measure that additionally excludes securities gains (losses), merger-related and restructuring charges, amortization of intangible assets, and other selected items. Truist’s management believes these measures provide a greater understanding of ongoing operations and enhances comparability of results with prior periods. Tangible Common Equity and Related Measures - Tangible common equity and related measures are non-GAAP measures that exclude the impact of intangible assets, net of deferred taxes, and their related amortization. These measures are useful for evaluating the performance of a business consistently, whether acquired or developed internally. Truist’s management uses these measures to assess profitability, returns relative to balance sheet risk, and shareholder value. Core NIM - Core net interest margin is a non-GAAP measure that adjusts net interest margin to exclude the impact of purchase accounting. The purchase accounting marks and related amortization for loans, deposits, and long-term debt from mergers and acquisitions are excluded to approximate the yields paid by clients. Truist’s management believes the adjustments to the calculation of net interest margin for certain assets and liabilities acquired provide investors with useful information related to the performance of Truist’s earning assets. Insurance Holdings Adjusted EBITDA - EBITDA is a non-GAAP measurement of operating profitability that is calculated by adding back interest, taxes, depreciation, and amortization to net income. Truist’s management also adds back merger-related and restructuring charges, acquisition retention and changes in estimated earn-out incentives, equity and equity-like compensation items, independence readiness costs related to Truist Insurance Holdings, and other selected items. Truist’s management uses this measure in its analysis of the Corporation’s Insurance Holdings segment. Truist’s management believes this measure provides a greater understanding of ongoing operations and enhances comparability of results with prior periods, as well as demonstrates the effects of significant gains and charges.


4


Financial Results


6 2Q23 performance highlights Key areas of focus – Significant capital momentum and flexibility with completion of TIH minority stake sale, organic capital generation, and managed RWA growth – Sharpening strategic focus on our core business as evidenced by the divestiture of a $5 billion non-core student loan portfolio (“Student”) near the end of 2Q23 at net carrying value – Focused on bending the expense curve Earnings and profitability – $1.2 billion of net income available to common ($0.92 per share) and ROTCE of 19% – EPS down 16% vs. 2Q22 reflecting higher loan loss provision and higher expenses – Partially offset by higher net interest income – EPS down 12% vs. 1Q23 reflecting lower net interest income due to higher funding costs and higher expenses – Partially offset by seasonally higher fees – Total revenue up 5.1% YoY and down 2.9% vs. 1Q23 (in-line with guidance) – Adjusted expenses up 1.9% vs.1Q23 (in-line with guidance) Balance sheet, asset quality, capital, and liquidity – Average loans flat vs. 1Q23 – EOP loans down 1.7% primarily due to Student – Average deposits declined 2.1% vs. 1Q23 – NCOs were 54 bps (42 bps excluding Student) – Strong liquidity and funding profile – LCR of 112% – Total available liquidity of $178 billion – CET1 up 50 bps vs. 1Q23 to 9.6% and TBVPS up 5.1% driven by the TIH minority stake sale and organic capital generation Change vs. 2Q23 1Q23 2Q22 GAAP / Unadjusted Revenue $5,972 (2.9)% 5.1% Expense $3,748 1.5% 4.7% PPNR $2,224 (9.7)% 5.8% Provision for credit losses $538 7.2% NM Net income available to common $1,234 (12.5)% (15.1)% Diluted EPS $0.92 (12.4)% (15.6)% ROCE 8.6% (170) bps (170) bps ROTCE 19.4% (470) bps (330) bps Efficiency ratio 63.3% 280 bps 0 bps TBVPS $20.44 5.1% (0.3)% Adjusted Efficiency ratio 59.6% 280 bps 260 bps PPNR $2,413 (9.3)% (1.3)% Note: All data points are taxable-equivalent, where applicable; see non-GAAP reconciliations in the appendix Current quarter regulatory capital information is preliminary Summary Income Statement Commentary ($ in millions, except per share data)


7 3Q22 4Q22 1Q23 2Q23 T3 (Touch + Technology = Trust) Connected Channel Experiences Deliver on Deposit Acquisition, Retention, and Client Empowerment 3Q22 4Q22 1Q23 2Q23 Continued digital momentum 3Q22 4Q22 1Q23 2Q23 1 Active users reflect clients that have logged in using the mobile app over the prior 90 days 2 Digital transactions include transfers, Zelle, bill payments, mobile deposits, ACH, and wire transfers 3 Client satisfaction: How satisfied are you with your most recent experience using digital banking with Truist? 4.3 Mobile App Users1 Zelle Transactions Digital Transactions2 Increase in Client Satisfaction With Digital3 3Q22 4Q22 1Q23 2Q23 64.9 65.9 17.6 New Account Quality – Digitally-originated Truist One Checking average account balance up 17% vs. 1Q23 with 91% of clients digitally active Personalized Relationship Rates – Enhanced pricing tools effectively attract new balances and retain existing clients Onboarding with Care – Client experience and platform improvements result in new highs in application conversion rates; integrated Digital & Care Center outbound calling enhances account funding and client satisfaction Empowering Clients – Truist Insights (AI-driven platform) now delivers actionable insights for 550K Small Business clients including cash-flow summaries, income and expense analysis, and proactive balance monitoring 67.3 +7% +3% +1% 4.4 4.5 4.6 +6% 19.0 20.4 22.9 +31% 70.8 +9% +2% +13% (in millions) (in millions) (in millions) Small Business Insights


8 Average loans & leases HFI ($ in billions) $297 $309 $321 $326 $326 $173 $180 $188 $194 $195 $123 $130 $133 $132 $131 3.64% Commercial LHFI Consumer, mortgage, & card LHFI Loans HFI yield (%) Loans HFI yield ex. PAA (%) 2Q22 3Q22 4Q22 1Q23 2Q23 – Average loans increased $352 million, or 0.1% from 1Q23 – Average commercial loans increased $1.6 billion, or 0.8%, due primarily to seasonally strong mortgage warehouse balances and ongoing traditional C&I loan growth – Average consumer and card loans declined $1.2 billion primarily due to a decline in auto – Partially offset by growth in the Service Finance and Sheffield portfolios – EOP loans declined 1.7%, or $5.6 billion, primarily due to Student – Excluding Student, EOP loans declined 0.2% 5-Quarter Trend vs. Linked Quarter 4.36% May not foot due to rounding 5.14% 5.72% 5.25% 5.81% 6.07% 5.98% 4.49% 3.91%


9 ($ in billions) $424 $420 $413 $408 $400 $275 $274 $272 $277 $276 $149 $146 $141 $131 $124 0.09% Interest-bearing deposits Noninterest-bearing deposits Total deposit cost (%) 2Q22 3Q22 4Q22 1Q23 2Q23 Average deposits 1 Cumulative beta calculation is based on change in average interest-bearing deposit cost divided by change in average Fed Funds from 4Q21 to 2Q23 May not foot due to rounding – Average deposits declined 2.1%, or $8.6 billion – Noninterest-bearing deposits declined $7.4 billion, or 5.6% – Represented 31% of total deposits – Average interest-bearing checking declined $6.8 billion, or 6.2% – Average time deposits increased $7.2 billion, or 25% – Deposit costs continue to increase due to higher interest rates – Total cost of deposits was 151 bps, up 39 bps from the prior quarter – Total cost of interest-bearing deposits was 219 bps, up 55 bps from the prior quarter – Reflects 44% cumulative beta1 vs. Linked Quarter 5-Quarter Trend 0.31% 0.66% 1.12% 1.51%


10 $3,435 $3,783 $4,031 $3,919 $3,679 $3,231 $3,670 $3,937 $3,843 $3,604 $204 $113 $94 $76 $75 2.89% 3.12% 3.25% 3.17% 2.91% 2.72% 3.02% 3.17% 3.10% 2.85% Core net interest income TE ($ MM) Purchase accounting accretion ($ MM) Reported NIM (%) Core NIM (%) 2Q22 3Q22 4Q22 1Q23 2Q23 – Net interest income declined 6.1% due to higher funding costs – Partially offset by higher rates on earning assets – Reported NIM declined 26 bps driven by: – Acceleration of interest-bearing deposit betas – Decline in noninterest-bearing deposits – Higher cash balances and borrowing levels – Net interest income up 7.1% due to higher short-term interest rates and 10% growth in average loans – Partially offset by lower purchase accounting accretion – Reported NIM increased 2 bps, while core NIM improved 13 bps ($ in millions) Net interest income & net interest margin 1 See non-GAAP reconciliations in the appendix vs. Linked Quarter5-Quarter Trend 1 vs. Like Quarter


11 ($ in millions) $2,248 $2,102 $2,227 $2,234 $2,293 2Q22 3Q22 4Q22 1Q23 2Q23 Noninterest income vs. Linked Quarter5-Quarter Trend – Noninterest income increased 2.6% due to record insurance revenue and higher other income – Partially offset by lower mortgage banking and investment banking and trading revenue vs. Like Quarter – Noninterest income up 2.0% due primarily to 13% growth in insurance revenue (strong 9.1% organic growth and acquisitions) – Partially offset by lower investment banking and trading revenue


12 ($ in millions) – Noninterest expense increased $168 million, or 4.7% – Noninterest expense includes $54 million of merger-related and restructuring charges vs. $238 million of merger costs – Adjusted noninterest expense2 increased $321 million, or 9.9%, due to higher compensation costs related to increases in minimum wage, new hires, and acquisitions, as well as ongoing investments in technology and infrastructure 63.3% 61.8% 60.0% 60.5% 63.3% 57.0% 56.4% 54.2% 56.8% 59.6% Adjusted noninterest expense Merger costs Amortization Other items GAAP efficiency ratio Adjusted efficiency ratio 2Q22 3Q22 4Q22 1Q23 2Q23 1 Includes merger-related and restructuring charges and incremental operating expenses related to the merger 2 Excludes merger-related charges, incremental operating expenses related to the merger, amortization, and other items. See appendix for non-GAAP reconciliation. May not foot due to rounding Noninterest expense $143 $238 $3,238 $170 $3,321 $3,580 ($39) 1 $3,613 vs. Linked Quarter5-Quarter Trend – Noninterest expense increased $57 million, or 1.5% – Adjusted noninterest expense2 increased $67 million, or 1.9%, due to higher variable comp and professional fees – Partially offset by lower operational losses vs. Like Quarter $152 $3,389 $163 $3,492 $63 $136 $3,722 $140 $3,559 $54 $3,691 $131 $4 $3,748


13 $171 $234 $467 $502 $538 2Q22 3Q22 4Q22 1Q23 2Q23 $159 $213 $273 $297 $440 0.27% 0.34% 0.37% 0.54% NCO NCO ratio 2Q22 3Q22 4Q22 1Q23 2Q23 NCOs, excluding Student, increased 5 bps linked quarter reflecting higher commercial losses Asset quality 4.5x 9.0x 8.8x Net Charge-Offs Provision for Credit Losses Nonperforming Loans / LHFI ALLL $4,187 $4,205 $4,377 $4,479 $4,606 1.38% 1.34% 1.34% 1.37% 1.43% ALLL ALLL ratio ALLL / NCO 2Q22 3Q22 4Q22 1Q23 2Q23 ALLL ratio up 6 bps due to updated economic outlook Increase in the loan loss reserve reflects normalization of asset quality NPLs increased 11 bps linked quarter reflecting credit normalization and modest deterioration within commercial 6.5X 5.0X0.36% 0.35% 0.36% 0.36% 0.47% 2Q22 3Q22 4Q22 1Q23 2Q23 3.7X4.1X $467 $502 2.6X 3.4X ex. Student 0.42% ex. Student 0.22% Provision increased slightly vs. 1Q23 due to higher NCOs and an updated economic outlook


14 Multi Tenant 90% Medical 8% Single Tenant 2% 8.9% 8.1% 7.8% 9.7% 11.2% 0.07% 0.02% 0.29% 0.41% 1.01% 0.06% 0.49% Criticized & classified ratio NPL ratio NCO ratio 2Q22 3Q22 4Q22 1Q23 2Q23 8% 24% 25% 43% 2023 2024 2025 2026 and beyond Office Portfolio Primarily Comprised of Class A, Multi Tenant Properties Within Footprint Class A 65% Class B 25% Class C and Other 10% Commercial real estate (CRE) spotlight 5-Quarter Total CRE Trends CRE Office 1.6% Class Type (From Top 10 Markets) (0.09)% (0.02)% Total LHFI at 6/30/23 ($322B) CRE Mix Tenant Type Scheduled Office Maturities CRE Represents 8.9% of Total Loans HFI Including Office at 1.6% NPL% 5.6% LTM NCO ratio 0.88% Loan loss reserves 6.2% WALTV ~60% Weighted average maturity ~3 years % in Truist Southeast/ Mid-Atlantic footprint ~75% 0.14% Office Spotlight All other loans 91.1% CRE 8.9% CRE information on this slide includes the commercial construction portfolio WALTV based on appraisals conducted at origination Hotel 9% Industrial 16% Office 18% Multifamily 30% Retail 16% Other 11%


15 ($ in billions) 1Q23 CET1 Organic capital generation TIH minority stake sale 2Q23 CET1 Organic capital generation & managed RWA growth FDIC assessment 4Q23 CET1 Significant capital momentum and flexibility 1 Organic capital generation is retained earnings net of dividend 2 Current quarter regulatory capital information is preliminary 3 Based on April 2023 valuation 4 AOCI impact based on the current forward curve of interest rates and internal estimates 5 Total AOCI at 6/30/23 of $13.4 billion includes $1.5 billion of AOCI (held constant) related to the pension plan (AOCI burn down ~40% ex. pension) 9.1% 0.2% 0.3% ~0.5% ~(0.1%) 9.6% ~10% Estimate if remaining TIH ownership divested3 ~2.0%+ 1 2 AOCI Burn Down4 6/30/23 12/31/24 12/31/25 12/31/26 $13.4 $10.7 $9.4 $8.6 Truist’s CET1 Increased by 0.5% in 2Q23 and has Continuing Momentum and Flexibility 5 Truist continues to build capital and maintains significant strategic flexibility with its remaining stake in TIH (36%) AOCI should decrease by 36% by the end of 2026 1


16 13.9% 2Q23 Actuals 3Q23 Outlook Revenue (TE) $6.0 Down 4% Adjusted expenses $3.6 Down 0-1% Full Year 2022 Actuals Full Year 2023 Outlook Adjusted revenue (TE) $23.2 Up 1-2% Adjusted expenses $13.1 Up ~7% Net charge-off ratio 27 bps 40-50 bps Tax rate 19% effective; 21% on FTE basis 3Q23 and 2023 outlook Fu ll ye ar 2 02 3 co m pa re d to fu ll ye ar 2 02 2 ($ in billions) 3Q 23 co m pa re d to 2 Q 23 All data points are taxable-equivalent, where applicable Adjusted expenses exclude amortization of intangibles, merger-related and restructuring charges, incremental operating expenses related to the merger, and other selected items Adjusted revenues exclude securities gains / (losses) and other selected items See non-GAAP reconciliations in the appendix


17 Investment thesis Why Truist? Purpose-Driven Culture Exceptional Company Investing in the Future Leading Financial Performance – Inspire and build better lives and communities – Optimize long-term value for all stakeholders through safe, sound, and ethical practices – Attract and retain top talent – Continued strong sustainability progress – Top 10 U.S. commercial bank – Strong retail and commercial banking market shares in high growth footprint (South / Mid- Atlantic) with select national businesses – Comprehensive and diverse business mix with distinct capabilities in insurance, investment banking, digital / point-of-sale lending, and advice / industry expertise – Significant Integrated Relationship Management (IRM) potential – Further modernize technology stack – Obsess over enhanced client and teammate experience to drive client acquisition – Enable convenient commerce and strengthen payments capabilities – Fit-for-purpose approach (build, buy, partner) – Increased usage of Open Banking, APIs, and Truist Ventures – Targeting strong growth and profitability relative to peers (with lower volatility) – Disciplined risk and financial management; focus on diversity – Strong risk adjusted capital position


Appendix


A-1 Consumer Banking & Wealth Income statement ($ MM) 2Q23 vs. 1Q23 vs. 2Q22 Net interest income $2,668 ($80) $375 Allocated provision for credit losses 224 (50) 25 Noninterest income 828 (45) (3) Noninterest expense 2,048 (9) 121 Segment net income 931 (51) 171 Balance Sheet ($ B) Average loans(1) $143 $— $8.6 Average deposits 237 (1.9) (19) Other Key Metrics(2) Mortgages serviced for others ($ B) $223 $8.1 $13 Wealth management AUM ($ B) 191 3.3 11 Branches 2,002 (4) (115) (1) Excludes loans held for sale (2) Amount reported reflects end of period balance Represents performance for Retail and Small Business Banking, Wealth, Mortgage Banking, and Consumer Finance Solutions – Net income of $931 million, down $51 million, or 5.2% vs. 1Q23 – Net interest income of $2.7 billion decreased $80 million, or 2.9%, primarily driven by higher rate paid on deposits and lower average deposit balances – Average loans of $143 billion relatively flat vs. 1Q23, primarily driven by lower auto loans – Partially offset by growth in the Service Finance and Sheffield portfolios – Average deposits of $237 billion declined 0.8%, vs. 1Q23 reflecting continued consumer response to market conditions as well as tax-related seasonality – Provision for credit losses decreased $50 million, or 18%, primarily driven by lower net allowance build in the current quarter and a decrease in auto charge-offs – Noninterest income of $828 million decreased $45 million, or 5.2% vs. 1Q23, primarily driven by lower mortgage banking income, wealth income, and service charges on deposits – Mortgages serviced for others increased 3.8% vs. 1Q23 driven by bulk MSR acquisition completed in the current quarter – Wealth management AUM increased $3.3 billion, or 1.8%, vs. 1Q23 primarily due to increased markets and positive net asset flows – Noninterest expense of $2.0 billion remained relatively flat vs. 1Q23 – Branch count down 5.4% vs. 2Q22 due to continued branch network optimization Metrics Commentary


A-2 Corporate & Commercial Banking – Net income of $880 million, down $120 million, or 12% vs. 1Q23 – Net interest income of $1.7 billion decreased $47 million, or 2.7% vs. 1Q23, as a result of higher funding costs and lower balances for both loans and deposits, partially offset by higher rates on earning assets – Average loans of $184 billion decreased $0.7 billion, or 0.4% vs. 1Q23, as a result of strategic capital deployment and optimization efforts – Average deposits of $130 billion decreased $11 billion, or 7.5% vs. 1Q23, due to tax payments, monetary tightening, higher rate alternatives, and prior quarter declines – Provision for credit losses increased $80 million vs. 1Q23 related to CRE and increased stress in certain C&I portfolios – Noninterest income of $576 million decreased $54 million, or 8.6% vs. 1Q23, primarily related to lower investment banking & trading income – Noninterest expense of $872 million decreased $11 million, or 1.2% v 1Q23 driven by lower variable incentives and reduced operational losses (1) Excludes loans held for sale Represents performance for Commercial Community Banking, Corporate & Investment Banking, CRE, Wholesale Payments, and Insurance Premium Finance Metrics Commentary Income statement ($ MM) 2Q23 vs. 1Q23 vs. 2Q22 Net interest income $1,700 ($47) $341 Allocated provision for credit losses 312 80 339 Noninterest income 576 (54) (112) Noninterest expense 872 (11) 57 Segment net income $880 ($120) ($106) Balance Sheet ($ B) Average loans(1) $184 ($0.7) $19 Average deposits 130 (11) (16)


A-3 Insurance Holdings – Total segment revenue growth of 16% vs. 1Q23 – Driven by strong organic growth, prior year acquisition of BenefitMall, and additional interest income on fiduciary deposits – Acquired revenue of $41 million – Organic revenue growth of 9.1%, up from 4.7% and 7.7% in 1Q23 and 2Q22, respectively – Driven by higher property and casualty renewal premium due to rate and exposure increases and strong performance in both retail and wholesale – New business generation was up 27.6% vs. 2Q22 with client retention up driven by higher renewal premiums – Adjusted EBITDA margin declined 310 bps vs. 2Q22 – Primarily driven by changes in allocated expenses, investments in new hires and teammates, and higher travel & entertainment expense – Completed minority stake sale with Stone Point Capital Market conditions – Property and casualty premium rate increases remained relatively consistent vs prior quarters – Current market factors such as inflation, rising reinsurance rates, and natural catastrophes continue to challenge the industry (1) Prior period noninterest expense includes the segment net interest income which was primarily an allocation (2) EBITDA is a non-GAAP measurement of operating profitability that is calculated by adding back interest, taxes, depreciation, and amortization to net income. Truist’s management also adds back merger- related and restructuring charges, acquisition retention and changes in estimated earn-out incentives, equity and equity-like compensation items, independence readiness costs related to Truist Insurance Holdings, and other selected items. Truist’s management uses this measure in its analysis of the Corporation’s Insurance Holdings segment. Truist’s management believes this measure provides a greater understanding of ongoing operations and enhances comparability of results with prior periods, as well as demonstrates the effects of significant gains and charges. See non-GAAP reconciliations included in the attached Appendix. Represents performance for Truist Insurance Holdings’ Retail and Wholesale Divisions Metrics Commentary Income statement ($ MM) 2Q23 vs. 1Q23 vs. 2Q22 Noninterest income $944 $127 $114 Interest income 19 19 19 Total revenue 963 146 133 Noninterest expense(1) 705 33 101 Interest expense 103 103 103 Segment net income 155 46 (16) Performance ($ MM) YoY organic revenue growth 9.1 % 4.4 % 1.4 % Net acquired revenue $41 ($8) ($39) Performance based commissions 19 (1) (3) Adjusted EBITDA(2) 322 87 18 Adjusted EBITDA margin(2) 33.5 % 4.8 % (3.1) %


A-4 Purchase accounting summary(1) ($ in millions) As of/For the Quarter Ended June 30 March 31 Dec. 31 Sept. 30 June 30 2023 2023 2022 2022 2022 Loans and Leases(2) Beginning balance unamortized fair value mark $ (673) $ (741) $ (826) $ (924) $ (1,119) Accretion 63 64 80 96 189 Purchase accounting adjustments and other activity 31 4 5 2 6 Ending balance $ (579) $ (673) $ (741) $ (826) $ (924) Core deposit and other intangible assets Beginning balance $ 3,535 $ 3,672 $ 3,726 $ 3,535 $ 3,693 Additions - acquisitions — — 111 336 — Amortization(3) (131) (136) (163) (140) (143) Amortization in net occupancy expense (1) (1) (3) (5) (5) Purchase accounting adjustments and other activity — — 1 — (10) Ending balance $ 3,403 $ 3,535 $ 3,672 $ 3,726 $ 3,535 Deposits(4) Beginning balance unamortized fair value mark $ — $ — $ (1) $ (3) $ (5) Amortization — — 1 2 2 Ending balance $ — $ — $ — $ (1) $ (3) Long-Term Debt(4) Beginning balance unamortized fair value mark $ (69) $ (81) $ (94) $ (109) $ (122) Amortization 12 12 13 15 13 Adjustments (2) — — — Ending balance $ (59) $ (69) $ (81) $ (94) $ (109) (1) Includes only selected information and does not represent all purchase accounting adjustments. (2) Purchase accounting marks on loans and leases includes credit, interest and liquidity components, and are generally recognized using the level-yield or straight-line method over the remaining life of the individual loans or recognized in full in the event of prepayment. (3) 4Q22 amortization expense includes $16 million partial write-down of an investment advisory intangible asset from a prior acquisition. (4) Purchase accounting marks on liabilities represents interest rate marks on time deposits and long-term debt and are recognized using the level-yield method over the term of the liability.


A-5 Preferred dividend ($ in millions) 3Q23 4Q23 1Q24 2Q24 Estimated dividends based on projected interest rates and amounts outstanding ($ MM) $106 $77 $106 $77 Estimates assume forward-looking SOFR rates as of 6/30/23. Actual interest rates could vary significantly causing dividend payments to differ from the estimates shown above.


Non-GAAP Reconciliations


A-7 Quarter Ended Dec. 31 Sept. 30 June 30 2022 2022 2022 Net income available to common shareholders - GAAP $ 1,610 $ 1,536 $ 1,454 Merger-related and restructuring charges 87 48 92 Securities (gains) losses — 1 — Loss (gain) on early extinguishment of debt — — (30) Incremental operating expenses related to the merger 43 69 89 Net income available to common shareholders - Adjusted $ 1,740 $ 1,654 $ 1,605 Weighted average shares outstanding - diluted 1,337,338 1,336,659 1,338,864 Diluted EPS - GAAP $ 1.20 $ 1.15 $ 1.09 Diluted EPS - adjusted(1) 1.30 1.24 1.20 Non-GAAP reconciliations Diluted EPS ($ in millions, except per share data, shares in thousands) (1) The adjusted diluted earnings per share is non-GAAP in that it excludes merger-related and restructuring charges and other selected items, net of tax. Truist’s management uses this measure in their analysis of the Corporation’s performance. Truist’s management believes this measure provides a greater understanding of ongoing operations and enhances comparability of results with prior periods, as well as demonstrates the effects of significant gains and charges. 1Q23 and 2Q23 intentionally excluded as Truist is no longer reporting an adjusted diluted EPS metric.


A-8 Non-GAAP reconciliations Efficiency ratio ($ in millions) (1) Revenue is defined as net interest income plus noninterest income. (2) The adjusted efficiency ratio is non-GAAP in that it excludes securities gains (losses), amortization of intangible assets, merger-related and restructuring charges, and other selected items. Truist’s management uses this measure in their analysis of the Corporation’s performance. Truist’s management believes this measure provides a greater understanding of ongoing operations and enhances comparability of results with prior periods, as well as demonstrates the effects of significant gains and charges. Quarter Ended June 30 March 31 Dec. 31 Sept. 30 June 30 2023 2023 2022 2022 2022 Efficiency ratio numerator - noninterest expense - GAAP $ 3,748 $ 3,691 $ 3,722 $ 3,613 $ 3,580 Merger-related and restructuring charges, net (54) (63) (114) (62) (121) Gain (loss) on early extinguishment of debt (4) — — — 39 Incremental operating expense related to the merger — — (56) (90) (117) Amortization of intangibles (131) (136) (163) (140) (143) Efficiency ratio numerator - adjusted $ 3,559 $ 3,492 $ 3,389 $ 3,321 $ 3,238 Efficiency ratio denominator - revenue(1) - GAAP $ 5,918 $ 6,102 $ 6,208 $ 5,847 $ 5,655 Taxable equivalent adjustment 54 51 50 38 28 Securities (gains) losses — — — 1 1 Efficiency ratio denominator - adjusted $ 5,972 $ 6,153 $ 6,258 $ 5,886 $ 5,684 Efficiency ratio - GAAP 63.3 % 60.5 % 60.0 % 61.8 % 63.3 % Efficiency ratio - adjusted(2) 59.6 56.8 54.2 56.4 57.0


A-9 Non-GAAP reconciliations Pre-provision net revenue ($ in millions) (1) Revenue is defined as net interest income plus noninterest income. (2) Pre-provision net revenue is a non-GAAP measure that adjusts net income determined in accordance with GAAP to exclude the impact of the provision for credit losses and provision for income taxes. Adjusted pre-provision net revenue is a non-GAAP measure that additionally excludes securities gains (losses), merger-related and restructuring charges, amortization of intangible assets, and other selected items. Truist’s management believes these measures provide a greater understanding of ongoing operations and enhances comparability of results with prior periods. Quarter Ended June 30 March 31 Dec. 31 Sept. 30 June 30 2023 2023 2022 2022 2022 Net income $ 1,345 $ 1,515 $ 1,682 $ 1,637 $ 1,532 Provision for credit losses 538 502 467 234 171 Provision for income taxes 287 394 337 363 372 Taxable-equivalent adjustment 54 51 50 38 28 Pre-provision net revenue(1)(2) $ 2,224 $ 2,462 $ 2,536 $ 2,272 $ 2,103 PPNR $ 2,224 $ 2,462 $ 2,536 $ 2,272 $ 2,103 Merger-related and restructuring charges, net 54 63 114 62 121 Gain (loss) on early extinguishment of debt 4 — — — (39) Incremental operating expense related to the merger — — 56 90 117 Amortization of intangibles 131 136 163 140 143 Securities (gains) losses — — — 1 1 Pre-provision net revenue - adjusted(1)(2) $ 2,413 $ 2,661 $ 2,869 $ 2,565 $ 2,446


A-10 Non-GAAP reconciliations Calculations of tangible common equity and related measures ($ in millions, except per share data, shares in thousands) (1) Tangible common equity and related measures are non-GAAP measures that exclude the impact of intangible assets, net of deferred taxes, and their related amortization. These measures are useful for evaluating the performance of a business consistently, whether acquired or developed internally. Truist’s management uses these measures to assess profitability, returns relative to balance sheet risk, and shareholder value. These measures are not necessarily comparable to similar measures that may be presented by other companies. As of / Quarter Ended June 30 March 31 Dec. 31 Sept. 30 June 30 2023 2023 2022 2022 2022 Common shareholders’ equity $ 56,853 $ 55,699 $ 53,841 $ 54,115 $ 56,302 Less: Intangible assets, net of deferred taxes 29,628 29,788 29,908 29,752 29,095 Tangible common shareholders’ equity(1) $ 27,225 $ 25,911 $ 23,933 $ 24,363 $ 27,207 Outstanding shares at end of period 1,331,976 1,331,918 1,326,829 1,326,766 1,326,393 Common shareholders’ equity per common share $ 42.68 $ 41.82 $ 40.58 $ 40.79 $ 42.45 Tangible common shareholders’ equity per common share(1) 20.44 19.45 18.04 18.36 20.51 Net income available to common shareholders $ 1,234 $ 1,410 $ 1,610 $ 1,536 $ 1,454 Plus amortization of intangibles, net of tax 100 104 125 107 109 Tangible net income available to common shareholders(1) $ 1,334 $ 1,514 $ 1,735 $ 1,643 $ 1,563 Average common shareholders’ equity $ 57,302 $ 55,380 $ 54,823 $ 56,813 $ 56,803 Less: Average intangible assets, net of deferred taxes 29,775 29,889 29,891 29,035 29,173 Average tangible common shareholders’ equity(1) $ 27,527 $ 25,491 $ 24,932 $ 27,778 $ 27,630 Return on average common shareholders’ equity 8.6 % 10.3 % 11.7 % 10.7 % 10.3 % Return on average tangible common shareholders’ equity(1) 19.4 24.1 27.6 23.5 22.7


A-11 Quarter Ended June 30 March 31 Dec. 31 Sept. 30 June 30 2023 2023 2022 2022 2022 Net interest income - GAAP $ 3,625 $ 3,868 $ 3,981 $ 3,745 $ 3,407 Taxable-equivalent adjustment 54 51 50 38 28 Net interest income - taxable-equivalent 3,679 3,919 4,031 3,783 3,435 Accretion of mark on acquired loans (63) (64) (80) (96) (189) Accretion of mark on acquired liabilities (12) (12) (14) (17) (15) Net interest income - core(1) $ 3,604 $ 3,843 $ 3,937 $ 3,670 $ 3,231 Average earning assets - GAAP $ 506,084 $ 499,149 $ 492,805 $ 482,349 $ 475,818 Average balance - mark on acquired loans 641 702 787 875 1,029 Average earning assets - core(1) $ 506,725 $ 499,851 $ 493,592 $ 483,224 $ 476,847 Annualized net interest margin: Reported - taxable-equivalent 2.91 % 3.17 % 3.25 % 3.12 % 2.89 % Core(1) 2.85 3.10 3.17 3.02 2.72 Non-GAAP reconciliations Core NIM ($ in millions) (1) Core net interest margin is a non-GAAP measure that adjusts net interest margin to exclude the impact of purchase accounting. The purchase accounting marks and related amortization for loans, deposits, and long-term debt from mergers and acquisitions are excluded to approximate the yields paid by clients. Truist’s management believes the adjustments to the calculation of net interest margin for certain assets and liabilities acquired provide investors with useful information related to the performance of Truist’s earning assets. This measure is not necessarily comparable to similar measures that may be presented by other companies.


A-12 Non-GAAP reconciliations Insurance Holdings adjusted EBITDA ($ in millions) (1) EBITDA is a non-GAAP measurement of operating profitability that is calculated by adding back interest, taxes, depreciation, and amortization to net income. Truist’s management also adds back merger- related and restructuring charges, acquisition retention and changes in estimated earn-out incentives, equity and equity-like compensation items, independence readiness costs related to Truist Insurance Holdings, and other selected items. Truist’s management uses this measure in its analysis of the Corporation’s Insurance Holdings segment. Truist’s management believes this measure provides a greater understanding of ongoing operations and enhances comparability of results with prior periods, as well as demonstrates the effects of significant gains and charges. Quarter Ended June 30 March 31 Dec. 31 Sept. 30 June 30 2023 2023 2022 2022 2022 Segment interest income $ 19 $ — $ — $ — $ — Noninterest income 944 817 792 731 830 Total revenue 963 817 792 731 830 Segment net income (loss) - GAAP $ 155 $ 109 $ 107 $ 85 $ 171 Provision (benefit) for income taxes — 36 35 29 55 Interest 103 — — — — Depreciation & amortization 35 37 36 34 31 EBITDA 293 182 178 148 257 Merger-related and restructuring charges, net 3 5 18 21 8 Acquisition retention and change in earn-out incentives 4 13 8 10 10 Equity and equity-like compensation items 19 20 20 26 29 Operating loss — 15 — — — Independence readiness costs related to TIH 3 — 2 — — Adjusted EBITDA(1) $ 322 $ 235 $ 226 $ 205 $ 304 Adjusted EBITDA(1) margin 33.5 % 28.7 % 28.6 % 28.1 % 36.6 %


To inspire and build better lives and communities