tfc-20211015
0000092230FALSE00000922302021-10-152021-10-150000092230us-gaap:CommonStockMember2021-10-152021-10-150000092230tfc:SeriesIPreferredStockMember2021-10-152021-10-150000092230tfc:SeriesJPreferredStockMember2021-10-152021-10-150000092230tfc:SeriesOPreferredStockMember2021-10-152021-10-150000092230tfc:SeriesRPreferredStockMember2021-10-152021-10-15
UNITED STATES
SECURITIES AND EXCHANGE COMMISSION
Washington, D.C. 20549
_____________________________________________
Form 8-K
Current Report
_____________________________________________

Pursuant to Section 13 or 15(d)
of the Securities Exchange Act of 1934

October 15, 2021
Date of Report (Date of earliest event reported)

Truist Financial Corporation
(Exact name of registrant as specified in its charter)
_____________________________________________
North Carolina1-1085356-0939887
(State or other jurisdiction of incorporation)
(Commission File Number)
(I.R.S. Employer Identification No.)
214 North Tryon Street
Charlotte,
North Carolina
28202
(Address of principal executive offices)
(Zip Code)

(336) 733-2000
(Registrant's telephone number, including area code)
_____________________________________________

Check the appropriate box below if the Form 8-K filing is intended to simultaneously satisfy the filing obligation of the registrant under any of the following provisions:
Written communications pursuant to Rule 425 under the Securities Act (17 CFR 230.425)
Soliciting material pursuant to Rule 14a-12 under the Exchange Act (17 CFR 240.14a-12)
Pre-commencement communications pursuant to Rule 14d-2(b) under the Exchange Act (17 CFR 240.14d-2(b))
Pre-commencement communications pursuant to Rule 13e-4(c) under the Exchange Act (17 CFR 240.13e-4(c))

Securities registered pursuant to Section 12(b) of the Act:
Title of each classTrading SymbolName of each exchange on which registered
Common Stock, $5 par valueTFCNew York Stock Exchange
Depositary Shares each representing 1/4,000th interest in a share of Series I Perpetual Preferred StockTFC.PINew York Stock Exchange
5.853% Fixed-to-Floating Rate Normal Preferred Purchase Securities each representing 1/100th interest in a share of Series J Perpetual Preferred StockTFC.PJNew York Stock Exchange
Depositary Shares each representing 1/1,000th interest in a share of Series O Non-Cumulative Perpetual Preferred StockTFC.PONew York Stock Exchange
Depositary Shares each representing 1/1,000th interest in a share of Series R Non-Cumulative Perpetual Preferred StockTFC.PRNew York Stock Exchange

Indicate by check mark whether the registrant is an emerging growth company as defined in Rule 405 of the Securities Act of 1933 (§230.405 of this chapter) or Rule 12b-2 of the Securities Exchange Act of 1934 (§240.12b-2 of this chapter).
Emerging growth company 

If an emerging growth company, indicate by check mark if the registrant has elected not to use the extended transition period for complying with any new or revised financial accounting standards provided pursuant to Section 13(a) of the Exchange Act. ¨


ITEM 2.02    Results of Operations and Financial Condition.

On October 15, 2021, Truist Financial Corporation (“Truist”) issued a press release reporting third quarter 2021 results and posted on its website its third quarter 2021 Earnings Release, Quarterly Performance Summary, and Earnings Release Presentation. The materials contain forward-looking statements regarding Truist and include cautionary language identifying important factors that could cause actual results to differ materially from those anticipated. The Earnings Release, Quarterly Performance Summary and Earnings Release Presentation are furnished as Exhibits 99.1, 99.2, and 99.3, respectively. Consequently, they are not deemed “filed” for purposes of Section 18 of the Securities Exchange Act of 1934 or otherwise subject to the liabilities of that section. Such materials may only be incorporated by reference into another filing under the Exchange Act or Securities Act of 1933 if such subsequent filing specifically references this Form 8-K. All information in the Earnings Release, Quarterly Performance Summary, and Earnings Release Presentation speaks as of the date thereof, and Truist does not assume any obligation to update such information in the future.

ITEM 9.01    Financial Statements and Exhibits.
(d)    Exhibits
Exhibit No.Description of Exhibit
Earnings Release issued October 15, 2021.
Quarterly Performance Summary issued October 15, 2021.
Earnings Release Presentation issued October 15, 2021.
104The cover page from this Current Report on Form 8-K, formatted in Inline XBRL.


SIGNATURE

Pursuant to the requirements of the Securities Exchange Act of 1934, the registrant has duly caused this report to be signed on its behalf by the undersigned hereunto duly authorized.
TRUIST FINANCIAL CORPORATION
(Registrant)
By:/s/ Cynthia B. Powell
Cynthia B. Powell
Executive Vice President and Corporate Controller
(Principal Accounting Officer)

Date: October 15, 2021


logo-boxed1a.jpg
News Release
Contact:
Investors:Ankur Vyas
404.827.6714 | [email protected]
Media:Shelley Miller
704.692.1518 | [email protected]

Truist reports third quarter 2021 results
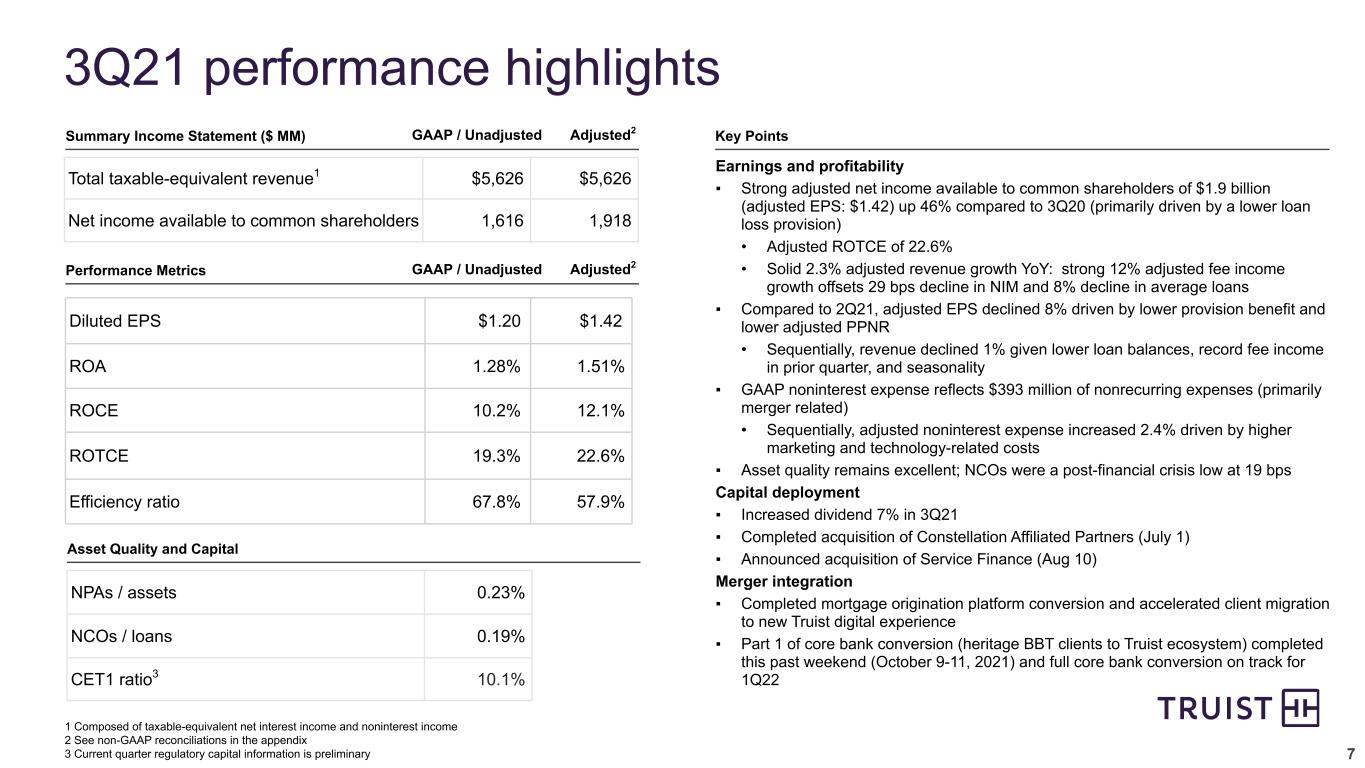
GAAP earnings of $1.6 billion, or $1.20 per diluted share
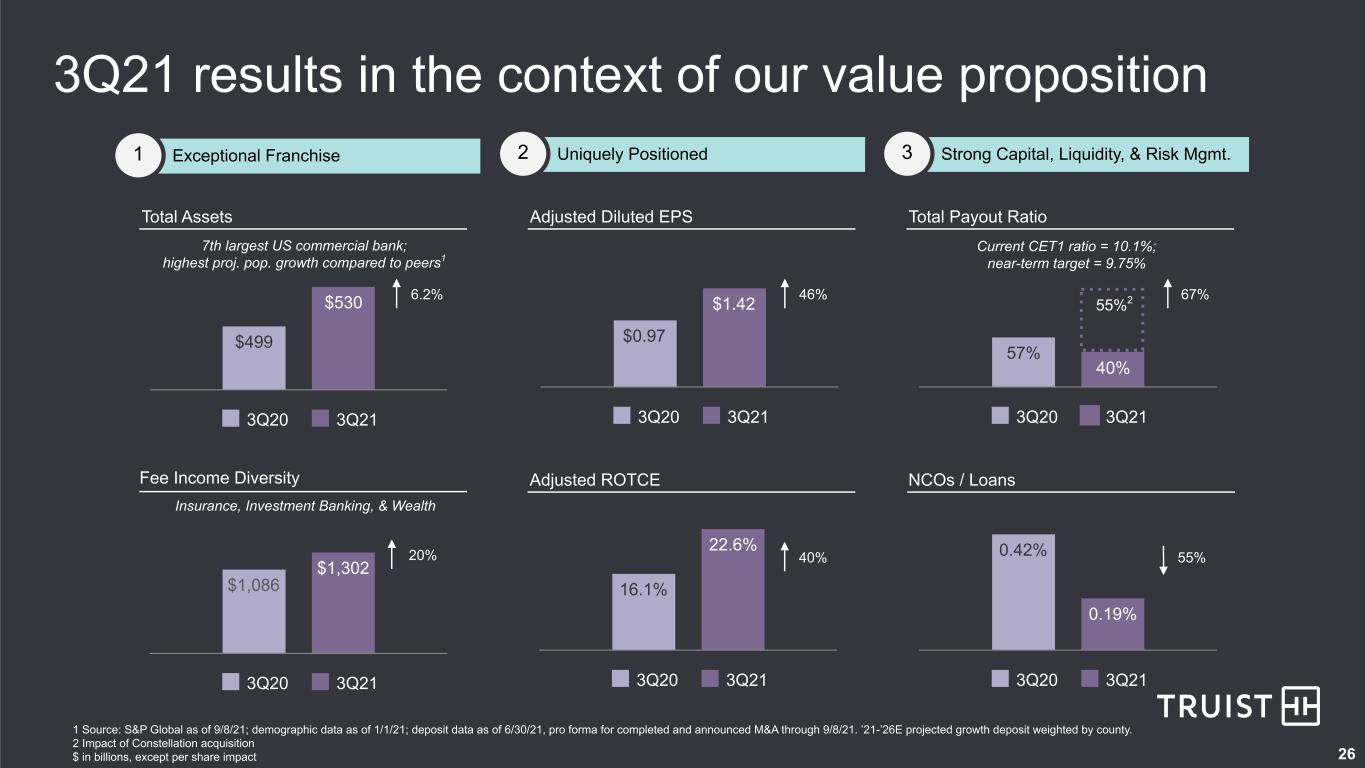
Adjusted earnings of $1.9 billion, or $1.42 per diluted share
Results reflect diverse business mix, strong fee income, and solid core loan and deposit growth
Excellent credit quality and improving economic conditions drive provision benefit
Successful conversion of heritage BB&T clients

CHARLOTTE, N.C., (October 15, 2021) — Truist Financial Corporation (NYSE: TFC) today reported earnings for the third quarter of 2021.

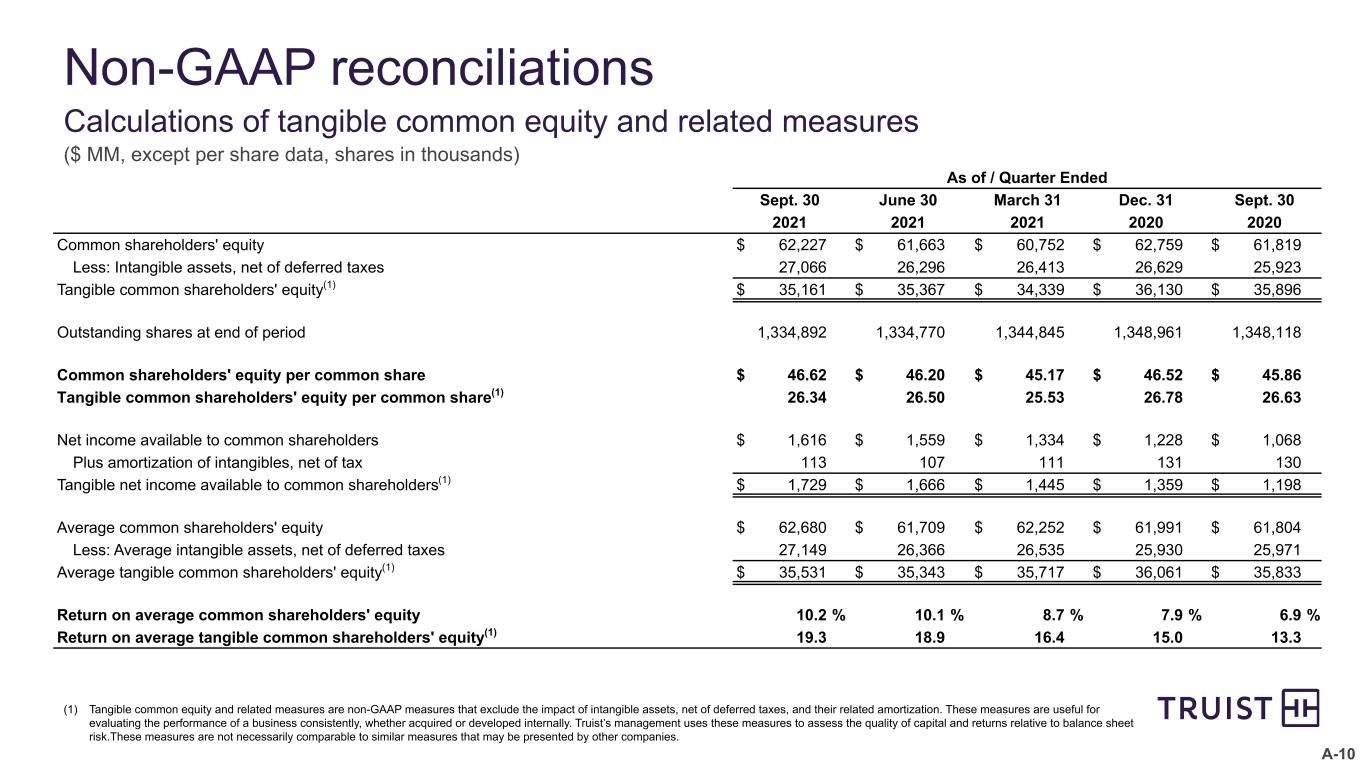
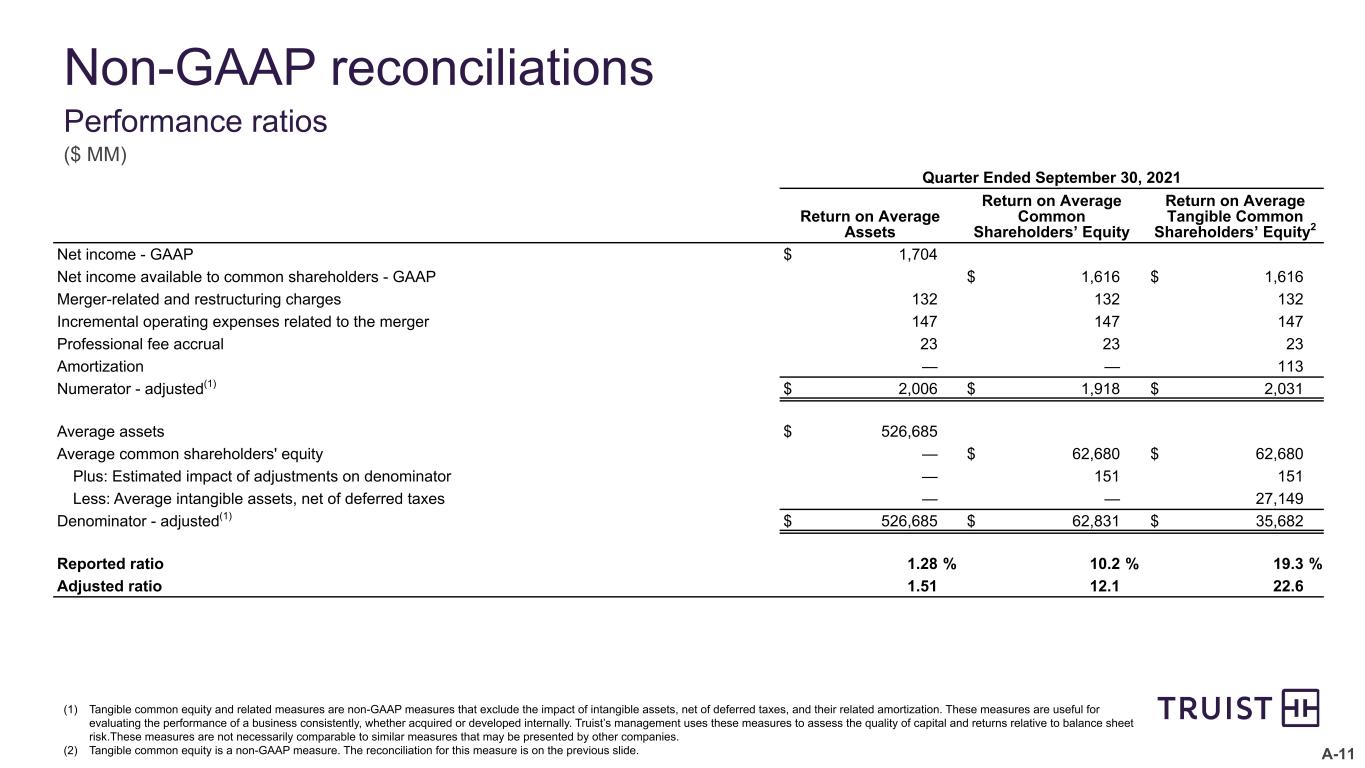
Net income available to common shareholders was $1.6 billion, up 51%, compared to the third quarter last year. Earnings per diluted common share were $1.20, an increase of 52% compared with the same period last year. Results for the third quarter produced an annualized return on average assets (ROA) of 1.28%, an annualized return on average common shareholders' equity (ROCE) of 10.2%, and an annualized return on tangible common shareholders' equity (ROTCE) of 19.3%.

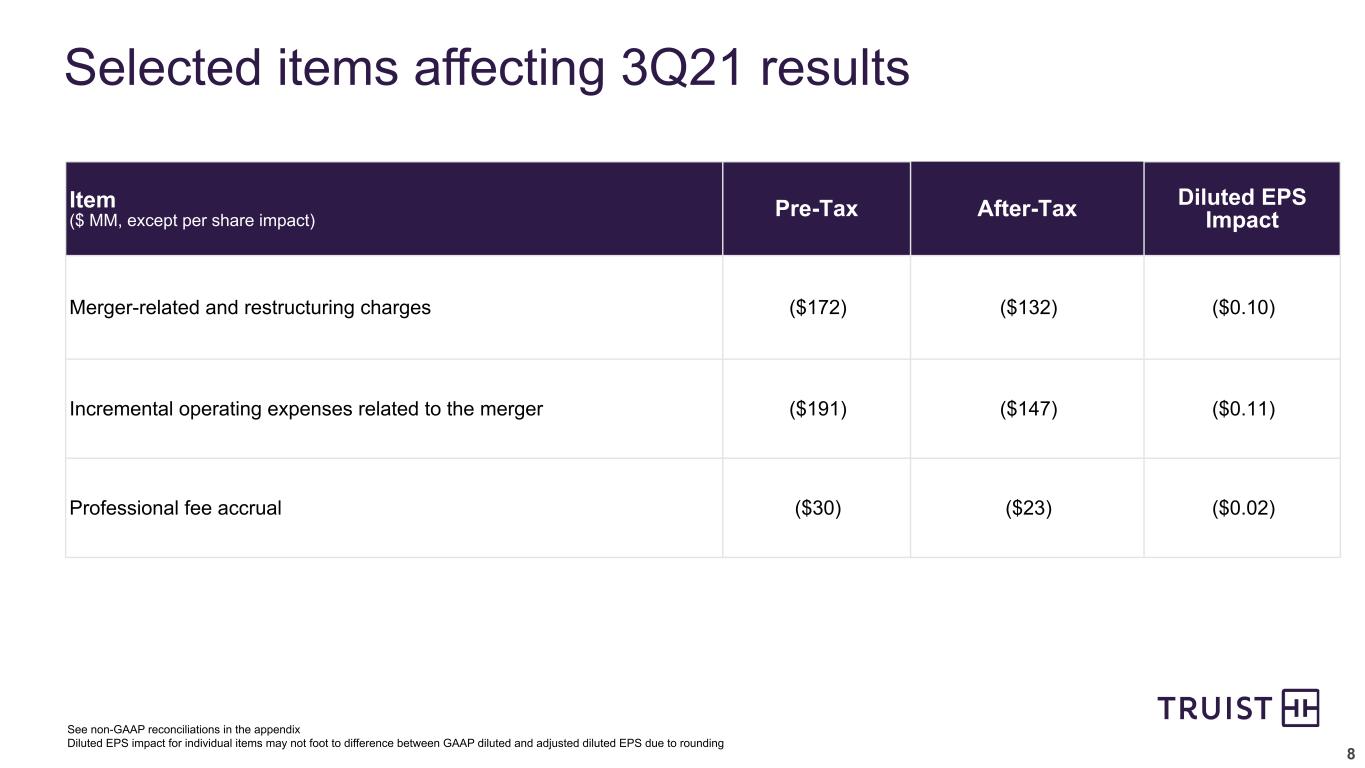
Adjusted net income available to common shareholders was $1.9 billion, or $1.42 per diluted share, excluding merger-related and restructuring charges of $172 million ($132 million after-tax), incremental operating expenses related to the merger of $191 million ($147 million after-tax), and a one-time professional fee expense of $30 million ($23 million after-tax). Adjusted results produced an annualized ROA of 1.51%, an annualized ROCE of 12.1%, and an annualized ROTCE of 22.6%. Adjusted earnings per diluted share were up 46% compared to the prior year.

“Truist produced solid results in the third quarter, driven by strong fee income from our diverse business mix - including wealth, insurance brokerage, investment banking, and positive trends in a number of other businesses given improving economic conditions,” said Chief Executive Officer William H. Rogers Jr. “We also continue to deliver exceptional credit performance with net charge-offs at 19 basis points. The health of our clients remains strong and we delivered average loan growth of 2% annualized compared to the prior quarter, excluding PPP loans.

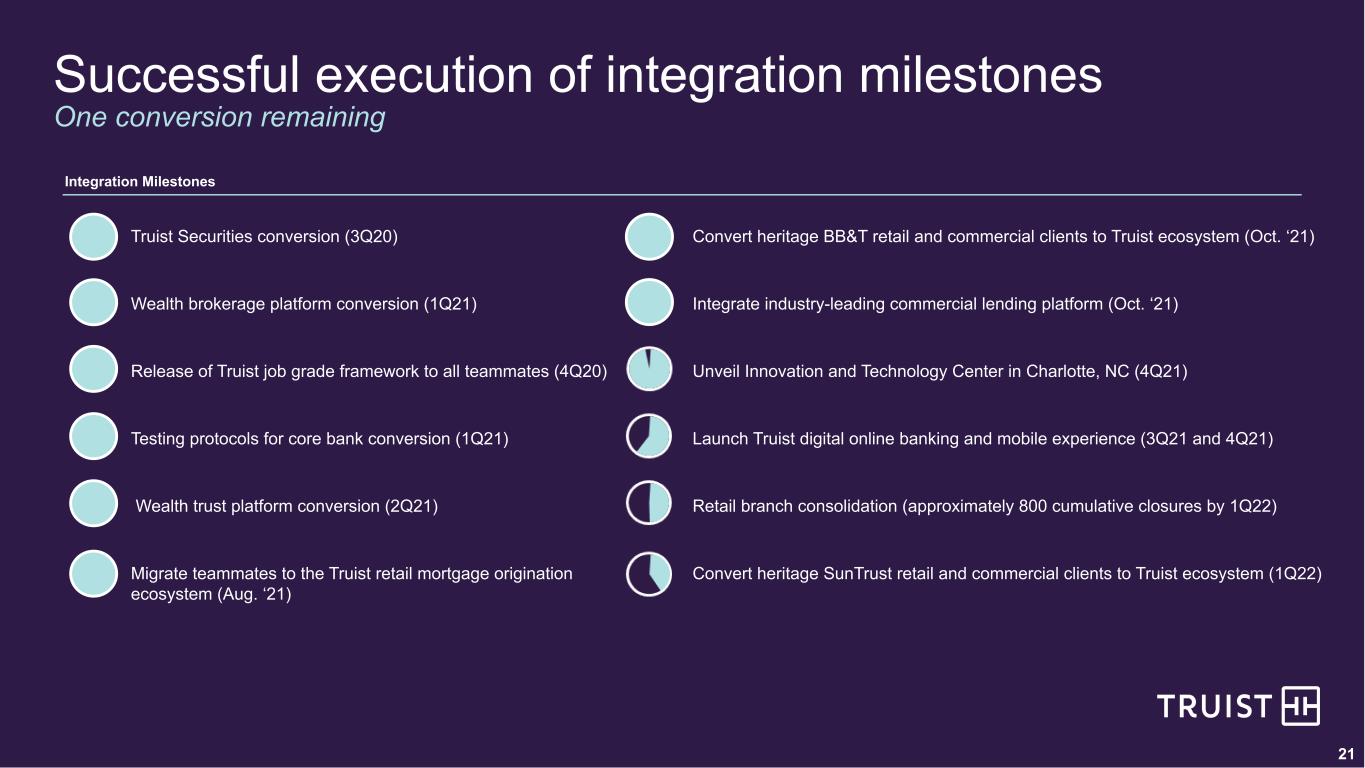
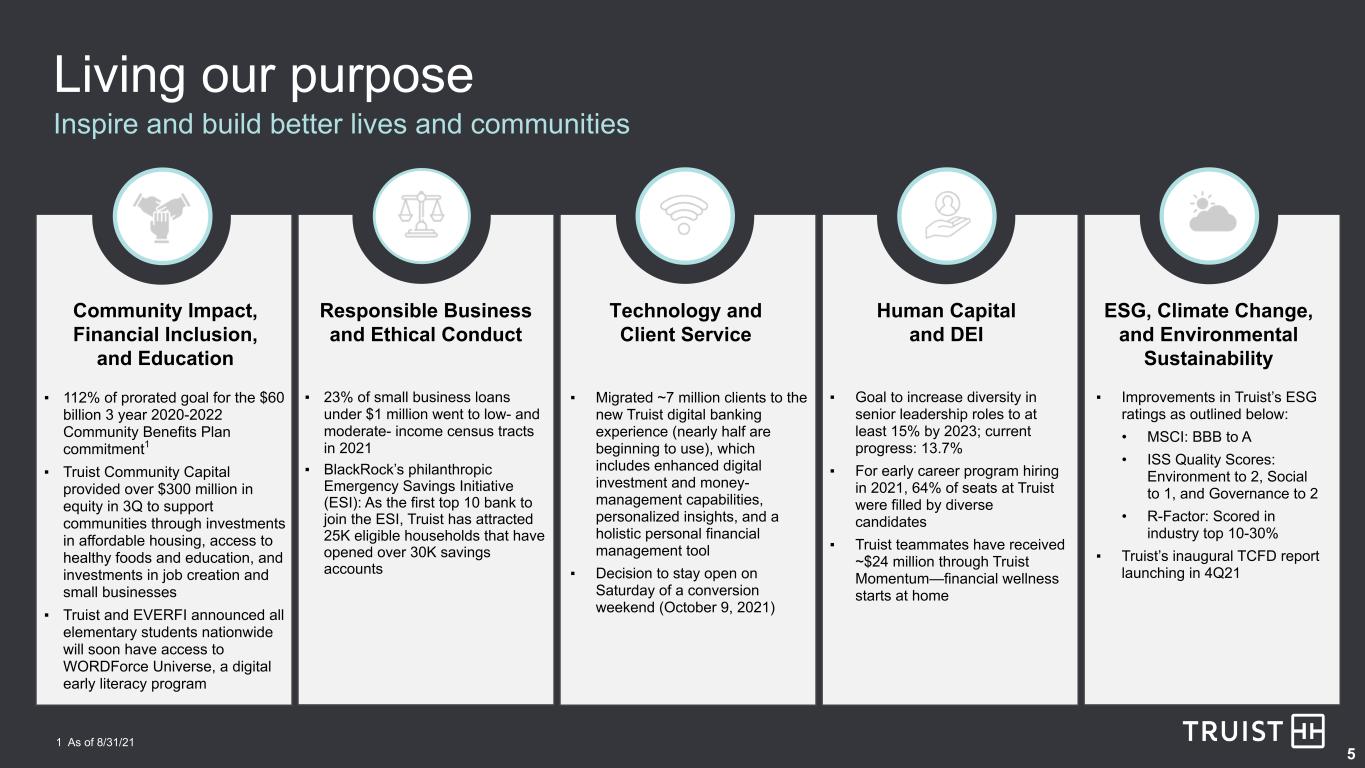
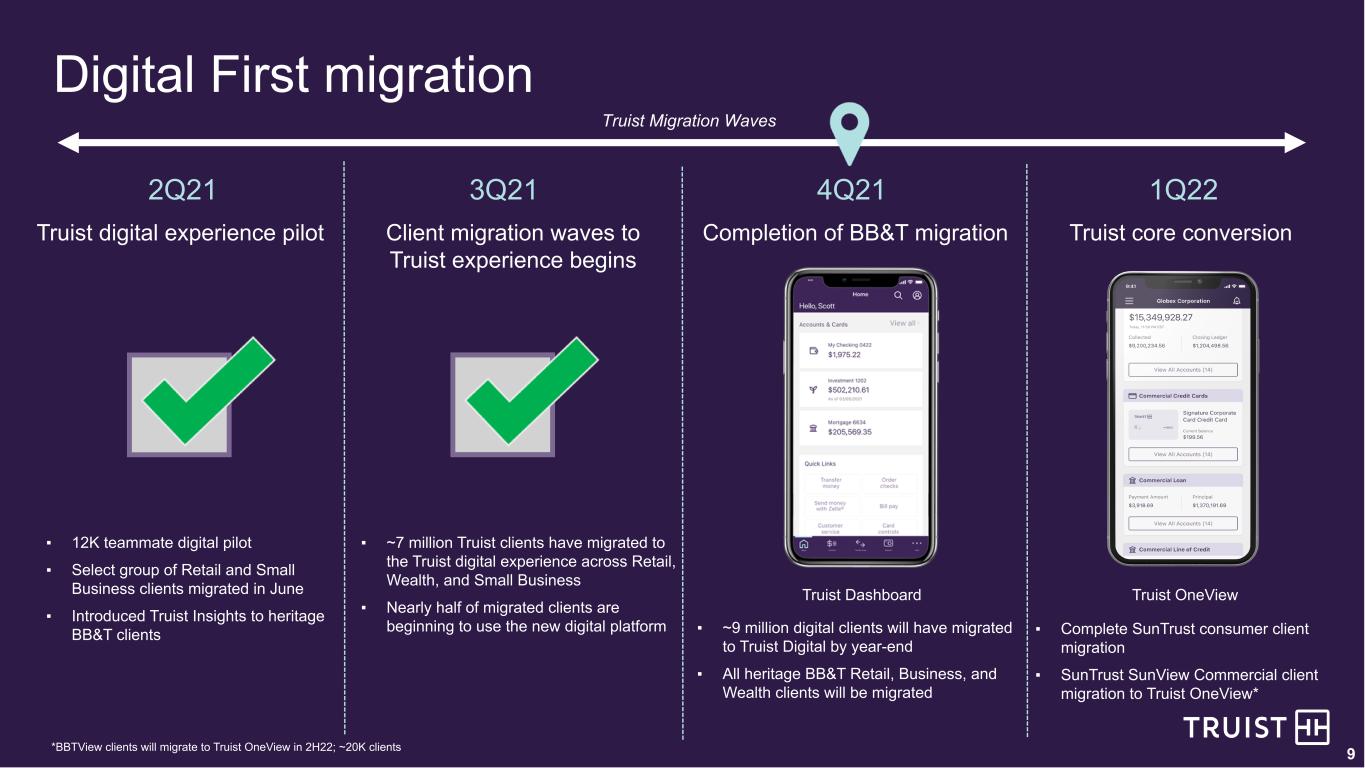
“We continue to make great progress and carefully guide our clients through conversion milestones, including completing our retail mortgage origination conversion and accelerating the roll-out of our Truist digital app. In addition, after months of intense preparation, we migrated approximately 7 million clients to the new Truist technology ecosystem - our most significant milestone to date and the result of the expertise and purposeful commitment from thousands of dedicated teammates. We are excited about these successful milestones in the integration process and are one step closer to the finish line of the merger.

- 1 -


“Truist continued fulfilling our purpose—to inspire and build better lives and communities—in the third quarter through a number of unique and creative initiatives. Purpose drove our decision to remain open this past Saturday to ensure a smooth and successful systems conversion. This quarter, we expanded our partnership with EVERFI bringing literacy tools to elementary schools across the nation. We showed leadership as the first top 10 bank to join Blackrock’s philanthropic Emergency Savings Initiative, and 64% of our early career hiring in 2021 has been filled by diverse candidates. Our teammates and I are very proud of all the ways we live our purpose at Truist.”


Third Quarter 2021 Performance Highlights

Earnings per diluted common share were $1.20
Adjusted diluted earnings per share were $1.42 up $0.45 per share, or 46%, compared to third quarter 2020
ROA was 1.28%; adjusted ROA was 1.51%
ROCE was 10.2%; adjusted ROCE was 12.1%
ROTCE was 19.3%; adjusted ROTCE was 22.6%

Taxable-equivalent revenue was $5.6 billion
Adjusted taxable-equivalent revenue (excluding securities gains) was down 0.9% compared to second quarter 2021 and up 2.3% compared to third quarter 2020
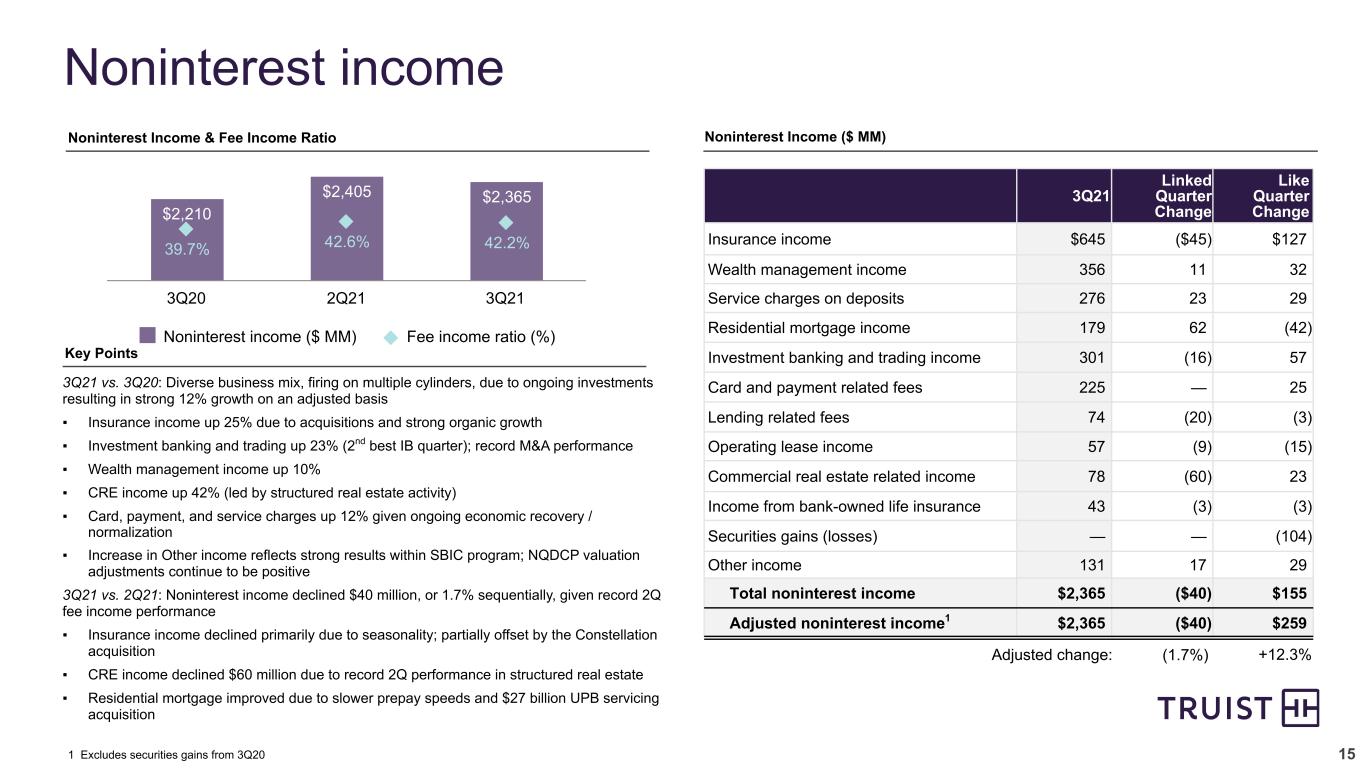
Noninterest income, excluding securities gains, was down 1.7% compared to second quarter 2021 and up 12% compared to third quarter 2020
Strong results from wealth, insurance, investment banking, and residential mortgage banking; traditional fee streams increased from higher economic activity (card, payments, and service charges on deposit accounts)
Fee income ratio was 42.2%, compared to 42.6% for second quarter 2021
Net interest income was down 0.4% compared to second quarter 2021 and 3.8% compared to third quarter 2020
Net interest margin was 2.81%, down seven basis points from second quarter 2021
Core net interest margin was 2.58%, down two basis points from second quarter 2021

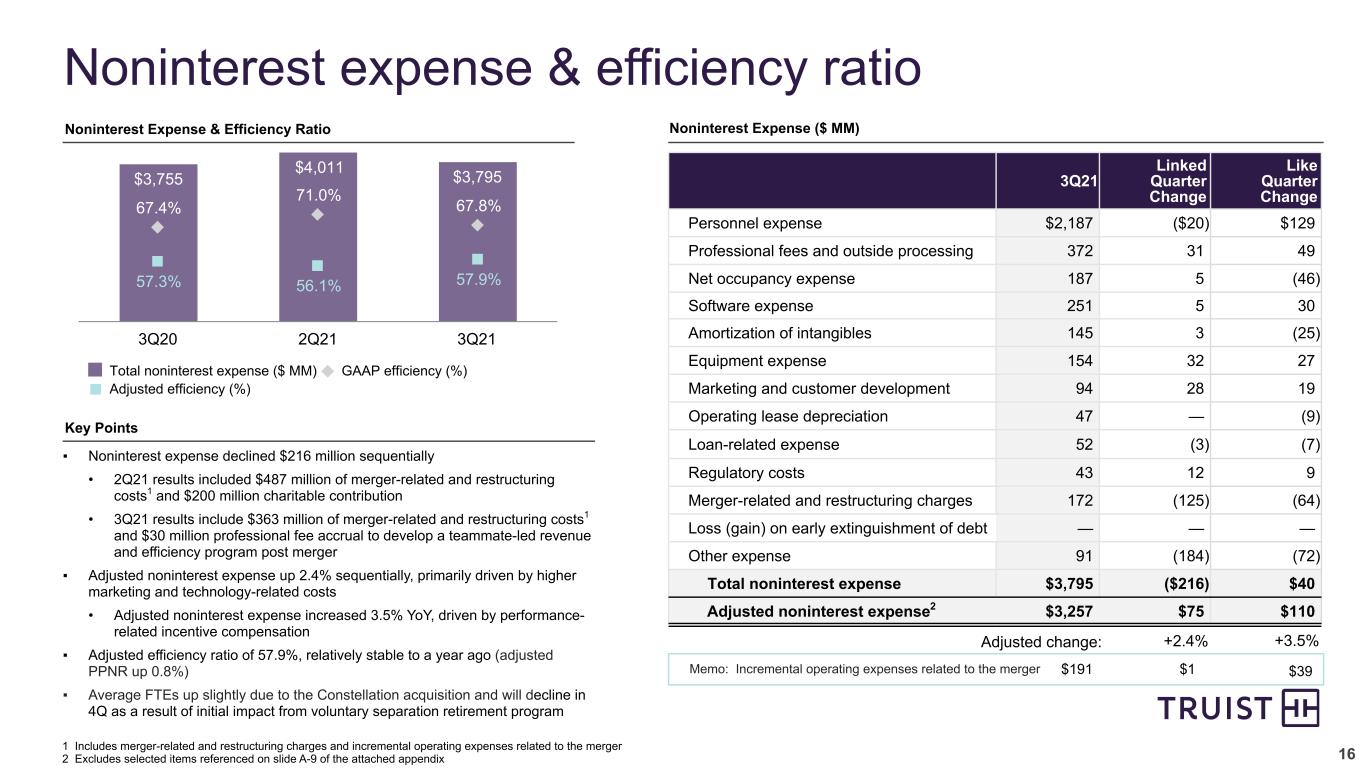
Noninterest expense was $3.8 billion
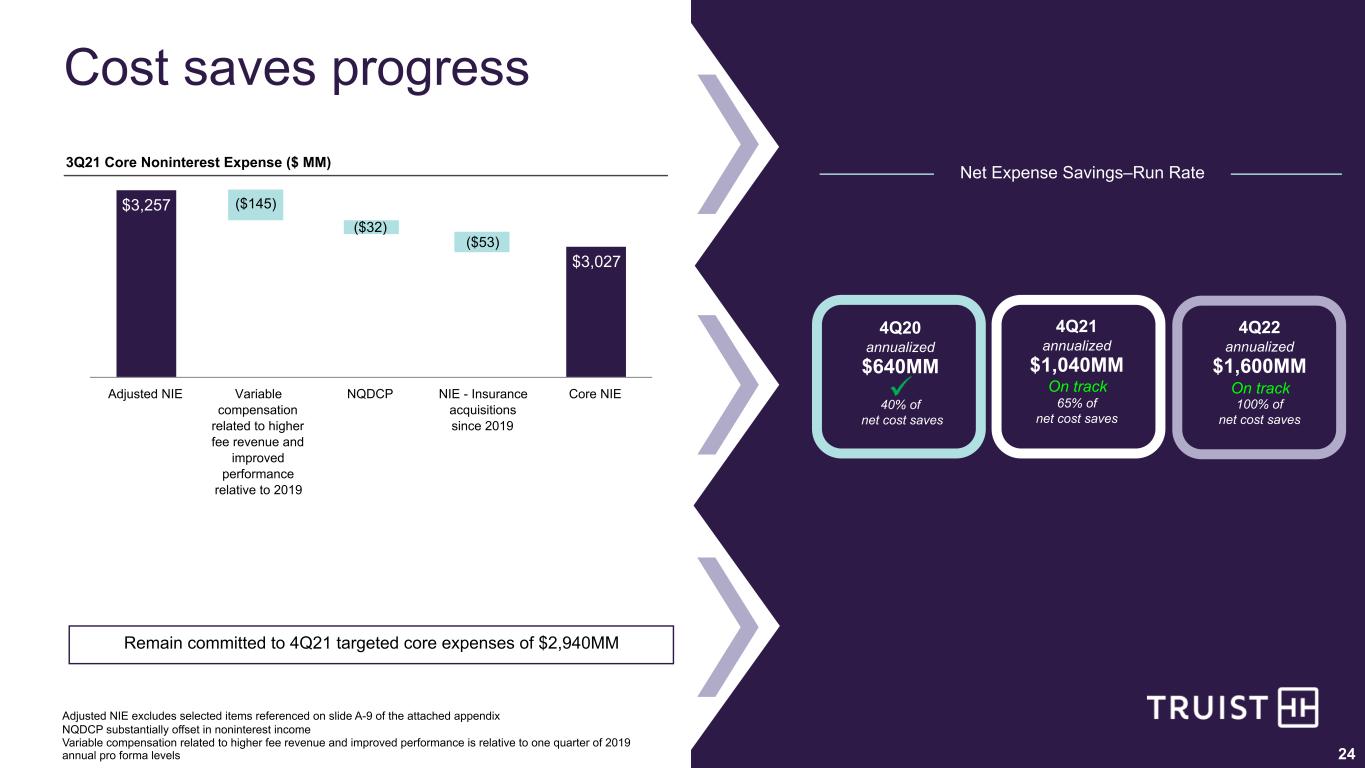
Adjusted noninterest expense was $3.3 billion, up 2.4% compared to second quarter 2021 and 3.5% compared to third quarter 2020
GAAP efficiency ratio was 67.8%, compared to 71.0% for second quarter 2021
Adjusted efficiency ratio was 57.9%, compared to 56.1% for second quarter 2021

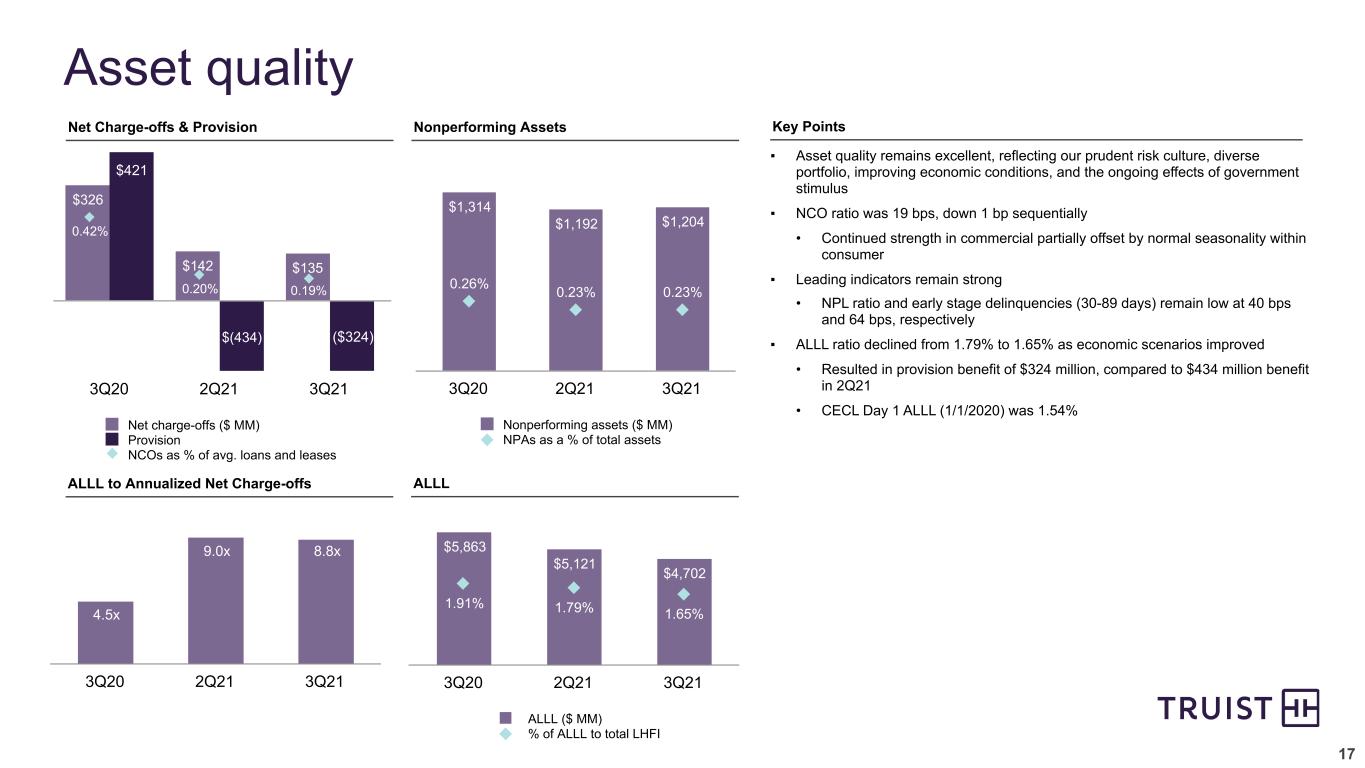
Asset quality remains excellent, reflecting our prudent risk culture, diverse portfolio, improving economic conditions, and the ongoing effects of government stimulus
Nonperforming assets were 0.23% of total assets, relatively stable from second quarter 2021
Net charge-offs were 0.19% of average loans and leases, down one basis point compared to second quarter 2021
The ALLL ratio was 1.65% compared to 1.79% for second quarter 2021
Provision for credit losses was a benefit of $324 million for third quarter 2021, primarily reflecting an improving economic outlook
The ALLL coverage ratio was 4.35X nonperforming loans and leases held for investment, versus 4.83X in second quarter 2021

- 2 -


Capital and liquidity levels remained strong; deployed capital through increased dividend and acquisitions
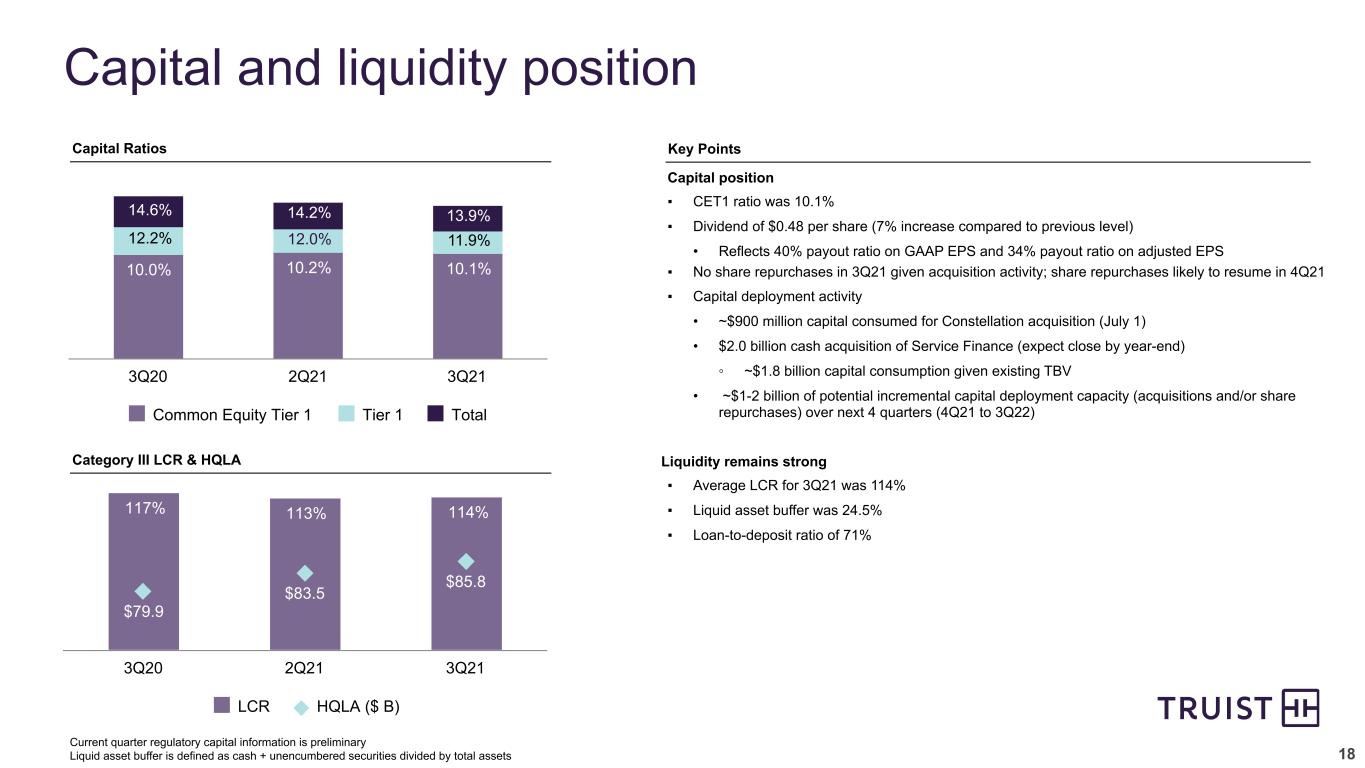
Common equity tier 1 to risk-weighted assets was 10.1%
Consolidated average LCR ratio was 114%
Increased common dividend 7% in third quarter 2021
Completed acquisition of Constellation Affiliated Partners
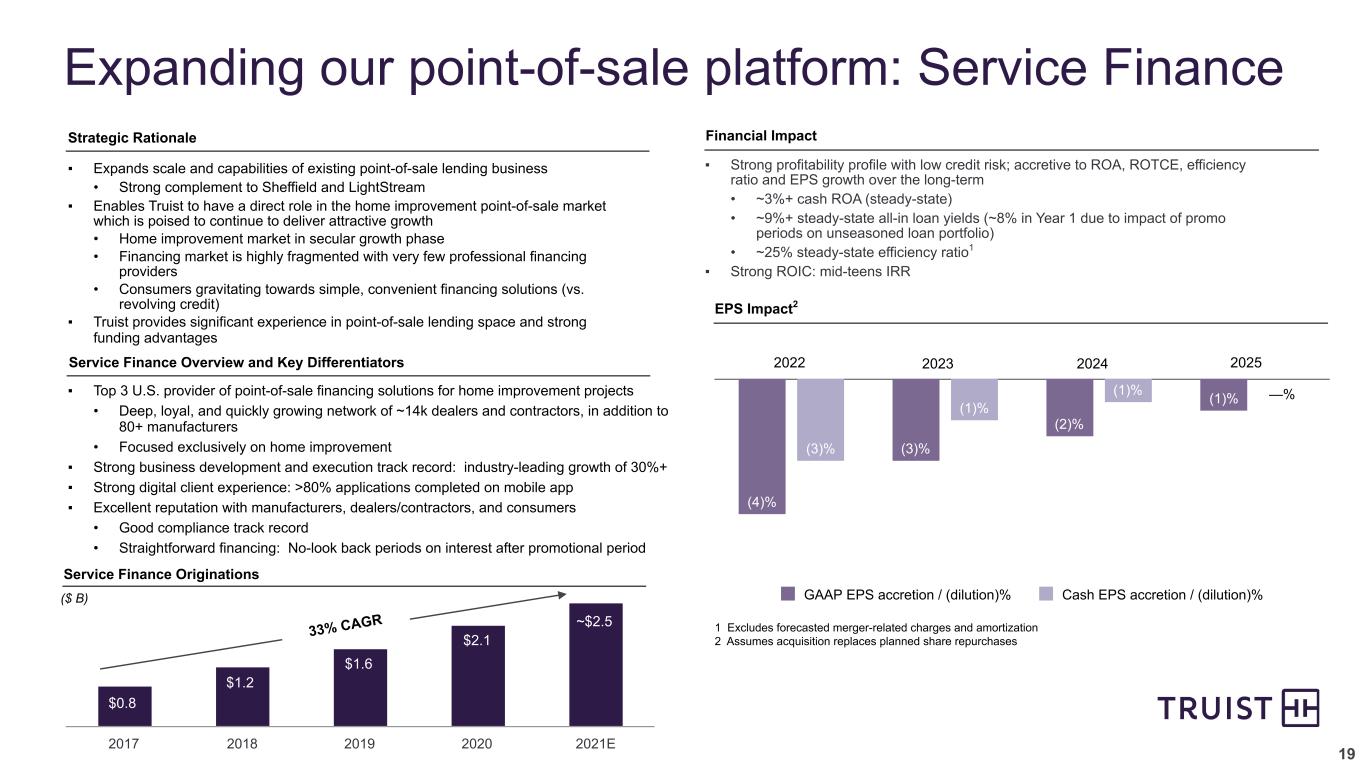
Announced acquisition of Service Finance, LLC to expand point-of-sale lending capabilities

EARNINGS HIGHLIGHTSChange 3Q21 vs.
(dollars in millions, except per share data)3Q212Q213Q202Q213Q20
Net income available to common shareholders$1,616 $1,559 $1,068 $57 $548 
Diluted earnings per common share1.20 1.16 0.79 0.04 0.41 
Net interest income - taxable equivalent$3,261 $3,273 $3,391 $(12)$(130)
Noninterest income2,365 2,405 2,210 (40)155 
Total taxable-equivalent revenue$5,626 $5,678 $5,601 $(52)$25 
Less taxable-equivalent adjustment28 28 29 
Total revenue$5,598 $5,650 $5,572 
Return on average assets1.28 %1.28 %0.91 %— %0.37 %
Return on average risk-weighted assets (current quarter is preliminary)1.77 1.76 1.19 0.01 0.58 
Return on average common shareholders' equity10.2 10.1 6.9 0.1 3.3 
Return on average tangible common shareholders' equity (1)
19.3 18.9 13.3 0.4 6.0 
Net interest margin - taxable equivalent2.81 2.88 3.10 (0.07)(0.29)
(1)Excludes certain items as detailed in the non-GAAP reconciliations in the Quarterly Performance Summary.

Third Quarter 2021 compared to Second Quarter 2021

Total taxable-equivalent revenue was $5.6 billion for the third quarter of 2021, a decrease of $52 million, or 0.9%, compared to the prior quarter.

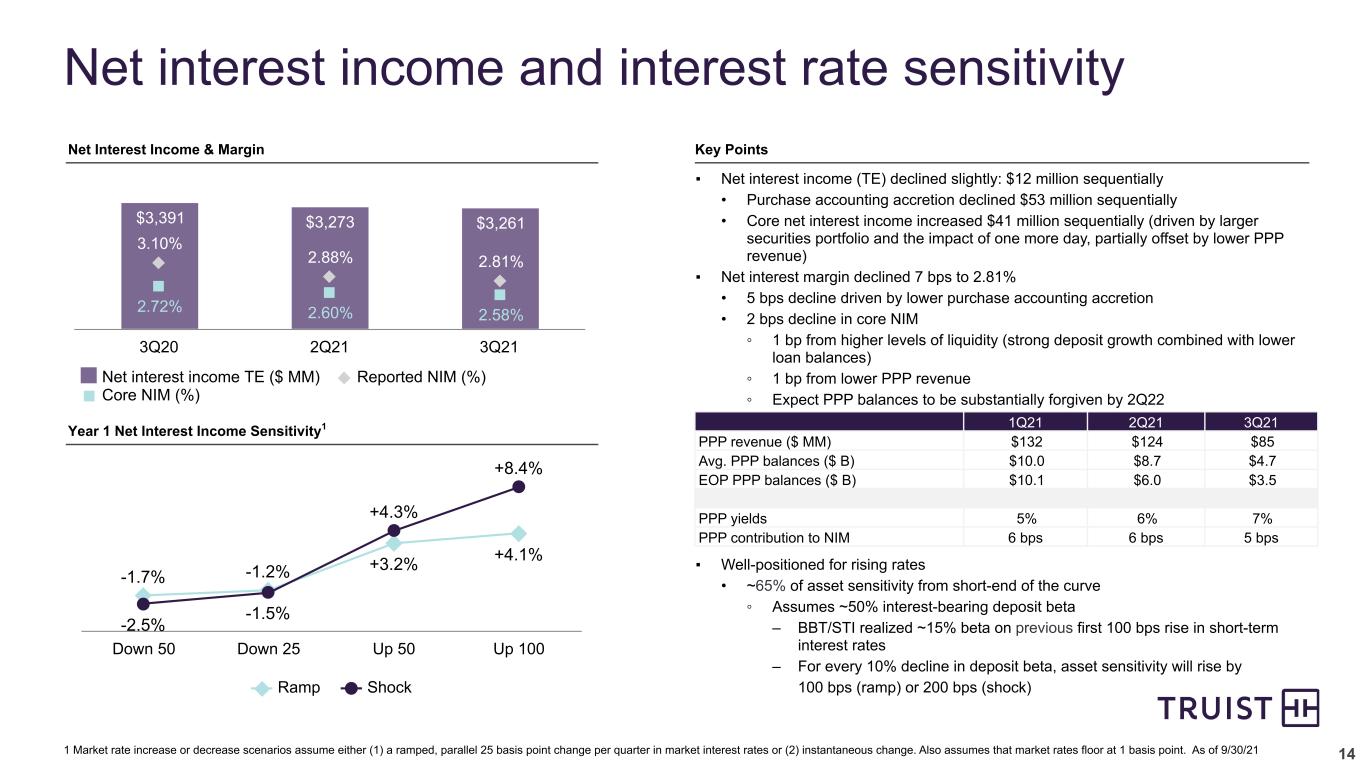
Net interest income for the third quarter of 2021 was down $12 million, or 0.4%, compared to the prior quarter due primarily to lower purchase accounting accretion and lower fees from Paycheck Protection Program (PPP) loans, partially offset by growth in the securities portfolio. Average earning assets increased $6.5 billion, or 1.4%, compared to the prior quarter. Average securities available for sale increased $10.6 billion, or 7.8%, while average total loans decreased $2.6 billion, or 0.9%, and average other earning assets (primarily cash at the Federal Reserve) decreased $2.3 billion, or 10.5%. The growth in average earning assets is a result of an increase in investment securities driven by strong deposit growth. Average deposits increased $6.5 billion, or 1.6%, primarily due to the ongoing impacts of fiscal and monetary stimulus.

The net interest margin was 2.81% for the third quarter, down seven basis points compared to the prior quarter. The decline in the net interest margin was primarily due to lower purchase accounting accretion. The yield on the total loan portfolio for the third quarter was 3.90%, down 11 basis points compared to the prior quarter primarily due to lower purchase accounting accretion and loan mix changes. The yield on the average securities portfolio for the third quarter was 1.50%, up three basis points compared to the prior quarter. Core net interest margin was 2.58% for the third quarter, down two basis points compared to the prior quarter driven by higher levels of liquidity and lower PPP revenue.

The average cost of total deposits was 0.03%, down one basis point compared to the prior quarter. The average rate on long-term debt was 1.61%, up one basis point compared to the prior quarter.
- 3 -


The provision for credit losses was a benefit of $324 million and net charge-offs were $135 million for the third quarter, compared to a benefit of $434 million and $142 million, respectively, for the prior quarter. The net charge-off rate for the current quarter of 0.19% was down one basis point compared to second quarter 2021.

Noninterest income was $2.4 billion, a decrease of $40 million, or 1.7%, compared to the prior quarter. Commercial real-estate related income decreased $60 million primarily due to client-related structured real estate transactions in the prior quarter. Insurance income decreased $45 million primarily due to seasonality, partially offset by $41 million of revenue from the Constellation Affiliated Partners acquisition. Residential mortgage income increased $62 million primarily due to higher servicing income (due to lower prepayment rates and a bulk purchase of servicing assets).

Noninterest expense was $3.8 billion for the third quarter, down $216 million, or 5.4%, compared to the prior quarter. Merger-related and restructuring charges decreased $125 million primarily due to costs in connection with a voluntary separation and retirement program in the prior quarter. Incremental operating expenses related to the merger were relatively flat compared to second quarter 2021. The current quarter also includes a $30 million professional fee to develop an ongoing program to identify, prioritize, and roadmap teammate generated revenue growth and expense savings opportunities beyond the merger. The prior quarter included $200 million of expense associated with charitable contributions to the Truist Foundation and the Truist Charitable Fund. Excluding the aforementioned items and changes in amortization of intangibles, adjusted noninterest expense was up $75 million, or 2.4%, compared to the prior quarter. Equipment expense increased $32 million primarily due to a higher volume of laptop purchases, partially as a result of delays due to supply chain issues. Marketing and customer development expense increased $28 million due to planned advertising campaigns to expand Truist brand awareness. Personnel expense decreased $20 million compared to second quarter 2021 due to lower incentive expenses, partially offset by higher medical insurance claims and personnel costs related to the Constellation Affiliated Partners acquisition.

The provision for income taxes was $423 million for the third quarter of 2021, compared to $415 million for the prior quarter. The effective tax rate for the third quarter of 2021 was 19.9%, compared to 20.0% for the prior quarter.

Third Quarter 2021 compared to Third Quarter 2020

Total taxable-equivalent revenues were $5.6 billion for the third quarter of 2021, an increase of $25 million, or 0.4%, compared to the earlier quarter. Excluding securities gains of $104 million from the third quarter of 2020, adjusted taxable equivalent revenues increased $129 million, or 2.3%, compared to the earlier quarter.

Net interest income for the third quarter of 2021 was down $130 million, or 3.8%, compared to the earlier quarter due to lower purchase accounting accretion, lower rates on earning assets, and a decrease in loans. These decreases were partially offset by growth in the securities portfolio, lower funding costs, higher fees on Payroll Protection Program loans, and fewer interest deferrals on COVID-19 loan accommodations. Average earning assets increased $26.4 billion, or 6.1%, compared to the earlier quarter. The increase in average earning assets reflects a $66.4 billion, or 83%, increase in average securities, while average total loans and leases decreased $25.4 billion, or 8.0%, and average other earning assets decreased $16.5 billion, or 46%. The growth in average earning assets is a result of an increase in investment securities driven by strong deposit growth resulting from fiscal and monetary stimulus. Average deposits increased $30.5 billion, or 8.2%, compared to the earlier quarter, while average long-term debt and short-term borrowings decreased $3.6 billion, or 8.8%, and $849 million, or 14%, respectively.

- 4 -


Net interest margin was 2.81%, down 29 basis points compared to the earlier quarter. The yield on the total loan portfolio for the third quarter of 2021 was 3.90%, down 14 basis points compared to the earlier quarter, reflecting the impact of lower purchase accounting accretion and a lower rate environment. The yield on the average securities portfolio was 1.50%, down 47 basis points compared to the earlier quarter primarily due to lower yields on new purchases.

The average cost of total deposits was 0.03%, down seven basis points compared to the earlier quarter. The average rate on short-term borrowings was 0.68%, down 17 basis points compared to the earlier quarter. The average rate on long-term debt was 1.61%, up 13 basis points compared to the earlier quarter. The lower rates on deposits and short-term borrowings reflect the lower rate environment. The higher rates on long-term debt was due to the runoff of lower rate FHLB advances.

The provision for credit losses was a benefit of $324 million, compared to a cost of $421 million for the earlier quarter. The earlier quarter reflected significant uncertainty related to the economic impacts resulting from the pandemic, whereas the current quarter includes a reserve release due to the improving economic outlook. Net charge-offs for the third quarter of 2021 totaled $135 million compared to $326 million in the earlier quarter. The third quarter of 2020 included $97 million of charge-offs related to the implementation of CECL, which required a gross up of loan carrying values in connection with the establishment of an allowance on PCD loans. The net charge-off ratio for the current quarter of 0.19% was down 23 basis points compared to the third quarter 2020, due primarily to the additional losses on PCD loans taken in the earlier quarter and lower actual net losses in the commercial portfolio.

Noninterest income for the third quarter of 2021 increased $155 million, or 7.0%, compared to the earlier quarter. Noninterest income for the third quarter of 2020 included $104 million of securities gains on available-for-sale securities. Excluding securities gains, noninterest income increased $259 million, or 12%, compared to the earlier quarter. Insurance income increased $127 million due to acquisitions, as well as organic growth. Investment banking and trading income increased $57 million due to strong merger and acquisition activity and loan syndications. Wealth management income increased $32 million due to higher valuations of assets under management. Service charges on deposit accounts and card and payment related fees increased $29 million and $25 million, respectively, due to increased economic activity. Residential mortgage banking income decreased $42 million primarily due to lower production related revenues as a result of lower gain on sale margins and volumes, partially offset by higher servicing income due to increases in the valuation of mortgage servicing rights and lower prepayment rates. Other income increased $29 million primarily due to investment income (primarily valuation gains) from the Company’s SBIC investments.

Noninterest expense for the third quarter of 2021 was up $40 million, or 1.1%, compared to the earlier quarter. Merger-related and restructuring charges decreased $64 million primarily due to facilities impairments in the earlier quarter, while incremental operating expenses related to the merger increased $39 million, primarily reflected in professional fees and outside processing. The current quarter also includes the previously mentioned $30 million professional fee expense. The earlier quarter included $50 million for charitable contributions to the Truist Charitable Fund (other expense). Excluding the aforementioned items and changes in amortization of intangibles, adjusted noninterest expense was up $110 million, or 3.5%, compared to the earlier quarter. Personnel expense increased $129 million primarily due to higher incentive expenses due to variable compensation from higher revenues and improved overall performance relative to targets, higher medical insurance claims, and personnel cost related to acquired companies, partially offset by lower equity based compensation. Additionally, net occupancy expense decreased $46 million primarily due to branch and property consolidations. Other expense also includes a decrease of $42 million for non-service-related pension cost components.

- 5 -


The provision for income taxes was $423 million for the third quarter of 2021, compared to $255 million for the earlier quarter. This produced an effective tax rate for the third quarter of 2021 of 19.9%, compared to 18.3% for the earlier quarter. The higher effective tax rate is primarily due to higher pre-tax income in the current quarter.

LOANS AND LEASES
(dollars in millions)
Average balances3Q212Q21Change% Change
Commercial:
Commercial and industrial$130,025 $133,646 $(3,621)(2.7)%
CRE24,849 25,645 (796)(3.1)
Commercial construction5,969 6,359 (390)(6.1)
Lease financing4,917 4,893 24 0.5 
Total commercial165,760 170,543 (4,783)(2.8)
Consumer:
Residential mortgage45,369 43,605 1,764 4.0 
Residential home equity and direct25,242 25,238 — 
Indirect auto26,830 26,444 386 1.5 
Indirect other11,112 10,797 315 2.9 
Student7,214 7,396 (182)(2.5)
Total consumer115,767 113,480 2,287 2.0 
Credit card4,632 4,552 80 1.8 
Total loans and leases held for investment$286,159 $288,575 $(2,416)(0.8)

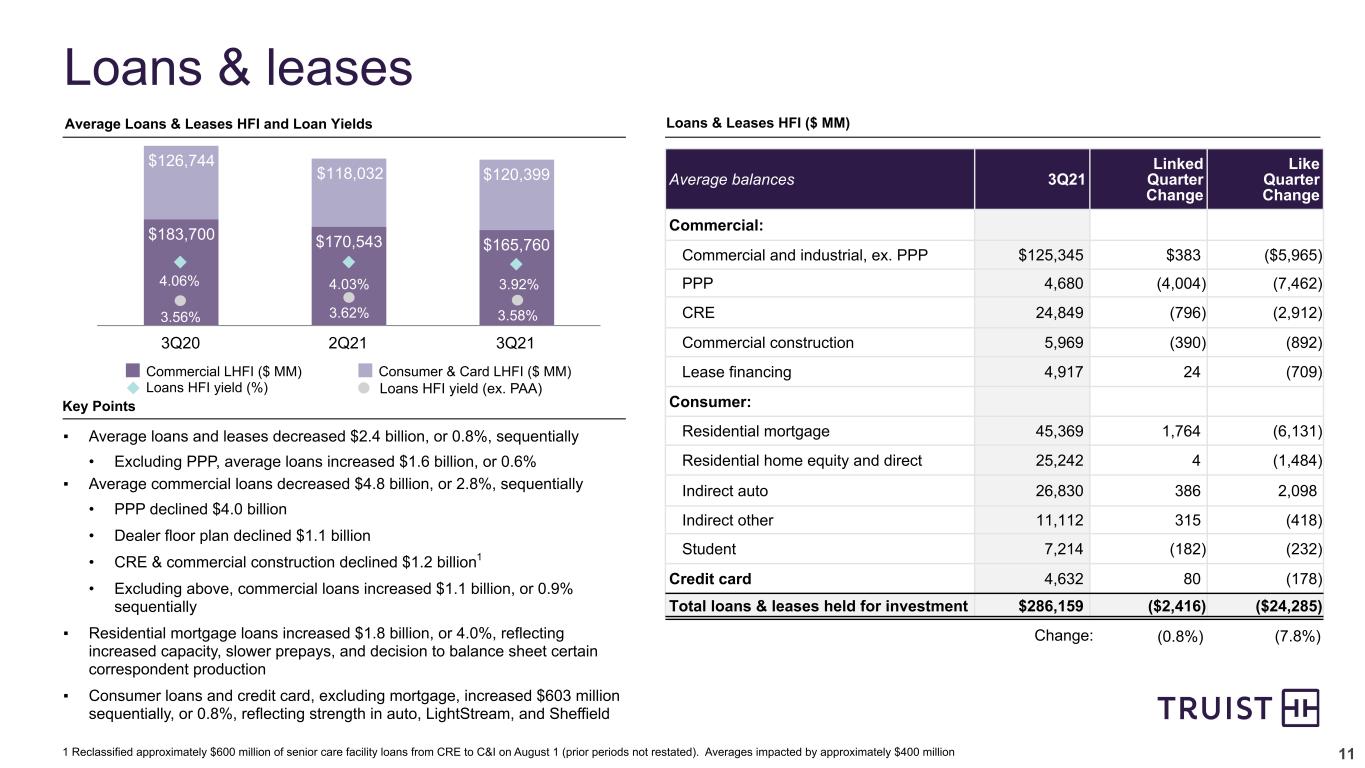
Average loans and leases held for investment for the third quarter of 2021 were $286.2 billion, down $2.4 billion, or 0.8%, compared to the second quarter of 2021.

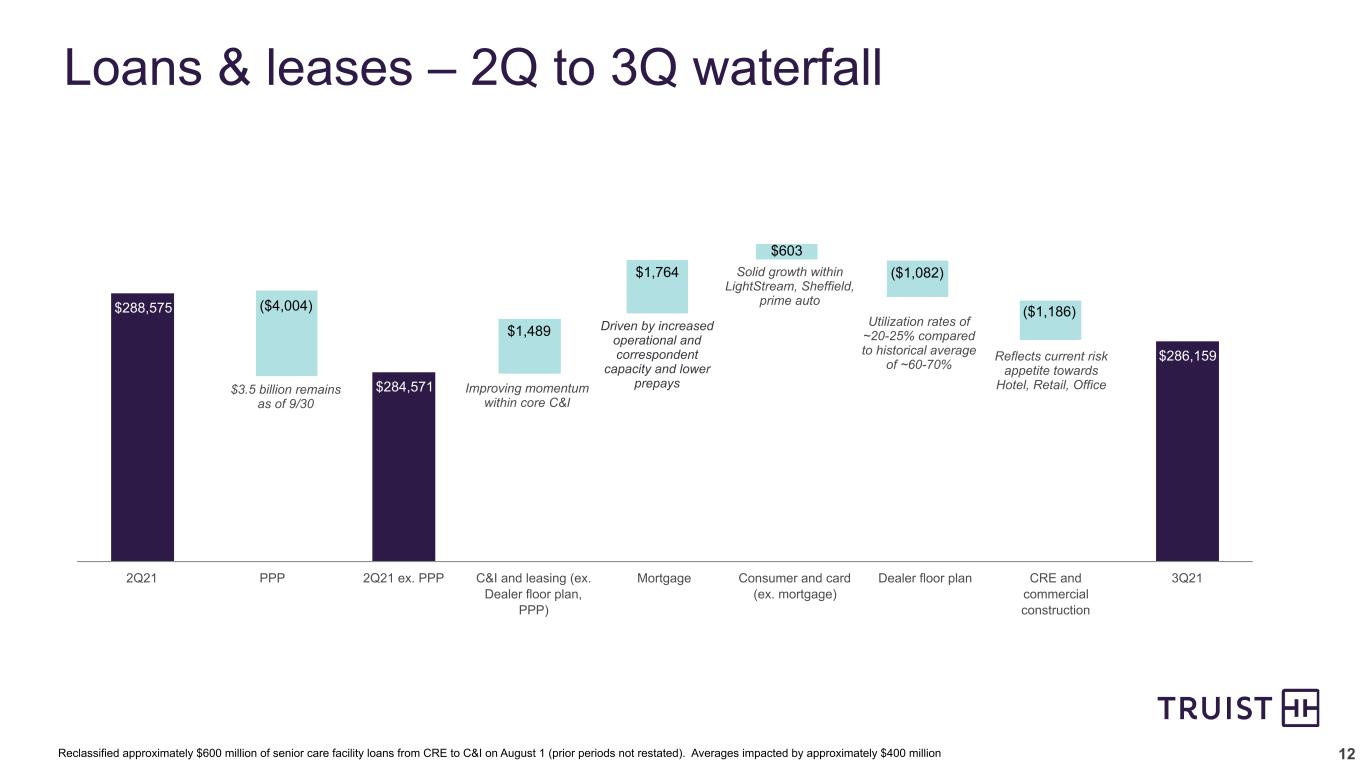
Average commercial loans decreased $4.8 billion, or 2.8%, as $1.5 billion of average growth within the core commercial and industrial portfolio was more than offset by a $4.0 billion decrease in average Paycheck Protection Program loans (commercial and industrial), a $1.1 billion decrease in average dealer floor plan loans (commercial and industrial), a $796 million decrease in average CRE loans, and a $390 million decrease in average commercial construction loans. Approximately $600 million of senior care facility loans were transferred primarily from CRE to commercial and industrial at the beginning of August, which impacted the variances noted above.

Average consumer loans increased $2.3 billion, or 2.0%, primarily due to a $1.8 billion increase in residential mortgages due to increased capacity, lower prepayments and the decision to balance sheet certain production from the correspondent channel, a $386 million increase in indirect auto loans primarily due to solid growth in the prime automobile segment, and a $315 million increase in other indirect loans primarily due to growth in recreational and power sports lending. Residential home equity and direct loans was up slightly due to solid growth from Lightstream more than offsetting the decline in home equity lines of credit.

DEPOSITS
(dollars in millions)
Average balances3Q212Q21Change% Change
Noninterest-bearing deposits$141,738 $137,892 $3,846 2.8 %
Interest checking107,802 106,121 1,681 1.6 
Money market and savings136,094 134,029 2,065 1.5 
Time deposits17,094 18,213 (1,119)(6.1)
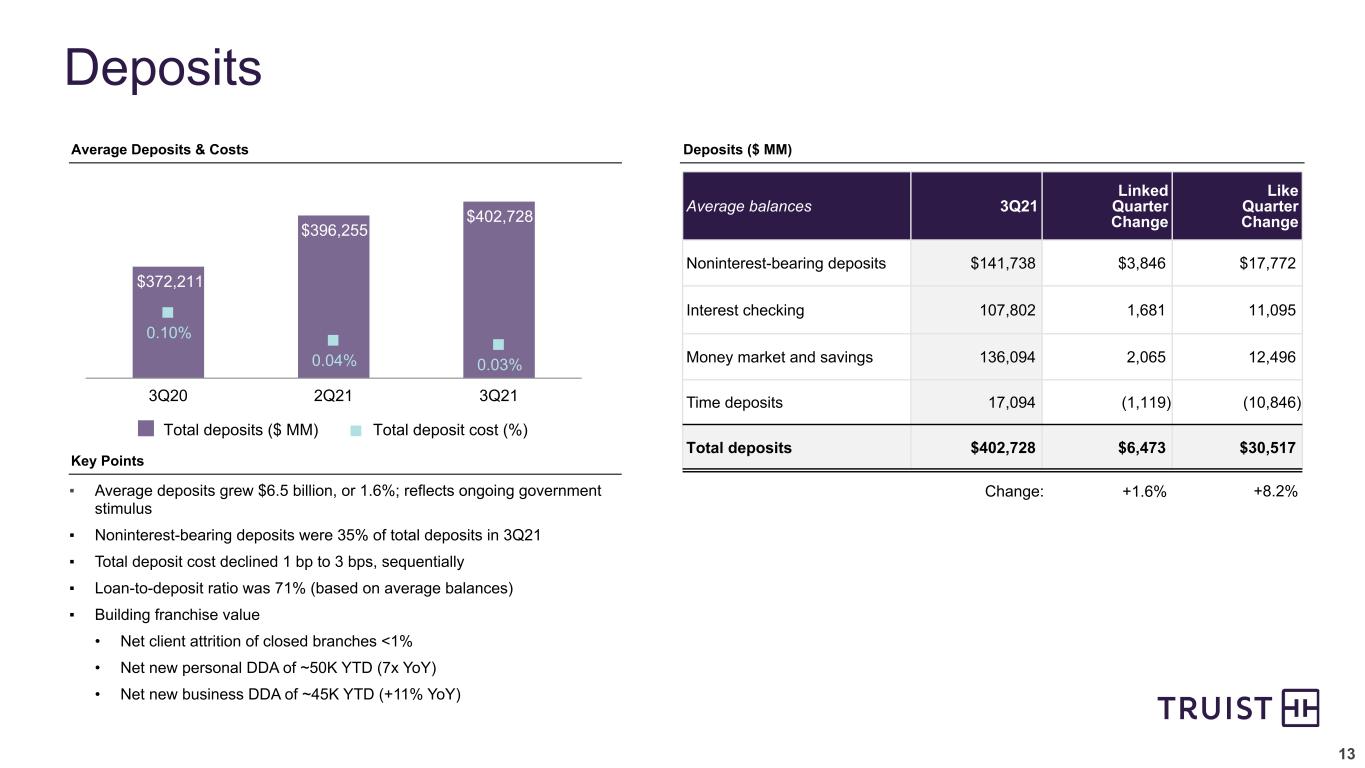
Total deposits$402,728 $396,255 $6,473 1.6 
- 6 -


Average deposits for the third quarter of 2021 were $402.7 billion, an increase of $6.5 billion, or 1.6%, compared to the prior quarter. Average noninterest bearing deposits grew 2.8% compared to the prior quarter and represented 35.2% of total deposits for the third quarter of 2021, compared to 34.8% for the prior quarter. Average interest checking and money market and savings grew 1.6% and 1.5%, respectively, compared to the prior quarter.

Average time deposits decreased 6.1% primarily due to the maturity of higher-cost personal accounts.

CAPITAL RATIOS3Q212Q211Q214Q203Q20
Risk-based:(preliminary)
Common equity Tier 110.1 %10.2 %10.1 %10.0 %10.0 %
Tier 111.9 12.0 12.0 12.1 12.2 
Total13.9 14.2 14.3 14.5 14.6 
Leverage9.0 9.1 9.4 9.6 9.6 
Supplementary leverage7.8 7.9 8.3 8.7 8.9 

Capital ratios remained strong compared to the regulatory requirements for well capitalized banks. Truist increased the common dividend 7% during the third quarter of 2021 to $0.48 per share. The dividend and total payout ratios for the third quarter of 2021 were both 40% as no shares were repurchased in the quarter.

Truist continues to target a CET1 ratio of approximately 9.75% over the near-term. As previously communicated, the Company expects to be able to, with appropriate approvals from its Board of Directors, deploy approximately $4 billion to $5 billion of capital (either in the form of share repurchases or acquisitions) between 3Q21 and 3Q22. During the third quarter of 2021, Truist completed the acquisition of Constellation Affiliated Partners and announced the acquisition of Service Finance, LLC, reducing the amount of capital deployment available for acquisitions or share repurchases to approximately $1 billion to $2 billion through 3Q22.

Truist's average LCR was 114% for the three months ended September 30, 2021, compared to the regulatory minimum of 100%. Truist continues to maintain a strong liquidity position and is prepared to meet the funding needs of clients. In addition, the liquid asset buffer, which is defined as high quality unencumbered liquid assets as a percentage of total assets, was 24.5% at September 30, 2021.

- 7 -


ASSET QUALITY
(dollars in millions)3Q212Q211Q214Q203Q20
Total nonperforming assets$1,204 $1,192 $1,299 $1,387 $1,314 
Total performing TDRs1,475 1,501 1,539 1,361 1,217 
Total loans 90 days past due and still accruing1,872 2,068 2,072 2,008 1,197 
Total loans 30-89 days past due1,823 1,824 1,788 2,220 2,148 
Nonperforming loans and leases as a percentage of loans and leases held for investment
0.38 %0.37 %0.40 %0.44 %0.37 %
Nonperforming loans and leases as a percentage of loans and leases, including loans held for sale0.40 0.39 0.42 0.44 0.40 
Nonperforming assets as a percentage of total assets
0.23 0.23 0.25 0.27 0.26 
Loans 30-89 days past due and still accruing as a percentage of loans and leases
0.64 0.64 0.61 0.74 0.70 
Loans 90 days or more past due and still accruing as a percentage of loans and leases
0.66 0.72 0.71 0.67 0.39 
Loans 90 days or more past due and still accruing as a percentage of loans and leases, excluding PPP and other government guaranteed0.03 0.04 0.04 0.04 0.03 
Allowance for loan and lease losses as a percentage of loans and leases held for investment
1.65 1.79 1.94 1.95 1.91 
Net charge-offs as a percentage of average loans and leases, annualized
0.19 0.20 0.33 0.27 0.42 
Ratio of allowance for loan and lease losses to net charge-offs, annualized
8.79x8.98x5.87x7.15x4.52x
Ratio of allowance for loan and lease losses to nonperforming loans and leases held for investment
4.35x4.83x4.84x4.39x5.22x

Nonperforming assets totaled $1.2 billion at September 30, 2021, up $12 million compared to June 30, 2021. Nonperforming loans and leases represented 0.40% of total loans and leases, up one basis point compared to June 30, 2021.

Performing TDRs were down $26 million compared to the prior quarter primarily due to declines in the residential mortgage and CRE portfolios.

Loans 90 days or more past due and still accruing totaled $1.9 billion at September 30, 2021, down $196 million compared to the prior quarter. The ratio of loans 90 days or more past due and still accruing as a percentage of loans and leases was 0.66% at September 30, 2021, down six basis points from the prior quarter. The decline in loans 90 days or more past due and still accruing was primarily in residential mortgages and student loans. Excluding government guaranteed loans, the ratio of loans 90 days or more past due and still accruing as a percentage of loans and leases was 0.03% at September 30, 2021, down one basis point from June 30, 2021.

Loans 30-89 days past due and still accruing of $1.8 billion at September 30, 2021 were stable compared to the prior quarter.

Net charge-offs during the third quarter totaled $135 million, down $7 million compared to the prior quarter. The net charge-off ratio was 0.19%, down one basis point compared to the prior quarter.

The allowance for credit losses was $5.0 billion and includes $4.7 billion for the allowance for loan and lease losses and $276 million for the reserve for unfunded commitments. The ALLL ratio was 1.65% compared to 1.79% at June 30, 2021. The ALLL covered nonperforming loans and leases held for investment 4.35X compared to 4.83X at June 30, 2021. At September 30, 2021, the ALLL was 8.79X annualized net charge-offs, compared to 8.98X at June 30, 2021.

- 8 -


SEGMENT RESULTSChange 3Q21 vs.
(dollars in millions)
Segment Net Income3Q212Q213Q202Q213Q20
Consumer Banking and Wealth$872 $848 $818 $24 $54 
Corporate and Commercial Banking1,075 1,243 586 (168)489 
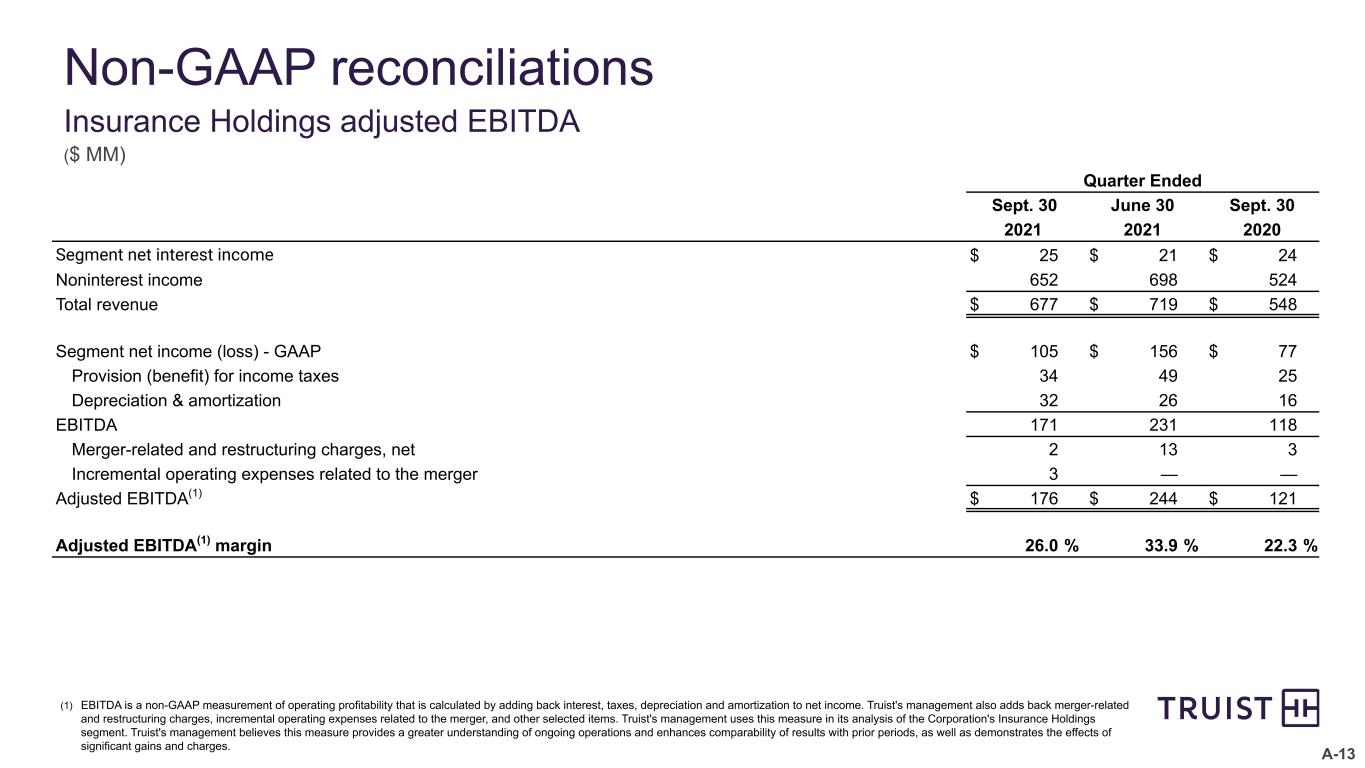
Insurance Holdings105 156 77 (51)28 
Other, Treasury & Corporate(348)(589)(340)241 (8)
Total net income$1,704 $1,658 $1,141 $46 $563 

Truist operates and measures business activity across three segments: Consumer Banking and Wealth, Corporate and Commercial Banking, and Insurance Holdings, with functional activities included in Other, Treasury and Corporate. The Company’s business segment structure is based on the manner in which financial information is evaluated by management as well as the products and services provided or the type of client served. For additional information, see “Note 21. Operating Segments” of the Annual Report on Form 10-K for the year ended December 31, 2020.

Third Quarter 2021 compared to Second Quarter 2021

Consumer Banking and Wealth (“CB&W”)

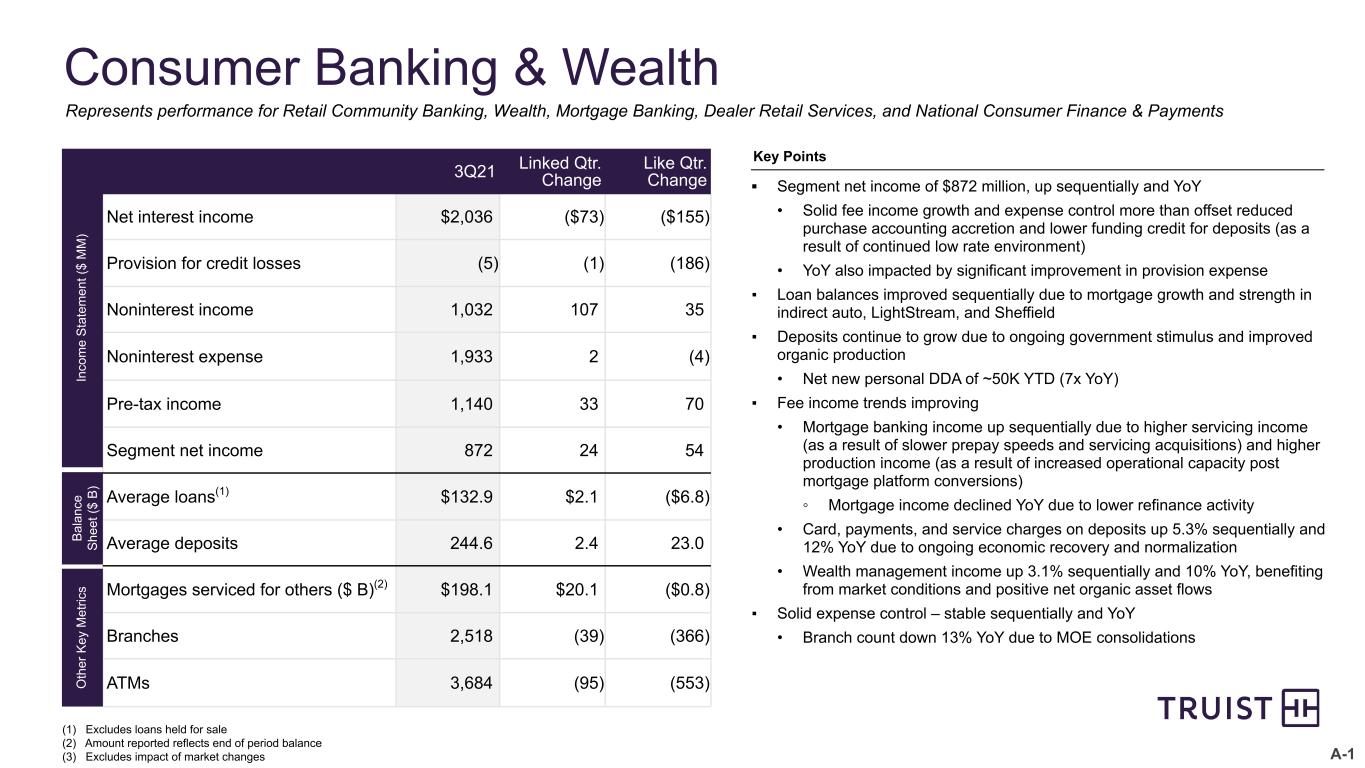
CB&W net income was $872 million for the third quarter of 2021, an increase of $24 million compared to the prior quarter. Segment net interest income decreased $73 million primarily driven by a decline in the funding credit on deposits, lower purchase accounting accretion, and spreads on retail loans driven by the continued low rate environment, partially offset by loan growth. Noninterest income increased $107 million driven by higher mortgage related income primarily due to higher servicing income (due to lower prepayment rates and a bulk purchase of servicing assets), increased income from service charges on deposits, and higher wealth income due to a favorable market environment. Noninterest expense was stable.

Average loans held for investment increased $2.1 billion, or 1.6%, compared to the prior quarter primarily due to higher residential mortgage and indirect auto. Average total deposits increased $2.4 billion, or 1.0%, compared to the prior quarter primarily due to the ongoing impacts of fiscal and monetary stimulus.

Corporate and Commercial Banking (“C&CB”)

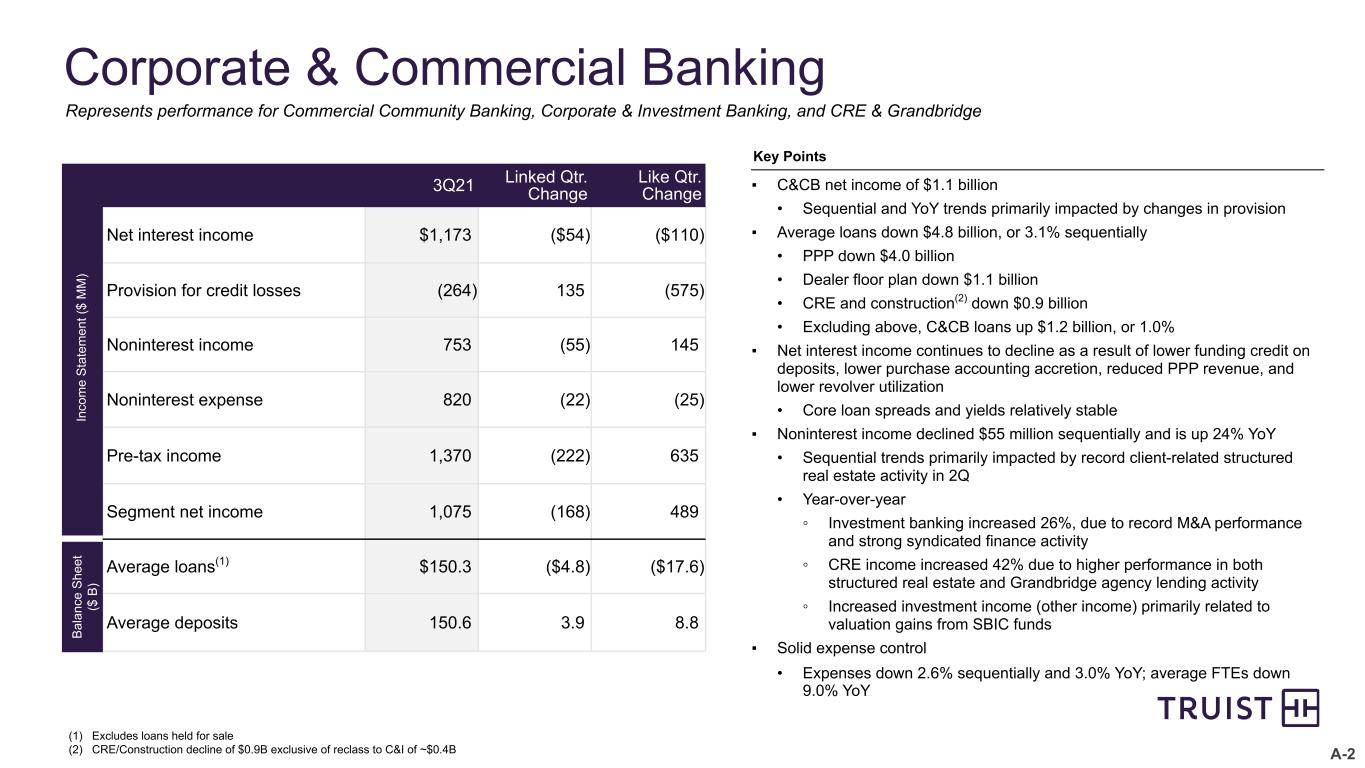
C&CB net income was $1.1 billion for the third quarter of 2021, a decrease of $168 million compared to the prior quarter. Segment net interest income decreased $54 million due to reduced funding credit on deposits, a decrease in PPP revenue, and lower purchase accounting accretion. The allocated provision for credit losses increased $135 million which reflects a lower allowance release than the prior quarter. Noninterest income decreased $55 million primarily due to record client-related structured real estate activity in the prior quarter, lower lending related fees due to losses on lease terminations, and lower investment banking fees, partially offset by income from SBIC investments and higher trading revenues associated with derivative CVA/DVA mark-to-market. Noninterest expense decreased $22 million primarily due to lower restructuring charges in the third quarter as well as lower personnel and outside professional services.

Average loans held for investment decreased $4.8 billion, or 3.1%, compared to the prior quarter primarily due to a decline in PPP loans and a decrease in dealer floor plan line utilization. Average total deposits increased $3.9 billion, or 2.6%, compared to the prior quarter primarily due to the impacts of fiscal and monetary stimulus.

- 9 -


Insurance Holdings (“IH”)

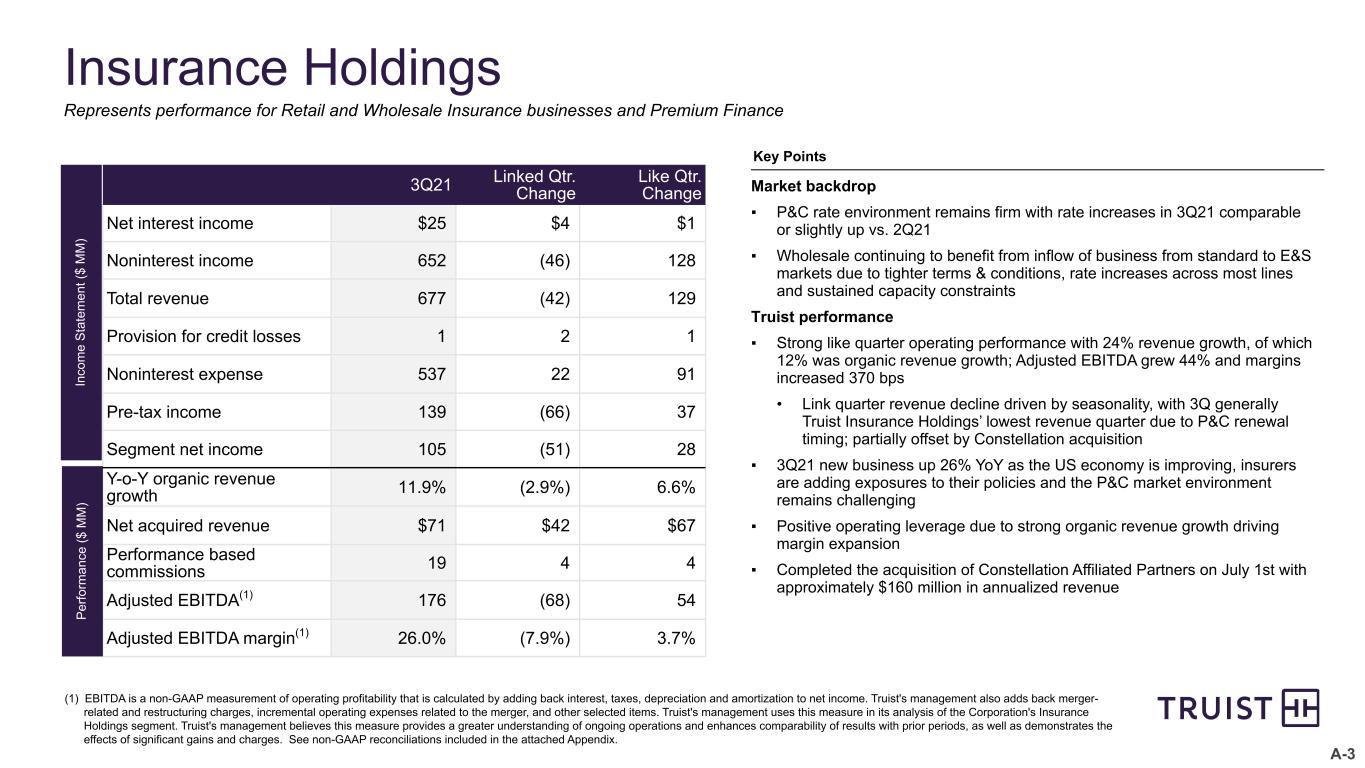
IH net income was $105 million for the third quarter of 2021, a decrease of $51 million compared to the prior quarter. Noninterest income decreased $46 million primarily due to seasonality in property and casualty insurance commissions, partially offset by $41 million of revenue from the Constellation Affiliated Partners acquisition. Noninterest expense increased $22 million primarily due to salaries and related benefits, as well as professional fees associated with the Constellation Affiliated Partners acquisition, partially offset by lower incentives due to seasonality.

Other, Treasury & Corporate (“OT&C”)

OT&C generated a net loss of $348 million for the third quarter of 2021, compared to a net loss of $589 million for the prior quarter. Segment net interest income increased $111 million primarily due to lower net funding credits on deposits to other segments and higher earnings in the securities portfolio from purchases to utilize excess liquidity. The allocated provision for credit losses decreased $26 million primarily driven by an improving economic outlook. Noninterest income decreased $46 million primarily due to lower investment income from Truist Ventures related partnerships in the current quarter as well as lower gains on equity securities from market value changes. Noninterest expense decreased $218 million primarily due to charitable contributions to the Truist Foundation and the Truist Charitable Fund in the prior quarter, lower restructuring charges in the current quarter, and lower executive incentive expenses and related benefits, partially offset by higher professional service fees, equipment, and marketing expenses.

Third Quarter 2021 compared to Third Quarter 2020

Consumer Banking and Wealth

CB&W net income was $872 million for the third quarter of 2021, an increase of $54 million compared to the earlier quarter. Segment net interest income decreased $155 million primarily due to a decline in the funding credit provided on deposits, lower purchase accounting accretion, and a decline in average loans. The allocated provision for credit losses decreased $186 million which reflects the impact of an allowance release during the current quarter and an allowance build during the earlier quarter. The earlier quarter reflected significant uncertainty related to the economic impacts resulting from the pandemic, whereas the current quarter includes a reserve release due to the improving economic outlook. Noninterest income increased $35 million due to increases in wealth management income due to favorable market conditions in the current quarter, card and related fee income, and service charges on deposits, partially offset by lower residential mortgage income driven by lower gain on sale margins and volumes. Noninterest expense was stable compared to earlier quarter.

Corporate and Commercial Banking

C&CB net income was $1.1 billion for the third quarter of 2021, an increase of $489 million compared to the earlier quarter. Segment net interest income decreased $110 million primarily due to reduced funding credit on deposits, lower purchase accounting accretion, and a decline in average loans, partially offset by higher spreads on loans. The allocated provision for credit losses decreased $575 million primarily reflecting an allowance release in the current quarter, whereas the earlier quarter included an allowance build. The earlier quarter reflected significant uncertainty related to the economic impacts resulting from the pandemic, whereas the current quarter includes a reserve release due to the improving economic outlook. Noninterest income increased $145 million driven by investment banking income, commercial real estate income, and higher investment income (primarily valuation gains) from SBIC investments. Noninterest expense decreased $25 million primarily due to lower operating losses, operating lease depreciation, and lower allocated corporate expenses in the current quarter, partially offset by higher restructuring charges in the current quarter.
- 10 -


Insurance Holdings

IH net income was $105 million for the third quarter of 2021, an increase of $28 million compared to the earlier quarter. Noninterest income increased $128 million primarily due to acquisitions and higher property and casualty insurance production from strong organic growth. Noninterest expense increased $91 million primarily due to higher performance-based incentives and amortization of intangibles related to acquisitions.

Other, Treasury & Corporate

OT&C generated a net loss of $348 million in the third quarter of 2021, compared to a net loss of $340 million in the earlier quarter. Segment net interest income increased $135 million primarily due to lower net funding credits on liabilities to other segments and higher earnings in the securities portfolio from purchases to utilize excess liquidity. The allocated provision for credit losses increased $15 million which primarily reflects a smaller release in the reserve for unfunded commitments in the current quarter compared to the earlier quarter. Noninterest income decreased $153 million primarily due to a gain on sale of securities in the earlier quarter. Noninterest expense decreased $22 million primarily due to lower merger related charges in the current quarter and charitable contributions to the Truist Foundation and the Truist Charitable Fund in the earlier quarter, partially offset by higher incentive expense driven by executive incentive compensation and higher accruals reflecting the job regrading project in the fourth quarter 2020.

Earnings Presentation and Quarterly Performance Summary

To listen to Truist's live third quarter 2021 earnings conference call at 8 a.m. ET today, please call 866-519-2796 and enter the participant code 391805. A presentation will be used during the earnings conference call and is available on our website at https://ir.truist.com/events-and-presentation. Replays of the conference call will be available for 30 days by dialing 888-203-1112 (access code 391805).

The presentation, including an appendix reconciling non-GAAP disclosures, and Truist's Third Quarter 2021 Quarterly Performance Summary, which contains detailed financial schedules, are available at https://ir.truist.com/earnings.

About Truist

Truist Financial Corporation is a purpose-driven financial services company committed to inspiring and building better lives and communities. Formed by the historic merger of equals of BB&T and SunTrust, Truist has leading market share in many high-growth markets in the country. The company offers a wide range of services including retail, small business and commercial banking; asset management; capital markets; commercial real estate; corporate and institutional banking; insurance; mortgage; payments; specialized lending; and wealth management. Headquartered in Charlotte, North Carolina, Truist is a top 10 U.S. commercial bank with total assets of $530 billion as of September 30, 2021. Truist Bank, Member FDIC. Learn more at Truist.com.

#-#-#

Capital ratios and return on risk-weighted assets are preliminary.

- 11 -


This news release contains financial information and performance measures determined by methods other than in accordance with accounting principles generally accepted in the United States of America (“GAAP”). Truist's management uses these “non-GAAP” measures in their analysis of the Corporation's performance and the efficiency of its operations. Management believes these non-GAAP measures provide a greater understanding of ongoing operations, enhance comparability of results with prior periods and demonstrate the effects of significant items in the current period. The Corporation believes a meaningful analysis of its financial performance requires an understanding of the factors underlying that performance. Truist’s management believes investors may find these non-GAAP financial measures useful. These disclosures should not be viewed as a substitute for financial measures determined in accordance with GAAP, nor are they necessarily comparable to non-GAAP performance measures that may be presented by other companies. Below is a listing of the types of non-GAAP measures used in this news release:

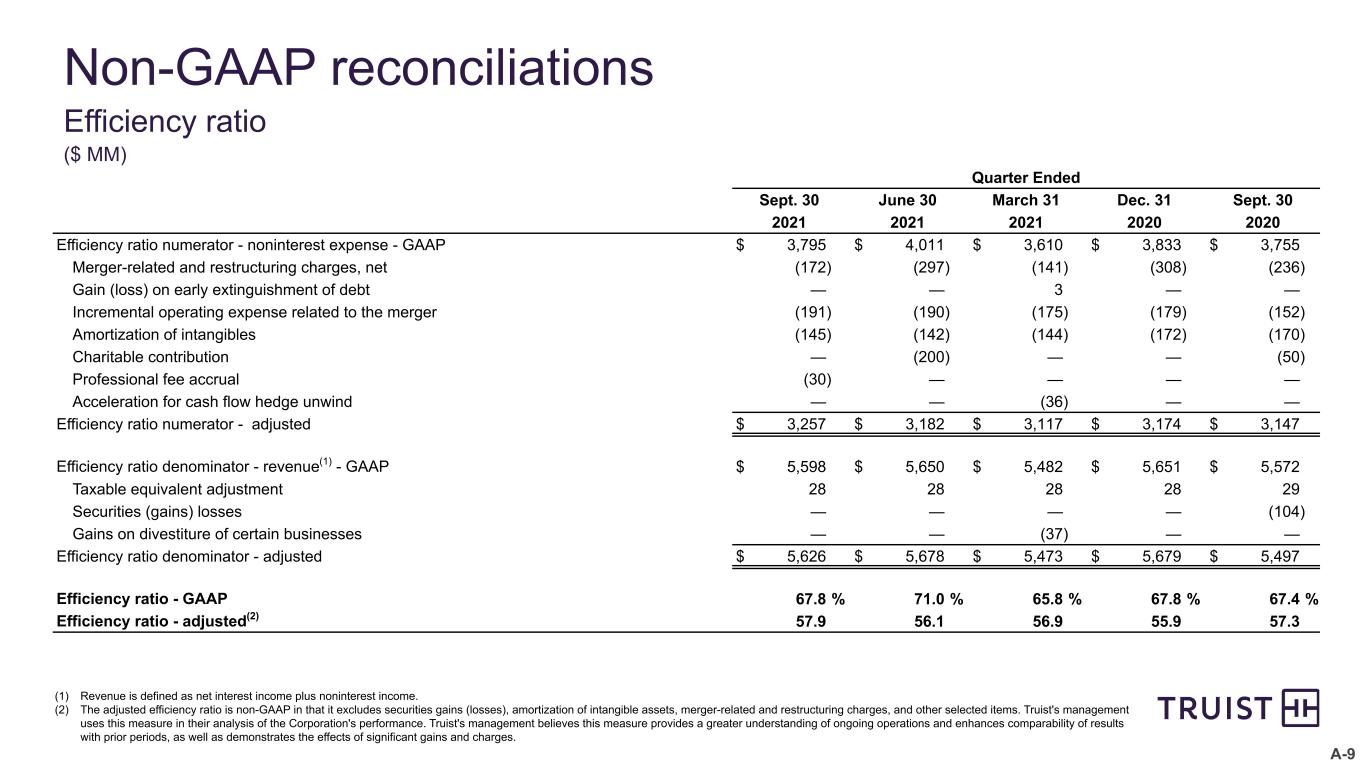
Adjusted Efficiency Ratio - The adjusted efficiency ratio is non-GAAP in that it excludes securities gains (losses), amortization of intangible assets, merger-related and restructuring charges, and other selected items. Truist's management uses this measure in their analysis of the Corporation's performance. Truist's management believes this measure provides a greater understanding of ongoing operations and enhances comparability of results with prior periods, as well as demonstrates the effects of significant gains and charges.
Tangible Common Equity and Related Measures - Tangible common equity and related measures are non-GAAP measures that exclude the impact of intangible assets, net of deferred taxes, and their related amortization. These measures are useful for evaluating the performance of a business consistently, whether acquired or developed internally. Truist’s management uses these measures to assess the quality of capital and returns relative to balance sheet risk.
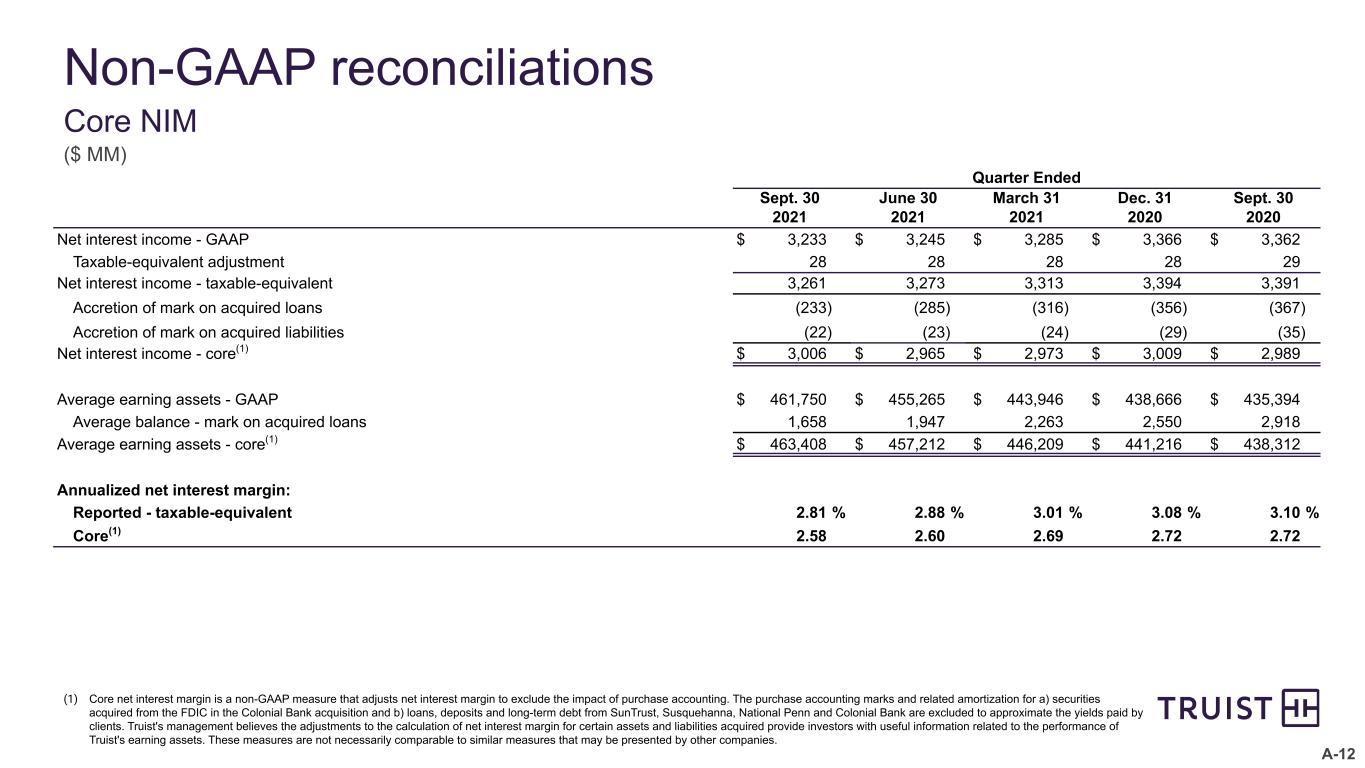
Core NIM - Core net interest margin is a non-GAAP measure that adjusts net interest margin to exclude the impact of purchase accounting. The purchase accounting marks and related amortization for a) securities acquired from the FDIC in the Colonial Bank acquisition and b) loans, deposits and long-term debt from SunTrust, Susquehanna, National Penn and Colonial Bank are excluded to approximate the yields paid by clients. Truist's management believes the adjustments to the calculation of net interest margin for certain assets and liabilities acquired provide investors with useful information related to the performance of Truist's earning assets.
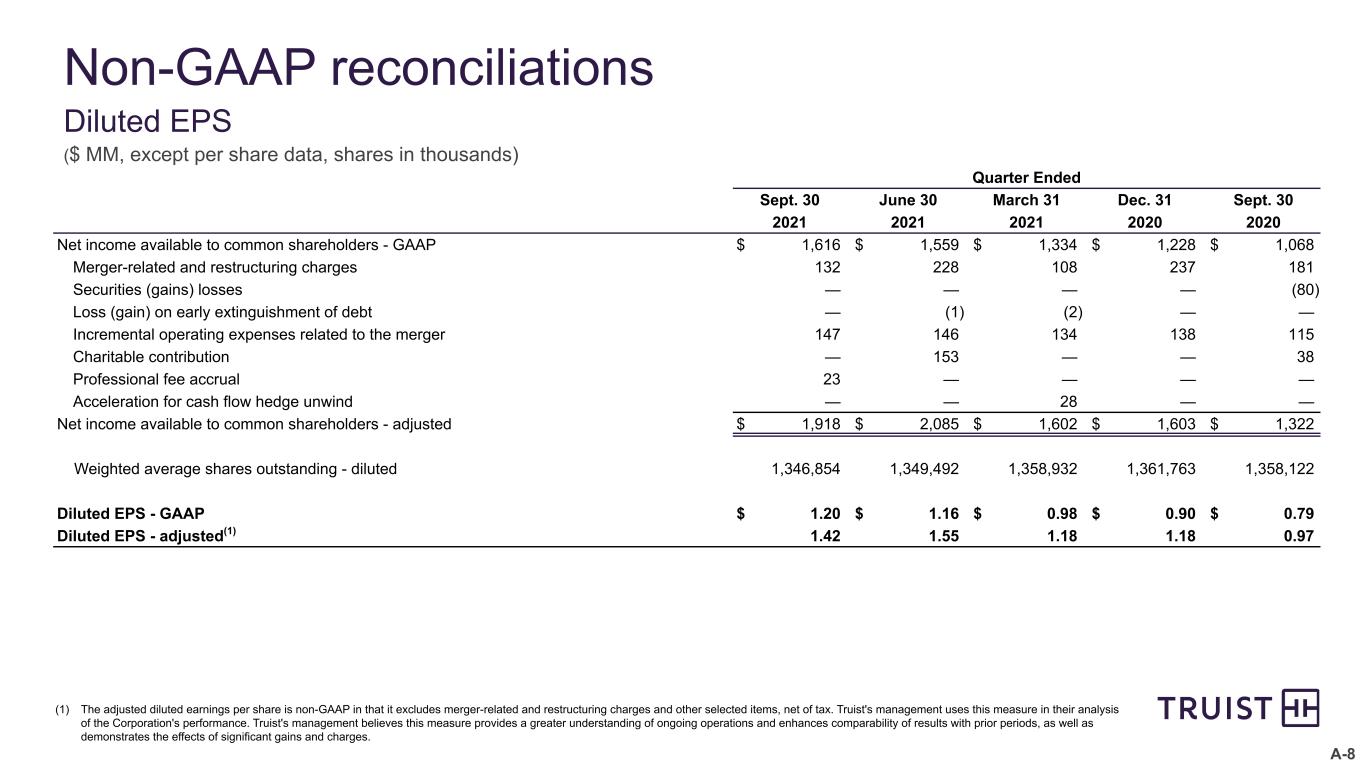
Adjusted Diluted EPS - The adjusted diluted earnings per share is non-GAAP in that it excludes merger-related and restructuring charges and other selected items, net of tax. Truist's management uses this measure in their analysis of the Corporation's performance. Truist's management believes this measure provides a greater understanding of ongoing operations and enhances comparability of results with prior periods, as well as demonstrates the effects of significant gains and charges.
Performance Ratios - The adjusted performance ratios, including adjusted return on average assets, adjusted return on average common shareholders’ equity, and adjusted return on average tangible common shareholders’ equity, are non-GAAP in that they exclude merger-related and restructuring charges, selected items, and, in the case of return on average tangible common shareholders' equity, amortization of intangible assets. Truist's management uses these measures in their analysis of the Corporation's performance. Truist's management believes these measures provide a greater understanding of ongoing operations and enhance comparability of results with prior periods, as well as demonstrate the effects of significant gains and charges.
Insurance Holdings Adjusted EBITDA - EBITDA is a non-GAAP measurement of operating profitability that is calculated by adding back interest, taxes, depreciation and amortization to net income. Truist's management also adds back merger-related and restructuring charges, incremental operating expenses related to the merger, and other selected items. Truist's management uses this measure in its analysis of the Corporation's Insurance Holdings segment. Truist's management believes this measure provides a greater understanding of ongoing operations and enhances comparability of results with prior periods, as well as demonstrates the effects of significant gains and charges.
Allowance for Loan and Lease Losses and Unamortized Fair Value Mark as a Percentage of Gross Loans and Leases - Allowance for loan and lease losses and unamortized fair value mark as a percentage of gross loans and leases is a non-GAAP measurement of credit reserves that is calculated by adjusting the ALLL and loans and leases held for investment by the unamortized fair value mark. Truist's management uses these measures to assess loss absorption capacity.

A reconciliation of each of these non-GAAP measures to the most directly comparable GAAP measure is included in the appendix to Truist's Third Quarter 2021 Earnings Presentation, which is available at https://ir.truist.com/earnings.

This news release contains ”forward-looking statements” within the meaning of the Private Securities Litigation Reform Act of 1995, regarding the financial condition, results of operations, business plans and the future performance of Truist. Words such as “anticipates,” “believes,” “estimates,” “expects,” “forecasts,” “intends,” “plans,” “projects,” “may,” “will,” “should,” “would,” “could” and other similar expressions are intended to identify these forward-looking statements.

Forward-looking statements are not based on historical facts but instead represent management's expectations and assumptions regarding Truist's business, the economy and other future conditions. Such statements involve inherent uncertainties, risks and changes in circumstances that are difficult to predict. As such, Truist’s actual results may differ materially from those contemplated by forward-looking statements. While there can be no assurance that any list of risks and uncertainties or risk factors is complete, important factors that could cause actual results to differ materially from those contemplated by forward-looking statements include the following, without limitation, as well as the risks and uncertainties more fully discussed under Part I, Item 1A-Risk Factors in our Annual Report on Form 10-K for the year ended December 31, 2020 and in Truist's subsequent filings with the Securities and Exchange Commission:
- 12 -


risks and uncertainties relating to the Merger of heritage BB&T and heritage SunTrust, including the ability to successfully integrate the companies or to realize the anticipated benefits of the Merger;
expenses relating to the Merger and integration of heritage BB&T and heritage SunTrust;
deposit attrition, client loss or revenue loss following completed mergers or acquisitions may be greater than anticipated;
the COVID-19 pandemic disrupted the global economy and adversely impacted Truist’s financial condition and results of operations, including through increased expenses, reduced fee income and net interest margin, and increases in the allowance for credit losses; the resurgence of the pandemic in recent months could reintroduce or prolong these negative impacts and also adversely affect Truist’s capital and liquidity position or cost of capital, impair the ability of borrowers to repay outstanding loans, cause an outflow of deposits, and impair goodwill or other assets;
Truist is subject to credit risk by lending or committing to lend money, and may have more credit risk and higher credit losses to the extent that loans are concentrated by loan type, industry segment, borrower type or location of the borrower or collateral;
changes in the interest rate environment, including the replacement of LIBOR as an interest rate benchmark and potentially negative interest rates, which could adversely affect Truist’s revenue and expenses, the value of assets and obligations, and the availability and cost of capital, cash flows, and liquidity;
inability to access short-term funding or liquidity, loss of client deposits or changes in Truist’s credit ratings, which could increase the cost of funding or limit access to capital markets;
risk management oversight functions may not identify or address risks adequately, and management may not be able to effectively manage credit risk;
risks resulting from the extensive use of models in Truist’s business, which may impact decisions made by management and regulators;
failure to execute on strategic or operational plans, including the ability to successfully complete or integrate mergers and acquisitions;
increased competition, including from (i) new or existing competitors that could have greater financial resources or be subject to different regulatory standards, and (ii) products and services offered by non-bank financial technology companies, may reduce Truist’s client base, cause Truist to lower prices for its products and services in order to maintain market share or otherwise adversely impact Truist’s businesses or results of operations;
failure to maintain or enhance Truist’s competitive position with respect to new products, services and technology, whether it fails to anticipate client expectations or because its technological developments fail to perform as desired or do not achieve market acceptance or regulatory approval or for other reasons, may cause Truist to lose market share or incur additional expense;
negative public opinion, which could damage Truist’s reputation;
increased scrutiny regarding Truist’s consumer sales practices, training practices, incentive compensation design, and governance;
regulatory matters, litigation or other legal actions, which may result in, among other things, costs, fines, penalties, restrictions on Truist’s business activities, reputational harm, negative publicity, or other adverse consequences;
evolving legislative, accounting and regulatory standards, including with respect to capital and liquidity requirements, and results of regulatory examinations may adversely affect Truist’s financial condition and results of operations;
the monetary and fiscal policies of the federal government and its agencies could have a material adverse effect on profitability;
accounting policies and processes require management to make estimates about matters that are uncertain, including the potential write down to goodwill if there is an elongated period of decline in market value for Truist’s stock and adverse economic conditions are sustained over a period of time;
general economic or business conditions, either globally, nationally or regionally, may be less favorable than expected, and instability in global geopolitical matters or volatility in financial markets could result in, among other things, slower deposit or asset growth, a deterioration in credit quality, or a reduced demand for credit, insurance, or other services;
risks related to originating and selling mortgages, including repurchase and indemnity demands from purchasers related to representations and warranties on loans sold, which could result in an increase in the amount of losses for loan repurchases;
risks relating to Truist’s role as a loan servicer, including an increase in the scope or costs of the services Truist is required to perform, without any corresponding increase in servicing fees or a breach of Truist’s obligations as servicer;
Truist’s success depends on hiring and retaining key personnel, and if these individuals leave or change roles without effective replacements, Truist’s operations and integration activities could be adversely impacted, which could be exacerbated as Truist continues to integrate the management teams of heritage BB&T and heritage SunTrust;
fraud or misconduct by internal or external parties, which Truist may not be able to prevent, detect, or mitigate;
security risks, including denial of service attacks, hacking, social engineering attacks targeting Truist’s teammates and clients, malware intrusion, data corruption attempts, system breaches, cyber attacks, identity theft, ransomware attacks, and physical security risks, such as natural disasters, environmental conditions, and intentional acts of destruction, could result in the disclosure of confidential information, adversely affect Truist’s business or reputation or create significant legal or financial exposure; and
- 13 -


widespread outages of operational, communication, or other systems, whether internal or provided by third parties, natural or other disasters (including acts of terrorism and pandemics), and the effects of climate change, including physical risks, such as more frequent and intense weather events, and risks related to the transition to a lower carbon economy, such as regulatory or technological changes or shifts in market dynamics or consumer preferences, could have an adverse effect on Truist’s financial condition and results of operations, lead to material disruption of Truist’s operations or the ability or willingness of clients to access Truist’s products and services.

Readers are cautioned not to place undue reliance on these forward-looking statements, which speak only as of the date they are made. Except to the extent required by applicable law or regulation, Truist undertakes no obligation to revise or update any forward-looking statements.
- 14 -




logo-boxeda.jpg

Quarterly Performance Summary
Truist Financial Corporation
Third Quarter 2021


Table of Contents 
Quarterly Performance Summary 
Truist Financial Corporation


  Page
Financial Highlights
Financial Highlights - Five Quarter Trend
Consolidated Statements of Income
Consolidated Statements of Income - Five Quarter Trend
Segment Financial Performance - Five Quarter Trend
Consolidated Ending Balance Sheets - Five Quarter Trend
Average Balance Sheets
Average Balance Sheets - Five Quarter Trend
Average Balances and Rates - Quarters
Credit Quality
Capital Information - Five Quarter Trend
Selected Mortgage Banking Information & Additional Information
Selected Items
Non-GAAP Reconciliations


Financial Highlights
Quarter Ended Year-to-Date
 September 30%September 30%
(Dollars in millions, except per share data, shares in thousands)20212020Change20212020Change
Summary Income Statement      
Interest income - taxable equivalent (1)$3,454 $3,652 (5.4)%$10,447 $12,034 (13.2)%
Interest expense193 261 (26.1)600 1,477 (59.4)
Net interest income - taxable equivalent3,261 3,391 (3.8)9,847 10,557 (6.7)
Less: Taxable-equivalent adjustment28 29 (3.4)84 97 (13.4)
Net interest income3,233 3,362 (3.8)9,763 10,460 (6.7)
Provision for credit losses(324)421 (177.0)(710)2,158 (132.9)
Net interest income after provision for credit losses3,557 2,941 20.9 10,473 8,302 26.2 
Noninterest income2,365 2,210 7.0 6,967 6,594 5.7 
Noninterest expense3,795 3,755 1.1 11,416 11,064 3.2 
Income before income taxes2,127 1,396 52.4 6,024 3,832 57.2 
Provision for income taxes423 255 65.9 1,189 670 77.5 
Net income1,704 1,141 49.3 4,835 3,162 52.9 
Noncontrolling interests— (100.0)(3)(133.3)
Net income available to the bank holding company1,704 1,138 49.7 4,838 3,153 53.4 
Preferred stock dividends and other88 70 25.7 329 197 67.0 
Net income available to common shareholders1,616 1,068 51.3 4,509 2,956 52.5 
Per Common Share Data
Earnings per share-basic$1.21 $0.79 53.2 %$3.37 $2.20 53.2 %
Earnings per share-diluted1.20 0.79 51.9 3.34 2.18 53.2 
Earnings per share-adjusted diluted (2)1.42 0.97 46.4 4.15 2.62 58.4 
Cash dividends declared0.48 0.45 6.7 1.38 1.35 2.2 
Common shareholders' equity46.62 45.86 1.7 46.62 45.86 1.7 
Tangible common shareholders' equity (2)26.34 26.63 (1.1)26.34 26.63 (1.1)
End of period shares outstanding1,334,892 1,348,118 (1.0)1,334,892 1,348,118 (1.0)
Weighted average shares outstanding-basic1,334,825 1,347,916 (1.0)1,339,558 1,346,605 (0.5)
Weighted average shares outstanding-diluted1,346,854 1,358,122 (0.8)1,351,712 1,357,174 (0.4)
Performance Ratios
Return on average assets1.28 %0.91 %1.25 %0.85 %
Return on average risk-weighted assets (current period is preliminary)1.77 1.19 1.70 1.10 
Return on average common shareholders' equity10.2 6.9 9.7 6.5 
Return on average tangible common shareholders' equity (2)19.3 13.3 18.2 12.8 
Net interest margin - taxable equivalent2.81 3.10 2.90 3.26 
Fee income ratio42.2 39.7 41.6 38.7 
Efficiency ratio-GAAP67.8 67.4 68.2 64.9 
Efficiency ratio-adjusted (2)57.9 57.3 57.0 55.9 
Credit Quality
Nonperforming assets as a percentage of:
Assets, including LHFS0.23 %0.26 %0.23 %0.26 %
Loans and leases plus foreclosed property0.40 0.39 0.40 0.39 
Net charge-offs as a percentage of average loans and leases0.19 0.42 0.24 0.39 
Allowance for loan and lease losses as a percentage of LHFI1.65 1.91 1.65 1.91 
Ratio of allowance for loan and lease losses to nonperforming LHFI4.35x5.22x4.35x5.22x
Average Balances
Assets$526,685 $500,826 5.2 %$518,163 $497,710 4.1 %
Securities available for sale (3)146,272 79,828 83.2 134,810 76,906 75.3 
Loans and leases 290,338 315,691 (8.0)294,248 316,621 (7.1)
Deposits402,728 372,211 8.2 394,128 359,273 9.7 
Common shareholders' equity62,680 61,804 1.4 62,215 61,173 1.7 
Total shareholders' equity69,353 69,634 (0.4)69,353 67,311 3.0 
Period-End Balances
Assets$529,884 $499,183 6.2 %$529,884 $499,183 6.2 %
Securities available for sale (3)151,038 86,132 75.4 151,038 86,132 75.4 
Loans and leases 290,655 312,149 (6.9)290,655 312,149 (6.9)
Deposits405,857 370,747 9.5 405,857 370,747 9.5 
Common shareholders' equity62,227 61,819 0.7 62,227 61,819 0.7 
Total shareholders' equity68,900 69,973 (1.5)68,900 69,973 (1.5)
Capital Ratios (current quarter is preliminary)
Common equity Tier 110.1 %10.0 %10.1 %10.0 %
Tier 111.9 12.2 11.9 12.2 
Total 13.9 14.6 13.9 14.6 
Leverage9.0 9.6 9.0 9.6 
Supplementary leverage7.8 8.9 7.8 8.9 
Applicable ratios are annualized.
(1) Interest income includes certain fees, deferred costs, fair value mark accretion, and dividends.
(2) Represents a non-GAAP measure. See the calculations and management's reasons for using these measures in the Non-GAAP Reconciliations and Preliminary Capital Information - Five Quarter Trend sections of this supplement.
(3) Average balances reflect AFS securities at amortized cost. Period-end balances reflect AFS securities at fair value.
Truist Financial Corporation 1


Financial Highlights - Five Quarter Trend   
Quarter Ended
 Sept. 30June 30March 31Dec. 31Sept. 30
(Dollars in millions, except per share data, shares in thousands)20212021202120202020
Summary Income Statement
Interest income - taxable equivalent (1)$3,454 $3,471 $3,522 $3,639 $3,652 
Interest expense193 198 209 245 261 
Net interest income - taxable equivalent3,261 3,273 3,313 3,394 3,391 
Less: Taxable-equivalent adjustment28 28 28 28 29 
Net interest income3,233 3,245 3,285 3,366 3,362 
Provision for credit losses(324)(434)48 177 421 
Net interest income after provision for credit losses3,557 3,679 3,237 3,189 2,941 
Noninterest income2,365 2,405 2,197 2,285 2,210 
Noninterest expense3,795 4,011 3,610 3,833 3,755 
Income before income taxes2,127 2,073 1,824 1,641 1,396 
Provision for income taxes423 415 351 311 255 
Net income1,704 1,658 1,473 1,330 1,141 
Noncontrolling interests— (4)
Net income available to the bank holding company1,704 1,657 1,477 1,329 1,138 
Preferred stock dividends and other88 98 143 101 70 
Net income available to common shareholders1,616 1,559 1,334 1,228 1,068 
Per Common Share Data
Earnings per share-basic$1.21 $1.16 $0.99 $0.91 $0.79 
Earnings per share-diluted1.20 1.16 0.98 0.90 0.79 
Earnings per share-adjusted diluted (2)1.42 1.55 1.18 1.18 0.97 
Cash dividends declared0.48 0.45 0.45 0.45 0.45 
Common shareholders' equity46.62 46.20 45.17 46.52 45.86 
Tangible common shareholders' equity (2)26.34 26.50 25.53 26.78 26.63 
End of period shares outstanding1,334,892 1,334,770 1,344,845 1,348,961 1,348,118 
Weighted average shares outstanding-basic1,334,825 1,338,302 1,345,666 1,348,493 1,347,916 
Weighted average shares outstanding-diluted1,346,854 1,349,492 1,358,932 1,361,763 1,358,122 
Performance Ratios
Return on average assets1.28 %1.28 %1.17 %1.05 %0.91 %
Return on average risk-weighted assets (current quarter is preliminary)1.77 1.76 1.58 1.40 1.19 
Return on average common shareholders' equity10.2 10.1 8.7 7.9 6.9 
Return on average tangible common shareholders' equity (2)19.3 18.9 16.4 15.0 13.3 
Net interest margin - taxable equivalent2.81 2.88 3.01 3.08 3.10 
Fee income ratio42.2 42.6 40.1 40.4 39.7 
Efficiency ratio-GAAP67.8 71.0 65.8 67.8 67.4 
Efficiency ratio-adjusted (2)57.9 56.1 56.9 55.9 57.3 
Credit Quality
Nonperforming assets as a percentage of:
Assets, including LHFS0.23 %0.23 %0.25 %0.27 %0.26 %
Loans and leases plus foreclosed property0.40 0.39 0.42 0.46 0.39 
Net charge-offs as a percentage of average loans and leases0.19 0.20 0.33 0.27 0.42 
Allowance for loan and lease losses as a percentage of LHFI1.65 1.79 1.94 1.95 1.91 
Ratio of allowance for loan and lease losses to nonperforming LHFI4.35x4.83x4.84x4.39x5.22x
Average Balances
Assets$526,685 $518,774 $508,833 $503,181 $500,826 
Securities available for sale (3)146,272 135,647 122,246 102,053 79,828 
Loans and leases 290,338 292,965 299,541 308,188 315,691 
Deposits402,728 396,255 383,185 375,266 372,211 
Common shareholders' equity62,680 61,709 62,252 61,991 61,804 
Total shareholders' equity69,353 68,665 70,047 70,145 69,634 
Period-End Balances
Assets$529,884 $521,964 $517,537 $509,228 $499,183 
Securities available for sale (3)151,038 139,879 123,807 120,788 86,132 
Loans and leases 290,655 289,494 297,179 305,793 312,149 
Deposits405,857 398,279 395,562 381,077 370,747 
Common shareholders' equity62,227 61,663 60,752 62,759 61,819 
Total shareholders' equity68,900 68,336 67,876 70,912 69,973 
Capital Ratios (current quarter is preliminary)
Common equity Tier 110.1 %10.2 %10.1 %10.0 %10.0 %
Tier 111.9 12.0 12.0 12.1 12.2 
Total 13.9 14.2 14.3 14.5 14.6 
Leverage9.0 9.1 9.4 9.6 9.6 
Supplementary leverage7.8 7.9 8.3 8.7 8.9 
Applicable ratios are annualized.
(1) Interest income includes certain fees, deferred costs, fair value mark accretion, and dividends.
(2) Represents a non-GAAP measure. See the calculations and management's reasons for using these measures in the Non-GAAP Reconciliations and Preliminary Capital Information - Five Quarter Trend sections of this supplement.
(3) Average balances reflect AFS securities at amortized cost. Period-end balances reflect AFS securities at fair value.

2 Truist Financial Corporation


Consolidated Statements of Income 
 Quarter EndedYear-to-Date
 Sept. 30ChangeSept. 30Change
(Dollars in millions, except per share data, shares in thousands)20212020$%20212020$%
Interest Income
Interest and fees on loans and leases$2,825 $3,174 $(349)(11.0)%$8,728 $10,327 $(1,599)(15.5)%
Interest on securities548 393 155 39.4 1,488 1,331 157 11.8 
Interest on other earning assets53 56 (3)(5.4)147 279 (132)(47.3)
Total interest income3,426 3,623 (197)(5.4)10,363 11,937 (1,574)(13.2)
Interest Expense
Interest on deposits33 96 (63)(65.6)116 718 (602)(83.8)
Interest on long-term debt151 152 (1)(0.7)446 635 (189)(29.8)
Interest on other borrowings13 (4)(30.8)38 124 (86)(69.4)
Total interest expense193 261 (68)(26.1)600 1,477 (877)(59.4)
Net Interest Income3,233 3,362 (129)(3.8)9,763 10,460 (697)(6.7)
Provision for credit losses(324)421 (745)(177.0)(710)2,158 (2,868)(132.9)
Net Interest Income After Provision for Credit Losses3,557 2,941 616 20.9 10,473 8,302 2,171 26.2 
Noninterest Income
Insurance income645 518 127 24.5 1,961 1,648 313 19.0 
Wealth management income356 324 32 9.9 1,042 945 97 10.3 
Service charges on deposits276 247 29 11.7 787 754 33 4.4 
Residential mortgage income179 221 (42)(19.0)396 807 (411)(50.9)
Investment banking and trading income301 244 57 23.4 958 636 322 50.6 
Card and payment related fees225 200 25 12.5 650 558 92 16.5 
Lending related fees74 77 (3)(3.9)268 210 58 27.6 
Operating lease income57 72 (15)(20.8)191 232 (41)(17.7)
Commercial real estate related income78 55 23 41.8 259 148 111 75.0 
Income from bank-owned life insurance43 46 (3)(6.5)139 135 3.0 
Securities gains (losses)— 104 (104)NM— 402 (402)NM
Other income131 102 29 28.4316 119 197 165.5
Total noninterest income2,365 2,210 155 7.0 6,967 6,594 373 5.7 
Noninterest Expense
Personnel expense2,187 2,058 129 6.3 6,536 6,038 498 8.2 
Professional fees and outside processing372 323 49 15.2 1,063 859 204 23.7 
Net occupancy expense187 233 (46)(19.7)578 697 (119)(17.1)
Software expense251 221 30 13.6 707 647 60 9.3 
Amortization of intangibles145 170 (25)(14.7)431 513 (82)(16.0)
Equipment expense154 127 27 21.3 389 363 26 7.2 
Marketing and customer development94 75 19 25.3 226 215 11 5.1 
Operating lease depreciation47 56 (9)(16.1)144 204 (60)(29.4)
Loan-related expense52 59 (7)(11.9)161 177 (16)(9.0)
Regulatory costs43 34 26.5 99 93 6.5 
Merger-related and restructuring charges172 236 (64)(27.1)610 552 58 10.5 
Loss (gain) on early extinguishment of debt— — — — (3)235 (238)(101.3)
Other expense91 163 (72)(44.2)475 471 0.8 
Total noninterest expense3,795 3,755 40 1.1 11,416 11,064 352 3.2 
Earnings
Income before income taxes2,127 1,396 731 52.4 6,024 3,832 2,192 57.2 
Provision for income taxes423 255 168 65.9 1,189 670 519 77.5 
Net income1,704 1,141 563 49.3 4,835 3,162 1,673 52.9 
Noncontrolling interests— (3)(100.0)(3)(12)(133.3)
Net income available to the bank holding company1,704 1,138 566 49.7 4,838 3,153 1,685 53.4 
Preferred stock dividends and other88 70 18 25.7 329 197 132 67.0 
Net income available to common shareholders$1,616 $1,068 $548 51.3 %$4,509 $2,956 $1,553 52.5 %
Earnings Per Common Share
Basic$1.21 $0.79 $0.42 53.2 %$3.37 $2.20 $1.17 53.2 %
Diluted1.20 0.79 0.41 51.9 3.34 2.18 1.16 53.2 
Weighted Average Shares Outstanding
Basic1,334,825 1,347,916 (13,091)(1.0)1,339,558 1,346,605 (7,047)(0.5)
Diluted1,346,854 1,358,122 (11,268)(0.8)1,351,712 1,357,174 (5,462)(0.4)
NM - not meaningful

Truist Financial Corporation 3


Consolidated Statements of Income - Five Quarter Trend   
Quarter Ended
Sept. 30June 30March 31Dec. 31Sept. 30
(Dollars in millions, except per share data, shares in thousands)20212021202120202020
Interest Income
Interest and fees on loans and leases$2,825 $2,901 $3,002 $3,158 $3,174 
Interest on securities548 497 443 408 393 
Interest on other earning assets53 45 49 45 56 
Total interest income3,426 3,443 3,494 3,611 3,623 
Interest Expense
Interest on deposits33 36 47 67 96 
Interest on long-term debt151 147 148 165 152 
Interest on other borrowings15 14 13 13 
Total interest expense193 198 209 245 261 
Net Interest Income3,233 3,245 3,285 3,366 3,362 
Provision for credit losses(324)(434)48 177 421 
Net Interest Income After Provision for Credit Losses3,557 3,679 3,237 3,189 2,941 
Noninterest Income
Insurance income645 690 626 545 518 
Wealth management income356 345 341 332 324 
Service charges on deposits276 253 258 266 247 
Residential mortgage income179 117 100 193 221 
Investment banking and trading income301 317 340 308 244 
Card and payment related fees225 225 200 203 200 
Lending related fees74 94 100 105 77 
Operating lease income57 66 68 77 72 
Commercial real estate related income78 138 43 123 55 
Income from bank-owned life insurance43 46 50 44 46 
Securities gains (losses)— — — — 104 
Other income131 114 71 89 102 
Total noninterest income2,365 2,405 2,197 2,285 2,210 
Noninterest Expense
Personnel expense2,187 2,207 2,142 2,108 2,058 
Professional fees and outside processing372 341 350 393 323 
Net occupancy expense187 182 209 207 233 
Software expense251 246 210 215 221 
Amortization of intangibles145 142 144 172 170 
Equipment expense154 122 113 121 127 
Marketing and customer development94 66 66 58 75 
Operating lease depreciation47 47 50 54 56 
Loan-related expense52 55 54 65 59 
Regulatory costs43 31 25 32 34 
Merger-related and restructuring charges172 297 141 308 236 
Loss (gain) on early extinguishment of debt— — (3)— — 
Other expense91 275 109 100 163 
Total noninterest expense3,795 4,011 3,610 3,833 3,755 
Earnings
Income before income taxes2,127 2,073 1,824 1,641 1,396 
Provision for income taxes423 415 351 311 255 
Net income1,704 1,658 1,473 1,330 1,141 
Noncontrolling interests— (4)
Net income available to the bank holding company1,704 1,657 1,477 1,329 1,138 
Preferred stock dividends and other88 98 143 101 70 
Net income available to common shareholders$1,616 $1,559 $1,334 $1,228 $1,068 
Earnings Per Common Share
Basic$1.21 $1.16 $0.99 $0.91 $0.79 
Diluted1.20 1.16 0.98 0.90 0.79 
Weighted Average Shares Outstanding
Basic1,334,825 1,338,302 1,345,666 1,348,493 1,347,916 
Diluted1,346,854 1,349,492 1,358,932 1,361,763 1,358,122 

4 Truist Financial Corporation


Segment Financial Performance - Preliminary   
Quarter Ended
Sept. 30June 30March 31Dec. 31Sept. 30
(Dollars in millions)20212021202120202020
Consumer Banking and Wealth
Net interest income (expense)$1,667 $1,689 $1,754 $1,819 $1,858 
Net intersegment interest income (expense) 369 420 373 370 333 
Segment net interest income2,036 2,109 2,127 2,189 2,191 
Allocated provision for credit losses(5)(4)100 116 181 
Noninterest income1,032 925 920 997 997 
Noninterest expense1,933 1,931 1,916 1,956 1,937 
Income (loss) before income taxes1,140 1,107 1,031 1,114 1,070 
Provision (benefit) for income taxes268 259 241 263 252 
Segment net income (loss)$872 $848 $790 $851 $818 
Corporate and Commercial Banking
Net interest income (expense)$1,124 $1,181 $1,206 $1,270 $1,234 
Net intersegment interest income (expense) 49 46 20 25 49 
Segment net interest income1,173 1,227 1,226 1,295 1,283 
Allocated provision for credit losses(264)(399)(35)60 311 
Noninterest income753 808 693 788 608 
Noninterest expense820 842 775 835 845 
Income (loss) before income taxes1,370 1,592 1,179 1,188 735 
Provision (benefit) for income taxes295 349 252 261 149 
Segment net income (loss)$1,075 $1,243 $927 $927 $586 
Insurance Holdings
Net interest income (expense)$27 $25 $24 $26 $31 
Net intersegment interest income (expense) (2)(4)(4)(4)(7)
Segment net interest income25 21 20 22 24 
Allocated provision for credit losses(1)— 
Noninterest income652 698 633 562 524 
Noninterest expense537 515 479 451 446 
Income (loss) before income taxes139 205 173 131 102 
Provision (benefit) for income taxes34 49 42 32 25 
Segment net income (loss)$105 $156 $131 $99 $77 
Other, Treasury & Corporate (1)
Net interest income (expense)$415 $350 $301 $251 $239 
Net intersegment interest income (expense) (416)(462)(389)(391)(375)
Segment net interest income(1)(112)(88)(140)(136)
Allocated provision for credit losses(56)(30)(18)(1)(71)
Noninterest income(72)(26)(49)(62)81 
Noninterest expense505 723 440 591 527 
Income (loss) before income taxes(522)(831)(559)(792)(511)
Provision (benefit) for income taxes(174)(242)(184)(245)(171)
Segment net income (loss)$(348)$(589)$(375)$(547)$(340)
Total Truist Financial Corporation
Net interest income (expense)$3,233 $3,245 $3,285 $3,366 $3,362 
Net intersegment interest income (expense) — — — — — 
Segment net interest income3,233 3,245 3,285 3,366 3,362 
Allocated provision for credit losses(324)(434)48 177 421 
Noninterest income2,365 2,405 2,197 2,285 2,210 
Noninterest expense3,795 4,011 3,610 3,833 3,755 
Income (loss) before income taxes2,127 2,073 1,824 1,641 1,396 
Provision (benefit) for income taxes423 415 351 311 255 
Net income$1,704 $1,658 $1,473 $1,330 $1,141 
(1) Includes financial data from subsidiaries below the quantitative and qualitative thresholds requiring disclosure.

Truist Financial Corporation 5


Consolidated Ending Balance Sheets - Five Quarter Trend   
Sept. 30June 30March 31Dec. 31Sept. 30
(Dollars in millions)20212021202120202020
Assets
Cash and due from banks$4,656 $5,077 $5,097 $5,029 $4,194 
Interest-bearing deposits with banks15,171 21,480 27,035 13,839 32,914 
Securities borrowed or purchased under resale agreements 1,919 1,242 1,349 1,745 1,300 
Trading assets at fair value6,972 5,945 5,094 3,872 4,670 
Securities available for sale at fair value151,038 139,879 123,807 120,788 86,132 
Loans and leases:
Commercial:
Commercial and industrial128,992 130,924 135,432 138,354 140,874 
CRE24,309 25,399 25,899 26,595 27,474 
Commercial construction5,689 6,160 6,559 6,491 6,772 
Lease financing4,799 4,957 4,883 5,240 5,493 
Consumer:
Residential mortgage46,691 44,036 44,298 47,272 50,379 
Residential home equity and direct25,222 25,334 25,333 26,064 26,558 
Indirect auto26,923 26,696 26,438 26,150 25,269 
Indirect other11,155 11,039 10,631 11,177 11,527 
Student7,059 7,341 7,478 7,552 7,480 
Credit card4,683 4,599 4,560 4,839 4,801 
Total loans and leases held for investment285,522 286,485 291,511 299,734 306,627 
Loans held for sale5,133 3,009 5,668 6,059 5,522 
Total loans and leases290,655 289,494 297,179 305,793 312,149 
Allowance for loan and lease losses(4,702)(5,121)(5,662)(5,835)(5,863)
Premises and equipment3,719 3,699 3,787 3,870 3,968 
Goodwill24,891 24,374 24,356 24,447 23,869 
Core deposit and other intangible assets2,930 2,665 2,825 2,984 2,840 
Mortgage servicing rights2,584 2,231 2,365 2,023 1,991 
Other assets30,051 30,999 30,305 30,673 31,019 
Total assets$529,884 $521,964 $517,537 $509,228 $499,183 
Liabilities
Deposits:
Noninterest-bearing deposits$143,595 $138,623 $136,555 $127,629 $124,297 
Interest checking108,954 107,993 107,082 105,269 98,694 
Money market and savings136,633 134,118 132,733 126,238 121,856 
Time deposits16,675 17,545 19,192 21,941 25,900 
Total deposits405,857 398,279 395,562 381,077 370,747 
Short-term borrowings5,226 5,652 5,889 6,092 6,244 
Long-term debt37,837 37,969 37,753 39,597 41,008 
Other liabilities12,064 11,728 10,457 11,550 11,211 
Total liabilities460,984 453,628 449,661 438,316 429,210 
Shareholders' Equity:
Preferred stock6,673 6,673 7,124 8,048 8,048 
Common stock6,674 6,674 6,724 6,745 6,741 
Additional paid-in capital 34,977 34,898 35,360 35,843 35,774 
Retained earnings22,114 21,139 20,184 19,455 18,834 
Accumulated other comprehensive loss(1,538)(1,048)(1,516)716 470 
Noncontrolling interests— — — 105 106 
Total shareholders' equity68,900 68,336 67,876 70,912 69,973 
Total liabilities and shareholders' equity$529,884 $521,964 $517,537 $509,228 $499,183 

6 Truist Financial Corporation


Average Balance Sheets  
 Quarter EndedYear-to-Date
 September 30ChangeSeptember 30Change
(Dollars in millions)20212020$%20212020$%
Assets        
Securities available for sale at amortized cost:
U.S. Treasury$9,699 $2,218 $7,481 NM$6,872 $2,243 $4,629 NM
U.S. government-sponsored entities (GSE)1,830 1,842 (12)(0.7)1,837 1,847 (10)(0.5)
Mortgage-backed securities issued by GSE132,890 75,232 57,658 76.6 125,157 72,152 53,005 73.5 
States and political subdivisions425 499 (74)(14.8)435 512 (77)(15.0)
Non-agency mortgage-backed1,398 — 1,398 NM477 115 362 NM
Other30 37 (7)(18.9)32 37 (5)(13.5)
Total securities146,272 79,828 66,444 83.2 134,810 76,906 57,904 75.3 
Loans and leases:
Commercial:
Commercial and industrial130,025 143,452 (13,427)(9.4)133,218 142,731 (9,513)(6.7)
CRE24,849 27,761 (2,912)(10.5)25,563 27,538 (1,975)(7.2)
Commercial construction5,969 6,861 (892)(13.0)6,293 6,673 (380)(5.7)
Lease financing4,917 5,626 (709)(12.6)4,928 5,872 (944)(16.1)
Consumer:
Residential mortgage45,369 51,500 (6,131)(11.9)44,931 52,288 (7,357)(14.1)
Residential home equity and direct25,242 26,726 (1,484)(5.6)25,378 27,161 (1,783)(6.6)
Indirect auto26,830 24,732 2,098 8.5 26,547 24,809 1,738 7.0 
Indirect other11,112 11,530 (418)(3.6)10,920 11,255 (335)(3.0)
Student7,214 7,446 (232)(3.1)7,375 7,622 (247)(3.2)
Credit card4,632 4,810 (178)(3.7)4,610 5,097 (487)(9.6)
Total loans and leases held for investment286,159 310,444 (24,285)(7.8)289,763 311,046 (21,283)(6.8)
Loans held for sale4,179 5,247 (1,068)(20.4)4,485 5,575 (1,090)(19.6)
Total loans and leases290,338 315,691 (25,353)(8.0)294,248 316,621 (22,373)(7.1)
Interest earning trading assets5,809 4,056 1,753 43.2 5,208 4,695 513 10.9 
Other earning assets19,331 35,819 (16,488)(46.0)19,453 33,708 (14,255)(42.3)
Total earning assets461,750 435,394 26,356 6.1 453,719 431,930 21,789 5.0 
Nonearning assets64,935 65,432 (497)(0.8)64,444 65,780 (1,336)(2.0)
Total assets$526,685 $500,826 $25,859 5.2 %$518,163 $497,710 $20,453 4.1 %
Liabilities and Shareholders' Equity
Deposits:
Noninterest-bearing deposits$141,738 $123,966 $17,772 14.3 %$136,118 $110,375 $25,743 23.3 %
Interest checking107,802 96,707 11,095 11.5 106,234 93,205 13,029 14.0 
Money market and savings136,094 123,598 12,496 10.1 133,167 123,536 9,631 7.8 
Time deposits17,094 27,940 (10,846)(38.8)18,609 32,157 (13,548)(42.1)
Total deposits402,728 372,211 30,517 8.2 394,128 359,273 34,855 9.7 
Short-term borrowings5,360 6,209 (849)(13.7)6,081 11,350 (5,269)(46.4)
Long-term debt37,329 40,919 (3,590)(8.8)37,339 47,643 (10,304)(21.6)
Other liabilities11,915 11,853 62 0.5 11,262 12,133 (871)(7.2)
Total liabilities457,332 431,192 26,140 6.1 448,810 430,399 18,411 4.3 
Shareholders' equity69,353 69,634 (281)(0.4)69,353 67,311 2,042 3.0 
Total liabilities and shareholders' equity$526,685 $500,826 $25,859 5.2 %$518,163 $497,710 $20,453 4.1 %
Average balances exclude basis adjustments for fair value hedges.
NM - not meaningful

Truist Financial Corporation 7


Average Balance Sheets - Five Quarter Trend   
 Quarter Ended
 Sept. 30June 30March 31Dec. 31Sept. 30
(Dollars in millions)20212021202120202020
Assets     
Securities available for sale at amortized cost:     
U.S. Treasury$9,699 $9,070 $1,759 $2,049 $2,218 
U.S. government-sponsored entities (GSE)1,830 1,840 1,839 1,841 1,842 
Mortgage-backed securities issued by GSE132,890 124,251 118,171 97,660 75,232 
States and political subdivisions425 437 444 469 499 
Non-agency mortgage-backed1,398 17 — — — 
Other30 32 33 34 37 
Total securities146,272 135,647 122,246 102,053 79,828 
Loans and leases:
Commercial:
Commercial and industrial130,025 133,646 136,051 139,223 143,452 
CRE24,849 25,645 26,211 27,030 27,761 
Commercial construction5,969 6,359 6,557 6,616 6,861 
Lease financing4,917 4,893 4,975 5,401 5,626 
Consumer:
Residential mortgage45,369 43,605 45,823 48,847 51,500 
Residential home equity and direct25,242 25,238 25,658 26,327 26,726 
Indirect auto26,830 26,444 26,363 25,788 24,732 
Indirect other11,112 10,797 10,848 11,291 11,530 
Student7,214 7,396 7,519 7,519 7,446 
Credit card4,632 4,552 4,645 4,818 4,810 
Total loans and leases held for investment286,159 288,575 294,650 302,860 310,444 
Loans held for sale4,179 4,390 4,891 5,328 5,247 
Total loans and leases290,338 292,965 299,541 308,188 315,691 
Interest earning trading assets5,809 5,061 4,742 4,538 4,056 
Other earning assets19,331 21,592 17,417 23,887 35,819 
Total earning assets461,750 455,265 443,946 438,666 435,394 
Nonearning assets64,935 63,509 64,887 64,515 65,432 
Total assets$526,685 $518,774 $508,833 $503,181 $500,826 
Liabilities and Shareholders' Equity
Deposits:
Noninterest-bearing deposits$141,738 $137,892 $128,579 $127,103 $123,966 
Interest checking107,802 106,121 104,744 99,866 96,707 
Money market and savings136,094 134,029 129,303 124,692 123,598 
Time deposits17,094 18,213 20,559 23,605 27,940 
Total deposits402,728 396,255 383,185 375,266 372,211 
Short-term borrowings5,360 6,168 6,731 6,493 6,209 
Long-term debt37,329 36,873 37,820 40,284 40,919 
Other liabilities11,915 10,813 11,050 10,993 11,853 
Total liabilities457,332 450,109 438,786 433,036 431,192 
Shareholders' equity69,353 68,665 70,047 70,145 69,634 
Total liabilities and shareholders' equity$526,685 $518,774 $508,833 $503,181 $500,826 
Average balances exclude basis adjustments for fair value hedges.

8 Truist Financial Corporation


Average Balances and Rates - Quarters   
 Quarter Ended
 September 30, 2021June 30, 2021
 (1)(2) Interest(2)(1)(2) Interest(2)
 AverageIncome/Yields/AverageIncome/Yields/
(Dollars in millions)BalancesExpenseRatesBalancesExpenseRates
Assets      
Securities available for sale at amortized cost:
U.S. Treasury$9,699 $18 0.72 %$9,070 $16 0.73 %
U.S. government-sponsored entities (GSE)1,830 10 2.31 1,840 11 2.33 
Mortgage-backed securities issued by GSE132,890 509 1.53 124,251 466 1.50 
States and political subdivisions425 3.52 437 3.55 
Non-agency mortgage-backed1,398 2.20 17 — 2.46 
Other30 — 1.90 32 — 1.88 
Total securities146,272 549 1.50 135,647 497 1.47 
Loans and leases:
Commercial:
Commercial and industrial130,025 981 3.00 133,646 1,024 3.07 
CRE24,849 181 2.86 25,645 183 2.84 
Commercial construction5,969 42 2.96 6,359 45 2.95 
Lease financing4,917 42 3.39 4,893 48 3.91 
Consumer:
Residential mortgage45,369 450 3.96 43,605 474 4.35 
Residential home equity and direct25,242 360 5.67 25,238 361 5.74 
Indirect auto26,830 405 5.99 26,444 409 6.20 
Indirect other11,112 183 6.54 10,797 185 6.86 
Student7,214 74 4.02 7,396 72 3.90 
Credit card4,632 105 9.01 4,552 99 8.73 
Total loans and leases held for investment286,159 2,823 3.92 288,575 2,900 4.03 
Loans held for sale4,179 28 2.69 4,390 28 2.57 
Total loans and leases290,338 2,851 3.90 292,965 2,928 4.01 
Interest earning trading assets5,809 41 2.81 5,061 37 2.82 
Other earning assets19,331 13 0.25 21,592 0.19 
Total earning assets461,750 3,454 2.98 455,265 3,471 3.06 
Nonearning assets64,935 63,509 
Total assets$526,685 $518,774 
Liabilities and Shareholders' Equity
Interest-bearing deposits:      
Interest checking$107,802 14 0.05 $106,121 15 0.06 
Money market and savings136,094 0.03 134,029 0.03 
Time deposits17,094 10 0.23 18,213 13 0.28 
Total interest-bearing deposits (3)260,990 33 0.05 258,363 36 0.06 
Short-term borrowings5,360 0.68 6,168 15 0.98 
Long-term debt37,329 151 1.61 36,873 147 1.60 
Total interest-bearing liabilities303,679 193 0.25 301,404 198 0.26 
Noninterest-bearing deposits (3)141,738 137,892 
Other liabilities11,915 10,813 
Shareholders' equity69,353 68,665 
Total liabilities and shareholders' equity$526,685 $518,774 
Average interest-rate spread2.73 2.80 
Net interest income/ net interest margin - taxable equivalent$3,261 2.81 %$3,273 2.88 %
Taxable-equivalent adjustment$28 $28 
Applicable ratios are annualized.
(1) Excludes basis adjustments for fair value hedges.
(2) Amounts are on a taxable-equivalent basis utilizing the federal income tax rate of 21% for the periods presented. Interest income includes certain fees, deferred costs, and dividends.
(3) Total deposit costs were 0.03% and 0.04% for the three months ended September 30, 2021 and June 30, 2021, respectively.

Truist Financial Corporation 9


Average Balances and Rates - Quarters
 Quarter Ended
 March 31, 2021December 31, 2020September 30, 2020
 (1)(2) Interest(2)(1)(2) Interest(2)(1)(2) Interest(2)
 AverageIncome/Yields/AverageIncome/Yields/AverageIncome/Yields/
(Dollars in millions)BalancesExpenseRatesBalancesExpenseRatesBalancesExpenseRates
Assets         
Securities available for sale at amortized cost:
U.S. Treasury$1,759 $0.89 %$2,049 $1.62 %$2,218 $10 1.78 %
U.S. government-sponsored entities (GSE)1,839 11 2.33 1,841 11 2.33 1,842 10 2.33 
Mortgage-backed securities issued by GSE118,171 426 1.44 97,660 385 1.58 75,232 366 1.95 
States and political subdivisions444 3.52 469 3.52 499 5.03 
Other33 — 1.92 34 — 1.98 37 1.99 
Total securities122,246 445 1.45 102,053 408 1.60 79,828 394 1.97 
Loans and leases:
Commercial:
Commercial and industrial136,051 1,040 3.10 139,223 1,091 3.12 143,452 1,087 3.02 
CRE26,211 189 2.90 27,030 197 2.88 27,761 203 2.88 
Commercial construction6,557 48 3.04 6,616 51 3.13 6,861 55 3.26 
Lease financing4,975 53 4.28 5,401 65 4.82 5,626 52 3.71 
Consumer:
Residential mortgage45,823 507 4.42 48,847 542 4.44 51,500 576 4.47 
Residential home equity and direct25,658 368 5.81 26,327 388 5.86 26,726 394 5.86 
Indirect auto26,363 426 6.56 25,788 416 6.41 24,732 405 6.51 
Indirect other10,848 187 6.98 11,291 195 6.87 11,530 204 7.05 
Student7,519 73 3.96 7,519 80 4.23 7,446 80 4.30 
Credit card4,645 106 9.24 4,818 114 9.35 4,810 109 9.03 
Total loans and leases held for investment294,650 2,997 4.11 302,860 3,139 4.13 310,444 3,165 4.06 
Loans held for sale4,891 32 2.59 5,328 47 3.54 5,247 37 2.78 
Total loans and leases299,541 3,029 4.09 308,188 3,186 4.12 315,691 3,202 4.04 
Interest earning trading assets4,742 32 2.79 4,538 33 2.89 4,056 32 3.23 
Other earning assets17,417 16 0.37 23,887 12 0.20 35,819 24 0.26 
Total earning assets443,946 3,522 3.20 438,666 3,639 3.31 435,394 3,652 3.34 
Nonearning assets64,887 64,515 65,432 
Total assets$508,833 $503,181 $500,826 
Liabilities and Shareholders' Equity        
Interest-bearing deposits:
Interest checking$104,744 15 0.06 $99,866 17 0.07 $96,707 15 0.06 
Money market and savings129,303 10 0.03 124,692 10 0.03 123,598 19 0.06 
Time deposits20,559 22 0.44 23,605 40 0.66 27,940 62 0.89 
Total interest-bearing deposits (3)254,606 47 0.07 248,163 67 0.11 248,245 96 0.15 
Short-term borrowings6,731 14 0.82 6,493 13 0.77 6,209 13 0.85 
Long-term debt37,820 148 1.57 40,284 165 1.64 40,919 152 1.48 
Total interest-bearing liabilities299,157 209 0.28 294,940 245 0.33 295,373 261 0.35 
Noninterest-bearing deposits (3)128,579 127,103 123,966 
Other liabilities11,050 10,993 11,853 
Shareholders' equity70,047 70,145 69,634 
Total liabilities and shareholders' equity$508,833 $503,181 $500,826 
Average interest-rate spread2.92 2.98 2.99 
Net interest income/ net interest margin - taxable equivalent$3,313 3.01 %$3,394 3.08 %$3,391 3.10 %
Taxable-equivalent adjustment$28 $28 $29 
Applicable ratios are annualized.
(1) Excludes basis adjustments for fair value hedges.
(2) Amounts are on a taxable-equivalent basis utilizing the federal income tax rate of 21% for the periods presented. Interest income includes certain fees, deferred costs, and dividends.
(3) Total deposit costs were 0.05%, 0.07%, and 0.10% for the three months ended March 31, 2021, December 31, 2020, and September 30, 2020, respectively.

10 Truist Financial Corporation


Average Balances and Rates - Year-To-Date   
 Year-to-Date
 September 30, 2021September 30, 2020
 (1)(2) Interest(2)(1)(2) Interest(2)
 AverageIncome/Yields/AverageIncome/Yields/
(Dollars in millions)BalancesExpenseRatesBalancesExpenseRates
Assets      
Securities available for sale at amortized cost:
U.S. Treasury$6,872 $38 0.74 %$2,243 $31 1.86 %
U.S. government-sponsored entities (GSE)1,837 32 2.32 1,847 32 2.33 
Mortgage-backed securities issued by GSE125,157 1,401 1.49 72,152 1,240 2.29 
States and political subdivisions435 12 3.53 512 16 4.04 
Non-agency mortgage-backed477 2.18 115 15 16.78 
Other32 — 1.90 37 2.44 
Total securities134,810 1,491 1.48 76,906 1,335 2.31 
Loans and leases:
Commercial:
Commercial and industrial133,218 3,045 3.06 142,731 3,710 3.47 
CRE25,563 553 2.86 27,538 717 3.46 
Commercial construction6,293 135 2.98 6,673 192 3.92 
Lease financing4,928 143 3.86 5,872 187 4.24 
Consumer:
Residential mortgage44,931 1,431 4.25 52,288 1,778 4.53 
Residential home equity and direct25,378 1,089 5.74 27,161 1,237 6.08 
Indirect auto26,547 1,240 6.25 24,809 1,240 6.68 
Indirect other10,920 555 6.79 11,255 606 7.19 
Student7,375 219 3.96 7,622 271 4.75 
Credit card4,610 310 8.99 5,097 356 9.34 
Total loans and leases held for investment289,763 8,720 4.02 311,046 10,294 4.42 
Loans held for sale4,485 88 2.61 5,575 126 3.00 
Total loans and leases294,248 8,808 4.00 316,621 10,420 4.39 
Interest earning trading assets5,208 110 2.80 4,695 135 3.85 
Other earning assets19,453 38 0.26 33,708 144 0.57 
Total earning assets453,719 10,447 3.08 431,930 12,034 3.72 
Nonearning assets64,444 65,780 
Total assets$518,163 $497,710 
Liabilities and Shareholders' Equity    
Interest-bearing deposits:
Interest checking$106,234 44 0.06 $93,205 199 0.28 
Money market and savings133,167 27 0.03 123,536 254 0.27 
Time deposits18,609 45 0.32 32,157 265 1.10 
Total interest-bearing deposits (3)258,010 116 0.06 248,898 718 0.39 
Short-term borrowings6,081 38 0.84 11,350 124 1.46 
Long-term debt37,339 446 1.59 47,643 635 1.78 
Total interest-bearing liabilities301,430 600 0.27 307,891 1,477 0.64 
Noninterest-bearing deposits (3)136,118 110,375 
Other liabilities11,262 12,133 
Shareholders' equity69,353 67,311 
Total liabilities and shareholders' equity$518,163 $497,710 
Average interest-rate spread2.81 3.08 
Net interest income/ net interest margin - taxable equivalent$9,847 2.90 %$10,557 3.26 %
Taxable-equivalent adjustment$84 $97 
Applicable ratios are annualized.
(1) Excludes basis adjustments for fair value hedges.
(2) Amounts are on a taxable-equivalent basis utilizing the federal income tax rate of 21% for the periods presented. Interest income includes certain fees, deferred costs, and dividends.
(3) Total deposit costs were 0.04% and 0.27% for the nine months ended September 30, 2021 and 2020, respectively.

Truist Financial Corporation 11


Credit Quality   
 Sept. 30June 30March 31Dec. 31Sept. 30
(Dollars in millions)20212021202120202020
Nonperforming Assets     
Nonaccrual loans and leases:     
Commercial:     
Commercial and industrial$411 $397 $451 $532 $507 
CRE20 25 58 75 52 
Commercial construction12 13 14 
Lease financing12 23 28 32 
Consumer:
Residential mortgage306 302 290 316 205 
Residential home equity and direct146 165 172 205 180 
Indirect auto172 148 158 155 137 
Indirect other
Total nonaccrual loans and leases held for investment1,080 1,060 1,171 1,330 1,124 
Loans held for sale76 78 72 130 
Total nonaccrual loans and leases1,156 1,138 1,243 1,335 1,254 
Foreclosed real estate13 18 20 30 
Other foreclosed property39 41 38 32 30 
Total nonperforming assets$1,204 $1,192 $1,299 $1,387 $1,314 
Troubled Debt Restructurings (TDRs)     
Performing TDRs:
Commercial:     
Commercial and industrial$144 $144 $142 $78 $84 
CRE24 47 47 36 
Commercial construction— — — — 
Lease financing56 58 59 60 
Consumer:
Residential mortgage712 727 733 648 640 
Residential home equity and direct105 107 109 88 71 
Indirect auto390 389 399 392 336 
Indirect other
Student23 13 
Credit card30 32 35 37 38 
Total performing TDRs1,475 1,501 1,539 1,361 1,217 
Nonperforming TDRs159 190 207 164 140 
Total TDRs$1,634 $1,691 $1,746 $1,525 $1,357 
Loans 90 Days or More Past Due and Still Accruing
Commercial:
Commercial and industrial$$14 $14 $13 $
CRE— — — — 
Lease financing16 — — — — 
Consumer:
Residential mortgage852 976 975 841 573 
Residential home equity and direct11 10 
Indirect auto
Indirect other
Student968 1,046 1,037 1,111 570 
Credit card23 22 32 29 24 
Total loans 90 days past due and still accruing$1,872 $2,068 $2,072 $2,008 $1,197 
Loans 30-89 Days Past Due
Commercial:
Commercial and industrial$131 $128 $117 $83 $155 
CRE14 
Commercial construction— 
Lease financing18 35 
Consumer:
Residential mortgage495 543 577 782 796 
Residential home equity and direct81 73 82 98 103 
Indirect auto560 428 328 495 321 
Indirect other53 47 45 68 52 
Student456 548 556 618 666 
Credit card37 31 35 51 39 
Total loans 30-89 days past due $1,823 $1,824 $1,788 $2,220 $2,148 

12 Truist Financial Corporation


As of/For the Quarter Ended
 Sept. 30June 30March 31Dec. 31Sept. 30
(Dollars in millions)20212021202120202020
Allowance for Credit Losses     
Beginning balance$5,436 $6,011 $6,199 $6,229 $6,133 
Provision for credit losses(324)(434)48 177 421 
Charge-offs:
Commercial:
Commercial and industrial(57)(51)(73)(84)(112)
CRE(1)— (4)(19)(44)
Commercial construction— — (2)(8)(19)
Lease financing— (2)(6)(4)(44)
Consumer:
Residential mortgage(7)(4)(11)(6)(4)
Residential home equity and direct(51)(57)(55)(46)(52)
Indirect auto(73)(69)(105)(84)(72)
Indirect other(13)(11)(17)(14)(8)
Student(6)(3)(3)(3)(6)
Credit card(31)(42)(40)(35)(44)
Total charge-offs(239)(239)(316)(303)(405)
Recoveries:     
Commercial:     
Commercial and industrial21 20 19 34 20 
CRE— 
Commercial construction
Lease financing21 — — 
Consumer:
Residential mortgage
Residential home equity and direct20 20 18 20 16 
Indirect auto22 27 22 24 22 
Indirect other
Student— — — — 
Credit card10 10 
Total recoveries104 97 78 98 79 
Net charge-offs(135)(142)(238)(205)(326)
Other(2)
Ending balance$4,978 $5,436 $6,011 $6,199 $6,229 
Allowance for Credit Losses:     
Allowance for loan and lease losses (excluding PCD loans)$4,577 $4,979 $5,506 $5,668 $5,675 
Allowance for PCD loans125 142 156 167 188 
Reserve for unfunded lending commitments (RUFC)276 315 349 364 366 
Total$4,978 $5,436 $6,011 $6,199 $6,229 
Truist Financial Corporation 13


    As of/For the Year-to-Date
    Period Ended Sept. 30
(Dollars in millions)   20212020
Allowance for Credit Losses   
Beginning balance   $6,199 $1,889 
CECL adoption - impact to retained earnings before tax— 2,762 
CECL adoption - reserves on PCD assets— 378 
Provision for credit losses   (710)2,158 
Charge-offs:   
Commercial:   
Commercial and industrial   (181)(274)
CRE   (5)(59)
Commercial construction(2)(22)
Lease financing   (8)(50)
Consumer:
Residential mortgage   (22)(50)
Residential home equity and direct   (163)(185)
Indirect auto   (247)(294)
Indirect other(41)(46)
Student(12)(20)
Credit card   (113)(147)
Total charge-offs   (794)(1,147)
Recoveries:     
Commercial:     
Commercial and industrial   60 58 
CRE   
Commercial construction10 
Lease financing   24 
Consumer:
Residential mortgage   10 
Residential home equity and direct   58 46 
Indirect auto   71 63 
Indirect other18 18 
Student
Credit card   28 22 
Total recoveries   279 233 
Net charge-offs   (515)(914)
Other(44)
Ending balance   $4,978 $6,229 

As of/For the Quarter Ended
 Sept. 30June 30March 31Dec. 31Sept. 30
 20212021202120202020
Asset Quality Ratios     
Loans 30-89 days past due and still accruing as a percentage of loans and leases0.64 %0.64 %0.61 %0.74 %0.70 %
Loans 90 days or more past due and still accruing as a percentage of loans and leases0.66 0.72 0.71 0.67 0.39 
Nonperforming loans and leases as a percentage of loans and leases held for investment0.38 0.37 0.40 0.44 0.37 
Nonperforming loans and leases as a percentage of loans and leases (1)0.40 0.39 0.42 0.44 0.40 
Nonperforming assets as a percentage of:
Total assets (1)0.23 0.23 0.25 0.27 0.26 
Loans and leases plus foreclosed property0.40 0.39 0.42 0.46 0.39 
Net charge-offs as a percentage of average loans and leases (2)0.19 0.20 0.33 0.27 0.42 
Allowance for loan and lease losses as a percentage of loans and leases1.65 1.79 1.94 1.95 1.91 
Ratio of allowance for loan and lease losses to:
Net charge-offs8.79X8.98X5.87X7.15X4.52X
Nonperforming loans and leases4.35X4.83X4.84X4.39X5.22X
Asset Quality Ratios (Excluding PPP and other Government Guaranteed)
Loans 90 days or more past due and still accruing as a percentage of loans and leases0.03 %0.04 %0.04 %0.04 %0.03 %
Applicable ratios are annualized.
(1)Includes loans held for sale.
(2)The third quarter of 2020 includes $97 million of charge-offs on PCD assets directly related to the implementation of CECL.
    As of/For the Year-to-Date
    Period Ended Sept. 30
    20212020
Asset Quality Ratios     
Net charge-offs as a percentage of average loans and leases   0.24 %0.39 %
Ratio of allowance for loan and lease losses to net charge-offs   6.83X4.80X
Applicable ratios are annualized.

14 Truist Financial Corporation


 September 30, 2021
  Past Due 30-89Past Due 90+ 
(Dollars in millions)Current StatusDaysDaysTotal
Troubled Debt Restructurings
Performing TDRs: (1)      
Commercial:      
Commercial and industrial$144 100.0 %$— — %$— — %$144 
CRE100.0 — — — — 
Lease financing56 100.0 — — — — 56 
Consumer:
Residential mortgage482 67.7 81 11.4 149 20.9 712 
Residential home equity and direct101 96.2 3.8 — — 105 
Indirect auto320 82.1 70 17.9 — — 390 
Indirect other85.7 14.3 — — 
Student22 95.7 4.3 — — 23 
Credit card26 86.7 10.0 3.3 30 
Total performing TDRs (1)1,165 78.9 160 10.9 150 10.2 1,475 
Nonperforming TDRs (2)49 30.8 17 10.7 93 58.5 159 
Total TDRs (1)(2)$1,214 74.3 %$177 10.8 %$243 14.9 %$1,634 
(1)Past due performing TDRs are included in past due disclosures.
(2)Nonperforming TDRs are included in nonaccrual loan disclosures.
Quarter Ended
 Sept. 30June 30March 31Dec. 31Sept. 30
 20212021202120202020
Net Charge-offs as a Percentage of Average Loans and Leases:     
Commercial:     
Commercial and industrial0.04 %0.09 %0.16 %0.15 %0.25 %
CRE— (0.05)0.04 0.27 0.63 
Commercial construction(0.06)(0.06)0.08 0.39 1.02 
Lease financing0.04 (0.04)0.44 0.20 2.92 
Consumer:
Residential mortgage0.04 (0.01)0.08 0.03 0.01 
Residential home equity and direct0.49 0.59 0.58 0.39 0.53 
Indirect auto0.75 0.63 1.28 0.92 0.76 
Indirect other0.26 0.17 0.39 0.31 0.21 
Student0.31 0.16 0.16 0.17 0.28 
Credit card1.90 2.75 2.74 2.11 3.00 
Total loans and leases0.19 0.20 0.33 0.27 0.42 
Applicable ratios are annualized.  

Credit Quality - Allowance with Fair Value Marks
As of/For the Quarter Ended
Sept. 30June 30March 31Dec. 31Sept. 30
(Dollars in millions)20212021202120202020
ALLL$4,702 $5,121 $5,662 $5,835 $5,863 
Unamortized fair value mark (1)1,540 1,777 2,067 2,395 2,676 
Allowance plus unamortized fair value mark$6,242 $6,898 $7,729 $8,230 $8,539 
Loans and leases held for investment$285,522 $286,485 $291,511 $299,734 $306,627 
Unamortized fair value mark (1)1,540 1,777 2,067 2,395 2,676 
Gross loans and leases$287,062 $288,262 $293,578 $302,129 $309,303 
Allowance for loan and lease losses as a percentage of loans and leases - GAAP1.65 %1.79 %1.94 %1.95 %1.91 %
Allowance for loan and lease losses and unamortized fair value mark as a percentage of gross loans and leases - Adjusted (1) (2)2.17 2.39 2.63 2.72 2.76 
(1)Unamortized fair value mark includes credit, interest rate and liquidity components.
(2)Allowance for loan and lease losses and unamortized fair value mark as a percentage of gross loans and leases is a non-GAAP measurement of credit reserves that is calculated by adjusting the ALLL and loans and leases held for investment by the unamortized fair value mark. Truist's management uses these measures to assess loss absorption capacity.
Truist Financial Corporation 15


Rollforward of Intangible Assets and Selected Fair Value Marks (1)
 As of/For the Quarter Ended
Sept. 30June 30March 31Dec. 31Sept. 30
(Dollars in millions)20212021202120202020
Loans and Leases (2)
Beginning balance unamortized fair value mark$(1,777)$(2,067)$(2,395)$(2,676)$(3,077)
Accretion233 285 316 356 367 
Purchase accounting adjustments and other activity12 (75)34 
Ending balance$(1,540)$(1,777)$(2,067)$(2,395)$(2,676)
Core deposit and other intangible assets
Beginning balance$2,665 $2,825 $2,984 $2,840 $3,016 
Additions - acquisitions418 — 14 320 — 
Amortization of intangibles(145)(142)(144)(172)(170)
Amortization in net occupancy expense(4)(3)(3)(4)(6)
Purchase accounting adjustments and other activity(4)(15)(26)— — 
Ending balance$2,930 $2,665 $2,825 $2,984 $2,840 
Deposits (3)
Beginning balance unamortized fair value mark$(12)$(15)$(19)$(26)$(37)
Amortization11 
Ending balance$(9)$(12)$(15)$(19)$(26)
Long-Term Debt (3)
Beginning balance unamortized fair value mark$(176)$(196)$(216)$(238)$(262)
Amortization19 20 20 22 24 
Ending balance$(157)$(176)$(196)$(216)$(238)
(1)Includes the merger with SunTrust. This summary includes only selected information and does not represent all purchase accounting adjustments.
(2)Purchase accounting marks on loans and leases includes credit, interest and liquidity components, and are generally recognized using the level-yield or straight-line method over the remaining life of the individual loans or recognized in full in the event of prepayment.
(3)Purchase accounting marks on liabilities represents interest rate marks on time deposits and long-term debt and are recognized using the level-yield method over the term of the liability.

Capital Information - Five Quarter Trend
 As of/For the Quarter Ended
 Sept. 30June 30March 31Dec. 31Sept. 30
(Dollars in millions, except per share data, shares in thousands)20212021202120202020
Selected Capital Information(preliminary)    
Risk-based capital:     
Common equity tier 1$38,859 $38,690 $38,267 $37,869 $37,879 
Tier 145,530 45,360 45,388 45,915 45,925 
Total53,230 53,640 54,245 55,011 55,030 
Risk-weighted assets383,073 379,044 378,458 379,153 377,420 
Average quarterly assets for leverage ratio503,224 496,391 484,961 478,608 476,868 
Average quarterly assets for supplementary leverage ratio585,484 576,734 546,470 530,716 513,230 
Risk-based capital ratios:
Common equity tier 110.1 %10.2 %10.1 %10.0 %10.0 %
Tier 111.9 12.0 12.0 12.1 12.2 
Total13.9 14.2 14.3 14.5 14.6 
Leverage capital ratio9.0 9.1 9.4 9.6 9.6 
Supplementary leverage7.8 7.9 8.3 8.7 8.9 
Equity as a percentage of total assets13.0 13.1 13.1 13.9 14.0 
Common equity per common share$46.62 $46.20 $45.17 $46.52 $45.86 
Sept. 30June 30March 31Dec. 31Sept. 30
(Dollars in millions, except per share data, shares in thousands)20212021202120202020
Calculations of Tangible Common Equity and Related Measures: (1)
Total shareholders' equity$68,900 $68,336 $67,876 $70,912 $69,973 
Less:
Preferred stock6,673 6,673 7,124 8,048 8,048 
Noncontrolling interests— — — 105 106 
Intangible assets, net of deferred taxes27,066 26,296 26,413 26,629 25,923 
Tangible common equity$35,161 $35,367 $34,339 $36,130 $35,896 
Outstanding shares at end of period (in thousands)1,334,892 1,334,770 1,344,845 1,348,961 1,348,118 
Tangible Common Equity Per Common Share$26.34 $26.50 $25.53 $26.78 $26.63 
(1)Tangible common equity and related measures are non-GAAP measures that exclude the impact of intangible assets, net of deferred taxes, and their related amortization. These measures are useful for evaluating the performance of a business consistently, whether acquired or developed internally. Truist’s management uses these measures to assess the quality of capital and returns relative to balance sheet risk. These measures are not necessarily comparable to similar measures that may be presented by other companies.
16 Truist Financial Corporation


Selected Mortgage Banking Information & Additional Information
 As of/For the Quarter Ended
Sept. 30June 30March 31Dec. 31Sept. 30
(Dollars in millions, except per share data)20212021202120202020
Residential Mortgage Income
Residential mortgage production revenue$139 $122 $140 $229 $339 
Residential mortgage servicing revenue157 139 141 150 152 
Realization of expected residential MSR cash flows(146)(175)(208)(209)(212)
Residential mortgage income before MSR valuation150 86 73 170 279 
Income statement impact of mortgage servicing rights valuation:     
MSRs fair value increase (decrease) 77 (188)360 62 (54)
MSRs hedge gains (losses) (48)219 (333)(39)(4)
Net MSRs valuation29 31 27 23 (58)
Total residential mortgage income$179 $117 $100 $193 $221 
Commercial Real Estate Related Income
Commercial mortgage production revenue$72 $131 $40 $117 $49 
Commercial mortgage servicing revenue17 17 17 16 16 
Realization of expected commercial MSR cash flows(11)(11)(15)(11)(10)
Commercial real estate related income before MSR valuation78 137 42 122 55 
Income statement impact of mortgage servicing rights valuation:
MSRs fair value increase (decrease) (4)13 
MSRs hedge gains (losses) (1)(12)(2)(1)
Net MSRs valuation— — 
Commercial real estate related income$78 $138 $43 $123 $55 
Other Mortgage Banking Information
Residential mortgage loan originations$15,852 $14,301 $13,075 $13,235 $15,346 
Residential mortgage servicing portfolio (1):     
Loans serviced for others198,119 178,004 179,836 188,341 198,881 
Bank-owned loans serviced50,427 46,031 48,800 50,693 54,587 
Total servicing portfolio248,546 224,035 228,636 239,034 253,468 
Weighted-average coupon rate on mortgage loans serviced for others3.49 %3.66 %3.76 %3.84 %3.92 %
Weighted-average servicing fee on mortgage loans serviced for others0.31 0.31 0.31 0.32 0.32 
Additional Information
NQDC plan income (expense):
Interest income$$$$$
Other income30 43 23 32 49 
Personnel expense(32)(45)(32)(33)(51)
Total NQDC plan income (expense) $— $— $— $— $— 
Fair value of derivatives, net$2,375 $2,614 $2,222 $3,282 $3,646 
CVA/DVA income (expense) included in investment banking and trading income16 (12)48 21 (2)
Common stock prices:
High60.74 62.89 61.26 49.72 42.04 
Low51.87 52.61 46.71 37.86 33.47 
End of period58.65 55.50 58.32 47.93 38.05 
Banking offices2,518 2,557 2,556 2,781 2,884 
ATMs3,684 3,779 3,807 4,082 4,237 
FTEs (2)52,675 52,248 53,207 53,693 55,000 
(1)Amounts reported are unpaid principal balance.
(2)FTEs represents an average for the quarter.
Truist Financial Corporation 17


Selected Items (1)
 Favorable (Unfavorable)
(Dollars in millions)After-Tax at
DescriptionPre-TaxMarginal Rate
Selected Items
Third Quarter 2021
Incremental operating expenses related to the merger ($132 million professional fees and outside processing, $41 million personnel expense, and $18 million other)$(191)$(147)
Professional fee accrual(30)(23)
Second Quarter 2021
Charitable contribution$(200)$(153)
Incremental operating expenses related to the merger ($137 million professional fees and outside processing, $42 million personnel expense, and $11 million other)(190)(146)
First Quarter 2021
Incremental operating expenses related to the merger ($120 million professional fees and outside processing, $42 million personnel expense, and $13 million other)$(175)$(134)
Acceleration for cash flow hedge unwind(36)(28)
Fourth Quarter 2020
Incremental operating expenses related to the merger ($124 million in professional fees and outside processing, $47 million in personnel expense, and $8 million in other expense)$(179)$(138)
Third Quarter 2020
Incremental operating expenses related to the merger ($99 million in professional fees and outside processing, $48 million in personnel expense, and $5 million in other expense)$(152)$(115)
Charitable contribution(50)(38)
Second Quarter 2020
Incremental operating expenses related to the merger ($64 million in professional fees and outside processing, $49 million in personnel expense, and $16 million in other expense)$(129)$(99)
First Quarter 2020
Incremental operating expenses related to the merger ($44 million in personnel expense, $20 million in professional fees and outside processing, and $10 million in other expense)$(74)$(57)
(1)Includes costs not classified as merger-related and restructuring charges that are excluded from adjusted disclosures.

Non-GAAP Reconciliations   
Quarter EndedYear-to-Date
 Sept. 30June 30March 31Dec. 31Sept. 30Sept. 30Sept. 30
(Dollars in millions)2021202120212020202020212020
Efficiency Ratio (1)
Efficiency Ratio Numerator - Noninterest Expense - GAAP
$3,795 $4,011 $3,610 $3,833 $3,755 $11,416 $11,064 
Merger-related and restructuring charges, net(172)(297)(141)(308)(236)(610)(552)
Gain (loss) on early extinguishment of debt— — — — (235)
Incremental operating expense related to the merger(191)(190)(175)(179)(152)(556)(355)
Amortization of intangibles(145)(142)(144)(172)(170)(431)(513)
Charitable contribution— (200)— — (50)(200)(50)
Professional fee accrual(30)— — — — (30)— 
Acceleration for cash flow hedge unwind— — (36)— — (36)— 
Efficiency Ratio Numerator - Adjusted$3,257 $3,182 $3,117 $3,174 $3,147 $9,556 $9,359 
Efficiency Ratio Denominator - Revenue (2) - GAAP
$5,598 $5,650 $5,482 $5,651 $5,572 $16,730 $17,054 
Taxable equivalent adjustment28 28 28 28 29 84 97 
Securities (gains) losses— — — — (104)— (402)
Gains on divestiture of certain businesses— — (37)— — (37)— 
Efficiency Ratio Denominator - Adjusted$5,626 $5,678 $5,473 $5,679 $5,497 $16,777 $16,749 
Efficiency Ratio - GAAP67.8 %71.0 %65.8 %67.8 %67.4 %68.2 %64.9 %
Efficiency Ratio - Adjusted57.9 56.1 56.9 55.9 57.3 57.0 55.9 
(1)The adjusted efficiency ratio is non-GAAP in that it excludes securities gains (losses), amortization of intangible assets, merger-related and restructuring charges, and other selected items. Truist's management uses this measure in their analysis of the Corporation's performance. Truist's management believes this measure provides a greater understanding of ongoing operations and enhances comparability of results with prior periods, as well as demonstrates the effects of significant gains and charges. These measures are not necessarily comparable to similar measures that may be presented by other companies.
(2)Revenue is defined as net interest income plus noninterest income.
18 Truist Financial Corporation


 Quarter EndedYear-to-Date
 Sept. 30June 30March 31Dec. 31Sept. 30Sept. 30Sept. 30
(Dollars in millions)2021202120212020202020212020
Return on Average Tangible Common Shareholders' Equity (1)
Net income available to common shareholders$1,616 $1,559 $1,334 $1,228 $1,068 $4,509 $2,956 
Plus: Amortization of intangibles, net of tax113 107 111 131 130 331 393 
Tangible net income available to common shareholders$1,729 $1,666 $1,445 $1,359 $1,198 $4,840 $3,349 
Average common shareholders' equity$62,680 $61,709 $62,252 $61,991 $61,804 $62,215 $61,173 
Less: Average intangible assets, net of deferred taxes27,149 26,366 26,535 25,930 25,971 26,686 26,186 
Average tangible common shareholders' equity$35,531 $35,343 $35,717 $36,061 $35,833 $35,529 $34,987 
Return on average common shareholders' equity10.2 %10.1 %8.7 %7.9 %6.9 %9.7 %6.5 %
Return on average tangible common shareholders' equity19.3 18.9 16.4 15.0 13.3 18.2 12.8 
(1)Tangible common equity and related measures are non-GAAP measures that exclude the impact of intangible assets, net of deferred taxes, and their related amortization. These measures are useful for evaluating the performance of a business consistently, whether acquired or developed internally. Truist’s management uses these measures to assess the quality of capital and returns relative to balance sheet risk. These measures are not necessarily comparable to similar measures that may be presented by other companies.

 Quarter EndedYear-to-Date
 Sept. 30June 30March 31Dec. 31Sept. 30Sept. 30Sept. 30
(Dollars in millions, except per share data)2021202120212020202020212020
Diluted EPS (1)
Net income available to common shareholders - GAAP
$1,616 $1,559 $1,334 $1,228 $1,068 $4,509 $2,956 
Merger-related and restructuring charges132 228 108 237 181 468 423 
Securities (gains) losses— — — — (80)— (308)
Loss (gain) on early extinguishment of debt— (1)(2)— — (3)180 
Incremental operating expenses related to the merger147 146 134 138 115 427 271 
Charitable contribution— 153 — — 38 153 38 
Professional fee accrual23 — — — — 23 — 
Acceleration for cash flow hedge unwind— — 28 — — 28 — 
Net income available to common shareholders - adjusted$1,918 $2,085 $1,602 $1,603 $1,322 $5,605 $3,560 
Weighted average shares outstanding - diluted
1,346,854 1,349,492 1,358,932 1,361,763 1,358,122 1,351,712 1,357,174 
Diluted EPS - GAAP$1.20 $1.16 $0.98 $0.90 $0.79 $3.34 $2.18 
Diluted EPS - adjusted1.42 1.55 1.18 1.18 0.97 4.15 2.62 
(1)The adjusted diluted earnings per share is non-GAAP in that it excludes merger-related and restructuring charges and other selected items, net of tax. Truist's management uses this measure in their analysis of the Corporation's performance. Truist's management believes this measure provides a greater understanding of ongoing operations and enhances comparability of results with prior periods, as well as demonstrates the effects of significant gains and charges.
Truist Financial Corporation 19
Third Quarter 2021 Earnings Conference Call Bill Rogers – CEO Daryl Bible – CFO October 15, 2021


2 This presentation contains “forward-looking statements” within the meaning of the Private Securities Litigation Reform Act of 1995, regarding the financial condition, results of operations, business plans and the future performance of Truist. Words such as “anticipates,” “believes,” “estimates,” “expects,” “forecasts,” “intends,” “plans,” “projects,” “may,” “will,” “should,” “would,” “could” and other similar expressions are intended to identify these forward-looking statements. In particular, forward looking statements include, but are not limited to, statements we make about: (i) future declines in Paycheck Protection Program (“PPP”) loan balances and projected PPP-related revenues, (ii) the timing for completion of the Service Finance acquisition as well as the financial performance of Service Finance and the financial impact of the acquisition to Truist in future fiscal years, (iii) the benefits to clients of migrating to the Truist retail mortgage origination platform, (iv) future levels of residential mortgage income, purchase accounting accretion, net interest income, net interest margin, noninterest income, noninterest expense, net charge-off ratio and ALLL ratio, (v) the timing for completion of Truist’s merger integration and conversion activities, (vi) projected total amounts of merger-related and restructuring charges and incremental operating expenses related to the merger, (vii) the amount of expense savings to be realized from the merger and the timing of such realization, including through reductions in third party spend and non-branch facilities, branch closures, decreases in personnel and technology integrations, (viii) Truist’s expectations for its CET1 ratio, (ix) anticipated capital deployment over the near term, including through acquisitions or share repurchases, (x) the effect of interest rate changes on Truist’s net interest income, (xi) Truist’s medium-term performance targets with respect to return on tangible common equity and efficiency and capital ratios, (xii) Truist’s ability to generate earnings growth with less volatility than its peers over the long term, and (xiii) projections of future dividends. Forward-looking statements are not based on historical facts but instead represent management’s expectations and assumptions regarding Truist’s business, the economy and other future conditions. Such statements involve inherent uncertainties, risks and changes in circumstances that are difficult to predict. As such, Truist’s actual results may differ materially from those contemplated by forward-looking statements. While there can be no assurance that any list of risks and uncertainties or risk factors is complete, important factors that could cause actual results to differ materially from those contemplated by forward-looking statements include the following, without limitation, as well as the risks and uncertainties more fully discussed under Part I, Item 1A-Risk Factors in our Annual Report on Form 10-K for the year ended December 31, 2020 and in Truist's subsequent filings with the Securities and Exchange Commission: • risks and uncertainties relating to the Merger of heritage BB&T and heritage SunTrust, including the ability to successfully integrate the companies or to realize the anticipated benefits of the Merger; • expenses relating to the Merger and integration of heritage BB&T and heritage SunTrust; • deposit attrition, client loss or revenue loss following completed mergers or acquisitions may be greater than anticipated; • the COVID-19 pandemic disrupted the global economy and adversely impacted Truist’s financial condition and results of operations, including through increased expenses, reduced fee income and net interest margin, and increases in the allowance for credit losses; the resurgence of the pandemic in recent months could reintroduce or prolong these negative impacts and also adversely affect Truist’s capital and liquidity position or cost of capital, impair the ability of borrowers to repay outstanding loans, cause an outflow of deposits, and impair goodwill or other assets; • Truist is subject to credit risk by lending or committing to lend money, and may have more credit risk and higher credit losses to the extent that loans are concentrated by loan type, industry segment, borrower type or location of the borrower or collateral; • changes in the interest rate environment, including the replacement of LIBOR as an interest rate benchmark and potentially negative interest rates, which could adversely affect Truist’s revenue and expenses, the value of assets and obligations, and the availability and cost of capital, cash flows, and liquidity; • inability to access short-term funding or liquidity, loss of client deposits or changes in Truist’s credit ratings, which could increase the cost of funding or limit access to capital markets; • risk management oversight functions may not identify or address risks adequately, and management may not be able to effectively manage credit risk; • risks resulting from the extensive use of models in Truist’s business, which may impact decisions made by management and regulators; • failure to execute on strategic or operational plans, including the ability to successfully complete or integrate mergers and acquisitions; • increased competition, including from (i) new or existing competitors that could have greater financial resources or be subject to different regulatory standards, and (ii) products and services offered by non-bank financial technology companies, may reduce Truist’s client base, cause Truist to lower prices for its products and services in order to maintain market share or otherwise adversely impact Truist’s businesses or results of operations; • failure to maintain or enhance Truist’s competitive position with respect to new products, services and technology, whether it fails to anticipate client expectations or because its technological developments fail to perform as desired or do not achieve market acceptance or regulatory approval or for other reasons, may cause Truist to lose market share or incur additional expense; • negative public opinion, which could damage Truist’s reputation; • increased scrutiny regarding Truist’s consumer sales practices, training practices, incentive compensation design, and governance; • regulatory matters, litigation or other legal actions, which may result in, among other things, costs, fines, penalties, restrictions on Truist’s business activities, reputational harm, negative publicity, or other adverse consequences; • evolving legislative, accounting and regulatory standards, including with respect to capital and liquidity requirements, and results of regulatory examinations may adversely affect Truist’s financial condition and results of operations; • the monetary and fiscal policies of the federal government and its agencies could have a material adverse effect on profitability; • accounting policies and processes require management to make estimates about matters that are uncertain, including the potential write down to goodwill if there is an elongated period of decline in market value for Truist’s stock and adverse economic conditions are sustained over a period of time; • general economic or business conditions, either globally, nationally or regionally, may be less favorable than expected, and instability in global geopolitical matters or volatility in financial markets could result in, among other things, slower deposit or asset growth, a deterioration in credit quality, or a reduced demand for credit, insurance, or other services; • risks related to originating and selling mortgages, including repurchase and indemnity demands from purchasers related to representations and warranties on loans sold, which could result in an increase in the amount of losses for loan repurchases; • risks relating to Truist’s role as a loan servicer, including an increase in the scope or costs of the services Truist is required to perform, without any corresponding increase in servicing fees or a breach of Truist’s obligations as servicer; • Truist’s success depends on hiring and retaining key personnel, and if these individuals leave or change roles without effective replacements, Truist’s operations and integration activities could be adversely impacted, which could be exacerbated as Truist continues to integrate the management teams of heritage BB&T and heritage SunTrust; • fraud or misconduct by internal or external parties, which Truist may not be able to prevent, detect, or mitigate; • security risks, including denial of service attacks, hacking, social engineering attacks targeting Truist’s teammates and clients, malware intrusion, data corruption attempts, system breaches, cyber attacks, identity theft, ransomware attacks, and physical security risks, such as natural disasters, environmental conditions, and intentional acts of destruction, could result in the disclosure of confidential information, adversely affect Truist’s business or reputation or create significant legal or financial exposure; and • widespread outages of operational, communication, or other systems, whether internal or provided by third parties, natural or other disasters (including acts of terrorism and pandemics), and the effects of climate change, including physical risks, such as more frequent and intense weather events, and risks related to the transition to a lower carbon economy, such as regulatory or technological changes or shifts in market dynamics or consumer preferences, could have an adverse effect on Truist’s financial condition and results of operations, lead to material disruption of Truist’s operations or the ability or willingness of clients to access Truist’s products and services. Readers are cautioned not to place undue reliance on these forward-looking statements, which speak only as of the date they are made. Except to the extent required by applicable law or regulation, Truist undertakes no obligation to revise or update any forward-looking statements. Forward-Looking Statements


3 Non-GAAP Information This presentation contains financial information and performance measures determined by methods other than in accordance with accounting principles generally accepted in the United States of America ("GAAP"). Truist’s management uses these "non-GAAP" measures in their analysis of the Corporation's performance and the efficiency of its operations. Management believes these non-GAAP measures provide a greater understanding of ongoing operations, enhance comparability of results with prior periods and demonstrate the effects of significant items in the current period. The Company believes a meaningful analysis of its financial performance requires an understanding of the factors underlying that performance. Truist’s management believes investors may find these non-GAAP financial measures useful. These disclosures should not be viewed as a substitute for financial measures determined in accordance with GAAP, nor are they necessarily comparable to non- GAAP performance measures that may be presented by other companies. Below is a listing of the types of non-GAAP measures used in this presentation: Adjusted Efficiency Ratio - The adjusted efficiency ratio is non-GAAP in that it excludes securities gains (losses), amortization of intangible assets, merger-related and restructuring charges, and other selected items. Truist's management uses this measure in their analysis of the Corporation's performance. Truist's management believes this measure provides a greater understanding of ongoing operations and enhances comparability of results with prior periods, as well as demonstrates the effects of significant gains and charges. Tangible Common Equity and Related Measures - Tangible common equity and related measures are non-GAAP measures that exclude the impact of intangible assets, net of deferred taxes, and their related amortization. These measures are useful for evaluating the performance of a business consistently, whether acquired or developed internally. Truist’s management uses these measures to assess the quality of capital and returns relative to balance sheet risk. Core NIM - Core net interest margin is a non-GAAP measure that adjusts net interest margin to exclude the impact of purchase accounting. The purchase accounting marks and related amortization for a) securities acquired from the FDIC in the Colonial Bank acquisition and b) loans, deposits and long-term debt from SunTrust, Susquehanna, National Penn and Colonial Bank are excluded to approximate the yields paid by clients. Truist's management believes the adjustments to the calculation of net interest margin for certain assets and liabilities acquired provide investors with useful information related to the performance of Truist's earning assets. Adjusted Diluted EPS - The adjusted diluted earnings per share is non-GAAP in that it excludes merger-related and restructuring charges and other selected items, net of tax. Truist's management uses this measure in their analysis of the Corporation's performance. Truist's management believes this measure provides a greater understanding of ongoing operations and enhances comparability of results with prior periods, as well as demonstrates the effects of significant gains and charges. Performance Ratios - The adjusted performance ratios, including adjusted return on average assets, adjusted return on average common shareholders’ equity, and adjusted return on average tangible common shareholders’ equity, are non-GAAP in that they exclude merger-related and restructuring charges, selected items, and, in the case of return on average tangible common shareholders' equity, amortization of intangible assets. Truist's management uses these measures in their analysis of the Corporation's performance. Truist's management believes these measures provide a greater understanding of ongoing operations and enhance comparability of results with prior periods, as well as demonstrate the effects of significant gains and charges. Insurance Holdings Adjusted EBITDA - EBITDA is a non-GAAP measurement of operating profitability that is calculated by adding back interest, taxes, depreciation and amortization to net income. Truist's management also adds back merger- related and restructuring charges, incremental operating expenses related to the merger, and other selected items. Truist's management uses this measure in its analysis of the Corporation's Insurance Holdings segment. Truist's management believes this measure provides a greater understanding of ongoing operations and enhances comparability of results with prior periods, as well as demonstrates the effects of significant gains and charges. Selected items affecting results are included on slide 8.


4


5 Living our purpose Inspire and build better lives and communities Community Impact, Financial Inclusion, and Education Responsible Business and Ethical Conduct Technology and Client Service Human Capital and DEI ESG, Climate Change, and Environmental Sustainability ▪ 112% of prorated goal for the $60 billion 3 year 2020-2022 Community Benefits Plan commitment1 ▪ Truist Community Capital provided over $300 million in equity in 3Q to support communities through investments in affordable housing, access to healthy foods and education, and investments in job creation and small businesses ▪ Truist and EVERFI announced all elementary students nationwide will soon have access to WORDForce Universe, a digital early literacy program ▪ 23% of small business loans under $1 million went to low- and moderate- income census tracts in 2021 ▪ BlackRock’s philanthropic Emergency Savings Initiative (ESI): As the first top 10 bank to join the ESI, Truist has attracted 25K eligible households that have opened over 30K savings accounts ▪ Migrated ~7 million clients to the new Truist digital banking experience (nearly half are beginning to use), which includes enhanced digital investment and money- management capabilities, personalized insights, and a holistic personal financial management tool ▪ Decision to stay open on Saturday of a conversion weekend (October 9, 2021) ▪ Goal to increase diversity in senior leadership roles to at least 15% by 2023; current progress: 13.7% ▪ For early career program hiring in 2021, 64% of seats at Truist were filled by diverse candidates ▪ Truist teammates have received ~$24 million through Truist Momentum—financial wellness starts at home ▪ Improvements in Truist’s ESG ratings as outlined below: • MSCI: BBB to A • ISS Quality Scores: Environment to 2, Social to 1, and Governance to 2 • R-Factor: Scored in industry top 10-30% ▪ Truist’s inaugural TCFD report launching in 4Q21 1 As of 8/31/21


3Q21 Results


7 3Q21 performance highlights Total taxable-equivalent revenue1 $5,626 $5,626 Net income available to common shareholders 1,616 1,918 1 Composed of taxable-equivalent net interest income and noninterest income 2 See non-GAAP reconciliations in the appendix 3 Current quarter regulatory capital information is preliminary Earnings and profitability ▪ Strong adjusted net income available to common shareholders of $1.9 billion (adjusted EPS: $1.42) up 46% compared to 3Q20 (primarily driven by a lower loan loss provision) • Adjusted ROTCE of 22.6% • Solid 2.3% adjusted revenue growth YoY: strong 12% adjusted fee income growth offsets 29 bps decline in NIM and 8% decline in average loans ▪ Compared to 2Q21, adjusted EPS declined 8% driven by lower provision benefit and lower adjusted PPNR • Sequentially, revenue declined 1% given lower loan balances, record fee income in prior quarter, and seasonality ▪ GAAP noninterest expense reflects $393 million of nonrecurring expenses (primarily merger related) • Sequentially, adjusted noninterest expense increased 2.4% driven by higher marketing and technology-related costs ▪ Asset quality remains excellent; NCOs were a post-financial crisis low at 19 bps Capital deployment ▪ Increased dividend 7% in 3Q21 ▪ Completed acquisition of Constellation Affiliated Partners (July 1) ▪ Announced acquisition of Service Finance (Aug 10) Merger integration ▪ Completed mortgage origination platform conversion and accelerated client migration to new Truist digital experience ▪ Part 1 of core bank conversion (heritage BBT clients to Truist ecosystem) completed this past weekend (October 9-11, 2021) and full core bank conversion on track for 1Q22 Diluted EPS $1.20 $1.42 ROA 1.28% 1.51% ROCE 10.2% 12.1% ROTCE 19.3% 22.6% Efficiency ratio 67.8% 57.9% NPAs / assets 0.23% NCOs / loans 0.19% CET1 ratio3 10.1% Key PointsSummary Income Statement ($ MM) GAAP / Unadjusted Adjusted2 Asset Quality and Capital Performance Metrics GAAP / Unadjusted Adjusted2


8 Selected items affecting 3Q21 results Item ($ MM, except per share impact) Pre-Tax After-Tax Diluted EPS Impact Merger-related and restructuring charges ($172) ($132) ($0.10) Incremental operating expenses related to the merger ($191) ($147) ($0.11) Professional fee accrual ($30) ($23) ($0.02) See non-GAAP reconciliations in the appendix Diluted EPS impact for individual items may not foot to difference between GAAP diluted and adjusted diluted EPS due to rounding


9 Digital First migration Truist Migration Waves 2Q21 3Q21 4Q21 1Q22 Truist digital experience pilot Client migration waves to Truist experience begins Completion of BB&T migration Truist core conversion ▪ 12K teammate digital pilot ▪ Select group of Retail and Small Business clients migrated in June ▪ Introduced Truist Insights to heritage BB&T clients ▪ ~7 million Truist clients have migrated to the Truist digital experience across Retail, Wealth, and Small Business ▪ Nearly half of migrated clients are beginning to use the new digital platform ▪ ~9 million digital clients will have migrated to Truist Digital by year-end ▪ All heritage BB&T Retail, Business, and Wealth clients will be migrated ▪ Complete SunTrust consumer client migration ▪ SunTrust SunView Commercial client migration to Truist OneView* Truist Dashboard Truist OneView *BBTView clients will migrate to Truist OneView in 2H22; ~20K clients


10 Digital acceleration YTD 2020 YTD 2021 YTD 2020 YTD 2021 1 Digital commerce defined as products delivered through digital applications 2 Active users reflects clients that have logged in using the mobile app over the prior 90 days; clients using mobile app at both organizations were counted only once 507K 530K 3.8MM 4.2MM Digital Commerce Growth1 Mobile App Users2 Mobile Check Deposits (Transactions) Zelle Transactions New Truist platform will support clients across the continuum (including Retail, Wealth, and Small Business) with relevant differentiation for each client segment Wealth differentiation includes: ▪ Financial Planning Center: Provides a dashboard view of the client’s holistic financial picture, providing the flexibility to customize to fit their specific financial needs ▪ Secure Document Exchange: Wealth clients and their advisory team will be able to store and exchange documents securely through the new digital experience ▪ Investment solutions: To support the wide range of our clients’ investment interests, we offer a robo-advisor solution (and Invest Pro with an advisor) primarily to Retail clients, but also leveraged by many Wealth clients +5% +11% YTD 2020 YTD 2021 14.9MM 17.5MM+17% YTD 2020 YTD 2021 24.3MM 38.3MM+58% Wealth dashboard Robo-advisor


11 Loans & leases $183,700 $170,543 $165,760 $126,744 $118,032 $120,399 Commercial LHFI ($ MM) Consumer & Card LHFI ($ MM) Loans HFI yield (%) 3Q20 2Q21 3Q21 Average balances 3Q21 Linked Quarter Change Like Quarter Change Commercial: Commercial and industrial, ex. PPP $125,345 $383 ($5,965) PPP 4,680 (4,004) (7,462) CRE 24,849 (796) (2,912) Commercial construction 5,969 (390) (892) Lease financing 4,917 24 (709) Consumer: Residential mortgage 45,369 1,764 (6,131) Residential home equity and direct 25,242 4 (1,484) Indirect auto 26,830 386 2,098 Indirect other 11,112 315 (418) Student 7,214 (182) (232) Credit card 4,632 80 (178) Total loans & leases held for investment $286,159 ($2,416) ($24,285) Average Loans & Leases HFI and Loan Yields Key Points Loans & Leases HFI ($ MM) (0.8%) (7.8%)Change: ▪ Average loans and leases decreased $2.4 billion, or 0.8%, sequentially • Excluding PPP, average loans increased $1.6 billion, or 0.6% ▪ Average commercial loans decreased $4.8 billion, or 2.8%, sequentially • PPP declined $4.0 billion • Dealer floor plan declined $1.1 billion • CRE & commercial construction declined $1.2 billion1 • Excluding above, commercial loans increased $1.1 billion, or 0.9% sequentially ▪ Residential mortgage loans increased $1.8 billion, or 4.0%, reflecting increased capacity, slower prepays, and decision to balance sheet certain correspondent production ▪ Consumer loans and credit card, excluding mortgage, increased $603 million sequentially, or 0.8%, reflecting strength in auto, LightStream, and Sheffield Loans HFI yield (ex. PAA) 1 Reclassified approximately $600 million of senior care facility loans from CRE to C&I on August 1 (prior periods not restated). Averages impacted by approximately $400 million 4.06% 4.03% 3.92% 3.56% 3.62% 3.58%


12 $288,575 $284,571 $286,159 2Q21 PPP 2Q21 ex. PPP C&I and leasing (ex. Dealer floor plan, PPP) Mortgage Consumer and card (ex. mortgage) Dealer floor plan CRE and commercial construction 3Q21 Loans & leases – 2Q to 3Q waterfall $603 $1,489 $1,764 ($4,004) ($1,082) ($1,186) Improving momentum within core C&I Driven by increased operational and correspondent capacity and lower prepays Solid growth within LightStream, Sheffield, prime auto $3.5 billion remains as of 9/30 Utilization rates of ~20-25% compared to historical average of ~60-70% Reflects current risk appetite towards Hotel, Retail, Office Reclassified approximately $600 million of senior care facility loans from CRE to C&I on August 1 (prior periods not restated). Averages impacted by approximately $400 million


13 Deposits $372,211 $396,255 $402,728 0.10% 0.04% 0.03% Total deposits ($ MM) Total deposit cost (%) 3Q20 2Q21 3Q21 ▪ Average deposits grew $6.5 billion, or 1.6%; reflects ongoing government stimulus ▪ Noninterest-bearing deposits were 35% of total deposits in 3Q21 ▪ Total deposit cost declined 1 bp to 3 bps, sequentially ▪ Loan-to-deposit ratio was 71% (based on average balances) ▪ Building franchise value • Net client attrition of closed branches <1% • Net new personal DDA of ~50K YTD (7x YoY) • Net new business DDA of ~45K YTD (+11% YoY) Average balances 3Q21 Linked Quarter Change Like Quarter Change Noninterest-bearing deposits $141,738 $3,846 $17,772 Interest checking 107,802 1,681 11,095 Money market and savings 136,094 2,065 12,496 Time deposits 17,094 (1,119) (10,846) Total deposits $402,728 $6,473 $30,517 Key Points Average Deposits & Costs Deposits ($ MM) Change: +1.6% +8.2%


14 Net interest income and interest rate sensitivity ▪ Net interest income (TE) declined slightly: $12 million sequentially • Purchase accounting accretion declined $53 million sequentially • Core net interest income increased $41 million sequentially (driven by larger securities portfolio and the impact of one more day, partially offset by lower PPP revenue) ▪ Net interest margin declined 7 bps to 2.81% • 5 bps decline driven by lower purchase accounting accretion • 2 bps decline in core NIM ◦ 1 bp from higher levels of liquidity (strong deposit growth combined with lower loan balances) ◦ 1 bp from lower PPP revenue ◦ Expect PPP balances to be substantially forgiven by 2Q22 ▪ Well-positioned for rising rates • ~65% of asset sensitivity from short-end of the curve ◦ Assumes ~50% interest-bearing deposit beta – BBT/STI realized ~15% beta on previous first 100 bps rise in short-term interest rates – For every 10% decline in deposit beta, asset sensitivity will rise by 100 bps (ramp) or 200 bps (shock) $3,391 $3,273 $3,261 3.10% 2.88% 2.81% 2.72% 2.60% 2.58% Net interest income TE ($ MM) Reported NIM (%) Core NIM (%) 3Q20 2Q21 3Q21 -1.7% -1.2% +3.2% +4.1% -2.5% -1.5% +4.3% +8.4% Ramp Shock Down 50 Down 25 Up 50 Up 100 1 Market rate increase or decrease scenarios assume either (1) a ramped, parallel 25 basis point change per quarter in market interest rates or (2) instantaneous change. Also assumes that market rates floor at 1 basis point. As of 9/30/21 Key PointsNet Interest Income & Margin Year 1 Net Interest Income Sensitivity1 1Q21 2Q21 3Q21 PPP revenue ($ MM) $132 $124 $85 Avg. PPP balances ($ B) $10.0 $8.7 $4.7 EOP PPP balances ($ B) $10.1 $6.0 $3.5 PPP yields 5% 6% 7% PPP contribution to NIM 6 bps 6 bps 5 bps


15 Noninterest income 3Q21 Linked Quarter Change Like Quarter Change Insurance income $645 ($45) $127 Wealth management income 356 11 32 Service charges on deposits 276 23 29 Residential mortgage income 179 62 (42) Investment banking and trading income 301 (16) 57 Card and payment related fees 225 — 25 Lending related fees 74 (20) (3) Operating lease income 57 (9) (15) Commercial real estate related income 78 (60) 23 Income from bank-owned life insurance 43 (3) (3) Securities gains (losses) — — (104) Other income 131 17 29 Total noninterest income $2,365 ($40) $155 Adjusted noninterest income1 $2,365 ($40) $259 $2,210 $2,405 $2,365 39.7% 42.6% 42.2% Noninterest income ($ MM) Fee income ratio (%) 3Q20 2Q21 3Q21 1 Excludes securities gains from 3Q20 Noninterest Income & Fee Income Ratio Noninterest Income ($ MM) 3Q21 vs. 3Q20: Diverse business mix, firing on multiple cylinders, due to ongoing investments resulting in strong 12% growth on an adjusted basis ▪ Insurance income up 25% due to acquisitions and strong organic growth ▪ Investment banking and trading up 23% (2nd best IB quarter); record M&A performance ▪ Wealth management income up 10% ▪ CRE income up 42% (led by structured real estate activity) ▪ Card, payment, and service charges up 12% given ongoing economic recovery / normalization ▪ Increase in Other income reflects strong results within SBIC program; NQDCP valuation adjustments continue to be positive 3Q21 vs. 2Q21: Noninterest income declined $40 million, or 1.7% sequentially, given record 2Q fee income performance ▪ Insurance income declined primarily due to seasonality; partially offset by the Constellation acquisition ▪ CRE income declined $60 million due to record 2Q performance in structured real estate ▪ Residential mortgage improved due to slower prepay speeds and $27 billion UPB servicing acquisition Key Points Adjusted change: (1.7%) +12.3%


16 Noninterest expense & efficiency ratio ▪ Noninterest expense declined $216 million sequentially • 2Q21 results included $487 million of merger-related and restructuring costs1 and $200 million charitable contribution • 3Q21 results include $363 million of merger-related and restructuring costs1 and $30 million professional fee accrual to develop a teammate-led revenue and efficiency program post merger ▪ Adjusted noninterest expense up 2.4% sequentially, primarily driven by higher marketing and technology-related costs • Adjusted noninterest expense increased 3.5% YoY, driven by performance- related incentive compensation ▪ Adjusted efficiency ratio of 57.9%, relatively stable to a year ago (adjusted PPNR up 0.8%) ▪ Average FTEs up slightly due to the Constellation acquisition and will decline in 4Q as a result of initial impact from voluntary separation retirement program 3Q21 Linked Quarter Change Like Quarter Change Personnel expense $2,187 ($20) $129 Professional fees and outside processing 372 31 49 Net occupancy expense 187 5 (46) Software expense 251 5 30 Amortization of intangibles 145 3 (25) Equipment expense 154 32 27 Marketing and customer development 94 28 19 Operating lease depreciation 47 — (9) Loan-related expense 52 (3) (7) Regulatory costs 43 12 9 Merger-related and restructuring charges 172 (125) (64) Loss (gain) on early extinguishment of debt — — — Other expense 91 (184) (72) Total noninterest expense $3,795 ($216) $40 Adjusted noninterest expense2 $3,257 $75 $110 $3,755 $4,011 $3,795 67.4% 71.0% 67.8% 57.3% 56.1% 57.9% Total noninterest expense ($ MM) GAAP efficiency (%) Adjusted efficiency (%) 3Q20 2Q21 3Q21 1 Includes merger-related and restructuring charges and incremental operating expenses related to the merger 2 Excludes selected items referenced on slide A-9 of the attached appendix Noninterest Expense & Efficiency Ratio Noninterest Expense ($ MM) Key Points Memo: Incremental operating expenses related to the merger Adjusted change: +2.4% +3.5% $191 $1 $39


17 Asset quality $1,314 $1,192 $1,204 0.26% 0.23% 0.23% Nonperforming assets ($ MM) NPAs as a % of total assets 3Q20 2Q21 3Q21 $326 $142 $135 $(434) Net charge-offs ($ MM) Provision NCOs as % of avg. loans and leases 3Q20 2Q21 3Q21 0.42% 3Q20 2Q21 3Q21 4.5x 9.0x 0.20% ▪ Asset quality remains excellent, reflecting our prudent risk culture, diverse portfolio, improving economic conditions, and the ongoing effects of government stimulus ▪ NCO ratio was 19 bps, down 1 bp sequentially • Continued strength in commercial partially offset by normal seasonality within consumer ▪ Leading indicators remain strong • NPL ratio and early stage delinquencies (30-89 days) remain low at 40 bps and 64 bps, respectively ▪ ALLL ratio declined from 1.79% to 1.65% as economic scenarios improved • Resulted in provision benefit of $324 million, compared to $434 million benefit in 2Q21 • CECL Day 1 ALLL (1/1/2020) was 1.54% Key PointsNet Charge-offs & Provision Nonperforming Assets ALLL to Annualized Net Charge-offs $5,863 $5,121 $4,702 1.91% 1.79% 1.65% ALLL ($ MM) % of ALLL to total LHFI 3Q20 2Q21 3Q21 ALLL 8.8x 0.19% $421 ($324)


18 Capital and liquidity position Capital position ▪ CET1 ratio was 10.1% ▪ Dividend of $0.48 per share (7% increase compared to previous level) • Reflects 40% payout ratio on GAAP EPS and 34% payout ratio on adjusted EPS ▪ No share repurchases in 3Q21 given acquisition activity; share repurchases likely to resume in 4Q21 ▪ Capital deployment activity • ~$900 million capital consumed for Constellation acquisition (July 1) • $2.0 billion cash acquisition of Service Finance (expect close by year-end) ◦ ~$1.8 billion capital consumption given existing TBV • ~$1-2 billion of potential incremental capital deployment capacity (acquisitions and/or share repurchases) over next 4 quarters (4Q21 to 3Q22) Liquidity remains strong ▪ Average LCR for 3Q21 was 114% ▪ Liquid asset buffer was 24.5% ▪ Loan-to-deposit ratio of 71% 10.0% 10.2% 10.1% Common Equity Tier 1 Tier 1 Total 3Q20 2Q21 3Q21 Current quarter regulatory capital information is preliminary Liquid asset buffer is defined as cash + unencumbered securities divided by total assets 12.2% 14.6% 12.0% 117% 113% 114% $79.9 $83.5 $85.8 LCR HQLA ($ B) 3Q20 2Q21 3Q21 14.2% Key PointsCapital Ratios Category III LCR & HQLA 13.9% 11.9%


192017 2018 2019 2020 2021E ($ B) Expanding our point-of-sale platform: Service Finance Strategic Rationale ▪ Expands scale and capabilities of existing point-of-sale lending business • Strong complement to Sheffield and LightStream ▪ Enables Truist to have a direct role in the home improvement point-of-sale market which is poised to continue to deliver attractive growth • Home improvement market in secular growth phase • Financing market is highly fragmented with very few professional financing providers • Consumers gravitating towards simple, convenient financing solutions (vs. revolving credit) ▪ Truist provides significant experience in point-of-sale lending space and strong funding advantages Service Finance Originations ~$2.5 Financial Impact 1 Excludes forecasted merger-related charges and amortization 2 Assumes acquisition replaces planned share repurchases Service Finance Overview and Key Differentiators ▪ Top 3 U.S. provider of point-of-sale financing solutions for home improvement projects • Deep, loyal, and quickly growing network of ~14k dealers and contractors, in addition to 80+ manufacturers • Focused exclusively on home improvement ▪ Strong business development and execution track record: industry-leading growth of 30%+ ▪ Strong digital client experience: >80% applications completed on mobile app ▪ Excellent reputation with manufacturers, dealers/contractors, and consumers • Good compliance track record • Straightforward financing: No-look back periods on interest after promotional period 33% CAGR ▪ Strong profitability profile with low credit risk; accretive to ROA, ROTCE, efficiency ratio and EPS growth over the long-term • ~3%+ cash ROA (steady-state) • ~9%+ steady-state all-in loan yields (~8% in Year 1 due to impact of promo periods on unseasoned loan portfolio) • ~25% steady-state efficiency ratio1 ▪ Strong ROIC: mid-teens IRR EPS Impact2 (4)% (3)% (2)% (1)% (3)% (1)% (1)% —% GAAP EPS accretion / (dilution)% Cash EPS accretion / (dilution)% $2.1 $1.6 $1.2 $0.8 2022 2023 2024 2025


Merger Integration Update


21 Successful execution of integration milestones Truist Securities conversion (3Q20) Wealth brokerage platform conversion (1Q21) Release of Truist job grade framework to all teammates (4Q20) Testing protocols for core bank conversion (1Q21) Wealth trust platform conversion (2Q21) Migrate teammates to the Truist retail mortgage origination ecosystem (Aug. ‘21) Integration Milestones Convert heritage BB&T retail and commercial clients to Truist ecosystem (Oct. ‘21) Integrate industry-leading commercial lending platform (Oct. ‘21) Unveil Innovation and Technology Center in Charlotte, NC (4Q21) Launch Truist digital online banking and mobile experience (3Q21 and 4Q21) Retail branch consolidation (approximately 800 cumulative closures by 1Q22) Convert heritage SunTrust retail and commercial clients to Truist ecosystem (1Q22) One conversion remaining


22 Committed to achieving net cost saves Digital Innovation Marketing / Branding Talent / Benefits Technology Platforms Third Party Spend Targeting 10% reduction in sourceable spend Non-Branch Facilities Targeting approximately 4.8MM net sq. ft. reductions Retail Banking Targeting 800 total closures by 1Q22 Technology Driven by integration efforts, applications, hardware, and staff rationalization; savings anticipated post conversion / decommissioning process Personnel1 Avg. FTEs decreased by approximately 11% at 3Q21 1 Reflects normal attrition and reductions in force from 1Q19 proforma through 3Q21, excluding FTE increases from Insurance acquisitions Achieved through: 1Q21–9.3% 2Q21–10.3% 3Q21–11.2% Cumulative closures through: 1Q21–374 2Q21–374 3Q21–413 Cumulative closures through: 1Q21–3.5MM 2Q21–3.8MM 3Q21–4.3MM C os t s av es In ve st m en ts Includes normal attrition and reductions in force Includes Lightstream expansion, Truist Digital, and agile teams Includes digital marketing, hyper-personalization, and CRM capabilities and teams Includes pension, revenue producers in fee businesses (e.g. CIB, wealth, and insurance), and positive impacts from Truist job structure framework Includes best of both technology, modernization, and cyber build out


23 Merger cost update Anticipated total merger costs through 2022 (not in run rate thereafter) Estimated total merger-related and restructuring charges and incremental operating expenses include costs projected through 2022 (not expected be part of the run rate post 2022); Only includes merger and restructuring charges associated with the BB&T and SunTrust MOE (i.e. excludes merger costs associated with insurance acquisitions) ▪ Expenses to complete merger with no future benefit include: • Severance and compensation ◦ (E.g. primarily severance payments) • Occupancy and equipment ◦ (E.g. impairments related to vacated buildings) • Professional fees and outside processing ◦ (E.g. investment banker and legal fees related to the merger as well as 3rd party labor related to system conversions and decommissioning) • System conversion costs ◦ (E.g. write-offs for technology assets) ExamplesEst. Total Merger Related and Restructuring Charges Est. Total Incremental Operating Expense Related to the Merger $1.8B $2.1B incurred Feb.’19–Sept. ‘21 $1.3B $1.8B ▪ Expenses for which the ongoing entity receives a future benefit include: • Personnel ◦ (E.g. salaries and incentive expense for FTEs dedicated to merger integration work) • Professional fees and outside processing ◦ (E.g. 3rd party labor related to target future state system design, optimization, and enhancement) • Marketing and other developments ◦ (E.g. rebranding costs) • All other operating expenses ◦ (E.g. includes net occupancy, software, equipment, loan processing, and other expense) Examples incurred Feb.’19–Sept. ‘21 A pproxim ately $1 billion rem aining


24 Cost saves progress 4Q20 annualized $640MM 40% of net cost saves 4Q21 annualized $1,040MM 65% of net cost saves 4Q22 annualized $1,600MM 100% of net cost saves $3,257 $3,027 Adjusted NIE Variable compensation related to higher fee revenue and improved performance relative to 2019 NQDCP NIE - Insurance acquisitions since 2019 Core NIE Adjusted NIE excludes selected items referenced on slide A-9 of the attached appendix NQDCP substantially offset in noninterest income Variable compensation related to higher fee revenue and improved performance is relative to one quarter of 2019 annual pro forma levels 3Q21 Core Noninterest Expense ($ MM) Remain committed to 4Q21 targeted core expenses of $2,940MM On track On track Net Expense Savings–Run Rate ($145) ($32) ($53)


25 Value proposition Purpose-driven: Committed to inspire and build better lives and communities Growing earnings stream with less volatility relative to peers over the long-term ▪ 7th largest commercial bank in the U.S. ▪ Strong market share in vibrant, fast-growing MSAs throughout the Southeast and Mid- Atlantic and a growing national presence ▪ Comprehensive business mix with distinct capabilities in traditional banking, capital markets and insurance ▪ Better together: “Best of breed” talent, technology, strategy, and processes ▪ Continued confidence in achieving $1.6 billion of net cost savings ▪ Highly complementary businesses and expanded client base combine to yield revenue synergies over time ▪ Meaningful investments in innovative technologies, teammates, and marketing ▪ Top quartile performance for ROTCE and efficiency ratio; medium-term targets: • ROTCE: low 20s • Efficiency ratio: low 50s • CET1 ratio: <10% ▪ Prudent and disciplined risk and financial management ▪ Conservative risk culture; leading credit metrics; among the highest-rated large banks ▪ Diversification benefits arising from the merger ▪ Stress test well (CCAR 2021 affirms) ▪ Strong capital and liquidity support flight to quality ▪ Defensive balance sheet insulated by purchase accounting marks, combined with CECL credit reserves Exceptional franchise with diverse products, services, and markets Uniquely positioned to deliver best-in-class efficiency and returns while investing in the future Strong capital and liquidity with resilient risk profile enhanced by the merger


26 3Q21 results in the context of our value proposition Total Assets $1,086 $1,302 3Q20 3Q21 Fee Income Diversity Exceptional Franchise1 Uniquely Positioned2 $0.97 $1.42 3Q20 3Q21 Adjusted Diluted EPS 46% 16.1% 22.6% 3Q20 3Q21 Adjusted ROTCE 40% Strong Capital, Liquidity, & Risk Mgmt.3 57% 40% 3Q20 3Q21 Total Payout Ratio 0.42% 0.19% 3Q20 3Q21 NCOs / Loans 55% $499 $530 3Q20 3Q21 1 Source: S&P Global as of 9/8/21; demographic data as of 1/1/21; deposit data as of 6/30/21, pro forma for completed and announced M&A through 9/8/21. ’21-’26E projected growth deposit weighted by county. 2 Impact of Constellation acquisition $ in billions, except per share impact Insurance, Investment Banking, & Wealth Current CET1 ratio = 10.1%; near-term target = 9.75% 7th largest US commercial bank; highest proj. pop. growth compared to peers1 6.2% 20% 67% 55%2


Appendix


A-1 Consumer Banking & Wealth 3Q21 Linked Qtr. Change Like Qtr. Change Net interest income $2,036 ($73) ($155) Provision for credit losses (5) (1) (186) Noninterest income 1,032 107 35 Noninterest expense 1,933 2 (4) Pre-tax income 1,140 33 70 Segment net income 872 24 54 Average loans(1) $132.9 $2.1 ($6.8) Average deposits 244.6 2.4 23.0 Mortgages serviced for others ($ B)(2) $198.1 $20.1 ($0.8) Branches 2,518 (39) (366) ATMs 3,684 (95) (553) In co m e S ta te m en t ( $ M M ) B al an ce S he et ($ B ) O th er K ey M et ric s (1) Excludes loans held for sale (2) Amount reported reflects end of period balance (3) Excludes impact of market changes Represents performance for Retail Community Banking, Wealth, Mortgage Banking, Dealer Retail Services, and National Consumer Finance & Payments ▪ Segment net income of $872 million, up sequentially and YoY • Solid fee income growth and expense control more than offset reduced purchase accounting accretion and lower funding credit for deposits (as a result of continued low rate environment) • YoY also impacted by significant improvement in provision expense ▪ Loan balances improved sequentially due to mortgage growth and strength in indirect auto, LightStream, and Sheffield ▪ Deposits continue to grow due to ongoing government stimulus and improved organic production • Net new personal DDA of ~50K YTD (7x YoY) ▪ Fee income trends improving • Mortgage banking income up sequentially due to higher servicing income (as a result of slower prepay speeds and servicing acquisitions) and higher production income (as a result of increased operational capacity post mortgage platform conversions) ◦ Mortgage income declined YoY due to lower refinance activity • Card, payments, and service charges on deposits up 5.3% sequentially and 12% YoY due to ongoing economic recovery and normalization • Wealth management income up 3.1% sequentially and 10% YoY, benefiting from market conditions and positive net organic asset flows ▪ Solid expense control – stable sequentially and YoY • Branch count down 13% YoY due to MOE consolidations Key Points


A-2 Corporate & Commercial Banking 3Q21 Linked Qtr. Change Like Qtr. Change Net interest income $1,173 ($54) ($110) Provision for credit losses (264) 135 (575) Noninterest income 753 (55) 145 Noninterest expense 820 (22) (25) Pre-tax income 1,370 (222) 635 Segment net income 1,075 (168) 489 Average loans(1) $150.3 ($4.8) ($17.6) Average deposits 150.6 3.9 8.8 In co m e S ta te m en t ( $ M M ) ▪ C&CB net income of $1.1 billion • Sequential and YoY trends primarily impacted by changes in provision ▪ Average loans down $4.8 billion, or 3.1% sequentially • PPP down $4.0 billion • Dealer floor plan down $1.1 billion • CRE and construction(2) down $0.9 billion • Excluding above, C&CB loans up $1.2 billion, or 1.0% ▪ Net interest income continues to decline as a result of lower funding credit on deposits, lower purchase accounting accretion, reduced PPP revenue, and lower revolver utilization • Core loan spreads and yields relatively stable ▪ Noninterest income declined $55 million sequentially and is up 24% YoY • Sequential trends primarily impacted by record client-related structured real estate activity in 2Q • Year-over-year ◦ Investment banking increased 26%, due to record M&A performance and strong syndicated finance activity ◦ CRE income increased 42% due to higher performance in both structured real estate and Grandbridge agency lending activity ◦ Increased investment income (other income) primarily related to valuation gains from SBIC funds ▪ Solid expense control • Expenses down 2.6% sequentially and 3.0% YoY; average FTEs down 9.0% YoY B al an ce S he et ($ B ) (1) Excludes loans held for sale (2) CRE/Construction decline of $0.9B exclusive of reclass to C&I of ~$0.4B Represents performance for Commercial Community Banking, Corporate & Investment Banking, and CRE & Grandbridge Key Points


A-3 Insurance Holdings 3Q21 Linked Qtr. Change Like Qtr. Change Net interest income $25 $4 $1 Noninterest income 652 (46) 128 Total revenue 677 (42) 129 Provision for credit losses 1 2 1 Noninterest expense 537 22 91 Pre-tax income 139 (66) 37 Segment net income 105 (51) 28 Y-o-Y organic revenue growth 11.9% (2.9%) 6.6% Net acquired revenue $71 $42 $67 Performance based commissions 19 4 4 Adjusted EBITDA(1) 176 (68) 54 Adjusted EBITDA margin(1) 26.0% (7.9%) 3.7% In co m e S ta te m en t ( $ M M ) P er fo rm an ce ($ M M ) Market backdrop ▪ P&C rate environment remains firm with rate increases in 3Q21 comparable or slightly up vs. 2Q21 ▪ Wholesale continuing to benefit from inflow of business from standard to E&S markets due to tighter terms & conditions, rate increases across most lines and sustained capacity constraints Truist performance ▪ Strong like quarter operating performance with 24% revenue growth, of which 12% was organic revenue growth; Adjusted EBITDA grew 44% and margins increased 370 bps • Link quarter revenue decline driven by seasonality, with 3Q generally Truist Insurance Holdings’ lowest revenue quarter due to P&C renewal timing; partially offset by Constellation acquisition ▪ 3Q21 new business up 26% YoY as the US economy is improving, insurers are adding exposures to their policies and the P&C market environment remains challenging ▪ Positive operating leverage due to strong organic revenue growth driving margin expansion ▪ Completed the acquisition of Constellation Affiliated Partners on July 1st with approximately $160 million in annualized revenue (1) EBITDA is a non-GAAP measurement of operating profitability that is calculated by adding back interest, taxes, depreciation and amortization to net income. Truist's management also adds back merger- related and restructuring charges, incremental operating expenses related to the merger, and other selected items. Truist's management uses this measure in its analysis of the Corporation's Insurance Holdings segment. Truist's management believes this measure provides a greater understanding of ongoing operations and enhances comparability of results with prior periods, as well as demonstrates the effects of significant gains and charges. See non-GAAP reconciliations included in the attached Appendix. Represents performance for Retail and Wholesale Insurance businesses and Premium Finance Key Points


A-4 Purchase accounting summary(1) ($ MM) As of/For the Quarter Ended Sept. 30 June 30 March 31 Dec. 31 Sept. 30 2021 2021 2021 2020 2020 Loans and Leases(2) Beginning balance unamortized fair value mark $ (1,777) $ (2,067) $ (2,395) $ (2,676) $ (3,077) Accretion 233 285 316 356 367 Purchase accounting adjustments and other activity 4 5 12 (75) 34 Ending balance $ (1,540) $ (1,777) $ (2,067) $ (2,395) $ (2,676) Core deposit and other intangible assets Beginning balance $ 2,665 $ 2,825 $ 2,984 $ 2,840 $ 3,016 Additions - acquisitions 418 — 14 320 — Amortization (145) (142) (144) (172) (170) Amortization in net occupancy expense (4) (3) (3) (4) (6) Purchase accounting adjustments and other activity (4) (15) (26) — — Ending balance $ 2,930 $ 2,665 $ 2,825 $ 2,984 $ 2,840 Deposits(3) Beginning balance unamortized fair value mark $ (12) $ (15) $ (19) $ (26) $ (37) Amortization 3 3 4 7 11 Ending balance $ (9) $ (12) $ (15) $ (19) $ (26) Long-Term Debt(3) Beginning balance unamortized fair value mark $ (176) $ (196) $ (216) $ (238) $ (262) Amortization 19 20 20 22 24 Ending balance $ (157) $ (176) $ (196) $ (216) $ (238) (1) Includes the merger with SunTrust. This summary includes only selected information and does not represent all purchase accounting adjustments. (2) Purchase accounting marks on loans and leases includes credit, interest and liquidity components, and are generally recognized using the level-yield or straight-line method over the remaining life of the individual loans or recognized in full in the event of prepayment. (3) Purchase accounting marks on liabilities represents interest rate marks on time deposits and long-term debt and are recognized using the level-yield method over the term of the liability.


A-5 Purchase accounting accretion – historical and forecast PAA ($ MM) Contribution to NIM (bps) 4Q21 $229 20 1Q22 $211 19 2Q22 $193 17 3Q22 $175 15 4Q22 $159 14 1Q23 $142 12 2Q23 $126 10 3Q23 $110 9 PAA ($ MM) Contribution to NIM (bps) 1Q20 $506 52 2Q20 $483 46 3Q20 $402 38 4Q20 $385 36 1Q21 $340 32 2Q21 $308 28 3Q21 $253 23 (1) Purchase accounting marks on loans and leases includes credit, interest and liquidity components, and are generally recognized using the level-yield or straight-line method over the remaining life of the individual loans or recognized in full in the event of prepayment. (2) Purchase accounting marks on liabilities represents interest rate marks on time deposits and long-term debt and are recognized using the level-yield method over the term of the liability. (3) Forecasted accretion is based on current prepayment assumptions and is subject to change


A-6 4Q21–2Q22 preferred stock projected dividends 3ML = 3-month LIBOR. Estimates assume an average LIBOR rate of 0.17% for 3Q21-1Q22. Actual 3ML could vary significantly causing dividend payments to differ from the estimates shown above. Table may not foot due to rounding Truist Preferred Outstandings ($ MM) 4Q21 1Q22 2Q22 Series I $172.5 $1.7 $1.7 $1.8 Series J $101.5 1.0 1.0 1.0 Series L $750.0 18.9 — 18.9 Series M $500.0 12.8 — 12.8 Series N $1,700.0 — 40.8 — Series O $575.0 7.5 7.5 7.5 Series P $1,000.0 24.8 — 24.8 Series Q $1,000.0 — 25.5 — Series R $925.0 11.0 11.0 11.0 Estimated dividends based on current interest rates and amounts outstanding ($ MM) $77.8 $87.6 $77.8


Non-GAAP Reconciliations


A-8 Quarter Ended Sept. 30 June 30 March 31 Dec. 31 Sept. 30 2021 2021 2021 2020 2020 Net income available to common shareholders - GAAP $ 1,616 $ 1,559 $ 1,334 $ 1,228 $ 1,068 Merger-related and restructuring charges 132 228 108 237 181 Securities (gains) losses — — — — (80) Loss (gain) on early extinguishment of debt — (1) (2) — — Incremental operating expenses related to the merger 147 146 134 138 115 Charitable contribution — 153 — — 38 Professional fee accrual 23 — — — — Acceleration for cash flow hedge unwind — — 28 — — Net income available to common shareholders - adjusted $ 1,918 $ 2,085 $ 1,602 $ 1,603 $ 1,322 Weighted average shares outstanding - diluted 1,346,854 1,349,492 1,358,932 1,361,763 1,358,122 Diluted EPS - GAAP $ 1.20 $ 1.16 $ 0.98 $ 0.90 $ 0.79 Diluted EPS - adjusted(1) 1.42 1.55 1.18 1.18 0.97 Non-GAAP reconciliations Diluted EPS ($ MM, except per share data, shares in thousands) (1) The adjusted diluted earnings per share is non-GAAP in that it excludes merger-related and restructuring charges and other selected items, net of tax. Truist's management uses this measure in their analysis of the Corporation's performance. Truist's management believes this measure provides a greater understanding of ongoing operations and enhances comparability of results with prior periods, as well as demonstrates the effects of significant gains and charges.


A-9 Non-GAAP reconciliations Efficiency ratio ($ MM) (1) Revenue is defined as net interest income plus noninterest income. (2) The adjusted efficiency ratio is non-GAAP in that it excludes securities gains (losses), amortization of intangible assets, merger-related and restructuring charges, and other selected items. Truist's management uses this measure in their analysis of the Corporation's performance. Truist's management believes this measure provides a greater understanding of ongoing operations and enhances comparability of results with prior periods, as well as demonstrates the effects of significant gains and charges. Quarter Ended Sept. 30 June 30 March 31 Dec. 31 Sept. 30 2021 2021 2021 2020 2020 Efficiency ratio numerator - noninterest expense - GAAP $ 3,795 $ 4,011 $ 3,610 $ 3,833 $ 3,755 Merger-related and restructuring charges, net (172) (297) (141) (308) (236) Gain (loss) on early extinguishment of debt — — 3 — — Incremental operating expense related to the merger (191) (190) (175) (179) (152) Amortization of intangibles (145) (142) (144) (172) (170) Charitable contribution — (200) — — (50) Professional fee accrual (30) — — — — Acceleration for cash flow hedge unwind — — (36) — — Efficiency ratio numerator - adjusted $ 3,257 $ 3,182 $ 3,117 $ 3,174 $ 3,147 Efficiency ratio denominator - revenue(1) - GAAP $ 5,598 $ 5,650 $ 5,482 $ 5,651 $ 5,572 Taxable equivalent adjustment 28 28 28 28 29 Securities (gains) losses — — — — (104) Gains on divestiture of certain businesses — — (37) — — Efficiency ratio denominator - adjusted $ 5,626 $ 5,678 $ 5,473 $ 5,679 $ 5,497 Efficiency ratio - GAAP 67.8 % 71.0 % 65.8 % 67.8 % 67.4 % Efficiency ratio - adjusted(2) 57.9 56.1 56.9 55.9 57.3


A-10 Non-GAAP reconciliations Calculations of tangible common equity and related measures ($ MM, except per share data, shares in thousands) (1) Tangible common equity and related measures are non-GAAP measures that exclude the impact of intangible assets, net of deferred taxes, and their related amortization. These measures are useful for evaluating the performance of a business consistently, whether acquired or developed internally. Truist’s management uses these measures to assess the quality of capital and returns relative to balance sheet risk.These measures are not necessarily comparable to similar measures that may be presented by other companies. As of / Quarter Ended Sept. 30 June 30 March 31 Dec. 31 Sept. 30 2021 2021 2021 2020 2020 Common shareholders' equity $ 62,227 $ 61,663 $ 60,752 $ 62,759 $ 61,819 Less: Intangible assets, net of deferred taxes 27,066 26,296 26,413 26,629 25,923 Tangible common shareholders' equity(1) $ 35,161 $ 35,367 $ 34,339 $ 36,130 $ 35,896 Outstanding shares at end of period 1,334,892 1,334,770 1,344,845 1,348,961 1,348,118 Common shareholders' equity per common share $ 46.62 $ 46.20 $ 45.17 $ 46.52 $ 45.86 Tangible common shareholders' equity per common share(1) 26.34 26.50 25.53 26.78 26.63 Net income available to common shareholders $ 1,616 $ 1,559 $ 1,334 $ 1,228 $ 1,068 Plus amortization of intangibles, net of tax 113 107 111 131 130 Tangible net income available to common shareholders(1) $ 1,729 $ 1,666 $ 1,445 $ 1,359 $ 1,198 Average common shareholders' equity $ 62,680 $ 61,709 $ 62,252 $ 61,991 $ 61,804 Less: Average intangible assets, net of deferred taxes 27,149 26,366 26,535 25,930 25,971 Average tangible common shareholders' equity(1) $ 35,531 $ 35,343 $ 35,717 $ 36,061 $ 35,833 Return on average common shareholders' equity 10.2 % 10.1 % 8.7 % 7.9 % 6.9 % Return on average tangible common shareholders' equity(1) 19.3 18.9 16.4 15.0 13.3


A-11 Non-GAAP reconciliations Performance ratios ($ MM) (1) Tangible common equity and related measures are non-GAAP measures that exclude the impact of intangible assets, net of deferred taxes, and their related amortization. These measures are useful for evaluating the performance of a business consistently, whether acquired or developed internally. Truist’s management uses these measures to assess the quality of capital and returns relative to balance sheet risk.These measures are not necessarily comparable to similar measures that may be presented by other companies. (2) Tangible common equity is a non-GAAP measure. The reconciliation for this measure is on the previous slide. Quarter Ended September 30, 2021 Return on Average Assets Return on Average Common Shareholders’ Equity Return on Average Tangible Common Shareholders’ Equity2 Net income - GAAP $ 1,704 Net income available to common shareholders - GAAP $ 1,616 $ 1,616 Merger-related and restructuring charges 132 132 132 Incremental operating expenses related to the merger 147 147 147 Professional fee accrual 23 23 23 Amortization — — 113 Numerator - adjusted(1) $ 2,006 $ 1,918 $ 2,031 Average assets $ 526,685 Average common shareholders' equity — $ 62,680 $ 62,680 Plus: Estimated impact of adjustments on denominator — 151 151 Less: Average intangible assets, net of deferred taxes — — 27,149 Denominator - adjusted(1) $ 526,685 $ 62,831 $ 35,682 Reported ratio 1.28 % 10.2 % 19.3 % Adjusted ratio 1.51 12.1 22.6


A-12 Quarter Ended Sept. 30 June 30 March 31 Dec. 31 Sept. 30 2021 2021 2021 2020 2020 Net interest income - GAAP $ 3,233 $ 3,245 $ 3,285 $ 3,366 $ 3,362 Taxable-equivalent adjustment 28 28 28 28 29 Net interest income - taxable-equivalent 3,261 3,273 3,313 3,394 3,391 Accretion of mark on acquired loans (233) (285) (316) (356) (367) Accretion of mark on acquired liabilities (22) (23) (24) (29) (35) Net interest income - core(1) $ 3,006 $ 2,965 $ 2,973 $ 3,009 $ 2,989 Average earning assets - GAAP $ 461,750 $ 455,265 $ 443,946 $ 438,666 $ 435,394 Average balance - mark on acquired loans 1,658 1,947 2,263 2,550 2,918 Average earning assets - core(1) $ 463,408 $ 457,212 $ 446,209 $ 441,216 $ 438,312 Annualized net interest margin: Reported - taxable-equivalent 2.81 % 2.88 % 3.01 % 3.08 % 3.10 % Core(1) 2.58 2.60 2.69 2.72 2.72 Non-GAAP reconciliations Core NIM ($ MM) (1) Core net interest margin is a non-GAAP measure that adjusts net interest margin to exclude the impact of purchase accounting. The purchase accounting marks and related amortization for a) securities acquired from the FDIC in the Colonial Bank acquisition and b) loans, deposits and long-term debt from SunTrust, Susquehanna, National Penn and Colonial Bank are excluded to approximate the yields paid by clients. Truist's management believes the adjustments to the calculation of net interest margin for certain assets and liabilities acquired provide investors with useful information related to the performance of Truist's earning assets. These measures are not necessarily comparable to similar measures that may be presented by other companies.


A-13 Non-GAAP reconciliations Insurance Holdings adjusted EBITDA ($ MM) (1) EBITDA is a non-GAAP measurement of operating profitability that is calculated by adding back interest, taxes, depreciation and amortization to net income. Truist's management also adds back merger-related and restructuring charges, incremental operating expenses related to the merger, and other selected items. Truist's management uses this measure in its analysis of the Corporation's Insurance Holdings segment. Truist's management believes this measure provides a greater understanding of ongoing operations and enhances comparability of results with prior periods, as well as demonstrates the effects of significant gains and charges. Quarter Ended Sept. 30 June 30 Sept. 30 2021 2021 2020 Segment net interest income $ 25 $ 21 $ 24 Noninterest income 652 698 524 Total revenue $ 677 $ 719 $ 548 Segment net income (loss) - GAAP $ 105 $ 156 $ 77 Provision (benefit) for income taxes 34 49 25 Depreciation & amortization 32 26 16 EBITDA 171 231 118 Merger-related and restructuring charges, net 2 13 3 Incremental operating expenses related to the merger 3 — — Adjusted EBITDA(1) $ 176 $ 244 $ 121 Adjusted EBITDA(1) margin 26.0 % 33.9 % 22.3 %


To inspire and build better lives and communities