April 20, 2022 Q1 2022 Earnings Release Exhibit 99.2
PAGE 2 DISCLAIMER FORWARD-LOOKING STATEMENTS This presentation contains forward-looking statements. Any statements about our expectations, beliefs, plans, predictions, forecasts, objectives, assumptions or future events or performance are not historical facts and may be forward-looking. You can identify forward-looking statements by the use of forward-looking terminology such as “believes,” “expects,” “could,” “may,” “will,” “should,” “seeks,” “likely,” “intends,” “plans,” “pro forma,” “projects,” “estimates” or “anticipates” or the negative of these words and phrases or similar words or phrases that are predictions of or indicate future events or trends and that do not relate solely to historical matters. You can also identify forward-looking statements by discussions of strategy, plans or intentions. Forward-looking statements involve numerous risks and uncertainties and you should not rely on them as predictions of future events. Forward-looking statements depend on assumptions, data or methods that may be incorrect or imprecise and we may not be able to realize them. We do not guarantee that the transactions and events described will happen as described (or that they will happen at all). The following factors, among others, could cause actual results and future events to differ materially from those set forth or contemplated in the forward-looking statements: business and economic conditions generally and in the bank and non-bank financial services industries, nationally and within our local market areas; the impact of COVID-19 on our business, including the impact of the actions taken by governmental authorities to try and contain the virus or address the impact of the virus on the United States economy (including, without limitation, the CARES Act), and the resulting effect of all of such items on our operations, liquidity and capital position, and on the financial condition of our borrowers and other customers; our ability to mitigate our risk exposures; our ability to maintain our historical earnings trends; changes in management personnel; interest rate risk; concentration of our products and services in the transportation industry; credit risk associated with our loan portfolio; lack of seasoning in our loan portfolio; deteriorating asset quality and higher loan charge-offs; time and effort necessary to resolve nonperforming assets; inaccuracy of the assumptions and estimates we make in establishing reserves for probable loan losses and other estimates; risks related to the integration of acquired businesses (including our acquisition of HubTran Inc. and developments related to our acquisition of Transport Financial Solutions and the related over-formula advances) and any future acquisitions; our ability to successfully identify and address the risks associated with our possible future acquisitions, and the risks that our prior and possible future acquisitions make it more difficult for investors to evaluate our business, financial condition and results of operations, and impairs our ability to accurately forecast our future performance; lack of liquidity; fluctuations in the fair value and liquidity of the securities we hold for sale; impairment of investment securities, goodwill, other intangible assets or deferred tax assets; our risk management strategies; environmental liability associated with our lending activities; increased competition in the bank and non-bank financial services industries, nationally, regionally or locally, which may adversely affect pricing and terms; the accuracy of our financial statements and related disclosures; material weaknesses in our internal control over financial reporting; system failures or failures to prevent breaches of our network security; the institution and outcome of litigation (including related to our pending litigation with the United States Postal Service and a counterparty relating to certain misdirected payments) and other legal proceedings against us or to which we become subject; changes in carry-forwards of net operating losses; changes in federal tax law or policy; the impact of recent and future legislative and regulatory changes, including changes in banking, securities and tax laws and regulations, such as the Dodd-Frank Wall Street Reform and Consumer Protection Act (the “Dodd-Frank Act”) and their application by our regulators; governmental monetary and fiscal policies; changes in the scope and cost of FDIC, insurance and other coverages; failure to receive regulatory approval for future acquisitions; and increases in our capital requirements. While forward-looking statements reflect our good-faith beliefs, they are not guarantees of future performance. All forward-looking statements are necessarily only estimates of future results. Accordingly, actual results may differ materially from those expressed in or contemplated by the particular forward-looking statement, and, therefore, you are cautioned not to place undue reliance on such statements. Further, any forward-looking statement speaks only as of the date on which it is made, and we undertake no obligation to update any forward-looking statement to reflect events or circumstances after the date on which the statement is made or to reflect the occurrence of unanticipated events or circumstances, except as required by applicable law. For a discussion of such risks and uncertainties, which could cause actual results to differ from those contained in the forward-looking statements, see “Risk Factors” and the forward-looking statement disclosure contained in Triumph’s Annual Report on Form 10-K, filed with the Securities and Exchange Commission on February 14, 2022. Non-GAAP Financial Measures This presentation includes certain non‐GAAP financial measures intended to supplement, not substitute for, comparable GAAP measures. Reconciliations of non‐GAAP financial measures to GAAP financial measures are provided at the end of the presentation. Numbers in this presentation may not sum due to rounding. Unless otherwise referenced, all data presented is as of March 31, 2022.
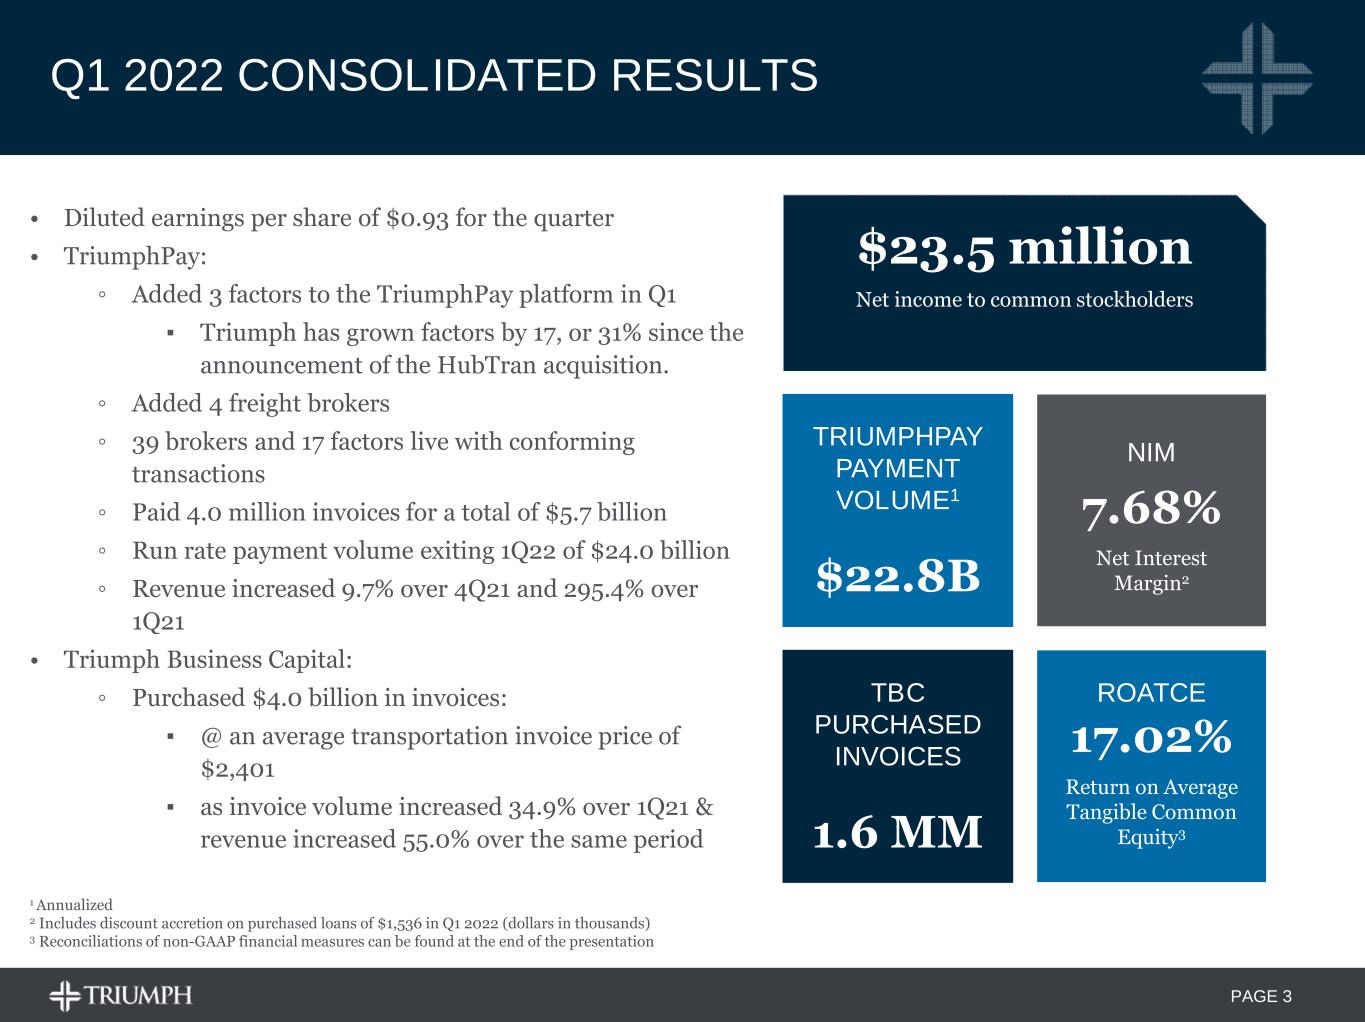
PAGE 3 Q1 2022 CONSOLIDATED RESULTS • Diluted earnings per share of $0.93 for the quarter • TriumphPay: ◦ Added 3 factors to the TriumphPay platform in Q1 ▪ Triumph has grown factors by 17, or 31% since the announcement of the HubTran acquisition. ◦ Added 4 freight brokers ◦ 39 brokers and 17 factors live with conforming transactions ◦ Paid 4.0 million invoices for a total of $5.7 billion ◦ Run rate payment volume exiting 1Q22 of $24.0 billion ◦ Revenue increased 9.7% over 4Q21 and 295.4% over 1Q21 • Triumph Business Capital: ◦ Purchased $4.0 billion in invoices: ▪ @ an average transportation invoice price of $2,401 ▪ as invoice volume increased 34.9% over 1Q21 & revenue increased 55.0% over the same period $23.5 million Net income to common stockholders TRIUMPHPAY PAYMENT VOLUME1 $22.8B NIM 7.68% Net Interest Margin2 ROATCE 17.02% Return on Average Tangible Common Equity3 TBC PURCHASED INVOICES 1.6 MM 1 Annualized 2 Includes discount accretion on purchased loans of $1,536 in Q1 2022 (dollars in thousands) 3 Reconciliations of non-GAAP financial measures can be found at the end of the presentation
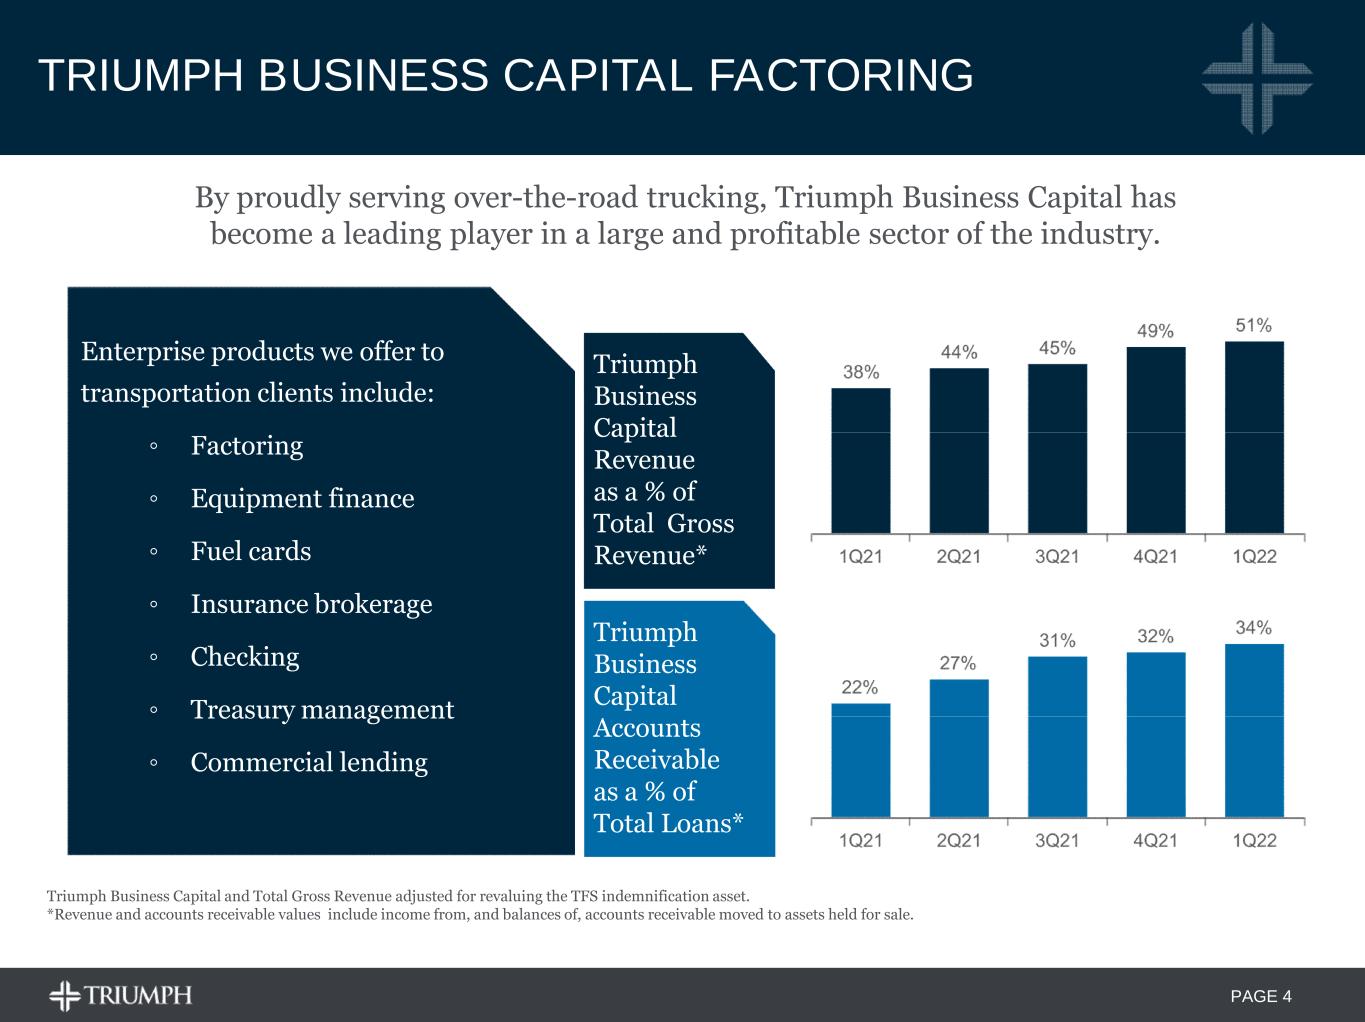
PAGE 4 TRIUMPH BUSINESS CAPITAL FACTORING Triumph Business Capital and Total Gross Revenue adjusted for revaluing the TFS indemnification asset. *Revenue and accounts receivable values include income from, and balances of, accounts receivable moved to assets held for sale. By proudly serving over-the-road trucking, Triumph Business Capital has become a leading player in a large and profitable sector of the industry. Enterprise products we offer to transportation clients include: ◦ Factoring ◦ Equipment finance ◦ Fuel cards ◦ Insurance brokerage ◦ Checking ◦ Treasury management ◦ Commercial lending Triumph Business Capital Revenue as a % of Total Gross Revenue* Triumph Business Capital Accounts Receivable as a % of Total Loans*
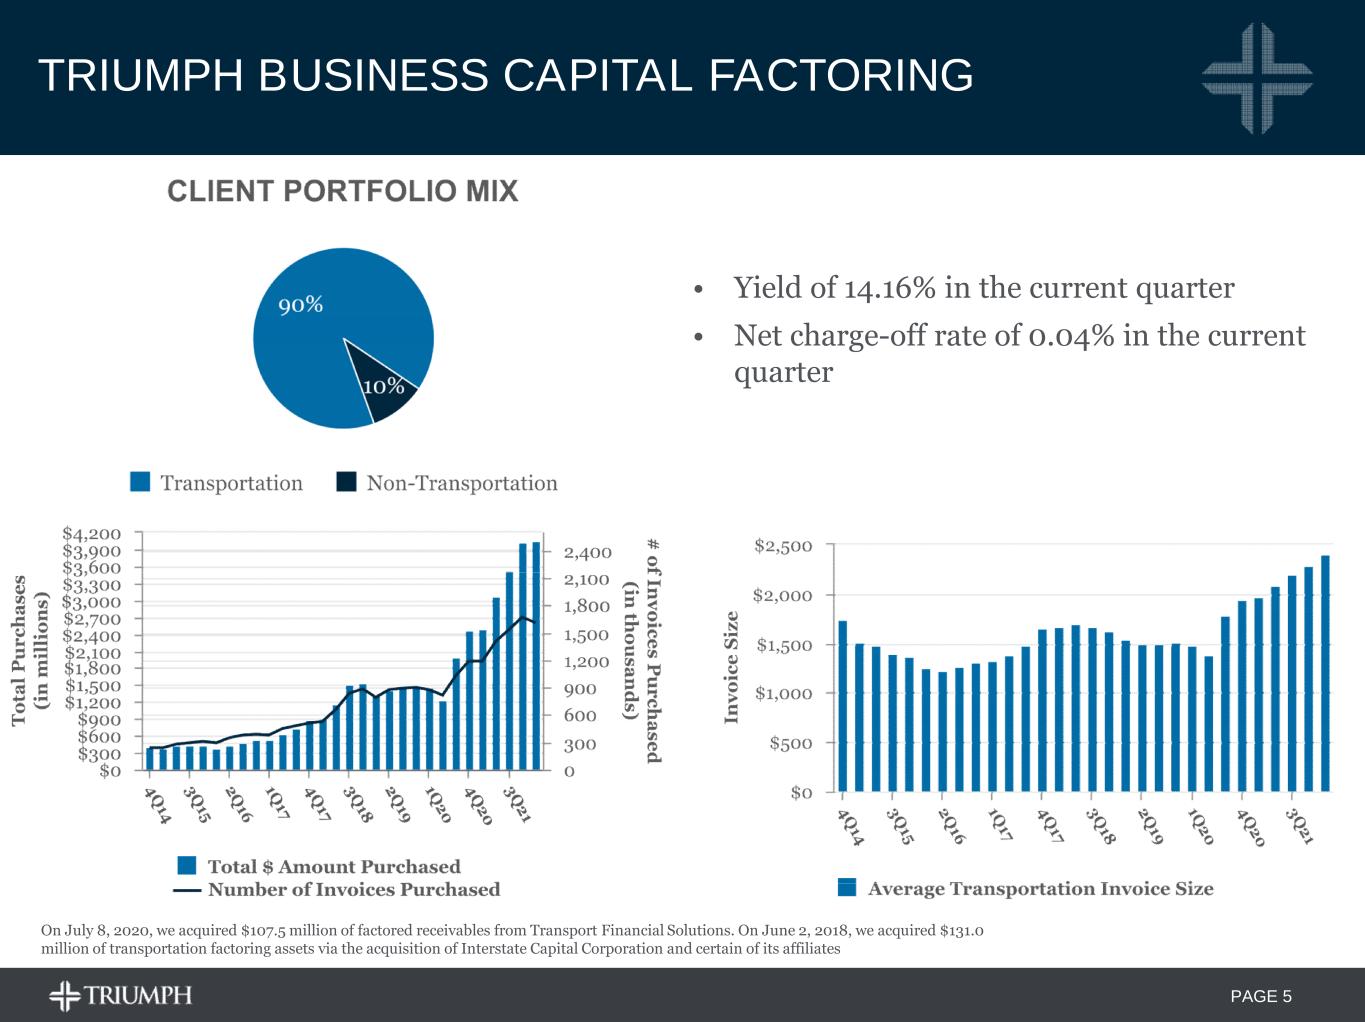
PAGE 5 TRIUMPH BUSINESS CAPITAL FACTORING • Yield of 14.16% in the current quarter • Net charge-off rate of 0.04% in the current quarter On July 8, 2020, we acquired $107.5 million of factored receivables from Transport Financial Solutions. On June 2, 2018, we acquired $131.0 million of transportation factoring assets via the acquisition of Interstate Capital Corporation and certain of its affiliates [Pie Chart] Transportation Non-Transportation 89% 11% [Bar/Line Chart] Total Purchases Number of Invoices Purchased [Bar Chart] Average Invoice Size
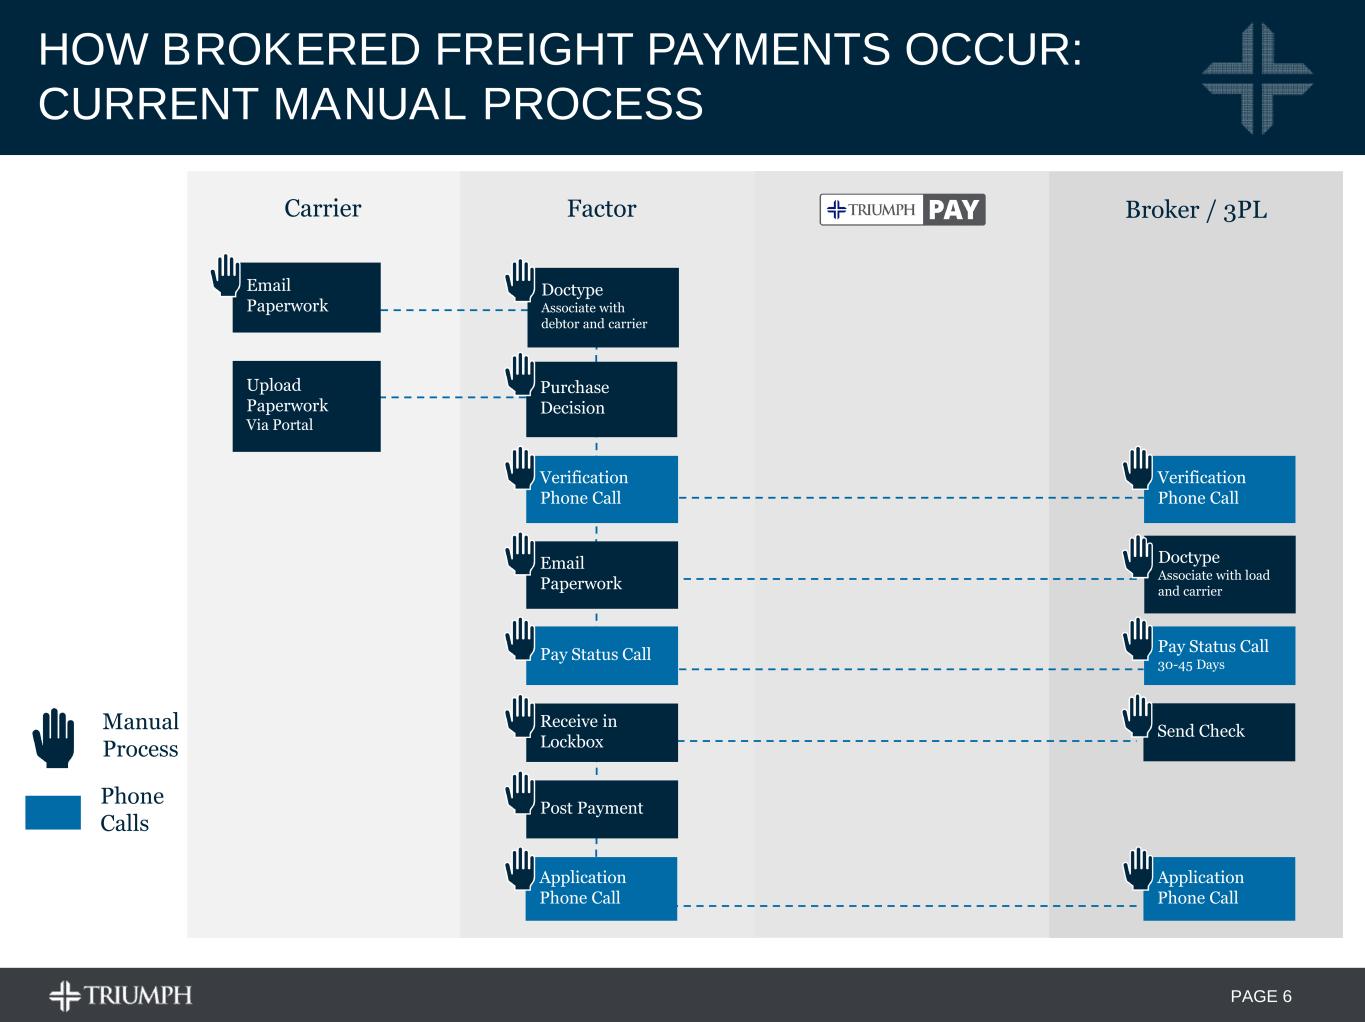
PAGE 6 Manual Process Email Paperwork Upload Paperwork Via Portal Carrier Doctype Associate with load and carrier Send Check Verification Phone Call Pay Status Call 30-45 Days Application Phone Call Phone Calls Doctype Associate with debtor and carrier Verification Phone Call Email Paperwork Pay Status Call Receive in Lockbox Post Payment Application Phone Call Purchase Decision Factor Broker / 3PL HOW BROKERED FREIGHT PAYMENTS OCCUR: CURRENT MANUAL PROCESS
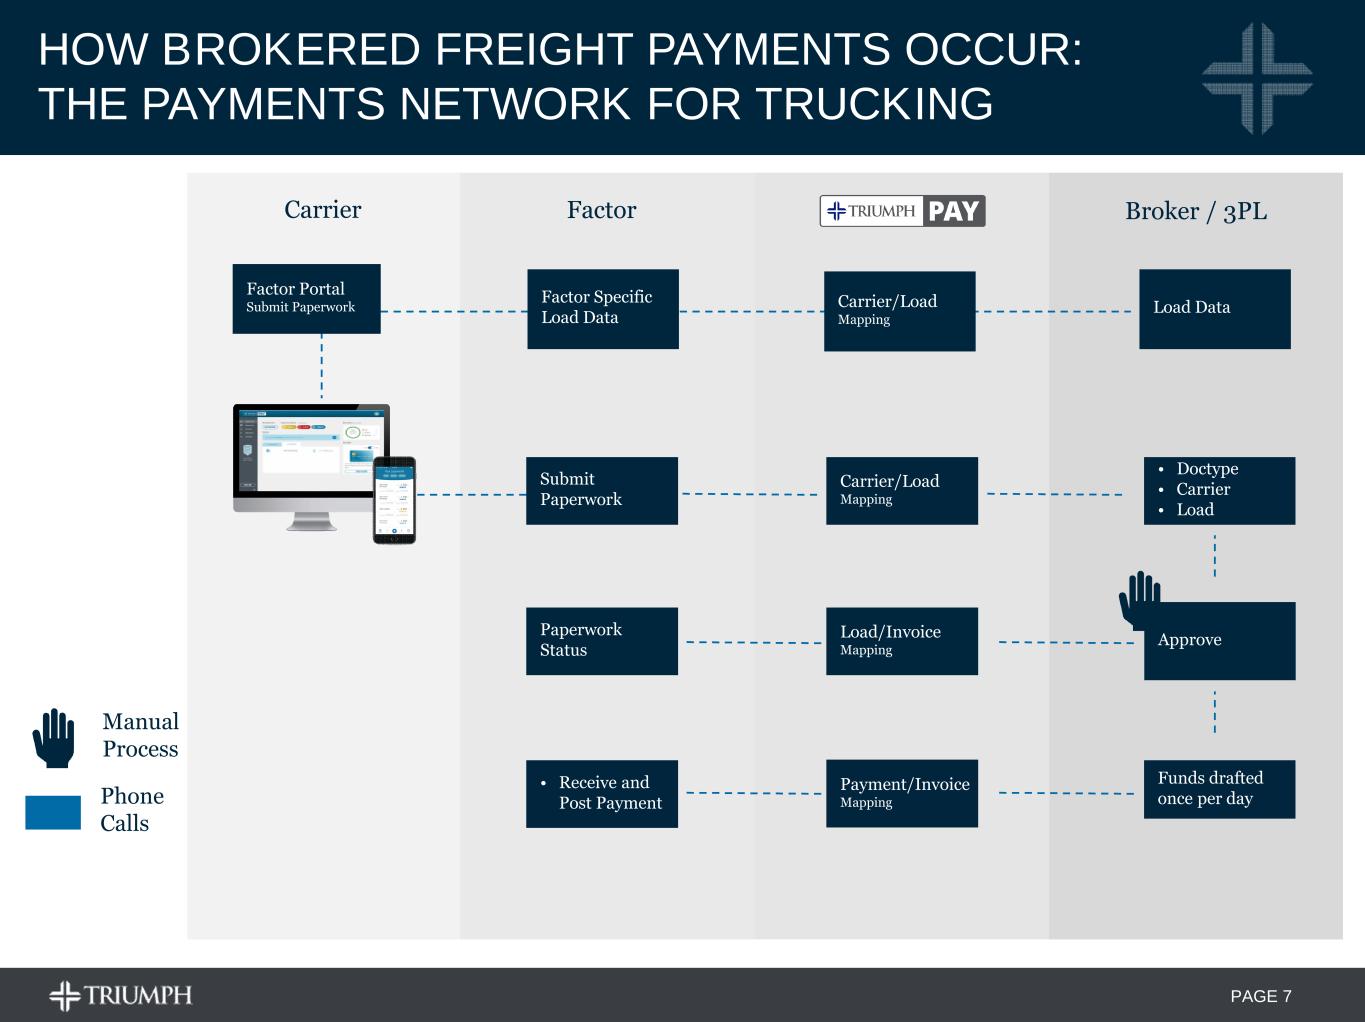
PAGE 7 Factor Portal Submit Paperwork Factor Specific Load Data Submit Paperwork Paperwork Status • Receive and Post Payment Approve • Doctype • Carrier • Load Funds drafted once per day Load Data Carrier/Load Mapping Load/Invoice Mapping Payment/Invoice Mapping Carrier/Load Mapping Manual Process Phone Calls Carrier Factor Broker / 3PL HOW BROKERED FREIGHT PAYMENTS OCCUR: THE PAYMENTS NETWORK FOR TRUCKING
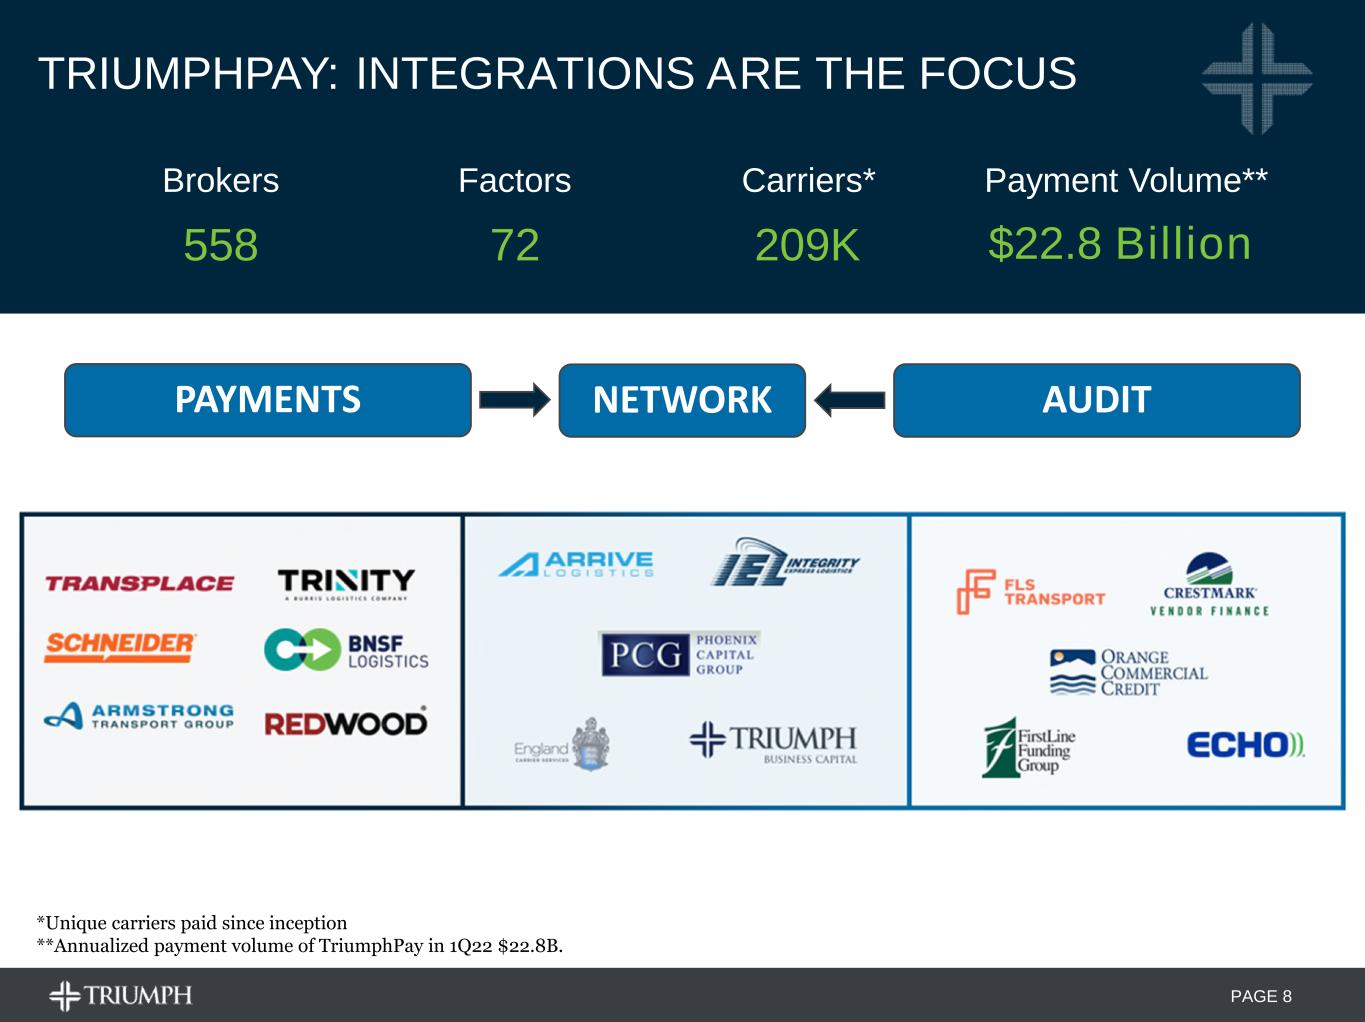
PAGE 8 Brokers 558 Factors 72 Payment Volume** $22.8 Billion Carriers* 209K *Unique carriers paid since inception **Annualized payment volume of TriumphPay in 1Q22 $22.8B. TRIUMPHPAY: INTEGRATIONS ARE THE FOCUS PAYMENTS AUDITNETWORK
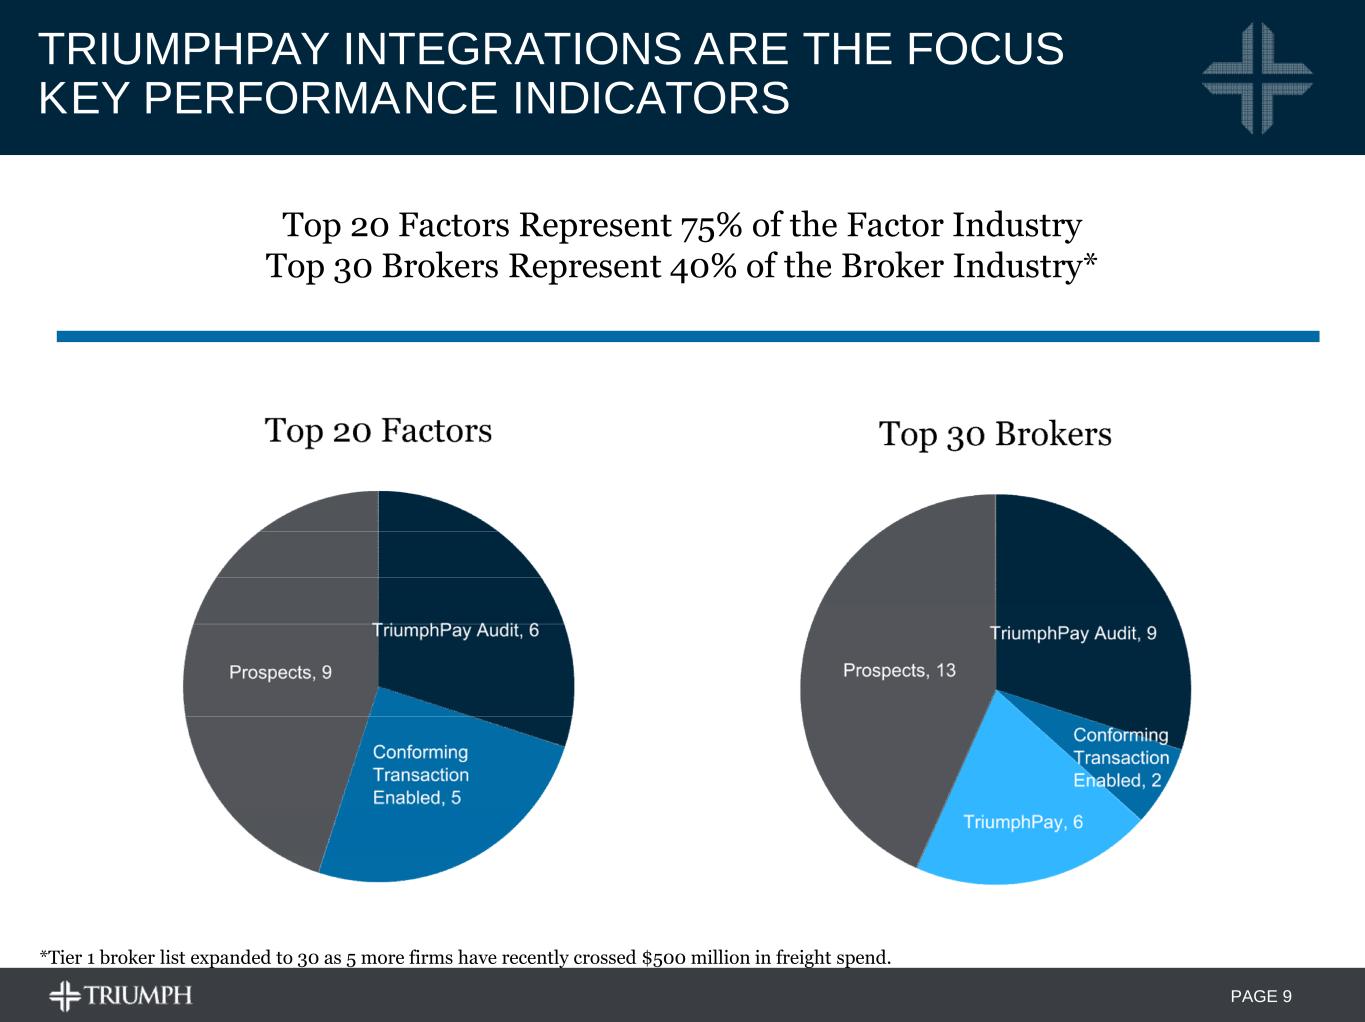
PAGE 9 TRIUMPHPAY INTEGRATIONS ARE THE FOCUS KEY PERFORMANCE INDICATORS Top 20 Factors Represent 75% of the Factor Industry Top 30 Brokers Represent 40% of the Broker Industry* *Tier 1 broker list expanded to 30 as 5 more firms have recently crossed $500 million in freight spend.
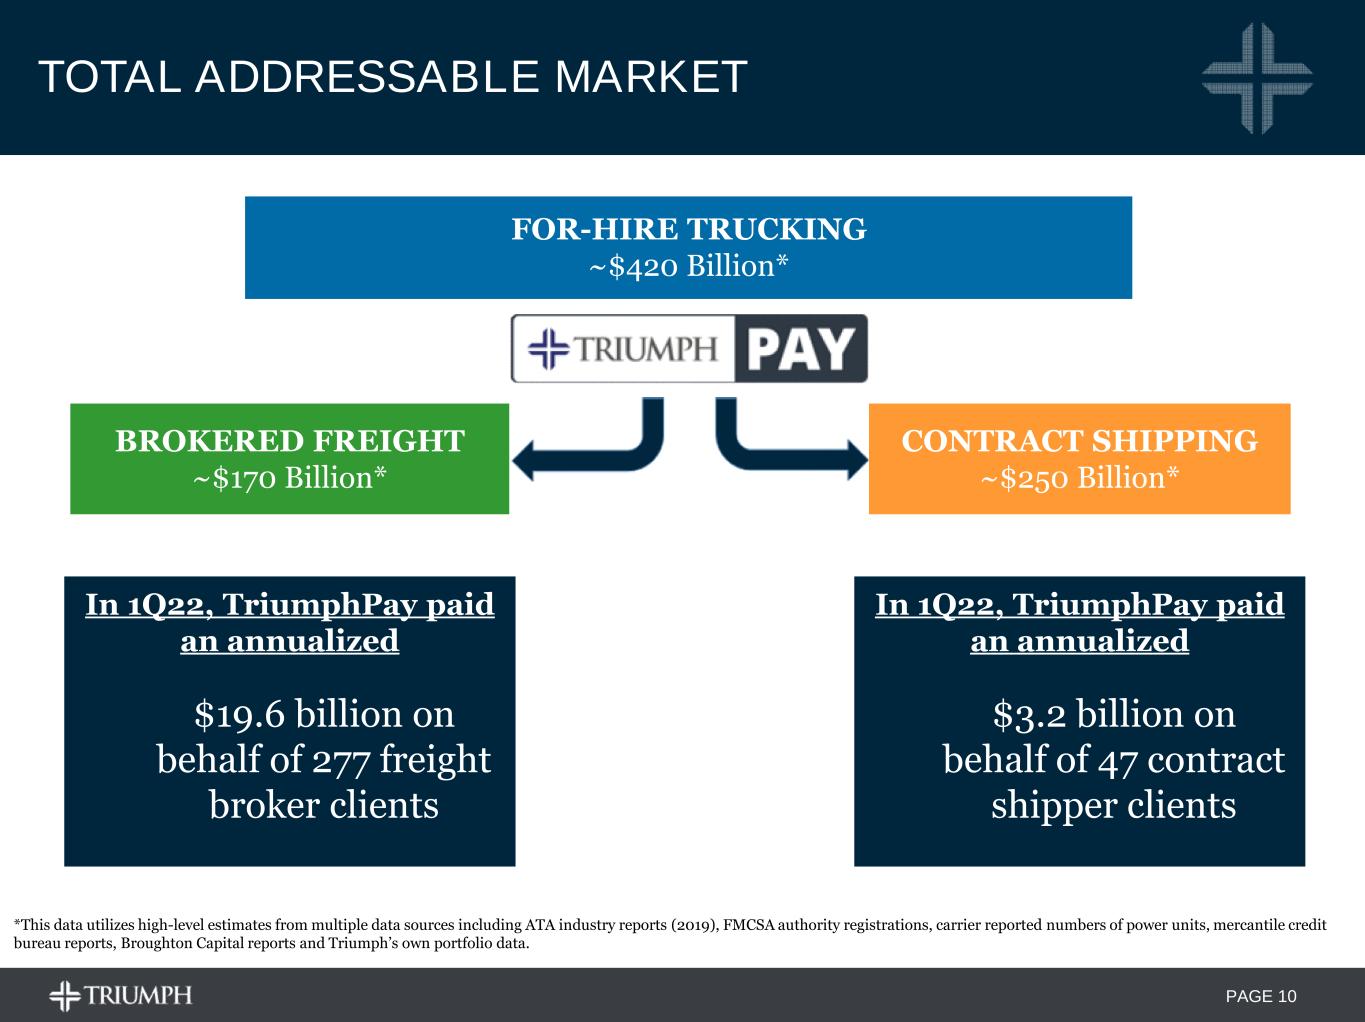
PAGE 10 FOR-HIRE TRUCKING ~$420 Billion* CONTRACT SHIPPING ~$250 Billion* BROKERED FREIGHT ~$170 Billion* *This data utilizes high-level estimates from multiple data sources including ATA industry reports (2019), FMCSA authority registrations, carrier reported numbers of power units, mercantile credit bureau reports, Broughton Capital reports and Triumph’s own portfolio data. TOTAL ADDRESSABLE MARKET In 1Q22, TriumphPay paid an annualized $19.6 billion on behalf of 277 freight broker clients In 1Q22, TriumphPay paid an annualized $3.2 billion on behalf of 47 contract shipper clients
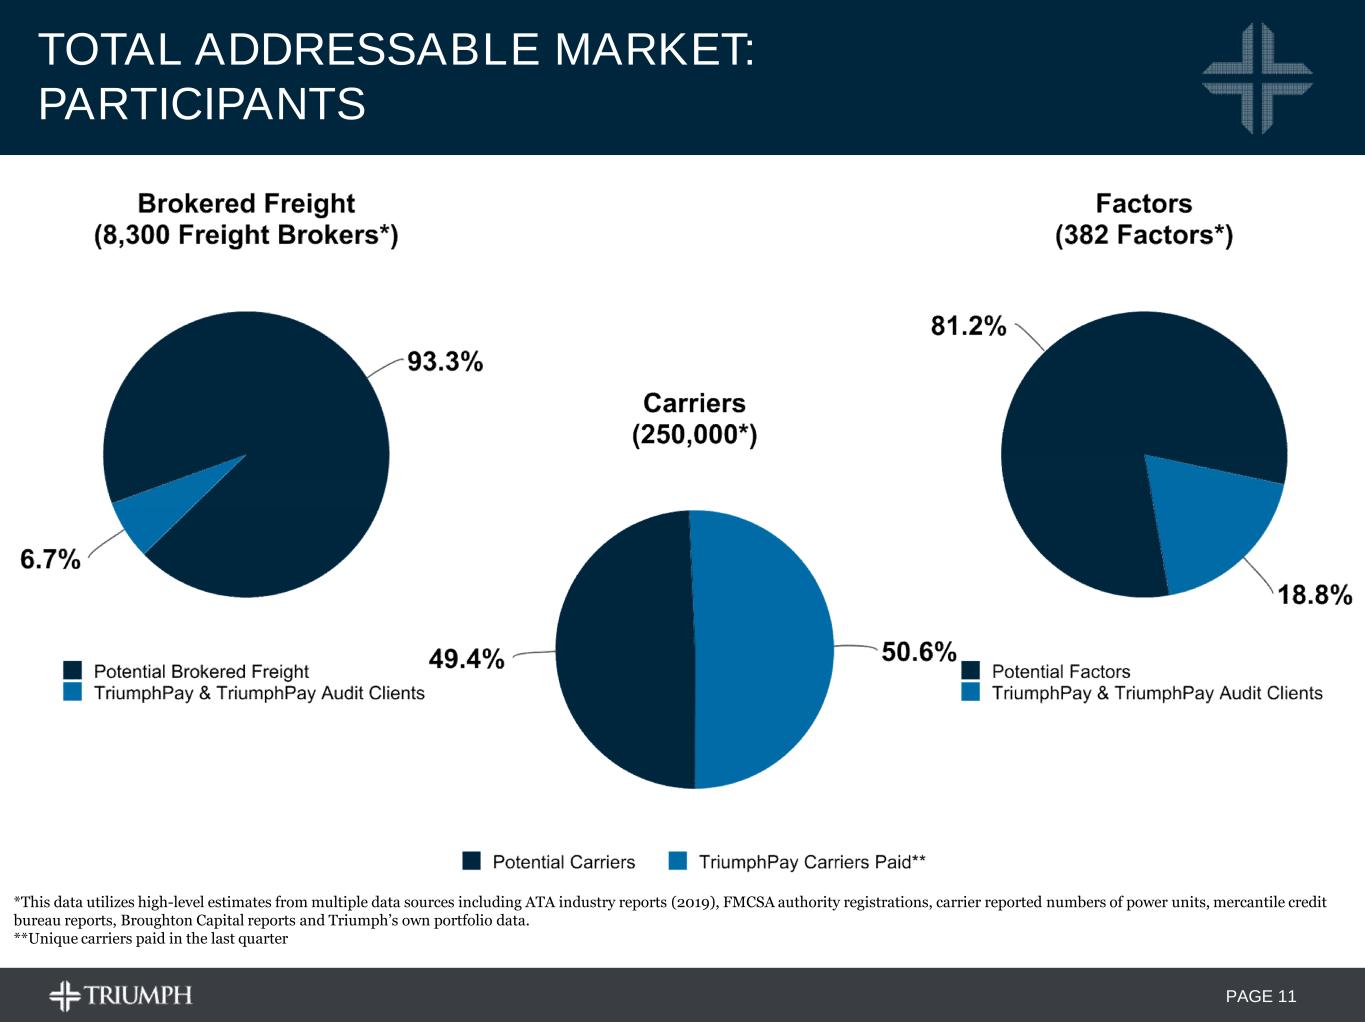
PAGE 11 *This data utilizes high-level estimates from multiple data sources including ATA industry reports (2019), FMCSA authority registrations, carrier reported numbers of power units, mercantile credit bureau reports, Broughton Capital reports and Triumph’s own portfolio data. **Unique carriers paid in the last quarter TOTAL ADDRESSABLE MARKET: PARTICIPANTS
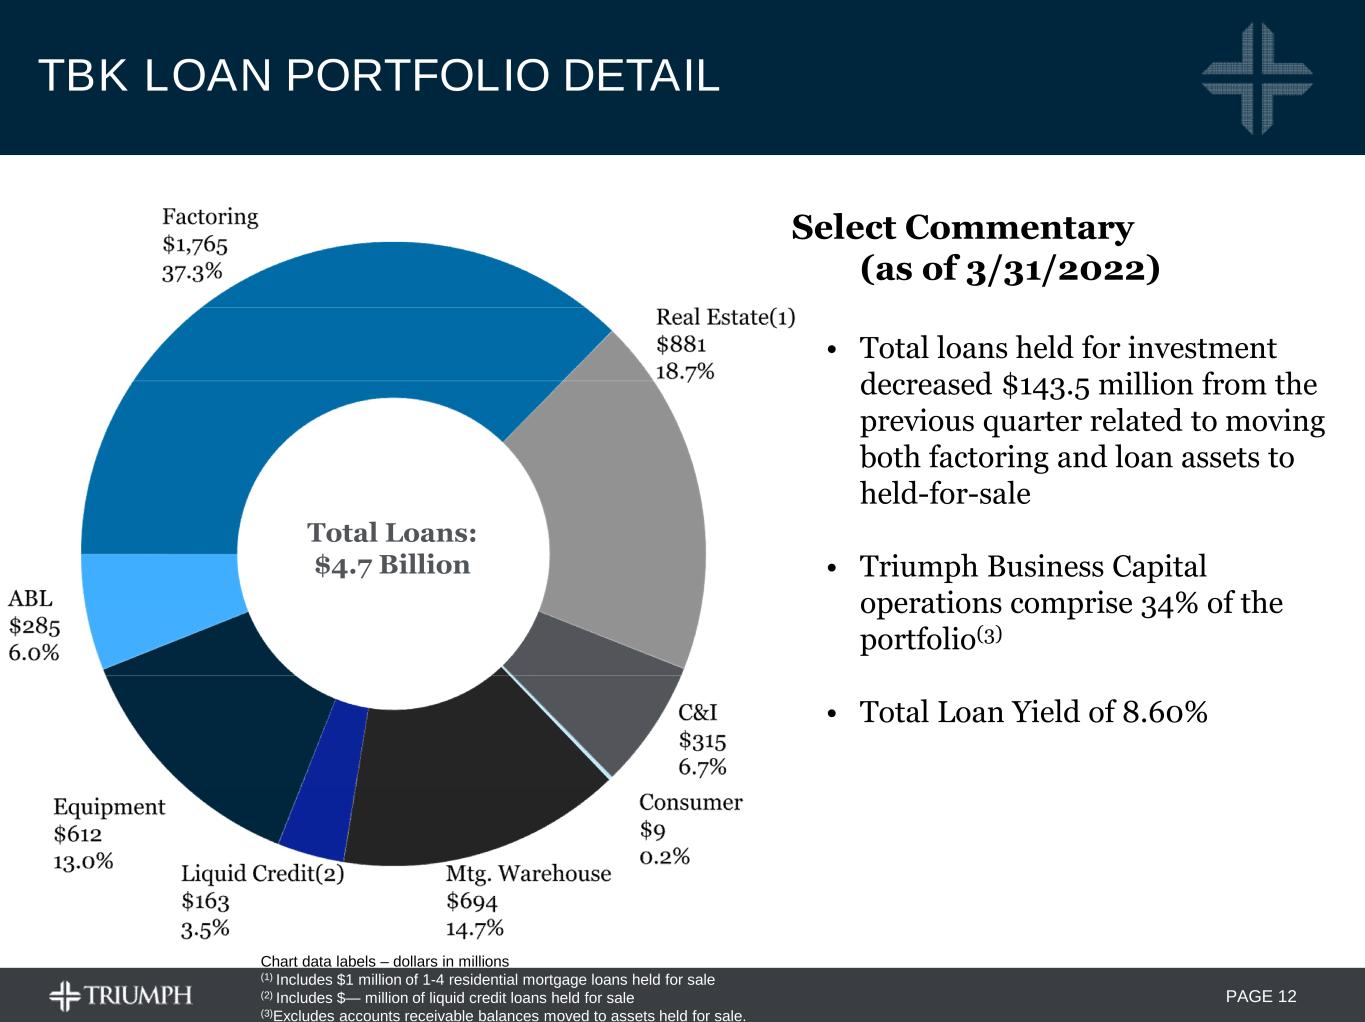
PAGE 12 TBK LOAN PORTFOLIO DETAIL Total Loans: $4.7 Billion Chart data labels – dollars in millions (1) Includes $1 million of 1-4 residential mortgage loans held for sale (2) Includes $— million of liquid credit loans held for sale (3)Excludes accounts receivable balances moved to assets held for sale. Select Commentary (as of 3/31/2022) • Total loans held for investment decreased $143.5 million from the previous quarter related to moving both factoring and loan assets to held-for-sale • Triumph Business Capital operations comprise 34% of the portfolio(3) • Total Loan Yield of 8.60%
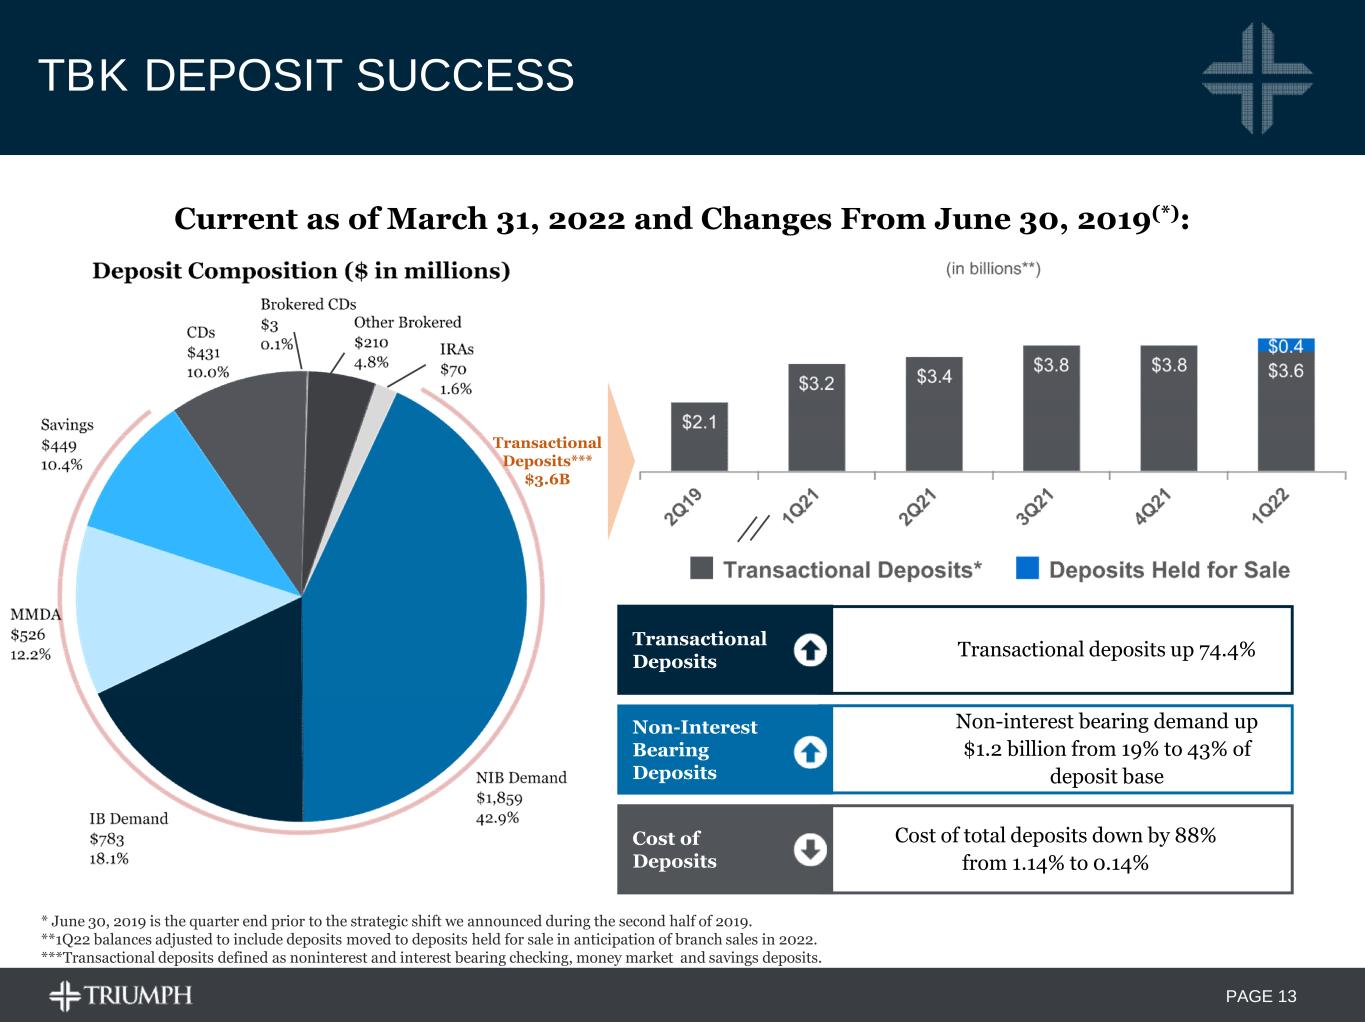
PAGE 13 TBK DEPOSIT SUCCESS * June 30, 2019 is the quarter end prior to the strategic shift we announced during the second half of 2019. **1Q22 balances adjusted to include deposits moved to deposits held for sale in anticipation of branch sales in 2022. ***Transactional deposits defined as noninterest and interest bearing checking, money market and savings deposits. Current as of March 31, 2022 and Changes From June 30, 2019(*): Transactional Deposits*** $3.6B Transactional deposits up 74.4% Transactional Deposits Non-Interest Bearing Deposits Non-interest bearing demand up $1.2 billion from 19% to 43% of deposit base Cost of Deposits Cost of total deposits down by 88% from 1.14% to 0.14%
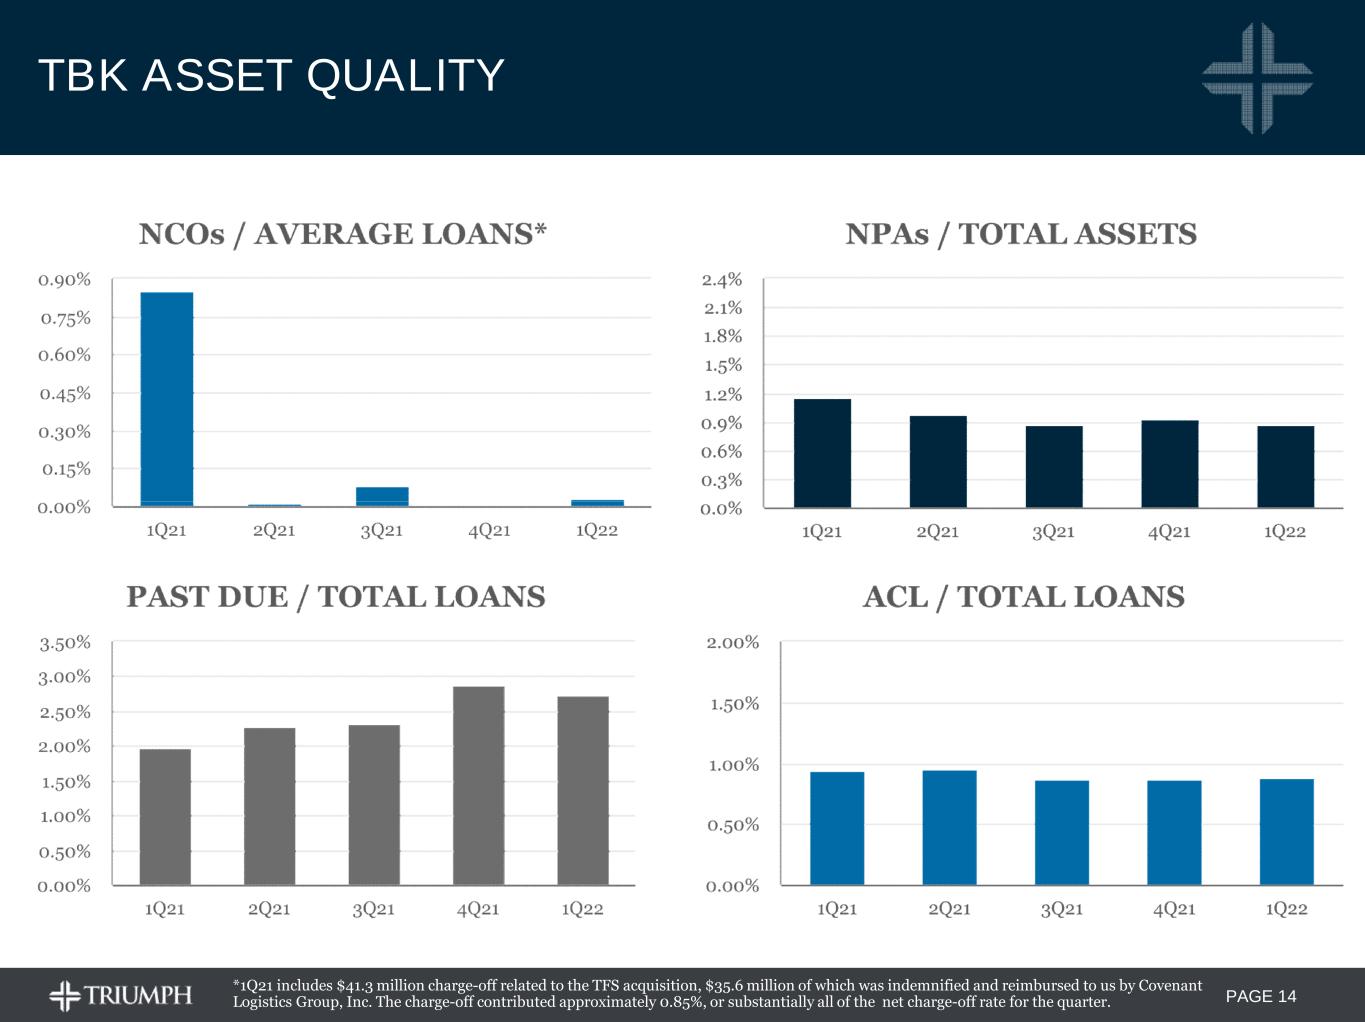
PAGE 14 TBK ASSET QUALITY *1Q21 includes $41.3 million charge-off related to the TFS acquisition, $35.6 million of which was indemnified and reimbursed to us by Covenant Logistics Group, Inc. The charge-off contributed approximately 0.85%, or substantially all of the net charge-off rate for the quarter.
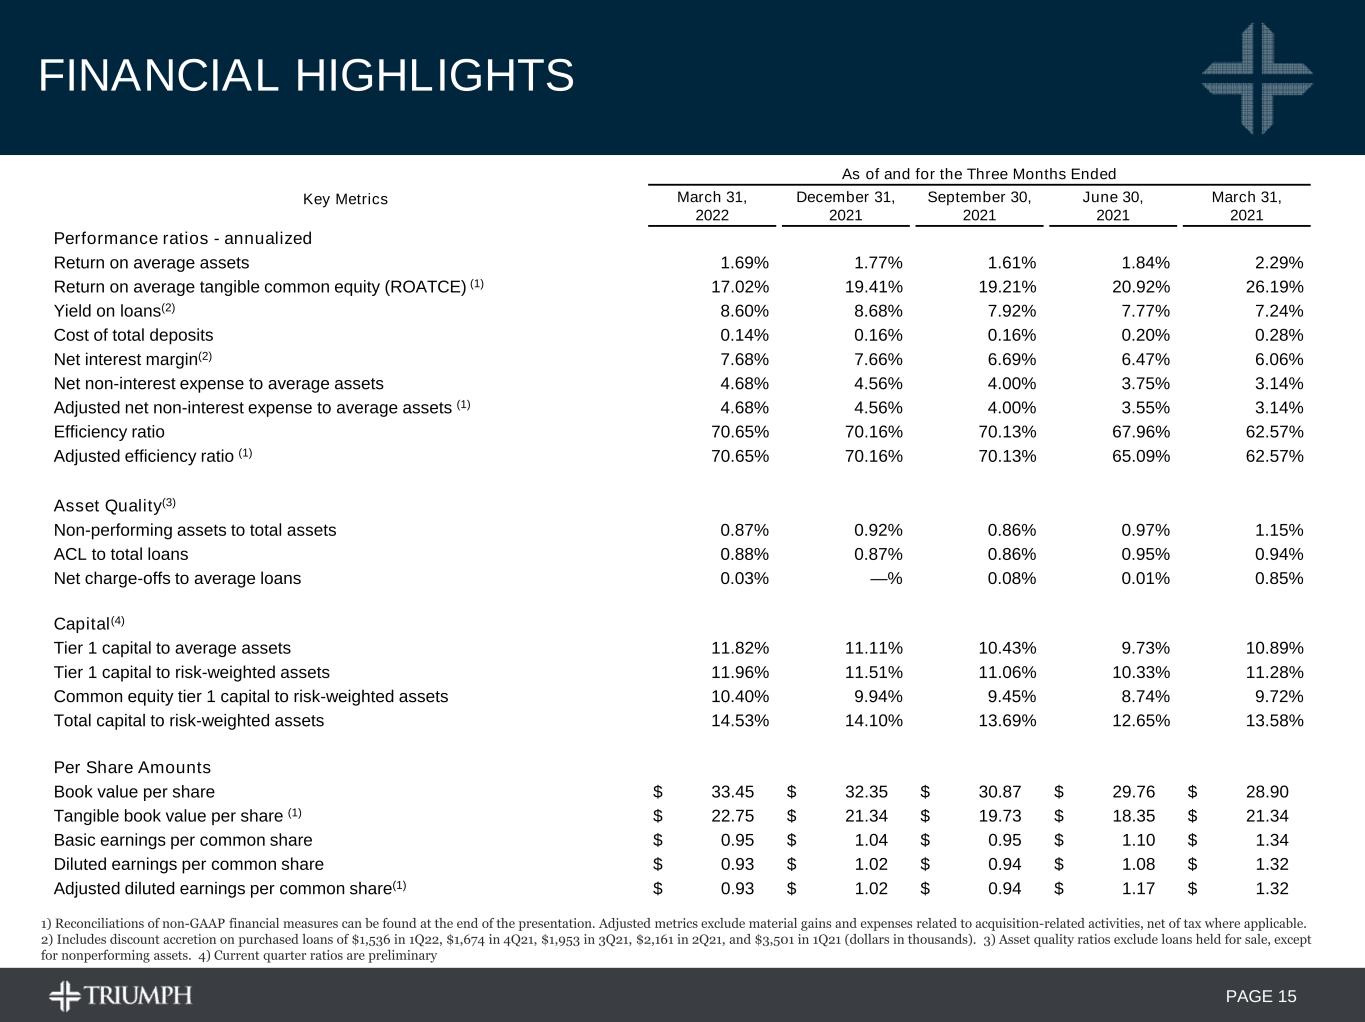
PAGE 15 FINANCIAL HIGHLIGHTS 1) Reconciliations of non-GAAP financial measures can be found at the end of the presentation. Adjusted metrics exclude material gains and expenses related to acquisition-related activities, net of tax where applicable. 2) Includes discount accretion on purchased loans of $1,536 in 1Q22, $1,674 in 4Q21, $1,953 in 3Q21, $2,161 in 2Q21, and $3,501 in 1Q21 (dollars in thousands). 3) Asset quality ratios exclude loans held for sale, except for nonperforming assets. 4) Current quarter ratios are preliminary As of and for the Three Months Ended Key Metrics March 31, 2022 December 31, 2021 September 30, 2021 June 30, 2021 March 31, 2021 Performance ratios - annualized Return on average assets 1.69% 1.77% 1.61% 1.84% 2.29% Return on average tangible common equity (ROATCE) (1) 17.02% 19.41% 19.21% 20.92% 26.19% Yield on loans(2) 8.60% 8.68% 7.92% 7.77% 7.24% Cost of total deposits 0.14% 0.16% 0.16% 0.20% 0.28% Net interest margin(2) 7.68% 7.66% 6.69% 6.47% 6.06% Net non-interest expense to average assets 4.68% 4.56% 4.00% 3.75% 3.14% Adjusted net non-interest expense to average assets (1) 4.68% 4.56% 4.00% 3.55% 3.14% Efficiency ratio 70.65% 70.16% 70.13% 67.96% 62.57% Adjusted efficiency ratio (1) 70.65% 70.16% 70.13% 65.09% 62.57% Asset Quality(3) Non-performing assets to total assets 0.87% 0.92% 0.86% 0.97% 1.15% ACL to total loans 0.88% 0.87% 0.86% 0.95% 0.94% Net charge-offs to average loans 0.03% —% 0.08% 0.01% 0.85% Capital(4) Tier 1 capital to average assets 11.82% 11.11% 10.43% 9.73% 10.89% Tier 1 capital to risk-weighted assets 11.96% 11.51% 11.06% 10.33% 11.28% Common equity tier 1 capital to risk-weighted assets 10.40% 9.94% 9.45% 8.74% 9.72% Total capital to risk-weighted assets 14.53% 14.10% 13.69% 12.65% 13.58% Per Share Amounts Book value per share $ 33.45 $ 32.35 $ 30.87 $ 29.76 $ 28.90 Tangible book value per share (1) $ 22.75 $ 21.34 $ 19.73 $ 18.35 $ 21.34 Basic earnings per common share $ 0.95 $ 1.04 $ 0.95 $ 1.10 $ 1.34 Diluted earnings per common share $ 0.93 $ 1.02 $ 0.94 $ 1.08 $ 1.32 Adjusted diluted earnings per common share(1) $ 0.93 $ 1.02 $ 0.94 $ 1.17 $ 1.32
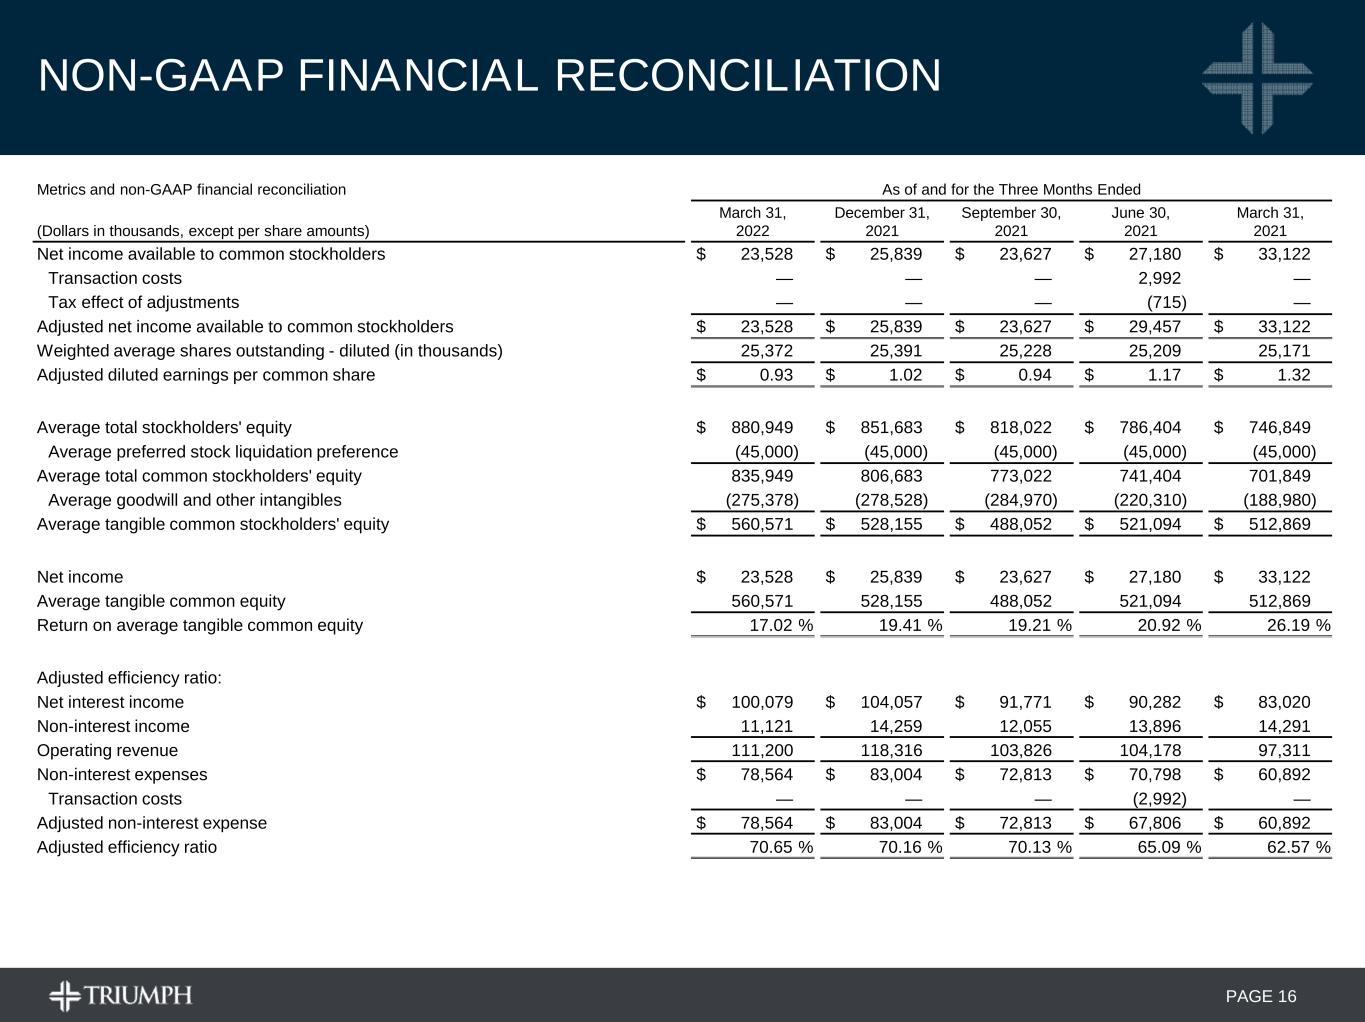
PAGE 16 NON-GAAP FINANCIAL RECONCILIATION Metrics and non-GAAP financial reconciliation As of and for the Three Months Ended December 31, September 30, June 30, March 31, December 31, (Dollars in thousands, except per share amounts) 2020 2020 2020 2020 2019 Net income available to common stockholders $31,328 $22,005 $13,440 $(4,450) $16,709 Transaction costs — 827 — — — Gain on sale of subsidiary or division — — (9,758) — — Tax effect of adjustments — (197) 2,451 — — Adjusted net income available to common stockholders $31,328 $22,635 $6,133 $(4,450) $16,709 Weighted average shares outstanding - diluted 25,053,386 24,802,388 24,074,442 24,314,329 25,254,862 Adjusted diluted earnings per common share $1.25 $0.91 $0.25 $(0.18) $0.66 Average total stockholders' equity $720,892 $688,327 $610,258 $627,369 $647,546 Average preferred stock liquidation preference (45,000) (45,000) (5,934) — — Average total common stockholders' equity 675,892 643,327 604,324 627,369 647,546 Average goodwill and other intangibles (191,017) (192,682) (187,255) (189,359) (191,551) Average tangible common stockholders' equity $484,875 $450,645 $417,069 $438,010 $455,995 Net income (loss) $31,328 $22,005 $13,440 $(4,450) $16,709 Average tangible common equity 484,875 450,645 417,069 438,010 455,995 Return on average tangible common equity 25.70% 19.43% 12.96% (4.09%) 14.54% Adjusted efficiency ratio: Net interest income $83,598 $74,379 $64,251 $62,500 $66,408 Non-interest income 22,386 10,493 20,029 7,477 8,666 Operating revenue 105,984 84,872 84,280 69,977 75,074 Gain on sale of subsidiary or division — — (9,758) — — Adjusted operating revenue $105,984 $84,872 $74,522 $69,977 $75,074 Non-interest expenses $59,298 $55,297 $52,726 $54,753 $52,661 Transaction costs — (827) — — — Adjusted non-interest expense $59,298 $54,470 $52,726 $54,753 $52,661 Adjusted efficiency ratio 55.95% 64.18% 70.75% 78.24% 70.15% Metrics and non-GAAP financial reconciliation As of and for the Three Months Ended (Dollars in thousands, except per share amounts) March 31, 2022 December 31, 2021 September 30, 2021 June 30, 2021 March 31, 2021 Net income available to common stockholders $ 23,528 $ 25,839 $ 23,627 $ 27,180 $ 33,122 Transaction costs — — — 2,992 — Tax effect of adjustments — — — (715) — Adjusted net income available to common stockholders $ 23,528 $ 25,839 $ 23,627 $ 29,457 $ 33,122 Weighted average shares outstanding - diluted (in thousands) 25,372 25,391 25,228 25,209 25,171 Adjusted diluted earnings per common share $ 0.93 $ 1.02 $ 0.94 $ 1.17 $ 1.32 Average total stockholders' equity $ 880,949 $ 851,683 $ 818,022 $ 786,404 $ 746,849 Average preferred stock liquidation preference (45,000) (45,000) (45,000) (45,000) (45,000) Average total common stockholders' equity 835,949 806,683 773,022 741,404 701,849 Average goodwill and other intangibles (275,378) (278,528) (284,970) (220,310) (188,980) Average tangible common stockholders' equity $ 560,571 $ 528,155 $ 488,052 $ 521,094 $ 512,869 Net income $ 23,528 $ 25,839 $ 23,627 $ 27,180 $ 33,122 Average tangible common equity 560,571 528,155 488,052 521,094 512,869 Return on average tangible common equity 17.02 % 19.41 % 19.21 % 20.92 % 26.19 % Adjusted efficiency ratio: Net interest income $ 100,079 $ 104,057 $ 91,771 $ 90,282 $ 83,020 Non-interest income 11,121 14,259 12,055 13,896 14,291 Operating revenue 111,200 118,316 103,826 104,178 97,311 Non-interest expenses $ 78,564 $ 83,004 $ 72,813 $ 70,798 $ 60,892 Transaction costs — — — (2,992) — Adjusted non-interest expense $ 78,564 $ 83,004 $ 72,813 $ 67,806 $ 60,892 Adjusted efficiency ratio 70.65 % 70.16 % 70.13 % 65.09 % 62.57 %
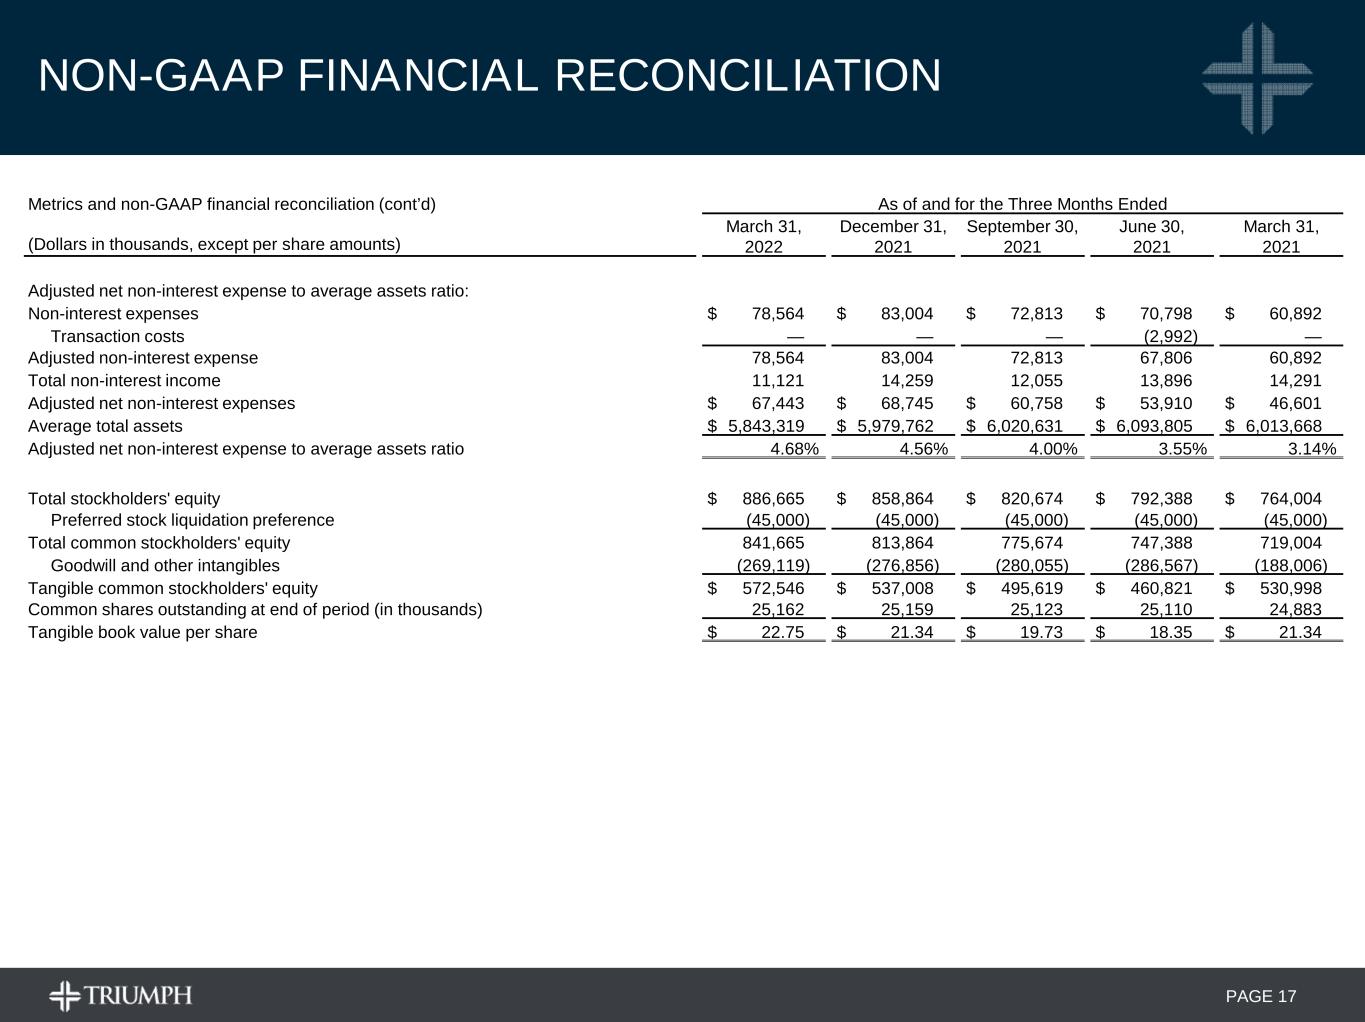
PAGE 17 NON-GAAP FINANCIAL RECONCILIATION Metrics and non-GAAP financial reconciliation (cont'd) As of and for the Three Months Ended December 31, September 30, June 30, March 31, December 31, (Dollars in thousands, except per share amounts) 2020 2020 2020 2020 2019 Adjusted net non-interest expense to average assets ratio: Non-interest expenses $59,298 $55,297 $52,726 $54,753 $52,661 Transaction costs — (827) — — — Adjusted non-interest expense 59,298 54,470 52,726 54,753 52,661 Total non-interest income 22,386 10,493 20,029 7,477 8,666 Gain on sale of subsidiary or division — — (9,758) — — Adjusted non-interest income $22,386 $10,493 $10,271 $7,477 $8,666 Adjusted net non-interest expenses $36,912 $43,977 $42,455 $47,276 $43,995 Average total assets $5,788,549 $5,518,708 $5,487,072 $4,906,547 $5,050,860 Adjusted net non-interest expense to average assets ratio 2.54% 3.17% 3.11% 3.88% 3.46% Total stockholders' equity $726,781 $693,842 $656,871 $589,347 $636,590 Preferred stock liquidation preference (45,000) (45,000) (45,000) — — Total common stockholders' equity 681,781 648,842 611,871 589,347 636,590 Goodwill and other intangibles (189,922) (192,041) (186,162) (188,208) (190,286) Tangible common stockholders' equity $491,859 $456,801 $425,709 $401,139 $446,304 Common shares outstanding at end of period 24,868,218 24,851,601 24,202,686 24,101,120 24,964,961 Tangible book value per share $19.78 $18.38 $17.59 $16.64 $17.88 Total assets at end of period $5,935,791 $5,836,787 $5,617,493 $5,353,729 $5,060,297 Goodwill and other intangibles (189,922) (192,041) (186,162) (188,208) (190,286) Tangible assets at period end $5,745,869 $5,644,746 $5,431,331 $5,165,521 $4,870,011 Tangible common stockholders' equity ratio 8.56% 8.09% 7.84% 7.77% 9.16% Metrics and non-GAAP financial reconciliation (cont’d) As of and for the Three Months Ended (Dollars in thousands, except per share amounts) March 31, 2022 December 31, 2021 September 30, 2021 June 30, 2021 March 31, 2021 Adjusted net non-interest expense to average assets ratio: Non-interest expenses $ 78,564 $ 83,004 $ 72,813 $ 70,798 $ 60,892 Transaction costs — — — (2,992) — Adjusted non-interest expense 78,564 83,004 72,813 67,806 60,892 Total non-interest income 11,121 14,259 12,055 13,896 14,291 Adjusted net non-interest expenses $ 67,443 $ 68,745 $ 60,758 $ 53,910 $ 46,601 Average total assets $ 5,843,319 $ 5,979,762 $ 6,020,631 $ 6,093,805 $ 6,013,668 Adjusted net non-interest expense to average assets ratio 4.68% 4.56% 4.00% 3.55% 3.14% Total stockholders' equity $ 886,665 $ 858,864 $ 820,674 $ 792,388 $ 764,004 Preferred stock liquidation preference (45,000) (45,000) (45,000) (45,000) (45,000) Total common stockholders' equity 841,665 813,864 775,674 747,388 719,004 Goodwill and other intangibles (269,119) (276,856) (280,055) (286,567) (188,006) Tangible common stockholders' equity $ 572,546 $ 537,008 $ 495,619 $ 460,821 $ 530,998 Common shares outstanding at end of period (in thousands) 25,162 25,159 25,123 25,110 24,883 Tangible book value per share $ 22.75 $ 21.34 $ 19.73 $ 18.35 $ 21.34