Tecogen Reports Record Product Revenues for Full Year 2019
Generates Full Year '19 Adjusted EBITDA(1) of $114 thousand
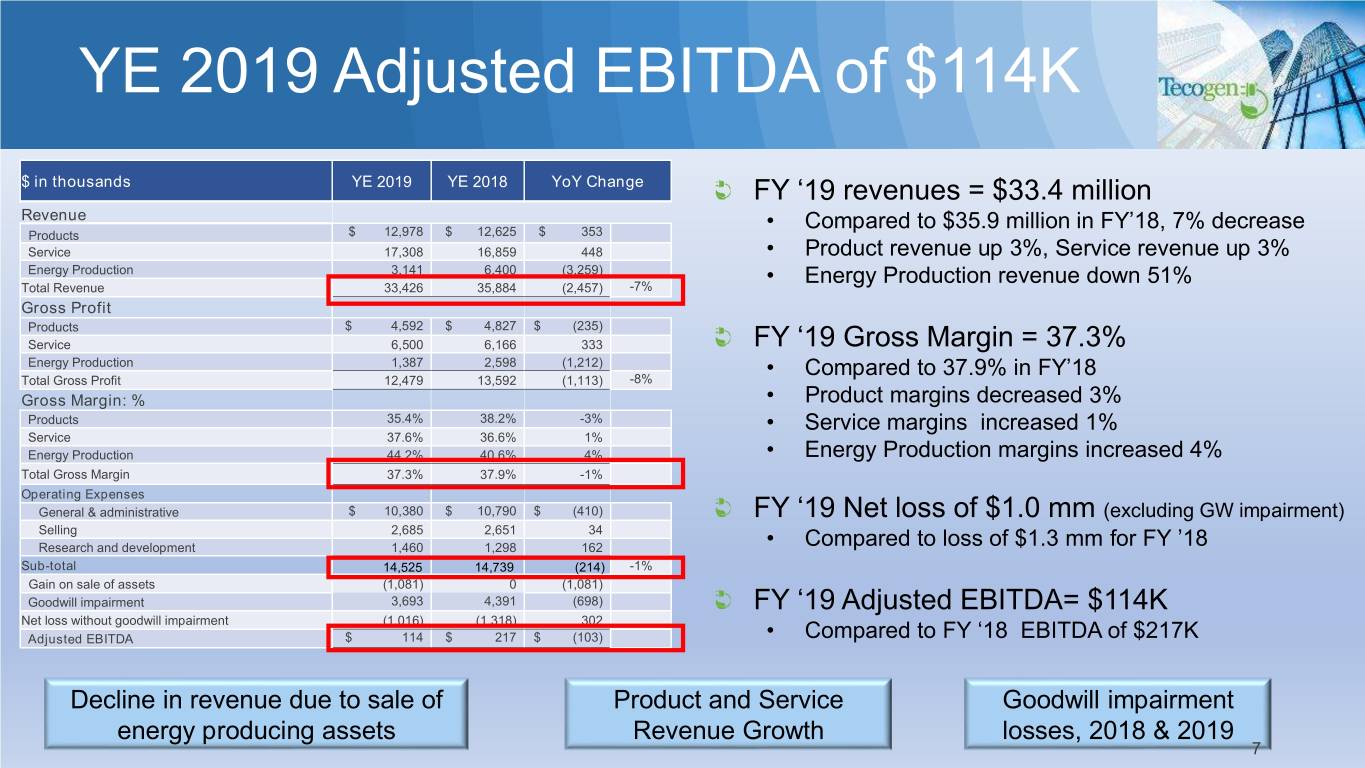
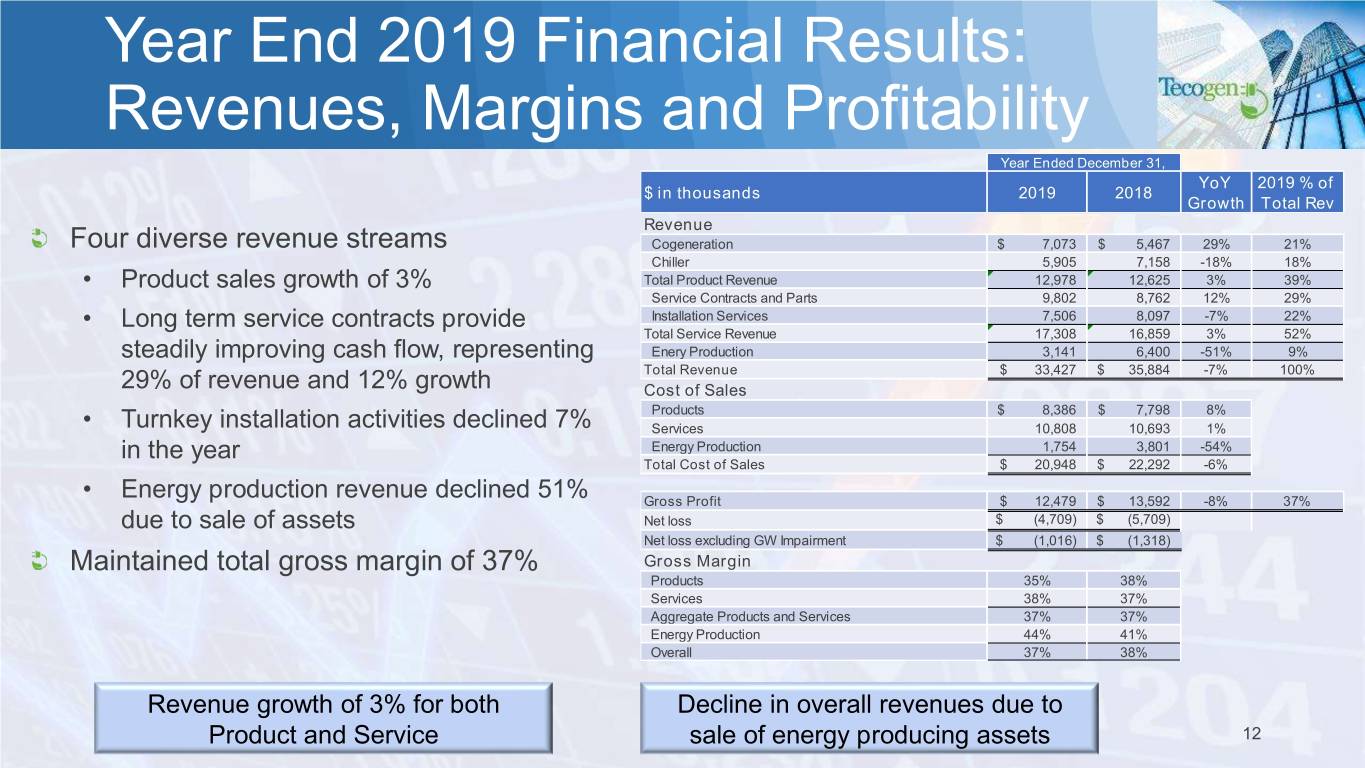
WALTHAM, Mass., March 12, 2020, Tecogen Inc. (NASDAQ:TGEN, the "Company"), a leading manufacturer of clean energy products, reported revenues of $33.4 million for the year ended December 31, 2019 compared to $35.9 million for the same period in 2018, a 7% decrease. The decline in top line revenues was due to a 51% or $3.3 million reduction in energy production revenue from the sale of several energy producing assets at the end of 2018 and early 2019. Product and services revenues were both up 3% for the year compared to 2018.
Gross profit was $12.5 million for the year ended December 31, 2019 compared to $13.6 million for the prior year. Gross margin for 2019 was 37% compared to 38% for 2018.
Operating expenses for the year ended December 31, 2019 decreased 10% as compared to 2018. While selling and research and development expenses have increased by 1% and 13%, respectively, general and administrative costs have decreased by $411 thousand or 4% as compared to 2018.
Net loss, exclusive of goodwill impairment for the year ended December 31, 2019 was $1.0 million compared to $1.3 million for the same period in 2018, an improvement of $302 thousand or 23%.
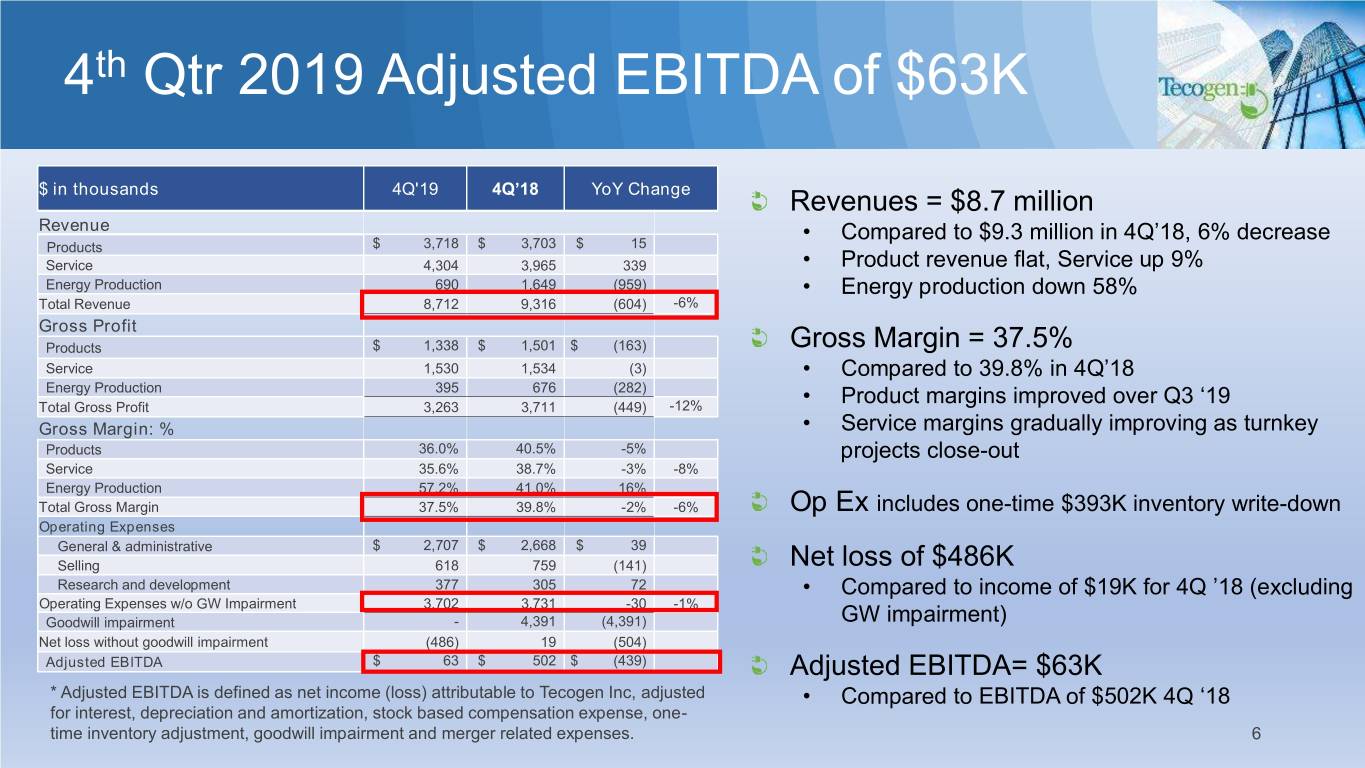
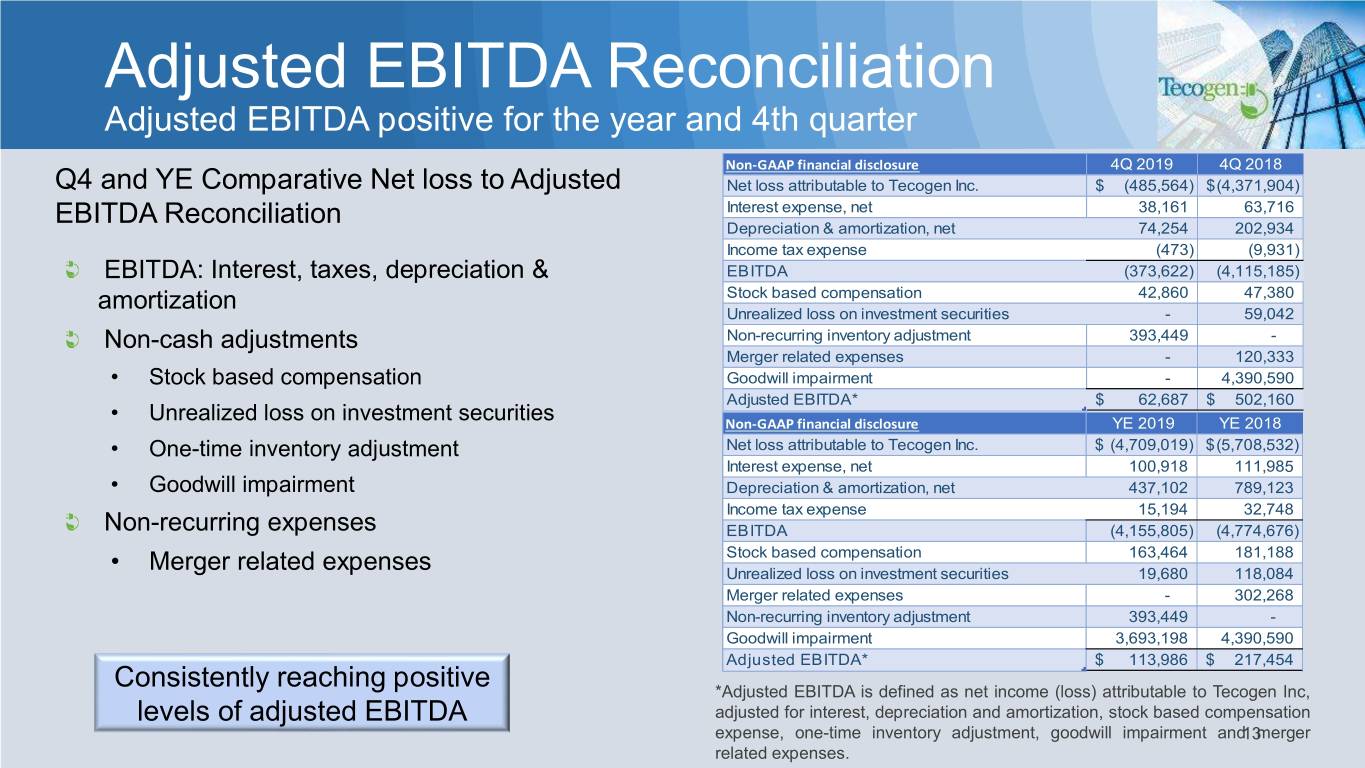
Adjusted EBITDA(1) was $63 thousand and $114 thousand for the quarter and year ended December 31, 2019, respectively, compared to $502 thousand and $217 thousand for the quarter and year ended December 31, 2018. (Adjusted EBITDA is defined as net income or loss attributable to Tecogen, adjusted for interest, income taxes, depreciation and amortization, stock-based compensation expense, unrealized gain or loss on equity securities, goodwill impairment charges, one-time inventory adjustment and merger related expenses. See table following the statements of operations for a reconciliation from net income (loss) to Adjusted EBITDA as well as important disclosures about the company's use of Adjusted EBITDA).
The fourth quarter of 2019 included a one-time, non-cash adjustment to inventory of approximately $393 thousand.
The Company completed the sale of six American DG Energy power purchase agreements and related assets for an aggregate price of $5 million in 2019, resulting in charges for goodwill impairment in the amount of $3.7 million. Tecogen continues to provide maintenance for the equipment and various management functions for the duration of these power purchase agreements. Performance incentives were also included for energy savings in excess of agreed minimums, which will be split evenly by the parties.
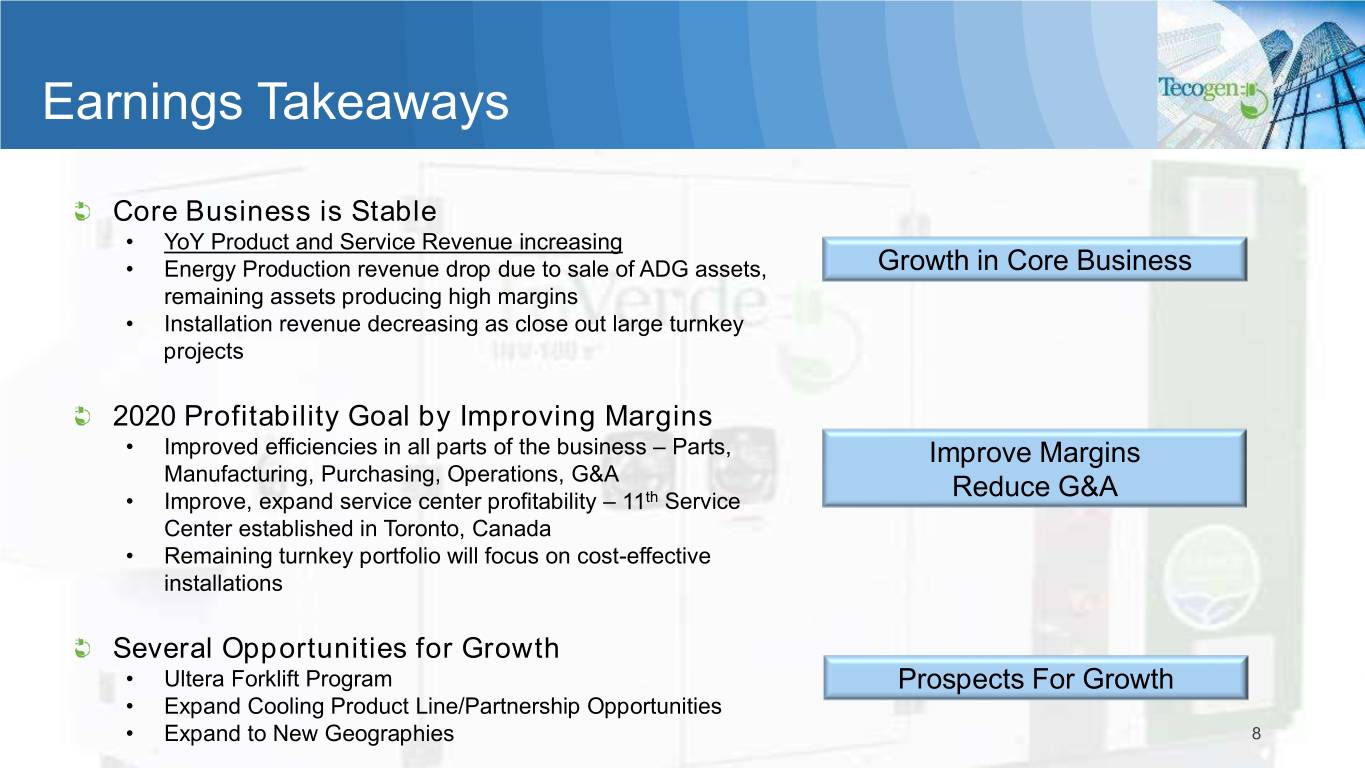
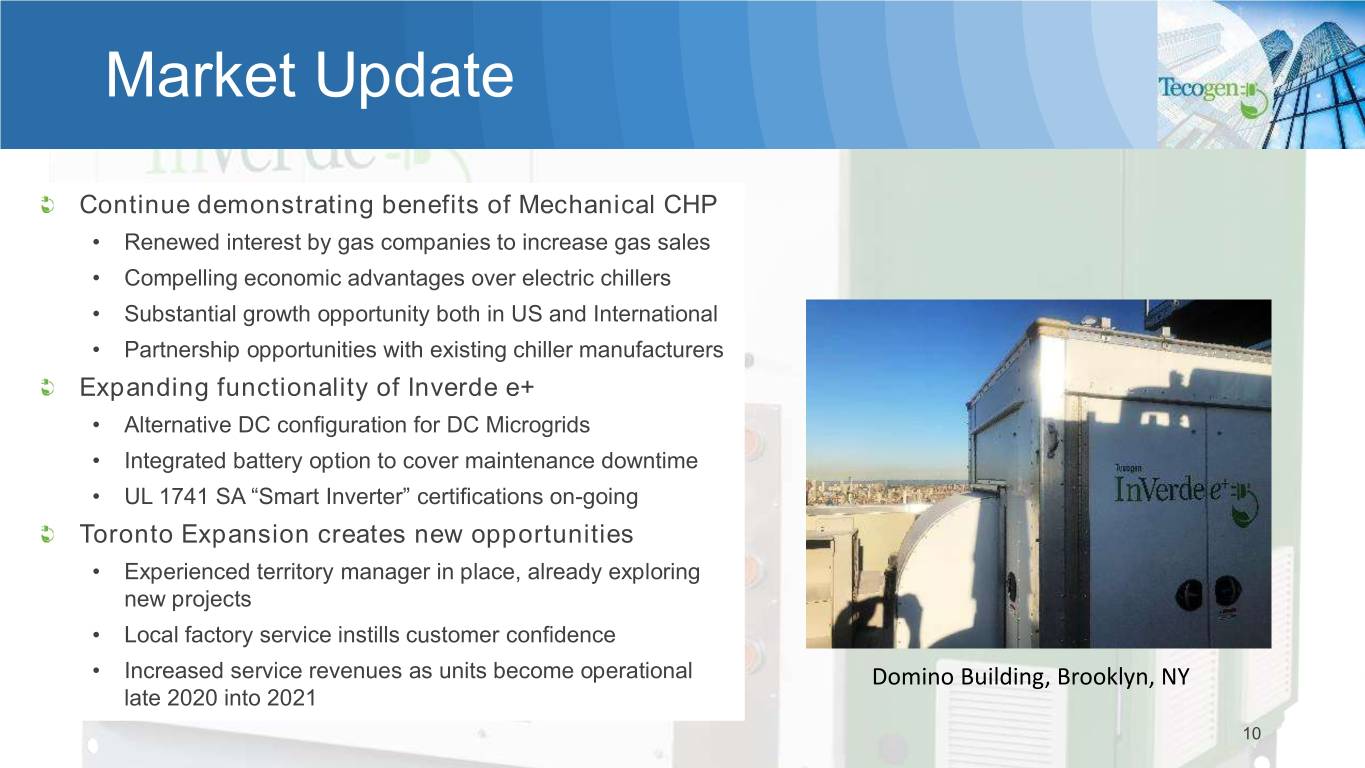
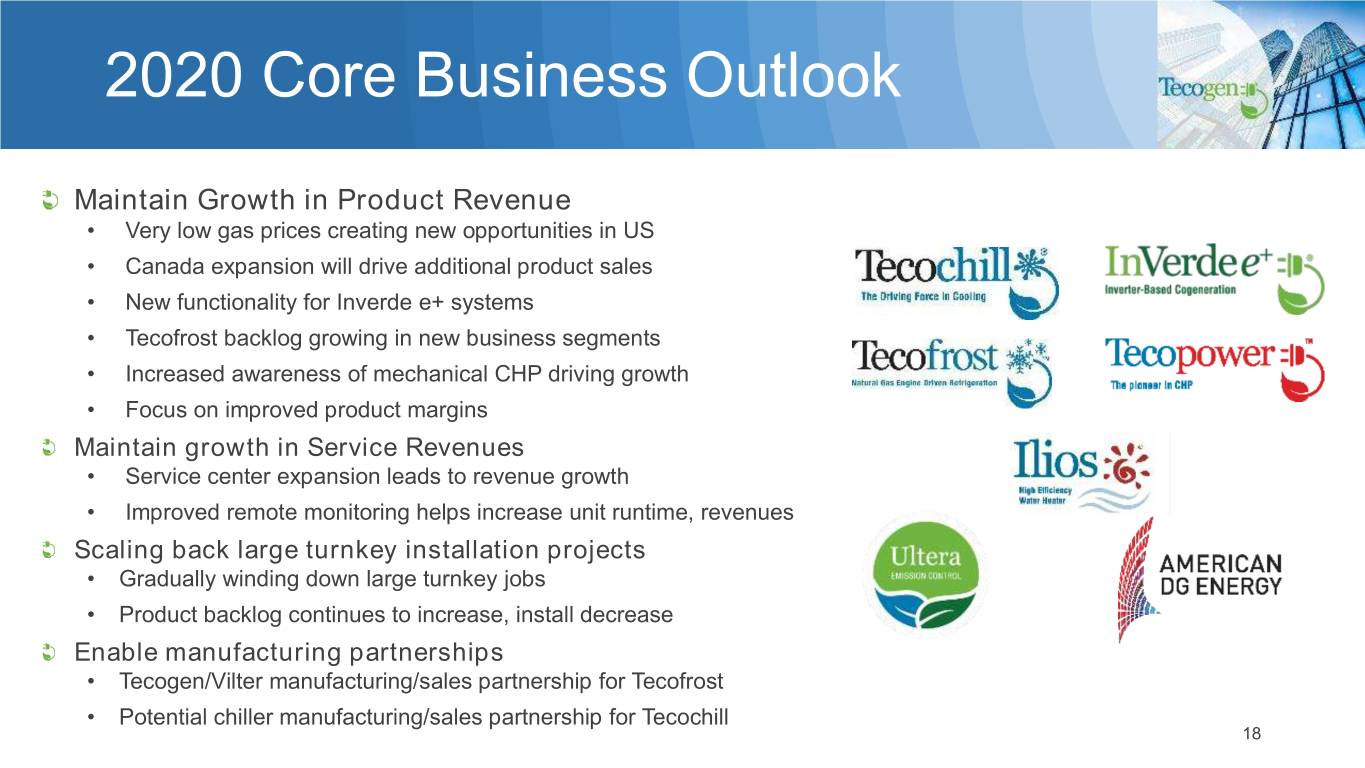
“I am happy that our product sales and service were both up for the year,” noted Benjamin Locke, Tecogen CEO. “The sale of some of our energy assets earlier in the year provided us with the resources to continue investing in our core business. We expect continued growth in our product and services segments in 2020 as we expand to new geographies including our 11th service center recently established in Toronto, Canada.”
2019 Major Highlights:
Financial - Year end
| |
• | Working capital as of December 31, 2019 was $14.5 million compared to $13.2 million as of December 31, 2018, an increase of $1.3 million or 10%. |
| |
• | Revenue for the year ended December 31, 2019 was $33.4 million compared to $35.9 million for the same period in 2018, a decrease of 7% due to the sale of energy producing assets during the year. |
| |
• | Product revenue for the full year 2019 was $13.0 million compared to $12.6 million for the full year 2018, an increase of 3%. Cogeneration sales increased to $7.1 million, or 29% over 2018. Chiller sales declined by 18% in 2019, compared to 2018. |
| |
• | Service revenue for the full year 2019 was $17.3 million, showing 3% growth from the $16.9 million in service-related revenues in 2018. Full year 2019 service revenue benefited from 12% growth in maintenance revenue. |
| |
• | Energy production revenue for the year ended December 31, 2019 was $3.1 million, providing a gross margin of 44% and gross profit of $1.4 million. For the year ended December 31, 2018, gross margin for energy production was 41%, with gross profit of $2.6 million, providing an increase in gross margin of 9%, and a decrease of $1.2 million in gross profit as a result of the sale of certain energy producing assets. |
| |
• | Full year 2019 consolidated gross margin was 37% compared to 38% in 2018. |
| |
• | The Company recorded goodwill impairment in the first quarter of 2019 in the amount of $3.7 million, which represents the excess of the carrying value of the Company's energy production reporting unit over its estimated fair value based primarily on a discounted cash flow analysis. This impairment was largely due to the sale of the energy producing assets underlying this goodwill. |
| |
• | Net loss before goodwill impairment for the year ended December 31, 2019 was $1.0 million compared to a loss exclusive of goodwill impairment of $1.3 million for the same period in 2018. |
Financial - 4th Quarter
| |
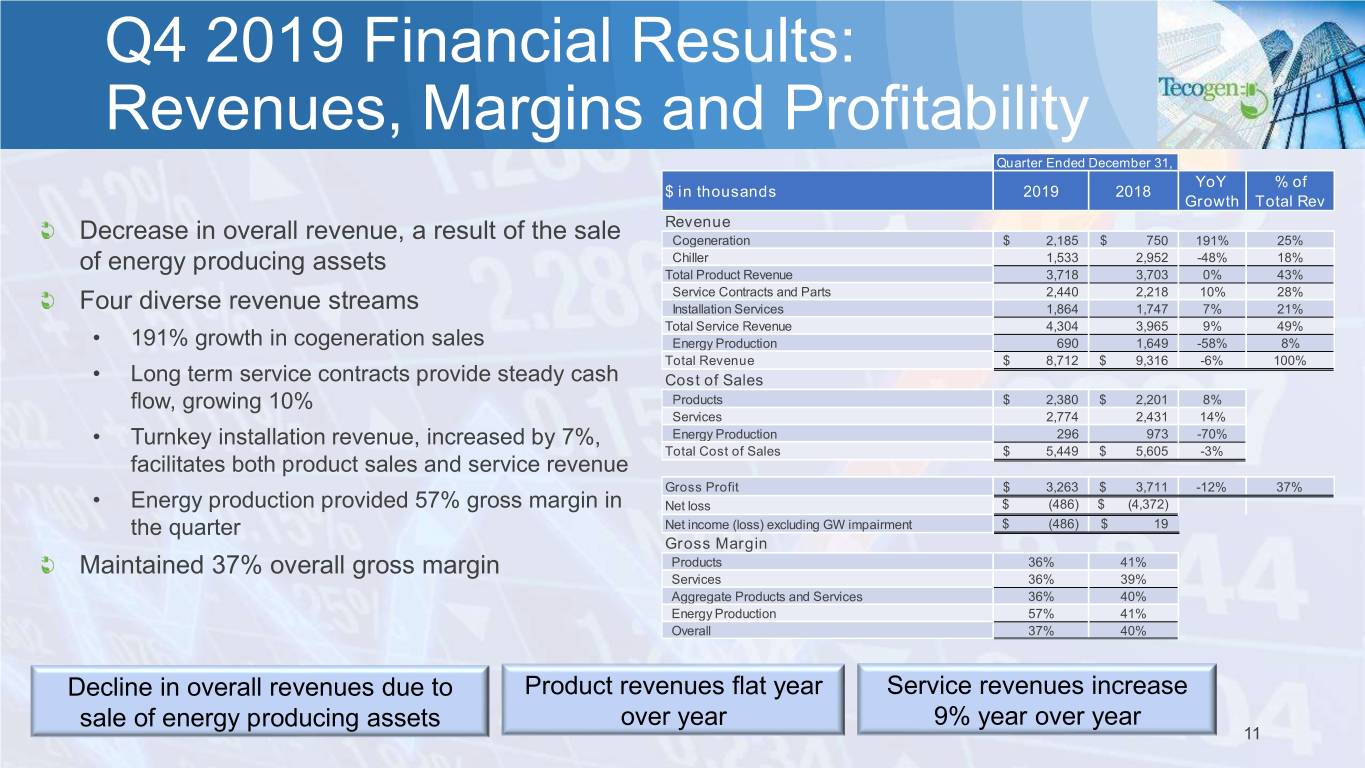
• | Product revenue was relatively flat with Q4 2019 and 2018 revenue of $3.72 million and $3.70 million, respectively. |
| |
• | Cogeneration revenue grew by 191% with Q4 2019 revenue of $2.2 million compared to $750 thousand for Q4 2018. Chiller sales for Q4 2019 were $1.53 million, a decline of 48% when compared to Q4 2018, a result of both sales timing and an overall shift in product mix for the year. We continue to generate chiller orders with approximately $4.1 million currently in backlog. |
| |
• | Service revenue rose by 9% to $4.30 million for Q4 2019 compared to the same period in 2018. Service contract revenue rose by 10% to $2.44 million while installation revenue increased by 7% to $1.86 million for Q4 2019 compared to that of Q4 2018, respectively. |
| |
• | Overall gross margin for Q4 2019 was 37% compared to 40% for the same period in 2018, a decline of 6% year over year. |
| |
• | Net loss for the fourth quarter of 2019 was $486 thousand, which includes the one-time non-cash inventory adjustment of $393 thousand, compared to net income, excluding goodwill, of $19 thousand for the same period in 2018. |
Sales and Operations
| |
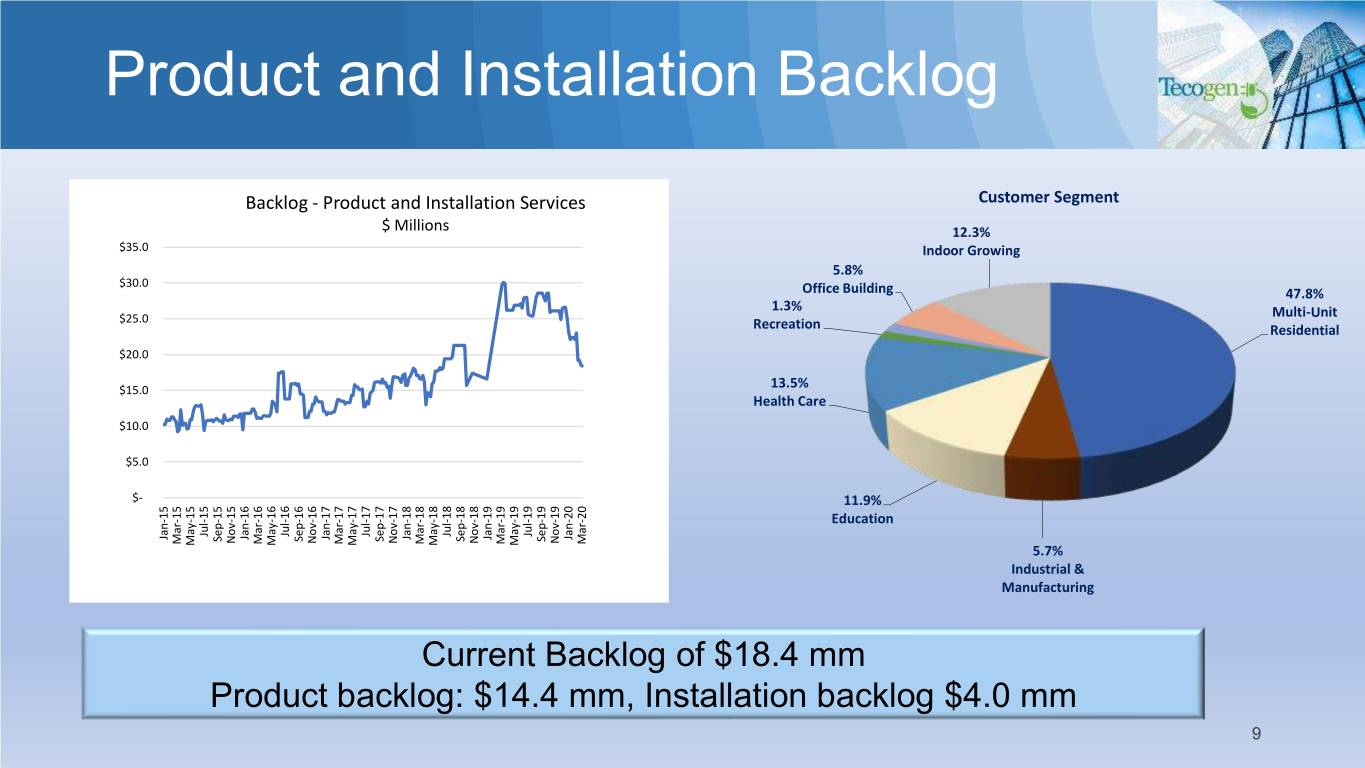
• | Sales backlog of product and installation projects increased to $22.4 million at year end 2019 compared to $16.6 million at year end 2018. Product and installation backlog is $18.4 million as of March 9, 2020, with product related backlog at $14.4 million and installation backlog at $4 million. |
| |
• | Installed first new Tecofrost gas engine driven ammonia refrigeration system for an ice skating facility located in Massachusetts. This system is fully operational and under a service contract with the facility. |
| |
• | Received order for 26 Inverde e+ cogeneration units with installed capacity of 3.25 MW to a housing development in Toronto, Ontario, to be shipped in 2020. |
| |
• | Continued chiller orders for indoor cultivation with seven (7) 200-ton chillers and two (2) 400-ton chillers to various cannabis cultivation facilities located in the US. |
| |
• | Recognized in US Microgrid Study ranking Tecogen #3 for number of operational microgrids in the US and #41 in terms of microgrid operational capacity. |
| |
• | Established our 11th service center to support the growing fleet in Toronto, Canada. |
.
Research and Development
In 2019, Company expenses relating to R&D totaled $1.5 million for product development and improvement, product certifications, and patents. Key activities are summarized below.
Product R&D
| |
• | Industrial Refrigeration Product Reintroduction (Tecofrost). Reintroduced Tecofrost ammonia refrigeration line of natural gas compressors with improved heat recovery, higher overall efficiency, and incorporating Ultera emissions after-treatment system. |
| |
• | Tecochill Controls Improvement. Redesigned system controllers improves overall system efficiency. New user interface featuring touchscreen operation and improved compatibility with existing building management operation (BMO) systems. |
| |
• | Inverde DC Microgrid Development. In anticipation of an order from a large utility, modifying the Inverde e+ cogeneration system to provide power for DC microgrids to supplement the other power sources (solar and batteries) which are intermittent. |
| |
• | Inverde Energy Storage Integration. Demonstrated integration of battery storage into the Inverde e+ inverter to allow seamless transition from engine power to storage power to provide continuous power to facility during maintenance operations. |
Emissions Technology
| |
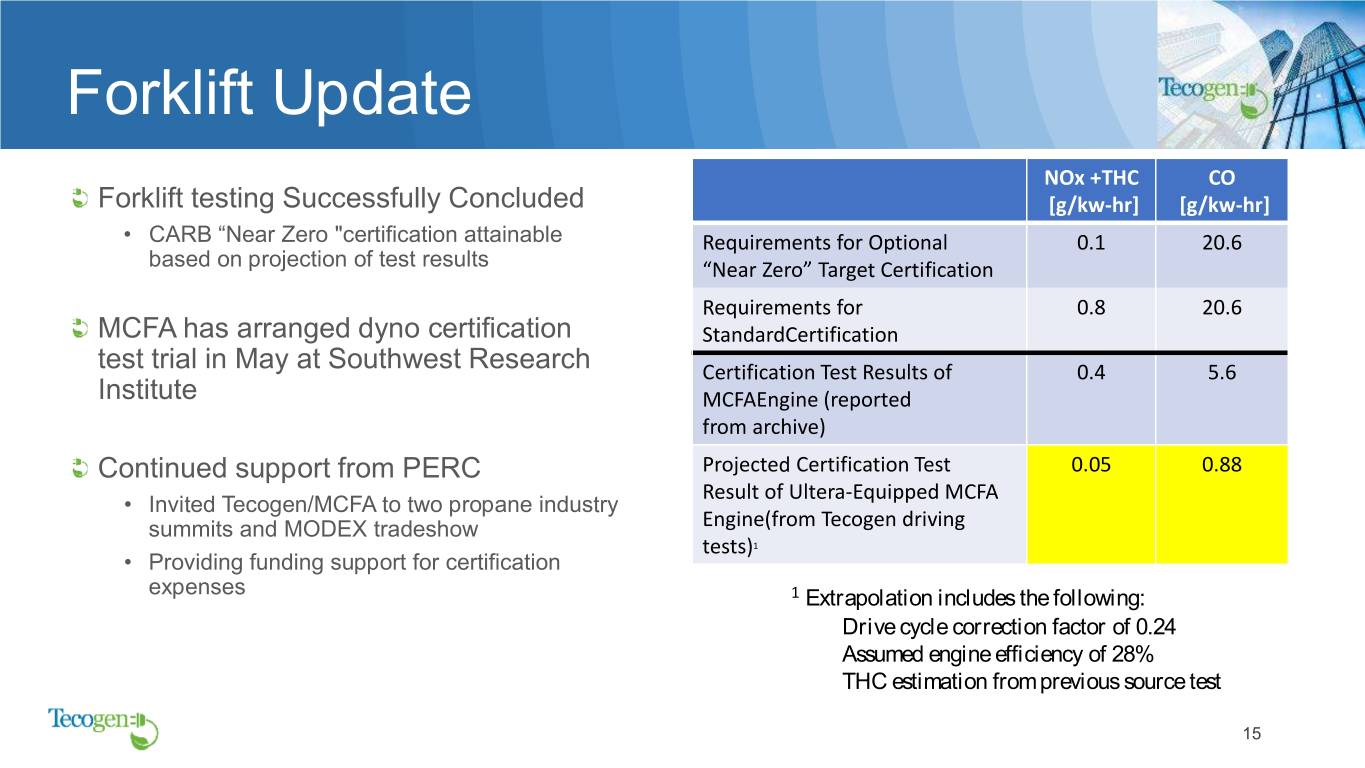
• | Ultera Emissions System - Near-Zero Emissions Certification for Forklift Trucks. In May 2020, Southwest Research Institute will perform near-zero emissions certification testing of the engine retuned by Tecogen and MCFA (Mitsubishi Caterpillar Forklift Trucks of America) with our Ultera emissions control system. |
| |
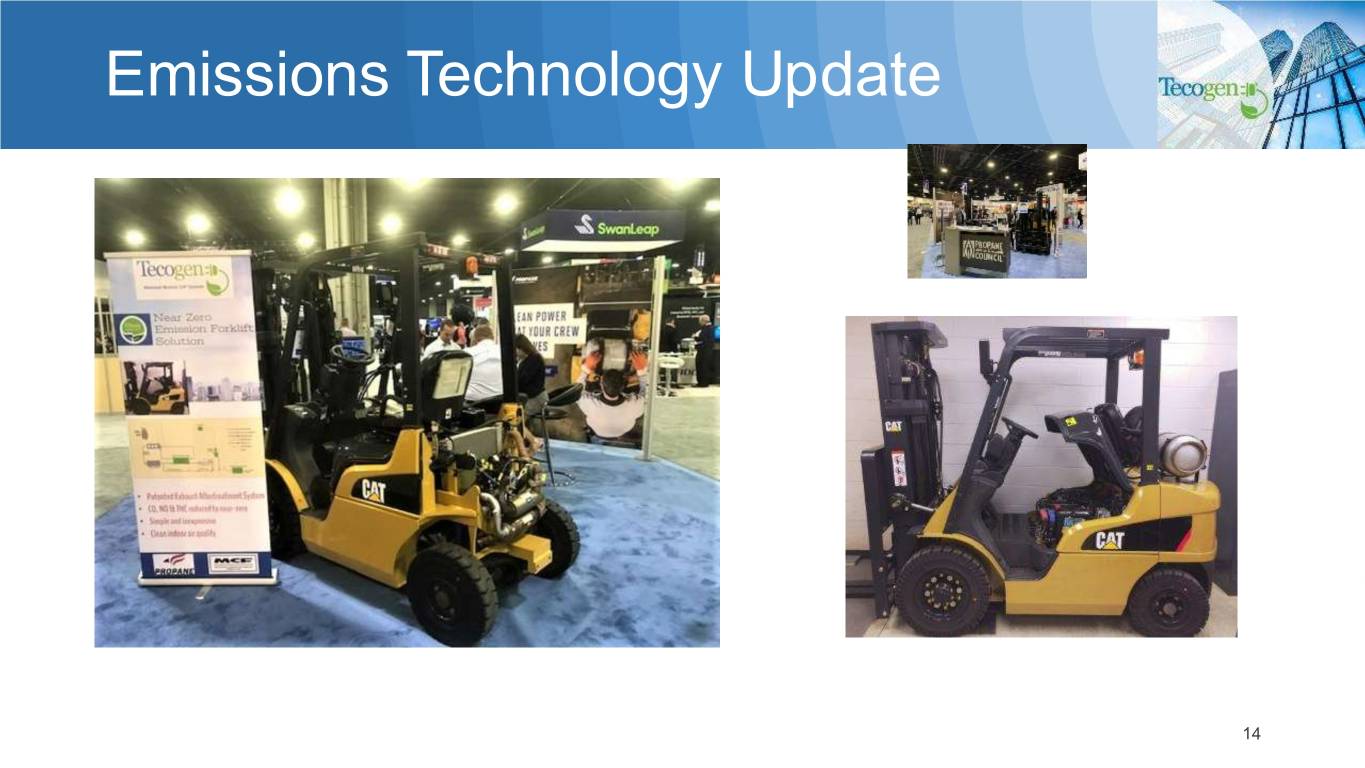
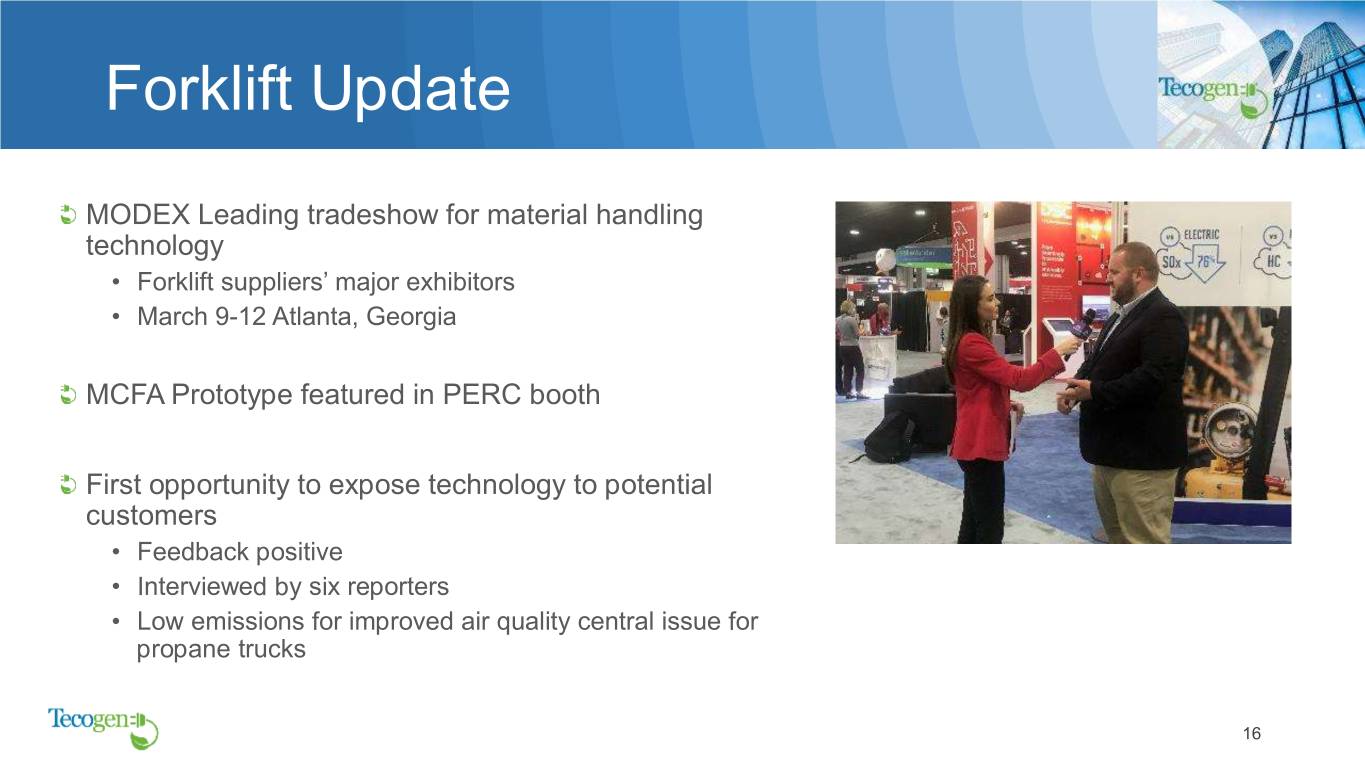
• | Prototype MCFA Forklift with Ultera Emissions System Retrofit Displayed at MODEX 2020. In March 2020, PERC (The Propane Education and Research Council) displayed a MCFA forklift truck retrofitted with an Ultera emissions control system at the MODEX 2020 show (the leading trade show showcasing material handling technology, including forklift trucks). |
| |
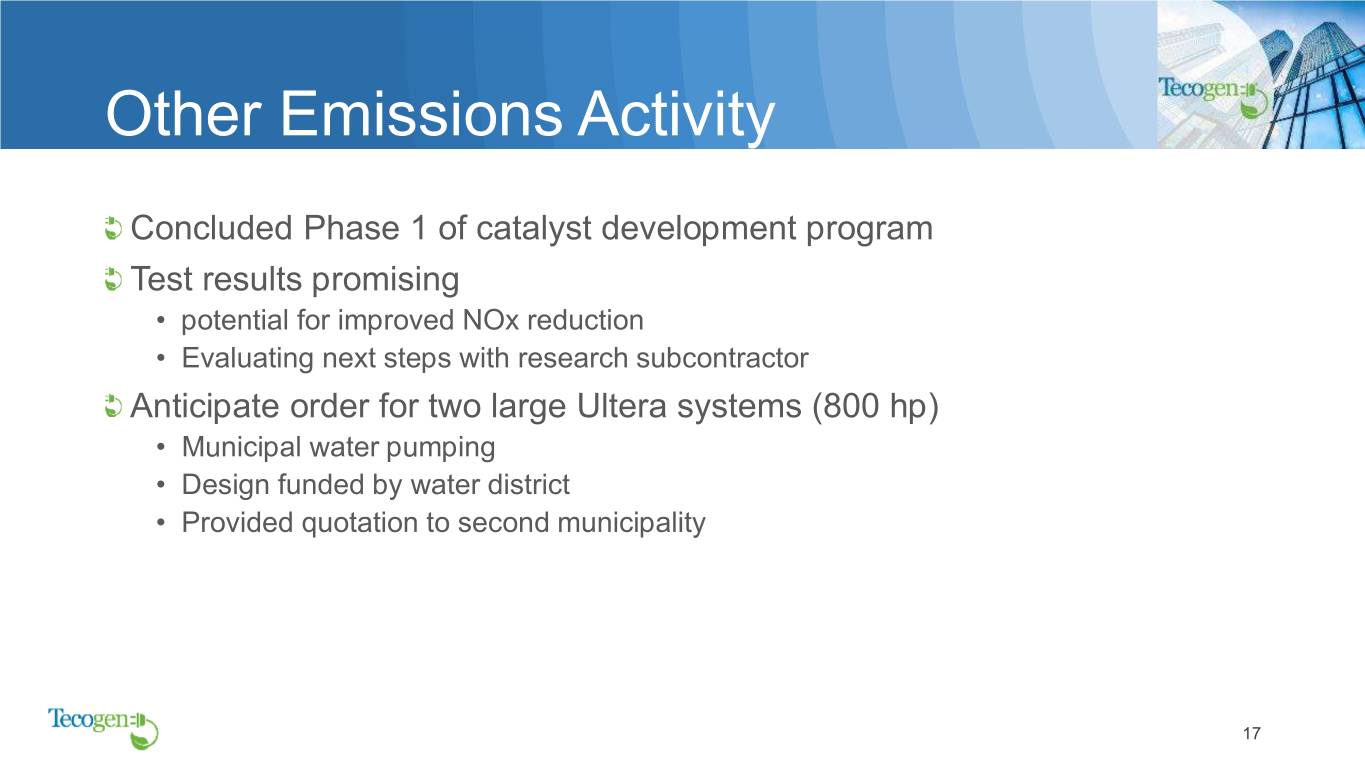
• | Ultera Emissions System - Retrofit for Larger Stationary Engines. Received order from a Southern California water district for the Phase 1 design of an innovative Ultera after-treatment system for two 800-horsepower Caterpillar natural gas engines to drive municipal water pumps. |
| |
• | Ultera Emissions System - Automotive Catalyst Development. Our subcontractor reported promising test results for a special catalyst material formulated for the Ultera process to further improve NOx reduction. |
.
Conference Call Scheduled for Today at 11:00 am ET
Tecogen will host a conference call today to discuss the fourth quarter and year end results beginning at 11:00 a.m. ET. To listen to the call dial (877) 407-7186 within the US and Canada or (201) 689-8052 from other international locations. Participants should ask to be joined to the Tecogen year-end 2019 earnings call. We suggest call participants begin dialing at least 10 minutes before the scheduled starting time. The earnings press release will be available on the Company website at www.Tecogen.com in the "News and Events" section under "About Us." The earnings conference call will be webcast live. To view the associated slides, register for and listen to the webcast, go to http://ir.tecogen.com/ir.calendar. Following the call, the webcast will be archived for 14 days.
The earnings conference call will be recorded and available for playback one hour after the end of the call. To listen to the playback, dial (877) 660-6853 within the U.S. and Canada, or (201) 612-7415 from other international locations and use Conference Call ID#: 13672659.
About Tecogen
Tecogen Inc. designs, manufactures, sells, installs, and maintains high efficiency, ultra-clean, cogeneration products including natural gas engine-driven combined heat and power, air conditioning systems, and high-efficiency water heaters for residential, commercial, recreational and industrial use. The company provides cost effective, environmentally friendly and reliable products for energy production that, through patented technology, nearly eliminate criteria pollutants and significantly reduce a customer’s carbon footprint.
In business for over 35 years, Tecogen has shipped more than 3,000 units, supported by an established network of engineering, sales, and service personnel across the United States. For more information, please visit www.tecogen.com or contact us for a free Site Assessment.
Tecogen, InVerde e+, Ilios, Tecochill, Tecopower, Tecofrost and Ultera are registered or pending trademarks of Tecogen Inc.
Forward Looking Statements
This press release and any accompanying documents, contain “forward-looking statements” which may describe strategies, goals, outlooks or other non-historical matters, or projected revenues, income, returns or other financial measures, that may include words such as "believe," "expect," "anticipate," "intend," "plan," "estimate," "project," "target," "potential," "will," "should," "could," "likely," or "may" and similar expressions intended to identify forward-looking statements. These statements are only predictions and involve known and unknown risks, uncertainties, and other factors that may cause our actual results to differ materially from those expressed or implied by such forward-looking statements. Given these uncertainties, you should not place undue reliance on these forward-looking statements. Forward-looking statements speak only as of the date on which they are made, and we undertake no obligation to update or revise any forward-looking statements.
In addition to those factors described in our Annual Report on Form 10-K and our Quarterly Reports on Form 10-Q under “Risk Factors”, among the factors that could cause actual results to differ materially from past and projected future results are the following: fluctuations in demand for our products and services, competing technological developments, issues relating to research and development, the availability of incentives, rebates, and tax benefits relating to our products and services, changes in the regulatory environment relating to our products and services, integration of acquired business operations, and the ability to obtain financing on favorable terms to fund existing operations and anticipated growth.
In addition to GAAP financial measures, this press release includes certain non-GAAP financial measures, including adjusted EBITDA which excludes certain expenses as described in the presentation. We use Adjusted EBITDA as an internal measure of business operating performance and believe that the presentation of non-GAAP financial measures provides a meaningful perspective of the underlying operating performance of our current business and enables investors to better understand and evaluate our historical and prospective operating performance by eliminating items that vary from period to period without correlation to our core operating performance and highlights trends in our business that may not otherwise be apparent when relying solely on GAAP financial measures.
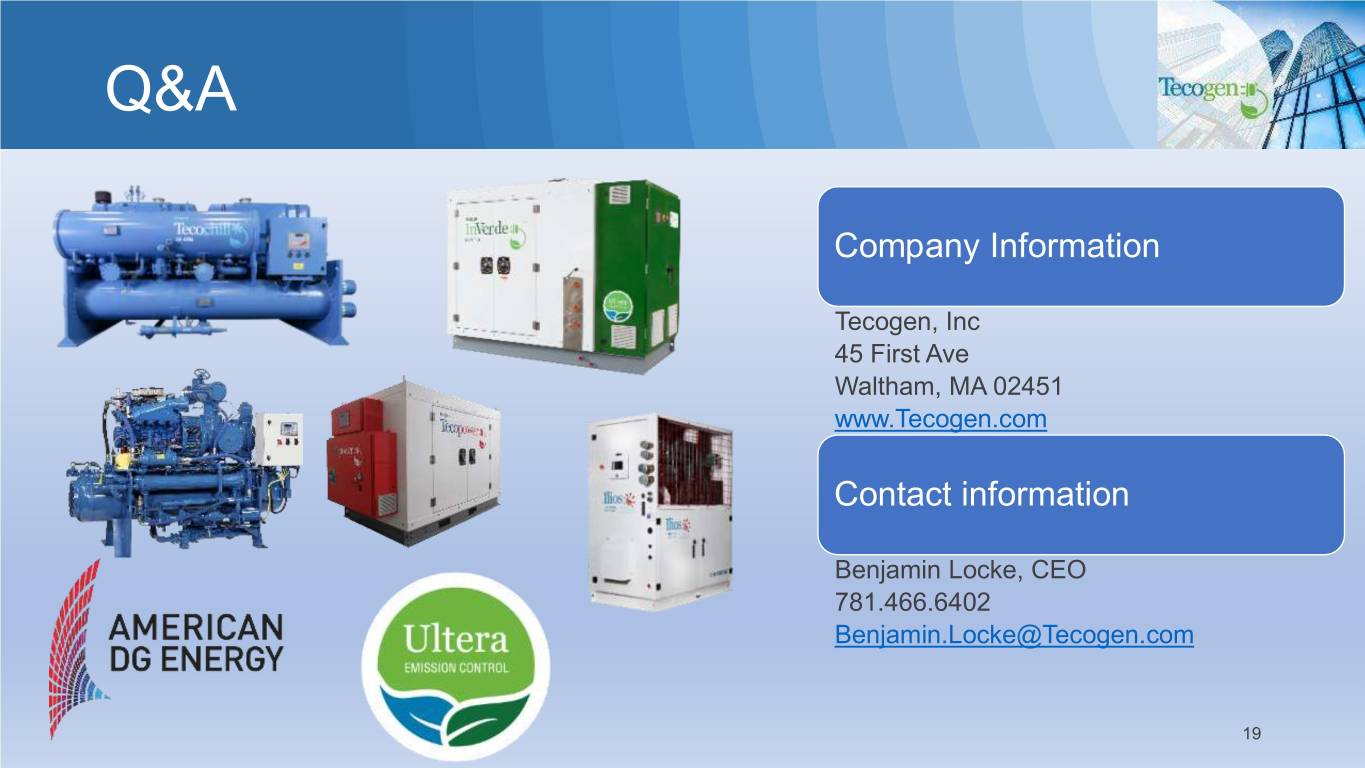
Tecogen Media & Investor Relations Contact Information:
Benjamin Locke
P: 781-466-6402
TECOGEN INC
CONSOLIDATED BALANCE SHEETS
As of December 31, 2019 and 2018
|
| | | | | | | |
| 2019 | | 2018 |
ASSETS | |
| | |
|
Current assets: | |
| | |
|
Cash and cash equivalents | $ | 877,676 |
| | $ | 272,552 |
|
Accounts receivable, net | 14,569,397 |
| | 14,176,452 |
|
Unbilled revenue | 5,421,811 |
| | 4,893,259 |
|
Inventory, net | 6,405,229 |
| | 6,294,862 |
|
Due from related party | — |
| | 9,405 |
|
Prepaid and other current assets | 635,034 |
| | 722,042 |
|
Total current assets | 27,909,147 |
| | 26,368,572 |
|
Property, plant and equipment, net | 3,465,948 |
| | 11,273,115 |
|
Right of use assets | 2,173,951 |
| | — |
|
Intangible assets, net | 1,593,781 |
| | 2,893,990 |
|
Goodwill | 5,281,867 |
| | 8,975,065 |
|
Other assets | 691,941 |
| | 393,651 |
|
TOTAL ASSETS | $ | 41,116,635 |
| | $ | 49,904,393 |
|
| | | |
LIABILITIES AND STOCKHOLDERS’ EQUITY | |
| | |
|
Current liabilities: | |
| | |
|
Revolving line of credit, bank | $ | 2,402,384 |
| | $ | 2,009,435 |
|
Accounts payable | 5,271,756 |
| | 7,153,330 |
|
Accrued expenses | 2,599,366 |
| | 1,528,014 |
|
Deferred revenue | 2,635,619 |
| | 2,507,541 |
|
Lease obligations, current | 536,443 |
| | — |
|
Total current liabilities | 13,445,568 |
| | 13,198,320 |
|
Long-term liabilities: | |
| | |
|
Deferred revenue, net of current portion | 145,464 |
| | 2,375,700 |
|
Lease obligations, long-term | 1,637,508 |
| | — |
|
Unfavorable contract liability, net | 2,534,818 |
| | 6,292,599 |
|
Total liabilities | 17,763,358 |
| | 21,866,619 |
|
| | | |
Commitments and contingencies (Note 11) |
|
| |
|
|
| | | |
Stockholders’ equity: | |
| | |
|
Tecogen Inc. stockholders’ equity: | |
| | |
|
Common stock, $0.001 par value; 100,000,000 shares authorized; 24,849,261 and 24,824,746 issued and outstanding at December 31, 2019 and 2018, respectively | 24,849 |
| | 24,825 |
|
Additional paid-in capital | 56,622,285 |
| | 56,427,928 |
|
Accumulated deficit | (33,379,114 | ) | | (28,670,095 | ) |
Total Tecogen Inc. stockholders’ equity | 23,268,020 |
| | 27,782,658 |
|
Noncontrolling interest | 85,257 |
| | 255,116 |
|
Total stockholders’ equity | 23,353,277 |
| | 28,037,774 |
|
TOTAL LIABILITIES AND STOCKHOLDERS’ EQUITY | $ | 41,116,635 |
| | $ | 49,904,393 |
|
TECOGEN INC
CONSOLIDATED STATEMENTS OF OPERATIONS
For the Three Months Ended December 31, 2019 and 2018
(unaudited)
|
| | | | | | | |
| 2019 | | 2018 |
Revenues | |
| | |
|
Products | $ | 3,717,631 |
| | $ | 3,702,610 |
|
Services | 4,304,189 |
| | 3,964,852 |
|
Energy production | 690,124 |
| | 1,648,946 |
|
| 8,711,944 |
| | 9,316,408 |
|
Cost of sales | |
| | |
|
Products | 2,379,755 |
| | 2,201,319 |
|
Services | 2,773,732 |
| | 2,430,973 |
|
Energy production | 295,620 |
| | 972,749 |
|
| 5,449,107 |
| | 5,605,041 |
|
Gross profit | 3,262,837 |
| | 3,711,367 |
|
| | | |
Operating expenses | | | |
General and administrative | 2,707,338 |
| | 2,667,985 |
|
Selling | 617,527 |
| | 758,898 |
|
Research and Development | 376,651 |
| | 304,511 |
|
Goodwill impairment | — |
| | 4,390,590 |
|
Total operating expenses | 3,701,516 |
| | 8,121,984 |
|
Loss from operations | (438,679 | ) | | (4,410,617 | ) |
| | | |
Other income (expense) | | | |
Interest and other income | 143 |
| | 104 |
|
Interest expense | (38,304 | ) | | (63,820 | ) |
Unrealized loss on investment securities | — |
| | (59,042 | ) |
Total other expense, net | (38,161 | ) | | (122,758 | ) |
| | | |
Loss before income taxes | (476,840 | ) | | (4,533,375 | ) |
Income tax provision | (473 | ) | | 9,931 |
|
Consolidated net loss | (476,367 | ) | | (4,523,444 | ) |
(Income) loss attributable to the noncontrolling interest | (9,197 | ) | | 151,540 |
|
Net loss attributable to Tecogen Inc | $ | (485,564 | ) | | $ | (4,371,904 | ) |
Net loss per share - basic and diluted | $ | (0.02 | ) | | $ | (0.18 | ) |
Weighted average shares outstanding - basic and diluted | 24,844,674 |
| | 24,821,832 |
|
|
| | | | | | | |
Non-GAAP financial disclosure (1) | | | |
Net loss attributable to Tecogen Inc | $ | (485,564 | ) | | $ | (4,371,904 | ) |
Interest expense, net | 38,161 |
| | 63,716 |
|
Provision for income taxes | (473 | ) | | (9,931 | ) |
Depreciation and amortization, net | 74,254 |
| | 202,934 |
|
EBITDA | (373,622 | ) | | (4,115,185 | ) |
Stock-based compensation | 42,860 |
| | 47,380 |
|
Unrealized loss on securities | — |
| | 59,042 |
|
Merger related expenses | — |
| | 120,333 |
|
Inventory write down | 393,449 |
| | — |
|
Goodwill impairment | — |
| | 4,390,590 |
|
Adjusted EBITDA | $ | 62,687 |
| | $ | 502,160 |
|
TECOGEN INC
CONSOLIDATED STATEMENTS OF OPERATIONS
For the Years Ended December 31, 2019 and 2018
|
| | | | | | | |
| 2019 | | 2018 |
Revenues | |
| | |
|
Products | $ | 12,977,896 |
| | $ | 12,624,867 |
|
Services | 17,307,718 |
| | 16,859,291 |
|
Energy production | 3,140,834 |
| | 6,399,526 |
|
Total revenues | 33,426,448 |
| | 35,883,684 |
|
Cost of sales | |
| | |
|
Products | 8,385,574 |
| | 7,797,591 |
|
Services | 10,808,142 |
| | 10,693,077 |
|
Energy production | 1,753,980 |
| | 3,801,154 |
|
Total cost of sales | 20,947,696 |
| | 22,291,822 |
|
Gross profit | 12,478,752 |
| | 13,591,862 |
|
Operating expenses | |
| | |
|
General and administrative | 10,380,143 |
| | 10,790,841 |
|
Selling | 2,685,200 |
| | 2,651,128 |
|
Research and development | 1,460,096 |
| | 1,297,612 |
|
Gain on sale of assets | (1,081,304 | ) | | — |
|
Goodwill impairment | 3,693,198 |
| | 4,390,590 |
|
Total operating expenses | 17,137,333 |
| | 19,130,171 |
|
Loss from operations | (4,658,581 | ) | | (5,538,309 | ) |
Other income (expense) | |
| | |
|
Interest and other income | 933 |
| | 8,030 |
|
Interest expense | (101,851 | ) | | (120,015 | ) |
Unrealized loss on investment securities | (19,680 | ) | | (118,084 | ) |
Total other expense, net | (120,598 | ) | | (230,069 | ) |
Loss before income taxes | (4,779,179 | ) | | (5,768,378 | ) |
State income tax provision | 15,194 |
| | 32,748 |
|
Consolidated net loss | (4,794,373 | ) | | (5,801,126 | ) |
Loss attributable to the noncontrolling interest | 85,354 |
| | 92,594 |
|
Net loss attributable to Tecogen Inc. | $ | (4,709,019 | ) | | $ | (5,708,532 | ) |
Net loss per share - basic and diluted | $ | (0.19 | ) | | $ | (0.23 | ) |
Weighted average shares outstanding - basic and diluted | 24,839,957 |
| | 24,815,926 |
|
|
| | | | | | | |
Non-GAAP financial disclosure (1) |
| |
|
Net income (loss) attributable to Tecogen Inc | $ | (4,709,019 | ) | | $ | (5,708,532 | ) |
Provision for income taxes | 15,194 |
| | 32,748 |
|
Interest expense, net | 100,918 |
| | 111,985 |
|
Depreciation and amortization, net | 437,102 |
| | 789,123 |
|
EBITDA | (4,155,805 | ) | | (4,774,676 | ) |
Stock-based compensation | 163,464 |
| | 181,188 |
|
Unrealized loss on investment securities | 19,680 |
| | 118,084 |
|
Goodwill impairment | 3,693,198 |
| | 4,390,590 |
|
Inventory write down | 393,449 |
| | — |
|
Merger related expenses | — |
| | 302,268 |
|
Adjusted EBITDA | $ | 113,986 |
| | $ | 217,454 |
|
TECOGEN INC
CONSOLIDATED STATEMENTS OF CASH FLOWS
For the Years Ended December 31, 2019 and 2018 |
| | | | | | | | |
| | CASH FLOWS FROM OPERATING ACTIVITIES: | 2019 | | 2018 |
| |
| | Consolidated net loss | $ | (4,794,373 | ) | | $ | (5,801,126 | ) |
| | Adjustments to reconcile net loss to net cash used in operating activities: | |
| | |
|
| | Depreciation, accretion and amortization, net | 437,102 |
| | 789,123 |
|
| | Gain on contract termination | — |
| | (124,733 | ) |
| | (Gain) loss on sale of assets | (1,081,304 | ) | | 22,088 |
|
| | Provision for losses on accounts receivable | 48,000 |
| | 4,395 |
|
| | Stock-based compensation | 163,464 |
| | 181,188 |
|
| | Goodwill impairment | 3,693,198 |
| | 4,390,590 |
|
| | Non-cash interest expense | 43,669 |
| | 32,225 |
|
| | Changes in operating assets and liabilities, net of effects of acquisition: | |
| | |
|
| | (Increase) decrease in: | | | |
| | Accounts receivable | (440,945 | ) | | (4,467,939 | ) |
| | Unbilled revenue | (528,452 | ) | | (697,586 | ) |
| | Inventory, net | (110,367 | ) | | (1,164,057 | ) |
| | Due from related party | 9,405 |
| | 576,087 |
|
| | Prepaid expenses and other current assets | (9,545 | ) | | 49,484 |
|
| | Other non-current assets | (298,290 | ) | | 113,284 |
|
| | Increase (decrease) in: | |
| | |
|
| | Accounts payable | (1,881,574 | ) | | 1,173,979 |
|
| | Accrued expenses and other current liabilities | 380,993 |
| | 111,038 |
|
| | Deferred revenue | (115,223 | ) | | 1,006,893 |
|
| | Interest payable, related party | — |
| | (52,265 | ) |
| | Net cash used in operating activities | (4,484,242 | ) | | (3,857,332 | ) |
| | CASH FLOWS FROM INVESTING ACTIVITIES: | |
| | |
|
| | Purchases of property and equipment | (95,643 | ) | | (828,086 | ) |
| | Proceeds on sale of property and equipment | 5,000,000 |
| | 2,003,606 |
|
| | Purchases of intangible assets | (110,683 | ) | | (226,847 | ) |
| | Cash acquired in acquisition | — |
| | 442,746 |
|
| | Expenses associated with asset acquisition | — |
| | (2,457 | ) |
| | Payment of stock issuance costs | (2,700 | ) | | — |
|
| | Distributions to non-controlling interest | (84,505 | ) | | (107,901 | ) |
| | Net cash provided by investing activities | 4,706,469 |
| | 1,281,061 |
|
| | CASH FLOWS FROM FINANCING ACTIVITIES: | |
| | |
|
| | Proceeds on revolving line of credit, net of payments | 349,280 |
| | 2,097,837 |
|
| | Payments for debt issuance costs | — |
| | (145,011 | ) |
| | Payments made on loan due to related party | — |
| | (850,000 | ) |
| | Proceeds from exercise of stock options | 33,617 |
| | 72,925 |
|
| | Net cash provided by financing activities | 382,897 |
| | 1,175,751 |
|
| | Change in cash and cash equivalents | 605,124 |
| | (1,400,520 | ) |
| | Cash and cash equivalents, beginning of the year | 272,552 |
| | 1,673,072 |
|
| | Cash and cash equivalents, end of the year | $ | 877,676 |
| | $ | 272,552 |
|
TECOGEN INC
(1) Non-GAAP Financial Measures
In addition to reporting net income, a U.S. generally accepted accounting principle (“GAAP”) measure, this news release contains information about EBITDA (net income (loss) attributable to Tecogen Inc adjusted for interest, depreciation and amortization, stock based compensation expense, goodwill impairment, one-time inventory adjustment and merger related expenses), which is a non-GAAP measure. The Company believes EBITDA allows investors to view its performance in a manner similar to the methods used by management and provides additional insight into its operating results. EBITDA is not calculated through the application of GAAP. Accordingly, it should not be considered as a substitute for the GAAP measure of net income and, therefore, should not be used in isolation of, but in conjunction with, the GAAP measure. The use of any non-GAAP measure may produce results that vary from the GAAP measure and may not be comparable to a similarly defined non-GAAP measure used by other companies.