UNITED STATES
SECURITIES AND EXCHANGE COMMISSION
WASHINGTON, D.C. 20549
__________________________
FORM 8-K
CURRENT REPORT
PURSUANT TO SECTION 13 OR 15(d) OF THE
SECURITIES EXCHANGE ACT OF 1934
Date of report: August 12, 2021
TECOGEN INC. (OTCQX: TGEN)
(Exact Name of Registrant as Specified in Charter)
Delaware
(State or Other Jurisdiction of Incorporation)
| | | | | | | | |
| 001-36103 | | 04-3536131 |
| (Commission File Number) | | (IRS Employer Identification No.) |
| | | |
| 45 First Avenue | | |
Waltham, Massachusetts | | 02451 |
| (Address of Principal Executive Offices) | | (Zip Code) |
(781) 466-6400
(Registrant's telephone number, including area code)
_______________________________________________
Securities registered or to be registered pursuant to Section 12(b) of the Act. | | | | | | | | |
| Title of each class | Trading Symbol | Name of exchange on which registered |
| | |
Check the appropriate box below if the Form 8-K filing is intended to simultaneously satisfy the filing obligation of the registrant under any of the following provisions: ☐ Written communications pursuant to Rule 425 under the Securities Act (17 CFR 230.425)
☐ Soliciting material pursuant to Rule 14a-12 under the Exchange Act (17 CFR 240.14a-12)
☐ Pre-commencement communications pursuant to Rule 14d-2(b) under the Exchange Act (17 CFR 240.14d-2(b))
☐ Pre-commencement communications pursuant to Rule 13e-4(c) under the Exchange Act (17 CFR 240.13e-4(c))
Indicate by check mark whether the registrant is an emerging growth company as defined in Rule 405 of the Securities Act of 1933 (§230.405 of this chapter) or Rule 12b-2 of the Securities Exchange Act of 1934 (§240.12b-2 of this chapter). Emerging growth company ☐
If an emerging growth company, indicate by check mark if the registrant has elected not to use the extended transition period for complying with any new or revised financial accounting standards provided pursuant to Section 13(a) of the Exchange Act. o
Item 2.02. Results of Operations and Financial Condition.
On August 12, 2021, the registrant issued a press release with earnings commentary and supplemental information for the three and six months ended June 30, 2021. The press release is furnished as Exhibit 99.01 to this Current Report on Form 8-K.
The information in this Item 2.02 and Exhibit 99.01 to this Current Report on Form 8-K shall shall not be deemed “filed” for purposes of Section 18 of the Exchange Act or otherwise subject to the liabilities of that section, nor shall it be deemed incorporated by reference in any filing under the Securities Act or the Exchange Act, except as expressly set forth by specific reference in such a filing.
Item 7.01. Regulation FD Disclosure.
On August 12, 2021, the registrant presented the attached slides online in connection with an earnings conference call. The slides are being furnished as Exhibit 99.02 to this Current Report on Form 8-K.
The information in this Item 7.01 and Exhibit 99.02 to this Current Report on Form 8-K shall not be deemed “filed” for purposes of Section 18 of the Exchange Act or otherwise subject to the liabilities of that section, nor shall it be deemed incorporated by reference in any filing under the Securities Act or the Exchange Act, except as expressly set forth by specific reference in such a filing.
Item 9.01. Financial Statements and Exhibits.
(d) Exhibits
The following exhibits relating to Items 2.02 and 7.01 shall be deemed to be furnished, and not filed:
| | | | | |
| Exhibit | Description |
| 99.01 | |
| 99.02 | |
SIGNATURES
Pursuant to the requirements of the Securities Exchange Act of 1934, the Company has duly caused this report to be signed on its behalf by the undersigned, hereunto duly authorized. | | | | | | | | |
|
| | |
| TECOGEN INC. |
| |
| | By: /s/ Benjamin Locke |
| August 12, 2021 | | Benjamin Locke, Chief Executive Officer |
Tecogen Announces Second Quarter 2021 Results
Net Income of $2.2 million for H1 2021 and $0.4 million for Q2 2021
Earnings per share of $0.09/share for H1 2021 and $0.02/share for Q2 2021
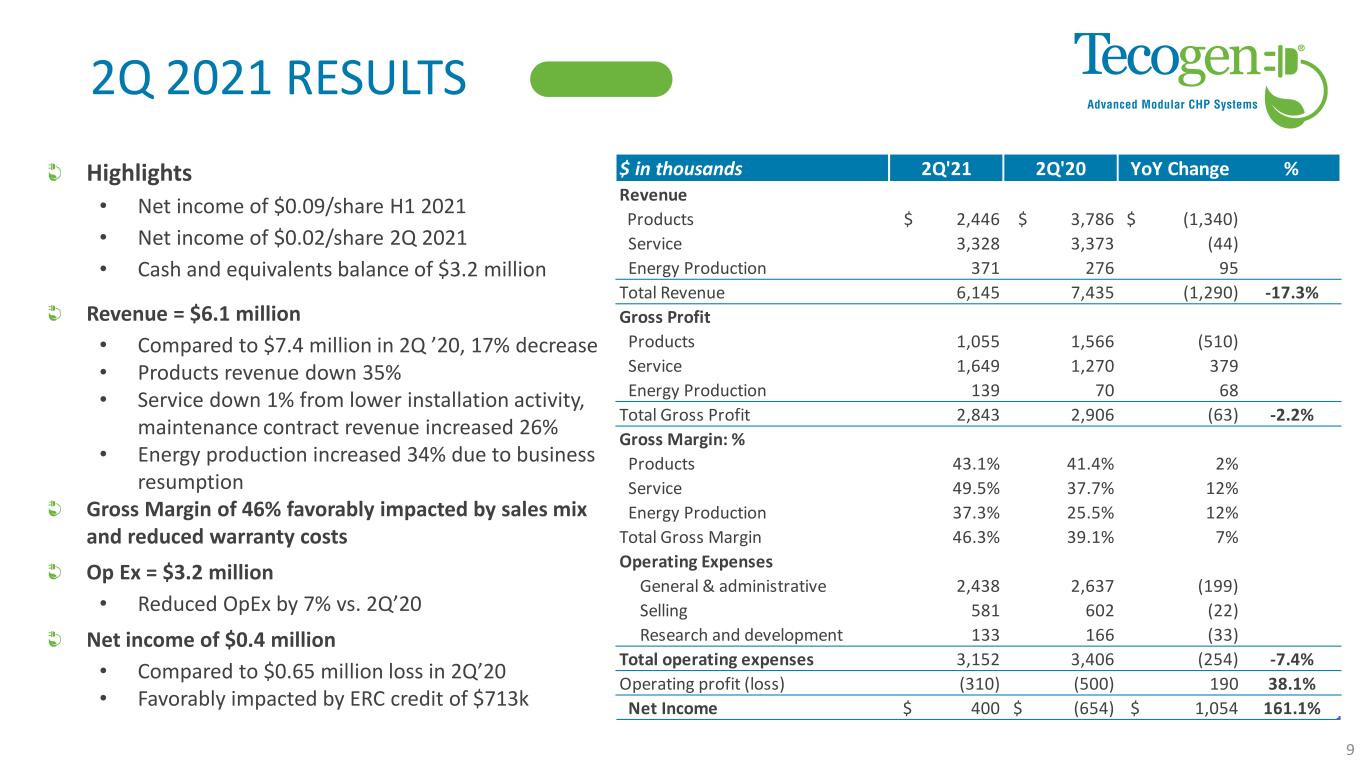
WALTHAM, Mass., August 12, 2021 - Tecogen Inc. (OTCQX:TGEN), a leading manufacturer of clean energy products, reported net income of $0.4 million for the quarter ended June 30, 2021 compared to a net loss of $0.7 million in 2020, an improvement of $1.1 million. For the six months ended June 30, 2021, net income was $2.2 million compared to a net loss of $1.9 million, an improvement of $4.1 million. The increase in net income for both periods was primarily due to the benefit from the CARES Act payroll support programs, and to a lesser extent, from lower operating expenses and improved gross margin. Our gross margin increased to 47.5% in the six months ended June 30, 2021 compared to 37.0% for the same period in 2020.
Key Takeaways
Earnings Per Share
•Net income (loss) per share, basic and diluted, was net income of $0.09 per share in the six months ended June 30, 2021 compared to a loss of $0.07 in the six months ended June 30, 2020.
•Net income (loss) per share, basic and diluted, was net income of $0.02 in the second quarter of 2021 compared to a loss of $0.03 in the second quarter of 2020.
Revenues
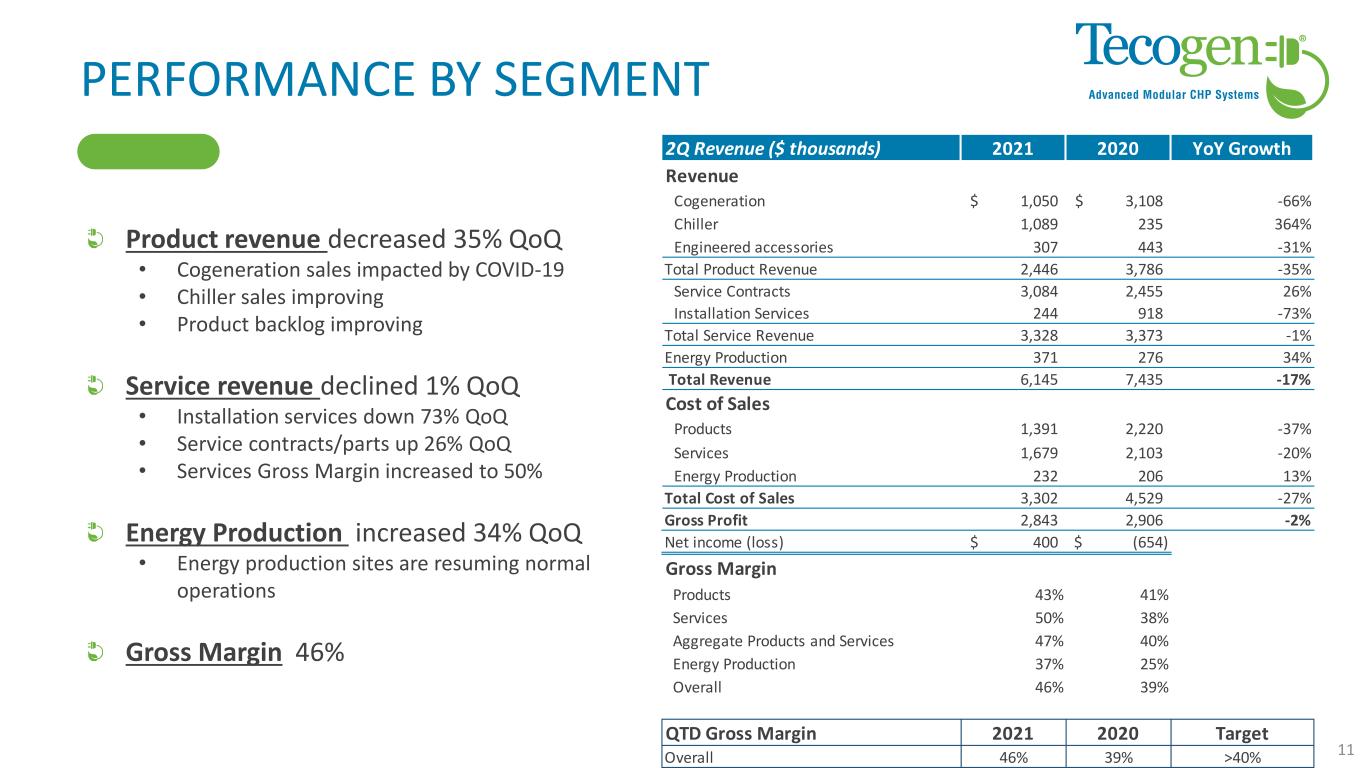
•Revenues for the quarter ended June 30, 2021 were $6.1 million compared to $7.4 million for the same period in 2020, a 17.3% decrease.
◦Product revenue was $2.4 million in Q2 2021 compared to $3.8 million in the same period in 2020, a decline of 35.4%, primarily due to lower cogeneration unit volume.
◦Services revenue was $3.3 million in Q2 2021 compared to $3.4 million in the same period in 2020, a decline of 1.3%, primarily due to reduced lower margin installation activity. Services contract revenue increased 25.6% to $3.1 million compared to $2.5 million in the second quarter of 2020.
◦Energy Production revenue increased by $95 thousand, or 34.2%, to $371 thousand compared to the same period in 2020 due to the resumption of business operations at our energy production sites.
•For the six months ended June 30, 2021 revenues were $12.2 million compared to $15.4 million for the same period in 2020, a decrease of $3.2 million or 20.8% year over year.
◦Product revenue was $4.6 million in the six months ended June 30, 2021 compared to $6.8 million in the same period in 2020, a decline of 33.2%, primarily due to lower cogeneration unit volume.
◦Services revenue was $6.6 million in the six months ended June 30, 2021 compared to $7.5 million in the same period in 2020, a decline of 12.3%, primarily due to reduced lower margin installation activity. Services contract revenue increased 18.8% to $5.8 million compared to $4.9 million in the same period in 2020.
◦Energy production revenue in the six months ended June 30, 2021 was $1.024 million, compared to $1.027 million for the same period in 2020, a decrease of $3 thousand, or 0.3%.
Gross Profit
•Gross profit for the second quarter of 2021 was $2.8 million compared to $2.9 million in the second quarter of 2020. Gross margin improved to 46.3% in the second quarter compared to 39.1% for the same period in 2020 due to higher Product margin which increased to 43.1% in Q2 2021 from 41.4% in Q2 2020 and Services margin which improved to 49.5% in Q1 2021 from 37.7% in Q1 2020.
•Gross profit for the six months ended June 30, 2021 was $5.8 million compared to $5.7 million for the same period in 2020, an increase of $0.1 million, or 1.7%. During the six months ended June 30, 2021 gross margin increased to 47.5% compared to 37.0% for the same period in 2020 due to higher Product margin which increased to 43.9% from 41.2% and higher Services margin which increased to 51.3% from 33.8%.
Operating Expenses
•Operating expenses decreased by 7% to $3.2 million for the second quarter of 2021 compared to $3.4 million in the same period of 2020.
•For the six months ended June 30, 2021 operating expenses decreased $1.1 million, or 14.7%, to $6.2 million compared to $7.3 million in the same period in 2020.
The decreased operating expenses in the quarter and six month periods were primarily due to cost controls, resulting in decreased payroll and payroll related expenses and reductions in other operating expenses compared to the same periods in 2020.
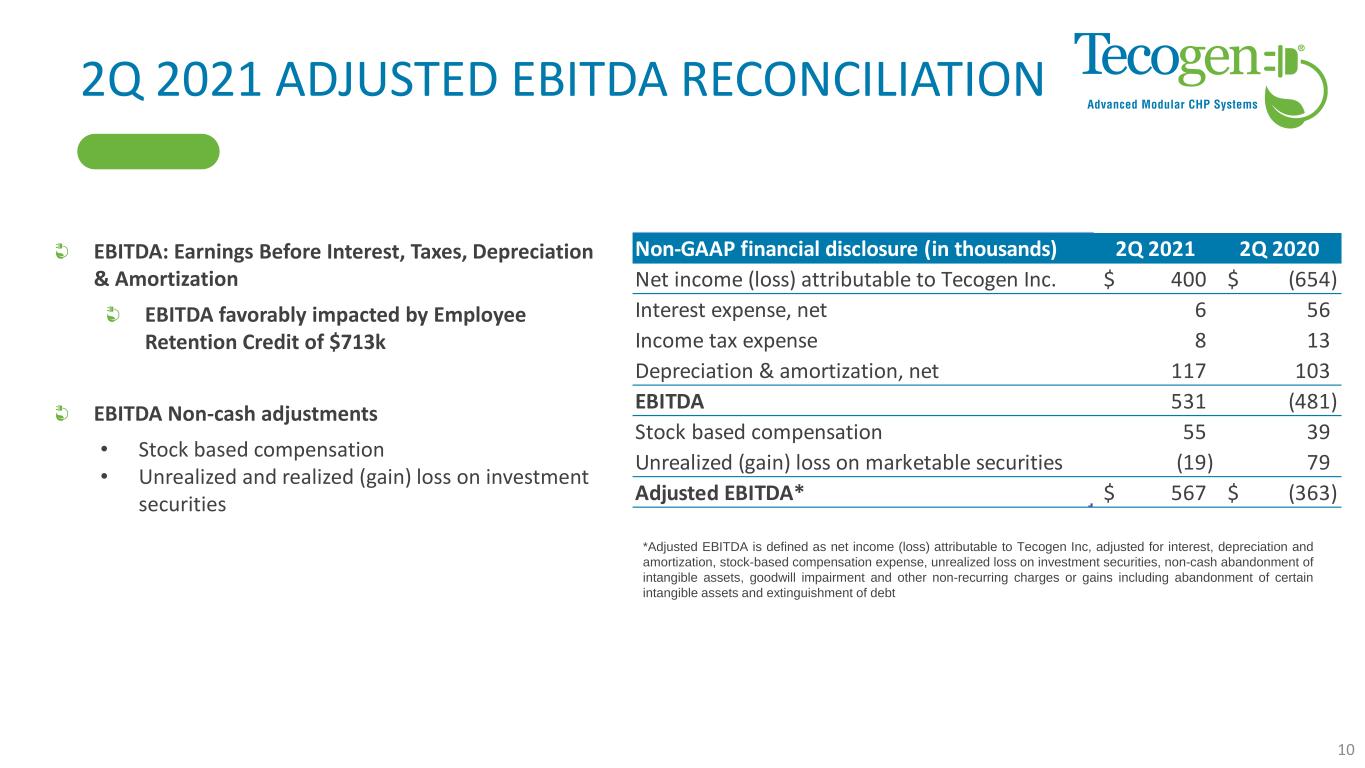
Adjusted EBITDA(1) was $567 thousand for the second quarter of 2021 compared to negative $363 thousand for the second quarter of 2020. (Adjusted EBITDA is defined as net income or loss attributable to Tecogen, adjusted for interest, income taxes, depreciation and amortization, stock-based compensation expense, unrealized gain or loss on equity securities, goodwill impairment charges and other non-cash non-recurring charges or gains including abandonment of intangible assets and extinguishment of debt. See the table following the Condensed Consolidated Statements of Operations for a reconciliation from net income (loss) to Adjusted EBITDA, as well as important disclosures about the company's use of Adjusted EBITDA).
“Our core business areas continued to be negatively impacted by COVID-19, but despite the challenging economic environment, we achieved significant improvements in our gross margin and operations,” commented Benjamin Locke, Tecogen's Chief Executive Officer. “We expect Product sales to rebound as we move further into 2021. Our Energy Production assets are gradually returning to normal operation as COVID related closures and restrictions are eased, and our Service maintenance revenues continue to grow each quarter."
Operational Highlights:
•Qualified for Employee Retention Credit and recognized a $713 thousand benefit in the second quarter of 2021.
•Continued sales growth in the Controlled Environment Agriculture (CEA) space with total capacity of Tecochill chillers sold to cannabis cultivation facilities now in excess of 10,000 tons.
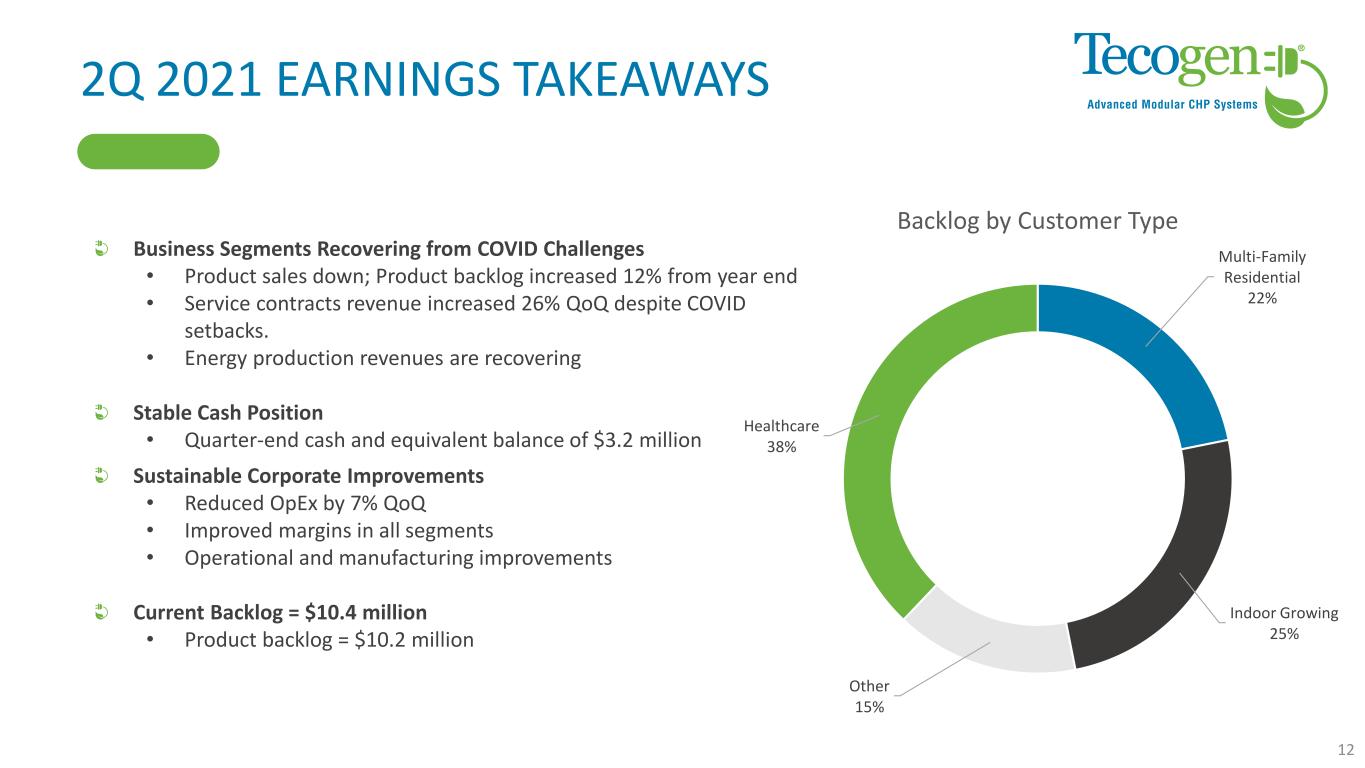
•Current sales backlog of equipment and installations as of August 12, 2021 is $10.4 million, comprised of $10.2 million of products and $0.2 million of installation services.
•Added two Manufacturers' Representatives to support Tecofrost sales in parts of western United States and Canada.
•Filed a provisional patent application titled "High Efficiency Hybrid Engine-Driven Variable Drive" with the United States Patent and Trademark Office.
Conference Call Scheduled for Today at 11:00 am ET
Tecogen will host a conference call today to discuss the first quarter results beginning at 11:00 am eastern time. To listen to the call please dial (877) 407-7186 within the U.S. and Canada, or (201) 689-8052 from other international locations. Participants should ask to be joined to the Tecogen Second Quarter 2021 earnings call. Please begin dialing 10 minutes before the scheduled starting time. The earnings press release will be available on the Company website at www.Tecogen.com in the "News and Events" section under "About Us." The earnings conference call will be webcast live. To view the associated slides, register for and listen to the webcast, go to https://ir.tecogen.com/ir-calendar. Following the call, the recording will be archived for 14 days.
The earnings conference call will be recorded and available for playback one hour after the end of the call. To listen to the playback, dial (877) 660-6853 within the U.S. and Canada, or (201) 612-7415 from other international locations and use Conference Call ID#: 13672659.
About Tecogen
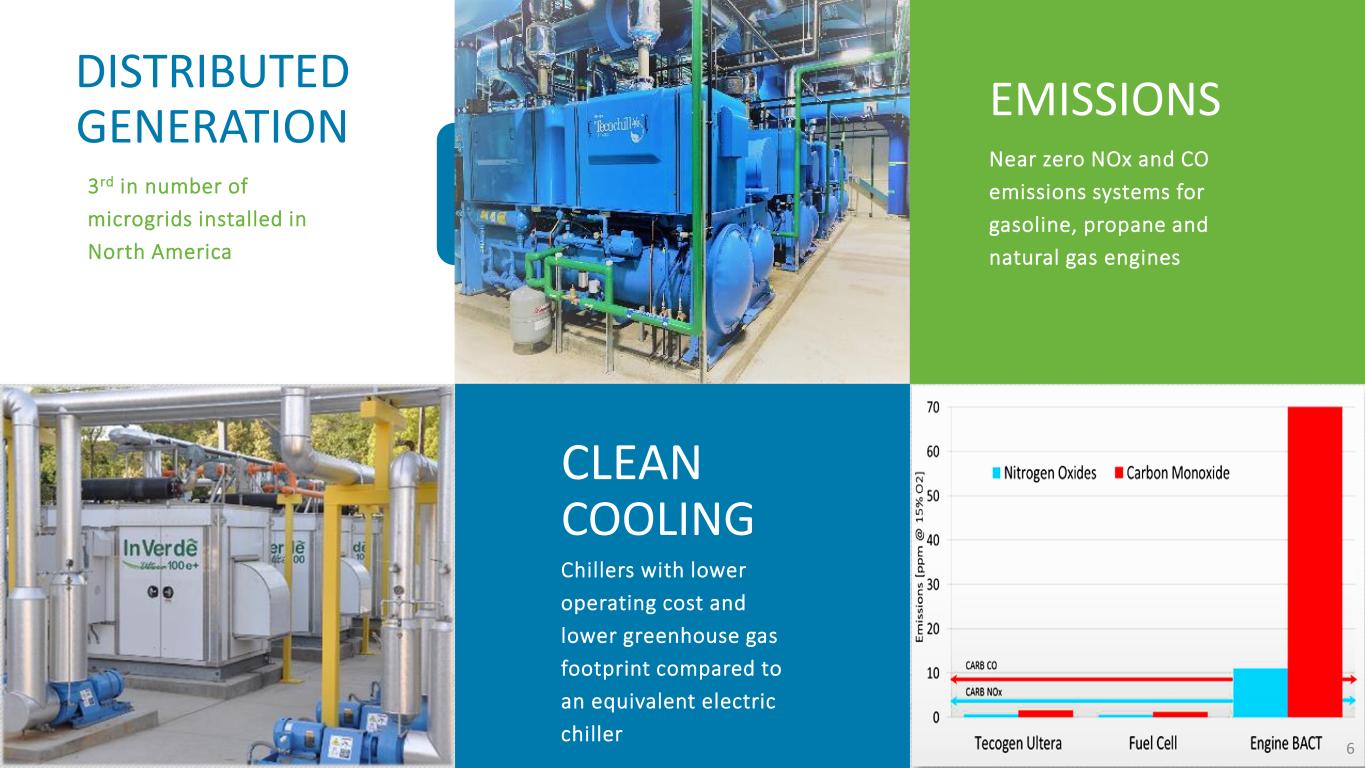
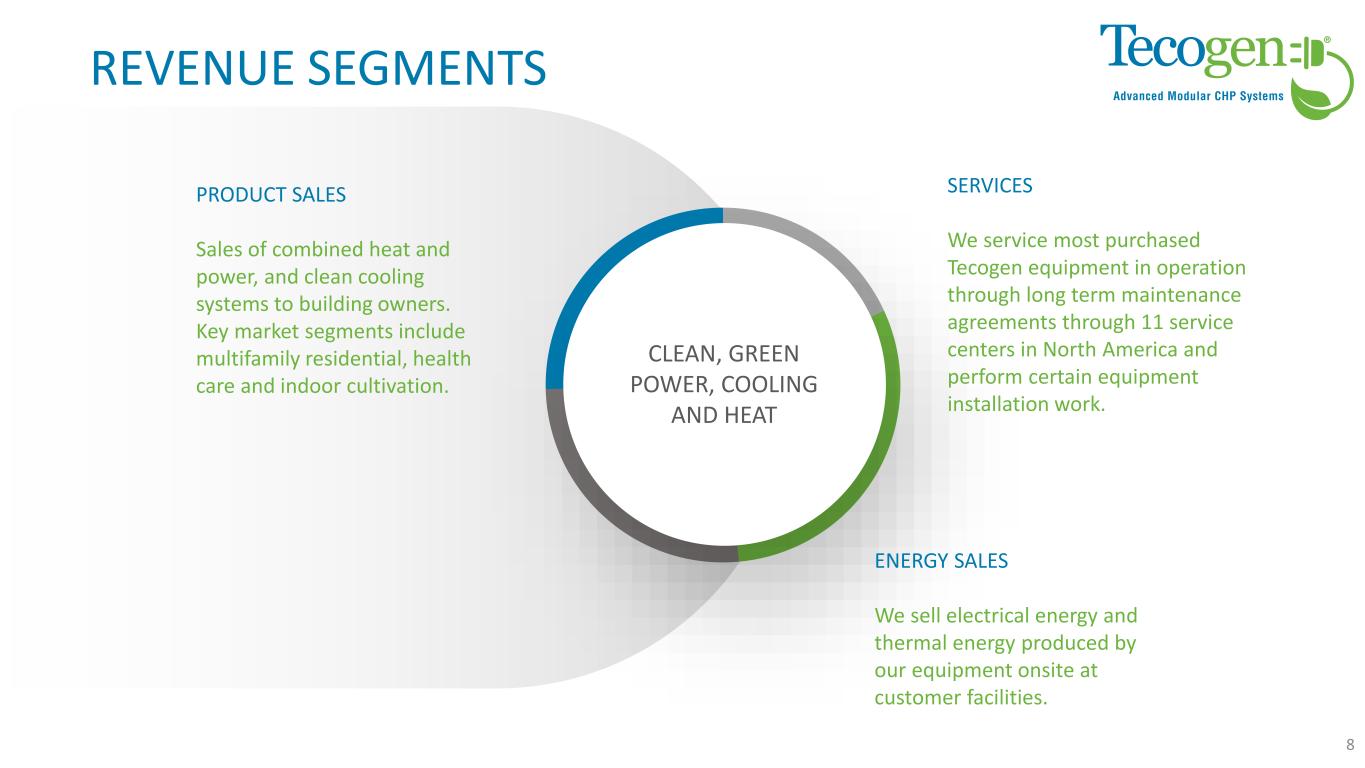
Tecogen Inc. designs, manufactures, sells, installs, and maintains high efficiency, ultra-clean, cogeneration products including engine-driven combined heat and power, air conditioning systems, and high-efficiency water heaters for residential, commercial, recreational and industrial use. The company provides cost effective, environmentally friendly and reliable products for energy production that, through patented technology, nearly eliminate criteria pollutants and significantly reduce a customer’s carbon footprint.
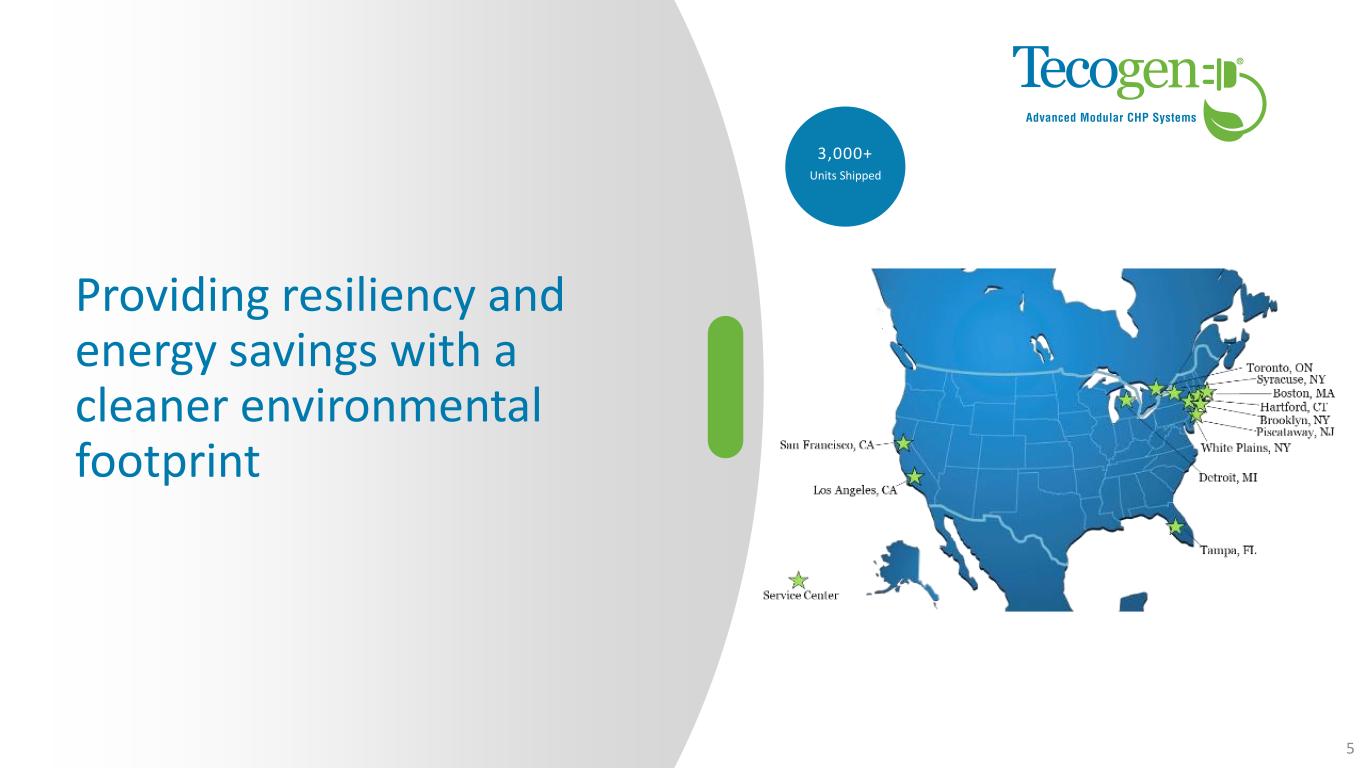
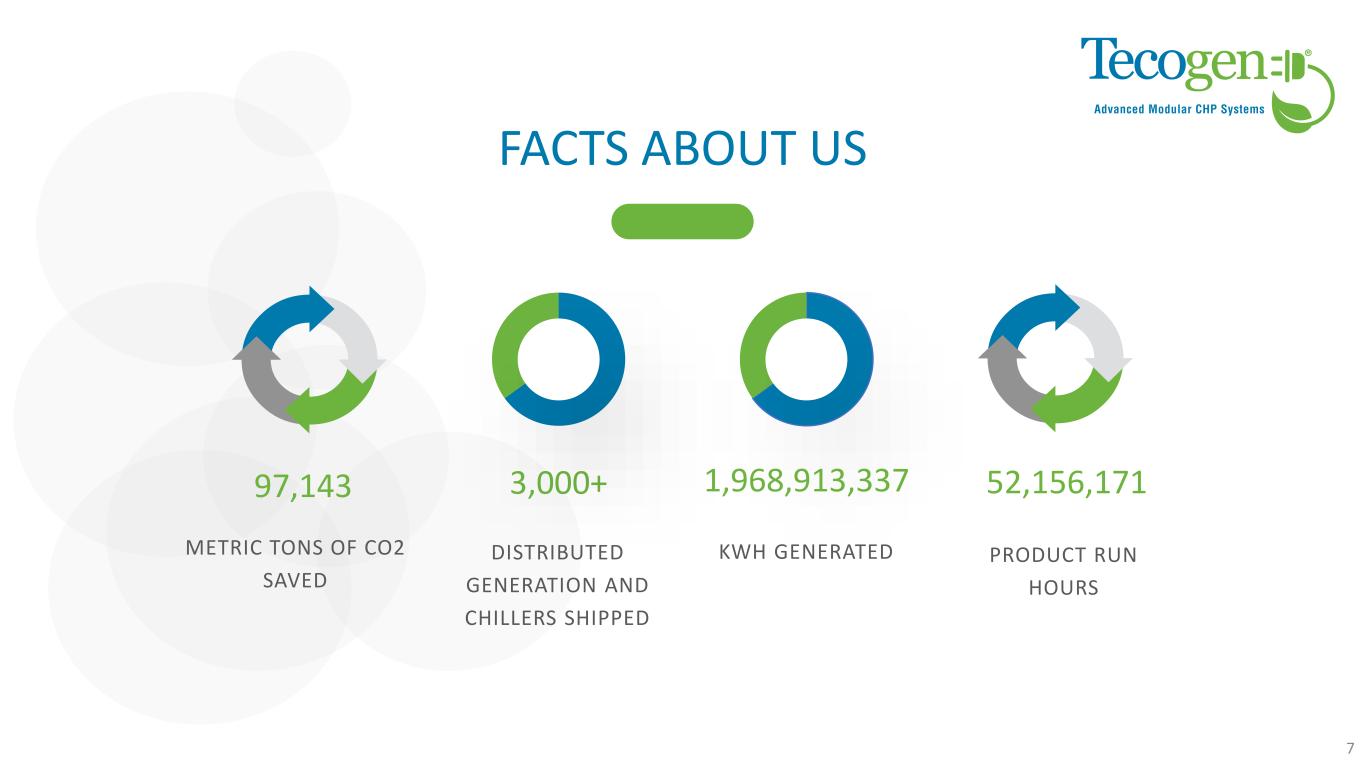
In business for over 35 years, Tecogen has shipped more than 3,000 units, supported by an established network of engineering, sales, and service personnel across the United States. For more information, please visit www.tecogen.com or contact us for a free Site Assessment.
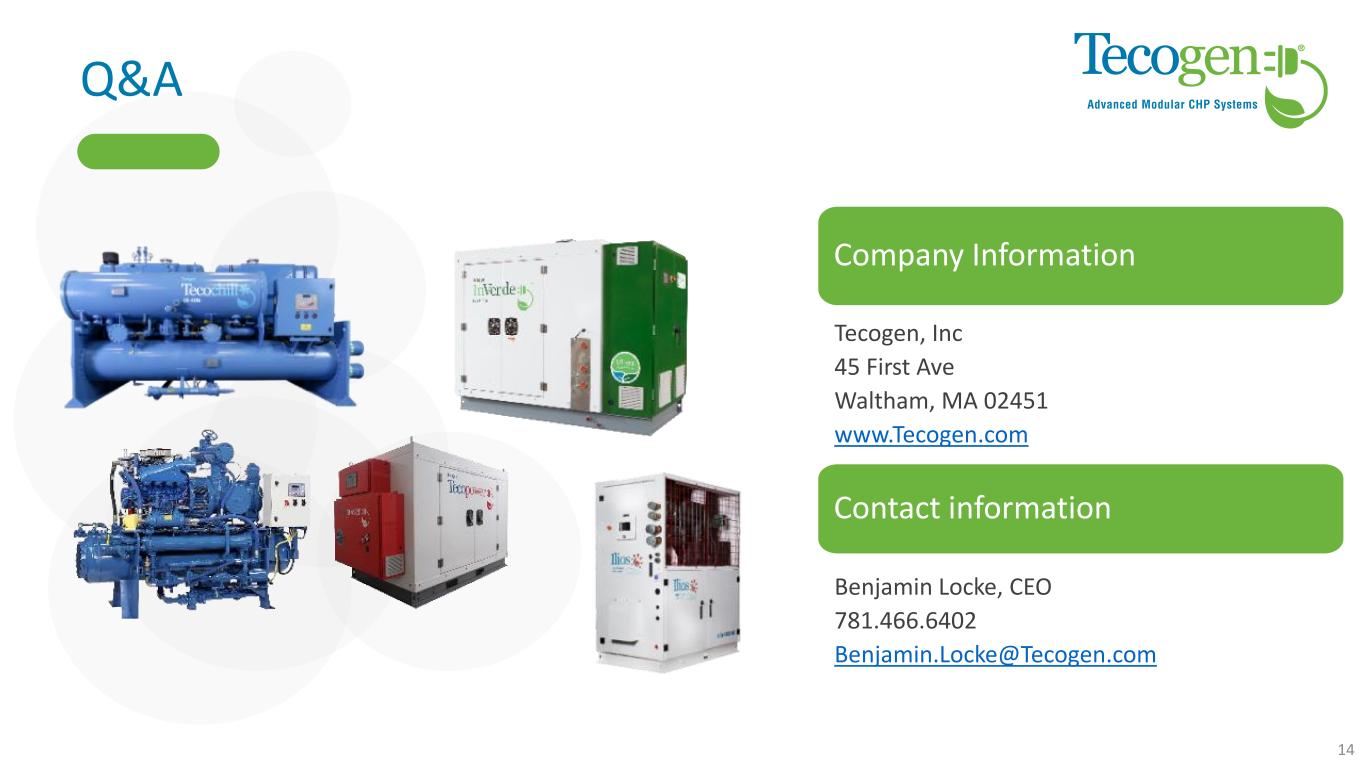
Tecogen, InVerde e+, Ilios, Tecochill, Tecopower, Tecofrost, Tecopack and Ultera are registered or pending trademarks of Tecogen Inc.
Forward Looking Statements
This press release and any accompanying documents, contain “forward-looking statements” which may describe strategies, goals, outlooks or other non-historical matters, or projected revenues, income, returns or other financial measures, that may include words such as "believe," "expect," "anticipate," "intend," "plan," "estimate," "project," "target," "potential," "will," "should," "could," "likely," or "may" and similar expressions intended to identify forward-looking statements. These statements are only predictions and involve known and unknown risks, uncertainties, and other factors that may cause our actual results to differ materially from those expressed or implied by such forward-looking statements. Given these uncertainties, you should not place undue reliance on these forward-looking statements. Forward-looking statements speak only as of the date on which they are made, and we undertake no obligation to update or revise any forward-looking statements.
In addition to those factors described in our Annual Report on Form 10-K, our Quarterly Reports on Form 10-Q and on our Form 8-K filed on August 12, 2021, under “Risk Factors”, among the factors that could cause actual results to differ materially from past and projected future results are the following: fluctuations in demand for our products and services, competing technological developments, issues relating to research and development, the availability of incentives, rebates, and tax benefits relating to our products and services, changes in the regulatory environment relating to our products and services, integration of acquired business operations, and the ability to obtain financing on favorable terms to fund existing operations and anticipated growth.
In addition to GAAP financial measures, this press release includes certain non-GAAP financial measures, including adjusted EBITDA which excludes certain expenses as described in the presentation. We use Adjusted EBITDA as an internal measure of business operating performance and believe that the presentation of non-GAAP financial measures provides a meaningful perspective of the underlying operating performance of our current business and enables investors to better understand and evaluate our historical and prospective operating performance by eliminating items that vary from period to period without correlation to our core operating performance and highlights trends in our business that may not otherwise be apparent when relying solely on GAAP financial measures.
Tecogen Media & Investor Relations Contact Information:
Benjamin Locke
P: 781-466-6402
TECOGEN INC.
CONDENSED CONSOLIDATED BALANCE SHEETS
(unaudited)
| | | | | | | | | | | |
| June 30, 2021 | | December 31, 2020 |
| ASSETS | | | |
| Current assets: | | | |
| Cash and cash equivalents | $ | 3,185,478 | | | $ | 1,490,219 | |
| | | |
| Accounts receivable, net | 7,777,064 | | | 8,671,163 | |
| Unbilled revenue | 3,899,499 | | | 4,267,249 | |
| Employee retention credit | 713,268 | | | — | |
| Inventories, net | 6,811,525 | | | 7,168,596 | |
| | | |
| | | |
| Prepaid and other current assets | 839,732 | | | 597,144 | |
| Total current assets | 23,226,566 | | | 22,194,371 | |
| | | |
| Property, plant and equipment, net | 2,025,334 | | | 2,283,846 | |
| Right of use assets | 2,168,100 | | | 1,632,574 | |
| Intangible assets, net | 1,244,373 | | | 1,360,319 | |
| | | |
| Goodwill | 2,406,156 | | | 2,406,156 | |
| | | |
| | | |
| Other assets | 248,713 | | | 196,387 | |
| TOTAL ASSETS | $ | 31,319,242 | | | $ | 30,073,653 | |
| | | |
| LIABILITIES AND STOCKHOLDERS’ EQUITY | | | |
| Current liabilities: | | | |
| Note payable | $ | — | | | $ | 837,861 | |
| | | |
| | | |
| Accounts payable | 2,597,737 | | | 4,183,105 | |
| Accrued expenses | 2,138,931 | | | 1,993,471 | |
| Deferred revenue | 1,119,943 | | | 1,294,157 | |
| Lease obligations, current | 617,540 | | | 506,514 | |
| | | |
| | | |
| | | |
| Total current liabilities | 6,474,151 | | | 8,815,108 | |
| | | |
| Long-term liabilities: | | | |
| Note payable, net of current portion | 1,874,269 | | | 1,036,339 | |
| Deferred revenue, net of current portion | 244,425 | | | 115,329 | |
| Lease obligations, long-term | 1,642,801 | | | 1,222,492 | |
| Unfavorable contract liability, net | 131,224 | | | — | |
| Total liabilities | 1,438,278 | | | 1,617,051 | |
| 11,805,148 | | | 12,806,319 | |
| Commitments and contingencies | | | |
| | | |
| — | | | — | |
| Stockholders’ equity: | | | |
| Tecogen Inc. shareholders’ equity: | | | |
| Common stock, $0.001 par value; 100,000,000 shares authorized; 24,850,261 and 24,850,261 issued and outstanding at June 30, 2021 and December 31, 2020, respectively | 24,850 | | | 24,850 | |
| Additional paid-in capital | 56,908,194 | | | 56,814,428 | |
| | | |
| | | |
| Accumulated deficit | (37,363,283) | | | (39,529,621) | |
| Total Tecogen Inc. stockholders’ equity | 19,569,761 | | | 17,309,657 | |
| Non-controlling interest | (55,667) | | | (42,323) | |
| Total stockholders’ equity | 19,514,094 | | | 17,267,334 | |
| | | |
| TOTAL LIABILITIES AND STOCKHOLDERS’ EQUITY | $ | 31,319,242 | | | $ | 30,073,653 | |
TECOGEN INC.
CONDENSED CONSOLIDATED STATEMENTS OF OPERATIONS
(unaudited)
| | | | | | | | | | | |
| Three Months Ended |
| June 30, 2021 | | June 30, 2020 |
| Revenues | | | |
| Products | $ | 2,445,927 | | | $ | 3,786,134 | |
| Services | 3,328,314 | | | 3,372,583 | |
| Energy production | 370,861 | | | 276,341 | |
| Total revenues | 6,145,102 | | | 7,435,058 | |
| Cost of sales | | | |
| Products | 1,390,725 | | | 2,220,456 | |
| Services | 1,679,386 | | | 2,102,735 | |
| Energy production | 232,353 | | | 205,876 | |
| Total cost of sales | 3,302,464 | | | 4,529,067 | |
| | | |
| Gross profit | 2,842,638 | | | 2,905,991 | |
| | | |
| | | |
| | | |
| | | |
| | | |
| Operating expenses | | | |
| General and administrative | 2,438,452 | | | 2,637,479 | |
| Selling | 580,871 | | | 602,383 | |
| Research and development | 132,883 | | | 166,027 | |
| | | |
| | | |
| Total operating expenses | 3,152,206 | | | 3,405,889 | |
| | | |
| Loss from operations | (309,568) | | | (499,898) | |
| | | |
| | | |
| Other income (expense) | | | |
| Interest and other income (expense), net | (1,125) | | | 238 | |
| Interest expense | (5,088) | | | (56,253) | |
| Employee retention credit | 713,268 | | | — | |
| Unrealized gain (loss) on investment securities | 18,749 | | | (78,723) | |
| Total other income (expense), net | 725,804 | | | (134,738) | |
| | | |
| Income (loss) before provision for state income taxes | 416,236 | | | (634,636) | |
| Provision for state income taxes | 7,933 | | | 13,171 | |
| Consolidated net income (loss) | 408,303 | | | (647,807) | |
| | | |
| (Income) loss attributable to non-controlling interest | (8,672) | | | (6,081) | |
| Net income (loss) attributable to Tecogen Inc. | $ | 399,631 | | | $ | (653,888) | |
| | | |
| | | |
| | | |
| Net income (loss) per share - basic | $ | 0.02 | | | $ | (0.03) | |
| Net income (loss) per share - diluted | $ | 0.02 | | | $ | (0.03) | |
| Weighted average shares outstanding - basic | 24,850,261 | | | 24,850,261 | |
| Weighted average shares outstanding - diluted | 25,125,210 | | | 24,850,261 | |
| | | | | | | | | | | |
| | | |
| |
| | | |
Non-GAAP financial disclosure (1) | | | |
| Net income (loss) attributable to Tecogen Inc. | $ | 399,631 | | | $ | (653,888) | |
| Interest expense, net | 6,213 | | | 56,015 | |
| Income taxes | 7,933 | | | 13,171 | |
| Depreciation & amortization, net | 117,404 | | | 103,485 | |
| EBITDA | 531,181 | | | (481,217) | |
| Stock based compensation | 54,681 | | | 39,494 | |
| | | |
| Unrealized (gain) loss on investment securities | (18,749) | | | 78,723 | |
| | | |
| Adjusted EBITDA | $ | 567,113 | | | $ | (363,000) | |
TECOGEN INC.
CONDENSED CONSOLIDATED STATEMENTS OF OPERATIONS
(unaudited)
| | | | | | | | | | | |
| Six Months Ended |
| June 30, 2021 | | June 30, 2020 |
| Revenues | | | |
| Products | $ | 4,568,649 | | | $ | 6,837,894 | |
| Services | 6,609,458 | | | 7,532,673 | |
| Energy production | 1,024,156 | | | 1,027,191 | |
| Total revenues | 12,202,263 | | | 15,397,758 | |
| Cost of sales | | | |
| Products | 2,565,012 | | | 4,023,339 | |
| Services | 3,216,989 | | | 4,985,981 | |
| Energy production | 626,416 | | | 690,280 | |
| Total cost of sales | 6,408,417 | | | 9,699,600 | |
| | | |
| Gross profit | 5,793,846 | | | 5,698,158 | |
| | | |
| | | |
| | | |
| | | |
| | | |
| Operating expenses | | | |
| General and administrative | 4,892,305 | | | 5,326,941 | |
| Selling | 1,091,074 | | | 1,458,170 | |
| Research and development | 259,033 | | | 530,363 | |
| | | |
| | | |
| Total operating expenses | 6,242,412 | | | 7,315,474 | |
| | | |
| Loss from operations | (448,566) | | | (1,617,316) | |
| | | |
| | | |
| Other income (expense) | | | |
| Interest and other income (expense), net | (2,328) | | | 11,965 | |
| Interest expense | (9,728) | | | (116,238) | |
| Gain on extinguishment of debt | 1,887,859 | | | — | |
| Employee retention credit | 713,268 | | | — | |
| Gain on sale of investment securities | 6,046 | | | — | |
| Unrealized gain (loss) on investment securities | 56,246 | | | (98,404) | |
| Total other income (expense), net | 2,651,363 | | | (202,677) | |
| Income (loss) before provision for state income taxes | 2,202,797 | | | (1,819,993) | |
| Provision for state income taxes | 15,991 | | | 18,393 | |
| Consolidated net income (loss) | 2,186,806 | | | (1,838,386) | |
| | | |
| (Income) loss attributable to non-controlling interest | (20,468) | | | (17,889) | |
| Net income (loss) attributable to Tecogen Inc. | $ | 2,166,338 | | | $ | (1,856,275) | |
| | | |
| | | |
| | | |
| Net income (loss) per share - basic | $ | 0.09 | | | $ | (0.07) | |
| Net income (loss) per share - diluted | $ | 0.09 | | | $ | (0.07) | |
| Weighted average shares outstanding - basic | 24,850,261 | | | 24,850,256 | |
| Weighted average shares outstanding - diluted | 25,102,470 | | | 24,850,256 | |
| | | | | | | | | | | |
| Six Months Ended |
| June 30, 2021 | | June 30, 2020 |
Non-GAAP financial disclosure (1) | | | |
| Net income (loss) attributable to Tecogen Inc. | $ | 2,166,338 | | | $ | (1,856,275) | |
| Interest & other expense, net | 12,056 | | | 104,273 | |
| Income taxes | 15,991 | | | 18,393 | |
| Depreciation & amortization, net | 241,470 | | | 193,637 | |
| EBITDA | 2,435,855 | | | (1,539,972) | |
| Gain on extinguishment of debt | (1,887,859) | | | — | |
| Stock based compensation | 93,766 | | | 81,730 | |
| Unrealized (gain) loss on marketable securities | (56,246) | | | 98,404 | |
| Gain on sale of marketable securities | (6,046) | | | — | |
| Non-cash abandonment of intangible assets | 7,400 | | | 179,944 | |
| Adjusted EBITDA | $ | 586,870 | | | $ | (1,179,894) | |
(1) Non-GAAP Financial Measures
In addition to reporting net income, a U.S. generally accepted accounting principle (“GAAP”) measure, this news release contains information about Adjusted EBITDA (net income (loss) attributable to Tecogen Inc adjusted for interest, income taxes, depreciation and amortization, stock-based compensation expense, unrealized gain or loss on investment securities, goodwill impairment charges and other non-cash non-recurring charges including abandonment of certain intangible assets and extinguishment of debt), which is a non-GAAP measure. The Company believes Adjusted EBITDA allows investors to view its performance in a manner similar to the methods used by management and provides additional insight into its operating results. Adjusted EBITDA is not calculated through the application of GAAP. Accordingly, it should not be considered as a substitute for the GAAP measure of net income and, therefore, should not be used in isolation of, but in conjunction with, the GAAP measure. The use of any non-GAAP measure may produce results that vary from the GAAP measure and may not be comparable to a similarly defined non-GAAP measure used by other companies.
TECOGEN INC.
CONDENSED CONSOLIDATED STATEMENTS OF CASH FLOWS
(unaudited)
| | | | | | | | | | | |
| Six Months Ended |
| June 30, 2021 | | June 30, 2020 |
| CASH FLOWS FROM OPERATING ACTIVITIES: | | | |
| Consolidated net income (loss) | $ | 2,186,806 | | | $ | (1,838,386) | |
| | | |
| Adjustments to reconcile net income (loss) to net cash provided by (used in) operating activities: | | | |
| Depreciation and amortization | 241,470 | | | 193,637 | |
| Gain on extinguishment of debt | (1,887,859) | | | — | |
| Employee retention credit | (713,268) | | | — | |
| Stock-based compensation | 93,766 | | | 81,730 | |
| | | |
| Gain on sale of investment securities | (6,046) | | | — | |
| Unrealized (gain) loss on investment securities | (56,246) | | | 98,404 | |
| Abandonment of intangible assets | 7,400 | | | 179,944 | |
| Non-cash interest expense | — | | | 50,775 | |
| Changes in operating assets and liabilities | | | |
| (Increase) decrease in: | | | |
| | | |
| Accounts receivable | 894,100 | | | 6,405,936 | |
| Unbilled revenue | 367,750 | | | 538,032 | |
| Inventory | 357,072 | | | (890,868) | |
| | | |
| Prepaid assets and other current assets | (242,588) | | | (6,382) | |
| Other assets | (537,197) | | | 532,293 | |
| Increase (decrease) in: | | | |
| Accounts payable | (1,585,368) | | | (1,197,576) | |
| Accrued expenses and other current liabilities | 290,342 | | | 284,506 | |
| Deferred revenue | (45,118) | | | (1,671,239) | |
| Other liabilities | 531,335 | | | — | |
| | | |
| Net cash provided by (used in) operating activities | (103,649) | | | 2,760,806 | |
| CASH FLOWS FROM INVESTING ACTIVITIES: | | | |
| Purchases of property and equipment | (47,504) | | | (53,674) | |
| | | |
| Proceeds from the sale of investment securities | 11,637 | | | — | |
| Purchases of intangible assets | (5,682) | | | (123,254) | |
| | | |
| Payment of stock issuance costs | — | | | (802) | |
| | | |
| Distributions to non-controlling interest | (33,812) | | | (23,070) | |
| Net cash used in investing activities | (75,361) | | | (200,800) | |
| CASH FLOWS FROM FINANCING ACTIVITIES: | | | |
| | | |
| Proceeds from note payable | 1,874,269 | | | 1,874,200 | |
| Proceeds (payments) on revolving line of credit, net | — | | | (2,453,159) | |
| | | |
| | | |
| Proceeds from exercise of stock options | — | | | 1,200 | |
| | | |
| | | |
| Net cash provided by (used in) financing activities | 1,874,269 | | | (577,759) | |
| Net increase in cash and cash equivalents | 1,695,259 | | | 1,982,247 | |
| Cash and cash equivalents, beginning of the period | 1,490,219 | | | 877,676 | |
| Cash and cash equivalents, end of the period | $ | 3,185,478 | | | $ | 2,859,923 | |
| | | |
| | | |
| Supplemental disclosures of cash flows information: | | | |
| | | |
| | | |
| | | |
| Cash paid for interest | $ | — | | | $ | 36,326 | |
| Cash paid for taxes | $ | 15,991 | | | $ | 5,222 | |