Exhibit 99.1

Thryv Raises SaaS Revenue Guidance and Reports Second Quarter 2021 Financial Results
SaaS Revenue Grows 32% Year-Over-Year
DALLAS, August 11, 2021 – Thryv Holdings, Inc. (NASDAQ:THRY) (“Thryv” or the “Company”), the provider of Thryv®
software, the end-to-end client experience platform for growing small businesses, announced financial results for the second quarter 2021. The Company has also raised its 2021 outlook for its SaaS segment.
“During Q2, we saw strong and continued growth in our SaaS business,” said Joe Walsh, CEO and president of Thryv. “Small businesses are moving to the cloud and we are providing them the tools they need to automate and modernize their businesses.
As a result of our efforts, we are seeing accelerated growth and we are raising our SaaS revenue guidance for 2021.”
“We see clients putting their faith in us as they take that leap to manage and grow their business using modern small business software. Small businesses need an end-to-end solution, not several different point solutions. Multiple solutions are
expensive and are difficult to manage. Thryv provides the frictionless and simplified experience small businesses need.”
Second Quarter 2021 Financial Highlights:
| • |
U.S. SaaS revenue was $41.4 million, a 32.3% increase year-over-year
|
| • |
U.S. Marketing Services revenue was $202.8 million
|
| • |
Thryv International Marketing Services revenue was $46.9 million, net of a $27.8 million deferred revenue purchase price accounting adjustment
|
| • |
Consolidated total revenue was $291.0 million
|
| • |
Consolidated net income was $24.4 million
|
| • |
Consolidated adjusted EBITDA was $96.8 million, representing an adjusted EBITDA margin of 33.2%
|
| • |
Consolidated gross profit was $178.4 million
|
| • |
Consolidated adjusted gross profit was $195.3 million
|
Additional US Business Highlights
| • |
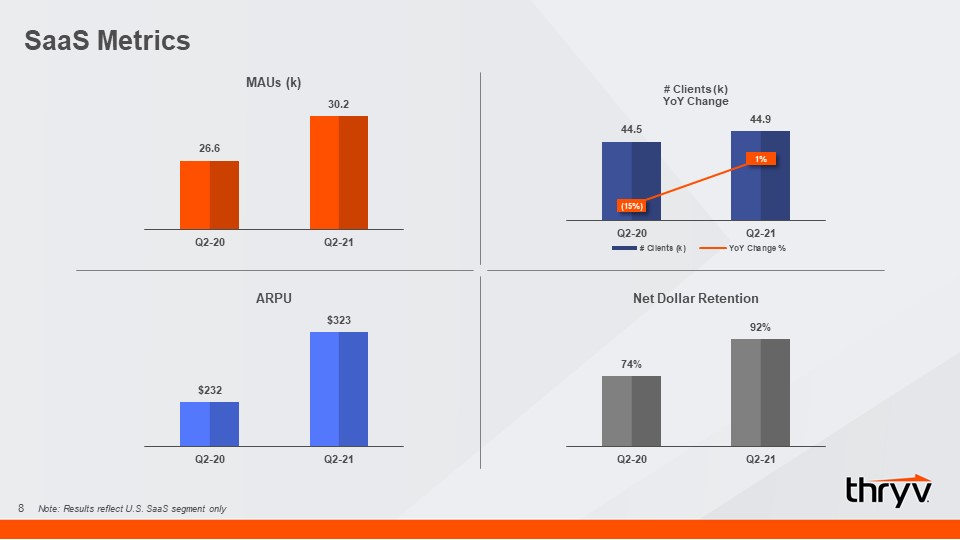
SaaS ARPU increased to $323 for the second quarter of 2021, compared to $232 in the second quarter of 2020
|
| • |
Total SaaS clients increased sequentially to 45 thousand for the second quarter of 2021
|
| • |
SaaS monthly churn was 2.1% for the second quarter of 2021, compared to 3.0% for the second quarter of 2020
|
| • |
Net Dollar Retention improved 18 percentage points to 92% at end of the second quarter of 2021, when compared to the second quarter of 2020
|
| • |
SaaS active users and usage frequency reached new all-time high as daily and weekly active users increased 27% year-over-year
|
| • |
Thryv added to Russell 2000 Index
|
Outlook:
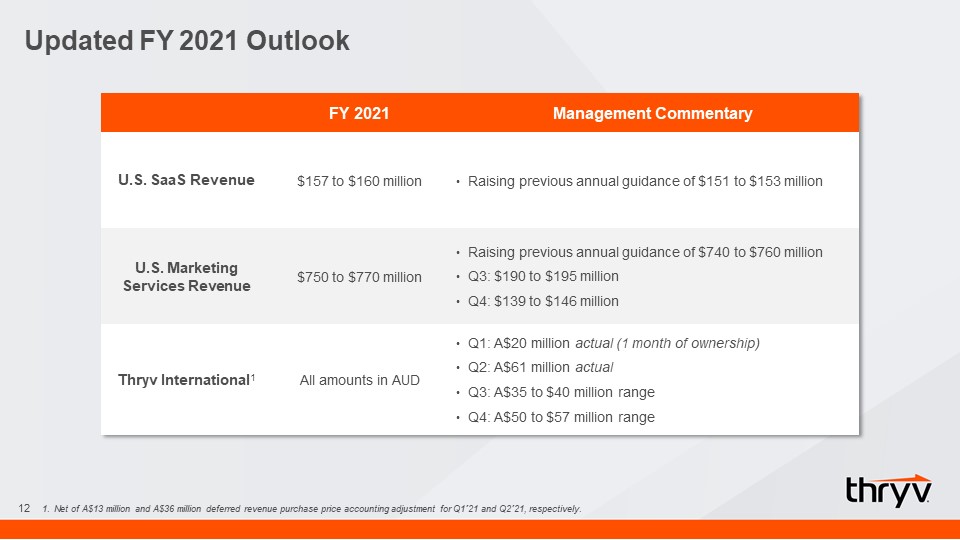
The Company is updating guidance for fiscal year 2021 as indicated below.
| • |
U.S. SaaS year over year revenue guidance is raised to 21 to 23%, from the prior increase in the mid to upper teens.
|
| ◦ |
In dollars, the guidance was raised to $157 – $160 million, up from the previously announced $151 - $158 million
|
| • |
U.S Marketing Services revenue range raised to $750 - $770 million, up from the previously announced $740 - $760 million
|
| • |
Thryv International, which reflects the acquisition of Sensis Holdings, is maintaining guidance for the remainder of the year.(1)
|
(1) Thryv International includes Sensis Pty Ltd (“Sensis”) results subsequent to the March 1, 2021 acquisition date.
These statements are forward-looking and actual results may materially differ. Refer to the “Forward-Looking Statements” section below for information on the factors that could cause our actual results to materially differ from these
forward-looking statements.
Earnings Conference Call Information
Thryv will host a conference call on Wednesday, August 11, 2021 at 8:30 a.m. (Eastern Time) to discuss the Company's second quarter 2021 results. The conference call will be available via the Internet at www.thryv.com. There will be several slides
accompanying the webcast. Please go to the website at least 15 minutes prior to the call to register, download and install any necessary software. The recorded webcast will also be available on the Company's website.
If you are unable to participate in the conference call, a replay will be available. To access the replay, please dial (800) 585-8367 or (416) 621-4642 and enter “5092525.”
Final Results
Thryv Holdings, Inc. and Subsidiaries
Condensed Consolidated Statements of Operations
(in thousands, except share and per share data)
(unaudited)
|
Three Months Ended
June 30,
|
Six Months Ended
June 30,
|
|||||||||||||||
|
2021
|
2020
|
2021
|
2020
|
|||||||||||||
|
Revenue
|
$
|
291,047
|
$
|
303,612
|
$
|
571,653
|
$
|
622,182
|
||||||||
|
Cost of services
|
112,607
|
110,605
|
210,767
|
228,581
|
||||||||||||
|
Gross profit
|
178,440
|
193,007
|
360,886
|
393,601
|
||||||||||||
|
Operating expenses:
|
||||||||||||||||
|
Sales and marketing
|
87,394
|
79,105
|
163,934
|
168,397
|
||||||||||||
|
General and administrative
|
33,100
|
44,194
|
74,379
|
93,756
|
||||||||||||
|
Impairment charges
|
3,611
|
18,132
|
3,611
|
18,230
|
||||||||||||
|
Total operating expenses
|
124,105
|
141,431
|
241,924
|
280,383
|
||||||||||||
|
Operating income
|
54,335
|
51,576
|
118,962
|
113,218
|
||||||||||||
|
Other income (expense):
|
||||||||||||||||
|
Interest expense
|
(14,502
|
)
|
(13,426
|
)
|
(26,109
|
)
|
(28,206
|
)
|
||||||||
|
Interest expense, related party
|
(4,668
|
)
|
(4,586
|
)
|
(8,733
|
)
|
(9,736
|
)
|
||||||||
|
Other components of net periodic pension benefit (cost)
|
272
|
(936
|
)
|
725
|
(1,137
|
)
|
||||||||||
|
Other expense
|
(2,966
|
)
|
—
|
(4,059
|
)
|
—
|
||||||||||
|
Income before (provision) for income taxes
|
32,471
|
32,628
|
80,786
|
74,139
|
||||||||||||
|
(Provision) for income taxes
|
(8,112
|
)
|
(21,164
|
)
|
(19,921
|
)
|
(34,573
|
)
|
||||||||
|
Net income
|
$
|
24,359
|
$
|
11,464
|
$
|
60,865
|
$
|
39,566
|
||||||||
|
Net income per common share:
|
||||||||||||||||
|
Basic
|
$
|
0.72
|
$
|
0.36
|
$
|
1.82
|
$
|
1.24
|
||||||||
|
Diluted
|
$
|
0.66
|
$
|
0.34
|
$
|
1.72
|
$
|
1.15
|
||||||||
|
Weighted-average shares used in computing basic and diluted net income per common share:
|
||||||||||||||||
|
Basic
|
33,622,666
|
31,435,941
|
33,367,734
|
32,007,114
|
||||||||||||
|
Diluted
|
36,687,030
|
33,803,465
|
35,352,445
|
34,414,996
|
||||||||||||
Thryv Holdings, Inc. and Subsidiaries
Condensed Consolidated Balance Sheets
(in thousands, except share data)
(unaudited)
|
June 30, 2021
|
December 31, 2020
|
|||||||
|
Assets
|
||||||||
|
Current assets
|
||||||||
|
Cash and cash equivalents
|
$
|
15,785
|
$
|
2,406
|
||||
|
Accounts receivable, net of allowance of $21,450 and $33,030
|
312,457
|
296,570
|
||||||
|
Contract assets, net of allowance of $157 and $338
|
8,415
|
10,975
|
||||||
|
Taxes receivable
|
1,890
|
9,229
|
||||||
|
Prepaid expenses and other current assets
|
36,370
|
26,172
|
||||||
|
Indemnification asset
|
25,190
|
24,346
|
||||||
|
Total current assets
|
400,107
|
369,698
|
||||||
|
Fixed assets and capitalized software, net
|
76,315
|
89,044
|
||||||
|
Goodwill
|
678,793
|
609,457
|
||||||
|
Intangible assets, net
|
123,907
|
31,777
|
||||||
|
Deferred tax assets
|
106,069
|
93,099
|
||||||
|
Other assets
|
26,944
|
21,902
|
||||||
|
Total assets
|
$
|
1,412,135
|
$
|
1,214,977
|
||||
|
Liabilities and Stockholders' Equity
|
||||||||
|
Current liabilities
|
||||||||
|
Accounts payable
|
$
|
30,024
|
$
|
8,927
|
||||
|
Accrued liabilities
|
168,602
|
139,613
|
||||||
|
Current portion of unrecognized tax benefits
|
30,615
|
30,022
|
||||||
|
Contract liabilities
|
32,233
|
18,942
|
||||||
|
New Term Loan, current
|
70,000
|
—
|
||||||
|
Other current liabilities
|
12,898
|
9,896
|
||||||
|
Total current liabilities
|
344,372
|
207,400
|
||||||
|
New Term Loan, net
|
365,189
|
—
|
||||||
|
New Term Loan, related party
|
154,697
|
—
|
||||||
|
Senior Term Loan, net
|
—
|
335,683
|
||||||
|
Senior Term Loan, related party
|
—
|
113,482
|
||||||
|
ABL Facility
|
58,022
|
79,238
|
||||||
|
Leaseback obligations
|
—
|
54,798
|
||||||
|
Pension obligations, net
|
174,217
|
190,827
|
||||||
|
Deferred tax liabilities
|
1,179
|
508
|
||||||
|
Other liabilities
|
44,756
|
36,266
|
||||||
|
Total long-term liabilities
|
798,060
|
810,802
|
||||||
|
Commitments and contingencies
|
||||||||
|
Stockholders' equity
|
||||||||
|
Common stock - $0.01 par value, 250,000,000 shares authorized; 60,391,597, shares issued and 33,713,187 shares outstanding at June 30, 2021; and 59,590,422 shares issued and 32,912,012 shares
outstanding at December 31, 2020
|
604
|
596
|
||||||
|
Additional paid-in capital
|
1,076,124
|
1,059,624
|
||||||
|
Treasury stock - 26,678,410 shares at June 30, 2021 and December 31, 2020
|
(468,613
|
)
|
(468,613
|
)
|
||||
|
Accumulated other comprehensive income (loss)
|
(4,445
|
)
|
—
|
|||||
|
Accumulated deficit
|
(333,967
|
)
|
(394,832
|
)
|
||||
|
Total stockholders' equity
|
269,703
|
196,775
|
||||||
|
Total liabilities and stockholders' equity
|
$
|
1,412,135
|
$
|
1,214,977
|
||||
Thryv Holdings, Inc. and Subsidiaries
Condensed Consolidated Statements of Cash Flows
(in thousands)
(unaudited)
|
Six Months Ended June 30,
|
||||||||
|
2021
|
2020
|
|||||||
|
Cash Flows from Operating Activities
|
||||||||
|
Net income
|
$
|
60,865
|
$
|
39,566
|
||||
|
Adjustments to reconcile net income to net cash provided by operating activities:
|
||||||||
|
Depreciation and amortization
|
49,626
|
75,429
|
||||||
|
Amortization of debt issuance costs
|
1,930
|
534
|
||||||
|
Deferred income taxes
|
(51,439
|
)
|
(42,150
|
)
|
||||
|
Provision for credit losses
|
292
|
22,436
|
||||||
|
Provision for service credits
|
8,719
|
17,197
|
||||||
|
Stock-based compensation expense (benefit)
|
3,892
|
(5,484
|
)
|
|||||
|
Other components of net periodic pension (benefit) cost
|
(725
|
)
|
1,137
|
|||||
|
Loss on termination of leaseback obligations
|
3,409
|
—
|
||||||
|
(Gain) loss on disposal/write-off of fixed assets and capitalized software
|
(44
|
)
|
3,491
|
|||||
|
Impairment charges
|
3,611
|
18,230
|
||||||
|
Non-cash (gain) loss from remeasurement of indemnification asset
|
(844
|
)
|
4,418
|
|||||
|
Loss on foreign currency exchange rates
|
640
|
—
|
||||||
|
Other, net
|
(17
|
)
|
—
|
|||||
|
Changes in working capital items, excluding acquisitions:
|
||||||||
|
Accounts receivable
|
70,491
|
(28,791
|
)
|
|||||
|
Contract assets
|
2,402
|
(2,050
|
)
|
|||||
|
Prepaid expenses and other assets
|
(7,567
|
)
|
3,177
|
|||||
|
Accounts payable and accrued liabilities
|
(51,133
|
)
|
(67,064
|
)
|
||||
|
Accrued income taxes, net
|
3,258
|
64,821
|
||||||
|
Operating lease liability
|
(2,407
|
)
|
(3,482
|
)
|
||||
|
Contract liabilities
|
(13,157
|
)
|
(3,544
|
)
|
||||
|
Net cash provided by operating activities
|
81,802
|
97,871
|
||||||
|
Cash Flows from Investing Activities
|
||||||||
|
Additions to fixed assets and capitalized software
|
(14,315
|
)
|
(12,975
|
)
|
||||
|
Proceeds from the sale of building and fixed assets
|
63
|
1,502
|
||||||
|
Acquisition of a business, net of cash acquired
|
(174,190
|
)
|
—
|
|||||
|
Net cash (used in) investing activities
|
(188,442
|
)
|
(11,473
|
)
|
||||
|
Cash Flows from Financing Activities
|
||||||||
|
Proceeds from New Term Loan
|
418,070
|
—
|
||||||
|
Proceeds from New Term Loan, related party
|
260,930
|
—
|
||||||
|
Payments of New Tern Loan
|
(62,089
|
)
|
—
|
|||||
|
Payments of New Term Loan, related party
|
(25,911
|
)
|
—
|
|||||
|
Payments of Senior Term Loan
|
(335,821
|
)
|
(45,090
|
)
|
||||
|
Payments of Senior Term Loan, related party
|
(113,789
|
)
|
(20,300
|
)
|
||||
|
Proceeds from ABL Facility
|
545,809
|
606,455
|
||||||
|
Payments of ABL Facility
|
(567,025
|
)
|
(596,969
|
)
|
||||
|
Purchase of treasury stock
|
—
|
(30,626
|
)
|
|||||
|
Other
|
3,305
|
(191
|
)
|
|||||
|
Net cash provided by (used in) financing activities
|
123,479
|
(86,721
|
)
|
|||||
|
Effect of exchange rate changes on cash and cash equivalents
|
(819
|
)
|
—
|
|||||
|
Increase (decrease) in cash and cash equivalents and restricted cash
|
16,020
|
(323
|
)
|
|||||
|
Cash and cash equivalents and restricted cash, beginning of period
|
2,406
|
1,912
|
||||||
|
Cash and cash equivalents and restricted cash, end of period
|
$
|
18,426
|
$
|
1,589
|
||||
|
Supplemental Information
|
||||||||
|
Cash paid for interest
|
$
|
37,608
|
$
|
39,671
|
||||
|
Cash paid for income taxes, net
|
$
|
38,411
|
$
|
11,902
|
||||
|
Three Months Ended June 30, 2021
|
||||||||||||||||
|
Marketing
Services
|
SaaS
|
Thryv
International
|
Total
|
|||||||||||||
|
Revenue
|
$
|
202,795
|
$
|
41,386
|
$
|
46,866
|
$
|
291,047
|
||||||||
|
Segment EBITDA
|
82,684
|
(2,119
|
)
|
16,188
|
96,753
|
|||||||||||
|
Six Months Ended June 30, 2021
|
||||||||||||||||
|
Marketing
Services
|
SaaS
|
Thryv
International
|
Total
|
|||||||||||||
|
Revenue
|
$
|
430,728
|
$
|
78,637
|
$
|
62,288
|
$
|
571,653
|
||||||||
|
Segment EBITDA
|
181,315
|
(1,803
|
)
|
22,174
|
201,686
|
|||||||||||
Non-GAAP Measures
Our results included in this press release include Adjusted EBITDA and Adjusted Gross Profit, which are not presented in accordance with U.S. generally accepted accounting principles (“GAAP”). These non-GAAP measures are presented for supplemental
informational purposes only and are not intended to be considered in isolation or as a substitute for, or superior to, financial information prepared and presented in accordance with GAAP. Please refer to the supplemental information presented in the
tables below for a reconciliation of Adjusted EBITDA to Net income, and Adjusted Gross Profit to gross profit. Both Net income and Gross profit are the most comparable GAAP financial measure to Adjusted EBITDA and Adjusted Gross Profit, respectively.
We believe that these non-GAAP financial measures provide useful information about our financial performance, enhance the overall understanding of our past performance and future prospects and allow for greater transparency with respect to
important metrics used by our management for financial and operational decision-making. We believe that these measures provide an additional tool for investors to use in comparing our core financial performance over multiple periods with other
companies in our industry. However, it is important to note that the particular items we exclude from, or include in, our non-GAAP financial measures may differ from the items excluded from, or included in, similar non-GAAP financial measures used by
other companies in the same industry.
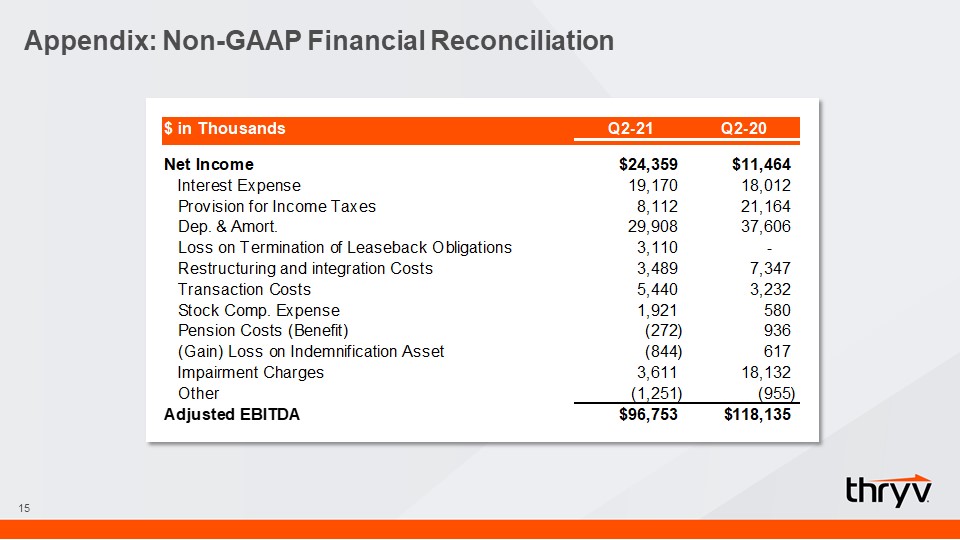
The following is a reconciliation of Adjusted EBITDA to its most directly comparable GAAP measure, Net income (in thousands):
|
Three Months Ended June 30,
|
Six Months Ended June 30,
|
|||||||||||||||
|
2021
|
2020
|
2021
|
2020
|
|||||||||||||
|
Reconciliation of Adjusted EBITDA
|
||||||||||||||||
|
Net income
|
$
|
24,359
|
$
|
11,464
|
$
|
60,865
|
$
|
39,566
|
||||||||
|
Interest expense
|
19,170
|
18,012
|
34,842
|
37,942
|
||||||||||||
|
Provision for income taxes
|
8,112
|
21,164
|
19,921
|
34,573
|
||||||||||||
|
Depreciation and amortization expense
|
29,908
|
37,606
|
49,626
|
75,429
|
||||||||||||
|
Loss on termination of leaseback obligations
|
3,110
|
—
|
3,409
|
—
|
||||||||||||
|
Restructuring and integration expenses (1)
|
3,489
|
7,347
|
12,723
|
17,192
|
||||||||||||
|
Transaction costs (2)
|
5,440
|
3,232
|
15,986
|
9,766
|
||||||||||||
|
Stock-based compensation expense (benefit) (3)
|
1,921
|
580
|
3,892
|
(5,484
|
)
|
|||||||||||
|
Other components of net periodic pension (benefit) cost (4)
|
(272
|
)
|
936
|
(725
|
)
|
1,137
|
||||||||||
|
Non-cash (gain) loss from remeasurement of indemnification asset (5)
|
(844
|
)
|
617
|
(844
|
)
|
4,418
|
||||||||||
|
Impairment charges
|
3,611
|
18,132
|
3,611
|
18,230
|
||||||||||||
|
Other (6)
|
(1,251
|
)
|
(955
|
)
|
(1,620
|
)
|
(1,855
|
)
|
||||||||
|
Adjusted EBITDA
|
$
|
96,753
|
$
|
118,135
|
$
|
201,686
|
$
|
230,914
|
||||||||
| (1) |
For the three and six months ended June 30, 2021 and 2020, expenses relate to periodic efforts to enhance efficiencies and reduce costs, and include severance benefits, loss on disposal of fixed assets and capitalized software, and costs
associated with abandoned facilities and system consolidation.
|
| (2) |
Expenses related to the Company's direct listing, Sensis acquisition and other transaction costs.
|
| (3) |
Company records stock-based compensation expense related to the amortization of grant date fair value of the Company’s stock-based compensation awards. Additionally, stock-based compensation expense includes the remeasurement of these
awards at each period end, prior to October 1, 2020.
|
| (4) |
Other components of net periodic pension cost is from our non-contributory defined benefit pension plans that are currently frozen and incur no additional service costs. The most significant component of other components of net periodic
pension cost relates to the mark to market pension remeasurement.
|
| (5) |
In connection with the YP Acquisition, the seller provided the Company indemnity for future potential losses associated with certain federal and state tax positions taken in tax returns filed by the seller prior to the Acquisition Date.
|
| (6) |
Other primarily includes expenses related to potential non income-based tax liabilities. Additionally, during the three and six months ended June 30, 2021, other includes foreign exchange related expense.
|
The following is a reconciliation of Adjusted Gross Profit, to its most directly comparable GAAP measure, Gross profit (in thousands):
|
Three Months Ended June 30,
|
||||||||
|
2021
|
2020
|
|||||||
|
Reconciliation of Adjusted Gross Profit
|
||||||||
|
Gross profit
|
$
|
178,440
|
$
|
193,007
|
||||
|
Plus:
|
||||||||
|
Depreciation and amortization expense
|
16,817
|
18,632
|
||||||
|
Stock-based compensation expense
|
83
|
70
|
||||||
|
Adjusted gross profit
|
$
|
195,340
|
$
|
211,709
|
||||
|
Gross margin
|
61.3
|
%
|
63.6
|
%
|
||||
|
Adjusted gross margin
|
67.1
|
%
|
69.7
|
%
|
||||
|
Six Months Ended June 30,
|
||||||||
|
2021
|
2020
|
|||||||
|
Reconciliation of Adjusted Gross Profit
|
||||||||
|
Gross profit
|
$
|
360,886
|
$
|
393,601
|
||||
|
Plus:
|
||||||||
|
Depreciation and amortization expense
|
28,061
|
36,987
|
||||||
|
Stock-based compensation expense (benefit)
|
164
|
(246
|
)
|
|||||
|
Adjusted gross profit
|
$
|
389,111
|
$
|
430,342
|
||||
|
Gross margin
|
63.1
|
%
|
63.3
|
%
|
||||
|
Adjusted gross margin
|
68.1
|
%
|
69.2
|
%
|
||||
Forward-Looking Statements
Some statements included in this release constitute forward-looking statements. Statements that include the words “may”, “will”, “could”, “should”, “would”, “believe”, “anticipate”, “forecast”, “estimate”, “expect”, “preliminary”, “intend”,
“plan”, “project”, “outlook”, “future”, “forward”, “guidance” and similar statements of a future or forward-looking nature identify forward-looking statements. These statements are not guarantees of future performance. Forward-looking statements
provide current expectations with respect to our financial performance and future events with respect to our business and industry in general. Forward-looking statements are based on certain assumptions and include any statement that does not
directly relate to any historical or current fact. Accordingly, there are or will be important factors that could cause our actual results to differ materially from those indicated in these statements. We believe that these factors include, but are
not limited to, the risks related to the following: risks related to the ongoing COVID-19 pandemic, the Company’s ability to maintain adequate liquidity to fund operations; the Company’s future operating and financial performance; the Company’s
ability to consummate acquisitions, or, if consummated, to successfully integrate acquired businesses into the Company’s operations, the Company’s ability to recognize the benefits of acquisitions, or the failure of an acquired company to achieve its
plans and objectives; limitations on our operating and strategic flexibility and the ability to operate our business, finance our capital needs or expand business strategies under the terms of our credit facilities; our ability to retain existing
business and obtain and retain new business; general economic or business conditions affecting the markets we serve; declining use of print yellow page directories by consumers; our ability to collect trade receivables from clients to whom we extend
credit; credit risk associated with our reliance on small and medium sized businesses as clients; our ability to attract and retain key managers; increased competition in our markets; our ability to obtain future financing due to changes in the
lending markets or our financial position; our ability to maintain agreements with major Internet search and local media companies; reduced advertising spending and increased contract cancellations by our clients, which causes reduced revenue; and
our ability to anticipate or respond effectively to changes in technology and consumer preferences. All subsequent written and oral forward-looking statements attributable to us or persons acting on our behalf are expressly qualified in their
entirety by such cautionary statements.
If one or more events related to these or other risks or uncertainties materialize, or if our underlying assumptions prove to be incorrect, actual results may differ materially from what we anticipate. For these reasons, we caution you against
relying on forward-looking statements. All forward-looking statements included in this press release are expressly qualified in their entirety by the foregoing cautionary statements. These forward-looking statements speak only as of the date hereof
and, other than as required by law, we undertake no obligation to publicly update or revise any forward-looking statements, whether as a result of new information, future events or otherwise.
About Thryv Holdings, Inc.
Thryv Holdings, Inc. owns the easy-to-use Thryv® end-to-end customer experience software built for growing small to medium sized businesses (SMBs) that helps over 40,000 SaaS clients with the daily demands of running a business. With Thryv®, SMBs
can get the job, manage the job and get credit. Thryv’s award-winning platform provides modernized business functions, allowing SMBs to reach more customers, stay organized, get paid faster and generate reviews. These functions include building a
digital customer database, automated marketing through email and text, updating business listings across the internet, scheduling online appointments, sending notifications and reminders, managing ratings and reviews, generating estimates and
invoices, and processing payments.
Thryv supports franchise operators and multi-location business owners with Hub by Thryv™, a software console that enables businesses managers to oversee their operations using the Thryv® software.
Thryv also connects local businesses to consumer services through our search, display and social media management products, our print directories featuring The Real Yellow Pages® tagline, and our local search portals, which operate under the
DexKnows.com®, Superpages.com® and Yellowpages.com URLs and reach some 35 million monthly visitors. For more information about the company, visit thryv.com.
Thryv delivers business services to more than 400,000 SMBs worldwide that enable these SMBs to compete and win in today’s economy.
On March 1, 2021, Thryv announced it closed the acquisition of Sensis, Australia’s leading digital, marketing and directory services provider, which helps Australians connect and engage through its leading platforms, digital consumer businesses
(Yellow, White Pages, True Local and Whereis), search engine marketing and optimization services, website products, social, data and mapping solutions, and through its digital agency Found. Sensis is also Australia’s largest print directory publisher
including the Yellow and White Pages.
Headquartered in Melbourne, Sensis has a sales presence in all states and territories across Australia.
Media Contact:
Paige Blankenship
Thryv, Inc.
972.453.3012
Investor Contacts:
Cameron Lessard
Thryv, Inc.
214.773.7022
KJ Christopher
Thryv, Inc.
972.453.7068
###