 | Exhibit 99.1 | |||||||
Thryv Grows SaaS Profitability in the Second Quarter, Raises Full-Year 2023 Guidance
–Company achieves 20% SaaS revenue growth
–Company's Q2 SaaS Adjusted EBITDA exceeds guidance range by $5 million
–Full Year 2023 SaaS Revenue and Adjusted EBITDA guidance raised
–Launches free, industry-first offering, Thryv Command Center, to drive product-led growth strategy
DALLAS, August 3, 2023 – Thryv Holdings, Inc. (NASDAQ:THRY) (“Thryv” or the “Company”), the provider of Thryv®, the leading small business software platform, reported SaaS revenue growth of 20% year-over-year in the second quarter of 2023, while SaaS EBITDA margins expanded to 10%.
“We delivered solid second quarter results,” said Joe Walsh, Chairman and CEO. “We have been focused on driving profitable SaaS growth - and we have a strong operating framework in place for this to continue. Our consistent, profitable SaaS growth is the result of leveraging our sales channels. We also continue to demonstrate that our traditional sales channels, selling SaaS to our existing Marketing Services customers, and our client referral initiatives, drive significant margin expansion and profitability. Together, this has improved our SaaS EBITDA margins by 10% sequentially.”
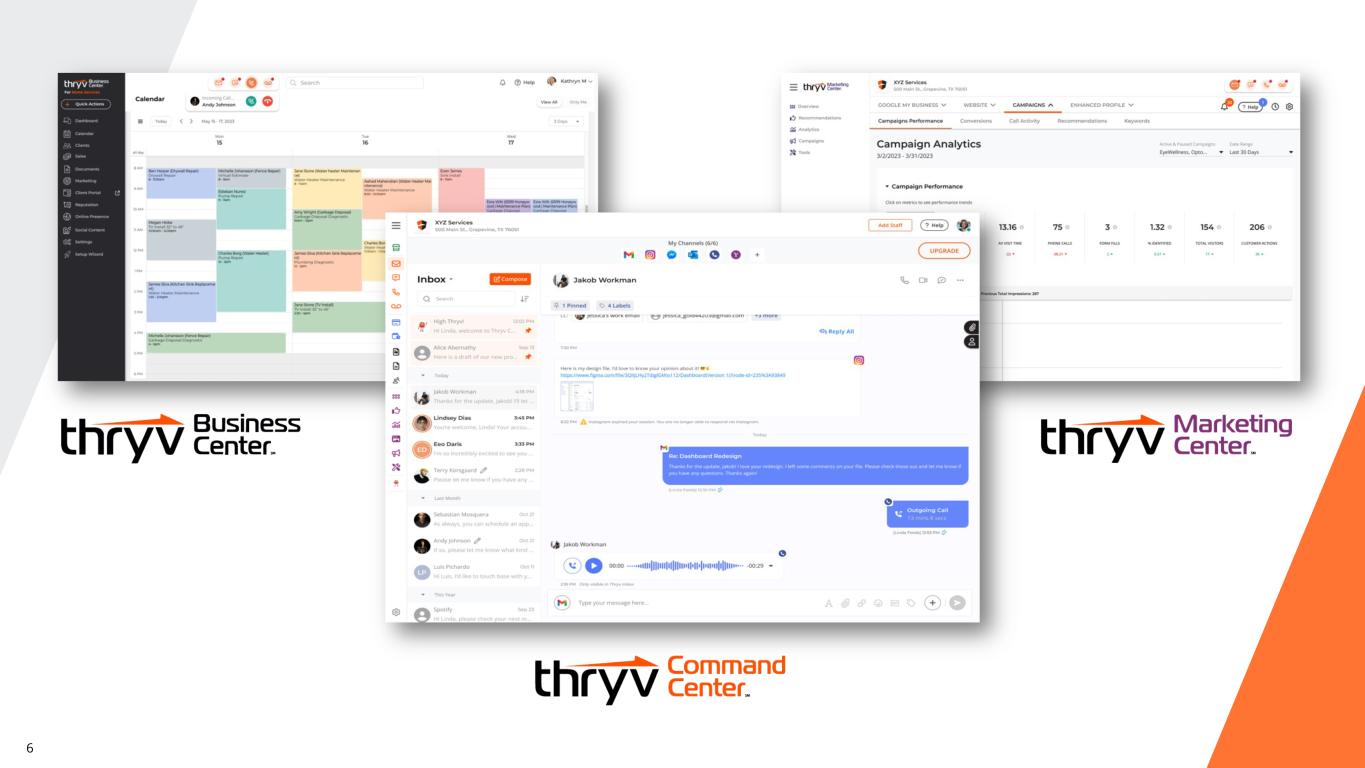
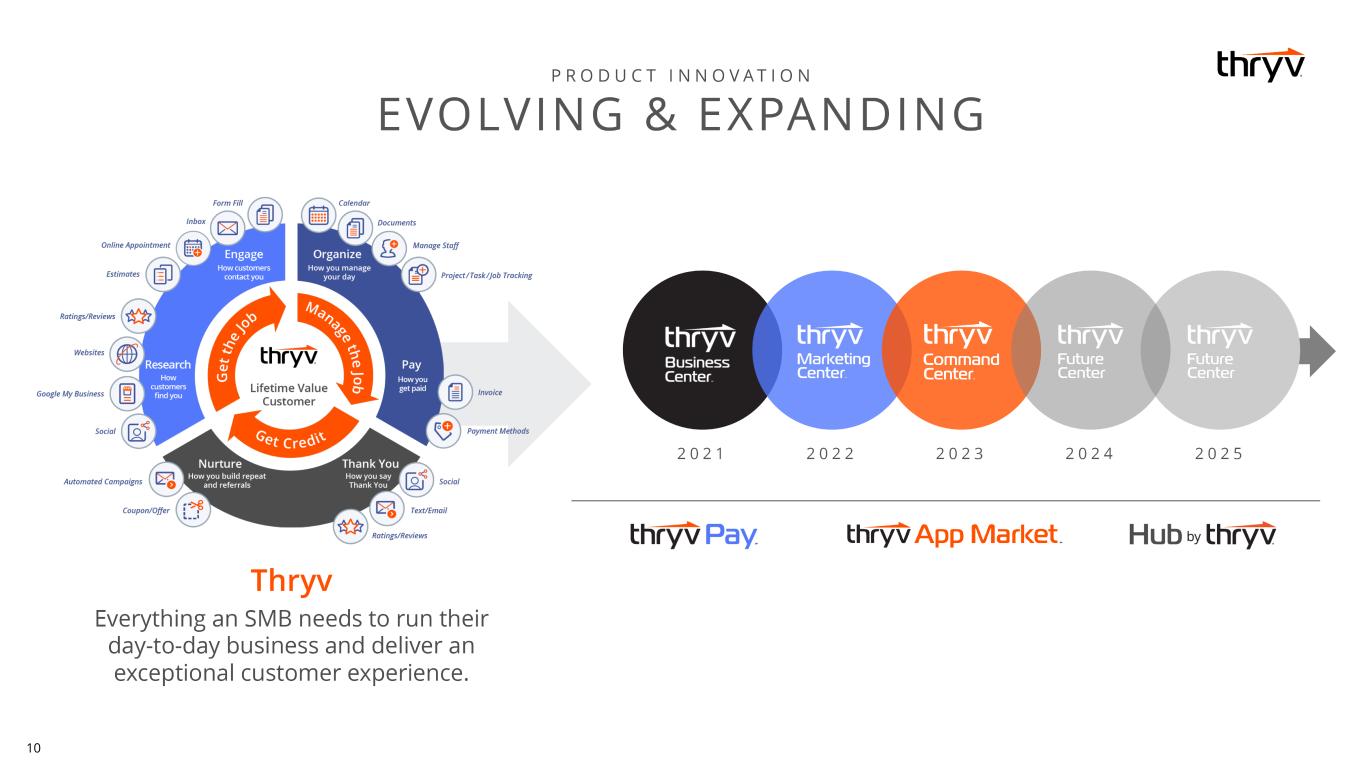
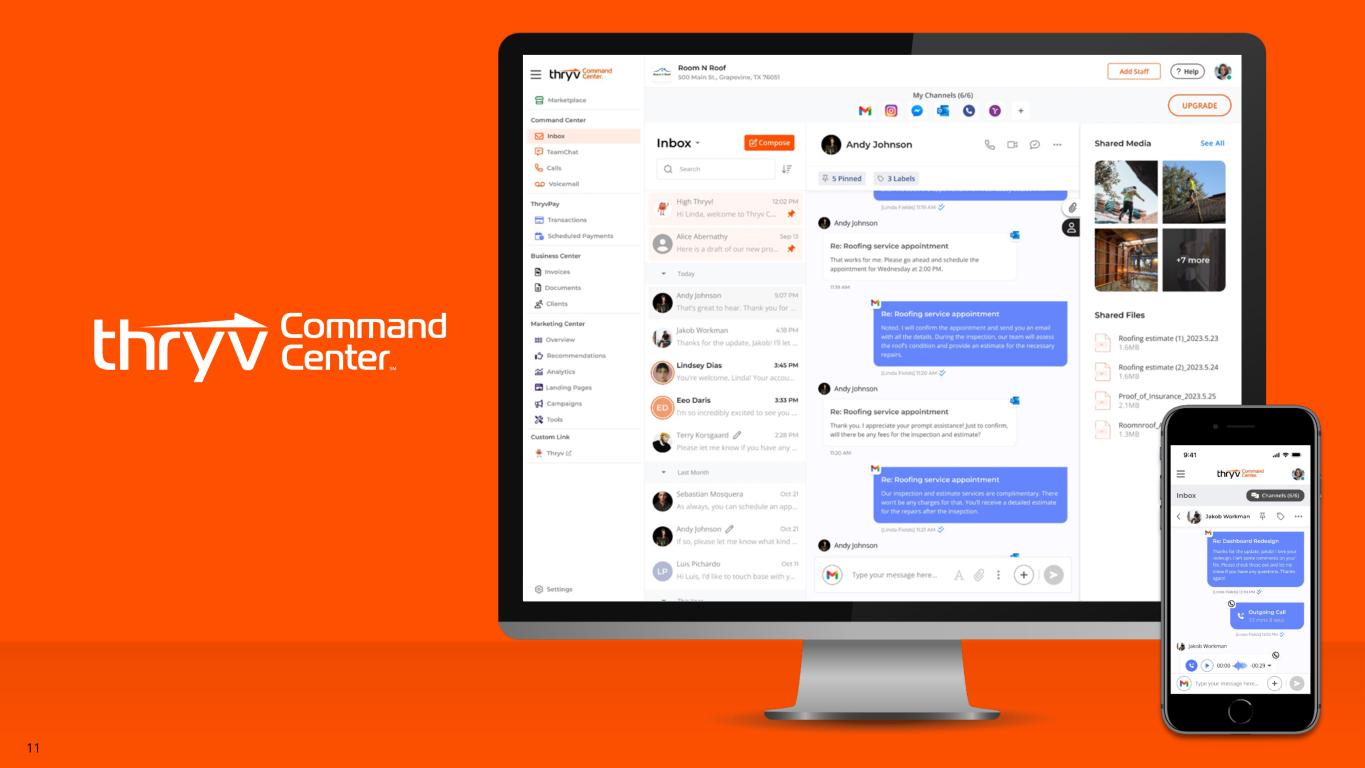
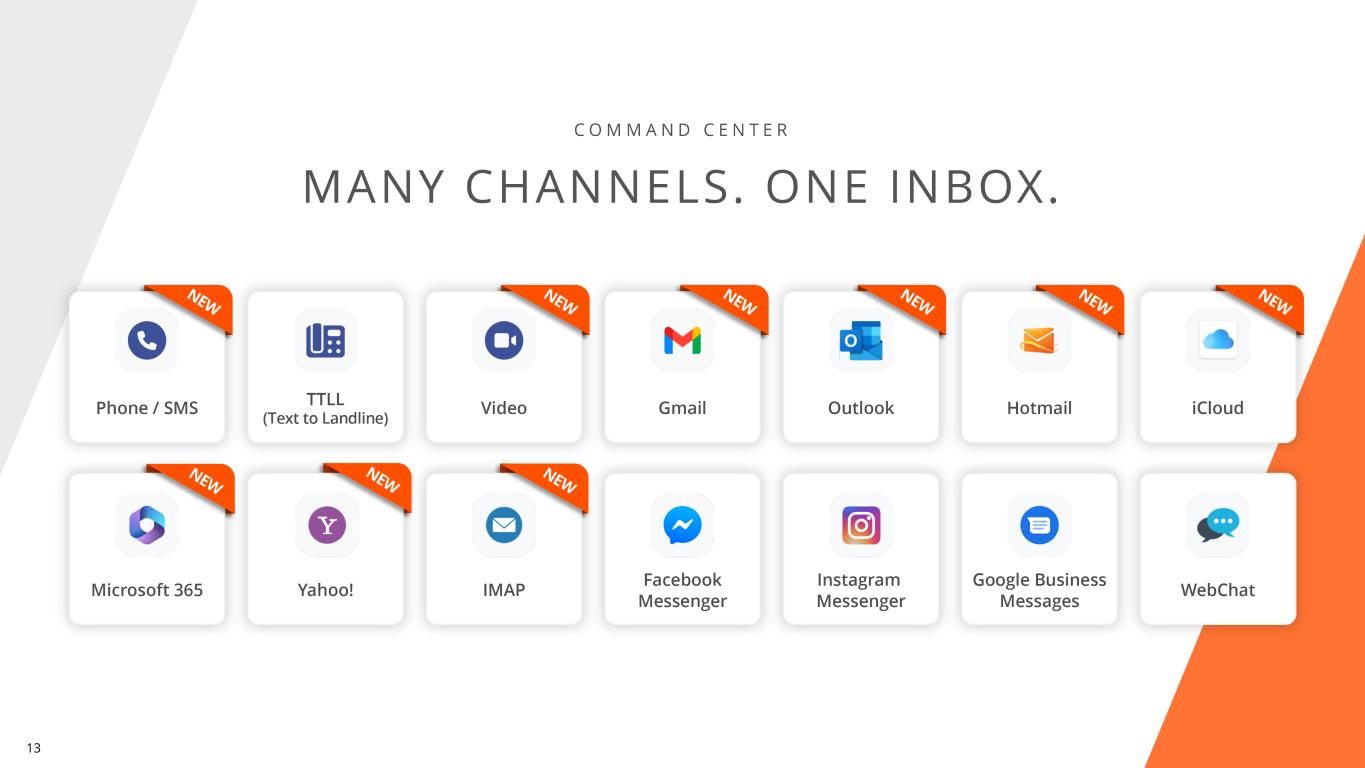
“We are continuing the evolution of our Thryv platform and are laser-focused on delivering solutions that solve problems that small businesses face,” Walsh continued. “We have released a beta version of Thryv Command Center, an industry-first offering that will be a core element to our product-led growth initiative. Thryv Command Center can be downloaded for free to all small business users, and they can upgrade to a more powerful and advanced paid version as their needs warrant. Thryv Command Center centralizes all communication, from email to text to phone and video, into one inbox. With all of our centers, users can upgrade as they are ready. We are excited about this new center, which reinforces our commitment to innovation and layers a product-led growth onto our sales-led motion.”
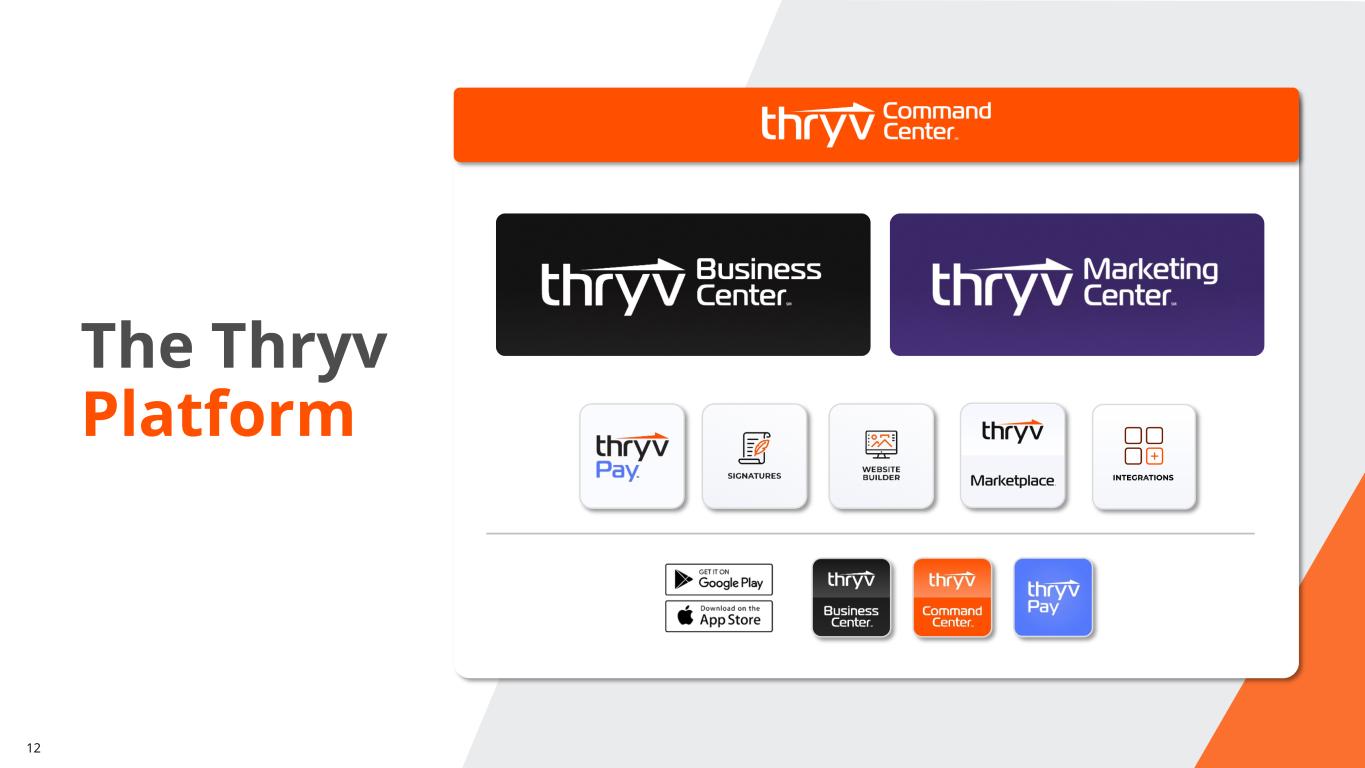
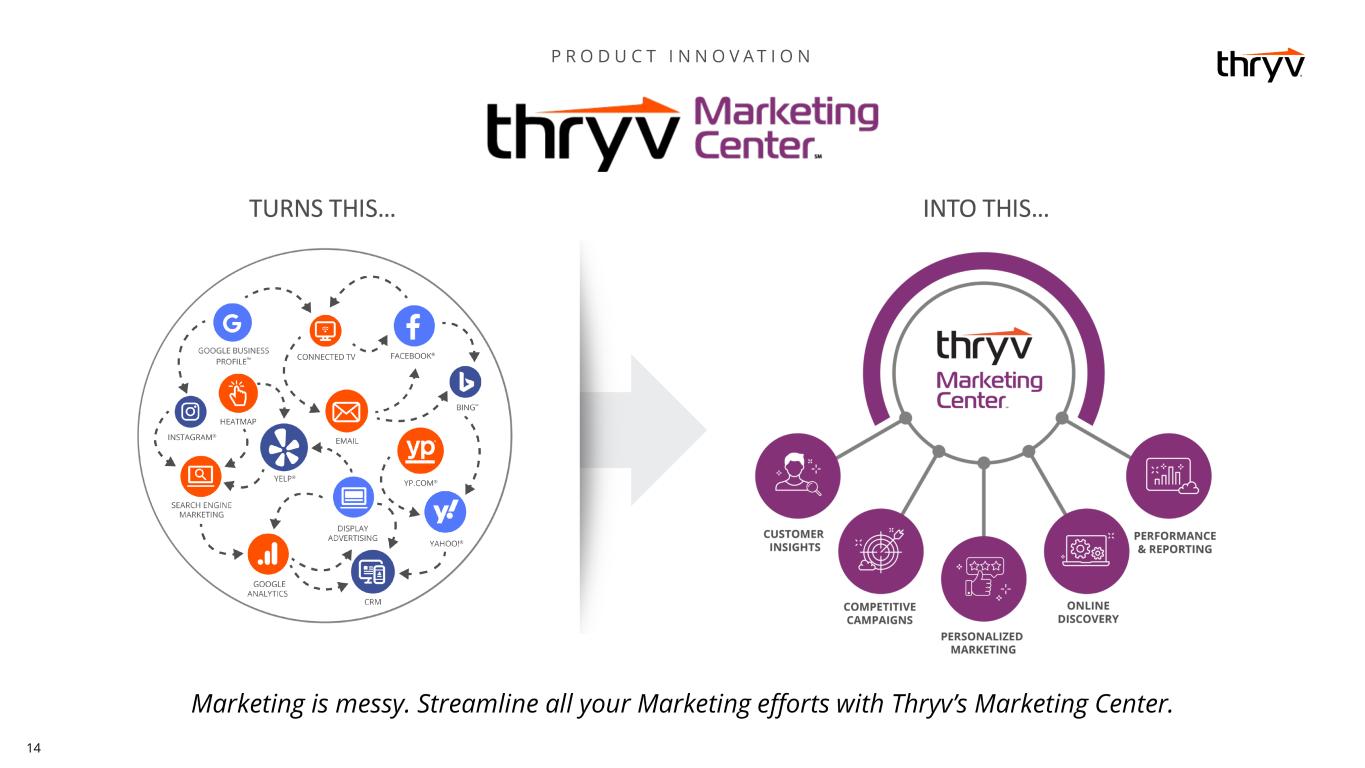
With this launch, the Thryv platform has been re-architected, providing small business owners a modular, easily expandable and customizable user experience that meets their needs. It creates a strong new customer acquisition channel and a clear path to sustained Net Dollar Retention improvement. This launch continues the roll out of new centers, such as the recently announced Marketing Center.
“As we continue to advance our strategy and look to the rest of 2023, we are raising our full-year guidance for SaaS revenue and EBITDA,” said Paul Rouse, Chief Financial Officer. "We are pleased with our results this quarter. We believe we have a sound strategy for accelerating profitable growth in the SaaS business for the balance of the year and into the future.”
| ||||||||
Second Quarter 2023 Financial Highlights:
Revenue
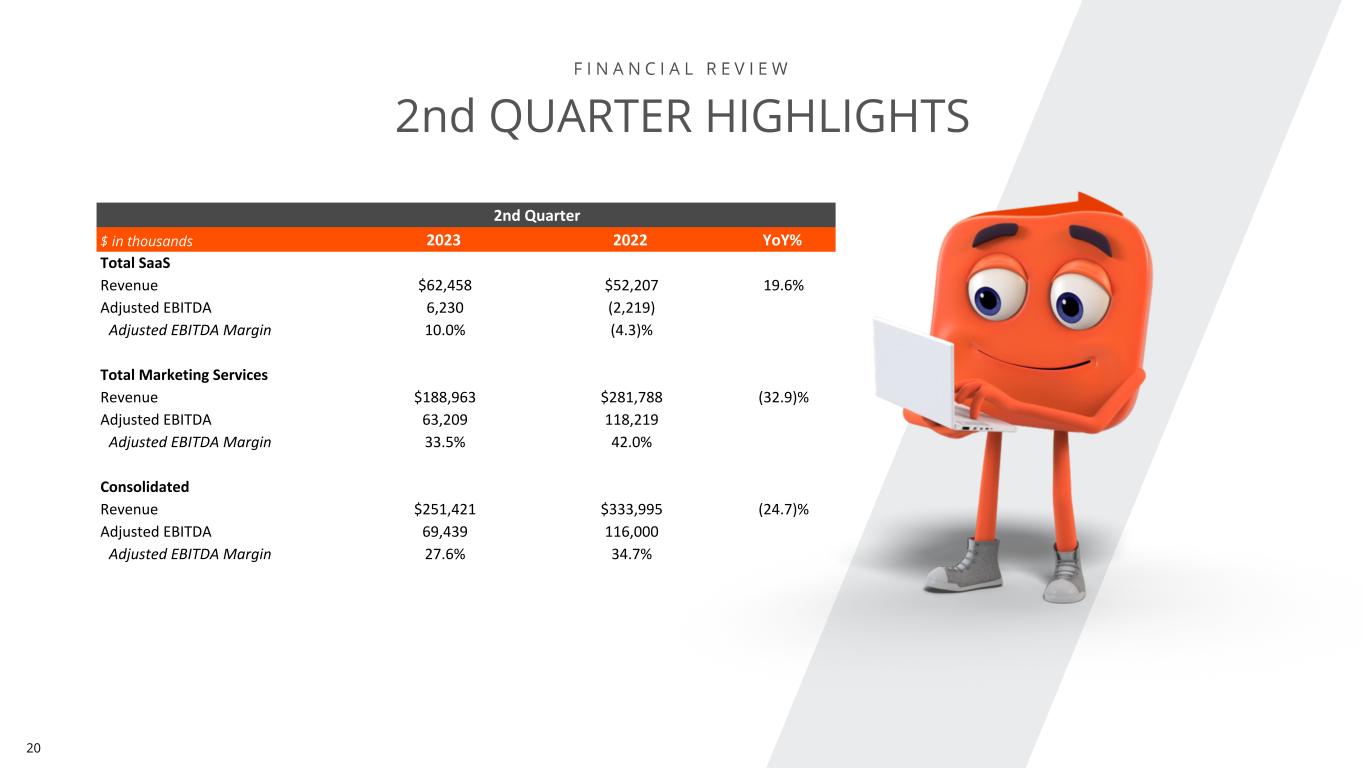
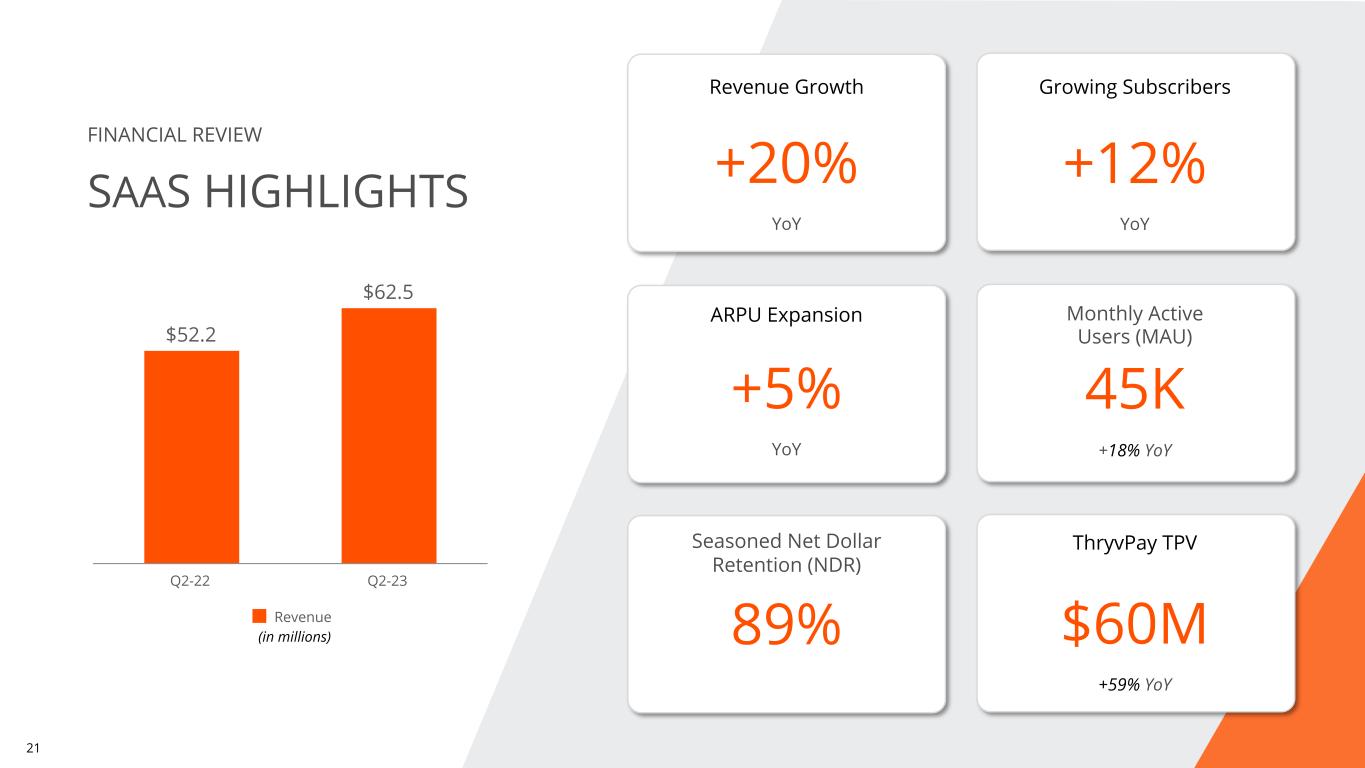
•Total SaaS1 revenue was $62.5 million, a 19.6% increase year-over-year
•Total Marketing Services2 revenue was $189.0 million, a 32.9% decrease year-over-year
•Consolidated total revenue was $251.4 million, a decrease of 24.7% year-over-year
•Consolidated net income was $16.0 million, or $0.43 per diluted share, compared to net income of $58.0 million, or $1.61 per diluted share, for the second quarter of 2022
•Consolidated Adjusted EBITDA was $69.4 million, representing an Adjusted EBITDA margin of 27.6%
•Total SaaS Adjusted EBITDA was $6.2 million, representing an Adjusted EBITDA margin of 10.0%.
•Total Marketing Services Adjusted EBITDA was $63.2 million, representing an Adjusted EBITDA margin of 33.5%
•Consolidated Gross Profit was $160.1 million
•Consolidated Adjusted Gross Profit3 was $167.9 million
•SaaS Gross Profit was $39.2 million, representing a Gross Profit Margin of 62.8%
•SaaS Adjusted Gross Profit was $40.7 million, representing an Adjusted Gross Profit Margin of 65.1%
SaaS Metrics
•SaaS monthly Average Revenue per Unit (“ARPU”)4 increased to $377 for the second quarter of 2023, compared to $358 in the second quarter of 2022
•Total SaaS clients increased 12% year-over-year to 56 thousand for the second quarter of 2023
•Seasoned Net Dollar Retention5 was 89% at the end of the second quarter of 2023
•SaaS monthly active users6 increased 18% year-over-year to 45 thousand active users for the second quarter of 2023
•ThryvPay total payment volume was $60 million, an increase of 59% year-over-year
1 Total SaaS revenue in the U.S. and International segments was $60.2 million and $2.3 million for the three months ended June 30, 2023, respectively.
2 Total Marketing Services revenue in the U.S. and International segments was $137.7 million and $51.3 million for the three months ended June 30, 2023, respectively.
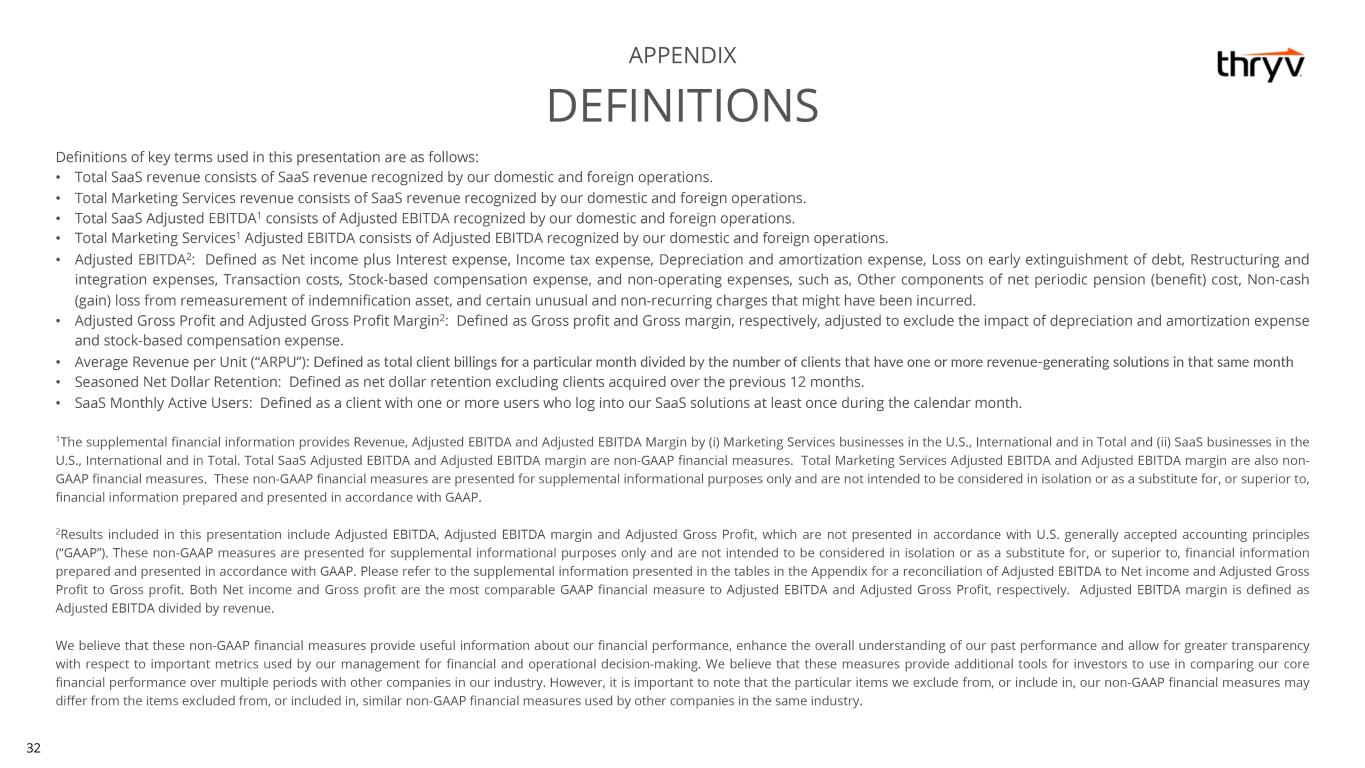
3 Defined as Gross profit adjusted to exclude the impact of depreciation and amortization expense and stock-based compensation expense.
4 Defined as total client billings for a particular month divided by the number of clients that have one or more revenue-generating solutions in that same month.
5 Seasoned Net Dollar Retention is defined as net dollar retention excluding clients acquired over the previous 12 months.
6 Defined as a client with one or more users who log into our SaaS solutions at least once during the calendar month.
| ||||||||
Outlook
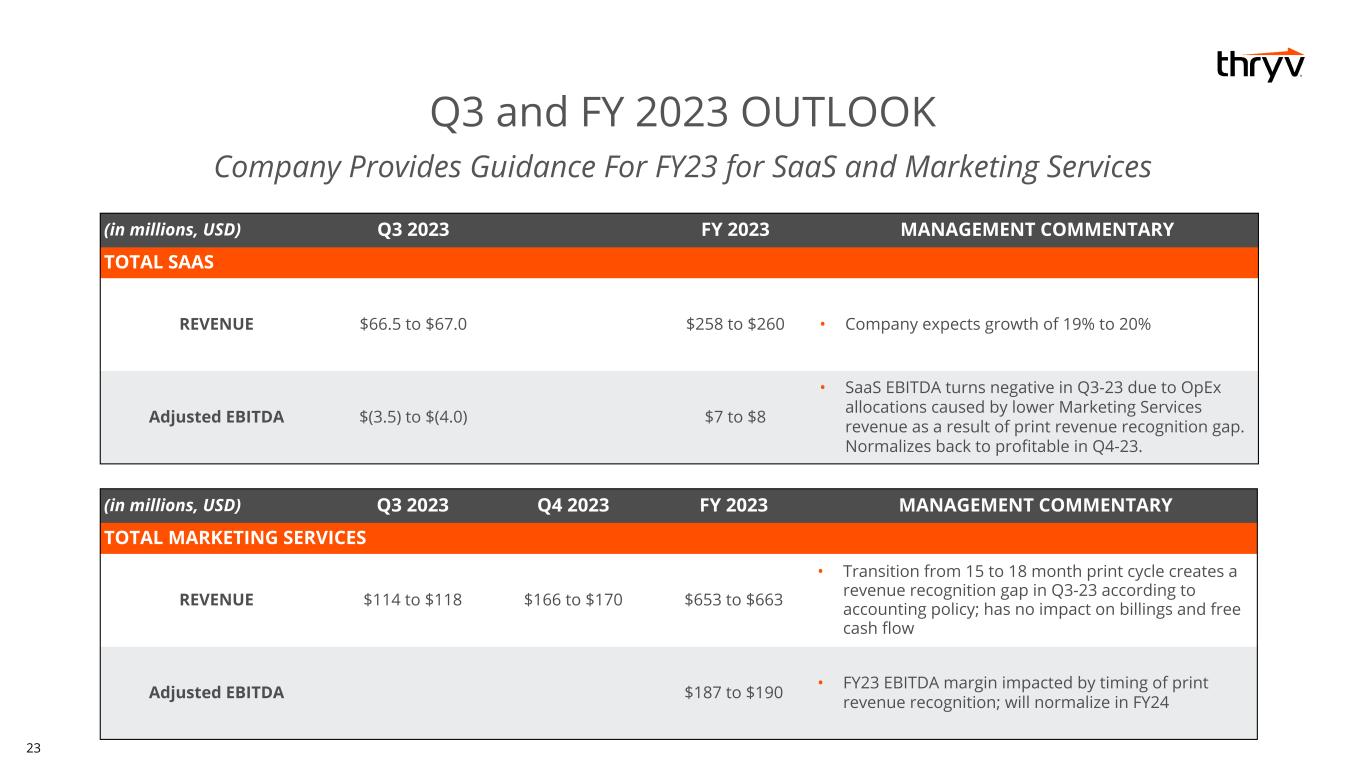
Based on information available as of August 3, 2023, Thryv is issuing guidance7 for the third quarter of 2023 and full year 2023 as indicated below:
| 3rd Quarter | Full Year | ||||||||||||||||
| (in millions) | 2023 | 2023 | |||||||||||||||
| SaaS Revenue | $66.5 - $67.0 | $258 to $260 | |||||||||||||||
| SaaS Adjusted EBITDA | $(3.5) - $(4.0) | $7 - $8 | |||||||||||||||
| 3rd Quarter | 4th Quarter | Full Year | ||||||||||||||||||
| (in millions) | 2023 | 2023 | 2023 | |||||||||||||||||
| Marketing Services Revenue | $114 - $118 | $166 - $170 | $653 - $663 | |||||||||||||||||
| Marketing Services Adjusted EBITDA | $187 - $190 | |||||||||||||||||||
Earnings Conference Call Information
Thryv will host a conference call on Thursday, August 3, 2023 at 8:30 a.m. (Eastern Time) to discuss the Company's second quarter 2023 results.
For analysts to register for this conference call, please use this link. After registering, a confirmation email will be sent, including dial-in details and a unique code for entry. We recommend registering a day in advance or at a minimum thirty minutes prior to the start of the call. To listen to the webcast, please use this link or visit Thryv's Investor Relations website at investor.thryv.com. A live webcast will also be available on the Investor Relations section of the Company's website at investor.thryv.com.
If you are unable to participate in the conference call, a replay will be available. To access the replay, please dial (800) 770-2030 or (647) 362-9199 and enter “87769.”
7 These statements are forward-looking and actual results may materially differ. Refer to the “Forward-Looking Statements” section below for information on the factors that could cause our actual results to materially differ from these forward-looking statements.
| ||||||||
Final Results
Thryv Holdings, Inc. and Subsidiaries
Consolidated Statements of Operations and Comprehensive Income (Loss)
| Three Months Ended | Six Months Ended | ||||||||||||||||||||||
| June 30, | June 30, | ||||||||||||||||||||||
| (in thousands, except share and per share data) | 2023 | 2022 | 2023 | 2022 | |||||||||||||||||||
| Revenue | $ | 251,421 | $ | 333,995 | $ | 496,976 | $ | 642,370 | |||||||||||||||
| Cost of services | 91,336 | 106,013 | 182,083 | 216,532 | |||||||||||||||||||
| Gross profit | 160,085 | 227,982 | 314,893 | 425,838 | |||||||||||||||||||
| Operating expenses: | |||||||||||||||||||||||
| Sales and marketing | 75,683 | 91,813 | 152,026 | 185,768 | |||||||||||||||||||
| General and administrative | 53,695 | 52,650 | 101,375 | 104,844 | |||||||||||||||||||
| Impairment charges | — | 222 | — | 222 | |||||||||||||||||||
| Total operating expenses | 129,378 | 144,685 | 253,401 | 290,834 | |||||||||||||||||||
| Operating income | 30,707 | 83,297 | 61,492 | 135,004 | |||||||||||||||||||
| Other income (expense): | |||||||||||||||||||||||
| Interest expense | (16,292) | (13,756) | (32,780) | (26,864) | |||||||||||||||||||
| Interest expense, related party | — | (896) | — | (2,655) | |||||||||||||||||||
| Other components of net periodic pension (cost) benefit | (1,865) | 9,153 | (1,986) | 9,223 | |||||||||||||||||||
| Other income (expense) | — | 2,404 | (366) | 8,626 | |||||||||||||||||||
| Income before income tax benefit (expense) | 12,550 | 80,202 | 26,360 | 123,334 | |||||||||||||||||||
| Income tax benefit (expense) | 3,428 | (22,200) | (1,068) | (31,821) | |||||||||||||||||||
| Net income | $ | 15,978 | $ | 58,002 | $ | 25,292 | $ | 91,513 | |||||||||||||||
| Other comprehensive income (loss): | |||||||||||||||||||||||
| Foreign currency translation adjustment, net of tax | (302) | (10,139) | (2,490) | (4,691) | |||||||||||||||||||
| Comprehensive income | $ | 15,676 | $ | 47,863 | $ | 22,802 | $ | 86,822 | |||||||||||||||
| Net income per common share: | |||||||||||||||||||||||
| Basic | $ | 0.46 | $ | 1.69 | $ | 0.73 | $ | 2.68 | |||||||||||||||
| Diluted | $ | 0.43 | $ | 1.61 | $ | 0.68 | $ | 2.47 | |||||||||||||||
| Weighted-average shares used in computing basic and diluted net income per common share: | |||||||||||||||||||||||
| Basic | 34,575,338 | 34,250,706 | 34,625,561 | 34,205,593 | |||||||||||||||||||
| Diluted | 36,863,295 | 36,137,989 | 36,956,933 | 37,048,087 | |||||||||||||||||||
| ||||||||
Thryv Holdings, Inc. and Subsidiaries
Consolidated Balance Sheets
| (in thousands, except share data) | June 30, 2023 | December 31, 2022 | |||||||||
| Assets | |||||||||||
| Current assets | |||||||||||
| Cash and cash equivalents | $ | 15,245 | $ | 16,031 | |||||||
Accounts receivable, net of allowance of $14,399 in 2023 and $14,766 in 2022 | 243,893 | 284,698 | |||||||||
Contract assets, net of allowance of $28 in 2023 and $33 in 2022 | 1,746 | 2,583 | |||||||||
| Taxes receivable | 3,640 | 11,553 | |||||||||
| Prepaid expenses | 29,318 | 25,092 | |||||||||
| Indemnification asset | — | 26,495 | |||||||||
| Other current assets | 15,557 | 11,864 | |||||||||
| Total current assets | 309,399 | 378,316 | |||||||||
| Fixed assets and capitalized software, net | 38,569 | 42,334 | |||||||||
| Goodwill | 569,780 | 566,004 | |||||||||
| Intangible assets, net | 31,321 | 34,715 | |||||||||
| Deferred tax assets | 122,548 | 113,859 | |||||||||
| Other assets | 29,610 | 42,649 | |||||||||
| Total assets | $ | 1,101,227 | $ | 1,177,877 | |||||||
| Liabilities and Stockholders' Equity | |||||||||||
| Current liabilities | |||||||||||
| Accounts payable | $ | 7,341 | $ | 18,972 | |||||||
| Accrued liabilities | 106,606 | 126,810 | |||||||||
| Current portion of unrecognized tax benefits | 22,969 | 31,919 | |||||||||
| Contract liabilities | 20,136 | 41,854 | |||||||||
| Current portion of long-term debt | 70,000 | 70,000 | |||||||||
| Other current liabilities | 10,887 | 10,937 | |||||||||
| Total current liabilities | 237,939 | 300,492 | |||||||||
| Term Loan, net | 295,179 | 345,256 | |||||||||
| ABL Facility | 68,278 | 54,554 | |||||||||
| Pension obligations, net | 74,321 | 72,590 | |||||||||
| Other liabilities | 21,184 | 22,718 | |||||||||
| Total long-term liabilities | 458,962 | 495,118 | |||||||||
| Commitments and contingencies | |||||||||||
| Stockholders' equity | |||||||||||
Common stock - $0.01 par value, 250,000,000 shares authorized; 61,832,315 shares issued and 34,477,286 shares outstanding at June 30, 2023; and 61,279,379 shares issued and 34,593,837 shares outstanding at December 31, 2022 | 618 | 613 | |||||||||
| Additional paid-in capital | 1,121,804 | 1,105,701 | |||||||||
Treasury stock - 27,355,029 shares at June 30, 2023 and 26,685,542 shares at December 31, 2022 | (485,730) | (468,879) | |||||||||
| Accumulated other comprehensive income (loss) | (18,751) | (16,261) | |||||||||
| Accumulated deficit | (213,615) | (238,907) | |||||||||
| Total stockholders' equity | 404,326 | 382,267 | |||||||||
| Total liabilities and stockholders' equity | $ | 1,101,227 | $ | 1,177,877 | |||||||
| ||||||||
Thryv Holdings, Inc. and Subsidiaries
Consolidated Statements of Cash Flows
| Six Months Ended June 30, | |||||||||||
| (in thousands) | 2023 | 2022 | |||||||||
| Cash Flows from Operating Activities | |||||||||||
| Net income | $ | 25,292 | $ | 91,513 | |||||||
| Adjustments to reconcile net income to net cash provided by operating activities: | |||||||||||
| Depreciation and amortization | 31,098 | 42,561 | |||||||||
| Amortization of deferred commissions | 5,032 | 5,174 | |||||||||
| Amortization of debt issuance costs | 2,721 | 2,883 | |||||||||
| Deferred income taxes | (9,135) | (16,752) | |||||||||
| Provision for credit losses and service credits | 11,580 | 13,043 | |||||||||
| Stock-based compensation expense | 11,191 | 5,738 | |||||||||
| Other components of net periodic pension cost (benefit) | 1,986 | (9,223) | |||||||||
| Impairment charges | — | 222 | |||||||||
| Gain on foreign currency exchange rates | (881) | (1,622) | |||||||||
| Non-cash loss (gain) from the remeasurement of the indemnification asset | 10,734 | (887) | |||||||||
| Bargain purchase gain | — | (7,005) | |||||||||
| Other | — | 1,688 | |||||||||
| Changes in working capital items, excluding acquisitions: | |||||||||||
| Accounts receivable | 25,075 | (10,298) | |||||||||
| Contract assets | 837 | 1,793 | |||||||||
| Prepaid expenses and other assets | 10,090 | 2,748 | |||||||||
| Accounts payable and accrued liabilities | (38,654) | (29,472) | |||||||||
| Other liabilities | (29,230) | (35,201) | |||||||||
| Net cash provided by operating activities | 57,736 | 56,903 | |||||||||
| Cash Flows from Investing Activities | |||||||||||
| Additions to fixed assets and capitalized software | (14,016) | (9,648) | |||||||||
| Acquisition of a business, net of cash acquired | (8,897) | (22,777) | |||||||||
| Other | (217) | — | |||||||||
| Net cash (used in) investing activities | (23,130) | (32,425) | |||||||||
| Cash Flows from Financing Activities | |||||||||||
| Payments of Term Loan | (52,500) | (36,828) | |||||||||
| Payments of Term Loan, related party | — | (5,672) | |||||||||
| Proceeds from ABL Facility | 483,473 | 488,547 | |||||||||
| Payments of ABL Facility | (469,750) | (471,866) | |||||||||
| Other | 3,826 | 4,338 | |||||||||
| Net cash (used in) financing activities | (34,951) | (21,481) | |||||||||
| Effect of exchange rate changes on cash and cash equivalents | (240) | (627) | |||||||||
| Decrease (increase) in cash and cash equivalents and restricted cash | (585) | 2,370 | |||||||||
| Cash and cash equivalents and restricted cash, beginning of period | 18,180 | 13,557 | |||||||||
| Cash and cash equivalents and restricted cash, end of period | $ | 17,595 | $ | 15,927 | |||||||
| Supplemental Information | |||||||||||
| Cash paid for interest | $ | 29,592 | $ | 24,915 | |||||||
| Cash paid for income taxes, net | $ | 7,419 | $ | 36,934 | |||||||
| Non-cash investing and financing activities | |||||||||||
| Repurchase of Treasury stock as a result of the settlement of the indemnification asset | $ | 15,760 | $ | — | |||||||
| ||||||||
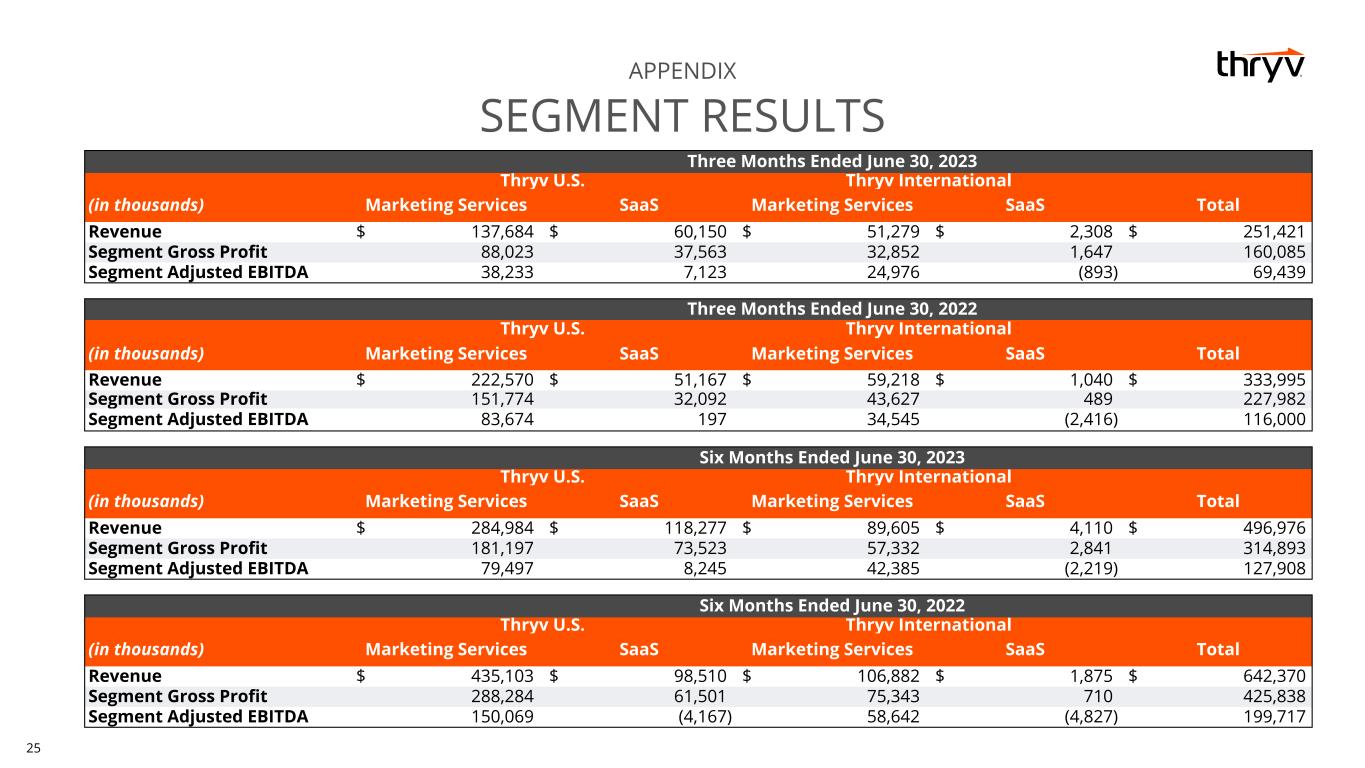
The following tables summarize the operating results of the Company's reportable segments:
| Three Months Ended June 30, | Change | ||||||||||||||||||||||
| (in thousands) | 2023 (1) | 2022 | Amount | % | |||||||||||||||||||
| Revenue | |||||||||||||||||||||||
| Thryv U.S. | |||||||||||||||||||||||
| Marketing Services | $ | 137,684 | $ | 222,570 | $ | (84,886) | (38.1) | % | |||||||||||||||
| SaaS | 60,150 | 51,167 | 8,983 | 17.6 | % | ||||||||||||||||||
| Thryv International | |||||||||||||||||||||||
| Marketing Services | 51,279 | 59,218 | (7,939) | (13.4) | % | ||||||||||||||||||
| SaaS | 2,308 | 1,040 | 1,268 | 121.9 | % | ||||||||||||||||||
| Consolidated Revenue | $ | 251,421 | $ | 333,995 | $ | (82,574) | (24.7) | % | |||||||||||||||
| Segment Gross Profit | |||||||||||||||||||||||
| Thryv U.S. | |||||||||||||||||||||||
| Marketing Services | $ | 88,023 | $ | 151,774 | $ | (63,751) | (42.0) | % | |||||||||||||||
| SaaS | 37,563 | 32,092 | 5,471 | 17.0 | % | ||||||||||||||||||
| Thryv International | |||||||||||||||||||||||
| Marketing Services | 32,852 | 43,627 | (10,775) | (24.7) | % | ||||||||||||||||||
| SaaS | 1,647 | 489 | 1,158 | 236.8 | % | ||||||||||||||||||
| Consolidated Segment Gross Profit | $ | 160,085 | $ | 227,982 | $ | (67,897) | (29.8) | % | |||||||||||||||
| Segment EBITDA | |||||||||||||||||||||||
| Thryv U.S. | |||||||||||||||||||||||
| Marketing Services | $ | 38,233 | $ | 83,674 | $ | (45,441) | (54.3) | % | |||||||||||||||
| SaaS | 7,123 | 197 | 6,926 | NM | |||||||||||||||||||
| Thryv International | |||||||||||||||||||||||
| Marketing Services | 24,976 | 34,545 | (9,569) | (27.7) | % | ||||||||||||||||||
| SaaS | (893) | (2,416) | 1,523 | 63.0 | % | ||||||||||||||||||
| Consolidated Adjusted EBITDA | $ | 69,439 | $ | 116,000 | $ | (46,561) | (40.1) | % | |||||||||||||||
(1) Thryv International includes Yellow's results of operations subsequent to the Yellow Acquisition.
| ||||||||
| Six Months Ended June 30, | Change | ||||||||||||||||||||||
| (in thousands) | 2023 (1) | 2022 (2) | Amount | % | |||||||||||||||||||
| Revenue | |||||||||||||||||||||||
| Thryv U.S. | |||||||||||||||||||||||
| Marketing Services | $ | 284,984 | $ | 435,103 | $ | (150,119) | (34.5) | % | |||||||||||||||
| SaaS | 118,277 | 98,510 | 19,767 | 20.1 | % | ||||||||||||||||||
| Thryv International | |||||||||||||||||||||||
| Marketing Services | 89,605 | 106,882 | (17,277) | (16.2) | % | ||||||||||||||||||
| SaaS | 4,110 | 1,875 | 2,235 | 119.2 | % | ||||||||||||||||||
| Consolidated Revenue | $ | 496,976 | $ | 642,370 | $ | (145,394) | (22.6) | % | |||||||||||||||
| Segment Gross Profit | |||||||||||||||||||||||
| Thryv U.S. | |||||||||||||||||||||||
| Marketing Services | $ | 181,197 | $ | 288,284 | $ | (107,087) | (37.1) | % | |||||||||||||||
| SaaS | 73,523 | 61,501 | 12,022 | 19.5 | % | ||||||||||||||||||
| Thryv International | |||||||||||||||||||||||
| Marketing Services | 57,332 | 75,343 | (18,011) | (23.9) | % | ||||||||||||||||||
| SaaS | 2,841 | 710 | 2,131 | 300.1 | % | ||||||||||||||||||
| Consolidated Segment Gross Profit | $ | 314,893 | $ | 425,838 | $ | (110,945) | (26.1) | % | |||||||||||||||
| Segment EBITDA | |||||||||||||||||||||||
| Thryv U.S. | |||||||||||||||||||||||
| Marketing Services | $ | 79,497 | $ | 150,069 | $ | (70,572) | (47.0) | % | |||||||||||||||
| SaaS | 8,245 | (4,167) | 12,412 | 297.9 | % | ||||||||||||||||||
| Thryv International | |||||||||||||||||||||||
| Marketing Services | 42,385 | 58,642 | (16,257) | (27.7) | % | ||||||||||||||||||
| SaaS | (2,219) | (4,827) | 2,608 | 54.0 | % | ||||||||||||||||||
| Consolidated Adjusted EBITDA | $ | 127,908 | $ | 199,717 | $ | (71,809) | (36.0) | % | |||||||||||||||
(1) Thryv International includes Yellow's results of operations subsequent to the Yellow Acquisition.
(2) Thryv U.S. includes Vivial's results of operations subsequent to the Vivial Acquisition.
| ||||||||
Non-GAAP Measures
Our results included in this press release include Adjusted EBITDA, Adjusted EBITDA margin and Adjusted Gross Profit, which are not presented in accordance with U.S. generally accepted accounting principles (“GAAP”). These non-GAAP measures are presented for supplemental informational purposes only and are not intended to be considered in isolation or as a substitute for, or superior to, financial information prepared and presented in accordance with GAAP. Please refer to the supplemental information presented in the tables below for a reconciliation of Adjusted EBITDA to Net income and Adjusted Gross Profit to Gross profit. Both Net income and Gross profit are the most comparable GAAP financial measure to Adjusted EBITDA and Adjusted Gross Profit, respectively. Adjusted EBITDA margin is defined as Adjusted EBITDA divided by revenue.
We believe that these non-GAAP financial measures provide useful information about our financial performance, enhance the overall understanding of our past performance and allow for greater transparency with respect to important metrics used by our management for financial and operational decision-making. We believe that these measures provide additional tools for investors to use in comparing our core financial performance over multiple periods with other companies in our industry. However, it is important to note that the particular items we exclude from, or include in, our non-GAAP financial measures may differ from the items excluded from, or included in, similar non-GAAP financial measures used by other companies in the same industry.
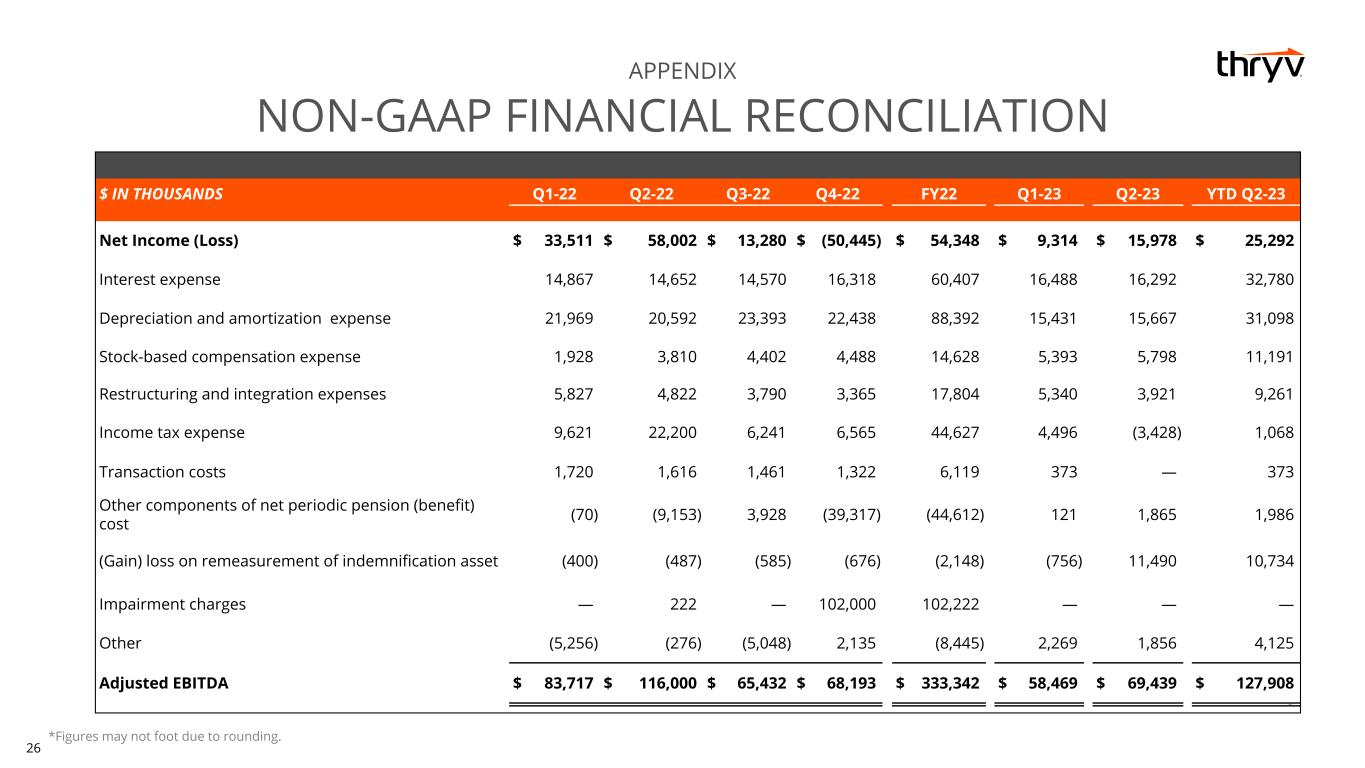
The following is a reconciliation of Adjusted EBITDA to its most directly comparable GAAP measure, Net income:
| Three Months Ended June 30, | Six Months Ended June 30, | ||||||||||||||||||||||
| (in thousands) | 2023 | 2022 | 2023 | 2022 | |||||||||||||||||||
| Reconciliation of Adjusted EBITDA | |||||||||||||||||||||||
| Net income | $ | 15,978 | $ | 58,002 | $ | 25,292 | $ | 91,513 | |||||||||||||||
| Interest expense | 16,292 | 14,652 | 32,780 | 29,519 | |||||||||||||||||||
| Depreciation and amortization expense | 15,667 | 20,592 | 31,098 | 42,561 | |||||||||||||||||||
Stock-based compensation expense (1) | 5,798 | 3,810 | 11,191 | 5,738 | |||||||||||||||||||
Restructuring and integration expenses (2) | 3,921 | 4,822 | 9,261 | 10,649 | |||||||||||||||||||
| Income tax (benefit) expense | (3,428) | 22,200 | 1,068 | 31,821 | |||||||||||||||||||
Transaction costs (3) | — | 1,616 | 373 | 3,336 | |||||||||||||||||||
Other components of net periodic pension cost (benefit) (4) | 1,865 | (9,153) | 1,986 | (9,223) | |||||||||||||||||||
Non-cash loss (gain) from remeasurement of indemnification asset (5) | 11,490 | (487) | 10,734 | (887) | |||||||||||||||||||
| Impairment charges | — | 222 | — | 222 | |||||||||||||||||||
Other (6) | 1,856 | (276) | 4,125 | (5,532) | |||||||||||||||||||
| Adjusted EBITDA | $ | 69,439 | $ | 116,000 | $ | 127,908 | $ | 199,717 | |||||||||||||||
(1)We record stock-based compensation expense related to the amortization of grant date fair value of the Company’s stock-based compensation awards.
(2)For the three and six months ended June 30, 2023 and 2022, expenses relate to periodic efforts to enhance efficiencies and reduce costs, and include severance benefits, and costs associated with abandoned facilities and system consolidation.
(3)Expenses related to the Yellow acquisition, Vivial acquisition and other transaction costs.
| ||||||||
(4)Other components of net periodic pension cost (benefit) is from our non-contributory defined benefit pension plans that are currently frozen and incur no additional service costs. The most significant component of Other components of net periodic pension cost (benefit) relates to periodic mark-to-market pension remeasurement.
(5)In connection with the YP Acquisition, the seller indemnified us for future potential losses associated with certain federal and state tax positions taken in tax returns filed by the seller prior to the acquisition date.
(6)Other primarily represents foreign exchange-related expense. Additionally, during the six months ended June 30, 2022, Other includes the bargain purchase gain as a result of the Vivial Acquisition.
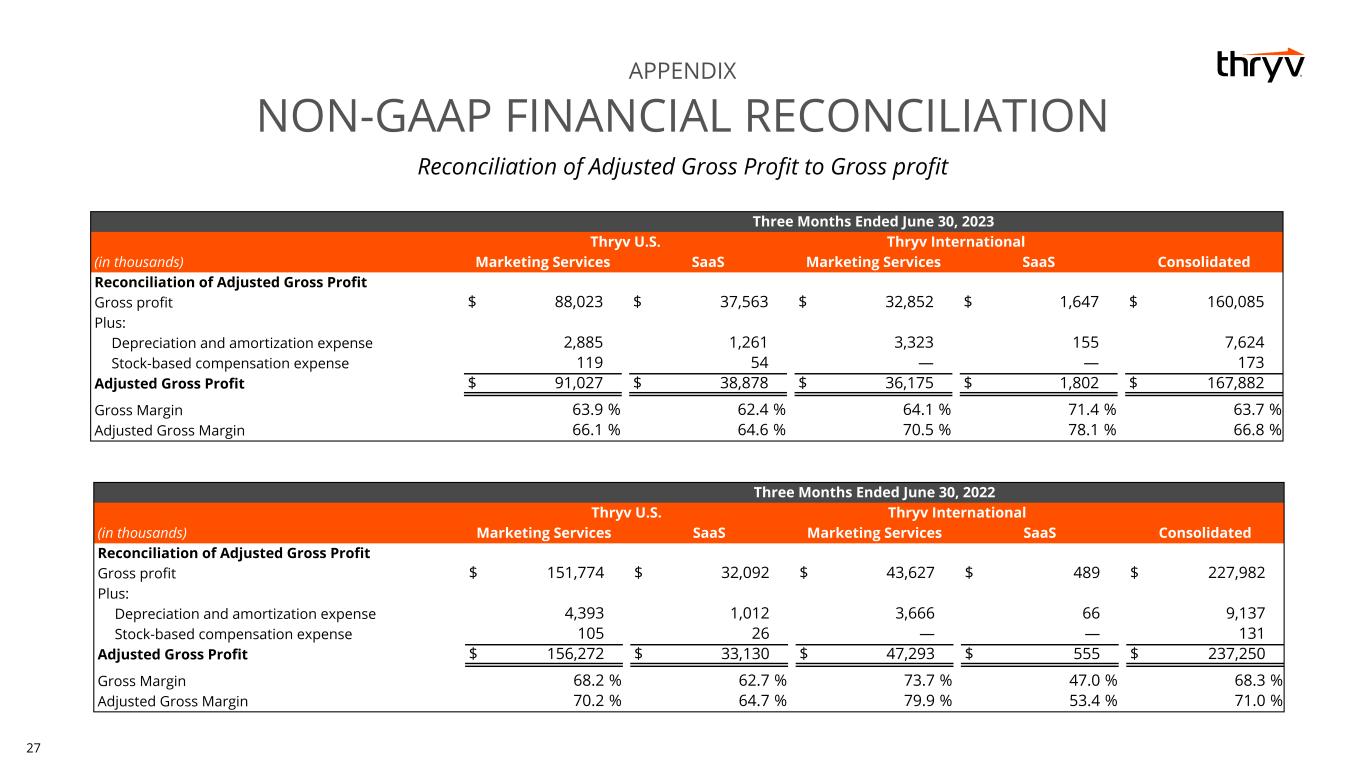
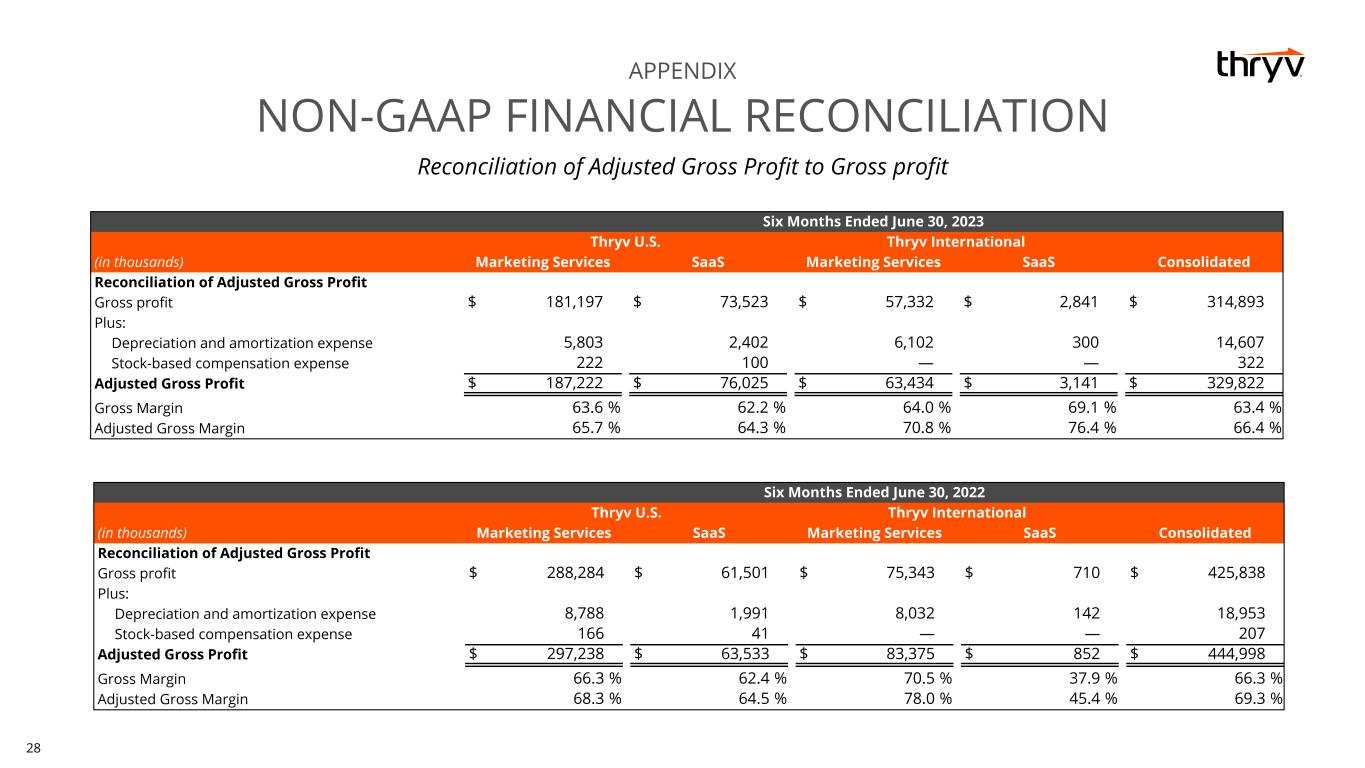
The following tables set forth reconciliations of Adjusted Gross Profit and Adjusted Gross Margin, to their most directly comparable GAAP measures, Gross profit and Gross margin:
| Three Months Ended June 30, 2023 | |||||||||||||||||||||||||||||
| Thryv U.S. | Thryv International | ||||||||||||||||||||||||||||
| (in thousands) | Marketing Services | SaaS | Marketing Services | SaaS | Total | ||||||||||||||||||||||||
| Reconciliation of Adjusted Gross Profit | |||||||||||||||||||||||||||||
| Gross profit | $ | 88,023 | $ | 37,563 | $ | 32,852 | $ | 1,647 | $ | 160,085 | |||||||||||||||||||
| Plus: | |||||||||||||||||||||||||||||
| Depreciation and amortization expense | 2,885 | 1,261 | 3,323 | 155 | 7,624 | ||||||||||||||||||||||||
| Stock-based compensation expense | 119 | 54 | — | — | 173 | ||||||||||||||||||||||||
| Adjusted Gross Profit | $ | 91,027 | $ | 38,878 | $ | 36,175 | $ | 1,802 | $ | 167,882 | |||||||||||||||||||
| Gross Margin | 63.9 | % | 62.4 | % | 64.1 | % | 71.4 | % | 63.7 | % | |||||||||||||||||||
| Adjusted Gross Margin | 66.1 | % | 64.6 | % | 70.5 | % | 78.1 | % | 66.8 | % | |||||||||||||||||||
| Three Months Ended June 30, 2022 | |||||||||||||||||||||||||||||
| Thryv U.S. | Thryv International | ||||||||||||||||||||||||||||
| (in thousands) | Marketing Services | SaaS | Marketing Services | SaaS | Total | ||||||||||||||||||||||||
| Reconciliation of Adjusted Gross Profit | |||||||||||||||||||||||||||||
| Gross profit | $ | 151,774 | $ | 32,092 | $ | 43,627 | $ | 489 | $ | 227,982 | |||||||||||||||||||
| Plus: | |||||||||||||||||||||||||||||
| Depreciation and amortization expense | 4,393 | 1,012 | 3,666 | 66 | 9,137 | ||||||||||||||||||||||||
| Stock-based compensation expense | 105 | 26 | — | — | 131 | ||||||||||||||||||||||||
| Adjusted Gross Profit | $ | 156,272 | $ | 33,130 | $ | 47,293 | $ | 555 | $ | 237,250 | |||||||||||||||||||
| Gross Margin | 68.2 | % | 62.7 | % | 73.7 | % | 47.0 | % | 68.3 | % | |||||||||||||||||||
| Adjusted Gross Margin | 70.2 | % | 64.7 | % | 79.9 | % | 53.4 | % | 71.0 | % | |||||||||||||||||||
| ||||||||
| Six Months Ended June 30, 2023 | |||||||||||||||||||||||||||||
| Thryv U.S. | Thryv International | ||||||||||||||||||||||||||||
| (in thousands) | Marketing Services | SaaS | Marketing Services | SaaS | Total | ||||||||||||||||||||||||
| Reconciliation of Adjusted Gross Profit | |||||||||||||||||||||||||||||
| Gross profit | $ | 181,197 | $ | 73,523 | $ | 57,332 | $ | 2,841 | $ | 314,893 | |||||||||||||||||||
| Plus: | |||||||||||||||||||||||||||||
| Depreciation and amortization expense | 5,803 | 2,402 | 6,102 | 300 | 14,607 | ||||||||||||||||||||||||
| Stock-based compensation expense | 222 | 100 | — | — | 322 | ||||||||||||||||||||||||
| Adjusted Gross Profit | $ | 187,222 | $ | 76,025 | $ | 63,434 | $ | 3,141 | $ | 329,822 | |||||||||||||||||||
| Gross Margin | 63.6 | % | 62.2 | % | 64.0 | % | 69.1 | % | 63.4 | % | |||||||||||||||||||
| Adjusted Gross Margin | 65.7 | % | 64.3 | % | 70.8 | % | 76.4 | % | 66.4 | % | |||||||||||||||||||
| Six Months Ended June 30, 2022 | |||||||||||||||||||||||||||||
| Thryv U.S. | Thryv International | ||||||||||||||||||||||||||||
| (in thousands) | Marketing Services | SaaS | Marketing Services | SaaS | Total | ||||||||||||||||||||||||
| Reconciliation of Adjusted Gross Profit | |||||||||||||||||||||||||||||
| Gross profit | $ | 288,284 | $ | 61,501 | $ | 75,343 | $ | 710 | $ | 425,838 | |||||||||||||||||||
| Plus: | |||||||||||||||||||||||||||||
| Depreciation and amortization expense | 8,788 | 1,991 | 8,032 | 142 | 18,953 | ||||||||||||||||||||||||
| Stock-based compensation expense | 166 | 41 | — | — | 207 | ||||||||||||||||||||||||
| Adjusted Gross Profit | $ | 297,238 | $ | 63,533 | $ | 83,375 | $ | 852 | $ | 444,998 | |||||||||||||||||||
| Gross Margin | 66.3 | % | 62.4 | % | 70.5 | % | 37.9 | % | 66.3 | % | |||||||||||||||||||
| Adjusted Gross Margin | 68.3 | % | 64.5 | % | 78.0 | % | 45.4 | % | 69.3 | % | |||||||||||||||||||
Supplemental Financial Information
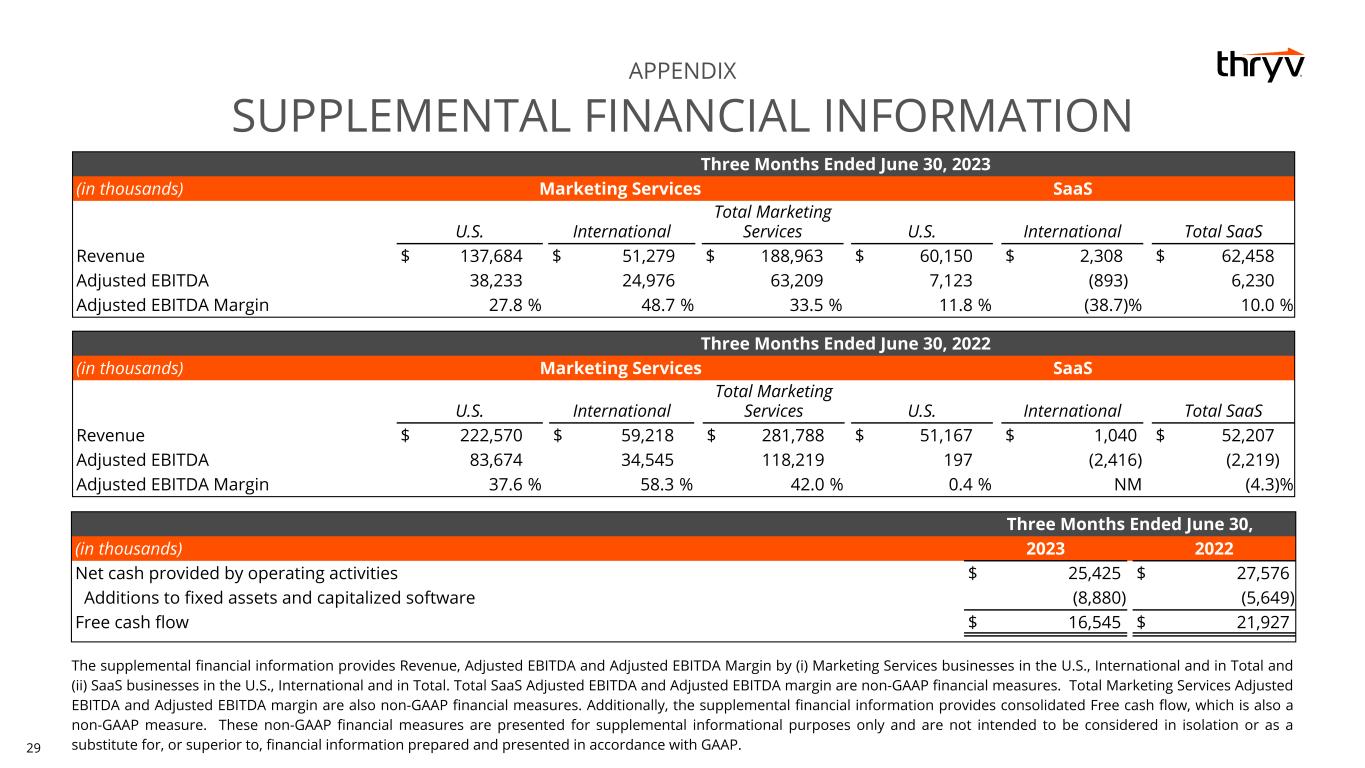
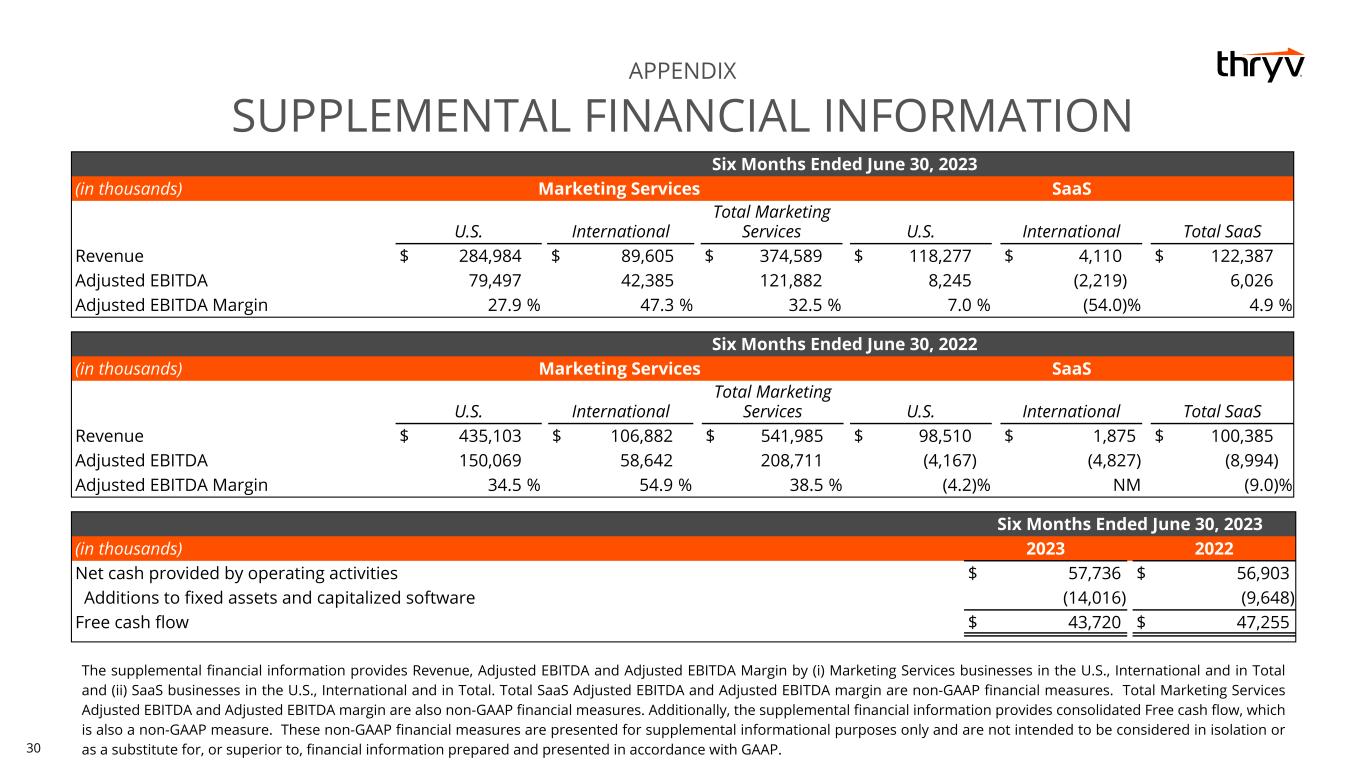
The following supplemental financial information provides Revenue, Adjusted EBITDA and Adjusted EBITDA Margin by (i) Marketing Services businesses in the U.S., International and in Total and (ii) SaaS businesses in the U.S., International and in Total. Total SaaS Adjusted EBITDA and Adjusted EBITDA margin are non-GAAP financial measures. Total Marketing Services Adjusted EBITDA and Adjusted EBITDA margin are also non-GAAP financial measures. These non-GAAP financial measures are presented for supplemental informational purposes only and are not intended to be considered in isolation or as a substitute for, or superior to, financial information prepared and presented in accordance with GAAP. Please refer to the supplemental information presented in the tables below for a reconciliation of these non-GAAP financial measures to the corresponding segment financial measures presented in accordance with GAAP.
We believe that these non-GAAP financial measures provide useful information about our global SaaS and Marketing Services financial performance, enhance the overall understanding of our global SaaS and Marketing Services past financial performance and allow for greater transparency with respect to important metrics used by our management for financial and operational decision-making. We believe that these measures provide additional tools for investors to use in comparing our core financial performance over multiple periods.
| ||||||||
| Three Months Ended June 30, 2023 | |||||||||||||||||||||||||||||||||||
| (in thousands) | Marketing Services | SaaS | |||||||||||||||||||||||||||||||||
| U.S. | International | Total | U.S. | International | Total | ||||||||||||||||||||||||||||||
| Revenue | $ | 137,684 | $ | 51,279 | $ | 188,963 | $ | 60,150 | $ | 2,308 | $ | 62,458 | |||||||||||||||||||||||
| Adjusted EBITDA | 38,233 | 24,976 | 63,209 | 7,123 | (893) | 6,230 | |||||||||||||||||||||||||||||
| Adjusted EBITDA Margin | 27.8 | % | 48.7 | % | 33.5 | % | 11.8 | % | (38.7) | % | 10.0 | % | |||||||||||||||||||||||
| Three Months Ended June 30, 2022 | |||||||||||||||||||||||||||||||||||
| (in thousands) | Marketing Services | SaaS | |||||||||||||||||||||||||||||||||
| U.S. | International | Total | U.S. | International | Total | ||||||||||||||||||||||||||||||
| Revenue | $ | 222,570 | $ | 59,218 | $ | 281,788 | $ | 51,167 | $ | 1,040 | $ | 52,207 | |||||||||||||||||||||||
| Adjusted EBITDA | 83,674 | 34,545 | 118,219 | 197 | (2,416) | (2,219) | |||||||||||||||||||||||||||||
| Adjusted EBITDA Margin | 37.6 | % | 58.3 | % | 42.0 | % | 0.4 | % | NM | (4.3) | % | ||||||||||||||||||||||||
| Six Months Ended June 30, 2023 | |||||||||||||||||||||||||||||||||||
| (in thousands) | Marketing Services | SaaS | |||||||||||||||||||||||||||||||||
| U.S. | International | Total | U.S. | International | Total | ||||||||||||||||||||||||||||||
| Revenue | $ | 284,984 | $ | 89,605 | $ | 374,589 | $ | 118,277 | $ | 4,110 | $ | 122,387 | |||||||||||||||||||||||
| Adjusted EBITDA | 79,497 | 42,385 | 121,882 | 8,245 | (2,219) | 6,026 | |||||||||||||||||||||||||||||
| Adjusted EBITDA Margin | 27.9 | % | 47.3 | % | 32.5 | % | 7.0 | % | (54.0) | % | 4.9 | % | |||||||||||||||||||||||
| Six Months Ended June 30, 2022 | |||||||||||||||||||||||||||||||||||
| (in thousands) | Marketing Services | SaaS | |||||||||||||||||||||||||||||||||
| U.S. | International | Total | U.S. | International | Total | ||||||||||||||||||||||||||||||
| Revenue | $ | 435,103 | $ | 106,882 | $ | 541,985 | $ | 98,510 | $ | 1,875 | $ | 100,385 | |||||||||||||||||||||||
| Adjusted EBITDA | 150,069 | 58,642 | 208,711 | (4,167) | (4,827) | (8,994) | |||||||||||||||||||||||||||||
| Adjusted EBITDA Margin | 34.5 | % | 54.9 | % | 38.5 | % | (4.2) | % | NM | (9.0) | % | ||||||||||||||||||||||||
Forward-Looking Statements
Certain statements contained herein are not historical facts, constitute “forward-looking statements” within the meaning of the Private Securities Litigation Reform Act of 1995 and involve a number of risks and uncertainties. Statements that include the words “may”, “will”, “could”, “should”, “would”, “believe”, “anticipate”, “forecast”, “estimate”, “expect”, “preliminary”, “intend”, “plan”, “target”, “project”, “outlook”, “future”, “forward”, “guidance” and similar statements of a future or forward-looking nature identify forward-looking statements. These statements are not guarantees of future performance. These forward-looking statements are based on our current expectations and beliefs concerning future developments and their potential effect on us. While management believes that these forward-looking statements are reasonable as and when made, there can be no assurance that future developments affecting us will be those that we anticipate. Accordingly, there are or will be important factors that could cause our actual results to differ materially from those indicated in these statements. We believe that these factors include, but are not limited to, the risks related to the following: risks related to the ongoing COVID-19 pandemic, the Company’s ability to maintain adequate liquidity to fund operations; the Company’s future operating and financial performance; the Company’s ability to consummate acquisitions, or, if consummated, to successfully integrate acquired businesses into the Company’s operations, the Company’s ability to recognize the benefits of acquisitions, or the failure of an acquired company to achieve its plans and objectives; limitations on our operating and strategic flexibility and the ability to operate our business,
| ||||||||
finance our capital needs or expand business strategies under the terms of our credit facilities; our ability to retain existing business and obtain and retain new business; general economic or business conditions affecting the markets we serve; declining use of print yellow page directories by consumers; our ability to collect trade receivables from clients to whom we extend credit; credit risk associated with our reliance on small and medium sized businesses as clients; our ability to attract and retain key managers; increased competition in our markets; our ability to obtain future financing due to changes in the lending markets or our financial position; our ability to maintain agreements with major Internet search and local media companies; reduced advertising spending and increased contract cancellations by our clients, which causes reduced revenue; and our ability to anticipate or respond effectively to changes in technology and consumer preferences as well as the risks and uncertainties set forth in the Company's most recent Annual Report on Form 10-K and subsequent Quarterly Reports on From 10-Q filed with the Securities and Exchange Commission. All subsequent written and oral forward-looking statements attributable to us or persons acting on our behalf are expressly qualified in their entirety by such cautionary statements.
If one or more events related to these or other risks or uncertainties materialize, or if our underlying assumptions prove to be incorrect, actual results may differ materially from what we anticipate. For these reasons, we caution you against relying on forward-looking statements. All forward-looking statements included in this press release are expressly qualified in their entirety by the foregoing cautionary statements. These forward-looking statements speak only as of the date hereof and, other than as required by law, we undertake no obligation to publicly update or revise any forward-looking statements, whether as a result of new information, future events or otherwise.
About Thryv Holdings, Inc.
Thryv Holdings, Inc. (NASDAQ: THRY) is a global software and marketing services company that empowers small- to medium-sized businesses (“SMBs”) to grow and modernize their operations so they can compete and win in today's economy. Over 50,000 businesses use our award-winning SaaS platform, Thryv®, to manage their end-to-end operations, which has helped businesses across the U.S. and overseas grow their bottom line. Thryv also manages digital and print presence for approximately 400,000 businesses, connecting these SMBs to local consumers via proprietary local search portals and print directories. For more information about Thryv Holdings, Inc, visit thryv.com.
Media Contact:
Paige Blankenship
Thryv, Inc.
214-392-9609
Investor Contact:
Cameron Lessard
Thryv, Inc.
214.773.7022
| ||||||||
###