
tms-20260814
0002048951FALSE00020489512026-08-142026-08-140002048951us-gaap:CommonStockMember2026-08-142026-08-140002048951us-gaap:WarrantMember2026-08-142026-08-14

UNITED STATES
SECURITIES AND EXCHANGE COMMISSION

Washington, D.C. 20549

FORM 8-K

CURRENT REPORT
Pursuant to Section 13 OR 15
(d)
of the Securities Exchange Act of 1934

Date of Report (Date of earliest event reported): August 14, 2026

TEAMSHARES INC.
(Exact name of registrant as specified in its charter)

Delaware001-4254061-2235506
(State or other jurisdiction
of incorporation)
(Commission
File Number)
(IRS Employer
Identification No.)
214 Sullivan Street, 3B
New York
, NY 10012
(Address of principal executive offices, including zip code)
(917) 310-2731
Registrant’s telephone number, including area code
N/A
(Former name or former address, if changed since last report)

Check the appropriate box below if the Form 8-K filing is intended to simultaneously satisfy the filing obligation of the registrant under any of the following provisions:
Written communications pursuant to Rule 425 under the Securities Act (17 CFR 230.425)
Soliciting material pursuant to Rule 14a-12 under the Exchange Act (17 CFR 240.14a-12)
Pre-commencement communications pursuant to Rule 14d-2(b) under the Exchange Act (17 CFR 240.14d-2(b))
Pre-commencement communications pursuant to Rule 13e-4(c) under the Exchange Act (17 CFR 240.13e-4(c))
Securities registered pursuant to Section 12(b) of the Act:
Title of each class
Trading Symbol(s)
Name of each exchange on which registered
Common Stock, par value $0.0001 per shareTMSThe Nasdaq Stock Market LLC
Warrants, each whole warrant exercisable for one share of Common Stock at an exercise price of $11.50 per shareTMSWWThe Nasdaq Stock Market LLC
Indicate by check mark whether the registrant is an emerging growth company as defined in Rule 405 of the Securities Act of 1933 (§230.405 of this chapter) or Rule 12b-2 of the Securities Exchange Act of 1934 (§240.12b-2 of this chapter).
Emerging growth company
If an emerging growth company, indicate by check mark if the registrant has elected not to use the extended transition period for complying with any new or revised financial accounting standards provided pursuant to Section 13(a) of the Exchange Act.


Item 2.02.    Results of Operations and Financial Condition.

On August 14, 2026, Teamshares Inc. and its subsidiaries (“Teamshares” or the “Company”) issued a press release announcing its financial results for the second quarter ended June 30, 2026. The full text of the press release is attached hereto as Exhibit 99.1 and is incorporated herein by reference.

The information in this Item 2.02 and Exhibit 99.1 shall not be deemed “filed” for purposes of Section 18 of the Exchange Act or otherwise subject to the liabilities of that section, nor shall it be deemed incorporated by reference in any filing under the Securities Act or the Exchange Act, except as expressly set forth by specific reference in such a filing.

Item 7.01.    Regulation FD Disclosure.
The Company will hold a conference call on August 14, 2026 at 8:30 a.m. (Eastern Time) to discuss the Company’s financial results for the second quarter and six months ended June 30, 2026. In addition to the press release, an earnings presentation will be made available on the Investor Relations section of the Company’s website at investors.teamshares.com. A copy of the earnings presentation is furnished as Exhibit 99.2 to this Current Report on Form 8-K and is incorporated herein by reference.

The information in this Item 7.01 and Exhibit 99.2 shall not be deemed “filed” for purposes of Section 18 of the Exchange Act or otherwise subject to the liabilities of that section, nor shall it be deemed incorporated by reference in any filing under the Securities Act or the Exchange Act, except as expressly set forth by specific reference in such a filing.

Item 9.01.    Financial Statements and Exhibits.
(d) Exhibits.
The following exhibits relate to Item 2.02 and/or Item 7.01, which shall be deemed to be furnished, and not filed:
Exhibit No.Description
99.1
99.2
104Cover Page Interactive Data File (formatted as Inline XBRL)

SIGNATURES
Pursuant to the requirements of the Securities Exchange Act of 1934, as amended, the registrant has duly caused this Current Report to be signed on its behalf by the undersigned hereunto duly authorized.

Date:August 14, 2026Teamshares Inc.
By:/s/ Michael Brown
Name: Michael Brown
Title: Chief Executive Officer
(Principal Executive Officer)


Teamshares Reports 2Q 2026 Results and Reaffirms 2026 Outlook

New York, NY – August 14, 2026 – Teamshares (NASDAQ:TMS, the “Company”), a tech-enabled acquiror of high-quality SMEs, announced financial results for the second quarter ended June 30, 2026 and other business updates.

Second Quarter and Other Business Highlights
Revenue of $148.7 million, a $25.1 million (20%) increase year-over-year.
Net Income of $9.5 million, a $22.4 million increase year-over-year, inclusive of non-cash changes in fair value of financial instruments and contributions from acquisitions.
Adjusted EBITDA of $9.6 million, a $6.0 million (166%) increase year-over-year.
Pro Forma Adjusted EBITDA of $9.8 million, a $6.2 million (171%) increase year-over-year.
LTM Pro Forma Adjusted EBITDA as of quarter end was $21.2 million.
Teamshares began trading on Nasdaq on June 23, 2026, concurrent with close of a significant equity raise, strengthening the Company’s ability to accelerate its programmatic acquisition strategy with improved access to capital as a public company.
Teamshares is reaffirming its 2026 Outlook, and as of today has approximately $30 million of annual SME EBITDA under LOI, in addition to acquisitions closed to date, against the $40 million acquired EBITDA target for 2026.

Teamshares CEO Michael Brown said, “We are building on the momentum of our recent Nasdaq listing and equity raise with a strong pipeline of acquisition opportunities and complementary financing to execute our growth strategy. Since inception, we planned to be a public company given acquisition financing is the raw material of programmatically acquiring durable, cash flowing companies at attractive terms. The early expansion in financing opportunities received since listing have been encouraging. We continue to think it's the first inning in becoming a permanent home for thousands of great companies as owners retire.”

Teamshares President Alex Eu added, “We believe our current acquisition funnel provides a comfortable pathway to our 2026 acquisition outlook. We buy businesses that we want to be permanent owners of and that we believe have long term potential for growth. The continued year-over-year growth we delivered across our key financial metrics provides evidence that our programmatic acquirer model is working. It becomes even more powerful as we scale, providing us with attractive organic reinvestment opportunities across the businesses. As we continue to purchase more businesses, we look forward to combining their historic success with the proven Teamshares operating model.”

Business Updates

Acquisitions
Teamshares has closed two acquisitions YTD, which generated approximately $2.5 million of net income and $2.6 million of Adjusted EBITDA in the aggregate during the LTM period preceding the respective closings.
As of August 14, 2026, Teamshares has executed non-binding letters of intent (LOIs) to acquire 10 businesses, which are collectively expected to generate approximately $30 million in annual EBITDA, based on initial due diligence of information provided by the sellers and remain subject to further due diligence prior to closing. The LOIs are mutually non-binding, subject to completion of diligence and other customary closing conditions,
1


the negotiation and execution of definitive agreements, the availability of financing and the satisfaction of applicable closing conditions.

Operations
Teamshares continued to deliver significant increases in revenues and EBITDA of its Operating Subsidiaries, driven by acquisitions and organic growth. For the three months ended June 30, 2026, compared to the same period in prior year:
SME Segment Revenue increased $25.1 million (20%) primarily driven by acquisitions and organic growth of 3.4% by existing operating subsidiaries. In the YTD period, SME Segment Revenue increased $43.6 million (19%) primarily driven by acquisitions and organic growth of 4.2% by existing operating subsidiaries (calculated as period-over-period revenue growth from operating subsidiaries owned for the full duration of both comparable periods, excluding the impact of acquisitions closed during either period). LTM Pro Forma Revenue as of the quarter end was $560.0 million.
SME Segment EBITDA increased $6.4 million (47%) primarily driven by acquisitions. Organic growth from existing operating subsidiaries was 0.4% in the quarter. In the YTD period, SME Segment EBITDA increased $10.2 million (54%) primarily driven by acquisitions and organic growth of 4.6% by existing operating subsidiaries.

Growing Operating Leverage
Teamshares corporate expenses (not allocated to reportable segments), excluding transaction expenses related to the Business Combination, decreased by $0.5 million from the same period in prior year.
The decline in corporate overhead relative to a 47% increase in SME Segment EBITDA demonstrates the scalability of Teamshares’ business model through creation of operating leverage from our tech-enabled infrastructure.

Financing
Together with the concurrent common equity PIPE investment, the business combination with Live Oak Acquisition Corp. V (“Business Combination”) provided $132.4 million in gross proceeds to Teamshares (excluding the net impact from a forward purchase agreement). The proceeds were utilized to pay transaction costs, reduce indebtedness and provide cash to fund the Company’s growth strategy.
During the second quarter, in conjunction with the Business Combination, Teamshares repaid $33.9 million in outstanding debt obligations. Subsequent to the close of the second quarter, Teamshares repaid an additional $20.6 million in outstanding debt obligations, further deleveraging the Company.
On August 4, 2026, Teamshares entered into a non-binding term sheet for a proposed senior secured warehouse facility designed to provide committed capital to fund acquisition closings, including a material amount related to businesses under LOI. The proposed facility remains subject to definitive documentation and customary closing conditions.
Teamshares is evaluating multiple non-binding term sheets from lenders to refinance a significant portion of its existing indebtedness. This process remains subject to definitive documentation and customary closing conditions.

2026 Outlook
2


Teamshares is reaffirming its 2026 full year guidance for Pro Forma Adjusted EBITDA of $60 million, inclusive of $40 million in annual Adjusted EBITDA from business acquisitions. This guidance assumes the successful and timely completion of transactions providing the Company with additional sources of capital to finance its expected level of acquisitions.

Conference Call
The Company will host a conference call to discuss its results on Friday, August 14, 2026, beginning at 8:30 a.m. ET. Interested parties may access the conference call through a live webcast, which can be accessed via this link or by visiting the Company’s Investor Relations website at https://investors.teamshares.com/. Please join the live webcast or dial in at least 10 minutes before the start of the call. A replay of the event webcast will be available on the Company’s Investor Relations website for one year following the call.

About Teamshares
Teamshares is a tech-enabled acquiror of high-quality businesses, intending to be a permanent home for businesses. Part holdco, part fintech, Teamshares programmatically acquires companies with $0.5 to $5 million of EBITDA from retiring owners, integrates them with the Teamshares platform, and helps employees earn company stock. Founded in 2019, Teamshares operates subsidiaries with consolidated revenue of over $500 million for the trailing twelve month period as of June 30, 2026 across over 40 industries and 30 states. For more information, visit https://investors.teamshares.com/.

Forward Looking Statements
This press release contains forward-looking statements. All statements other than statements of historical facts contained in this press release are forward-looking statements. In some cases, forward-looking statements can be identified by terms such as "anticipates," "believes," "estimates," "expects," "intends," "plans," "predicts," "projects," "seeks," "future," "outlook," "prospects," "will," "would," "should," "could," "may," "can have" or similar words. These statements are not guarantees of future events or performance, and you should not unduly rely on them as they involve certain risks, uncertainties and assumptions that are difficult to predict and that could cause actual results to differ materially from those contemplated by the forward-looking statements. These risks include, but are not limited to, the following: our ability to realize the expected benefits from the Business Combination; our ability to maintain the listing of our common stock on Nasdaq; our ability to consummate any current potential financing transactions and our ability to raise financing in the future and to comply with restrictive covenants related to long-term indebtedness; our limited operating history; our ability to manage growth effectively; our ability to successfully acquire, integrate and grow SMEs and implement our tech-enabled employee ownership platform; our ability to continue as a going concern; our ability to refinance or extend certain of our existing credit facilities; costs and resources of operating as a public company; unfavorable or no analyst research or reports; and those risks and factors described under the caption "Risk Factors" in the Company's registration statement on Form S-4, Quarterly Report on Form 10-Q and other subsequent filings made with the Securities and Exchange Commission (“SEC”). Forward-looking statements speak only as of the date of this press release and the Company does not undertake any obligation to update or revise any forward-looking information to reflect changes in assumptions, the occurrence of unanticipated events or otherwise.

Non-GAAP Financial Measures
3


Certain financial information contained in this communication, such as Adjusted EBITDA, Pro Forma Adjusted EBITDA and Free Cash Flow, have not been prepared in accordance with United States generally accepted accounting principles (“GAAP”). These non-GAAP financial measures are not intended to replace financial measures calculated in accordance with GAAP and are intended to supplement our GAAP results. We believe that using these measures affords a more consistent basis for comparing our results of operations from period to period. The principal limitation of these non-GAAP financial measures is that they exclude significant expenses and income that are required by GAAP to be recorded in financial statements. In addition, they are subject to inherent limitations as they reflect the exercise of judgment by management about which expenses and income are excluded and included in determining these non-GAAP financial measures. The information required by Item 10(e) of Regulation S-K under the Securities Act of 1933 and the Securities Exchange Act of 1934 and Regulation G under the Securities Exchange Act of 1934, including a reconciliation to the most directly comparable financial measure calculated in accordance with GAAP, is included in the table at the end of this press release.

Contacts
Investor Relations Contact: [email protected]
Press Contact: [email protected]
4


Teamshares Inc.
Summarized Consolidated Statements of Operations
($ in thousands, except per share values)
(Unaudited)

Three Months Ended
June 30,
Six Months Ended
June 30,
(in thousands, except for percentages)20262025$ Change% Change20262025$ Change% Change
Revenue$148,660 $123,574 $25,086 20%$269,699 $226,118 $43,582 19%
Cost of Revenue87,242 74,498 12,743 17%160,338 138,142 22,196 16%
Gross Profit61,418 49,076 12,342 25%109,362 87,976 21,385 24%
Operating Expenses (Income)
Depreciation1,107 822 285 35 %1,930 1,659 271 16 %
Amortization1,719 1,469 250 17%3,423 2,882 541 19%
Selling, General, and Administrative Expenses55,263 47,326 7,937 17%108,277 93,115 15,162 16%
Goodwill Impairment— 3,845 (3,845)(100)%— 6,826 (6,826)(100)%
Loss (Gain) on Disposition of Assets334 415 (81)(20)%131 850 (719)(85)%
Total Operating Expenses58,422 53,877 4,545 8%113,761 105,332 8,429 8%
Income/(Loss) from Operations2,996 (4,801)7,797 (162)%(4,399)(17,356)12,957 (75)%
Non-Operating Expenses (Income)
Interest Expense, Net10,167 7,785 2,381 31%25,531 15,089 10,442 69%
Change in Fair Value of Earnout Share and Deferred Founder Share Liabilities(24,884)— (24,884)N/A(24,884)— (24,884)N/A
Change in Fair Value of Forward Purchase Agreement Liability5,003 — 5,003 N/A5,003 — 5,003 N/A
Loss on the Conversion of SAFE Notes2,175 — 2,175 N/A2,175 — 2,175 N/A
Change in Fair Value of Warrant Liability(380)(109)(271)248 %(421)(434)12 (3)%
Change in Fair Value of Contingent Consideration889 437 453 104 %886 260 626 241 %
Other Non-Operating Expense (Income), Net(103)(169)66 (39)%(399)1,682 (2,081)(124)%
Total Non-Operating Expenses (Income)(7,131)7,944 (15,075)(190%)7,892 16,598 (8,706)(52%)
Income/(Loss) Before Income Taxes10,127 (12,745)22,872 (179%)(12,291)(33,953)21,662 (64%)
Income Tax Expense601 109 492 452 %960 290 670 231 %
Net Income/(Loss)$9,526 $(12,854)$22,380 (174%)$(13,251)$(34,243)$20,992 (61%)
Net Income/(Loss) Attributable to Noncontrolling Interests358 (16)374 (2293)%458 (76)534 (703)%
Net Income/(Loss) Attributable to Teamshares Inc.$9,168 $(12,838)$22,006 (171%)$(13,709)$(34,167)$20,458 (60%)
Basic Earnings (Loss) Per Share Attributable to Common Stockholders$0.17 $(0.26)$0.44 (167%)$(0.27)$(0.69)$0.43 (61%)
Diluted Earnings (Loss) Per Share Attributable to Common Stockholders$0.16 $(0.26)$0.43 (163%)$(0.27)$(0.69)$0.43 (61%)
5


Teamshares Inc.
Statement of Cash Flows
($ in thousands)
(Unaudited)
For the Six Months
Ended
June 30,
2026
June 30,
2025
Cash Flows From Operating Activities
Net Loss$(13,251)$(34,243)
Adjustments to Reconcile Net Loss to Net Cash Used in Operating Activities:
Depreciation and Amortization6,269 5,704 
Non-Cash Stock-Based Compensation Expense2,016 1,950 
Non-Cash Interest Expense9,304 1,105 
Goodwill Impairment— 6,826 
Loss on Disposition of Assets131 850 
Loss on the Conversion of SAFE Notes2,175 — 
Change in Fair Value of Earnout Shares and Deferred Founder Shares(24,884)— 
Change in Fair Value of Forward Purchase Agreement Liability5,003 — 
Change in Fair Value of Warrant Liability(421)(434)
Change in Fair Value of Contingent Consideration, Net of Payments408 (501)
Change in Fair Value of the Former Owner Loan600— 
Changes in Operating Assets and Liabilities, Net of Acquisitions:
Inventory(1,457)(3,360)
Accounts Receivable(2,858)(1,649)
Other Assets1,986 (780)
Accounts Payable5,589 (2,453)
Other Liabilities4,320 (579)
Net Cash Used in Operating Activities(5,068)(27,563)
Cash Flows From Investing Activities
Capital Expenditures(2,960)(1,779)
Business Acquisitions, Net of Cash Received(4,488)(10,399)
Additions to Internally Developed Software(709)(1,481)
Net Cash Used in Investing Activities(8,157)(13,659)
Cash Flows From Financing Activities
Borrowings Under Credit Facilities3,000 3,188 
Repayments Under Credit Facilities(33,850)— 
Borrowings Under Other Debt Instruments5,089 16,286 
Repayments of Other Debt Instruments(5,371)(3,435)
Issuance of SAFE Notes3,330 — 
Proceeds from Issuance of Preferred Stock, Net (converted to Company Common Stock at the Closing)— 1,350 
Forward Purchase Agreement Prepayment(42,240)— 
Proceeds from SPAC Merger, Net159,487 — 
Payment of Transaction Costs Directly Attributable to the SPAC Merger(1,116)— 
Exercise of Common Stock for Cash10 — 
Dividends to Noncontrolling Interests(862)(620)
Acquisitions of Noncontrolling Interests(1,532)(1,540)
Payments of Debt Issuance Costs(214)— 
Contingent Consideration Payments(794)(144)
Net Cash Provided by Financing Activities84,937 15,085 
Effect of Exchange Rate Changes on Cash and Cash Equivalents(178)— 
Net Increase (Decrease) in Cash, Cash Equivalents and Restricted Cash71,534 (26,137)
Cash, Cash Equivalents and Restricted Cash at Beginning of Period54,097 75,509 
Cash, Cash Equivalents and Restricted Cash at End of Period125,631 49,371 
Supplemental Disclosures of Cash Flow Information:
Interest Paid$17,266 $14,214 
Income Taxes Paid$819 $570 
6


Teamshares Inc.
Statement of Cash Flows
($ in thousands)
(Unaudited)
Supplemental Non-Cash Activity:
Debt Assumed to Acquire Operating Subsidiaries$11,000 $25,550 
Conversion of Legacy Teamshares Series B Warrants into Legacy Teamshares Common Stock$2,501 $— 
Conversion of SAFE Notes into Company Common Stock and Issuance of Incentive Founder Shares to SAFE Investors$8,505 $— 
7


Teamshares Inc.
Consolidated Balance Sheets
($ in thousands)
June 30,
2026
December 31,
2025
Assets
Current Assets
Cash and Cash Equivalents$113,396 $40,246 
Restricted Cash11,813 13,426 
Accounts Receivable, Net24,421 21,354 
Inventories57,323 46,405 
Prepaid Expenses3,027 2,870 
Other Current Assets1,038 3,052 
Total Current Assets211,018 127,352 
Long-Term Assets
Restricted Cash422 425 
Property, Plant, and Equipment, Net30,583 30,043 
Operating Lease Right of Use Assets, Net96,554 93,586 
Goodwill, Net246,781 244,743 
Internally Developed Software, Net5,464 6,769 
Trade Names, Net12,506 11,598 
Other Assets12,338 13,676 
Total Long-Term Assets404,648 400,840 
Total Assets$615,667 $528,193 
Liabilities and Stockholders’ Equity
Current Liabilities
Accounts Payable$30,789 $22,586 
Accrued Expenses12,369 10,562 
Deferred Revenue13,200 10,051 
Contingent Consideration2,686 3,151 
Short-Term Debt and Current Portion of Long-Term Debt207,193 200,147 
Current Portion of Operating Lease Obligations8,952 8,524 
Other Current Liabilities13,687 9,893 
Total Current Liabilities288,876 264,913 
Long-Term Liabilities
Warrant Liability— 2,922 
Contingent Consideration6,313 6,044 
Long-Term Debt, Net70,742 91,399 
Long-Term Operating Lease Obligations89,203 88,144 
Earnout Share and Deferred Founder Share Liabilities37,118 — 
Forward Purchase Agreement Liability10,390 — 
Other Long-Term Liabilities5,817 8,687 
Total Long-Term Liabilities219,583 197,196 
Total Liabilities508,459 462,109 
Redeemable Noncontrolling Interests1,890 2,451 
Stockholders’ Equity
Common Stock, 0.0001 par value, 450,000,000 shares authorized, 71,985,735 issued and outstanding as of June 30, 2026; 97,899,711 shares authorized, 49,180,937 issued and outstanding as of December 31, 2025
Additional Paid-In Capital385,873 327,839 
Accumulated Deficit(275,484)(261,775)
Accumulated Other Comprehensive Loss(1,875)(128)
Total Stockholders’ Equity108,521 65,941 
Noncontrolling Interests(3,204)(2,308)
Total Equity105,318 63,633 
Total Liabilities and Stockholders’ Equity$615,667 $528,193 
8


Teamshares Inc.
Segment Reporting
($ in thousands)
(Unaudited)

Three Months Ended
June 30,
Six Months Ended
June 30,
20262025$ Change% Change20262025$ Change% Change
SME Revenue from External Customers$148,660 $123,574 $25,086 20%$269,699 $226,118 $43,582 19%
SME Segment EBITDA$20,064 $13,669 $6,395 47%$29,193 $19,001 $10,192 54%


9


Teamshares Inc.
Non-GAAP Financial Measures
($ in thousands)
(Unaudited)


Limitations of Non-GAAP Measures and Reconciliations to GAAP

Our non-GAAP financial measures have important limitations and are not intended to be considered in isolation or as a substitute for the most directly comparable GAAP measures. These measures exclude significant expenses and income that are required by GAAP to be reflected in our financial statements and, as a result, may not fully capture the costs of operating our business or the timing of related cash flows. The adjustments we make to arrive at these measures may vary from period to period and involve judgment, which reduces comparability over time and to similarly titled measures presented by other companies. Because of these and other limitations, you should consider our non-GAAP financial measures only in conjunction with, and not as superior to, our GAAP results and the reconciliations presented below.

For all periods presented, the most directly comparable GAAP measure to LTM Pro Forma Revenue is Revenue. The most directly comparable GAAP measure to Adjusted EBITDA, Pro Forma Adjusted EBITDA, and LTM Pro Forma Adjusted EBITDA is Net Income. The most directly comparable GAAP measure to Free Cash Flow is net cash provided by (used in) operating activities. Reconciliations of each non-GAAP measure to the most directly comparable GAAP measure are presented in the tables immediately following this discussion.

Adjusted EBITDA

Adjusted EBITDA represents our consolidated results for the post-acquisition period and is calculated as net income (loss) adjusted to exclude (i) interest expense, net, (ii) income tax expense (benefit), (iii) depreciation and amortization and (iv) certain non-cash items and other amounts that we do not consider indicative of our core operating performance, including share-based compensation, gains or losses on disposition of assets, impairment expense and changes in fair value of financial instruments. We believe Adjusted EBITDA is useful in evaluating our ability to generate earnings from our operating base and to compare our performance across periods, particularly where non-cash expenses and other items may vary in timing and amount. This measure has historically been utilized both internally and externally to assess liquidity, reinvestment capacity, and shareholder returns.

Pro Forma Adjusted EBITDA

Pro Forma Adjusted EBITDA represents Adjusted EBITDA plus the pre-acquisition results for businesses acquired during the relevant period, as if such businesses had been owned for the entirety of the period presented.

The pre-acquisition results reflect pro forma financial information prepared in accordance with ASC 805 and presented in the notes to our consolidated financial statements, adjusted to conform to the requirements of Article 11 of Regulation S-X, including the application of appropriate transaction accounting adjustments. The pre-acquisition results included in Pro Forma Adjusted EBITDA are sourced from the historical financial statements of the acquired businesses, adjusted to conform to GAAP. For each acquired business, we identify the applicable pre-acquisition period(s) within the fiscal year presented and extract the relevant EBITDA (or net income with reconciling adjustments) for those pre-acquisition periods. For each acquisition closed during the period, we include the portion of the fiscal year prior to the acquisition date such that, when combined with the post-acquisition period included in our consolidated results, the acquired business is reflected as if owned for the full fiscal year. For example, for a business acquired on September 1, we include pre-acquisition results for January 1 through August 31 of the applicable year.

The target’s historical financial results are subject to our pre-acquisition financial due diligence procedures, which includes an assessment of their accounting policies and practices. Additionally, thorough financial and legal diligence is performed over the historical financial results, including a quality of earnings assessment and substantive testing of transactions within the general ledger. To ensure consistency and comparability, we apply only factually supportable, policy-conforming adjustments to pre-acquisition results in order to comply with GAAP, including:     
Conforming classification adjustments to align with our presentation (for example, recalculating and reclassifying depreciation and amortization to match our financial statement line items and EBITDA definition).
Removal of owner-specific, non-recurring compensation and related-party expenses that do not continue post-acquisition and for which we assume or implement arm’s-length market terms. The cost structure is then burdened with expected costs related to the placement of a president to replace the retiring owner.
Elimination of non-recurring transaction costs directly related to the acquisition.
Standardization of accounting policies where objectively determinable and factually supportable (for example, capitalization thresholds for property and equipment, classification of repairs and maintenance). We do not adjust pre-acquisition results for expected synergies, integration initiatives, or other hypothetical or forward-looking benefits.

Our primary debt agreements define EBITDA-based covenant measures using similar adjustments as the non-GAAP measures presented herein. As a result, the Pro Forma Adjusted EBITDA we present is defined consistently with the EBITDA measure used for covenant compliance under our credit agreements. We are also including this disclosure to enable public investors to understand
10


Teamshares Inc.
Non-GAAP Financial Measures
($ in thousands)
(Unaudited)
and assess our compliance with those covenants. We may, from time to time, disclose covenant calculations as required by our agreements; such disclosures are provided for compliance assessment and transparency. In addition, including pre-acquisition results improves the alignment between income statement activity and the balance sheet, as the balance sheet fully reflects the impact of acquisition accounting while the income statement would otherwise present only a partial period of post-acquisition results. Therefore, key financial metrics such as leverage ratios would be distorted without this adjustment. Furthermore, we believe Pro Forma Adjusted EBITDA enhances consistency and comparability across periods and provides a more representative view of the consolidated entity’s future earnings potential.

The Company is unable to provide a quantitative reconciliation of its forward-looking Pro Forma Adjusted EBITDA guidance to net income, the most directly comparable GAAP measure, without unreasonable effort because certain items that impact net income (loss), including changes in fair value of financial instruments, acquisition-related costs, and the timing and magnitude of future acquisitions, cannot be reasonably predicted.

LTM Pro Forma Revenue

LTM Pro Forma Revenue represents consolidated revenue for the trailing-twelve month period plus the pre-acquisition revenue for businesses acquired during the relevant period, as if such businesses had been owned for the entirety of the period presented.

The pre-acquisition revenue of newly acquired companies is calculated in the same method described in Pro Forma Adjusted EBITDA.

Including pre-acquisition results improves the alignment between income statement activity and the balance sheet, as the balance sheet fully reflects the impact of acquisition accounting while the income statement would otherwise present only a partial period of post-acquisition results. We believe LTM Pro Forma Revenue enhances consistency and comparability across periods and provides a more representative view of the consolidated entity’s future revenue potential.

LTM Pro Forma Adjusted EBITDA

LTM Pro Forma Revenue represents Adjusted EBITDA for the trailing-twelve month period plus the pre-acquisition EBITDA for businesses acquired during the relevant period, as if such businesses had been owned for the entirety of the period presented.

The pre-acquisition EBITDA of newly acquired companies is calculated in the same method described in Pro Forma Adjusted EBITDA.

LTM Pro Forma Adjusted EBITDA improves the comparability across periods of Pro Forma Adjusted EBITDA. Additionally, our primary debt agreements mentioned in the Pro Forma Adjusted EBITDA definition generally utilize EBITDA based covenants on a trailing-twelve month basis. We are also including this disclosure to enable public investors to understand and assess our compliance with those covenants.


Reconciliation of Adjusted EBITDA and Pro Forma Adjusted EBITDA

For the Three Months
Ended
For the Six Months
Ended
June 30,
2026
June 30,
2025
June 30,
2026
June 30,
2025
Net Income (Loss)$9,526 $(12,854)$(13,251)$(34,243)
Interest Expense, Net10,167 7,785 25,531 15,089 
Income Tax Expense601 109 960 290 
Depreciation1
1,717 1,403 2,861 2,822 
Amortization1,719 1,469 3,423 2,882 
Goodwill Impairment— 3,845 — 6,826 
Share-Based Compensation1,220 1,099 2,416 2,159 
Non-Cash Gains/Losses2
(16,795)742 (17,126)676 
SPAC Merger Transaction Costs3
429 — 2,106 — 
Acquisition Costs and Other Items Affecting Comparability4
1,010 11 1,020 3,304 
Adjusted EBITDA$9,595 $3,610 $7,941 $(195)
Pro Forma EBITDA for Acquisitions5
177 — 594 68 
Pro Forma Adjusted EBITDA$9,772 $3,610 $8,536 $(127)

11


Teamshares Inc.
Non-GAAP Financial Measures
($ in thousands)
(Unaudited)
1.Includes $0.6 million and $0.9 million of depreciation expense recognized in cost of revenue during the three and six months ended June 30, 2026, respectively, and $0.6 million and $1.2 million during the three and six months ended June 30, 2025, respectively.
2.Non-Cash Gains and Losses includes Loss (Gain) on Disposition of Assets, Change in Fair Value of Earnout Shares and Deferred Founder Shares, Change in Fair Value of Forward Purchase Agreement Liability, Loss on the Conversion of SAFE Notes, Change in Fair Value of Warrant Liability, Change in Fair Value of Contingent Consideration, and Change in Fair Value of Derivatives, which is included in Other non-operating income on the Consolidated Statements of Operations.
3.Includes costs incurred during the three and six months ended June 30, 2026 related to the Business Combination, which primarily related to legal and accounting fees related to the merger agreement and regulatory matters. These costs did not meet the criteria for capitalization in accordance with Staff Accounting Bulletin Topic 5.A and ASC 340-10-S99-1; however, these costs significantly impact the comparability of periods and are therefore included as an adjustment to calculate Adjusted EBITDA.
4.Includes transaction fees directly attributable to the consummation of certain acquisitions of $0.5 million during the three months ended June 30, 2026, and $0.5 million and $1.2 million during the six months ended June 30, 2026 and 2025, respectively. These are direct incremental costs associated with certain acquisitions and exclude any internal costs related to originations, diligence or legal activities, and recurring costs with third-parties associated with evaluating acquisitions. These costs are included in Selling, General, and Administrative Expenses within the Consolidated Statements of Operations. Additionally, this includes a $0.5 million loss on the change in fair value of a financing instrument included in Other Non-Operating Expenses/(Income), Net during three and six months ended June 30, 2026. There were no similar costs during three and six months ended June 30, 2025. Also, this includes an adjustment of immaterial and $2.1 million during three and six months ended June 30, 2025, respectively, for the settlement of performance and payment bonds that were issued by an operating subsidiary that ceased operations. There were no similar costs during the three and six months ended June 30, 2026. The type of business was unique relative to other operating subsidiaries and the Company has never incurred any other similar types of costs. These costs are included in Other Non-Operating Expense (Income), Net within the Consolidated Statements of Operations. These costs were included as an adjustment to calculate Adjusted EBITDA since they are not representative of ongoing operations.
5.Pro Forma EBITDA for Acquisitions represents the pre-acquisition results of operating subsidiaries acquired prior to the end of the respective periods. The amounts were derived from the pro forma financial results prepared in accordance with ASC 805 and presented within the “Business Combinations” footnote to the Company’s interim consolidated financial statements. The adjustments and presentation conform to the requirements of Article 11 of Regulation S-X, including the application of appropriate transaction accounting adjustments. The following table includes further financial information related to the pre-acquisition results of operating subsidiaries acquired prior to the end of the respective periods, which includes two companies acquired during the six months ended June 30, 2026 and five companies acquired during the year ended December 31, 2025 (there were 4 additional companies acquired during January 2025; however, they are not included in this adjustment as they had a full three months of post-acquisition results during the three and six months ended June 30, 2025):
($ in thousands)Three Months Ended June 30, 2026Three Months Ended June 30, 2025Six Months Ended June 30, 2026Six Months Ended June 30, 2025
Revenue$598 $ $3,434 $1,280 
Income from operations177 — 589 29 
Net Income (Loss)$151 $ $482 $(5)
Interest Expense— — — — 
Depreciation and Amortization25 — 107 34 
Loss (Gain) on Disposition of Assets— — 39 
Pro Forma EBITDA for Acquisitions$177 $ $594 $68 
During the three and six months ended June 30, 2026 the post-acquisition results of operating subsidiaries acquired during the period contributed $0.6 million and $0.6 million, respectively, to Adjusted EBITDA. During the three and six months ended June 30, 2025 the post-acquisition results of operating subsidiaries acquired during the period contributed $2.1 million and $3.4 million, respectively, to Adjusted EBITDA.

Reconciliation of LTM Pro Forma Revenue

12


Teamshares Inc.
Non-GAAP Financial Measures
($ in thousands)
(Unaudited)
Calculation of LTM Pro Forma Revenue
Revenue for year ended December 31, 20251
$471,567 
Revenue for the six months ended June 30, 2026269,699 
Revenue for the six months ended June 30, 2025(226,118)
LTM Revenue$515,149 
Pro Forma Revenue for Acquisitions2
44,845 
LTM Pro Forma Revenue$559,994 

1.Please refer to the consolidated statements of operations for the year ended December 31, 2025 in in our definitive proxy statement and final prospectus included in the Registration Statement on Form S-4 (File No. 333-294869), dated May 27, 2026, filed with the Securities and Exchange Commission (the “SEC”) on May 27, 2026 and declared effective by the SEC on May 27, 2026 (as supplemented on June 3, 2026, the “Proxy Statement/Prospectus”).
2.The operating subsidiaries acquired during 2025 and the six months ended June 30, 2026 had pre-acquisition revenue of $44.8 million for the twelve months ended June 30, 2026, which was intended to provide additional perspective on the full-period revenue contribution of recently acquired businesses.


Reconciliation of LTM Pro Forma Adjusted EBITDA

Calculation of LTM Pro Forma Adjusted EBITDA
Adjusted EBITDA for year ended December 31, 20251
$3,849 
Adjusted EBITDA for the six months ended June 30, 20267,941 
Adjusted EBITDA for the six months ended June 30, 2025195 
LTM Adjusted EBITDA$11,985 
Pro Forma EBITDA for Acquisitions2
9,177 
LTM Pro Forma Adjusted EBITDA$21,162 

1.Please refer to the Limitations of Non-GAAP Measures and Reconciliations to GAAP section within Management’s Discussion and Analysis of Financial Condition and Results of Operations of Teamshares in the Proxy Statement/Prospectus for the full calculation of Adjusted EBITDA for the year ended December 31, 2025.
2.The operating subsidiaries acquired during 2025 and the six months ended June 30, 2026 had pre-acquisition EBITDA of $9.2 million for the twelve months ended June 30, 2026, which was calculated in a manner consistent with the adjustments reflected in Pro Forma EBITDA for Acquisitions and are intended to provide additional perspective on the full-period earnings contribution of recently acquired businesses.


Reconciliation of Free Cash Flow

Free Cash Flow represents net cash used in operating activities less capital expenditures and additions to internally developed software. We believe Free Cash Flow is useful in assessing our ability to reinvest in the business, pursue strategic transactions and return capital to investors.

For the Six Months
Ended
June 30,
2026
June 30,
2025
Net Cash Used in Operating Activities$(5,068)$(27,563)
Capital Expenditures(2,960)(1,779)
Additions to Internally Developed Software(709)(1,481)
Free Cash Flow$(8,737)$(30,823)
13

1 2Q 2026 Earnings A permanent home for great businesses when owners retire NASDAQ:TMS

 
2 Forward Looking Statements This Presentation contains certain forward-looking statements within the meaning of Section 27A of the U.S. Securities Act of 1933, as amended (the “Securities Act”), and Section 21E of the Exchange Act that are based on beliefs and assumptions and on information currently available to the Company. Forward-looking statements generally relate to future events or the Company’s future financial or operating performance. For example, statements regarding anticipated growth in the industry in which the Company operates and anticipated growth in demand for the Company’s products and services are forward-looking statements. In some cases, you can identify forward-looking statements by terminology such as “pro forma”, “may”, “should”, “could”, “might”, “plan”, “possible”, “project”, “strive”, “budget”, “forecast”, “expect”, “intend”, “will”, “estimate”, “anticipate”, “believe”, “predict”, “potential” or “continue”, or the negatives of these terms or variations of them or similar terminology. Such forward-looking statements are subject to risks, uncertainties, and other factors which could cause actual results to differ materially from those expressed or implied by such forward looking statements. These forward-looking statements are based upon estimates and assumptions that, while considered reasonable by the Company and its management, as the case may be, are inherently uncertain. Factors that may cause actual results to differ materially from current expectations include, but are not limited to: competition, the ability of the Company to grow and manage growth, maintain relationships with customers and retain its management and key employees; changes in applicable laws or regulations; the possibility that the Company may be adversely affected by other economic, business or competitive factors; the Company’s estimates of expenses and profitability; the evolution of the markets in which the Company competes; the ability of the Company to implement its strategic initiatives and continue to innovate its existing products and services. Nothing in this Presentation should be regarded as a representation by any person that the forward-looking statements set forth herein will be achieved or that any of the contemplated results of such forward-looking statements will be achieved. You should not place undue reliance on forward-looking statements, which speak only as of the date they are made. The Company undertakes no duty to update these forward-looking statements. Financial Information; Non-GAAP Financial Measures The financial information and data contained in this Presentation is unaudited and does not conform to Regulation S-X. Such information and data may not be included in, may be adjusted in or may be presented differently in the registration statement to be filed relating to the Proposed Business Combination and the proxy statement/prospectus contained therein. Some of the financial information and data contained in this Presentation, such as EBITDA, Adjusted EBITDA, Pro Forma Adj. EBITDA, Free Cash Flow, has not been prepared in accordance with United States generally accepted accounting principles (“GAAP”).The Company believe that the use of these non-GAAP financial measures provides an additional tool for investors to use in comparing the Company’s financial condition and results of operations with other similar companies, many of which present similar non-GAAP financial measures to investors, and to assess certain financial and business trends relating to the Company’s financial condition and results of operations. Among other things, the Company’s management uses these non-GAAP measures for trend analyses and for budgeting and planning purposes. Management does not consider these non-GAAP measures in isolation or as an alternative to financial measures determined in accordance with GAAP. The principal limitation of these non-GAAP financial measures is that they exclude significant expenses and income that are required by GAAP to be recorded in the Company’s financial statements. In addition, they are subject to inherent limitations as they reflect the exercise of judgments by management about which expenses and income are excluded and included in determining these non-GAAP financial measures. In order to compensate for these limitations, management presents non-GAAP financial measures in connection with GAAP results. Please see the Appendix of this Presentation for reconciliation of non-GAAP measures to their closest GAAP metric. Use of Projections This Presentation contains projected financial information with respect to the Company. The projected financial information constitutes forward-looking information, is for illustrative purposes only and should not be relied upon as necessarily being indicative of future results. The assumptions and estimates underlying such financial forecast information are inherently uncertain and are subject to a wide variety of significant business, economic, competitive and other risks and uncertainties. See “Forward-Looking Statements” above. Actual results may differ materially from the results contemplated by the financial forecast information contained in this Presentation, and the inclusion of such information in this Presentation should not be regarded as a representation by any person that the results reflected in such forecasts will be achieved. Disclaimer


 
3 Teamshares is a tech-enabled acquiror of SMEs, and a permanent home for great businesses Part holdco. Part fintech. We programmatically acquire companies with $0.5 to 5 million of EBITDA from retiring owners, integrate them with the Teamshares platform, and help employees earn company stock
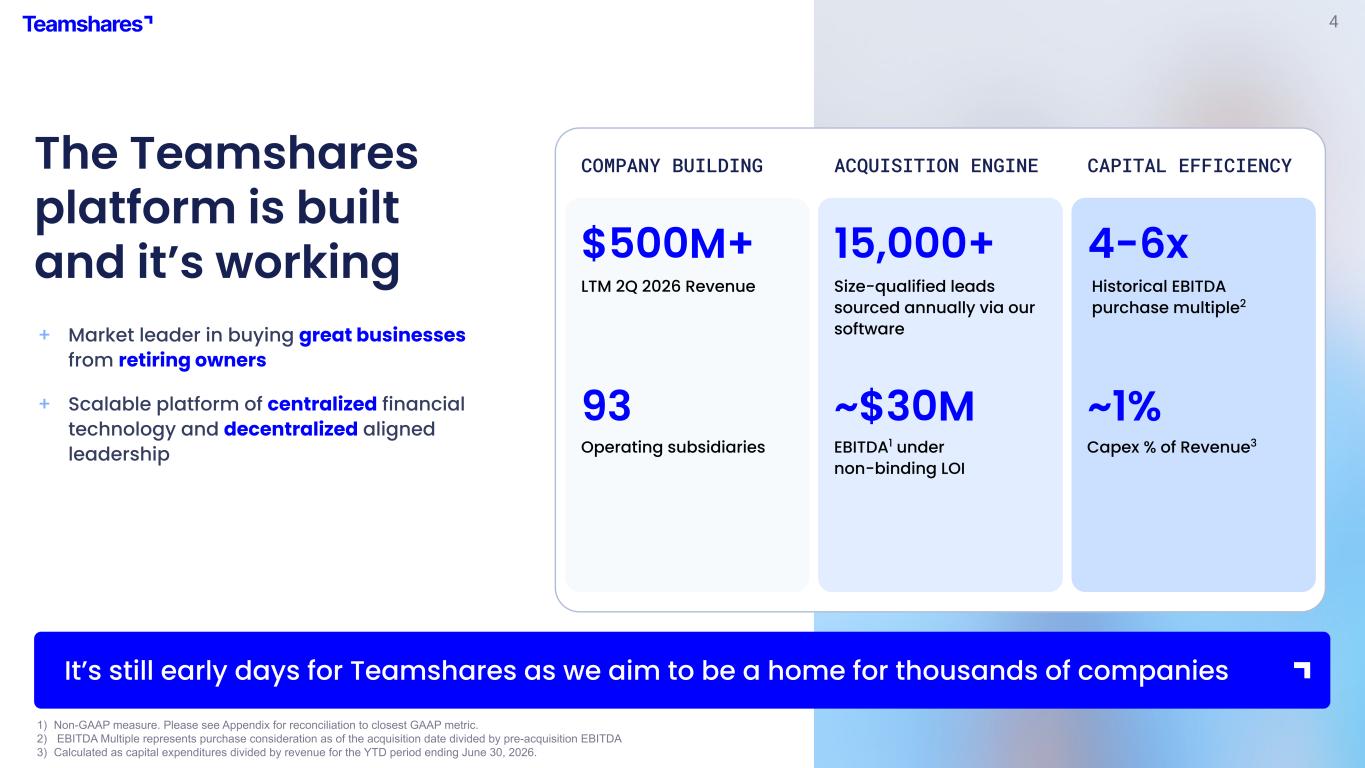

 
4 1) Non-GAAP measure. Please see Appendix for reconciliation to closest GAAP metric. 2) EBITDA Multiple represents purchase consideration as of the acquisition date divided by pre-acquisition EBITDA 3) Calculated as capital expenditures divided by revenue for the YTD period ending June 30, 2026. The Teamshares platform is built and it’s working + Market leader in buying great businesses from retiring owners + Scalable platform of centralized financial technology and decentralized aligned leadership ACQUISITION ENGINE $500M+ 93 15,000+ ~$30M COMPANY BUILDING CAPITAL EFFICIENCY 4-6x ~1% Size-qualified leads sourced annually via our software It’s still early days for Teamshares as we aim to be a home for thousands of companies Operating subsidiaries EBITDA1 under non-binding LOI Historical EBITDA purchase multiple2 LTM 2Q 2026 Revenue MB Capex % of Revenue3
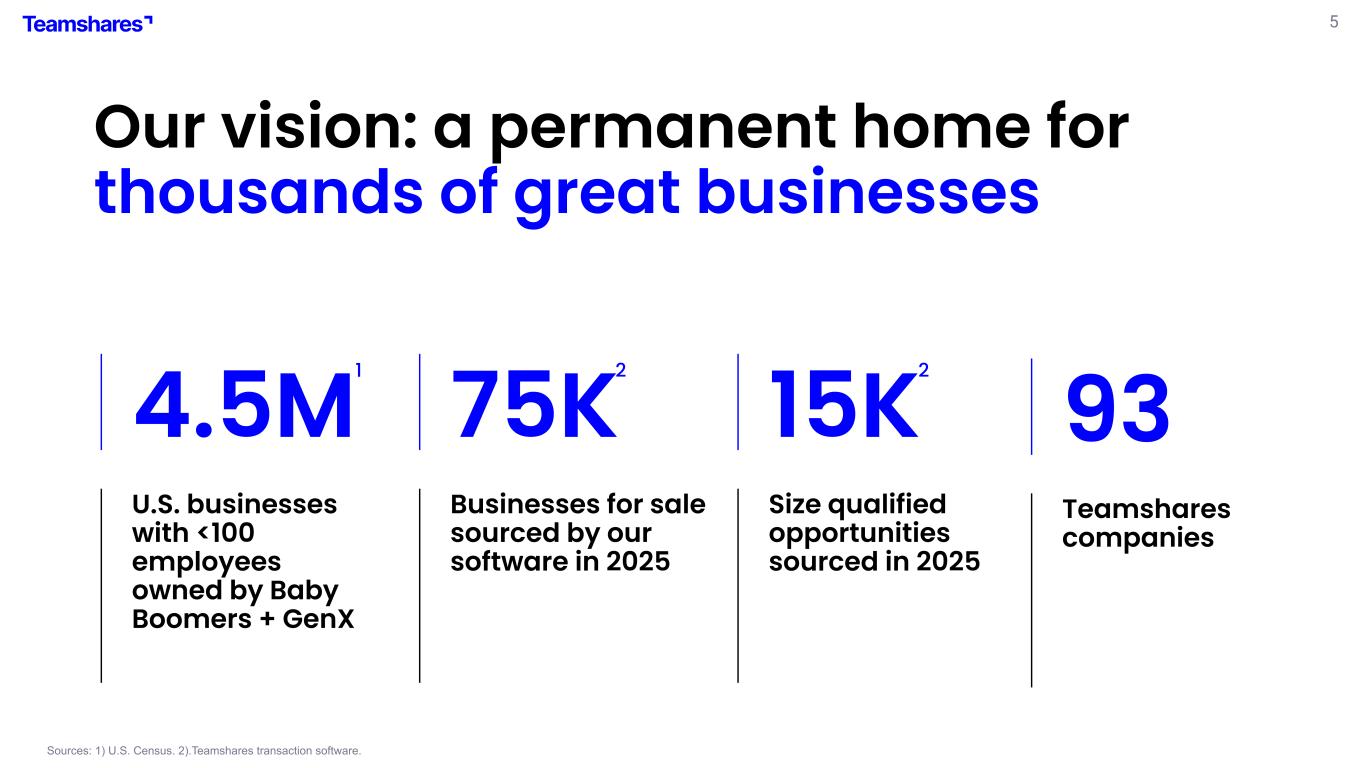

 
5 Sources: 1) U.S. Census. 2).Teamshares transaction software. 75K Businesses for sale sourced by our software in 2025 15K Size qualified opportunities sourced in 2025 1 2 2 Our vision: a permanent home for thousands of great businesses 93 Teamshares companies 4.5M U.S. businesses with <100 employees owned by Baby Boomers + GenX
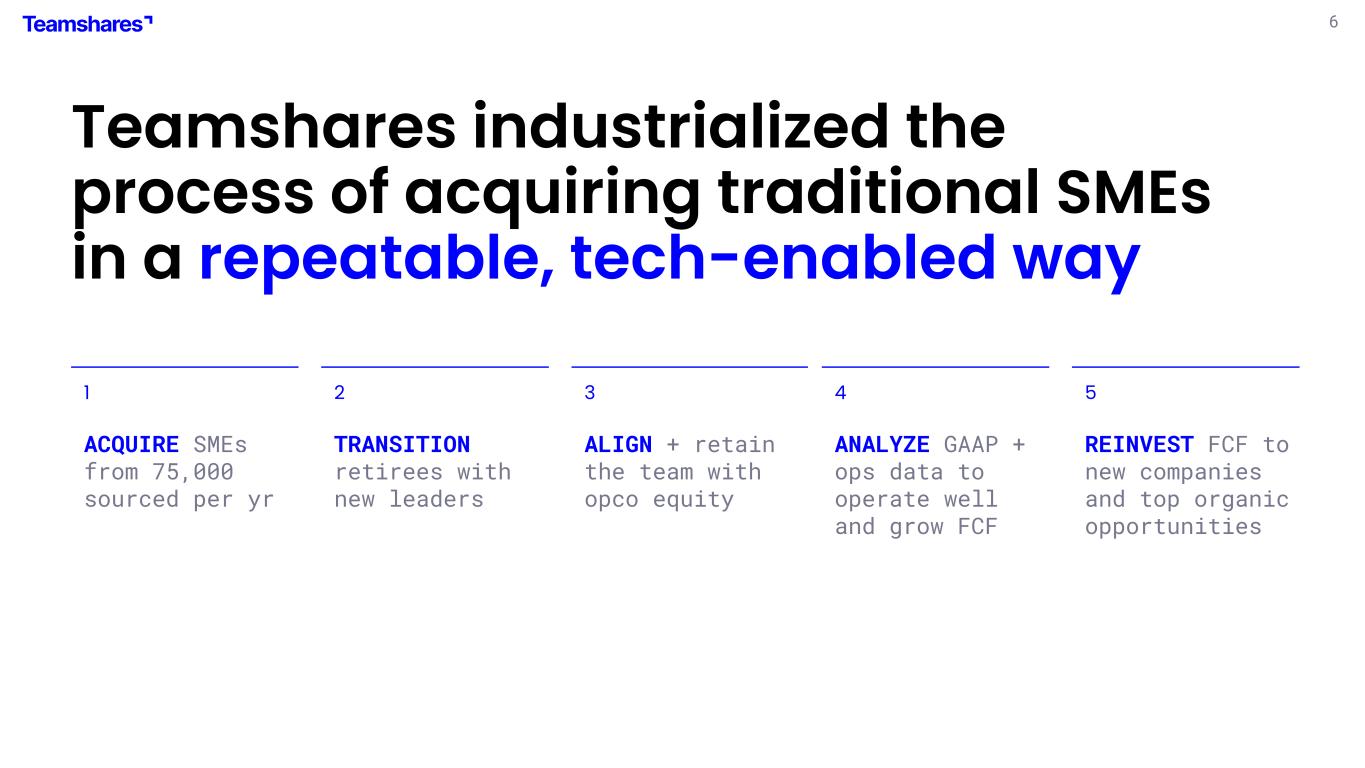

 
6 Teamshares industrialized the process of acquiring traditional SMEs in a repeatable, tech-enabled way 1 ACQUIRE SMEs from 75,000 sourced per yr 2 TRANSITION retirees with new leaders 3 ALIGN + retain the team with opco equity 4 ANALYZE GAAP + ops data to operate well and grow FCF 5 REINVEST FCF to new companies and top organic opportunities
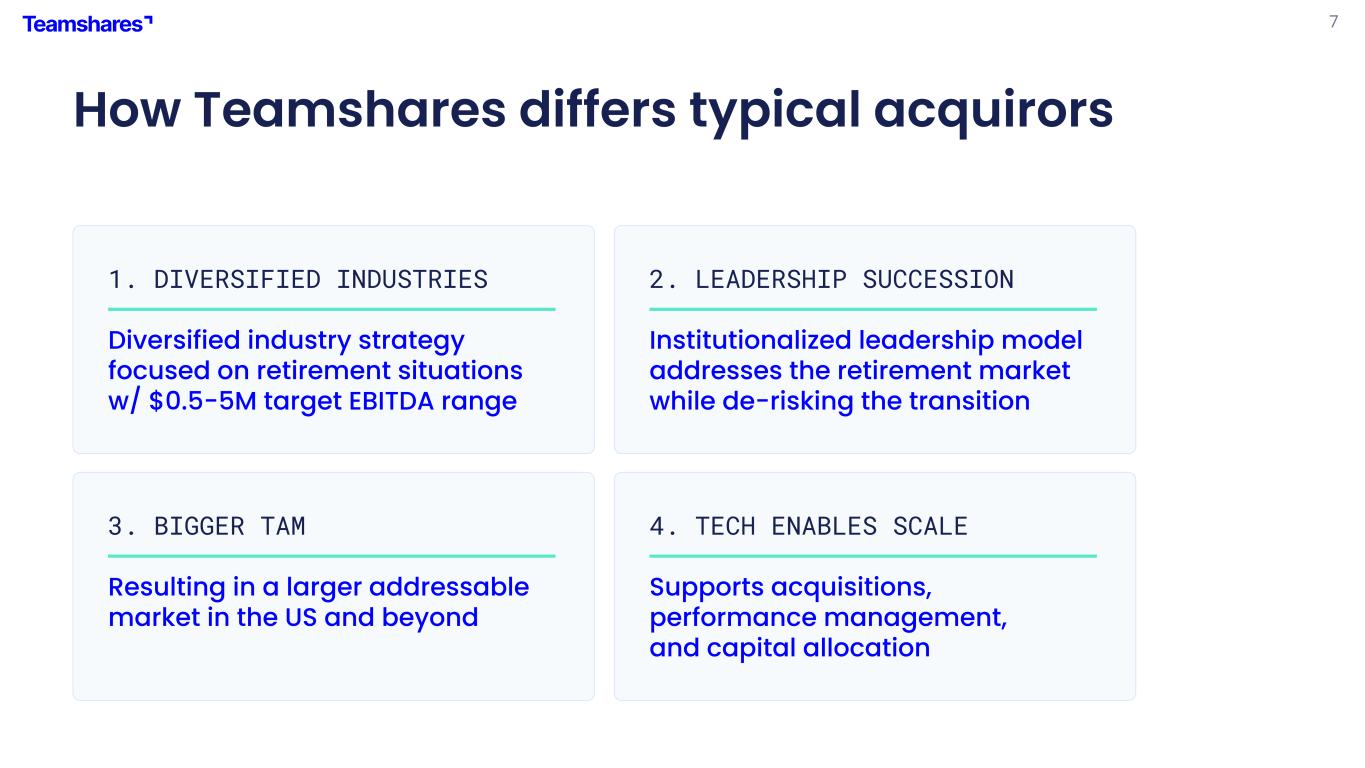

 
7 How Teamshares differs typical acquirors 1. DIVERSIFIED INDUSTRIES Diversified industry strategy focused on retirement situations w/ $0.5-5M target EBITDA range 2. LEADERSHIP SUCCESSION Institutionalized leadership model addresses the retirement market while de-risking the transition 3. BIGGER TAM Resulting in a larger addressable market in the US and beyond 4. TECH ENABLES SCALE Supports acquisitions, performance management, and capital allocation
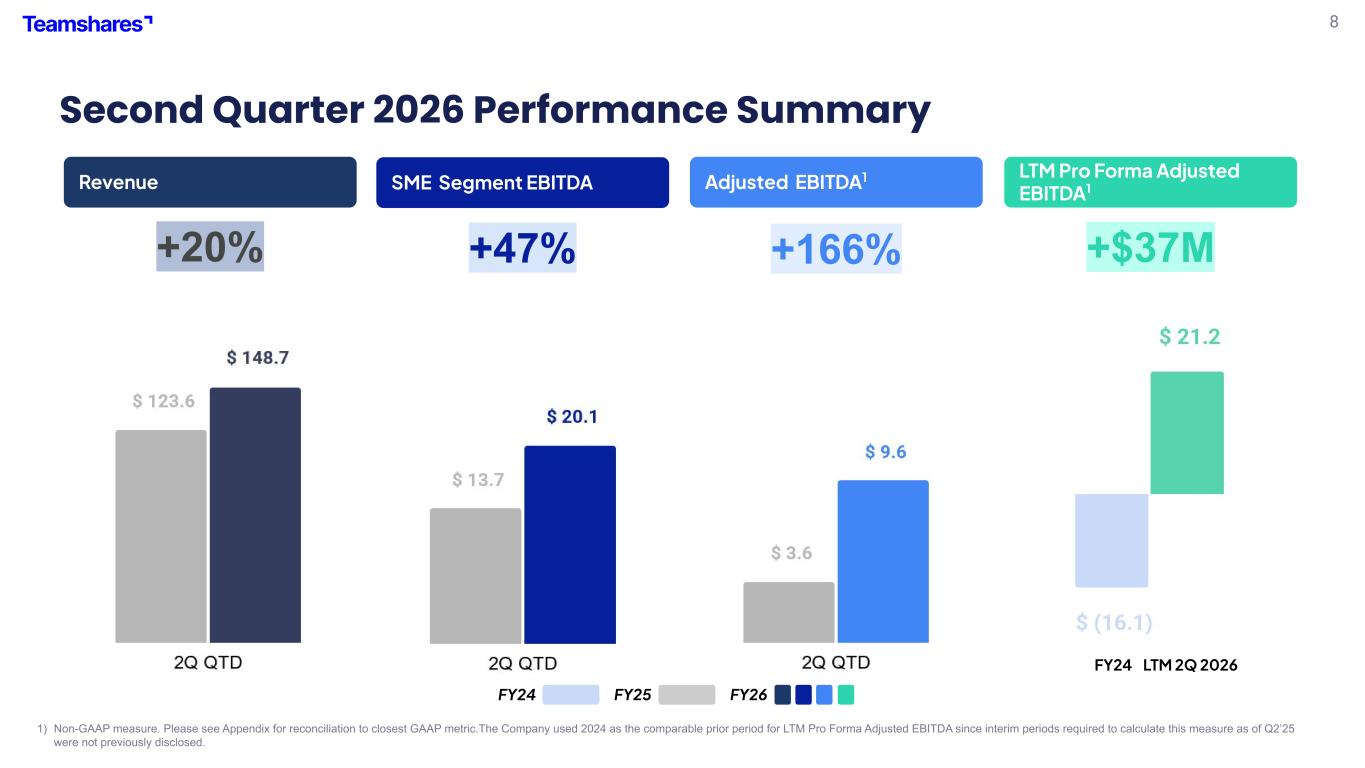

 
8 Second Quarter 2026 Performance Summary 1) Non-GAAP measure. Please see Appendix for reconciliation to closest GAAP metric.The Company used 2024 as the comparable prior period for LTM Pro Forma Adjusted EBITDA since interim periods required to calculate this measure as of Q2’25 were not previously disclosed. Revenue Adjusted EBITDA1 LTM Pro Forma Adjusted EBITDA1 FY25 FY26 SME Segment EBITDA +20% +47% +166% +$37M FY24 LTM 2Q 2026 FY24 Brian
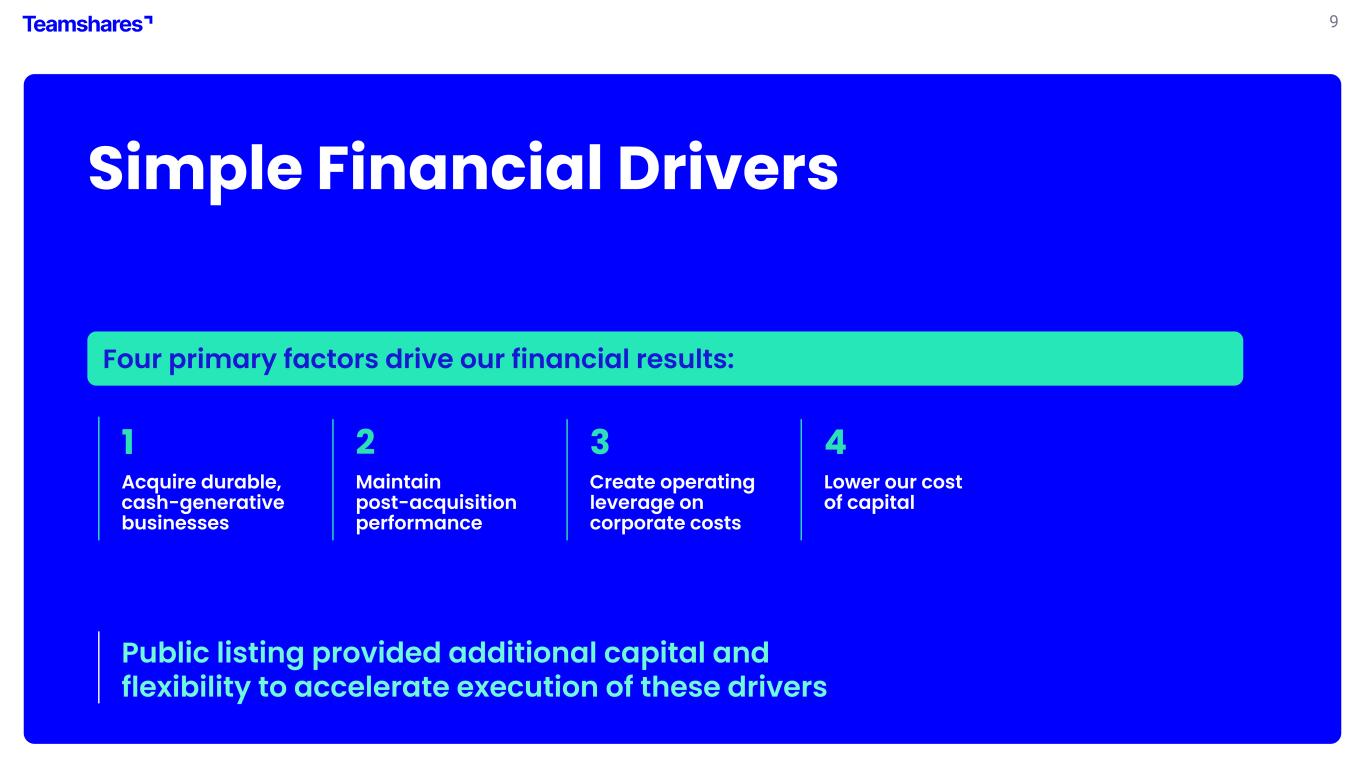

 
9 Simple Financial Drivers 1 Acquire durable, cash-generative businesses 2 Maintain post-acquisition performance 3 4 Lower our cost of capital Public listing provided additional capital and flexibility to accelerate execution of these drivers Four primary factors drive our financial results: Alex Create operating leverage on corporate costs
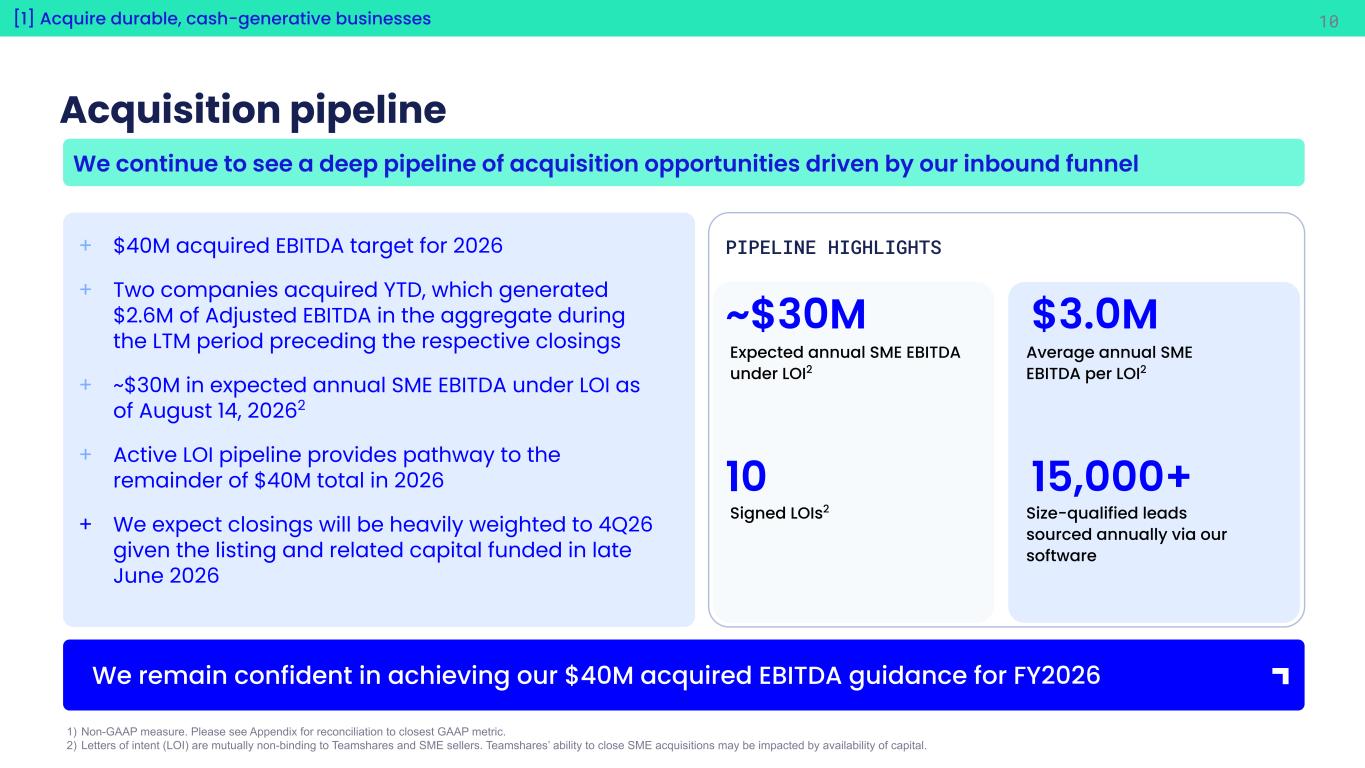

 
10[1] Acquire durable, cash-generative businesses Acquisition pipeline 1) Non-GAAP measure. Please see Appendix for reconciliation to closest GAAP metric. 2) Letters of intent (LOI) are mutually non-binding to Teamshares and SME sellers. Teamshares’ ability to close SME acquisitions may be impacted by availability of capital. We remain confident in achieving our $40M acquired EBITDA guidance for FY2026 Alex We continue to see a deep pipeline of acquisition opportunities driven by our inbound funnel + $40M acquired EBITDA target for 2026 + Two companies acquired YTD, which generated $2.6M of Adjusted EBITDA in the aggregate during the LTM period preceding the respective closings + ~$30M in expected annual SME EBITDA under LOI as of August 14, 20262 + Active LOI pipeline provides pathway to the remainder of $40M total in 2026 + We expect closings will be heavily weighted to 4Q26 given the listing and related capital funded in late June 2026 ~$30M 10 $3.0M 15,000+ PIPELINE HIGHLIGHTS Average annual SME EBITDA per LOI2 Signed LOIs2 Size-qualified leads sourced annually via our software Expected annual SME EBITDA under LOI2
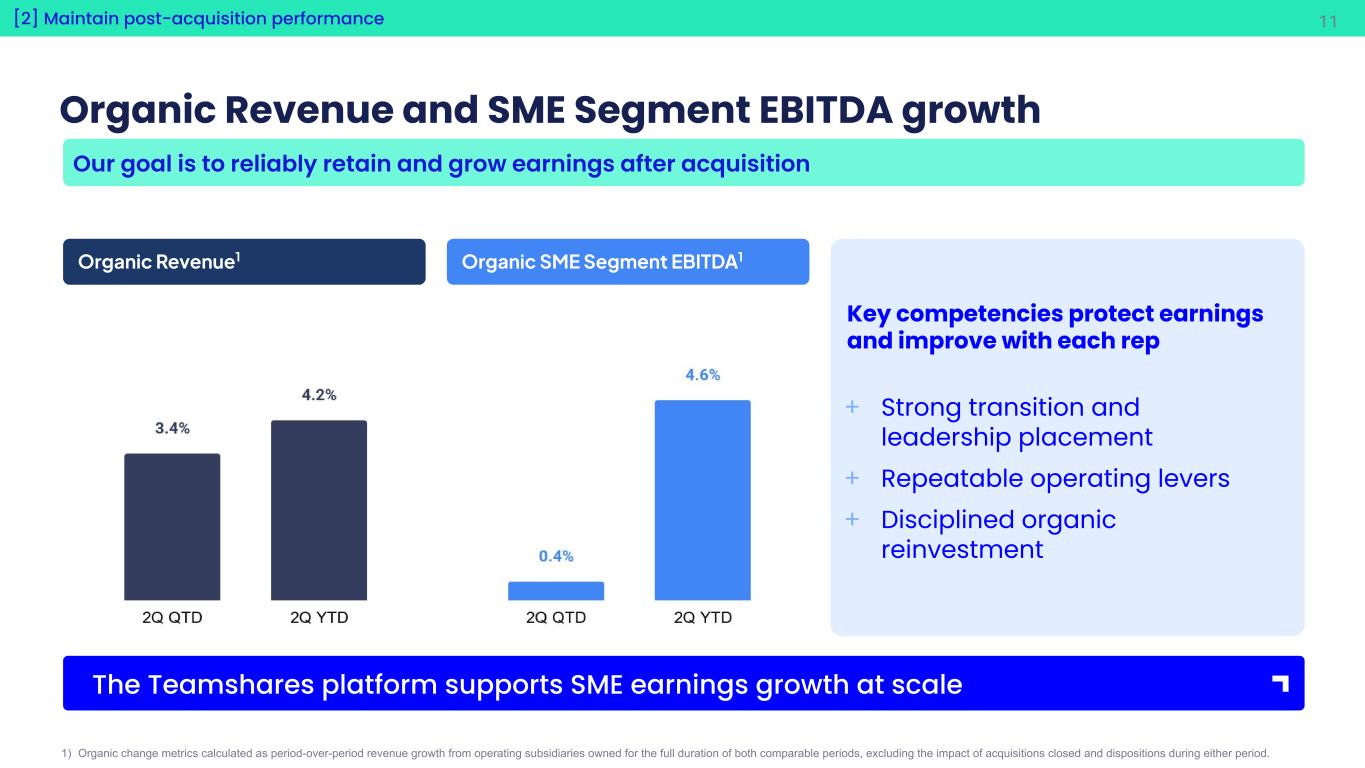

 
11 Organic Revenue and SME Segment EBITDA growth 1) Organic change metrics calculated as period-over-period revenue growth from operating subsidiaries owned for the full duration of both comparable periods, excluding the impact of acquisitions closed and dispositions during either period. The Teamshares platform supports SME earnings growth at scale [2] Maintain post-acquisition performance Alex Organic Revenue1 Organic SME Segment EBITDA1 Key competencies protect earnings and improve with each rep + Strong transition and leadership placement + Repeatable operating levers + Disciplined organic reinvestment Our goal is to reliably retain and grow earnings after acquisition
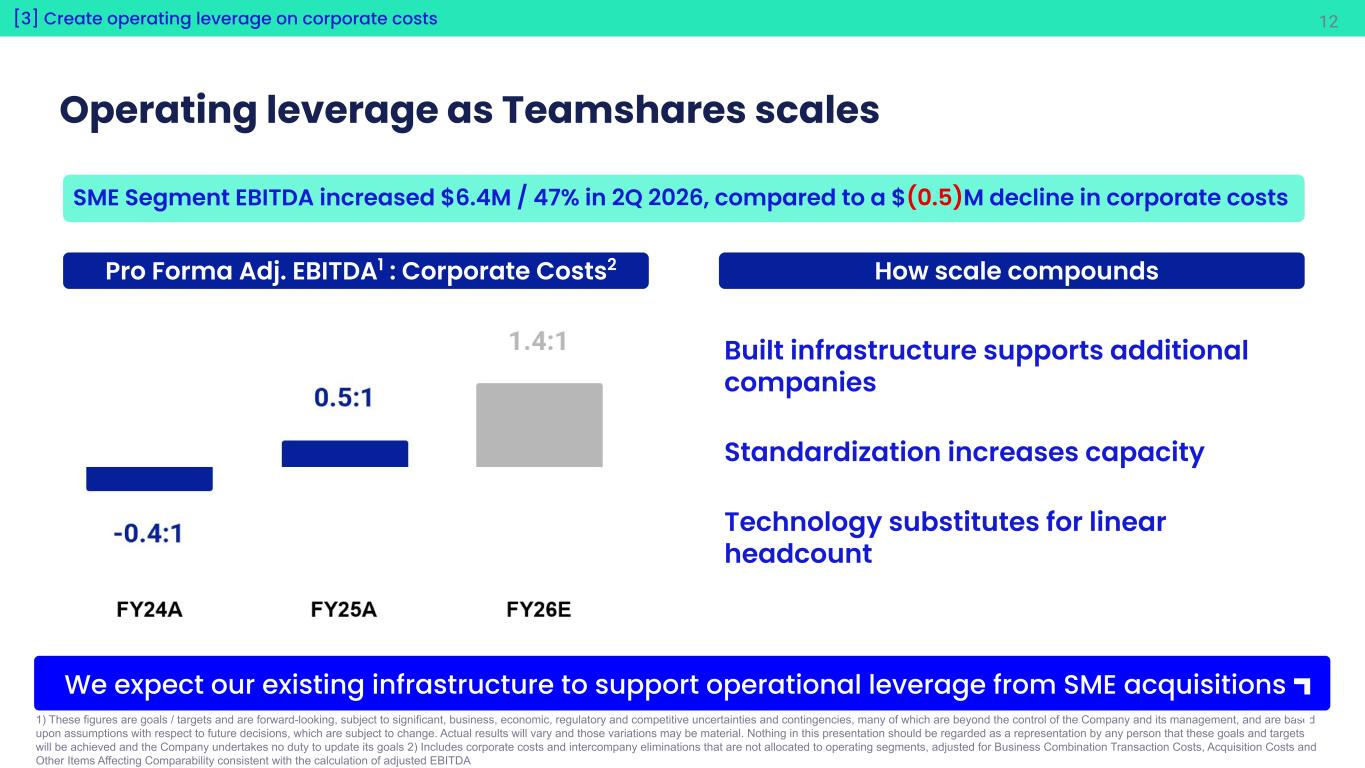

 
12 Operating leverage as Teamshares scales SME Segment EBITDA increased $6.4M / 47% in 2Q 2026, compared to a $(0.5)M decline in corporate costs 1) These figures are goals / targets and are forward-looking, subject to significant, business, economic, regulatory and competitive uncertainties and contingencies, many of which are beyond the control of the Company and its management, and are based upon assumptions with respect to future decisions, which are subject to change. Actual results will vary and those variations may be material. Nothing in this presentation should be regarded as a representation by any person that these goals and targets will be achieved and the Company undertakes no duty to update its goals 2) Includes corporate costs and intercompany eliminations that are not allocated to operating segments, adjusted for Business Combination Transaction Costs, Acquisition Costs and Other Items Affecting Comparability consistent with the calculation of adjusted EBITDA We expect our existing infrastructure to support operational leverage from SME acquisitions [3] Create operating leverage on corporate costs Pro Forma Adj. EBITDA1 : Corporate Costs2 Alex How scale compounds Built infrastructure supports additional companies Standardization increases capacity Technology substitutes for linear headcount
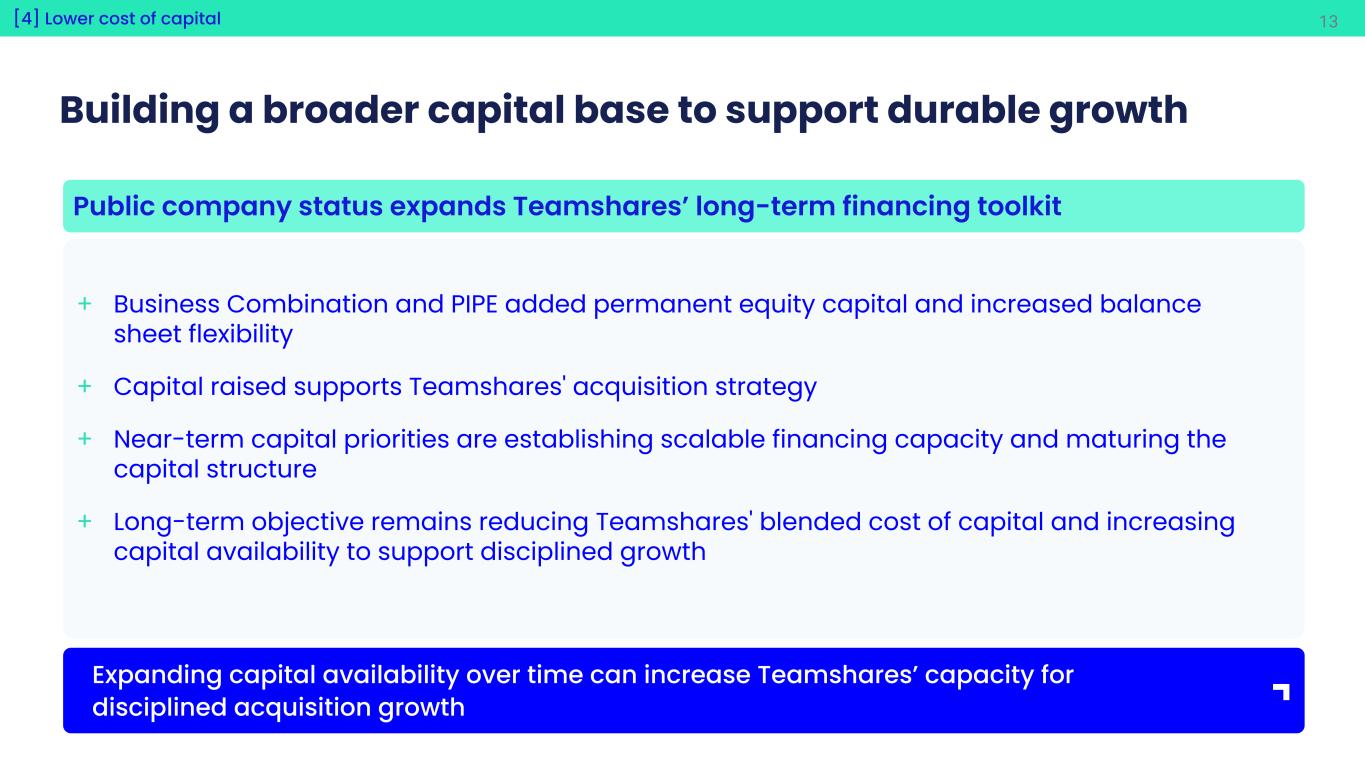

 
13 Building a broader capital base to support durable growth + Business Combination and PIPE added permanent equity capital and increased balance sheet flexibility + Capital raised supports Teamshares' acquisition strategy + Near-term capital priorities are establishing scalable financing capacity and maturing the capital structure + Long-term objective remains reducing Teamshares' blended cost of capital and increasing capital availability to support disciplined growth Public company status expands Teamshares’ long-term financing toolkit Expanding capital availability over time can increase Teamshares’ capacity for disciplined acquisition growth [4] Lower cost of capital Brian
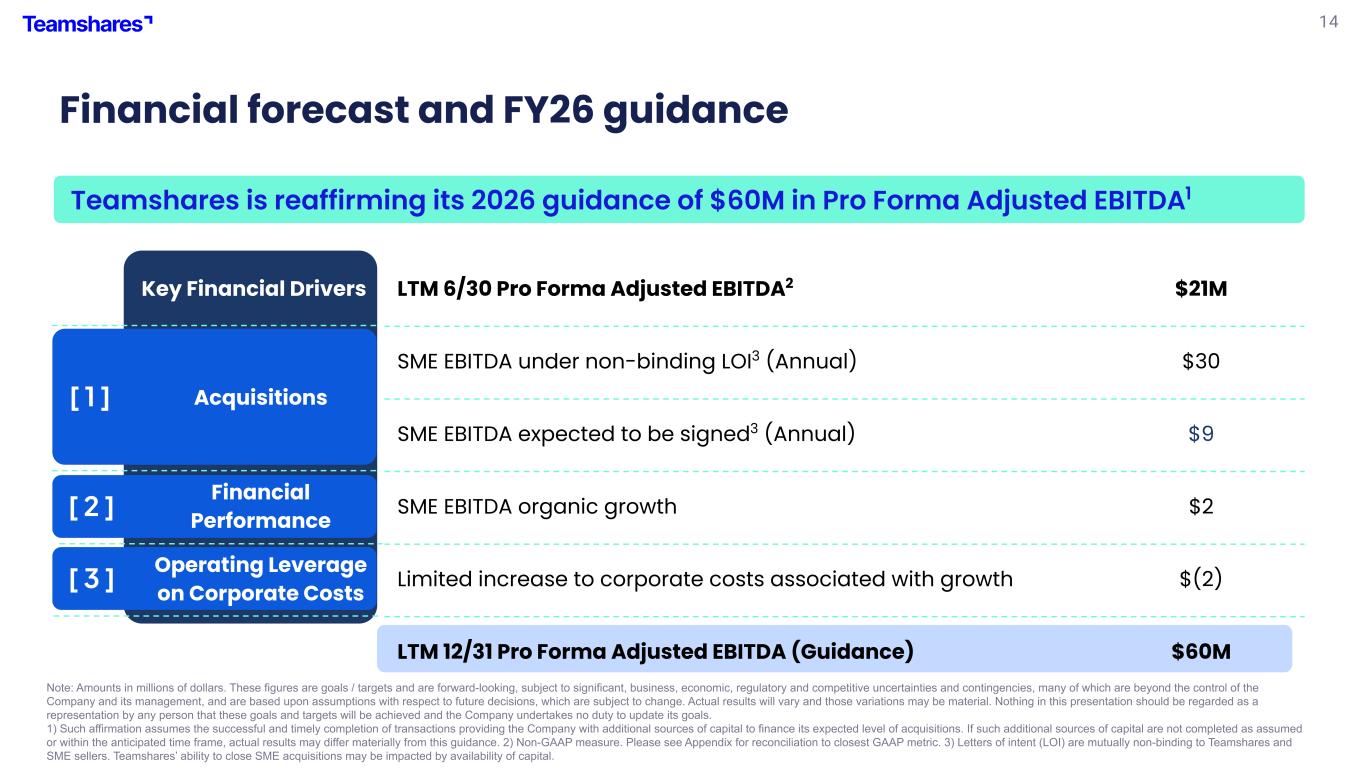

 
14 [ 1 ] [ 2 ] [ 3 ] Financial forecast and FY26 guidance Teamshares is reaffirming its 2026 guidance of $60M in Pro Forma Adjusted EBITDA1 Note: Amounts in millions of dollars. These figures are goals / targets and are forward-looking, subject to significant, business, economic, regulatory and competitive uncertainties and contingencies, many of which are beyond the control of the Company and its management, and are based upon assumptions with respect to future decisions, which are subject to change. Actual results will vary and those variations may be material. Nothing in this presentation should be regarded as a representation by any person that these goals and targets will be achieved and the Company undertakes no duty to update its goals. 1) Such affirmation assumes the successful and timely completion of transactions providing the Company with additional sources of capital to finance its expected level of acquisitions. If such additional sources of capital are not completed as assumed or within the anticipated time frame, actual results may differ materially from this guidance. 2) Non-GAAP measure. Please see Appendix for reconciliation to closest GAAP metric. 3) Letters of intent (LOI) are mutually non-binding to Teamshares and SME sellers. Teamshares’ ability to close SME acquisitions may be impacted by availability of capital. Key Financial Drivers LTM 6/30 Pro Forma Adjusted EBITDA2 $21M Acquisitions SME EBITDA under non-binding LOI3 (Annual) $30 SME EBITDA expected to be signed3 (Annual) $9 Financial Performance SME EBITDA organic growth $2 Operating Leverage on Corporate Costs Limited increase to corporate costs associated with growth $(2) LTM 12/31 Pro Forma Adjusted EBITDA (Guidance) $60M Brian
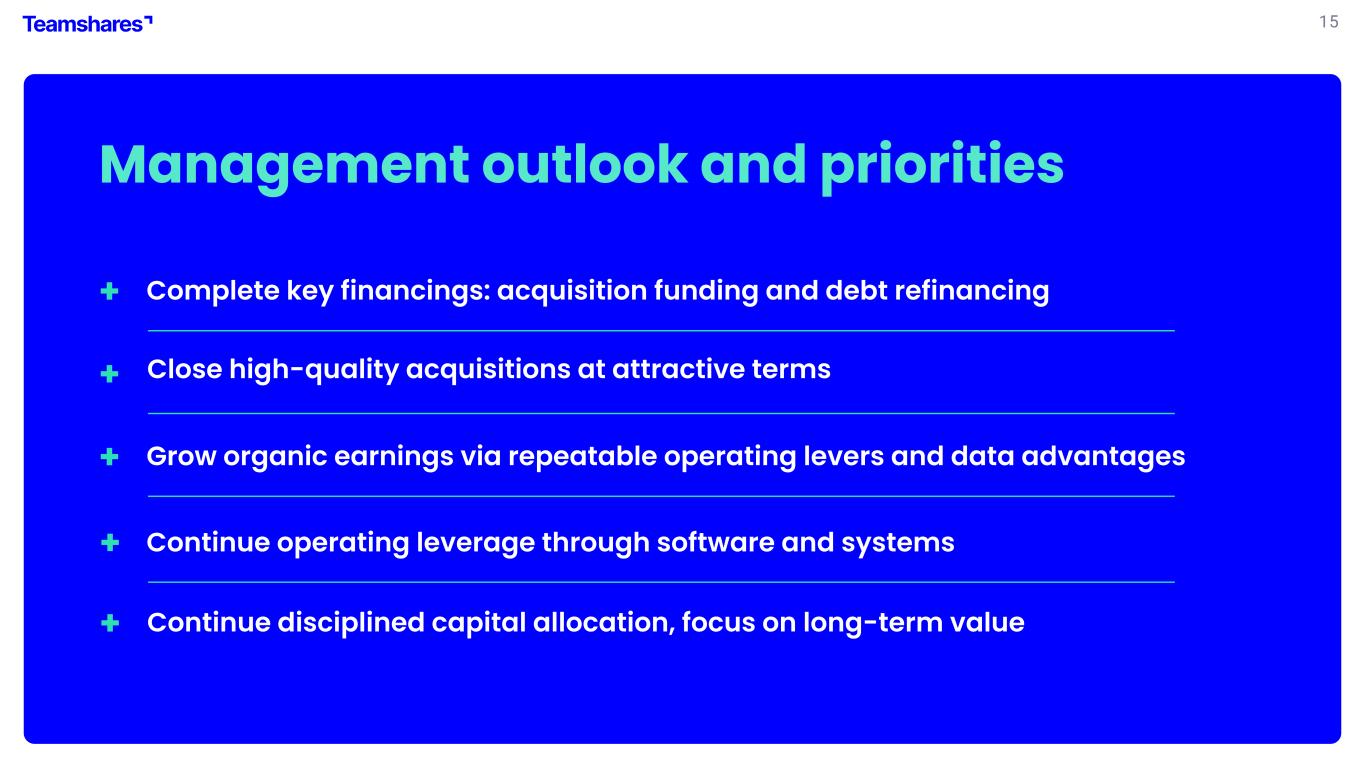

 
15 Management outlook and priorities + + Continue operating leverage through software and systems + Grow organic earnings via repeatable operating levers and data advantages + Close high-quality acquisitions at attractive terms + Continue disciplined capital allocation, focus on long-term value Complete key financings: acquisition funding and debt refinancing Michael


 
16 Appendix
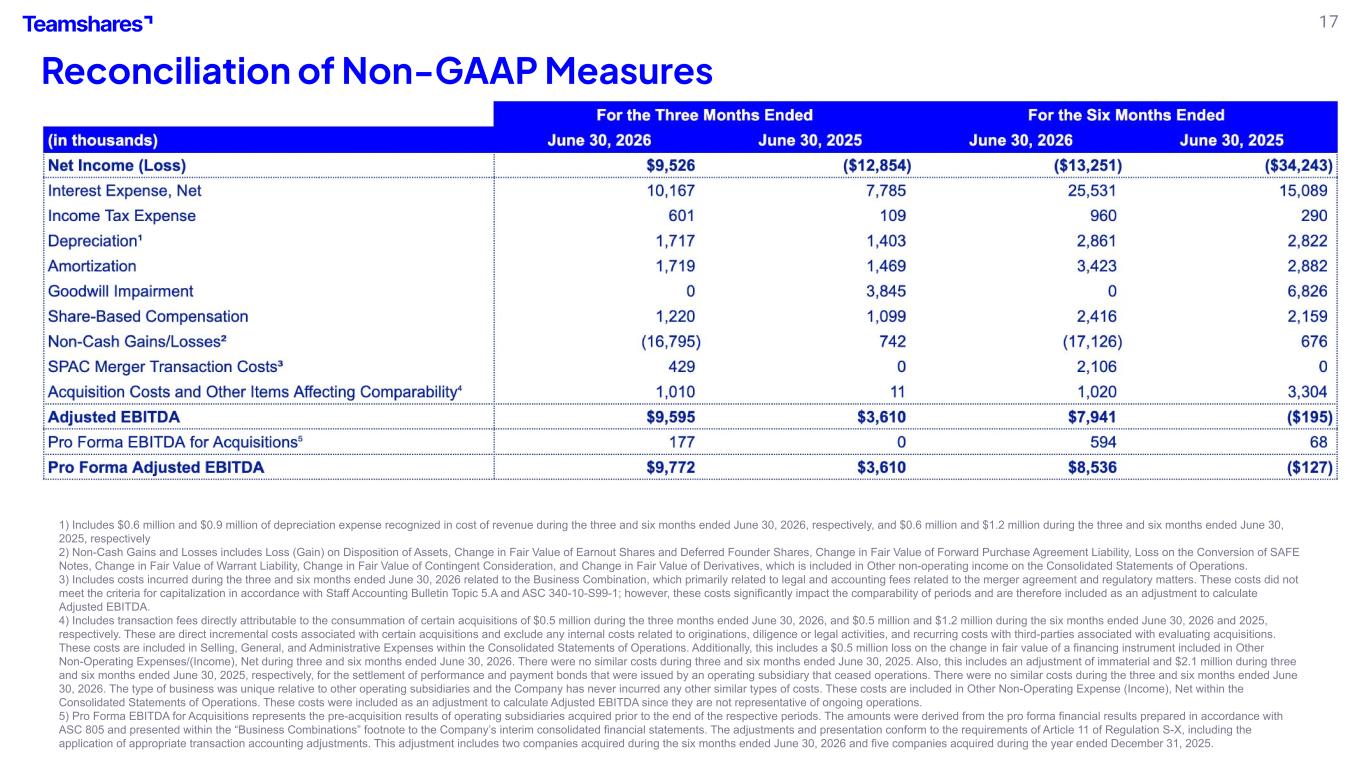

 
17 Reconciliation of Non-GAAP Measures 1) Includes $0.6 million and $0.9 million of depreciation expense recognized in cost of revenue during the three and six months ended June 30, 2026, respectively, and $0.6 million and $1.2 million during the three and six months ended June 30, 2025, respectively 2) Non-Cash Gains and Losses includes Loss (Gain) on Disposition of Assets, Change in Fair Value of Earnout Shares and Deferred Founder Shares, Change in Fair Value of Forward Purchase Agreement Liability, Loss on the Conversion of SAFE Notes, Change in Fair Value of Warrant Liability, Change in Fair Value of Contingent Consideration, and Change in Fair Value of Derivatives, which is included in Other non-operating income on the Consolidated Statements of Operations. 3) Includes costs incurred during the three and six months ended June 30, 2026 related to the Business Combination, which primarily related to legal and accounting fees related to the merger agreement and regulatory matters. These costs did not meet the criteria for capitalization in accordance with Staff Accounting Bulletin Topic 5.A and ASC 340-10-S99-1; however, these costs significantly impact the comparability of periods and are therefore included as an adjustment to calculate Adjusted EBITDA. 4) Includes transaction fees directly attributable to the consummation of certain acquisitions of $0.5 million during the three months ended June 30, 2026, and $0.5 million and $1.2 million during the six months ended June 30, 2026 and 2025, respectively. These are direct incremental costs associated with certain acquisitions and exclude any internal costs related to originations, diligence or legal activities, and recurring costs with third-parties associated with evaluating acquisitions. These costs are included in Selling, General, and Administrative Expenses within the Consolidated Statements of Operations. Additionally, this includes a $0.5 million loss on the change in fair value of a financing instrument included in Other Non-Operating Expenses/(Income), Net during three and six months ended June 30, 2026. There were no similar costs during three and six months ended June 30, 2025. Also, this includes an adjustment of immaterial and $2.1 million during three and six months ended June 30, 2025, respectively, for the settlement of performance and payment bonds that were issued by an operating subsidiary that ceased operations. There were no similar costs during the three and six months ended June 30, 2026. The type of business was unique relative to other operating subsidiaries and the Company has never incurred any other similar types of costs. These costs are included in Other Non-Operating Expense (Income), Net within the Consolidated Statements of Operations. These costs were included as an adjustment to calculate Adjusted EBITDA since they are not representative of ongoing operations. 5) Pro Forma EBITDA for Acquisitions represents the pre-acquisition results of operating subsidiaries acquired prior to the end of the respective periods. The amounts were derived from the pro forma financial results prepared in accordance with ASC 805 and presented within the “Business Combinations” footnote to the Company’s interim consolidated financial statements. The adjustments and presentation conform to the requirements of Article 11 of Regulation S-X, including the application of appropriate transaction accounting adjustments. This adjustment includes two companies acquired during the six months ended June 30, 2026 and five companies acquired during the year ended December 31, 2025.
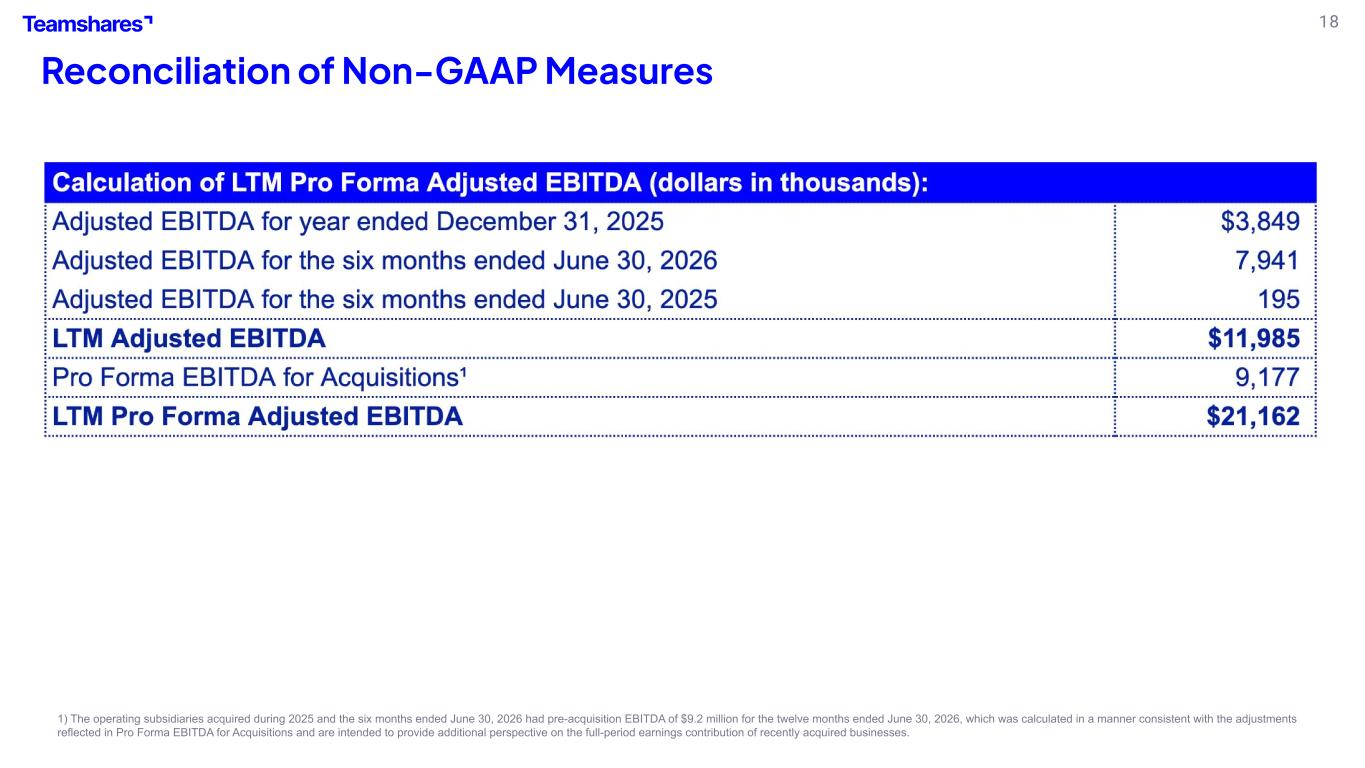

 
18 Reconciliation of Non-GAAP Measures 1) The operating subsidiaries acquired during 2025 and the six months ended June 30, 2026 had pre-acquisition EBITDA of $9.2 million for the twelve months ended June 30, 2026, which was calculated in a manner consistent with the adjustments reflected in Pro Forma EBITDA for Acquisitions and are intended to provide additional perspective on the full-period earnings contribution of recently acquired businesses.
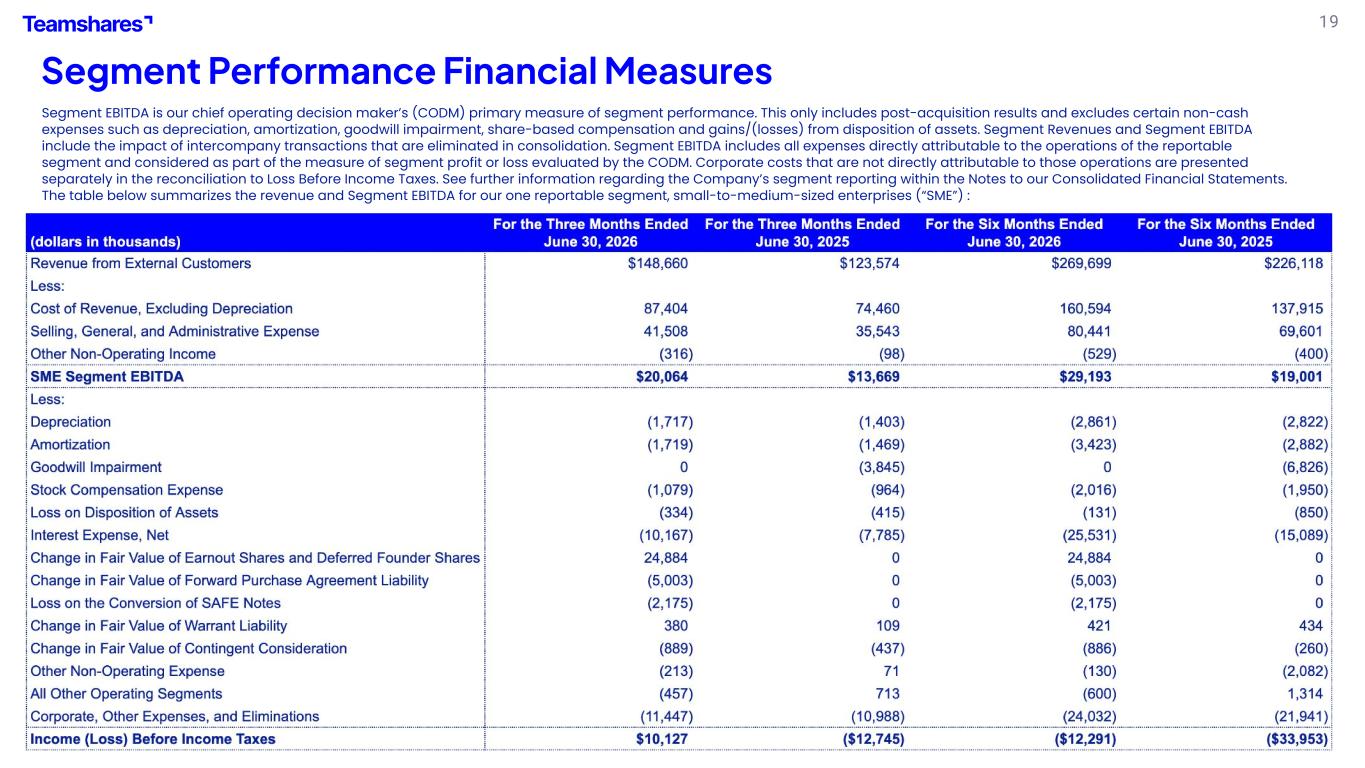

 
19 Segment Performance Financial Measures Segment EBITDA is our chief operating decision maker’s (CODM) primary measure of segment performance. This only includes post-acquisition results and excludes certain non-cash expenses such as depreciation, amortization, goodwill impairment, share-based compensation and gains/(losses) from disposition of assets. Segment Revenues and Segment EBITDA include the impact of intercompany transactions that are eliminated in consolidation. Segment EBITDA includes all expenses directly attributable to the operations of the reportable segment and considered as part of the measure of segment profit or loss evaluated by the CODM. Corporate costs that are not directly attributable to those operations are presented separately in the reconciliation to Loss Before Income Taxes. See further information regarding the Company’s segment reporting within the Notes to our Consolidated Financial Statements. The table below summarizes the revenue and Segment EBITDA for our one reportable segment, small-to-medium-sized enterprises (“SME”) :


 
20 It’s still Day One at