(State or other jurisdiction | (Commission File Number) | (I.R.S. Employer | ||
of incorporation or organization) | Identification No.) | |||
Written communications pursuant to Rule 425 under the Securities Act (17 CFR 230.425) | |
Soliciting material pursuant to Rule 14a-12 under the Exchange Act (17 CFR 240.14a-12) | |
Pre-commencement communications pursuant to Rule 14d-2(b) under the Exchange Act (17 CFR 240.14d-2(b)) | |
Pre-commencement communications pursuant to Rule 13e-4(c) under the Exchange Act (17 CFR 240.13e-4(c)) | |
Title of each class | Trading Symbol | Name of each exchange on which registered | ||
Exhibit | Description | |
104 | Cover Page Interactive Data File (the cover page XBRL tags are embedded within the Inline XBRL document.) | |
SIGNATURE | |||
T-MOBILE US, INC. | |||
May 6, 2020 | /s/ J. Braxton Carter | ||
J. Braxton Carter Executive Vice President and Chief Financial Officer | |||
• | 777,000 branded postpaid net additions in Q1 2020, best in industry |
• | 452,000 branded postpaid phone net additions in Q1 2020, best in industry |
• | 649,000 total branded net additions in Q1 2020, best in industry |
• | Record-low Q1 branded postpaid phone churn of 0.86% in Q1 2020, down 2 bps YoY |
• | Record-low Q1 branded prepaid churn of 3.52% in Q1 2020, down 33 bps YoY |
• | Record Service revenues of $8.7 billion, up 5% in Q1 2020, with Branded postpaid service revenues up 7% |
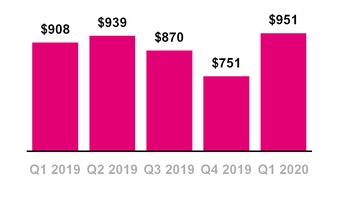
• | Record Q1 Net income of $951 million, up 5% in Q1 2020 |
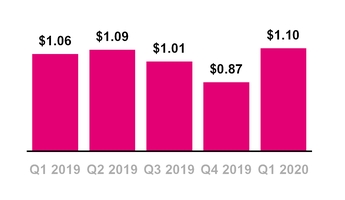
• | Record Q1 Diluted earnings per share (“EPS”) of $1.10, up 4% in Q1 2020 |
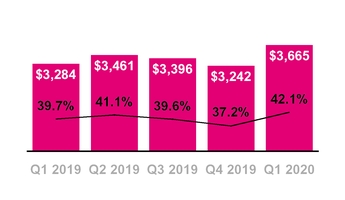
• | Record Adjusted EBITDA(1) of $3.7 billion, up 12% in Q1 2020 |
• | Record Q1 Net cash provided by operating activities of $1.6 billion, up 16% in Q1 2020 |
• | Record Q1 Free Cash Flow(1) of $732 million, up 18% in Q1 2020 |
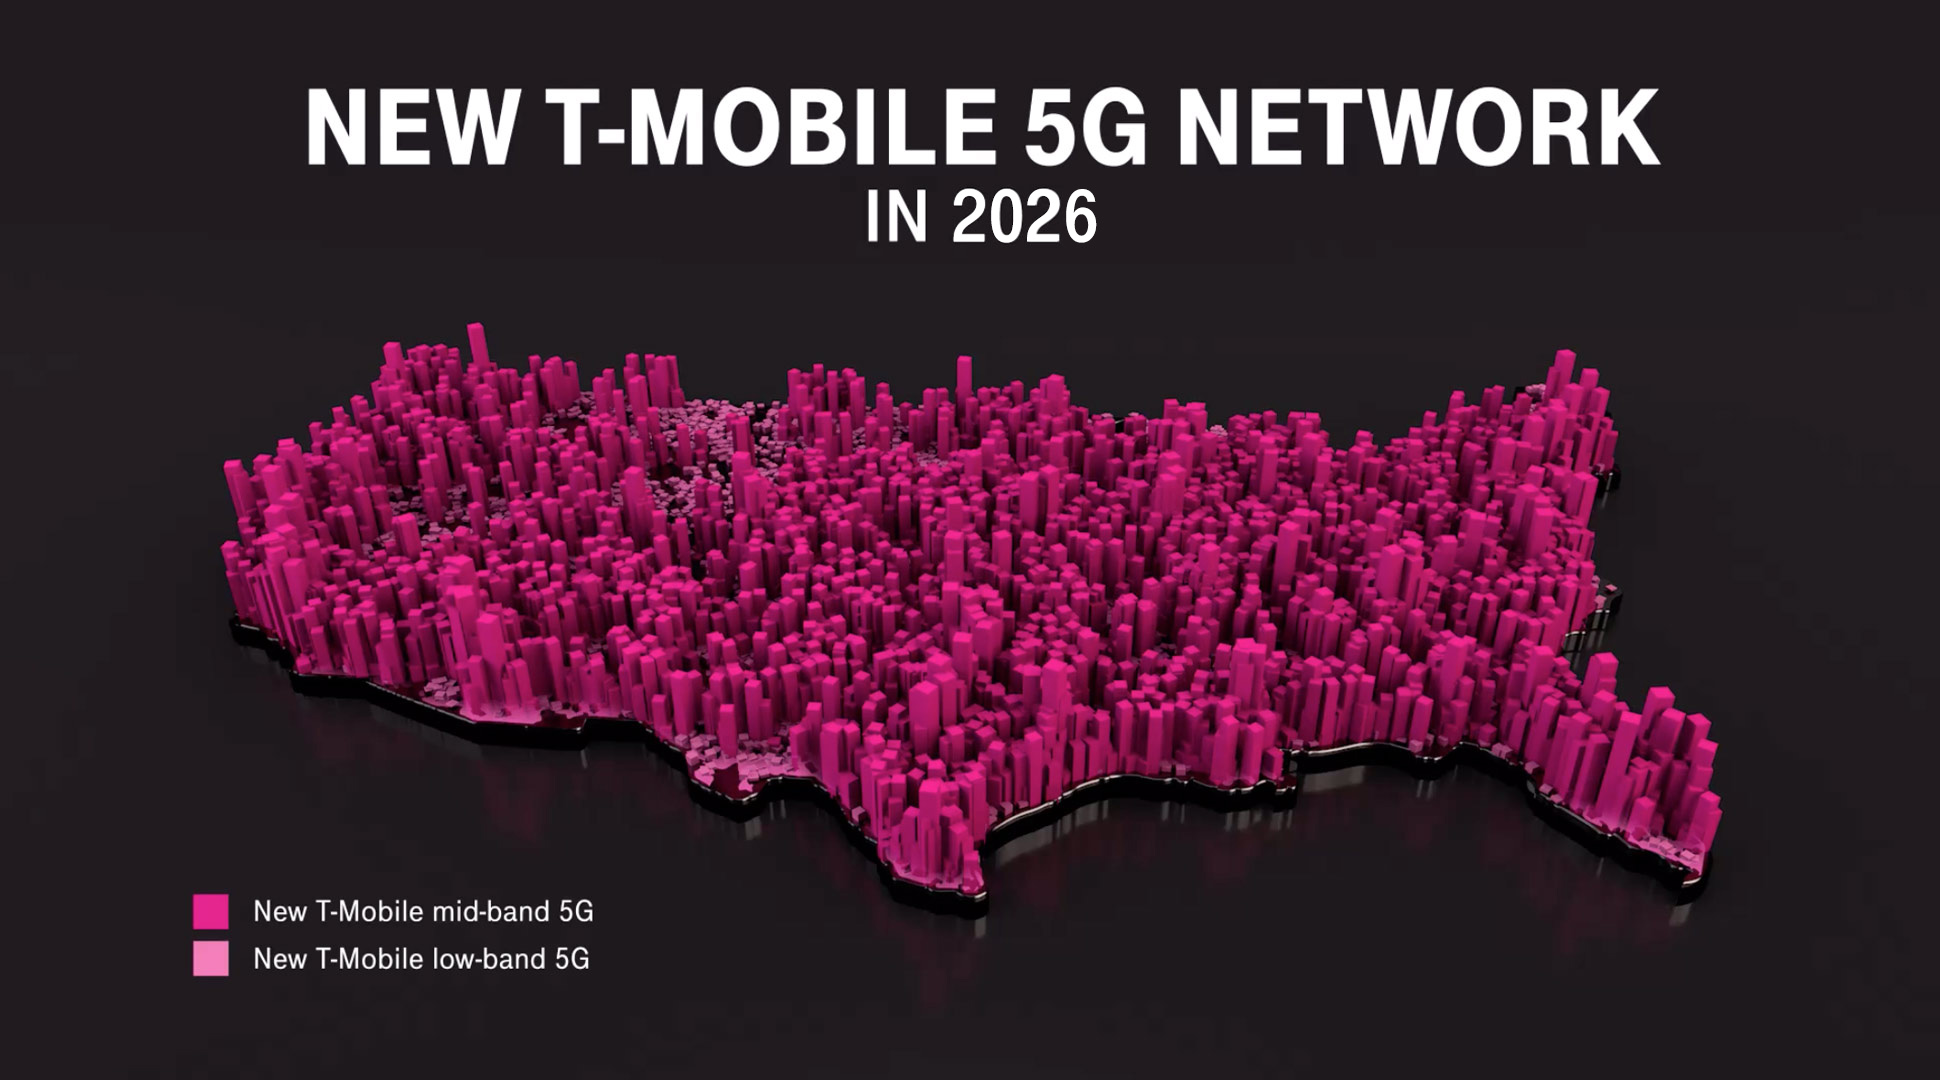
• | Rapid start to deploying 5G sites in Philadelphia and New York City using Sprint’s 2.5 GHz mid-band spectrum on T-Mobile’s 5G network |
• | After launching America’s first nationwide 5G network on our 600 MHz spectrum in December 2019, we further expanded our 5G footprint across an additional 1,600 sites in Q1 2020 and ramped pace to 1,000 sites in April 2020 |
• | 600 MHz 5G now covers 215 million people including the cities of Detroit, St. Louis and Columbus with the Bay Area added this week and more cities coming online soon |
• | Over 50 million New T-Mobile devices have access to the 600 MHz LTE network and 5G access is being made available to Sprint customers |
• | Partnered with multiple spectrum holders and the FCC to temporarily deploy additional 600 MHz spectrum, effectively doubling total 600 MHz LTE capacity across the nation |
• | We committed to the FCC’s Keep Americans Connected pledge by maintaining service and waiving late fees for residential and small business customers impacted by COVID-19 |
• | Accelerated the launch of T-Mobile Connect - T-Mobile’s lowest priced smartphone plan ever |
• | In mid-March, before the merger with Sprint, we closed approximately 80% of our company-owned retail stores, implemented remote working arrangements for our care teams and encouraged our employees to work remotely |
• | In compliance with the regulations in various states, we have since reopened a number of our previously closed stores |
• | We perform incremental deep cleaning and keep additional cleaning products stocked in the stores that remain open |
• | We supplemented pay to certain of our employees and commissions for third-party dealers impacted by COVID-19 |
• | On April 1, 2020, we closed on our merger with Sprint, supercharging the Un-carrier |
• | We expect to be able to rapidly build the world’s best 5G network, accelerating innovation and increasing competition in the U.S. wireless, video and broadband industries |
• | Customers are already seeing the benefits with millions of Sprint customers now able to access our LTE network |
• | Sprint customers now have access to more than double the number of LTE sites than on Sprint’s network alone |
• | Synergies have the potential to unlock massive scale and unleash an expected $43 billion in value for shareholders |
(1) | Adjusted EBITDA and Free Cash Flow are non-GAAP financial measures. These non-GAAP financial measures should be considered in addition to, but not as a substitute for, the information provided in accordance with GAAP. Reconciliations for these non-GAAP financial measures to the most directly comparable financial measures are provided in the Reconciliation of Non-GAAP Financial Measures to GAAP Financial Measures tables. |
Quarter | ||||||||
(in thousands, except churn) | Q1 2020 | Q4 2019 | Q1 2019 | |||||
Branded net customer additions | 649 | 1,391 | 1,088 | |||||
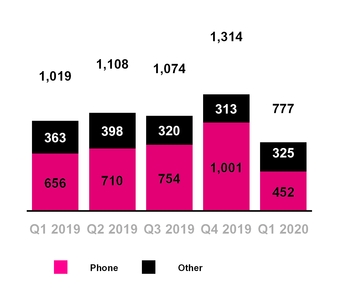
Branded postpaid net customer additions | 777 | 1,314 | 1,019 | |||||
Branded postpaid phone net customer additions | 452 | 1,001 | 656 | |||||
Branded postpaid other customer additions | 325 | 313 | 363 | |||||
Branded prepaid net customer (losses) additions | (128 | ) | 77 | 69 | ||||
Total branded customers, end of period | 68,543 | 67,894 | 64,744 | |||||
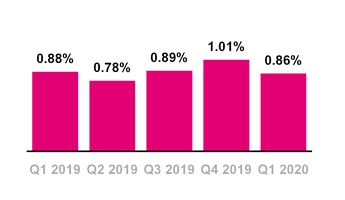
Branded postpaid phone churn | 0.86 | % | 1.01 | % | 0.88 | % | ||
Branded prepaid churn | 3.52 | % | 3.97 | % | 3.85 | % | ||
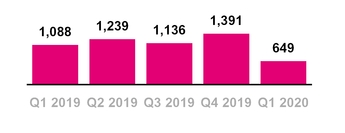
• | Branded net customer additions were 649,000 in Q1 2020, the 21st consecutive quarter we have led the industry in this metric. Our total branded customer count is 68.5 million. |
• | Branded postpaid net customer additions were 777,000 in Q1 2020, the 9th consecutive quarter we have led the industry in this metric. |
• | Branded postpaid phone net customer additions were 452,000 in Q1 2020, down 204,000 year-over-year. This decrease was primarily due to lower gross additions impacted by reduced demand from social distancing rules and retail store closures arising from COVID-19, partially offset by lower churn. Q1 2020 was the 25th consecutive quarter in which T-Mobile led the industry in this category. |
• | Branded postpaid other net customer additions were 325,000 in Q1 2020, down 38,000 year-over-year. This decrease was primarily due to lower gross additions impacted by reduced demand from social distancing rules and retail store closures arising from COVID-19, partially offset by lower churn. |
• | Branded postpaid phone churn was a Q1 record-low 0.86% in Q1 2020, down 2 bps year-over-year, primarily impacted by the beginning effects of reduced demand from social distancing rules and retail store closures arising from COVID-19. |
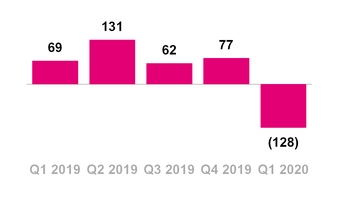
• | Branded prepaid net customer losses were 128,000 in Q1 2020, primarily due to lower gross additions impacted by reduced demand from social distancing rules and retail store closures arising from COVID-19, partially offset by lower churn. Migrations to branded postpaid plans reduced branded prepaid net customer additions by approximately 115,000 in Q1 2020. |
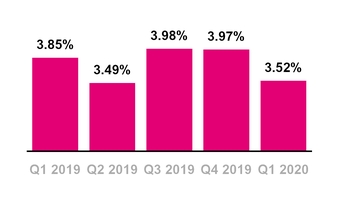
• | Branded prepaid churn was a Q1 record-low 3.52% in Q1 2020, down 33 bps year-over-year, primarily due to the continued success of our prepaid brands due to promotional activities and rate plan offers and the beginning effects of reduced demand from social distancing rules and retail store closures arising from COVID-19. |
(in millions, except EPS) | Quarter | Q1 2020 vs. Q4 2019 | Q1 2020 vs. Q1 2019 | ||||||||||||||
Q1 2020 | Q4 2019 | Q1 2019 | |||||||||||||||
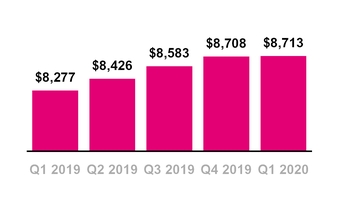
Total service revenues | $ | 8,713 | $ | 8,708 | $ | 8,277 | 0.1 | % | 5.3 | % | |||||||
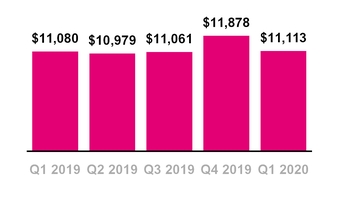
Total revenues | 11,113 | 11,878 | 11,080 | (6.4 | )% | 0.3 | % | ||||||||||
Net income | 951 | 751 | 908 | 26.6 | % | 4.7 | % | ||||||||||
EPS | 1.10 | 0.87 | 1.06 | 26.4 | % | 3.8 | % | ||||||||||
Adjusted EBITDA (1) | 3,665 | 3,242 | 3,284 | 13.0 | % | 11.6 | % | ||||||||||
Net cash provided by operating activities | 1,617 | 1,537 | 1,392 | 5.2 | % | 16.2 | % | ||||||||||
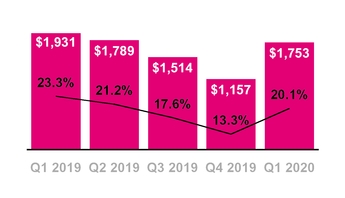
Cash purchases of property and equipment, including capitalized interest | 1,753 | 1,157 | 1,931 | 51.5 | % | (9.2 | )% | ||||||||||
Free Cash Flow (1) | 732 | 1,398 | 618 | (47.6 | )% | 18.4 | % | ||||||||||
(1) | Adjusted EBITDA and Free Cash Flow are non-GAAP financial measures. These non-GAAP financial measures should be considered in addition to, but not as a substitute for, the information provided in accordance with GAAP. Reconciliations for these non-GAAP financial measures to the most directly comparable financial measures are provided in the Reconciliation of Non-GAAP Financial Measures to GAAP Financial Measures tables. |
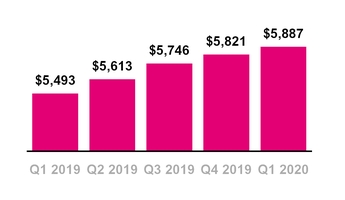
• | Total service revenues increased 5% year-over-year to $8.7 billion in Q1 2020. These results represent our best quarterly performance ever and we led the industry for the 24th consecutive quarter in year-over-year service revenue percentage growth. Branded postpaid service revenues increased 7% to $5.9 billion. |
• | Total revenues increased slightly year-over-year to $11.1 billion in Q1 2020, driven by growth in service revenues, offset by a decrease in equipment revenues impacted by reduced demand from social distancing rules and retail store closures arising from COVID-19. |
• | Branded postpaid Average Revenue per Account (ARPA) was essentially flat year-over-year. Branded postpaid ARPA was primarily impacted by an increase in average customers per account due to the growing success of wearables, specifically the Apple Watch, and other connected devices, offset by an increase in our promotional activities, including the ongoing growth in our Netflix offering, a reduction in regulatory program revenues from the continued adoption of tax inclusive plans and a reduction in certain non-recurring charges including the impact of credits for restore fees, international calls and data usage in connection with our response to COVID-19. |
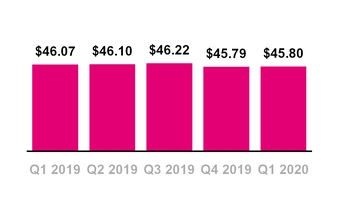
• | Branded postpaid phone Average Revenue per User (ARPU) decreased 1% year-over-year to $45.80 in Q1 2020. The decrease was primarily due to an increase in our promotional activities, including the ongoing growth in our Netflix offering, a reduction in regulatory program revenues from the continued adoption of tax inclusive plans and a reduction in certain non-recurring charges including the impact of credits for restore fees, international calls and data usage in connection with our response to COVID-19, partially offset by a decrease in the discount allocation to branded postpaid phone revenue within contracts that involve a mobile internet line and the growing success of new customer segments and rate plans. |
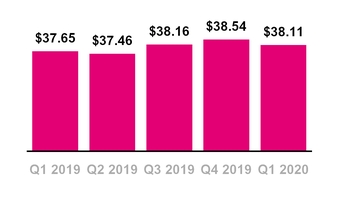
• | Branded prepaid ARPU increased 1% year-over-year to $38.11 in Q1 2020 primarily due the removal of certain branded prepaid customers associated with products now offered and distributed by a current MVNO partner, partially offset by dilution from our promotional activities, a reduction in certain non-recurring charges and growth in our Amazon Prime offering. |
• | Net income increased 5% year-over-year to a Q1 record $951 million in Q1 2020, primarily due to higher Operating income, partially offset by higher Income tax expense. Net income was impacted by the following: |
◦ | Merger-related costs, net of tax, of $117 million, in Q1 2020 compared to $93 million in Q1 2019. |
◦ | Supplemental employee payroll, third-party commissions and cleaning-related COVID-19 costs, net of tax, of $86 million in Q1 2020. |
◦ | Commission costs capitalized and amortized beginning upon the adoption of ASC 606 on January 1, 2018, net of tax, reduced Net income by $66 million in Q1 2020 compared to Q1 2019. |
• | EPS increased 4% year-over-year to a Q1 record $1.10 in Q1 2020. EPS was impacted by the following: |
◦ | The impact from merger-related costs, net of tax, of $0.14 in Q1 2020 compared to $0.11 in Q1 2019. |
◦ | The impact of supplemental employee payroll, third-party commissions and cleaning-related COVID-19 costs, net of tax, of $0.10 in Q1 2020. |
◦ | Commission costs capitalized and amortized beginning upon the adoption of ASC 606 on January 1, 2018, net of tax, reduced EPS by $0.08 compared to Q1 2019. |
• | Adjusted EBITDA increased 12% year-over-year to a record $3.7 billion in Q1 2020 primarily due to higher service revenues and lower net losses on equipment sales, partially offset by higher Cost of services expenses and higher Selling, general and administrative expenses, excluding Merger-related costs and supplemental employee payroll, third-party commissions and cleaning-related COVID-19 costs. The impact from commission costs capitalized and amortized, beginning upon the adoption of ASC 606 on January 1, 2018, reduced Adjusted EBITDA by $89 million compared to Q1 2019. The following impacts were excluded from Adjusted EBITDA: |
◦ | Merger-related costs of $143 million in Q1 2020 compared to $113 million in Q1 2019. |
◦ | Supplemental employee payroll, third-party commissions and cleaning-related COVID-19 costs of $117 million. |
• | Net cash provided by operating activities increased 16% year-over-year to a Q1 record $1.6 billion in Q1 2020 primarily due to higher Net income, adjusted for non-cash income and expense. |
• | Cash purchases of property and equipment including capitalized interest of $112 million, decreased 9% year-over-year to $1.8 billion in Q1 2020, primarily due to higher expenditures in Q1 2019 related to laying the initial groundwork for 5G. |
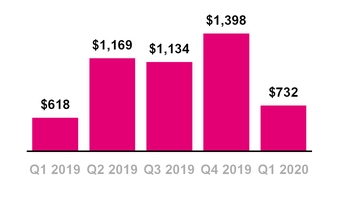
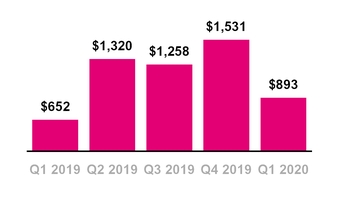
• | Free Cash Flow increased 18% year-over-year to a Q1 record $732 million in Q1 2020, primarily due to higher net cash provided by operating activities and lower cash purchases of property and equipment, partially offset by lower proceeds related to our deferred purchase price from securitization transactions. Excluding the impact of payments for merger-related costs of $161 million in Q1 2020, Free Cash Flow was $893 million in Q1 2020. Free Cash Flow was impacted by the following: |
◦ | Cash received in settlement of interest rate swaps of $46 million in Q1 2020. There were no cash settlements of interest rate swaps in Q1 2019. |
◦ | Payments for supplemental employee payroll, third-party commissions and cleaning-related COVID-19 costs of $12 million in Q1 2020. There were no cash payments related to COVID-19 in Q1 2019. |
• | COVID-19 impacts and the T-Mobile response: We have seen some notable shifts in how customers are using our network: more tethering, messaging, collaboration and conferencing activity. To meet this increased demand during COVID-19, T-Mobile has partnered with multiple spectrum holders and the FCC to effectively double its 600 MHz capacity temporarily, lifted smartphone high-speed data caps for customers on our limited data plans, made additional hotspot data available to every customer with a smartphone hotspot and significantly expanded network access for Sprint customers. Our dedicated team of engineers continues to work hard, and we will take the steps needed to ensure that we can keep our customers connected. |
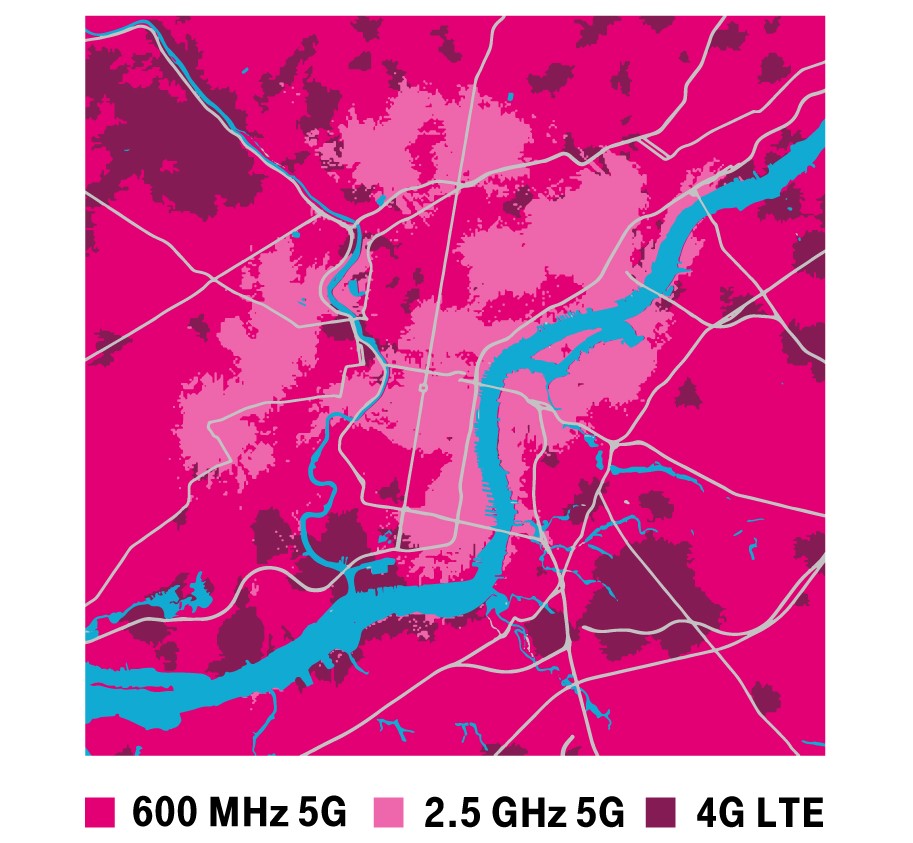
• | New T-Mobile network integration: In order to build the network capacity and reliability to keep Americans connected in the future, we have already started the integration of the Sprint and T-Mobile networks. We deployed our first 5G sites using Sprint 2.5 GHz spectrum in Philadelphia where customers with compatible 5G devices have realized peak speeds in excess of 600 Mbps. We also recently deployed in New York City, with multiple other cities to follow this year. |
• | Improving the Sprint customer experience: T-Mobile has significantly expanded network access for Sprint customers by enabling more than 65,000 towers for low and mid-band roaming, and we have seen over 10 million Sprint customers utilizing the T-Mobile network weekly. More than 80% of Sprint postpaid customers have handsets that are compatible with the T-Mobile network today. |
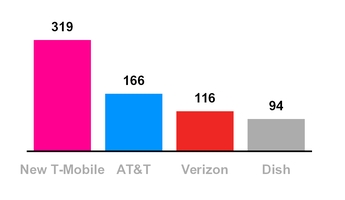
• | Spectrum Position: Combining the spectrum holdings of T-Mobile and Sprint, New T-Mobile controls 319 MHz of spectrum nationwide, not including mmWave spectrum. This spectrum position of New T-Mobile is nearly double that of AT&T and nearly three times that of Verizon. Combining all the mmWave spectrum holdings of T-Mobile and Sprint, New T-Mobile controls 1,160 MHz of spectrum nationwide, second most in the industry, ahead of AT&T. |
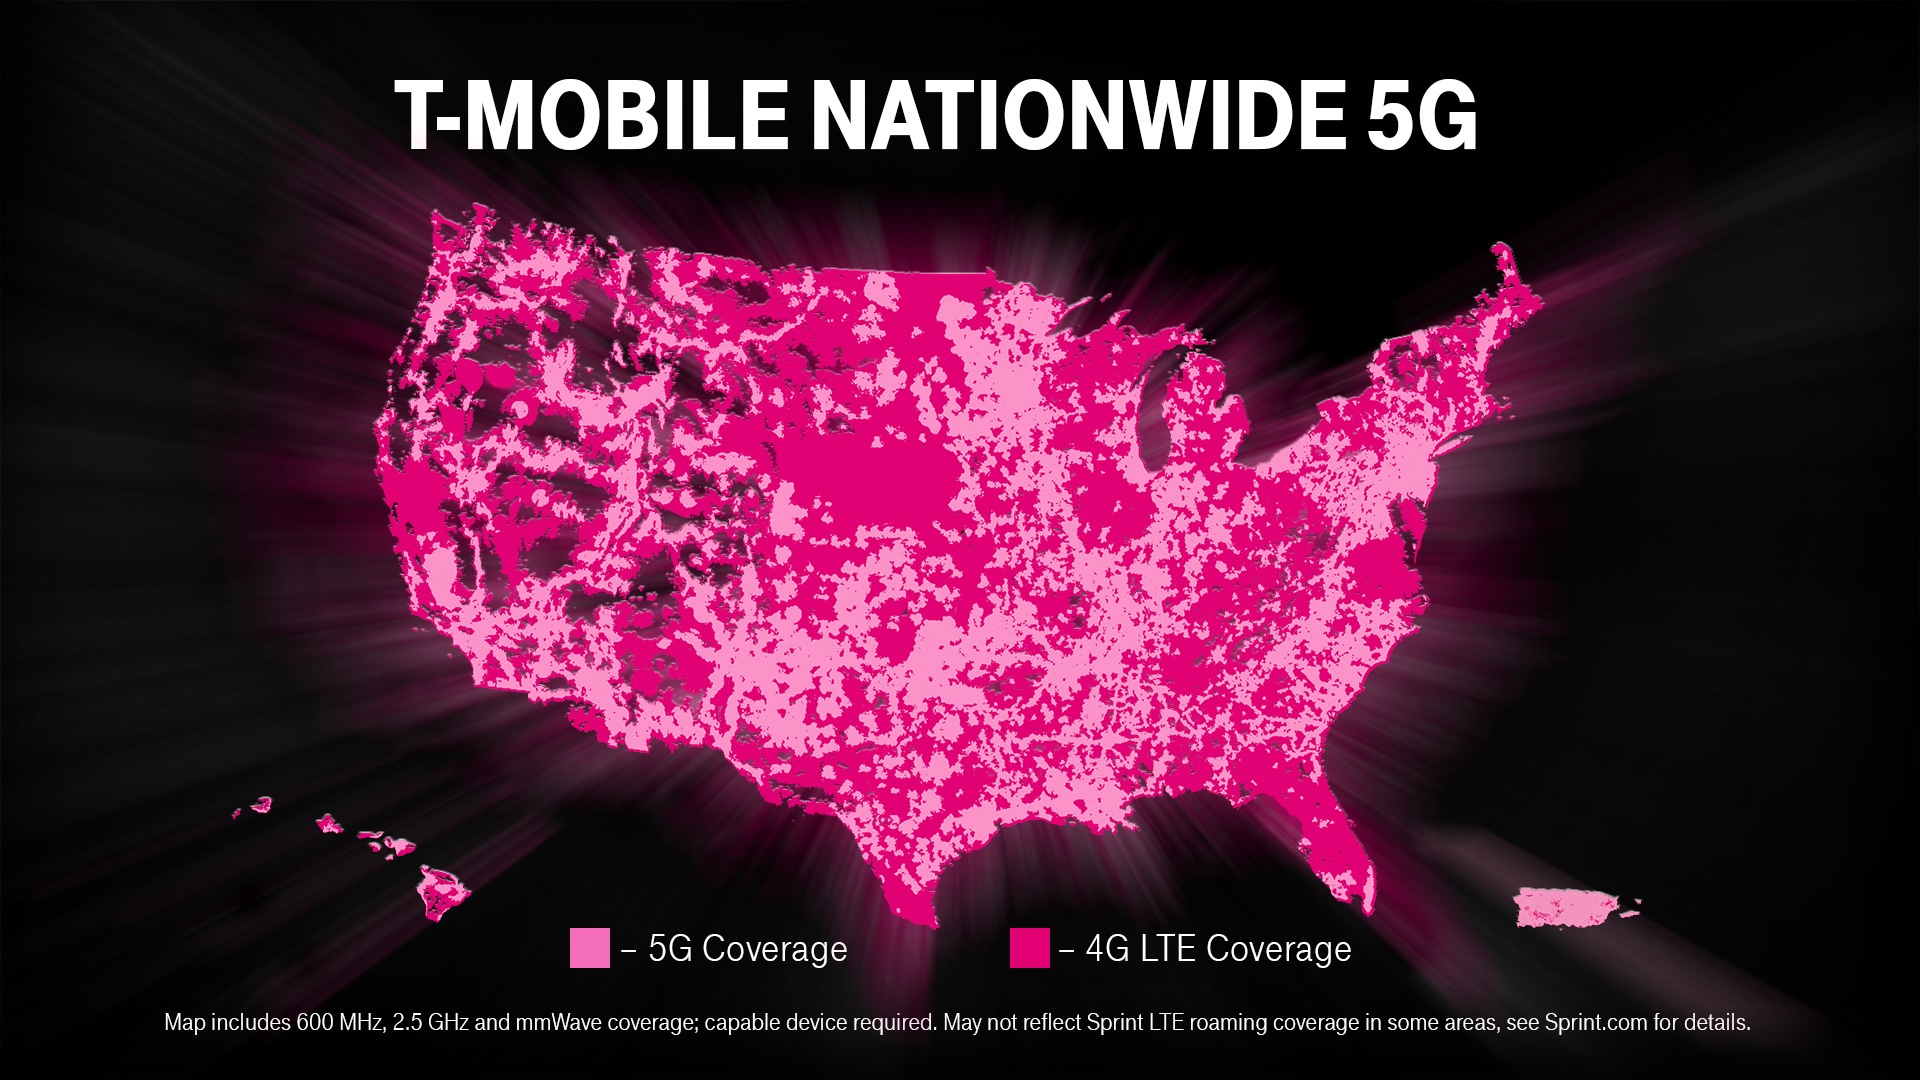
• | 600 MHz Spectrum: In December 2019, T-Mobile launched America’s first nationwide 5G network, which is now live in 49 states and Puerto Rico, with Alaska set to launch in May 2020, and covers 215 million people in almost 6,000 cities and towns across the United States. Recent cities covered by 5G on 600 MHz spectrum include Detroit, St. Louis and Columbus with the Bay Area added this week and more cities coming online soon. Over 50 million New T-Mobile devices have access to the 600 MHz LTE network and 5G access is being made available to Sprint customers. |
• | Network Coverage Growth: T-Mobile continues to expand its coverage breadth and covered 327 million people at the end of Q1 2020. T-Mobile added 1,600 sites to its 5G footprint in Q1 2020 and has further accelerated that pace by adding 1,000 sites in April 2020. |
• | Lower net customer additions, equipment revenues and cost of equipment sales, and higher bad debt expense; |
• | Continued costs to protect and support our employees and customers, which will increase from the costs incurred during the first quarter of 2020; and |
• | Potential disruptions in our supply chains. |
Date: | Wednesday, May 6, 2020 |
Time: | 4:30 p.m. (EDT) |
US/Canada: | 866-575-6534 |
International: | +1 323-994-2131 |
Participant Passcode: | 6064937 |
Twitter: | Send a tweet to @TMobileIR or @MikeSievert using $TMUS |
Press Contact: | Investor Relations Contact: |
Media Relations | Jud Henry |
T-Mobile US, Inc. | T-Mobile US, Inc. |
http://newsroom.t-mobile.com | |
Quarter | |||||||||||||||||||
(in millions) | Q1 2019 | Q2 2019 | Q3 2019 | Q4 2019 | Q1 2020 | ||||||||||||||
Net income | $ | 908 | $ | 939 | $ | 870 | $ | 751 | $ | 951 | |||||||||
Adjustments: | |||||||||||||||||||
Interest expense | 179 | 182 | 184 | 182 | 185 | ||||||||||||||
Interest expense to affiliates | 109 | 101 | 100 | 98 | 99 | ||||||||||||||
Interest income | (8 | ) | (4 | ) | (5 | ) | (7 | ) | (12 | ) | |||||||||
Other (income) expense, net | (7 | ) | 22 | (3 | ) | (4 | ) | 10 | |||||||||||
Income tax expense | 295 | 301 | 325 | 214 | 306 | ||||||||||||||
Operating income | 1,476 | 1,541 | 1,471 | 1,234 | 1,539 | ||||||||||||||
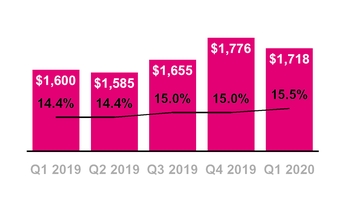
Depreciation and amortization | 1,600 | 1,585 | 1,655 | 1,776 | 1,718 | ||||||||||||||
Stock-based compensation (1) | 93 | 111 | 108 | 111 | 123 | ||||||||||||||
Merger-related costs | 113 | 222 | 159 | 126 | 143 | ||||||||||||||
COVID-19-related costs | — | — | — | — | 117 | ||||||||||||||
Other, net (2) | 2 | 2 | 3 | (5 | ) | 25 | |||||||||||||
Adjusted EBITDA | $ | 3,284 | $ | 3,461 | $ | 3,396 | $ | 3,242 | $ | 3,665 | |||||||||
(1) | Stock-based compensation includes payroll tax impacts and may not agree to stock-based compensation expense in the consolidated financial statements. Additionally, certain stock-based compensation expenses associated with the Transactions have been included in Merger-related costs. |
(2) | Other, net may not agree to the Condensed Consolidated Statements of Comprehensive Income, primarily due to certain non-routine operating activities, such as other special items that would not be expected to reoccur or are not reflective of T-Mobile’s ongoing operating performance, and are therefore excluded in Adjusted EBITDA. |
(in millions, except net debt ratios) | Mar 31, 2019 | Jun 30, 2019 | Sep 30, 2019 | Dec 31, 2019 | Mar 31, 2020 | ||||||||||||||
Short-term debt | $ | 250 | $ | 300 | $ | 475 | $ | 25 | $ | — | |||||||||
Short-term debt to affiliates | 598 | — | — | — | 2,000 | ||||||||||||||
Short-term financing lease liabilities | 911 | 963 | 1,013 | 957 | 918 | ||||||||||||||
Long-term debt | 10,952 | 10,954 | 10,956 | 10,958 | 10,959 | ||||||||||||||
Long-term debt to affiliates | 13,985 | 13,985 | 13,986 | 13,986 | 11,987 | ||||||||||||||
Financing lease liabilities | 1,224 | 1,314 | 1,440 | 1,346 | 1,276 | ||||||||||||||
Less: Cash and cash equivalents | (1,439 | ) | (1,105 | ) | (1,653 | ) | (1,528 | ) | (1,112 | ) | |||||||||
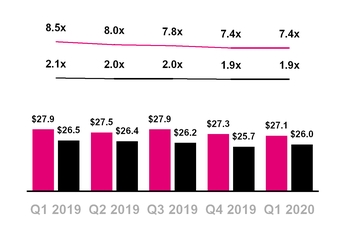
Net debt (excluding tower obligations) | $ | 26,481 | $ | 26,411 | $ | 26,217 | $ | 25,744 | $ | 26,028 | |||||||||
Divided by: Last twelve months Net income | $ | 3,125 | $ | 3,282 | $ | 3,357 | $ | 3,468 | $ | 3,511 | |||||||||
Net debt (excluding tower obligations) to last twelve months Net income Ratio | 8.5 | 8.0 | 7.8 | 7.4 | 7.4 | ||||||||||||||
Divided by: Last twelve months Adjusted EBITDA | $ | 12,726 | $ | 12,954 | $ | 13,111 | $ | 13,383 | $ | 13,764 | |||||||||
Net debt (excluding tower obligations) to last twelve months Adjusted EBITDA Ratio | 2.1 | 2.0 | 2.0 | 1.9 | 1.9 | ||||||||||||||
Quarter | |||||||||||||||||||
(in millions) | Q1 2019 | Q2 2019 | Q3 2019 | Q4 2019 | Q1 2020 | ||||||||||||||
Net cash provided by operating activities | $ | 1,392 | $ | 2,147 | $ | 1,748 | $ | 1,537 | $ | 1,617 | |||||||||
Cash purchases of property and equipment | (1,931 | ) | (1,789 | ) | (1,514 | ) | (1,157 | ) | (1,753 | ) | |||||||||
Proceeds related to beneficial interests in securitization transactions | 1,157 | 839 | 900 | 980 | 868 | ||||||||||||||
Proceeds from sales of tower sites | — | — | — | 38 | — | ||||||||||||||
Cash payments for debt prepayment or debt extinguishment costs | — | (28 | ) | — | — | — | |||||||||||||
Free Cash Flow | 618 | 1,169 | 1,134 | 1,398 | 732 | ||||||||||||||
Payments for merger-related costs | 34 | 151 | 124 | 133 | 161 | ||||||||||||||
Free Cash Flow, excluding payments for merger-related costs | $ | 652 | $ | 1,320 | $ | 1,258 | $ | 1,531 | $ | 893 | |||||||||
Net cash used in investing activities | $ | (966 | ) | $ | (1,615 | ) | $ | (657 | ) | $ | (887 | ) | $ | (1,580 | ) | ||||
Net cash used in financing activities | $ | (190 | ) | $ | (866 | ) | $ | (543 | ) | $ | (775 | ) | $ | (453 | ) | ||||
Q2 2020 | |||||||
(in millions) | Guidance Range | ||||||
Net cash provided by operating activities | $ | 700 | $ | 1,000 | |||
Gross payments for the settlement of interest rate swaps(1) | 2,300 | 2,300 | |||||
Cash purchases of property and equipment | (2,300 | ) | (2,500 | ) | |||
Proceeds related to beneficial interests in securitization transactions | 600 | 700 | |||||
Free Cash Flow | $ | 1,300 | $ | 1,500 | |||
(in millions, except average number of customers, ARPA and ARPU) | Quarter | ||||||||||||||||||
Q1 2019 | Q2 2019 | Q3 2019 | Q4 2019 | Q1 2020 | |||||||||||||||
Calculation of Branded Postpaid ARPA | |||||||||||||||||||
Branded postpaid service revenues | $ | 5,493 | $ | 5,613 | $ | 5,746 | $ | 5,821 | $ | 5,887 | |||||||||
Divided by: Average number of branded postpaid accounts (in thousands) and number of months in period | 14,108 | 14,354 | 14,602 | 14,881 | 15,155 | ||||||||||||||
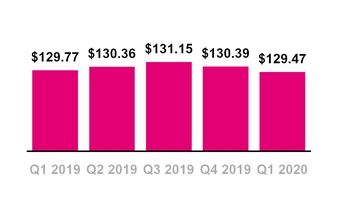
Branded postpaid ARPA | $ | 129.77 | $ | 130.36 | $ | 131.15 | $ | 130.39 | $ | 129.47 | |||||||||
Calculation of Branded Postpaid Phone ARPU | |||||||||||||||||||
Branded postpaid service revenues | $ | 5,493 | $ | 5,613 | $ | 5,746 | $ | 5,821 | $ | 5,887 | |||||||||
Less: Branded postpaid other revenues | (310 | ) | (326 | ) | (346 | ) | (362 | ) | (310 | ) | |||||||||
Branded postpaid phone service revenues | $ | 5,183 | $ | 5,287 | $ | 5,400 | $ | 5,459 | $ | 5,577 | |||||||||
Divided by: Average number of branded postpaid phone customers (in thousands) and number of months in period | 37,504 | 38,226 | 38,944 | 39,736 | 40,585 | ||||||||||||||
Branded postpaid phone ARPU | $ | 46.07 | $ | 46.10 | $ | 46.22 | $ | 45.79 | $ | 45.80 | |||||||||
Calculation of Branded Prepaid ARPU | |||||||||||||||||||
Branded prepaid service revenues | $ | 2,386 | $ | 2,379 | $ | 2,385 | $ | 2,393 | $ | 2,373 | |||||||||
Divided by: Average number of branded prepaid customers (in thousands) and number of months in period | 21,122 | 21,169 | 20,837 | 20,691 | 20,759 | ||||||||||||||
Branded prepaid ARPU | $ | 37.65 | $ | 37.46 | $ | 38.16 | $ | 38.54 | $ | 38.11 | |||||||||

T-Mobile US, Inc. | ||
Investor Factbook | ||
T-Mobile US Reports First Quarter 2020 Results | ||
• | 777,000 branded postpaid net additions in Q1 2020, best in industry |
• | 452,000 branded postpaid phone net additions in Q1 2020, best in industry |
• | 649,000 total branded net additions in Q1 2020, best in industry |
• | Record-low Q1 branded postpaid phone churn of 0.86% in Q1 2020, down 2 bps YoY |
• | Record-low Q1 branded prepaid churn of 3.52% in Q1 2020, down 33 bps YoY |
• | Record Service revenues of $8.7 billion, up 5% in Q1 2020, with Branded postpaid service revenues up 7% |
• | Record Q1 Net income of $951 million, up 5% in Q1 2020 |
• | Record Q1 Diluted earnings per share (“EPS”) of $1.10, up 4% in Q1 2020 |
• | Record Adjusted EBITDA(1) of $3.7 billion, up 12% in Q1 2020 |
• | Record Q1 Net cash provided by operating activities of $1.6 billion, up 16% in Q1 2020 |
• | Record Q1 Free Cash Flow(1) of $732 million, up 18% in Q1 2020 |
• | Rapid start to deploying 5G sites in Philadelphia and New York City using Sprint’s 2.5 GHz mid-band spectrum on T-Mobile’s 5G network |
• | After launching America’s first nationwide 5G network on our 600 MHz spectrum in December 2019, we further expanded our 5G footprint across an additional 1,600 sites in Q1 2020 and ramped pace to 1,000 sites in April 2020 |
• | 600 MHz 5G now covers 215 million people including the cities of Detroit, St. Louis and Columbus with the Bay Area added this week and more cities coming online soon |
• | Over 50 million New T-Mobile devices have access to the 600 MHz LTE network and 5G access is being made available to Sprint customers |
• | Partnered with multiple spectrum holders and the FCC to temporarily deploy additional 600 MHz spectrum, effectively doubling total 600 MHz LTE capacity across the nation |
• | We committed to the FCC’s Keep Americans Connected pledge by maintaining service and waiving late fees for residential and small business customers impacted by COVID-19 |
• | Accelerated the launch of T-Mobile Connect - T-Mobile’s lowest priced smartphone plan ever |
• | In mid-March, before the merger with Sprint, we closed approximately 80% of our company-owned retail stores, implemented remote working arrangements for our care teams and encouraged our employees to work remotely |
• | In compliance with the regulations in various states, we have since reopened a number of our previously closed stores |
• | We perform incremental deep cleaning and keep additional cleaning products stocked in the stores that remain open |
• | We supplemented pay to certain of our employees and commissions for third-party dealers impacted by COVID-19 |
• | On April 1, 2020, we closed on our merger with Sprint, supercharging the Un-carrier |
• | We expect to be able to rapidly build the world’s best 5G network, accelerating innovation and increasing competition in the U.S. wireless, video and broadband industries |
• | Customers are already seeing the benefits with millions of Sprint customers now able to access our LTE network |
• | Sprint customers now have access to more than double the number of LTE sites than on Sprint’s network alone |
• | Synergies have the potential to unlock massive scale and unleash an expected $43 billion in value for shareholders |
(1) | Adjusted EBITDA and Free Cash Flow are non-GAAP financial measures. These non-GAAP financial measures should be considered in addition to, but not as a substitute for, the information provided in accordance with GAAP. Reconciliations for these non-GAAP financial measures to the most directly comparable financial measures are provided in the Reconciliation of Non-GAAP Financial Measures to GAAP Financial Measures tables. |


▪ | On April 1, 2020, we completed our planned acquisition of Sprint (“the Merger”), and as a result, Sprint and its subsidiaries became wholly owned consolidated subsidiaries of T-Mobile. |
▪ | The completion of the merger enables us to build upon our recently launched foundational 5G network of 600 MHz spectrum to deliver the world’s best 5G network while delivering significant value creation through an expected $43 billion in synergies. We also see opportunity to unlock synergies on an accelerated timeframe and further enhance value creation in other areas such as scale in procurement. |
▪ | On April 1, 2020, in connection with the closing of the Merger, we drew down on our $19 billion New Secured Bridge Loan Facility and our $4 billion New Secured Term Loan Facility with certain financial institutions. We used the net proceeds to redeem certain debt of us, Sprint and our and Sprint’s respective subsidiaries and for post-closing general corporate purposes of the combined company. Subsequently, on April 9, 2020, we repaid our $19 billion New Secured Bridge Loan Facility with the net proceeds of an offering of senior secured notes together with cash on hand. See T-Mobile’s Quarterly Report on Form 10-Q for the quarterly period ended March 31, 2020, for additional details. |
▪ | In Q1 2020, Merger-related costs were $143 million before taxes compared to $126 million in Q4 2019 and $113 million in Q1 2019. These costs impact Selling, general, and administrative (“SG&A”) expenses and Net income but are excluded from Adjusted EBITDA. |
▪ | The COVID-19 pandemic has resulted in a widespread health crisis that has adversely affected businesses, economies, and financial markets worldwide, and has caused significant volatility in the U.S. and international debt and equity markets. The impact of COVID-19 has been wide-ranging, including, but not limited to, the temporary closures of many businesses, “shelter in place” orders, travel restrictions, social distancing guidelines and other governmental, business and individual actions taken in response to the COVID-19 pandemic. These restrictions have impacted, and will continue to impact, our business, including the demand for our products and services and the ways in which our customers use them. In addition, the COVID-19 pandemic has resulted in economic uncertainty and a significant increase in unemployment in the United States, which could affect our customers’ purchasing decisions and ability to make timely payments. |
▪ | As a critical communications infrastructure provider as designated by the government, our focus has been on ensuring the safety and well-being of our employees while providing crucial connectivity to our customers and impacted communities. |
▪ | We have taken a variety of steps to protect the health and well-being of our workforce and customers to help mitigate the impact of COVID-19. |
▪ | To protect and support our employees: |
▪ | Before the merger, in mid-March, approximately 80% of T-Mobile and 70% of Sprint company-owned store locations, as well as many third-party retailer locations, which sell our T-Mobile, Metro by T-Mobile and Sprint brands, were closed. In compliance with the regulations of various states, we have since reopened a number of our previously closed stores; |
▪ | We supplemented pay for certain of our employees and commissions for third-party dealers impacted by COVID-19 and provided access to incremental paid time off for employees experiencing symptoms, taking care of children who were home due to school closures or caring for individuals impacted by COVID-19; |
▪ | We implemented remote working arrangements for many employees with more than 14,000 T-Mobile and Sprint internal care employees and over 29,000 T-Mobile and Sprint global care employees transitioned to a work-from-home environment as of May 1, 2020 and we encouraged our corporate and administrative employees to work remotely if possible; and |
▪ | To keep our employees safe, we perform incremental deep cleaning and keep additional hygiene and cleaning products stocked in the stores that remain open and we are endeavoring to follow the guidance from the Centers for Disease Control and Prevention, World Health Organization and other authorities and health officials. |
▪ | To keep our customers connected: |
▪ | We are committed to the FCC’s Keep Americans Connected pledge, which we have extended to June 30, 2020. We pledged to: |
◦ | Not terminate service to any residential or small business customers because of their inability to pay their bills due to disruptions caused by the COVID-19 pandemic; and |
◦ | Waive any late fees that any residential or small business customers incur because of their economic circumstances related to the COVID-19 pandemic. |
▪ | We also took additional temporary steps to ensure that all current T-Mobile customers that have data plans are provided the connectivity they need to learn and work remotely during the pandemic, including: |
◦ | Providing unlimited high-speed smartphone data to current customers as of March 31, 2020 who have legacy plans without unlimited high-speed data (excluding roaming) through June 30, 2020; |
◦ | Giving T-Mobile postpaid and Metro by T-Mobile customers on smartphone plans with mobile hotspot data the ability to add 10GB of Smartphone Mobile HotSpot each month (20GB total) through June 30, 2020; |
◦ | Working with our Lifeline partners to provide customers up to 5GB per month of free data through June 30, 2020; |
◦ | Increasing the data allowance, at no extra charge, to schools and students using our EmpowerED digital learning program to ensure each participant has access to at least 20GB of data per month through June 30, 2020; and |
◦ | Providing free international calling to landlines (and in many cases mobile numbers) to countries that were significantly impacted by COVID-19 through May 13, 2020. |
▪ | We launched T-Mobile Connect, a new, competitive $15 per month prepaid option, in March 2020, ahead of schedule to provide a reliable, low-cost connection for many Americans facing financial strain. |
▪ | We partnered with multiple spectrum holders and the FCC to successfully deploy additional 600 MHz spectrum on a temporary basis, effectively doubling total 600 MHz LTE capacity across the nation to help ensure customers can stay connected during this critical time; and |
▪ | We are committed to keeping our network fully operational as an essential service to first responders, 911 communications and our customers and have continued to expand our 5G network while adhering to all governmental guidelines. |
▪ | We continue to monitor the COVID-19 pandemic and its impacts and may adjust our steps as needed to meet the needs of our employees and customers and to continue to provide our products and services. |
▪ | In Q1 2020, we incurred $117 million, before taxes, in supplemental employee payroll, third-party commissions and cleaning-related COVID-19 costs, which are included in Selling, general and administrative expenses in our Condensed Consolidated Statement of Comprehensive Income. Substantially all of these costs were incurred during March, as COVID-19 had a minimal impact on our expenses in January and February. These costs have been excluded from the calculation of Adjusted EBITDA, a non-GAAP financial measure, as they represent direct, incremental costs as a result of our response to COVID-19 that we do not consider to be indicative of our ongoing operating performance. |
▪ | Additional impacts of COVID-19 during Q1 2020, which primarily impacted our results during March, include: |
▪ | Lower net customer additions due to reduced demand from social distancing rules and retail store closures, which impacted our ability to sell devices and to persuade potential customers to switch to our network during the crisis; |
▪ | Lower branded postpaid phone and branded prepaid churn due to social distancing rules and retail store closures; |
▪ | Lower Total service revenues from lower net customer additions and customer concessions as part of our commitments to the FCC’s Keep Americans Connected pledge and other efforts to keep our customers connected; |
▪ | Lower Equipment revenues and lower Cost of equipment sales due to reduced demand from social distancing rules and retail store closures, which impacted our ability to sell devices; and |
▪ | Higher bad debt expense due to the recording of estimated losses associated with the adoption of the new credit loss standard and the macro-economic impacts of COVID-19. Late in the first quarter of 2020, we noticed an increase in the number of delinquent payments across our retail and business customers base. |
▪ | We will continue to monitor developments regarding the COVID-19 pandemic and evaluate the appropriate steps we need to take as a business to align with guidelines from state, local and federal government agencies to do what is best for our employees and customers. We expect our business, liquidity, financial condition, and operating results to continue to be adversely impacted by the COVID-19 pandemic for the remainder of 2020 and thereafter. The extent to which the COVID-19 pandemic impacts our business, operations and financial results will depend on numerous future developments that we are not able to predict at this time, including the duration and scope of the pandemic, the success of governmental, business and individual actions that have been and continue to be taken in response to the pandemic, and the impact on economic activity from the pandemic and actions taken in response. These uncertainties may also adversely impact the Q2 guidance we provided. Such impacts may include: |
▪ | Lower net customer additions due to reduced demand from social distancing rules, retail store closures and reduced consumer spending caused by widespread unemployment and other adverse economic effects, partially offset by lower churn; |
▪ | Lower Equipment revenues and lower Cost of equipment sales from lower device sales due to reduced demand from social distancing rules and retail store closures, which will impact our ability to sell devices; |
▪ | Higher bad debt expense on our service and EIP receivable portfolios due to adverse macro-economic conditions and payment behavior of customers, including those who have been placed on collection hold as part of our commitment to the FCC’s Keep Americans Connected pledge and a continuation of the trend from late in the first quarter of an elevated number of delinquent payments across our retail and business customers bases. Should these delinquencies continue to grow, our operating and financial results could be negatively impacted; |
▪ | Continued costs to protect and support our employees and customers, which will increase from the costs incurred during the first quarter of 2020 because COVID-19 primarily impacted costs during the last month of Q1 2020; |
▪ | Higher device insurance fulfillment costs due to a lower supply of returned devices; and |
▪ | Potential disruptions in our supply chains. |
▪ | In addition, we are in the process of reevaluating our spending, including for marketing purposes like advertising, capital projects like build-out of our stores, travel, third-party services and certain operating expenses. We have taken actions to adjust our spending given the significant uncertainty around the magnitude and duration of any recessionary impacts arising from the COVID-19 pandemic. |

▪ | The customer metrics presented in this section relate to historical periods prior to the Merger and do not include Sprint customer results. On May 1, 2020, we provided preliminary standalone Sprint customer results for the quarter ended March 31, 2020. Those results were calculated based on the customer reporting policies of Sprint prior to the Merger and thus are not indicative of future results of the combined company. The historical Sprint policies differ from those applied by T-Mobile as a combined company, and the customer results will be materially lower once T-Mobile reporting policies are applied and the Sprint prepaid brands divesture is reflected. |
▪ | Branded postpaid phone net customer additions were 452,000 in Q1 2020, compared to 1,001,000 in Q4 2019 and 656,000 in Q1 2019. This marks the 25th consecutive quarter that T-Mobile led the industry in branded postpaid phone net customer additions. |
▪ | Sequentially, the decrease was primarily due to lower gross customer additions impacted by seasonality and reduced demand from social distancing rules and retail store closures arising from COVID-19, partially offset by lower churn. |
▪ | Year-over-year, the decrease was primarily due to lower gross customer additions impacted by reduced demand from social distancing rules and retail store closures arising from COVID-19, partially offset by lower churn. |
▪ | Branded postpaid other net customer additions were 325,000 in Q1 2020, compared to 313,000 in Q4 2019 and 363,000 in Q1 2019. |
▪ | Sequentially, the increase was primarily due to lower churn, partially offset by lower gross customer additions impacted by seasonality and reduced demand from social distancing rules and retail store closures arising from COVID-19. |
▪ | Year-over-year, the decrease was primarily due to lower gross customer additions impacted by reduced demand from social distancing rules and retail store closures arising from COVID-19, partially offset by lower churn. |
▪ | Branded postpaid net customer additions were 777,000 in Q1 2020, compared to 1,314,000 in Q4 2019 and 1,019,000 in Q1 2019. |


▪ | Branded postpaid phone churn was 0.86% in Q1 2020, down 15 basis points from 1.01% in Q4 2019 and down 2 basis points from 0.88% in Q1 2019. |
▪ | Sequentially, the decrease was primarily due to seasonality and the beginning effects of reduced demand from social distancing rules and retail store closures arising from COVID-19. |
▪ | Year-over-year, the decrease was primarily due to the beginning effects of reduced demand from social distancing rules and retail store closures arising from COVID-19. |
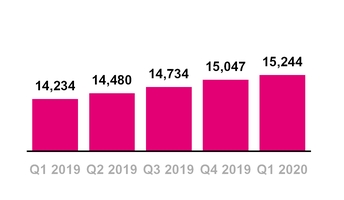
▪ | Total branded postpaid accounts were 15.2 million at the end of Q1 2020, compared to 15.0 million at the end of Q4 2019 and 14.2 million at the end of Q1 2019. |
▪ | Sequentially and year-over-year, the increase was primarily due to the growing success of new customer segments and rate plans, continued growth in existing and Greenfield markets, improvements in network quality, industry-leading customer service and the overall value of our offerings. Sequentially, the increase was partially offset by the impact of seasonality. |
▪ | Branded prepaid net customer losses were 128,000 in Q1 2020, compared to net additions of 77,000 in Q4 2019 and net additions of 69,000 in Q1 2019. |
▪ | Sequentially, the decrease was primarily due to lower gross customer additions impacted by seasonality and reduced demand from social distancing rules and retail store closures arising from COVID-19, partially offset by lower churn. |
▪ | Year-over-year, the decrease was primarily due to lower gross customer additions impacted by reduced demand from social distancing rules and retail store closures arising from COVID-19, partially offset by lower churn. |
▪ | Migrations to branded postpaid plans reduced branded prepaid net customer additions in Q1 2020 by approximately 115,000, down from 160,000 in Q4 2019 and down from 120,000 in Q1 2019. |


▪ | Branded prepaid churn was 3.52% in Q1 2020, compared to 3.97% in Q4 2019 and 3.85% in Q1 2019. |
▪ | Sequentially, the decrease was primarily due to the beginning effects of reduced demand from social distancing rules and retail store closures arising from COVID-19 and seasonality. |
▪ | Year-over year, the decrease was primarily due to the continued success of our prepaid brands due to promotional activities and rate plan offers and the beginning effects of reduced demand from social distancing rules and retail store closures arising from COVID-19. |
▪ | Total branded net customer additions were 649,000 in Q1 2020, compared to 1,391,000 in Q4 2019 and 1,088,000 in Q1 2019. |

▪ | T-Mobile continues to expand the footprint and improve the quality of its network to better serve its customers, something that is even more critical today as we provide the vital communications services our customers need in a socially distanced world. While COVID-19-related impacts have increased usage, our network continues to meet and exceed our performance standards, and that performance will only be improved and amplified as we begin to integrate Sprint’s spectrum, building the world’s best 5G network. |
▪ | We have seen some notable shifts in how customers are using our network. Comparing to pre-COVID-19, we have seen tethering and messaging activity up more than 50% and collaboration and conferencing activity up more than 100%. |
▪ | To meet this increased demand during COVID-19, T-Mobile has taken multiple steps to better serve our customers. First, T-Mobile has partnered with multiple spectrum holders to effectively double its 600 MHz capacity temporarily. Second, T-Mobile has temporarily lifted smartphone high-speed data caps and made additional hotspot data |


▪ | Our dedicated team of engineers continues to work hard in this difficult time, observing safe and health-conscious protocols. |
▪ | On April 1, 2020, we closed our Merger with Sprint. While the full integration of the Sprint and T-Mobile networks is expected to take approximately three years, we are already well underway with permitting, building, deploying and getting sites on air, leveraging the network assets of the combined companies. |
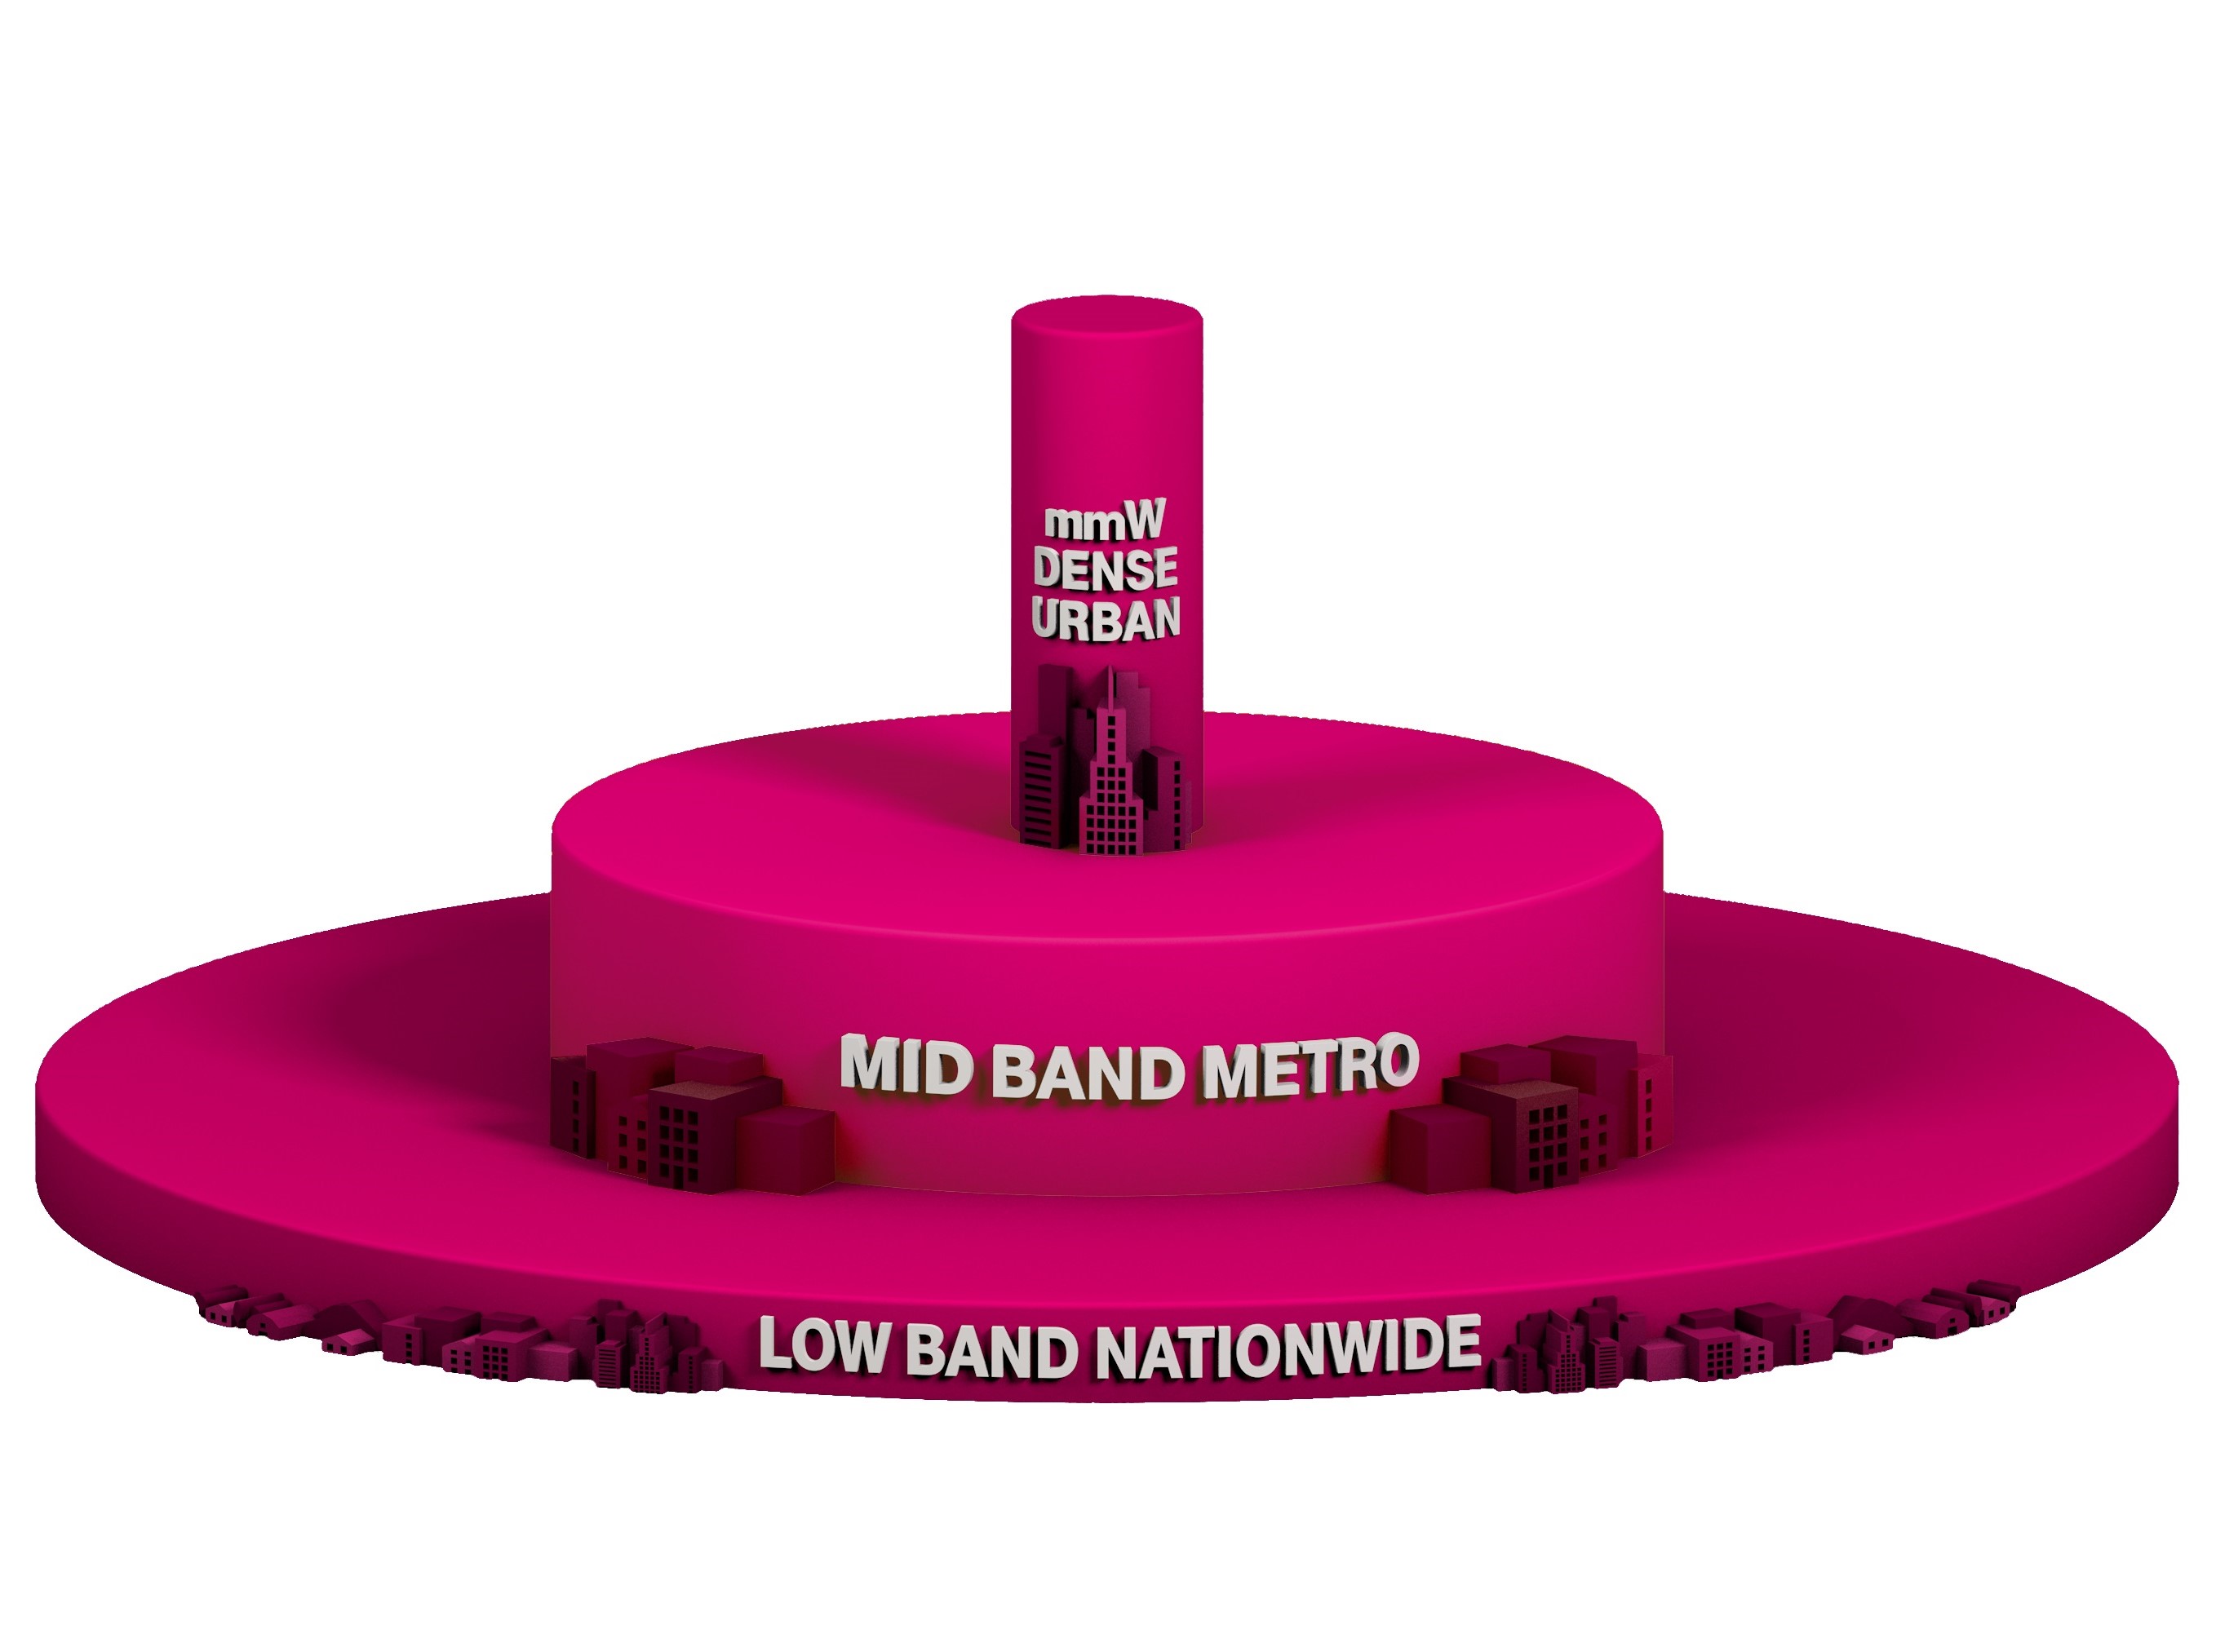
▪ | This integration work is essential to start today as it will provide the network capacity and reliability required to keep Americans connected in the future. The combined networks will provide the “layer cake” of spectrum and enable customers to have an unmatched 5G experience. |
▪ | T-Mobile deployed its first 5G sites using Sprint 2.5 GHz spectrum in Philadelphia where customers with compatible 5G devices have realized peak speeds in excess of 600 Mbps. We also recently deployed in New York City, with multiple other cities to follow this year. |
▪ | T-Mobile has significantly expanded network access for Sprint customers by enabling more than 65,000 towers for low and mid-band roaming, and we have seen over 10 million unique Sprint customers utilizing the T-Mobile network weekly. We have also implemented technologies like Voice over LTE (“VoLTE”) to enhance the network service experience. |
▪ | More than 80% of Sprint’s postpaid customers have handsets that are compatible with the T-Mobile network today. |
▪ | At the end of Q1 2020, T-Mobile controlled an average of 111 MHz of spectrum nationwide, not including millimeter wave (“mmWave”) spectrum. |
▪ | Combining the spectrum holdings of T-Mobile and Sprint, New T-Mobile controls 319 MHz of spectrum nationwide, not including mmWave spectrum. The spectrum comprises an average of 55 MHz in the low-band and 264 MHz in the mid-band. This spectrum position of New T-Mobile is nearly double that of AT&T and nearly three times that of Verizon. |

▪ | On March 26, 2020, the FCC announced that T-Mobile was the winning bidder of 2,384 licenses in Auction 103 (37/39 GHz and 47 GHz spectrum). In total, T-Mobile will spend $873 million, net of an incentive payment of $59 million, on the licenses won. |
▪ | Combining all the mmWave spectrum holdings of T-Mobile and Sprint, New T-Mobile controls 1,160 MHz of spectrum nationwide, second most in the industry, ahead of AT&T. |
▪ | We will evaluate future spectrum purchases in upcoming auctions and in the secondary market to further augment our current spectrum position. |
▪ | At the end of Q1 2020, T-Mobile controlled a nationwide average of 31 MHz of 600 MHz low-band spectrum. The spectrum covers 100% of the U.S. As of the end of Q1 2020, T-Mobile had cleared 285 million POPs and expects to clear the remaining 600 MHz spectrum POPs in 2020. |
▪ | T-Mobile continues its deployment of LTE and 5G on 600 MHz spectrum. At the end of Q1 2020, we were live with 4G LTE covering 269 million POPs. |
▪ | At the end of Q1 2020, we were live with 5G in 49 states and Puerto Rico covering 215 million POPs. 5G will be deployed in Alaska in May 2020, bringing 5G to all 50 states. |
▪ | Recent cities covered by 5G on 600 MHz spectrum include Detroit, St. Louis and Columbus with the Bay Area added this week and more cities coming online soon. |
▪ | Over 50 million New T-Mobile devices have access to the 600 MHz LTE network and 5G access is being made available to Sprint customers. |
▪ | In total, T-Mobile controlled approximately 41 MHz of low-band spectrum (600 MHz and 700 MHz). Combining 600 MHz and 700 MHz spectrum, we have deployed 4G LTE in low-band spectrum to 318 million POPs. |
▪ | In June 2019, T-Mobile first lit up its 5G network using high-band mmWave spectrum. The 5G network on mmWave spectrum has been rolled out in parts of seven cities. |
▪ | In December 2019, T-Mobile launched America’s first nationwide 5G network, including prepaid 5G with Metro by T-Mobile, on 600 MHz spectrum. |
▪ | T-Mobile’s 5G network covers more than 65% of the US population in almost 6,000 cities and towns across more than 1 million square miles. |

▪ | Today, there are seven different smartphones across different price points compatible with 5G, including the OnePlus 8 5G released on April 29th, with more expected this year. |
▪ | T-Mobile continues to expand its coverage breadth and covered 327 million people at the end of Q1 2020. |
▪ | At the end of Q1 2020, T-Mobile had equipment deployed on approximately 67,000 macro cell sites and 26,000 small cell/distributed antenna system sites. |
▪ | T-Mobile added 1,600 sites to its 5G footprint in Q1 2020 and has further accelerated that pace by adding 1,000 sites in April. |
▪ | VoLTE comprised 91% of total voice calls in Q1 2020, up from 90% in Q4 2019 and 88% in Q1 2019. |
▪ | LAA has been deployed to 31 cities. |
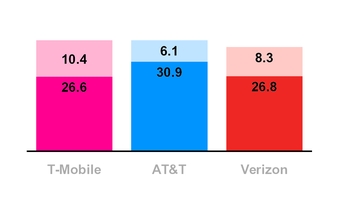
▪ | Based on data from Opensignal for Q1 2020, T-Mobile’s average LTE download speed was 26.6 Mbps, compared to AT&T at 30.9 Mbps, and Verizon at 26.8 Mbps. |
▪ | Based on data from Opensignal for Q1 2020, T-Mobile’s average LTE upload speed was 10.4 Mbps, compared to Verizon at 8.3 Mbps and AT&T at 6.1 Mbps. |
Devices Sold or Leased | |||||
(in million units) | |||||
Q1 2019 | Q4 2019 | Q1 2020 | |||
Total Company | |||||
Phones | 7.4 | 8.3 | 6.4 | ||
Mobile broadband and IoT devices | 0.6 | 0.8 | 0.8 | ||
Total Company | 8.0 | 9.1 | 7.2 | ||

▪ | Total devices sold or leased were 7.2 million units in Q1 2020, compared to 9.1 million units in Q4 2019 and 8.0 million units in Q1 2019. |
▪ | Total phones (smartphones and non-smartphones) sold or leased were 6.4 million units in Q1 2020, compared to 8.3 million units in Q4 2019 and 7.4 million units in Q1 2019. |
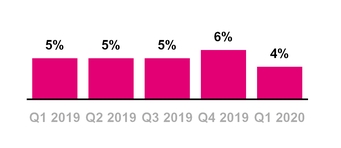
▪ | The branded postpaid upgrade rate was approximately 4% in Q1 2020, down sequentially from 6% in Q4 2019 and down from 5% in Q1 2019. |
▪ | Sequentially and year-over-year, total phones sold or leased and the branded postpaid upgrade rate were impacted by reduced demand from social distancing rules and retail store closures arising from COVID-19. Sequentially, total phone sold or leased and the branded postpaid upgrade rate were also impacted by seasonality. |


▪ | T-Mobile provided $1.44 billion in gross EIP device financing to its customers in Q1 2020, down 35.6% from $2.24 billion in Q4 2019 and down 17.3% from $1.74 billion in Q1 2019. |
▪ | Sequentially, the decrease was primarily due to lower EIP unit sales driven by reduced demand from social distancing rules and retail store closures from the impact of COVID-19 and seasonality. |
▪ | Year-over-year, the decrease was primarily due to lower EIP unit sales driven by reduced demand from social distancing rules and retail store closures from the impact of COVID-19. |
▪ | Customers on T-Mobile plans had associated EIP billings of $1.79 billion in Q1 2020, up 1.6% from $1.76 billion in Q4 2019 and up 7.6% from $1.66 billion in Q1 2019. EIP billings include prepayments and adjustments. |
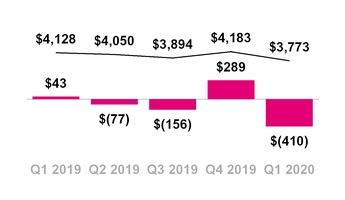
▪ | Total EIP receivables, net of imputed discount and allowances for credit losses, were $3.77 billion at the end of Q1 2020, compared to $4.18 billion at the end of Q4 2019 and $4.13 billion at the end of Q1 2019. |
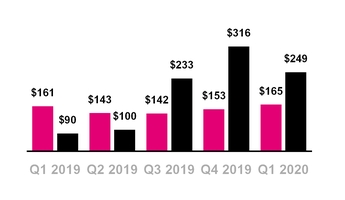
▪ | Leased devices transferred to property and equipment from inventory, net, was $249 million in Q1 2020, compared to $316 million in Q4 2019 and $90 million in Q1 2019. |
▪ | Sequentially, the decrease was primarily due to a lower number of devices leased driven by seasonality and reduced demand from social distancing rules and retail store closures from the impact of COVID-19. |
▪ | Year-over-year, the increase was primarily due to a higher number of devices leased driven by expansion of our leasing program to include more devices across various price points. |
▪ | Depreciation expense associated with leased devices was $163 million in Q1 2020, compared to $126 million in Q4 2019 and $184 million in Q1 2019. |
▪ | Leased devices included in property and equipment, net was $819 million at the end of Q1 2020, compared to $732 million at the end of Q4 2019 and $442 million at the end of Q1 2019. |
▪ | Lease revenues were $165 million in Q1 2020, compared to $153 million in Q4 2019 and $161 million in Q1 2019. |

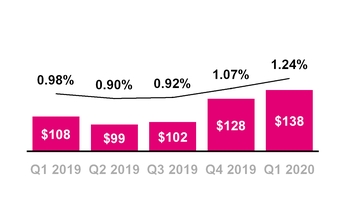
▪ | Total bad debt expense and losses from sales of receivables was $138 million in Q1 2020, compared to $128 million in Q4 2019 and $108 million in Q1 2019. |
▪ | As a percentage of total revenues, total bad debt expense and losses from sales of receivables was 1.24% in Q1 2020, compared to 1.07% in Q4 2019 and 0.98% in Q1 2019. |
▪ | Sequentially, total bad debt expense and losses from sales of receivables increased by $10 million. As a percentage of Total revenues, bad debt expense and losses from sales of receivables increased by 17 basis points. |
▪ | Year-over-year, total bad debt expense and losses from sales of receivables increased by $30 million. As a percentage of Total revenues, bad debt expense and losses from sales of receivables increased by 26 basis points. |
▪ | Sequentially and year-over-year, total bad debt expense and losses from sales of receivables increased due to the recording of estimated losses associated with the adoption of the new credit loss standard including an incremental $30 million for the estimated macro-economic impacts of COVID-19. See T-Mobile’s Quarterly Report on Form 10-Q for the quarterly period ended March 31, 2020, for additional details regarding the adoption of the new credit standard. |
▪ | Including the EIP receivables sold, total EIP receivables classified as Prime were 53% of total EIP receivables at the end of Q1 2020, compared to 53% at the end of Q4 2019 and 52% at the end of Q1 2019. |


▪ | Branded postpaid ARPA was $129.47 at the end of Q1 2020, down 0.7% compared to $130.39 at the end of Q4 2019 and essentially flat compared to $129.77 at the end of Q1 2019. |
▪ | Sequentially, the decrease was primarily due to an increase in our promotional activities, including the ongoing growth in our Netflix offering, which totaled $1.58 in Q1 2020 and decreased branded postpaid ARPA by $0.38 compared to Q4 2019, and a reduction in certain non-recurring charges including the impact of credits for restore fees, international calls and data usage in connection with our response to COVID-19, partially offset by an increase in average customers per account due to the growing success of wearables, specifically the Apple Watch, and other connected devices. |
▪ | Year-over-year, branded postpaid ARPA was primarily impacted by an increase in average customers per account due to the growing success of wearables, specifically the Apple Watch, and other connected devices, offset by an increase in our promotional activities, including the ongoing growth in our Netflix offering, which totaled $1.58 in Q1 2020 and decreased branded postpaid ARPA by $0.23 compared to Q1 2019, a reduction in regulatory program revenues from the continued adoption of tax inclusive plans and a reduction in certain non-recurring charges including the impact of credits for restore fees, international calls and data usage in connection with our response to COVID-19. |
▪ | Branded postpaid phone ARPU was $45.80 in Q1 2020, essentially flat compared to Q4 2019 and down 0.6% from $46.07 in Q1 2019. |
▪ | Sequentially, branded postpaid phone ARPU was primarily impacted by a decrease in the discount allocation to branded postpaid phone revenue within contracts that involve a mobile internet line, offset by an increase in our promotional activities, including the ongoing growth in our Netflix offering, which totaled $0.59 in Q1 2020 and decreased branded postpaid phone ARPU by $0.14 compared to Q4 2019, lower premium services revenue and a reduction in certain non-recurring charges including the impact of credits for restore fees, international |

▪ | Year-over-year, the decrease was primarily due to an increase in our promotional activities, including the ongoing growth in our Netflix offering, which totaled $0.59 in Q1 2020 and decreased branded postpaid phone ARPU by $0.08 compared to Q1 2019, a reduction in regulatory program revenues from the continued adoption of tax inclusive plans and a reduction in certain non-recurring charges including the impact of credits for restore fees, international calls and data usage in connection with our response to COVID-19, partially offset by a decrease in the discount allocation to branded postpaid phone revenue within contracts that involve a mobile internet line and the growing success of new customer segments and rate plans. |
▪ | Branded prepaid ARPU was $38.11 in Q1 2020, down 1.1% from $38.54 in Q4 2019 and up 1.2% from $37.65 in Q1 2019. |
▪ | Sequentially, the decrease was primarily due to dilution from promotional activity and certain one-time tax benefits in Q4 2019, partially offset by an increase in certain non-recurring charges. |
▪ | Year-over-year, the increase was primarily due to the removal of certain branded prepaid customers associated with products now offered and distributed by a current MVNO partner as those customers had lower ARPU. This increase was partially offset by dilution from promotional activity, a reduction in certain non-recurring charges and the growth in our Amazon Prime offering which impacted branded prepaid ARPU by $0.40 in Q1 2020 and decreased branded prepaid ARPU by $0.08 compared to Q1 2019. |


▪ | T-Mobile again led the industry in year-over-year Service revenue percentage growth in Q1 2020. This marks the 24th consecutive quarter that T-Mobile led the industry in this measure. |
▪ | Service revenues were $8.71 billion in Q1 2020, flat compared to $8.71 billion in Q4 2019 and up 5.3% from $8.28 billion in Q1 2019. |
▪ | Sequentially, Service revenues were essentially flat, primarily due to an increase in Branded postpaid service revenues, driven by an increase in average branded postpaid phone and other subscribers, offset by lower Prepaid, Roaming and Wholesale revenues. |
▪ | Year-over-year, the increase was primarily due to a 7.2% increase in Branded postpaid service revenues, driven by an 8.2% increase in average branded postpaid phone customers, primarily from growth in our customer base driven by the continued growth in existing and Greenfield markets, including the growing success of new customer segments and rate plans such as Unlimited 55+, Military, Business and Essentials, partially offset by a 1% decrease in branded postpaid phone ARPU. |
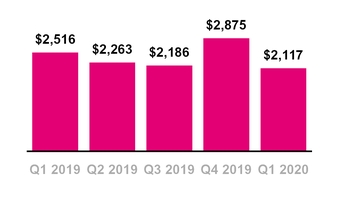
▪ | Equipment revenues were $2.12 billion in Q1 2020, down 26.4% from $2.88 billion in Q4 2019 and down 15.9% from $2.52 billion in Q1 2019. Equipment revenues in Q1 2020 were comprised of lease revenues of $165 million and non-lease revenues of $1.95 billion. |
▪ | Sequentially, the decrease was primarily due to a 21% decrease in the number of devices sold, excluding purchased leased devices, primarily due to reduced demand from social distancing rules and retail store closures arising from COVID-19, as well as seasonality, and lower average revenue per device sold, primarily due to a decrease in the high-end device mix. |

▪ | Year-over-year, the decrease was primarily due to a 15% decrease in the number of devices sold, excluding purchased leased devices, primarily due to reduced demand and retail store closures arising from COVID-19 and lower average revenue per device sold, primarily due to a decrease in the high-end device mix and higher promotions. |
▪ | Total revenues were a Q1 record-high $11.11 billion in Q1 2020, down 6.4% from $11.88 billion in Q4 2019 and a slight increase compared to $11.08 billion in Q1 2019. |
▪ | Sequentially, the decrease was primarily due to a decrease in Equipment revenues. |
▪ | Year-over-year, total revenues were impacted by growth in Service revenues, offset by a decrease in Equipment revenues. |


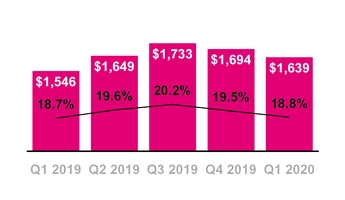
▪ | Cost of services, exclusive of depreciation and amortization, was $1.64 billion in Q1 2020, down 3.2% from $1.69 billion in Q4 2019 and up 6.0% from $1.55 billion in Q1 2019. |
▪ | Sequentially, the decrease was primarily due to a reduction in certain non-recurring costs for network expansion, partially offset by expenses associated with new and modified leases due to network expansion and the launch of our 5G network and higher employee-related costs to support our network expansion. |
▪ | As a percentage of Service revenues, Cost of Services, exclusive of D&A, decreased by 70 basis points sequentially. |
▪ | Year-over-year, the increase was primarily due to expenses associated with new and modified leases due to network expansion and the launch of our 5G network and higher employee-related costs to support our network expansion. |
▪ | As a percentage of Service revenues, Cost of services, exclusive of D&A, increased by 10 basis points year-over-year. |
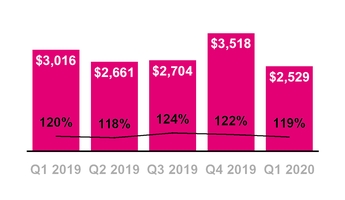
▪ | Cost of equipment sales, exclusive of D&A, was $2.53 billion in Q1 2020, down 28.1% from $3.52 billion in Q4 2019 and down 16.1% from $3.02 billion in Q1 2019. |
▪ | Sequentially, the decrease was primarily due to a 21% decrease in the number of devices sold, excluding purchased leased devices, primarily due to reduced demand from social distancing rules and retail store closures from the impact of COVID-19, as well as seasonality, and lower average cost per device sold primarily due to a decrease in the high-end device mix. |
▪ | Year-over-year, the decrease was primarily due to a 15% decrease in the number of devices sold, excluding purchased leased devices, due to reduced demand from social distancing rules and retail store closures arising from COVID-19 and lower average cost per device sold primarily due to a decrease in the high-end device mix. |


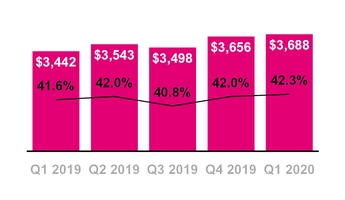
▪ | SG&A expense was $3.69 billion in Q1 2020, up 0.9% from $3.66 billion in Q4 2019 and up 7.1% from $3.44 billion in Q1 2019. |
▪ | Sequentially, the slight increase was primarily due to higher employee-related costs, higher legal-related expenses including from recording an estimated accrual associated with the FCC Notice of Apparent Liability, higher bad debt expense primarily due to the recording of estimated losses associated with the adoption of the new credit loss standard including an incremental $30 million for the estimated macro-economic impacts of COVID-19 and higher commission expense resulting from an increase of $16 million in amortization expense related to commission costs that were capitalized beginning upon the adoption of ASC 606 on January 1, 2018, partially offset by lower advertising expenses due to a seasonal increase in Q4 2019. SG&A expense included $117 million of supplemental employee payroll, third-party commissions and cleaning-related COVID-19 costs in Q1 2020. |
▪ | As a percentage of Service revenues, SG&A expense increased 30 basis points sequentially. |
▪ | Merger-related costs were $143 million in Q1 2020, compared to $126 million in Q4 2019. Supplemental employee payroll, third-party commissions and cleaning-related COVID-19 costs were $117 million in Q1 2020. There were no COVID-19-related costs in Q4 2019. As a percentage of Service revenues, excluding Merger-related costs and COVID-19-related costs, SG&A expense decreased 120 basis points sequentially. |
▪ | Year-over-year, the increase was primarily due to higher employee-related costs, higher commission expense resulting from an increase of $89 million in amortization expense related to commission costs that were capitalized beginning upon the adoption of ASC 606 on January 1, 2018, higher legal-related expenses including from recording an estimated accrual associated with the FCC Notice of Apparent Liability, higher bad debt expense primarily due to the recording of estimated losses associated with the adoption of the new credit loss standard including an incremental $30 million for the estimated macro-economic impacts of COVID-19 and an increase in Merger-related costs, partially offset by lower advertising costs. SG&A expense included $117 million of supplemental employee |

▪ | As a percentage of Service revenues, SG&A expense increased 70 basis points year-over-year. |
▪ | Merger-related costs were $143 million in Q1 2020, compared to $113 million in Q1 2019. Supplemental employee payroll, third-party commissions and cleaning-related COVID-19 costs were $117 million in Q1 2020. There were no COVID-19-related costs in Q1 2019. As a percentage of Service revenues, excluding Merger-related costs and COVID-19-related costs, SG&A expense decreased 90 basis points year-over-year. |
▪ | D&A was $1.72 billion in Q1 2020, down 3.3% from $1.78 billion in Q4 2019 and up 7.4% from $1.60 billion in Q1 2019. |
▪ | D&A related to leased devices was $163 million in Q1 2020, compared to $126 million in Q4 2019 and $184 million in Q1 2019. |
▪ | Non-lease-related D&A was $1.56 billion in Q1 2020, compared to $1.65 billion in Q4 2019 and $1.42 billion in Q1 2019. |
▪ | Sequentially, the decrease was primarily due to higher costs in Q4 2019 related to the acceleration of depreciation for certain assets due to our accelerated 600 MHz build-out and 5G nationwide launch, partially offset by higher depreciation on leased devices. |
▪ | Year-over-year, the increase was primarily from network expansion, including the continued deployment of low band spectrum, including 600 MHz, and the nationwide launch of our 5G network. |


▪ | Net income was $951 million in Q1 2020, up 26.6% from $751 million in Q4 2019 and up 4.7% from $908 million in Q1 2019. EPS was $1.10 in Q1 2020, up from $0.87 in Q4 2019 and up from $1.06 in Q1 2019. |
▪ | Sequentially, the increases in Net income and EPS were primarily due to higher Operating income, partially offset by higher Income tax expense. Net income and EPS were impacted by the following: |
◦ | Merger-related costs, net of tax, for Q1 2020 of $117 million and $0.14, respectively, compared to $105 million and $0.12 in Q4 2019, respectively. |
◦ | Supplemental employee payroll, third-party commissions and cleaning-related COVID-19 costs, net of tax, for Q1 2020 of $86 million and $0.10, respectively. |
◦ | The sequential impact from commission costs capitalized and amortized, beginning upon the adoption of ASC 606 on January 1, 2018, net of tax, reduced Net income and EPS by $12 million and $0.01, respectively. |
▪ | Year-over-year, the increases in Net income and EPS were primarily due to higher Operating income, partially offset by higher Income tax expense. Net income and EPS were impacted by the following: |
◦ | Merger-related costs, net of tax, for Q1 2020 of $117 million and $0.14, respectively, compared to $93 million and $0.11 in Q1 2019, respectively. |
◦ | Supplemental employee payroll, third-party commissions and cleaning-related COVID-19 costs, net of tax, for Q1 2020 of $86 million and $0.10, respectively. |
◦ | The year-over-year impact from commission costs capitalized and amortized, beginning upon the adoption of ASC 606 on January 1, 2018, net of tax, reduced Net income and EPS by $66 million and $0.08, respectively. |
▪ | Net income margin was 10.9% in Q1 2020, compared to 8.6% in Q4 2019 and 11.0% in Q1 2019. Net income margin is calculated as Net income divided by Service revenues. |

▪ | Adjusted EBITDA was $3.67 billion in Q1 2020, up 13.0% from $3.24 billion in Q4 2019 and up 11.6% from $3.28 billion in Q1 2019. |
▪ | Sequentially, the increase in Adjusted EBITDA was primarily due to lower net losses on equipment sales, lower SG&A expenses, excluding Merger-related costs and supplemental employee payroll, third-party commissions and cleaning-related COVID-19 costs, and lower Cost of services expenses. |
▪ | Year-over-year, the increase in Adjusted EBITDA was primarily due to higher Service revenues and lower net losses on equipment sales, partially offset by higher Cost of services expenses and higher SG&A expenses, excluding Merger-related costs and supplemental employee payroll, third-party commissions and cleaning-related COVID-19 costs. |
▪ | The impact from commission costs capitalized and amortized, beginning upon the adoption of ASC 606 on January 1, 2018, reduced Adjusted EBITDA by $16 million sequentially and $89 million year-over-year. |
▪ | Adjusted EBITDA excludes Merger-related costs of $143 million in Q1 2020 compared to $126 million in Q4 2019 and $113 million in Q1 2019. |
▪ | Adjusted EBITDA margin was 42.1% in Q1 2020, compared to 37.2% in Q4 2019 and 39.7% in Q1 2019. Adjusted EBITDA margin is calculated as Adjusted EBITDA divided by Service revenues. |


▪ | Cash purchases of property and equipment were $1.75 billion in Q1 2020, compared to $1.16 billion in Q4 2019 and $1.93 billion in Q1 2019. |
▪ | Sequentially, the increase was primarily due to fluctuations in the timing of expenditures for improvements to network capacity, including the continued build-out of our 5G network, which are typically front-loaded during the year. |
▪ | Year-over-year, the decrease was primarily due to higher expenditures in Q1 2019 related to laying the initial groundwork for 5G. |
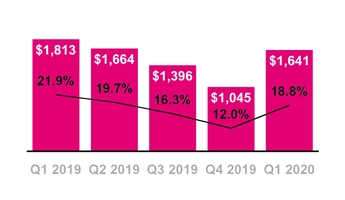
▪ | Cash purchases of property and equipment, excluding capitalized interest, were $1.64 billion in Q1 2020, compared to $1.05 billion in Q4 2019 and $1.81 billion in Q1 2019. |
▪ | Capitalized interest included in cash purchases of property and equipment was $112 million in Q1 2020, compared to $112 million in Q4 2019 and $118 million in Q1 2019. |

▪ | Net cash provided by operating activities was $1.62 billion in Q1 2020, compared to $1.54 billion in Q4 2019 and $1.39 billion in Q1 2019. |
▪ | Sequentially, the increase was due to higher Net income, adjusted for non-cash income and expense, partially offset by higher net cash outflows from changes in working capital. |
◦ | The change in working capital was primarily due to changes in Accounts payable and accrued liabilities, Short and long-term operating lease liabilities and Other current and long-term assets, partially offset by lower use from Equipment installment plan receivables and Accounts receivable. |
▪ | Year-over-year, the increase was due to higher Net income, adjusted for non-cash income and expense. |
◦ | The net change in working capital was relatively neutral, primarily due to changes in Accounts payable and accrued liabilities, Inventories, and Short and long-term operating lease liabilities, offset by lower use from Accounts receivable and Equipment installment plan receivables. |
◦ | Year-over-year, Net cash provided by operating activities benefited from improvements in the contractual terms of factoring agreements which led to an accounting geography change, offset by a reduction in proceeds related to our deferred purchase price from securitization transactions within Net cash used in investing activities. |


▪ | Net cash used in investing activities was an outflow of $1.58 billion in Q1 2020, compared to an outflow of $887 million in Q4 2019 and an outflow of $966 million in Q1 2019. |
▪ | Sequentially, the increase in cash outflows was primarily due to higher purchases of property and equipment, including capitalized interest and lower proceeds related to our deferred purchase price from securitization transactions, partially offset by lower net cash transfers related to derivatives under collateral exchange agreements. |
▪ | Year-over-year, the increase in cash outflows was primarily due to net cash transfers related to derivatives under collateral exchange agreements in Q1 2020 and lower proceeds related to our deferred purchase price from securitization transactions, driven by improvements in the contractual terms of factoring agreements which led to an accounting geography change, partially offset by lower purchases of property and equipment, including capitalized interest, and lower purchases of spectrum licenses and other intangible assets, including deposits. |
▪ | Net cash used in financing activities was $453 million in Q1 2020, compared to $775 million in Q4 2019 and $190 million in Q1 2019. |
▪ | Sequentially, the decrease in cash outflows was primarily due to lower repayments of short-term debt for purchases of inventory, property and equipment, partially offset by higher tax withholdings on share-based awards. |
▪ | Year-over-year, the increase in cash outflows was primarily due to higher repayments of financing lease obligations and higher tax withholdings on share-based awards. |


▪ | Free Cash Flow was $732 million in Q1 2020, compared to $1.40 billion in Q4 2019 and $618 million in Q1 2019. |
▪ | Sequentially, the decrease was primarily due to higher cash purchases of property and equipment, including capitalized interest, and lower proceeds related to our deferred purchase price from securitization transactions, partially offset by higher Net cash provided by operating activities. |
▪ | Year-over-year, the increase was due to higher Net cash provided by operating activities, as described above and lower cash purchases of property and equipment, including capitalized interest, partially offset by lower proceeds related to our deferred purchase price from securitization transactions. |
▪ | The impact of payments for Merger-related costs on Free Cash Flow was $161 million in Q1 2020 compared to $133 million in Q4 2019 and $34 million in Q1 2019. Free Cash Flow, excluding payments for Merger-related costs, was $893 million in Q1 2020. |
▪ | Free Cash Flow in Q1 2020 includes $46 million in cash received in settlement of interest rate swaps. There were no cash settlements of interest rate swaps in 2019. |
▪ | Free Cash Flow in Q1 2020 includes $12 million in payments for supplemental employee payroll, third-party commissions and cleaning-related COVID-19 costs. There were no payments related to COVID-19 in Q1 2019. |

▪ | Total debt, excluding tower obligations, at the end of Q1 2020 was $27.14 billion and was comprised of the following: |
▪ | $2.00 billion of Short-term debt to affiliates, |
▪ | $10.96 billion of Long-term debt, |
▪ | $11.99 billion of Long-term debt to affiliates, |
▪ | $918 million of Short-term financing lease liabilities, and |
▪ | $1.28 billion of Financing lease liabilities. |
▪ | Net debt, excluding tower obligations, at the end of Q1 2020 was $26.03 billion. |
▪ | The ratio of net debt, excluding tower obligations, to Net income for the trailing last twelve months (“LTM”) period was 7.4x at the end of Q1 2020, compared to 7.4x at the end of Q4 2019 and 8.5x at the end of Q1 2019. |
▪ | The ratio of net debt, excluding tower obligations, to Adjusted EBITDA for the trailing LTM period was 1.9x at the end of Q1 2020, compared to 1.9x at the end of Q4 2019 and 2.1x at the end of Q1 2019. |
▪ | Subsequent to March 31, 2020, on April 1, 2020, we closed our Merger with Sprint. In connection with the closing of the Merger, we completed the following debt transactions: |
▪ | Drew on our $19 billion New Secured Bridge Loan Facility and our $4 billion New Secured Term Loan Facility; |
▪ | Repaid our $4 billion Incremental Term Loan Facility with DT; |
▪ | Repurchased from DT our $2 billion 5.300% Senior Notes due 2021 and $2 billion 6.000% Senior Notes due 2024; |
▪ | Redeemed certain debt of Sprint and its subsidiaries with an aggregate outstanding balance of $9.17 billion; |
▪ | Entered into a $4 billion New Revolving Credit Facility; and |
▪ | Assumed Sprint debt with an aggregate principal balance of $26.51 billion. |
▪ | Subsequent to March 31, 2020, on April 9, 2020, we issued Senior Secured Notes in an aggregate amount of $19 billion. The proceeds were used to repay the $19 billion New Secured Bridge Loan Facility. |
▪ | See T-Mobile’s Quarterly Report on Form 10-Q for the quarterly period ended March 31, 2020, for additional details. |
Q2 2020 Guidance Outlook | ||||
Q2 2020 | ||||
Branded Postpaid Net Adds | — | 150,000 | ||
Adjusted EBITDA ($ in billions) | $6.2 | $6.5 | ||
Cash purchases of prop and equip excl Cap int ($ in billions) | $2.2 | $2.4 | ||
Net cash provided by operating activities ($ in billions) | $0.7 | $1.0 | ||
Free Cash Flow ($ in billions) | $1.3 | $1.5 | ||
▪ | Due to uncertainty around the ongoing impact of COVID-19, purchase price accounting and accounting policy alignment work and conforming legacy Sprint key performance indicators to T-Mobile policies, our guidance for the New T-Mobile is for Q2 2020 only. We expect to provide guidance for the remainder of 2020 on our second quarter earnings call. |
▪ | Branded postpaid net customer additions: Branded postpaid net customer additions for Q2 2020 are expected to be 0 to 150,000. This reflects the ongoing impact of COVID-19 including retail store closures and lower gross adds, partially offset by lower churn. |
▪ | Net Income: We are not able to forecast Net income on a forward-looking basis without unreasonable efforts due to the high variability and difficulty in predicting certain items that affect GAAP Net income, including, but not limited to, Income tax expense, stock-based compensation expense and Interest expense. Adjusted EBITDA should not be used to predict Net income as the difference between the two measures is variable. |
▪ | Adjusted EBITDA: For Q2 2020, Adjusted EBITDA is expected to be in the range of $6.2 to $6.5 billion. This target includes expected leasing revenues of $1.3 billion to $1.4 billion. |
▪ | Capital expenditures: Cash purchases of property and equipment for Q2 2020, including capitalized interest of approximately $100 million, are expected to be in the range of $2.3 to $2.5 billion. |
▪ | Merger-related costs: In Q2 2020, Merger-related costs are expected to be $500 to $600 million before taxes. These costs are excluded from Adjusted EBITDA but will impact Net income and cash flows. These amounts are before any incremental opportunities to accelerate synergy realization through a potential pull forward of additional spending into Q2, such as severance related restructuring, store rationalization and network build expenses. |
▪ | COVID-19 costs: In Q2 2020, COVID-19-related costs are expected to be $450 to $550 million before taxes. These costs are excluded from Adjusted EBITDA but will impact Net income and cash flows. |
▪ | Net cash provided by operating activities: Net cash provided by operating activities, including payments for Merger-related costs, COVID-19-related costs and $2.3 billion in gross payments for the settlement of interest rate swaps is expected to be in the range of $700 million to $1.0 billion in Q2 2020. |
▪ | Free Cash Flow: Free Cash Flow, including payments for Merger-related costs and COVID-19-related costs, but excluding $2.3 billion in gross payments for the settlement of interest rate swaps, is expected to be in the range of $1.3 to $1.5 billion in Q2 2020. Free cash flow guidance does not assume any material net cash inflows from securitization in 2020. |
▪ | We will continue to monitor developments regarding the COVID-19 pandemic and evaluate the appropriate steps we need to take as a business to align with guidelines from state, local and federal government agencies to do what is best for our employees and customers. We expect our business, liquidity, financial condition, and operating results to continue to be adversely impacted by the COVID-19 pandemic for the remainder of 2020 and potentially thereafter. The extent to which the COVID-19 pandemic impacts our business, operations and financial results will depend on numerous future developments that we are not be able to predict at this time, including the duration and scope of the pandemic, the success of governmental, business and individual actions that have been and continue to be taken in response to the pandemic, and the impact on economic activity from the pandemic and actions taken in response. The full impact of COVID-19 on our business is difficult to predict and is subject to uncertainty, potential impacts include: |
▪ | Lower net customer additions, equipment revenues and cost of equipment sales, and higher bad debt expense; |
▪ | Continued costs to protect and support our employees and customers, which will increase from the costs incurred during the first quarter of 2020; and |
▪ | Potential disruptions in our supply chains. |
▪ | In addition, we are in the process of re-evaluating our spending across various operating expenses. We are taking actions to adjust our spending given the significant uncertainty around the magnitude and duration of any recessionary impacts arising from the COVID-19 pandemic. |
▪ | The uncertainties related to COVID-19 may also adversely impact the Q2 guidance we provided. |
▪ | 7th Annual MoffettNathanson Media and Communications Summit, May 11-12, 2020, Virtual meetings |
▪ | J.P. Morgan Global Technology, Media and Communications Conference, May 12-14, 2020, Virtual meetings |
▪ | Wells Fargo 5G Conference, June 18, 2020, Virtual meetings |
(in millions, except share and per share amounts) | March 31, 2020 | December 31, 2019 | |||||
Assets | |||||||
Current assets | |||||||
Cash and cash equivalents | $ | 1,112 | $ | 1,528 | |||
Accounts receivable, net of allowance for credit losses of $69 and $61 | 1,836 | 1,888 | |||||
Equipment installment plan receivables, net of allowance for credit losses and imputed discount of $386 and $333 | 2,406 | 2,600 | |||||
Accounts receivable from affiliates | 26 | 20 | |||||
Inventory | 1,225 | 964 | |||||
Other current assets | 2,882 | 2,305 | |||||
Total current assets | 9,487 | 9,305 | |||||
Property and equipment, net | 22,149 | 21,984 | |||||
Operating lease right-of-use assets | 10,956 | 10,933 | |||||
Financing lease right-of-use assets | 2,749 | 2,715 | |||||
Goodwill | 1,930 | 1,930 | |||||
Spectrum licenses | 36,471 | 36,465 | |||||
Other intangible assets, net | 91 | 115 | |||||
Equipment installment plan receivables due after one year, net of allowance for credit losses and imputed discount of $83 and $66 | 1,367 | 1,583 | |||||
Other assets | 2,026 | 1,891 | |||||
Total assets | $ | 87,226 | $ | 86,921 | |||
Liabilities and Stockholders' Equity | |||||||
Current liabilities | |||||||
Accounts payable and accrued liabilities | $ | 6,003 | $ | 6,746 | |||
Payables to affiliates | 228 | 187 | |||||
Short-term debt | — | 25 | |||||
Short-term debt to affiliates | 2,000 | — | |||||
Deferred revenue | 619 | 631 | |||||
Short-term operating lease liabilities | 2,187 | 2,287 | |||||
Short-term financing lease liabilities | 918 | 957 | |||||
Other current liabilities | 2,801 | 1,673 | |||||
Total current liabilities | 14,756 | 12,506 | |||||
Long-term debt | 10,959 | 10,958 | |||||
Long-term debt to affiliates | 11,987 | 13,986 | |||||
Tower obligations | 2,230 | 2,236 | |||||
Deferred tax liabilities | 5,618 | 5,607 | |||||
Operating lease liabilities | 10,464 | 10,539 | |||||
Financing lease liabilities | 1,276 | 1,346 | |||||
Other long-term liabilities | 959 | 954 | |||||
Total long-term liabilities | 43,493 | 45,626 | |||||
Commitments and contingencies | |||||||
Stockholders' equity | |||||||
Common Stock, par value $0.00001 per share, 1,000,000,000 shares authorized; 862,636,935 and 858,418,615 shares issued, 861,128,106 and 856,905,400 shares outstanding | — | — | |||||
Additional paid-in capital | 38,597 | 38,498 | |||||
Treasury stock, at cost, 1,508,829 and 1,513,215 shares issued | (11 | ) | (8 | ) | |||
Accumulated other comprehensive loss | (1,660 | ) | (868 | ) | |||
Accumulated deficit | (7,949 | ) | (8,833 | ) | |||
Total stockholders' equity | 28,977 | 28,789 | |||||
Total liabilities and stockholders' equity | $ | 87,226 | $ | 86,921 | |||
Three Months Ended | |||||||||||
(in millions, except share and per share amounts) | March 31, 2020 | December 31, 2019 | March 31, 2019 | ||||||||
Revenues | |||||||||||
Branded postpaid revenues | $ | 5,887 | $ | 5,821 | $ | 5,493 | |||||
Branded prepaid revenues | 2,373 | 2,393 | 2,386 | ||||||||
Wholesale revenues | 325 | 341 | 304 | ||||||||
Roaming and other service revenues | 128 | 153 | 94 | ||||||||
Total service revenues | 8,713 | 8,708 | 8,277 | ||||||||
Equipment revenues | 2,117 | 2,875 | 2,516 | ||||||||
Other revenues | 283 | 295 | 287 | ||||||||
Total revenues | 11,113 | 11,878 | 11,080 | ||||||||
Operating expenses | |||||||||||
Cost of services, exclusive of depreciation and amortization shown separately below | 1,639 | 1,694 | 1,546 | ||||||||
Cost of equipment sales, exclusive of depreciation and amortization shown separately below | 2,529 | 3,518 | 3,016 | ||||||||
Selling, general and administrative | 3,688 | 3,656 | 3,442 | ||||||||
Depreciation and amortization | 1,718 | 1,776 | 1,600 | ||||||||
Total operating expenses | 9,574 | 10,644 | 9,604 | ||||||||
Operating income | 1,539 | 1,234 | 1,476 | ||||||||
Other income (expense) | |||||||||||
Interest expense | (185 | ) | (182 | ) | (179 | ) | |||||
Interest expense to affiliates | (99 | ) | (98 | ) | (109 | ) | |||||
Interest income | 12 | 7 | 8 | ||||||||
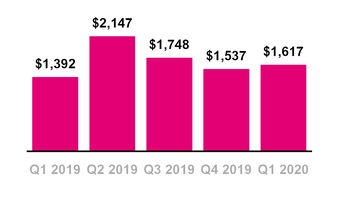
Other income (expense), net | (10 | ) | 4 | 7 | |||||||
Total other expense, net | (282 | ) | (269 | ) | (273 | ) | |||||
Income before income taxes | 1,257 | 965 | 1,203 | ||||||||
Income tax expense | (306 | ) | (214 | ) | (295 | ) | |||||
Net income | $ | 951 | $ | 751 | $ | 908 | |||||
Other comprehensive income (loss), net of tax | |||||||||||
Unrealized gain (loss) on cash flow hedges, net of tax effect of ($276), $69 and ($66) | (792 | ) | 202 | (189 | ) | ||||||
Other comprehensive income (loss) | (792 | ) | 202 | (189 | ) | ||||||
Total comprehensive income | $ | 159 | $ | 953 | $ | 719 | |||||
Earnings per share | |||||||||||
Basic | $ | 1.11 | $ | 0.88 | $ | 1.07 | |||||
Diluted | $ | 1.10 | $ | 0.87 | $ | 1.06 | |||||
Weighted average shares outstanding | |||||||||||
Basic | 858,148,284 | 856,294,467 | 851,223,498 | ||||||||
Diluted | 865,998,532 | 864,158,739 | 858,643,481 | ||||||||
Three Months Ended | |||||||||||
(in millions) | March 31, 2020 | December 31, 2019 | March 31, 2019 | ||||||||
Operating activities | |||||||||||
Net income | $ | 951 | $ | 751 | $ | 908 | |||||
Adjustments to reconcile net income to net cash provided by operating activities | |||||||||||
Depreciation and amortization | 1,718 | 1,776 | 1,600 | ||||||||
Stock-based compensation expense | 138 | 129 | 110 | ||||||||
Deferred income tax expense | 310 | 242 | 288 | ||||||||
Bad debt expense | 113 | 89 | 73 | ||||||||
Losses from sales of receivables | 25 | 39 | 35 | ||||||||
Changes in operating assets and liabilities | |||||||||||
Accounts receivable | (748 | ) | (1,016 | ) | (1,143 | ) | |||||
Equipment installment plan receivables | 69 | (537 | ) | (250 | ) | ||||||
Inventories | (511 | ) | (478 | ) | (265 | ) | |||||
Operating lease right-of-use assets | 527 | 501 | 435 | ||||||||
Other current and long-term assets | 6 | 144 | (87 | ) | |||||||
Accounts payable and accrued liabilities | (405 | ) | 356 | 13 | |||||||
Short and long-term operating lease liabilities | (725 | ) | (539 | ) | (522 | ) | |||||
Other current and long-term liabilities | 79 | 8 | 121 | ||||||||
Other, net | 70 | 72 | 76 | ||||||||
Net cash provided by operating activities | 1,617 | 1,537 | 1,392 | ||||||||
Investing activities | |||||||||||
Purchases of property and equipment, including capitalized interest of ($112), ($112) and ($118) | (1,753 | ) | (1,157 | ) | (1,931 | ) | |||||
Purchases of spectrum licenses and other intangible assets, including deposits | (99 | ) | (104 | ) | (185 | ) | |||||
Proceeds from sales of tower sites | — | 38 | — | ||||||||
Proceeds related to beneficial interests in securitization transactions | 868 | 980 | 1,157 | ||||||||
Net cash related to derivative contracts under collateral exchange arrangements | (580 | ) | (632 | ) | — | ||||||
Other, net | (16 | ) | (12 | ) | (7 | ) | |||||
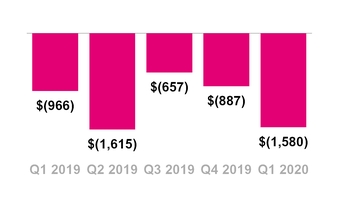
Net cash used in investing activities | (1,580 | ) | (887 | ) | (966 | ) | |||||
Financing activities | |||||||||||
Proceeds from borrowing on revolving credit facility | — | — | 885 | ||||||||
Repayments of revolving credit facility | — | — | (885 | ) | |||||||
Repayments of financing lease obligations | (282 | ) | (248 | ) | (86 | ) | |||||
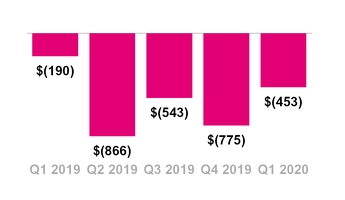
Repayments of short-term debt for purchases of inventory, property and equipment, net | (25 | ) | (475 | ) | — | ||||||
Tax withholdings on share-based awards | (141 | ) | (48 | ) | (100 | ) | |||||
Other, net | (5 | ) | (4 | ) | (4 | ) | |||||
Net cash used in financing activities | (453 | ) | (775 | ) | (190 | ) | |||||
Change in cash and cash equivalents | (416 | ) | (125 | ) | 236 | ||||||
Cash and cash equivalents | |||||||||||
Beginning of period | 1,528 | 1,653 | 1,203 | ||||||||
End of period | $ | 1,112 | $ | 1,528 | $ | 1,439 | |||||
Supplemental disclosure of cash flow information | |||||||||||
Interest payments, net of amounts capitalized | $ | 341 | $ | 216 | $ | 340 | |||||
Operating lease payments | 875 | 689 | 688 | ||||||||
Income tax payments | 24 | 11 | 32 | ||||||||
Non-cash investing and financing activities | |||||||||||
Non-cash beneficial interest obtained in exchange for securitized receivables | $ | 1,613 | $ | 1,647 | $ | 1,512 | |||||
Decrease in accounts payable for purchases of property and equipment | (301 | ) | (29 | ) | (333 | ) | |||||
Leased devices transferred from inventory to property and equipment | 309 | 394 | 147 | ||||||||
Returned leased devices transferred from property and equipment to inventory | (59 | ) | (78 | ) | (57 | ) | |||||
Short-term debt assumed for financing of property and equipment | — | 25 | 250 | ||||||||
Operating lease right-of-use assets obtained in exchange for lease obligations | 555 | 538 | 694 | ||||||||
Financing lease right-of-use assets obtained in exchange for lease obligations | 178 | 98 | 180 | ||||||||
Quarter | ||||||||||||||
(in thousands) | Q1 2019 | Q2 2019 | Q3 2019 | Q4 2019 | Q1 2020 | |||||||||
Customers, end of period | ||||||||||||||
Branded postpaid phone customers | 37,880 | 38,590 | 39,344 | 40,345 | 40,797 | |||||||||
Branded postpaid other customers | 5,658 | 6,056 | 6,376 | 6,689 | 7,014 | |||||||||
Total branded postpaid customers | 43,538 | 44,646 | 45,720 | 47,034 | 47,811 | |||||||||
Branded prepaid customers (1) | 21,206 | 21,337 | 20,783 | 20,860 | 20,732 | |||||||||
Total branded customers | 64,744 | 65,983 | 66,503 | 67,894 | 68,543 | |||||||||
Adjustment to branded prepaid customers (1) | — | — | (616 | ) | — | — | ||||||||
(1) | On July 18, 2019, we entered into an agreement whereby certain T-Mobile branded prepaid products will now be offered and distributed by a current MVNO partner. As a result, we included a base adjustment in Q3 2019 to reduce branded prepaid customers by 616,000. |
Quarter | ||||||||||||||
(in thousands) | Q1 2019 | Q2 2019 | Q3 2019 | Q4 2019 | Q1 2020 | |||||||||
Net customer additions (losses) | ||||||||||||||
Branded postpaid phone customers | 656 | 710 | 754 | 1,001 | 452 | |||||||||
Branded postpaid other customers | 363 | 398 | 320 | 313 | 325 | |||||||||
Total branded postpaid customers | 1,019 | 1,108 | 1,074 | 1,314 | 777 | |||||||||
Branded prepaid customers (1) | 69 | 131 | 62 | 77 | (128 | ) | ||||||||
Total branded customers | 1,088 | 1,239 | 1,136 | 1,391 | 649 | |||||||||
(1) | On July 18, 2019, we entered into an agreement whereby certain T-Mobile branded prepaid products will now be offered and distributed by a current MVNO partner. As a result, we included a base adjustment in Q3 2019 to reduce branded prepaid customers by 616,000. |
Quarter | ||||||||||||||
Q1 2019 | Q2 2019 | Q3 2019 | Q4 2019 | Q1 2020 | ||||||||||
Branded postpaid phone churn | 0.88 | % | 0.78 | % | 0.89 | % | 1.01 | % | 0.86 | % | ||||
Branded prepaid churn | 3.85 | % | 3.49 | % | 3.98 | % | 3.97 | % | 3.52 | % | ||||
Quarter | |||||||||
(in thousands) | Q1 2019 | Q2 2019 | Q3 2019 | Q4 2019 | Q1 2020 | ||||
Accounts, end of period | |||||||||
Total branded postpaid customer accounts | 14,234 | 14,480 | 14,734 | 15,047 | 15,244 | ||||
Quarter | |||||||||
Q1 2019 | Q2 2019 | Q3 2019 | Q4 2019 | Q1 2020 | |||||
Financial Measures | |||||||||
Service revenues (in millions) | $8,277 | $8,426 | $8,583 | $8,708 | $8,713 | ||||
Total revenues (in millions) | $11,080 | $10,979 | $11,061 | $11,878 | $11,113 | ||||
Net income (in millions) | $908 | $939 | $870 | $751 | $951 | ||||
Net income margin | 11.0% | 11.1% | 10.1% | 8.6% | 10.9% | ||||
Adjusted EBITDA (in millions) | $3,284 | $3,461 | $3,396 | $3,242 | $3,665 | ||||
Adjusted EBITDA margin | 39.7% | 41.1% | 39.6% | 37.2% | 42.1% | ||||
Selling, general and administrative (in millions) | $3,442 | $3,543 | $3,498 | $3,656 | $3,688 | ||||
Merger-related costs (in millions) | $113 | $222 | $159 | $126 | $143 | ||||
COVID-19-related costs (in millions) | $— | $— | $— | $— | $117 | ||||
Selling, general and administrative excluding Merger-related costs and COVID-19-related costs (in millions) | $3,329 | $3,321 | $3,339 | $3,530 | $3,428 | ||||
Cash purchases of property and equipment including capitalized interest (in millions) | $1,931 | $1,789 | $1,514 | $1,157 | $1,753 | ||||
Capitalized Interest (in millions) | $118 | $125 | $118 | $112 | $112 | ||||
Cash purchases of property and equipment excluding capitalized interest (in millions) | $1,813 | $1,664 | $1,396 | $1,045 | $1,641 | ||||
Net cash provided by operating activities (in millions) | $1,392 | $2,147 | $1,748 | $1,537 | $1,617 | ||||
Net cash (used in) provided by investing activities (in millions) | $(966) | $(1,615) | $(657) | $(887) | $(1,580) | ||||
Net cash provided by (used in) financing activities (in millions) | $(190) | $(866) | $(543) | $(775) | $(453) | ||||
Free Cash Flow (in millions) | $618 | $1,169 | $1,134 | $1,398 | $732 | ||||
Net cash proceeds from securitization (in millions) | $(18) | $95 | $(3) | $(9) | $(5) | ||||
Operating Metrics | |||||||||
Branded postpaid phone ARPU | $46.07 | $46.10 | $46.22 | $45.79 | $45.80 | ||||
Branded prepaid ARPU | $37.65 | $37.46 | $38.16 | $38.54 | $38.11 | ||||
Branded postpaid ARPA | $129.77 | $130.36 | $131.15 | $130.39 | $129.47 | ||||
Branded postpaid accounts, end of period (in thousands) | 14,234 | 14,480 | 14,734 | 15,047 | 15,244 | ||||
Device Sales and Leased Devices | |||||||||
Phones (in millions) | 7.4 | 6.5 | 7.4 | 8.3 | 6.4 | ||||
Branded postpaid upgrade rate | 5% | 5% | 5% | 6% | 4% | ||||
Device Financing | |||||||||
Gross EIP financed (in millions) | $1,742 | $1,625 | $1,535 | $2,235 | $1,440 | ||||
EIP billings (in millions) | $1,663 | $1,645 | $1,688 | $1,762 | $1,790 | ||||
EIP receivables, net (in millions) | $4,128 | $4,050 | $3,894 | $4,183 | $3,773 | ||||
Lease revenues (in millions) | $161 | $143 | $142 | $153 | $165 | ||||
Leased devices transferred from inventory to property and equipment (in millions) | $147 | $167 | $298 | $394 | $309 | ||||
Returned leased devices transferred from property and equipment to inventory (in millions) | $(57) | $(67) | $(65) | $(78) | $(59) | ||||
Customer Quality | |||||||||
EIP receivables classified as prime | 46% | 50% | 51% | 53% | 52% | ||||
EIP receivables classified as prime (including EIP receivables sold) | 52% | 52% | 52% | 53% | 53% | ||||
Total bad debt expense and losses from sales of receivables (in millions) | $108 | $99 | $102 | $128 | $138 | ||||
Quarter | |||||||||||||||||||
(in millions) | Q1 2019 | Q2 2019 | Q3 2019 | Q4 2019 | Q1 2020 | ||||||||||||||
Net income | $ | 908 | $ | 939 | $ | 870 | $ | 751 | $ | 951 | |||||||||
Adjustments: | |||||||||||||||||||
Interest expense | 179 | 182 | 184 | 182 | 185 | ||||||||||||||
Interest expense to affiliates | 109 | 101 | 100 | 98 | 99 | ||||||||||||||
Interest income | (8 | ) | (4 | ) | (5 | ) | (7 | ) | (12 | ) | |||||||||
Other (income) expense, net | (7 | ) | 22 | (3 | ) | (4 | ) | 10 | |||||||||||
Income tax expense | 295 | 301 | 325 | 214 | 306 | ||||||||||||||
Operating income | 1,476 | 1,541 | 1,471 | 1,234 | 1,539 | ||||||||||||||
Depreciation and amortization | 1,600 | 1,585 | 1,655 | 1,776 | 1,718 | ||||||||||||||
Stock-based compensation (1) | 93 | 111 | 108 | 111 | 123 | ||||||||||||||
Merger-related costs | 113 | 222 | 159 | 126 | 143 | ||||||||||||||
COVID-19-related costs | — | — | — | — | 117 | ||||||||||||||
Other, net (2) | 2 | 2 | 3 | (5 | ) | 25 | |||||||||||||
Adjusted EBITDA | $ | 3,284 | $ | 3,461 | $ | 3,396 | $ | 3,242 | $ | 3,665 | |||||||||
(1) | Stock-based compensation includes payroll tax impacts and may not agree to stock-based compensation expense in the Condensed Consolidated Financial Statements. Additionally, certain stock-based compensation expenses associated with the Transactions have been included in Merger-related costs. |
(2) | Other, net may not agree to the Condensed Consolidated Statements of Comprehensive Income primarily due to certain non-routine operating activities, such as other special items that would not be expected to reoccur or are not reflective of T-Mobile’s ongoing operating performance, and are therefore excluded in Adjusted EBITDA. |
(in millions, except net debt ratios) | Mar 31, 2019 | Jun 30, 2019 | Sep 30, 2019 | Dec 31, 2019 | Mar 31, 2020 | ||||||||||||||
Short-term debt | $ | 250 | $ | 300 | $ | 475 | $ | 25 | $ | — | |||||||||
Short-term debt to affiliates | 598 | — | — | — | 2,000 | ||||||||||||||
Short-term financing lease liabilities | 911 | 963 | 1,013 | 957 | 918 | ||||||||||||||
Long-term debt | 10,952 | 10,954 | 10,956 | 10,958 | 10,959 | ||||||||||||||
Long-term debt to affiliates | 13,985 | 13,985 | 13,986 | 13,986 | 11,987 | ||||||||||||||
Financing lease liabilities | 1,224 | 1,314 | 1,440 | 1,346 | 1,276 | ||||||||||||||
Less: Cash and cash equivalents | (1,439 | ) | (1,105 | ) | (1,653 | ) | (1,528 | ) | (1,112 | ) | |||||||||
Net debt (excluding tower obligations) | $ | 26,481 | $ | 26,411 | $ | 26,217 | $ | 25,744 | $ | 26,028 | |||||||||
Divided by: Last twelve months Net income | $ | 3,125 | $ | 3,282 | $ | 3,357 | $ | 3,468 | $ | 3,511 | |||||||||
Net debt (excluding tower obligations) to last twelve months Net income Ratio | 8.5 | 8.0 | 7.8 | 7.4 | 7.4 | ||||||||||||||
Divided by: Last twelve months Adjusted EBITDA | $ | 12,726 | $ | 12,954 | $ | 13,111 | $ | 13,383 | $ | 13,764 | |||||||||
Net debt (excluding tower obligations) to last twelve months Adjusted EBITDA Ratio | 2.1 | 2.0 | 2.0 | 1.9 | 1.9 | ||||||||||||||
Quarter | |||||||||||||||||||
(in millions) | Q1 2019 | Q2 2019 | Q3 2019 | Q4 2019 | Q1 2020 | ||||||||||||||
Net cash provided by operating activities | $ | 1,392 | $ | 2,147 | $ | 1,748 | $ | 1,537 | $ | 1,617 | |||||||||
Cash purchases of property and equipment | (1,931 | ) | (1,789 | ) | (1,514 | ) | (1,157 | ) | (1,753 | ) | |||||||||
Proceeds related to beneficial interests in securitization transactions | 1,157 | 839 | 900 | 980 | 868 | ||||||||||||||
Proceeds from sales of tower sites | — | — | — | 38 | — | ||||||||||||||
Cash payments for debt prepayment or debt extinguishment costs | — | (28 | ) | — | — | — | |||||||||||||
Free Cash Flow | 618 | 1,169 | 1,134 | 1,398 | 732 | ||||||||||||||
Payments for merger-related costs | 34 | 151 | 124 | 133 | 161 | ||||||||||||||
Free Cash Flow, excluding payments for merger-related costs | $ | 652 | $ | 1,320 | $ | 1,258 | $ | 1,531 | $ | 893 | |||||||||
Net cash used in investing activities | $ | (966 | ) | $ | (1,615 | ) | $ | (657 | ) | $ | (887 | ) | $ | (1,580 | ) | ||||
Net cash used in financing activities | $ | (190 | ) | $ | (866 | ) | $ | (543 | ) | $ | (775 | ) | $ | (453 | ) | ||||
Q2 2020 | |||||||
(in millions) | Guidance Range | ||||||
Net cash provided by operating activities | $ | 700 | $ | 1,000 | |||
Gross payments for the settlement of interest rate swaps (1) | 2,300 | 2,300 | |||||
Cash purchases of property and equipment | (2,300 | ) | (2,500 | ) | |||
Proceeds related to beneficial interests in securitization transactions | 600 | 700 | |||||
Free Cash Flow | $ | 1,300 | $ | 1,500 | |||
(in millions, except average number of customers, ARPA and ARPU) | Quarter | ||||||||||||||||||
Q1 2019 | Q2 2019 | Q3 2019 | Q4 2019 | Q1 2020 | |||||||||||||||
Calculation of Branded Postpaid ARPA | |||||||||||||||||||
Branded postpaid service revenues | $ | 5,493 | $ | 5,613 | $ | 5,746 | $ | 5,821 | $ | 5,887 | |||||||||
Divided by: Average number of branded postpaid accounts (in thousands) and number of months in period | 14,108 | 14,354 | 14,602 | 14,881 | 15,155 | ||||||||||||||
Branded postpaid ARPA | $ | 129.77 | $ | 130.36 | $ | 131.15 | $ | 130.39 | $ | 129.47 | |||||||||
Calculation of Branded Postpaid Phone ARPU | |||||||||||||||||||
Branded postpaid service revenues | $ | 5,493 | $ | 5,613 | $ | 5,746 | $ | 5,821 | $ | 5,887 | |||||||||
Less: Branded postpaid other revenues | (310 | ) | (326 | ) | (346 | ) | (362 | ) | (310 | ) | |||||||||
Branded postpaid phone service revenues | $ | 5,183 | $ | 5,287 | $ | 5,400 | $ | 5,459 | $ | 5,577 | |||||||||
Divided by: Average number of branded postpaid phone customers (in thousands) and number of months in period | 37,504 | 38,226 | 38,944 | 39,736 | 40,585 | ||||||||||||||
Branded postpaid phone ARPU | $ | 46.07 | $ | 46.10 | $ | 46.22 | $ | 45.79 | $ | 45.80 | |||||||||
Calculation of Branded Prepaid ARPU | |||||||||||||||||||
Branded prepaid service revenues | $ | 2,386 | $ | 2,379 | $ | 2,385 | $ | 2,393 | $ | 2,373 | |||||||||
Divided by: Average number of branded prepaid customers (in thousands) and number of months in period | 21,122 | 21,169 | 20,837 | 20,691 | 20,759 | ||||||||||||||
Branded prepaid ARPU | $ | 37.65 | $ | 37.46 | $ | 38.16 | $ | 38.54 | $ | 38.11 | |||||||||
1. | Customer - SIM number with a unique T-Mobile mobile identifier which is associated with an account that generates revenue. Branded customers generally include customers that are qualified either for postpaid service, where they generally pay after incurring service, or prepaid service, where they generally pay in advance. Wholesale customers include Machine-to-Machine (M2M) and Mobile Virtual Network Operator (MVNO) customers that operate on T-Mobile’s network, but are managed by wholesale partners. |
2. | Churn - Number of customers whose service was disconnected as a percentage of the average number of customers during the specified period. The number of customers whose service was disconnected is presented net of customers that subsequently have their service restored within a certain period of time. |
3. | Customers per account - The number of branded postpaid customers as of the end of the period divided by the number of branded postpaid accounts as of the end of the period. An account may include branded postpaid phone, mobile broadband, and DIGITS customers. |
4. | Average Revenue Per Account (ARPA) - Average monthly branded postpaid service revenue earned per account. Branded postpaid service revenues for the specified period divided by the average number of branded postpaid accounts during the period, further divided by the number of months in the period. |
5. | Cost of services - Costs directly attributable to providing wireless service through the operation of T-Mobile’s network, including direct switch and cell site costs, such as rent, network access and transport costs, utilities, maintenance, associated labor costs, long distance costs, regulatory program costs, roaming fees paid to other carriers and data content costs. |
6. | Net income margin - Margin % calculated as net income divided by service revenues. |
7. | Adjusted EBITDA - Earnings before interest expense, net of interest income, income tax expense, depreciation and amortization expense, non-cash stock-based compensation and certain expenses not reflective of T-Mobile’s ongoing operating performance such as Merger-related costs. Adjusted EBITDA margin represents Adjusted EBITDA divided by service revenues. Adjusted EBITDA is a non-GAAP financial measure utilized by T-Mobile’s management to monitor the financial performance of our operations. T-Mobile uses Adjusted EBITDA internally as a measure to evaluate and compensate its personnel and management for their performance, and as a benchmark to evaluate T-Mobile’s operating performance in comparison to its competitors. Management believes analysts and investors use Adjusted EBITDA as a supplemental measure to evaluate overall operating performance and facilitate comparisons with other wireless communications companies because it is indicative of T-Mobile’s ongoing operating performance and trends by excluding the impact of interest expense from financing, non-cash depreciation and amortization from capital investments, non-cash stock-based compensation, network decommissioning costs and costs related to the Transactions, as they are not indicative of T-Mobile’s ongoing operating performance, as well as certain other nonrecurring income and expenses. Adjusted EBITDA has limitations as an analytical tool and should not be considered in isolation or as a substitute for income from operations, net income or any other measure of financial performance reported in accordance with U.S. Generally Accepted Accounting Principles (“GAAP”). |
8. | Adjusted EBITDA Margin - Margin % calculated as Adjusted EBITDA divided by service revenues. |
9. | Smartphones - UMTS/HSPA/HSPA+ 21/HSPA+ 42/4G LTE enabled converged devices, which integrate voice and data services. |
10. | Free Cash Flow - Net cash provided by operating activities less cash purchases of property and equipment, including proceeds from sales of tower sites and proceeds related to beneficial interests in securitization transactions and less cash payments for debt prepayment or debt extinguishment costs. Free Cash Flow is utilized by T-Mobile’s management, investors, and analysts to evaluate cash available to pay debt and provide further investment in the business. The reconciliation of Free Cash Flow to net cash provided by operating activities is detailed in the Reconciliation of Non-GAAP Financial Measures to GAAP Financial Measures schedule. |
11. | Net debt - Short-term debt, short-term debt to affiliates, long-term debt, and long-term debt (excluding tower obligations) to affiliates, short-term financing lease liabilities and financing lease liabilities, less cash and cash equivalents. |