(State or other jurisdiction | (Commission File Number) | (I.R.S. Employer | ||
of incorporation or organization) | Identification No.) | |||
Written communications pursuant to Rule 425 under the Securities Act (17 CFR 230.425) | |
Soliciting material pursuant to Rule 14a-12 under the Exchange Act (17 CFR 240.14a-12) | |
Pre-commencement communications pursuant to Rule 14d-2(b) under the Exchange Act (17 CFR 240.14d-2(b)) | |
Pre-commencement communications pursuant to Rule 13e-4(c) under the Exchange Act (17 CFR 240.13e-4(c)) | |
Title of each class | Trading Symbol | Name of each exchange on which registered | ||
Exhibit | Description | |
99.1 | ||
99.2 | ||
104 | Cover Page Interactive Data File (the cover page XBRL tags are embedded within the Inline XBRL document. | |
SIGNATURE | |||
T-MOBILE US, INC. | |||
February 6, 2020 | /s/ J. Braxton Carter | ||
J. Braxton Carter Executive Vice President and Chief Financial Officer | |||
• | Record Service revenues of $8.7 billion, up 6% in Q4 2019 - up 6% to $34.0 billion in 2019 |
• | Record Total revenues of $11.9 billion, up 4% in Q4 2019 - up 4% to $45.0 billion in 2019 |
• | Strong Net income of $751 million, up 17% in Q4 2019 - up 20% to $3.5 billion in 2019 |
• | Diluted earnings per share (“EPS”) of $0.87, up 16% in Q4 2019 - up 20% to $4.02 in 2019 |
• | Record Q4 Adjusted EBITDA(1) of $3.2 billion, up 9% in Q4 2019 - up 8% to $13.4 billion in 2019 |
• | Strong Net cash provided by operating activities of $1.5 billion, up 61% in Q4 2019 - up 75% to $6.8 billion in 2019 |
• | Record Free Cash Flow(1) of $1.4 billion, up 15% in Q4 2019 - up 22% to $4.3 billion in 2019 |
• | 1.9 million total net additions in Q4 2019 - 7.0 million in 2019 - 6th year in a row of more than 5 million total net additions |
• | 1.3 million branded postpaid net additions in Q4 2019, best in industry - 4.5 million in 2019, best in industry |
• | 1.0 million branded postpaid phone net additions in Q4 2019, best in industry - 3.1 million in 2019, best in industry |
• | 77,000 branded prepaid net additions in Q4 2019 - 339,000 in 2019 |
• | Branded postpaid phone churn of 1.01% in Q4 2019, up 2 bps YoY - 0.89% in 2019, down 12 bps from 2018 |
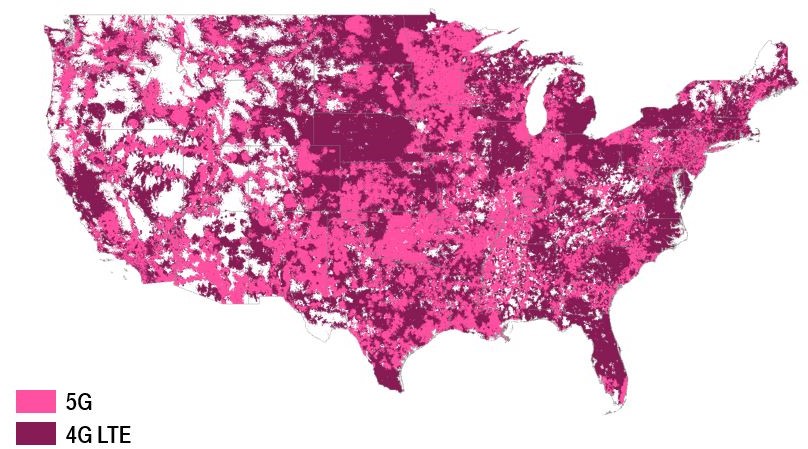
• | Launched the first nationwide 5G network utilizing 600 MHz spectrum, forming the foundational 5G coverage layer for New T-Mobile; network covers more than 200 million people and more than 5,000 cities and towns |
• | 4G LTE on 600 MHz now covers 248 million people and 1.5 million square miles |
• | Currently, more than 33 million 600 MHz compatible devices already on our network |
• | Branded postpaid net additions of 2.6 to 3.6 million |
• | Net income is not available on a forward-looking basis(2) |
• | Adjusted EBITDA target of $13.7 to $14.0 billion, which includes leasing revenues of $450 to $550 million |
• | Cash purchases of property and equipment, including capitalized interest of approximately $400 million, are expected to be $5.9 to $6.2 billion. Cash purchases of property and equipment, excluding capitalized interest, are expected to be $5.5 to $5.8 billion |
• | In Q1 2020, pre-close merger-related costs are expected to be $200 to $300 million before taxes |
• | Net cash provided by operating activities, excluding payments for merger-related costs and any settlement of interest rate swaps, is expected to be in the range of $7.9 to $8.5 billion |
• | Free Cash Flow, excluding payments for merger-related costs and any settlement of interest rate swaps, is expected to be in the range of $5.4 to $5.8 billion |
(1) | Adjusted EBITDA and Free Cash Flow are non-GAAP financial measures. These non-GAAP financial measures should be considered in addition to, but not as a substitute for, the information provided in accordance with GAAP. Reconciliations for these non-GAAP financial measures to the most directly comparable financial measures are provided in the Reconciliation of Non-GAAP Financial Measures to GAAP Financial Measures tables. |
(2) | We are not able to forecast Net income on a forward-looking basis without unreasonable efforts due to the high variability and difficulty in predicting certain items that affect GAAP Net income including, but not limited to, Income tax expense, stock-based compensation expense and Interest expense. Adjusted EBITDA should not be used to predict Net income as the difference between the two measures is variable. |
Quarter | Year Ended December 31, | |||||||||||||
(in thousands, except churn) | Q4 2019 | Q3 2019 | Q4 2018 | 2019 | 2018 | |||||||||
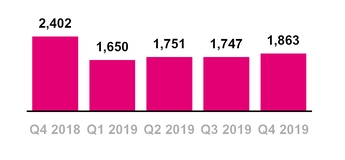
Total net customer additions | 1,863 | 1,747 | 2,402 | 7,011 | 7,044 | |||||||||
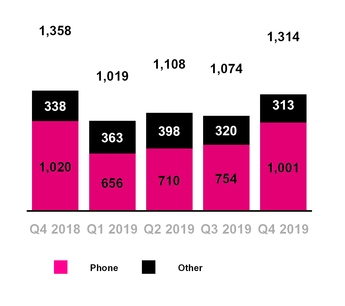
Branded postpaid net customer additions | 1,314 | 1,074 | 1,358 | 4,515 | 4,459 | |||||||||
Branded postpaid phone net customer additions | 1,001 | 754 | 1,020 | 3,121 | 3,097 | |||||||||
Branded postpaid other customer additions | 313 | 320 | 338 | 1,394 | 1,362 | |||||||||
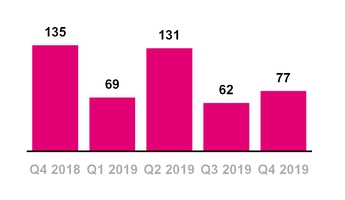
Branded prepaid net customer additions | 77 | 62 | 135 | 339 | 460 | |||||||||
Total customers, end of period | 86,046 | 84,183 | 79,651 | 86,046 | 79,651 | |||||||||
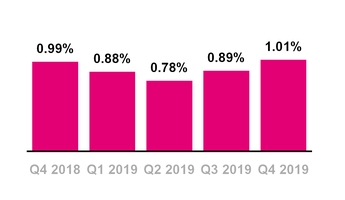
Branded postpaid phone churn | 1.01 | % | 0.89 | % | 0.99 | % | 0.89 | % | 1.01 | % | ||||
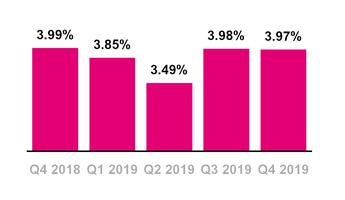
Branded prepaid churn | 3.97 | % | 3.98 | % | 3.99 | % | 3.82 | % | 3.96 | % | ||||
• | Total net customer additions were 1.9 million in Q4 2019, bringing our total customer count to 86.0 million, and marking the 27th straight quarter in which T-Mobile generated more than 1 million total net customer additions. For full-year 2019, total net customer additions were 7.0 million, marking the sixth year in a row of more than 5 million total net customer additions. |
• | Branded postpaid net customer additions were 1.3 million in Q4 2019, the 8th consecutive quarter we have led the industry in this metric. For full-year 2019, branded postpaid net customer additions were 4.5 million, which exceeded the top end of our increased guidance range for branded postpaid net customer additions of 4.1 to 4.3 million. |
• | Branded postpaid phone net customer additions were 1.0 million in Q4 2019, down 19,000 year-over-year. This slight decrease was primarily due to higher deactivations from a growing customer base, partially offset by higher gross customer additions. Q4 2019 was the 24th consecutive quarter in which T-Mobile led the industry in this category. For full-year 2019, branded postpaid phone net customer additions were 3.1 million, up 24,000 primarily due to lower churn, the 6th straight year in which T-Mobile led the industry in this category. |
• | Branded postpaid other net customer additions were 313,000 in Q4 2019, down 25,000 year-over-year. This decrease was primarily due to higher deactivations from a growing customer base. Branded postpaid other net customer additions were a record 1.4 million in full-year 2019, up 32,000 primarily due to additions from other connected devices. |
• | Branded postpaid phone churn was 1.01% in Q4 2019, essentially flat year-over-year, reflecting continued strong brand loyalty in a heightened competitive environment. For full-year 2019, branded postpaid phone churn decreased 12 basis points to 0.89%, primarily due to increased customer satisfaction and loyalty from ongoing improvements to network quality, industry-leading customer service and the overall value of our offerings. |
• | Branded prepaid net customer additions were 77,000 in Q4 2019 and 339,000 in full-year 2019. Migrations to branded postpaid plans reduced branded prepaid net customer additions by approximately 160,000 in Q4 2019 and 525,000 for full-year 2019. |
• | Branded prepaid churn was 3.97% in Q4 2019, essentially flat year-over-year and down 14 basis points to 3.82% in full-year 2019, primarily due to increased customer satisfaction and loyalty from ongoing improvements to network quality and the continued success of our prepaid brands due to promotional activities and rate plan offers. |
(in millions, except EPS) | Quarter | Year Ended December 31, | Q4 2019 vs. Q3 2019 | Q4 2019 vs. Q4 2018 | YTD 2019 vs. YTD 2018 | |||||||||||||||||||||||
Q4 2019 | Q3 2019 | Q4 2018 | 2019 | 2018 | ||||||||||||||||||||||||
Total service revenues | $ | 8,708 | $ | 8,583 | $ | 8,189 | $ | 33,994 | $ | 31,992 | 1.5 | % | 6.3 | % | 6.3 | % | ||||||||||||
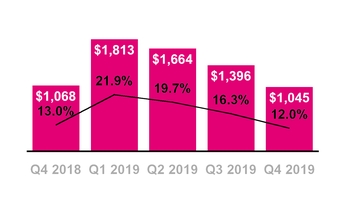
Total revenues | 11,878 | 11,061 | 11,445 | 44,998 | 43,310 | 7.4 | % | 3.8 | % | 3.9 | % | |||||||||||||||||
Net income | 751 | 870 | 640 | 3,468 | 2,888 | (13.7 | )% | 17.3 | % | 20.1 | % | |||||||||||||||||
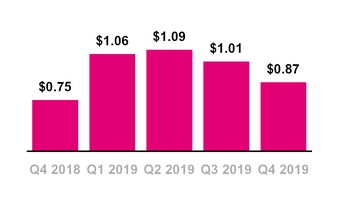
EPS | 0.87 | 1.01 | 0.75 | 4.02 | 3.36 | (13.9 | )% | 16.0 | % | 19.6 | % | |||||||||||||||||
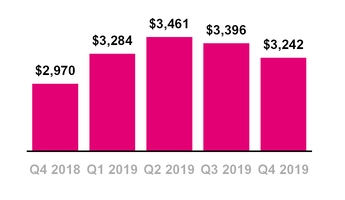
Adjusted EBITDA (1) | 3,242 | 3,396 | 2,970 | 13,383 | 12,398 | (4.5 | )% | 9.2 | % | 7.9 | % | |||||||||||||||||
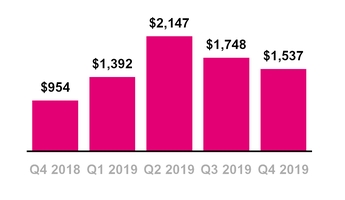
Net cash provided by operating activities | 1,537 | 1,748 | 954 | 6,824 | 3,899 | (12.1 | )% | 61.1 | % | 75.0 | % | |||||||||||||||||
Cash purchases of property and equipment, including capitalized interest | 1,157 | 1,514 | 1,184 | 6,391 | 5,541 | (23.6 | )% | (2.3 | )% | 15.3 | % | |||||||||||||||||
Free Cash Flow (1) | 1,398 | 1,134 | 1,220 | 4,319 | 3,552 | 23.3 | % | 14.6 | % | 21.6 | % | |||||||||||||||||
(1) | Adjusted EBITDA and Free Cash Flow are non-GAAP financial measures. These non-GAAP financial measures should be considered in addition to, but not as a substitute for, the information provided in accordance with GAAP. Reconciliations for these non-GAAP financial measures to the most directly comparable financial measures are provided in the Reconciliation of Non-GAAP Financial Measures to GAAP Financial Measures tables. |
• | Total service revenues increased 6% to a record-high of $8.7 billion in Q4 2019 and 6% to a record-high of $34.0 billion in full-year 2019. These results represent our best quarterly and full-year performance ever and we led the industry for the 23rd consecutive quarter in year-over-year service revenue percentage growth. Branded postpaid revenues increased 8% year-over-year. |
• | Total revenues increased 4% to a record-high of $11.9 billion in Q4 2019 and increased 4% to a record-high of $45.0 billion in full-year 2019, driven by growth in service revenues, partially offset by a decrease in equipment revenues. |
• | Branded postpaid phone Average Revenue per User (ARPU) decreased 1.1% to $45.79 in Q4 2019 and decreased 0.8% to $46.04 in full-year 2019. The slight decrease in both periods was primarily due to increased promotional activities, including growth in our Netflix offering, and a reduction in regulatory program revenues from the continued adoption of tax inclusive plans. Also impacting Q4 2019 was the impact of a reduction in the non-cash, non-recurring benefit related to Data Stash as the majority of customers had transitioned to unlimited plans by Q3 2019. These decreases were partially offset by the growing success of new customer segments and rate plans and higher premium services revenue. |
• | Branded prepaid ARPU was essentially flat at $38.54 in Q4 2019 and down 1.5% to $37.95 in full-year 2019, primarily due to the impact of dilution from promotional activity and growth in our Amazon Prime offering, partially offset by the removal of certain branded prepaid customers associated with products now offered and distributed by a current MVNO partner as those customers had lower Branded prepaid ARPU. |
• | Net income increased 17% to $751 million in Q4 2019 and 20% to $3.5 billion in full-year 2019, primarily due to higher Operating income. Net income was impacted by the following: |
◦ | Merger-related costs of $105 million and $501 million in Q4 2019 and full-year 2019, respectively, compared to merger-related costs of $88 million and $180 million in the same periods of 2018, respectively. |
◦ | The year-over-year and full-year 2019 impact from commission costs capitalized and amortized beginning upon the adoption of ASC 606 on January 1, 2018, reduced Net income by $69 million and $249 million, respectively. |
◦ | The negative impact of hurricane costs, net of insurance reimbursements, was $11 million in Q4 2018. The positive impact of hurricane-related reimbursements, net of costs, was $99 million in 2018. There were no significant impacts from hurricanes in 2019. |
◦ | The positive impact of the new lease standard of approximately $44 million and $175 million in Q4 2019 and full-year 2019, respectively. |
• | EPS increased 16% to $0.87 in Q4 2019 and 20% to $4.02 in full-year 2019. EPS was impacted by the following: |
◦ | The impact from merger-related costs of $0.12 and $0.58 in Q4 2019 and full-year 2019, respectively, compared to the impact from merger-related costs of $0.10 and $0.21 in the same periods of 2018. |
◦ | The year-over-year and full-year 2019 impact from commission costs capitalized and amortized beginning upon the adoption of ASC 606 on January 1, 2018, reduced EPS by $0.08 and $0.29, respectively. |
◦ | The negative impact of hurricane costs, net of insurance reimbursements, was $0.01 in Q4 2018. The positive impact of hurricane-related reimbursements, net of costs, was $0.12 in 2018. There were no significant impacts from hurricanes in 2019. |
◦ | The positive impact of the new lease standard of approximately $0.05 and $0.20 in Q4 2019 and full-year 2019, respectively. |
• | Adjusted EBITDA increased 9% to a Q4 record $3.2 billion in Q4 2019 and 8% to a record $13.4 billion in full-year 2019, primarily due to higher service revenues, partially offset by higher Selling, general and administrative expenses and higher Cost of services expenses. Adjusted EBITDA was impacted by the following: |
◦ | The impact from commission costs capitalized and amortized, beginning upon the adoption of ASC 606 on January 1, 2018, reduced Adjusted EBITDA by $93 million year-over-year and $337 million in 2019 compared to 2018. |
◦ | The negative impact of hurricane costs, net of insurance reimbursements, was $14 million in Q4 2018. The positive impact of hurricane-related reimbursements, net of costs, was $158 million in 2018. There were no significant impacts from hurricanes in 2019. |
◦ | The positive impact of the new lease standard of approximately $49 million and $195 million in Q4 2019 and full-year 2019, respectively. |
◦ | Excluded from Adjusted EBITDA were merger-related costs of $126 million and $620 million in Q4 2019 and full-year 2019, respectively, compared to $102 million and $196 million in the same periods of 2018. |
• | Net cash provided by operating activities increased 61% to $1.5 billion in Q4 2019 and 75% to $6.8 billion in full-year 2019. These increases primarily resulted from higher Net income and net non-cash adjustments to Net income and lower net cash outflows from changes in working capital. |
• | Cash purchases of property and equipment were essentially flat at $1.2 billion in Q4 2019, including capitalized interest of $112 million. For full-year 2019, cash purchases of property and equipment, including capitalized interest of $473 million, increased 15% to $6.4 billion due to expenditures for the accelerated launch of our 5G network and the continued build-out of our 600 MHz low-band spectrum. |
• | Free Cash Flow increased 15% to $1.4 billion in Q4 2019 and 22% to $4.3 billion in full-year 2019, primarily due to higher net cash provided by operating activities, partially offset by lower proceeds related to our deferred purchase price from securitization transactions. Excluding the impact of payments for merger-related costs of $133 million in Q4 2019 and $442 million in full-year 2019, Free Cash Flow was $1.5 billion in Q4 2019 and $4.8 billion in full-year 2019. |
• | Nationwide 5G: In December 2019, T-Mobile launched America’s first nationwide 5G network, including prepaid 5G with Metro by T-Mobile, covering more than 200 million people and more than 5,000 cities and towns across the United States with 5G. In addition, we introduced two new 600 MHz 5G capable superphones, the exclusive OnePlus 7T Pro 5G McLaren and the Samsung Galaxy Note10+ 5G and anticipate offering an industry-leading smartphone portfolio built to work on nationwide 5G in 2020. This 5G network is our foundational layer of 5G coverage on 600 MHz low-band spectrum and this is just the beginning! T-Mobile’s 5G covers more than 60% of the population across more than 1 million square miles. T-Mobile’s 5G network works indoors and is available to anyone with a capable device. We have also rolled out 5G on millimeter wave (mmWave) spectrum in parts of 7 cities, including New York and most recently Miami. |
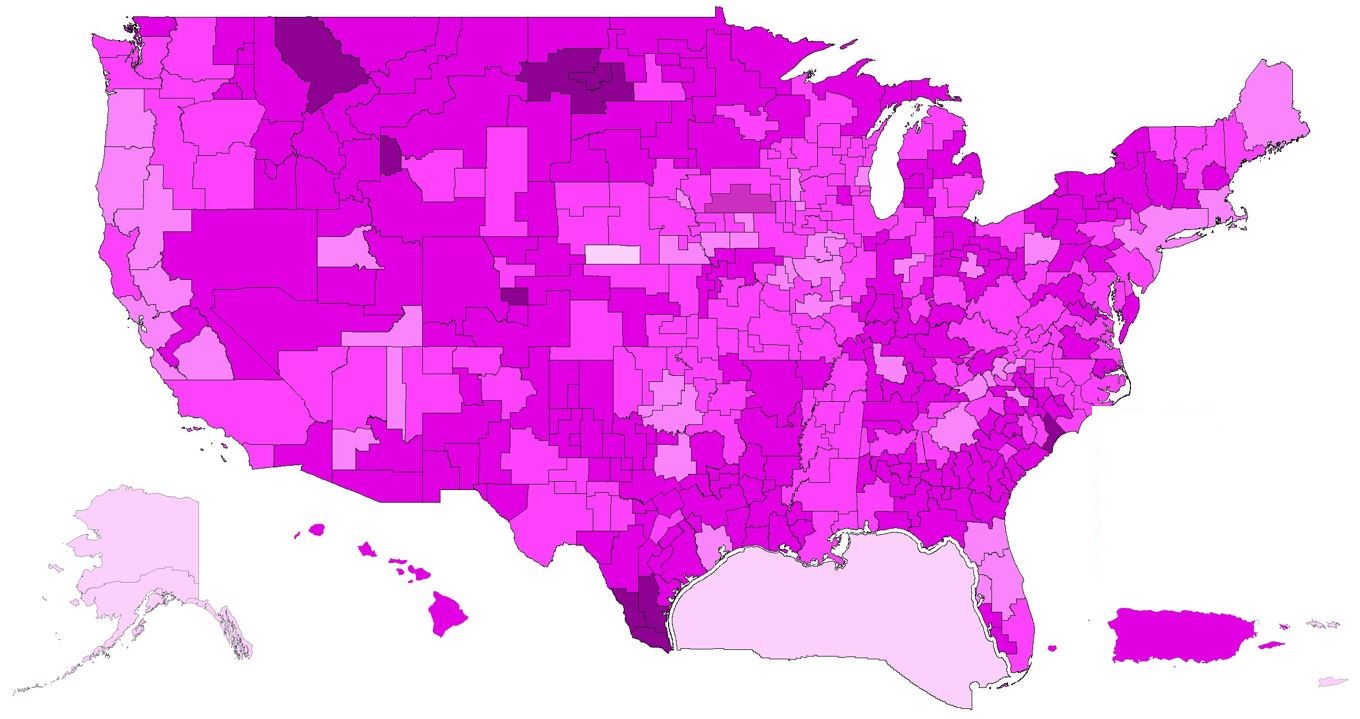
• | Deployment of 600 MHz spectrum: At the end of Q4 2019, T-Mobile owned a nationwide average of 31 MHz of 600 MHz low-band spectrum. As of December 31, 2019, we had cleared 275 million POPs and we expect to clear the remaining 600 MHz POPs in 2020. T-Mobile continues its deployment of 4G LTE on 600 MHz spectrum, using 5G-ready equipment, with 1.5 million square miles already lit up, covering 248 million POPs in nearly 8,900 cities and towns in 49 states and Puerto Rico. Combining 600 MHz spectrum and 700 MHz spectrum, we have deployed low-band spectrum to 316 million POPs. Currently, more than 33 million devices on T-Mobile’s network are compatible with 600 MHz spectrum. |
Date: | Thursday, February 6, 2020 |
Time: | 4:30 p.m. (ET) |
US/Canada: | 866-575-6534 |
International: | +1 323-794-2094 |
Participant Passcode: | 5259088 |
Twitter: | Send a tweet to @TMobileIR or @JohnLegere using $TMUS |
Press Contact: | Investor Relations Contact: |
Media Relations | Nils Paellmann |
T-Mobile US, Inc. | T-Mobile US, Inc. |
http://newsroom.t-mobile.com | |
Quarter | Year Ended December 31, | ||||||||||||||||||||||||||||||||||||||
(in millions) | Q1 2018 | Q2 2018 | Q3 2018 | Q4 2018 | Q1 2019 | Q2 2019 | Q3 2019 | Q4 2019 | 2018 | 2019 | |||||||||||||||||||||||||||||
Net income | $ | 671 | $ | 782 | $ | 795 | $ | 640 | $ | 908 | $ | 939 | $ | 870 | $ | 751 | $ | 2,888 | $ | 3,468 | |||||||||||||||||||
Adjustments: | |||||||||||||||||||||||||||||||||||||||
Interest expense | 251 | 196 | 194 | 194 | 179 | 182 | 184 | 182 | 835 | 727 | |||||||||||||||||||||||||||||
Interest expense to affiliates | 166 | 128 | 124 | 104 | 109 | 101 | 100 | 98 | 522 | 408 | |||||||||||||||||||||||||||||
Interest income | (6 | ) | (6 | ) | (5 | ) | (2 | ) | (8 | ) | (4 | ) | (5 | ) | (7 | ) | (19 | ) | (24 | ) | |||||||||||||||||||
Other (income) expense, net | (10 | ) | 64 | (3 | ) | 3 | (7 | ) | 22 | (3 | ) | (4 | ) | 54 | 8 | ||||||||||||||||||||||||
Income tax expense | 210 | 286 | 335 | 198 | 295 | 301 | 325 | 214 | 1,029 | 1,135 | |||||||||||||||||||||||||||||
Operating income | 1,282 | 1,450 | 1,440 | 1,137 | 1,476 | 1,541 | 1,471 | 1,234 | 5,309 | 5,722 | |||||||||||||||||||||||||||||
Depreciation and amortization | 1,575 | 1,634 | 1,637 | 1,640 | 1,600 | 1,585 | 1,655 | 1,776 | 6,486 | 6,616 | |||||||||||||||||||||||||||||
Stock-based compensation (1) | 96 | 106 | 102 | 85 | 93 | 111 | 108 | 111 | 389 | 423 | |||||||||||||||||||||||||||||
Merger-related costs | — | 41 | 53 | 102 | 113 | 222 | 159 | 126 | 196 | 620 | |||||||||||||||||||||||||||||
Other, net (2) | 3 | 2 | 7 | 6 | 2 | 2 | 3 | (5 | ) | 18 | 2 | ||||||||||||||||||||||||||||
Adjusted EBITDA | $ | 2,956 | $ | 3,233 | $ | 3,239 | $ | 2,970 | $ | 3,284 | $ | 3,461 | $ | 3,396 | $ | 3,242 | $ | 12,398 | $ | 13,383 | |||||||||||||||||||
(1) | Stock-based compensation includes payroll tax impacts and may not agree to stock-based compensation expense in the consolidated financial statements. Additionally, certain stock-based compensation expenses associated with the Transactions have been included in Merger-related costs. |
(2) | Other, net may not agree to the Consolidated Statements of Comprehensive Income, primarily due to certain non-routine operating activities, such as other special items that would not be expected to reoccur or are not reflective of T-Mobile’s ongoing operating performance, and are therefore excluded in Adjusted EBITDA. |
(in millions, except net debt ratios) | Mar 31, 2018 | Jun 30, 2018 | Sep 30, 2018 | Dec 31, 2018 | Mar 31, 2019 | Jun 30, 2019 | Sep 30, 2019 | Dec 31, 2019 | |||||||||||||||||||||||
Short-term debt | $ | 3,320 | $ | 1,004 | $ | 783 | $ | 841 | $ | 250 | $ | 300 | $ | 475 | $ | 25 | |||||||||||||||
Short-term debt to affiliates | 445 | 320 | — | — | 598 | — | — | — | |||||||||||||||||||||||
Short-term financing lease liabilities (1) | — | — | — | — | 911 | 963 | 1,013 | 957 | |||||||||||||||||||||||
Long-term debt | 12,127 | 12,065 | 11,993 | 12,124 | 10,952 | 10,954 | 10,956 | 10,958 | |||||||||||||||||||||||
Long-term debt to affiliates | 14,586 | 14,581 | 14,581 | 14,582 | 13,985 | 13,985 | 13,986 | 13,986 | |||||||||||||||||||||||
Financing lease liabilities (1) | — | — | — | — | 1,224 | 1,314 | 1,440 | 1,346 | |||||||||||||||||||||||
Less: Cash and cash equivalents | (2,527 | ) | (215 | ) | (329 | ) | (1,203 | ) | (1,439 | ) | (1,105 | ) | (1,653 | ) | (1,528 | ) | |||||||||||||||
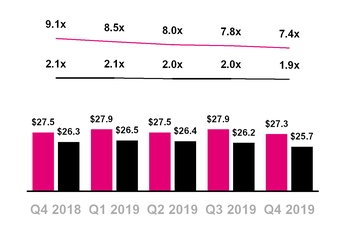
Net debt (excluding tower obligations) | $ | 27,951 | $ | 27,755 | $ | 27,028 | $ | 26,344 | $ | 26,481 | $ | 26,411 | $ | 26,217 | $ | 25,744 | |||||||||||||||
Divided by: Last twelve months Net income | $ | 4,509 | $ | 4,710 | $ | 4,955 | $ | 2,888 | $ | 3,125 | $ | 3,282 | $ | 3,357 | $ | 3,468 | |||||||||||||||
Net debt (excluding tower obligations) to last twelve months Net income Ratio | 6.2 | 5.9 | 5.5 | 9.1 | 8.5 | 8.0 | 7.8 | 7.4 | |||||||||||||||||||||||
Divided by: Last twelve months Adjusted EBITDA | $ | 11,501 | $ | 11,722 | $ | 12,139 | $ | 12,398 | $ | 12,726 | $ | 12,954 | $ | 13,111 | $ | 13,383 | |||||||||||||||
Net debt (excluding tower obligations) to last twelve months Adjusted EBITDA Ratio | 2.4 | 2.4 | 2.2 | 2.1 | 2.1 | 2.0 | 2.0 | 1.9 | |||||||||||||||||||||||
(1) | In Q1 2019, the adoption of the new lease accounting standard resulted in a reclassification of capital lease liabilities previously included in Short-term debt and Long-term debt to Short-term financing lease liabilities and Financing lease liabilities in our Consolidated Balance Sheet. In Q1 2019, we redefined Net debt (excluding Tower obligations) to reflect the above changes in classification and present Net debt (excluding tower obligations) on a consistent basis for investor transparency. The effects of this change are applied prospectively, consistent with the adoption of the standard. See Note 1 – Summary of Significant Accounting Policies in our Annual Report on Form 10-K for the year ended December 31, 2019, for additional details. |
Quarter | Year Ended December 31, | ||||||||||||||||||||||||||||||||||||||
(in millions) | Q1 2018 | Q2 2018 | Q3 2018 | Q4 2018 | Q1 2019 | Q2 2019 | Q3 2019 | Q4 2019 | 2018 | 2019 | |||||||||||||||||||||||||||||
Net cash provided by operating activities | $ | 770 | $ | 1,261 | $ | 914 | $ | 954 | $ | 1,392 | $ | 2,147 | $ | 1,748 | $ | 1,537 | $ | 3,899 | $ | 6,824 | |||||||||||||||||||
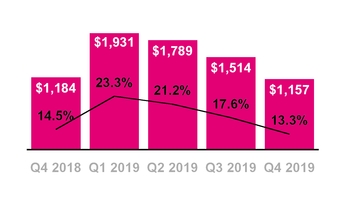
Cash purchases of property and equipment | (1,366 | ) | (1,629 | ) | (1,362 | ) | (1,184 | ) | (1,931 | ) | (1,789 | ) | (1,514 | ) | (1,157 | ) | (5,541 | ) | (6,391 | ) | |||||||||||||||||||
Proceeds related to beneficial interests in securitization transactions | 1,295 | 1,323 | 1,338 | 1,450 | 1,157 | 839 | 900 | 980 | 5,406 | 3,876 | |||||||||||||||||||||||||||||
Proceeds from sales of tower sites | — | — | — | — | — | — | — | 38 | — | 38 | |||||||||||||||||||||||||||||
Cash payments for debt prepayment or debt extinguishment costs | (31 | ) | (181 | ) | — | — | — | (28 | ) | — | — | (212 | ) | (28 | ) | ||||||||||||||||||||||||
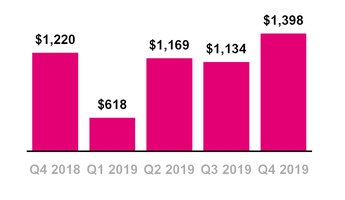
Free Cash Flow | 668 | 774 | 890 | 1,220 | 618 | 1,169 | 1,134 | 1,398 | 3,552 | 4,319 | |||||||||||||||||||||||||||||
Payments for merger-related costs | — | 17 | 23 | 46 | 34 | 151 | 124 | 133 | 86 | 442 | |||||||||||||||||||||||||||||
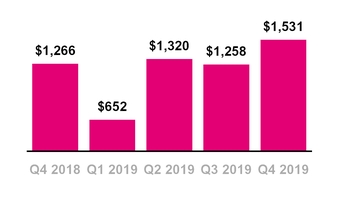
Free Cash Flow, excluding payments for merger-related costs | $ | 668 | $ | 791 | $ | 913 | $ | 1,266 | $ | 652 | $ | 1,320 | $ | 1,258 | $ | 1,531 | $ | 3,638 | $ | 4,761 | |||||||||||||||||||
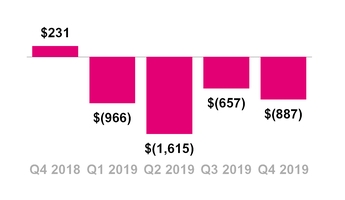
Net cash (used in) provided by investing activities | $ | (462 | ) | $ | (306 | ) | $ | (42 | ) | $ | 231 | $ | (966 | ) | $ | (1,615 | ) | $ | (657 | ) | $ | (887 | ) | $ | (579 | ) | $ | (4,125 | ) | ||||||||||
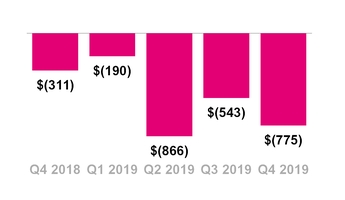
Net cash provided by (used in) financing activities | $ | 1,000 | $ | (3,267 | ) | $ | (758 | ) | $ | (311 | ) | $ | (190 | ) | $ | (866 | ) | $ | (543 | ) | $ | (775 | ) | $ | (3,336 | ) | $ | (2,374 | ) | ||||||||||
FY | |||||||
(in millions) | 2020 Guidance Range | ||||||
Net cash provided by operating activities (1) | $ | 7,900 | $ | 8,500 | |||
Cash purchases of property and equipment | (5,900 | ) | (6,200 | ) | |||
Proceeds related to beneficial interests in securitization transactions | 3,400 | 3,500 | |||||
Free Cash Flow | $ | 5,400 | $ | 5,800 | |||
(1) | Guidance for Net cash provided by operating activities excludes payments for merger-related costs and any settlement of interest rate swaps, which are not available without unreasonable effort and may be significant. The interest rate swaps will be settled upon the issuance of fixed-rate debt or the mandatory termination date of June 3, 2020. See Note 7 – Fair Value Measurements in our Annual Report on Form 10-K for the year ended December 31, 2019, for additional details. |
(in millions, except average number of customers and ARPU) | Quarter | Year Ended December 31, | |||||||||||||||||||||||||||||||||||||
Q1 2018 | Q2 2018 | Q3 2018 | Q4 2018 | Q1 2019 | Q2 2019 | Q3 2019 | Q4 2019 | 2018 | 2019 | ||||||||||||||||||||||||||||||
Calculation of Branded Postpaid Phone ARPU | |||||||||||||||||||||||||||||||||||||||
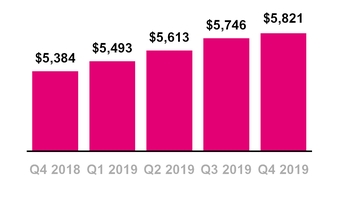
Branded postpaid service revenues | $ | 5,070 | $ | 5,164 | $ | 5,244 | $ | 5,384 | $ | 5,493 | $ | 5,613 | $ | 5,746 | $ | 5,821 | $ | 20,862 | $ | 22,673 | |||||||||||||||||||
Less: Branded postpaid other revenues | (259 | ) | (272 | ) | (289 | ) | (297 | ) | (310 | ) | (326 | ) | (346 | ) | (362 | ) | (1,117 | ) | (1,344 | ) | |||||||||||||||||||
Branded postpaid phone service revenues | $ | 4,811 | $ | 4,892 | $ | 4,955 | $ | 5,087 | $ | 5,183 | $ | 5,287 | $ | 5,400 | $ | 5,459 | $ | 19,745 | $ | 21,329 | |||||||||||||||||||
Divided by: Average number of branded postpaid phone customers (in thousands) and number of months in period | 34,371 | 35,051 | 35,779 | 36,631 | 37,504 | 38,226 | 38,944 | 39,736 | 35,458 | 38,602 | |||||||||||||||||||||||||||||
Branded postpaid phone ARPU | $ | 46.66 | $ | 46.52 | $ | 46.17 | $ | 46.29 | $ | 46.07 | $ | 46.10 | $ | 46.22 | $ | 45.79 | $ | 46.40 | $ | 46.04 | |||||||||||||||||||
Calculation of Branded Prepaid ARPU | |||||||||||||||||||||||||||||||||||||||
Branded prepaid service revenues | $ | 2,402 | $ | 2,402 | $ | 2,395 | $ | 2,399 | $ | 2,386 | $ | 2,379 | $ | 2,385 | $ | 2,393 | $ | 9,598 | $ | 9,543 | |||||||||||||||||||
Divided by: Average number of branded prepaid customers (in thousands) and number of months in period | 20,583 | 20,806 | 20,820 | 20,833 | 21,122 | 21,169 | 20,837 | 20,691 | 20,761 | 20,955 | |||||||||||||||||||||||||||||
Branded prepaid ARPU | $ | 38.90 | $ | 38.48 | $ | 38.34 | $ | 38.39 | $ | 37.65 | $ | 37.46 | $ | 38.16 | $ | 38.54 | $ | 38.53 | $ | 37.95 | |||||||||||||||||||

T-Mobile US, Inc. | ||
Investor Factbook | ||
T-Mobile US Reports Fourth Quarter and Full Year 2019 Results | ||
• | Record Service revenues of $8.7 billion, up 6% in Q4 2019 - up 6% to $34.0 billion in 2019 |
• | Record Total revenues of $11.9 billion, up 4% in Q4 2019 - up 4% to $45.0 billion in 2019 |
• | Strong Net income of $751 million, up 17% in Q4 2019 - up 20% to $3.5 billion in 2019 |
• | Diluted earnings per share (“EPS”) of $0.87, up 16% in Q4 2019 - up 20% to $4.02 in 2019 |
• | Record Q4 Adjusted EBITDA(1) of $3.2 billion, up 9% in Q4 2019 - up 8% to $13.4 billion in 2019 |
• | Strong Net cash provided by operating activities of $1.5 billion, up 61% in Q4 2019 - up 75% to $6.8 billion in 2019 |
• | Record Free Cash Flow(1) of $1.4 billion, up 15% in Q4 2019 - up 22% to $4.3 billion in 2019 |
• | 1.9 million total net additions in Q4 2019 - 7.0 million in 2019 - 6th year in a row of more than 5 million total net additions |
• | 1.3 million branded postpaid net additions in Q4 2019, best in industry - 4.5 million in 2019, best in industry |
• | 1.0 million branded postpaid phone net additions in Q4 2019, best in industry - 3.1 million in 2019, best in industry |
• | 77,000 branded prepaid net additions in Q4 2019 - 339,000 in 2019 |
• | Branded postpaid phone churn of 1.01% in Q4 2019, up 2 bps YoY - 0.89% in 2019, down 12 bps from 2018 |
• | Launched the first nationwide 5G network utilizing 600 MHz spectrum, forming the foundational 5G coverage layer for New T-Mobile; network covers more than 200 million people and more than 5,000 cities and towns |
• | 4G LTE on 600 MHz now covers 248 million people and 1.5 million square miles |
• | Currently, more than 33 million 600 MHz compatible devices already on our network |
• | Branded postpaid net additions of 2.6 to 3.6 million |
• | Net income is not available on a forward-looking basis(2) |
• | Adjusted EBITDA target of $13.7 to $14.0 billion, which includes leasing revenues of $450 to $550 million |
• | Cash purchases of property and equipment, including capitalized interest of approximately $400 million, are expected to be $5.9 to $6.2 billion. Cash purchases of property and equipment, excluding capitalized interest, are expected to be $5.5 to $5.8 billion |
• | In Q1 2020, pre-close merger-related costs are expected to be $200 to $300 million before taxes |
• | Net cash provided by operating activities, excluding payments for merger-related costs and any settlement of interest rate swaps, is expected to be in the range of $7.9 to $8.5 billion |
• | Free Cash Flow, excluding payments for merger-related costs and any settlement of interest rate swaps, is expected to be in the range of $5.4 to $5.8 billion |
(1) | Adjusted EBITDA and Free Cash Flow are non-GAAP financial measures. These non-GAAP financial measures should be considered in addition to, but not as a substitute for, the information provided in accordance with GAAP. Reconciliations for these non-GAAP financial measures to the most directly comparable financial measures are provided in the Reconciliation of Non-GAAP Financial Measures to GAAP Financial Measures tables. |
(2) | We are not able to forecast Net income on a forward-looking basis without unreasonable efforts due to the high variability and difficulty in predicting certain items that affect GAAP Net income including, but not limited to, Income tax expense, stock-based compensation expense and Interest expense. Adjusted EBITDA should not be used to predict Net income as the difference between the two measures is variable. |


▪ | Branded postpaid phone net customer additions were 1,001,000 in Q4 2019, compared to 754,000 in Q3 2019 and 1,020,000 in Q4 2018. This marks the 24th consecutive quarter that T-Mobile led the industry in branded postpaid phone net customer additions. |
▪ | Sequentially, the increase was primarily due to higher gross customer additions driven by seasonality, partially offset by higher churn. |
▪ | Year-over-year, the slight decrease was primarily due to higher deactivations from a growing customer base, partially offset by higher gross customer additions. |
▪ | Branded postpaid other net customer additions were 313,000 in Q4 2019, compared to 320,000 in Q3 2019 and 338,000 in Q4 2018. |
▪ | The sequential and year-over-year decreases were primarily due to higher deactivations from a growing customer base. |
▪ | Branded postpaid net customer additions were 1,314,000 in Q4 2019, compared to 1,074,000 in Q3 2019 and 1,358,000 in Q4 2018. |
▪ | Branded postpaid phone churn was 1.01% in Q4 2019, up 12 basis points from 0.89% in Q3 2019 and up 2 basis points from 0.99% in Q4 2018. |
▪ | Sequentially, the increase was primarily due to increased seasonal competitor promotional activity in the marketplace, partially offset by increased customer satisfaction and loyalty from ongoing improvements to network quality, industry-leading customer service and the overall value of our offerings. |
▪ | Year-over-year, branded postpaid phone churn was essentially flat. |
▪ | Branded postpaid phone net customer additions were 3,121,000 in 2019, compared to 3,097,000 in 2018. The increase was primarily driven by lower churn. |

▪ | Branded postpaid other net customer additions were 1,394,000 in 2019, compared to 1,362,000 in 2018. The increase was primarily due to additions from other connected devices, partially offset by higher deactivations from a growing customer base. |
▪ | Branded postpaid net customer additions were 4,515,000 in 2019, compared to 4,459,000 in 2018. Full-year 2019 branded postpaid net customer additions exceeded the top end of the revised and increased guidance range of 4.1 to 4.3 million provided in connection with Q3 2019 earnings. |
▪ | Branded postpaid phone churn was 0.89% in 2019, down 12 basis points compared to 1.01% in 2018 primarily from increased customer satisfaction and loyalty from ongoing improvements to network quality, industry-leading customer service and the overall value of our offerings. |
▪ | Branded prepaid net customer additions were 77,000 in Q4 2019, compared to 62,000 in Q3 2019 and 135,000 in Q4 2018. |
▪ | Sequentially, the increase was primarily due to the continued success of our prepaid brands due to seasonality, promotional activities and rate plan offers, partially offset by higher migrations to postpaid plans. |
▪ | Year-over-year, the decrease was primarily due to the impact of continued competitor promotional activities in the marketplace. |
▪ | Migrations to branded postpaid plans reduced branded prepaid net customer additions in Q4 2019 by approximately 160,000, up from 130,000 in Q3 2019 and flat from 160,000 in Q4 2018. |
▪ | On July 18, 2019, we entered into an agreement whereby certain T-Mobile branded prepaid products will now be offered and distributed by a current Mobile Virtual Network Operator (“MVNO”) partner. Upon the effective date, the agreement resulted in a base adjustment to reduce branded prepaid customers by 616,000 as we will no longer actively support the branded product offering. Prospectively, new customer activity associated with these products is recorded within Wholesale customers and revenue for these customers is recorded within Wholesale revenues in our Consolidated Statements of Comprehensive Income. |


▪ | Branded prepaid churn was 3.97% in Q4 2019, compared to 3.98% in Q3 2019 and 3.99% in Q4 2018. |
▪ | Sequentially and year-over-year, branded prepaid churn was essentially flat. |
▪ | For the full-year 2019, branded prepaid net customer additions were 339,000, compared to 460,000 in 2018. The decrease was primarily due to the impact of continued competitor promotional activities in the marketplace, partially offset by lower churn. |
▪ | Branded prepaid churn was 3.82% for the full-year 2019, down 14 basis points compared to 3.96% in 2018. The decrease was primarily due to increased customer satisfaction and loyalty from ongoing improvements to network quality and the continued success of our prepaid brands due to promotional activities and rate plan offers. |
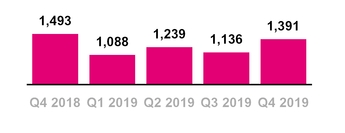
▪ | Total branded net customer additions were 1,391,000 in Q4 2019, compared to 1,136,000 in Q3 2019 and 1,493,000 in Q4 2018. |
▪ | For the full-year 2019, total branded net customer additions were 4,854,000 compared to 4,919,000 in 2018. |
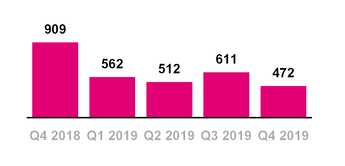
▪ | Wholesale net customer additions were 472,000 in Q4 2019, compared to 611,000 in Q3 2019 and 909,000 in Q4 2018. |
▪ | Sequentially, the decrease was primarily due to lower Machine-to-Machine (“M2M”) net additions. |
▪ | Year-over-year, the decrease was primarily due to lower M2M and MVNO net additions. |
▪ | For the full-year 2019, wholesale net customer additions were 2,157,000 compared to 2,125,000 in 2018. The increase was primarily due to the continued success of our M2M and MVNO partnerships. |
▪ | Starting in Q1 2020, we plan to discontinue reporting wholesale customers and instead focus on branded customers and wholesale revenues, which we consider more relevant than the number of wholesale customers given the expansion of M2M and Internet of Things (“IoT”) products. |

▪ | Total net customer additions were 1,863,000 in Q4 2019, compared to 1,747,000 in Q3 2019 and 2,402,000 in Q4 2018. This is the 27th consecutive quarter in which T-Mobile added more than one million total net customers. |
▪ | T-Mobile ended Q4 2019 with 86.0 million total customers, of which 67.9 million were total branded customers. |
▪ | For the full-year 2019, total net customer additions were 7,011,000 compared to 7,044,000 in 2018. This was the sixth consecutive year in which total net customer additions exceeded 5 million. |

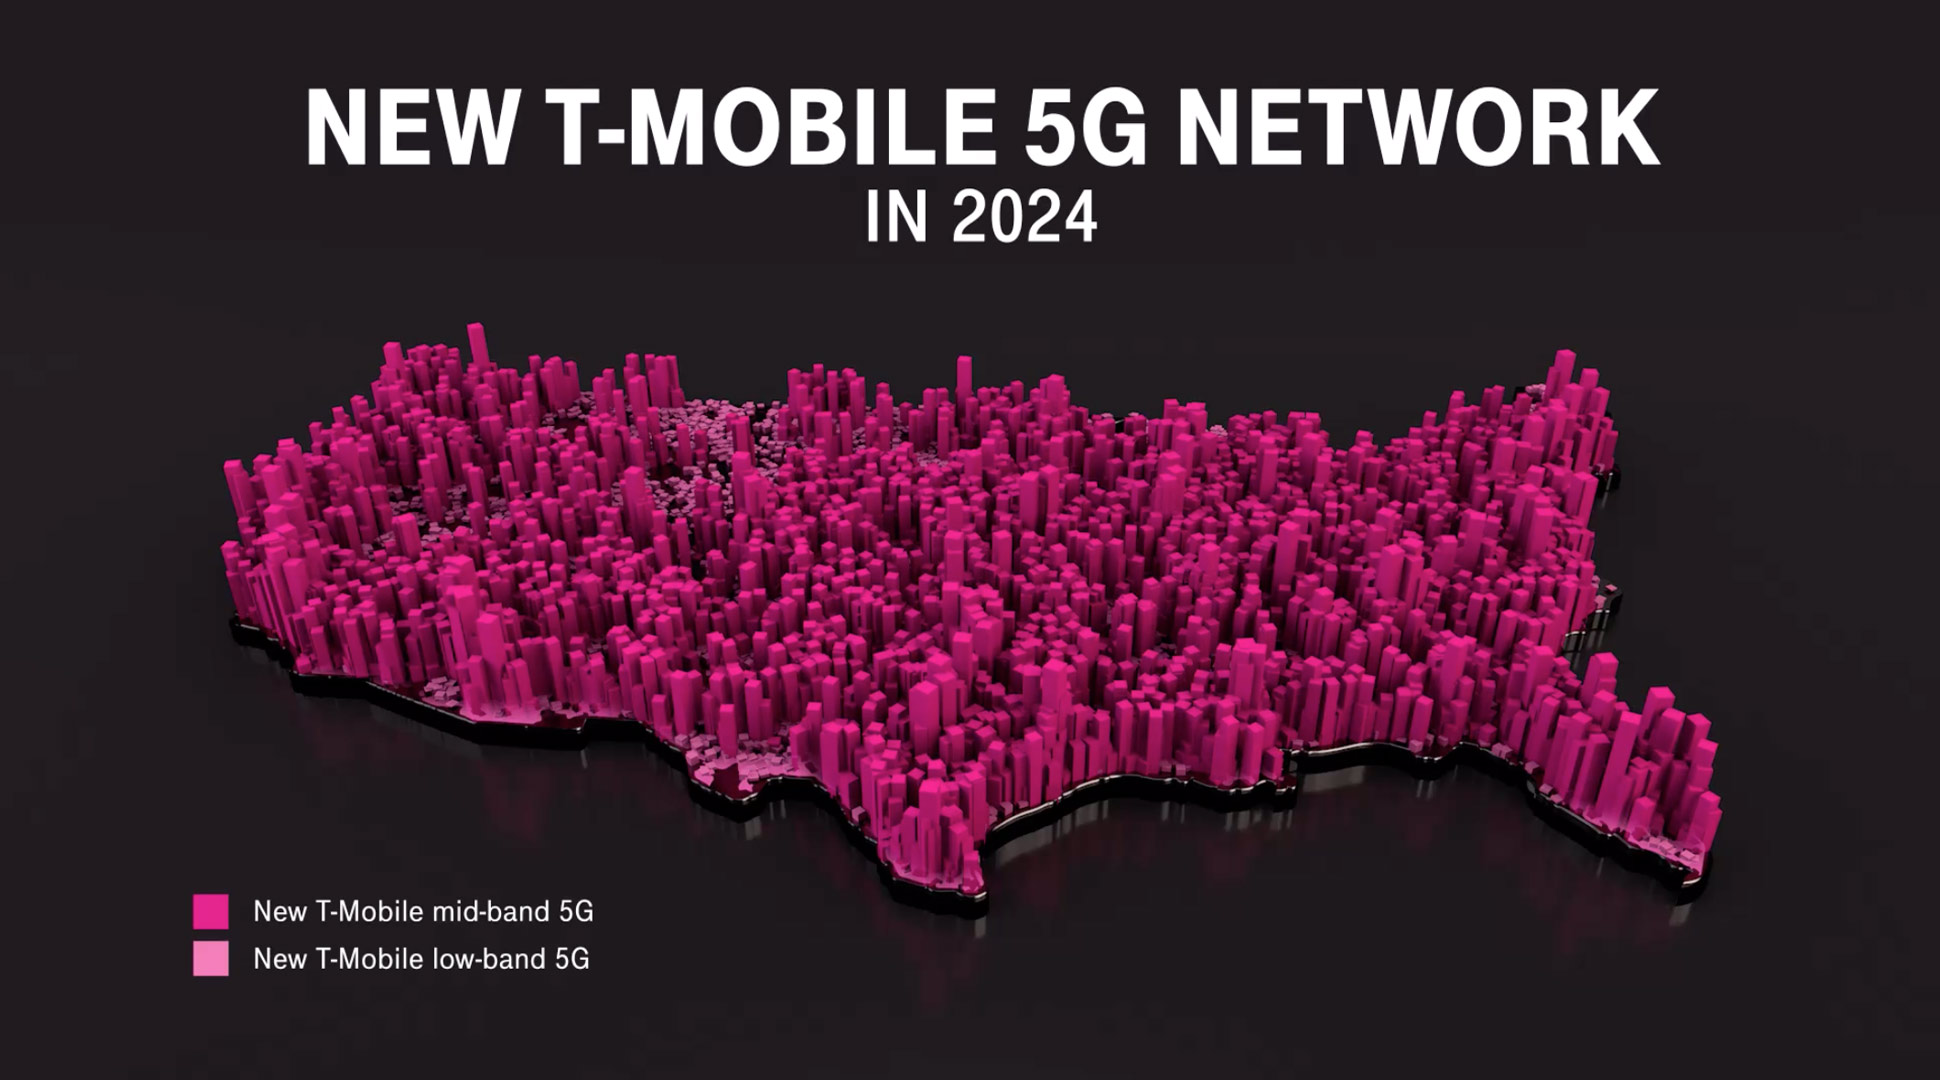
▪ | On December 2, 2019, T-Mobile launched America’s first nationwide 5G network, including prepaid 5G with Metro by T-Mobile, covering more than 200 million people and more than 5,000 cities and towns across over 1 million square miles with 5G. In addition, we introduced two new 600 MHz 5G capable superphones, the exclusive OnePlus 7T Pro 5G McLaren and the Samsung Galaxy Note10+ 5G and anticipate offering an industry-leading smartphone portfolio built to work on nationwide 5G in 2020. This 5G network is our foundational layer of 5G coverage on 600 MHz low-band spectrum. |
▪ | Should we close our merger with Sprint, we will rapidly deploy 5G on Sprint’s 2.5 GHz spectrum, completing the “layer cake” of spectrum and providing consumers with an unmatched 5G experience. |
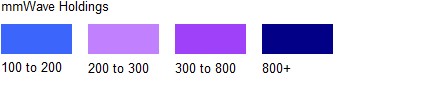
▪ | On June 28, 2019, T-Mobile introduced its 5G network using high-band millimeter wave (mmWave) spectrum in conjunction with the introduction of our first 5G handset, the Samsung Galaxy S10 5G. The 5G network on mmWave spectrum has been rolled out in parts of seven cities (New York City, Los Angeles, Dallas, Atlanta, Cleveland, Las Vegas and Miami). |
▪ | At the end of Q4 2019, T-Mobile owned a nationwide average of 31 MHz of 600 MHz low-band spectrum. In total, T-Mobile owns approximately 41 MHz of low-band spectrum (600 MHz and 700 MHz). The spectrum covers 100% of the U.S. |
▪ | As of the end of Q4 2019, T-Mobile had cleared 275 million POPs and expects to clear the remaining 600 MHz spectrum POPs in 2020. |
▪ | T-Mobile continues its deployment of LTE on 600 MHz spectrum using 5G-ready equipment. At the end of Q4 2019, we were live with 4G LTE in nearly 8,900 cities and towns in 49 states and Puerto Rico covering 1.5 million square miles and 248 million POPs. |
▪ | Combining 600 and 700 MHz spectrum, we have deployed 4G LTE in low-band spectrum to 316 million POPs. |
▪ | Currently, more than 33 million devices on T-Mobile’s network are compatible with 600 MHz spectrum. |


▪ | At the end of Q4 2019, T-Mobile owned an average of 111 MHz of spectrum nationwide, not including mmWave spectrum. The spectrum comprises an average of 31 MHz in the 600 MHz band, 10 MHz in the 700 MHz band, 29 MHz in the 1900 MHz PCS band, and 41 MHz in the AWS band. |
▪ | On June 3, 2019, the FCC announced the results of Auctions 101 (28 GHz spectrum) and 102 (24 GHz spectrum). In the combined auctions, T-Mobile spent $842 million to more than quadruple its nationwide average total mmWave spectrum holdings from 104 MHz to 471 MHz. |
▪ | We will evaluate future spectrum purchases in upcoming auctions and in the secondary market to further augment our current spectrum position. We are not aware of any such spectrum purchase options that come close to matching the efficiencies and synergies possible from merging with Sprint. |
▪ | T-Mobile continues to expand its coverage breadth and covered 327 million people with 4G LTE at the end of Q4 2019. |
▪ | At the end of Q4 2019, T-Mobile had equipment deployed on approximately 66,000 macro cell sites and 25,000 small cell/distributed antenna system sites. |
▪ | Due to industry spectrum limitations (especially in mid-band), T-Mobile continues to make efforts to expand its capacity and increase the quality of its network through the re-farming of existing spectrum and implementation of new technologies including Voice over LTE (“VoLTE”), Carrier Aggregation, 4x4 multiple-input and multiple-output (“MIMO”), 256 Quadrature Amplitude Modulation (“QAM”) and License Assisted Access (“LAA”). |
▪ | VoLTE comprised 90% of total voice calls in Q4 2019, flat with 90% in Q3 2019 and up from 87% in Q4 2018. |
▪ | Carrier aggregation is live for T-Mobile customers in 969 markets, up from 956 markets in Q3 2019 and 923 in Q4 2018. |
▪ | 4x4 MIMO is currently available in 708 markets, up from 683 markets in Q3 2019 and 564 in Q4 2018. |
▪ | T-Mobile customers have 256 QAM available across the Un-carrier’s entire 4G LTE footprint. |

▪ | T-Mobile is the first carrier globally to have rolled out the combination of carrier aggregation, 4x4 MIMO and 256 QAM. This trifecta of standards has been rolled out to 701 markets, up from 674 markets in Q3 2019 and 549 markets in Q4 2018. |
▪ | LAA has been deployed to 30 cities including Atlanta, Austin, Chicago, Denver, Houston, Las Vegas, Los Angeles, Miami, New Orleans, New York, Philadelphia, Sacramento, San Diego, Seattle, and Washington, DC. |
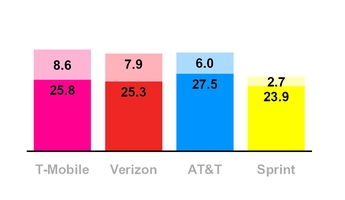
▪ | Based on data from Opensignal for Q4 2019, T-Mobile’s average download speed was 25.8 Mbps, AT&T at 27.5 Mbps, Verizon at 25.3 Mbps, and Sprint at 23.9 Mbps. |
▪ | Based on data from Opensignal for Q4 2019, T-Mobile’s average upload speed was 8.6 Mbps, compared to Verizon at 7.9 Mbps, AT&T at 6.0 Mbps, and Sprint at 2.7 Mbps. |


▪ | On April 29, 2018, T-Mobile entered into a Business Combination Agreement with Sprint to merge in an all-stock transaction at a fixed exchange ratio of 0.10256 shares of T-Mobile common stock for each share of Sprint common stock, or 9.75 shares of Sprint common stock for each share of T-Mobile common stock (the “Merger”). The Merger, and other transactions contemplated by the Business Combination Agreement, are referred to as the “Transactions.” |
▪ | The combined company will be named “T-Mobile” and, as a result of the Merger, is expected to be able to build upon our recently launched foundational 5G network of 600 MHz spectrum to deliver transformational broad and deep 5G with crazy-fast speeds for customers nationwide, accelerate innovation and supercharge competition in the U.S. wireless, video and broadband industries. With real, nationwide 5G for All, the New T-Mobile will open massive wireless highways and lower prices for all Americans, helping to ignite innovation and challenge a failed status quo. Neither T-Mobile nor Sprint on its own could generate comparable benefits to consumers. The combined company is expected to trade under the “TMUS” symbol on NASDAQ. |
▪ | The Transactions are subject to certain closing conditions: |
▪ | We received approval from CFIUS and Team Telecom in December 2018. |
▪ | We received favorable action from 18 of the 19 state utility commissions conducting reviews with only the California Public Utility Commission (PUC) still outstanding. |
▪ | In June 2019, a number of state attorneys general filed a lawsuit against us, Deutsche Telekom, Sprint, and SoftBank in the U.S. District Court for the Southern District of New York, alleging that the Merger, if consummated, would violate Section 7 of the Clayton Act and so should be enjoined. We believe the plaintiffs’ claims are without merit, and have defended the case vigorously. The trial concluded and we are now waiting for the trial court’s ruling. |
▪ | In July 2019, T-Mobile and Sprint received clearance for the Merger from the U.S. Department of Justice by entering into a consent decree. The DOJ consent decree is still subject to the final Tunney Act review, which is expected to conclude in February 2020. |
▪ | In July 2019, T-Mobile and Sprint also entered into agreements with DISH Network Corporation to divest Sprint’s prepaid businesses and 800 MHz spectrum assets to DISH for total proceeds of $5.0 billion. Additionally, the companies will enter into commercial agreements to provide the transferred prepaid and new DISH wireless customers access to the New T-Mobile network for seven years. |
▪ | The Federal Communications Commission (“FCC”) approved the Merger on November 5, 2019. |
▪ | We remain confident about completing the final steps for the Merger. |
▪ | We expect the Merger will be permitted to close in early 2020. |
▪ | In Q4 2019, costs related to the Sprint transaction were $126 million before taxes compared to $159 million in Q3 2019 and $102 million in Q4 2018. These costs impacted Selling, general, and administrative (“SG&A”) expenses and Net income but are excluded from Adjusted EBITDA. |
▪ | In Q1 2020, pre-close merger-related costs are expected to be $200 million to $300 million before taxes. |
Devices Sold or Leased | |||||
(in million units) | |||||
Q4 2018 | Q3 2019 | Q4 2019 | |||
Total Company | |||||
Phones | 8.3 | 7.4 | 8.3 | ||
Mobile broadband and IoT devices | 0.7 | 0.6 | 0.8 | ||
Total Company | 9.0 | 8.0 | 9.1 | ||

▪ | Total devices sold or leased were 9.1 million units in Q4 2019, compared to 8.0 million units in Q3 2019 and 9.0 million units in Q4 2018. |
▪ | Total phones (smartphones and non-smartphones) sold or leased were 8.3 million units in Q4 2019, compared to 7.4 million units in Q3 2019 and 8.3 million units in Q4 2018. |
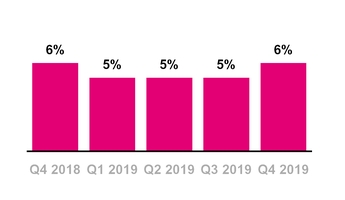
▪ | The branded postpaid upgrade rate was approximately 6% in Q4 2019, up sequentially from 5% in Q3 2019 and flat year-over-year. |


▪ | T-Mobile provided $2.24 billion in gross EIP device financing to its customers in Q4 2019, up 45.6% from $1.54 billion in Q3 2019 and essentially flat compared to $2.20 billion in Q4 2018. |
▪ | Sequentially, the increase was primarily due to higher EIP unit sales. |
▪ | Year-over-year, gross EIP device financing was essentially flat. |
▪ | Customers on T-Mobile plans had associated EIP billings of $1.76 billion in Q4 2019, up 4.4% from $1.69 billion in Q3 2019 and up 5.9% from $1.66 billion in Q4 2018. EIP billings include prepayments and adjustments. |
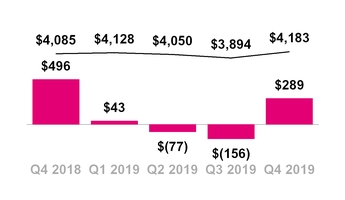
▪ | Total EIP receivables, net of imputed discount and allowances for credit losses, were $4.18 billion at the end of Q4 2019, compared to $3.89 billion at the end of Q3 2019 and $4.09 billion at the end of Q4 2018. |
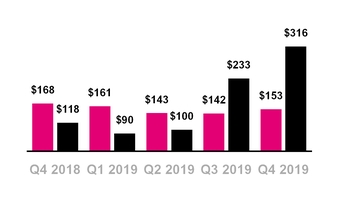
▪ | Leased devices transferred to property and equipment from inventory, net, was $316 million in Q4 2019, compared to $233 million in Q3 2019 and $118 million in Q4 2018. |
▪ | The sequential and year-over year increases were primarily due to a higher number of devices leased. |
▪ | Depreciation expense associated with leased devices was $126 million in Q4 2019, compared to $107 million in Q3 2019 and $234 million in Q4 2018. |
▪ | Leased devices included in property and equipment, net was $732 million at the end of Q4 2019, compared to $543 million at the end of Q3 2019 and $537 million at the end of Q4 2018. |
▪ | Lease revenues were $153 million in Q4 2019, compared to $142 million in Q3 2019 and $168 million in Q4 2018. |

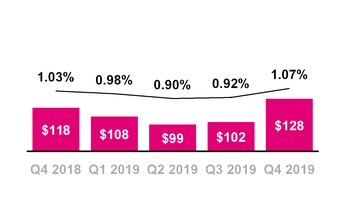
▪ | Total bad debt expense and losses from sales of receivables was $128 million in Q4 2019, compared to $102 million in Q3 2019 and $118 million in Q4 2018. |
▪ | As a percentage of total revenues, total bad debt expense and losses from sales of receivables was 1.07% in Q4 2019, compared to 0.92% in Q3 2019 and 1.03% in Q4 2018. |
▪ | Sequentially, total bad debt expense and losses from sales of receivables increased by $26 million. As a percentage of Total revenues, bad debt expense and losses from sales of receivables increased by 15 basis points. These increases were primarily driven by seasonality and certain one-time benefits which occurred in Q3 2019. |
▪ | Year-over-year, total bad debt expense and losses from sales of receivables increased by $10 million. As a percentage of Total revenues, bad debt expense and losses from sales of receivables increased by 4 basis points. |
▪ | For full-year 2019, total bad debt expense and losses from sales of receivables decreased to $437 million from $454 million in 2018. As a percentage of Total revenues, total bad debt expense and losses from sales of receivables was 0.97% in 2019 compared to 1.05% in 2018. The decreases in both measures reflect our ongoing focus on managing customer quality. |
▪ | Including the EIP receivables sold, total EIP receivables classified as Prime were 53% of total EIP receivables at the end of Q4 2019, compared to 52% at the end of Q3 2019 and 53% at the end of Q4 2018. |

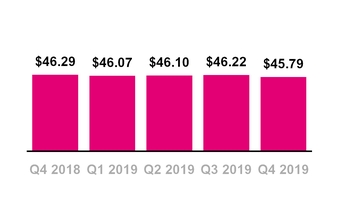
▪ | Branded postpaid phone ARPU was $45.79 in Q4 2019, down 0.9% from $46.22 in Q3 2019 and down 1.1% from $46.29 in Q4 2018. |
▪ | Sequentially, the decrease was primarily due to dilution from promotional activities and a reduction in the non-cash, non-recurring benefit related to Data Stash, as the majority of impacted customers had transitioned to unlimited plans by Q3 2019, partially offset by the growing success of new customer segments and rate plans. |
▪ | Year-over-year, the decrease was primarily due to dilution from promotional activities, a reduction in regulatory program revenues from the continued adoption of tax inclusive plans and a reduction in the non-cash, non-recurring benefit related to Data Stash as the majority of impacted customers had transitioned to unlimited plans by Q3 2019, partially offset by the growing success of new customer segments and rate plans and higher premium services revenue. |
▪ | For full-year 2019, branded postpaid phone ARPU was $46.04, down 0.8% from $46.40 in 2018, primarily from an increase in promotional activities, including the ongoing growth in our Netflix offering, which totaled $0.54 for 2019, and decreased branded postpaid phone ARPU by $0.19 compared to 2018, a reduction in regulatory program revenues from the continued adoption of tax inclusive plans and a reduction in certain non-recurring charges, partially offset by higher premium services revenue and the growing success of new customer segments and rate plans. |
▪ | We expect Branded postpaid phone ARPU in full-year 2020 to be generally stable compared to full-year 2019 within a range of plus 1% to minus 1%. |
▪ | Starting in Q1 2020, we plan to report Average Revenue per Postpaid Account or Postpaid ARPA in addition to our existing ARPU metrics, reflecting the increasing importance of non-phone devices to our customers. We also plan to discontinue reporting branded postpaid customers per account. |


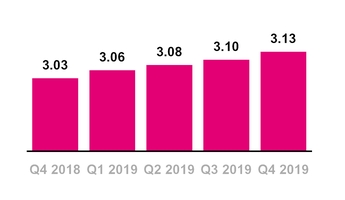
▪ | Branded postpaid customers per account was 3.13 at the end of Q4 2019, compared to 3.10 at the end of Q3 2019 and 3.03 at the end of Q4 2018. |
▪ | The sequential and year-over-year increases were primarily due to the continued growth of new customer segments and rate plans such as Unlimited 55+, Military, Business and Essentials, promotional activities targeting families and the continued success of other connected devices and wearables, specifically the Apple Watch. |
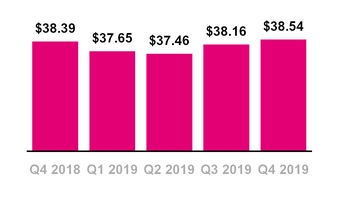
▪ | Branded prepaid ARPU was $38.54 in Q4 2019, up 1.0% from $38.16 in Q3 2019 and essentially flat compared to $38.39 in Q4 2018. |
▪ | Sequentially, the increase was primarily due to certain one-time tax benefits and the removal of certain branded prepaid customers associated with products now offered and distributed by a current MVNO partner as those customers had lower ARPU, partially offset by dilution from promotional activity. |
▪ | Year-over-year, the slight increase was primarily due to a combination of offsetting factors including the removal of certain branded prepaid customers associated with products now offered and distributed by a current MVNO partner as those customers had lower ARPU and certain one-time tax benefits, offset by dilution from promotional activity, a reduction in certain one-time charges, and the growth in our Amazon Prime offering - included as a benefit with certain Metro by T-Mobile unlimited rate plans as of Q4 2018 - which impacted branded prepaid ARPU by $0.39 in Q4 2019 and decreased branded prepaid ARPU by $0.27 compared to Q4 2018. |
▪ | For full-year 2019, branded prepaid ARPU was $37.95, down 1.5% compared to $38.53 in 2018, primarily from dilution from promotional activity and the growth in our Amazon Prime offering - included as a benefit with certain Metro by T-Mobile unlimited rate plans as of Q4 2018 - which impacted branded prepaid ARPU by $0.39 in 2019 and decreased branded prepaid ARPU by $0.36 compared to 2018, partially offset by the removal of certain branded prepaid customers associated with products now offered and distributed by a current MVNO partner as those customers had lower ARPU. |


▪ | T-Mobile again led the industry in year-over-year Service revenue percentage growth in Q4 2019. This marks the 23rd consecutive quarter that T-Mobile led the industry in this measure. |
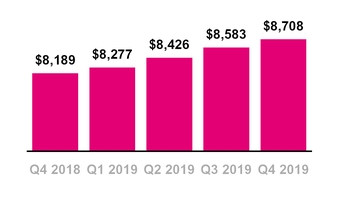
▪ | Service revenues were a record-high $8.71 billion in Q4 2019, up 1.5% from $8.58 billion in Q3 2019 and up 6.3% from $8.19 billion in Q4 2018. |
▪ | Sequentially, the increase was primarily due to a 1.3% increase in Branded postpaid revenues, primarily due to higher average branded postpaid phone customers from growth in our customer base driven by the continued growth in existing and Greenfield markets, including the growing success of new customer segments and rate plans such as Unlimited 55+, Military, Business and Essentials, partially offset by lower branded postpaid phone ARPU. |
▪ | Year-over-year, the increase was primarily due to an 8.1% increase in Branded postpaid revenues, primarily due to higher average branded postpaid phone customers from growth in our customer base driven by the continued growth in existing and Greenfield markets, including the growing success of new customer segments and rate plans such as Unlimited 55+, Military, Business and Essentials, along with higher average branded postpaid other customers driven by higher other connected devices and wearables, specifically the Apple Watch, partially offset by lower branded postpaid phone ARPU. |
▪ | For the full-year 2019, Service revenues were $33.99 billion, up 6.3% compared to $31.99 billion in 2018, driven by an 8.7% increase in Branded postpaid revenues, primarily due to higher average branded postpaid phone customers, primarily from growth in our customer base driven by the continued growth in existing and Greenfield markets including the growing success of new customer segments and rate plans such as Unlimited 55+, Military, Business and Essentials, along with higher average branded postpaid other customers, driven by higher other connected devices and wearables, specifically the Apple Watch, partially offset by lower branded postpaid phone ARPU. |


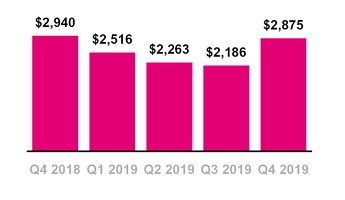
▪ | Equipment revenues were $2.88 billion in Q4 2019, up 31.5% from $2.19 billion in Q3 2019 and down 2.2% from $2.94 billion in Q4 2018. Equipment revenues in Q4 2019 were comprised of lease revenues of $153 million and non-lease revenues of $2.72 billion. |
▪ | Sequentially, the increase was primarily due to higher average revenue per device sold, excluding purchased leased devices, driven by an increase in the high-end device mix and a 14% increase in the number of devices sold, excluding purchased leased devices, partially driven by seasonality. |
▪ | Year-over-year, the decrease was primarily due to lower average revenue per device sold, driven by increased promotions, and a 1% decrease in the number of devices sold, excluding purchased leased devices. |
▪ | For the full-year 2019, Equipment revenues were $9.84 billion, down 2% compared to $10.01 billion in 2018. Equipment revenues in 2019 were comprised of lease revenues of $599 million and non-lease revenues of $9.24 billion. The decrease was primarily due to: |
▪ | A decrease of $94 million in device sales revenues, excluding purchased leased devices, primarily due to a 7% decrease in the number of devices sold, excluding purchased leased devices, partially offset by higher average revenue per device sold primarily due to an increase in the high-end device mix; and |
▪ | A decrease of $93 million in lease revenues primarily due to a lower number of customer devices under lease, partially offset by higher revenue per device under lease. |
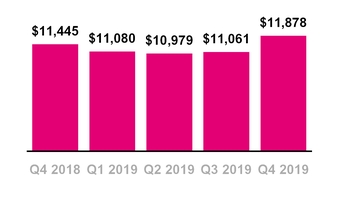
▪ | Total revenues were a record-high $11.88 billion in Q4 2019, up 7.4% from $11.06 billion in Q3 2019 and up 3.8% from $11.45 billion in Q4 2018. |
▪ | For the full-year 2019, Total revenues were $45.00 billion, up 4% compared to $43.31 billion in 2018. This marks the sixth consecutive year that T-Mobile has led the industry in Total revenue percentage growth. |

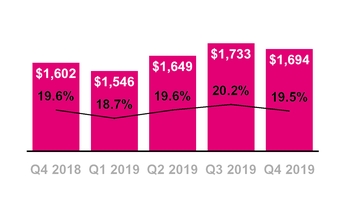
▪ | Cost of services, exclusive of depreciation and amortization (“D&A”), was $1.69 billion in Q4 2019, down 2.3% from $1.73 billion in Q3 2019 and up 5.7% from $1.60 billion in Q4 2018. |
▪ | Sequentially, the decrease was primarily due to lower regulatory program costs and roaming expenses, partially offset by higher costs for network expansion. |
▪ | As a percentage of Service revenues, Cost of Services, exclusive of D&A, decreased by 70 basis points sequentially. |
▪ | Year-over-year, the increase was primarily due to higher costs for network expansion, expenses from new leases, regulatory program costs, and employee-related expenses, partially offset by the positive impact of the new lease standard of approximately $95 million in Q4 2019. |
▪ | As a percentage of Service revenues, Cost of services, exclusive of D&A, decreased by 10 basis points year-over-year. |
▪ | For the full-year 2019, Cost of services, exclusive of D&A, was $6.62 billion, up 5% compared to $6.31 billion in 2018. This increase was primarily due to: |
▪ | Higher costs for employee-related expenses, network expansion, expenses from new leases and repair and maintenance; |
▪ | Hurricane-related reimbursements, net of costs, of $76 million in 2018, compared to no significant impacts from hurricanes in 2019; and |
▪ | Higher spectrum lease expense from the reciprocal long-term lease agreement with Sprint executed during Q4 2018; partially offset by |
▪ | The positive impact of the new lease standard of approximately $380 million in 2019; and |
▪ | Lower regulatory program costs. |
▪ | As a percentage of Service revenues, Cost of services, exclusive of D&A, declined 20 basis points from 19.7% in 2018 to 19.5% in 2019. |

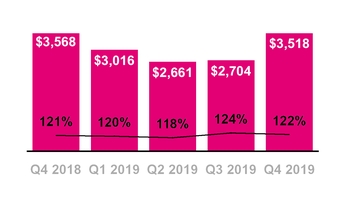
▪ | Cost of equipment sales, exclusive of D&A, was $3.52 billion in Q4 2019, up 30.1% from $2.70 billion in Q3 2019 and down 1.4% from $3.57 billion in Q4 2018. |
▪ | Sequentially, the increase was primarily due to a higher average cost per device sold, excluding purchased leased devices, driven by an increase in the high-end device mix, and a 14% increase in the number of devices sold, excluding purchased leased devices, partially driven by seasonality. |
▪ | Year-over-year, the decrease was primarily due to a 1% decrease in the number of devices sold, excluding purchased leased devices, and a decrease in warranty costs, partially offset by a higher average cost per device sold due to an increase in the high-end device mix. |
▪ | For the full-year 2019, Cost of equipment sales, exclusive of D&A, was $11.90 billion, down 1% compared to $12.05 billion in 2018. This decrease was primarily due to: |
▪ | A decrease of $98 million in device cost of equipment sales, excluding purchased lease devices, primarily from a 7% decrease in the number of devices sold, excluding purchased leased devices, partially offset by a higher average cost per device sold due to an increase in the high-end device mix; |
▪ | A decrease of $30 million in returned handset expenses due to reduced device sales; |
▪ | A decrease in leased device cost of equipment sales, primarily due to lower leased device returns; and |
▪ | A decrease in extended warranty costs, primarily due to a lower volume of purchased handsets for warranty replacement; partially offset by |
▪ | An increase in costs related to the liquidation of inventory. |


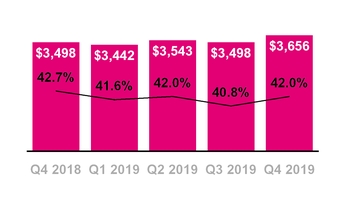
▪ | SG&A expense was $3.66 billion in Q4 2019, up 4.5% from $3.50 billion in Q3 2019 and up 4.5% from $3.50 billion in Q4 2018. |
▪ | Sequentially, the increase was primarily due to the seasonal increase in advertising expenses and higher commissions expense driven by increased customer additions and an increase of $27 million in amortization expense related to commission costs that were capitalized, beginning upon the adoption of ASC 606 on January 1, 2018, and higher bad debt expense. |
▪ | As a percentage of Service revenues, SG&A expense increased 120 basis points sequentially. |
▪ | Merger-related costs were $126 million in Q4 2019, compared to $159 million in Q3 2019. As a percentage of Service revenues, excluding merger-related costs, SG&A expense increased 160 basis points sequentially. |
▪ | Year-over-year, the increase was primarily due to higher employee-related costs primarily due to annual pay increases and growth in headcount and higher commissions expense resulting primarily from an increase of $93 million in amortization expense related to commission costs that were capitalized, beginning upon the adoption of ASC 606 on January 1, 2018, partially offset by lower advertising expenses. |
▪ | As a percentage of Service revenues, SG&A expense decreased 70 basis points year-over-year. |
▪ | Merger-related costs were $126 million in Q4 2019, compared to $102 million in Q4 2018. As a percentage of Service revenues, excluding merger-related costs, SG&A expense decreased 100 basis points year-over-year. |
▪ | For the full-year 2019, SG&A expenses were $14.14 billion, up 7% compared to $13.16 billion in 2018. This increase was primarily due to: |
▪ | Merger-related costs of $620 million in Q4 2019, compared to $196 million in Q4 2018; |
▪ | Higher commissions expense resulting from an increase of $337 million in amortization expense related to commission costs that were capitalized, beginning upon the adoption of ASC 606 on January 1, 2018; |
▪ | Higher employee-related costs primarily due to annual pay increases and growth in headcount; and |

▪ | Higher costs related to outsourced functions; partially offset by |
▪ | Lower commissions expense from lower branded prepaid customer additions and compensation structure changes; and |
▪ | Lower advertising costs. |
▪ | As a percentage of Service revenues, SG&A expenses increased 50 basis points to 41.6% during 2019. As a percentage of Service revenues, excluding merger-related costs, SG&A expense decreased 70 basis points. |
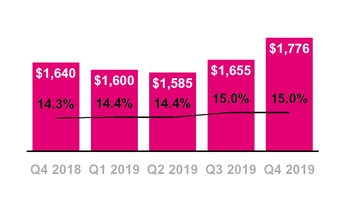
▪ | D&A was $1.78 billion in Q4 2019, up 7.3% from $1.66 billion in Q3 2019 and up 8.3% from $1.64 billion in Q4 2018. |
▪ | D&A related to leased devices was $126 million in Q4 2019, compared to $108 million in Q3 2019 and $234 million in Q4 2018. |
▪ | Non-lease-related D&A was $1.65 billion in Q4 2019, compared to $1.55 billion in Q3 2019 and $1.41 billion in Q4 2018. |
▪ | Sequentially, and year-over-year, the increase was primarily from network expansion, including the continued deployment of low band spectrum, including 600 MHz, and the nationwide launch of our 5G network and higher costs related to the acceleration of depreciation for certain assets due to our accelerated 600 MHz build-out and 5G nationwide launch. |
▪ | For the full-year 2019, D&A was $6.62 billion, up 2% compared to $6.49 billion in 2018 primarily from network expansion, including the continued deployment of low band spectrum, including 600 MHz, and the nationwide launch of our 5G network and higher costs related to the acceleration of depreciation for certain assets due to our accelerated 600 MHz build-out and 5G nationwide launch, partially offset by lower depreciation expense resulting from a lower total number of customer devices under lease. |


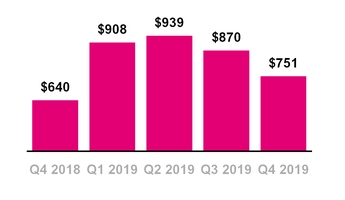
▪ | Net income was $751 million in Q4 2019, down 14% from $870 million in Q3 2019 and up 17% from $640 million in Q4 2018. EPS was $0.87 in Q4 2019, down from $1.01 in Q3 2019 and up from $0.75 in Q4 2018. |
▪ | Sequentially, the decreases in Net income and EPS were primarily due to lower Operating income, partially offset by lower Income tax expense. Net income and EPS were impacted by the following: |
◦ | Merger-related costs for Q4 2019 of $105 million and $0.12, respectively, compared to $128 million and $0.15 in Q3 2019, respectively. |
◦ | The sequential impact from commission costs capitalized and amortized, beginning upon the adoption of ASC 606 on January 1, 2018, reduced Net income and EPS by $20 million and $0.02, respectively. |
▪ | Year-over-year, the increases in Net income and EPS were primarily due to higher Operating income. Net income and EPS were impacted by the following: |
◦ | Merger-related costs for Q4 2019 of $105 million and $0.12, respectively, compared to $88 million and $0.10 in Q4 2018, respectively. |
◦ | The year-over-year impact from commission costs capitalized and amortized, beginning upon the adoption of ASC 606 on January 1, 2018, reduced Net income and EPS by $69 million and $0.08, respectively. |
◦ | The negative impact of hurricane costs, net of insurance reimbursements, for Q4 2018 of $11 million and $0.01, respectively. There were no significant impacts from hurricanes in 2019. |
◦ | The positive impact of the new lease standard for Q4 2019 of approximately $44 million and $0.05, respectively. |
▪ | Net income margin was 8.6% in Q4 2019, compared to 10.1% in Q3 2019 and 7.8% in Q4 2018. Net income margin is calculated as Net income divided by Service revenues. |
▪ | For the full-year 2019, Net income was $3.47 billion up 20% from $2.89 billion in 2018 and EPS was $4.02, up from $3.36 in 2018. |
▪ | The increases in Net income and EPS were primarily due to higher Operating income and lower Interest expense to affiliates and Interest expense. Net income and EPS were impacted by the following: |
◦ | Merger-related costs for 2019 of $501 million and $0.58, respectively, compared to $180 million and $0.21 in 2018, respectively. |
◦ | The 2019 impact from commission costs capitalized and amortized, beginning upon the adoption of ASC 606 on January 1, 2018, reduced Net income and EPS by $249 million and $0.29, respectively. |
◦ | The positive impact of hurricane-related reimbursements, net of costs, for 2018 of $99 million and $0.12, respectively. There were no significant impacts from hurricanes in 2019. |
◦ | The positive impact of the new lease standard for 2019 of approximately $175 million and $0.20, respectively. |
▪ | Net income margin was 10.2% in 2019, compared to 9.0% in 2018. |
▪ | The effective tax rate for was 22% for Q4 2019 and 25% for full-year 2019, at the low end of our 2019 guidance range of 25% to 26% due to the favorable rate impact of certain non-recurring legal entity restructuring in 2019. For full-year 2020, the effective tax rate is expected to be 26% to 27%. |

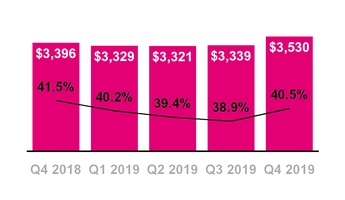
▪ | Adjusted EBITDA was $3.24 billion in Q4 2019, down 4.5% from $3.40 billion in Q3 2019 and up 9.2% from $2.97 billion in Q4 2018. |
▪ | Sequentially, the decrease in Adjusted EBITDA was primarily due to higher Selling, general and administrative expenses, excluding merger-related costs, and higher net losses on equipment sales, partially offset by higher Service revenues. |
▪ | Year-over-year, the increase in Adjusted EBITDA was primarily due to higher Service revenues and the positive impact of the new lease standard of approximately $49 million, partially offset by higher Selling, general and administrative expenses, excluding merger-related costs, and higher Cost of services expenses. |
▪ | The impact from commission costs capitalized and amortized, beginning upon the adoption of ASC 606 on January 1, 2018, reduced Adjusted EBITDA by $27 million sequentially and $93 million year-over-year. |
▪ | The negative impact of hurricane costs, net of insurance reimbursements, was $14 million in Q4 2018. There was no significant impact from hurricanes in 2019. |
▪ | Adjusted EBITDA excludes merger-related costs of $126 million in Q4 2019 compared to $159 million in Q3 2019 and $102 million in Q4 2018. |
▪ | Adjusted EBITDA margin was 37.2% in Q4 2019, compared to 39.6% in Q3 2019 and 36.3% in Q4 2018. Adjusted EBITDA margin is calculated as Adjusted EBITDA divided by Service revenues. |
▪ | For full-year 2019, Adjusted EBITDA was $13.38 billion, up 8% compared to $12.40 billion in 2018. This increase was primarily due to higher Service revenues and the positive impact of the new lease standard of approximately $195 million, partially offset by higher Selling, general and administrative expenses, excluding merger-related costs, higher Cost of services expenses and the positive impact of hurricane-related reimbursements, net of costs, of $158 million in 2018. There was no significant impact from hurricanes in 2019. |
▪ | The impact from commission costs capitalized and amortized, beginning upon the adoption of ASC 606 on January 1, 2018, reduced Adjusted EBITDA by $337 million in 2019 compared to 2018. |
▪ | Adjusted EBITDA excludes merger-related costs of $620 million in 2019 compared to $196 million in 2018. |
▪ | Adjusted EBITDA margin was 39.4% in 2019, compared to 38.8% in 2018. |


▪ | Cash purchases of property and equipment were $1.16 billion in Q4 2019, compared to $1.51 billion in Q3 2019 and $1.18 billion in Q4 2018. |
▪ | Sequentially, the decrease was primarily due to expenditures for the accelerated launch of our 5G network and the continued build-out of our 600 MHz low-band spectrum which were more front-loaded in 2019. |
▪ | Year-over-year, cash purchases of property and equipment were essentially flat. |
▪ | Cash purchases of property and equipment, excluding capitalized interest, were $1.05 billion in Q4 2019, compared to $1.40 billion in Q3 2019 and $1.07 billion in Q4 2018. |
▪ | Capitalized interest included in cash purchases of property and equipment was $112 million in Q4 2019, compared to $118 million in Q3 2019 and $116 million in Q4 2018. |
▪ | For full-year 2019, cash purchases of property and equipment were $6.39 billion compared to $5.54 billion in 2018. The increase was primarily due to expenditures for the accelerated launch of our 5G network and the continued build-out of our 600 MHz low-band spectrum. |
▪ | Cash purchases of property and equipment, excluding capitalized interest, were $5.92 billion in 2019 compared to $5.18 billion in 2018. |
▪ | Capitalized interest included in cash capital expenditures was $473 million in 2019 compared to $362 million in 2018. |

▪ | Net cash provided by operating activities was $1.54 billion in Q4 2019, compared to $1.75 billion in Q3 2019 and $954 million in Q4 2018. |
▪ | Sequentially, the decrease was primarily due to higher net cash outflows from changes in working capital and lower Net income and net non-cash adjustments to Net income. |
◦ | The change in working capital was primarily due to higher use from Equipment installment plan receivables, Inventories and Accounts receivable, partially offset by changes in Accounts payable and accrued liabilities and Other current and long-term assets. |
▪ | Year-over-year, the increase was primarily due to higher Net income and net non-cash adjustments to Net income and lower net cash outflows from change in working capital. |
◦ | The change in working capital was primarily due to lower use from Accounts receivable and Equipment installment plan receivables, partially offset by higher use from Inventories and changes in Accounts payable and accrued liabilities. |
◦ | Year-over-year, Net cash provided by operating activities benefited from improvements in the contractual terms of factoring agreements which led to an accounting geography change, offset by a reduction in proceeds related to our deferred purchase price from securitization transactions within Net cash provided by (used in) investing activities. |
• | With the adoption of the new lease standard, changes in Operating lease right-of-use assets and Short and long-term operating lease liabilities are now presented in Changes in operating assets and liabilities. Sequentially, the net impact of changes in these accounts increased Net cash provided by operating activities by $20 million. Year-over-year, the net impact of changes in these accounts decreased Net cash provided by operating activities by $38 million. |
▪ | For full-year 2019, Net cash provided by operating activities was $6.82 billion compared to $3.90 billion in 2018. This increase was primarily due to lower net cash outflows from changes in working capital and higher Net income and net non-cash adjustments to Net income. |

▪ | The change in working capital was primarily due to lower use from Accounts receivable, Accounts payable and accrued liabilities and Equipment installment plan receivables, partially offset by higher use from Inventories. |
▪ | Net cash provided by operating activities for full-year 2019 benefited from improvements in the contractual terms of factoring agreements which led to an accounting geography change, offset by a reduction in proceeds related to our deferred purchase price from securitization transactions within Net cash provided by (used in) investing activities. |
▪ | With the adoption of the new lease standard, changes in Operating lease right-of-use assets and Short and long-term operating lease liabilities are now presented in Changes in operating assets and liabilities. For full-year 2019, the net impact of changes in these accounts decreased Net cash provided by operating activities by $235 million compared to full-year 2018. |
▪ | Net cash provided by operating activities three-year CAGR, excluding payments for merger-related costs, from full-year 2016 to full-year 2019 was 38%, ahead of our updated and increased guidance range of 36% to 37%. |
▪ | Net cash provided by (used in) investing activities was an outflow of $887 million in Q4 2019, compared to an outflow of $657 million in Q3 2019 and an inflow of $231 million in Q4 2018. |
▪ | Sequentially, the increase in cash outflows was primarily due to net cash transfers related to derivatives under collateral exchange agreements in Q4 2019, partially offset by lower purchases of property and equipment, including capitalized interest. |
▪ | Year-over-year, the change was primarily due to net cash transfers related to derivatives under collateral exchange agreements in Q4 2019 and lower proceeds related to our deferred purchase price from securitization transactions, driven by improvements in the contractual terms of factoring agreements which led to an accounting geography change. |

▪ | For full-year 2019, Net cash used in investing activities was $4.1 billion compared to $579 million in 2018. The increase was primarily due to lower proceeds related to our deferred purchase price from securitization, driven by improvements in the contractual terms of factoring agreements which led to an accounting geography change, higher purchases of property and equipment, including capitalized interest, higher purchases of spectrum licenses and other intangible assets, including deposits, and net cash transfers under collateral exchange agreements in Q4 2019, partially offset by lower acquisitions of companies, net of cash acquired, due to our acquisitions of Layer3 and Iowa Wireless Services in 2018. |
▪ | In Q4 2019, we made net collateral transfers to certain of our derivative counterparties totaling $632 million, which included variation margin transfers to (or from) such derivative counterparties based on daily market movements. These collateral transfers are included in Net cash related to derivative contracts under collateral exchange arrangements within Net cash used in investing activities in our Consolidated Statements of Cash Flows. |
▪ | Net cash used in financing activities was $775 million in Q4 2019, compared to $543 million in Q3 2019 and $311 million in Q4 2018. |
▪ | Sequentially and year-over-year, the increases were primarily due to higher repayments of short-term debt for purchases of inventory, property and equipment. |
▪ | For full-year 2019, Net cash used in financing activities was $2.37 billion compared to $3.34 billion in 2018. The decrease was primarily due to lower repayments of long-term debt and no repurchases of common stock in 2019 compared to repurchases of $1.07 billion in 2018, partially offset by no proceeds from the issuance of long-term debt in 2019 compared to proceeds of $2.49 billion in 2018 and higher repayments of short-term debt for purchases of inventory, property and equipment. |


▪ | Free Cash Flow was $1.40 billion in Q4 2019, compared to $1.13 billion in Q3 2019 and $1.22 billion in Q4 2018. |
▪ | Sequentially, the increase was primarily due to lower cash purchases of property and equipment, including capitalized interest, and higher proceeds related to our deferred purchase price from securitization transactions, partially offset by lower Net cash provided by operating activities. |
▪ | Year-over-year, the increase was due to higher Net cash provided by operating activities, as described above, partially offset by lower proceeds related to our deferred purchase price from securitization transactions. |
▪ | The impact of payments for merger-related costs on Free Cash Flow was $133 million in Q4 2019 compared to $124 million in Q3 2019 and $46 million in Q4 2018. Free Cash Flow, excluding payments for merger-related costs, was $1.53 billion in Q4 2019. |
▪ | For full-year 2019, Free Cash Flow was $4.32 billion compared to $3.55 billion in 2018. The increase was due to higher Net cash provided by operating activities and lower cash payments for debt extinguishments costs, partially offset by lower proceeds related to our deferred purchase price from securitization transactions and higher cash purchases of property and equipment, including capitalized interest. |
▪ | The impact of payments for merger-related costs on Free Cash Flow was $442 million in 2019 and $86 million in 2018. Free Cash Flow, excluding payments for merger-related costs, was $4.76 billion in 2019. |
▪ | Free Cash Flow three-year CAGR, excluding payments for merger-related costs, from full-year 2016 to full-year 2019 was 49%, compared to our guidance range of 46% to 48%. |

▪ | Total debt, excluding tower obligations, at the end of Q4 2019 was $27.27 billion and was comprised of the following: |
▪ | $25 million of Short-term debt, |
▪ | $10.96 billion of Long-term debt, |
▪ | $13.99 billion of Long-term debt to affiliates, |
▪ | $957 million of Short-term financing lease liabilities, and |
▪ | $1.35 billion of Financing lease liabilities |
▪ | Net debt, excluding tower obligations, at the end of Q4 2019 was $25.74 billion. |
▪ | The ratio of net debt, excluding tower obligations, to Net income for the trailing last twelve months (“LTM”) period was 7.4x at the end of Q4 2019, compared to 7.8x at the end of Q3 2019 and 9.1x at the end of Q4 2018. |
▪ | The ratio of net debt, excluding tower obligations, to Adjusted EBITDA for the trailing LTM period was 1.9x at the end of Q4 2019, compared to 2.0x at the end of Q3 2019 and 2.1x at the end of Q4 2018. |
2020 Guidance Outlook | ||||
FY 2020 | ||||
Branded Postpaid Net Adds (in millions) | 2.6 | 3.6 | ||
Adjusted EBITDA ($ in billions) | $13.7 | $14.0 | ||
Cash purchases of prop and equip excl Cap int ($ in billions) | $5.5 | $5.8 | ||
Net cash provided by operating activities ($ in billions) | $7.9 | $8.5 | ||
Free Cash Flow ($ in billions) | $5.4 | $5.8 | ||
▪ | Our 2020 guidance outlook is for T-Mobile standalone. |
▪ | Branded postpaid net customer additions: Branded postpaid net customer additions for the full-year 2020 are expected to be 2.6 to 3.6 million. |
▪ | Net Income: We are not able to forecast Net income on a forward-looking basis without unreasonable efforts due to the high variability and difficulty in predicting certain items that affect GAAP Net income, including, but not limited to, Income tax expense, stock-based compensation expense and Interest expense. Adjusted EBITDA should not be used to predict Net income as the difference between the two measures is variable. |
▪ | Adjusted EBITDA: For the full-year 2020, Adjusted EBITDA is expected to be in the range of $13.7 to $14.0 billion. This target includes expected leasing revenues of $450 to $550 million and takes into account the network expansion, including the continued deployment of our 600 MHz spectrum and 5G network. |
▪ | Capital expenditures: Cash purchases of property and equipment for the full-year 2020, including capitalized interest of approximately $400 million, are expected to be in the range of $5.9 to $6.2 billion. Cash purchases of property and equipment for the full-year 2020, excluding capitalized interest, are expected to be in the range of $5.5 to $5.8 billion. We expect that cash purchases of property and equipment will be heavily weighted to early in the year, similar to 2019. |
▪ | Net cash provided by operating activities: Net cash provided by operating activities, excluding payments for merger-related costs and any settlement of interest rate swaps, is expected to be in the range of $7.9 to $8.5 billion in 2020. |
▪ | Free Cash Flow: Free Cash Flow, excluding payments for merger-related costs and any settlement of interest rate swaps, is expected to be in the range of $5.4 to $5.8 billion in 2020. We expect a similar seasonal development of Free Cash Flow in 2020 as in 2019 with a lower Free Cash Flow in the first quarter, ramping in later quarters, based on expected timing for cash purchases of property and equipment. Free cash flow guidance does not assume any material net cash inflows from securitization in 2020. |
▪ | Branded postpaid phone ARPU: We expect Branded postpaid phone ARPU in full-year 2020 to be generally stable compared to full-year 2019 within a range of plus 1% to minus 1%. |
▪ | Tax Rate: For full-year 2020, the effective tax rate is expected to be 26% to 27%. |
▪ | Merger-related costs: In Q1 2020, pre-close merger-related costs are expected to be $200 to $300 million before taxes. These costs are excluded from Adjusted EBITDA but will impact Net income and cash flows. |
▪ | Morgan Stanley Technology, Media & Telecom Conference, March 2-5, San Francisco, CA |
▪ | Deutsche Bank 28th Annual Media, Internet & Telecom Conference, March 9-11, Palm Beach, FL |
(in millions, except share and per share amounts) | December 31, 2019 | December 31, 2018 | |||||
Assets | |||||||
Current assets | |||||||
Cash and cash equivalents | $ | 1,528 | $ | 1,203 | |||
Accounts receivable, net of allowances of $61 and $67 | 1,888 | 1,769 | |||||
Equipment installment plan receivables, net | 2,600 | 2,538 | |||||
Accounts receivable from affiliates | 20 | 11 | |||||
Inventory | 964 | 1,084 | |||||
Other current assets | 2,305 | 1,676 | |||||
Total current assets | 9,305 | 8,281 | |||||
Property and equipment, net | 21,984 | 23,359 | |||||
Operating lease right-of-use assets | 10,933 | — | |||||
Financing lease right-of-use assets | 2,715 | — | |||||
Goodwill | 1,930 | 1,901 | |||||
Spectrum licenses | 36,465 | 35,559 | |||||
Other intangible assets, net | 115 | 198 | |||||
Equipment installment plan receivables due after one year, net | 1,583 | 1,547 | |||||
Other assets | 1,891 | 1,623 | |||||
Total assets | $ | 86,921 | $ | 72,468 | |||
Liabilities and Stockholders' Equity | |||||||
Current liabilities | |||||||
Accounts payable and accrued liabilities | $ | 6,746 | $ | 7,741 | |||
Payables to affiliates | 187 | 200 | |||||
Short-term debt | 25 | 841 | |||||
Deferred revenue | 631 | 698 | |||||
Short-term operating lease liabilities | 2,287 | — | |||||
Short-term financing lease liabilities | 957 | — | |||||
Other current liabilities | 1,673 | 787 | |||||
Total current liabilities | 12,506 | 10,267 | |||||
Long-term debt | 10,958 | 12,124 | |||||
Long-term debt to affiliates | 13,986 | 14,582 | |||||
Tower obligations | 2,236 | 2,557 | |||||
Deferred tax liabilities | 5,607 | 4,472 | |||||
Operating lease liabilities | 10,539 | — | |||||
Financing lease liabilities | 1,346 | — | |||||
Deferred rent expense | — | 2,781 | |||||
Other long-term liabilities | 954 | 967 | |||||
Total long-term liabilities | 45,626 | 37,483 | |||||
Commitments and contingencies | |||||||
Stockholders' equity | |||||||
Common Stock, par value $0.00001 per share, 1,000,000,000 shares authorized; 858,418,615 and 851,675,119 shares issued, 856,905,400 and 850,180,317 shares outstanding | — | — | |||||
Additional paid-in capital | 38,498 | 38,010 | |||||
Treasury stock, at cost, 1,513,215 and 1,494,802 shares issued | (8 | ) | (6 | ) | |||
Accumulated other comprehensive loss | (868 | ) | (332 | ) | |||
Accumulated deficit | (8,833 | ) | (12,954 | ) | |||
Total stockholders' equity | 28,789 | 24,718 | |||||
Total liabilities and stockholders' equity | $ | 86,921 | $ | 72,468 | |||
Three Months Ended | Year Ended December 31, | ||||||||||||||||||
(in millions, except share and per share amounts) | December 31, 2019 | September 30, 2019 | December 31, 2018 | 2019 | 2018 | ||||||||||||||
Revenues | |||||||||||||||||||
Branded postpaid revenues | $ | 5,821 | $ | 5,746 | $ | 5,384 | $ | 22,673 | $ | 20,862 | |||||||||
Branded prepaid revenues | 2,393 | 2,385 | 2,399 | 9,543 | 9,598 | ||||||||||||||
Wholesale revenues | 341 | 321 | 304 | 1,279 | 1,183 | ||||||||||||||
Roaming and other service revenues | 153 | 131 | 102 | 499 | 349 | ||||||||||||||
Total service revenues | 8,708 | 8,583 | 8,189 | 33,994 | 31,992 | ||||||||||||||
Equipment revenues | 2,875 | 2,186 | 2,940 | 9,840 | 10,009 | ||||||||||||||
Other revenues | 295 | 292 | 316 | 1,164 | 1,309 | ||||||||||||||
Total revenues | 11,878 | 11,061 | 11,445 | 44,998 | 43,310 | ||||||||||||||
Operating expenses | |||||||||||||||||||
Cost of services, exclusive of depreciation and amortization shown separately below | 1,694 | 1,733 | 1,602 | 6,622 | 6,307 | ||||||||||||||
Cost of equipment sales, exclusive of depreciation and amortization shown separately below | 3,518 | 2,704 | 3,568 | 11,899 | 12,047 | ||||||||||||||
Selling, general and administrative | 3,656 | 3,498 | 3,498 | 14,139 | 13,161 | ||||||||||||||
Depreciation and amortization | 1,776 | 1,655 | 1,640 | 6,616 | 6,486 | ||||||||||||||
Total operating expenses | 10,644 | 9,590 | 10,308 | 39,276 | 38,001 | ||||||||||||||
Operating income | 1,234 | 1,471 | 1,137 | 5,722 | 5,309 | ||||||||||||||
Other income (expense) | |||||||||||||||||||
Interest expense | (182 | ) | (184 | ) | (194 | ) | (727 | ) | (835 | ) | |||||||||
Interest expense to affiliates | (98 | ) | (100 | ) | (104 | ) | (408 | ) | (522 | ) | |||||||||
Interest income | 7 | 5 | 2 | 24 | 19 | ||||||||||||||
Other income (expense), net | 4 | 3 | (3 | ) | (8 | ) | (54 | ) | |||||||||||
Total other expense, net | (269 | ) | (276 | ) | (299 | ) | (1,119 | ) | (1,392 | ) | |||||||||
Income before income taxes | 965 | 1,195 | 838 | 4,603 | 3,917 | ||||||||||||||
Income tax expense | (214 | ) | (325 | ) | (198 | ) | (1,135 | ) | (1,029 | ) | |||||||||
Net income | 751 | 870 | 640 | 3,468 | 2,888 | ||||||||||||||
Net income | $ | 751 | $ | 870 | $ | 640 | $ | 3,468 | $ | 2,888 | |||||||||
Other comprehensive income (loss), net of tax | |||||||||||||||||||
Unrealized gain (loss) on cash flow hedges, net of tax effect of $69, ($88), ($115), ($187), ($115) | 202 | (257 | ) | (332 | ) | (536 | ) | (332 | ) | ||||||||||
Other comprehensive income (loss) | 202 | (257 | ) | (332 | ) | (536 | ) | (332 | ) | ||||||||||
Total comprehensive income | $ | 953 | $ | 613 | $ | 308 | $ | 2,932 | $ | 2,556 | |||||||||
Earnings per share | |||||||||||||||||||
Basic | $ | 0.88 | $ | 1.02 | $ | 0.75 | $ | 4.06 | $ | 3.40 | |||||||||
Diluted | $ | 0.87 | $ | 1.01 | $ | 0.75 | $ | 4.02 | $ | 3.36 | |||||||||
Weighted average shares outstanding | |||||||||||||||||||
Basic | 856,294,467 | 854,578,241 | 849,102,785 | 854,143,751 | 849,744,152 | ||||||||||||||
Diluted | 864,158,739 | 862,690,751 | 856,344,347 | 863,433,511 | 858,290,174 | ||||||||||||||
Three Months Ended | Year Ended December 31, | ||||||||||||||||||
(in millions) | December 31, 2019 | September 30, 2019 | December 31, 2018 | 2019 | 2018 | ||||||||||||||
Operating activities | |||||||||||||||||||
Net income | $ | 751 | $ | 870 | $ | 640 | $ | 3,468 | $ | 2,888 | |||||||||
Adjustments to reconcile net income to net cash provided by operating activities | |||||||||||||||||||
Depreciation and amortization | 1,776 | 1,655 | 1,640 | 6,616 | 6,486 | ||||||||||||||
Stock-based compensation expense | 129 | 126 | 100 | 495 | 424 | ||||||||||||||
Deferred income tax expense | 242 | 294 | 218 | 1,091 | 980 | ||||||||||||||
Bad debt expense | 89 | 74 | 88 | 307 | 297 | ||||||||||||||
Losses from sales of receivables | 39 | 28 | 30 | 130 | 157 | ||||||||||||||
Deferred rent expense | — | — | 5 | — | 26 | ||||||||||||||
Losses on redemption of debt | — | — | — | 19 | 122 | ||||||||||||||
Changes in operating assets and liabilities | |||||||||||||||||||
Accounts receivable | (1,016 | ) | (745 | ) | (1,370 | ) | (3,709 | ) | (4,617 | ) | |||||||||
Equipment installment plan receivables | (537 | ) | (78 | ) | (755 | ) | (1,015 | ) | (1,598 | ) | |||||||||
Inventories | (478 | ) | (36 | ) | (244 | ) | (617 | ) | (201 | ) | |||||||||
Operating lease right-of-use assets | 501 | 491 | — | 1,896 | — | ||||||||||||||
Other current and long-term assets | 144 | (118 | ) | 128 | (144 | ) | (181 | ) | |||||||||||
Accounts payable and accrued liabilities | 356 | (395 | ) | 505 | 17 | (867 | ) | ||||||||||||
Short and long-term operating lease liabilities | (539 | ) | (549 | ) | — | (2,131 | ) | — | |||||||||||
Other current and long-term liabilities | 8 | 42 | (48 | ) | 144 | (69 | ) | ||||||||||||
Other, net | 72 | 89 | 17 | 257 | 52 | ||||||||||||||
Net cash provided by operating activities | 1,537 | 1,748 | 954 | 6,824 | 3,899 | ||||||||||||||
Investing activities | |||||||||||||||||||
Purchases of property and equipment, including capitalized interest of ($112), ($118), ($116), ($473), ($362) | (1,157 | ) | (1,514 | ) | (1,184 | ) | (6,391 | ) | (5,541 | ) | |||||||||
Purchases of spectrum licenses and other intangible assets, including deposits | (104 | ) | (13 | ) | (26 | ) | (967 | ) | (127 | ) | |||||||||
Proceeds from sales of tower sites | 38 | — | — | 38 | — | ||||||||||||||
Proceeds related to beneficial interests in securitization transactions | 980 | 900 | 1,450 | 3,876 | 5,406 | ||||||||||||||
Net cash related to derivative contracts under collateral exchange arrangements | (632 | ) | — | — | (632 | ) | — | ||||||||||||
Acquisition of companies, net of cash acquired | — | (31 | ) | — | (31 | ) | (338 | ) | |||||||||||
Other, net | (12 | ) | 1 | (9 | ) | (18 | ) | 21 | |||||||||||
Net cash (used in) provided by investing activities | (887 | ) | (657 | ) | 231 | (4,125 | ) | (579 | ) | ||||||||||
Financing activities | |||||||||||||||||||
Proceeds from issuance of long-term debt | — | — | — | — | 2,494 | ||||||||||||||
Proceeds from borrowing on revolving credit facility | — | 575 | 215 | 2,340 | 6,265 | ||||||||||||||
Repayments of revolving credit facility | — | (575 | ) | (215 | ) | (2,340 | ) | (6,265 | ) | ||||||||||
Repayments of financing lease obligations | (248 | ) | (235 | ) | (192 | ) | (798 | ) | (700 | ) | |||||||||
Repayments of short-term debt for purchases of inventory, property and equipment, net | (475 | ) | (300 | ) | (54 | ) | (775 | ) | (300 | ) | |||||||||
Repayments of long-term debt | — | — | — | (600 | ) | (3,349 | ) | ||||||||||||
Repurchases of common stock | — | — | — | — | (1,071 | ) | |||||||||||||
Tax withholdings on share-based awards | (48 | ) | (4 | ) | (57 | ) | (156 | ) | (146 | ) | |||||||||
Cash payments for debt prepayment or debt extinguishment costs | — | — | — | (28 | ) | (212 | ) | ||||||||||||
Other, net | (4 | ) | (4 | ) | (8 | ) | (17 | ) | (52 | ) | |||||||||
Net cash used in financing activities | (775 | ) | (543 | ) | (311 | ) | (2,374 | ) | (3,336 | ) | |||||||||
Change in cash and cash equivalents | (125 | ) | 548 | 874 | 325 | (16 | ) | ||||||||||||
Cash and cash equivalents | |||||||||||||||||||
Beginning of period | 1,653 | 1,105 | 329 | 1,203 | 1,219 | ||||||||||||||
End of period | $ | 1,528 | $ | 1,653 | $ | 1,203 | $ | 1,528 | $ | 1,203 | |||||||||
Supplemental disclosure of cash flow information | |||||||||||||||||||
Interest payments, net of amounts capitalized | $ | 216 | $ | 327 | $ | 222 | $ | 1,128 | $ | 1,525 | |||||||||
Operating lease payments (1) | 689 | 703 | — | 2,783 | — | ||||||||||||||
Income tax payments | 11 | 5 | 11 | 88 | 51 | ||||||||||||||
Non-cash investing and financing activities | |||||||||||||||||||
Non-cash beneficial interest obtained in exchange for securitized receivables | $ | 1,647 | $ | 1,734 | $ | 1,376 | $ | 6,509 | $ | 4,972 | |||||||||
(Decrease) increase in accounts payable for purchases of property and equipment | (29 | ) | (460 | ) | 737 | (935 | ) | 65 | |||||||||||
Leased devices transferred from inventory to property and equipment | 394 | 298 | 198 | 1,006 | 1,011 | ||||||||||||||
Returned leased devices transferred from property and equipment to inventory | (78 | ) | (65 | ) | (80 | ) | (267 | ) | (326 | ) | |||||||||
Short-term debt assumed for financing of property and equipment | 25 | 475 | — | 800 | 291 | ||||||||||||||
Operating lease right-of-use assets obtained in exchange for lease obligations | 538 | 989 | — | 3,621 | — | ||||||||||||||
Financing lease right-of-use assets obtained in exchange for lease obligations | 98 | 395 | 434 | 1,041 | 885 | ||||||||||||||
(1) | On January 1, 2019, we adopted ASU 2016-02, “Leases (Topic 842),” which requires certain supplemental cash flow disclosures. Where these disclosures or a comparable figure were not required under the former lease standard, we have not retrospectively presented historical amounts. |
Quarter | Year Ended December 31, | ||||||||||||||||||||||||||||
(in thousands) | Q1 2018 | Q2 2018 | Q3 2018 | Q4 2018 | Q1 2019 | Q2 2019 | Q3 2019 | Q4 2019 | 2018 | 2019 | |||||||||||||||||||
Customers, end of period | |||||||||||||||||||||||||||||
Branded postpaid phone customers | 34,744 | 35,430 | 36,204 | 37,224 | 37,880 | 38,590 | 39,344 | 40,345 | 37,224 | 40,345 | |||||||||||||||||||
Branded postpaid other customers | 4,321 | 4,652 | 4,957 | 5,295 | 5,658 | 6,056 | 6,376 | 6,689 | 5,295 | 6,689 | |||||||||||||||||||
Total branded postpaid customers | 39,065 | 40,082 | 41,161 | 42,519 | 43,538 | 44,646 | 45,720 | 47,034 | 42,519 | 47,034 | |||||||||||||||||||
Branded prepaid customers (1) | 20,876 | 20,967 | 21,002 | 21,137 | 21,206 | 21,337 | 20,783 | 20,860 | 21,137 | 20,860 | |||||||||||||||||||
Total branded customers | 59,941 | 61,049 | 62,163 | 63,656 | 64,744 | 65,983 | 66,503 | 67,894 | 63,656 | 67,894 | |||||||||||||||||||
Wholesale customers (1) | 14,099 | 14,570 | 15,086 | 15,995 | 16,557 | 17,069 | 17,680 | 18,152 | 15,995 | 18,152 | |||||||||||||||||||
Total customers, end of period | 74,040 | 75,619 | 77,249 | 79,651 | 81,301 | 83,052 | 84,183 | 86,046 | 79,651 | 86,046 | |||||||||||||||||||
Adjustment to branded prepaid customers (1) | — | — | — | — | — | — | (616 | ) | — | — | (616 | ) | |||||||||||||||||
(1) | On July 18, 2019, we entered into an agreement whereby certain T-Mobile branded prepaid products will now be offered and distributed by a current MVNO partner. As a result, we included a base adjustment in Q3 2019 to reduce branded prepaid customers by 616,000. Prospectively, new customer activity associated with these products is recorded within wholesale customers. |
Quarter | Year Ended December 31, | ||||||||||||||||||||||||||||
(in thousands) | Q1 2018 | Q2 2018 | Q3 2018 | Q4 2018 | Q1 2019 | Q2 2019 | Q3 2019 | Q4 2019 | 2018 | 2019 | |||||||||||||||||||
Net customer additions | |||||||||||||||||||||||||||||
Branded postpaid phone customers | 617 | 686 | 774 | 1,020 | 656 | 710 | 754 | 1,001 | 3,097 | 3,121 | |||||||||||||||||||
Branded postpaid other customers | 388 | 331 | 305 | 338 | 363 | 398 | 320 | 313 | 1,362 | 1,394 | |||||||||||||||||||
Total branded postpaid customers | 1,005 | 1,017 | 1,079 | 1,358 | 1,019 | 1,108 | 1,074 | 1,314 | 4,459 | 4,515 | |||||||||||||||||||
Branded prepaid customers (1) | 199 | 91 | 35 | 135 | 69 | 131 | 62 | 77 | 460 | 339 | |||||||||||||||||||
Total branded customers | 1,204 | 1,108 | 1,114 | 1,493 | 1,088 | 1,239 | 1,136 | 1,391 | 4,919 | 4,854 | |||||||||||||||||||
Wholesale customers (1) | 229 | 471 | 516 | 909 | 562 | 512 | 611 | 472 | 2,125 | 2,157 | |||||||||||||||||||
Total net customer additions | 1,433 | 1,579 | 1,630 | 2,402 | 1,650 | 1,751 | 1,747 | 1,863 | 7,044 | 7,011 | |||||||||||||||||||
(1) | On July 18, 2019, we entered into an agreement whereby certain T-Mobile branded prepaid products will now be offered and distributed by a current MVNO partner. As a result, we included a base adjustment in Q3 2019 to reduce branded prepaid customers by 616,000. Prospectively, new customer activity associated with these products is recorded within wholesale customers. |
Quarter | Year Ended December 31, | ||||||||||||||||||||||||||||
Q1 2018 | Q2 2018 | Q3 2018 | Q4 2018 | Q1 2019 | Q2 2019 | Q3 2019 | Q4 2019 | 2018 | 2019 | ||||||||||||||||||||
Branded postpaid phone churn | 1.07 | % | 0.95 | % | 1.02 | % | 0.99 | % | 0.88 | % | 0.78 | % | 0.89 | % | 1.01 | % | 1.01 | % | 0.89 | % | |||||||||
Branded prepaid churn | 3.94 | % | 3.81 | % | 4.12 | % | 3.99 | % | 3.85 | % | 3.49 | % | 3.98 | % | 3.97 | % | 3.96 | % | 3.82 | % | |||||||||
Quarter | Year Ended December 31, | ||||||||||||||||||
Q1 2018 | Q2 2018 | Q3 2018 | Q4 2018 | Q1 2019 | Q2 2019 | Q3 2019 | Q4 2019 | 2018 | 2019 | ||||||||||
Financial Measures | |||||||||||||||||||
Service revenues (in millions) | $7,806 | $7,931 | $8,066 | $8,189 | $8,277 | $8,426 | $8,583 | $8,708 | $31,992 | $33,994 | |||||||||
Total revenues (in millions) | $10,455 | $10,571 | $10,839 | $11,445 | $11,080 | $10,979 | $11,061 | $11,878 | $43,310 | $44,998 | |||||||||
Net income (in millions) | $671 | $782 | $795 | $640 | $908 | $939 | $870 | $751 | $2,888 | $3,468 | |||||||||
Net income margin | 8.6% | 9.9% | 9.9% | 7.8% | 11.0% | 11.1% | 10.1% | 8.6% | 9.0% | 10.2% | |||||||||
Adjusted EBITDA (in millions) | $2,956 | $3,233 | $3,239 | $2,970 | $3,284 | $3,461 | $3,396 | $3,242 | $12,398 | $13,383 | |||||||||
Adjusted EBITDA margin | 38.0% | 41.0% | 40.0% | 36.3% | 39.7% | 41.1% | 39.6% | 37.2% | 38.8% | 39.4% | |||||||||
Selling, general and administrative (in millions) | $3,164 | $3,185 | $3,314 | $3,498 | $3,442 | $3,543 | $3,498 | $3,656 | $13,161 | $14,139 | |||||||||
Merger-related costs (in millions) | $— | $41 | $53 | $102 | $113 | $222 | $159 | $126 | $196 | $620 | |||||||||
Selling, general and administrative excluding merger-related costs (in millions) | $3,164 | $3,144 | $3,261 | $3,396 | $3,329 | $3,321 | $3,339 | $3,530 | $12,965 | $13,519 | |||||||||
Cash purchases of property and equipment including capitalized interest (in millions) | $1,366 | $1,629 | $1,362 | $1,184 | $1,931 | $1,789 | $1,514 | $1,157 | $5,541 | $6,391 | |||||||||
Capitalized Interest (in millions) | $43 | $102 | $101 | $116 | $118 | $125 | $118 | $112 | $362 | $473 | |||||||||
Cash purchases of property and equipment excluding capitalized interest (in millions) | $1,323 | $1,527 | $1,261 | $1,068 | $1,813 | $1,664 | $1,396 | $1,045 | $5,179 | $5,918 | |||||||||
Net cash provided by operating activities (in millions) | $770 | $1,261 | $914 | $954 | $1,392 | $2,147 | $1,748 | $1,537 | $3,899 | $6,824 | |||||||||
Net cash (used in) provided by investing activities (in millions) | $(462) | $(306) | $(42) | $231 | $(966) | $(1,615) | $(657) | $(887) | $(579) | $(4,125) | |||||||||
Net cash provided by (used in) financing activities (in millions) | $1,000 | $(3,267) | $(758) | $(311) | $(190) | $(866) | $(543) | $(775) | $(3,336) | $(2,374) | |||||||||
Free Cash Flow (in millions) | $668 | $774 | $890 | $1,220 | $618 | $1,169 | $1,134 | $1,398 | $3,552 | $4,319 | |||||||||
Net cash proceeds from securitization (in millions) | $(150) | $25 | $(18) | $(36) | $(18) | $95 | $(3) | $(9) | $(179) | $65 | |||||||||
Operating Metrics | |||||||||||||||||||
Branded postpaid phone ARPU | $46.66 | $46.52 | $46.17 | $46.29 | $46.07 | $46.10 | $46.22 | $45.79 | $46.40 | $46.04 | |||||||||
Branded prepaid ARPU | $38.90 | $38.48 | $38.34 | $38.39 | $37.65 | $37.46 | $38.16 | $38.54 | $38.53 | $37.95 | |||||||||
Branded postpaid accounts, end of period (in thousands) | 13,237 | 13,498 | 13,753 | 14,015 | 14,234 | 14,480 | 14,734 | 15,029 | 14,015 | 15,029 | |||||||||
Branded postpaid customers per account | 2.95 | 2.97 | 2.99 | 3.03 | 3.06 | 3.08 | 3.10 | 3.13 | 3.03 | 3.13 | |||||||||
Device Sales and Leased Devices | |||||||||||||||||||
Phones (in millions) | 8.7 | 7.9 | 8.1 | 8.3 | 7.4 | 6.5 | 7.4 | 8.3 | 33.0 | 29.6 | |||||||||
Branded postpaid upgrade rate | 5% | 6% | 6% | 6% | 5% | 5% | 5% | 6% | 23% | 21% | |||||||||
Device Financing | |||||||||||||||||||
Gross EIP financed (in millions) | $1,572 | $1,705 | $1,762 | $2,203 | $1,742 | $1,625 | $1,535 | $2,235 | $7,242 | $7,137 | |||||||||
EIP billings (in millions) | $1,698 | $1,585 | $1,601 | $1,664 | $1,663 | $1,645 | $1,688 | $1,762 | $6,548 | $6,758 | |||||||||
EIP receivables, net (in millions) | $3,515 | $3,530 | $3,589 | $4,085 | $4,128 | $4,050 | $3,894 | $4,183 | $4,085 | $4,183 | |||||||||
Lease revenues (in millions) | $171 | $177 | $176 | $168 | $161 | $143 | $142 | $153 | $692 | $599 | |||||||||
Leased devices transferred from inventory to property and equipment (in millions) | $304 | $280 | $229 | $198 | $147 | $167 | $298 | $394 | $1,011 | $1,006 | |||||||||
Returned leased devices transferred from property and equipment to inventory (in millions) | $(82) | $(90) | $(74) | $(80) | $(57) | $(67) | $(65) | $(78) | $(326) | $(267) | |||||||||
Customer Quality | |||||||||||||||||||
EIP receivables classified as prime | 43% | 42% | 42% | 44% | 46% | 50% | 51% | 53% | 44% | 53% | |||||||||
EIP receivables classified as prime (including EIP receivables sold) | 53% | 52% | 52% | 53% | 52% | 52% | 52% | 53% | 53% | 53% | |||||||||
Total bad debt expense and losses from sales of receivables (in millions) | $106 | $102 | $128 | $118 | $108 | $99 | $102 | $128 | $454 | $437 | |||||||||
Quarter | Year Ended December 31, | ||||||||||||||||||||||||||||||||||||||
(in millions) | Q1 2018 | Q2 2018 | Q3 2018 | Q4 2018 | Q1 2019 | Q2 2019 | Q3 2019 | Q4 2019 | 2018 | 2019 | |||||||||||||||||||||||||||||
Net income | $ | 671 | $ | 782 | $ | 795 | $ | 640 | $ | 908 | $ | 939 | $ | 870 | $ | 751 | $ | 2,888 | $ | 3,468 | |||||||||||||||||||
Adjustments: | |||||||||||||||||||||||||||||||||||||||
Interest expense | 251 | 196 | 194 | 194 | 179 | 182 | 184 | 182 | 835 | 727 | |||||||||||||||||||||||||||||
Interest expense to affiliates | 166 | 128 | 124 | 104 | 109 | 101 | 100 | 98 | 522 | 408 | |||||||||||||||||||||||||||||
Interest income | (6 | ) | (6 | ) | (5 | ) | (2 | ) | (8 | ) | (4 | ) | (5 | ) | (7 | ) | (19 | ) | (24 | ) | |||||||||||||||||||
Other (income) expense, net | (10 | ) | 64 | (3 | ) | 3 | (7 | ) | 22 | (3 | ) | (4 | ) | 54 | 8 | ||||||||||||||||||||||||
Income tax expense | 210 | 286 | 335 | 198 | 295 | 301 | 325 | 214 | 1,029 | 1,135 | |||||||||||||||||||||||||||||
Operating income | 1,282 | 1,450 | 1,440 | 1,137 | 1,476 | 1,541 | 1,471 | 1,234 | 5,309 | 5,722 | |||||||||||||||||||||||||||||
Depreciation and amortization | 1,575 | 1,634 | 1,637 | 1,640 | 1,600 | 1,585 | 1,655 | 1,776 | 6,486 | 6,616 | |||||||||||||||||||||||||||||
Stock-based compensation (1) | 96 | 106 | 102 | 85 | 93 | 111 | 108 | 111 | 389 | 423 | |||||||||||||||||||||||||||||
Merger-related costs | — | 41 | 53 | 102 | 113 | 222 | 159 | 126 | 196 | 620 | |||||||||||||||||||||||||||||
Other, net (2) | 3 | 2 | 7 | 6 | 2 | 2 | 3 | (5 | ) | 18 | 2 | ||||||||||||||||||||||||||||
Adjusted EBITDA | $ | 2,956 | $ | 3,233 | $ | 3,239 | $ | 2,970 | $ | 3,284 | $ | 3,461 | $ | 3,396 | $ | 3,242 | $ | 12,398 | $ | 13,383 | |||||||||||||||||||
(1) | Stock-based compensation includes payroll tax impacts and may not agree to stock-based compensation expense in the Consolidated Financial Statements. Additionally, certain stock-based compensation expenses associated with the Transactions have been included in Merger-related costs. |
(2) | Other, net may not agree to the Consolidated Statements of Comprehensive Income primarily due to certain non-routine operating activities, such as other special items that would not be expected to reoccur or are not reflective of T-Mobile’s ongoing operating performance, and are therefore excluded in Adjusted EBITDA. |
(in millions, except net debt ratios) | Mar 31, 2018 | Jun 30, 2018 | Sep 30, 2018 | Dec 31, 2018 | Mar 31, 2019 | Jun 30, 2019 | Sep 30, 2019 | Dec 31, 2019 | |||||||||||||||||||||||
Short-term debt | $ | 3,320 | $ | 1,004 | $ | 783 | $ | 841 | $ | 250 | $ | 300 | $ | 475 | $ | 25 | |||||||||||||||
Short-term debt to affiliates | 445 | 320 | — | — | 598 | — | — | — | |||||||||||||||||||||||
Short-term financing lease liabilities (1) | — | — | — | — | 911 | 963 | 1,013 | 957 | |||||||||||||||||||||||
Long-term debt | 12,127 | 12,065 | 11,993 | 12,124 | 10,952 | 10,954 | 10,956 | 10,958 | |||||||||||||||||||||||
Long-term debt to affiliates | 14,586 | 14,581 | 14,581 | 14,582 | 13,985 | 13,985 | 13,986 | 13,986 | |||||||||||||||||||||||
Financing lease liabilities (1) | — | — | — | — | 1,224 | 1,314 | 1,440 | 1,346 | |||||||||||||||||||||||
Less: Cash and cash equivalents | (2,527 | ) | (215 | ) | (329 | ) | (1,203 | ) | (1,439 | ) | (1,105 | ) | (1,653 | ) | (1,528 | ) | |||||||||||||||
Net debt (excluding tower obligations) | $ | 27,951 | $ | 27,755 | $ | 27,028 | $ | 26,344 | $ | 26,481 | $ | 26,411 | $ | 26,217 | $ | 25,744 | |||||||||||||||
Divided by: Last twelve months Net income | $ | 4,509 | $ | 4,710 | $ | 4,955 | $ | 2,888 | $ | 3,125 | $ | 3,282 | $ | 3,357 | $ | 3,468 | |||||||||||||||
Net debt (excluding tower obligations) to last twelve months Net income Ratio | 6.2 | 5.9 | 5.5 | 9.1 | 8.5 | 8.0 | 7.8 | 7.4 | |||||||||||||||||||||||
Divided by: Last twelve months Adjusted EBITDA | $ | 11,501 | $ | 11,722 | $ | 12,139 | $ | 12,398 | $ | 12,726 | $ | 12,954 | $ | 13,111 | $ | 13,383 | |||||||||||||||
Net debt (excluding tower obligations) to last twelve months Adjusted EBITDA Ratio | 2.4 | 2.4 | 2.2 | 2.1 | 2.1 | 2.0 | 2.0 | 1.9 | |||||||||||||||||||||||
(1) | In Q1 2019, the adoption of the new lease accounting standard resulted in a reclassification of capital lease liabilities previously included in Short-term debt and Long-term debt to Short-term financing lease liabilities and Financing lease liabilities in our Consolidated Balance Sheet. In Q1 2019, we redefined Net debt (excluding tower obligations) to reflect the above changes in classification and present Net debt (excluding tower obligations) on a consistent basis for investor transparency. The effects of this change are applied prospectively, consistent with the adoption of the standard. See Note 1 – Summary of Significant Accounting Policies in our Annual Report on Form 10-K for the year ended December 31, 2019, for additional details. |
Quarter | Year Ended December 31, | ||||||||||||||||||||||||||||||||||||||
(in millions) | Q1 2018 | Q2 2018 | Q3 2018 | Q4 2018 | Q1 2019 | Q2 2019 | Q3 2019 | Q4 2019 | 2018 | 2019 | |||||||||||||||||||||||||||||
Net cash provided by operating activities | $ | 770 | $ | 1,261 | $ | 914 | $ | 954 | $ | 1,392 | $ | 2,147 | $ | 1,748 | $ | 1,537 | $ | 3,899 | $ | 6,824 | |||||||||||||||||||
Cash purchases of property and equipment | (1,366 | ) | (1,629 | ) | (1,362 | ) | (1,184 | ) | (1,931 | ) | (1,789 | ) | (1,514 | ) | (1,157 | ) | (5,541 | ) | (6,391 | ) | |||||||||||||||||||
Proceeds from sales of tower sites | — | — | — | — | — | — | — | 38 | — | 38 | |||||||||||||||||||||||||||||
Proceeds related to beneficial interests in securitization transactions | 1,295 | 1,323 | 1,338 | 1,450 | 1,157 | 839 | 900 | 980 | 5,406 | 3,876 | |||||||||||||||||||||||||||||
Cash payments for debt prepayment or debt extinguishment costs | (31 | ) | (181 | ) | — | — | — | (28 | ) | — | — | (212 | ) | (28 | ) | ||||||||||||||||||||||||
Free Cash Flow | 668 | 774 | 890 | 1,220 | 618 | 1,169 | 1,134 | 1,398 | 3,552 | 4,319 | |||||||||||||||||||||||||||||
Payments for merger-related costs | — | 17 | 23 | 46 | 34 | 151 | 124 | 133 | 86 | 442 | |||||||||||||||||||||||||||||
Free Cash Flow, excluding payments for merger-related costs | $ | 668 | $ | 791 | $ | 913 | $ | 1,266 | $ | 652 | $ | 1,320 | $ | 1,258 | $ | 1,531 | $ | 3,638 | $ | 4,761 | |||||||||||||||||||
Net cash (used in) provided by investing activities | $ | (462 | ) | $ | (306 | ) | $ | (42 | ) | $ | 231 | $ | (966 | ) | $ | (1,615 | ) | $ | (657 | ) | $ | (887 | ) | $ | (579 | ) | $ | (4,125 | ) | ||||||||||
Net cash provided by (used in) financing activities | $ | 1,000 | $ | (3,267 | ) | $ | (758 | ) | $ | (311 | ) | $ | (190 | ) | $ | (866 | ) | $ | (543 | ) | $ | (775 | ) | $ | (3,336 | ) | $ | (2,374 | ) | ||||||||||
FY | |||||||
(in millions) | 2020 Guidance Range | ||||||
Net cash provided by operating activities (1) | $ | 7,900 | $ | 8,500 | |||
Cash purchases of property and equipment | (5,900 | ) | (6,200 | ) | |||
Proceeds related to beneficial interests in securitization transactions | 3,400 | 3,500 | |||||
Free Cash Flow | $ | 5,400 | $ | 5,800 | |||
(1) | Guidance for Net cash provided by operating activities excludes payments for merger-related costs and any settlement of interest rate swaps, which are not available without unreasonable effort and may be significant. The interest rate swaps will be settled upon the issuance of fixed-rate debt or the mandatory termination date of June 3, 2020. See Note 7 – Fair Value Measurements in our Annual Report on Form 10-K for the year ended December 31, 2019, for additional details. |
FY | ||||||||||
(in millions, except CAGR) | 2016 | 2019 | CAGR | |||||||
Net cash provided by operating activities | $ | 2,779 | $ | 6,824 | 35 | % | ||||
Payments for merger-related costs | — | 442 | ||||||||
Net cash provided by operating activities excluding payments for merger-related costs | 2,779 | 7,266 | 38 | % | ||||||
Cash purchases of property and equipment | (4,702 | ) | (6,391 | ) | 11 | % | ||||
Proceeds from sales of tower sites | — | 38 | ||||||||
Proceeds related to beneficial interests in securitization transactions | 3,356 | 3,876 | ||||||||
Cash payments for debt prepayment or debt extinguishment costs | — | (28 | ) | |||||||
Free Cash Flow excluding payments for merger-related costs | $ | 1,433 | $ | 4,761 | 49 | % | ||||
(in millions, except average number of customers and ARPU) | Quarter | Year Ended December 31, | |||||||||||||||||||||||||||||||||||||
Q1 2018 | Q2 2018 | Q3 2018 | Q4 2018 | Q1 2019 | Q2 2019 | Q3 2019 | Q4 2019 | 2018 | 2019 | ||||||||||||||||||||||||||||||
Calculation of Branded Postpaid Phone ARPU | |||||||||||||||||||||||||||||||||||||||
Branded postpaid service revenues | $ | 5,070 | $ | 5,164 | $ | 5,244 | $ | 5,384 | $ | 5,493 | $ | 5,613 | $ | 5,746 | $ | 5,821 | $ | 20,862 | $ | 22,673 | |||||||||||||||||||
Less: Branded postpaid other revenues | (259 | ) | (272 | ) | (289 | ) | (297 | ) | (310 | ) | (326 | ) | (346 | ) | (362 | ) | (1,117 | ) | (1,344 | ) | |||||||||||||||||||
Branded postpaid phone service revenues | $ | 4,811 | $ | 4,892 | $ | 4,955 | $ | 5,087 | $ | 5,183 | $ | 5,287 | $ | 5,400 | $ | 5,459 | $ | 19,745 | $ | 21,329 | |||||||||||||||||||
Divided by: Average number of branded postpaid phone customers (in thousands) and number of months in period | 34,371 | 35,051 | 35,779 | 36,631 | 37,504 | 38,226 | 38,944 | 39,736 | 35,458 | 38,602 | |||||||||||||||||||||||||||||
Branded postpaid phone ARPU | $ | 46.66 | $ | 46.52 | $ | 46.17 | $ | 46.29 | $ | 46.07 | $ | 46.10 | $ | 46.22 | $ | 45.79 | $ | 46.40 | $ | 46.04 | |||||||||||||||||||
Calculation of Branded Prepaid ARPU | |||||||||||||||||||||||||||||||||||||||
Branded prepaid service revenues | $ | 2,402 | $ | 2,402 | $ | 2,395 | $ | 2,399 | $ | 2,386 | $ | 2,379 | $ | 2,385 | $ | 2,393 | $ | 9,598 | $ | 9,543 | |||||||||||||||||||
Divided by: Average number of branded prepaid customers (in thousands) and number of months in period | 20,583 | 20,806 | 20,820 | 20,833 | 21,122 | 21,169 | 20,837 | 20,691 | 20,761 | 20,955 | |||||||||||||||||||||||||||||
Branded prepaid ARPU | $ | 38.90 | $ | 38.48 | $ | 38.34 | $ | 38.39 | $ | 37.65 | $ | 37.46 | $ | 38.16 | $ | 38.54 | $ | 38.53 | $ | 37.95 | |||||||||||||||||||
1. | Customer - SIM number with a unique T-Mobile mobile identifier which is associated with an account that generates revenue. Branded customers generally include customers that are qualified either for postpaid service, where they generally pay after incurring service, or prepaid service, where they generally pay in advance. Wholesale customers include Machine-to-Machine (M2M) and Mobile Virtual Network Operator (MVNO) customers that operate on T-Mobile’s network, but are managed by wholesale partners. |
2. | Churn - Number of customers whose service was disconnected as a percentage of the average number of customers during the specified period. The number of customers whose service was disconnected is presented net of customers that subsequently have their service restored within a certain period of time. |
3. | Customers per account - The number of branded postpaid customers as of the end of the period divided by the number of branded postpaid accounts as of the end of the period. An account may include branded postpaid phone, mobile broadband, and DIGITS customers. |
4. | Average Revenue Per User (ARPU) - Average monthly service revenue earned from customers. Service revenues for the specified period divided by the average customers during the period, further divided by the number of months in the period. |
5. | Cost of services - Costs directly attributable to providing wireless service through the operation of T-Mobile’s network, including direct switch and cell site costs, such as rent, network access and transport costs, utilities, maintenance, associated labor costs, long distance costs, regulatory program costs, roaming fees paid to other carriers and data content costs. |
6. | Net income margin - Margin % calculated as net income divided by service revenues. |
7. | Adjusted EBITDA - Earnings before interest expense, net of interest income, income tax expense, depreciation and amortization expense, non-cash stock-based compensation and certain expenses not reflective of T-Mobile’s ongoing operating performance such as merger-related costs. Adjusted EBITDA margin represents Adjusted EBITDA divided by service revenues. Adjusted EBITDA is a non-GAAP financial measure utilized by T-Mobile’s management to monitor the financial performance of our operations. T-Mobile uses Adjusted EBITDA internally as a measure to evaluate and compensate its personnel and management for their performance, and as a benchmark to evaluate T-Mobile’s operating performance in comparison to its competitors. Management believes analysts and investors use Adjusted EBITDA as a supplemental measure to evaluate overall operating performance and facilitate comparisons with other wireless communications companies because it is indicative of T-Mobile’s ongoing operating performance and trends by excluding the impact of interest expense from financing, non-cash depreciation and amortization from capital investments, non-cash stock-based compensation, network decommissioning costs and costs related to the Transactions, as they are not indicative of T-Mobile’s ongoing operating performance, as well as certain other nonrecurring income and expenses. Adjusted EBITDA has limitations as an analytical tool and should not be considered in isolation or as a substitute for income from operations, net income or any other measure of financial performance reported in accordance with U.S. Generally Accepted Accounting Principles (“GAAP”). |
8. | Adjusted EBITDA Margin - Margin % calculated as Adjusted EBITDA divided by service revenues. |
9. | Smartphones - UMTS/HSPA/HSPA+ 21/HSPA+ 42/4G LTE enabled converged devices, which integrate voice and data services. |
10. | Free Cash Flow - Net cash provided by operating activities less cash purchases of property and equipment, including proceeds from sales of tower sites and proceeds related to beneficial interests in securitization transactions and less cash payments for debt prepayment or debt extinguishment costs. Free Cash Flow is utilized by T-Mobile’s management, investors, and analysts to evaluate cash available to pay debt and provide further investment in the business. The reconciliation of Free Cash Flow to net cash provided by operating activities is detailed in the Reconciliation of Non-GAAP Financial Measures to GAAP Financial Measures schedule. In Q1 2018, we made an accounting change to reduce net cash provided by operating activities by the deferred purchase price less payments for debt prepayment or debt extinguishment costs, as a result of the adoption of ASU 2016-15. Free Cash Flow has been redefined to reflect the changes in classification and present cash flows on a consistent basis for investor transparency. |
11. | Net debt - Short-term debt, short-term debt to affiliates, long-term debt, and long-term debt (excluding tower obligations) to affiliates, short-term financing lease liabilities and financing lease liabilities, less cash and cash equivalents. Leases classified as capital leases under the previous standard are included in Financing Lease liabilities within our Consolidated Balance Sheet under the new lease standard. The liabilities related to these leases are included in the Net debt calculation under the previous and new lease standards. |