Exhibit 99.1

Turning Point Brands Announces First Quarter 2020 Results
LOUISVILLE, KY. (April 28, 2020) - Turning Point Brands (“TPB”) (NYSE: TPB), a leading provider of Other Tobacco Products (“OTP”) and adult consumer alternatives, today announced financial results for the first
quarter ended March 31, 2020.
Results at a Glance
First Quarter 2020
(Comparisons vs. same period year-ago)
| ✓ |
Net sales decreased 1.0% to $90.7 million;
|
| ✓ |
Gross profit increased 2.4% to $41.4 million;
|
| ✓ |
Net income decreased $3.3 million to $3.3 million, reflecting the inclusion of expensing PMTA costs incurred during the quarter;
|
| ✓ |
Adjusted EBITDA increased 10.6% to $17.8 million (see Schedule A for a reconciliation to net income);
|
| ✓ |
Diluted EPS of $0.16 and Adjusted Diluted EPS of $0.51 as compared to $0.33 and $0.43 in the year-ago period, respectively (see Schedule C for a reconciliation to Diluted EPS);
|
“Our results this quarter reflect the robust demand for our products even during challenging times. Sales performance was driven by mid-teens growth in our core Smokeless and Smoking segments partially aided by trade
load-in as a response to strong customer demand and the uncertain environment. We estimate trade load-in impacted sales in our core tobacco segments by $2 million. Our NewGen segment also delivered better than expected results after we reorganized
the business last quarter,” said Larry Wexler, President and CEO. “During this challenging environment, we are especially proud of the job our employees are doing to ensure the health and safety of each other and our local communities while
maintaining our commitment to meet our customers’ needs. The dedication of TPB’s workforce to serve those needs has been remarkable.”
COVID-19 Impact
“As a result of the extraordinary situation we are facing, our focus during the quarter was on the safety and well-being of our colleagues and the communities and customers we serve. This focus serves
as the basis for decisions we make as a company and how we react going forward,” said Wexler.
TPB implemented several changes to enhance safety and mitigate health risk in its work environment. For warehouse and manufacturing operations, these include split shifts, temperature scans,
additional contactless hand sanitizing stations, protective equipment, social distancing guidelines, and increased cleaning and sanitization.
Unnecessary travel was suspended, and telecommuting is being facilitated where possible. Like many organizations, the company has changed the way it communicates through increased use of
videoconferencing and has implemented tele-selling initiatives through its sales force. Some of these changes are likely to remain in-place even after this crisis and will lead to on-going cost savings. Annual compensation increases for corporate
employees have been deferred other than those contractually required. In addition, new spending commitments are on hold as management cautiously manages through this environment.
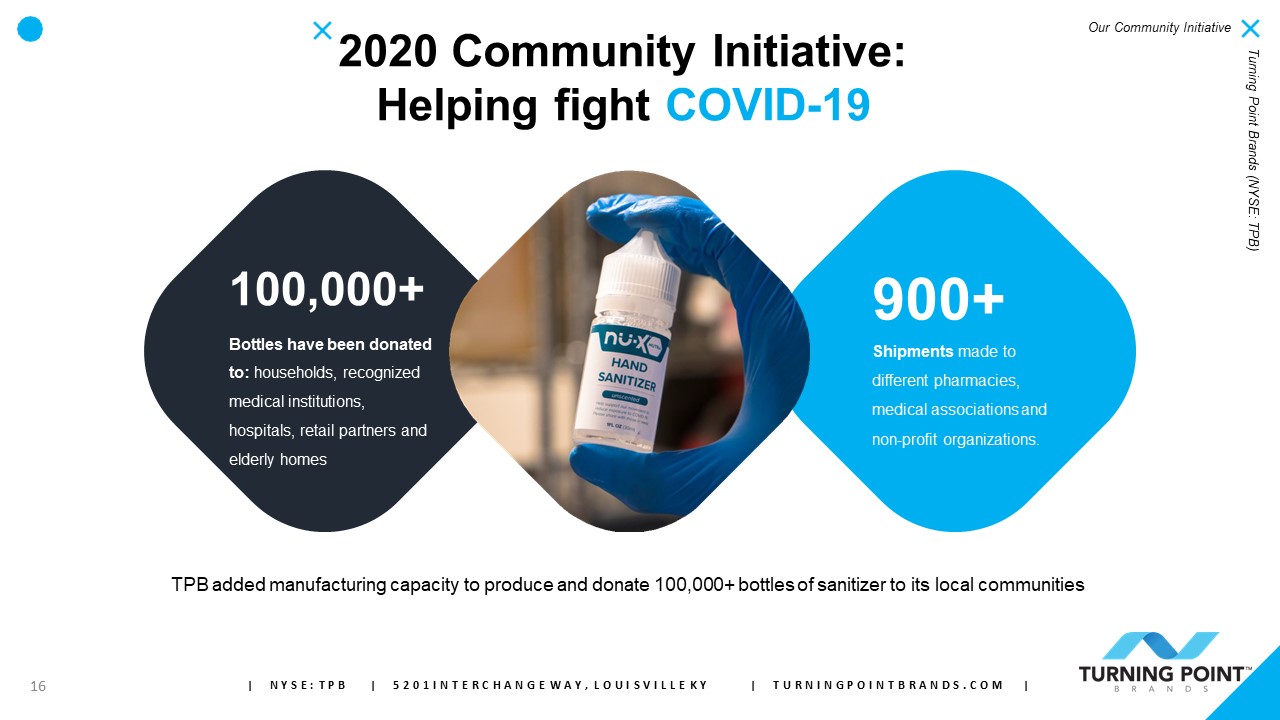
To meet increased demand, the company hired additional employees for its Louisville facility and implemented wage increases for hourly employees. Production capacity was utilized to manufacture hand
sanitizers with bottles being donated to hospitals, nursing homes and first responders in our local communities.
The company expects COVID-19 to impact results in the second quarter. A third-party cigar wrap manufacturer in the Dominican Republic temporarily closed for three weeks and is slowly ramping back up.
In-person selling has been dramatically dampened, which will slow new product launches. Select budgeted annual price increases will be delayed. These issues will be partially offset by TPB’s growing B2C platforms. Management will continue to
monitor this challenging environment closely and will make necessary adjustments as needed to make sure TPB continues to serve its customers, while also protecting the safety of its employees and communities.
Recent Events
On April 8, 2020, TPB and Standard Diversified Inc. (“SDI”) (NYSE: SDI) announced a definitive agreement under which SDI will be merged into a wholly-owned subsidiary of TPB in a tax-free downstream
merger, in a transaction first announced by the companies in November 2019. Under the terms of the agreement, the holders of SDI’s Class A Common Stock and SDI’s Class B Common Stock (collectively, the “SDI Common Stock”) will receive in the
aggregate, in return for their SDI Common Stock, TPB Voting Common Stock (“TPB Common Stock”) at a ratio of 0.97 of a share of TPB Common Stock for each share of TPB Common Stock held by SDI at the time of the merger. SDI will divest its assets
prior to close such that the net liabilities at closing will not exceed $25,000 and the only assets that it shall retain is the remaining TPB stock holdings.
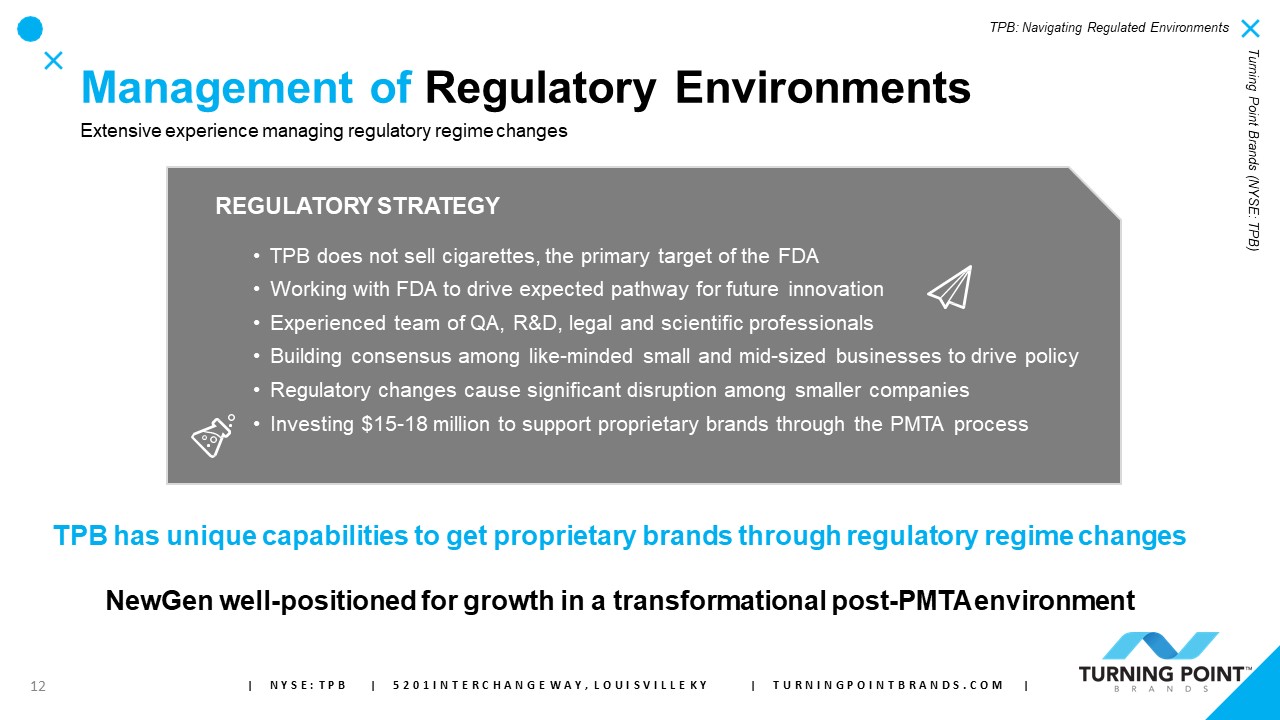
As a result of impacts due to COVID-19, FDA requested and received a modification to the United States District Court for the District of Maryland remedy order, resulting in a 120-day extension of the
premarket tobacco application deadline for many e-cigarettes, cigars and other tobacco products. The new deadline of September 9, 2020 will allow TPB to utilize this additional time to bolster its premarket filings. The company continues to expect
to spend a total of $15 to $18 million (inclusive of $2.2 million spent in 2019 and $5.9 million in the first quarter of 2020) on the PMTA process.
The company continues to actively engage in potential acquisition discussions with multiple candidates, but with no firm commitments currently. While the coronavirus has likely delayed the timing of
completing such transactions, we have seen an increased pipeline of attractive opportunities as capital has become scarce.
Smokeless Products Segment (29% of total net sales in the quarter)
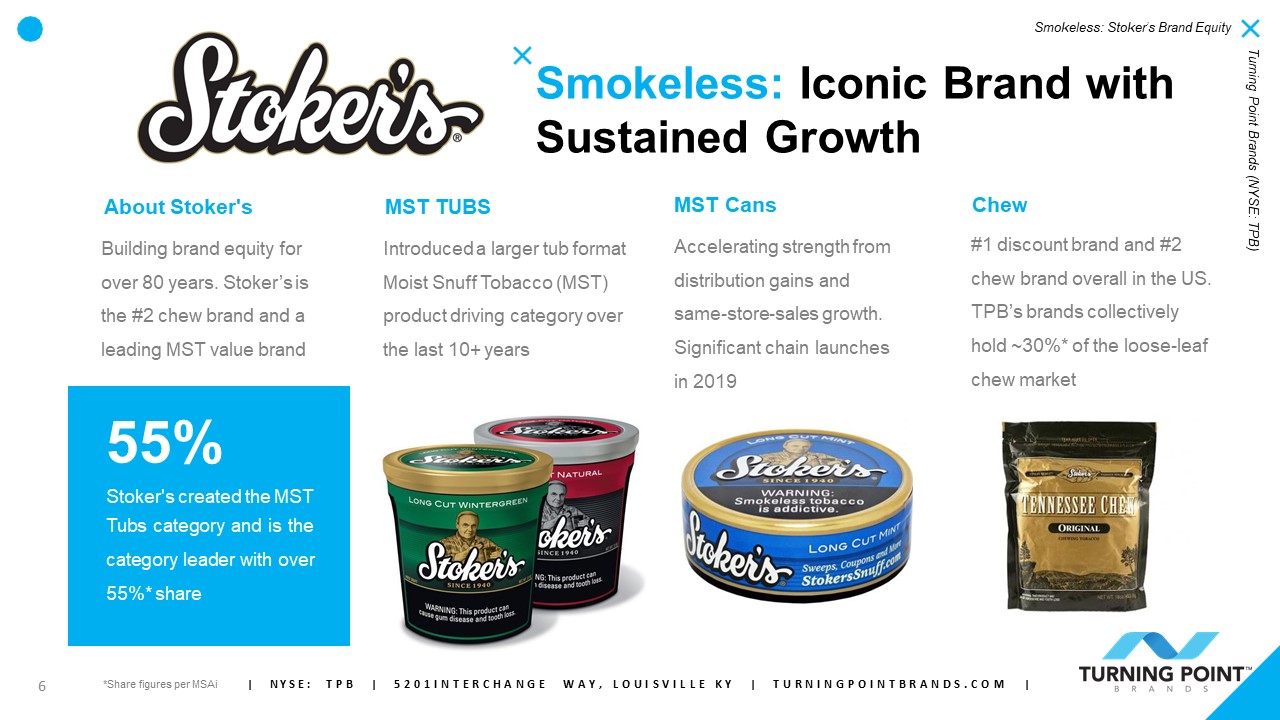
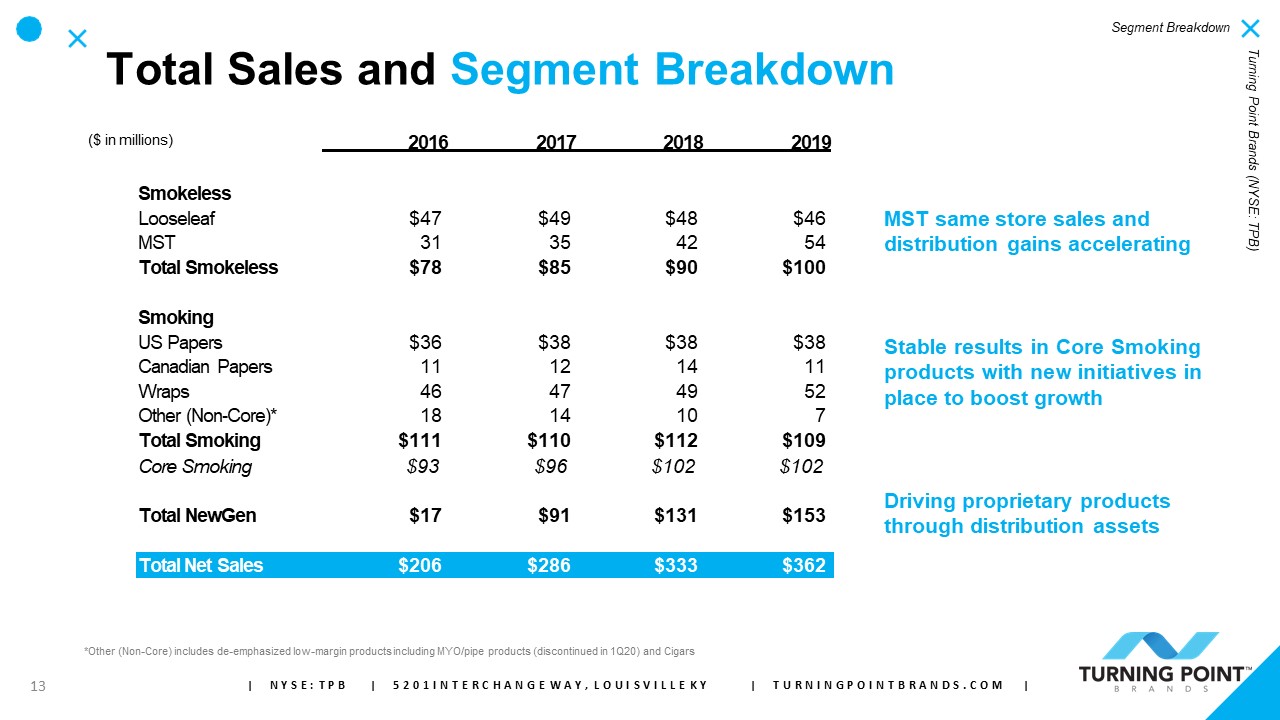
For the first quarter, Smokeless products net sales increased 17.5% to $26.5 million on continued double-digit volume growth of Stoker’s MST. Sales in chewing tobacco were flat as compared to the
year-ago quarter. MST represented 59% of Smokeless revenues in the quarter, up from 52% a year earlier. In the quarter, total Smokeless segment volume increased 16.7% and price/mix advanced 0.8%.
“Our Stoker’s MST tubs line saw elevated demand at the end of the quarter as consumer trade down trends accelerated with a shift to larger volume purchases during the pandemic. We estimate trade load-in likely
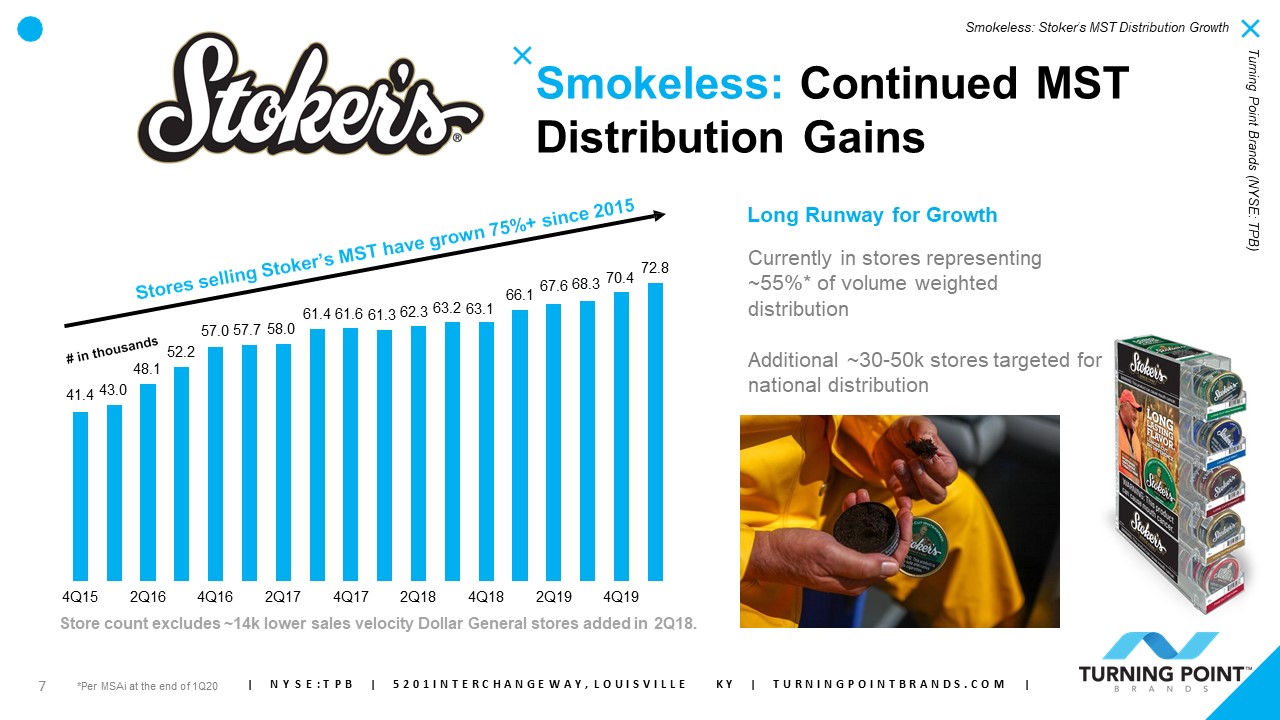
impacted sales by approximately $0.9 million during the quarter,” said Graham Purdy, Chief Operating Officer. “Stoker’s MST market share gains are poised to continue through same store sales gains along with further distribution expansion.”
For the quarter, Smokeless segment gross profit increased 14.9% to $13.9 million. Segment gross margin contracted 120 basis points to 52.4% primarily as a result of mix.
Smoking Products Segment (32% of total net sales in the quarter)
For the first quarter, net sales of Smoking products increased 13.3% to $28.9 million. Growth was driven by double-digit advances in US rolling papers, partially offset by a $0.5 million decline in
non-focus cigars and MYO/Pipe. In the quarter, total Smoking segment volume increased 10.9% while price/mix increased 2.4%.
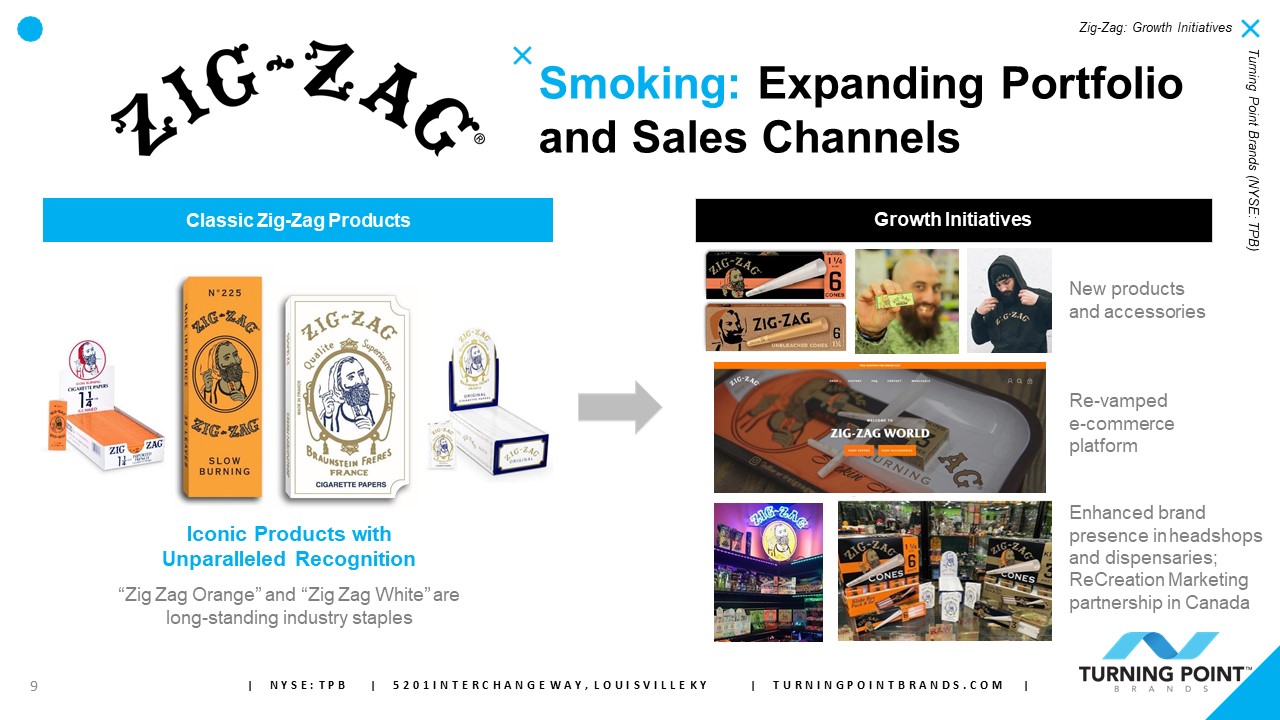
Zig-Zag continues to leverage its iconic positioning in rolling papers to successfully extend into new product lines. The expansion of organic hemp, paper cones, and unbleached papers continued during
the quarter. Zig-Zag organic hemp papers are now in approximately 39,000 retail outlets while paper cones and unbleached papers are now in approximately 31,000 and 21,000 retail outlets, respectively.
“Our recent Zig-Zag introductions continue to perform well. According to MSAi, Zig-Zag’s share of the paper cone category climbed from 5% to 27% over the last year to position Zig-Zag as
the #2 brand while Zig-Zag hemp paper is the #1 hemp paper brand with 28% share. We have also launched new initiatives to enhance Zig-Zag’s presence in other channels such as e-commerce and dispensaries both in the U.S. and in Canada that can be
meaningful drivers of growth. Trade load-in likely impacted sales by approximately $1.1 million during the quarter,” said Purdy.
For the quarter, Smoking products gross profit increased 19.6% to $16.1 million. Segment gross margin expanded 300 basis points to 55.8% as a result of increased US rolling paper sales and a continued decline in the
low margin cigar business.
NewGen (New Generation) Products Segment (39% of total net sales in the quarter)
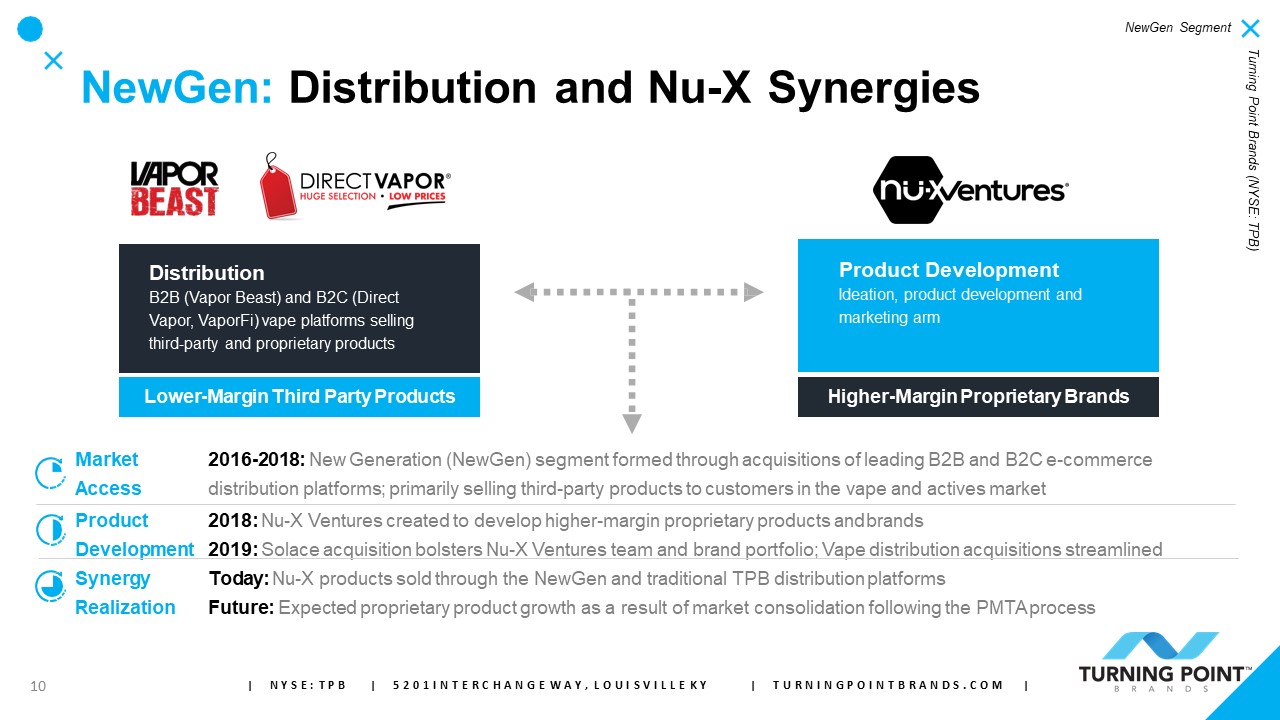
For the first quarter, NewGen segment net sales contracted 19.0% to $35.3 million as a result of the continued impact of the vapor market disruption and the
discontinuance of the V2 business. This was partially offset by positive contributions from CBD, Solace and other Nu-X products.
“We are encouraged by the results from the recent consolidation and streamlining of our business, despite lingering headwinds related to disruption in the vapor market that began in third quarter
2019. The NewGen segment is again profitable. In our B2C business, we experienced a strong rebound at the end of the quarter that has continued as customers shift to buying online,” said Purdy. “We successfully navigated our vape business through
the disruption in the market last year and believe the trough is now behind us. We are now looking forward to completing the PMTA process after which there is significant potential for our proprietary brands. Furthermore, we are excited about the
new products we have in the pipeline for Nu-X and continue to believe the Nu-X platform will serve as a strong engine for future growth.”
For the quarter, NewGen gross profit decreased $3.5 million to $11.4 million primarily as a result of the decline in net sales. Segment gross margin declined 180 basis points to 32.4%
primarily due to recent product introductions. First quarter 2020 included $2.8 million of tariff expense compared to $2.0 million a year-ago.
Other Events and Performance Measures in the First Quarter
First quarter consolidated selling, general and administrative (“SG&A”) expenses were $32.4 million compared to $28.4 million in 2019.
The first quarter had notable non-recurring impacts:
| • |
$5.9 million of FDA related expenses as compared to $0.0 million a year-ago; and
|
| • |
$1.0 million of transaction expenses principally related to M&A activity, including the announced SDI transaction.
|
The effective tax rate for the quarter was 22%.
Total debt at March 31, 2020 was $280.0 million. Net debt at March 31, 2020 was $180.6 million. Net debt at March 31, 2020 to rolling twelve months Adjusted EBITDA was 2.6x (see Schedule B for a
reconciliation).
2020 Outlook
We are pleased that our first quarter results were above our expectations. We are also encouraged by government measures to support consumers and the economy. In-light of the changing
landscape, we feel it is prudent to maintain our full year net sales and Adjusted EBITDA guidance provided February 26, 2020 until there is some clarity on the duration and the impact of the government reaction to the pandemic.
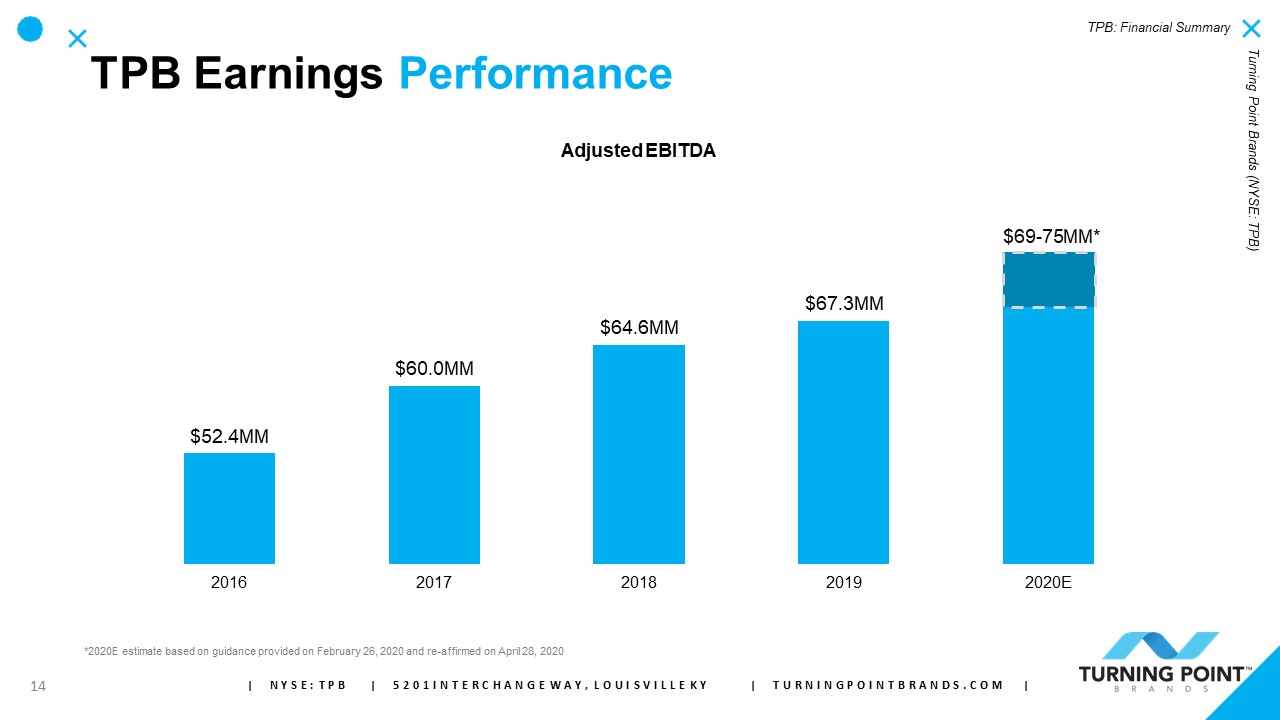
Absent any acquisitions, the company projects 2020 net sales to be $338 to $353 million. We project 2020 Adjusted EBITDA of $69 to $75 million. Our projections assume no upside from the PMTA process in 2020.
Stock compensation and non-cash incentive expense in 2020 is now projected to be $2.8 million (down from previous guidance of $3.3 million).
The company continues to expect to spend a total of $15 to $18 million (inclusive of $2.2 million spent in 2019 and $5.9 million in the first quarter of 2020) on the PMTA process, with expenses heavily weighted
towards the first half of 2020.
Cash interest expense is projected to be $11 to $12 million and GAAP interest expense includes $7 million of debt discount amortization equal to the fair value of the equity components over the expected life of the
2024 convertible notes.
The company now expects the 2020 effective income tax rate to be 22% to 24% (compared to previous guidance of 21 to 23%).
Capital expenditures for 2020 are anticipated to be approximately $4 to $6 million (up from $4 million previously) as we are currently evaluating accelerating certain capital expenditure projects due to temporary tax
code incentives.
Net Sales for the second quarter 2020 are expected to be $81 to $87 million.
Earnings Conference Call
As previously disclosed, a conference call with the investment community to review TPB’s financial results has been scheduled for 10 a.m. Tuesday, April 28, 2020. Investment community
participants should dial in ten minutes ahead of time using the toll-free number 844-889-4324 (International participants should call 412-317-9262). A live listen-only webcast of the call is available from the Events and Presentations section of
the investor relations portion of the company website (www.turningpointbrands.com). A replay of the webcast will be available on the site three hours following the
call.
Non-GAAP Financial Measures
In addition to financial measures prepared in accordance with generally accepted accounting principles in the United States (GAAP), this press release includes certain non-GAAP financial
measures including Adjusted EBITDA, Adjusted diluted EPS, Net Debt and Adjusted Operating Income. A reconciliation of these non-GAAP financial measures accompanies this release.
About Turning Point Brands, Inc.
Louisville, Kentucky-based Turning Point Brands, Inc. (NYSE: TPB) is a leading U.S. provider of Other Tobacco Products and adult consumer alternatives. TPB, through its focus brands
generates solid cash flow which it uses to finance acquisitions, increase brand support and strengthen its capital structure. TPB does not sell cigarettes. More information about the company is available at its corporate website, www.turningpointbrands.com.
Forward-Looking Statements
This press release contains forward-looking statements within the meaning of the federal securities laws. Forward-looking statements may generally be identified by the use of words such as "anticipate," "believe,"
"expect," "intend," "plan" and "will" or, in each case, their negative, or other variations or comparable terminology. These forward-looking statements include all matters that are not historical facts. By their nature, forward-looking statements
involve risks and uncertainties because they relate to events and depend on circumstances that may or may not occur in the future. As a result, actual events may differ materially from those expressed in or suggested by the forward-looking
statements. Any forward-looking statement made by TPB in this press release speaks only as of the date hereof. New risks and uncertainties come up from time to time, and it is impossible for TPB to predict these events or how they may affect it.
TPB has no obligation, and does not intend, to update any forward-looking statements after the date hereof, except as required by federal securities laws. Factors that could cause these differences include, but are not limited to:
| • |
declining sales of tobacco products, and expected continuing decline of sales, in the tobacco industry overall;
|
| • |
our dependence on a small number of third-party suppliers and producers;
|
| • |
the possibility that we will be unable to identify or contract with new suppliers or producers in the event of a supply or product disruption;
|
| • |
our business may be damaged by events outside of our suppliers’ control, such as the impact of epidemics (e.g., coronavirus), pollical upheavals, or natural disasters;
|
| • |
the possibility that our licenses to use certain brands or trademarks will be terminated, challenged or restricted;
|
| • |
failure to maintain consumer brand recognition and loyalty of our customers;
|
| • |
substantial and increasing U.S. regulation;
|
| • |
regulation of our products by the FDA, which has broad regulatory powers;
|
| • |
our products are subject to developing and unpredictable regulation, for example, current court action moving forward certain substantial Pre Market Tobacco Application obligations;
|
| • |
some of our products contain nicotine which is considered to be a highly addictive substance;
|
| • |
uncertainty related to the regulation and taxation of our NewGen products;
|
| • |
possible significant increases in federal, state and local municipal tobacco- and vapor-related taxes;
|
| • |
possible increasing international control and regulation;
|
| • |
our reliance on relationships with several large retailers and national chains for distribution of our products;
|
| • |
our amount of indebtedness;
|
| • |
the terms of our credit facilities, which may restrict our current and future operations;
|
| • |
intense competition and our ability to compete effectively;
|
| • |
uncertainty and continued evolution of markets containing our NewGen products;
|
| • |
significant product liability litigation;
|
| • |
the scientific community’s lack of information regarding the long-term health effects of electronic cigarettes, vaporizer and e-liquid use;
|
| • |
requirement to maintain compliance with master settlement agreement escrow account;
|
| • |
competition from illicit sources;
|
| • |
our reliance on information technology;
|
| • |
security and privacy breaches;
|
| • |
contamination of our tobacco supply or products;
|
| • |
infringement on our intellectual property;
|
| • |
third-party claims that we infringe on their intellectual property;
|
| • |
failure to manage our growth;
|
| • |
failure to successfully integrate our acquisitions or otherwise be unable to benefit from pursuing acquisitions;
|
| • |
fluctuations in our results;
|
| • |
exchange rate fluctuations;
|
| • |
adverse U.S. and global economic conditions;
|
| • |
sensitivity of end-customers to increased sales taxes and economic conditions;
|
| • |
failure to comply with certain regulations;
|
| • |
departure of key management personnel or our inability to attract and retain talent;
|
| • |
imposition of significant tariffs on imports into the U.S.;
|
| • |
reduced disclosure requirements applicable to emerging growth companies may make our common stock less attractive to investors, potentially decreasing our stock price;
|
| • |
failure to maintain our status as an emerging growth company before the five-year maximum time period a company may retain such status;
|
| • |
our principal stockholders will be able to exert significant influence over matters submitted to our stockholders and may take certain actions to prevent takeovers;
|
| • |
our certificate of incorporation and bylaws, as well as Delaware law and certain regulations, could discourage or prohibit acquisition bids or merger proposals, which may adversely affect the market price of our
common stock;
|
| • |
our certificate of incorporation limits the ownership of our common stock by individuals and entities that are Restricted Investors. These restrictions may affect the liquidity of our common stock and may result
in Restricted Investors being required to sell or redeem their shares at a loss or relinquish their voting, dividend and distribution rights;
|
| • |
future sales of our common stock in the public market could reduce our stock price, and any additional capital raised by us through the sale of equity or convertible securities may dilute your ownership in us;
|
| • |
we may issue preferred stock whose terms could adversely affect the voting power or value of our common stock; and
|
| • |
our status as a “controlled company” could make our common stock less attractive to some investors or otherwise harm our stock price.
|
Contact:
Robert Lavan, Senior Vice President, CFO
[email protected] (502) 774-9238
Financial Statements Follow:
Turning Point Brands, Inc.
Consolidated Statement of Income
(dollars in thousands except share data)
|
Three Months Ended
March 31,
|
||||||||
|
2020
|
2019
|
|||||||
|
Net sales
|
$
|
90,689
|
$
|
91,628
|
||||
|
Cost of sales
|
49,258
|
51,164
|
||||||
|
Gross profit
|
41,431
|
40,464
|
||||||
|
Selling, general, and administrative expenses
|
32,394
|
28,429
|
||||||
|
Operating income
|
9,037
|
12,035
|
||||||
|
Interest expense, net
|
4,994
|
3,856
|
||||||
|
Investment income
|
(91
|
)
|
(144
|
)
|
||||
|
Net periodic income, excluding service cost
|
(87
|
)
|
(11
|
)
|
||||
|
Income before income taxes
|
4,221
|
8,334
|
||||||
|
Income tax expense
|
946
|
1,774
|
||||||
|
Consolidated net income
|
$
|
3,275
|
$
|
6,560
|
||||
|
Basic income per common share:
|
||||||||
|
Consolidated net income
|
$
|
0.17
|
$
|
0.34
|
||||
|
Diluted income per common share:
|
||||||||
|
Consolidated net income
|
$
|
0.16
|
$
|
0.33
|
||||
|
Weighted average common shares outstanding:
|
||||||||
|
Basic
|
19,689,446
|
19,559,596
|
||||||
|
Diluted
|
20,106,800
|
20,045,964
|
||||||
|
Supplemental disclosures of statement of income information:
|
||||||||
|
Excise tax expense
|
$
|
5,041
|
$
|
4,976
|
||||
|
FDA fees
|
$
|
129
|
$
|
134
|
||||
Turning Point Brands, Inc.
Consolidated Balance Sheet
(dollars in thousands except share data)
|
ASSETS
|
(unaudited)
March 31,
2020
|
December 31,
2019
|
||||||
|
Current assets:
|
||||||||
|
Cash
|
$
|
99,406
|
$
|
95,250
|
||||
|
Accounts receivable, net of allowances of $256 in 2020 and $280 in 2019
|
4,310
|
6,906
|
||||||
|
Inventories
|
69,195
|
70,979
|
||||||
|
Other current assets
|
18,868
|
16,115
|
||||||
|
Total current assets
|
191,779
|
189,250
|
||||||
|
Property, plant, and equipment, net
|
13,404
|
13,816
|
||||||
|
Right of use assets
|
13,036
|
12,130
|
||||||
|
Deferred financing costs, net
|
860
|
890
|
||||||
|
Goodwill
|
154,282
|
154,282
|
||||||
|
Other intangible assets, net
|
33,044
|
33,469
|
||||||
|
Master Settlement Agreement (MSA) escrow deposits
|
32,074
|
32,074
|
||||||
|
Other assets
|
10,841
|
10,673
|
||||||
|
Total assets
|
$
|
449,320
|
$
|
446,584
|
||||
|
LIABILITIES AND STOCKHOLDERS' EQUITY
|
||||||||
|
Current liabilities:
|
||||||||
|
Accounts payable
|
$
|
17,348
|
$
|
14,126
|
||||
|
Accrued liabilities
|
28,754
|
26,520
|
||||||
|
Current portion of long-term debt
|
12,000
|
15,240
|
||||||
|
Revolving credit facility
|
-
|
-
|
||||||
|
Total current liabilities
|
58,102
|
55,886
|
||||||
|
Notes payable and long-term debt
|
267,977
|
268,951
|
||||||
|
Deferred income taxes
|
1,495
|
1,572
|
||||||
|
Lease liabilities
|
11,673
|
11,067
|
||||||
|
Other long-term liabilities
|
4,762
|
2,523
|
||||||
|
Total liabilities
|
344,009
|
339,999
|
||||||
|
Commitments and contingencies
|
||||||||
|
Stockholders' equity:
|
||||||||
|
Preferred stock; $0.01 par value; authorized shares 40,000,000; issued and outstanding shares -0-
|
-
|
-
|
||||||
|
Common stock, voting, $0.01 par value; authorized shares, 190,000,000; 19,723,080 issued shares, 19,588,950 outstanding shares at March 31, 2020, and 19,680,673
issued and outstanding shares at December 31, 2019
|
197
|
197
|
||||||
|
Common stock, nonvoting, $0.01 par value; authorized shares, 10,000,000; issued and outstanding shares -0-
|
-
|
-
|
||||||
| Additional paid-in capital |
126,151
|
125,469
|
||||||
|
Cost of repurchased common stock (134,130 shares at March 31, 2020 and 0 shares at December 31, 2019)
|
(2,627
|
)
|
-
|
|||||
|
Accumulated other comprehensive loss
|
(5,379
|
)
|
(3,773
|
)
|
||||
|
Accumulated deficit
|
(13,031
|
)
|
(15,308
|
)
|
||||
|
Total stockholders' equity
|
105,311
|
106,585
|
||||||
|
Total liabilities and stockholders' equity
|
$
|
449,320
|
$
|
446,584
|
||||
Turning Point Brands, Inc.
Consolidated Statement of Cash Flows
(dollars in thousands)
|
For the three months ended March 31,
|
||||||||
|
2020
|
2019
|
|||||||
|
Cash flows from operating activities:
|
||||||||
|
Consolidated net income
|
$
|
3,275
|
$
|
6,560
|
||||
|
Adjustments to reconcile net income to net cash provided by operating activities:
|
||||||||
|
Loss on disposal of property, plant, and equipment
|
-
|
23
|
||||||
|
Depreciation expense
|
851
|
531
|
||||||
|
Amortization of other intangible assets
|
425
|
359
|
||||||
|
Amortization of debt discount and deferred financing costs
|
2,237
|
237
|
||||||
|
Deferred income taxes
|
545
|
(29
|
)
|
|||||
|
Stock compensation expense
|
455
|
466
|
||||||
|
Noncash lease expense
|
13
|
-
|
||||||
|
Changes in operating assets and liabilities:
|
||||||||
|
Accounts receivable
|
2,596
|
(1,726
|
)
|
|||||
|
Inventories
|
1,784
|
366
|
||||||
|
Other current assets
|
(2,420
|
)
|
2,984
|
|||||
|
Other assets
|
(130
|
)
|
(427
|
)
|
||||
|
Accounts payable
|
3,210
|
8,229
|
||||||
|
Accrued postretirement liabilities
|
(27
|
)
|
(9
|
)
|
||||
|
Accrued liabilities and other
|
1,913
|
(3,539
|
)
|
|||||
|
Net cash provided by operating activities
|
14,727
|
14,025
|
||||||
|
Cash flows from investing activities:
|
||||||||
|
Capital expenditures
|
$
|
(877
|
)
|
$
|
(886
|
)
|
||
|
Restricted cash, MSA escrow deposits
|
-
|
1,702
|
||||||
|
Net cash (used in) provided for by investing activities
|
(877
|
)
|
816
|
|||||
|
Cash flows from financing activities:
|
||||||||
|
Payments of 2018 first lien term loan
|
(2,000
|
)
|
(2,000
|
)
|
||||
|
Payments of 2018 revolving credit facility
|
-
|
(12,000
|
)
|
|||||
|
Payment of dividends
|
(886
|
)
|
(880
|
)
|
||||
|
Payment of IVG note
|
(4,240
|
)
|
-
|
|||||
|
Payments of financing costs
|
(168
|
)
|
-
|
|||||
|
Common stock repurchased
|
(2,627
|
)
|
-
|
|||||
|
Exercise of options
|
227
|
187
|
||||||
|
Redemption of options
|
-
|
(12
|
)
|
|||||
|
Net cash used in financing activities
|
$
|
(9,694
|
)
|
$
|
(14,705
|
)
|
||
|
Net increase in cash
|
$
|
4,156
|
$
|
136
|
||||
|
Cash, beginning of period:
|
||||||||
|
Unrestricted
|
$
|
95,250
|
$
|
3,306
|
||||
|
Restricted
|
32,074
|
2,361
|
||||||
|
Total cash at beginning of period
|
$
|
127,324
|
$
|
5,667
|
||||
|
Unrestricted
|
$
|
99,406
|
$
|
1,741
|
||||
|
Restricted
|
32,074
|
4,062
|
||||||
|
Total cash at end of period
|
$
|
131,480
|
$
|
5,803
|
||||
Non-GAAP Financial Measures
To supplement our financial information presented in accordance with generally accepted accounting principles in the United States, or U.S. GAAP, we use non-U.S. GAAP financial measures, including EBITDA, Adjusted
EBITDA, Adjusted diluted EPS, Net Debt and Adjusted Operating Income. We believe Adjusted EBITDA provides useful information to management and investors regarding certain financial and business trends relating to our financial condition and
results of operations. Adjusted EBITDA, Adjusted diluted EPS, Net Debt and Adjusted Operating Income are used by management to compare our performance to that of prior periods for trend analyses and planning purposes and are presented to our board
of directors. We believe that EBITDA, Adjusted EBITDA, Adjusted diluted EPS and Adjusted Operating Income are appropriate measures of operating performance because they eliminate the impact of expenses that do not relate to business performance.
We define “EBITDA” as net income before interest expense, loss on extinguishment of debt, provision for income taxes, depreciation and amortization. We define “Adjusted EBITDA” as net income before interest expense,
loss on extinguishment of debt, provision for income taxes, depreciation, amortization, other non-cash items and other items that we do not consider ordinary course in our evaluation of ongoing operating performance. We define “Adjusted diluted
EPS” as diluted earnings per share excluding items that we do not consider ordinary course in our evaluation of ongoing operating performance. We define “Net Debt” as total debt less cash. We define “Adjusted Operating Income” as operating income
excluding depreciation, amortization, LIFO, other non-cash items and other items that we do not consider ordinary course in our evaluation of ongoing operating performance.
Non-U.S. GAAP measures should not be considered a substitute for, or superior to, financial measures calculated in accordance with U.S. GAAP. EBITDA, Adjusted EBITDA Adjusted diluted EPS and Adjusted Operating
Income exclude significant expenses that are required by U.S. GAAP to be recorded in our financial statements and is subject to inherent limitations. In addition, other companies in our industry may calculate this non-U.S. GAAP measure differently
than we do or may not calculate it at all, limiting its usefulness as a comparative measure.
In accordance with SEC rules, we have provided, in the supplemental information attached, a reconciliation of the non-GAAP measures to the next directly comparable GAAP measures.
Schedule A
Turning Point Brands, Inc.
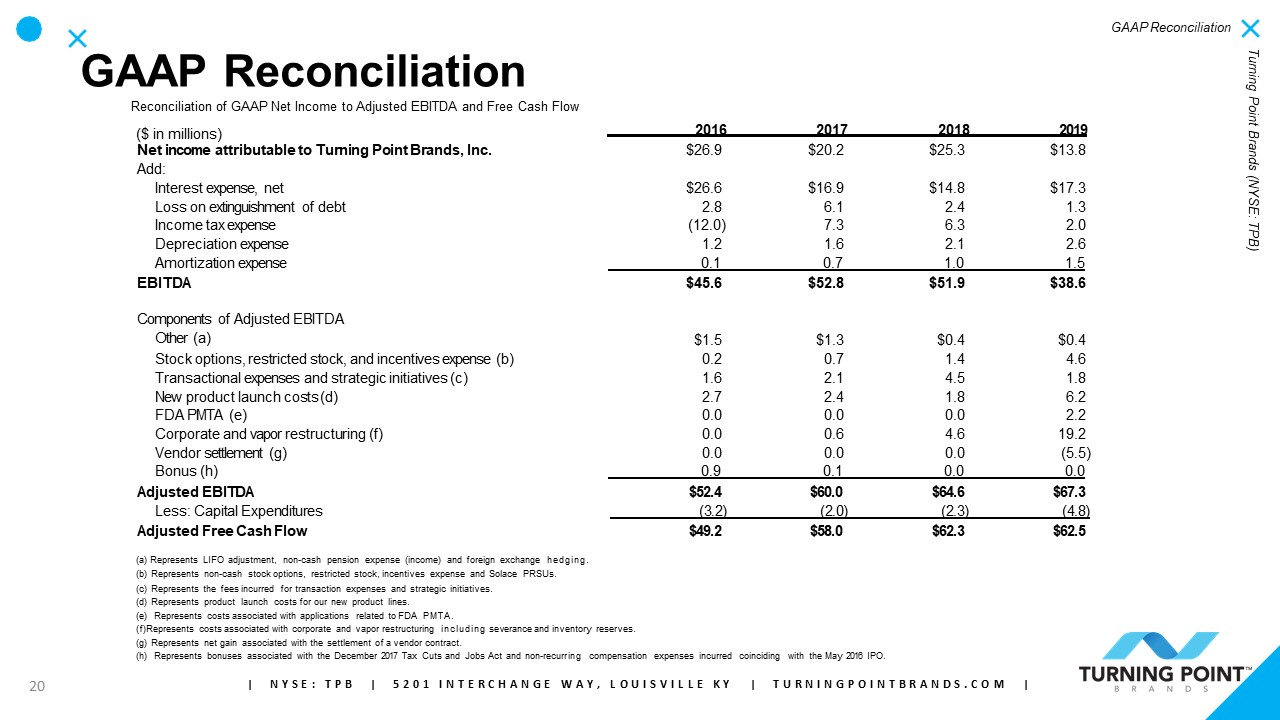
Reconciliation of GAAP Net Income to Adjusted EBITDA
(dollars in thousands)
|
Three Months Ended
March 31, |
||||||||
|
2020
|
2019
|
|||||||
|
Consolidated net income
|
$
|
3,275
|
$
|
6,560
|
||||
|
Add:
|
||||||||
|
Interest expense, net
|
4,994
|
3,856
|
||||||
|
Income tax expense
|
946
|
1,774
|
||||||
|
Depreciation expense
|
851
|
531
|
||||||
|
Amortization expense
|
425
|
359
|
||||||
|
EBITDA
|
$
|
10,491
|
$
|
13,080
|
||||
|
Components of Adjusted EBITDA
|
||||||||
|
Other (a)
|
(87
|
)
|
(79
|
)
|
||||
|
Stock options, restricted stock, and incentives expense (b)
|
455
|
715
|
||||||
|
Transactional expenses and strategic initiatives (c)
|
1,049
|
910
|
||||||
|
New product launch costs (d)
|
-
|
442
|
||||||
|
Corporate and vapor restructuring (e)
|
-
|
1,004
|
||||||
|
FDA PMTA (f)
|
5,874
|
-
|
||||||
|
Adjusted EBITDA
|
$
|
17,782
|
$
|
16,072
|
||||
| (a) |
Represents LIFO adjustment, non-cash pension/postretirement expense (income) and foreign exchange hedging.
|
| (b) |
Represents non-cash stock options, restricted stock, incentives expense and Solace PRSUs.
|
| (c) |
Represents the fees incurred for transaction expenses and strategic initiatives.
|
| (d) |
Represents product launch costs of our new product lines.
|
| (e) |
Represents costs associated with corporate and vapor restructuring including severance and inventory reserves.
|
| (f) |
Represents costs associated with applications related to FDA PMTA.
|
Schedule B
Turning Point Brands, Inc.
Reconciliation of GAAP Total Debt to Net Debt
(dollars in thousands)
|
March 31,
2020 |
December 31,
2019 |
|||||||
|
Cash
|
$
|
99,406
|
$
|
95,250
|
||||
|
Total Debt
|
$
|
279,977
|
$
|
284,191
|
||||
|
Net Debt
|
$
|
180,571
|
$
|
188,941
|
||||
|
Leverage Ratio (a)
|
2.6
|
x
|
3.1
|
x
|
||||
|
(a)
|
Leverage ratio is calculated by net debt / adjusted EBITDA.
|
Turning Point Brands, Inc.
Reconciliation of GAAP Net Income to Adjusted EBITDA
April 1, 2019, to March 31, 2020
(dollars in thousands)
|
Rolling
12 Months
|
1st Quarter
2020
|
4th Quarter
2019
|
3rd Quarter
2019
|
2nd Quarter
2019
|
||||||||||||||||
|
Consolidated net income (loss)
|
$
|
10,489
|
$
|
3,275
|
$
|
(12,265
|
)
|
$
|
6,274
|
$
|
13,205
|
|||||||||
|
Add:
|
||||||||||||||||||||
|
Interest expense, net
|
18,480
|
4,994
|
6,109
|
3,641
|
3,736
|
|||||||||||||||
|
Loss on extinguishment of debt
|
1,308
|
-
|
-
|
1,158
|
150
|
|||||||||||||||
|
Income tax expense (benefit)
|
1,216
|
946
|
(4,945
|
)
|
2,236
|
2,979
|
||||||||||||||
|
Depreciation expense
|
2,958
|
851
|
783
|
692
|
632
|
|||||||||||||||
|
Amortization expense
|
1,517
|
425
|
372
|
356
|
364
|
|||||||||||||||
|
EBITDA
|
$
|
35,968
|
$
|
10,491
|
$
|
(9,946
|
)
|
$
|
14,357
|
$
|
21,066
|
|||||||||
|
Components of Adjusted EBITDA
|
||||||||||||||||||||
|
Other
|
352
|
(87
|
)
|
385
|
151
|
(97
|
)
|
|||||||||||||
|
Stock options, restricted stock, and incentives expense
|
4,366
|
455
|
1,399
|
1,314
|
1,198
|
|||||||||||||||
|
Transactional expenses and strategic initiatives
|
1,903
|
1,049
|
197
|
470
|
187
|
|||||||||||||||
|
New product launch costs
|
5,743
|
-
|
2,494
|
1,979
|
1,270
|
|||||||||||||||
|
Corporate and vapor restructuring
|
18,210
|
-
|
17,795
|
265
|
150
|
|||||||||||||||
|
FDA PMTA
|
8,027
|
5,874
|
1,912
|
241
|
-
|
|||||||||||||||
|
Vendor settlement
|
(5,522
|
)
|
-
|
-
|
-
|
(5,522
|
)
|
|||||||||||||
|
Adjusted EBITDA
|
$
|
69,047
|
$
|
17,782
|
$
|
14,236
|
$
|
18,777
|
$
|
18,252
|
||||||||||
|
Net Debt / 12 months ended March 31, 2020, rolling Adjusted EBITDA
|
2.6
|
x
|
||||||||||||||||||
Schedule C
Turning Point Brands
Reconciliation of GAAP diluted EPS to Adjusted diluted EPS
|
(dollars in thousands except share data)
|
Three Months Ended
March 31, |
|||||||
|
|
2020
|
2019
|
||||||
|
GAAP EPS
|
$
|
0.16
|
$
|
0.33
|
||||
|
Other (a)
|
|
(0.00
|
)
|
(0.00
|
)
|
|||
|
Stock options, restricted stock, and incentives expense (b)
|
|
0.02
|
0.03
|
|||||
|
Transactional expenses and strategic initiatives (c)
|
|
0.04
|
0.03
|
|||||
|
New product launch costs (d)
|
|
-
|
0.02
|
|||||
|
Corporate and vapor restructuring (e)
|
|
-
|
0.04
|
|||||
|
FDA PMTA (f)
|
|
0.22
|
-
|
|||||
|
Amortization of debt discount (g)
|
|
0.07
|
-
|
|||||
|
Tax benefit (h)
|
|
(0.00
|
)
|
(0.02
|
)
|
|||
|
Adjusted diluted EPS
|
$
|
0.51
|
$
|
0.43
|
||||
| (a) |
Represents LIFO adjustment, non-cash pension/ postretirement expense (income) and foreign exchange hedging reporting tax effected at the quarterly effective tax rate.
|
| (b) |
Represents non-cash stock options, restricted stock, incentives expense and Solace PRSUs tax effected at the quarterly effective tax rate.
|
| (c) |
Represents the fees incurred for transaction expenses and strategic initiatives tax effected at the quarterly effective tax rate.
|
| (d) |
Represents product launch costs of our new product lines tax effected at the quarterly effective tax rate.
|
| (e) |
Represents costs associated with corporate and vapor restructuring including severance and inventory reserves tax effected at the quarterly effective tax rate .
|
| (f) |
Represents costs associated with applications related to the FDA PMTA tax effected at the quarterly effective tax rate.
|
| (g) |
Represents non-cash amortization of debt discount tax effected at the quarterly effective tax rate.
|
| (h) |
Represents adjustment from quarterly effective tax rate to annual projected effective tax rate of 23%.
|
Schedule D
Turning Point Brands, Inc.
Reconciliation of GAAP Gross Profit to Adjusted Gross Profit and GAAP Operating Income to Adjusted Operating Income
(dollars in thousands)
|
|
Consolidated
|
Smokeless
|
Smoking
|
NewGen
|
||||||||||||||||||||||||||||
|
|
1st Quarter
2020
|
1st Quarter
2019
|
1st Quarter
2020
|
1st Quarter
2019
|
1st Quarter
2020
|
1st Quarter
2019
|
1st Quarter
2020
|
1st Quarter
2019
|
||||||||||||||||||||||||
|
|
||||||||||||||||||||||||||||||||
|
Net sales
|
$
|
90,689
|
$
|
91,628
|
$
|
26,495
|
$
|
22,544
|
$
|
28,914
|
$
|
25,519
|
$
|
35,280
|
$
|
43,565
|
||||||||||||||||
|
|
||||||||||||||||||||||||||||||||
|
Gross profit
|
$
|
41,431
|
$
|
40,464
|
$
|
13,874
|
$
|
12,073
|
$
|
16,132
|
$
|
13,484
|
$
|
11,425
|
$
|
14,907
|
||||||||||||||||
|
Adjustments:
|
||||||||||||||||||||||||||||||||
|
LIFO adjustment
|
-
|
(24
|
)
|
-
|
(24
|
)
|
-
|
-
|
-
|
-
|
||||||||||||||||||||||
|
|
||||||||||||||||||||||||||||||||
|
Adjusted gross profit
|
$
|
41,431
|
$
|
40,440
|
$
|
13,874
|
$
|
12,049
|
$
|
16,132
|
$
|
13,484
|
$
|
11,425
|
$
|
14,907
|
||||||||||||||||
|
|
||||||||||||||||||||||||||||||||
|
Operating income
|
$
|
9,037
|
$
|
12,035
|
$
|
9,746
|
$
|
7,487
|
$
|
12,417
|
$
|
9,946
|
$
|
477
|
$
|
2,838
|
||||||||||||||||
|
Adjustments:
|
||||||||||||||||||||||||||||||||
|
LIFO adjustment
|
-
|
(24
|
)
|
-
|
(24
|
)
|
-
|
-
|
-
|
-
|
||||||||||||||||||||||
|
Foreign exchange hedging
|
-
|
(71
|
)
|
-
|
-
|
-
|
(71
|
)
|
-
|
-
|
||||||||||||||||||||||
|
Transactional expenses and strategic initiatives
|
1,049
|
910
|
-
|
-
|
-
|
-
|
-
|
-
|
||||||||||||||||||||||||
|
New product launch costs
|
-
|
442
|
-
|
-
|
-
|
-
|
-
|
442
|
||||||||||||||||||||||||
|
Corporate and vapor restructuring
|
-
|
1,004
|
-
|
-
|
-
|
-
|
-
|
508
|
||||||||||||||||||||||||
|
FDA PMTA
|
5,874
|
-
|
-
|
-
|
-
|
-
|
-
|
-
|
||||||||||||||||||||||||
|
Adjusted operating income
|
$
|
15,960
|
$
|
14,296
|
$
|
9,746
|
$
|
7,463
|
$
|
12,417
|
$
|
9,875
|
$
|
477
|
$
|
3,788
|
||||||||||||||||