Exhibit 99.1
Turning Point Brands Announces Third Quarter 2020 Results, Increases 2020 Guidance
LOUISVILLE, KY. (October 27, 2020) - Turning Point Brands, Inc. (“TPB”) (NYSE: TPB), a manufacturer, marketer and distributor of branded consumer products with active ingredients, today announced financial results for
the third quarter ended September 30, 2020.
Results at a Glance
Third Quarter 2020
(Comparisons vs. same period year-ago)
| ✓ |
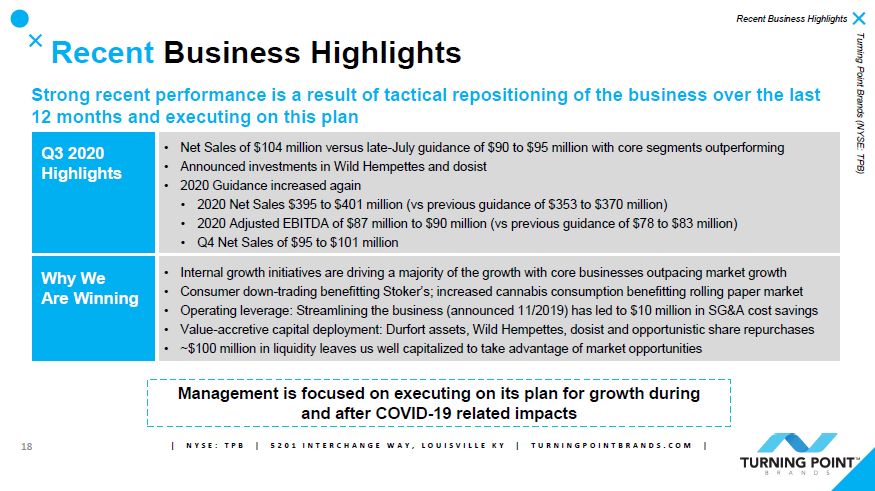
Net sales increased 7.6% to $104.2 million;
|
| ✓ |
Gross profit increased 12.8% to $48.3 million;
|
| ✓ |
Net income increased $1.5 million to $7.8 million despite PMTA costs incurred during the current quarter;
|
| ✓ |
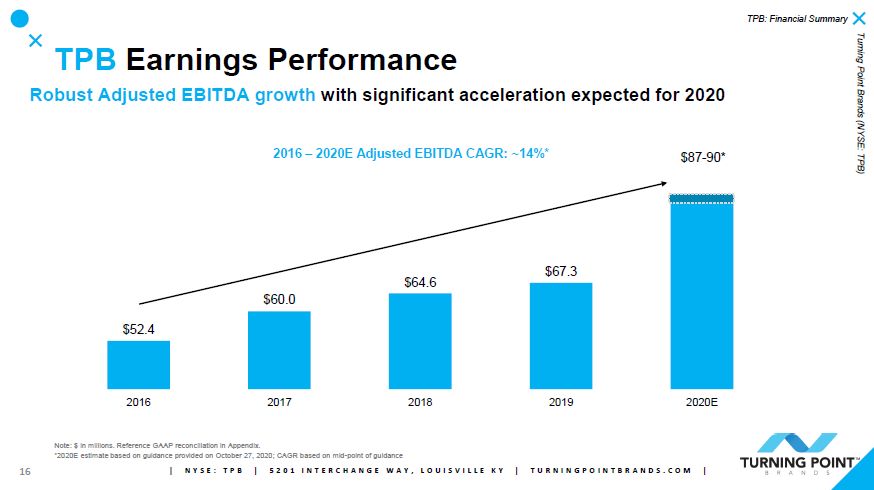
Adjusted EBITDA increased 27.4% to $23.9 million (see Schedule A for a reconciliation to net income);
|
| ✓ |
Diluted EPS of $0.40 and Adjusted Diluted EPS of $0.75 as compared to $0.31 and $0.61 in the year-ago period, respectively (see Schedule B for a reconciliation to Diluted EPS);
|
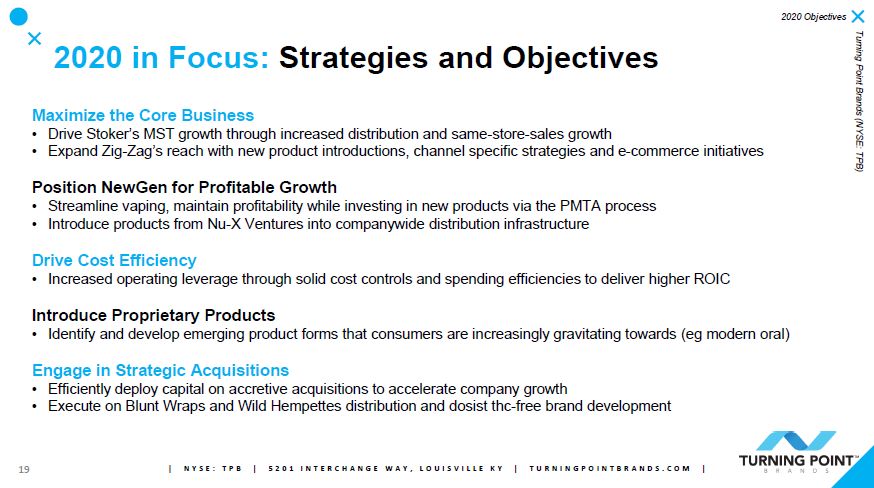
“Streamlining and repositioning the business at the end of 2019 has paid dividends throughout 2020. Smokeless saw continued same store sales momentum in MST and newfound
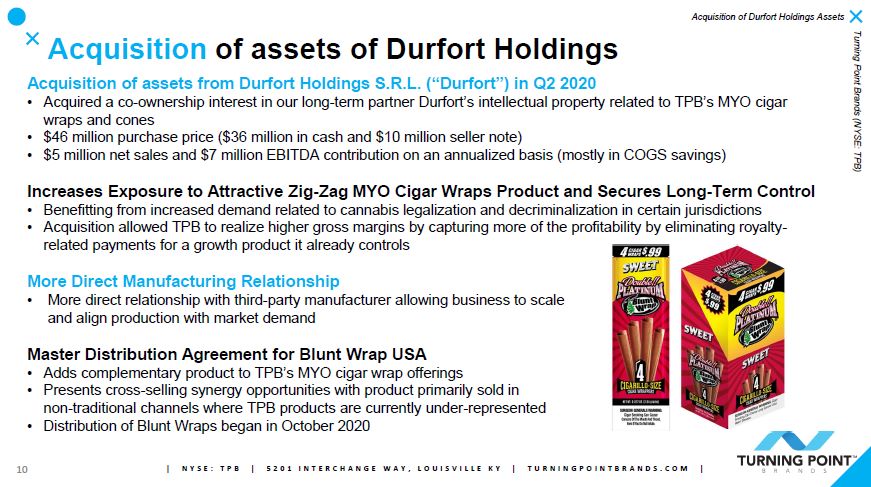
strength in loose leaf chewing tobacco. Smoking (Zig-Zag) saw its highest growth rate in recent history driven by product and channel growth initiatives behind rolling papers, the benefits of greater control of our MYO cigar wraps business after the
Durfort transaction closed in the second quarter, and a burgeoning e-commerce presence. The NewGen segment navigated admirably through significant market disruption caused by the PMTA application deadline,” said Larry Wexler, President and CEO.
“Overall, we are seeing ongoing benefits from re-shaping our business towards a more growth-oriented mindset and are able to raise our outlook once again for the remainder of the fiscal year.”
Recent Events
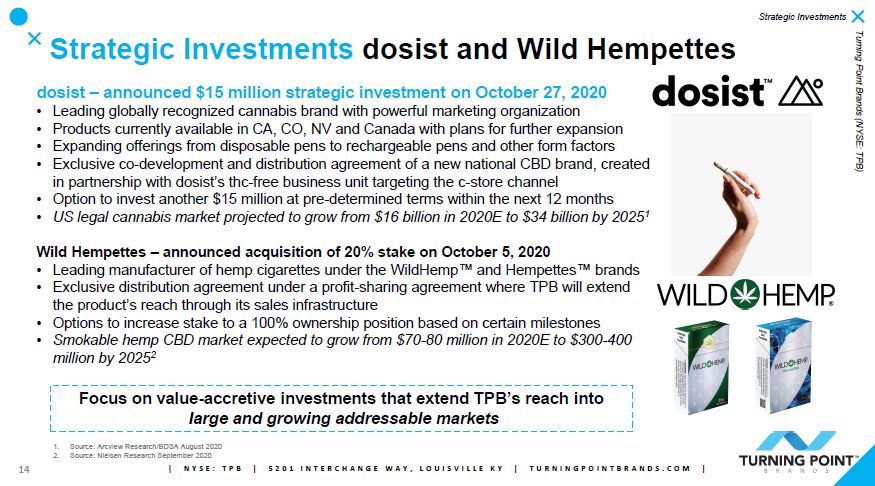
As detailed in a separate press release, TPB today announced a $15 million strategic investment in leading global cannabinoid company dosist™ and an exclusive co-development and distribution
agreement of a new national CBD brand, created in partnership with dosist’s thc-free business unit. Additionally, TPB has an option to invest another $15 million at pre-determined terms within the next 12 months. TPB has been issued a warrant to
receive preferred shares of dosist that will automatically be exercised upon a change in federal laws in the United States to reschedule or deschedule cannabis and/or permit its general cultivation, distribution and possession. As part of this
agreement, TPB will also have an option to fill a seat on the board of directors of dosist upon legalization.
On October 5, 2020, TPB announced the acquisition of a 20% stake in Wild Hempettes LLC (“Wild Hempettes”), a leading manufacturer of hemp cigarettes under the WildHemp™ and Hempettes™ brands, with
options to increase its stake to a 100% ownership position based on certain milestones. As part of the transaction, TPB will be the exclusive distributor of Hempettes™ to U.S. bricks and mortar retailers.
On October 1, 2020, TPB sold the assets of its remaining owned retail stores in Oklahoma. As consideration for the transaction, TPB will receive a royalty from the acquiror, while also receiving
rights to market and test products in the stores on a quarterly basis. Year-to-date sales and gross profit for those stores was $2.9 million and $1.6 million, respectively. This transaction continues our efforts to streamline the NewGen segment, as
part of our announcement in the fourth quarter 2019 for the exploration of strategic alternatives for the third-party vaping distribution business.
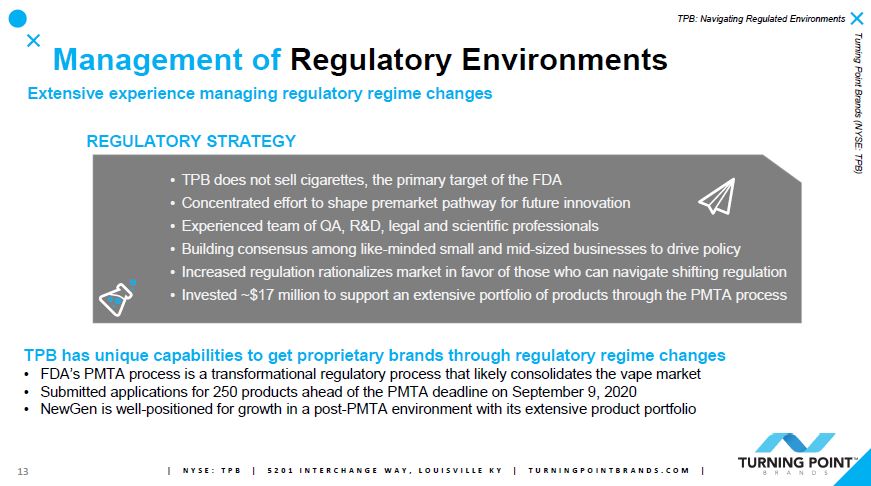
On September 8, 2020, TPB announced it had submitted to the U.S. Food and Drug Administration (“FDA”) Premarket Tobacco Applications (“PMTAs”) covering 250 products, an important and necessary step
for TPB to offer adult consumers an extensive portfolio of products that serve as alternatives to combustible cigarettes and satisfy a wide variety of consumer preferences. The PMTAs covered a broad assortment of products in the vapor category
including multiple proprietary e-liquid offerings in varying nicotine strengths, technologies and sizes; proprietary replacement parts and components of open system tank devices through partnerships with two leading manufacturers for exclusive
distribution of products in the United States; and a closed system e-cigarette. The PMTAs provided clarity to customers and retail partners of TPB’s continued support behind products across multiple leading brands including Solace™, VaporFi®, South
Beach Smoke™, HorizonTech®, FreeMaX® and other developing brands and partnerships.
Smokeless Products Segment (29% of total net sales in the
quarter)
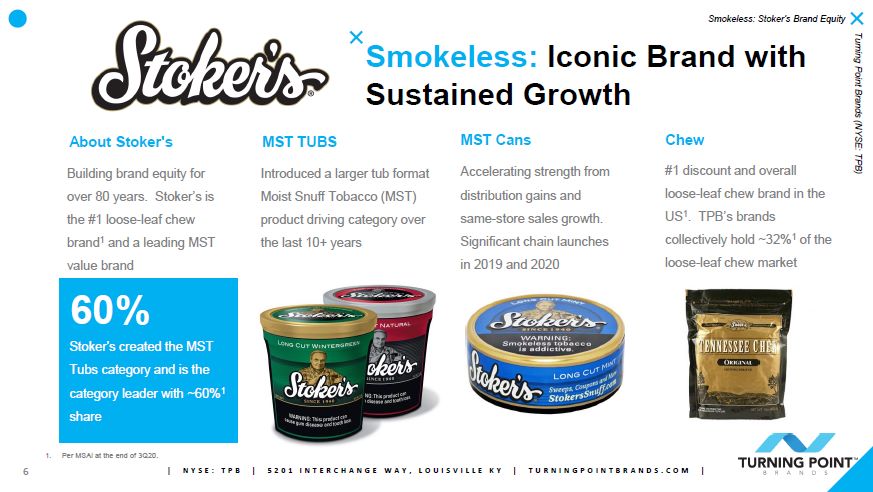
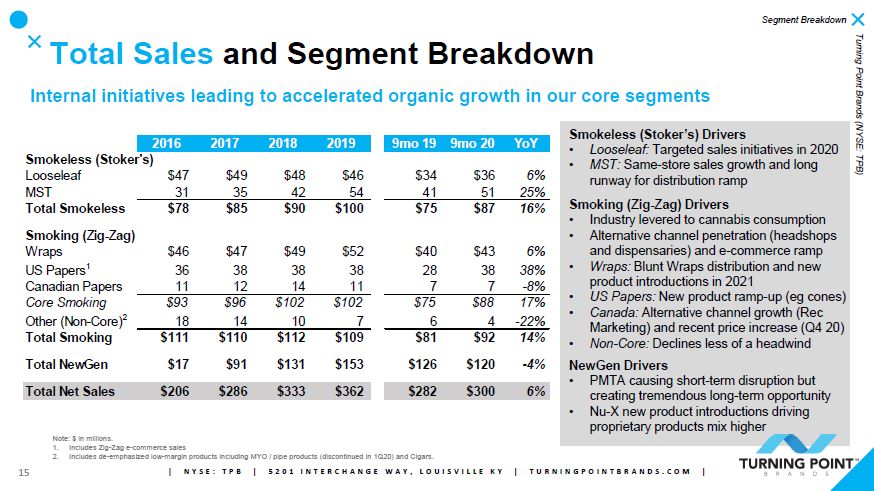
For the third quarter, Smokeless products net sales increased 13.7% to $29.8 million on double-digit growth of MST and loose leaf chewing tobacco. MST represented 59% of Smokeless revenues in the
quarter, up from 58% a year earlier. In the quarter, total Smokeless segment volume increased 10.3% and price/mix advanced 3.4%.
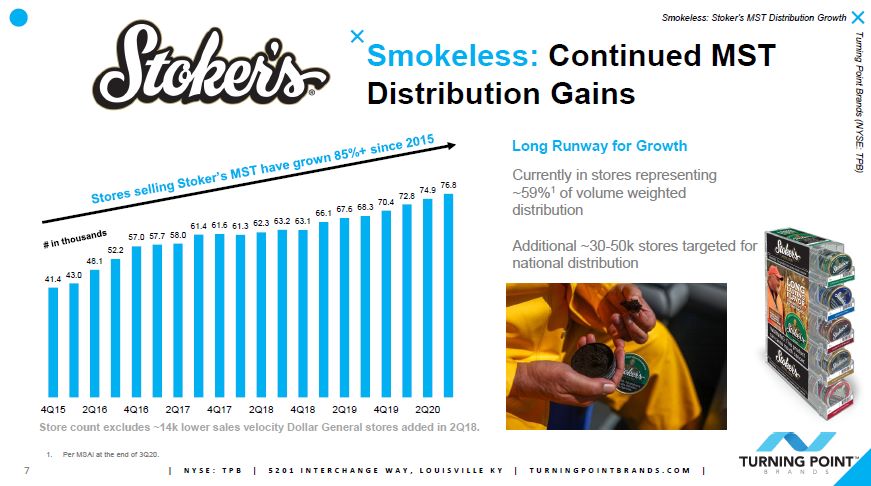
“MST continued to gain market momentum driven by strong same store sales growth despite a tough comparable. The outlook continues to be bright for this product line with increasing consumer acceptance and further
distribution gains,” said Graham Purdy, Chief Operating Officer. “Our loose leaf chewing tobacco business saw accelerated growth during the quarter as targeted selling initiatives that began earlier in the year led to meaningful year-over-year market
share growth according to MSAi.”
For the quarter, Smokeless segment gross profit increased 18.1% to $16.0 million. Segment gross margin expanded 200 basis points to 53.9% primarily as a result of strong incremental margin contribution of MST.
Smoking Products Segment (34% of total net sales in the
quarter)
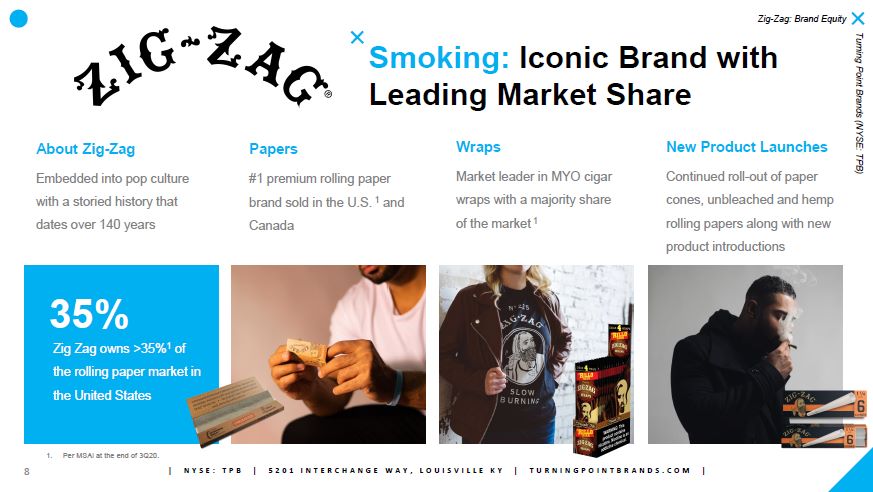
For the third quarter, net sales of Smoking products increased 19.0% to $36.0 million. Growth was driven by double-digit advances in US rolling papers and MYO cigar wraps. This more than offset a
$2.0 million decline in our Canadian papers business which compared against an inventory load-in during last year’s third quarter. Non-focus cigars and MYO pipe declined $0.3 million. In the quarter, total Smoking segment volume increased 18.0% while
price/mix increased 1.0%.
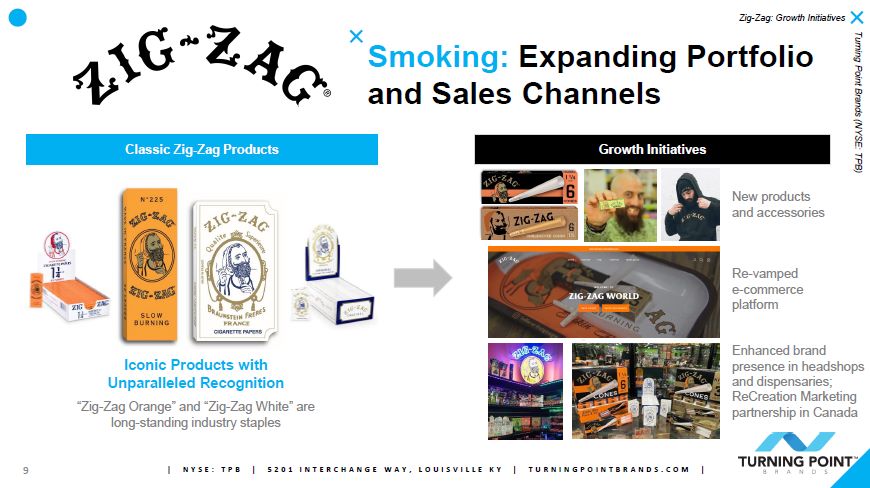
“This segment of the business is benefitting from new product introductions and channel-specific sales efforts that are expanding market share and better aligning our growth to cannabis consumption
trends. While increased consumption related to COVID-19 benefitted our US rolling papers business, we were encouraged to see our volumes grow significantly above the industry growth rate during the quarter. Our emerging e-commerce business demonstrated
strong progress with sales roughly doubling from the previous quarter,” said Purdy. “In addition, post-the Durfort transaction, we now have a stronger and more direct working relationship with our MYO cigar wrap manufacturer which is enabling us to
ramp production better to align with consumer demand.”
For the quarter, Smoking products gross profit increased 27.9% to $21.3 million. Segment gross margin expanded 410 basis points to 59.1% as a result of increased US rolling paper sales and increased margin in MYO cigar
sales as a result of the Durfort transaction.
NewGen (New Generation) Products Segment (37% of total net sales in the quarter)
For the third quarter, NewGen segment net sales decreased 4.8% to $38.4 million. Flat performance in our vape distribution business and double-digit
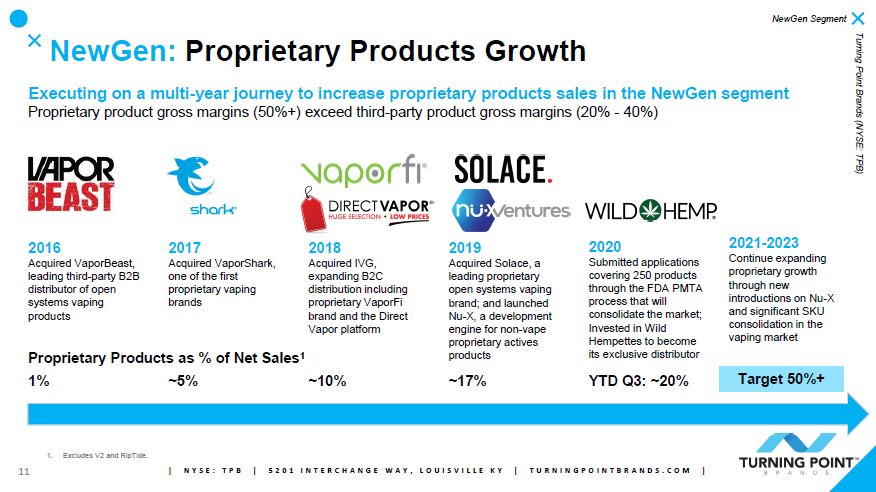
growth from Solace and other Nu-X products was offset by a decline in RipTide which compared against a trade load-in during its launch in the prior year period.
“Our NewGen business performed in-line with our expectations as the business managed through a challenging competitive environment created by the PMTA deadline with competitors liquidating
inventories in anticipation of exiting the market. The recent sale of the remaining Vapor Shark stores continues the streamlining of the segment,” said Purdy. “While we still expect short-term disruption related to the PMTA process to impact our fourth
quarter, the extensive portfolio of products submitted through the PMTA process has us increasingly optimistic about our outlook going forward as the market consolidates.”
For the quarter, NewGen gross profit decreased 12.8% to $11.0 million. Segment gross margin decreased 260 basis points to 28.6% primarily due to temporary pricing pressure as competitors liquidated inventories and
inventory reserves. Third quarter 2020 included $2.3 million of tariff expense compared to $2.6 million a year-ago.
Other Events and Performance Measures in the Third Quarter
Third quarter consolidated selling, general and administrative (“SG&A”) expenses were $32.3 million compared to $29.8 million in 2019 with the increase primarily due to non-recurring PMTA-related
expenses incurred during the quarter as detailed below.
The third quarter had notable non-recurring impacts:
| • |
$5.3 million of FDA PMTA-related expenses as compared to $0.2 million in the year-ago period; and
|
| • |
$0.6 million of transaction expenses principally related to M&A activity as compared to $0.5 million in the year-ago period.
|
The third quarter also included a $1.2 million non-cash charge within net periodic costs related to the termination of our defined benefit pension plan in 2019. We received net $1.7 million of cash
related to the termination of the plan.
Total gross debt as of September 30, 2020, was $328.0 million. The corresponding net debt (total gross debt less cash) at September 30, 2020 was $260.6 million. The company ended the quarter with total
liquidity of $113.8 million comprising $67.4 million of cash and $46.4 million of revolving credit facility capacity.
During the quarter, the company repurchased 82,097 shares at an average price of $28.95.
2020 Outlook Update
Taking into account the strength we have seen thus far this year and expected near-term volatility within our NewGen segment, we revise our guidance provided on July 28, 2020 as follows:
Absent any further acquisitions, the company projects 2020 net sales to be $395 to $401 million (up from previous guidance of $370 to $382 million). We project 2020 Adjusted EBITDA of $87 million to $90 million (up from
previous guidance of $78 to $83 million).
Stock compensation and non-cash incentive expense in 2020 is projected to be $2.8 million.
The company spent a total of $16.6 million on the PMTA process, in-line with previous guidance of $16 to $18 million. This is inclusive of $2.2 million spent in 2019 and $14.4 million in the first three quarters of 2020.
Cash interest expense is projected to be $12 million and GAAP interest expense includes $7 million of debt discount amortization equal to the fair value of the equity components over the expected life of the 2024
convertible notes.
The company expects the 2020 effective income tax rate to be 23% to 24%.
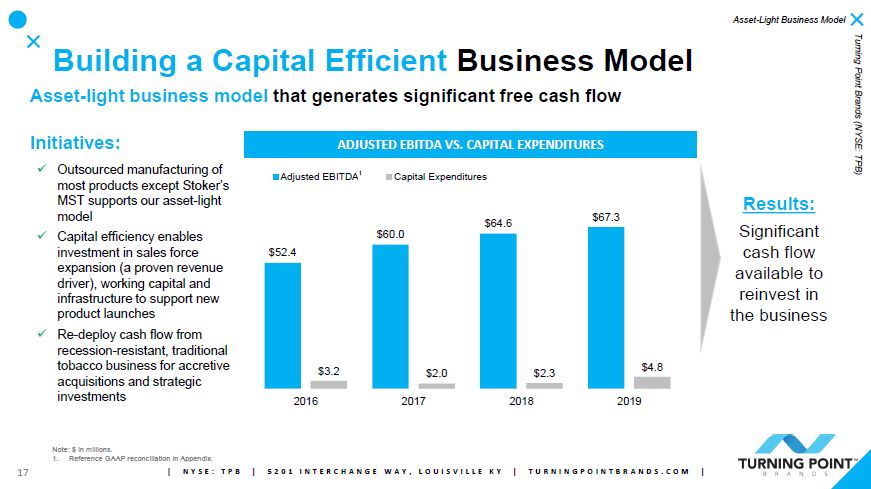
Capital expenditures for 2020 are anticipated to be approximately $6 million (up from previous guidance of $4 to $6 million) as we have accelerated certain capital expenditure projects due to temporary tax code
incentives.
Net Sales for the fourth quarter of 2020 are expected to be $95 to $101 million.
Earnings Conference Call
As previously disclosed, a conference call with the investment community to review TPB’s financial results has been scheduled for 10 a.m. Tuesday, October 27, 2020. Investment community participants
should dial in ten minutes ahead of time using the toll-free number 844-889-4324 (International participants should call 412-317-9262). A live listen-only webcast of the call is available from the Events and Presentations section of the investor
relations portion of the company website (www.turningpointbrands.com). A replay of the webcast will be available on the site three hours following the call.
Non-GAAP Financial Measures
In addition to financial measures prepared in accordance with generally accepted accounting principles in the United States (GAAP), this press release includes certain non-GAAP financial measures
including Adjusted EBITDA, Adjusted diluted EPS and Adjusted Operating Income. A reconciliation of these non-GAAP financial measures accompanies this release.
About Turning Point Brands, Inc.
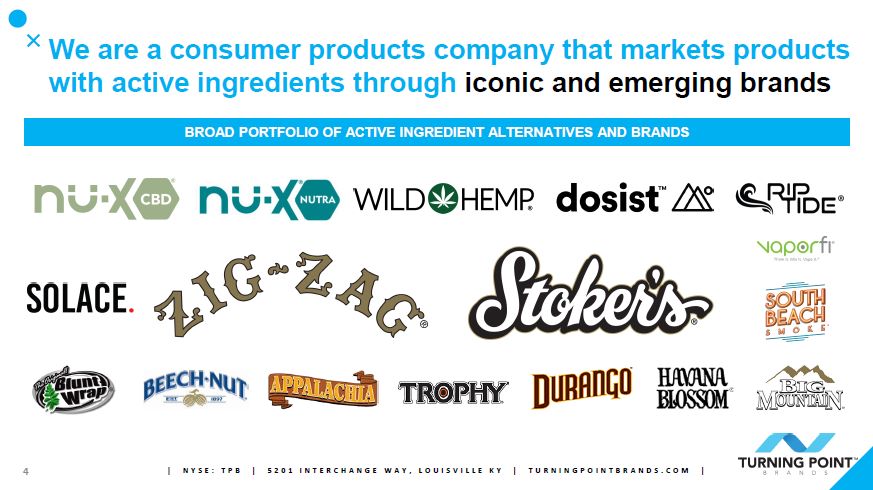
Turning Point Brands (NYSE: TPB) is a manufacturer, marketer and distributor of branded consumer products with active ingredients through its iconic core brands Zig-Zag® and Stoker’s®, and its
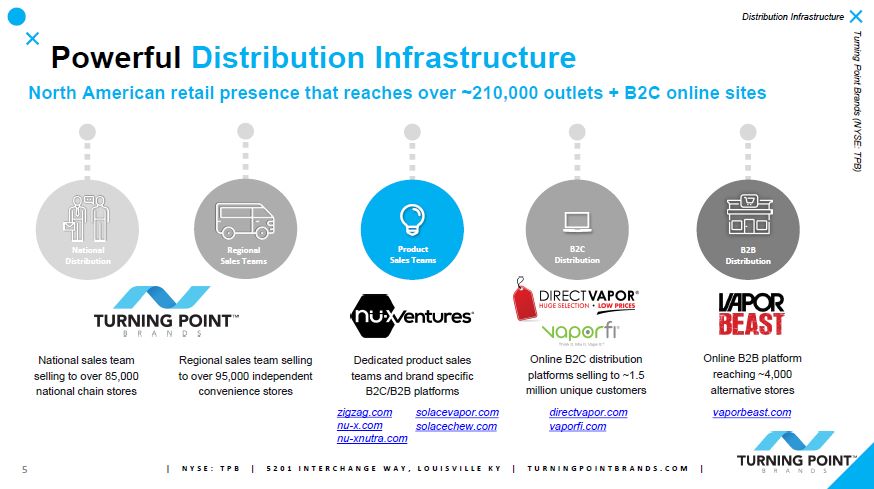
emerging brands within the NewGen segment. TPB’s products are available in more than 210,000 retail outlets in North America in addition to sites such as www.zigzag.com, www.nu-x.com and www.solacevapor.com. For the latest news
and information about TPB and its brands, please visit www.turningpointbrands.com.
Forward-Looking Statements
This press release contains forward-looking statements within the meaning of the federal securities laws. Forward-looking statements may generally be identified by the use of words such as "anticipate," "believe,"
"expect," "intend," "plan" and "will" or, in each case, their negative, or other variations or comparable terminology. These forward-looking statements include all matters that are not historical facts. By their nature, forward-looking statements
involve risks and uncertainties because they relate to events and depend on circumstances that may or may not occur in the future. As a result, actual events may differ materially from those expressed in or suggested by the forward-looking statements.
Any forward-looking statement made by TPB in this press release speaks only as of the date hereof. New risks and uncertainties come up from time to time, and it is impossible for TPB to predict these events or how they may affect it. TPB has no
obligation, and does not intend, to update any forward-looking statements after the date hereof, except as required by federal securities laws. Factors that could cause these differences include, but are not limited to:
| • |
declining sales of tobacco products, and expected continuing decline of sales, in the tobacco industry overall;
|
| • |
our dependence on a small number of third-party suppliers and producers;
|
| • |
the possibility that we will be unable to identify or contract with new suppliers or producers in the event of a supply or product disruption;
|
| • |
the possibility that our licenses to use certain brands or trademarks will be terminated, challenged or restricted;
|
| • |
failure to maintain consumer brand recognition and loyalty of our customers;
|
| • |
our reliance on relationships with several large retailers and national chains for distribution of our products;
|
| • |
uncertainty and continued evolution of markets containing our NewGen products;
|
| • |
intense competition and our ability to compete effectively;
|
| • |
competition from illicit sources;
|
| • |
regulation of our products by the FDA, which has broad regulatory powers;
|
| • |
our products are subject to developing and unpredictable regulation, for example, current court action moving forward certain substantial Pre Market Tobacco Application obligations;
|
| • |
uncertainty related to the regulation and taxation of our NewGen products;
|
| • |
possible significant increases in federal, state and local municipal tobacco- and vapor-related taxes;
|
| • |
sensitivity of end-customers to increased sales taxes and economic conditions;
|
| • |
substantial and increasing U.S. regulation;
|
| • |
possible increasing international control and regulation;
|
| • |
failure to comply with certain regulations;
|
| • |
imposition of significant tariffs on imports into the U.S.;
|
| • |
the scientific community’s lack of information regarding the long-term health effects of certain substances contained in some of our products;
|
| • |
some of our products contain nicotine which is considered to be a highly addictive substance;
|
| • |
contamination of our tobacco supply or products;
|
| • |
requirement to maintain compliance with master settlement agreement escrow account;
|
| • |
our amount of indebtedness;
|
| • |
the terms of our credit facilities, which may restrict our current and future operations;
|
| • |
significant product liability litigation;
|
| • |
reduced disclosure requirements applicable to emerging growth companies may make our common stock less attractive to investors, potentially decreasing our stock price;
|
| • |
failure to maintain our status as an emerging growth company before the five-year maximum time period a company may retain such status;
|
| • |
our principal stockholders will be able to exert significant influence over matters submitted to our stockholders and may take certain actions to prevent takeovers;
|
| • |
our certificate of incorporation and bylaws, as well as Delaware law and certain regulations, could discourage or prohibit acquisition bids or merger proposals, which may adversely affect the market price of our
common stock;
|
| • |
our certificate of incorporation limits the ownership of our common stock by individuals and entities that are Restricted Investors. These restrictions may affect the liquidity of our common stock and may result
in Restricted Investors being required to sell or redeem their shares at a loss or relinquish their voting, dividend and distribution rights;
|
| • |
our business may be damaged by events outside of our suppliers’ control, such as the impact of epidemics (e.g., coronavirus), political upheavals, or natural disasters;
|
| • |
our reliance on information technology;
|
| • |
security and privacy breaches;
|
| • |
infringement on our intellectual property;
|
| • |
third-party claims that we infringe on their intellectual property;
|
| • |
failure to manage our growth;
|
| • |
failure to successfully integrate our acquisitions or otherwise be unable to benefit from pursuing acquisitions;
|
| • |
fluctuations in our results;
|
| • |
exchange rate fluctuations;
|
| • |
adverse U.S. and global economic conditions;
|
| • |
departure of key management personnel or our inability to attract and retain talent;
|
| • |
future sales of our common stock in the public market could reduce our stock price, and any additional capital raised by us through the sale of equity or convertible securities may dilute your ownership in us;
and
|
| • |
we may issue preferred stock whose terms could adversely affect the voting power or value of our common stock.
|
Contact:
Robert Lavan, Senior Vice President, CFO
[email protected] (502) 774-9238
Financial Statements Follow:
Turning Point Brands, Inc.
Consolidated Statement of Income
(dollars in thousands except share data)
|
Three Months Ended September 30,
|
||||||||
|
2020
|
2019
|
|||||||
|
Net sales
|
$
|
104,174
|
$
|
96,800
|
||||
|
Cost of sales
|
55,867
|
53,984
|
||||||
|
Gross profit
|
48,307
|
42,816
|
||||||
|
Selling, general, and administrative expenses
|
32,286
|
29,784
|
||||||
|
Operating income
|
16,021
|
13,032
|
||||||
|
Interest expense, net
|
5,224
|
3,641
|
||||||
|
Investment income
|
(3
|
)
|
(265
|
)
|
||||
|
Loss on extinguishment of debt
|
-
|
1,158
|
||||||
|
Net periodic cost (income), excluding service cost
|
1,188
|
(12
|
)
|
|||||
|
Income before income taxes
|
9,612
|
8,510
|
||||||
|
Income tax expense
|
1,816
|
2,236
|
||||||
|
Consolidated net income
|
7,796
|
6,274
|
||||||
|
Basic income per common share:
|
||||||||
|
Consolidated net income
|
$
|
0.41
|
$
|
0.32
|
||||
|
Diluted income per common share:
|
||||||||
|
Consolidated net income
|
$
|
0.40
|
$
|
0.31
|
||||
|
Weighted average common shares outstanding:
|
||||||||
|
Basic
|
19,240,187
|
19,659,217
|
||||||
|
Diluted
|
19,636,989
|
20,067,413
|
||||||
|
Supplemental disclosures of statement of income information:
|
||||||||
|
Excise tax expense
|
$
|
5,810
|
$
|
5,503
|
||||
|
FDA fees
|
$
|
135
|
$
|
158
|
||||
Turning Point Brands, Inc.
Consolidated Balance Sheet
(dollars in thousands except share data)
|
(unaudited)
|
||||||||
|
ASSETS
|
September 30,
2020 |
December 31,
2019 |
||||||
|
Current assets:
|
||||||||
|
Cash
|
$
|
67,403
|
$
|
95,250
|
||||
|
Accounts receivable, net of allowances of $156 in 2020 and $280 in 2019
|
8,783
|
6,906
|
||||||
|
Inventories
|
73,343
|
70,979
|
||||||
|
Other current assets
|
20,943
|
16,115
|
||||||
|
Total current assets
|
170,472
|
189,250
|
||||||
|
Property, plant, and equipment, net
|
14,003
|
13,816
|
||||||
|
Right of use assets
|
19,064
|
12,130
|
||||||
|
Deferred financing costs, net
|
715
|
890
|
||||||
|
Goodwill
|
154,282
|
154,282
|
||||||
|
Other intangible assets, net
|
79,900
|
33,469
|
||||||
|
Master Settlement Agreement (MSA) escrow deposits
|
32,074
|
32,074
|
||||||
|
Other assets
|
8,721
|
10,673
|
||||||
|
Total assets
|
$
|
479,231
|
$
|
446,584
|
||||
|
LIABILITIES AND STOCKHOLDERS' EQUITY
|
||||||||
|
Current liabilities:
|
||||||||
|
Accounts payable
|
$
|
10,958
|
$
|
14,126
|
||||
|
Accrued liabilities
|
32,009
|
26,520
|
||||||
|
Current portion of long-term debt
|
12,000
|
15,240
|
||||||
|
Total current liabilities
|
54,967
|
55,886
|
||||||
|
Notes payable and long-term debt
|
283,792
|
268,951
|
||||||
|
Deferred income taxes
|
1,875
|
1,572
|
||||||
|
Lease liabilities
|
17,073
|
11,067
|
||||||
|
Other long-term liabilities
|
4,190
|
2,523
|
||||||
|
Total liabilities
|
361,897
|
339,999
|
||||||
|
Commitments and contingencies
|
||||||||
|
Stockholders' equity:
|
||||||||
|
Preferred stock; $0.01 par value; authorized shares 40,000,000; issued and outstanding shares -0-
|
-
|
-
|
||||||
|
Common stock, voting, $0.01 par value; authorized shares, 190,000,000; 19,483,861 issued shares, 19,144,901 outstanding shares at September 30, 2020, and 19,680,673 issued and outstanding
shares at December 31, 2019
|
195
|
197
|
||||||
|
Common stock, nonvoting, $0.01 par value; authorized shares, 10,000,000; issued and outstanding shares -0-
|
-
|
-
|
||||||
|
Additional paid-in capital
|
127,758
|
125,469
|
||||||
|
Cost of repurchased common stock
|
||||||||
|
(338,960 shares at September 30, 2020 and 0 shares at December 31, 2019)
|
(7,665
|
)
|
-
|
|||||
|
Accumulated other comprehensive loss
|
(3,245
|
)
|
(3,773
|
)
|
||||
|
Accumulated earnings (deficit)
|
291
|
(15,308
|
)
|
|||||
|
Total stockholders' equity
|
117,334
|
106,585
|
||||||
|
Total liabilities and stockholders' equity
|
$
|
479,231
|
$
|
446,584
|
||||
Turning Point Brands, Inc.
Consolidated Statement of Cash Flows
(dollars in thousands)
|
Nine Months Ended September 30,
|
||||||||
|
2020
|
2019
|
|||||||
|
Cash flows from operating activities:
|
||||||||
|
Consolidated net income
|
$
|
20,298
|
$
|
26,039
|
||||
|
Adjustments to reconcile net income to net cash provided by operating activities:
|
||||||||
|
Loss on extinguishment of debt
|
-
|
1,308
|
||||||
|
Pension settlement and curtailment loss
|
1,188
|
-
|
||||||
|
Impairment loss
|
149
|
-
|
||||||
|
Loss (gain) on sale of property, plant, and equipment
|
36
|
(12
|
)
|
|||||
|
Depreciation expense
|
2,482
|
1,855
|
||||||
|
Amortization of other intangible assets
|
1,304
|
1,079
|
||||||
|
Amortization of debt discount and deferred financing costs
|
6,725
|
1,018
|
||||||
|
Deferred income taxes
|
876
|
(4
|
)
|
|||||
|
Stock compensation expense
|
1,986
|
2,480
|
||||||
|
Noncash lease expense
|
179
|
-
|
||||||
|
Changes in operating assets and liabilities:
|
||||||||
|
Accounts receivable
|
(1,877
|
)
|
(3,556
|
)
|
||||
|
Inventories
|
(2,364
|
)
|
(6,704
|
)
|
||||
|
Other current assets
|
(829
|
)
|
(801
|
)
|
||||
|
Other assets
|
1,941
|
106
|
||||||
|
Accounts payable
|
(3,200
|
)
|
1,069
|
|||||
|
Accrued postretirement liabilities
|
(54
|
)
|
(125
|
)
|
||||
|
Accrued liabilities and other
|
4,359
|
(3,739
|
)
|
|||||
|
Net cash provided by operating activities
|
$
|
33,199
|
$
|
20,013
|
||||
|
Cash flows from investing activities:
|
||||||||
|
Capital expenditures
|
$
|
(3,420
|
)
|
$
|
(4,060
|
)
|
||
|
Acquisitions, net of cash acquired
|
(37,735
|
)
|
(7,703
|
)
|
||||
|
Restricted cash, MSA escrow deposits
|
-
|
29,713
|
||||||
|
Proceeds on the sale of property, plant and equipment
|
3
|
117
|
||||||
|
Payments for investments
|
-
|
(1,421
|
)
|
|||||
|
Net cash (used in) provided by investing activities
|
$
|
(41,152
|
)
|
$
|
16,646
|
|||
|
Cash flows from financing activities:
|
||||||||
|
Payments of 2018 first lien term loan
|
$
|
(8,000
|
)
|
$
|
(6,000
|
)
|
||
|
Payments of 2018 second lien term loan
|
-
|
(40,000
|
)
|
|||||
|
Payments of 2018 revolving credit facility
|
-
|
(26,000
|
)
|
|||||
|
Proceeds from Convertible Senior Notes
|
-
|
172,500
|
||||||
|
Payment of IVG note
|
(4,240
|
)
|
-
|
|||||
|
Proceeds from unsecured loan
|
7,485
|
-
|
||||||
|
Standard Diversified Inc. reorganization, net of cash acquired
|
(1,737
|
)
|
-
|
|||||
|
Payment of call options
|
-
|
(20,528
|
)
|
|||||
|
Payment of dividends
|
(2,846
|
)
|
(2,646
|
)
|
||||
|
Payments of financing costs
|
(194
|
)
|
(6,997
|
)
|
||||
|
Exercise of options
|
303
|
639
|
||||||
|
Surrender of restricted stock
|
-
|
(84
|
)
|
|||||
|
Redemption of options
|
-
|
(12
|
)
|
|||||
|
Common stock repurchased
|
(7,665
|
)
|
-
|
|||||
|
Net cash (used in) provided by financing activities
|
$
|
(16,894
|
)
|
$
|
70,872
|
|||
|
Net (decrease) increase in cash
|
$
|
(24,847
|
)
|
$
|
107,531
|
|||
|
Cash, beginning of period:
|
||||||||
|
Unrestricted
|
95,250
|
3,306
|
||||||
|
Restricted
|
32,074
|
2,361
|
||||||
|
Total cash at beginning of period
|
127,324
|
5,667
|
||||||
|
Cash, end of period:
|
||||||||
|
Unrestricted
|
67,403
|
81,124
|
||||||
|
Restricted
|
35,074
|
32,074
|
||||||
|
Total cash at end of period
|
$
|
102,477
|
$
|
113,198
|
||||
Non-GAAP Financial Measures
To supplement our financial information presented in accordance with generally accepted accounting principles in the United States, or U.S. GAAP, we use non-U.S. GAAP financial measures, including EBITDA, Adjusted
EBITDA, Adjusted diluted EPS, and Adjusted Operating Income. We believe Adjusted EBITDA provides useful information to management and investors regarding certain financial and business trends relating to our financial condition and results of
operations. Adjusted EBITDA, Adjusted diluted EPS, and Adjusted Operating Income are used by management to compare our performance to that of prior periods for trend analyses and planning purposes and are presented to our board of directors. We believe
that EBITDA, Adjusted EBITDA, Adjusted diluted EPS and Adjusted Operating Income are appropriate measures of operating performance because they eliminate the impact of expenses that do not relate to business performance.
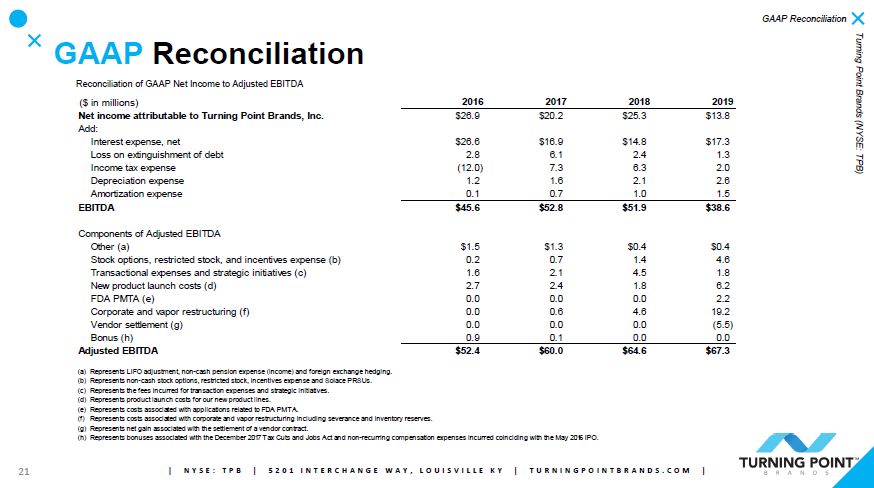
We define “EBITDA” as net income before interest expense, loss on extinguishment of debt, provision for income taxes, depreciation and amortization. We define “Adjusted EBITDA” as net income before interest expense, loss
on extinguishment of debt, provision for income taxes, depreciation, amortization, other non-cash items and other items that we do not consider ordinary course in our evaluation of ongoing operating performance. We define “Adjusted diluted EPS” as
diluted earnings per share excluding items that we do not consider ordinary course in our evaluation of ongoing operating performance. We define “Adjusted Operating Income” as operating income excluding depreciation, amortization, LIFO, other non-cash
items and other items that we do not consider ordinary course in our evaluation of ongoing operating performance.
Non-U.S. GAAP measures should not be considered a substitute for, or superior to, financial measures calculated in accordance with U.S. GAAP. EBITDA, Adjusted EBITDA Adjusted diluted EPS and Adjusted Operating Income
exclude significant expenses that are required by U.S. GAAP to be recorded in our financial statements and is subject to inherent limitations. In addition, other companies in our industry may calculate this non-U.S. GAAP measure differently than we do
or may not calculate it at all, limiting its usefulness as a comparative measure.
In accordance with SEC rules, we have provided, in the supplemental information attached, a reconciliation of the non-GAAP measures to the next directly comparable GAAP measures.
Schedule A
Turning Point Brands, Inc.
Reconciliation of GAAP Net Income to Adjusted EBITDA
(dollars in thousands)
|
Three Months Ended
September 30,
|
||||||||
|
2020
|
2019
|
|||||||
|
Consolidated net income
|
$
|
7,796
|
$
|
6,274
|
||||
|
Add:
|
||||||||
|
Interest expense, net
|
5,224
|
3,641
|
||||||
|
Loss on extinguishment of debt
|
-
|
1,158
|
||||||
|
Income tax expense
|
1,816
|
2,236
|
||||||
|
Depreciation expense
|
809
|
692
|
||||||
|
Amortization expense
|
477
|
356
|
||||||
|
EBITDA
|
$
|
16,122
|
$
|
14,357
|
||||
|
Components of Adjusted EBITDA
|
||||||||
|
Other (a)
|
1,188
|
151
|
||||||
|
Stock options, restricted stock, and incentives expense (b)
|
772
|
1,314
|
||||||
|
Transaction expenses (c)
|
570
|
470
|
||||||
|
New product launch costs (d)
|
-
|
1,979
|
||||||
|
FDA PMTA (e)
|
5,271
|
241
|
||||||
|
Corporate and vapor restructuring (f)
|
-
|
265
|
||||||
|
Adjusted EBITDA
|
$
|
23,923
|
$
|
18,777
|
||||
|
(a)
|
Represents LIFO adjustment, non-cash pension expense (income) and foreign exchange hedging.
|
|
(b)
|
Represents non-cash stock options, restricted stock, incentives expense and Solace PRSUs.
|
|
(c)
|
Represents the fees incurred for transaction expenses.
|
|
(d)
|
Represents product launch costs of our new product lines.
|
|
(e)
|
Represents costs associated with applications related to FDA PMTA.
|
|
(f)
|
Represents costs associated with corporate and vapor restructuring including severance and inventory reserves.
|
Schedule B
Turning Point Brands
Reconciliation of GAAP diluted EPS to Adjusted diluted EPS
(dollars in thousands except share data)
|
Three Months Ended
September 30, |
||||||||
|
2020
|
2019
|
|||||||
|
GAAP EPS
|
$
|
0.40
|
$
|
0.31
|
||||
|
Other (a)
|
0.05
|
0.05
|
||||||
|
Stock options, restricted stock, and incentives expense (b)
|
0.03
|
0.05
|
||||||
|
Transaction expenses (c)
|
0.02
|
0.02
|
||||||
|
New product launch costs (d)
|
-
|
0.07
|
||||||
|
FDA PMTA (e)
|
0.22
|
0.01
|
||||||
|
Amortization of debt discount (f)
|
0.07
|
0.04
|
||||||
|
Corporate and vapor restructuring (g)
|
-
|
0.01
|
||||||
|
Tax (expense) benefit (h)
|
(0.04
|
)
|
0.05
|
|||||
|
Adjusted diluted EPS
|
$
|
0.75
|
$
|
0.61
|
||||
|
Totals may not foot due to rounding
|
||||||||
(a) Represents LIFO adjustment, non-cash pension expense (income), foreign exchange hedging reporting and Loss on Extinguishment of Debt tax effected at the quarterly tax rate.
(b) Represents non-cash stock options, restricted stock, incentives expense and Solace PRSUs tax effected at the quarterly tax rate.
(c) Represents the fees incurred for transaction expenses tax effected at the quarterly tax rate.
(d) Represents product launch costs of our new product lines tax effected at the quarterly tax rate.
(e) Represents costs associated with applications related to the FDA PMTA tax effected at the quarterly tax rate.
(f) Represents non-cash amortization of debt discount tax effected at the quarterly tax rate.
(g) Represents costs associated with corporate and vapor restructuring including severance and inventory reserves tax effected at the quarterly tax rate
(h) Represents adjustment from quarterly tax rate to annual projected tax rate of 23% in 2020 and 20% in 2019.
Schedule C
Turning Point Brands, Inc.
Reconciliation of GAAP Gross Profit to Adjusted Gross Profit and GAAP Operating Income to Adjusted Operating Income
(dollars in thousands)
|
Consolidated
|
Smokeless
|
Smoking
|
NewGen
|
|||||||||||||||||||||||||||||
|
3rd Quarter
2020 |
3rd Quarter
2019 |
3rd Quarter
2020 |
3rd Quarter
2019 |
3rd Quarter
2020 |
3rd Quarter
2019 |
3rd Quarter
2020 |
3rd Quarter
2019 |
|||||||||||||||||||||||||
|
Net sales
|
$
|
104,174
|
$
|
96,800
|
$
|
29,764
|
$
|
26,187
|
$
|
35,973
|
$
|
30,222
|
$
|
38,437
|
$
|
40,391
|
||||||||||||||||
|
Gross profit
|
$
|
48,307
|
$
|
42,816
|
$
|
16,042
|
$
|
13,587
|
$
|
21,263
|
$
|
16,619
|
$
|
11,002
|
$
|
12,610
|
||||||||||||||||
|
Adjustments:
|
||||||||||||||||||||||||||||||||
|
LIFO adjustment
|
-
|
136
|
-
|
136
|
-
|
-
|
-
|
-
|
||||||||||||||||||||||||
|
Adjusted gross profit
|
$
|
48,307
|
$
|
42,952
|
$
|
16,042
|
$
|
13,723
|
$
|
21,263
|
$
|
16,619
|
$
|
11,002
|
$
|
12,610
|
||||||||||||||||
|
Operating income
|
$
|
16,021
|
$
|
13,032
|
$
|
11,466
|
$
|
9,392
|
$
|
16,827
|
$
|
12,931
|
$
|
745
|
$
|
(1,233
|
)
|
|||||||||||||||
|
Adjustments:
|
||||||||||||||||||||||||||||||||
|
LIFO adjustment
|
-
|
136
|
-
|
136
|
-
|
-
|
-
|
-
|
||||||||||||||||||||||||
|
Transaction expenses
|
570
|
470
|
-
|
-
|
-
|
-
|
-
|
-
|
||||||||||||||||||||||||
|
New product launch costs
|
-
|
1,979
|
-
|
-
|
-
|
-
|
-
|
1,979
|
||||||||||||||||||||||||
|
FDA PMTA
|
5,271
|
241
|
-
|
-
|
-
|
-
|
-
|
-
|
||||||||||||||||||||||||
|
Corporate and vapor restructuring
|
-
|
265
|
-
|
-
|
-
|
-
|
-
|
265
|
||||||||||||||||||||||||
|
Adjusted operating income
|
$
|
21,862
|
$
|
16,123
|
$
|
11,466
|
$
|
9,528
|
$
|
16,827
|
$
|
12,931
|
$
|
745
|
$
|
1,011
|
||||||||||||||||