EXHIBIT 99.1
TPI Composites, Inc. Announces First Quarter 2025 Earnings Results – Operational Execution and Strategic Initiatives Drive Improved Financial Results; Initiation of Strategic Review
SCOTTSDALE, Ariz., May 12, 2025 (GLOBE NEWSWIRE) -- TPI Composites, Inc. (Nasdaq: TPIC), today reported financial results for the first quarter ended March 31, 2025. TPI further announced that its Board of Directors has initiated a strategic review of the business.
”In the first quarter, TPI achieved 14% year-over-year growth in sales and drove positive cash flows from operating activities despite a challenging geopolitical and operating environment. The various economic challenges presented in the markets where we operate continue to create uncertainty in the industry’s near-term outlook and continue to challenge our operations. We are continuing to focus on maximizing value and ensuring that we have sufficient liquidity. Additionally, we are working with a committee of our Board of Directors and with advisors to conduct a strategic review of our business and evaluate potential strategic alternatives focused on optimizing our capital structure for the current and future environment,” said Bill Siwek, President and CEO of TPI Composites.
“During the pendency of this review, TPI remains focused on operational excellence and improving productivity and competitiveness. We continue to believe in the strength of our business and that our strategic partnerships position us well to navigate these challenges and capitalize on the opportunities within the renewable energy sector. No timetable has been established for the conclusion of the Board’s strategic review and no decisions related to any further actions or potential strategic alternatives have been made at this time. TPI does not intend to disclose developments relating to this process until it determines that further disclosure is appropriate or necessary.”
First Quarter 2025 Results and Recent Business Highlights
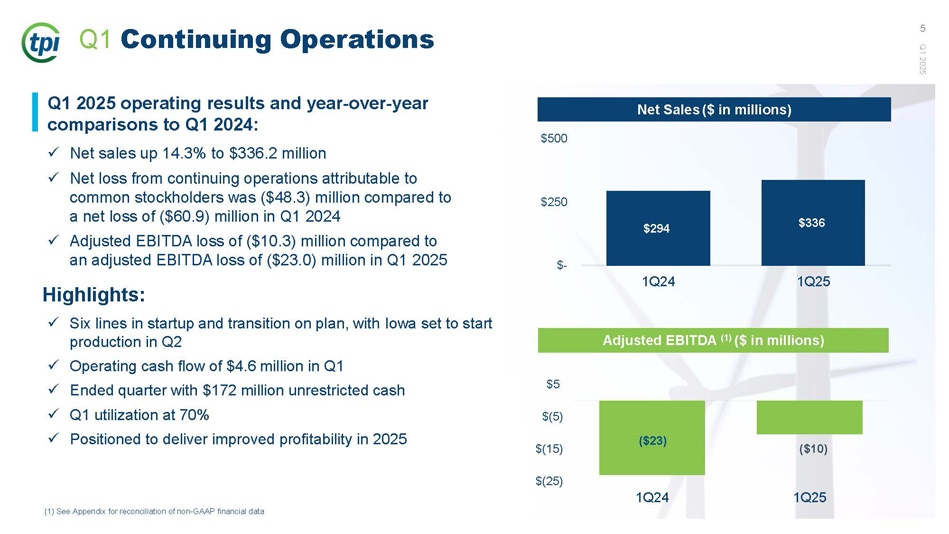
- Net Sales totaled $336.2 million for the three months ended March 31, 2025, an increase of 14.3% over the same period last year.
- Net loss from continuing operations attributable to common stockholders was $48.3 million for the three months ended March 31, 2025, compared to a net loss of $60.9 million in the same period last year.
- Adjusted EBITDA was a loss of $10.3 million for the three months ended March 31, 2025, compared to adjusted EBITDA loss of $23.0 million in the same period last year.
| | | |
| KPIs from continuing operations | 1Q’25 | | 1Q’24 | |
| Sets1 | 509 | | 488 | |
| Estimated megawatts2 | 1,933 | | 2,050 | |
| Utilization3 | 70% | | 67% | |
| Dedicated manufacturing lines4 | 36 | | 36 | |
| Manufacturing lines installed5 | 36 | | 36 | |
| Wind Blade ASP (in $ thousands)6 | $209 | | $183 | |
| 1. | Number of wind blade sets (which consist of three wind blades) produced worldwide during the period. |
| 2. | Estimated megawatts of energy capacity to be generated by wind blade sets produced during the period. |
| 3. | Utilization represents the percentage of wind blades invoiced during the period compared to the total potential wind blade capacity of manufacturing lines installed during the period. |
| 4. | Number of wind blade manufacturing lines that are dedicated to our customers under long-term supply agreements at the end of the period. |
| 5. | Number of wind blade manufacturing lines installed and either in operation, startup or transition during the period. |
| 6. | Wind blade ASP represents the average sales price during the period for a single wind blade that we manufacture for our customers. |
| | |
First Quarter 2025 Financial Results from Continuing Operations
Net sales for the three months ended March 31, 2025, increased 14.3% to $336.2 million as compared to $294.0 million in the same period in 2024 due to the following:
- Net Sales of wind blades, tooling and other wind related sales (“Wind”) increased by $40.1 million, or 13.9%, to $329.0 million for the three months ended March 31, 2025, as compared to $288.9 million in the same period in 2024. The increase was primarily due to higher average sales prices due to changes in the mix of wind blade models produced and a 4% increase in the number of wind blades produced. The increase in volume was primarily due to the restart of production at one of our previously idled facilities in Juarez, Mexico, and higher utilization as several of our manufacturing lines in Mexico and Türkiye were in serial production in the current period, that were either in startup or transition during the prior comparative period. This increase in Wind sales was partially offset by volume declines based on market activity levels impacting one of our Türkiye facilities and volume declines related to the Nordex Matamoros facility that shut down at the conclusion of the contract on June 30, 2024.
- Field service, inspection and repair services (“Field Services”) sales increased $2.0 million, or 38.4%, to $7.1 million for the three months ended March 31, 2025, as compared to $5.1 million in the same period in 2024. The increase was primarily due to an increase in technicians deployed to revenue generating projects due to a decrease in time spent on non-revenue generating inspection and repair activities.
Net loss from continuing operations attributable to common stockholders was $48.3 million for the three months ended March 31, 2025, compared to a net loss of $60.9 million in the same period in 2024. The decrease in net loss was primarily due to an increase in Wind sales, the absence of Nordex Matamoros losses, a decrease in startup and transition costs, lower general and administrative expenses and cost savings initiatives. These improvements were offset by higher labor costs in Türkiye and Mexico, higher pre-existing warranty charges, an increase in interest expense, and costs associated with ramping up certain Mexico facilities to a 24/7 schedule.
The net loss from continuing operations per common share was $1.01 for the three months ended March 31, 2025, compared to a net loss per common share of $1.29 for the same period in 2024.
Adjusted EBITDA was a loss of $10.3 million for the three months ended March 31, 2025, as compared to an adjusted EBITDA loss of $23.0 million during the same period in 2024. Adjusted EBITDA margin was a loss of (3.1%) as compared to an adjusted EBITDA margin loss of (7.8%) during the same period in 2024. The improvement in adjusted EBITDA was primarily due to an increase in Wind sales, the absence of Nordex Matamoros losses, a decrease in startup and transition costs, lower general and administrative expenses and cost savings initiatives. These improvements were offset by higher labor costs in Türkiye and Mexico, higher pre-existing warranty charges, and costs associated with ramping up certain Mexico facilities to a 24/7 schedule.
Net cash provided by operating activities improved by $43.6 million for the three months ended March 31, 2025, as compared to the same period in 2024, primarily due to a $12.6 million decrease in our net loss from continuing operations and changes in working capital.
Net cash used in investing activities decreased by $1.8 million for the three months ended March 31, 2025, as compared to the same period in 2024, primarily due to lower capital expenditures from a decrease in startup and transition activities.
2025 Guidance
Guidance for the full year ending December 31, 2025:
| Guidance | Full Year 2025 |
| Net Sales from Continuing Operations | $1.4 - $1.5 billion |
| Adjusted EBITDA Margin % from Continuing Operations | 0% to 2%, previously 2% to 4% |
| Utilization % | 80% - 85% (based on 34 lines installed)
(previously approx. 85%) |
| Capital Expenditures | $25 - $30 million |
| | |
Conference Call and Webcast Information
TPI Composites will host an investor conference call this afternoon, Monday, May 12th, at 5:00 pm ET, to discuss first quarter 2025 results and the strategic review and outlook for the business. Interested parties are invited to listen to the conference call which can be accessed live over the phone by dialing 1-877-407-8291, or for international callers, 1-201-689-8345. A replay will be available two hours after the call and can be accessed by dialing 1-877-660-6853, or for international callers, 1-201-612-7415. The passcode for the live call and the replay is 13752924. The replay will be available until May 26th, 2025. Interested investors and other parties may also listen to a simultaneous webcast of the conference call by logging onto the Investors section of the Company’s website at www.tpicomposites.com. The online replay will be available for a limited time beginning immediately following the call.
About TPI Composites, Inc.
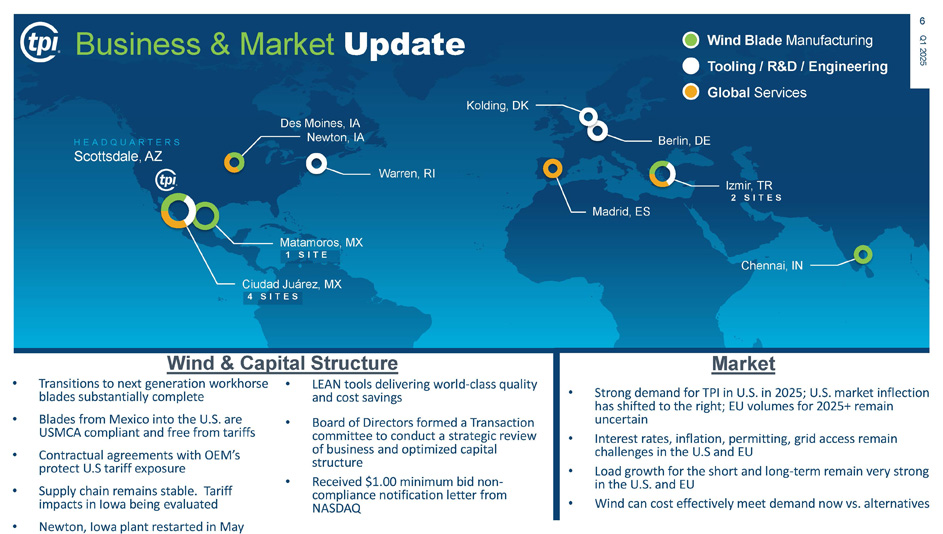
TPI Composites, Inc. is a global company focused on innovative and sustainable solutions to decarbonize and electrify the world. TPI delivers high-quality, cost-effective composite solutions through long-term relationships with leading OEMs in the wind markets. TPI is headquartered in Scottsdale, Arizona and operates factories in the U.S., Mexico, Türkiye and India. TPI operates additional engineering development centers in Denmark and Germany and global service training centers in the U.S. and Spain.
Forward-Looking Statements
This release contains forward-looking statements which are made pursuant to safe harbor provisions of the Private Securities Litigation Reform Act of 1995. These forward-looking statements include statements, among other things, concerning: growth of the wind energy and electric vehicle markets and our addressable markets for our products and services; effects on our financial statements and our financial outlook; our business strategy, including anticipated trends and developments in and management plans for our business and the wind industry and other markets in which we operate; the strategic review and evaluation of potential strategic alternatives for the business; competition; future financial results, operating results, revenues, gross margin, operating expenses, profitability, products, projected costs, warranties, our ability to improve our operating margins, and capital expenditures. These forward-looking statements are often characterized by the use of words such as “estimate,” “expect,” “anticipate,” “potential,” “project,” “plan,” “intend,” “seek,” “believe,” “forecast,” “foresee,” “likely,” “may,” “should,” “goal,” “target,” “might,” “will,” “could,” “predict,” “continue” and the negative or plural of these words and other comparable terminology. Forward-looking statements are only predictions based on our current expectations and our projections about future events. You should not place undue reliance on these forward-looking statements. We undertake no obligation to update any of these forward-looking statements for any reason. These forward-looking statements involve known and unknown risks, uncertainties and other factors that may cause our actual results, levels of activity, performance, or achievements to differ materially from those expressed or implied by these statements. These factors include, but are not limited to, the matters discussed in “Risk Factors,” in our Annual Report on Form 10-K and other reports that we will file with the SEC.
Non-GAAP Definitions
This press release includes unaudited non-GAAP financial measures, including EBITDA, adjusted EBITDA, net cash (debt) and free cash flow. We define EBITDA as net income (loss) plus interest expense (including losses on the extinguishment of debt and net of interest income), income taxes and depreciation and amortization, preferred stock dividends and accretion less gain on extinguishment on series A preferred stock. We define adjusted EBITDA as EBITDA plus any share-based compensation expense, any foreign currency income or losses, any gains or losses on the sale of assets and asset impairments and any restructuring charges. We define net cash (debt) as the total unrestricted cash and cash equivalents less the total principal amount of debt outstanding. We define free cash flow as net cash flow from operating activities less capital expenditures. We present non-GAAP measures when we believe that the additional information is useful and meaningful to investors. Non-GAAP financial measures do not have any standardized meaning and are therefore unlikely to be comparable to similar measures presented by other companies. The presentation of non-GAAP financial measures is not intended to be a substitute for, and should not be considered in isolation from, the financial measures reported in accordance with GAAP.
We provide forward-looking statements in the form of guidance in our quarterly earnings releases and during our quarterly earnings conference calls. This guidance is provided on a non-GAAP basis and cannot be reconciled to the closest GAAP measures without unreasonable effort because of the unpredictability of the amounts and timing of events affecting the items we exclude from non-GAAP measures. For example, stock-based compensation is unpredictable for our performance-based awards, which can fluctuate significantly based on current expectations of future achievement of performance-based targets. Amortization of intangible assets and restructuring costs are all impacted by the timing and size of potential future actions, which are difficult to predict. In addition, from time to time, we exclude certain items that occur infrequently, which are also inherently difficult to predict and estimate. It is also difficult to predict the tax effect of the items we exclude and to estimate certain discrete tax items, like the resolution of tax audits or changes to tax laws. As such, the costs that are being excluded from non-GAAP guidance are difficult to predict and a reconciliation or a range of results could lead to disclosure that would be imprecise or potentially misleading. Material changes to any one of the exclusions could have a significant effect on our guidance and future GAAP results. See Table Four for a reconciliation of certain non-GAAP financial measures to the comparable GAAP measures.
Investor Relations
480-315-8742
[email protected]
| |
| TPI COMPOSITES, INC. AND SUBSIDIARIES |
| TABLE ONE - CONDENSED CONSOLIDATED STATEMENTS OF OPERATIONS |
| (UNAUDITED) |
| |
| | Three Months Ended
March 31, |
| (in thousands, except per share data) | 2025 | | 2024
|
| Net sales | $ | 336,157 | | | $ | 294,046 | |
| Cost of sales | 341,739 | | | | 299,495 | |
| Startup and transition costs | 8,370 | | | | 22,229 | |
| Total cost of goods sold | 350,109 | | | | 321,724 | |
| Gross loss | (13,952 | ) | | | (27,678 | ) |
| General and administrative expenses | 5,919 | | | | 8,403 | |
| Loss on sale of assets and asset impairments | 2,549 | | | | 1,835 | |
| Restructuring charges, net | 372 | | | | 182 | |
| Loss from continuing operations | (22,792 | ) | | | (38,098 | ) |
| Other income (expense): | | | | | | |
| Interest expense, net | (24,204 | ) | | | (21,383 | ) |
| Foreign currency loss | (2,341 | ) | | | (631 | ) |
| Miscellaneous income | 1,464 | | | | 2,475 | |
| Total other expense | (25,081 | ) | | | (19,539 | ) |
| Loss before income taxes | (47,873 | ) | | | (57,637 | ) |
| Income tax provision | (418 | ) | | | (3,242 | ) |
| Net loss from continuing operations | (48,291 | ) | | | (60,879 | ) |
| Net loss from discontinued operations | (22 | ) | | | (589 | ) |
| Net loss attributable to common stockholders | $ | (48,313 | ) | | $ | (61,468 | ) |
| | | | | | | |
| Weighted-average shares of common stock outstanding: | | | | | | |
| Basic | 47,609 | | | | 47,204 | |
| Diluted | 47,609 | | | | 47,204 | |
| | | | | | | |
| Net loss from continuing operations per common share: | | | | | | |
| Basic | $ | (1.01 | ) | | $ | (1.29 | ) |
| Diluted | $ | (1.01 | ) | | $ | (1.29 | ) |
| | | | | | | |
| Net loss from discontinued operations per common share: | | | | | | |
| Basic | $ | (0.00 | ) | | $ | (0.01 | ) |
| Diluted | $ | (0.00 | ) | | $ | (0.01 | ) |
| | | | | | | |
| Net loss per common share: | | | | | | |
| Basic | $ | (1.01 | ) | | $ | (1.30 | ) |
| Diluted | $ | (1.01 | ) | | $ | (1.30 | ) |
| | | | | | | | |
| Non-GAAP Measures (unaudited): | | | | | | | |
| EBITDA | $ | (16,780 | ) | | $ | (28,216 | ) |
| Adjusted EBITDA | $ | (10,298 | ) | | $ | (23,022 | ) |
| | | | | | | |
| TPI COMPOSITES, INC. AND SUBSIDIARIES |
| TABLE TWO - CONDENSED CONSOLIDATED BALANCE SHEETS |
| (UNAUDITED) |
| |
| | March 31,
| | December 31, |
| (in thousands) | 2025
| | 2024 |
| Assets | | | | | |
| Current assets: | | | | | |
| Cash and cash equivalents | $ | 171,859 | | | $ | 196,518 | |
| Restricted cash | 9,695 | | | 9,639 | |
| Accounts receivable | 109,896 | | | 130,645 | |
| Contract assets | 70,705 | | | 43,849 | |
| Prepaid expenses | 14,633 | | | 15,692 | |
| Other current assets | 25,475 | | | 25,872 | |
| Inventories | 2,991 | | | 3,968 | |
| Assets held for sale | 16,842 | | | 17,301 | |
| Current assets of discontinued operations | 1,622 | | | 1,606 | |
| Total current assets | 423,718 | | | 445,090 | |
| Noncurrent assets: | | | | | |
| Property, plant and equipment, net | 91,129 | | | 93,144 | |
| Operating lease right of use assets | 116,916 | | | 122,589 | |
| Other noncurrent assets | 34,697 | | | 31,641 | |
| Total assets | $ | 666,460 | | | $ | 692,464 | |
| | | | | | |
| Liabilities and Stockholders' Deficit | | | | | |
| Current liabilities: | | | | | |
| Accounts payable and accrued expenses | $ | 265,537 | | | $ | 235,469 | |
| Accrued warranty | 46,793 | | | 38,768 | |
| Current maturities of long-term debt | 110,387 | | | 131,363 | |
| Current operating lease liabilities | 26,599 | | | 26,224 | |
| Contract liabilities | 29,609 | | | 40,392 | |
| Current liabilities of discontinued operations | 1,758 | | | 1,752 | |
| Total current liabilities | 480,683 | | | 473,968 | |
| Noncurrent liabilities: | | | | | |
| Long-term debt, net of current maturities | 505,833 | | | 485,239 | |
| Noncurrent operating lease liabilities | 93,394 | | | 99,428 | |
| Other noncurrent liabilities | 7,244 | | | 7,065 | |
| Total liabilities | 1,087,154 | | | 1,065,700 | |
| Total stockholders’ deficit | (420,694 | ) | | (373,236 | ) |
| Total liabilities and stockholders’ deficit | $ | 666,460 | | | $ | 692,464 | |
| | | | | | |
| Non-GAAP Measure (unaudited): | | | | | |
| Net debt | $ | (442,846 | ) | | $ | (418,582 | ) |
| | | | | | |
| TPI COMPOSITES, INC. AND SUBSIDIARIES |
| TABLE THREE - CONDENSED CONSOLIDATED STATEMENTS OF CASH FLOWS |
| (UNAUDITED) |
| | | |
| | Three Months Ended
March 31, |
| (in thousands) | 2025 | | 2024 |
| | | | | | |
| Net cash provided by (used in) operating activities | $ | 4,625 | | | $ | (39,004 | ) |
| Net cash used in investing activities | (6,512 | ) | | (8,285 | ) |
| Net cash (used in) provided by financing activities | (21,730 | ) | | 3,880 | |
| Impact of foreign exchange rates on cash, cash equivalents and restricted cash | (973 | ) | | 333 | |
| Cash, cash equivalents and restricted cash, beginning of period | 207,659 | | | 172,813 | |
| Cash, cash equivalents and restricted cash, end of period | $ | 183,069 | | | $ | 129,737 | |
| | | | | | |
| Non-GAAP Measure (unaudited): | | | | | |
| Free cash flow | $ | (1,887 | ) | | $ | (47,289 | ) |
| | | | | | |
| TPI COMPOSITES, INC. AND SUBSIDIARIES |
| TABLE FOUR - RECONCILIATION OF NON-GAAP MEASURES |
| (UNAUDITED) |
| | | |
| EBITDA and adjusted EBITDA are reconciled as follows: | Three Months Ended
March 31, |
| (in thousands) | 2025 | | 2024 |
| Net loss attributable to common stockholders | $ | (48,313 | ) | | $ | (61,468 | ) |
| Net loss from discontinued operations | 22 | | | 589 | |
| Net loss from continuing operations | (48,291 | ) | | (60,879 | ) |
| Adjustments: | | | | | |
| Depreciation and amortization | 6,889 | | | 8,038 | |
| Interest expense, net | 24,204 | | | 21,383 | |
| Income tax provision | 418 | | | 3,242 | |
| EBITDA | (16,780 | ) | | (28,216 | ) |
| Share-based compensation expense | 1,220 | | | 2,546 | |
| Foreign currency loss | 2,341 | | | 631 | |
| Loss on sale of assets and asset impairments | 2,549 | | | 1,835 | |
| Restructuring charges, net | 372 | | | 182 | |
| Adjusted EBITDA | $ | (10,298 | ) | | $ | (23,022 | ) |
| | | | | | |
| Net debt is reconciled as follows: | March 31, | | December 31, |
| (in thousands) | 2025 | | 2024 |
| Cash and cash equivalents | $ | 171,859 | | | $ | 196,518 | |
| Cash and cash equivalents of discontinued operations | 1,515 | | | 1,502 | |
| Total debt, net of debt issuance costs and debt discount | (616,220 | ) | | (616,602 | ) |
| Net debt | $ | (442,846 | ) | | $ | (418,582 | ) |
| | | | | | |
| Free cash flow is reconciled as follows: | Three Months Ended
March 31, |
| (in thousands) | 2025 | | 2024 |
| Net cash provided by (used in) operating activities | $ | 4,625 | | | $ | (39,004 | ) |
| Capital expenditures | (6,512 | ) | | (8,285 | ) |
| Free cash flow | $ | (1,887 | ) | | $ | (47,289 | ) |
| | | | | | |
Exhibit 99.2
Q1 2025 Earnings Call May 12 th , 2025
Legal Disclaimer 2 This presentation contains forward - looking statements within the meaning of Section 27A of the Securities Act of 1933, as amended, and Section 21E of the Securities Exchange Act of 1934, as amended (the Exchange Act). All statements other than statements of historical facts contained in this presentation, including statements regarding our future results of operations and financial position, business strategy and plans and objectives of management for future operations, are forward - looking statements. In many cases, you can identify forward - looking statements by terms such as “may,” “should,” “expects,” “plans,” “anticipates,” “could,” “intends,” “targets,” “projects,” “contemplates,” “believes,” “estimates,” “predicts,” “potential” or “continue” or the negative of these terms or other similar words. Forward - looking statements contained in this release include, but are not limited to, statements about: i . competition from other wind blade and wind blade turbine manufacturers; ii. the discovery of defects in our products and our ability to estimate the future cost of warranty campaigns; iii. the current status of the wind energy market and our addressable market; iv. our ability to absorb or mitigate the impact of price increases in resin, carbon reinforcements (or fiber), other raw materials and related logistics costs that we use to produce our products; v. our ability to absorb or mitigate the impact of wage inflation in the countries in which we operate; vi. our ability to procure adequate supplies of raw materials and components to fulfill our wind blade volume commitments to our customers; vii. the potential impact of the increasing prevalence of auction - based tenders in the wind energy market and increased competition from solar energy on our gross margins and overall financial performance; viii. our future financial performance, including our net sales, cost of goods sold, gross profit or gross margin, operating expenses, ability to generate positive cash flow and ability to achieve or maintain profitability; ix. changes in domestic or international government or regulatory policy, including without limitation, changes in trade policy, such as tariffs and energy policy; x. changes in global economic trends and uncertainty, geopolitical risks, and demand or supply disruptions from global events; xi. changes in macroeconomic and market conditions, including the potential impact of any pandemic, risk of recession, rising interest rates and inflation, supply chain constraints, commodity prices and exchange rates, and the impact of such changes on our business and results of operations; xii. the sufficiency of our cash and cash equivalents to meet our liquidity needs; xiii. the increasing cost and availability of additional capital, should such capital be needed; xiv. our ability to attract and retain customers for our products, and to optimize product pricing; xv. our ability to effectively manage our growth strategy and future expenses, including our startup and transition costs; xvi. our ability to successfully expand in our existing wind energy markets and into new international wind energy markets, including our ability to expand our field service inspection and repair services business; xvii. our ability to keep up with market changes and innovations; xviii. our ability to successfully open new manufacturing facilities and expand existing facilities on time and on budget; xix. the impact of the pace of new product and wind blade model introductions on our business and our results of operations; xx. Our projected sales and costs, including materials costs and capital expenditures, during the current fiscal year; xxi. our ability to maintain, protect and enhance our intellectual property; xxii. our ability to comply with existing, modified, or new laws and regulations applying to our business, including the imposition of new taxes, duties, or similar assessments on our products; xxiii. the attraction and retention of qualified associates and key personnel; xxiv. our ability to maintain good working relationships with our associates, and avoid labor disruptions, strikes and other disputes with labor unions that represent certain of our associates; xxv. the potential impact of one or more of our customers becoming bankrupt or insolvent or experiencing other financial problems; xxvi. our projected business model during the current fiscal year, including with respect to the number of wind blade manufacturing lines we anticipate; and xxvii. our ability to service our current debt and comply with any covenants related to such debt; xxviii. our ability to conduct a strategic review of our business and evaluate and, as appropriate, execute on, any strategic financial or other transactions; xxix. our ability to maintain the listing of our shares on the Nasdaq Global Market. These forward - looking statements are only predictions. These statements relate to future events or our future financial performance and involve known and unknown risks, uncertainties and other important factors that may cause our actual results, levels of activity, performance or achievements to materially differ from any future results, levels of activity, performance or achievements expressed or implied by these forward - looking statements. Because forward - looking statements are inherently subject to risks and uncertainties, some of which cannot be predicted or quantified, you should not rely on these forward - looking statements as guarantees of future events. Further information on the factors, risks and uncertainties that could affect our financial results and the forward - looking statements in this presentation are included in our filings with the Securities and Exchange Commission and will be included in subsequent periodic and current reports we make with the Securities and Exchange Commission from time to time, including in our Annual Report on Form 10 - K for the year ended December 31, 2024, filed with the Securities and Exchange Commission. The forward - looking statements in this presentation represent our views as of the date of this presentation. We anticipate that subsequent events and developments will cause our views to change. However, while we may elect to update these forward - looking statements at some point in the future, we undertake no obligation to update any forward - looking statement to reflect events or developments after the date on which the statement is made or to reflect the occurrence of unanticipated events except to the extent required by applicable law. You should, therefore, not rely on these forward - looking statements as representing our views as of any date after the date of this presentation. Our forward - looking statements do not reflect the potential impact of any future acquisitions, mergers, dispositions, joint ventures, or investments we may make. This presentation includes unaudited non - GAAP financial measures including EBITDA, adjusted EBITDA, net cash (debt) and free cash flow. We define EBITDA, a non - GAAP financial measure, as net income or loss from continuing operations plus interest expense net, income taxes, depreciation and amortization, preferred stock dividends and accretion less gain on extinguishment on series A preferred stock. We define adjusted EBITDA as EBITDA plus any share - based compensation expense, plus or minus any foreign currency losses or income, plus or minus any losses or gains from the sale of assets and asset impairments, plus any restructuring charges. We define net cash (debt) as total unrestricted cash and cash equivalents less the total principal amount of debt outstanding. We define free cash flow as net cash flow from operating activities less capital expenditures. We present non - GAAP measures when we believe that the additional information is useful and meaningful to investors. Non - GAAP financial measures do not have any standardized meaning and are therefore unlikely to be comparable to similar measures presented by other companies. The presentation of non - GAAP financial measures is not intended to be a substitute for, and should not be considered in isolation from, the financial measures reported in accordance with GAAP. See the Appendix for the reconciliations of certain non - GAAP financial measures to the comparable GAAP measures. This presentation also contains estimates and other information concerning our industry that are based on industry publications, surveys and forecasts. This information involves a number of assumptions and limitations, and we have not independently verified the accuracy or completeness of the information Q1 2025
Agenda ⎮ Q1 Highlights and Business Update ⎮ Q1 Financial Highlights and 2025 Guidance ⎮ 2024 Sustainability Report ⎮ Wrap Up ⎮ Q&A 3 Q1 2025
Q1 Highlights and Business Update Q1 2025 4
$294 $336 $- $250 $500 1Q24 1Q25 ($23) ($10) $(25) $(15) $(5) $5 1Q24 1Q25 Q1 Continuing Operations 5 Q1 2025 operating results and year - over - year comparisons to Q1 2024: Highlights: x Net sales up 14.3% to $336.2 million x Net loss from continuing operations attributable to common stockholders was ($48.3) million compared to a net loss of ($60.9) million in Q1 2024 x Adjusted EBITDA loss of ($10.3) million compared to an adjusted EBITDA loss of ($23.0) million in Q1 2025 x Six lines in startup and transition on plan, with Iowa set to start production in Q2 x Operating cash flow of $4.6 million in Q1 x Ended quarter with $172 million unrestricted cash x Q1 utilization at 70% x Positioned to deliver improved profitability in 2025 (1) See Appendix for reconciliation of non - GAAP financial data Adjusted EBITDA (1) ($ in millions) Net Sales ($ in millions) Q1 2025
Business & Market Update HEADQUARTERS Scottsdale, AZ Ciudad Juárez, MX 4 SITES Matamoros, MX 1 SITE Warren, RI Madrid, ES Berlin, DE Kolding, DK Izmir, TR 2 SITES Chennai, IN Wind Blade Manufacturing Global Services Tooling / R&D / Engineering 6 Q1 2025 Des Moines, IA Newton, IA Wind & Capital Structure • Transitions to next generation workhorse blades substantially complete • Blades from Mexico into the U.S. are USMCA compliant and free from tariffs • Contractual agreements with OEM’s protect U.S tariff exposure • Supply chain remains stable. Tariff impacts in Iowa being evaluated • Newton, Iowa plant restarted in May Market • Strong demand for TPI in U.S. in 2025; U.S. market inflection has shifted to the right; EU volumes for 2025+ remain uncertain • Interest rates, inflation, permitting, grid access remain challenges in the U.S and EU • Load growth for the short and long - term remain very strong in the U.S. and EU • Wind can cost effectively meet demand now vs. alternatives • LEAN tools delivering world - class quality and cost savings • Board of Directors formed a Transaction committee to conduct a strategic review of business and optimized capital structure • Received $1.00 minimum bid non - compliance notification letter from NASDAQ
Q1 Financial Highlights and 2025 Guidance Q1 2025 7
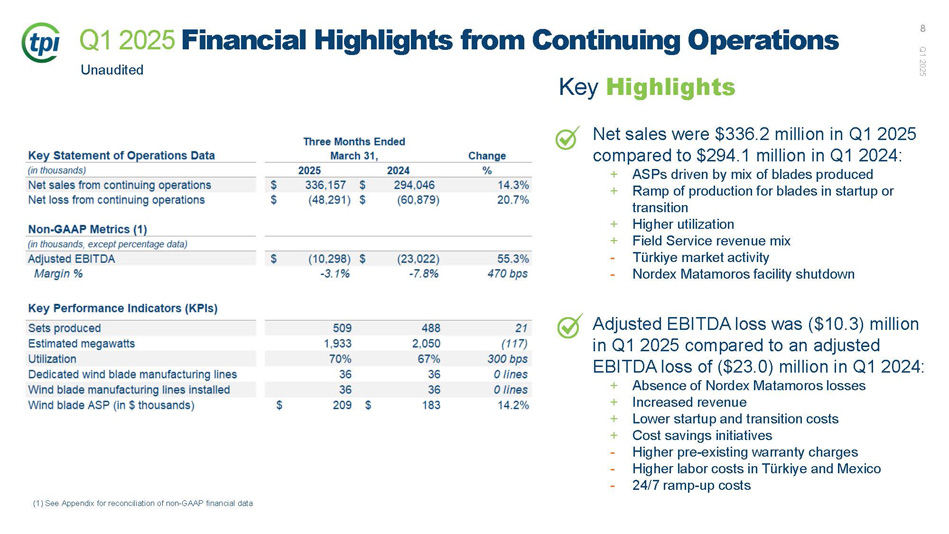
Net sales were $336.2 million in Q1 2025 compared to $294.1 million in Q1 2024: + ASPs driven by mix of blades produced + Ramp of production for blades in startup or transition + Higher utilization + Field Service revenue mix - Türkiye market activity - Nordex Matamoros facility shutdown Adjusted EBITDA loss was ($10.3) million in Q1 2025 compared to an adjusted EBITDA loss of ($23.0) million in Q1 2024: + Absence of Nordex Matamoros losses + Increased revenue + Lower startup and transition costs + Cost savings initiatives - Higher pre - existing warranty charges - Higher labor costs in Türkiye and Mexico - 24/7 ramp - up costs Key Highlights Unaudited Q1 2025 Financial Highlights from Continuing Operations (1) See Appendix for reconciliation of non - GAAP financial data Q1 2025 8
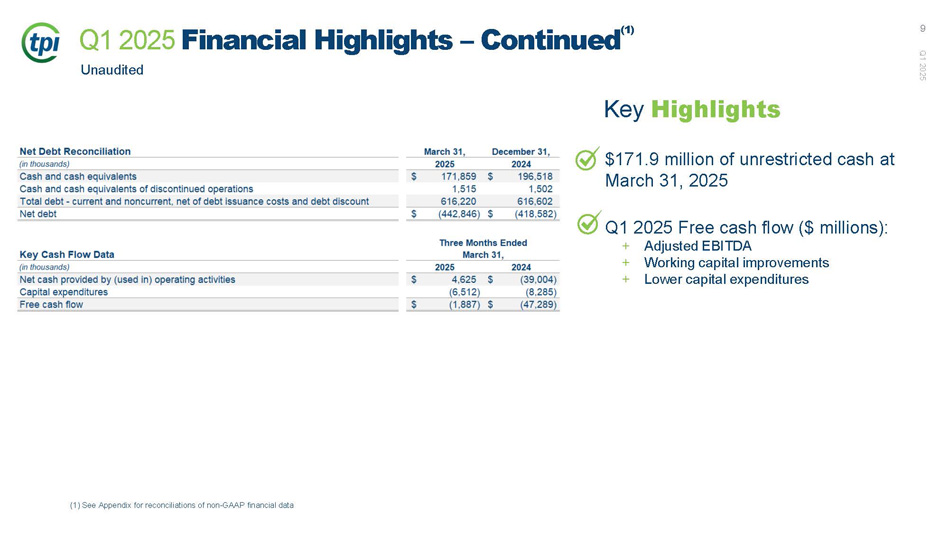
Key Highlights $171.9 million of unrestricted cash at March 31, 2025 Q1 2025 Free cash flow ($ millions): + Adjusted EBITDA + Working capital improvements + Lower capital expenditures Unaudited Q1 2025 Financial Highlights – Continued (1) (1) See Appendix for reconciliations of non - GAAP financial data Q1 2025 9
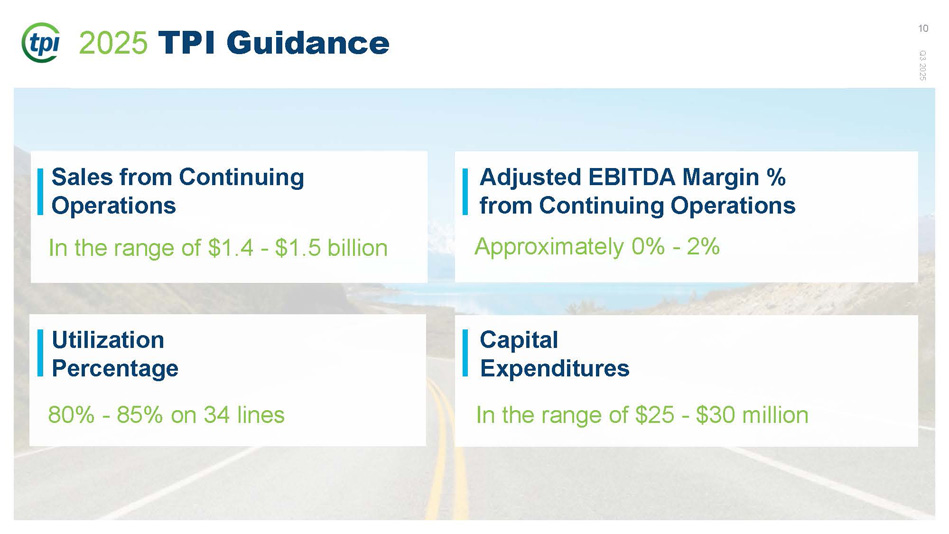
Adjusted EBITDA Margin % from Continuing Operations Approximately 0% - 2% Capital Expenditures In the range of $25 - $30 million Utilization Percentage 80% - 85% on 34 lines Sales from Continuing Operations In the range of $1.4 - $1.5 billion 2025 TPI Guidance 10 Q3 2025
2024 Sustainability Report Q1 2025 11
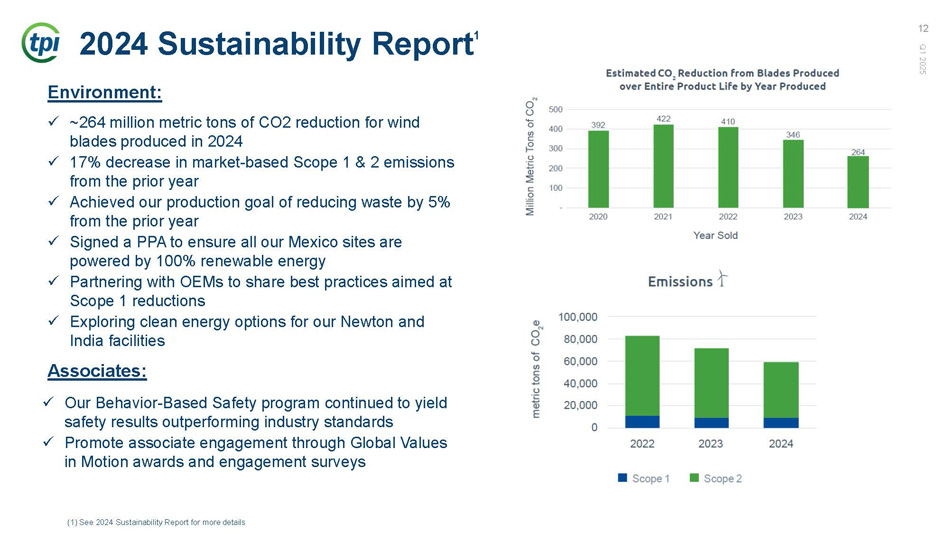
2024 Sustainability Report 1 12 Q1 2025 Environment: x ~264 million metric tons of CO2 reduction for wind blades produced in 2024 x 17% decrease in market - based Scope 1 & 2 emissions from the prior year x Achieved our production goal of reducing waste by 5% from the prior year x Signed a PPA to ensure all our Mexico sites are powered by 100% renewable energy x Partnering with OEMs to share best practices aimed at Scope 1 reductions x Exploring clean energy options for our Newton and India facilities Associates: x Our Behavior - Based Safety program continued to yield safety results outperforming industry standards x Promote associate engagement through Global Values in Motion awards and engagement surveys (1) See 2024 Sustainability Report for more details
Wrap Up Q1 2025 13
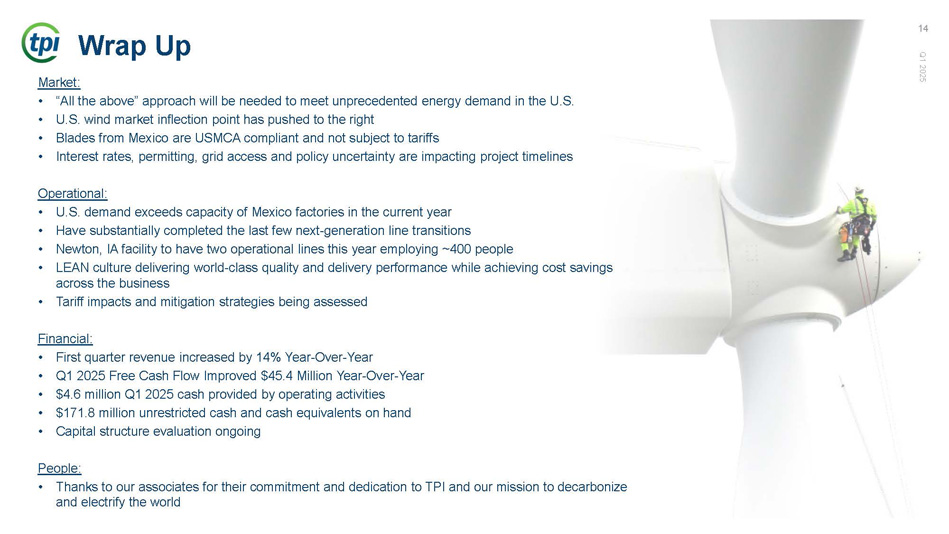
Q1 2025 14 Wrap Up Market: • “All the above” approach will be needed to meet unprecedented energy demand in the U.S. • U.S. wind market inflection point has pushed to the right • Blades from Mexico are USMCA compliant and not subject to tariffs • Interest rates, permitting, grid access and policy uncertainty are impacting project timelines Operational: • U.S. demand exceeds capacity of Mexico factories in the current year • Have substantially completed the last few next - generation line transitions • Newton, IA facility to have two operational lines this year employing ~400 people • LEAN culture delivering world - class quality and delivery performance while achieving cost savings across the business • Tariff impacts and mitigation strategies being assessed Financial: • First quarter revenue increased by 14% Year - Over - Year • Q1 2025 Free Cash Flow Improved $45.4 Million Year - Over - Year • $4.6 million Q1 2025 cash provided by operating activities • $171.8 million unrestricted cash and cash equivalents on hand • Capital structure evaluation ongoing People: • Thanks to our associates for their commitment and dedication to TPI and our mission to decarbonize and electrify the world
Q&A Q1 2025 15
16 Appendix – Non - GAAP Financial Information This presentation includes unaudited non - GAAP financial measures including EBITDA, adjusted EBITDA, net cash (debt) and free cas h flow. We define EBITDA, a non - GAAP financial measure, as net income or loss from continuing operations plus interest expense net, income taxes, depreciati on and amortization, preferred stock dividends and accretion less gain on extinguishment on series A preferred stock. We define adjusted EBITDA as EBITDA plus any sh are - based compensation expense, plus or minus any foreign currency losses or income, plus or minus any losses or gains from the sale of assets and a sse t impairments, plus any restructuring charges. We define net cash (debt) as total unrestricted cash and cash equivalents less the total principal amount of debt ou tst anding. We define free cash flow as net cash flow from operating activities less capital expenditures. We present non - GAAP measures when we believe that the additional information is useful and meaningful to investors. Non - GAAP financial measures do not have any standardized meaning and are therefore unlikely to be comparable to si milar measures presented by other companies. The presentation of non - GAAP financial measures is not intended to be a substitute for, and should not be considered in isolation from, the financial measures reported in accordance with GAAP. We provide forward - looking statements in the form of guidance in our quarterly earnings releases and during our quarterly earnin gs conference calls. This guidance is provided on a non - GAAP basis and cannot be reconciled to the closest GAAP measures without unreasonable effort because of the un predictability of the amounts and timing of events affecting the items we exclude from non - GAAP measures. For example, stock - based compensation is unpredictable f or our performance - based awards, which can fluctuate significantly based on current expectations of future achievement of performance - based targets. Amor tization of intangible assets and restructuring costs are all impacted by the timing and size of potential future actions, which are difficult to predict. In a ddi tion, from time to time, we exclude certain items that occur infrequently, which are also inherently difficult to predict and estimate. It is also difficult to predict the tax ef fect of the items we exclude and to estimate certain discrete tax items, like the resolution of tax audits or changes to tax laws. As such, the costs that are being exclu ded from non - GAAP guidance are difficult to predict and a reconciliation or a range of results could lead to disclosure that would be imprecise or potentially misleading . M aterial changes to any one of the exclusions could have a significant effect on our guidance and future GAAP results. See next page for a reconciliation of certain non - GAAP financial measures to the comparable GAAP measures. Q1 2025
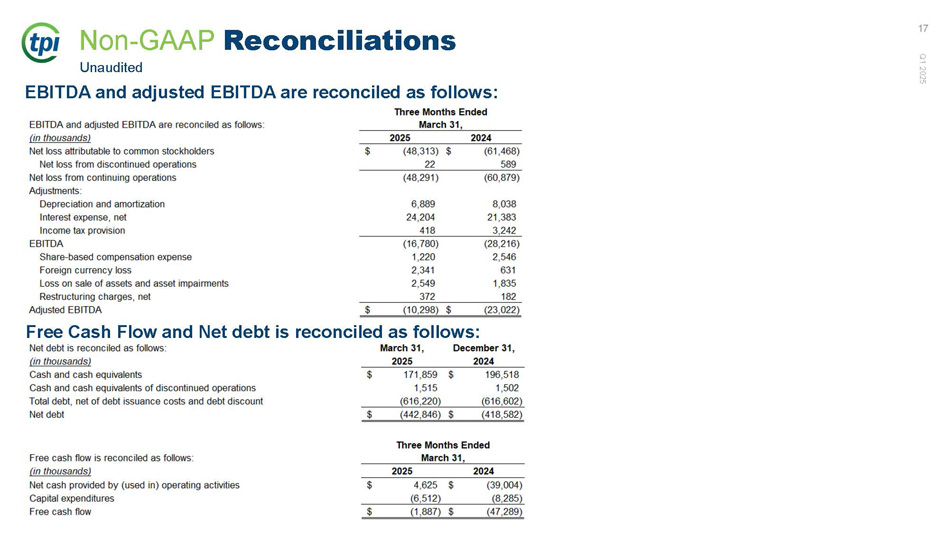
Non - GAAP Reconciliations EBITDA and adjusted EBITDA are reconciled as follows: Unaudited Free Cash Flow and Net debt is reconciled as follows: Q1 2025 17