Exhibit 99.1
FOR IMMEDIATE RELEASE
Trinity Industries, Inc. Announces Fourth Quarter and Full Year 2020 Results
Reports quarterly GAAP and Adjusted earnings (loss) from continuing operations of $(1.13) and $0.04 per diluted share, respectively
Generates full year operating and total free cash flow after dividends and investments of $652 million and $113 million, respectively
Returned $285 million of capital to stockholders during 2020
DALLAS, Texas – February 24, 2021 – Trinity Industries, Inc. (NYSE:TRN) today announced earnings results for the fourth quarter and year ended December 31, 2020.
Financial and Operational Highlights – Fourth Quarter 2020
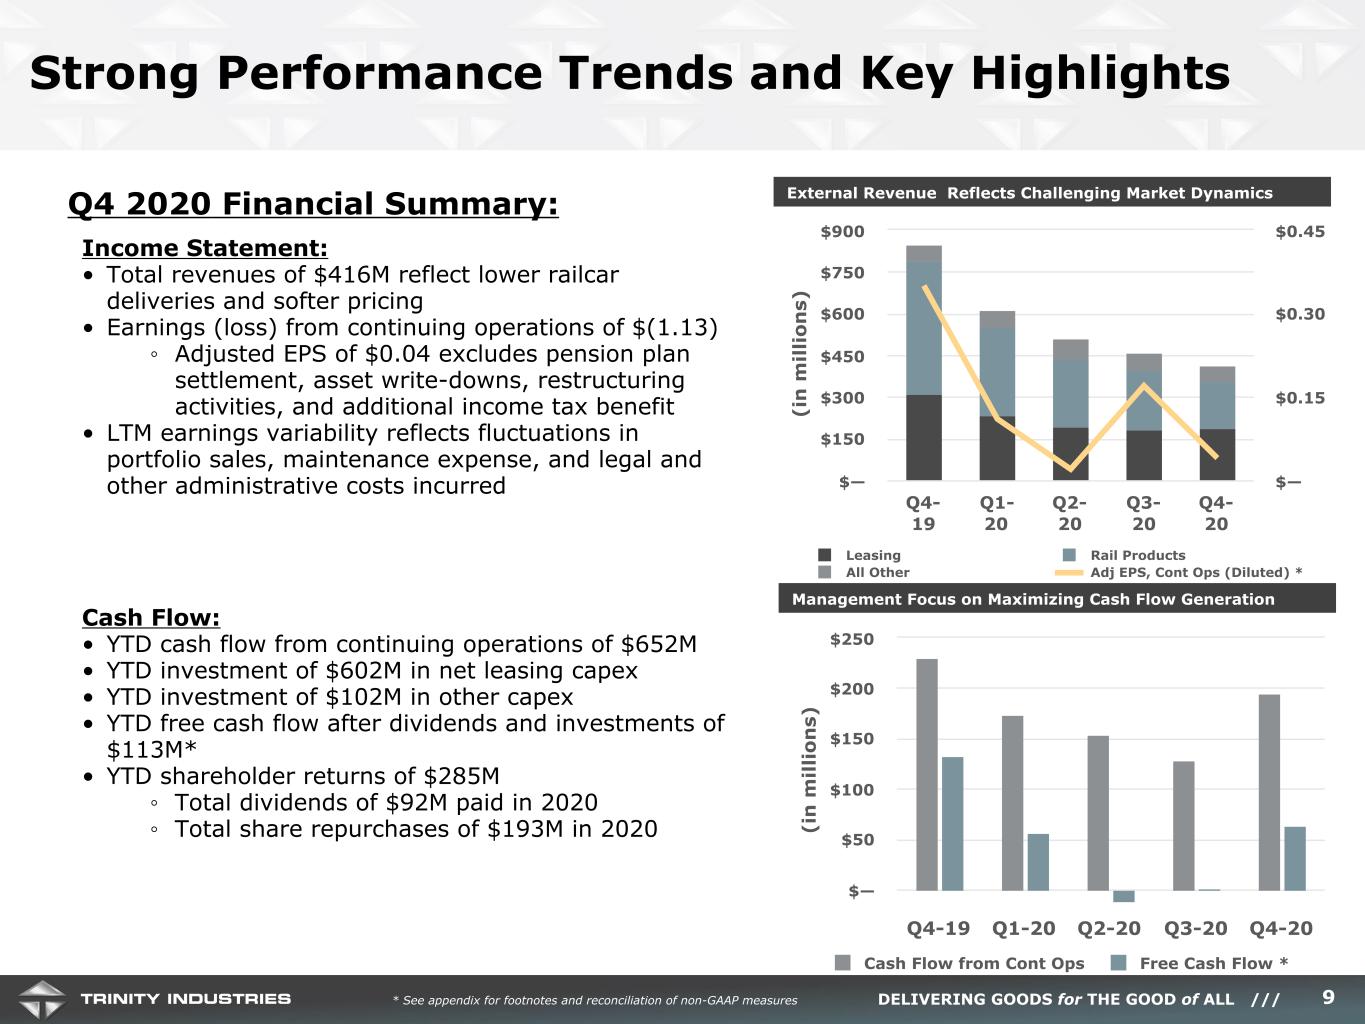
•Quarterly total company revenues of $416 million
•Quarterly income (loss) from continuing operations per common diluted share ("EPS") of $(1.13) and quarterly adjusted EPS of $0.04, which excludes the following (each per common diluted share):
◦Non-cash pension plan settlement charge totaling $1.03
◦Non-cash write-downs of non-strategic rail maintenance facilities and certain other assets totaling $0.18
◦Additional income tax benefit of $0.05 related to carryback claims as permitted under recent tax legislation
•Repurchases of approximately 3.0 million shares at a cost of $68 million under previously announced $250 million share repurchase authorization
•Completed financings of over $500 million
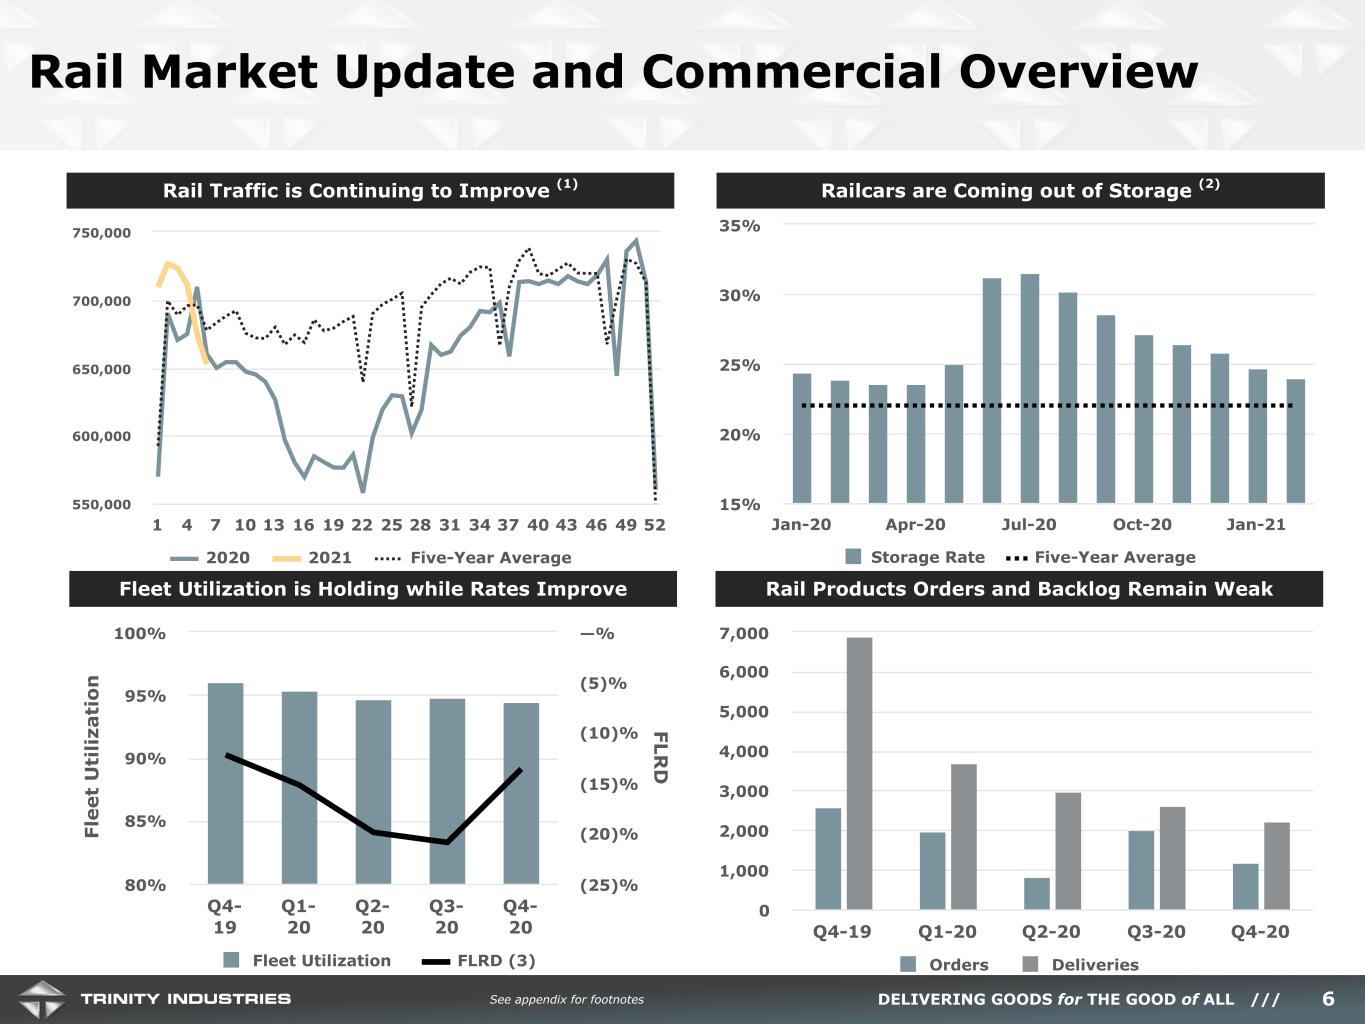
•Lease fleet utilization of 94.5% at year-end with sequentially improved Future Lease Rate Differential ("FLRD") to (13.6)%
•Railcar deliveries of 2,235 and new railcar orders of 1,170
Financial and Operational Highlights – Full Year 2020
•Full year total company revenues of $2.0 billion, representing a decrease of 33.5% when compared to 2019
•Reported EPS of $(1.27) and adjusted EPS of $0.37, which excludes the following (each per common diluted share):
◦Non-cash impairment of long-lived assets totaling $2.07
◦Non-cash pension plan settlement charge totaling $1.00
◦Restructuring activities totaling $0.07
◦Early redemption of high coupon debt totaling $0.03
◦Income tax benefit of $1.54 related to carryback claims as permitted under recent tax legislation
•Cash flow from operations and total free cash flow after dividends and investments ("Free Cash Flow") were $652 million and $113 million, respectively
◦Investment of $464 million in leasing capital expenditures, net of railcar sales, predominantly for growth, resulting in net additions of 3,340 railcars to the wholly-owned and partially-owned lease fleet during 2020, an increase of 3.2% from 2019
•Returns to shareholders of $285 million through dividends and share repurchases
◦Repurchases of 9.3 million shares at a cost of $193 million
•Committed liquidity of $727 million as of December 31, 2020
Management Commentary
“As we began 2020, we set out to transform Trinity’s rail-focused operating strategy to accelerate the financial performance of the Company and enhance value for shareholders,” said Jean Savage, Trinity’s CEO and President. “What our people accomplished in the midst of a global pandemic is nothing short of extraordinary. Throughout the year, we evaluated our strategy, redefined our vision with a new purpose statement, and aligned our business values and organization. We made substantial progress in rationalizing our footprint, and optimizing our corporate cost structure and balance sheet, all while maintaining safe operations through the COVID-19 outbreak and delivering high-quality products and services to our customers.”
“Our fourth quarter and fiscal year financial performance reflects the decline in railcar demand following the economic impacts of the COVID-19 pandemic. While our leasing operations results performed well during the year, the decline in lease portfolio sales and railcar deliveries created earnings headwinds to overcome. Our team responded to the crisis and offset some of this headwind through strong management of our fleet maintenance costs and significant reductions in headcount and SE&A. Certain of the cost-savings and restructuring activities associated with the repositioning of the Company generated one-time charges that impacted our financial performance. Through it all, Trinity’s rail-platform proved resilient – generating strong cash flows from operations of $652 million during 2020, and free cash flow of $113 million after dividends and investments in our platform and lease fleet. In addition to the dividends paid, we also returned $193 million to shareholders through the use of our share repurchase authorization.”
“Market uncertainty as it relates to COVID-19 remains the predominant story on the economic and rail industry outlook. We see early indicators of a recovery with improving year over year railcar traffic volumes, slowing train speeds, and, more importantly, higher overall cycle times for shippers, all of which require more railcars to return to service. However, given the pace of improvement, customers are hesitant in their long-term planning for railcar assets. Industry forecasts currently suggest a recovery in the second half of 2021, and our customer inquiry levels align with these expectations.”
“Our lease fleet utilization has remained stable through the beginning of the year, and we are seeing some improvement in lease rates. We expect our Leasing business to have comparable year over year financial performance as modest fleet growth and improved maintenance cost efficiency from utilizing our internal network are expected to mostly offset headwinds from renewing lease rates. We expect the Rail Products business to deliver better operating results in 2021 as we enhance the value of outsourced fabrication activities and implement more automation in facilities, against a backdrop of another challenging year for deliveries. When combined with additional cost savings initiatives in place, we expect earnings to improve from 2020 while still reflecting a challenging market environment in 2021. As a result of the strong cash flow synergies within Trinity’s business, we expect cash flow from operations to range between $625 million to $675 million for the 2021 year.”
Ms. Savage concluded, “2020 was a challenging year, but Trinity's team made difficult decisions that put our Company on a path to accelerate our financial performance. In 2021, we intend to further optimize our manufacturing platform through outsourced fabrication activities and integrating advanced technologies, and to enhance our product portfolio through evolutionary products and services for our customers. Additionally, we will continue to optimize our balance sheet through additional leverage, fleet modification, and RIV transactions. I am proud of the work the people of Trinity accomplished in 2020, and know they have set a high bar for performance in 2021.”
Consolidated Financial Summary
| | | | | | | | | | | | | | | | | |
| Three Months Ended
December 31, | | |
| 2020 | | 2019 | | Year over Year – Comparison |
| (in millions, except percentages and per share amounts) | | |
| Revenues | $ | 415.6 | | $ | 850.7 | | Lower deliveries in the Rail Products Group and fewer railcars sold from our lease fleet |
Selling, engineering, and administrative expenses | $ | 56.1 | | $ | 71.3 | | Lower employee-related costs resulting from cost optimization initiatives, including headcount reductions and adjustments to incentive-based compensation, and lower litigation-related expenses |
| | | | | |
Operating profit | $ | 36.9 | | $ | 97.2 | | Includes $27.0 million of non-cash write-downs of non-strategic rail maintenance facilities and certain other assets |
Adjusted Operating profit (1) | $ | 64.4 | | $ | 111.9 | | Lower volumes in the Rail Products Group and fewer railcar sales in the Leasing Group |
| Interest expense | $ | 52.6 | | $ | 56.3 | | Lower overall borrowing costs associated with the company's debt facilities, partially offset by higher overall average debt |
| Net income (loss) attributable to Trinity Industries, Inc. | $ | (127.2) | | $ | 21.6 | | Includes $151.5 million non-cash pension plan settlement charge |
EBITDA (1) | $ | (49.9) | | $ | 172.0 | | Includes $151.5 million non-cash pension plan settlement charge and $27.0 million non-cash asset write-downs |
Adjusted EBITDA (1) | $ | 129.1 | | $ | 186.7 | | See change in adjusted operating profit described above |
| Effective tax expense (benefit) rate | (25.0) | % | | 47.7 | % | | Primarily tax benefit due to the carryback of net operating losses |
| | | | | |
Diluted EPS – GAAP | $ | (1.13) | | $ | 0.18 | | Includes the impact of $1.03 in pension plan settlement charge and $0.18 in asset write-downs |
Diluted EPS – Adjusted (1) | $ | 0.04 | | $ | 0.35 | | |
| | | | | |
| Year Ended
December 31, | | |
| 2020 | | 2019 | | Year over Year – Comparison |
| (in millions) | | |
Net cash provided by operating activities – continuing operations | $ | 651.8 | | $ | 396.7 | | Cash impacts include cyclical shifts and working capital initiatives, as well as inflows from a customer's exercise of a purchase option on a sales-type lease |
Total Free Cash Flow After Investments and Dividends (1) | $ | 112.8 | | $ | 144.8 | |
| Capital expenditures – leasing, net of sold lease fleet railcars owned one year or less | $ | 602.2 | | $ | 1,122.2 | | Reduced lease fleet investment in 2020 |
| Returns of capital to shareholders | $ | 284.8 | | $ | 376.8 | | Reduced share repurchase activity in 2020 |
(1) Non-GAAP financial measure. See the Reconciliations of Non-GAAP Measures section within this Press Release for a reconciliation to the most directly comparable GAAP measure and why management believes this measure is useful to management and investors.
Business Group Summary
| | | | | | | | | | | | | | | | | |
| Three Months Ended
December 31, | | |
| 2020 | | 2019 | | Year over Year – Comparison |
| (in millions, except percentages and number of units) | | |
| Railcar Leasing and Management Services Group | | | | | |
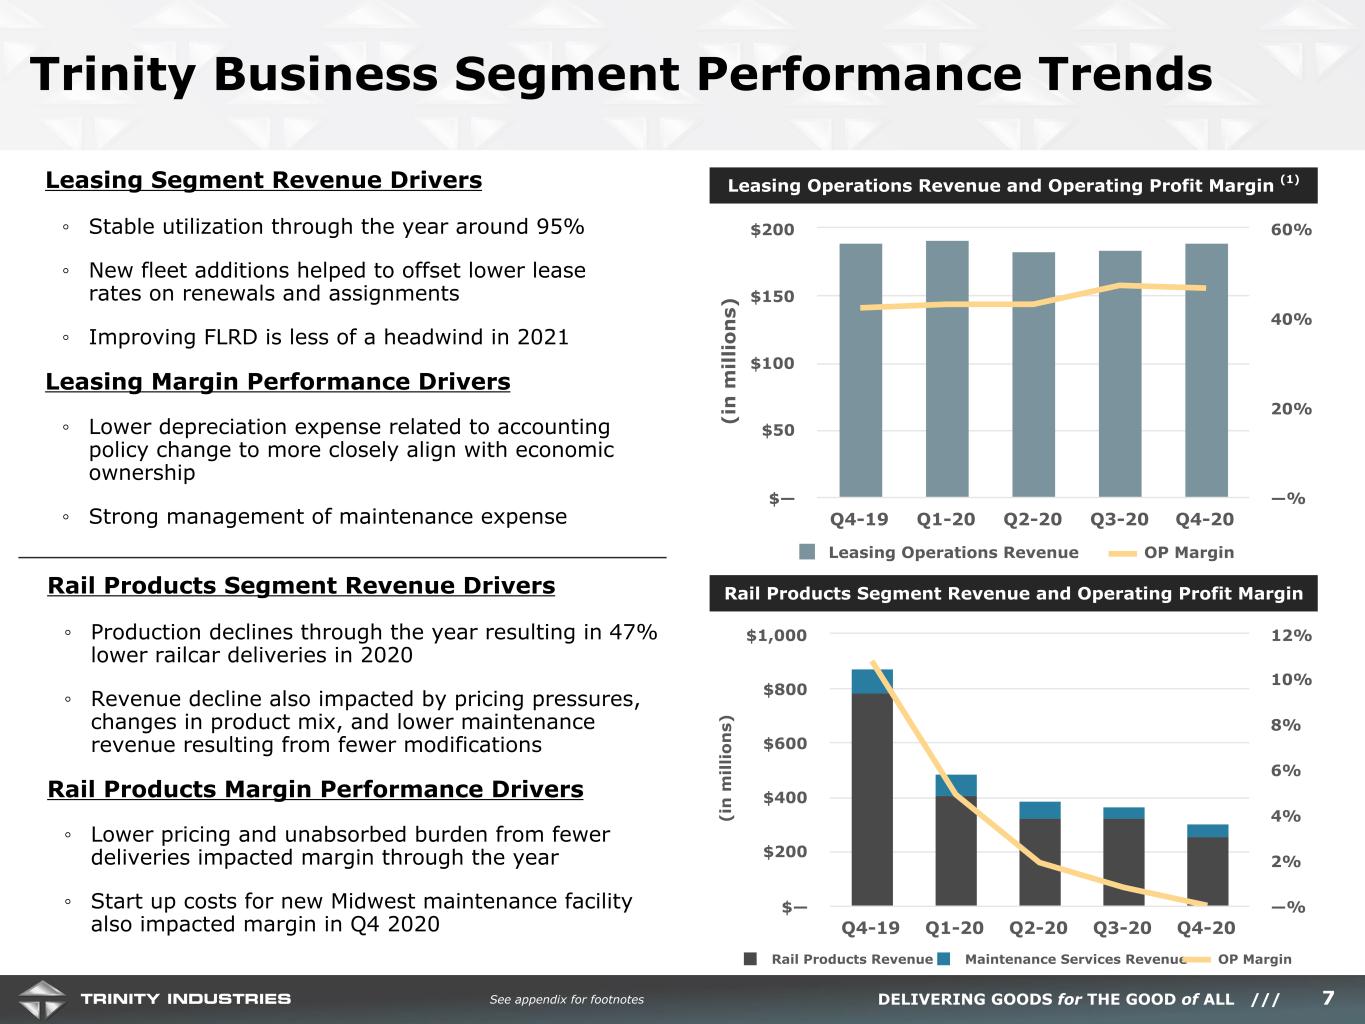
| Leasing and management revenues | $ | 189.3 | | $ | 189.9 | | Lower fleet utilization and lower lease rates on renewals, partially offset by growth in the lease fleet and higher lease rates associated with new railcar additions |
| Leasing and management operating profit | $ | 88.2 | | $ | 80.1 | | Growth in the lease fleet, lower depreciation expense, and reduced operating expenses resulting from fewer maintenance compliance events scheduled during the current period |
| Operating profit on sales of leased railcars | $ | — | | $ | 20.2 | | No railcar sales completed during the quarter |
| Fleet utilization | 94.5 | % | | 96.0 | % | | Primarily driven by decrease in energy-related markets |
Owned lease fleet (in units) (1) | 107,045 | | 103,705 | | |
Investor-owned lease fleet
(in units) | 26,645 | | 24,835 | | Additional sales of leased railcars to third-party fleets managed by the Company |
Future Lease Rate Differential ("FLRD") (2) | (13.6)% | | (12.2)% | | |
| | | | | |
| Rail Products Group | | | | | |
| Revenues | $ | 313.3 | | $ | 899.0 | | Lower deliveries and railcar modification services |
| Operating profit margin | 0.0 | % | | 10.8 | % | | Lower deliveries resulting in additional unabsorbed burden in addition to lower pricing |
| Deliveries (in units) | 2,235 | | 6,880 | | |
| Orders (in units) | 1,170 | | 2,585 | | |
| Order value | $ | 116.7 | | $ | 250.5 | | Lower number of units, competitive pricing, and differences in product mix |
| Backlog value | $ | 1,014.5 | | $ | 1,832.5 | | |
| | | | | |
| All Other Group | | | | | |
| Revenues | $ | 55.9 | | $ | 60.7 | | Decreased demand for highway products |
| Operating profit | $ | 4.3 | | $ | — | | Lower employee-related costs and lower costs associated with our non-operating facilities |
| | | | | |
| December 31, 2020 | | December 31, 2019 | | |
| Loan-to-value ratio: | | | | | |
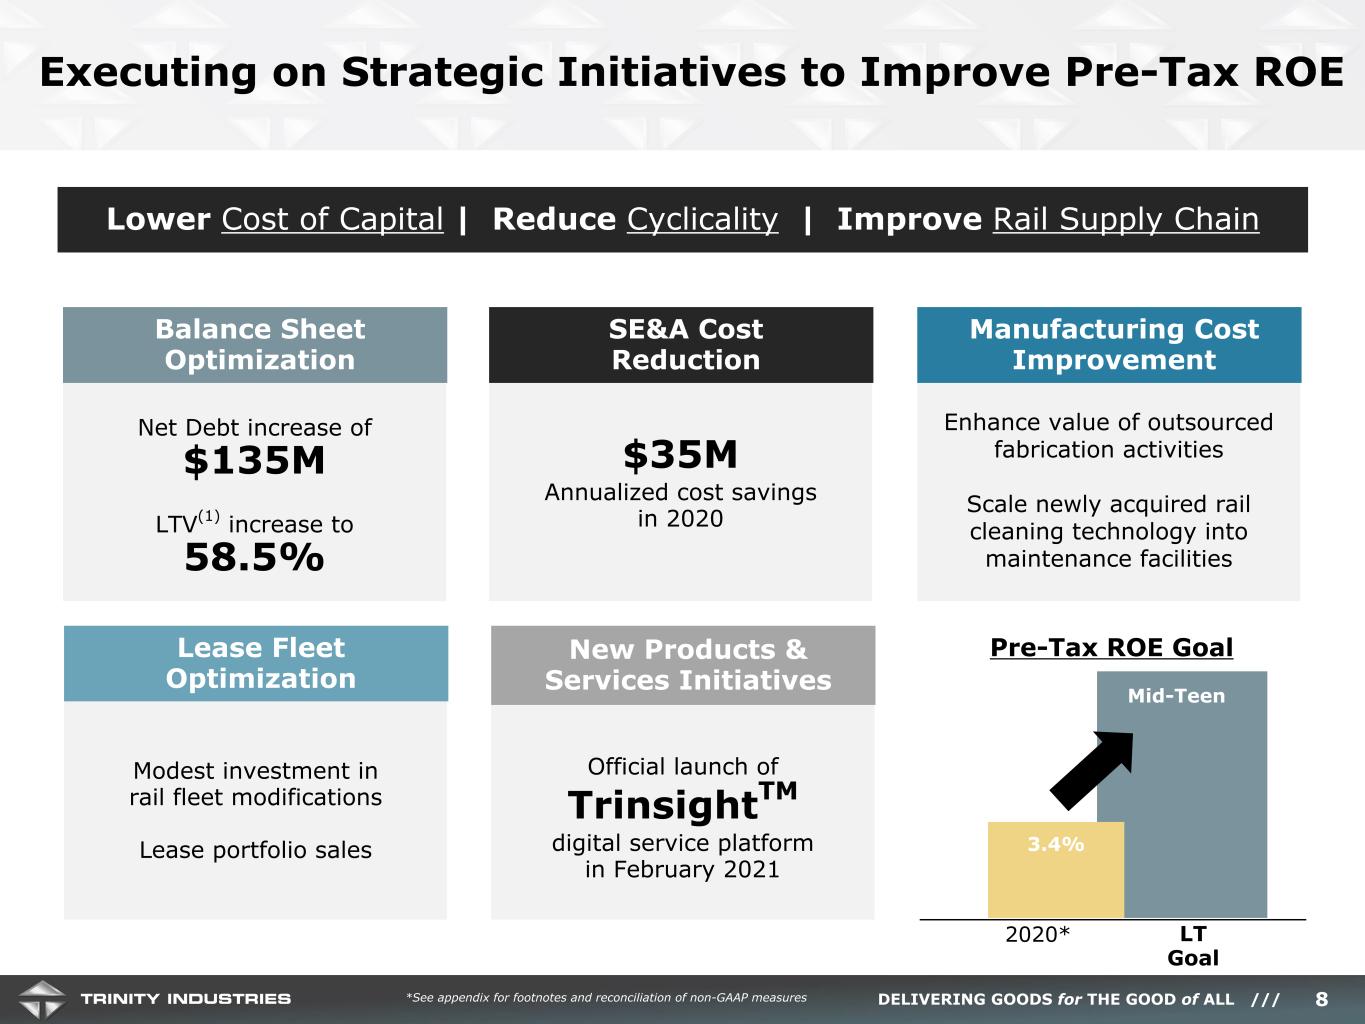
| Wholly-owned subsidiaries, including corporate revolving credit facility | 58.5 | % | | 55.1 | % | | Increased leverage associated with leased assets, partially offset by amortization of debt on encumbered assets |
(1) Includes wholly-owned railcars, partially-owned railcars, and railcars under sale-leaseback arrangements.
(2) Future Lease Rate Differential ("FLRD") calculates the weighted average of the most current quarterly lease rates transacted compared to the weighted average lease rates for railcars expiring over the next twelve months.
Additional Business Items
Income Tax Adjustments
•As a result of the reinstatement of the tax-loss carryback provisions in recent tax legislation, the Company recognized an additional tax benefit in the fourth quarter of $5.8 million, or $0.05 per common diluted share. The associated income tax losses were primarily due to accelerated tax depreciation associated with our investment in the lease fleet.
•The Company’s tax rate was a benefit of 25.0% for the quarter and a benefit of 54.3% for the year. These rates differed from the U.S. statutory rate primarily as a result of the Coronavirus Aid, Relief, and Economic Security Act (the "CARES Act") and state tax adjustments. The tax benefit for the year was partially offset by a portion of the second quarter non-cash impairment charge related to noncontrolling interest for which taxes are not provided.
Pension Plan Termination
•In connection with the Company's previously communicated pension plan termination, the plan was settled in the fourth quarter of 2020 and resulted in the Company no longer having any remaining funded pension plan obligations. Upon settlement, we recognized a pre-tax non-cash pension settlement charge of $151.5 million, which was inclusive of all unamortized losses recorded in Accumulated Other Comprehensive Loss. The surplus of the Pension Plan of $23.6 million will be used, as prescribed in the applicable regulations, to fund obligations associated with the Company's defined contribution profit sharing plan and final pension administrative expenses. We expect that any remaining surplus would be used for other corporate purposes, subject to applicable taxes.
Liquidity and Capital Resource Updates
•In November 2020, Trinity Rail Leasing 2020 LLC (“TRL-2020”), a wholly-owned subsidiary of Company, issued $370.8 million of Secured Railcar Equipment Notes. These notes bear interest at an all-in interest rate of 2.52% and have a stated final maturity date of 2050. Net proceeds received from the transaction were used to repay borrowings under our leasing secured warehouse credit facility, to redeem in full secured notes issued by TRIHC 2018 LLC, and for general corporate purposes.
•The Company's income tax receivable at the end of the fourth quarter was $446 million.
•Subsequent to quarter end, Trinity's leasing company announced its Green Financing Framework supported by a second-party opinion from Sustainalytics, a Morningstar company.
Cost Optimization and Operating Footprint Rationalization
•In connection with the Company's ongoing assessment of future needs to support our rail-focused strategy and to optimize the performance of the business, the Company recognized pre-tax restructuring charges totaling $11.0 million for the year. These charges were primarily from employee transition costs and the write-down of our corporate headquarters campus, partially offset by a net gain on the disposition of a non-operating facility and certain related assets.
•During the fourth quarter, management approved a plan to exit certain non-strategic maintenance facilities, resulting in a pre-tax non-cash asset write-down of $15.2 million. Additionally, during the quarter, we recorded a pre-tax non-cash charge to write off $11.8 million related to our investments in certain emerging technologies. These charges are reflected in the impairment of long-lived assets line of our Consolidated Statements of Operations for the three months and year ended December 31, 2020.
Conference Call
Trinity will hold a conference call at 8:30 a.m. Eastern on February 24, 2021 to discuss its fourth quarter results. To listen to the call, please visit the Investor Relations section of the Company's website at www.trin.net and access the Events & Presentations webpage, or the live call can be accessed at 1-888-317-6003 with the conference passcode "9858917". Please call at least 10 minutes in advance to ensure a timely connection. An audio replay may be accessed through the Company’s website or by dialing 1-877-344-7529 with passcode "10151360" until 11:59 p.m. Eastern on March 3, 2021.
Additionally, the Company will provide Supplemental Materials to accompany the earnings conference call. The materials will be accessible both within the webcast and on Trinity's Investor Relations website under the Events and Presentations portion of the site along with the Fourth Quarter Earnings Call event weblink.
Non-GAAP Financial Measures
We have included financial measures compiled in accordance with generally accepted accounting principles ("GAAP") and certain non-GAAP measures in this earnings press release to provide management and investors with additional information regarding our financial results. Non-GAAP measures should not be considered in isolation or as a substitute for our reporting results prepared in accordance with GAAP and, as calculated, may not be comparable to other similarly titled measures for other companies. For each non-GAAP financial measure, a reconciliation to the most comparable GAAP measure has been included in the accompanying tables. When forward-looking non-GAAP measures are provided, quantitative reconciliations to the most directly comparable GAAP measures are not provided because management cannot, without unreasonable effort, predict the timing and amounts of certain items included in the computations of each of these measures. These factors include, but are not limited to: the product mix of expected railcar deliveries; the timing and amount of significant transactions and investments, such as railcar sales from the lease fleet, capital expenditures, and returns of capital to shareholders; and the amount and timing of certain other items outside the normal course of our core business operations, such as restructuring activities and the potential financial and operational impacts of the COVID-19 pandemic.
About Trinity Industries
Trinity Industries, Inc., headquartered in Dallas, Texas, owns businesses that are leading providers of rail transportation products and services in North America. Our rail-related businesses market their railcar products and services under the trade name TrinityRail®. The TrinityRail platform provides railcar leasing and management services, as well as railcar manufacturing, maintenance and modifications. Trinity also owns businesses engaged in the manufacture of products used on the nation’s roadways and in traffic control. Trinity reports its financial results in three principal business segments: the Railcar Leasing and Management Services Group, the Rail Products Group, and the All Other Group. For more information, visit: www.trin.net.
Some statements in this release, which are not historical facts, are “forward-looking statements” as defined by the Private Securities Litigation Reform Act of 1995. Forward-looking statements include statements about Trinity's estimates, expectations, beliefs, intentions or strategies for the future, and the assumptions underlying these forward-looking statements, including, but not limited to, future financial and operating performance, future opportunities and any other statements regarding events or developments that Trinity believes or anticipates will or may occur in the future, including the potential financial and operational impacts of the COVID-19 pandemic. Trinity uses the words “anticipates,” “assumes,” “believes,” “estimates,” “expects,” “intends,” “forecasts,” “may,” “will,” “should,” “guidance,” “projected,” “outlook,” and similar expressions to identify these forward-looking statements. Forward-looking statements speak only as of the date of this release, and Trinity expressly disclaims any obligation or undertaking to disseminate any updates or revisions to any forward-looking statement contained herein to reflect any change in Trinity’s expectations with regard thereto or any change in events, conditions or circumstances on which any such statement is based, except as required by federal securities laws. Forward-looking statements involve risks and uncertainties that could cause actual results to differ materially from historical experience or our present expectations, including but not limited to risks and uncertainties regarding economic, competitive, governmental, and technological factors affecting Trinity’s operations, markets, products, services and prices, and such forward-looking statements are not guarantees of future performance. For a discussion of such risks and uncertainties, which could cause actual results to differ from those contained in the forward-looking statements, see “Risk Factors” and “Forward-Looking Statements” in Trinity’s Annual Report on Form 10-K for the most recent fiscal year, as may be revised and updated by Trinity’s Quarterly Reports on Form 10-Q, and Trinity’s Current Reports on Form 8-K.
| | |
| Investor Contact: |
| Jessica L. Greiner |
| Vice President, Investor Relations and Communications |
| Trinity Industries, Inc. |
| (Investors) 214/631-4420 |
|
| Media Contact: |
| Jack L. Todd |
| Vice President, Public Affairs |
| Trinity Industries, Inc. |
| (Media Line) 214/589-8909 |
- TABLES TO FOLLOW -
Trinity Industries, Inc.
Condensed Consolidated Statements of Operations
(in millions, except per share amounts)
(unaudited)
| | | | | | | | | | | | | | | | | | | | | | | |
| Three Months Ended
December 31, | | Year Ended
December 31, |
| 2020 | | 2019 | | 2020 | | 2019 |
| Revenues | $ | 415.6 | | | $ | 850.7 | | | $ | 1,999.4 | | | $ | 3,005.1 | |
| Operating costs: | | | | | | | |
| Cost of revenues | 295.3 | | | 674.7 | | | 1,508.4 | | | 2,365.7 | |
| Selling, engineering, and administrative expenses | 56.1 | | | 71.3 | | | 228.4 | | | 262.8 | |
| Gains (losses) on dispositions of property: | | | | | | | |
| Net gains on railcar lease fleet sales owned more than one year at the time of sale | — | | | 5.8 | | | 17.3 | | | 50.5 | |
| Other | 0.2 | | | 1.4 | | | 3.0 | | | 3.9 | |
| Impairment of long-lived assets | 27.0 | | | — | | | 396.4 | | | — | |
| Restructuring activities, net | 0.5 | | | 14.7 | | | 11.0 | | | 14.7 | |
| 378.7 | | | 753.5 | | | 2,123.9 | | | 2,588.8 | |
| Operating profit (loss) | 36.9 | | | 97.2 | | | (124.5) | | | 416.3 | |
| Interest expense, net | 52.4 | | | 53.7 | | | 216.0 | | | 214.5 | |
| Pension plan settlement | 151.5 | | | — | | | 151.5 | | | — | |
| Other, net | 2.0 | | | 0.9 | | | 2.5 | | | 1.1 | |
| Income (loss) from continuing operations before income taxes | (169.0) | | | 42.6 | | | (494.5) | | | 200.7 | |
| Provision (benefit) for income taxes: | | | | | | | |
| Current | (23.3) | | | 4.0 | | | (494.5) | | | 6.7 | |
| Deferred | (19.0) | | | 16.3 | | | 226.1 | | | 54.8 | |
| (42.3) | | | 20.3 | | | (268.4) | | | 61.5 | |
| Income (loss) from continuing operations | (126.7) | | | 22.3 | | | (226.1) | | | 139.2 | |
| Income (loss) from discontinued operations, net of income taxes | 0.1 | | | (0.8) | | | (0.1) | | | (3.1) | |
| Net income (loss) | (126.6) | | | 21.5 | | | (226.2) | | | 136.1 | |
| Net income (loss) attributable to noncontrolling interest | 0.6 | | | (0.1) | | | (78.9) | | | (1.5) | |
| Net income (loss) attributable to Trinity Industries, Inc. | $ | (127.2) | | | $ | 21.6 | | | $ | (147.3) | | | $ | 137.6 | |
| | | | | | | |
| Basic earnings per common share: | | | | | | | |
| Income (loss) from continuing operations | $ | (1.13) | | | $ | 0.18 | | | $ | (1.27) | | | $ | 1.11 | |
| Income (loss) from discontinued operations | — | | | (0.01) | | | — | | | (0.02) | |
| Basic net income (loss) attributable to Trinity Industries, Inc. | $ | (1.13) | | | $ | 0.17 | | | $ | (1.27) | | | $ | 1.09 | |
| Diluted earnings per common share: | | | | | | | |
| Income (loss) from continuing operations | $ | (1.13) | | | $ | 0.18 | | | $ | (1.27) | | | $ | 1.09 | |
| Income (loss) from discontinued operations | — | | | (0.01) | | | — | | | (0.02) | |
| Diluted net income (loss) attributable to Trinity Industries, Inc. | $ | (1.13) | | | $ | 0.17 | | | $ | (1.27) | | | $ | 1.07 | |
| Weighted average number of shares outstanding: | | | | | | | |
| Basic | 112.2 | | | 119.8 | | | 115.9 | | | 125.6 | |
| Diluted | 112.2 | | | 121.5 | | | 115.9 | | | 127.3 | |
Trinity is required to utilize the two-class method of calculating EPS as a result of unvested restricted shares that have non-forfeitable rights to dividends and are, therefore, considered to be participating securities. The calculation of EPS using the two-class method excludes income attributable to these participating securities from the numerator and excludes the dilutive impact of those shares from the denominator; therefore, the two-class method may result in a lower EPS than is calculated from the face of the income statement. There were no restricted shares and stock options included in the computation of diluted EPS for the three months and year ended December 31, 2020 as we incurred a loss for these periods, and any effect on loss per common share would have been antidilutive.
Trinity Industries, Inc.
Condensed Segment Data
(in millions)
(unaudited)
| | | | | | | | | | | | | | | | | | | | | | | |
| Three Months Ended
December 31, | | Year Ended
December 31, |
| Revenues: | 2020 | | 2019 | | 2020 | | 2019 |
| Railcar Leasing and Management Services Group | $ | 189.3 | | | $ | 313.3 | | | $ | 802.3 | | | $ | 1,117.2 | |
| Rail Products Group | 313.3 | | | 899.0 | | | 1,609.5 | | | 2,974.8 | |
| All Other | 55.9 | | | 60.7 | | | 251.2 | | | 261.0 | |
| Segment Totals before Eliminations | 558.5 | | | 1,273.0 | | | 2,663.0 | | | 4,353.0 | |
| Eliminations – Lease Subsidiary | (140.5) | | | (418.1) | | | (652.9) | | | (1,331.1) | |
| Eliminations – Other | (2.4) | | | (4.2) | | | (10.7) | | | (16.8) | |
| Consolidated Total | $ | 415.6 | | | $ | 850.7 | | | $ | 1,999.4 | | | $ | 3,005.1 | |
| | | | | | | |
| Three Months Ended
December 31, | | Year Ended
December 31, |
| Operating profit (loss): | 2020 | | 2019 | | 2020 | | 2019 |
| Railcar Leasing and Management Services Group | $ | 88.2 | | | $ | 100.3 | | | $ | 353.7 | | | $ | 406.6 | |
| Rail Products Group | 0.1 | | | 96.8 | | | 36.3 | | | 277.6 | |
| All Other | 4.3 | | | — | | | 28.2 | | | 19.9 | |
| Segment Totals before Eliminations, Corporate Expenses, Impairment of long-lived assets, and Restructuring activities | 92.6 | | | 197.1 | | | 418.2 | | | 704.1 | |
| Corporate | (24.4) | | | (29.9) | | | (97.7) | | | (108.0) | |
| Impairment of long-lived assets | (27.0) | | | — | | | (396.4) | | | — | |
| Restructuring activities, net | (0.5) | | | (14.7) | | | (11.0) | | | (14.7) | |
| Eliminations – Lease Subsidiary | (1.7) | | | (55.2) | | | (35.2) | | | (164.7) | |
| Eliminations – Other | (2.1) | | | (0.1) | | | (2.4) | | | (0.4) | |
| Consolidated Total | $ | 36.9 | | | $ | 97.2 | | | $ | (124.5) | | | $ | 416.3 | |
Trinity Industries, Inc.
Selected Financial Information – Leasing Group
($ in millions)
(unaudited)
| | | | | | | | | | | | | | | | | | | | | | | |
| Three Months Ended
December 31, | | Year Ended
December 31, |
| | 2020 | | 2019 | | 2020 | | 2019 |
| Revenues: | | | | | | | |
| Leasing and management | $ | 189.3 | | | $ | 189.9 | | | $ | 747.9 | | | $ | 756.5 | |
Sales of railcars owned one year or less at the time of sale (1)(2) | — | | | 123.4 | | | 54.4 | | | 360.7 | |
| Total revenues | $ | 189.3 | | | $ | 313.3 | | | $ | 802.3 | | | $ | 1,117.2 | |
Operating profit (3): | | | | | | | |
| Leasing and management | $ | 88.2 | | | $ | 80.1 | | | $ | 336.0 | | | $ | 314.7 | |
Railcars sales (1): | | | | | | | |
| Railcars owned one year or less at the time of sale | — | | | 14.4 | | | 0.4 | | | 41.4 | |
| Railcars owned more than one year at the time of sale | — | | | 5.8 | | | 17.3 | | | 50.5 | |
| | | | | | | |
| Total operating profit | $ | 88.2 | | | $ | 100.3 | | | $ | 353.7 | | | $ | 406.6 | |
| Total operating profit margin | 46.6 | % | | 32.0 | % | | 44.1 | % | | 36.4 | % |
| | | | | | | |
| Leasing and management operating profit margin | 46.6 | % | | 42.2 | % | | 44.9 | % | | 41.6 | % |
| | | | | | | |
| Selected expense information: | | | | | | | |
Depreciation (4)(5) | $ | 55.6 | | | $ | 60.6 | | | $ | 214.7 | | | $ | 232.2 | |
| Maintenance and compliance | $ | 20.7 | | | $ | 22.9 | | | $ | 88.1 | | | $ | 102.1 | |
| Rent | $ | 1.6 | | | $ | 3.3 | | | $ | 9.7 | | | $ | 16.9 | |
| Selling, engineering, and administrative expenses | $ | 12.3 | | | $ | 13.3 | | | $ | 51.3 | | | $ | 49.5 | |
| Interest | $ | 47.0 | | | $ | 50.8 | | | $ | 196.2 | | | $ | 197.2 | |
| | | | | | | | | | | | | | | | | | | | | | | |
| Three Months Ended
December 31, | | Year Ended
December 31, |
| 2020 | | 2019 | | 2020 | | 2019 |
| (in millions) |
| Sales of leased railcars: | | | | | | | |
Railcars owned one year or less at the time of sale (1)(2) | $ | — | | | $ | 123.4 | | | $ | 54.4 | | | $ | 360.7 | |
| Railcars owned more than one year at the time of sale | — | | | 30.7 | | | 138.7 | | | 205.7 | |
| $ | — | | | $ | 154.1 | | | $ | 193.1 | | | $ | 566.4 | |
| | | | | | | |
| Operating profit on sales of leased railcars: | | | | | | | |
| Railcars owned one year or less at the time of sale | $ | — | | | $ | 14.4 | | | $ | 0.4 | | | $ | 41.4 | |
| Railcars owned more than one year at the time of sale | — | | | 5.8 | | | 17.3 | | | 50.5 | |
| $ | — | | | $ | 20.2 | | | $ | 17.7 | | | $ | 91.9 | |
| | | | | | | |
| Operating profit margin on sales of leased railcars: | | | | | | | |
| Railcars owned one year or less at the time of sale | — | % | | 11.7 | % | | 0.7 | % | | 11.5 | % |
| Railcars owned more than one year at the time of sale | — | % | | 18.9 | % | | 12.5 | % | | 24.6 | % |
Weighted average operating profit margin on sales of leased railcars | — | % | | 13.1 | % | | 9.2 | % | | 16.2 | % |
(1) Beginning in the fourth quarter of 2020, we made a prospective change to the presentation of railcar sales and will now present all sales of railcars from the lease fleet as a net gain or loss from the disposal of a long-term asset. Historically, we presented sales of railcars from the lease fleet on a gross basis in leasing revenues and cost of revenues if the railcars had been owned for one year or less at the time of sale. Sales of railcars from the lease fleet owned for more than one year had historically been presented as a net gain or loss from the disposal of a long-term asset.
(2) Includes revenues associated with sales-type leases of $100.0 million and $160.5 million for the three months and year ended December 31, 2019, respectively.
(3) Operating profit includes: depreciation; maintenance and compliance; rent; and selling, engineering, and administrative expenses. Amortization of deferred profit on railcars sold from the Rail Products Group to the Leasing Group is included in the operating profit of the Leasing Group, resulting in the recognition of depreciation expense based on the Company's original manufacturing cost of the railcars. Interest expense is not a component of operating profit and includes the effect of hedges.
(4) Effective January 1, 2020, we revised the estimated useful lives and salvage values of certain railcar types in our lease fleet. This change in estimate resulted in a decrease in depreciation expense in the three months and year ended December 31, 2020 of approximately $7.7 million and $30.8 million, respectively. This decrease was partially offset by higher depreciation associated with growth in the lease fleet.
(5) As a result of the impairment of long-lived assets related to our small cube covered hopper railcars recorded in the second quarter of 2020, our quarterly depreciation expense beginning in the third quarter of 2020 has decreased by approximately $3.5 million, for a total reduction of $7.0 million for the year ended December 31, 2020.
Trinity Industries, Inc.
Condensed Consolidated Balance Sheets
(in millions)
(unaudited)
| | | | | | | | | | | |
| December 31, 2020 | | December 31, 2019 |
| ASSETS | | | |
| Cash and cash equivalents | $ | 132.0 | | | $ | 166.2 | |
| | | |
| Receivables, net of allowance | 199.0 | | | 260.1 | |
| Income tax receivable | 445.8 | | | 14.7 | |
| Inventories | 321.2 | | | 433.4 | |
| Restricted cash | 96.4 | | | 111.4 | |
| Property, plant, and equipment, net | 7,003.4 | | | 7,110.6 | |
| Goodwill | 208.8 | | | 208.8 | |
| | | |
| Other assets | 295.2 | | | 396.2 | |
| Total assets | $ | 8,701.8 | | | $ | 8,701.4 | |
| | | |
| LIABILITIES AND STOCKHOLDERS' EQUITY | | | |
| Accounts payable | $ | 156.4 | | | $ | 203.9 | |
| Accrued liabilities | 314.7 | | | 342.1 | |
| Debt | 5,017.0 | | | 4,881.9 | |
| | | |
| Deferred income taxes | 1,047.5 | | | 798.3 | |
| | | |
| Other liabilities | 150.2 | | | 96.3 | |
| Stockholders' equity: | | | |
| Trinity Industries, Inc. | 1,738.8 | | | 2,030.1 | |
| Noncontrolling interest | 277.2 | | | 348.8 | |
| 2,016.0 | | | 2,378.9 | |
| Total liabilities and stockholders' equity | $ | 8,701.8 | | | $ | 8,701.4 | |
Trinity Industries, Inc.
Additional Balance Sheet Information
(in millions)
(unaudited)
| | | | | | | | | | | |
| December 31, 2020 | | December 31, 2019 |
| Property, Plant, and Equipment | | | |
| Manufacturing/Corporate: | | | |
| Property, plant, and equipment | $ | 979.4 | | | $ | 1,040.4 | |
| Accumulated depreciation | (577.9) | | | (631.6) | |
| 401.5 | | | 408.8 | |
| Leasing: | | | |
| Wholly-owned subsidiaries: | | | |
| Machinery and other | 19.5 | | | 13.7 | |
| Equipment on lease | 7,010.6 | | | 6,944.2 | |
| Accumulated depreciation | (1,234.2) | | | (1,139.0) | |
| 5,795.9 | | | 5,818.9 | |
| Partially-owned subsidiaries: | | | |
| Equipment on lease | 2,248.2 | | | 2,410.0 | |
| Accumulated depreciation | (621.9) | | | (623.3) | |
| 1,626.3 | | | 1,786.7 | |
| | | |
| Deferred profit on railcars sold to the Leasing Group | (1,064.7) | | | (1,135.8) | |
| Accumulated amortization | 244.4 | | | 232.0 | |
| (820.3) | | | (903.8) | |
| $ | 7,003.4 | | | $ | 7,110.6 | |
| | | | | | | | | | | |
| December 31, 2020 | | December 31, 2019 |
| Debt | | | |
| Corporate – Recourse: | | | |
| Revolving credit facility | $ | 50.0 | | | $ | 125.0 | |
Senior notes, net of unamortized discount of $0.2 and $0.2 | 399.8 | | | 399.8 | |
| 449.8 | | | 524.8 | |
| Less: unamortized debt issuance costs | (1.6) | | | (2.0) | |
| Total recourse debt | 448.2 | | | 522.8 | |
| | | |
| Leasing – Non-recourse: | | | |
| Wholly-owned subsidiaries: | | | |
Secured railcar equipment notes, net of unamortized discount of $0.6 and $2.0 | 2,042.4 | | | 2,124.1 | |
2017 promissory notes, net of unamortized discount of $10.1 and $— | 802.7 | | | 627.1 | |
| TILC warehouse facility | 519.4 | | | 353.4 | |
| 3,364.5 | | | 3,104.6 | |
| Less: unamortized debt issuance costs | (24.0) | | | (23.9) | |
| 3,340.5 | | | 3,080.7 | |
| Partially-owned subsidiaries: | | | |
| Secured railcar equipment notes | 1,237.5 | | | 1,289.3 | |
| Less: unamortized debt issuance costs | (9.2) | | | (10.9) | |
| 1,228.3 | | | 1,278.4 | |
| Total non–recourse debt | 4,568.8 | | | 4,359.1 | |
| Total debt | $ | 5,017.0 | | | $ | 4,881.9 | |
Trinity Industries, Inc.
Condensed Consolidated Statements of Cash Flows
(in millions)
(unaudited)
| | | | | | | | | | | |
| Year Ended
December 31, |
| 2020 | | 2019 |
| Operating activities: | | | |
| Net cash provided by operating activities – continuing operations | $ | 651.8 | | | $ | 396.7 | |
| Net cash used in operating activities – discontinued operations | (0.1) | | | (3.1) | |
| Net cash provided by operating activities | 651.7 | | | 393.6 | |
| | | |
| Investing activities: | | | |
| Proceeds from railcar lease fleet sales owned more than one year at the time of sale | 138.7 | | | 205.7 | |
| Proceeds from dispositions of property and other assets | 32.9 | | | 20.2 | |
Capital expenditures – leasing, net of sold lease fleet railcars owned one year or less with a net cost of $54.0 and $319.3 | (602.2) | | | (1,122.2) | |
| Capital expenditures – manufacturing and other | (102.3) | | | (97.0) | |
| | | |
| | | |
| | | |
| | | |
| Net cash used in investing activities | (532.9) | | | (993.3) | |
| | | |
| Financing activities: | | | |
| Net (repayments of) proceeds from debt | 118.5 | | | 843.7 | |
| Shares repurchased | (191.3) | | | (224.7) | |
| Dividends paid to common shareholders | (91.7) | | | (82.1) | |
| Other | (3.5) | | | (10.4) | |
| | | |
| | | |
| Net cash provided by (used in) financing activities | (168.0) | | | 526.5 | |
| Net decrease in cash, cash equivalents, and restricted cash | (49.2) | | | (73.2) | |
| Cash, cash equivalents, and restricted cash at beginning of period | 277.6 | | | 350.8 | |
| Cash, cash equivalents, and restricted cash at end of period | $ | 228.4 | | | $ | 277.6 | |
Trinity Industries, Inc.
Reconciliations of Non-GAAP Measures
(in millions, except per share amounts)
(unaudited)
Adjusted Operating Results
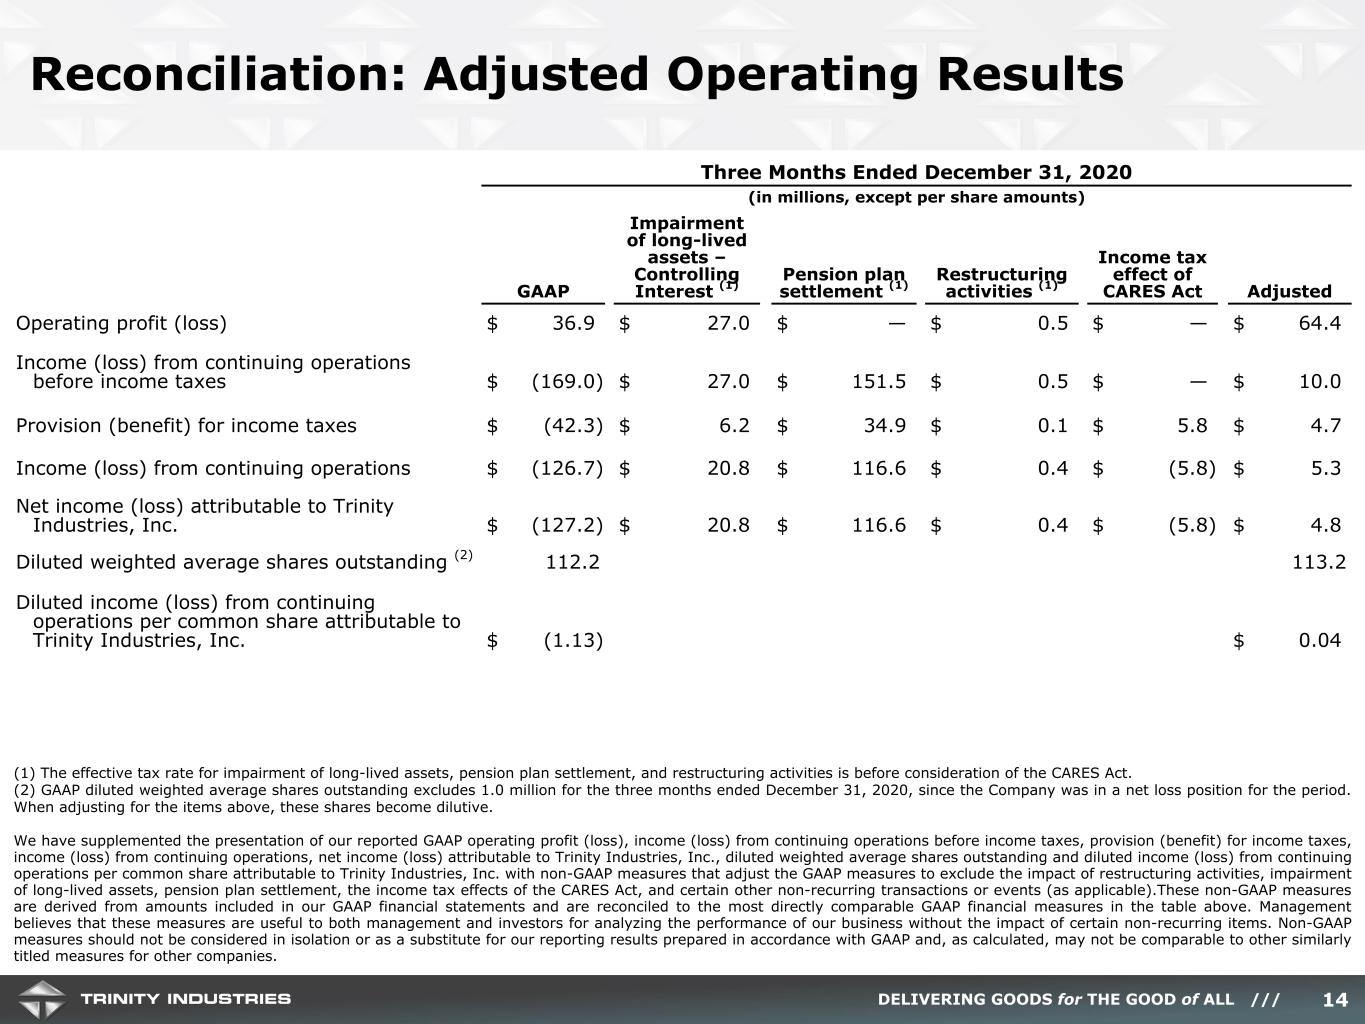
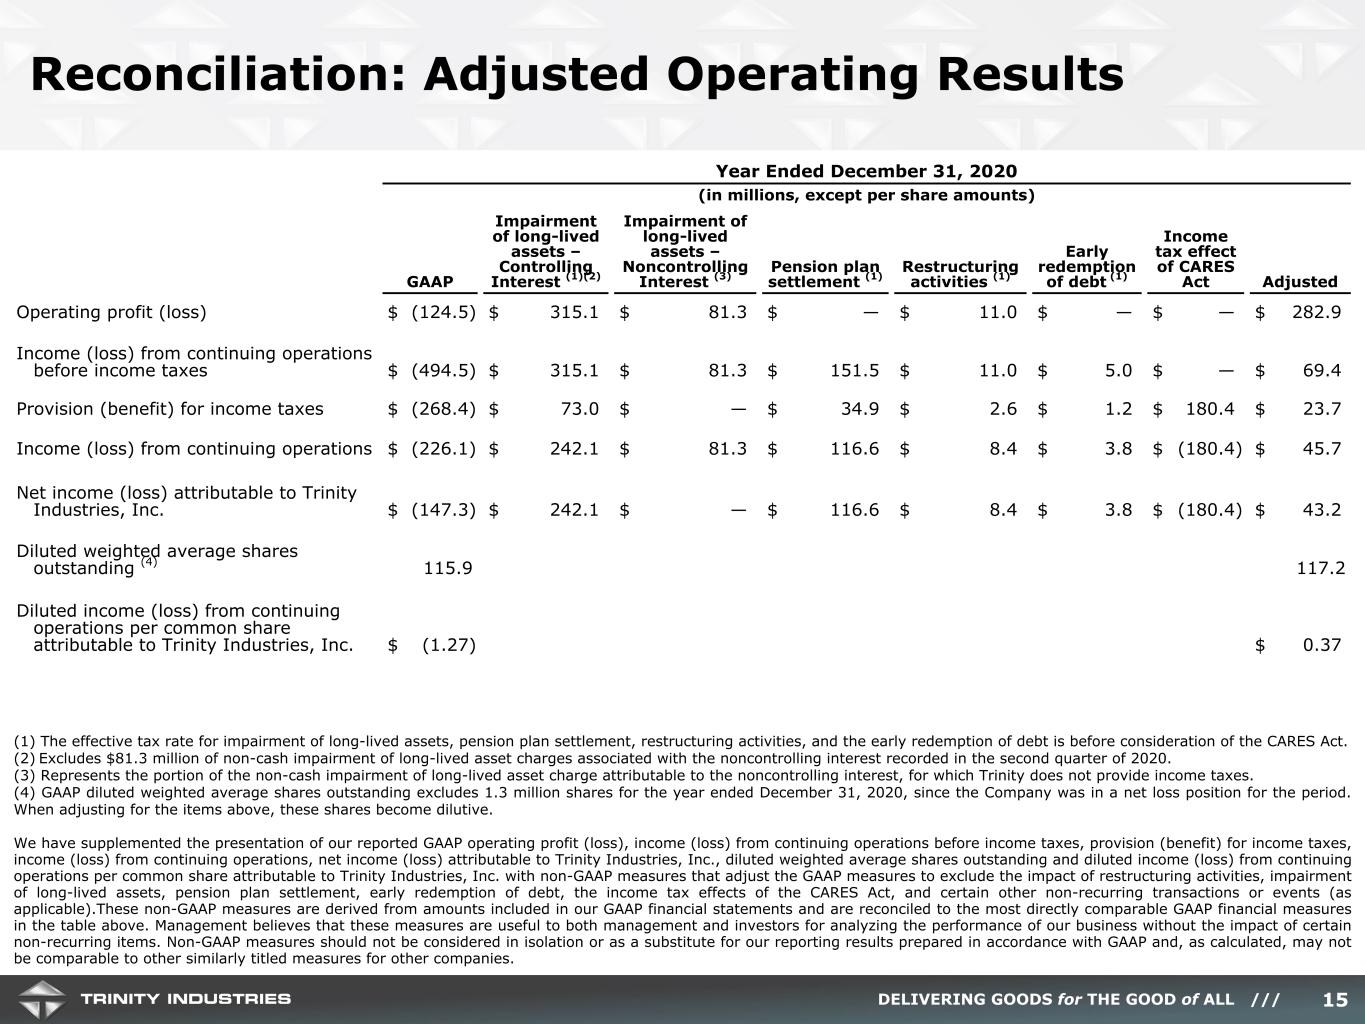
We have supplemented the presentation of our reported GAAP operating profit (loss), income (loss) from continuing operations before income taxes, provision (benefit) for income taxes, income (loss) from continuing operations, net income (loss) attributable to Trinity Industries, Inc., diluted weighted average shares outstanding and diluted income (loss) from continuing operations per common share attributable to Trinity Industries, Inc. with non-GAAP measures that adjust the GAAP measures to exclude the impact of restructuring activities, impairment of long-lived assets, pension plan settlement, early redemption of debt, the income tax effects of the CARES Act, the effects on income tax expense of a one-time, non-cash, deferred tax impact related to our planned Maintenance Services expansion into a new Midwest facility, and certain other non-recurring transactions or events (as applicable). These non-GAAP measures are derived from amounts included in our GAAP financial statements and are reconciled to the most directly comparable GAAP financial measures in the tables below. Management believes that these measures are useful to both management and investors for analyzing the performance of our business without the impact of certain non-recurring items. Non-GAAP measures should not be considered in isolation or as a substitute for our reporting results prepared in accordance with GAAP and, as calculated, may not be comparable to other similarly titled measures for other companies.
| | | | | | | | | | | | | | | | | | | | | | | | | | | | | | | | | | | |
| Three Months Ended December 31, 2020 |
| GAAP | | Impairment of long-lived assets – Controlling Interest (1) | | Pension plan settlement (1) | | Restructuring activities (1) | | Income tax effect of CARES Act | | Adjusted |
| Operating profit (loss) | $ | 36.9 | | | $ | 27.0 | | | $ | — | | | $ | 0.5 | | | $ | — | | | $ | 64.4 | |
| | | | | | | | | | | |
| | | | | | | | | | | |
| | | | | | | | | | | |
| Income (loss) from continuing operations before income taxes | $ | (169.0) | | | $ | 27.0 | | | $ | 151.5 | | | $ | 0.5 | | | $ | — | | | $ | 10.0 | |
| | | | | | | | | | | |
| Provision (benefit) for income taxes | $ | (42.3) | | | $ | 6.2 | | | $ | 34.9 | | | $ | 0.1 | | | $ | 5.8 | | | $ | 4.7 | |
| | | | | | | | | | | |
| Income (loss) from continuing operations | $ | (126.7) | | | $ | 20.8 | | | $ | 116.6 | | | $ | 0.4 | | | $ | (5.8) | | | $ | 5.3 | |
| | | | | | | | | | | |
| Net income (loss) attributable to Trinity Industries, Inc. | $ | (127.2) | | | $ | 20.8 | | | $ | 116.6 | | | $ | 0.4 | | | $ | (5.8) | | | $ | 4.8 | |
| | | | | | | | | | | |
Diluted weighted average shares outstanding (4) | 112.2 | | | | | | | | | | 113.2 |
| | | | | | | | | | | |
Diluted income (loss) from continuing operations per common share attributable to Trinity Industries, Inc. | $ | (1.13) | | | | | | | | | | | $ | 0.04 | |
| | | | | | | | | | | | | | | | | | | | | | | | | | | | | | | | | | | | | | | | | | | | | | | |
| Year Ended December 31, 2020 |
| GAAP | | Impairment of long-lived assets – Controlling Interest (1)(2) | | Impairment of long-lived assets – Noncontrolling Interest (3) | | Pension plan settlement (1) | | Restructuring activities (1) | | Early redemption of debt (1) | | Income tax effect of CARES Act | | Adjusted |
| Operating profit (loss) | $ | (124.5) | | | $ | 315.1 | | | $ | 81.3 | | | $ | — | | | $ | 11.0 | | | $ | — | | | $ | — | | | $ | 282.9 | |
| | | | | | | | | | | | | | | |
| | | | | | | | | | | | | | | |
| | | | | | | | | | | | | | | |
| | | | | | | | | | | | | | | |
| | | | | | | | | | | | | | | |
| Income (loss) from continuing operations before income taxes | $ | (494.5) | | | $ | 315.1 | | | $ | 81.3 | | | $ | 151.5 | | | $ | 11.0 | | | $ | 5.0 | | | $ | — | | | $ | 69.4 | |
| | | | | | | | | | | | | | | |
| Provision (benefit) for income taxes | $ | (268.4) | | | $ | 73.0 | | | $ | — | | | $ | 34.9 | | | $ | 2.6 | | | $ | 1.2 | | | $ | 180.4 | | | $ | 23.7 | |
| | | | | | | | | | | | | | | |
| Income (loss) from continuing operations | $ | (226.1) | | | $ | 242.1 | | | $ | 81.3 | | | $ | 116.6 | | | $ | 8.4 | | | $ | 3.8 | | | $ | (180.4) | | | $ | 45.7 | |
| | | | | | | | | | | | | | | |
| Net income (loss) attributable to Trinity Industries, Inc. | $ | (147.3) | | | $ | 242.1 | | | $ | — | | | $ | 116.6 | | | $ | 8.4 | | | $ | 3.8 | | | $ | (180.4) | | | $ | 43.2 | |
| | | | | | | | | | | | | | | |
Diluted weighted average shares outstanding (4) | 115.9 | | | | | | | | | | | | | | 117.2 |
| | | | | | | | | | | | | | | |
Diluted income (loss) from continuing operations per common share attributable to Trinity Industries, Inc. | $ | (1.27) | | | | | | | | | | | | | | | $ | 0.37 | |
(1) The effective tax rate for impairment of long-lived assets, pension plan settlement, restructuring activities, and the early redemption of debt is before consideration of the CARES Act.
(2) Excludes $81.3 million of non-cash impairment of long-lived asset charges associated with the noncontrolling interest recorded in the second quarter of 2020.
(3) Represents the portion of the non-cash impairment of long-lived asset charge attributable to the noncontrolling interest, for which Trinity does not provide income taxes.
(4) GAAP diluted weighted average shares outstanding excludes 1.0 million and 1.3 million shares for the three months and year ended December 31, 2020, respectively, since the Company was in a net loss position for these periods. When adjusting for the items above, these shares become dilutive.
| | | | | | | | | | | | | | | | | | | | | | | |
| Three Months Ended December 31, 2019 |
| GAAP | | Restructuring activities | | Income tax | | Adjusted |
| Operating profit (loss) | $ | 97.2 | | | $ | 14.7 | | | $ | — | | | $ | 111.9 | |
| | | | | | | |
| Income (loss) from continuing operations before income taxes | $ | 42.6 | | | $ | 14.7 | | | $ | — | | | $ | 57.3 | |
| | | | | | | |
| Provision (benefit) for income taxes | $ | 20.3 | | | $ | 3.3 | | | $ | (9.7) | | | $ | 13.9 | |
| | | | | | | |
| Income (loss) from continuing operations | $ | 22.3 | | | $ | 11.4 | | | $ | 9.7 | | | $ | 43.4 | |
| | | | | | | |
| Net income (loss) attributable to Trinity Industries, Inc. | $ | 21.6 | | | $ | 11.4 | | | $ | 9.7 | | | $ | 42.7 | |
| | | | | | | |
| Diluted weighted average shares outstanding | 121.5 | | | | | | 121.5 |
| | | | | | | |
Diluted income (loss) from continuing operations per common share attributable to Trinity Industries, Inc. | $ | 0.18 | | | | | | | $ | 0.35 | |
| | | | | | | | | | | | | | | | | | | | | | | |
| Year Ended December 31, 2019 |
| GAAP | | Restructuring activities | | Income tax | | Adjusted |
| Operating profit (loss) | $ | 416.3 | | | $ | 14.7 | | | $ | — | | | $ | 431.0 | |
| | | | | | | |
| Income (loss) from continuing operations before income taxes | $ | 200.7 | | | $ | 14.7 | | | $ | — | | | $ | 215.4 | |
| | | | | | | |
| Provision (benefit) for income taxes | $ | 61.5 | | | $ | 3.3 | | | $ | (9.7) | | | $ | 55.1 | |
| | | | | | | |
| Income (loss) from continuing operations | $ | 139.2 | | | $ | 11.4 | | | $ | 9.7 | | | $ | 160.3 | |
| | | | | | | |
| Net income (loss) attributable to Trinity Industries, Inc. | $ | 137.6 | | | $ | 11.4 | | | $ | 9.7 | | | $ | 158.7 | |
| | | | | | | |
| Diluted weighted average shares outstanding | 127.3 | | | | | | 127.3 |
| | | | | | | |
Diluted income (loss) from continuing operations per common share attributable to Trinity Industries, Inc. | $ | 1.09 | | | | | | | $ | 1.26 | |
Pre-Tax Return on Equity
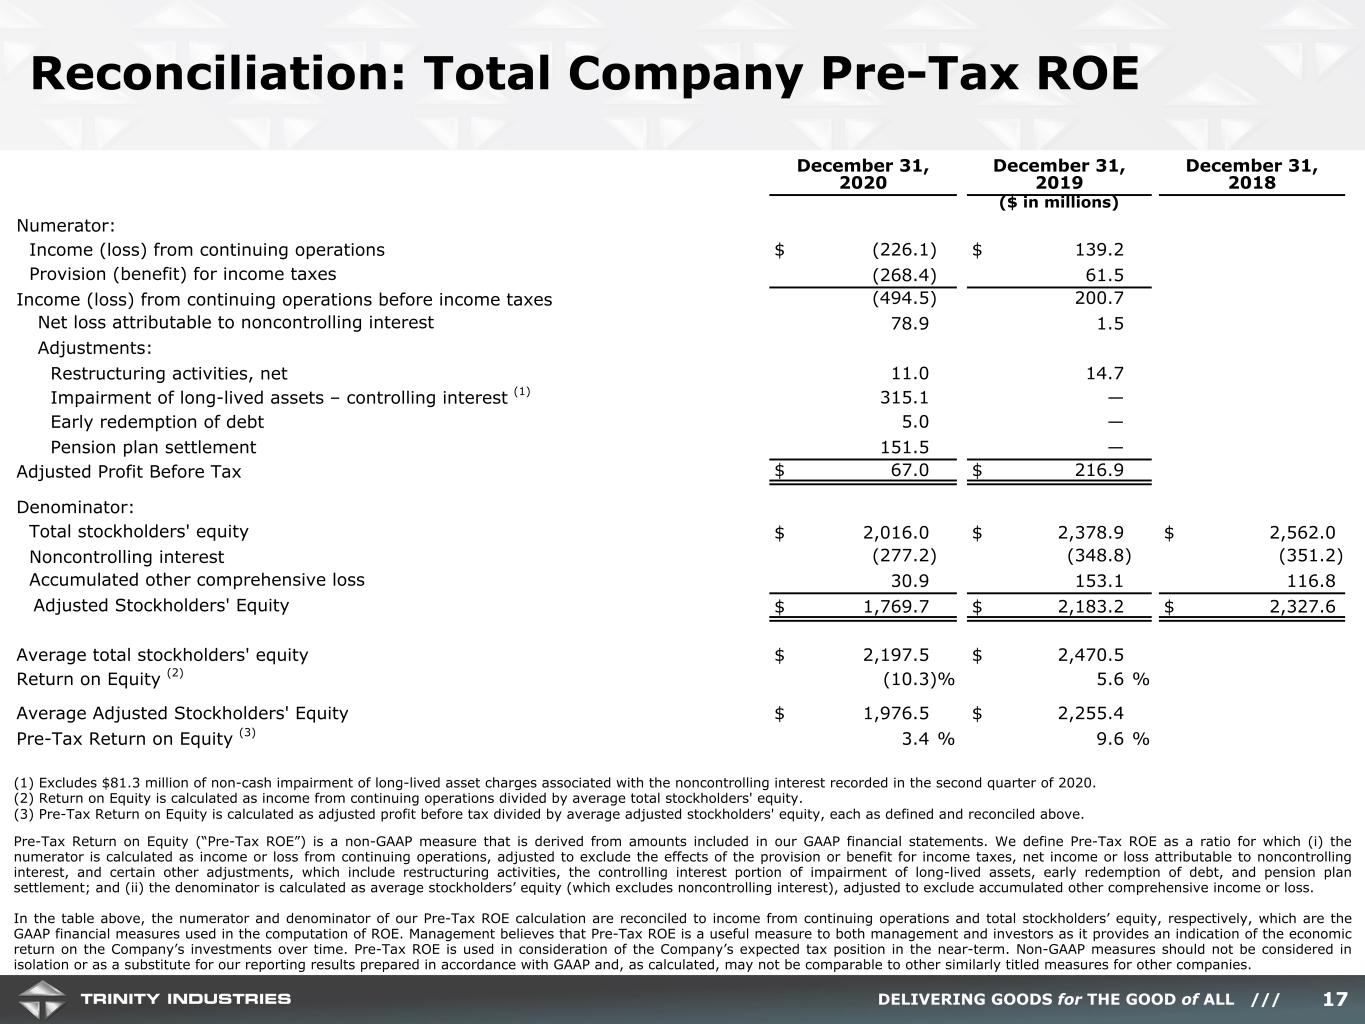
Pre-Tax Return on Equity (“Pre-Tax ROE”) is defined as a ratio for which (i) the numerator is calculated as income or loss from continuing operations, adjusted to exclude the effects of the provision or benefit for income taxes, net income or loss attributable to noncontrolling interest, and certain other adjustments, which include restructuring activities, the controlling interest portion of impairment of long-lived assets, early redemption of debt, and pension plan settlement; and (ii) the denominator is calculated as average stockholders’ equity (which excludes noncontrolling interest), adjusted to exclude accumulated other comprehensive income or loss. In the following table, the numerator and denominator of our Pre-Tax ROE calculation are reconciled to income from continuing operations and stockholders’ equity, respectively, which are the most directly comparable GAAP financial measures. Management believes that Pre-Tax ROE is a useful measure to both management and investors as it provides an indication of the economic return on the Company’s investments over time. Pre-Tax ROE is used in consideration of the Company’s expected tax position in the near-term.
| | | | | | | | | | | | | | | | | |
| December 31, 2020 | | December 31, 2019 | | December 31, 2018 |
| ($ in millions) |
| Numerator: | | | | | |
| Income (loss) from continuing operations | $ | (226.1) | | | $ | 139.2 | | | |
| Provision (benefit) for income taxes | (268.4) | | | 61.5 | | | |
| Income (loss) from continuing operations before income taxes | (494.5) | | | 200.7 | | | |
| Net loss attributable to noncontrolling interest | 78.9 | | | 1.5 | | | |
| Adjustments: | | | | | |
| Restructuring activities, net | 11.0 | | | 14.7 | | | |
Impairment of long-lived assets – controlling interest (1) | 315.1 | | | — | | | |
| Early redemption of debt | 5.0 | | | — | | | |
| Pension plan settlement | 151.5 | | | — | | | |
| Adjusted Profit Before Tax | $ | 67.0 | | | $ | 216.9 | | | |
| | | | | |
| Denominator: | | | | | |
| Total stockholders' equity | $ | 2,016.0 | | | $ | 2,378.9 | | | $ | 2,562.0 | |
| Noncontrolling interest | (277.2) | | | (348.8) | | | (351.2) | |
| Accumulated other comprehensive loss | 30.9 | | | 153.1 | | | 116.8 | |
Adjusted Stockholders' Equity | $ | 1,769.7 | | | $ | 2,183.2 | | | $ | 2,327.6 | |
| | | | | |
| Average total stockholders' equity | $ | 2,197.5 | | | $ | 2,470.5 | | | |
Return on Equity (2) | (10.3) | % | | 5.6 | % | | |
| | | | | |
| Average Adjusted Stockholders' Equity | $ | 1,976.5 | | | $ | 2,255.4 | | | |
Pre-Tax Return on Equity (3) | 3.4 | % | | 9.6 | % | | |
(1) Excludes $81.3 million of non-cash impairment of long-lived asset charges associated with the noncontrolling interest recorded in the second quarter of 2020.
(2) Return on Equity is calculated as income from continuing operations divided by average total stockholders' equity.
(3) Pre-Tax Return on Equity is calculated as adjusted profit before tax divided by average adjusted stockholders' equity, each as defined and reconciled above.
Free Cash Flow
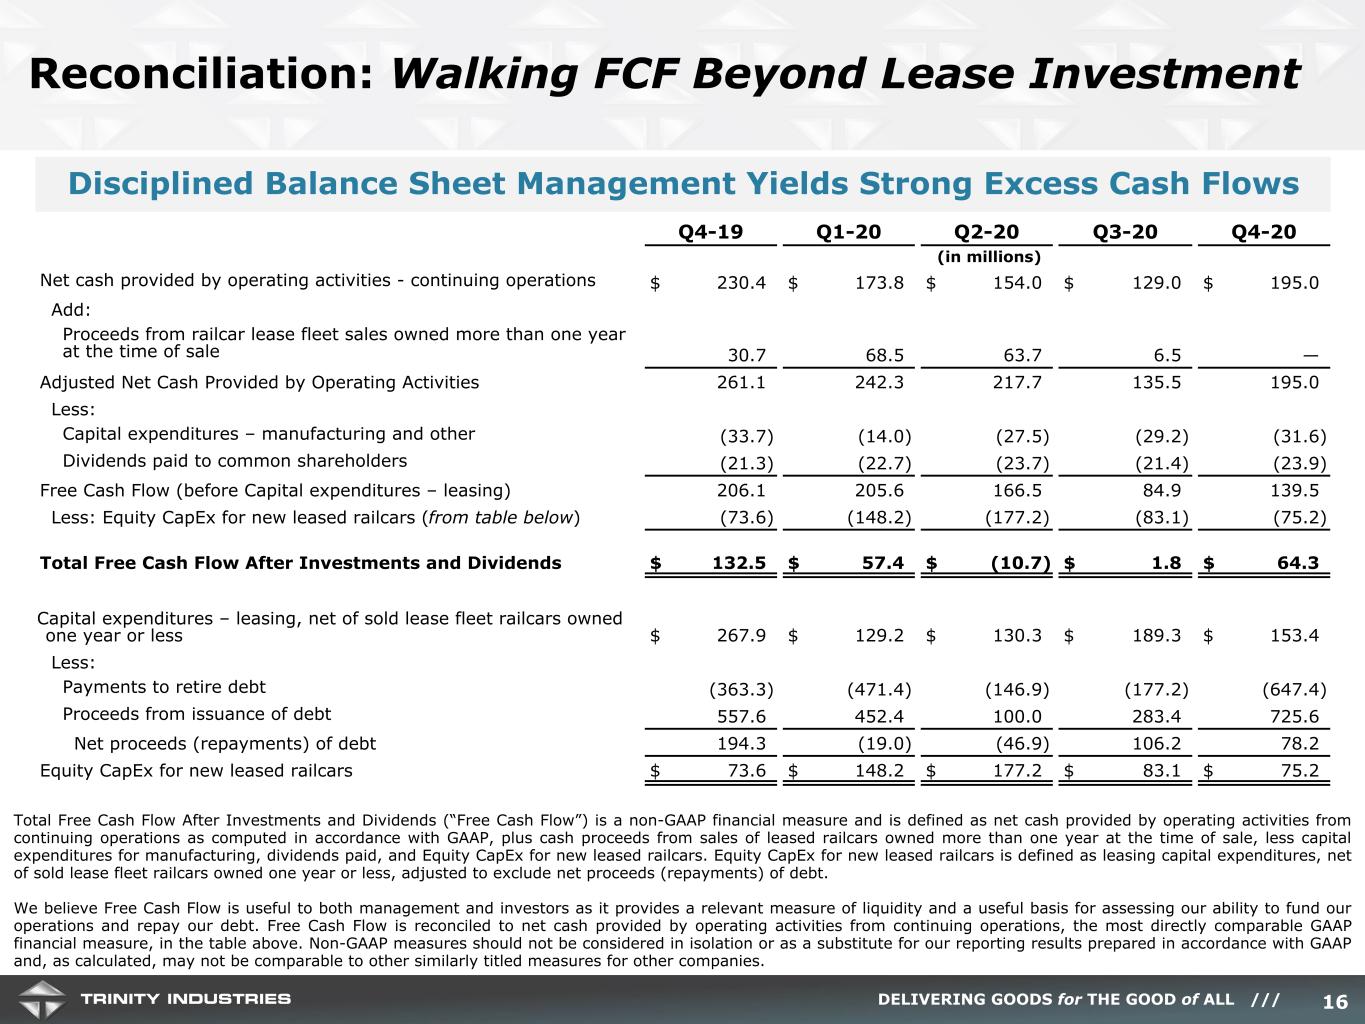
Total Free Cash Flow After Investments and Dividends ("Free Cash Flow") is a non-GAAP financial measure and is defined as net cash provided by operating activities from continuing operations as computed in accordance with GAAP, plus cash proceeds from sales of leased railcars owned more than one year at the time of sale, less capital expenditures for manufacturing, dividends paid, and Equity CapEx for new leased railcars. Equity CapEx for new leased railcars is defined as leasing capital expenditures, net of sold lease fleet railcars owned one year or less, adjusted to exclude net proceeds (repayments) of debt. We believe Free Cash Flow is useful to both management and investors as it provides a relevant measure of liquidity and a useful basis for assessing our ability to fund our operations and repay our debt. Free Cash Flow is reconciled to net cash provided by operating activities from continuing operations, the most directly comparable GAAP financial measure, in the following table.
| | | | | | | | | | | |
| Year Ended December 31, |
| 2020 | | 2019 |
| (in millions) |
| Net cash provided by operating activities – continuing operations | $ | 651.8 | | | $ | 396.7 | |
| Add: | | | |
| Proceeds from railcar lease fleet sales owned more than one year at the time of sale | 138.7 | | | 205.7 | |
| Adjusted Net Cash Provided by Operating Activities | 790.5 | | | 602.4 | |
| Less: | | | |
| Capital expenditures – manufacturing and other | (102.3) | | | (97.0) | |
| Dividends paid to common shareholders | (91.7) | | | (82.1) | |
Free Cash Flow (before Capital expenditures – leasing) | 596.5 | | | 423.3 | |
| Less: Equity CapEx for new leased railcars | (483.7) | | | (278.5) | |
| Total Free Cash Flow After Investments and Dividends | $ | 112.8 | | | $ | 144.8 | |
| | | |
| Capital expenditures – leasing, net of sold lease fleet railcars owned one year or less | $ | 602.2 | | | $ | 1,122.2 | |
| Less: | | | |
| Payments to retire debt | (1,442.9) | | | (1,724.1) | |
| Proceeds from the issuance of debt | 1,561.4 | | | 2,567.8 | |
| Net proceeds (repayments) of debt | 118.5 | | | 843.7 | |
| Equity CapEx for new leased railcars | $ | 483.7 | | | $ | 278.5 | |
EBITDA and Adjusted EBITDA
“EBITDA” is defined as income (loss) from continuing operations plus interest expense, income taxes, and depreciation and amortization expense. Adjusted EBITDA is defined as EBITDA plus non-cash impairment of long-lived assets, restructuring activities, and pension plan settlement. EBITDA and Adjusted EBITDA are non-GAAP financial measures; however, the amounts included in these calculations are derived from amounts included in our GAAP financial statements. EBITDA and Adjusted EBITDA are reconciled to net income (loss), the most directly comparable GAAP financial measure, in the following table. This information is provided to assist management and investors in making meaningful comparisons of our operating performance between periods. We believe EBITDA is a useful measure for analyzing the performance of our business. We also believe that EBITDA is commonly reported and widely used by investors and other interested parties as a measure of a company’s operating performance and debt servicing ability because it assists in comparing performance on a consistent basis without regard to capital structure, depreciation or amortization (which can vary significantly depending on many factors). EBITDA and Adjusted EBITDA should not be considered as alternatives to net income as indicators of our operating performance, or as alternatives to operating cash flows as measures of liquidity. Non-GAAP measures should not be considered in isolation or as a substitute for our reporting results prepared in accordance with GAAP and, as calculated, may not be comparable to other similarly titled measures for other companies.
| | | | | | | | | | | | | | | | | | | | | | | |
| Three Months Ended
December 31, | | Year Ended
December 31, |
| 2020 | | 2019 | | 2020 | | 2019 |
| Net income (loss) | $ | (126.6) | | | $ | 21.5 | | | $ | (226.2) | | | $ | 136.1 | |
| Less: Income (loss) from discontinued operations, net of income taxes | 0.1 | | | (0.8) | | | (0.1) | | | (3.1) | |
| Income (loss) from continuing operations | $ | (126.7) | | | $ | 22.3 | | | $ | (226.1) | | | $ | 139.2 | |
| Add: | | | | | | | |
| Interest expense | 52.6 | | | 56.3 | | | 219.2 | | | 221.8 | |
| Provision (benefit) for income taxes | (42.3) | | | 20.3 | | | (268.4) | | | 61.5 | |
| Depreciation and amortization expense | 66.5 | | | 73.1 | | | 266.0 | | | 283.6 | |
EBITDA | $ | (49.9) | | | $ | 172.0 | | | $ | (9.3) | | | $ | 706.1 | |
| Add: | | | | | | | |
| Impairment of long-lived assets | 27.0 | | | — | | | 396.4 | | | — | |
| Restructuring activities, net | 0.5 | | | 14.7 | | | 11.0 | | | 14.7 | |
| Pension plan settlement | 151.5 | | | — | | | 151.5 | | | — | |
| Adjusted EBITDA | $ | 129.1 | | | $ | 186.7 | | | $ | 549.6 | | | $ | 720.8 | |
Exhibit 99.2
Trinity Industries, Inc.
Earnings Release Conference Call – Q4 2020
February 24, 2021
Jessica Greiner
Vice President, Investor Relations and Communications
Thank you, Kate. Good morning everyone. I’m Jessica Greiner, Vice President of Investor Relations and Communications for Trinity. We appreciate you joining us for the Company’s rescheduled fourth quarter 2020 financial results conference call following the weather-related events affecting Texas and surrounding areas last week.
Our prepared remarks will include comments from Jean Savage, Trinity’s Chief Executive Officer and President, and Eric Marchetto, the Company’s Chief Financial Officer. We will hold a Q&A session following the prepared remarks from our leaders.
During the call today, we will refer to a few slides highlighting key points of discussion. The supplemental materials are accessible on our IR website at www.trin.net. These slides can be found under the Events and Presentations portion of the site along with the Fourth Quarter Earnings Call event link. They are also available live during the webcast.
It is now my pleasure to turn the call over to Jean.
E. Jean Savage
Chief Executive Officer and President
Thank you, Jessica – and good morning everyone!
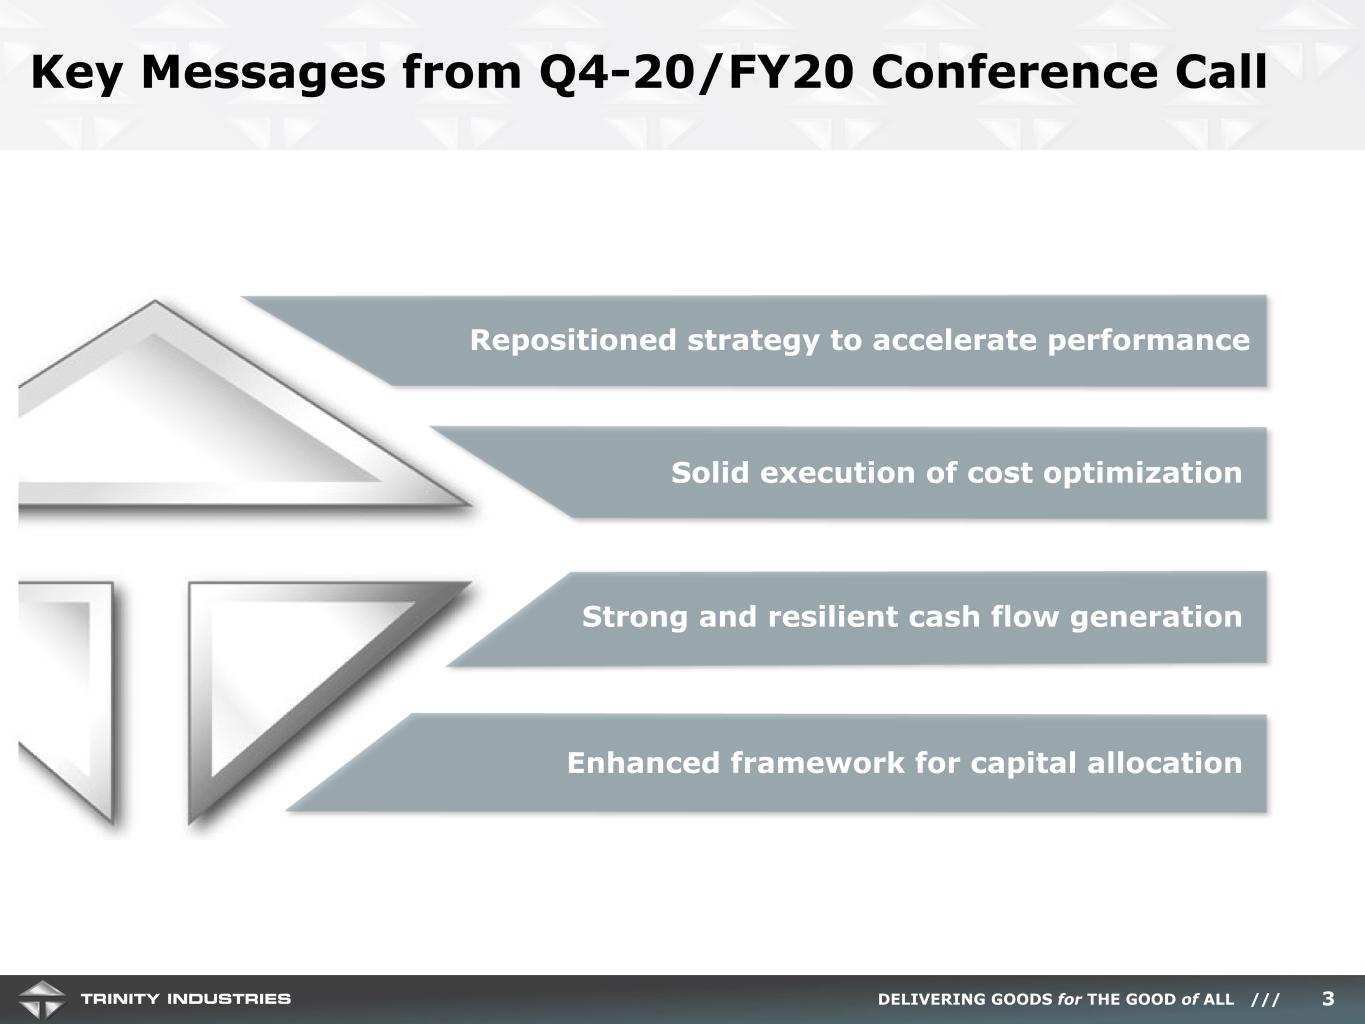
I’d like to start today on Slide 3 and pick up where we left off at our Investor Day in November last year. We laid out our strategy for Trinity’s rail platform to deliver premier financial performance and deploy capital to drive value creation. 2020 was a year of extraordinary change for Trinity. Effecting this change to evolve into a cash flow and returns-focused company during a global pandemic was all the more challenging. But our team pulled together and made difficult decisions that have put Trinity on a path to accelerate our financial performance. I want to commend our people for their commitment to the Company, to each other, and to our customers and all our stakeholders.
To begin my remarks, I believe there are several highlights from our fourth quarter and fiscal year 2020 performance that position us very well for the future. First, we’ve aligned our business under a core purpose and laid out our strategy for improving the Company’s returns. The strategic initiatives focused on optimizing our business structure, and growing our product and service offerings to
advance modal share for the railcar industry. Second, in line with this strategy, Trinity completed the vast majority of our planned restructuring efforts during 2020. We also made further progress on leveraging Trinity’s balance sheet under our targeted capital structure. We expect to make additional progress in lowering our overall cost structure in 2021. Third, Trinity’s rail platform proved resilient during the unprecedented market events of COVID-19, generating strong cash flow from operations. And finally, there is potential to return additional capital to shareholders given the attractive cash flow profile of our business and the enhanced capital allocation framework we laid out at our Investor Day.
We are very excited about our future and very much expect 2021 to be a year of execution against our strategy to move the company forward. We believe we have a number of levers at our disposal to improve our performance and will share those results with you along the way.
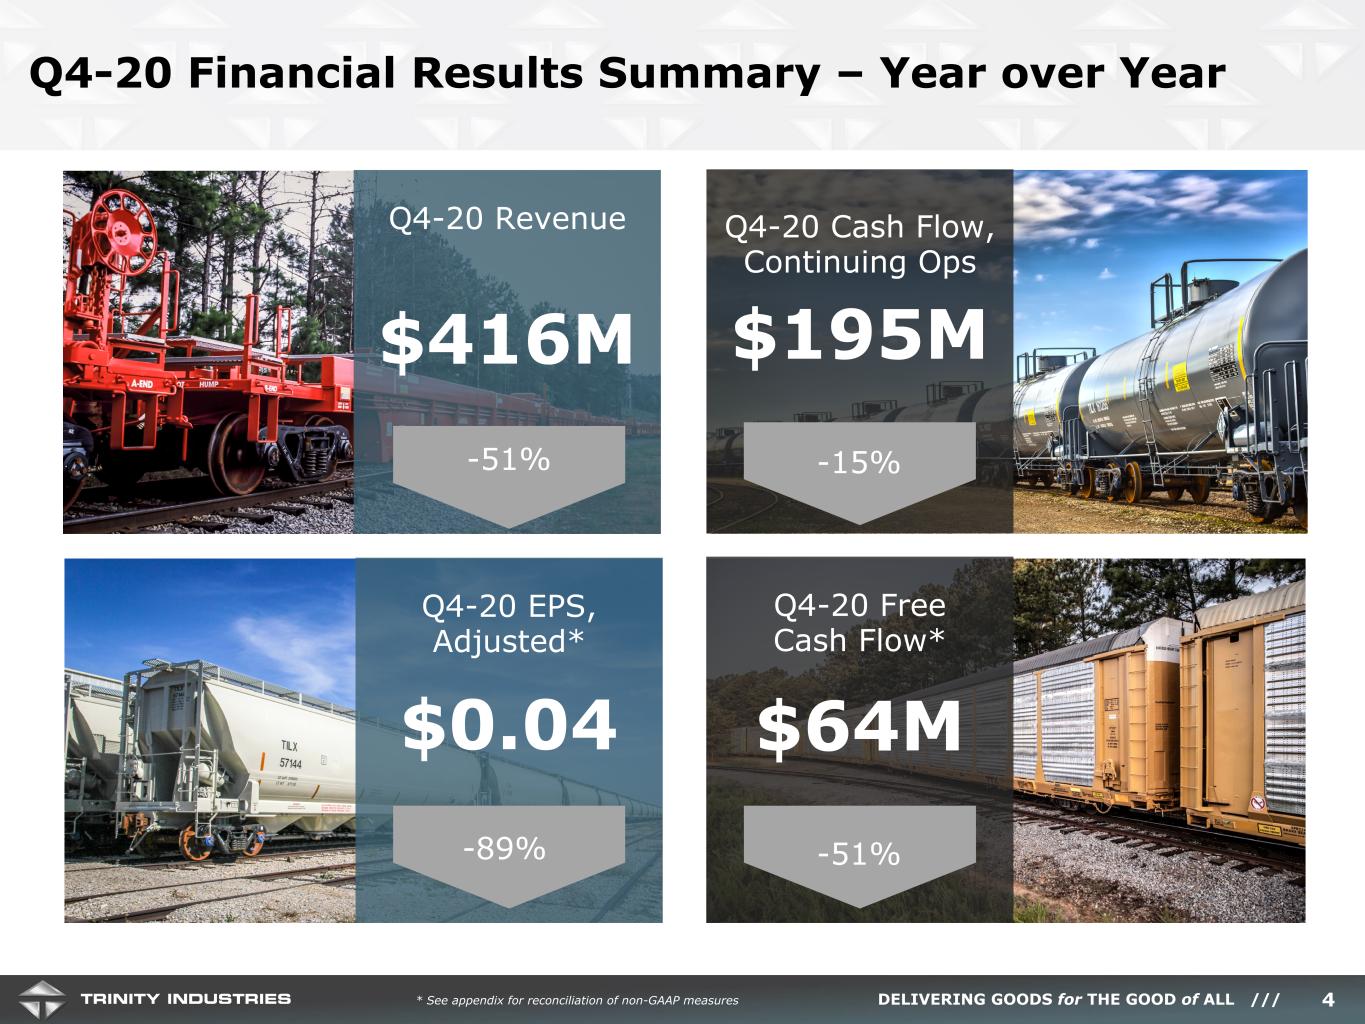
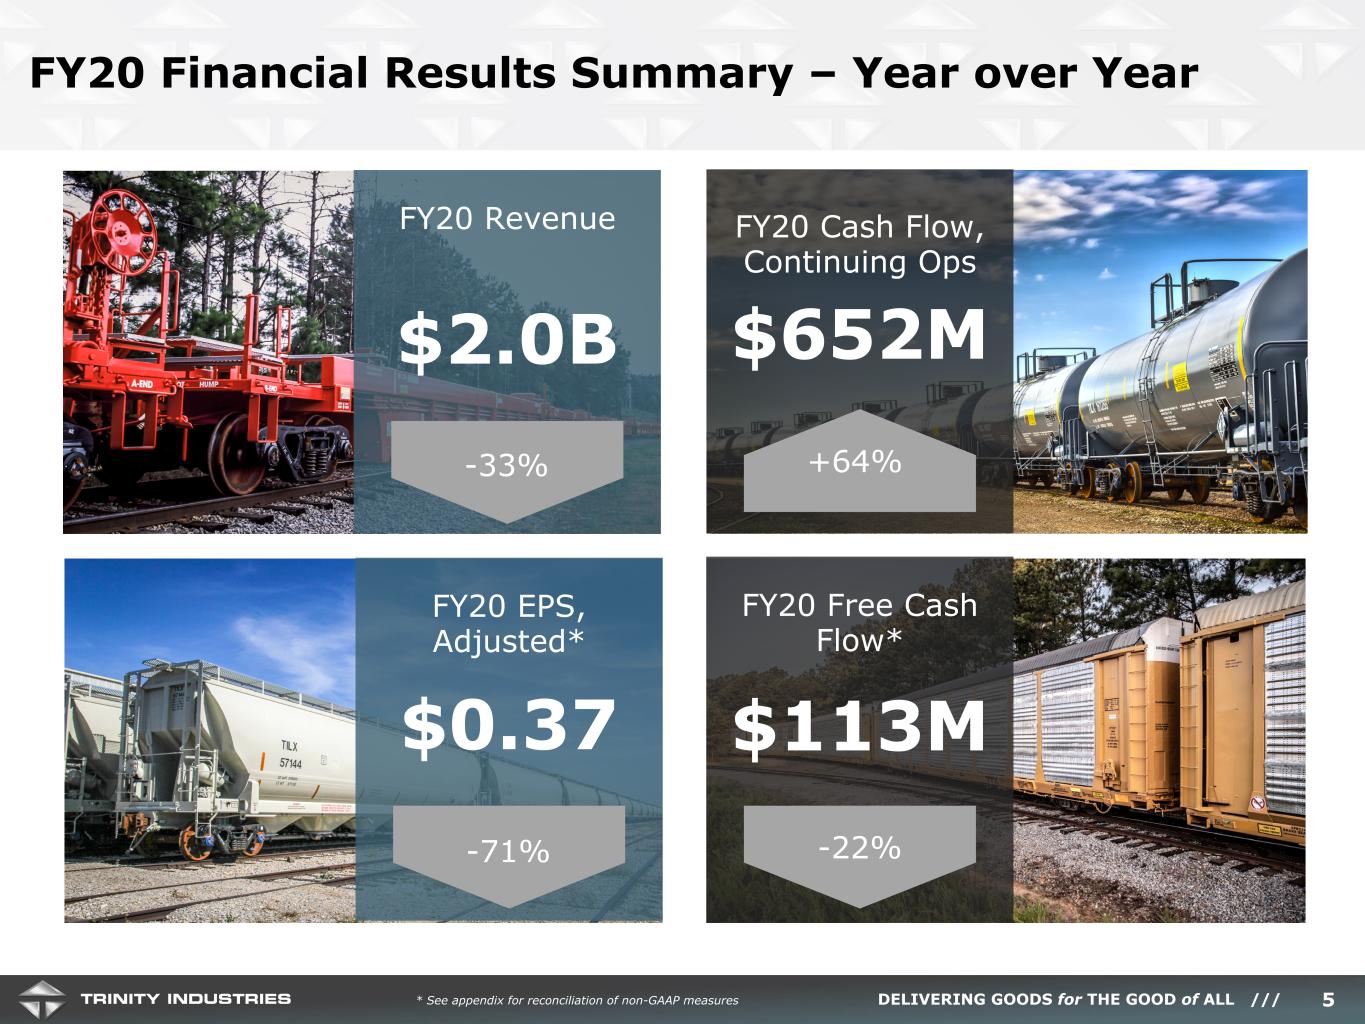
Turning to Slide 4, let’s review the key financial highlights. Our fourth quarter financial performance reflects the decline in railcar demand as rail traffic fell amid the COVID-19 outbreak last spring. As a result, fourth quarter revenue of $416 million declined approximately 51% compared to last year. Our fourth quarter GAAP loss of $1.13 primarily reflects one-time charges that occurred during the quarter. Trinity’s adjusted EPS of $0.04 fell from prior year as a result of lower deliveries and softer railcar pricing. Trinity’s team worked quickly and diligently to cut costs out of the business, but our cost structure was burdened by the lost efficiencies from production declines. While our leasing operations held steady during a challenging market, lower lease portfolio sales and railcar deliveries created an earnings headwind for the full year. Our total GAAP loss for the year of $1.27 declined 217% year over year, and 2020 adjusted earnings declined 71% to $0.37 per share.
Our earnings performance amid the COVID-19 environment is disappointing; however, our platform continues to drive significant and stable cash flows. Our fourth quarter cash flow from continuing operations totaled $195 million, which is down just 15% from the prior year. Free cash flow after all investments and dividends of $64 million decreased 51% over the fourth quarter of 2019. For the year, and turning to Slide 5, operating cash flow of $652 million improved significantly year over year. As a result of our more conservative capital structure during the pandemic, Free Cash Flow of $113 million declined approximately 22% given higher Leasing Equity CapEx for the year.
Both Eric and I will speak to the performance factors driving these results in a minute, but the important takeaway from our consolidated fourth quarter and full year metrics is the resilient and stable cash flow generated from Trinity’s rail platform in a very challenging market – a testament to the valuable synergies within the business.
Overall, we continue to operate in a soft but improving market.
Looking at Slide 6, rail volumes, which are closely tied to the US economic output, have essentially recovered from the decline we saw over the first half of 2020. We are seeing the strongest recovery in agricultural and consumer-related markets. Railcar loadings for energy-related commodities, like crude and coal, continue to lag the recovery given the impacts of the economic shutdowns.
Industry railcar utilization is also improving. Over 125,000 railcars have returned to service or were scrapped since the peak of railcars in storage last summer. We estimate nearly 51,000 railcars were scrapped in 2020 resulting in the first year of an industry fleet contraction in over a decade. We expect this elevated pace of scrapping to continue so long as higher steel prices incentivize railcar owners to scrap older assets. While the industry railcar storage rate of 24% remains above the five year average, the trend is a relevant indicator for the health of the railcar industry.
Looking at the bottom two charts specific to Trinity’s business, we generally see the sector-specific impacts of an industry recovery first within our lease fleet before we see improvements in new railcar demand. During 2020, lease rates declined significantly compared to expiring lease rates as a result of lower demand for railcars. As rail traffic has picked back up, lease fleet utilization is stabilizing. We are also beginning to see early improvement in sequential railcar lease rates with the Future Lease Rate Differential (“FLRD”) metric inflecting positively during the fourth quarter. We introduced this metric at our Investor Day to provide investors a sense of the headwinds or tailwinds the current pricing environment will have upon Trinity’s lease portfolio in the near term.
Orders during the fourth quarter were low as expected, and for the year, represent the lowest number of orders since the financial crisis in 2009. This is not surprising given the availability of railcars within the industry, and the current projections for a slowly recovering industrial economy.
We are seeing a significant increase year over year in the number of inquiries from shippers and Class 1 railroads for available railcar equipment. While it is premature to estimate when these inquiries will lead to improvement in lease utilization, rates, and new railcar orders – it is a very positive sign for the rail market recovery. Given where we are today, we expect a modest recovery in railcar demand in the back half of 2021.
Trinity’s market-leading platform and experience managing through railcar cycles enables us to promptly respond to changing market dynamics and meet customer demand. More importantly, while the railcar market may likely only improve to a more normalized or replacement-level market in the
near term, we feel confident in our ability to execute our strategy and improve our financial performance.
Turning from the industry to Trinity’s results on Slide 7. The value and stability of Trinity’s leasing business was readily apparent as the year unfolded. Our lease fleet utilization took an initial step down in the first quarter of the year, then proceeded to hover around 95% utilization through 2020. We are highly focused on maintaining our utilization and are seeing green shoots of improvement within various railcar types. Approximately 17% of our portfolio was up for renewal in 2020, limiting the impact of declining lease rates on top line revenue for the leasing business. Stronger lease rates on railcars added to the portfolio nearly offset the headwinds from utilization and lower lease rates on renewals, with annual revenue from leasing and management declining approximately 1% year over year. Looking into 2021, we have approximately 20% of our portfolio up for renewal, and we will have less of a headwind for lease rate pricing, as reflected by the FLRD metric.
The leasing team did a tremendous job managing our maintenance expenses to offset the earnings impact of the revenue decline within the segment. Segment profit also benefited from the change in our depreciation policy to extend the useful life of our assets and better reflect the economics of railcar ownership. We have a number of initiatives in place to lower our overall maintenance cost structure through increasing the use of our internal network, and implementing advanced technologies into our maintenance cleaning processes. Looking into next year, 2021 will be a heavier compliance year for maintenance events, so leveraging our maintenance platform will be key.
The Rail Products segment endured a difficult year as declining backlog required production cuts and layoffs within both our production and maintenance facilities. Lower pricing and the unabsorbed burden from the lower deliveries impacted the margin throughout the year. In the fourth quarter, the performance was also impacted by start-up costs related to our new maintenance facility in the Midwest, and idling costs associated with other non-strategic facilities, resulting in breakeven margin in the segment. We do expect there to be ongoing headwinds to segment performance in the first quarter of this year due to lower volumes, further headcount reductions, and additional maintenance facility start-up costs. We anticipate the benefit of our cost savings initiatives will begin to benefit segment performance in the second half of the year and will improve the segment margin performance year over year.
Before I turn the call over to Eric to discuss our financial results in further detail, let me close with an update on our initiatives to improve Trinity’s returns on Slide 8.
First as a reminder, we believe there are a number of levers at our disposal to improve our Pre-Tax ROE performance to a mid-teen level through the cycle. The strategic initiatives align under two areas of focus – optimization and growth. As we detailed at our Investor Day, there is a significant information value in our rail platform, and we are confident in our ability to monetize that value across services, parts, and solutions.
In 2020, our balance sheet optimization was modest as a result of a healthy level of near term liquidity and our decision to maintain a more conservative capital structure through the pandemic. During the year, our net debt increased approximately $135 million. In 2021, we expect to add additional leverage to our balance sheet as we have opportunity to deploy that capital.
In regards to SE&A, we achieved over $35 million of annualized administrative cost reductions in 2020. We’ll continue evaluating SE&A cost-reduction opportunities through process improvement and vendor management, and as always, manage the cost structure of our support organization to the size of the overall business. To improve our manufacturing performance, we are moving forward with our supply chain initiatives to enhance the value of outsourced fabrication activities from our facilities. We expect these efforts to shift approximately $45 million of cyclical headcount cost savings achieved in 2020 to structural cost savings upon execution. We’ve also made a modest investment subsequent to year end to acquire a railcar cleaning company with advanced proprietary robotics. We expect to scale this technology to our facilities over the next few years, which will improve our overall production operations efficiency and improve Rail segment margins.
In regards to fleet optimization, we expect to make modest investments to reposition certain railcars to other commodity service that we believe have better longer-term demand profiles. We also expect to complete a modest level of portfolio sales from our lease fleet to financial investment partners with lower-hurdled capital.
Earlier this month, our commercial team was very excited to officially launch the new Trinsight™ digital service offering for our customers. Trinsight™ provides real-time intelligence on the location, condition, and status of rail equipment, resulting in rail transportation efficiencies and safety that enhance rail fleet operations for shippers. This product offering is aligned with our sustainability commitment and is a key initiative in our business strategy to improve the overall rail modal supply chain. Trinsight™ is generating a modest amount of revenue through the beta testing of the product, and we are receiving a very positive response from shippers interested in the service following the product launch.
It is early days for sure, but with a backdrop of improving fundamentals and our confidence in the strategy we have developed, it is an exciting time to be looking forward at Trinity.
With that, let me now turn the call over to Eric to detail our quarterly results.
Eric R. Marchetto,
Executive Vice President and Chief Financial Officer
Thank you, Jean – and good morning everyone!
As Jean noted, Trinity’s fourth quarter represents the continuation of lower railcar demand brought on by the COVID-19 pandemic. Additionally, our fourth quarter operating results were impacted by a number of one-time items. These adjustments primarily relate to the effect of the pension plan settlement, as well as later-stage restructuring activities, including write-downs to manufacturing-related assets. We also had a benefit from our final 2020 income tax provision as a result of tax law changes in 2020.
Starting with the income statement portion of Slide 9. Total revenues and adjusted earnings reflect the challenging railcar market with declining railcar deliveries and softer pricing. At these lower levels of manufacturing earnings, timing of railcar sales and fluctuations in leasing operations and legal and administrative expense have had varying impacts on our earnings results.
During the fourth quarter, Trinity incurred two impairment charges related to restructuring efforts and other market-related factors. The first charge was a non-cash write-down related to existing maintenance facilities that do not fit our operational strategy or cost profile and have been classified as assets held for sale. Our maintenance business has realigned its operational approach to focus on large, full service railcar maintenance facilities thereby providing better and more timely service to Trinity’s railcar lease fleet and our strategic customers. The second charge was a write-off associated with an investment in emerging technology for advanced steel materials where the third party was unable to secure adequate funding and is in the process of liquidating.
Moving to our cash flow, total cash flow from operations during 2020 improved year over year as a result of the cash flow synergies of Trinity’s rail platform, as well as the counter-cyclical effects of working capital from our balance sheet. Trinity generated approximately $652 million in cash flow from operations, with the sequential fourth quarter increase resulting primarily from the receipt of a $64 million income tax receivable. At year end, we have approximately $446 million in income tax
receivable associated with the 2019 and 2020 tax years. We now expect to receive the 2019 refund in the first half of this year.
Trinity invested approximately $102 million last year in manufacturing and other company capex, which included the build-out of our maintenance facility in the Midwest. We also made a net investment in our lease fleet of approximately $464 million. When considering the effects of modest leverage on new lease fleet additions and associated debt amortization during the year, our Equity CapEx required for this investment totaled $484 million in 2020.
Total Free Cash Flow after all investments and dividends paid to investors amounted to $113 million for the fiscal year. Trinity returned a total of $285 million to shareholders in 2020, including dividends of $92 million and an additional $193 million in share repurchases. As of the end of the year, we have approximately $182 million remaining under our current authorization that runs through the end of 2021.
Before we move on, we also want to call investor attention to a change in the treatment of our portfolio sales from our lease fleet on a prospective basis. We will now present all sales of railcars from the lease fleet as a net gain from the disposal of a long-lived asset. This should simplify our reporting for investors. This change will slightly affect the presentation of our cash flow statement and the net investment in new lease fleet additions, but it will not change the net effect of our free cash flow metric or segment operating profit.
At this time, we are not providing specific earnings guidance given the uncertainty in the market related to the economic recovery of the COVID-19 pandemic. That being said, our business model generates significant cash flow, and we are highly focused on the value we can create from deploying this capital. For 2021, we expect cash flow from operations to be between $625 million and $675 million.
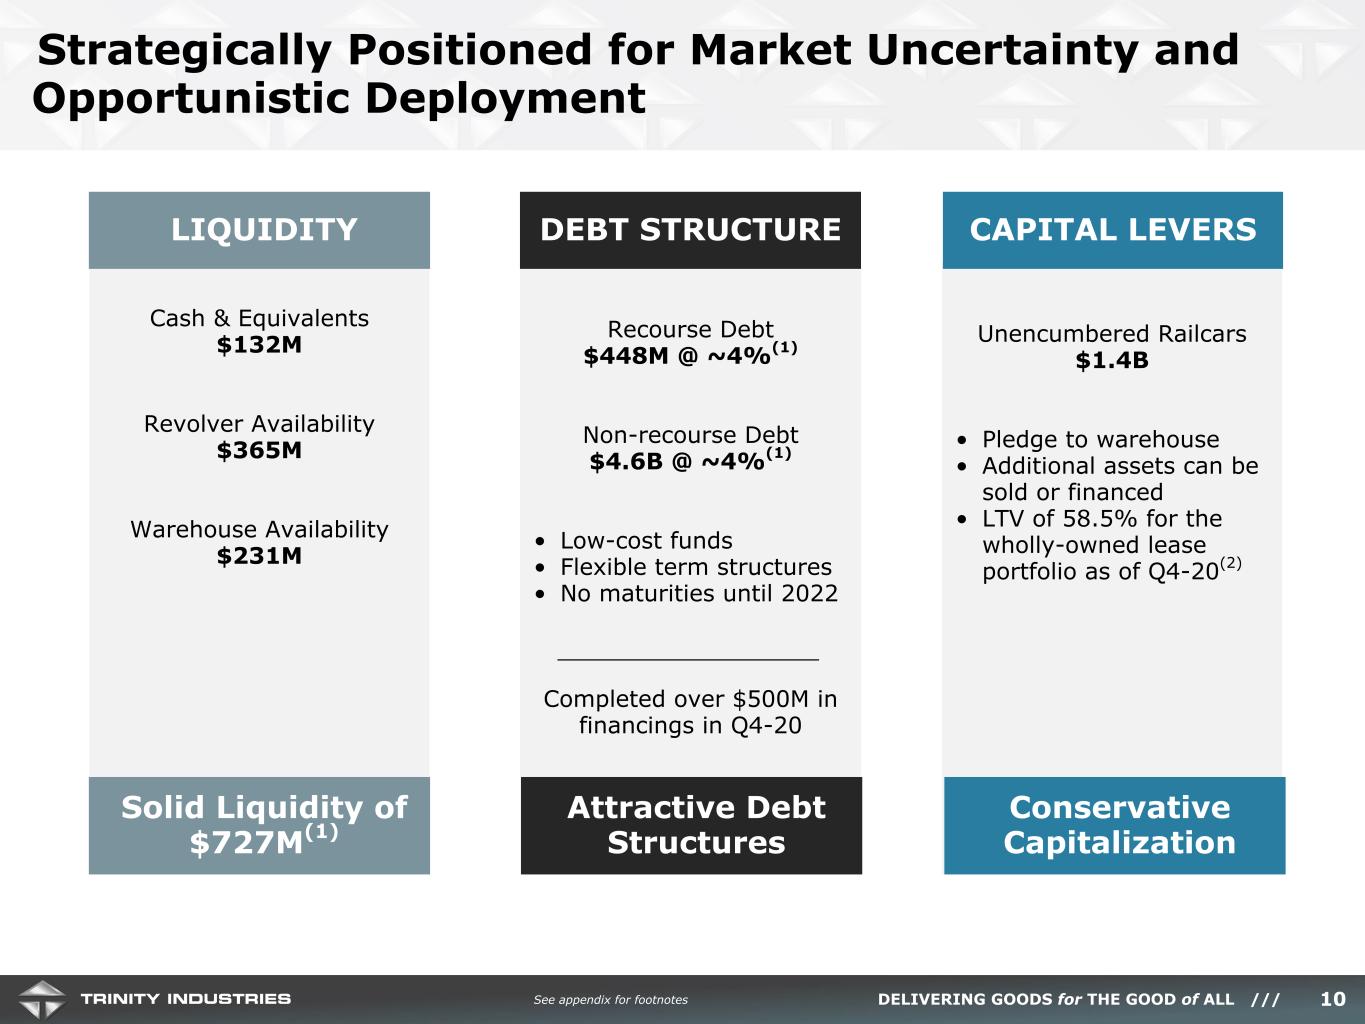
Turning to Slide 10, as Jean noted, our balance sheet is well capitalized, and we ended the fourth quarter with total liquidity of $727 million. During the fourth quarter, we issued over $526 million of new debt at a blended interest rate of 2.4%. We estimate Trinity’s pre-tax weighted average cost of capital improved during 2020 by 130 basis points to approximately 5%. The capital markets for railcar securitizations are at historically attractive rates as more and more investors are participating in these financings. As a pioneer in the railcar securitization market in the early 2000s, we are pleased to see this response to the asset class and expect to take further advantage of the market in 2021.
In late January, we were proud that Trinity’s leasing company was the first North American railcar lessor to establish a green financing framework. As part of our commitment to sustainability, Trinity takes our commitment to reducing our environmental impact seriously. TILC’s Green Financing Framework opens Trinity’s capital raising to new investors with a growing appetite for investing in green assets, and the response has been favorable.
Trinity remains in a very good capital position, with ample liquidity, strong cash flow generation, and approximately $1.4 billion in unencumbered assets.
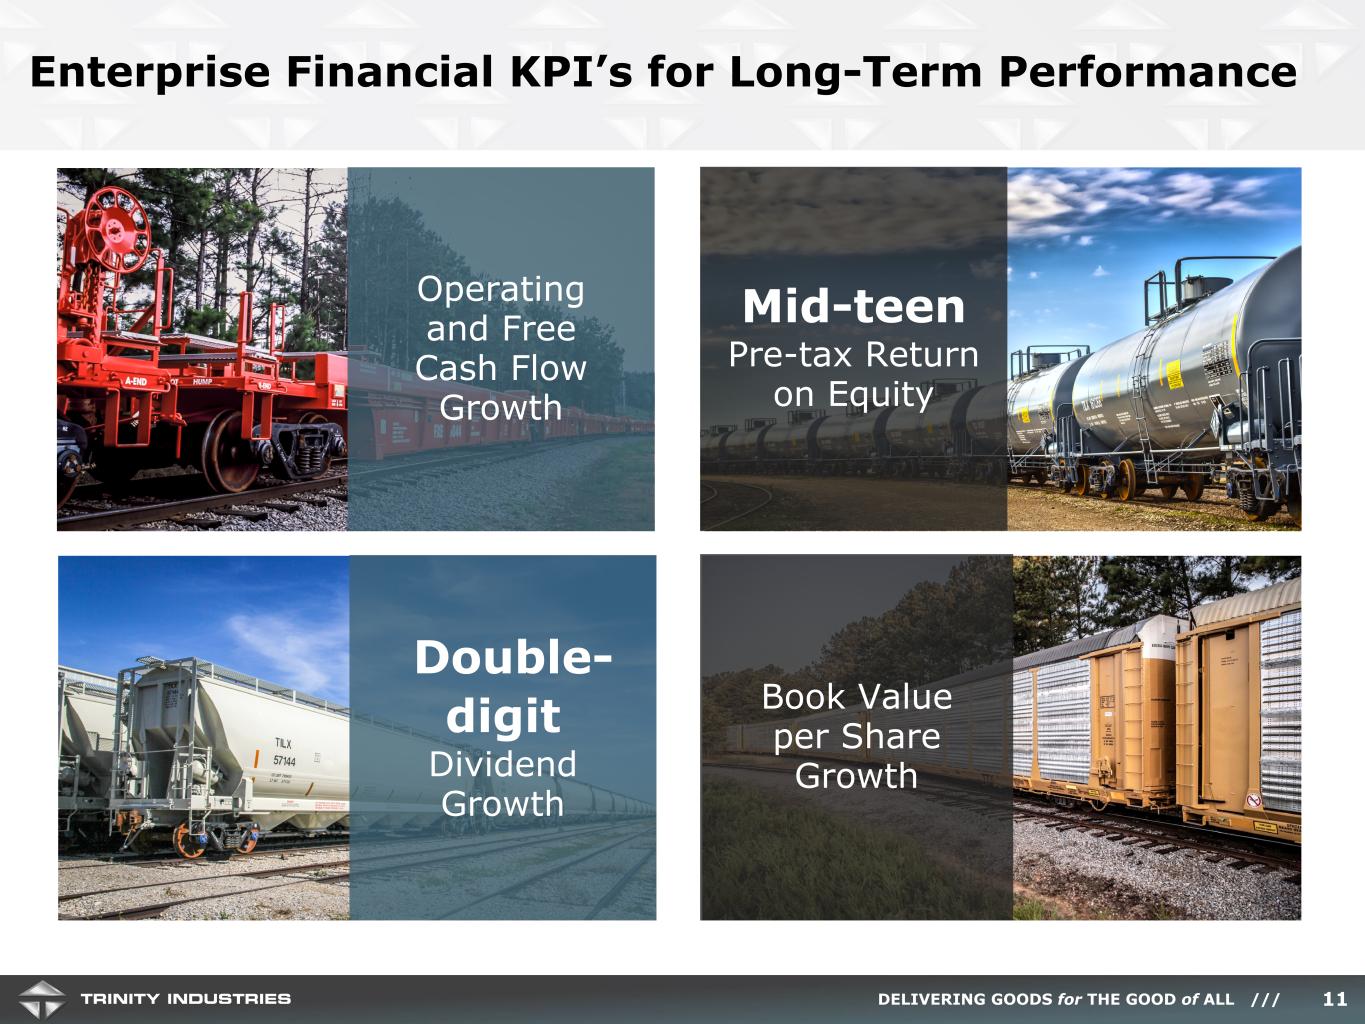
When we consider the long-term performance of the business, we are confident that the changes effected during 2020 will set our Company on a path for accelerating our financial performance and unlocking value for shareholders. At our Investor Day in November, we issued four long-term key performance indicators presented here on Slide 11.
Trinity’s value is inherent in the cash flows of our long-duration railcar assets, platform synergies, opportunities for growth, and a disciplined capital allocation framework focused on shareholder returns. When evaluated over time, we believe these indicators collectively drive long-term value creation.
In 2020, operating cash flow improved year over year as previously discussed, and Free Cash Flow declined modestly. Our return on equity declined year over year from deteriorating market fundamentals, however, the Company has established a framework for improving our performance for which we feel many of the levers for improvement are within management’s control. Trinity executed on its commitment to deliver double-digit dividend growth with our December dividend increase of 11%, which was paid in January 2021. Our dividend growth in 2020 compared to the previous 2019 year was also nearly 12% for the year. Book Value per share slightly declined year over year principally due to certain one-time items.
Before I leave this slide, let me reiterate that Trinity’s strategy to drive returns and cash flows will not be linear from quarter to quarter. Each action we take will be made with returns and cash flows in mind. The pace of economic recovery will impact the time frame to achieve our goals, but I want to be clear, that we expect to make progress against our returns and cash flow goals, regardless of the market environment, and believe that Trinity is well positioned to do so.
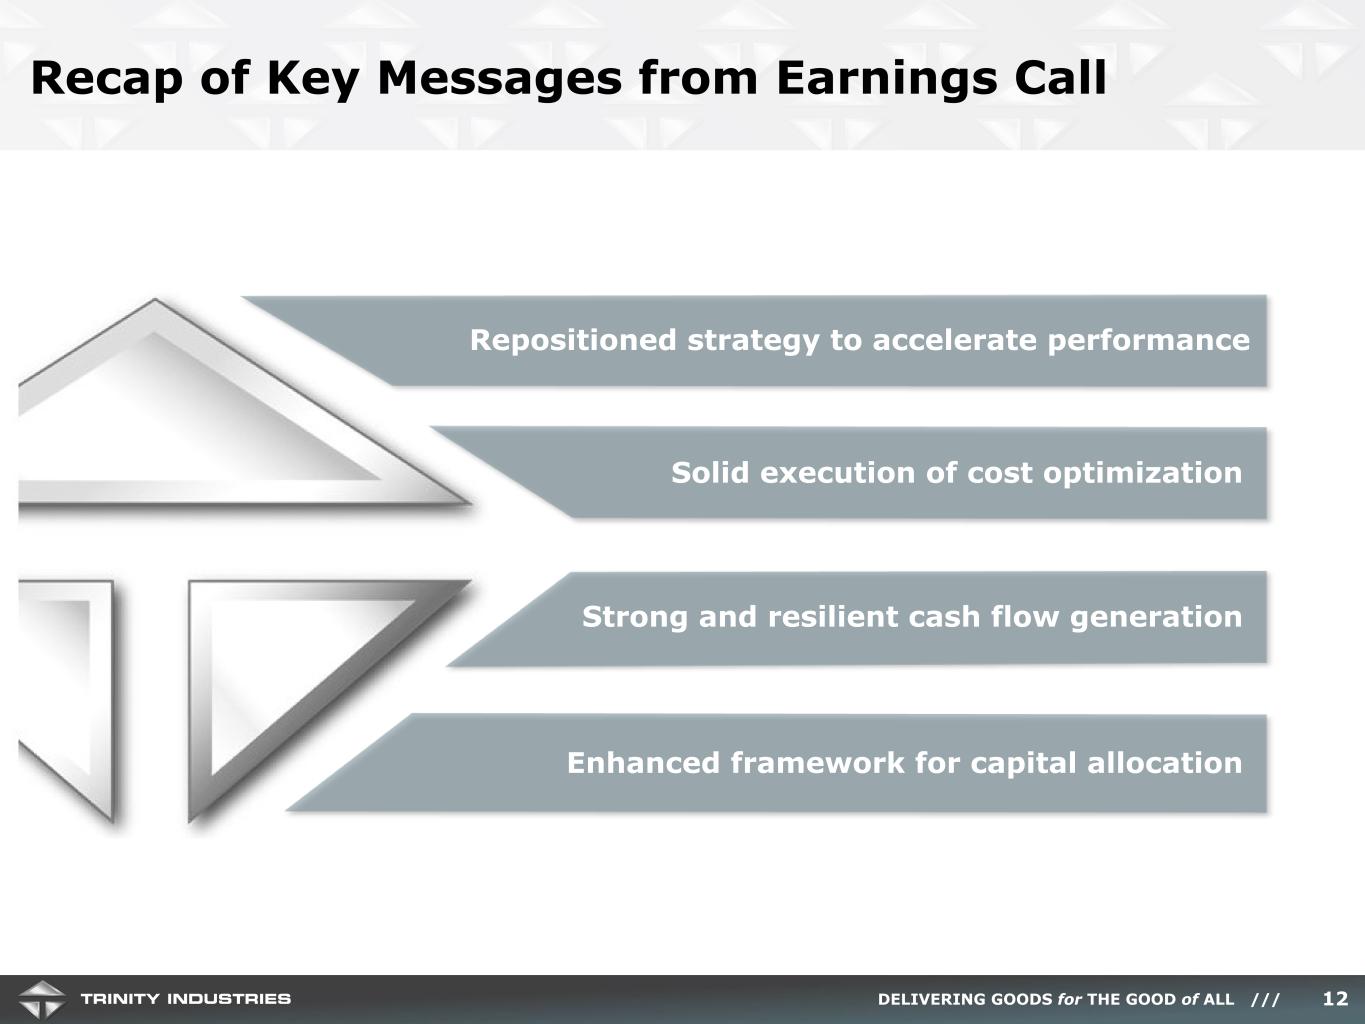
I will conclude our remarks on Slide 12 by reiterating our key takeaways from the fourth quarter and fiscal year end and look forward into 2021. First, we laid out a strategy to reposition Trinity’s rail
platform, improve the returns of the business, and unlock shareholder value. Second, we made solid progress on our initiatives to optimize both process and expenses across all aspects of our rail platform. We are proud of the hard work our people put forth during a global pandemic to reposition the Company for accelerating financial performance. Third, our platform demonstrated the ability to generate significant cash flow in a very challenging market environment. And finally, our commitment to a capital allocation framework that focuses on long-term shareholder value.
In 2021, we intend to further optimize our manufacturing platform through supply chain outsourcing and integrating advanced technologies, enhance our product portfolio through evolutionary products and services for our customers, and continue to optimize our balance sheet through additional leverage, fleet modifications, and portfolio sales. The uncertainty within the market could be a financial headwind to the impact of these initiatives, but we believe they are critical to accelerating the Company’s performance. We are confident in our ability to execute, and look forward to sharing our results with you throughout the year.
Kate, you may now take us to questions from our participants.
Jessica Greiner
Vice President, Investor Relations and Communications
Thank you, Kate. A replay of today’s call will be available after 10:30 a.m. Eastern standard time through midnight on March 3rd, 2021. The replay number is (877) 344-7529 with an access code of 10151360. A replay of the webcast will also be available under the Events and Presentations page on our Investor Relations website located at www.trin.net. We look forward to visiting with you again on our next conference call. Thank you for joining us this morning.