trn-20250220February 20, 2025February 20, 2025TRINITY INDUSTRIES INC0000099780false00000997802025-02-202025-02-20
UNITED STATES SECURITIES AND EXCHANGE COMMISSION
WASHINGTON, D.C. 20549
FORM 8-K
CURRENT REPORT
Pursuant to Section 13 or 15(d) of the Securities Exchange Act of 1934
| | | | | | | | |
| Date of Report (Date of Earliest Event Reported): | | February 20, 2025 |
_______________________________________
(Exact name of registrant as specified in its charter)
| | | | | | | | | | | | | | |
| | | | | |
| Delaware | | 1-6903 | | 75-0225040 |
(State or other jurisdiction
of incorporation) | | (Commission File No.) | | (I.R.S. Employer
Identification No.) |
14221 N. Dallas Parkway, Suite 1100,
Dallas, Texas 75254-2957
(Address of Principal Executive Offices, and Zip Code)
(214) 631-4420
Registrant's Telephone Number, Including Area Code
Not Applicable
(Former Name or Former Address, if Changed Since Last Report)
______________________________________________
Check the appropriate box below if the Form 8-K filing is intended to simultaneously satisfy the filing obligation of the registrant under any of the following provisions:
☐ Written communications pursuant to Rule 425 under the Securities Act (17 CFR 230.425)
☐ Soliciting material pursuant to Rule 14a-12 under the Exchange Act (17 CFR 240.14a-12)
☐ Pre-commencement communications pursuant to Rule 14d-2(b) under the Exchange Act (17 CFR 240.14d-2(b))
☐ Pre-commencement communications pursuant to Rule 13e-4(c) under the Exchange Act (17 CFR 240.13e-4(c))
Securities registered pursuant to Section 12(b) of the Act:
| | | | | | | | |
| Title of each class | Trading Symbol(s) | Name of each exchange on which registered |
| Common Stock | TRN | New York Stock Exchange |
Indicate by check mark whether the registrant is an emerging growth company as defined in Rule 405 of the Securities Act of 1933 (17 CFR §230.405) or Rule 12b-2 of the Securities Exchange Act of 1934 (17 CFR §240.12b-2).
Emerging growth company ☐
If an emerging growth company, indicate by check mark if the registrant has elected not to use the extended transition period for complying with any new or revised financial accounting standards provided pursuant to Section 13(a) of the Exchange Act. ☐
Item 2.02 Results of Operations and Financial Condition.
Trinity Industries, Inc. ("Trinity") hereby furnishes the information set forth in its News Release, dated February 20, 2025, announcing operating results for the three and twelve month periods ended December 31, 2024, a copy of which is furnished as Exhibit 99.1 and incorporated herein by reference. On February 20, 2025, Trinity held a conference call and webcast with respect to its financial results for the three and twelve month periods ended December 31, 2024. The conference call scripts of Leigh Anne Mann, Vice President of Investor Relations; E. Jean Savage, Chief Executive Officer and President; and Eric R. Marchetto, Executive Vice President and Chief Financial Officer are furnished as Exhibit 99.2, and incorporated herein by reference.
The conference call, News Release, and Presentation Materials, described below, included references to Adjusted Operating Results and Adjusted Earnings Per Share, Adjusted Return on Equity, Cash Flow from Operations with Net Gains on Lease Portfolio Sales, EBITDA and Adjusted EBITDA, which are not calculations based on generally accepted accounting principles (“GAAP”). Reconciliations of each of these non-GAAP measures to the most directly comparable GAAP measures have been included in the News Release and/or the Presentation Materials. When forward-looking non-GAAP measures are provided, Trinity does not provide quantitative reconciliations of forward-looking non-GAAP measures to the most directly comparable GAAP measures because it cannot, without unreasonable effort, predict the timing and amounts of certain items included in the computations of each of these measures. These factors include, but are not limited to: the product mix of expected railcar deliveries; the timing and amount of significant transactions and investments, such as lease portfolio sales, capital expenditures, and returns of capital to shareholders; and the amount and timing of certain other items outside the normal course of our core business operations.
This information and the materials described in Item 7.01 are not "filed" pursuant to the Securities Exchange Act of 1934 and are not incorporated by reference into any Securities Act of 1933 registration statements. Additionally, the submission of the report on Form 8-K is not an admission of the materiality of any information in this report that is required to be disclosed solely by Regulation FD.
Item 7.01 Regulation FD Disclosure.
See "Item 2.02 – Results of Operations and Financial Condition." Additionally, Trinity posted its presentation for investors and interested parties to its website to accompany the conference call; a copy of these materials is furnished as Exhibit 99.3 and incorporated herein by reference.
Forward-Looking Statements
Some statements in this release, which are not historical facts, are “forward-looking statements” as defined by the Private Securities Litigation Reform Act of 1995. Forward-looking statements include statements about Trinity's estimates, expectations, beliefs, intentions or strategies for the future, and the assumptions underlying these forward-looking statements, including, but not limited to, future financial and operating performance, future opportunities and any other statements regarding events or developments that Trinity believes or anticipates will or may occur in the future. Trinity uses the words “anticipates,” “assumes,” “believes,” “estimates,” “expects,” “intends,” “forecasts,” “may,” “will,” “should,” “guidance,” “projected,” “outlook,” and similar expressions to identify these forward-looking statements. Forward-looking statements speak only as of the date of this release, and Trinity expressly disclaims any obligation or undertaking to disseminate any updates or revisions to any forward-looking statement contained herein to reflect any change in Trinity’s expectations with regard thereto or any change in events, conditions or circumstances on which any such statement is based, except as required by federal securities laws. Forward-looking statements involve risks and uncertainties that could cause actual results to differ materially from historical experience or present expectations, including but not limited to risks and uncertainties regarding economic, competitive, governmental, and technological factors affecting Trinity’s operations, markets, products, services and prices, and such forward-looking statements are not guarantees of future performance. For a discussion of such risks and uncertainties, which could cause actual results to differ from those contained in the forward-looking statements, see “Risk Factors” and “Forward-Looking Statements” in Trinity’s Annual Report on Form 10-K for the most recent fiscal year, as may be revised and updated by Trinity’s Quarterly Reports on Form 10-Q, and Trinity’s Current Reports on Form 8-K.
Item 9.01 Financial Statements and Exhibits.
(a) - (c) Not applicable.
(d) Exhibits:
| | | | | | | | |
| NO. | | DESCRIPTION |
| 99.1 | | | |
| 99.2 | | | |
| 99.3 | | | |
| | |
| 101.SCH | | Inline XBRL Taxonomy Extension Schema Document (filed electronically herewith). |
| | |
| 101.LAB | | Inline XBRL Taxonomy Extension Label Linkbase Document (filed electronically herewith). |
| 101.PRE | | Inline XBRL Taxonomy Extension Presentation Linkbase Document (filed electronically herewith). |
| | |
| 104 | | Cover Page Interactive Data File (formatted as Inline XBRL and contained in Exhibit 101). |
SIGNATURES
Pursuant to the requirements of the Securities Exchange Act of 1934, the registrant has duly caused this report to be signed on its behalf by the undersigned hereunto duly authorized.
| | | | | | | | |
| Trinity Industries, Inc. |
| | |
| February 20, 2025 | By: | /s/ Eric R. Marchetto |
| | Name: Eric R. Marchetto |
| | Title: Executive Vice President and Chief Financial Officer |
Exhibit 99.1
FOR IMMEDIATE RELEASE
Trinity Industries, Inc. Announces Fourth Quarter and Full Year 2024 Results
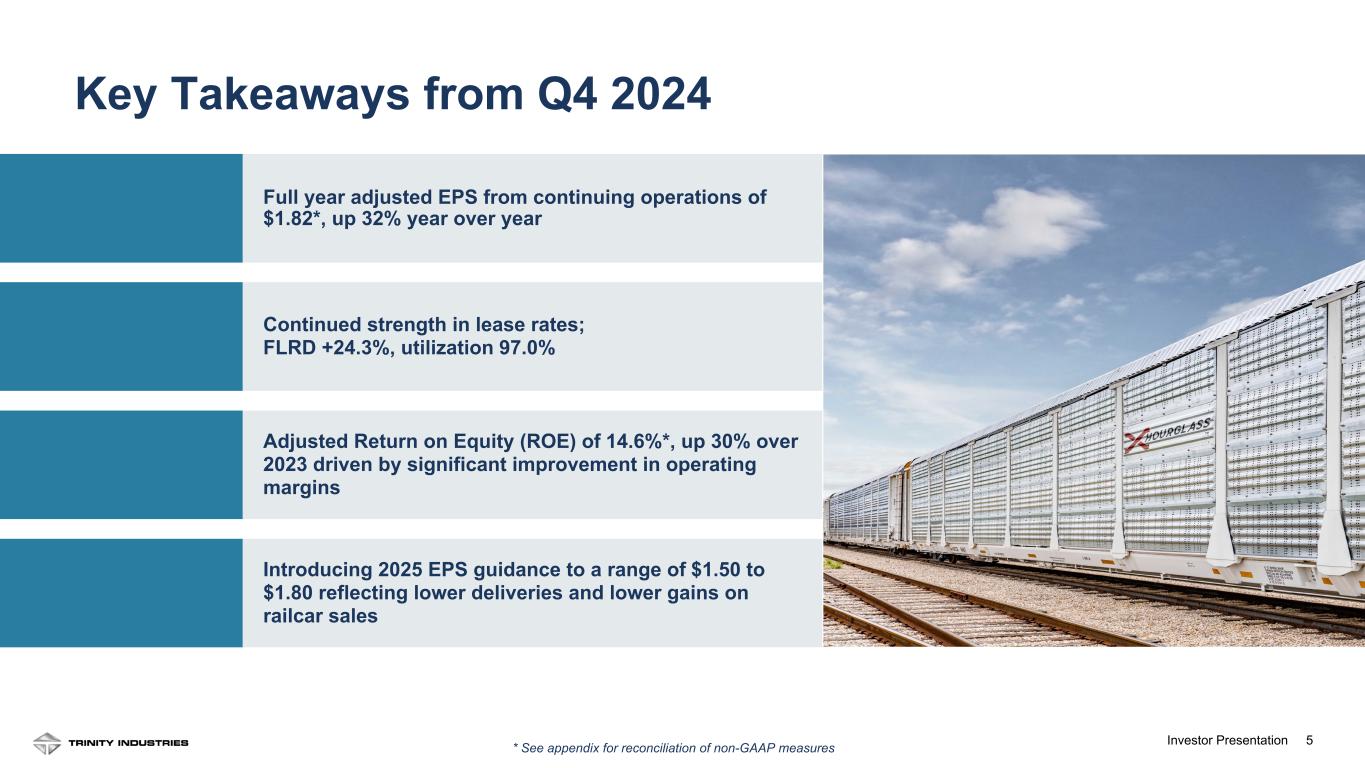
Reports full year GAAP and adjusted earnings from continuing operations of $1.81 and $1.82 per diluted share, respectively
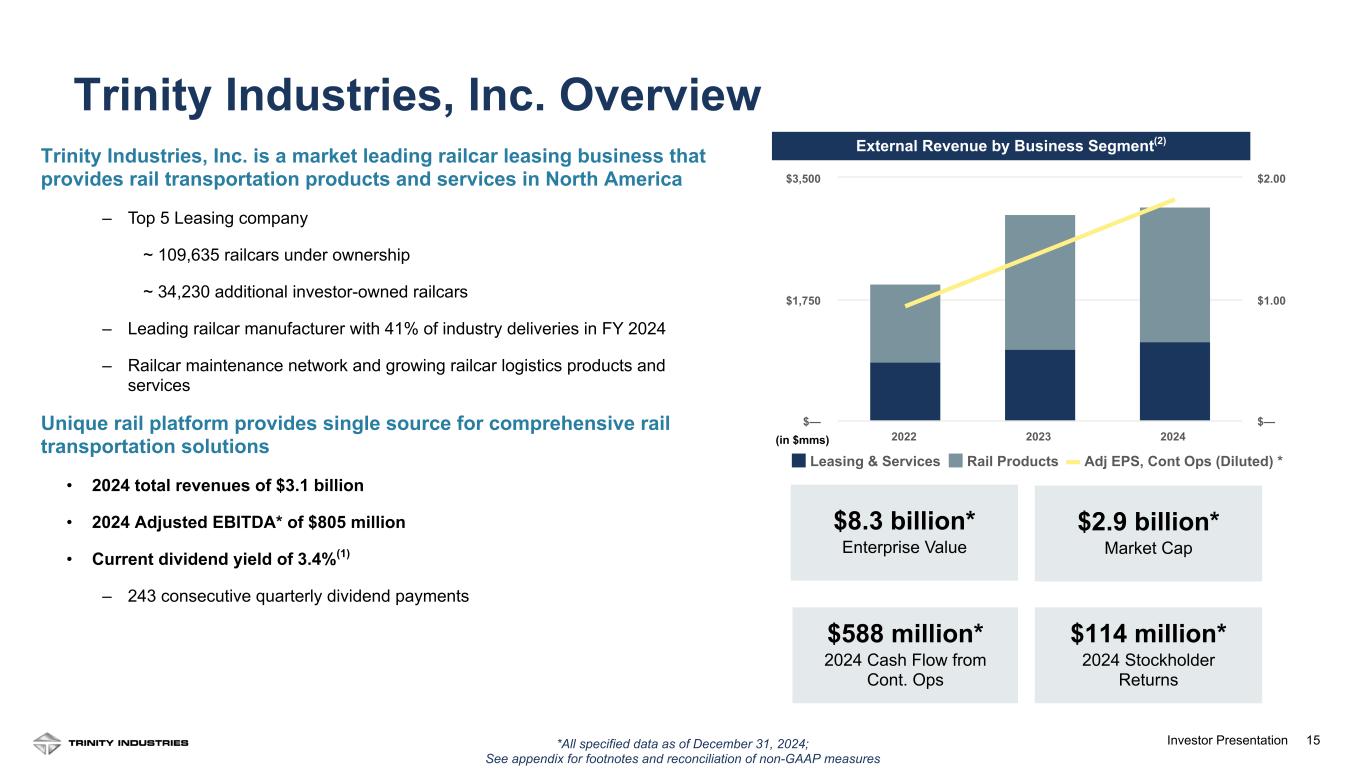
Generates full year operating cash flow of $588 million and net gains on lease portfolio sales of $57 million
Lease fleet utilization of 97.0% and Future Lease Rate Differential ("FLRD") of positive 24.3% at quarter-end
Delivered 17,570 railcars in the year; backlog of $2.1 billion at year-end
DALLAS, Texas – February 20, 2025 – Trinity Industries, Inc. (NYSE:TRN) today announced earnings results for the fourth quarter and year ended December 31, 2024.
Financial and Operational Highlights – Fourth Quarter
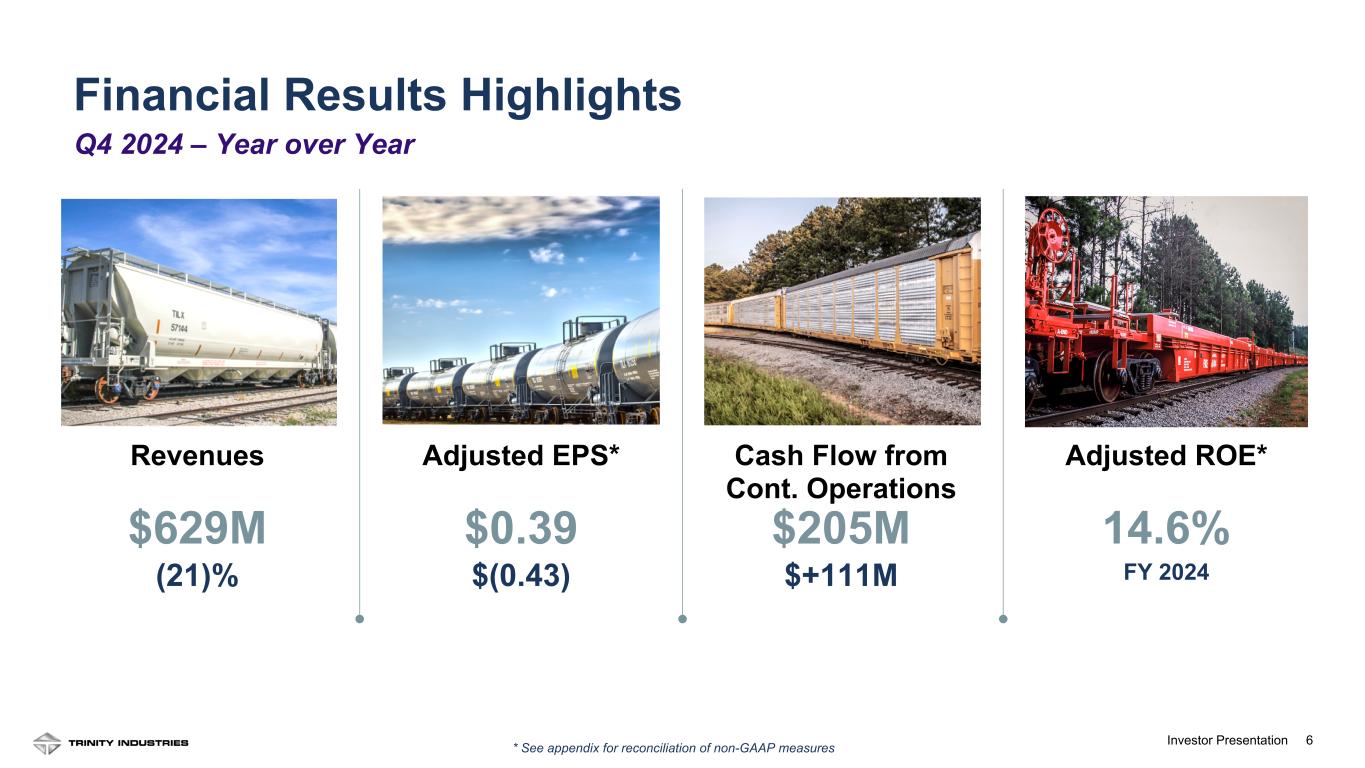
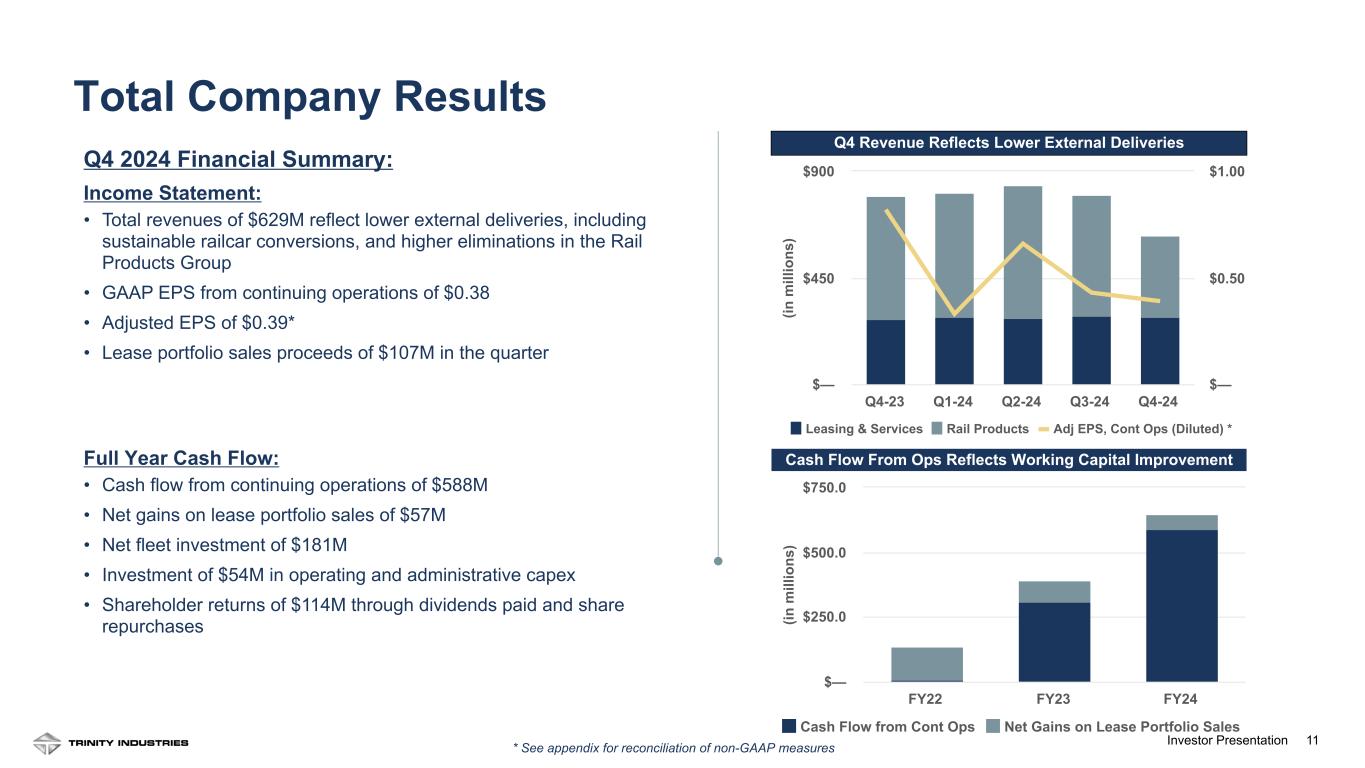
•Quarterly total company revenues of $629 million
•Quarterly income from continuing operations per common diluted share ("EPS") of $0.38 and adjusted EPS of $0.39
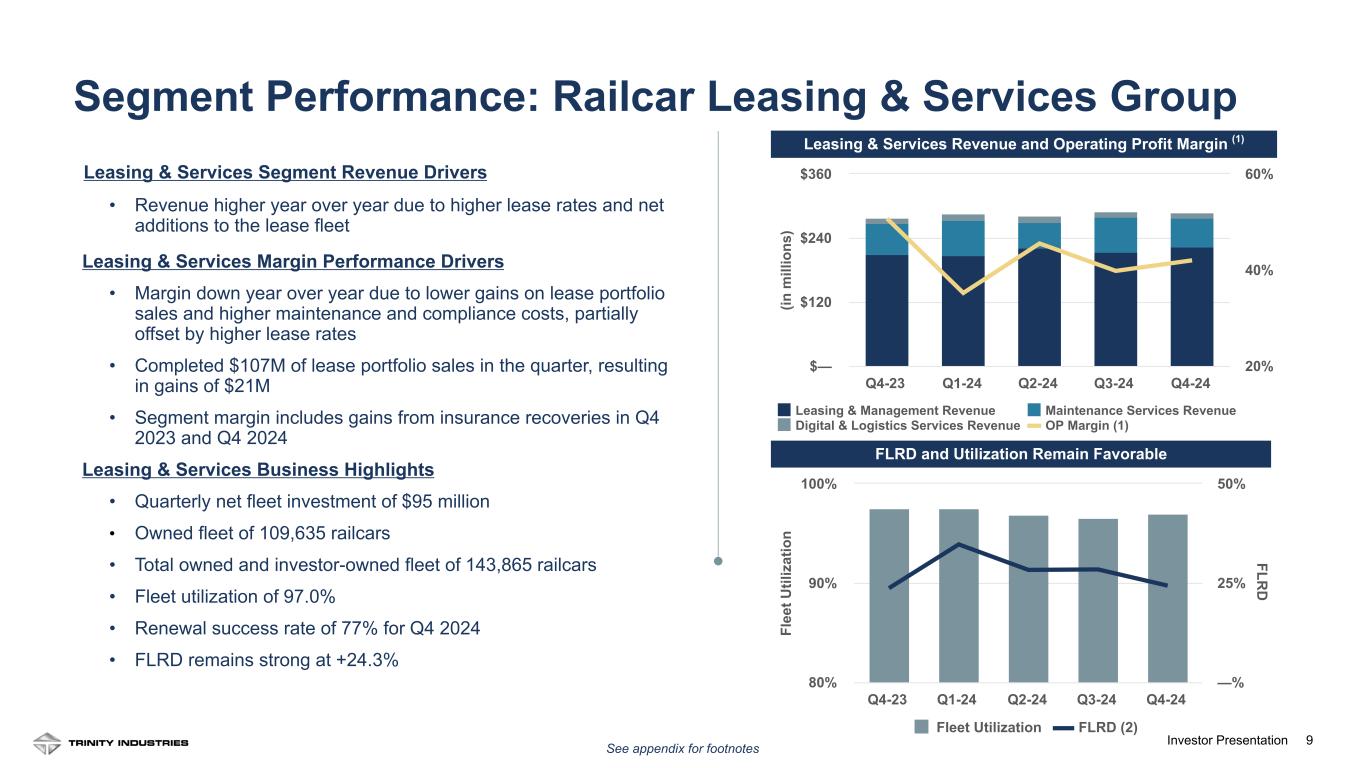
•Lease fleet utilization of 97.0% and FLRD of positive 24.3% at quarter-end
•Quarterly railcar deliveries of 3,760 and new railcar orders of 1,500
Financial and Operational Highlights – Full Year
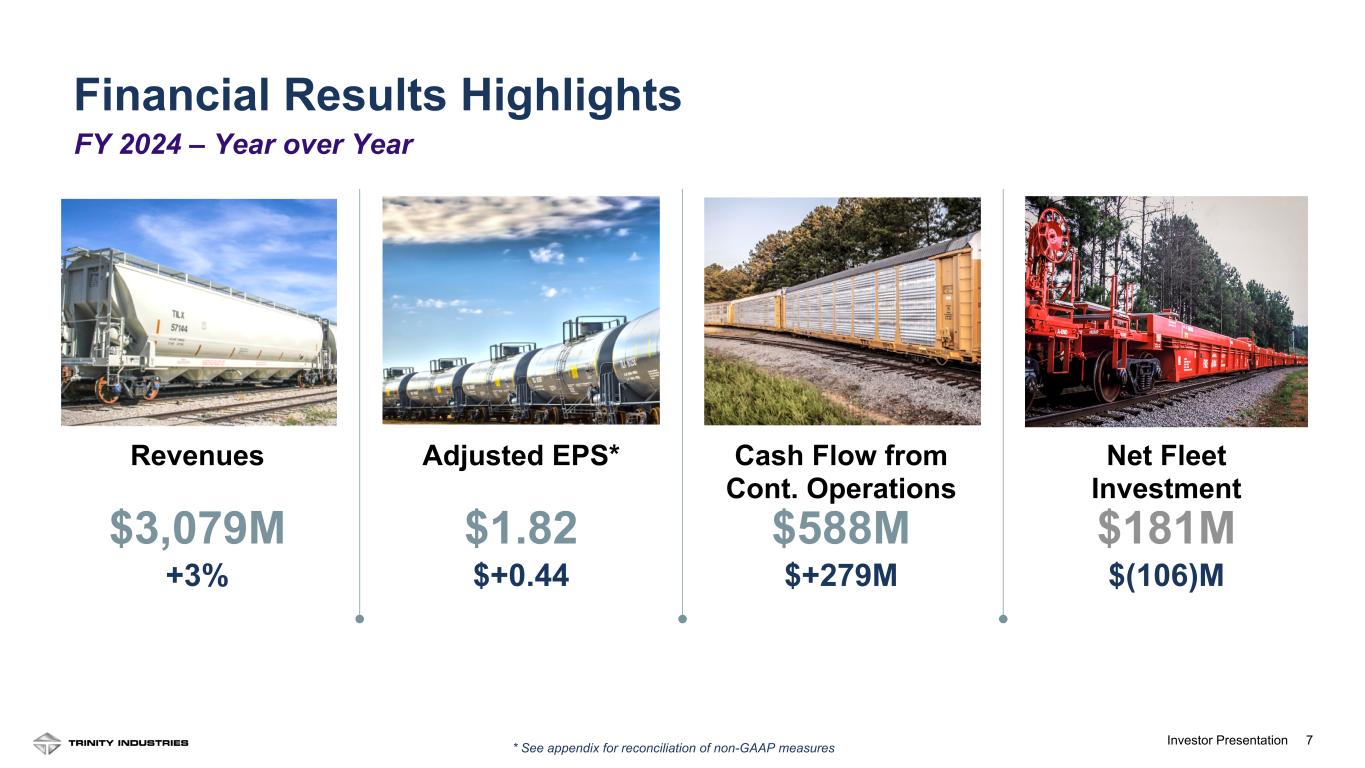
•Full year total company revenues of $3.1 billion
•Full year reported EPS of $1.81 and adjusted EPS of $1.82; $0.44 improvement in adjusted EPS year over year
•Full year cash flow from continuing operations of $588 million and net gains on lease portfolio sales of $57 million
•Full year Return on Equity ("ROE") of 13.3% and Adjusted ROE of 14.6%
2025 Guidance
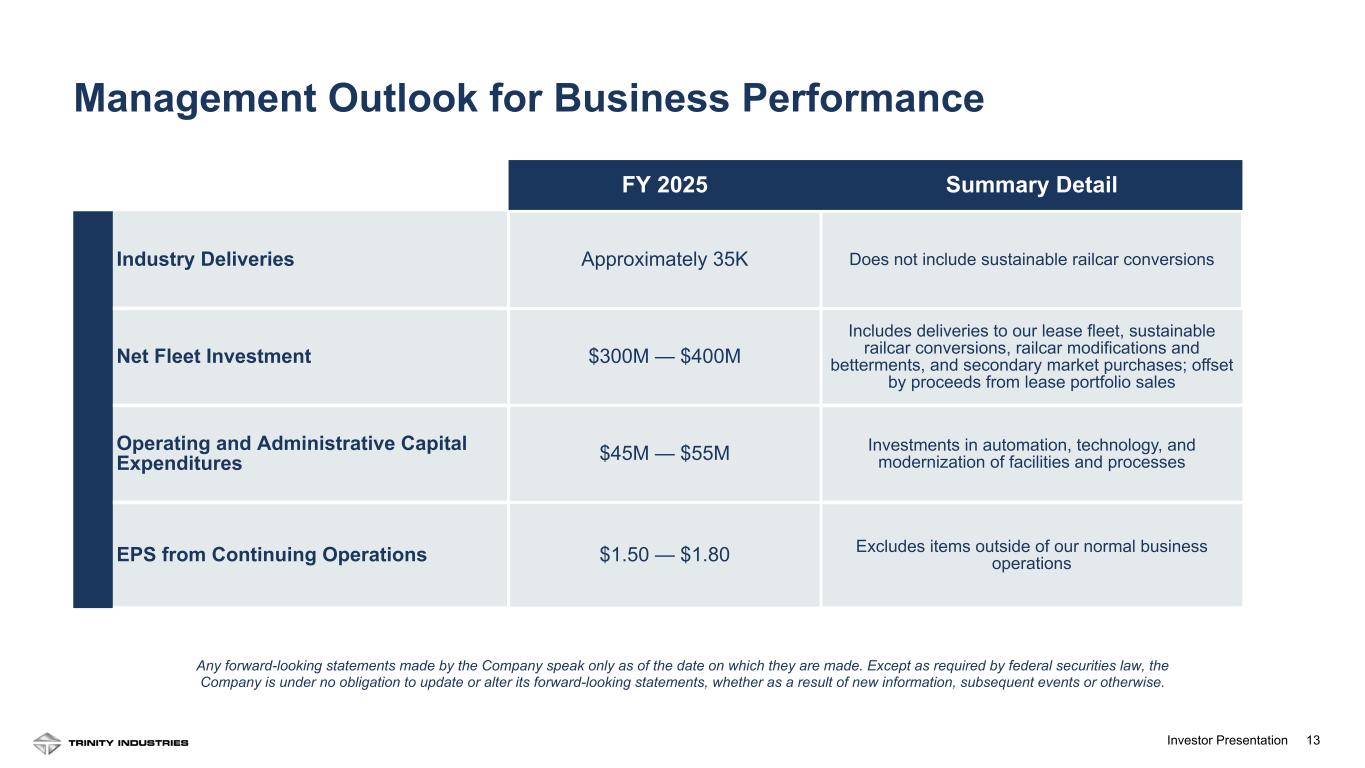
•Industry deliveries of approximately 35,000 railcars
•Net fleet investment of $300 million to $400 million
•Operating and administrative capital expenditures of $45 million to $55 million
•EPS of $1.50 to $1.80
◦Excludes items outside of our core business operations
Management Commentary
“Trinity Industries’ 2024 full year adjusted EPS of $1.82 represents a 32% increase over 2023, driven by higher lease rates, significantly improved margin performance, and a higher volume of external repairs. I extend my gratitude to the Trinity team for their outstanding efforts this year,” stated Trinity’s Chief Executive Officer and President Jean Savage. “We ended the year with an Adjusted ROE of 14.6%, within our target range. Furthermore, our cash flow from operations metric, which includes net gains on lease portfolio sales, was $645 million, up 65% over 2023.”
Ms. Savage continued, “In our Railcar Leasing and Services Group, we concluded the year with a 10% year over year revenue increase. We have now repriced over half of our fleet in a higher rate environment while maintaining a favorable utilization rate. We expect these positive trends to continue, evidenced by our FLRD of 24.3%. In the Rail Products Group, the impact of improved labor and operational efficiencies is evident with a 68% full year improvement in profit despite relatively flat revenue performance.”
“At our 2024 Investor Day, we emphasized that a less volatile operating environment combined with the reduced cyclicality of our platform will optimize our returns through the cycle. In 2025, we expect industry deliveries of 35,000, approximately a 20% decrease from 2024 as uncertainty around tariffs is delaying investment decisions."
"We are introducing our full year 2025 EPS guidance of $1.50 to $1.80. This guidance range reflects continued leasing revenue improvement, consistent operating margins, lower deliveries, and a higher proportion of deliveries to our lease fleet with slightly lower gains on lease portfolio sales in support of our net fleet investment targets.” Ms. Savage concluded, “We believe that our 2025 performance will demonstrate the strength of our platform and our ability to generate strong returns and consistent margin performance.”
Consolidated Financial Summary
| | | | | | | | | | | | | | | | | |
| Three Months Ended
December 31, | | |
| 2024 | | 2023 | | Year over Year – Comparison |
| ($ in millions, except per share amounts) | | |
| Revenues | $ | 629.4 | | $ | 797.9 | | Lower external deliveries, including sustainable railcar conversions, in the Rail Products Group |
| | | | | |
| | | | | |
Operating profit | $ | 112.0 | | $ | 148.7 | | Lower gains on lease portfolio sales and higher employee-related costs, including incentive-based compensation, as well as lower external deliveries in the Rail Products Group, partially offset by improved efficiencies in the Rail Products Group |
| | | | | |
| Interest expense, net | $ | 66.9 | | $ | 67.7 | | |
| Net income from continuing operations attributable to Trinity Industries, Inc. | $ | 31.9 | | $ | 68.1 | | |
| | | | | |
EBITDA (1) | $ | 191.1 | | $ | 225.2 | | |
| | | | | |
| Effective tax expense rate | 14.1 | % | | 8.8 | % | | Q4 2024 – Changes in valuation allowances
Q4 2023 – State apportionment and tax law changes |
| Diluted EPS – GAAP | $ | 0.38 | | $ | 0.81 | | |
Diluted EPS – Adjusted (1) | $ | 0.39 | | $ | 0.82 | | |
| | | | | |
| Year Ended
December 31, | | |
| 2024 | | 2023 | | Year over Year – Comparison |
| ($ in millions, except per share amounts) | | |
| Revenues | $ | 3,079.2 | | $ | 2,983.3 | | Higher volume of external repairs and higher lease rates in the Leasing Group and higher external deliveries, partially offset by a lower volume of sustainable railcar conversions in the Rail Products Group |
Operating profit | $ | 491.5 | | $ | 417.0 | | Improved efficiencies and the mix of railcars sold in the Rail Products Group and higher lease rates and a higher volume of external repairs in the Leasing Group, partially offset by lower gains on lease portfolio sales and higher employee-related costs |
| Interest expense, net | $ | 273.5 | | $ | 265.5 | | |
| Net income from continuing operations attributable to Trinity Industries, Inc. | $ | 152.7 | | $ | 119.4 | | |
EBITDA (1) | $ | 804.1 | | $ | 720.1 | | |
| Effective tax expense rate | 22.7 | % | | 6.0 | % | | 2023 tax rate includes benefits related to the release of residual taxes out of AOCI, state apportionment and tax law changes, and changes in valuation allowances |
| Diluted EPS – GAAP | $ | 1.81 | | $ | 1.43 | | |
Diluted EPS – Adjusted (1) | $ | 1.82 | | $ | 1.38 | | |
| | | | | |
| | | |
| | | | | |
| | | |
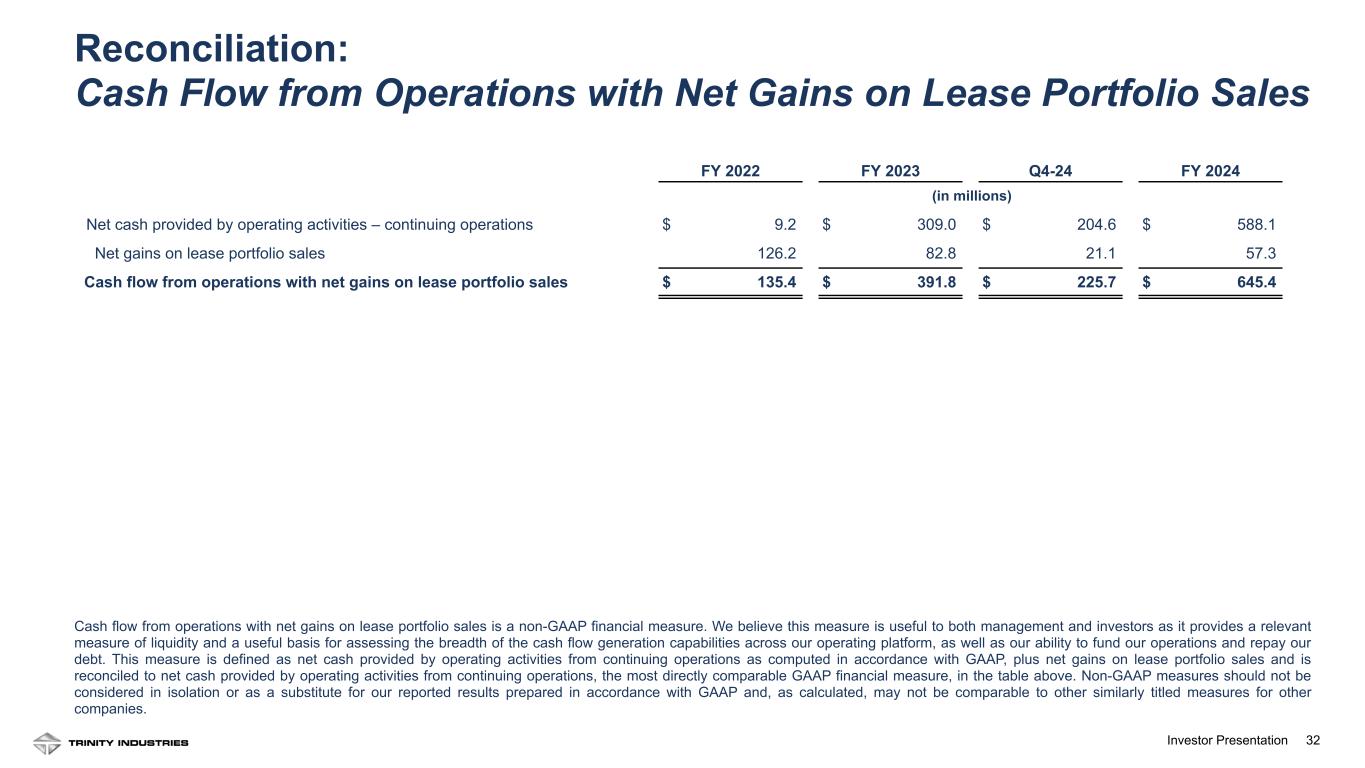
| Net cash provided by operating activities – continuing operations | $ | 588.1 | | $ | 309.0 | | Working capital improvements and significant improvement in Rail Products Group operating margin driving higher earnings |
Cash flow from operations with net gains on lease portfolio sales (1) | $ | 645.4 | | $ | 391.8 | |
| Net fleet investment | $ | 181.2 | | $ | 287.0 | | |
| Returns of capital to stockholders | $ | 114.2 | | $ | 86.0 | | |
| | | | | |
(1) Non-GAAP financial measure. See the Reconciliations of Non-GAAP Measures section within this Press Release for a reconciliation to the most directly comparable GAAP measure and why management believes this measure is useful to management and investors.
Business Group Summary
| | | | | | | | | | | | | | | | | |
| Three Months Ended
December 31, | | |
| 2024 | | 2023 | | Year over Year – Comparison |
| ($ in millions) | | |
| Railcar Leasing and Services Group | | |
| Revenues | $ | 287.1 | | $ | 278.1 | | Higher lease rates and net additions to the lease fleet |
| Operating profit | $ | 120.5 | | $ | 141.0 | | Lower gains on lease portfolio sales and higher maintenance and compliance costs, partially offset by higher lease rates |
| Operating profit margin | 42.0 | % | | 50.7 | % | |
| Gains on lease portfolio sales | $ | 21.1 | | $ | 36.4 | | |
Fleet utilization (1) | 97.0 | % | | 97.5 | % | | |
FLRD (2) | +24.3 | % | | +23.7 | % | | Continued strength in current lease rates |
Owned lease fleet (in units) (1) | 109,635 | | 109,295 | | |
| Investor-owned lease fleet (in units) | 34,230 | | 33,005 | | |
| Rail Products Group | | | | | |
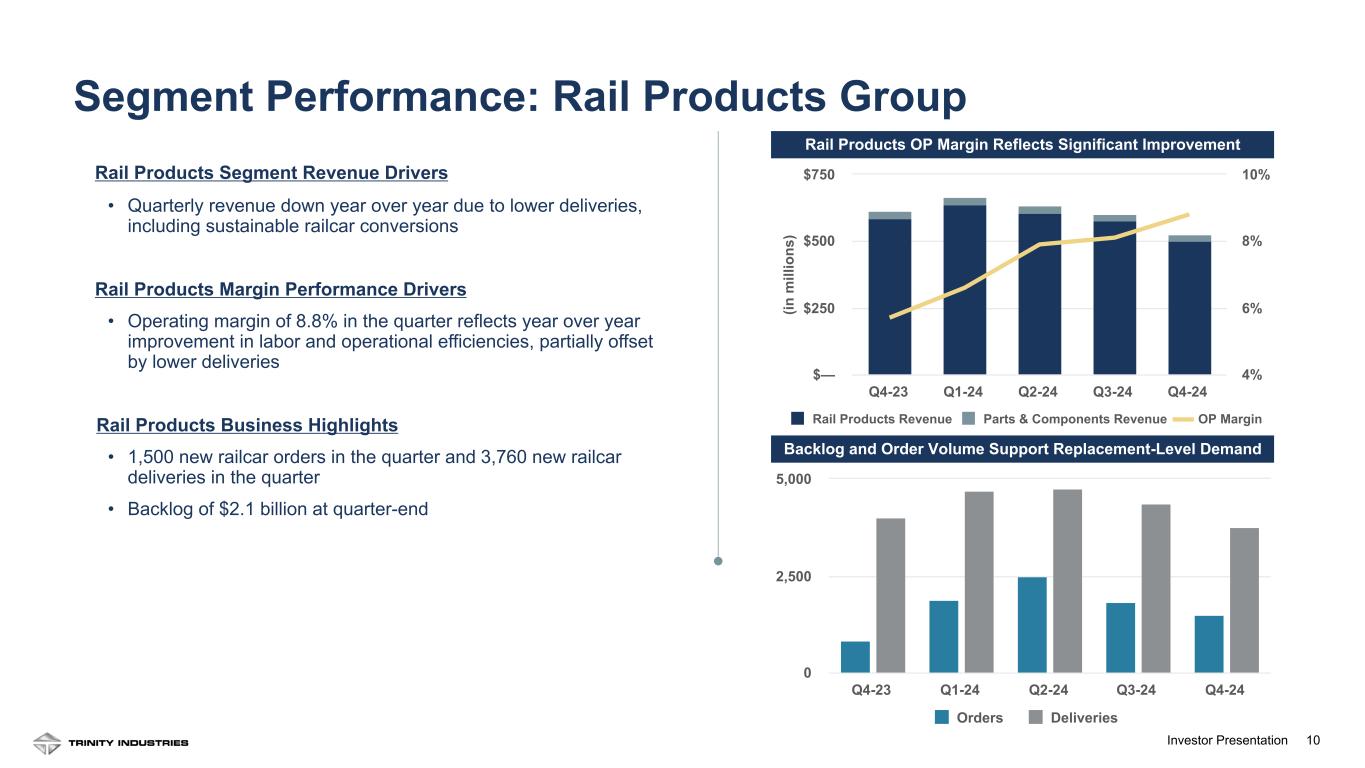
| Revenues | $ | 526.3 | | $ | 612.3 | | Lower deliveries, including sustainable railcar conversions |
| Operating profit | $ | 46.3 | | $ | 34.8 | | Improved labor and operational efficiencies, partially offset by lower deliveries |
| Operating profit margin | 8.8 | % | | 5.7 | % | |
| New railcars: | | | | | |
| Deliveries (in units) | 3,760 | | 4,000 | | |
| Orders (in units) | 1,500 | | 840 | | |
| Order value | $ | 191.9 | | $ | 156.1 | | |
| Backlog value | $ | 2,145.5 | | $ | 3,200.9 | |
|
| Sustainable railcar conversions: | | | | | |
| Deliveries (in units) | 55 | | 520 | | |
| | | | | |
| | | | | |
| Eliminations | | | | | |
| Eliminations – revenues | $ | (184.0) | | $ | (92.5) | | |
| Eliminations – operating profit | $ | (17.7) | | $ | (1.6) | | |
| Corporate and other | | | | | |
| Selling, engineering, and administrative expenses | $ | 32.8 | | $ | 26.6 | | Higher employee-related costs, including higher incentive-based compensation and costs associated with workforce reductions to improve our cost structure |
| | | | | |
| | | | | |
| December 31, 2024 | | December 31, 2023 | | |
| Loan-to-value ratio | | | | | |
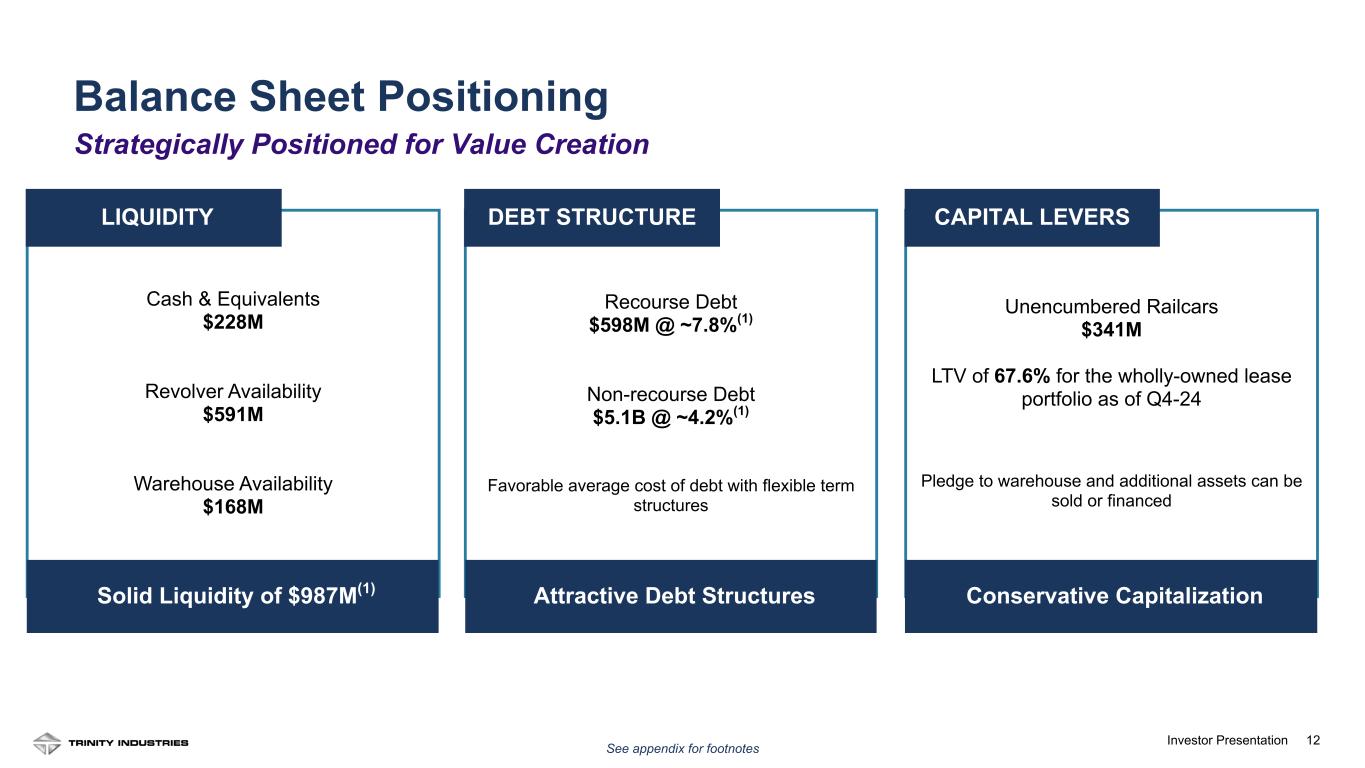
| Wholly-owned subsidiaries | 67.6 | % | | 64.4 | % | | |
(1) Includes wholly-owned railcars, partially-owned railcars, and railcars under leased-in arrangements.
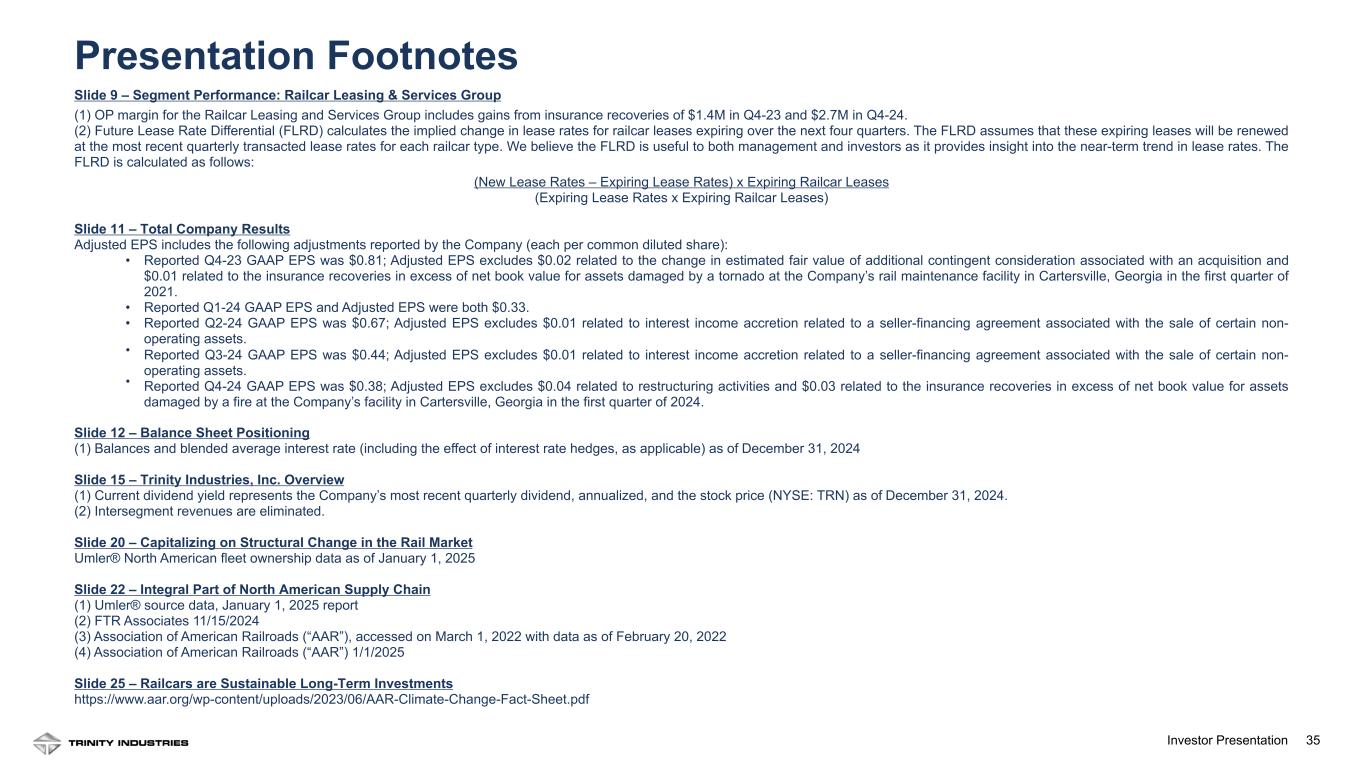
(2) FLRD calculates the implied change in lease rates for railcar leases expiring over the next four quarters. The FLRD assumes that these expiring leases will be renewed at the most recent quarterly transacted lease rates for each railcar type. We believe the FLRD is useful to both management and investors as it provides insight into the near-term trend in lease rates.
Additional Business Items
•Total committed liquidity of $987 million as of December 31, 2024.
•In December 2024, our Board of Directors declared an increase to our quarterly dividend from $0.28 per share to $0.30 per share.
Conference Call
Trinity will hold a conference call at 8:00 a.m. Eastern on February 20, 2025 to discuss its fourth quarter and full year results. To listen to the call, please visit the Investor Relations section of the Company's website at www.trin.net and access the Events & Presentations webpage, or the live call can be accessed at 1-888-317-6003 with the conference passcode "5284408". Please call at least 10 minutes in advance to ensure a proper connection. An audio replay may be accessed through the Company’s website or by dialing 1-877-344-7529 with passcode "2712638" until 11:59 p.m. Eastern on February 27, 2025.
Additionally, the Company will provide a quarterly investor presentation that will be accessible both within the webcast and on Trinity's Investor Relations website under the Events and Presentations portion of the site along with the Fourth Quarter Earnings Call event weblink.
Non-GAAP Financial Measures
We have included financial measures compiled in accordance with generally accepted accounting principles ("GAAP") and certain non-GAAP measures in this earnings press release to provide management and investors with additional information regarding our financial results. Non-GAAP measures should not be considered in isolation or as a substitute for our reported results prepared in accordance with GAAP and, as calculated, may not be comparable to other similarly titled measures for other companies. For each non-GAAP financial measure, a reconciliation to the most comparable GAAP measure has been included in the accompanying tables. When forward-looking non-GAAP measures are provided, quantitative reconciliations to the most directly comparable GAAP measures are not provided because management cannot, without unreasonable effort, predict the timing and amounts of certain items included in the computations of each of these measures. These factors include, but are not limited to: the product mix of expected railcar deliveries; the timing and amount of significant transactions and investments, such as lease portfolio sales, capital expenditures, and returns of capital to stockholders; and the amount and timing of certain other items outside the normal course of our core business operations.
About Trinity Industries
Trinity Industries, Inc., headquartered in Dallas, Texas, owns businesses that are leading providers of rail transportation products and services in North America. Our businesses market their railcar products and services under the trade name TrinityRail®. Our platform also includes the brands of RSI Logistics, a provider of software and logistics solutions, and Holden America, a supplier of railcar parts and components. Our platform provides railcar leasing and management services; railcar manufacturing; railcar maintenance and modifications; and other railcar logistics products and services. Trinity reports its financial results in two reportable business segments: (1) Railcar Leasing and Services Group and (2) Rail Products Group. For more information, visit: www.trin.net.
Some statements in this release, which are not historical facts, are “forward-looking statements” as defined by the Private Securities Litigation Reform Act of 1995. Forward-looking statements include statements about Trinity's estimates, expectations, beliefs, intentions or strategies for the future, and the assumptions underlying these forward-looking statements, including, but not limited to, future financial and operating performance, future opportunities and any other statements regarding events or developments that Trinity believes or anticipates will or may occur in the future. Trinity uses the words “anticipates,” “assumes,” “believes,” “estimates,” “expects,” “intends,” “forecasts,” “may,” “will,” “should,” “guidance,” “projected,” “outlook,” and similar expressions to identify these forward-looking statements. Forward-looking statements speak only as of the date of this release, and Trinity expressly disclaims any obligation or undertaking to disseminate any updates or revisions to any forward-looking statement contained herein to reflect any change in Trinity’s expectations with regard thereto or any change in events, conditions or circumstances on which any such statement is based, except as required by federal securities laws. Forward-looking statements involve risks and uncertainties that could cause actual results to differ materially from historical experience or our present expectations, including but not limited to risks and uncertainties regarding economic, competitive, governmental, and technological factors affecting Trinity’s operations, markets, products, services and prices, and such forward-looking statements are not guarantees of future performance. For a discussion of such risks and uncertainties, which could cause actual results to differ from those contained in the forward-looking statements, see “Risk Factors” and “Forward-Looking Statements” in Trinity’s Annual Report on Form 10-K for the most recent fiscal year, as may be revised and updated by Trinity’s Quarterly Reports on Form 10-Q, and Trinity’s Current Reports on Form 8-K.
| | |
| Investor Contact: |
| Leigh Anne Mann |
| Vice President, Investor Relations |
| Trinity Industries, Inc. |
| (Investors) 214/631-4420 |
|
| Media Contact: |
| Jack L. Todd |
| Vice President, Public Affairs |
| Trinity Industries, Inc. |
| (Media Line) 214/589-8909 |
- TABLES TO FOLLOW -
Trinity Industries, Inc.
Condensed Consolidated Statements of Operations
(in millions, except per share amounts)
(unaudited)
| | | | | | | | | | | | | | | | | | | | | | | |
| Three Months Ended
December 31, | | Year Ended
December 31, |
| 2024 | | 2023 | | 2024 | | 2023 |
| Revenues | $ | 629.4 | | | $ | 797.9 | | | $ | 3,079.2 | | | $ | 2,983.3 | |
| Operating costs: | | | | | | | |
| Cost of revenues | 474.4 | | | 637.0 | | | 2,411.0 | | | 2,456.2 | |
| Selling, engineering, and administrative expenses | 61.6 | | | 48.6 | | | 235.7 | | | 201.9 | |
| Gains on dispositions of property: | | | | | | | |
| Lease portfolio sales | 21.1 | | | 36.4 | | | 57.3 | | | 82.8 | |
| Other | 1.8 | | | — | | | 6.0 | | | 6.8 | |
| | | | | | | |
| Restructuring activities, net | 4.3 | | | — | | | 4.3 | | | (2.2) | |
| 517.4 | | | 649.2 | | | 2,587.7 | | | 2,566.3 | |
| Operating profit | 112.0 | | | 148.7 | | | 491.5 | | | 417.0 | |
| Interest expense, net | 66.9 | | | 67.7 | | | 273.5 | | | 265.5 | |
| | | | | | | |
| | | | | | | |
| Other, net | (2.4) | | | 0.5 | | | (3.8) | | | 2.5 | |
| Income from continuing operations before income taxes | 47.5 | | | 80.5 | | | 221.8 | | | 149.0 | |
| Provision (benefit) for income taxes: | | | | | | | |
| Current | 27.3 | | | 24.3 | | | 72.5 | | | 50.5 | |
| Deferred | (20.6) | | | (17.2) | | | (22.1) | | | (41.5) | |
| 6.7 | | | 7.1 | | | 50.4 | | | 9.0 | |
| Income from continuing operations | 40.8 | | | 73.4 | | | 171.4 | | | 140.0 | |
| Loss from discontinued operations, net of income taxes | (3.0) | | | (5.3) | | | (14.3) | | | (13.4) | |
| | | | | | | |
| Net income | 37.8 | | | 68.1 | | | 157.1 | | | 126.6 | |
| Net income attributable to noncontrolling interest | 8.9 | | | 5.3 | | | 18.7 | | | 20.6 | |
| Net income attributable to Trinity Industries, Inc. | $ | 28.9 | | | $ | 62.8 | | | $ | 138.4 | | | $ | 106.0 | |
| | | | | | | |
| Basic earnings per common share: | | | | | | | |
| Income from continuing operations | $ | 0.39 | | | $ | 0.83 | | | $ | 1.86 | | | $ | 1.47 | |
| Loss from discontinued operations | (0.04) | | | (0.06) | | | (0.17) | | | (0.16) | |
| Basic net income attributable to Trinity Industries, Inc. | $ | 0.35 | | | $ | 0.77 | | | $ | 1.69 | | | $ | 1.31 | |
| Diluted earnings per common share: | | | | | | | |
| Income from continuing operations | $ | 0.38 | | | $ | 0.81 | | | $ | 1.81 | | | $ | 1.43 | |
| Loss from discontinued operations | (0.04) | | | (0.06) | | | (0.17) | | | (0.16) | |
| Diluted net income attributable to Trinity Industries, Inc. | $ | 0.34 | | | $ | 0.75 | | | $ | 1.64 | | | $ | 1.27 | |
| Weighted average number of shares outstanding: | | | | | | | |
| Basic | 81.9 | | | 81.6 | | | 81.9 | | | 81.2 | |
| Diluted | 84.5 | | | 83.5 | | | 84.2 | | | 83.4 | |
Trinity has certain unvested restricted stock awards that participate in dividends on a nonforfeitable basis and are therefore considered to be participating securities. Consequently, diluted net income attributable to Trinity Industries, Inc. per common share is calculated under both the two-class method and the treasury stock method, and the more dilutive of the two calculations is presented.
Trinity Industries, Inc.
Condensed Consolidated Balance Sheets
(in millions)
(unaudited)
| | | | | | | | | | | |
| December 31, 2024 | | December 31, 2023 |
| ASSETS | | | |
| Cash and cash equivalents | $ | 228.2 | | | $ | 105.7 | |
| | | |
| Receivables, net of allowance | 379.1 | | | 363.5 | |
| Income tax receivable | 2.4 | | | 5.2 | |
| Inventories | 476.2 | | | 684.3 | |
| Restricted cash | 146.2 | | | 129.4 | |
| Property, plant, and equipment, net: | | | |
| Railcars in our lease fleet: | | | |
| Wholly-owned subsidiaries | 5,948.1 | | | 5,931.8 | |
| Partially-owned subsidiaries | 1,416.0 | | | 1,473.2 | |
| Deferred profit on railcar products sold | (732.5) | | | (750.2) | |
| Operating and administrative assets | 356.5 | | | 350.0 | |
| 6,988.1 | | | 7,004.8 | |
| Goodwill | 221.5 | | | 221.5 | |
| | | |
| Other assets | 390.5 | | | 392.1 | |
| Total assets | $ | 8,832.2 | | | $ | 8,906.5 | |
| | | |
| LIABILITIES AND STOCKHOLDERS' EQUITY | | | |
| Accounts payable | $ | 251.7 | | | $ | 305.3 | |
| Accrued liabilities | 353.0 | | | 302.3 | |
| Debt: | | | |
| Recourse | 597.8 | | | 794.6 | |
| Non-recourse: | | | |
| Wholly-owned subsidiaries | 4,021.3 | | | 3,819.2 | |
| Partially-owned subsidiaries | 1,071.8 | | | 1,140.4 | |
| 5,690.9 | | | 5,754.2 | |
| Deferred income taxes | 1,075.6 | | | 1,103.5 | |
| | | |
| Other liabilities | 153.8 | | | 165.7 | |
| Stockholders' equity: | | | |
| Trinity Industries, Inc. | 1,058.9 | | | 1,037.1 | |
| Noncontrolling interest | 248.3 | | | 238.4 | |
| 1,307.2 | | | 1,275.5 | |
| Total liabilities and stockholders' equity | $ | 8,832.2 | | | $ | 8,906.5 | |
Trinity Industries, Inc.
Condensed Consolidated Statements of Cash Flows
(in millions)
(unaudited)
| | | | | | | | | | | |
| Year Ended
December 31, |
| 2024 | | 2023 |
| Operating activities: | | | |
| Net cash provided by operating activities – continuing operations | $ | 588.1 | | | $ | 309.0 | |
| Net cash used in operating activities – discontinued operations | (14.3) | | | (13.4) | |
| Net cash provided by operating activities | 573.8 | | | 295.6 | |
| | | |
| Investing activities: | | | |
| Capital expenditures – lease fleet | (541.9) | | | (668.8) | |
| Proceeds from lease portfolio sales | 360.7 | | | 381.8 | |
| Capital expenditures – operating and administrative | (53.8) | | | (41.3) | |
| Acquisitions, net of cash acquired | — | | | (62.2) | |
| Other investing activities | 20.4 | | | 27.5 | |
| | | |
| | | |
| | | |
| Net cash used in investing activities | (214.6) | | | (363.0) | |
| | | |
| Financing activities: | | | |
| Net proceeds from (repayments of) debt | (80.1) | | | 133.8 | |
| Shares repurchased | (20.7) | | | — | |
| Dividends paid to common shareholders | (93.2) | | | (86.0) | |
| Other financing activities | (25.9) | | | (39.6) | |
| | | |
| | | |
| Net cash provided by (used in) financing activities | (219.9) | | | 8.2 | |
| Net increase (decrease) in cash, cash equivalents, and restricted cash | 139.3 | | | (59.2) | |
| Cash, cash equivalents, and restricted cash at beginning of period | 235.1 | | | 294.3 | |
| Cash, cash equivalents, and restricted cash at end of period | $ | 374.4 | | | $ | 235.1 | |
Trinity Industries, Inc.
Reconciliations of Non-GAAP Measures
(in millions, except per share amounts)
(unaudited)
Adjusted Operating Results
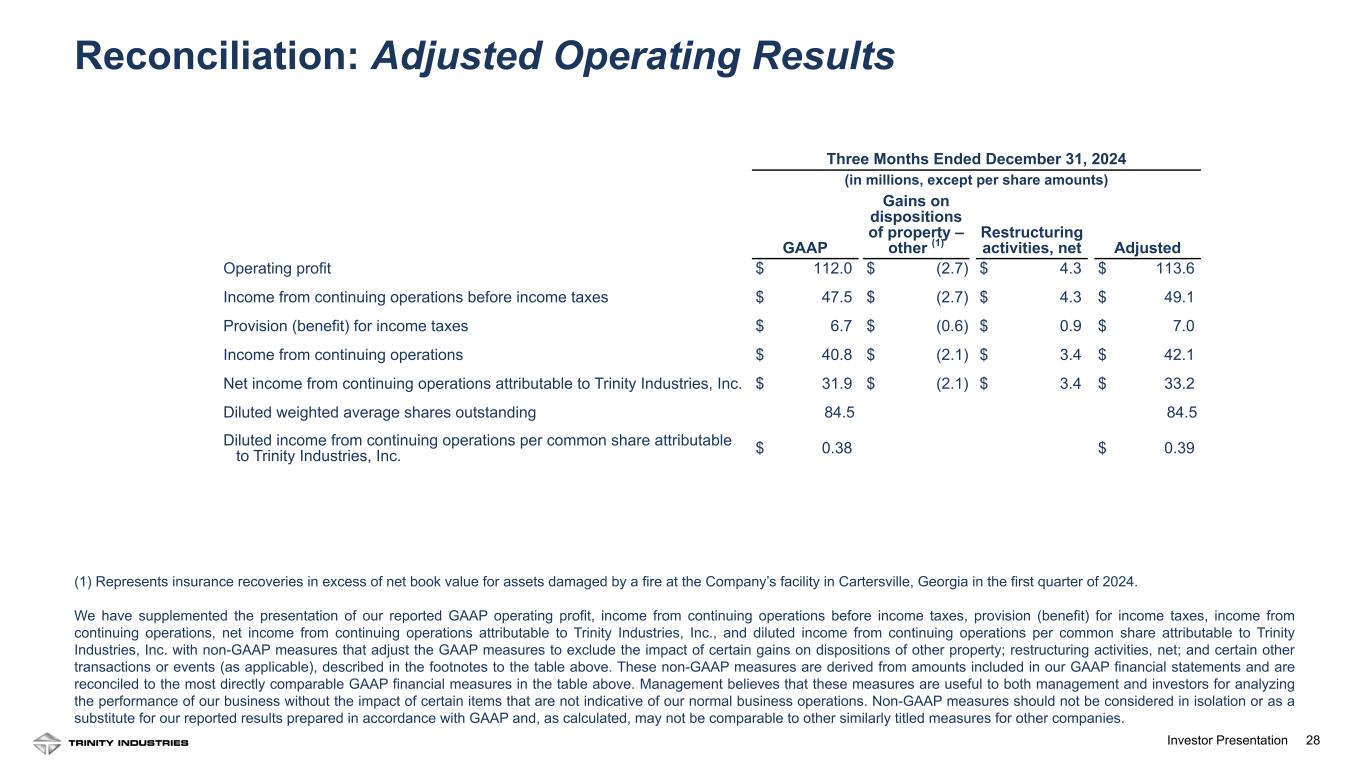
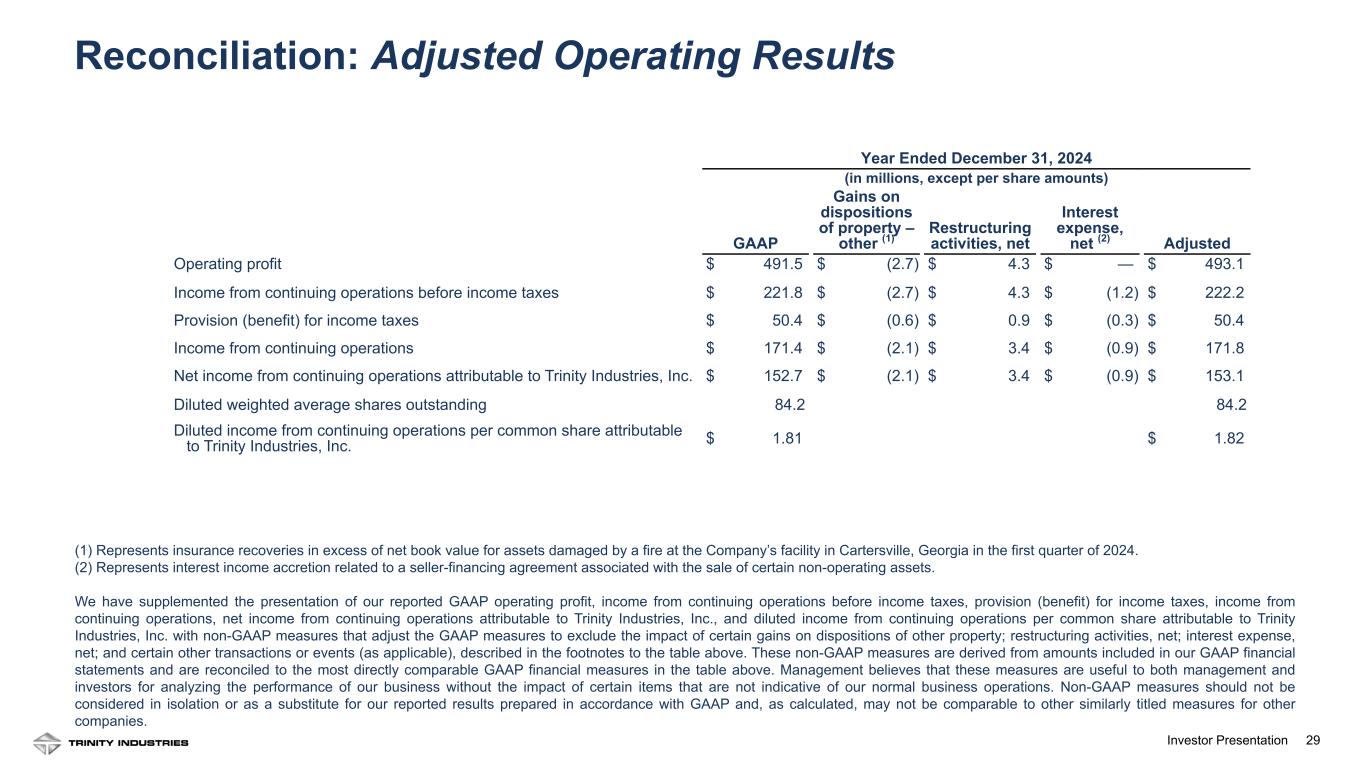
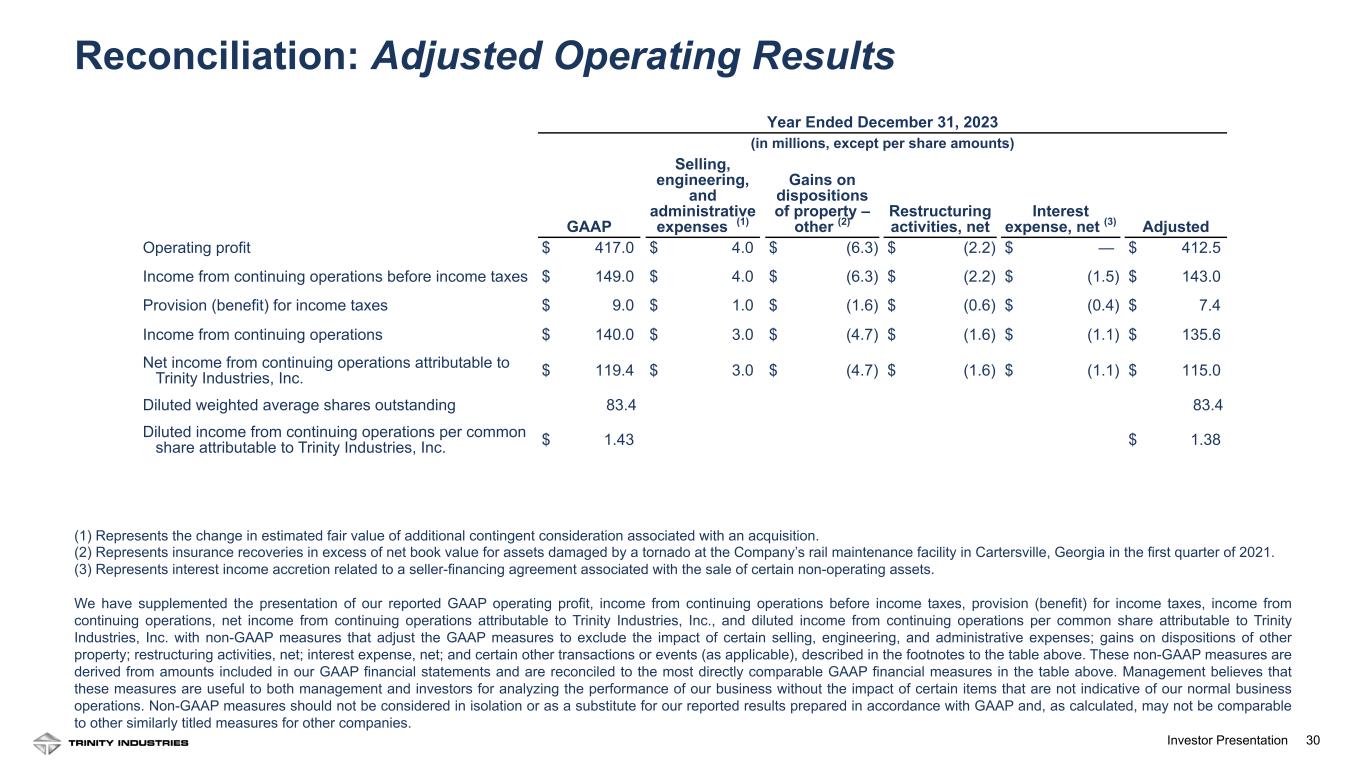
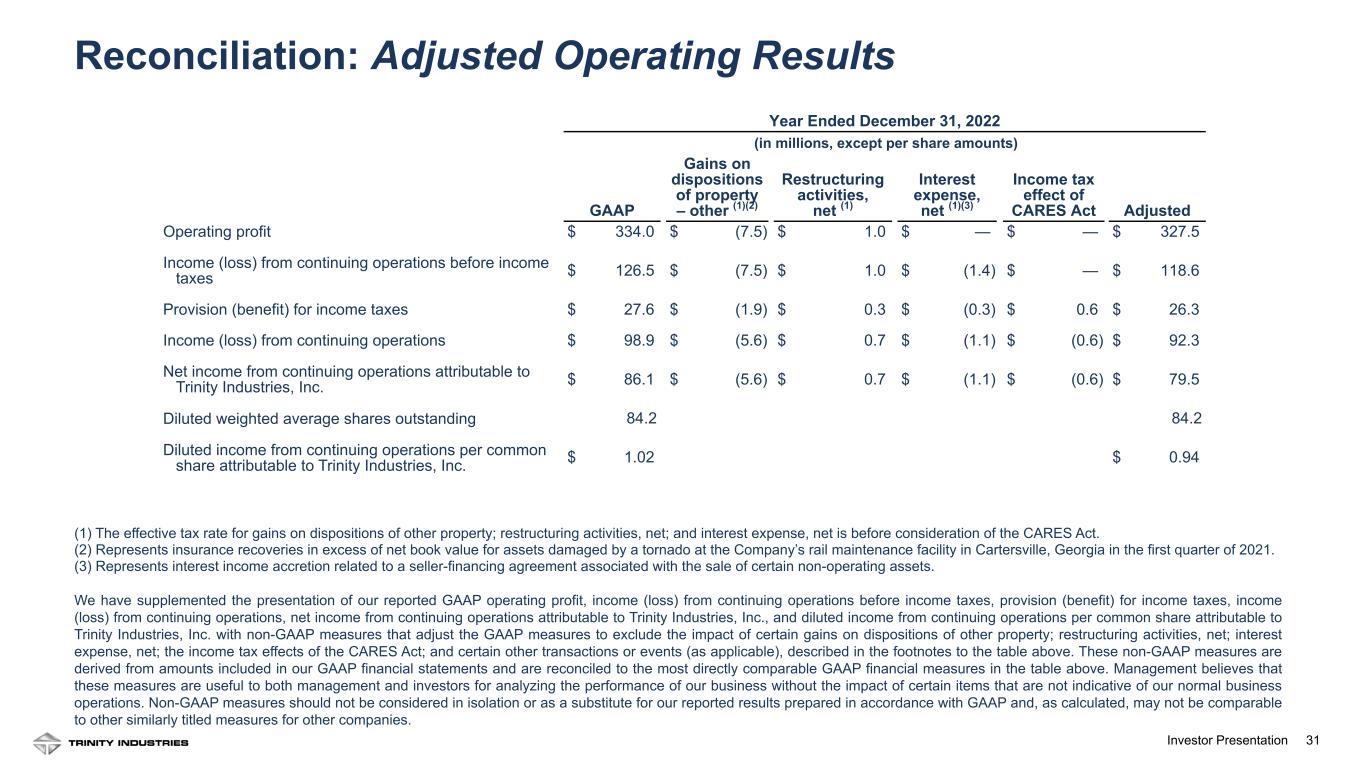
We have supplemented the presentation of our reported GAAP operating profit, income from continuing operations before income taxes, provision (benefit) for income taxes, income from continuing operations, net income from continuing operations attributable to Trinity Industries, Inc., and diluted income from continuing operations per common share attributable to Trinity Industries, Inc. with non-GAAP measures that adjust the GAAP measures to exclude the impact of certain selling, engineering, and administrative expenses; gains on dispositions of other property; restructuring activities, net; interest expense, net; and certain other transactions or events (as applicable), described in the footnotes to the tables below. These non-GAAP measures are derived from amounts included in our GAAP financial statements and are reconciled to the most directly comparable GAAP financial measures in the tables below. Management believes that these measures are useful to both management and investors for analyzing the performance of our business without the impact of certain items that are not indicative of our normal business operations. Non-GAAP measures should not be considered in isolation or as a substitute for our reported results prepared in accordance with GAAP and, as calculated, may not be comparable to other similarly titled measures for other companies.
| | | | | | | | | | | | | | | | | | | | | | | | | | | | | | | |
| Three Months Ended December 31, 2024 |
| GAAP | | | | | | Gains on dispositions of property – other (1) | | Restructuring activities, net | | | | | | Adjusted |
| Operating profit | $ | 112.0 | | | | | | | $ | (2.7) | | | $ | 4.3 | | | | | | | $ | 113.6 | |
| | | | | | | | | | | | | | | |
| | | | | | | | | | | | | | | |
| | | | | | | | | | | | | | | |
| Income from continuing operations before income taxes | $ | 47.5 | | | | | | | $ | (2.7) | | | $ | 4.3 | | | | | | | $ | 49.1 | |
| | | | | | | | | | | | | | | |
| Provision (benefit) for income taxes | $ | 6.7 | | | | | | | $ | (0.6) | | | $ | 0.9 | | | | | | | $ | 7.0 | |
| | | | | | | | | | | | | | | |
| Income from continuing operations | $ | 40.8 | | | | | | | $ | (2.1) | | | $ | 3.4 | | | | | | | $ | 42.1 | |
| | | | | | | | | | | | | | | |
| Net income from continuing operations attributable to Trinity Industries, Inc. | $ | 31.9 | | | | | | | $ | (2.1) | | | $ | 3.4 | | | | | | | $ | 33.2 | |
| | | | | | | | | | | | | | | |
| Diluted weighted average shares outstanding | 84.5 | | | | | | | | | | | | | | 84.5 |
| | | | | | | | | | | | | | | |
| Diluted income from continuing operations per common share attributable to Trinity Industries, Inc. | $ | 0.38 | | | | | | | | | | | | | | | $ | 0.39 | |
| | | | | | | | | | | | | | | | | | | | | | | | | | | | | | | | | | | | | |
| Year Ended December 31, 2024 |
| GAAP | | | | Gains on dispositions of property – other (1) | | Restructuring activities, net | | | | Interest expense, net (2) | | | | | | Adjusted |
| Operating profit | $ | 491.5 | | | | | $ | (2.7) | | | $ | 4.3 | | | | | $ | — | | | | | | | $ | 493.1 | |
| | | | | | | | | | | | | | | | | |
| | | | | | | | | | | | | | | | | |
| | | | | | | | | | | | | | | | | |
| | | | | | | | | | | | | | | | | |
| | | | | | | | | | | | | | | | | |
| Income from continuing operations before income taxes | $ | 221.8 | | | | | $ | (2.7) | | | $ | 4.3 | | | | | $ | (1.2) | | | | | | | $ | 222.2 | |
| | | | | | | | | | | | | | | | | |
| Provision (benefit) for income taxes | $ | 50.4 | | | | | $ | (0.6) | | | $ | 0.9 | | | | | $ | (0.3) | | | | | | | $ | 50.4 | |
| | | | | | | | | | | | | | | | | |
| Income from continuing operations | $ | 171.4 | | | | | $ | (2.1) | | | $ | 3.4 | | | | | $ | (0.9) | | | | | | | $ | 171.8 | |
| | | | | | | | | | | | | | | | | |
| Net income from continuing operations attributable to Trinity Industries, Inc. | $ | 152.7 | | | | | $ | (2.1) | | | $ | 3.4 | | | | | $ | (0.9) | | | | | | | $ | 153.1 | |
| | | | | | | | | | | | | | | | | |
| Diluted weighted average shares outstanding | 84.2 | | | | | | | | | | | | | | | | 84.2 |
| | | | | | | | | | | | | | | | | |
| Diluted income from continuing operations per common share attributable to Trinity Industries, Inc. | $ | 1.81 | | | | | | | | | | | | | | | | | $ | 1.82 | |
| | | | | | | | | | | | | | | | | | | | | | | | | | | | | | | |
| Three Months Ended December 31, 2023 |
| GAAP | | Selling, engineering, and administrative expenses (3) | | Gains on dispositions of property – other (4) | | | | Interest expense, net (2) | | Adjusted |
| Operating profit | $ | 148.7 | | | $ | 2.0 | | | $ | (1.4) | | | | | $ | — | | | $ | 149.3 | |
| | | | | | | | | | | |
| Income from continuing operations before income taxes | $ | 80.5 | | | $ | 2.0 | | | $ | (1.4) | | | | | $ | (0.4) | | | $ | 80.7 | |
| | | | | | | | | | | |
| Provision (benefit) for income taxes | $ | 7.1 | | | $ | 0.5 | | | $ | (0.4) | | | | | $ | (0.1) | | | $ | 7.1 | |
| | | | | | | | | | | |
| Income from continuing operations | $ | 73.4 | | | $ | 1.5 | | | $ | (1.0) | | | | | $ | (0.3) | | | $ | 73.6 | |
| | | | | | | | | | | |
| Net income from continuing operations attributable to Trinity Industries, Inc. | $ | 68.1 | | | $ | 1.5 | | | $ | (1.0) | | | | | $ | (0.3) | | | $ | 68.3 | |
| | | | | | | | | | | |
| Diluted weighted average shares outstanding | 83.5 | | | | | | | | | | 83.5 |
| | | | | | | | | | | |
| Diluted income from continuing operations per common share attributable to Trinity Industries, Inc. | $ | 0.81 | | | | | | | | | | | $ | 0.82 | |
| | | | | | | | | | | | | | | | | | | | | | | | | | | | | | | | | | | | | | | |
| Year Ended December 31, 2023 |
| GAAP | | Selling, engineering, and administrative expenses (3) | | Gains on dispositions of property – other (4) | | Restructuring activities, net | | | | | | Interest expense, net (2) | | Adjusted |
| Operating profit | $ | 417.0 | | | $ | 4.0 | | | $ | (6.3) | | | $ | (2.2) | | | | | | | $ | — | | | $ | 412.5 | |
| | | | | | | | | | | | | | | |
| Income from continuing operations before income taxes | $ | 149.0 | | | $ | 4.0 | | | $ | (6.3) | | | $ | (2.2) | | | | | | | $ | (1.5) | | | $ | 143.0 | |
| | | | | | | | | | | | | | | |
| Provision (benefit) for income taxes | $ | 9.0 | | | $ | 1.0 | | | $ | (1.6) | | | $ | (0.6) | | | | | | | $ | (0.4) | | | $ | 7.4 | |
| | | | | | | | | | | | | | | |
| Income from continuing operations | $ | 140.0 | | | $ | 3.0 | | | $ | (4.7) | | | $ | (1.6) | | | | | | | $ | (1.1) | | | $ | 135.6 | |
| | | | | | | | | | | | | | | |
| Net income from continuing operations attributable to Trinity Industries, Inc. | $ | 119.4 | | | $ | 3.0 | | | $ | (4.7) | | | $ | (1.6) | | | | | | | $ | (1.1) | | | $ | 115.0 | |
| | | | | | | | | | | | | | | |
| Diluted weighted average shares outstanding | 83.4 | | | | | | | | | | | | | | 83.4 |
| | | | | | | | | | | | | | | |
| Diluted income from continuing operations per common share attributable to Trinity Industries, Inc. | $ | 1.43 | | | | | | | | | | | | | | | $ | 1.38 | |
(1) Represents insurance recoveries in excess of net book value for assets damaged by a fire at the Company’s facility in Cartersville, Georgia in the first quarter of 2024.
(2) Represents interest income accretion related to a seller-financing agreement associated with the sale of certain non-operating assets.
(3) Represents the change in estimated fair value of additional contingent consideration associated with an acquisition.
(4) Represents insurance recoveries in excess of net book value for assets damaged by a tornado at the Company’s rail maintenance facility in Cartersville, Georgia in the first quarter of 2021.
Adjusted Return on Equity
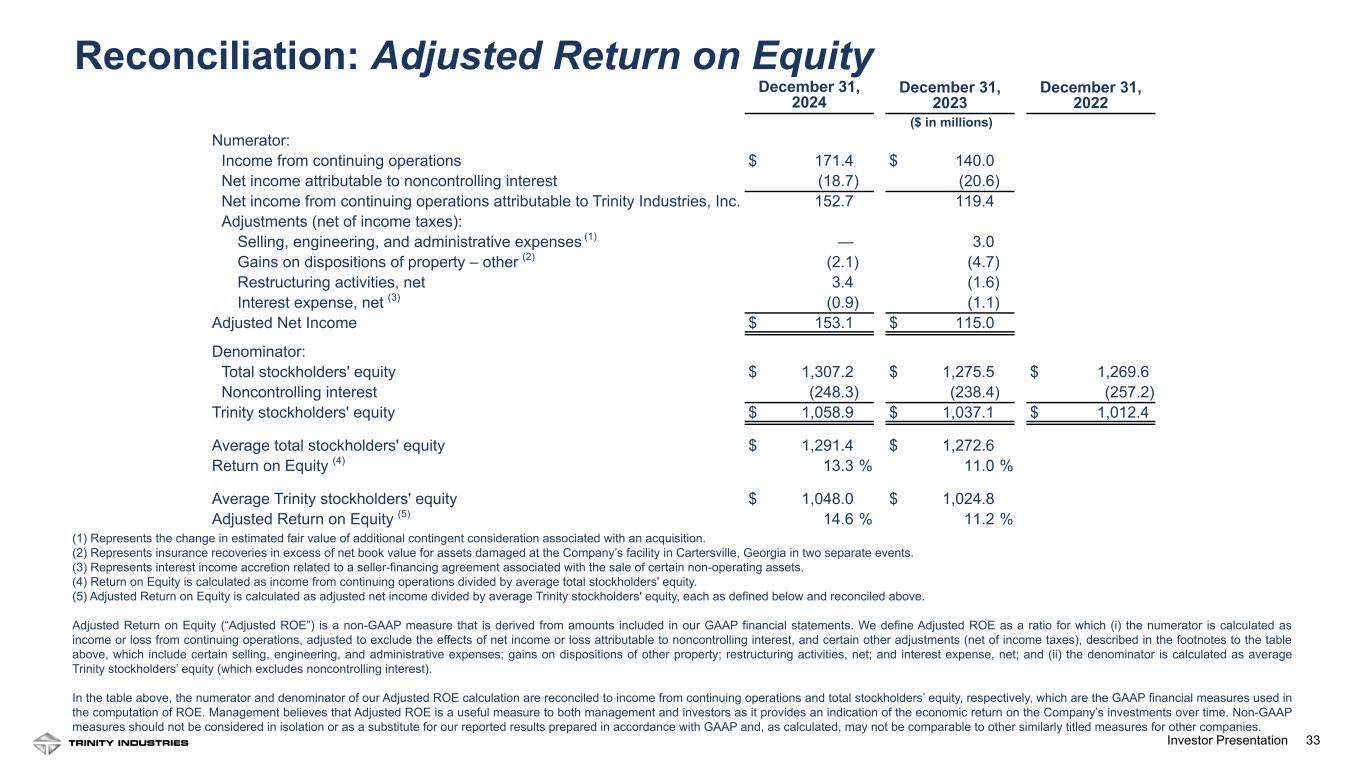
Adjusted Return on Equity (“Adjusted ROE”) is defined as a ratio for which (i) the numerator is calculated as income or loss from continuing operations, adjusted to exclude the effects of net income or loss attributable to noncontrolling interest, and certain other adjustments (net of income taxes), described in the footnotes to the table below, which include certain selling, engineering, and administrative expenses; gains on dispositions of other property; restructuring activities, net; and interest expense, net; and (ii) the denominator is calculated as average Trinity stockholders’ equity (which excludes noncontrolling interest). In the following table, the numerator and denominator of our Adjusted ROE calculation are reconciled to income from continuing operations and total stockholders’ equity, respectively, which are the most directly comparable GAAP financial measures. Management believes that Adjusted ROE is a useful measure to both management and investors as it provides an indication of the economic return on the Company’s investments over time. Non-GAAP measures should not be considered in isolation or as a substitute for our reported results prepared in accordance with GAAP and, as calculated, may not be comparable to other similarly titled measures for other companies.
| | | | | | | | | | | | | | | | | |
| December 31, 2024 | | December 31, 2023 | | December 31, 2022 |
| ($ in millions) |
| Numerator: | | | | | |
| Income from continuing operations | $ | 171.4 | | | $ | 140.0 | | | |
| Net income attributable to noncontrolling interest | (18.7) | | | (20.6) | | | |
| Net income from continuing operations attributable to Trinity Industries, Inc. | 152.7 | | | 119.4 | | | |
| Adjustments (net of income taxes): | | | | | |
Selling, engineering, and administrative expenses (1) | — | | | 3.0 | | | |
Gains on dispositions of property – other (2) | (2.1) | | | (4.7) | | | |
| Restructuring activities, net | 3.4 | | | (1.6) | | | |
Interest expense, net (3) | (0.9) | | | (1.1) | | | |
| Adjusted Net Income | $ | 153.1 | | | $ | 115.0 | | | |
| | | | | |
| Denominator: | | | | | |
| Total stockholders' equity | $ | 1,307.2 | | | $ | 1,275.5 | | | $ | 1,269.6 | |
| Noncontrolling interest | (248.3) | | | (238.4) | | | (257.2) | |
| Trinity stockholders' equity | $ | 1,058.9 | | | $ | 1,037.1 | | | $ | 1,012.4 | |
| | | | | |
| Average total stockholders' equity | $ | 1,291.4 | | | $ | 1,272.6 | | | |
Return on Equity (4) | 13.3 | % | | 11.0 | % | | |
| | | | | |
| Average Trinity stockholders' equity | $ | 1,048.0 | | | $ | 1,024.8 | | | |
Adjusted Return on Equity (5) | 14.6 | % | | 11.2 | % | | |
(1) Represents the change in estimated fair value of additional contingent consideration associated with an acquisition.
(2) Represents insurance recoveries in excess of net book value for assets damaged at the Company’s facility in Cartersville, Georgia in two separate events.
(3) Represents interest income accretion related to a seller-financing agreement associated with the sale of certain non-operating assets.
(4) Return on Equity is calculated as income from continuing operations divided by average total stockholders' equity.
(5) Adjusted Return on Equity is calculated as adjusted net income divided by average Trinity stockholders' equity, each as defined and reconciled above.
Cash Flow from Operations with Net Gains on Lease Portfolio Sales
Cash flow from operations with net gains on lease portfolio sales is a non-GAAP financial measure. We believe this measure is useful to both management and investors as it provides a relevant measure of liquidity and a useful basis for assessing the breadth of the cash flow generation capabilities across our operating platform, as well as our ability to fund our operations and repay our debt. This measure is defined as net cash provided by operating activities from continuing operations as computed in accordance with GAAP, plus net gains on lease portfolio sales and is reconciled to net cash provided by operating activities from continuing operations, the most directly comparable GAAP financial measure, in the following table. Non-GAAP measures should not be considered in isolation or as a substitute for our reported results prepared in accordance with GAAP and, as calculated, may not be comparable to other similarly titled measures for other companies.
| | | | | | | | | | | |
| Year Ended
December 31, |
| 2024 | | 2023 |
| Net cash provided by operating activities – continuing operations | $ | 588.1 | | | $ | 309.0 | |
| Net gains on lease portfolio sales | 57.3 | | | 82.8 | |
Cash flow from operations with net gains on lease portfolio sales | $ | 645.4 | | | $ | 391.8 | |
EBITDA and Adjusted EBITDA
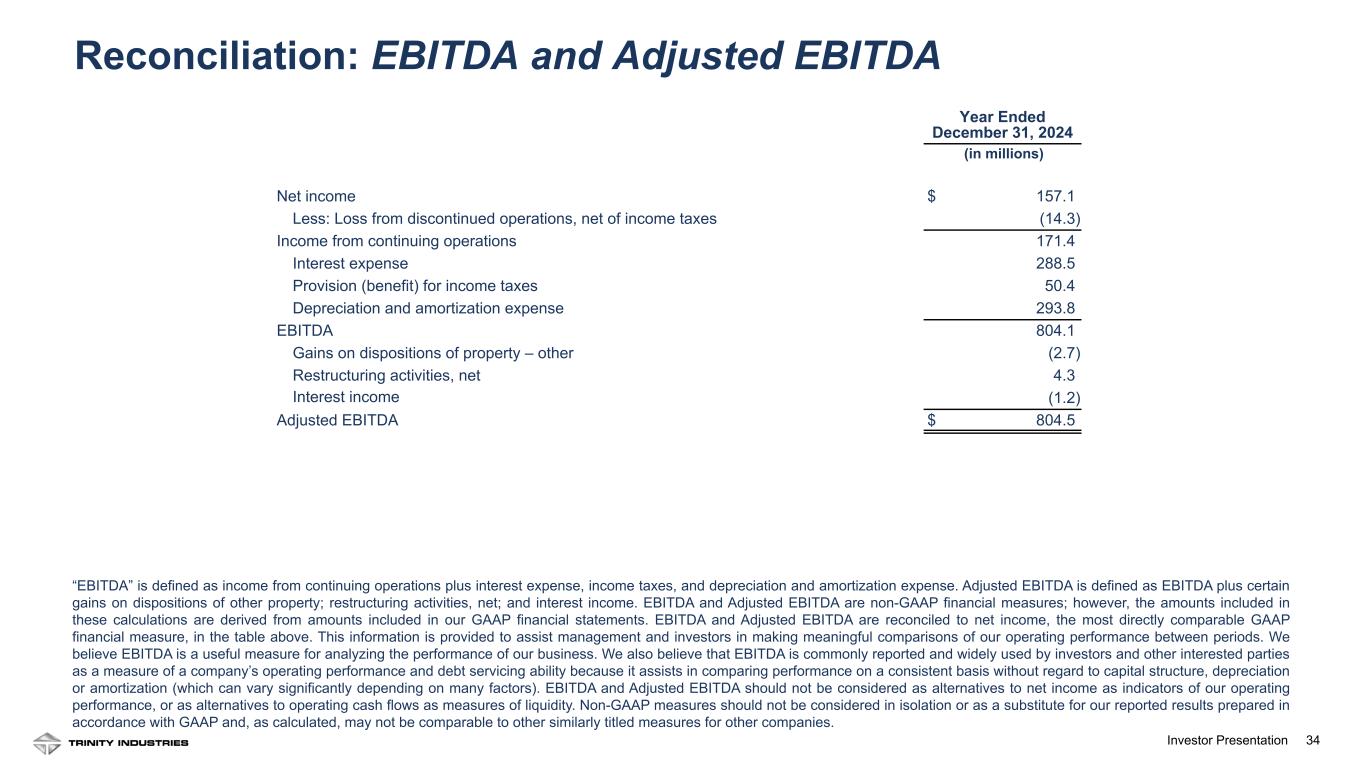
“EBITDA” is defined as income from continuing operations plus interest expense, income taxes, and depreciation and amortization expense. Adjusted EBITDA is defined as EBITDA plus certain selling, engineering, and administrative expenses; gains on dispositions of other property; restructuring activities, net; and interest income. EBITDA and Adjusted EBITDA are non-GAAP financial measures; however, the amounts included in these calculations are derived from amounts included in our GAAP financial statements. EBITDA and Adjusted EBITDA are reconciled to net income, the most directly comparable GAAP financial measure, in the following table. This information is provided to assist management and investors in making meaningful comparisons of our operating performance between periods. We believe EBITDA is a useful measure for analyzing the performance of our business. We also believe that EBITDA is commonly reported and widely used by investors and other interested parties as a measure of a company’s operating performance and debt servicing ability because it assists in comparing performance on a consistent basis without regard to capital structure, depreciation or amortization (which can vary significantly depending on many factors). EBITDA and Adjusted EBITDA should not be considered as alternatives to net income as indicators of our operating performance, or as alternatives to operating cash flows as measures of liquidity. Non-GAAP measures should not be considered in isolation or as a substitute for our reported results prepared in accordance with GAAP and, as calculated, may not be comparable to other similarly titled measures for other companies.
| | | | | | | | | | | | | | | | | | | | | | | |
| Three Months Ended
December 31, | | Year Ended
December 31, |
| 2024 | | 2023 | | 2024 | | 2023 |
| Net income | $ | 37.8 | | | $ | 68.1 | | | $ | 157.1 | | | $ | 126.6 | |
| Less: Loss from discontinued operations, net of income taxes | (3.0) | | | (5.3) | | | (14.3) | | | (13.4) | |
| | | | | | | |
| Income from continuing operations | 40.8 | | | 73.4 | | | 171.4 | | | 140.0 | |
| Interest expense | 70.0 | | | 71.4 | | | 288.5 | | | 277.9 | |
| Provision (benefit) for income taxes | 6.7 | | | 7.1 | | | 50.4 | | | 9.0 | |
| Depreciation and amortization expense | 73.6 | | | 73.3 | | | 293.8 | | | 293.2 | |
EBITDA | 191.1 | | | 225.2 | | | 804.1 | | | 720.1 | |
| Selling, engineering, and administrative expenses | — | | | 2.0 | | | — | | | 4.0 | |
| Gains on dispositions of property – other | (2.7) | | | (1.4) | | | (2.7) | | | (6.3) | |
| | | | | | | |
| Restructuring activities, net | 4.3 | | | — | | | 4.3 | | | (2.2) | |
| Interest income | — | | | (0.4) | | | (1.2) | | | (1.5) | |
| | | | | | | |
| | | | | | | |
| Adjusted EBITDA | $ | 192.7 | | | $ | 225.4 | | | $ | 804.5 | | | $ | 714.1 | |
Exhibit 99.2
Trinity Industries, Inc.
Earnings Release Conference Call – Q4 2024
February 20, 2025
Leigh Anne Mann
Vice President, Investor Relations
Thank you, operator. Good morning everyone. We appreciate you joining us for the Company’s fourth quarter and full year 2024 financial results conference call.
Our prepared remarks will include comments from Jean Savage, Trinity’s Chief Executive Officer and President, and Eric Marchetto, the Company’s Chief Financial Officer. We will hold a Q&A session following the prepared remarks from our leaders.
During the call today, we will reference certain non-GAAP financial metrics. The reconciliations of the non-GAAP metrics to comparable GAAP measures are provided in the appendix of the quarterly investor slides, which are accessible on our investor relations website at www.trin.net. These slides are under the Events and Presentations portion of the website, along with the Fourth Quarter Earnings Conference Call event link.
A replay of today’s call will be available after 10:30 a.m. Eastern time through midnight on February 27, 2025. Replay information is available under the Events and Presentations page on our Investor Relations website.
It is now my pleasure to turn the call over to Jean.
E. Jean Savage
Chief Executive Officer and President
Thank you, Leigh Anne, and good morning everyone.
To begin today, I would like to extend my gratitude to all the Trinity employees for delivering strong financial results in 2024 and demonstrating the power and potential of the Trinity platform. Our full year adjusted EPS of $1.82 represents a 32% year over year increase, driven by higher lease rates, significantly improved margin performance, and an increased volume of external repairs. We concluded the year with an Adjusted ROE of 14.6%, within our target range, and cash flow from operations with net gains on lease portfolio sales of $645 million, reflecting a 65% increase over 2023.
During our 2024 Investor Day last June, we emphasized that a less volatile operating environment combined with the reduced cyclicality of our platform, would optimize our returns through the cycle. We believe our 2024 results provide solid evidence of our ability to consistently perform.
I would also like to say a few words about our safety performance. Safety is a core value for Trinity, and we have continued to demonstrate incremental year over year improvements in safety metrics in each of the last several years, achieving approximately half the industry average of incidents for manufacturing.
As we look forward to 2025, we remain confident in the strength of our leasing business, especially in light of the balanced market conditions. While there are ongoing pressures on manufacturing driven by macroeconomic forces, this environment favors our existing assets. We believe that moderated additions to the industry railcar fleet will enable us to continue pricing our existing fleet upward, thereby improving returns for our business.
Today, I will discuss current market observations, provide specifics from our business segments, and then pass the call to Eric to discuss financial results and provide our thoughts and guidance for 2025 expectations. Let’s start with a market update.
Market Update
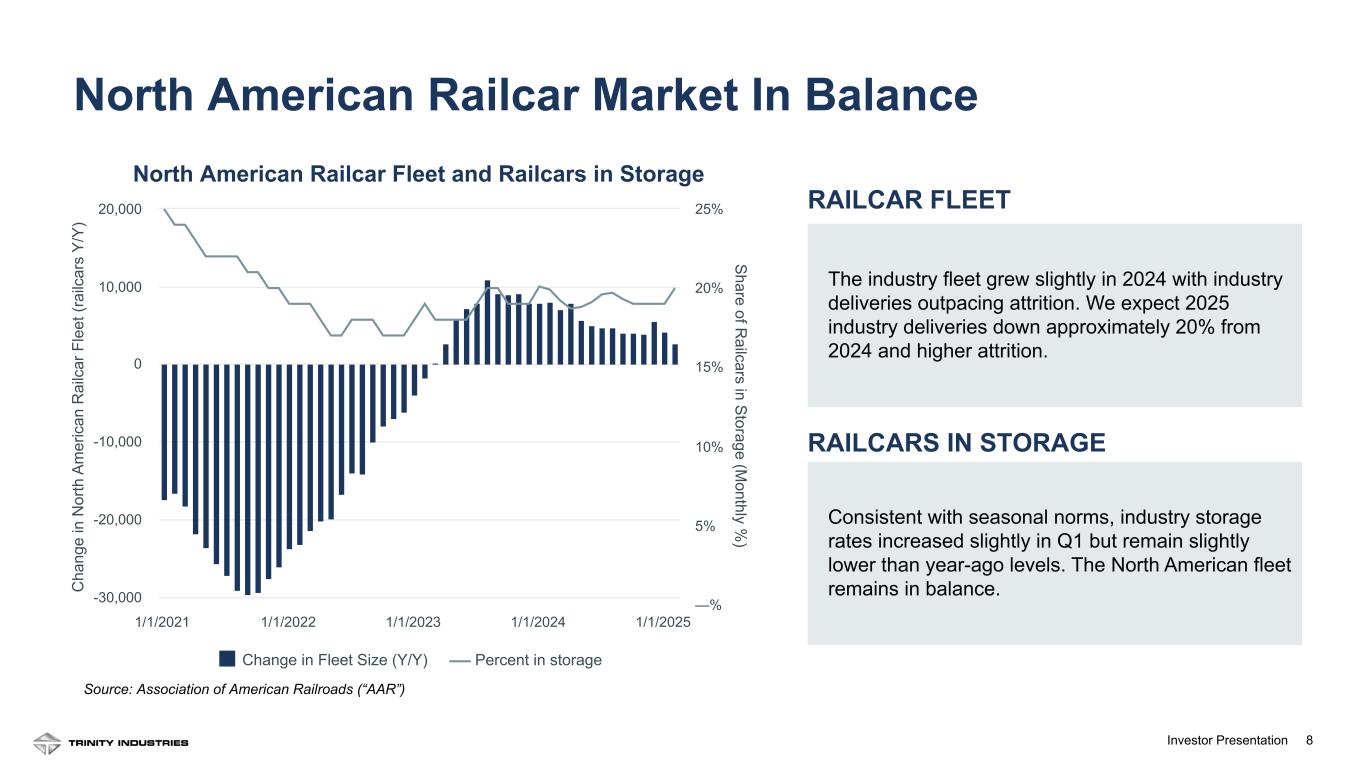
For the full year 2024, the industry delivered just under 43,000 railcars and received orders for 25,000 railcars. We believe 2024 attrition levels were just below 40,000 and expect to see these levels increase over the next few years, with concentration in box cars and covered hoppers. The industry backlog stands at approximately 34,000 railcars, with Trinity’s backlog comprising about 47% of the total, including our multi-year order. We continue to anticipate industry deliveries of about 120,000 railcars for the planning period of 2024 through 2026. As Eric will discuss in our guidance section, we expect a step down in industry deliveries for 2025. However, as previously stated, we foresee this railcar build cycle being narrower than previous cycles, characterized by lower peaks and higher floors. We believe the muted order volume in 2024 was influenced by uncertainties surrounding the election and, more recently, tariff implications. Nevertheless, 2025 inquiry levels have been elevated, and we anticipate an acceleration in orders as policy changes become more explicit.
We have seen positive volume signals in the agricultural, chemicals, and intermodal segments. Additionally, we have visibility into replacement opportunities for vehicular flats, grain cars, and small general service tank cars.
The railcar industry and the broader industrial economy are currently influenced by numerous macroeconomic forces. Despite these challenges, we remain confident in our internal projections for railcar production. More importantly, we are committed to maintaining the utilization and returns of our lease fleet, driving value for shareholders.
Segment Performance
I would now like to provide some segment highlights, beginning with the Railcar Leasing and Services segment, which includes our leasing business, maintenance business, and digital and logistics services businesses.
Leasing and Services
Our Leasing and Services business continues to perform favorably, and we anticipate this trend to persist in 2025. In the fourth quarter, the Leasing and Services segment generated revenues of $287 million and a segment operating profit of $121 million, with a margin of 42.0%. Gains on portfolio sales in the quarter amounted to $21 million.
For the full year 2024, leasing segment revenue of $1.1 billion increased by $102 million year over year as we continued to re-price our lease fleet upward. We also observed favorable year over year results in our maintenance business, with an increased volume of external repairs.
Our forward-looking metrics also remain favorable. We concluded the year with a Future Lease Rate Differential, or FLRD, of 24.3% and a lease fleet utilization rate of 97.0%. Our renewal success rate was 77% in the fourth quarter, which we believe indicates that the market remains balanced, allowing us to continue to push pricing upward. We have now re-priced just over half our fleet in a double-digit FLRD environment, indicating that we still have ample runway for further pricing improvement.
Full year lease portfolio sales were $361 million, with gains of $57 million. As expected, these gains were slightly lower than in 2023 but still represent a very healthy secondary market.
Trinity’s full year net lease fleet investment was $181 million, slightly below our guidance range of $200 to $300 million. Our volume of railcar sales exceeded expectations, as the secondary market has remained favorable.
Rail Products
Trinity delivered 3,760 railcars in the fourth quarter bringing the total for the year to 17,570. We received orders for 7,685 railcars in 2024, resulting in a year-end backlog of $2.1 billion. As
mentioned at the top of the call, we expect to see orders accelerate as certainty improves in the market around policy decisions and impact. I am proud of the performance in this segment. Despite relatively flat revenue, operating profit of $189 million increased by 68% compared to 2023. Our full year operating margin of 7.8% was at the high end of our guidance range of 6% to 8%, representing a 330 basis point improvement over 2023.
Our parts business also performed exceptionally well in 2024. As previously noted, we are focused on expanding our parts business to support our lease fleet and maintenance network, and we continue to identify promising opportunities for growth and improvement in this business.
Conclusion
Eric will provide guidance for 2025, but I wanted to share some high-level thoughts on our current operating environment. As you have heard from other companies this earnings cycle, our customers are deferring investment decisions until there is greater certainty and clarification regarding the regulatory environment, including tariffs. We remain engaged and informed about the potential impact tariffs may have on our manufacturing business. Given the uncertainty and resulting investment delays, our 2025 guidance includes a $0.30 EPS range to account for various scenarios and the timing of investment decisions. If the tariff uncertainty continues, resulting in further delays in railcar orders, there may be additional risk to our guidance.
That being said, we also own or manage approximately 144,000 railcars, and our primary focus is on improving the returns from these valuable assets. I will now turn the call over to Eric to discuss our financial statements, our performance against our longer-term targets, and our high-level guidance on expectations for 2025.
Eric R. Marchetto
Executive Vice President and Chief Financial Officer
Thank you, Jean, and good morning everyone. I will begin by discussing our fourth quarter and full year financial statements, starting with the income statement.
Income Statement
Fourth quarter consolidated revenues of $629 million reflect lower deliveries and higher eliminations as 36% of quarterly deliveries were added to our lease fleet. For the full year, revenues were $3.1 billion, representing a slight improvement over 2023. For the full year, 20% of deliveries were delivered to our lease fleet.
As Jean noted, operating profit significantly improved in 2024, driven primarily by margin improvement in the Rail Products Group, partially offset by lower full year gains on railcar sales and higher eliminations.
We benefited in the quarter from a lower than expected tax rate. For the full year, our effective tax rate was 22.7%.
Fourth quarter adjusted EPS was $0.39, and full year adjusted EPS was $1.82, representing a 32% improvement over 2023 and reflecting strong operating performance. I would like to reiterate Jean’s earlier point that this significant earnings improvement occurred despite a flat delivery and revenue environment. This is encouraging, as it demonstrates that our platform has the ability to generate strong returns in a flat economic cycle.
Moving to the cash flow statement, full year cash flow from continuing operations was $588 million. Net fleet investment for the year was $181 million, which included $542 million of fleet additions and enhancements, offset by $361 million in secondary market sales.
We returned $114 million to shareholders in 2024, comprised of $93 million through dividend payments and $21 million in share repurchases. In December, we announced a $0.02 increase to our quarterly dividend, which is now $0.30 per share. This represents a dividend yield of approximately 3.4% based on the year-end stock price and reinforces our commitment to dividend growth. We have consecutively paid a dividend for over 60 years.
Our wholly-owned lease fleet loan-to-value ratio was 67.6% in the fourth quarter, within our target range of 60% to 70%.
Three-Year Targets
At our Investor Day in June, we provided longer term guidance for the period of 2024 to 2026. Having completed the first year of this planning period, I would like to provide an update on our progress against our investor day targets.
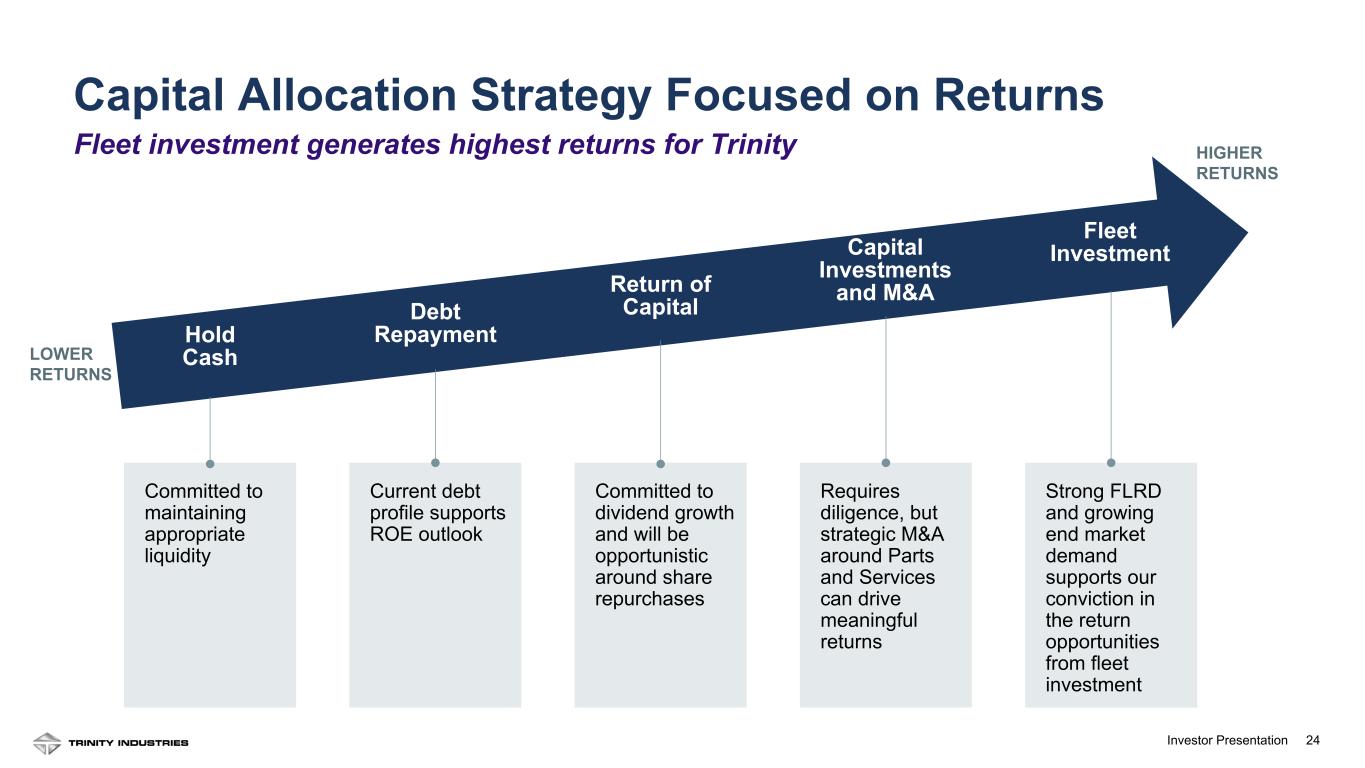
First, we set a three-year goal for net fleet investment of $750 million to $1 billion. In 2024, our net fleet investment was $181 million. As Jean mentioned, the secondary market proved stronger than expected, and we capitalized on this in 2024. Our 2025 guidance of $300 million to $400 million aligns us with the three-year run rate.
Second, we introduced a cash metric that encompasses cash flow from operations with net gains on lease portfolio sales, with a three-year target of $1.2 billion to $1.4 billion. In 2024, cash flow from
continuing operations was $588 million, and we recorded gains on railcar sales of $57 million. Combined, cash flow from operations and gains on lease portfolio sales amounted to $645 million for 2024. Cash flow was strong in 2024, and gains exceeded initial forecasts. Therefore, we believe we are in a favorable position to achieve this three-year target.
Finally, we stated that we expect our Adjusted Return on Equity to be in the range of 12% to 15% over the three-year planning period. We concluded 2024 with an Adjusted ROE of 14.6%, a significant increase from our 2023 Adjusted ROE of 11.2%. In 2023, we significantly improved our asset turnover and balance sheet optimization. In 2024, we improved our net profit margin, driving our Adjusted ROE up by 30% compared to 2023. We expect Adjusted ROE to remain within the target range in 2025.
Overall, we are on track to meet our longer term targets. We continue to believe these three targets highlight where we can create value as a business: investment in our fleet; durable cash flow generation; and optimized returns throughout the economic cycle.
Guidance
Moving to 2025 guidance, as Jean mentioned, we have observed delays in ordering decisions due to uncertainty around tariffs and a relatively flat US industrial production.
•Given these realities, we expect 2025 industry deliveries of approximately 35,000 railcars, which is about 20% lower than 2024 deliveries.
◦We continue to believe that industry deliveries over the three-year period will be around 120,000 railcars, meaning we expect to see backlogs grow this year as the industry plans for more deliveries in 2026.
•Our fourth quarter results reflect decisions made late in the year to prepare for a lower delivery environment. In addition to making changes to the corporate cost structure, our facilities also improved their cost structure with enhancements in efficiency, productivity, and supply chain management, as well as a continued focus on automation.
◦We expect lower SE&A costs in 2025 as compared to 2024, split among the segment results and corporate cost reductions. The total effect will be approximately $40 million of SE&A cost savings, including lower incentive compensation.
•In 2025, we expect net lease fleet investment of $300 to $400 million, in support of our three-year targets and reflecting a higher percentage of deliveries going into our fleet and fewer secondary market railcar sales.
•We expect manufacturing capital expenditures of $45 to $55 million this year.
•Finally, we are introducing our 2025 EPS guidance at a range of $1.50 to $1.80 per share.
•In the Leasing and Services segment, we expect segment operating margins inclusive of gains between 38% and 41% to reflect continued strength in lease rates. We expect gains on lease portfolio sales to be between $40 to $50 million.
•In the Rail Products segment, guidance assumes lower new railcar deliveries and approximately 30% of the deliveries going into our lease fleet, with a full year segment margin between 7% and 8%.
•We expect a tax rate of approximately 25% to 27% for the full year.
In conclusion, we are confident that 2025 will be a year of continued strength for our Leasing and Services business. Our focus remains on enhancing returns from our lease fleet while carefully managing production activity to ensure the fleet remains in balance. Leveraging our unique position as both a lessor and a manufacturer, we are attuned to market needs and are maintaining flexibility to adapt swiftly to changes in the market. We look forward to sharing our progress with you and appreciate your support.
Operator, we are now ready to take our first question.
(after Q&A)
E. Jean Savage
Chief Executive Officer and President
I want to thank everyone for your time today. While there is still a lot of uncertainty around government policy and how it may impact our business, we believe that our 2025 performance will demonstrate the strength of our platform and our ability to generate strong returns and consistent margin performance. So, we look forward to sharing our first quarter progress and results with you on our next earnings call.