Exhibit 99.1
FOR IMMEDIATE RELEASE
Trinity Industries, Inc. Announces First Quarter 2021 Results
Reports quarterly GAAP and adjusted earnings from continuing operations of $0.03 and $0.07 per diluted share, respectively
Generates year-to-date operating and total free cash flow after dividends and investments of $70 million and $90 million, respectively
Returned $60 million of capital to stockholders through dividends and share repurchases
DALLAS, Texas – April 22, 2021 – Trinity Industries, Inc. (NYSE:TRN) today announced earnings results for the first quarter ended March 31, 2021.
Financial and Operational Highlights – First Quarter 2021
•Quarterly total company revenues of $399 million
•Quarterly income from continuing operations per common diluted share ("EPS") of $0.03 and quarterly adjusted EPS of $0.07
•Lease fleet utilization of 94.5% and Future Lease Rate Differential ("FLRD") of (14.8)% at quarter end
•Railcar deliveries of 1,895 and new railcar orders of 1,410
•Cash flow from operations and total free cash flow after dividends and investments ("Free Cash Flow") were $70 million and $90 million, respectively
◦Investment of $91 million in leasing capital expenditures, net of lease portfolio sales
•Net additions of 4,155 railcars to the wholly-owned and partially-owned lease fleet compared to prior year period
•Repurchases of approximately 1.3 million shares at a cost of $37 million
•Committed liquidity of $772 million as of March 31, 2021
Management Commentary
"Trinity’s first quarter results reflect the dynamics of aggressive execution on our strategic initiatives in the midst of a challenging operating environment and a competitive market for railcar demand," said Jean Savage, Trinity's Chief Executive Officer and President. "Operationally, our businesses performed well against our expectations, especially considering the winter storms that interrupted operations for nearly two weeks of the quarter.”
"Trinity’s lease revenue was impacted by the continuation of softer lease pricing and slightly lower utilization compared to last year. Our Rail Products segment completed further rightsizing of our production footprint to align with lower delivery volumes, and made good progress on our strategic initiatives to lower our breakeven point and overall cost structure. While the margin for the first quarter was negative, the business segment is turning the corner, and margins trended positively through the quarter. We expect to build momentum on our cost initiatives through the remainder of the year resulting in year over year margin improvement for the segment.”
“We are also seeing positive developments in the market with railcar inquiries returning to a more normal level of activity during the first quarter. As a result, Trinity’s fleet utilization and pricing are firming within our lease portfolio, and we expect lease rates to experience modest improvement through the year as existing railcars are absorbed across the industry. When looking at the potential for new railcar demand, we expect industry deliveries to be below replacement levels this year, but believe that current inquiries support improving railcar deliveries at or just above replacement levels in 2022."
"Financially, Trinity is making disciplined investments while returning meaningful capital to shareholders as part of our overall capital allocation framework. In the first quarter, we made progress on our balance sheet initiatives by completing a small lease portfolio sale and extending our Leasing warehouse credit facility. The cash flows from Trinity’s rail platform continue to prove the resiliency of the business model through the cycle with approximately $70 million in operating cash flow generated during the quarter. We continue to expect strong operating cash flows in the range of $625 million to $675 million for the 2021 year."
Ms. Savage concluded, "We are certainly encouraged by the improving trends for our business and the economy as a whole, but market uncertainty in the wake of the COVID-19 pandemic remains a headwind. We are focused on what is more within our control in optimizing our cost structure and balance sheet, and I am pleased with the execution and progress on internal initiatives to accelerate Trinity’s financial performance and create long-term shareholder value.”
Consolidated Financial Summary
| | | | | | | | | | | | | | | | | |
| Three Months Ended
March 31, | | |
| 2021 | | 2020 | | Year over Year – Comparison |
| (in millions, except percentages and per share amounts) | | |
Revenues (1) | $ | 398.8 | | $ | 615.2 | | Lower deliveries in the Rail Products Group, and the change in presentation of railcar sales, which totaled $44 million in Q1 2020 |
Selling, engineering, and administrative expenses | $ | 54.4 | | $ | 64.3 | | Lower employee-related costs resulting from cost optimization initiatives, including headcount reductions, and lower litigation-related expenses |
| | | | | |
Operating profit | $ | 60.2 | | $ | 73.0 | | Lower volumes in the Rail Products Group and fewer railcar sales in the Leasing Group |
| | | | | |
| Interest expense | $ | 51.4 | | $ | 61.3 | | Lower overall borrowing costs associated with the company's debt facilities, partially offset by higher overall average debt; Q1 2020 included a $4.7M early redemption premium on a debt retirement |
| Net income (loss) attributable to Trinity Industries, Inc. | $ | 3.3 | | $ | 161.7 | | |
EBITDA (2) | $ | 125.7 | | $ | 143.1 | | |
Adjusted EBITDA (2) | $ | 126.6 | | $ | 148.6 | | |
| Effective tax expense (benefit) rate | 77.9 | % | | (990.6) | % | | 2020 tax benefit primarily related to changes in recent tax legislation; 2021 tax rate was impacted by adjustments to the benefits recognized in 2020 |
| | | | | |
| Diluted EPS – GAAP | $ | 0.03 | | $ | 1.33 | | Primarily the result of the tax impacts described above |
Diluted EPS – Adjusted (2) | $ | 0.07 | | $ | 0.11 | | |
| | | | | |
| Three Months Ended
March 31, | | |
| 2021 | | 2020 | | Year over Year – Comparison |
| (in millions) | | |
Net cash provided by operating activities – continuing operations | $ | 70.1 | | $ | 173.8 | | Decrease in other assets pertaining to the accounting treatment of a customer's sales-type lease in Q1 2020 |
Total Free Cash Flow After Investments and Dividends (2) | $ | 90.2 | | $ | 57.4 | | Timing difference of debt proceeds issued for financing lease fleet equity investment |
Capital expenditures – leasing (3) | $ | 107.9 | | $ | 129.2 | | Fewer railcars added to the lease fleet |
| Returns of capital to stockholders | $ | 60.0 | | $ | 58.1 | | Increase in the dividend compared to previous year, partially offset by fewer share repurchases |
(1) Beginning in the fourth quarter of 2020, we made a prospective change to the presentation of railcar sales and now present all sales of railcars from the lease fleet as a net gain or loss from the disposal of a long-term asset regardless of the age of railcar that is sold. Historically, we presented sales of railcars from the lease fleet on a gross basis in leasing revenues and cost of revenues if the railcars had been owned for one year or less at the time of sale. Sales of railcars from the lease fleet owned for more than one year had historically been presented as a net gain or loss from the disposal of a long-term asset.
(2) Non-GAAP financial measure. See the Reconciliations of Non-GAAP Measures section within this Press Release for a reconciliation to the most directly comparable GAAP measure and why management believes this measure is useful to management and investors.
(3) For the three months ended March 31, 2020, Capital expenditures – leasing is net of sold lease fleet railcars owned one year or less.
Business Group Summary
| | | | | | | | | | | | | | | | | |
| Three Months Ended
March 31, | | |
| 2021 | | 2020 | | Year over Year – Comparison |
| (in millions, except percentages and number of units) | | |
| Railcar Leasing and Management Services Group | | | | | |
| Leasing and management revenues | $ | 183.5 | | $ | 192.0 | | Lower lease rates and lower fleet utilization, partially offset by growth in the lease fleet |
| Leasing and management operating profit | $ | 76.6 | | $ | 82.5 | |
| Operating profit on lease portfolio sales | $ | 1.7 | | $ | 10.4 | | Fewer railcars sold from lease portfolio |
| Fleet utilization | 94.5 | % | | 95.4 | % | | Primarily driven by decrease in energy-related markets |
Future Lease Rate Differential ("FLRD") (2) | (14.8) | % | | (15.2) | % | | Lower current market lease rates compared to expiring lease rates over the next twelve months |
Owned lease fleet (in units) (1) | 107,970 | | 103,815 | | |
Investor-owned lease fleet
(in units) | 26,610 | | 25,840 | | Additional sales of leased railcars to third-party fleets managed by the Company |
| | | | | |
| Rail Products Group | | | | | |
| Revenues | $ | 261.0 | | $ | 509.4 | | Lower deliveries, pricing pressures, a shift in the mix of railcars sold, and reduced railcar modification services |
| Operating profit (loss) margin | (3.4) | % | | 4.9 | % | | Lower deliveries resulting in additional unabsorbed burden, as well as lower pricing and weather-related costs |
| Deliveries (in units) | 1,895 | | 3,705 | | |
| Orders (in units) | 1,410 | | 1,970 | | |
| Order value | $ | 171.1 | | $ | 227.5 | | Lower number of units, competitive pricing, and differences in product mix |
| Backlog value | $ | 989.9 | | $ | 1,557.8 | | |
| | | | | |
| All Other Group | | | | | |
| Revenues | $ | 68.1 | | $ | 63.4 | | Increased demand for highway products |
| Operating profit | $ | 15.3 | | $ | 9.3 | | Gain on the disposition of a non-operating facility |
| | | | | |
| March 31, 2021 | | December 31, 2020 | | |
| Loan-to-value ratio | | | | | |
| Wholly-owned subsidiaries, including corporate revolving credit facility | 60.9 | % | | 58.5 | % | | Increased leverage associated with leased assets, partially offset by amortization of debt on encumbered assets |
(1) Includes wholly-owned railcars, partially-owned railcars, and railcars under sale-leaseback arrangements.
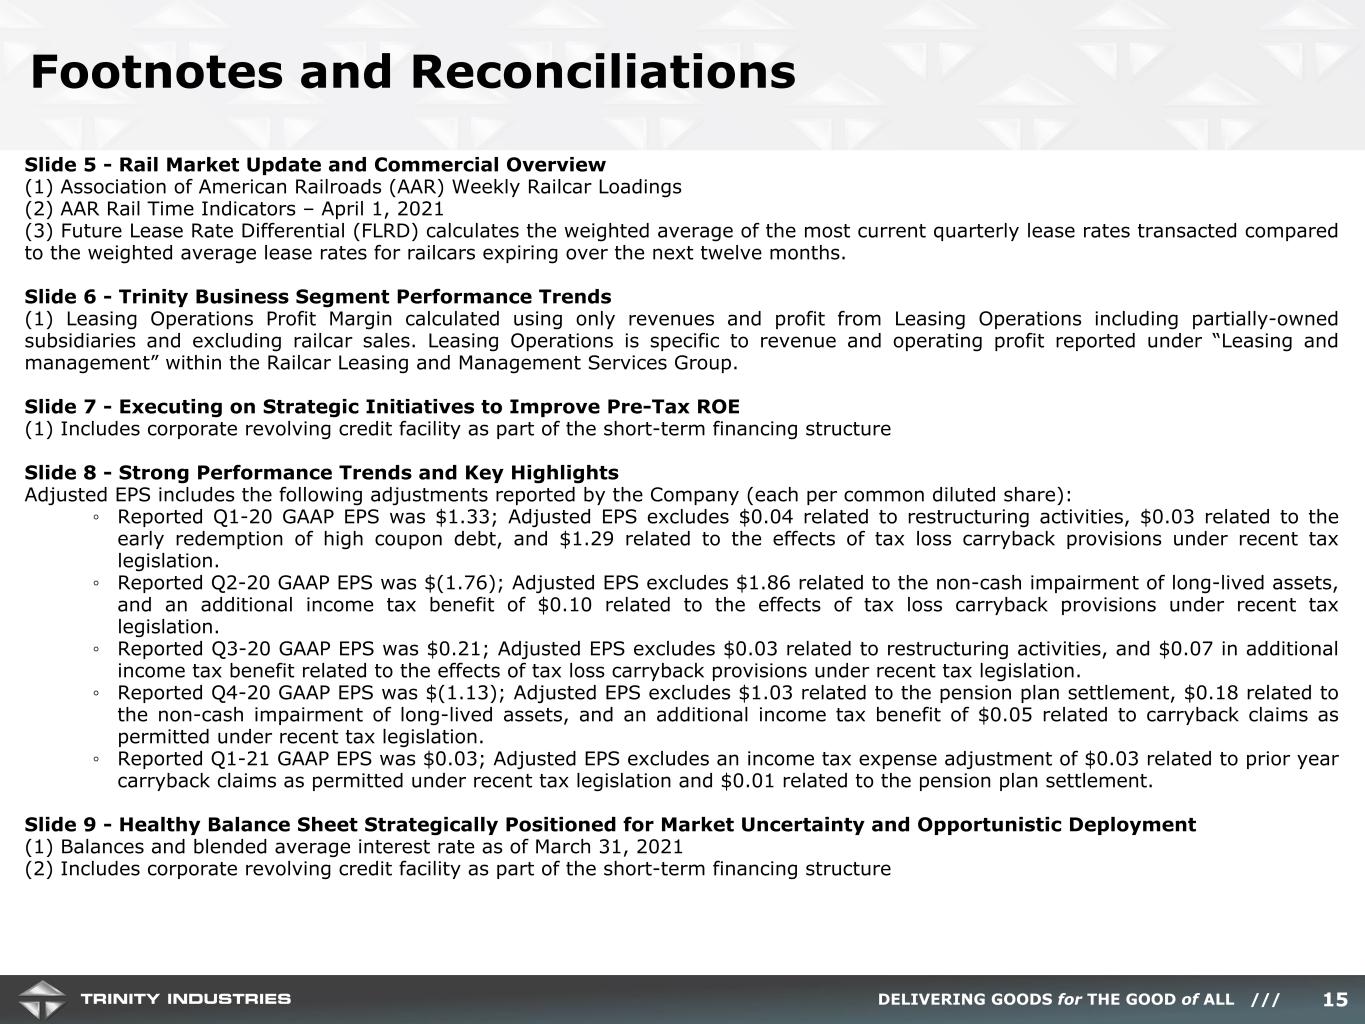
(2) FLRD calculates the weighted average of the most current quarterly lease rates transacted compared to the weighted average lease rates for railcars expiring over the next twelve months.
Additional Business Items
Liquidity and Capital Resource Updates
•Trinity completed a small tuck-in acquisition of Bay Worx Rail, including proprietary cleaning technology systems and a state of the art cleaning facility in South Texas. The technology acquired uses advanced robotics to improve the safety and efficiency of the railcar cleaning process, which the Company expects to scale at additional maintenance facilities over the next few years as part of the optimization initiatives.
•In the first quarter, Trinity completed the build-out of its Midwest maintenance facility, which began in May 2019, and commenced operations. The facility will enable the Company to meet its strategic initiative to internally service at least 50% of the maintenance events for the owned and investor-owned lease fleet.
•During the quarter, Trinity repurchased approximately $37 million of shares under the Company's authorized share repurchase program, of which $145 million remains authorized through December 31, 2021.
•In March 2021, the Trinity Industries Leasing Company ("TILC") warehouse facility was extended through March 15, 2024, and the total facility commitment was increased from $750 million to $1.0 billion, with a potential additional increase of up to an additional $250 million, subject to certain conditions.
•In January 2021, TILC announced its Green Financing Framework supported by a second-party opinion from Sustainalytics, a Morningstar company, enabling the leasing company to issue green financing instruments, including green nonrecourse ABS bonds and green loans, supported by green eligible assets. Under the existing framework, TILC has issued over $4 billion of railcar-related debt that meet the criteria and qualify for the Green Financing designation.
•The Company's income tax receivable at the end of the first quarter was $441 million.
Cost Optimization and Operating Footprint Rationalization
•In connection with the Company's ongoing assessment of future needs to support our rail-focused strategy and to optimize the performance of the business, the Company recognized pre-tax restructuring activities totaling a net gain of $0.3 million for the quarter, primarily from the disposition of certain non-operating facilities, partially offset by employee transition costs.
•During the quarter, the Company sold an idled facility in Dallas, Texas, which was not a part of the Company's previous restructuring efforts, for a gain of $8.7 million.
Other Business
•During the first quarter, Trinity experienced two weather-related events that disrupted operations and impacted operating profit by approximately $4 million due to lost productivity, and maintenance and repair of damaged facilities.
◦In February, winter storms idled several of our facilities for nearly two weeks given disruptions to critical utilities.
◦In the last week of March, a tornado damaged the Company's railcar maintenance facility in Cartersville, Georgia. This event is expected to have a minor impact on the Rail Products Group's second quarter results, and we believe our insurance coverage is sufficient to cover property damage costs related to the event; additionally, the Company may be entitled to business interruption proceeds in future periods.
•In February 2021, Trinity launched TrinsightTM, a revolutionary technology service platform offering in the railcar industry which advances the digital connection between North American rail shippers and their railcar fleets. Trinsight™ is expected to provide real-time intelligence on the location, condition and status of rail equipment, thereby improving rail transportation efficiencies and safety, and enhancing the management of fleet operations. This service is being offered to Trinity's leasing customers initially through a pilot program.
Conference Call
Trinity will hold a conference call at 8:30 a.m. Eastern on April 22, 2021 to discuss its first quarter results. To listen to the call, please visit the Investor Relations section of the Company's website at www.trin.net and access the Events & Presentations webpage, or the live call can be accessed at 1-888-317-6003 with the conference passcode "5196726". Please call at least 10 minutes in advance to ensure a timely connection. An audio replay may be accessed through the Company’s website or by dialing 1-877-344-7529 with passcode "10152017" until 11:59 p.m. Eastern on April 29, 2021.
Additionally, the Company will provide Supplemental Materials to accompany the earnings conference call. The materials will be accessible both within the webcast and on Trinity's Investor Relations website under the Events and Presentations portion of the site along with the First Quarter Earnings Call event weblink.
Non-GAAP Financial Measures
We have included financial measures compiled in accordance with generally accepted accounting principles ("GAAP") and certain non-GAAP measures in this earnings press release to provide management and investors with additional information regarding our financial results. Non-GAAP measures should not be considered in isolation or as a substitute for our reporting results prepared in accordance with GAAP and, as calculated, may not be comparable to other similarly titled measures for other companies. For each non-GAAP financial measure, a reconciliation to the most comparable GAAP measure has been included in the accompanying tables. When forward-looking non-GAAP measures are provided, quantitative reconciliations to the most directly comparable GAAP measures are not provided because management cannot, without unreasonable effort, predict the timing and amounts of certain items included in the computations of each of these measures. These factors include, but are not limited to: the product mix of expected railcar deliveries; the timing and amount of significant transactions and investments, such as lease portfolio sales, capital expenditures, and returns of capital to shareholders; and the amount and timing of certain other items outside the normal course of our core business operations, such as restructuring activities and the potential financial and operational impacts of the COVID-19 pandemic.
About Trinity Industries
Trinity Industries, Inc., headquartered in Dallas, Texas, owns businesses that are leading providers of rail transportation products and services in North America. Our rail-related businesses market their railcar products and services under the trade name TrinityRail®. The TrinityRail platform provides railcar leasing and management services, as well as railcar manufacturing, maintenance and modifications. Trinity also owns businesses engaged in the manufacture of products used on the nation’s roadways and in traffic control. Trinity reports its financial results in three principal business segments: the Railcar Leasing and Management Services Group, the Rail Products Group, and All Other. For more information, visit: www.trin.net.
Some statements in this release, which are not historical facts, are “forward-looking statements” as defined by the Private Securities Litigation Reform Act of 1995. Forward-looking statements include statements about Trinity's estimates, expectations, beliefs, intentions or strategies for the future, and the assumptions underlying these forward-looking statements, including, but not limited to, future financial and operating performance, future opportunities and any other statements regarding events or developments that Trinity believes or anticipates will or may occur in the future, including the potential financial and operational impacts of the COVID-19 pandemic. Trinity uses the words “anticipates,” “assumes,” “believes,” “estimates,” “expects,” “intends,” “forecasts,” “may,” “will,” “should,” “guidance,” “projected,” “outlook,” and similar expressions to identify these forward-looking statements. Forward-looking statements speak only as of the date of this release, and Trinity expressly disclaims any obligation or undertaking to disseminate any updates or revisions to any forward-looking statement contained herein to reflect any change in Trinity’s expectations with regard thereto or any change in events, conditions or circumstances on which any such statement is based, except as required by federal securities laws. Forward-looking statements involve risks and uncertainties that could cause actual results to differ materially from historical experience or our present expectations, including but not limited to risks and uncertainties regarding economic, competitive, governmental, and technological factors affecting Trinity’s operations, markets, products, services and prices, and such forward-looking statements are not guarantees of future performance. For a discussion of such risks and uncertainties, which could cause actual results to differ from those contained in the forward-looking statements, see “Risk Factors” and “Forward-Looking Statements” in Trinity’s Annual Report on Form 10-K for the most recent fiscal year, as may be revised and updated by Trinity’s Quarterly Reports on Form 10-Q, and Trinity’s Current Reports on Form 8-K.
| | |
| Investor Contact: |
| Jessica L. Greiner |
| Vice President, Investor Relations and Communications |
| Trinity Industries, Inc. |
| (Investors) 214/631-4420 |
|
| Media Contact: |
| Jack L. Todd |
| Vice President, Public Affairs |
| Trinity Industries, Inc. |
| (Media Line) 214/589-8909 |
- TABLES TO FOLLOW -
Trinity Industries, Inc.
Condensed Consolidated Statements of Operations
(in millions, except per share amounts)
(unaudited)
| | | | | | | | | | | | | | | |
| | | Three Months Ended
March 31, |
| | | | | 2021 | | 2020 |
| Revenues | | | | | $ | 398.8 | | | $ | 615.2 | |
| Operating costs: | | | | | | | |
| Cost of revenues | | | | | 296.0 | | | 482.0 | |
| Selling, engineering, and administrative expenses | | | | | 54.4 | | | 64.3 | |
| Gains on dispositions of property: | | | | | | | |
| Lease portfolio sales | | | | | 1.7 | | | 8.7 | |
| Other | | | | | 9.8 | | | 0.9 | |
| | | | | | | |
| Restructuring activities, net | | | | | (0.3) | | | 5.5 | |
| | | | | 338.6 | | | 542.2 | |
| Operating profit | | | | | 60.2 | | | 73.0 | |
| Interest expense, net | | | | | 51.3 | | | 58.9 | |
| | | | | | | |
| Other, net | | | | | 1.2 | | | (0.8) | |
| Income from continuing operations before income taxes | | | | | 7.7 | | | 14.9 | |
| Provision (benefit) for income taxes: | | | | | | | |
| Current | | | | | 4.8 | | | (372.8) | |
| Deferred | | | | | 1.2 | | | 225.2 | |
| | | | | 6.0 | | | (147.6) | |
| Income from continuing operations | | | | | 1.7 | | | 162.5 | |
| Loss from discontinued operations, net of income taxes | | | | | (0.4) | | | (0.2) | |
| Net income | | | | | 1.3 | | | 162.3 | |
| Net income (loss) attributable to noncontrolling interest | | | | | (2.0) | | | 0.6 | |
| Net income attributable to Trinity Industries, Inc. | | | | | $ | 3.3 | | | $ | 161.7 | |
| | | | | | | |
| Basic earnings per common share: | | | | | | | |
| Income from continuing operations | | | | | $ | 0.03 | | | $ | 1.36 | |
| Income (loss) from discontinued operations | | | | | — | | | — | |
| Basic net income attributable to Trinity Industries, Inc. | | | | | $ | 0.03 | | | $ | 1.36 | |
| Diluted earnings per common share: | | | | | | | |
| Income from continuing operations | | | | | $ | 0.03 | | | $ | 1.33 | |
| Income (loss) from discontinued operations | | | | | — | | | — | |
| Diluted net income attributable to Trinity Industries, Inc. | | | | | $ | 0.03 | | | $ | 1.33 | |
| Weighted average number of shares outstanding: | | | | | | | |
| Basic | | | | | 110.2 | | | 118.0 | |
| Diluted | | | | | 112.6 | | | 119.9 | |
Trinity has certain unvested restricted stock awards that participate in dividends on a nonforfeitable basis and are therefore considered to be participating securities. Consequently, diluted net income attributable to Trinity Industries, Inc. per common share is calculated under both the two-class method and the treasury stock method, and the more dilutive of the two calculations is presented.
Trinity Industries, Inc.
Condensed Segment Data
(in millions)
(unaudited)
| | | | | | | | | | | | | | | |
| | | Three Months Ended
March 31, |
| Revenues: | | | | | 2021 | | 2020 |
| Railcar Leasing and Management Services Group | | | | | $ | 183.5 | | | $ | 236.3 | |
| Rail Products Group | | | | | 261.0 | | | 509.4 | |
| All Other | | | | | 68.1 | | | 63.4 | |
| Segment Totals before Eliminations | | | | | 512.6 | | | 809.1 | |
| Eliminations – Lease Subsidiary | | | | | (111.3) | | | (190.4) | |
| Eliminations – Other | | | | | (2.5) | | | (3.5) | |
| Consolidated Total | | | | | $ | 398.8 | | | $ | 615.2 | |
| | | | | | | |
| | | Three Months Ended
March 31, |
| Operating profit (loss): | | | | | 2021 | | 2020 |
| Railcar Leasing and Management Services Group | | | | | $ | 78.3 | | | $ | 92.9 | |
| Rail Products Group | | | | | (8.8) | | | 25.1 | |
| All Other | | | | | 15.3 | | | 9.3 | |
| Segment Totals before Eliminations, Corporate Expenses, and Restructuring activities | | | | | 84.8 | | | 127.3 | |
| Corporate | | | | | (22.7) | | | (28.1) | |
| | | | | | | |
| Restructuring activities, net | | | | | 0.3 | | | (5.5) | |
| Eliminations – Lease Subsidiary | | | | | (1.8) | | | (19.9) | |
| Eliminations – Other | | | | | (0.4) | | | (0.8) | |
| Consolidated Total | | | | | $ | 60.2 | | | $ | 73.0 | |
Trinity Industries, Inc.
Selected Financial Information – Leasing Group
($ in millions)
(unaudited)
| | | | | | | | | | | | | | | |
| | | Three Months Ended
March 31, |
| | | | | | 2021 | | 2020 |
| Revenues: | | | | | | | |
| Leasing and management | | | | | $ | 183.5 | | | $ | 192.0 | |
Sales of railcars owned one year or less at the time of sale (1) | | | | | — | | | 44.3 | |
| Total revenues | | | | | $ | 183.5 | | | $ | 236.3 | |
Operating profit (2): | | | | | | | |
| Leasing and management | | | | | $ | 76.6 | | | $ | 82.5 | |
Lease portfolio sales (1) | | | | | 1.7 | | | 10.4 | |
| | | | | | | |
| Total operating profit | | | | | $ | 78.3 | | | $ | 92.9 | |
| Total operating profit margin | | | | | 42.7 | % | | 39.3 | % |
| | | | | | | |
| Leasing and management operating profit margin | | | | | 41.7 | % | | 43.0 | % |
| | | | | | | |
| Selected expense information: | | | | | | | |
Depreciation (3) | | | | | $ | 54.6 | | | $ | 53.6 | |
| Maintenance and compliance | | | | | $ | 25.6 | | | $ | 25.9 | |
| Rent | | | | | $ | 1.7 | | | $ | 3.0 | |
| Selling, engineering, and administrative expenses | | | | | $ | 11.3 | | | $ | 14.3 | |
| Interest | | | | | $ | 45.7 | | | $ | 55.1 | |
| | | | | | | | | | | | | | | |
| | | Three Months Ended
March 31, |
| | | | | 2021 | | 2020 |
| | | | | (in millions) |
| Lease portfolio sales | | | | | $ | 17.3 | | | $ | 112.8 | |
| Operating profit on lease portfolio sales | | | | | $ | 1.7 | | | $ | 10.4 | |
| Operating profit margin on lease portfolio sales | | | | | 9.8 | % | | 9.2 | % |
(1) Beginning in the fourth quarter of 2020, we made a prospective change to the presentation of railcar sales and now present all sales of railcars from the lease fleet as a net gain or loss from the disposal of a long-term asset regardless of the age of railcar that is sold. Historically, we presented sales of railcars from the lease fleet on a gross basis in leasing revenues and cost of revenues if the railcars had been owned for one year or less at the time of sale. Sales of railcars from the lease fleet owned for more than one year had historically been presented as a net gain or loss from the disposal of a long-term asset.
(2) Operating profit includes: depreciation; maintenance and compliance; rent; and selling, engineering, and administrative expenses. Amortization of deferred profit on railcars sold from the Rail Products Group to the Leasing Group is included in the operating profit of the Leasing Group, resulting in the recognition of depreciation expense based on the Company's original manufacturing cost of the railcars. Interest expense is not a component of operating profit and includes the effect of hedges.
(3) Depreciation expense related to our small cube covered hopper railcars decreased by approximately $3.5 million for the three months ended March 31, 2021 relative to the three months ended March 31, 2020 as a result of the impairment charge recorded in the second quarter of 2020 related to these railcars.
Trinity Industries, Inc.
Condensed Consolidated Balance Sheets
(in millions)
(unaudited)
| | | | | | | | | | | |
| March 31, 2021 | | December 31, 2020 |
| ASSETS | | | |
| Cash and cash equivalents | $ | 178.1 | | | $ | 132.0 | |
| | | |
| Receivables, net of allowance | 197.3 | | | 199.0 | |
| Income tax receivable | 440.5 | | | 445.8 | |
| Inventories | 320.9 | | | 321.2 | |
| Restricted cash | 107.4 | | | 96.4 | |
| Property, plant, and equipment, net | 7,026.8 | | | 7,003.4 | |
| Goodwill | 215.7 | | | 208.8 | |
| | | |
| Other assets | 288.8 | | | 295.2 | |
| Total assets | $ | 8,775.5 | | | $ | 8,701.8 | |
| | | |
| LIABILITIES AND STOCKHOLDERS' EQUITY | | | |
| Accounts payable | $ | 159.2 | | | $ | 156.4 | |
| Accrued liabilities | 276.3 | | | 314.7 | |
| Debt | 5,165.1 | | | 5,017.0 | |
| | | |
| Deferred income taxes | 1,051.5 | | | 1,047.5 | |
| | | |
| Other liabilities | 155.5 | | | 150.2 | |
| Stockholders' equity: | | | |
| Trinity Industries, Inc. | 1,692.4 | | | 1,738.8 | |
| Noncontrolling interest | 275.5 | | | 277.2 | |
| 1,967.9 | | | 2,016.0 | |
| Total liabilities and stockholders' equity | $ | 8,775.5 | | | $ | 8,701.8 | |
Trinity Industries, Inc.
Additional Balance Sheet Information
(in millions)
(unaudited)
| | | | | | | | | | | |
| March 31, 2021 | | December 31, 2020 |
| Property, Plant, and Equipment | | | |
| Manufacturing/Corporate: | | | |
| Property, plant, and equipment | $ | 966.7 | | | $ | 979.4 | |
| Accumulated depreciation | (569.1) | | | (577.9) | |
| 397.6 | | | 401.5 | |
| Leasing: | | | |
| Wholly-owned subsidiaries: | | | |
| Machinery and other | 19.4 | | | 19.5 | |
| Equipment on lease | 7,090.6 | | | 7,010.6 | |
| Accumulated depreciation | (1,279.7) | | | (1,234.2) | |
| 5,830.3 | | | 5,795.9 | |
| Partially-owned subsidiaries: | | | |
| Equipment on lease | 2,247.8 | | | 2,248.2 | |
| Accumulated depreciation | (635.9) | | | (621.9) | |
| 1,611.9 | | | 1,626.3 | |
| | | |
| Deferred profit on railcars sold to the Leasing Group | (1,064.7) | | | (1,064.7) | |
| Accumulated amortization | 251.7 | | | 244.4 | |
| (813.0) | | | (820.3) | |
| $ | 7,026.8 | | | $ | 7,003.4 | |
| | | | | | | | | | | |
| March 31, 2021 | | December 31, 2020 |
| Debt | | | |
| Corporate – Recourse: | | | |
| Revolving credit facility | $ | — | | | $ | 50.0 | |
Senior notes, net of unamortized discount of $0.2 and $0.2 | 399.8 | | | 399.8 | |
| 399.8 | | | 449.8 | |
| Less: unamortized debt issuance costs | (1.6) | | | (1.6) | |
| Total recourse debt | 398.2 | | | 448.2 | |
| | | |
| Leasing – Non-recourse: | | | |
| Wholly-owned subsidiaries: | | | |
Secured railcar equipment notes, net of unamortized discount of $0.5 and $0.6 | 2,018.5 | | 2,042.4 |
2017 promissory notes, net of unamortized discount of $9.5 and $10.1 | 792.1 | | | 802.7 | |
| TILC warehouse facility | 763.9 | | | 519.4 | |
| 3,574.5 | | | 3,364.5 | |
| Less: unamortized debt issuance costs | (24.0) | | | (24.0) | |
| 3,550.5 | | | 3,340.5 | |
| Partially-owned subsidiaries: | | | |
| Secured railcar equipment notes | 1,225.2 | | | 1,237.5 | |
| Less: unamortized debt issuance costs | (8.8) | | | (9.2) | |
| 1,216.4 | | | 1,228.3 | |
| Total non–recourse debt | 4,766.9 | | | 4,568.8 | |
| Total debt | $ | 5,165.1 | | | $ | 5,017.0 | |
Trinity Industries, Inc.
Condensed Consolidated Statements of Cash Flows
(in millions)
(unaudited)
| | | | | | | | | | | |
| Three Months Ended
March 31, |
| 2021 | | 2020 |
| Operating activities: | | | |
| Net cash provided by operating activities – continuing operations | $ | 70.1 | | | $ | 173.8 | |
| Net cash used in operating activities – discontinued operations | (0.4) | | | (0.2) | |
| Net cash provided by operating activities | 69.7 | | | 173.6 | |
| | | |
| Investing activities: | | | |
| Proceeds from lease portfolio sales | 17.3 | | | 68.5 | |
| Proceeds from dispositions of property and other assets | 19.8 | | | 9.8 | |
Capital expenditures – leasing (net of sold lease fleet railcars owned one year or less with a net cost of $42.5 for the three months ended March 31, 2020) | (107.9) | | | (129.2) | |
| Capital expenditures – manufacturing and other | (8.5) | | | (14.0) | |
| Acquisitions, net of cash acquired | (16.6) | | | — | |
| Other | (0.1) | | | 0.3 | |
| | | |
| | | |
| Net cash used in investing activities | (96.0) | | | (64.6) | |
| | | |
| Financing activities: | | | |
| Net (repayments of) proceeds from debt | 142.4 | | | (19.0) | |
| Shares repurchased | (35.7) | | | (35.4) | |
| Dividends paid to common shareholders | (23.2) | | | (22.7) | |
| Other | (0.1) | | | — | |
| | | |
| | | |
| Net cash provided by (used in) financing activities | 83.4 | | | (77.1) | |
| Net increase in cash, cash equivalents, and restricted cash | 57.1 | | | 31.9 | |
| Cash, cash equivalents, and restricted cash at beginning of period | 228.4 | | | 277.6 | |
| Cash, cash equivalents, and restricted cash at end of period | $ | 285.5 | | | $ | 309.5 | |
Trinity Industries, Inc.
Reconciliations of Non-GAAP Measures
(in millions, except per share amounts)
(unaudited)
Adjusted Operating Results
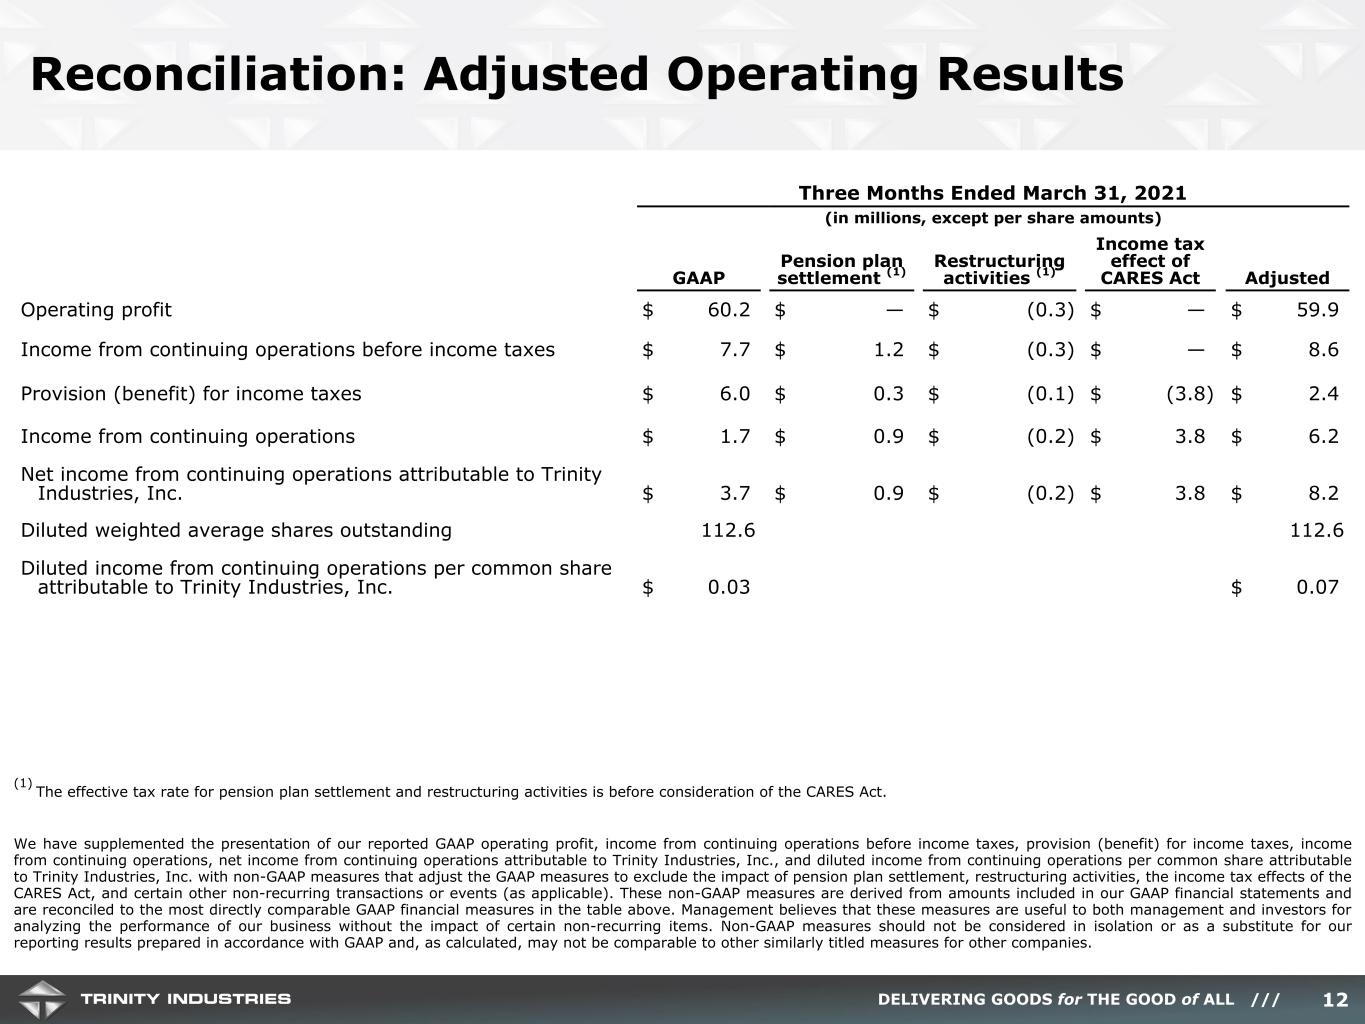
We have supplemented the presentation of our reported GAAP operating profit, income from continuing operations before income taxes, provision (benefit) for income taxes, income from continuing operations, net income from continuing operations attributable to Trinity Industries, Inc., and diluted income from continuing operations per common share attributable to Trinity Industries, Inc. with non-GAAP measures that adjust the GAAP measures to exclude the impact of pension plan settlement, restructuring activities, early redemption of debt, the income tax effects of the CARES Act, and certain other non-recurring transactions or events (as applicable). These non-GAAP measures are derived from amounts included in our GAAP financial statements and are reconciled to the most directly comparable GAAP financial measures in the tables below. Management believes that these measures are useful to both management and investors for analyzing the performance of our business without the impact of certain non-recurring items. Non-GAAP measures should not be considered in isolation or as a substitute for our reporting results prepared in accordance with GAAP and, as calculated, may not be comparable to other similarly titled measures for other companies.
| | | | | | | | | | | | | | | | | | | | | | | | | | | | | | | |
| Three Months Ended March 31, 2021 |
| GAAP | | | | Pension plan settlement (1) | | Restructuring activities (1) | | Income tax effect of CARES Act | | Adjusted |
| Operating profit | $ | 60.2 | | | | | $ | — | | | $ | (0.3) | | | $ | — | | | $ | 59.9 | |
| | | | | | | | | | | |
| | | | | | | | | | | |
| | | | | | | | | | | |
| Income from continuing operations before income taxes | $ | 7.7 | | | | | $ | 1.2 | | | $ | (0.3) | | | $ | — | | | $ | 8.6 | |
| | | | | | | | | | | |
| Provision (benefit) for income taxes | $ | 6.0 | | | | | $ | 0.3 | | | $ | (0.1) | | | $ | (3.8) | | | $ | 2.4 | |
| | | | | | | | | | | |
| Income from continuing operations | $ | 1.7 | | | | | $ | 0.9 | | | $ | (0.2) | | | $ | 3.8 | | | $ | 6.2 | |
| | | | | | | | | | | |
| Net income from continuing operations attributable to Trinity Industries, Inc. | $ | 3.7 | | | | | $ | 0.9 | | | $ | (0.2) | | | $ | 3.8 | | | $ | 8.2 | |
| | | | | | | | | | | |
| Diluted weighted average shares outstanding | 112.6 | | | | | | | | | | 112.6 |
| | | | | | | | | | | |
| Diluted income from continuing operations per common share attributable to Trinity Industries, Inc. | $ | 0.03 | | | | | | | | | | | $ | 0.07 | |
| | | | | | | | | | | | | | | | | | | | | | | | | | | | | |
| Three Months Ended March 31, 2020 |
| GAAP | | Restructuring activities (1) | | Early redemption of debt (1) | | Income tax effect of CARES Act | | Adjusted |
| Operating profit | $ | 73.0 | | | $ | 5.5 | | | $ | — | | | $ | — | | | $ | 78.5 | |
| | | | | | | | | |
| Income from continuing operations before income taxes | $ | 14.9 | | | $ | 5.5 | | | $ | 5.0 | | | $ | — | | | $ | 25.4 | |
| | | | | | | | | |
| Provision (benefit) for income taxes | $ | (147.6) | | | $ | 1.3 | | | $ | 1.2 | | | $ | 154.7 | | | $ | 9.6 | |
| | | | | | | | | |
| Income from continuing operations | $ | 162.5 | | | $ | 4.2 | | | $ | 3.8 | | | $ | (154.7) | | | $ | 15.8 | |
| | | | | | | | | |
| Net income from continuing operations attributable to Trinity Industries, Inc. | $ | 161.9 | | | $ | 4.2 | | | $ | 3.8 | | | $ | (154.7) | | | $ | 15.2 | |
| | | | | | | | | |
| Diluted weighted average shares outstanding | 119.9 | | | | | | | | 119.9 |
| | | | | | | | | |
| Diluted income from continuing operations per common share attributable to Trinity Industries, Inc. | $ | 1.33 | | | | | | | | | $ | 0.11 | |
(1) The effective tax rate for pension plan settlement, restructuring activities, and the early redemption of debt is before consideration of the CARES Act.
Free Cash Flow
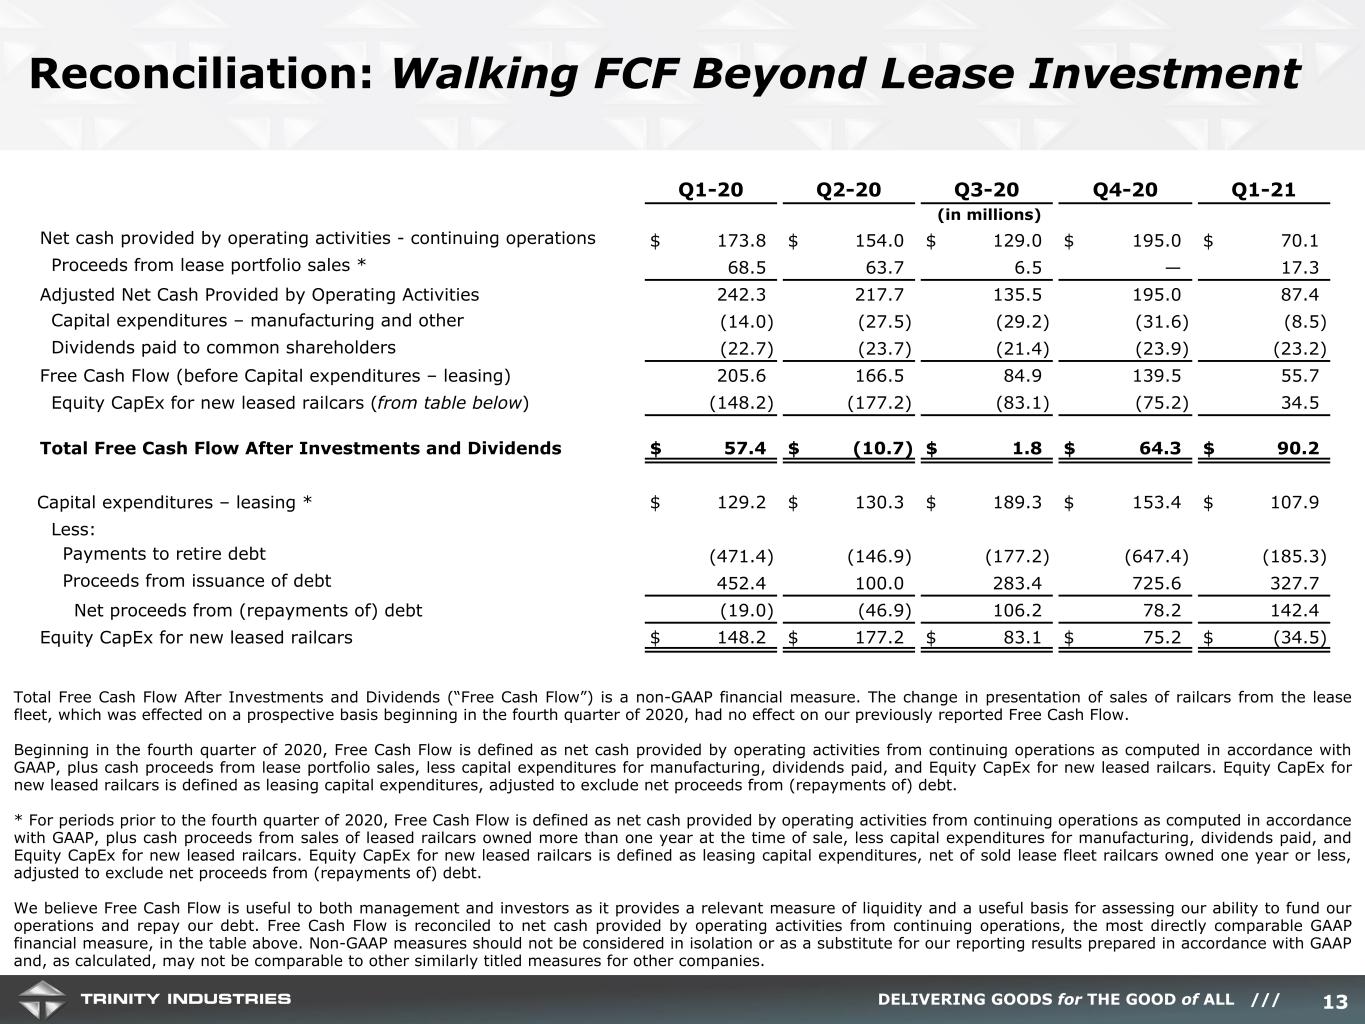
Total Free Cash Flow After Investments and Dividends ("Free Cash Flow") is a non-GAAP financial measure. The change in presentation of sales of railcars from the lease fleet, which was effected on a prospective basis beginning in the fourth quarter of 2020, had no effect on our previously reported Free Cash Flow.
We believe Free Cash Flow is useful to both management and investors as it provides a relevant measure of liquidity and a useful basis for assessing our ability to fund our operations and repay our debt. Free Cash Flow is reconciled to net cash provided by operating activities from continuing operations, the most directly comparable GAAP financial measure, in the following tables.
For the three months ended March 31, 2021, Free Cash Flow is defined as net cash provided by operating activities from continuing operations as computed in accordance with GAAP, plus cash proceeds from lease portfolio sales, less capital expenditures for manufacturing, dividends paid, and Equity CapEx for new leased railcars. Equity CapEx for new leased railcars is defined as leasing capital expenditures, adjusted to exclude net proceeds from (repayments of) debt.
| | | | | |
| Three Months Ended March 31, 2021 |
| (in millions) |
| Net cash provided by operating activities – continuing operations | $ | 70.1 | |
| Proceeds from lease portfolio sales | 17.3 | |
| Adjusted Net Cash Provided by Operating Activities | 87.4 | |
| Capital expenditures – manufacturing and other | (8.5) | |
| Dividends paid to common stockholders | (23.2) | |
Free Cash Flow (before Capital expenditures – leasing) | 55.7 | |
| Equity CapEx for new leased railcars | 34.5 | |
| Total Free Cash Flow After Investments and Dividends | $ | 90.2 | |
| |
| Capital expenditures – leasing | $ | 107.9 | |
| Less: | |
| Payments to retire debt | (185.3) | |
| Proceeds from issuance of debt | 327.7 | |
| Net proceeds from (repayments of) debt | 142.4 | |
| Equity CapEx for new leased railcars | $ | (34.5) | |
For the three months ended March 31, 2020, Free Cash Flow is defined as net cash provided by operating activities from continuing operations as computed in accordance with GAAP, plus cash proceeds from sales of leased railcars owned more than one year at the time of sale, less capital expenditures for manufacturing, dividends paid, and Equity CapEx for new leased railcars. Equity CapEx for new leased railcars is defined as leasing capital expenditures, net of sold lease fleet railcars owned one year or less, adjusted to exclude net proceeds from (repayments of) debt.
| | | | | |
| Three Months Ended March 31, 2020 |
| (in millions) |
| Net cash provided by operating activities – continuing operations | $ | 173.8 | |
| Proceeds from railcar lease fleet sales owned more than one year at the time of sale | 68.5 | |
| Adjusted Net Cash Provided by Operating Activities | 242.3 | |
| Capital expenditures – manufacturing and other | (14.0) | |
| Dividends paid to common stockholders | (22.7) | |
Free Cash Flow (before Capital expenditures – leasing) | 205.6 | |
| Equity CapEx for new leased railcars | (148.2) | |
| Total Free Cash Flow After Investments and Dividends | $ | 57.4 | |
| |
Capital expenditures – leasing, net of sold lease fleet railcars owned one year or less of $42.5 | $ | 129.2 | |
| Less: | |
| Payments to retire debt | (471.4) | |
| Proceeds from issuance of debt | 452.4 | |
| Net proceeds from (repayments of) debt | (19.0) | |
| Equity CapEx for new leased railcars | $ | 148.2 | |
EBITDA and Adjusted EBITDA
“EBITDA” is defined as income from continuing operations plus interest expense, income taxes, and depreciation and amortization expense. Adjusted EBITDA is defined as EBITDA plus non-cash restructuring activities and pension plan settlement. EBITDA and Adjusted EBITDA are non-GAAP financial measures; however, the amounts included in these calculations are derived from amounts included in our GAAP financial statements. EBITDA and Adjusted EBITDA are reconciled to net income, the most directly comparable GAAP financial measure, in the following table. This information is provided to assist management and investors in making meaningful comparisons of our operating performance between periods. We believe EBITDA is a useful measure for analyzing the performance of our business. We also believe that EBITDA is commonly reported and widely used by investors and other interested parties as a measure of a company’s operating performance and debt servicing ability because it assists in comparing performance on a consistent basis without regard to capital structure, depreciation or amortization (which can vary significantly depending on many factors). EBITDA and Adjusted EBITDA should not be considered as alternatives to net income as indicators of our operating performance, or as alternatives to operating cash flows as measures of liquidity. Non-GAAP measures should not be considered in isolation or as a substitute for our reporting results prepared in accordance with GAAP and, as calculated, may not be comparable to other similarly titled measures for other companies.
| | | | | | | | | | | | | | | |
| | | Three Months Ended
March 31, |
| | | | | 2021 | | 2020 |
| Net income | | | | | $ | 1.3 | | | $ | 162.3 | |
| Less: Loss from discontinued operations, net of income taxes | | | | | (0.4) | | | (0.2) | |
| Income from continuing operations | | | | | $ | 1.7 | | | $ | 162.5 | |
| Interest expense | | | | | 51.4 | | | 61.3 | |
| Provision (benefit) for income taxes | | | | | 6.0 | | | (147.6) | |
| Depreciation and amortization expense | | | | | 66.6 | | | 66.9 | |
EBITDA | | | | | $ | 125.7 | | | $ | 143.1 | |
| | | | | | | |
| Restructuring activities, net | | | | | (0.3) | | | 5.5 | |
| Pension plan settlement | | | | | 1.2 | | | — | |
| Adjusted EBITDA | | | | | $ | 126.6 | | | $ | 148.6 | |
Exhibit 99.2
Trinity Industries, Inc.
Earnings Release Conference Call – Q1 2021
April 22, 2021
Jessica Greiner
Vice President, Investor Relations and Communications
Thank you, Rocco. Good morning everyone. I’m Jessica Greiner, Vice President of Investor Relations and Communications for Trinity. We appreciate you joining us for the Company’s first quarter 2021 financial results conference call.
Our prepared remarks will include comments from Jean Savage, Trinity’s Chief Executive Officer and President, and Eric Marchetto, the Company’s Chief Financial Officer. We will hold a Q&A session following the prepared remarks from our leaders.
During the call today, we will reference slides highlighting key points of discussion, as well as certain non-GAAP financial metrics. The reconciliation of the non-GAAP metrics are provided in the appendix of our supplemental slides. The supplemental materials are accessible on our IR website at www.trin.net. These slides can be found under the Events and Presentations portion of the site along with the First Quarter Earnings Conference Call event link. They are also available live during the webcast.
It is now my pleasure to turn the call over to Jean.
E. Jean Savage
Chief Executive Officer and President
Thank you, Jessica, and good morning to everyone joining us today.
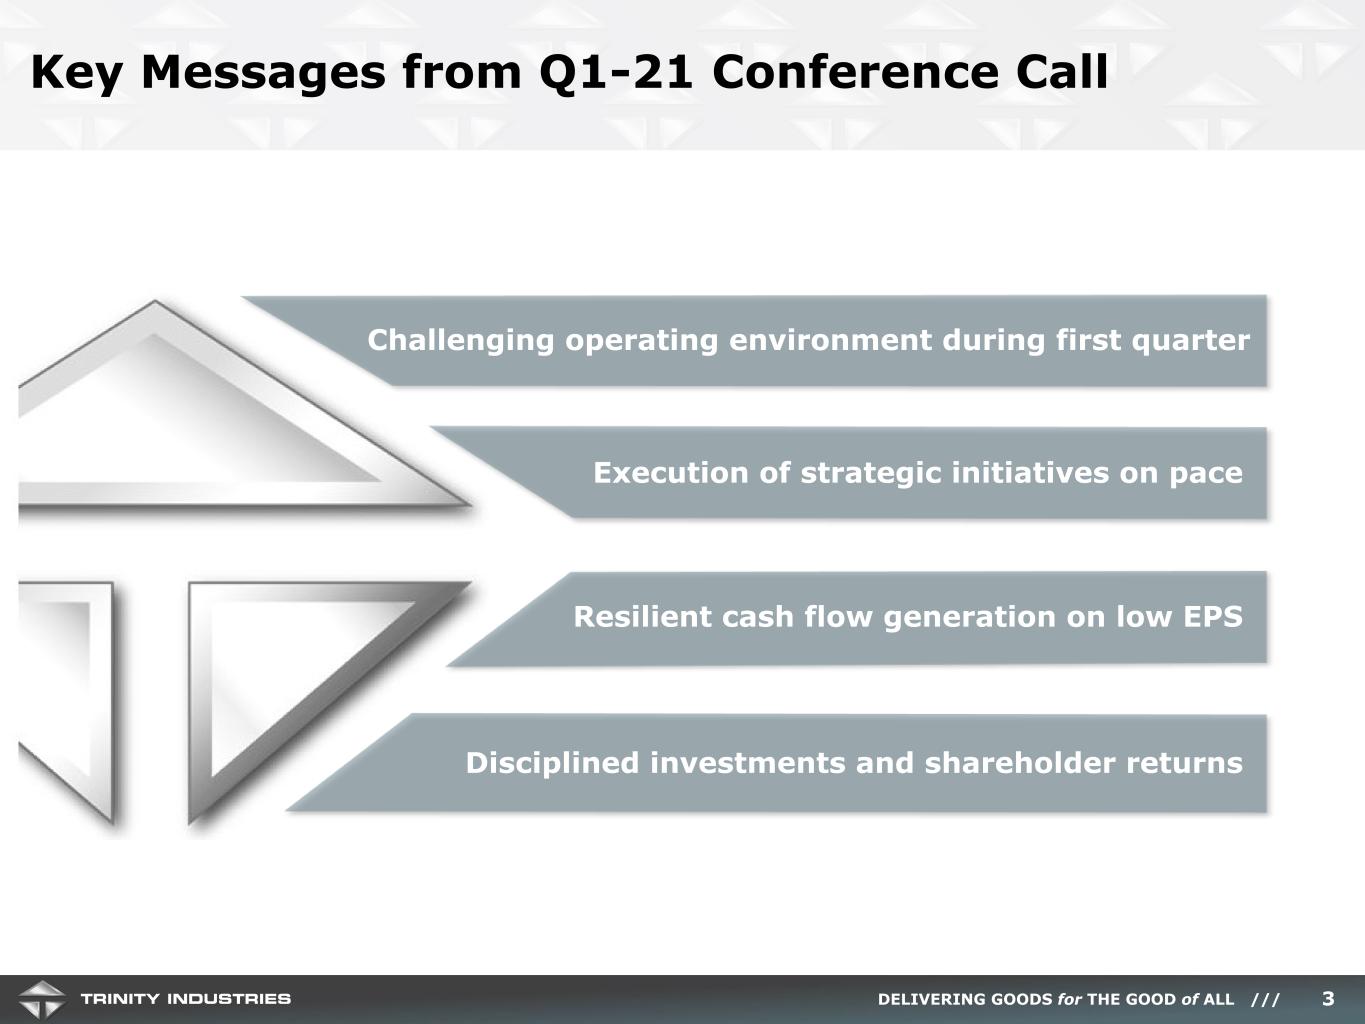
I hope everyone is staying healthy and looking forward to a brighter summer and year ahead. We certainly are, and are increasingly encouraged by the improving trends for our business and the economy as a whole. While the railcar market is showing signs of recovery in 2021, we are focused on the execution of strategic initiatives that are more within our control to position the Company for an acceleration in our financial performance – many of which were detailed at our Investor Day last winter as part of our 3 year strategic plan.
To highlight the key themes from the first quarter, Trinity’s results reflect the initial impact of implementing certain of these project initiatives on top of challenging pricing and declining volumes given the lower order volumes last year. Additionally, two significant weather events affected our
productivity in the quarter, one of which will have a lingering impact on our business in the second quarter.
Even so, I am pleased with our progress toward the goals we laid out at our Investor Day and the tremendous effort our teams have put forth. We feel very good about how we are positioning our business for a recovery, and the embedded value we are creating in the platform for long-term performance. While earnings were low given the reasons I just stated, Trinity’s rail platform still generated a healthy level of cash flow in the first quarter. We also believe the investments made during the quarter align with our capital allocation framework for creating long-term shareholder value.
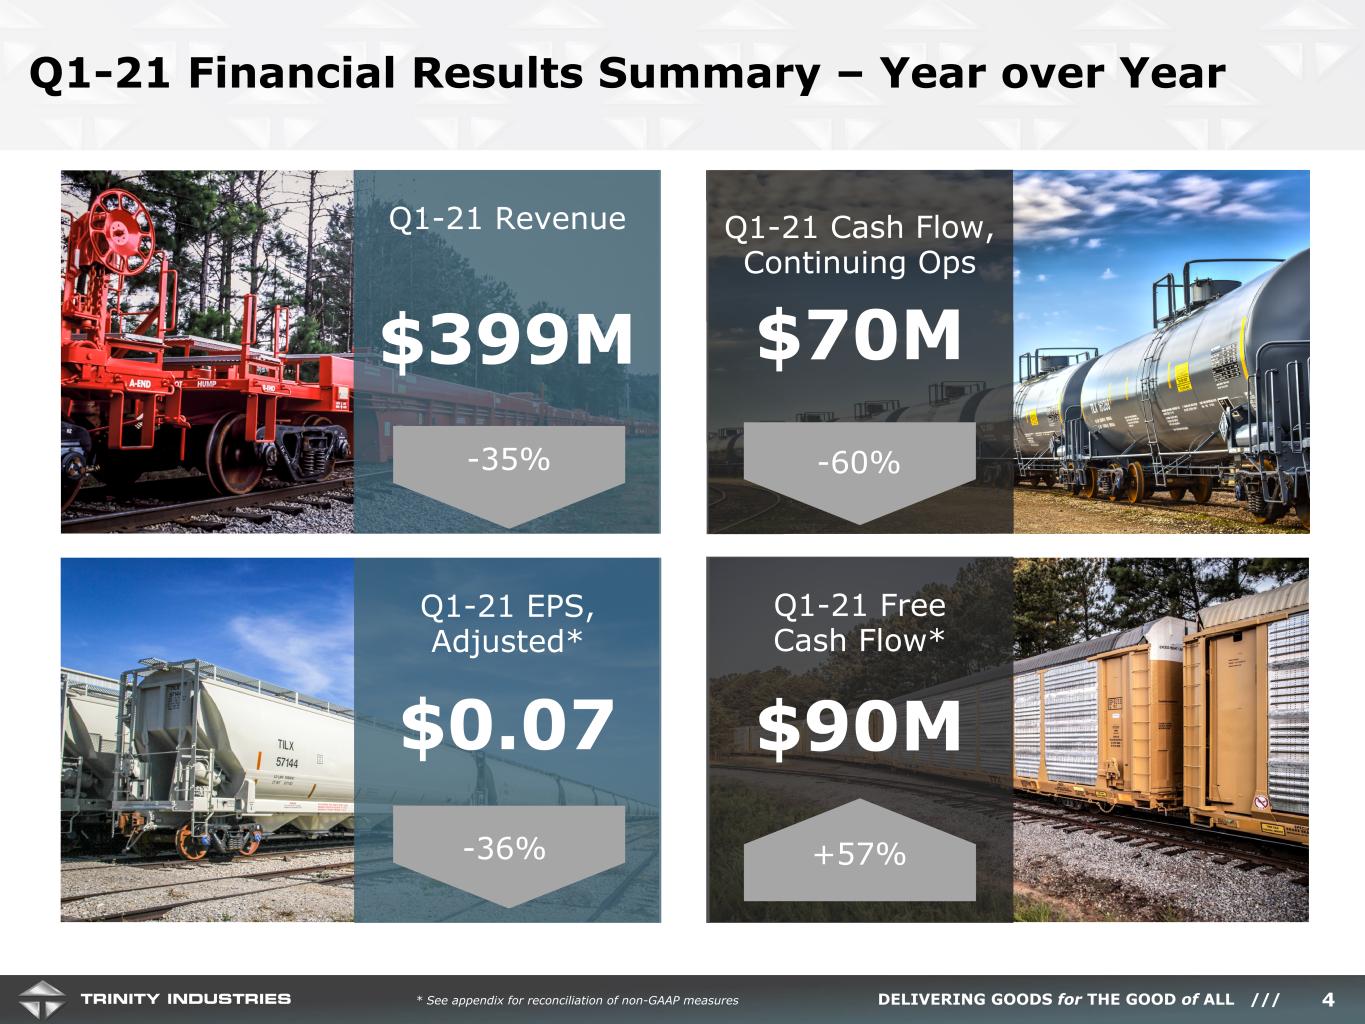
Let’s turn now to Slide 4 and review our results. As I mentioned in my opening, we believe the railcar market is early in its recovery from the pandemic-related headwinds of 2020. However, our first quarter financials continue to show the impact of lower demand and pricing pressure in the market over the past year. Our first quarter revenue of $399 million was down 35% from a year ago, which was within our expectations, but nonetheless, not where we like it to be. The past quarter will be the most challenging year-over-year comparison for us, given that COVID-19 did not take a broader hold in the U.S. until the second quarter of last year. Lower deliveries also impacted our adjusted EPS of $0.07, which was down compared to a year ago.
While the overall financial results remained weak, Trinity’s rail platform continues to drive solid cash flow relative to the level of earnings we achieved. In the first quarter, cash flow from operations totaled $70 million and Free Cash Flow, which is essentially our excess cash after all investments and dividends, was $90 million. Eric will go into more details on our cash flow results in a moment.
What is difficult to see in the consolidated results are the encouraging internal and external trends we are seeing. I am pleased to report that our operational performance and railcar inquiries are turning the corner, and trended positively as we progressed through the first quarter.
Let’s first briefly address the railcar market – turning to Slide 5, as mentioned, the rail market is still soft, but we are seeing signs of a recovery.
Market uncertainty in the wake of COVID-19 pandemic remains the largest headwind. Our customers tell us they continue to refine their expectations for the North American economic recovery and what that will mean for their businesses. Their concerns are starting to ease with increasing vaccine distribution and government stimulus programs. Customer confidence in the economic outlook impacts their decisions regarding lease renewals, fleet expansion, and asset replacement. Looking at
rail traffic, first quarter loadings were greatly impacted by weather events, but some positive momentum emerged in the last few weeks. Additionally, we’ve seen 9 straight months of railcars coming out of storage since the peak last summer, leading to industry utilization returning to pre-pandemic levels and trending around the 5 year industry average.
We see positive carload and storage trends for railcar types representing over 50% of the North American fleet. Previously, fleets serving the Agriculture and Consumer Products markets were presenting the most opportunity based on improving carloads. With early signs of a recovery in the industrial economy, high steel prices, and increasing steel mill utilization, as well as a potential Infrastructure Bill, we are also seeing positive benefits on railcars within the Construction and Metals markets. The Energy markets continue to lag, but we are seeing some recovery from the pandemic lows across commodities like coal, crude oil, and ethanol, likely associated with the reopening of the economy across the country.
Utilization and pricing are firming within our lease portfolio, and railcar inquiries returned to a more normal level of activity. Trinity’s FLRD metric declined slightly during the first quarter to a -14.8% as a result of difficult comps in the quarter for expiring lease rates. We expect lease rates to stabilize to slightly improve in many markets over the course of the year as excess railcar capacity returns to service to meet increasing car loads. When looking at the potential for new railcar demand, we currently expect industry deliveries to be below replacement levels this year, but believe that current inquiries support railcar deliveries at, or just above, replacement levels in 2022.
I want to make a quick comment on steel prices. Given the decline in industrial production the past few years, we are in a unique and dynamic environment as it relates to the supply of steel, and the unprecedented rise in steel prices seen over the last 6 to 9 months. Trinity typically uses contract-specific purchasing practices, existing supplier commitments, contractual price escalation provisions, and other arrangements with our customers to mitigate the effects of steel price volatility on our operating profits for the year. In general, we believe there is enough capacity in the industry to meet current production levels and that our existing contracts will meet our current production forecasts. If current steel prices sustain at these levels or trend higher, it could limit demand for new railcars. Of similar importance, current steel pricing could create a profit headwind in some of our near-term deliveries as the supply chain ramps up to meet increasing demand.
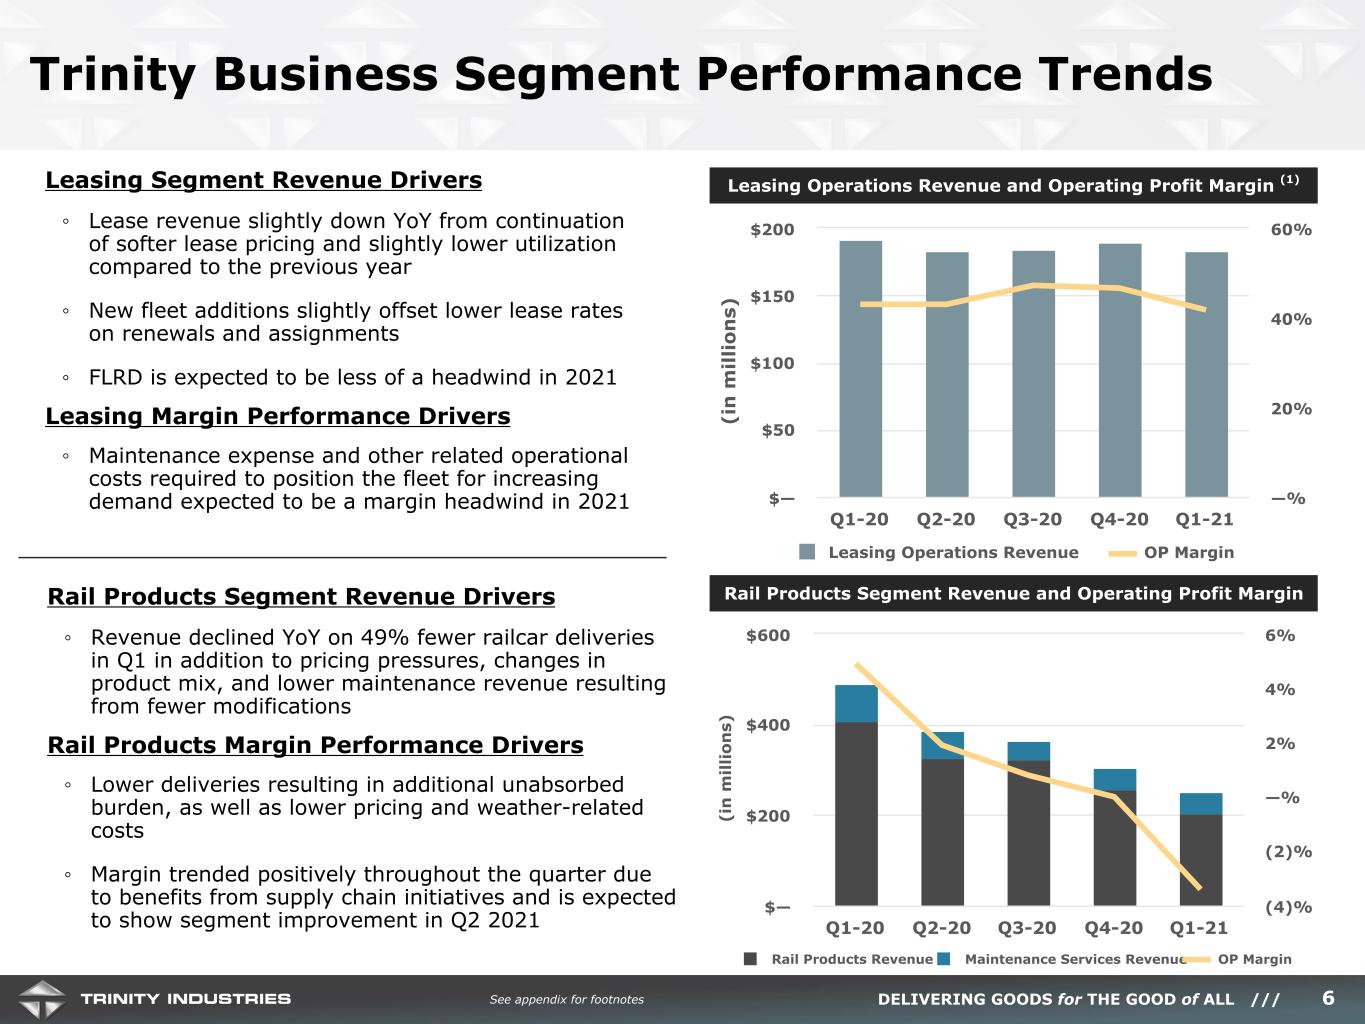
Turning to Slide 6, I’d like to provide a little further color on our segment results. For the Leasing business, Trinity’s lease revenue was slightly down compared to last year due to the continuation of
softer pricing on lease rates and slightly lower utilization. The good news is, in addition to prices firming in the market as demand improves, we are seeing positive developments with leading indicators, such as high renewal success rate and lengthening terms. We are taking a disciplined approach to pricing on our lease rates, and we believe we are nearing an inflection point as available railcars in certain markets are approaching full utilization. We are also closely monitoring our costs, but expect that maintenance and other operational expenses required to position the lease fleet for increasing demand will be a headwind to the Leasing segment margin for the year. As part of our strategic initiatives, we will continue to work towards increasing the percentage of maintenance and compliance events handled internally within our shops. Over the last few years, we have increased our service capacity from roughly one-third to over half of our maintenance events – achieving a target we set out at the end of 2018. With our current footprint, we have the ability to get to 70%, which will continue to reduce the effective maintenance costs of our fleet and improve the serviceability of the railcars for our customers.
In regards to our railcar production operations, on the surface, Rail segment margins are understandably still below our targets. We continue to work hard to right size our operations and shift variable and indirect costs. During the first quarter, we reduced manufacturing headcount by another 25% to balance our production capacity with demand. We also experienced two significant weather events that disrupted our operations in the first quarter and impacted profit by roughly $4 million. First, the severe winter storms that impacted much of the country over the middle of February impacted critical utilities for several facilities, with some buildings sustaining minor damage. Second, very late in the quarter, a tornado damaged our Cartersville, Georgia maintenance plant. Fortunately, no one was injured. The tornado damage is expected to have a minor impact on the Rail Products Group's second quarter results, and we believe our insurance coverage is sufficient to cover property damage costs related to the event. Additionally, the Company may be entitled to business interruption proceeds due to the work stoppage.
Looking forward, we expect progress on our optimization efforts will translate roughly into breakeven margins for the second quarter, with continuous improvement through year end. Approximately 55% of our backlog is expected to deliver in the year, resulting in declining year over year deliveries; although we do expect our delivery rate to build through the year to meet demand from new orders.
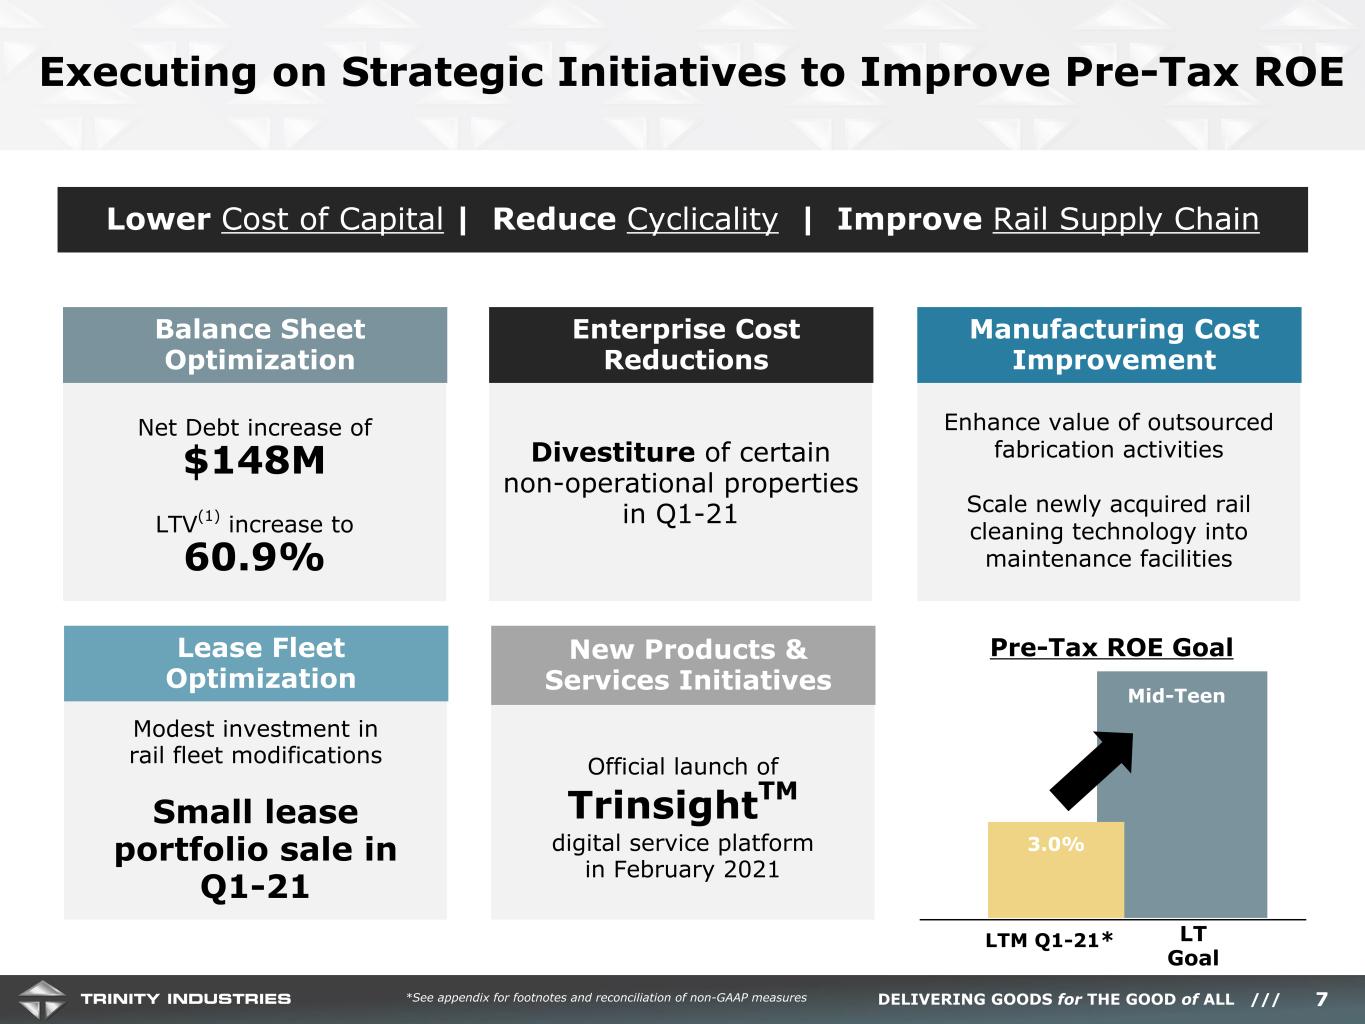
Moving along to Slide 7, in terms of progress on our initiatives in the first quarter, we executed against both our efficiency and our balance sheet goals.
Over the quarter, we successfully launched various initiatives to enhance the value of our outsourced fabrication activities. I already mentioned the completion of further headcount reductions. In aggregate, we have made great progress to lower our breakeven costs on railcar production, and we are starting to see tangible benefits from our efforts. Through the remainder of the year, we plan to continue lean initiatives and install additional automation throughout our rail operations to lower the overall cost structure.
We are continuing to evaluate cost savings across the enterprise. We sold several idled facilities during the first quarter, and we expect to conduct a number of these transactions over the next couple of years to clean up our operational footprint and reduce the carrying costs of these facilities.
On the balance sheet, we completed a small sale of leased railcars as part of our portfolio yield improvement goals. This portfolio sale is a small step toward the goal, but we have a number of strategies in progress to improve our balance sheet. As you’ll recall from our Investor Day, Trinity is committed to lowering our cost of capital by raising our leverage to a target of 60-65% LTV. Eric will speak more to our balance sheet optimization shortly.
And finally, an update on Trinsight, which is our real-time digital tracking and fleet data service. We continue to have promising dialog with customers and have moved to an active pilot program with a growing number of those customers. We look forward to updating you on the revenue opportunity and the potential for the market impact in the future.
In summary, we are executing our plans well, and with continued improvement in rail fundamentals, we believe our returns and financials will incrementally improve on the upcycle given the operating and financial leverage we are building in the business. It’s always difficult to predict the exact timing of an inflection or the pace of a recovery, but we are encouraged by the momentum we can see both within our business and within the market. Eric, I’ll hand it over to you for additional comments.
Eric R. Marchetto,
Executive Vice President and Chief Financial Officer
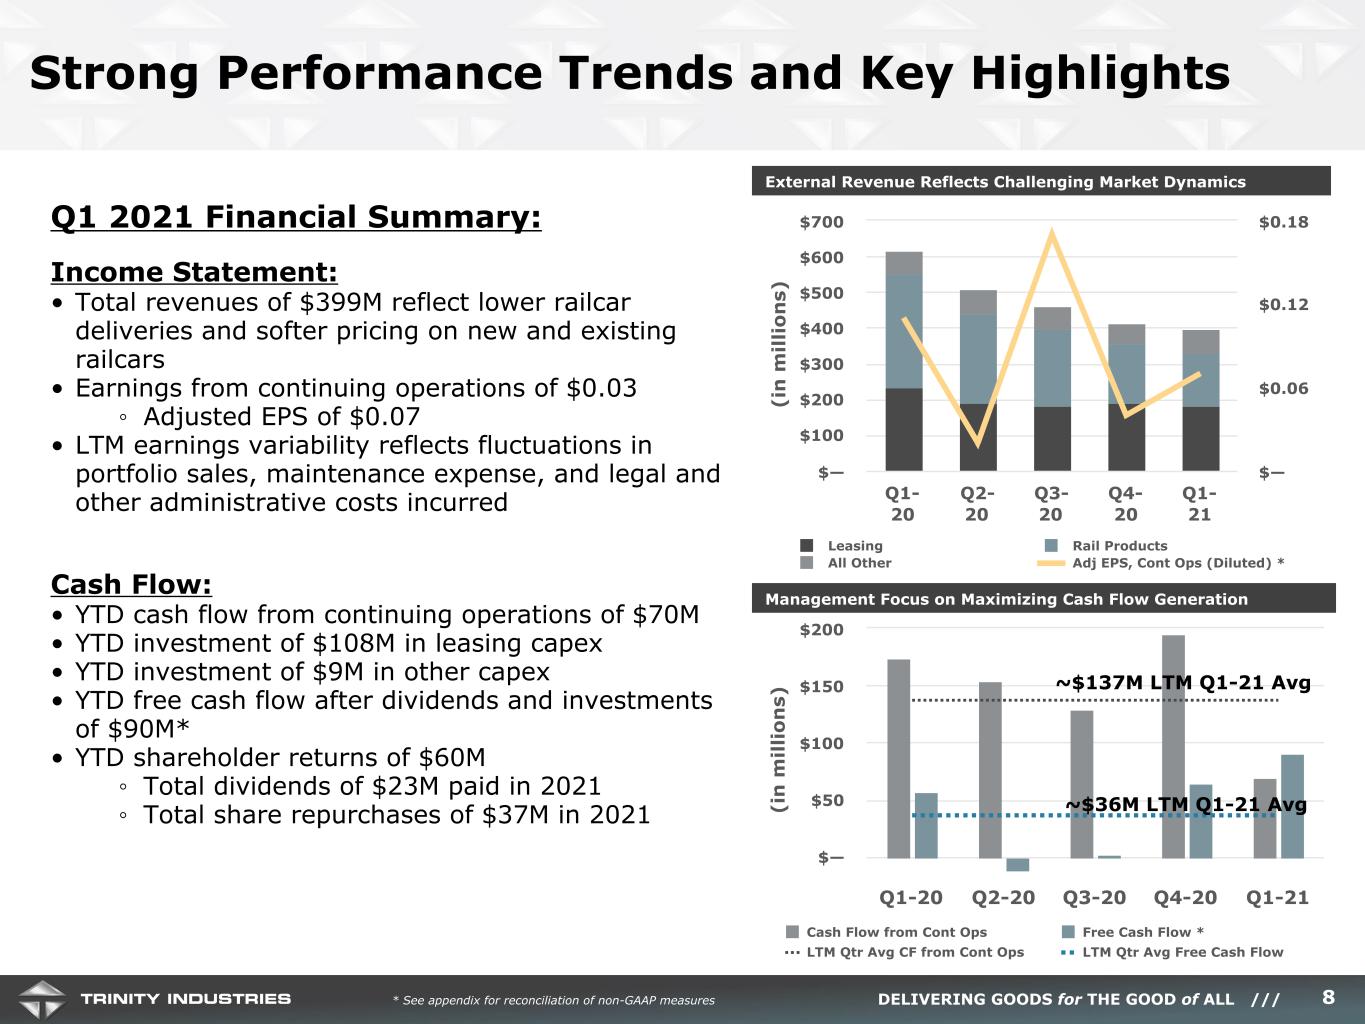
Thank you, Jean – and good morning everyone. I’ll start with the financial summary on Slide 8 and provide a few more details. Trinity’s first quarter results are a combination of the challenging post-pandemic market environment and our efforts to position the business for an acceleration in financial performance. While the earnings results are lower than the first quarter of 2020, we believe we are making the necessary changes for improved profitability in 2021, and as Jean said, we are seeing green shoots from our efforts within the business.
Jean has highlighted several business drivers of our financial performance, including lower overall deliveries, and challenging lease and new car pricing compared to prior quarters. During the quarter, our earnings results were impacted by approximately $4 million of direct costs and lost production time associated with two distinct weather events. As we look through 2021, we expect modest earnings improvement in the next quarter with further acceleration into the back half of the year, resulting in year-over-year earnings improvement in 2021.
In regards to cash flow, first quarter cash flow from operations primarily reflects the lower level of operating income. Our working capital was substantially unchanged during the first quarter resulting in $70 million in operating cash flow for the period. For 2021, we continue to expect cash flow from operations of between $625 million and $675 million.
Our investments in the quarter included approximately $108 million in leasing capex for new railcars and betterments and $9 million in manufacturing capex following the completion of our Midwest maintenance facility. For the year, our expectation for net leasing capex and manufacturing capex remains the same at $300 million to $350 million and $45 million to $60 million, respectively. We anticipate completing additional portfolio sales from the fleet during 2021 as we execute on our initiative to improve lease fleet returns.
Total Free Cash Flow after investments and dividends totaled $90 million in Q1. The improvement from cash flow from operations is the result of the timing in the financing of our lease fleet growth for the quarter, offsetting the equity capital required.
Trinity also completed the previously announced acquisition of a railcar cleaning technology company for approximately $17 million. We expect to leverage this new technology and build the capability as part of our automation efforts in rail maintenance operations.
We continue to return meaningful amounts of capital to shareholders through our dividend and share repurchases, which combined for approximately $60 million during the quarter. Our share repurchase authorization has $145 million remaining through the end of the year. As we look across our opportunity set for deploying capital, we are committed to taking a returns-based approach and do right by the shareholder.
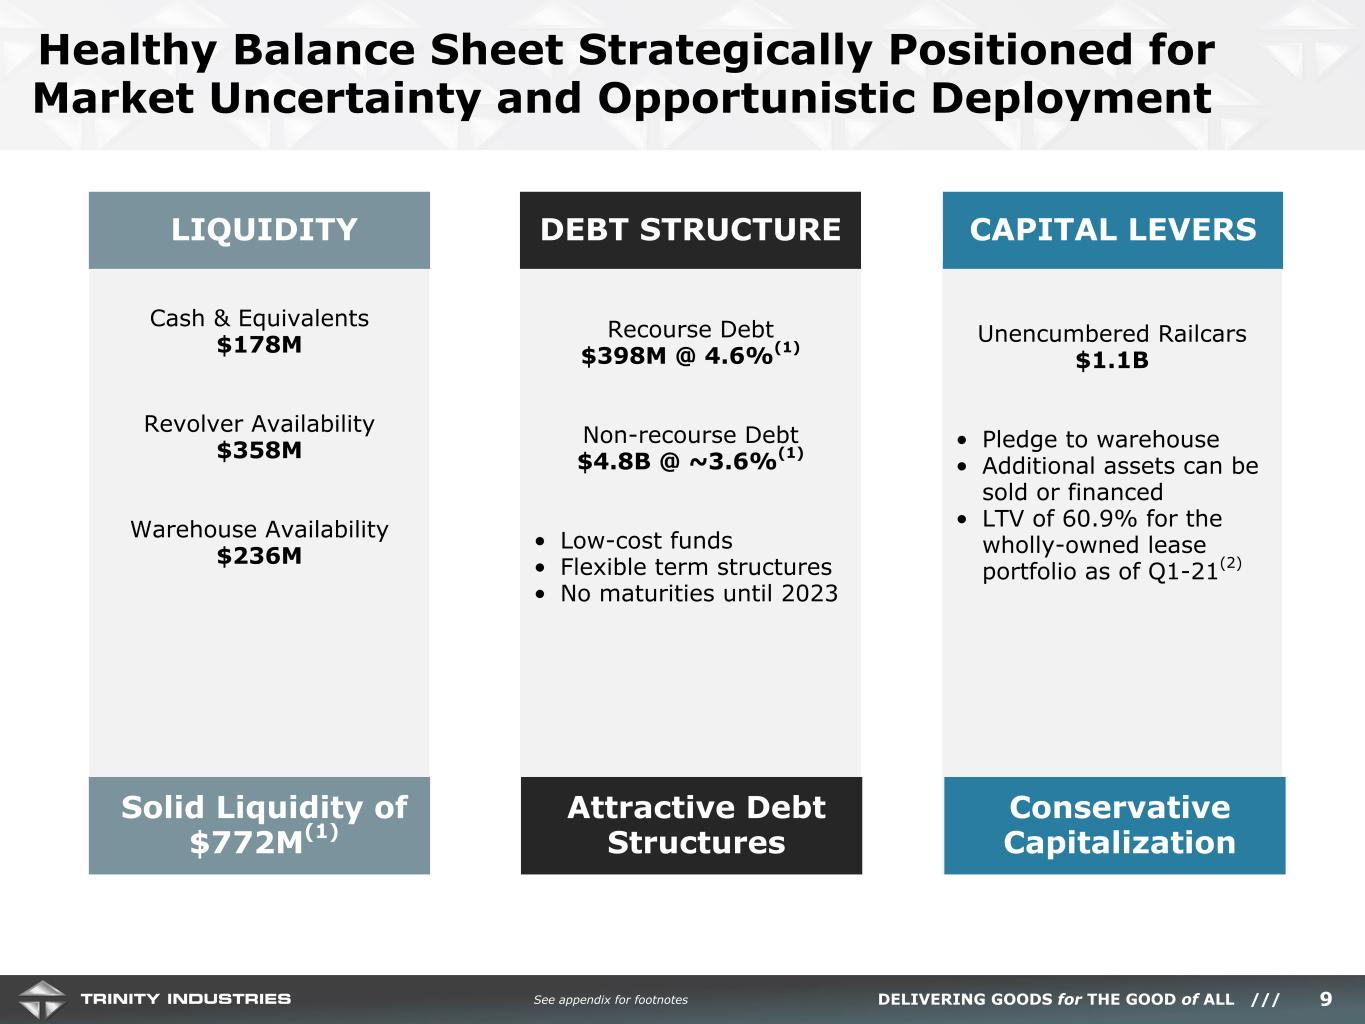
Turning to Slide 9, Trinity remains in a strong financial position with a balance sheet capable of opportunistic deployment. We’re also making steady progress on our leverage target goals and lowering our cost of capital. During the first quarter, Trinity expanded the size of our Leasing
warehouse. The increased size of the warehouse gives Trinity the ability to lower our overall interest expense while gaining exposure to floating rate debt. Our liquidity at the end of the first quarter was $772 million.
We expect to continue taking advantage of the low interest rate environment to reduce our overall cost of capital. Trinity’s nearest term debt maturities primarily relate to our partially-owned subsidiaries, which were financed in a much different interest rate environment. Rail asset-backed securities have continued to attract new investors creating a very deep market and compelling environment for completing new debt deals. The announcement of our Green Financing Framework for lease securitizations is also potentially opening new pools of capital. We are taking a disciplined approach to matching the increased leverage on the balance sheet with the ability to deploy that capital to create shareholder value.
Near term, our capital allocation priorities remain a modest investment in our lease fleet for growth, a normalized level of manufacturing capex, which includes implementing new cleaning technology into our maintenance business, as well as small tuck-in acquisitions for both secondary market portfolios and other services. Our loan-to-value ended the first quarter at 61%, which leaves us positioned to take advantage of attractive market opportunities, including returning capital to shareholders.
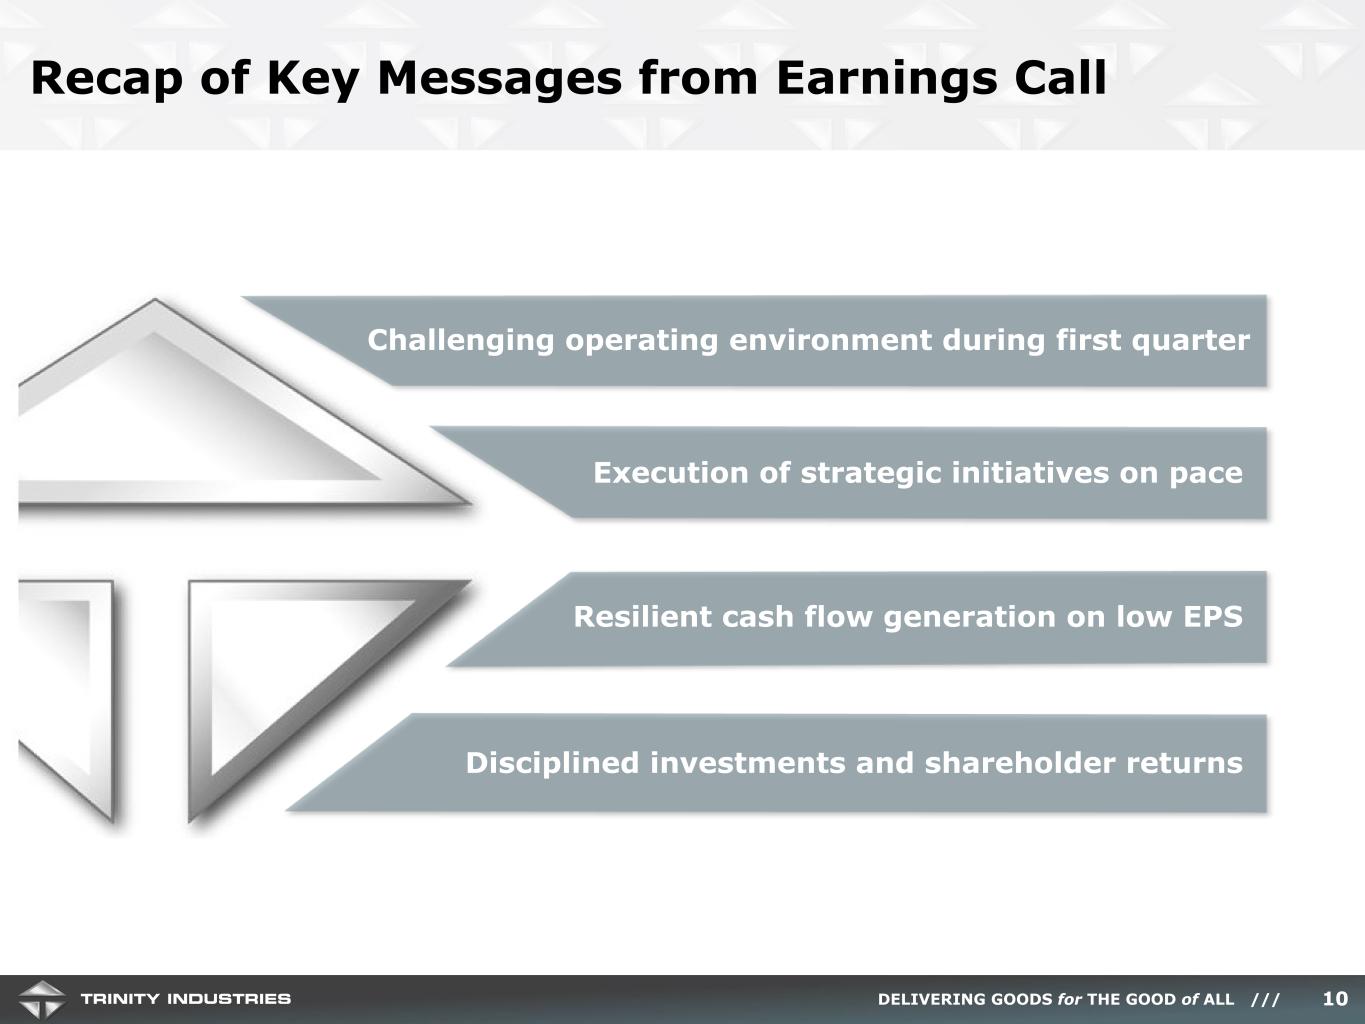
In closing, we believe that the strategic plan we laid out to investors is taking hold. And while the true success of our efforts will take time to come to fruition within our financials, we are focused on executing upon initiatives that are more within our control and will accelerate our financial performance as the market recovers. After a year of major change in a world-wide pandemic, and big down payments towards restructuring the Company in 2020, the first quarter of 2021 was another example of our people rising to meet a challenge. Our platform continues to prove its resiliency, delivering a healthy level of cash flows against an otherwise low earnings number. We remain committed to a disciplined approach for allocating capital to build long-term shareholder value. We are encouraged by the continued positive trends we are seeing across the railcar industry and believe, outside of a pandemic setback, that we are on the road to recovery.
Rocco, you may now take us to questions from our participants.
Jessica Greiner
Vice President, Investor Relations and Communications
Thank you, Rocco. A replay of today’s call will be available after 10:30 a.m. Eastern standard time through midnight on April 29th, 2021. The replay number is (877) 344-7529 with an access code of 10152017. A replay of the webcast will also be available under the Events and Presentations page on our Investor Relations website located at www.trin.net. We look forward to visiting with you again on our next conference call. Thank you for joining us this morning.