Exhibit 99.1
FOR IMMEDIATE RELEASE
Trinity Industries, Inc. Announces Second Quarter 2020 Results
Reports quarterly GAAP and Adjusted earnings (loss) from continuing operations of $(1.76) and $0.02 per diluted share, respectively
Generates year-to-date operating and free cash flow before leasing investment of $328 million and $372 million, respectively
Total committed liquidity of $709 million at the end of the second quarter
Pre-tax non-cash asset impairment charges of $369 million related to small cube covered hopper railcars
Returned $82 million of capital to stockholders year-to-date
DALLAS, Texas – July 22, 2020 – Trinity Industries, Inc. (NYSE:TRN) today announced earnings results for the second quarter ended June 30, 2020.
Financial and Operational Highlights — Second Quarter 2020
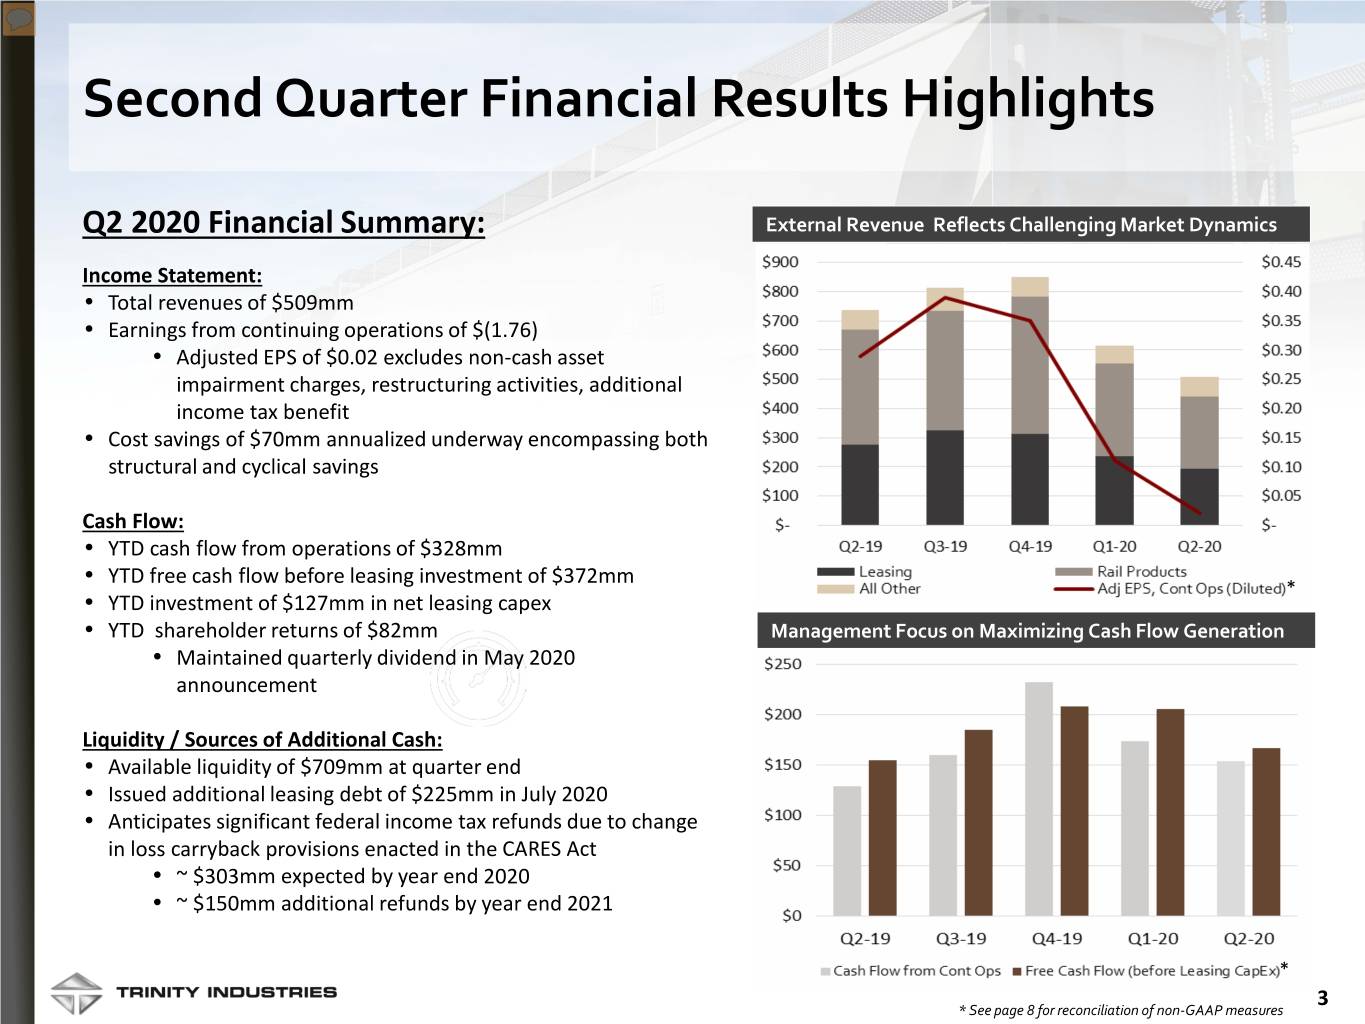
•Quarterly total company revenues of $509 million
•Quarterly loss from continuing operations per common diluted share ("EPS") of $(1.76) and quarterly adjusted EPS of $0.02, which excludes the following:
◦Non-cash impairment of long-lived assets totaling $1.86 per common diluted share
◦Additional income tax benefit of $0.10 per common diluted share related to the effects of the Coronavirus Aid, Relief, and Economic Security Act (the "CARES Act")
•Year-to-date cash flow from operations and free cash flow before leasing investment of $328 million and $372 million, respectively
•Year-to-date investment of $127 million in leasing capital expenditures, net of railcar sales, predominantly for growth
•Total committed liquidity of $709 million as of June 30, 2020
◦Expanded lease fleet borrowings by $225 million subsequent to quarter-end
◦Expects $303 million in federal income tax refunds in 2020, and an additional $150 million in 2021, as a result of utilizing loss carryback provisions included in the CARES Act
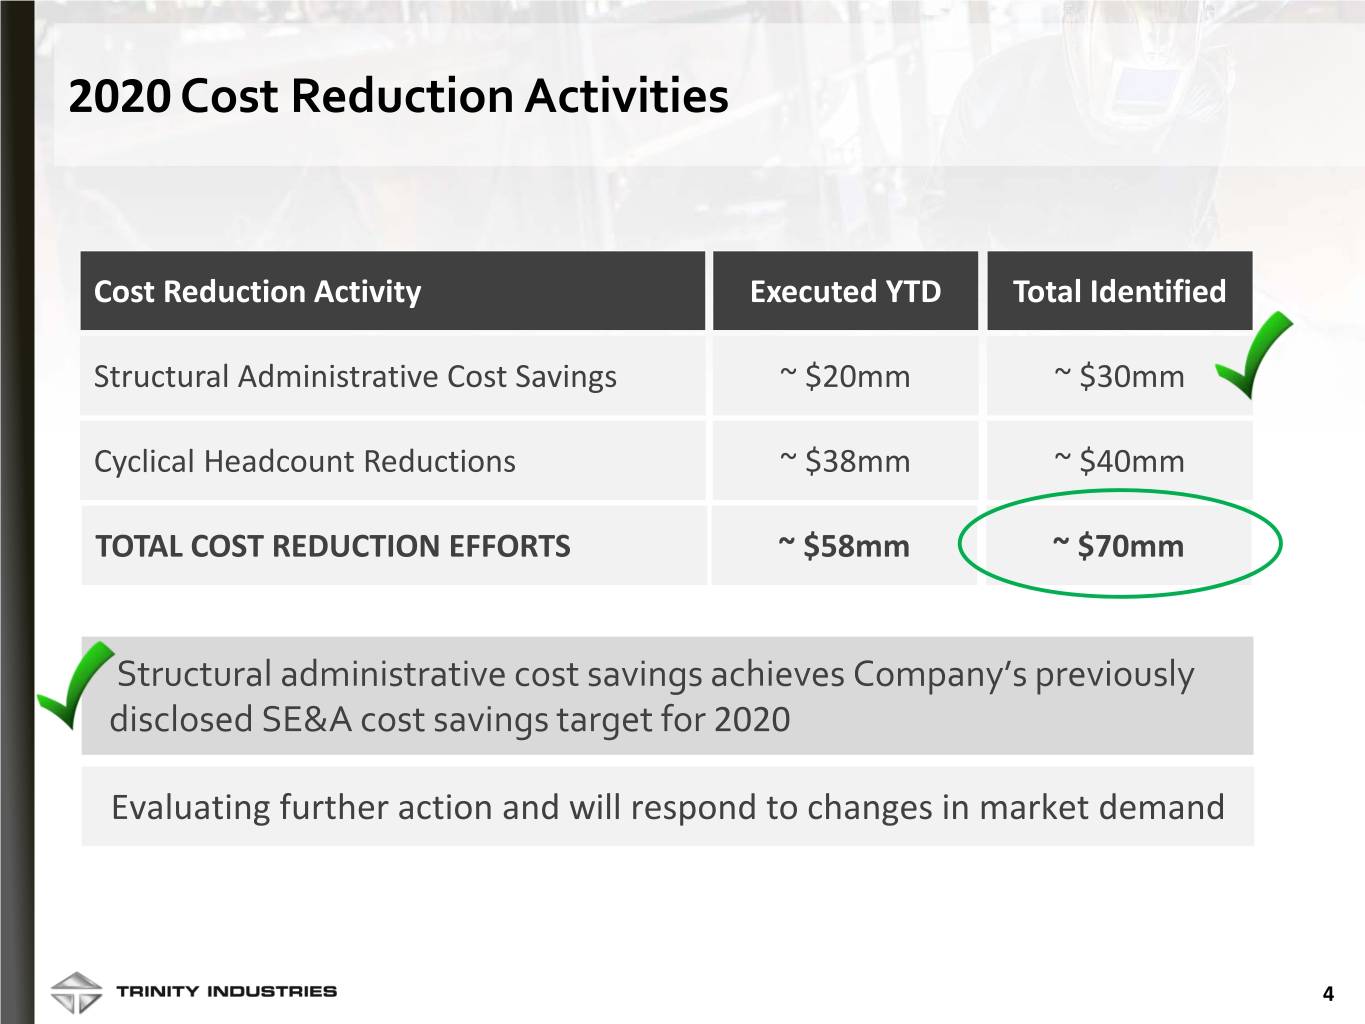
•Annualized cost savings of $70 million underway, encompassing both structural and cyclical savings
•Year-to-date returns to shareholders of $82 million through dividends and share repurchases
“During the second quarter, Trinity managed through significant headwinds related to the COVID-19 pandemic and economic fallout while executing on optimization initiatives to support the transition of our rail-focused strategy,” said Jean Savage, Trinity Industries CEO and President. “Our first priority is the safety of our employees, and we have taken actions designed to prevent community spread of the virus within our manufacturing facilities and administrative offices while ensuring business continuity. Our people have risen to the occasion with a spirit of resilience and collaboration – completing significant milestones in the streamlining of our organization structure and further positioning Trinity’s rail-platform for improved financial performance.”
“Our businesses are facing challenging market dynamics resulting from the historic decline in railcar loadings and the resulting underutilized railcars in North America. Commercially, our primary focus is to maintain the utilization of our lease fleet, then to meet customer demand for newly manufactured railcars as appropriate. Our lease fleet utilization is holding around 95%, albeit with pricing pressure on lease rates, and our production capacity for 2020 railcar deliveries is essentially sold. The timeline for a recovery in the rail sector remains unclear as increasing COVID-19 cases in the U.S. potentially threaten the recent improvement in economic and rail market activity. However, we are seeing a strong increase in railcar inquiries relative to last quarter from strategic buyers and large leasing customers, and we expect a number of these will turn to orders or lease contracts in the near term.”
“Trinity has realigned its organization from the previous holding company structure, to an operating model centrally focused on our customers’ business needs. As we work through the process flows for various production and service functions, we are establishing additional structural savings goals that will be part of our near-term focus. We are also prepared to take further actions to reduce our cost structure and manufacturing footprint in the event of a prolonged railcar down cycle.”
Ms. Savage concluded, “I am pleased Trinity’s rail platform continues to display its resiliency with strong cash flow generation stemming from the platform synergies. Leased railcar assets remain attractive to the capital markets, and we’ve had continued success in financing new railcar portfolios and selling railcars to our institutional investor partners in mutually-beneficial transactions. Trinity delivered second quarter cash flow from operations of $154 million, made a net investment of $94 million in our leasing and manufacturing businesses, and returned $24 million to shareholders in the form of dividends – highlighting again that Trinity’s platform enables meaningful investment in the business for growth while returning substantial capital to shareholders. Our liquidity stayed strong at $709 million at quarter end, and has been further enhanced by the recent completion of the $225 million rail financing and amendments to our corporate revolver in the month of July. We are committed to delivering long-term shareholder value, and Trinity is taking the necessary steps to optimize our business and position the Company for an acceleration in financial performance.”
Consolidated Financial Summary
| | | | | | | | | | | | | | | | | |
| Three Months Ended
June 30, | | | | |
| 2020 | | 2019 | | Year over Year – Comparison |
| (in millions, except percentages and per share amounts) | | | | |
| Revenues | $ | 509.2 | | | $ | 736.0 | | | Lower deliveries in the Rail Products Group and fewer railcars sold from our lease fleet |
Selling, engineering, and administrative expenses | $ | 56.8 | | | $ | 69.8 | | | Lower employee-related costs resulting from cost optimization initiatives and lower litigation-related expenses |
| | | | | |
| Operating profit (loss) | $ | (307.3) | | | $ | 107.0 | | | Includes $369.4 million non-cash impairment of long-lived assets charge |
Adjusted Operating profit (loss) (1) | $ | 62.4 | | | $ | 107.0 | | | Operational inefficiencies and related costs associated with lower manufacturing volumes in the Rail Products Group and lower profits associated with railcar sales in the Leasing Group |
| Interest expense | $ | 53.0 | | | $ | 57.0 | | | Reduction in the average borrowings and the variable interest rates associated with the Company's debt facilities, as well as the early redemption of a securitization in the first quarter of 2020 |
EBITDA (1) | $ | (238.9) | | | $ | 179.3 | | | Includes $369.4 million in impairment of long-lived assets |
Adjusted EBITDA (1) | $ | 130.8 | | | $ | 179.3 | | | See change in adjusted operating profit described above |
| Effective tax expense (benefit) rate | (20.0) | % | | 27.3 | % | | Primarily tax benefit due to the CARES Act, reduced by the portion of the impairment charge attributable to the noncontrolling interest, for which Trinity does not provide income taxes |
| | | | | |
| | | | | |
Diluted EPS – GAAP | $ | (1.76) | | | $ | 0.29 | | | Q2 2020 includes the impact of $1.86 in impairment of long-lived assets |
Diluted EPS – Adjusted (1) | $ | 0.02 | | | $ | 0.29 | | | |
| | | | | |
| Six Months Ended
June 30, | | | | |
| 2020 | | 2019 | | Year over Year – Comparison |
| (in millions) | | | | |
Net cash provided by operating activities – continuing operations | $ | 327.8 | | | $ | 4.0 | | | Cash impacts include cyclical shifts and working capital initiatives, as well as inflows from a customer's exercise of a purchase option on a sales-type lease |
Free cash flow before leasing investment (1) | $ | 372.1 | | | $ | 30.4 | | | |
| Capital expenditures – leasing, net | $ | 259.5 | | | $ | 690.9 | | | Reduced lease fleet investment in 2020 |
| Returns of capital to shareholders | $ | 81.8 | | | $ | 172.5 | | | Reduced share repurchase activity in 2020 |
(1) Non-GAAP financial measure. See the Reconciliations of Non-GAAP Measures section within this Form 8-K for a reconciliation to the most directly comparable GAAP measure and why management believes this measure is useful to management and investors.
Business Group Summary
| | | | | | | | | | | | | | | | | |
| Three Months Ended
June 30, | | | | |
| 2020 | | 2019 | | Year over Year – Comparison |
| (in millions, except percentages and number of units) | | | | |
Leasing and Management Services Group | | | | | |
Leasing and management revenues | $ | 182.7 | | | $ | 189.4 | | | Lower fleet utilization, partially offset by growth in the lease fleet and higher lease rates associated with new railcar additions |
Leasing and management operating profit | $ | 78.5 | | | $ | 77.7 | | | Growth in the lease fleet |
Operating profit on sales of leased railcars | $ | 4.4 | | | $ | 27.1 | | | Lower volume and associated margin of railcars sold from the lease fleet |
| Fleet utilization | 94.7 | % | | 97.8 | % | | Primarily driven by decrease in energy-related markets |
Owned lease fleet (in units) (1) | 104,085 | | | 102,140 | | | |
| Managed lease fleet (in units) | 26,710 | | | 22,510 | | | Increased sales of leased railcars to RIV partners managed by the Company |
| | | | | |
| Rail Products Group | | | | | |
| Revenues | $ | 405.6 | | | $ | 723.2 | | | Lower deliveries |
| Operating profit margin | 1.9 | % | | 9.2 | % | | Operational inefficiencies and related costs associated with lower manufacturing volumes |
| Deliveries (in units) | 2,985 | | | 5,255 | | | |
| Orders (in units) | 840 | | | 2,105 | | | |
| Order value | $ | 105.9 | | | $ | 213.9 | | | |
| Backlog value | $ | 1,337.3 | | | $ | 2,865.5 | | | |
| | | | | |
| All Other Group | | | | | |
| Revenues | $ | 69.3 | | | $ | 67.9 | | | Increased demand in highway products business |
| Operating profit | $ | 7.3 | | | $ | 7.9 | | | Insurance recoveries recognized in the prior year period |
| | | | | |
| June 30, 2020 | | December 31, 2019 | | |
| Loan-to-value ratio: | | | | | |
Wholly-owned subsidiaries, including corporate revolving credit facility | 57.1 | % | | 55.1 | % | | |
(1) Includes wholly-owned and partially-owned railcars and railcars under sale-leaseback arrangements.
Additional Business Items
Income Tax Adjustments
•As a result of the reinstatement of the tax-loss carryback provisions under the CARES Act, the Company recognized an additional tax benefit in the second quarter of $11.3 million, or $0.10 per common diluted share. The CARES Act includes loss carryback provisions that will allow the Company to utilize tax losses generated in recent years and our expectations for the current year to recover taxes paid for the 2013-2015 tax years, which were years of elevated Company performance. The associated income tax losses were primarily due to accelerated tax depreciation associated with our investment in the lease fleet.
•The Company’s tax rate was a benefit of 20.0% for the quarter and a benefit of 63.6% for the year. These rates differed from the U.S. statutory rate primarily as a result of the CARES Act, offset by the portion of the non-cash impairment charge that is not tax-effected because it is related to the noncontrolling interest.
•The $73.9 million net increase in our income tax receivable during the quarter primarily reflects additional 2020 tax losses accrued through June 30, 2020 that will be utilized to recover taxes paid in 2015, after the Company files its 2020 tax return in the fall of 2021.
Non-Cash Impairment of Small Cube Covered Hopper Railcars
•During the second quarter, the oil and gas proppants (or “frac sand”) industry continued to experience economic pressure created by low oil prices, reduced fracking activity, and the ongoing economic impact of COVID-19. The recent significant price declines in the crude oil market, as well as lower demand for certain commodities, have resulted in a decline in customer demand for certain types of railcars. Given these factors and the pressure on the oil and gas industry to maintain a low cost structure, fracking operations, particularly those located in the Permian Basin, have increasingly shifted away from the use of Northern White sand and towards the use of in-basin sand. Consequently, the cash flows and profitability of the frac sand industry continued to decline during the second quarter. As a result, certain of the Leasing Group's small cube covered hopper customers requested rent relief and, in a number of cases, filed for bankruptcy in the second quarter. These events led us to evaluate our small cube covered hopper railcars for potential impairment. As a result of our analysis, we recorded a pre-tax non-cash impairment charge of $369.4 million, or approximately $1.86 per adjusted diluted share, during the second quarter ended June 30, 2020. The impairment charge reflects the Company's estimates of the fair value of the assets based upon anticipated future net cash flows, which considered the depressed long-term market outlook for small cube covered hoppers, continued pressure on lease rates and utilization, and the salvage value of the assets. This impairment charge does not affect Trinity's compliance with any existing debt covenants.
Liquidity and Capital Source Updates
•In July 2020, Trinity Rail Leasing 2017 LLC, a wholly-owned subsidiary of the Company, issued $225.0 million of additional promissory notes through its existing loan agreement. The additional promissory notes increased the aggregate amount of such promissory notes outstanding as of July 17, 2020 to $831.8 million. The promissory notes bear interest at LIBOR plus 1.50%. Net proceeds received from the transaction will be used to repay borrowings under TILC's secured warehouse credit facility and under the Company’s revolving credit facility, and for general corporate purposes.
•In July 2020, we amended our revolving credit facility to increase the maximum leverage ratio through December 31, 2021 to provide near-term covenant flexibility.
•In addition to the $303 million of anticipated income tax refunds related to the 2018 and 2019 expected carryback claims, the Company also expects to receive anticipated income tax refunds of approximately $150 million in 2021 as a result of the expected tax losses in 2020, subject to the Company’s actual performance in the current year. A portion of this benefit was previously accrued and recognized in the Company’s first quarter financials.
Cost Optimization
•Trinity currently anticipates that the structural and cyclical administrative cost reductions completed and identified as of the date of this release will generate approximately $70 million in future annualized cost savings.
◦These activities achieve and exceed the previously provided SE&A and other administrative cost reductions goal of $25 million to $30 million for 2020.
•In the first and second quarter, in connection with the Company's continued assessment of future needs to support our rail-focused strategy and to optimize the performance of the business, the Company recognized pre-tax restructuring charges of $5.8 million, primarily from the write-down of our corporate headquarters campus and employee transition costs, partially offset by a net gain on the disposition of a non-operating facility and certain related assets.
•As the Company continues to reposition the organization to better support Trinity's rail-focused strategy and drive innovation and platform efficiency, we anticipate identifying further cost savings opportunities, which could lead to additional restructuring charges.
•In connection with the Company's previously communicated pension termination plan, the plan is now expected to be fully settled by the end of 2020. The Company expects to recognize a pre-tax pension settlement charge in the fourth quarter of 2020 totaling between $155 million to $185 million, which includes the non-cash charge for the recognition of all pre-tax actuarial losses accumulated in Accumulated Other Comprehensive Loss, and a potential additional cash contribution that is not expected to exceed $15 million to settle all of the Pension Plan's obligations.
Conference Call
Trinity will hold a conference call at 11:00 a.m. Eastern on July 23, 2020 to discuss its second quarter results. To listen to the call, please visit the Investor Relations section of the Company's website at www.trin.net and access the Events & Presentations webpage, or the live call can be accessed at 203-518-9544 with the conference ID "Trinity". Please call at least 10 minutes in advance to ensure proper connection. An audio replay may be accessed through the Company’s website or by dialing (402) 220-6088 until 11:59 p.m. Eastern on July 30, 2020.
Additionally, the Company will provide Supplemental Materials to accompany the earnings conference call. The materials will be accessible on Trinity's Investor Relations website under the Events and Presentations portion of the site along with the Second Quarter Earnings Call event weblink.
Non-GAAP Financial Measures
We have included financial measures compiled in accordance with generally accepted accounting principles ("GAAP") and certain non-GAAP measures in this earnings press release to provide management and investors with additional information regarding our financial results. Non-GAAP measures should not be considered in isolation or as a substitute for our reporting results prepared in accordance with GAAP and, as calculated, may not be comparable to other similarly titled measures for other companies. For each non-GAAP financial measure, a reconciliation to the most comparable GAAP measure has been included in the accompanying tables. When forward-looking non-GAAP measures are provided, quantitative reconciliations to the most directly comparable GAAP measures are not provided because management cannot, without unreasonable effort, predict the timing and amounts of certain items included in the computations of each of these measures. These factors include, but are not limited to: the product mix of expected railcar deliveries; the timing and amount of significant transactions and investments, such as railcar sales from the lease fleet, capital expenditures, and returns of capital to shareholders; and the amount and timing of certain other items outside the normal course of our core business operations, such as restructuring activities and pension plan termination charges.
About Trinity Industries
Trinity Industries, Inc., headquartered in Dallas, Texas, owns businesses that are leading providers of rail transportation products and services in North America. Our rail-related businesses market their railcar products and services under the trade name TrinityRail®. The TrinityRail platform provides railcar leasing and management services, as well as railcar manufacturing, maintenance and modifications. Trinity also owns businesses engaged in the manufacture of products used on the nation’s roadways and in traffic control. Trinity reports its financial results in three principal business segments: the Railcar Leasing and Management Services Group, the Rail Products Group, and the All Other Group. For more information, visit: www.trin.net.
Some statements in this release, which are not historical facts, are “forward-looking statements” as defined by the Private Securities Litigation Reform Act of 1995. Forward-looking statements include statements about Trinity's estimates, expectations, beliefs, intentions or strategies for the future, and the assumptions underlying these forward-looking statements, including, but not limited to, future financial and operating performance, future opportunities and any other statements regarding events or developments that Trinity believes or anticipates will or may occur in the future, including the potential financial and operational impacts of the COVID-19 pandemic. Trinity uses the words “anticipates,” “assumes,” “believes,” “estimates,” “expects,” “intends,” “forecasts,” “may,” “will,” “should,” “guidance,” “projected,” “outlook,” and similar expressions to identify these forward-looking statements. Forward-looking statements speak only as of the date of this release, and Trinity expressly disclaims any obligation or undertaking to disseminate any updates or revisions to any forward-looking statement contained herein to reflect any change in Trinity’s expectations with regard thereto or any change in events, conditions or circumstances on which any such statement is based, except as required by federal securities laws. Forward-looking statements involve risks and uncertainties that could cause actual results to differ materially from historical experience or our present expectations, including but not limited to risks and uncertainties regarding economic, competitive, governmental, and technological factors affecting Trinity’s operations, markets, products, services and prices, and such forward-looking statements are not guarantees of future performance. For a discussion of such risks and uncertainties, which could cause actual results to differ from those contained in the forward-looking statements, see “Risk Factors” and “Forward-Looking Statements” in Trinity’s Annual Report on Form 10-K for the most recent fiscal year, as may be revised and updated by Trinity’s Quarterly Reports on Form 10-Q, and Trinity’s Current Reports on Form 8-K.
| | |
| Investor & Media Contact: |
| Jessica Greiner |
| Vice President, Investor Relations and Communications |
| Trinity Industries, Inc. |
|
| (Investors) 214/631-4420 |
| (Media Line) 214/589-8909 |
- TABLES TO FOLLOW -
Trinity Industries, Inc.
Condensed Consolidated Statements of Operations
(in millions, except per share amounts)
(unaudited)
| | | | | | | | | | | | | | | | | | | | | | | |
| Three Months Ended
June 30, | | | | Six Months Ended
June 30, | | |
| 2020 | | 2019 | | 2020 | | 2019 |
| Revenues | $ | 509.2 | | | $ | 736.0 | | | $ | 1,124.4 | | | $ | 1,340.8 | |
| Operating costs: | | | | | | | |
| Cost of revenues | 396.6 | | | 578.5 | | | 878.6 | | | 1,041.9 | |
| Selling, engineering, and administrative expenses | 56.8 | | | 69.8 | | | 121.1 | | | 129.4 | |
| Gains on dispositions of property: | | | | | | | |
Net gains on railcar lease fleet sales owned more than one year at the time of sale | 5.7 | | | 18.7 | | | 14.4 | | | 26.6 | |
| Other | 0.9 | | | 0.6 | | | 1.8 | | | 2.7 | |
| Impairment of long-lived assets | 369.4 | | | — | | | 369.4 | | | — | |
| Restructuring activities, net | 0.3 | | | — | | | 5.8 | | | — | |
| 816.5 | | | 629.0 | | | 1,358.7 | | | 1,142.0 | |
| Operating profit (loss) | (307.3) | | | 107.0 | | | (234.3) | | | 198.8 | |
| Interest expense, net | 53.0 | | | 55.4 | | | 111.9 | | | 106.8 | |
| Other, net | (0.7) | | | (0.1) | | | (1.5) | | | 0.2 | |
| Income (loss) from continuing operations before income taxes | (359.6) | | | 51.7 | | | (344.7) | | | 91.8 | |
| Provision (benefit) for income taxes: | | | | | | | |
| Current | (79.7) | | | 1.0 | | | (452.5) | | | 0.2 | |
| Deferred | 7.9 | | | 13.1 | | | 233.1 | | | 22.8 | |
| (71.8) | | | 14.1 | | | (219.4) | | | 23.0 | |
| Income (loss) from continuing operations | (287.8) | | | 37.6 | | | (125.3) | | | 68.8 | |
Loss from discontinued operations, net of income taxes | — | | | (0.8) | | | (0.2) | | | (1.9) | |
Net income (loss) | (287.8) | | | 36.8 | | | (125.5) | | | 66.9 | |
Net income (loss) attributable to noncontrolling interest | (80.9) | | | 0.4 | | | (80.3) | | | (0.1) | |
| Net income (loss) attributable to Trinity Industries, Inc. | $ | (206.9) | | | $ | 36.4 | | | $ | (45.2) | | | $ | 67.0 | |
| | | | | | | |
| Basic earnings per common share: | | | | | | | |
| Income (loss) from continuing operations | $ | (1.76) | | | $ | 0.29 | | | $ | (0.38) | | | $ | 0.53 | |
| Income (loss) from discontinued operations | — | | | (0.01) | | | — | | | (0.02) | |
| Basic net income (loss) attributable to Trinity Industries, Inc. | $ | (1.76) | | | $ | 0.28 | | | $ | (0.38) | | | $ | 0.51 | |
| Diluted earnings per common share: | | | | | | | |
| Income (loss) from continuing operations | $ | (1.76) | | | $ | 0.29 | | | $ | (0.38) | | | $ | 0.52 | |
| Income (loss) from discontinued operations | — | | | (0.01) | | | — | | | (0.01) | |
| Diluted net income (loss) attributable to Trinity Industries, Inc. | $ | (1.76) | | | $ | 0.28 | | | $ | (0.38) | | | $ | 0.51 | |
| Weighted average number of shares outstanding: | | | | | | | |
| Basic | 117.3 | | | 127.6 | | | 117.6 | | | 129.0 | |
| Diluted | 117.3 | | | 129.2 | | | 117.6 | | | 130.7 | |
Trinity is required to utilize the two-class method of calculating earnings per share ("EPS") as a result of unvested restricted shares that have non-forfeitable rights to dividends and are, therefore, considered to be participating securities. The calculation of EPS using the two-class method excludes income attributable to these participating securities from the numerator and excludes the dilutive impact of those shares from the denominator; therefore, the two-class method may result in a lower EPS than is calculated from the face of the income statement. There were no restricted shares and stock options included in the computation of diluted EPS for the three and six months ended June 30, 2020 as we incurred a loss for these periods, and any effect on loss per common share would have been antidilutive.
Trinity Industries, Inc.
Condensed Segment Data
(in millions)
(unaudited)
| | | | | | | | | | | | | | | | | | | | | | | |
| Three Months Ended
June 30, | | | | Six Months Ended
June 30, | | |
| Revenues: | 2020 | | 2019 | | 2020 | | 2019 |
| Railcar Leasing and Management Services Group | $ | 192.8 | | | $ | 277.1 | | | $ | 429.1 | | | $ | 477.5 | |
| Rail Products Group | 405.6 | | | 723.2 | | | 915.0 | | | 1,340.7 | |
| All Other | 69.3 | | | 67.9 | | | 132.7 | | | 130.0 | |
| Segment Totals before Eliminations | 667.7 | | | 1,068.2 | | | 1,476.8 | | | 1,948.2 | |
| Eliminations – Lease Subsidiary | (156.0) | | | (328.9) | | | (346.4) | | | (599.0) | |
| Eliminations – Other | (2.5) | | | (3.3) | | | (6.0) | | | (8.4) | |
| Consolidated Total | $ | 509.2 | | | $ | 736.0 | | | $ | 1,124.4 | | | $ | 1,340.8 | |
| | | | | | | |
| Three Months Ended
June 30, | | | | Six Months Ended
June 30, | | |
| Operating profit (loss): | 2020 | | 2019 | | 2020 | | 2019 |
| Railcar Leasing and Management Services Group | $ | 82.9 | | | $ | 104.8 | | | $ | 175.8 | | | $ | 190.6 | |
| Rail Products Group | 7.9 | | | 66.3 | | | 33.0 | | | 115.4 | |
| All Other | 7.3 | | | 7.9 | | | 16.6 | | | 16.0 | |
Segment Totals before Eliminations, Corporate Expenses, Impairment of long-lived assets, and Restructuring activities | 98.1 | | | 179.0 | | | 225.4 | | | 322.0 | |
| Corporate | (24.2) | | | (30.6) | | | (52.3) | | | (54.2) | |
| Impairment of long-lived assets | (369.4) | | | — | | | (369.4) | | | — | |
| Restructuring activities, net | (0.3) | | | — | | | (5.8) | | | — | |
| Eliminations – Lease Subsidiary | (11.0) | | | (41.6) | | | (30.9) | | | (68.8) | |
| Eliminations – Other | (0.5) | | | 0.2 | | | (1.3) | | | (0.2) | |
| Consolidated Total | $ | (307.3) | | | $ | 107.0 | | | $ | (234.3) | | | $ | 198.8 | |
Trinity Industries, Inc.
Selected Financial Information – Leasing Group
($ in millions)
(unaudited)
| | | | | | | | | | | | | | | | | | | | | | | |
| Three Months Ended
June 30, | | | | Six Months Ended
June 30, | | |
| | 2020 | | 2019 | | 2020 | | 2019 |
| Revenues: | | | | | | | |
| Leasing and management | $ | 182.7 | | | $ | 189.4 | | | $ | 374.7 | | | $ | 376.5 | |
Sales of railcars owned one year or less at the time of sale (1)(2) | 10.1 | | | 87.7 | | | 54.4 | | | 101.0 | |
| Total revenues | $ | 192.8 | | | $ | 277.1 | | | $ | 429.1 | | | $ | 477.5 | |
Operating profit (loss)(3): | | | | | | | |
| Leasing and management | $ | 78.5 | | | $ | 77.7 | | | $ | 161.0 | | | $ | 154.8 | |
Railcar sales(1): | | | | | | | |
Railcars owned one year or less at the time of sale | (1.3) | | | 8.4 | | | 0.4 | | | 9.2 | |
Railcars owned more than one year at the time of sale | 5.7 | | | 18.7 | | | 14.4 | | | 26.6 | |
| | | | | | | |
| Total operating profit | $ | 82.9 | | | $ | 104.8 | | | $ | 175.8 | | | $ | 190.6 | |
| Total operating profit margin | 43.0 | % | | 37.8 | % | | 41.0 | % | | 39.9 | % |
| | | | | | | |
| Leasing and management operating profit margin | 43.0 | % | | 41.0 | % | | 43.0 | % | | 41.1 | % |
| | | | | | | |
| Selected expense information: | | | | | | | |
Depreciation (4)(5) | $ | 54.0 | | | $ | 57.8 | | | $ | 107.6 | | | $ | 112.2 | |
| Maintenance and compliance | $ | 23.0 | | | $ | 26.5 | | | $ | 48.9 | | | $ | 54.3 | |
| Rent | $ | 3.0 | | | $ | 4.3 | | | $ | 6.0 | | | $ | 9.8 | |
| Selling, engineering, and administrative expenses | $ | 13.0 | | | $ | 12.7 | | | $ | 27.3 | | | $ | 25.5 | |
| Interest | $ | 47.1 | | | $ | 50.4 | | | $ | 102.2 | | | $ | 96.4 | |
| | | | | | | | | | | | | | | | | | | | | | | |
| Three Months Ended
June 30, | | | | Six Months Ended
June 30, | | |
| 2020 | | 2019 | | 2020 | | 2019 |
| Sales of leased railcars: | | | | | | | |
Railcars owned one year or less at the time of sale (2) | $ | 10.1 | | | $ | 87.7 | | | $ | 54.4 | | | $ | 101.0 | |
Railcars owned more than one year at the time of sale | 63.7 | | | 70.5 | | | 132.2 | | | 99.9 | |
| $ | 73.8 | | | $ | 158.2 | | | $ | 186.6 | | | $ | 200.9 | |
| | | | | | | |
| Operating profit (loss) on sales of leased railcars: | | | | | | | |
| Railcars owned one year or less at the time of sale | $ | (1.3) | | | $ | 8.4 | | | $ | 0.4 | | | $ | 9.2 | |
| Railcars owned more than one year at the time of sale | 5.7 | | | 18.7 | | | 14.4 | | | 26.6 | |
| $ | 4.4 | | | $ | 27.1 | | | $ | 14.8 | | | $ | 35.8 | |
| | | | | | | |
| Operating profit (loss) margin on sales of leased railcars: | | | | | | | |
| Railcars owned one year or less at the time of sale | (12.9) | % | | 9.6 | % | | 0.7 | % | | 9.1 | % |
| Railcars owned more than one year at the time of sale | 8.9 | % | | 26.5 | % | | 10.9 | % | | 26.6 | % |
Weighted average operating profit margin on sales of leased railcars | 6.0 | % | | 17.1 | % | | 7.9 | % | | 17.8 | % |
(1) The Company recognizes sales of railcars from the lease fleet which have been owned by the lease fleet for one year or less as revenue. Sales of railcars from the lease fleet which have been owned by the lease fleet for more than one year are recognized as a net gain or loss from the disposal of a long-term asset.
(2) Includes revenues associated with sales-type leases of $32.3 million and $34.2 million for the three and six months ended June 30, 2019, respectively.
(3) Operating profit includes: depreciation; maintenance and compliance; rent; and selling, engineering, and administrative expenses. Amortization of deferred profit on railcars sold from the Rail Products Group to the Leasing Group is included in the operating profit of the Leasing Group, resulting in the recognition of depreciation expense based on the Company's original manufacturing cost of the railcars. Interest expense is not a component of operating profit and includes the effect of hedges.
(4) Effective January 1, 2020, we revised the estimated useful lives and salvage values of certain railcar types in our lease fleet. This change in estimate resulted in a decrease in depreciation expense in the three and six months ended June 30, 2020 of approximately $7.7 million and $15.4 million, respectively. This decrease was partially offset by higher depreciation associated with growth in the lease fleet.
(5) As a result of the impairment of long-lived assets related to our small cube covered hopper railcars recorded in the second quarter of 2020, our future quarterly depreciation expense will decrease approximately $3.5 million.
Trinity Industries, Inc.
Condensed Consolidated Balance Sheets
(in millions)
(unaudited)
| | | | | | | | | | | |
| June 30, 2020 | | December 31, 2019 |
| ASSETS | | | |
| Cash and cash equivalents | $ | 157.0 | | | $ | 166.2 | |
| | | |
| Receivables, net of allowance | 226.9 | | | 260.1 | |
| Income tax receivable | 463.0 | | | 14.7 | |
| Inventories | 421.5 | | | 433.4 | |
| Restricted cash | 136.9 | | | 111.4 | |
| Property, plant, and equipment, net | 6,784.4 | | | 7,110.6 | |
| Goodwill | 208.8 | | | 208.8 | |
| | | |
| Other assets | 266.9 | | | 396.2 | |
| Total assets | $ | 8,665.4 | | | $ | 8,701.4 | |
| | | |
| LIABILITIES AND STOCKHOLDERS' EQUITY | | | |
| Accounts payable | $ | 188.2 | | | $ | 203.9 | |
| Accrued liabilities | 325.6 | | | 342.1 | |
| Debt | 4,825.4 | | | 4,881.9 | |
| | | |
| Deferred income taxes | 1,026.4 | | | 798.3 | |
| | | |
| Other liabilities | 139.4 | | | 96.3 | |
| Stockholders' equity: | | | |
| Trinity Industries, Inc. | 1,891.3 | | | 2,030.1 | |
| Noncontrolling interest | 269.1 | | | 348.8 | |
| 2,160.4 | | | 2,378.9 | |
| Total liabilities and stockholders' equity | $ | 8,665.4 | | | $ | 8,701.4 | |
Trinity Industries, Inc.
Additional Balance Sheet Information
(in millions)
(unaudited)
| | | | | | | | | | | |
| June 30, 2020 | | December 31, 2019 |
| Property, Plant, and Equipment | | | |
| Manufacturing/Corporate: | | | |
| Property, plant, and equipment | $ | 1,056.1 | | | $ | 1,040.4 | |
| Accumulated depreciation | (644.4) | | | (631.6) | |
| 411.7 | | | 408.8 | |
| Leasing: | | | |
| Wholly-owned subsidiaries: | | | |
| Machinery and other | 13.9 | | | 13.7 | |
| Equipment on lease | 6,692.2 | | | 6,944.2 | |
| Accumulated depreciation | (1,149.0) | | | (1,139.0) | |
| 5,557.1 | | | 5,818.9 | |
| Partially-owned subsidiaries: | | | |
| Equipment on lease | 2,239.7 | | | 2,410.0 | |
| Accumulated depreciation | (591.5) | | | (623.3) | |
| 1,648.2 | | | 1,786.7 | |
| | | |
| Deferred profit on railcars sold to the Leasing Group | (1,062.4) | | | (1,135.8) | |
| Accumulated amortization | 229.8 | | | 232.0 | |
| (832.6) | | | (903.8) | |
| $ | 6,784.4 | | | $ | 7,110.6 | |
| | | | | | | | | | | |
| June 30, 2020 | | December 31, 2019 |
| Debt | | | |
| Corporate – Recourse: | | | |
| Revolving credit facility | $ | 130.0 | | | $ | 125.0 | |
Senior notes, net of unamortized discount of $0.2 and $0.2 | 399.8 | | | 399.8 | |
| | | |
| 529.8 | | | 524.8 | |
| Less: unamortized debt issuance costs | (1.8) | | | (2.0) | |
| 528.0 | | | 522.8 | |
| Leasing – Non-recourse: | | | |
| Wholly-owned subsidiaries: | | | |
Secured railcar equipment notes, net of unamortized discount of $1.4 and $2.0 | 1,974.5 | | | 2,124.1 | |
| TILC warehouse facility | 482.5 | | | 353.4 | |
| Promissory notes | 609.6 | | | 627.1 | |
| 3,066.6 | | | 3,104.6 | |
| Less: unamortized debt issuance costs | (20.9) | | | (23.9) | |
| 3,045.7 | | | 3,080.7 | |
| Partially-owned subsidiaries: | | | |
| Secured railcar equipment notes | 1,261.7 | | | 1,289.3 | |
| Less: unamortized debt issuance costs | (10.0) | | | (10.9) | |
| 1,251.7 | | | 1,278.4 | |
| Total debt | $ | 4,825.4 | | | $ | 4,881.9 | |
Trinity Industries, Inc.
Condensed Consolidated Statements of Cash Flows
(in millions)
(unaudited)
| | | | | | | | | | | |
| Six Months Ended
June 30, | | |
| 2020 | | 2019 |
| Operating activities: | | | |
| Net income (loss) | $ | (125.5) | | | $ | 66.9 | |
| Loss from discontinued operations, net of income taxes | 0.2 | | | 1.9 | |
Adjustments to reconcile net income (loss) to net cash provided by operating activities: | | | |
| Depreciation and amortization | 134.6 | | | 138.1 | |
| Provision for deferred income taxes | 233.1 | | | 22.8 | |
Net gains on railcar lease fleet sales owned more than one year at the time of sale | (14.4) | | | (26.6) | |
| | | |
| Impairment of long-lived assets | 369.4 | | | — | |
| Restructuring activities | 5.2 | | | — | |
| Other | 13.7 | | | 16.7 | |
| Changes in operating assets and liabilities: | | | |
| (Increase) decrease in receivables, inventories, and other assets | 214.7 | | | (183.9) | |
| (Increase) decrease in income tax receivable | (448.3) | | | 19.4 | |
| Increase (decrease) in accounts payable, accrued liabilities, and other liabilities | (54.9) | | | (51.3) | |
| Net cash provided by operating activities – continuing operations | 327.8 | | | 4.0 | |
| Net cash used in operating activities – discontinued operations | (0.2) | | | (1.1) | |
| Net cash provided by operating activities | 327.6 | | | 2.9 | |
| Investing activities: | | | |
Proceeds from railcar lease fleet sales owned more than one year at the time of sale | 132.2 | | | 99.9 | |
| Proceeds from disposition of property and other assets | 14.2 | | | 14.3 | |
Capital expenditures – leasing, net of sold lease fleet railcars owned one year or less with a net cost of $54.0 and $91.8 | (259.5) | | | (690.9) | |
Capital expenditures – manufacturing and other | (41.5) | | | (34.0) | |
| | | |
Other | — | | | (1.2) | |
| | | |
| | | |
| Net cash used in investing activities | (154.6) | | | (611.9) | |
| Financing activities: | | | |
| Net (repayments of) proceeds from debt | (65.9) | | | 582.0 | |
| Shares repurchased | (35.4) | | | (59.0) | |
| Dividends paid to common shareholders | (46.4) | | | (39.5) | |
| Other | (9.0) | | | (8.8) | |
| | | |
| | | |
| Net cash provided by (used in) financing activities | (156.7) | | | 474.7 | |
| Net increase (decrease) in cash, cash equivalents, and restricted cash | 16.3 | | | (134.3) | |
| Cash, cash equivalents, and restricted cash at beginning of period | 277.6 | | | 350.8 | |
| Cash, cash equivalents, and restricted cash at end of period | $ | 293.9 | | | $ | 216.5 | |
Trinity Industries, Inc.
Reconciliations of Non-GAAP Measures
(unaudited)
Adjusted Operating Results
We have supplemented the presentation of our reported GAAP operating profit (loss), interest expense, net, provision (benefit) for income taxes, income (loss) from continuing operations, net income (loss) attributable to Trinity Industries, Inc., diluted weighted average shares outstanding and diluted income (loss) from continuing operations per common share attributable to Trinity Industries, Inc. with non-GAAP measures that adjust the GAAP measures to exclude the impact of restructuring activities, impairment of long-lived assets, early redemption of debt, the income tax effects of the CARES Act and certain other non-recurring transactions or events (as applicable).These non-GAAP measures are derived from amounts included in our GAAP financial statements and are reconciled to the most directly comparable GAAP financial measures in the tables below. Management believes that these measures are useful to both management and investors for analyzing the performance of our business without the impact of certain non-recurring items. Non-GAAP measures should not be considered in isolation or as a substitute for our reporting results prepared in accordance with GAAP and, as calculated, may not be comparable to other similarly titled measures for other companies.
| | | | | | | | | | | | | | | | | | | | | | | | | | | | | | | | | | | |
| Three Months Ended June 30, 2020 | | | | | | | | | | |
| GAAP | | Impairment of long-lived assets – Controlling Interest (1)(2) | | Impairment of long-lived assets – Noncontrolling Interest (3) | | Restructuring activities (2) | | Income tax effect of CARES Act | | Adjusted |
| (in millions, except per share amounts) | | | | | | | | | | |
| Operating profit (loss) | $ | (307.3) | | | $ | 288.1 | | | $ | 81.3 | | | $ | 0.3 | | | $ | — | | | $ | 62.4 | |
| | | | | | | | | | | |
| | | | | | | | | | | |
| | | | | | | | | | | |
| Provision (benefit) for income taxes | $ | (71.8) | | | $ | 67.4 | | | $ | — | | | $ | 0.1 | | | $ | 11.3 | | | $ | 7.0 | |
| | | | | | | | | | | |
Income (loss) from continuing operations | $ | (287.8) | | | $ | 220.7 | | | $ | 81.3 | | | $ | 0.2 | | | $ | (11.3) | | | $ | 3.1 | |
| | | | | | | | | | | |
Net income (loss) attributable to Trinity Industries, Inc. | $ | (206.9) | | | $ | 220.7 | | | $ | — | | | $ | 0.2 | | | $ | (11.3) | | | $ | 2.7 | |
| | | | | | | | | | | |
Diluted weighted average shares outstanding (4) | 117.3 | | | | | | | | | | 118.7 |
| | | | | | | | | | | |
Diluted income (loss) from continuing operations per common share attributable to Trinity Industries, Inc. | $ | (1.76) | | | | | | | | | | | $ | 0.02 | |
| | | | | | | | | | | | | | | | | | | | | | | | | | | | | | | | | | | | | | | | | |
| Six Months Ended June 30, 2020 | | | | | | | | | | | | |
| GAAP | | Impairment of long-lived assets – Controlling Interest (1)(2) | | Impairment of long-lived assets – Noncontrolling Interest (3) | | Restructuring activities (2) | | Early redemption of debt (2) | | Income tax effect of CARES Act | | Adjusted |
| (in millions, except per share amounts) | | | | | | | | | | | | |
| Operating profit (loss) | $ | (234.3) | | | $ | 288.1 | | | $ | 81.3 | | | $ | 5.8 | | | $ | — | | | $ | — | | | $ | 140.9 | |
| | | | | | | | | | | | | |
| Interest expense, net | $ | 111.9 | | | $ | — | | | $ | — | | | $ | — | | | $ | (5.0) | | | $ | — | | | $ | 106.9 | |
| | | | | | | | | | | | | |
| Provision (benefit) for income taxes | $ | (219.4) | | | $ | 67.4 | | | $ | — | | | $ | 1.4 | | | $ | 1.2 | | | $ | 166.0 | | | $ | 16.6 | |
| | | | | | | | | | | | | |
Income (loss) from continuing operations | $ | (125.3) | | | $ | 220.7 | | | $ | 81.3 | | | $ | 4.4 | | | $ | 3.8 | | | $ | (166.0) | | | $ | 18.9 | |
| | | | | | | | | | | | | |
Net income (loss) attributable to Trinity Industries, Inc. | $ | (45.2) | | | $ | 220.7 | | | $ | — | | | $ | 4.4 | | | $ | 3.8 | | | $ | (166.0) | | | $ | 17.7 | |
| | | | | | | | | | | | | |
Diluted weighted average shares outstanding (4) | 117.6 | | | | | | | | | | | | 119.3 |
| | | | | | | | | | | | | |
Diluted income (loss) from continuing operations per common share attributable to Trinity Industries, Inc. | $ | (0.38) | | | | | | | | | | | | | $ | 0.15 | |
(1) Excludes $81.3 million of non-cash impairment of long-lived asset charges associated with the noncontrolling interest.
(2) The effective tax rate for impairment of long-lived assets, restructuring activities, and the early redemption of debt is before consideration of the CARES Act.
(3) Represents the portion of the non-cash impairment of long-lived asset charge attributable to the noncontrolling interest, for which Trinity does not provide income taxes.
(4) GAAP diluted weighted average shares outstanding excludes 1.4 million and 1.7 million shares for the three and six months ended June 30, 2020, respectively, since the Company was in a net loss position for those periods. When adjusting for the items above, these shares become dilutive.
Free Cash Flow
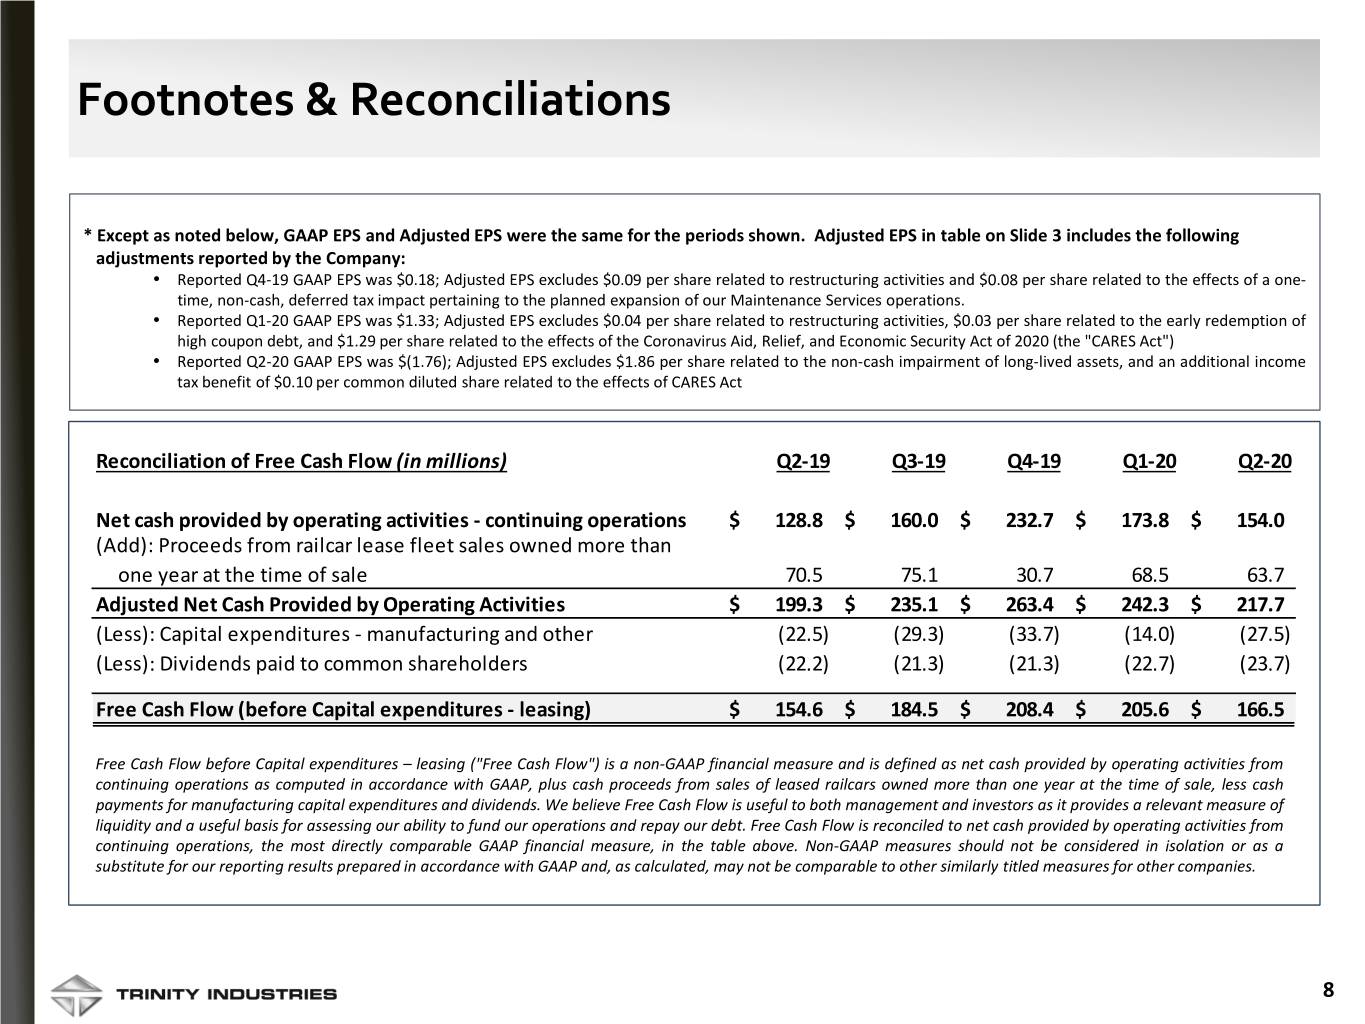
Free Cash Flow before Capital expenditures – leasing ("Free Cash Flow") is a non-GAAP financial measure and is defined as net cash provided by operating activities from continuing operations as computed in accordance with GAAP, plus cash proceeds from sales of leased railcars owned more than one year at the time of sale, less cash payments for manufacturing capital expenditures and dividends. We believe Free Cash Flow is useful to both management and investors as it provides a relevant measure of liquidity and a useful basis for assessing our ability to fund our operations and repay our debt. Free Cash Flow is reconciled to net cash provided by operating activities from continuing operations, the most directly comparable GAAP financial measure, in the following table. Non-GAAP measures should not be considered in isolation or as a substitute for our reporting results prepared in accordance with GAAP and, as calculated, may not be comparable to other similarly titled measures for other companies.
| | | | | | | | | | | |
| Six Months Ended
June 30, | | |
| 2020 | | 2019 |
| (in millions) | | |
| Net cash provided by operating activities – continuing operations | $ | 327.8 | | | $ | 4.0 | |
| Add: | | | |
Proceeds from railcar lease fleet sales owned more than one year at the time of sale | 132.2 | | | 99.9 | |
| Adjusted Net Cash Provided by Operating Activities | $ | 460.0 | | | $ | 103.9 | |
| Less: | | | |
| Capital expenditures – manufacturing and other | (41.5) | | | (34.0) | |
| Dividends paid to common shareholders | (46.4) | | | (39.5) | |
Free Cash Flow (before Capital expenditures – leasing) | $ | 372.1 | | | $ | 30.4 | |
EBITDA and Adjusted EBITDA
“EBITDA” is defined as income (loss) from continuing operations plus interest expense, income taxes, and depreciation and amortization expense. Adjusted EBITDA is defined as EBITDA plus non-cash impairment of long-lived assets and restructuring activities. EBITDA and Adjusted EBITDA are non-GAAP financial measures; however, the amounts included in these calculations are derived from amounts included in our GAAP financial statements. EBITDA and Adjusted EBITDA are reconciled to net income (loss), the most directly comparable GAAP financial measure, in the following table. This information is provided to assist management and investors in making meaningful comparisons of our operating performance between periods. We believe EBITDA is a useful measure for analyzing the performance of our business. We also believe that EBITDA is commonly reported and widely used by investors and other interested parties as a measure of a company’s operating performance and debt servicing ability because it assists in comparing performance on a consistent basis without regard to capital structure, depreciation or amortization (which can vary significantly depending on many factors). EBITDA and Adjusted EBITDA should not be considered as alternatives to net income as indicators of our operating performance, or as alternatives to operating cash flows as measures of liquidity. Non-GAAP measures should not be considered in isolation or as a substitute for our reporting results prepared in accordance with GAAP and, as calculated, may not be comparable to other similarly titled measures for other companies.
| | | | | | | | | | | | | | | | | | | | | | | |
| Three Months Ended
June 30, | | | | Six Months Ended
June 30, | | |
| 2020 | | 2019 | | 2020 | | 2019 |
| (in millions) | | | | | | |
| Net income (loss) | $ | (287.8) | | | $ | 36.8 | | | $ | (125.5) | | | $ | 66.9 | |
Less: loss from discontinued operations, net of income taxes | — | | | (0.8) | | | (0.2) | | | (1.9) | |
| Income (loss) from continuing operations | $ | (287.8) | | | $ | 37.6 | | | $ | (125.3) | | | $ | 68.8 | |
| Add: | | | | | | | |
| Interest expense | 53.0 | | | 57.0 | | | 114.3 | | | 109.7 | |
| Provision (benefit) for income taxes | (71.8) | | | 14.1 | | | (219.4) | | | 23.0 | |
| Depreciation and amortization expense | 67.7 | | | 70.6 | | | 134.6 | | | 138.1 | |
EBITDA | $ | (238.9) | | | $ | 179.3 | | | $ | (95.8) | | | $ | 339.6 | |
| Add: | | | | | | | |
| Impairment of long-lived assets | 369.4 | | | — | | | 369.4 | | | — | |
| Restructuring activities, net | 0.3 | | | — | | | 5.8 | | | — | |
| Adjusted EBITDA | $ | 130.8 | | | $ | 179.3 | | | $ | 279.4 | | | $ | 339.6 | |
Exhibit 99.2
Trinity Industries, Inc.
Earnings Release Conference Call – Q2 2020
July 23, 2020
Jessica Greiner
Vice President, Investor Relations and Communications
Thank you, Brie. Good morning everyone. I’m Jessica Greiner, Vice President of Investor Relations and Communications for Trinity. We appreciate you joining us for the Company’s second quarter 2020 financial results conference call.
Our prepared remarks will include comments from both Trinity’s Chief Executive Officer and President, Jean Savage, and Eric Marchetto, the Company’s Chief Financial Officer. We will hold a Q&A session following the prepared remarks from our leaders.
During the call today, we will refer to a few slides highlighting key points of discussion. The supplemental materials are accessible on our IR website at www.trin.net. These slides can be found under the Events and Presentations portion of the site along with the Second Quarter Earnings Call event link.
It is now my pleasure to turn the call over to Jean.
E. Jean Savage
Chief Executive Officer and President
Thank you, Jessica – and good morning everyone!
The pandemic and economic events of the second quarter created a very challenging operating environment for Trinity. Today, I’d like to share with you Trinity’s responses to these challenges and our longer-term plans to become a returns-focused company. In these difficult times, Trinity’s leadership and employees remain focused on taking the right actions now to best position the company for future success. Our first priority remains the health and safety of our people – including the protocols we implemented to help prevent the spread of COVID-19 in our production facilities and offices, in alignment with CDC and WHO guidance. I want to thank the people of Trinity for their hard work and continued focus on safety. Together we are ensuring Trinity’s high quality railcars continue to deliver essential goods across North America and the world.
We experienced weak railcar demand in the second quarter due to the economic ramifications of the pandemic and the major energy price and demand decline earlier in the year. The major decline in crude oil prices led to a number of bankruptcies for frac sand providers in the second quarter. As a result, Trinity reduced the carrying value of our small cube covered hopper fleet in
our lease portfolio. Eric will discuss more details about resulting actions we have taken in his prepared remarks.
While railcar loadings have improved somewhat in recent weeks, increasing COVID-19 cases in the U.S. potentially threaten the resurgent economic and rail market activity. We are closely monitoring our supply chains and engaging with our customers to keep our production plans and lease fleet operations aligned with the demand for railcars and related services. Industry metrics report that approximately 32% of the North American railcar fleet is underutilized. We expect the pricing environment for rail equipment, new and existing, to remain pressured as long as this number is elevated. In this type of environment, our commercial focus is to maintain the utilization of our lease fleet, and then meet demand for newly manufactured railcars as appropriate for our customers.
Recently, railcar inquiries from strategic buyers have increased relative to last quarter, and I expect a number of these opportunities will convert to orders or lease contracts soon. I am proud of recent transactions in which we leveraged the full breadth of our platform. In one case, we provided a strategic customer existing railcars within our lease portfolio, modification services, and new rail equipment in one transaction. This carefully-crafted solution created a differentiated experience that met the customer’s business needs and will create a long-term value for our shareholders. The best near-term opportunity for demand improvement for new and existing equipment, we believe, will be in the agricultural market. Not only has agriculture traffic experienced relatively fewer headwinds during the pandemic, but a significant portion of the existing covered hopper fleet for grain is reaching the end of its useful life. We also see potentially large replacement needs in the box car and aggregate open hopper and gondola fleets in the coming years.
Managing through a cyclical downturn is very challenging. Our Leasing operations delivered a solid second quarter given the environment. Declines in revenue from lease rate and utilization pressure were offset by effective cost management among other items. Our lease operations team has continued to experience high levels of customer satisfaction as we’ve invested in the state of the art tools and technology. These tools are an important element of our focus on customer experience as well as driving operating efficiencies while maintaining a safe railcar fleet. In our Products group, I also commend our plant leadership and employees for their continued focus on safely meeting production requirements. During the second quarter, Trinity delivered just under 3,000 railcars, and reported a 2% margin in the Rail Products segment. Volumes fell quicker than our ability to reduce costs as we managed the impacts of the coronavirus. The impact of having
higher risk and potentially exposed employees shelter in place did have an impact on our ability to align some of the cost to the volumes. Pricing was more aggressive also. Since the beginning of the year, we reduced our manufacturing workforce by 35% which has resulted in almost $40 million in overhead cost savings. Additional efforts are underway to align our cost structure with production levels for the rest of 2020, while we simultaneously work to move lower value-added fabrications to the supply base. This will allow us to reduce our cyclical risk by reducing the internal labor required through a cycle.
For the remainder of my remarks, I want to focus on additional actions Trinity is taking to improve the performance of our platform going forward: our focus on cash flow in the current environment; our optimization progress to accelerate the Company’s financial performance; and our longer-term strategic planning to continue creating shareholder value.
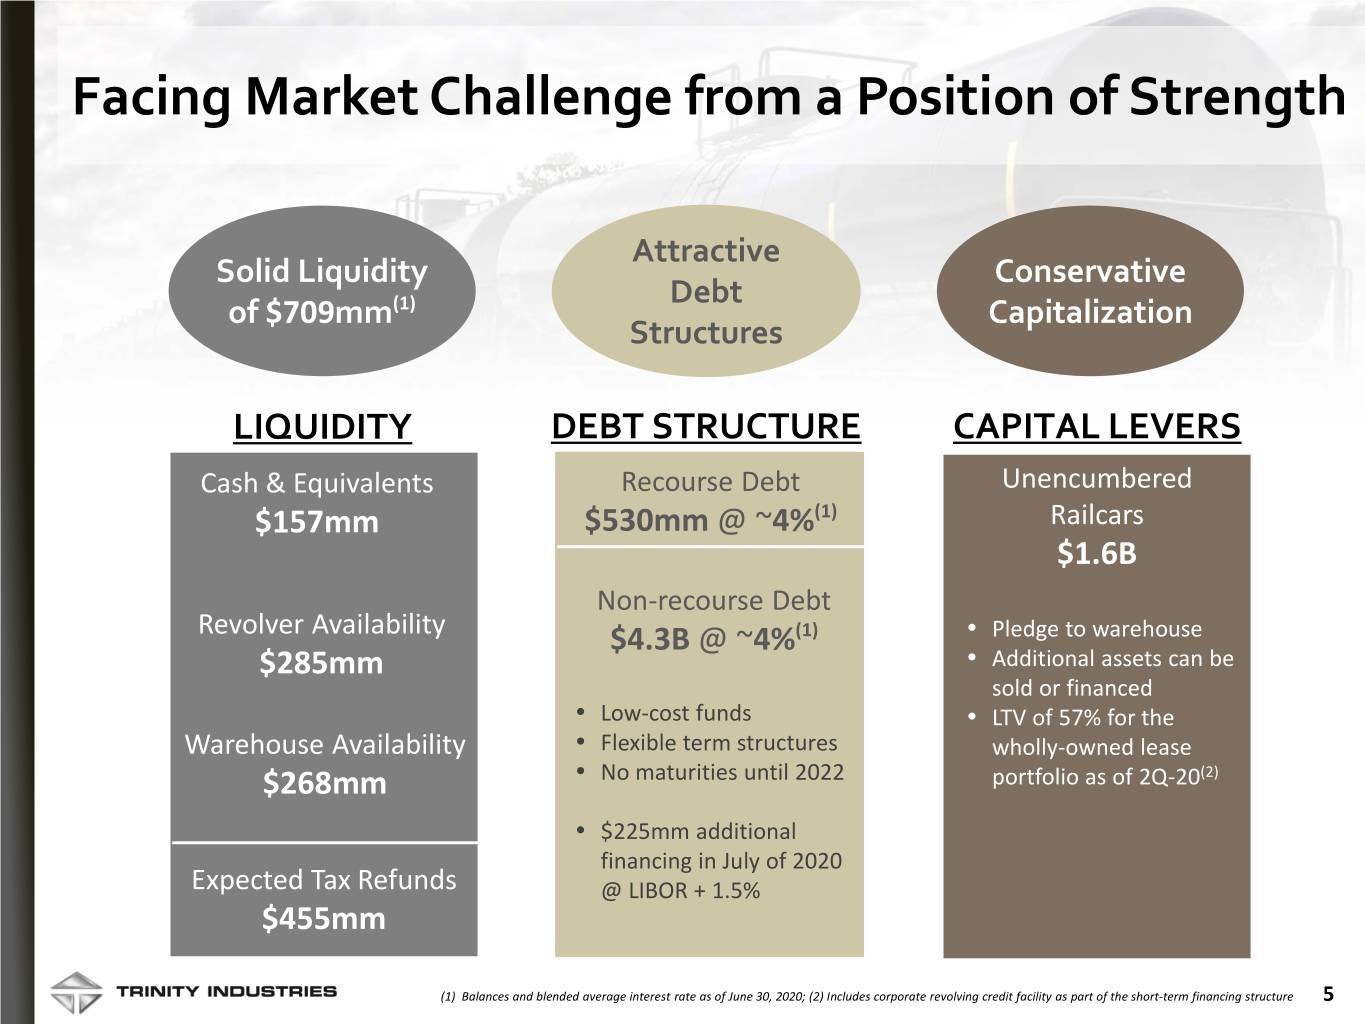
Trinity’s unique rail platform, strong balance sheet, and cash flow generation enable us to manage through the COVID-19 pandemic from a position of strength. The scale of our Leasing business and the long-term nature of the lease contracts protect the company from short-term market disruptions and are critical to the relative stability. Right now, we are highly focused on managing the effects of the coronavirus to minimize the disruption of our business and maximize our cash flow. Our financial position is sustained by committed future lease payments of $2 billion, our products backlog of $1.3 billion, our solid liquidity, and approximately $1.6 billion of unencumbered rail assets.
I’d also like to highlight our efforts to accelerate the Company’s longer-term financial performance through platform optimization, which has been a key focus for management and the Board in the last year. We are addressing optimization in all areas of our organization, including our operations and our balance sheet. Trinity’s business leaders have made difficult people-related decisions in recent months. Organizationally, we have restructured the company from Trinity’s former holding company model, to a more effective and efficient operating model aligned around our customers and markets. When combined with our actions from the first quarter, the results of these efforts will yield a total annualized cost savings of $30 million in SE&A and Cost of Sales, which achieves the $25-30 million target we set at the beginning of 2020. Slide 4 of the Supplemental Materials provides a few details of our Cost Activities.
As we work through the process flows for various production and service functions with the implementation of our new organization model, we are establishing additional structural savings goals that will be part of our near-term focus. The management teams are reviewing aspects of
our business operations, including our supply chain costs, idled facility carrying costs, and various service fees.
Looking specifically at our balance sheet optimization efforts, we delayed our plans to access the capital markets in the second quarter to allow the pandemic-related volatility around interest rate spreads to slow. Subsequent to quarter end, we were pleased to complete the upsizing of TRL 2017 with an additional $225 million of promissory notes which bear interest at LIBOR plus 1.5%. We also maintained our dividend during the second quarter, highlighting our commitment to shareholder returns as part of our capital allocation strategy and our confidence in the strong cash flow generation capability of our platform.
In addition to the shorter-term initiatives to accelerate our financial performance, we are actively engaged in our longer-term strategic planning process. We are evaluating both further platform optimization initiatives as well as growth opportunities. These efforts are aimed at improving the performance of our lease fleet, reducing the cyclicality of our platform of businesses, continuing our operational improvements, and evaluating growth into the rail transportation services space.
We believe Trinity’s position as a provider, servicer, and owner of railcar assets ideally positions us to engage with our customers on innovative products, services and solutions that increase the attractiveness of moving freight by rail. Our analysis is ongoing, and we look forward to sharing the results and decisions from this work at Trinity’s Investor Day in the near future.
We aim to be the premier provider of rail products and services, and are motivated to drive freight on to the North American rail network. We see Trinity’s purpose as moving goods and commodities by rail for the good of all, an integral part of our commitment to sustainability. We have a strong financial position to weather the current economic storm and be opportunistic when attractive value propositions arise. Trinity’s rail platform is Built to Deliver – to deliver essential goods to society; deliver innovative solutions and high quality products to our customers; and deliver high-quality earnings and returns to shareholders through the railcar cycle.
I’ll now turn the call over to Eric to discuss specific financial details for the quarter.
Eric R. Marchetto,
Executive Vice President and Chief Financial Officer
Thank you, Jean – and good morning everyone!
Trinity’s performance in the second quarter reflects the steps we are taking to create liquidity in the near-term while improving our returns through disciplined capital allocation. We are not providing specific financial guidance given current uncertainty, but we believe the Company will continue to
generate significant cash flow due to the resiliency of our platform of businesses and their inherent financial synergies.
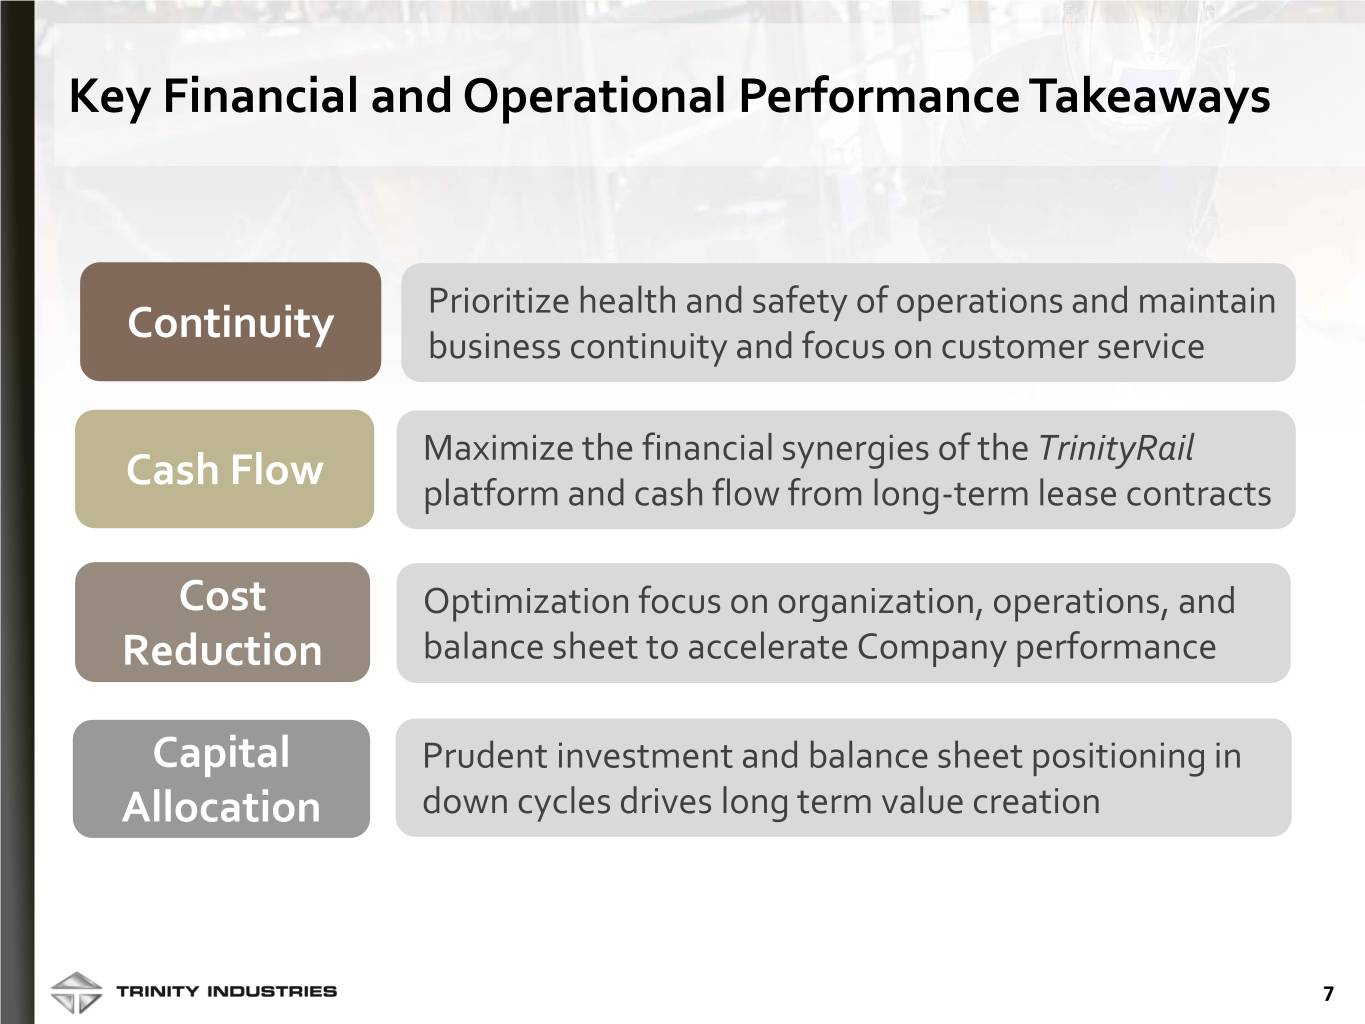
Referring to page 5 of the Supplemental Materials, we are focused on maximizing the cash flow of the business and maintaining a strong level of liquidity. As of the end of the second quarter, the Company had liquidity of nearly $710 million. Our liquidity position is further enhanced by the recent $225 million financing noted in our press release. We continue to expect over $300 million cash refunds of prior year tax losses by year end resulting from tax-provisions in the CARES Act. Our June 30th balance sheet also reflects our expectation for an additional $150 million of cash tax refunds to be received in 2021 associated with our 2020 tax year demonstrating the value enhancing tax attributes of our platform. Furthermore, Trinity has unencumbered assets of approximately $1.6 billion as dry powder, which would be available for monetization through additional leverage or secondary market transactions. We believe our balance sheet and financial strength enable Trinity to navigate the COVID-19 pandemic and capitalize on opportunities that may emerge for value creation.
We work diligently to maintain a diversified portfolio of railcars, manage the credit profile of our customers and stagger our portfolio expirations to maximize risk adjusted returns. On our last call we referenced challenges faced by many of our frac sand customers as a result of the “one-two” punch from the structural changes within the frac sand supply chain and the drastic fall of energy prices, including increased pressure related to the COVID-19 pandemic. We have been closely monitoring the structural changes in the frac sand market and working aggressively with our customers, as appropriate, to restructure lease arrangements to maintain associated cash flows and keep these assets utilized.
Ultimately, in the second quarter, four of Trinity’s frac sand customers filed for bankruptcy while others remained financially vulnerable – changing the expected recoverability of cash flows from the lease contracts for this railcar type. As a result, these filings necessitate that the Company estimate the fair value of these railcars. Our analysis concluded with a $369 million pre-tax, non-cash charge against the small cube covered hopper fleet within Trinity’s railcar portfolio, which reflects our estimates of the fair value of the assets based on the cash flows that have been stressed by continued pressure on the lease contracts, and the future salvage value of the assets. This impairment charge does not have an impact on our liquidity position, nor does it affect our compliance with the debt covenants within our rail securitizations. A portion of the impairment charge affected railcars in our partially-owned portfolios and thus has been apportioned to the noncontrolling interest on our balance sheet. Following the impairment charge, our small cube
covered hopper fleet represents 3% of the net book value of our owned and partially-owned portfolio.
During the second quarter, we sold a portfolio of railcars to one of our RIV partners. The total proceeds of the portfolio were $74 million with a gain of 6%. These high-quality, lower-yielding assets were a good risk-adjusted fit for our Partner’s portfolio. This allowed Trinity to deploy capital to higher yielding investments while we will continue to earn fee income by managing these assets. This sale highlights our ability to leverage our platform to create mutually-beneficial transactions for ourselves and our partners, as well as our renewed focus on a disciplined capital allocation framework to drive long-term value creation.
As we evaluate the future growth of our lease fleet, we are highly focused on the returns of the portfolio as part of our plan to drive the performance of the Company to a mid-teens pre-tax ROE. We believe we are taking the necessary actions to position the company for accelerated performance as the market recovers – with heightened focus on the levers within our control.
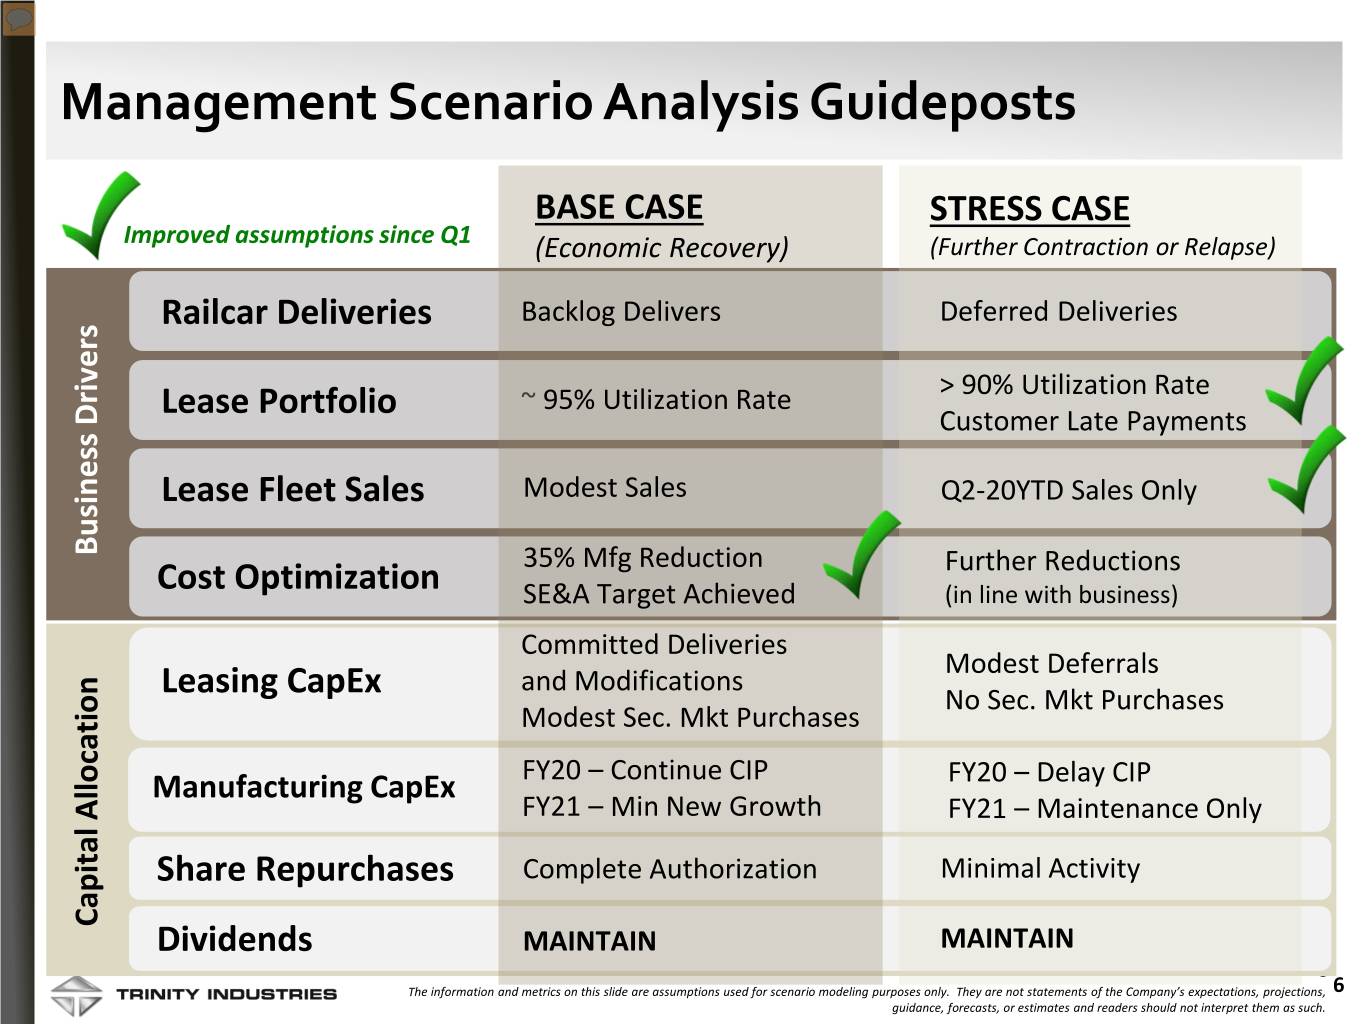
Turning to page 6 of the Supplemental Materials, in lieu of guidance last quarter, we presented base case and stress case scenarios as guideposts that management would use in determining our actions and capital allocation considerations. While the market uncertainty continues to cloud our ability to predict the timing of a rail recovery, our actions and performance from the second quarter have improved upon some of the assumptions in the scenarios we provided. The 2020 production plan is essentially sold with approximately 41% of our backlog value to be delivered by year end. Given the North American railcar loading trends and our success in renewing railcars in the quarter, we expect our lease fleet utilization will remain above 90% in a down side case. Our prior stress assumption for limited railcar sales would also improve following the small portfolio sale in the second quarter; furthermore, we have additional line of sight on potential smaller railcar portfolio sales in the balance of the year. Our cost initiatives will also yield savings achieving our target set for the year, with more actions to come. Of the $70 million in annualized savings actions year-to-date that Jean mentioned, approximately $30 million is structural and will result in decreases in SE&A and other overhead-related line items in the future.
Regarding capital allocation, our net investment in the lease fleet will now likely fall between $350 and $450 million as a result of RIV and secondary market activity. We’ve also deferred some manufacturing capex projects; however, we do still plan to complete the expansion project for our new maintenance facility in Iowa. Our expectations for the year now include approximately $90 to $100 million of manufacturing capex for the year. We did not repurchase any shares during the quarter in order to preserve our liquidity and bolster our financial position, but this tool is available
as we continue to optimize our balance sheet. In May, the Company announced our 225th consecutive dividend, maintaining the dividend at $0.19 per share for an annualized yield of approximately 3.5% as of the close of market yesterday.
Trinity is in the middle of a very exciting transformation. While combating the economic ramifications of the pandemic, we are putting the building blocks in place for the Trinity of tomorrow. We expect to share specific insights into our operational strategy and long-term performance expectations at an Investor Day in the weeks following our third quarter conference call. We will ask that you stay tuned for further details, as we look forward to sharing these plans with you very soon.
In closing, management is aligned in our expectation that the financial and commercial synergies of the rail platform enable both meaningful investment in the business and substantial return of capital to shareholders. We are demonstrating these results even in a sharp economic downturn. We believe our platform has the ability to generate positive cash flow, even in the down cycles, and we remain committed to investing in our railcar lease fleet through the cycle – with a focus on returns for the portfolio. As we manage through the COVID-19 environment, we are committed to a prudent capital allocation strategy and strong liquidity to maintain our position of strength. Through it all, we believe Trinity Rail’s Platform is Built to Deliver.
Operator, you can now take us into Q&A.
Jessica Greiner
Vice President, Investor Relations and Communications
Thank you, Brie. That concludes today's conference call. A replay of today’s call will be available after one o'clock eastern standard time through midnight on July 30th, 2020. The access number is (402) 220-6088. A replay of the webcast will also be available under the Events and Presentations page on our Investor Relations website located at www.trin.net. We look forward to visiting with you again on our next conference call. Thank you for joining us this morning.