Exhibit 99.1
FOR IMMEDIATE RELEASE
Trinity Industries, Inc. Announces Third Quarter 2021 Results
Reports quarterly GAAP and adjusted earnings from continuing operations of $0.33 and $0.29 per diluted share, respectively
Generates year-to-date operating and total free cash flow of $428 million and $516 million, respectively
Returned $473 million of capital to stockholders year-to-date through dividends and share repurchases
DALLAS, Texas – October 21, 2021 – Trinity Industries, Inc. (NYSE:TRN) today announced earnings results for the third quarter ended September 30, 2021.
Financial and Operational Highlights
•Quarterly total company revenues of $504 million
•Quarterly income from continuing operations per common diluted share ("EPS") of $0.33 and quarterly adjusted EPS of $0.29
•Completed initial railcar portfolio sale of $325 million to Signal Rail Holdings LLC, a new railcar investment vehicle ("RIV") partner
•Lease fleet utilization of 95.0% and Future Lease Rate Differential ("FLRD") of positive 1.4% at quarter end
•New railcar orders of 2,530 and railcar deliveries of 2,410
•Year-to-date cash flow from operations and total free cash flow after dividends and investments ("Free Cash Flow") were $428 million and $516 million, respectively
•Repurchases of approximately 2.8 million shares at a cost of $77 million
•Committed liquidity of $1.1 billion as of September 30, 2021
Management Commentary
"Trinity continues to execute well on our strategy to enhance returns and shareholder value," remarked Trinity's Chief Executive Officer and President, Jean Savage. "The Company continued to advance toward our initiatives to improve returns, highlighted by the $325 million portfolio sale in our latest RIV partnership. The Signal Rail portfolio sale this past quarter and its resulting benefit to our earnings and balance sheet are a prime example of this dynamic."
"While market activity continues to improve, Trinity's third quarter results were negatively impacted by labor shortages and turnover as well as supply chain disruptions, diluting the impact of margin improvement initiatives in the Rail Products Group," Ms. Savage continued. "It is important to note that while this quarter was challenged, we continue to expect improving demand for railcars and profitability."
"In contrast, our Railcar Leasing and Management Services Group had another quarter of strong performance, and we maintain our view that market fundamentals for railcar leasing should continue to ramp up into 2022. The Future Lease Rate Differential climbed again in the third quarter to 1.4%, compared to negative 2.5% and negative 14.8% in the past two quarters."
Ms. Savage concluded, "It has been nearly a year since we introduced our strategic vision, and I am pleased with the progress we have made. We are continuing to execute on our goals, and despite a challenging quarter in Rail Products, the Company's enthusiasm to achieve the goals we set out in last year's Investor Day presentation has never been stronger."
Consolidated Financial Summary
| | | | | | | | | | | | | | | | | |
| Three Months Ended
September 30, | | |
| 2021 | | 2020 | | Year over Year – Comparison |
| (in millions, except percentages and per share amounts) | | |
Revenues (1) | $ | 503.5 | | $ | 459.4 | | Increased demand and higher pricing in our highway products business and higher external deliveries in the Rail Products Group |
Selling, engineering, and administrative expenses | $ | 54.3 | | $ | 51.2 | | Higher employee-related costs, including increased incentive-based compensation |
| | | | | |
Operating profit | $ | 92.2 | | $ | 72.9 | | Higher volume of railcar sales from our lease portfolio, partially offset by higher costs associated with external deliveries in the Rail Products Group, and lower lease rates and higher depreciation expense in the Leasing Group |
| | | | | |
| Interest expense, net | $ | 45.2 | | $ | 51.7 | | Lower overall borrowing costs associated with the Company's debt, partially offset by higher overall average debt |
| Net income from continuing operations attributable to Trinity Industries, Inc. | $ | 32.4 | | $ | 25.1 | | |
| | | | | |
EBITDA (2) | $ | 163.6 | | $ | 136.4 | | |
| | | | | |
| Effective tax expense (benefit) rate | 23.9 | % | | (34.9) | % | | 2020 tax benefit primarily related to tax law changes |
| Diluted EPS – GAAP | $ | 0.33 | | $ | 0.21 | | 2021 includes $0.04 favorable impact of storm-related insurance recoveries |
Diluted EPS – Adjusted (2) | $ | 0.29 | | $ | 0.17 | | |
| | | | | |
| Nine Months Ended
September 30, | | |
| 2021 | | 2020 | | Year over Year – Comparison |
| (in millions) | | |
Net cash provided by operating activities – continuing operations | $ | 428.0 | | $ | 456.8 | | |
Free Cash Flow (2) | $ | 515.5 | | $ | 48.5 | | Higher volume of railcar sales from our lease portfolio and the timing difference of debt proceeds issued for financing lease fleet equity investment |
Capital expenditures – leasing (3) | $ | 363.9 | | $ | 448.8 | | |
| Returns of capital to stockholders | $ | 473.2 | | $ | 193.1 | | Increase in share repurchase activity in 2021, which included a privately negotiated repurchase agreement totaling $222.5 million in the second quarter |
(1) Beginning in the fourth quarter of 2020, we made a prospective change to the presentation of railcar sales and now present all sales of railcars from the lease fleet as a net gain or loss from the disposal of a long-term asset regardless of the age of railcar that is sold. Historically, we presented sales of railcars from the lease fleet on a gross basis in leasing revenues and cost of revenues if the railcars had been owned for one year or less at the time of sale. Sales of railcars from the lease fleet owned for more than one year had historically been presented as a net gain or loss from the disposal of a long-term asset.
(2) Non-GAAP financial measure. See the Reconciliations of Non-GAAP Measures section within this Press Release for a reconciliation to the most directly comparable GAAP measure and why management believes this measure is useful to management and investors.
(3) For the nine months ended September 30, 2020, Capital expenditures – leasing is net of sold lease fleet railcars owned one year or less.
Business Group Summary
| | | | | | | | | | | | | | | | | |
| Three Months Ended
September 30, | | |
| 2021 | | 2020 | | Year over Year – Comparison |
| (in millions, except percentages and number of units) | | |
| Railcar Leasing and Management Services Group | | |
| Leasing and management revenues | $ | 185.5 | | $ | 183.9 | | Growth in the lease fleet, slightly higher utilization, and increased servicer fees, partially offset by lower rental rates |
| Leasing and management operating profit | $ | 76.4 | | $ | 86.8 | | Increased depreciation, higher fleet operating costs, and lower lease rates, partially offset by slightly higher fleet utilization |
| Operating profit on lease portfolio sales | $ | 32.9 | | $ | 2.9 | | Higher volume of railcars sold from the lease portfolio |
| Fleet utilization | 95.0 | % | | 94.8 | % | | |
Future Lease Rate Differential ("FLRD") (1) | +1.4 | % | | (20.9) | % | | Recovery of current market lease rates compared to the prior year period |
Owned lease fleet (in units) (2) | 105,915 | | 105,925 | | Initial sale to new RIV partner, partially offset by growth in the lease fleet |
| Investor-owned lease fleet (in units) | 30,060 | | 26,655 | | Initial sale to new RIV partner |
| Rail Products Group | | | | | |
| Revenues | $ | 339.9 | | $ | 381.2 | | Lower deliveries and a shift in the mix of railcar products and services sold |
| Operating profit (loss) margin | (0.9) | % | | 0.8 | % | | Lower deliveries, mix changes, higher input costs and supply chain disruptions, along with operating inefficiencies, such as labor shortages and turnover, in our maintenance services business |
| New railcars: | | | | | |
| Deliveries (in units) | 2,410 | | 2,605 | | |
| Orders (in units) | 2,530 | | 2,000 | | |
| Order value | $ | 218.6 | | $ | 186.8 | | Higher number of units and differences in product mix |
| Backlog value | $ | 1,228.4 | | $ | 1,155.4 | | |
| Sustainable railcar conversions: | | | | | |
| Deliveries (in units) | 242 | | — | | |
| Backlog (in units) | 1,127 | | — | | |
| Backlog value | $ | 98.3 | | $ | — | | |
| All Other | | | | | |
| Revenues | $ | 83.7 | | $ | 62.6 | | Increased demand and higher pricing for highway products |
| Operating profit | $ | 14.7 | | $ | 7.3 | | Increased demand and manufacturing efficiencies in our highway products business and a gain on the disposition of a non-operating facility |
| | | | | |
| September 30, 2021 | | December 31, 2020 | | |
| Loan-to-value ratio | | | | | |
| Wholly-owned subsidiaries, including corporate revolving credit facility | 63.4 | % | | 58.5 | % | | Increased leverage associated with leased assets, partially offset by amortization of debt on encumbered assets |
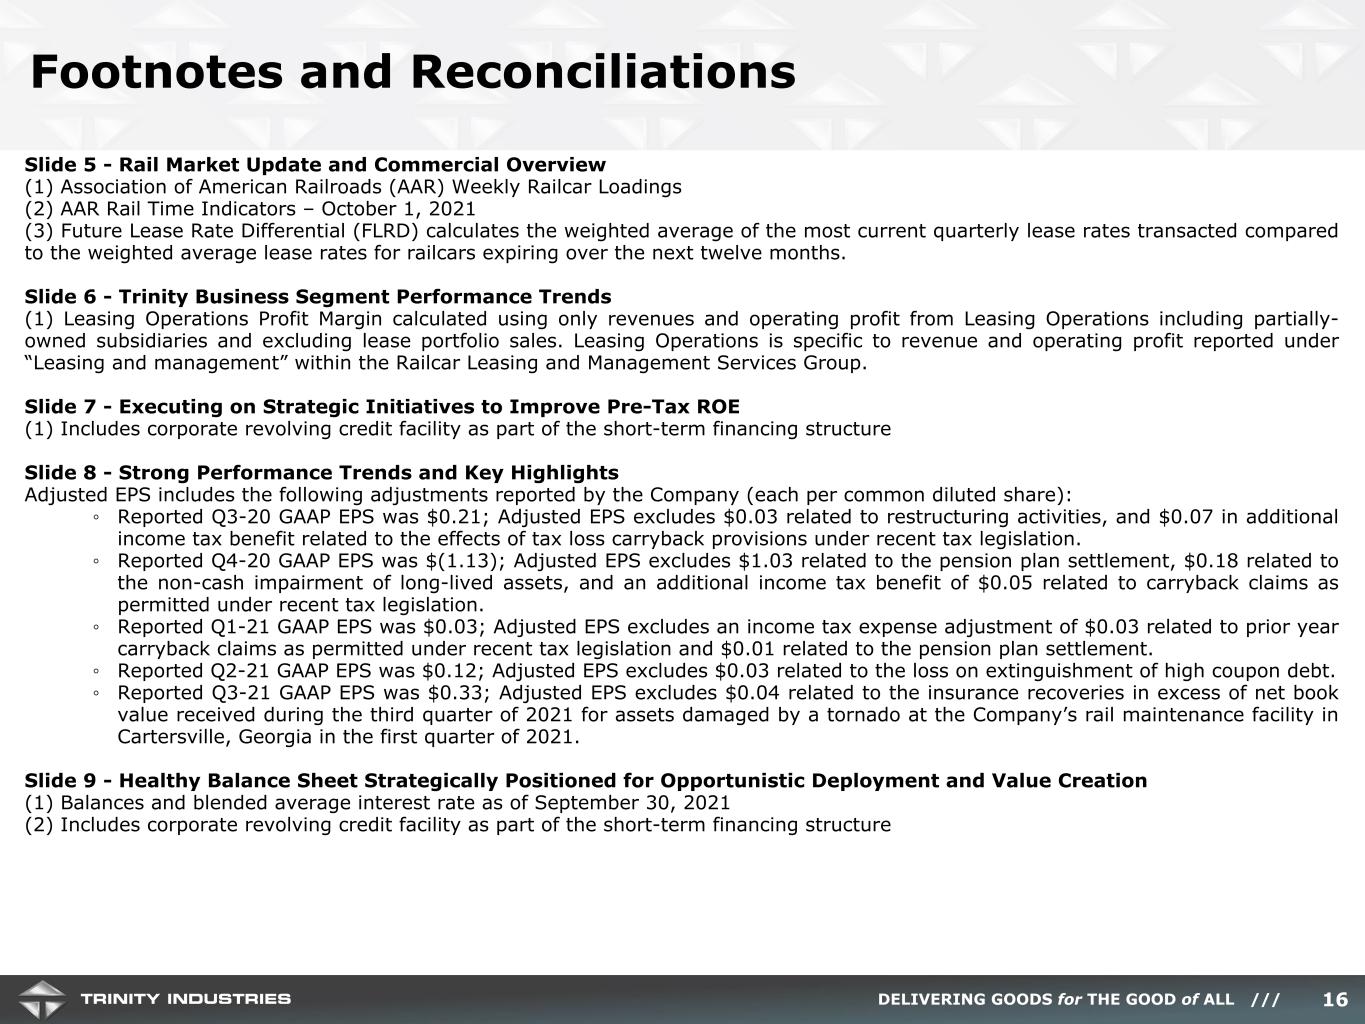
(1) FLRD calculates the weighted average of the most current quarterly lease rates transacted compared to the weighted average lease rates for railcars expiring over the next twelve months.
(2) Includes wholly-owned railcars, partially-owned railcars, and railcars under sale-leaseback arrangements.
Additional Business Items
Liquidity and Capital Resource Updates
•In August 2021, Trinity and Wafra, Inc. (“Wafra”), a global alternative investment manager, announced a new RIV program between Trinity and certain funds managed by Wafra (“Wafra Funds”). The joint venture created as part of this program, known as Signal Rail Holdings LLC (“Signal Rail”), is owned 90% by Wafra Funds and 10% by our wholly-owned subsidiary, Trinity Industries Leasing Company ("TILC"). Signal Rail or its subsidiaries are expected to invest in diversified portfolios of leased railcars originated by TILC targeting up to $1 billion in total acquisitions over an expected three-year investment period. TILC will service all railcars owned by Signal Rail.
◦In connection with the launch of the RIV program, in August 2021, TILC sold to Signal Rail an initial portfolio of 3,582 railcars and related leases that were previously owned by TILC and its subsidiaries for an aggregate sales price of approximately $325 million. As a result of the sale, TILC received approximately $319 million in cash and a 10% equity interest in Signal Rail valued at $6 million. TILC recognized a gain of approximately $33 million on the initial portfolio sale during the three months ended September 30, 2021.
•During the quarter, Trinity repurchased approximately $77 million of shares under the Company's authorized share repurchase program, which completed the previous share repurchase program.
•In September 2021, our Board of Directors authorized a new share repurchase program effective September 9, 2021 through December 31, 2022. The new share repurchase program authorizes the Company to repurchase up to $250 million of its common stock.
•During the quarter, Trinity received a $41 million income tax refund associated with the tax loss carryback for the 2019 tax year as permitted under recent tax legislation. The Company's income tax receivable at the end of the third quarter was $192 million.
Conference Call
Trinity will hold a conference call at 8:30 a.m. Eastern on October 21, 2021 to discuss its third quarter results. To listen to the call, please visit the Investor Relations section of the Company's website at www.trin.net and access the Events & Presentations webpage, or the live call can be accessed at 1-888-317-6003 with the conference passcode "7533427". Please call at least 10 minutes in advance to ensure a timely connection. An audio replay may be accessed through the Company’s website or by dialing 1-877-344-7529 with passcode "10152033" until 11:59 p.m. Eastern on October 28, 2021.
Additionally, the Company will provide Supplemental Materials to accompany the earnings conference call. The materials will be accessible both within the webcast and on Trinity's Investor Relations website under the Events and Presentations portion of the site along with the Third Quarter Earnings Call event weblink.
Non-GAAP Financial Measures
We have included financial measures compiled in accordance with generally accepted accounting principles ("GAAP") and certain non-GAAP measures in this earnings press release to provide management and investors with additional information regarding our financial results. Non-GAAP measures should not be considered in isolation or as a substitute for our reporting results prepared in accordance with GAAP and, as calculated, may not be comparable to other similarly titled measures for other companies. For each non-GAAP financial measure, a reconciliation to the most comparable GAAP measure has been included in the accompanying tables. When forward-looking non-GAAP measures are provided, quantitative reconciliations to the most directly comparable GAAP measures are not provided because management cannot, without unreasonable effort, predict the timing and amounts of certain items included in the computations of each of these measures. These factors include, but are not limited to: the product mix of expected railcar deliveries; the timing and amount of significant transactions and investments, such as lease portfolio sales, capital expenditures, and returns of capital to stockholders; and the amount and timing of certain other items outside the normal course of our core business operations, such as restructuring activities and the potential financial and operational impacts of the COVID-19 pandemic.
About Trinity Industries
Trinity Industries, Inc., headquartered in Dallas, Texas, owns businesses that are leading providers of rail transportation products and services in North America. Our rail-related businesses market their railcar products and services under the trade name TrinityRail®. The TrinityRail platform provides railcar leasing and management services, as well as railcar manufacturing, maintenance and modifications. Trinity also owns businesses engaged in the manufacture of products used on the nation’s roadways and in traffic control. Trinity reports its financial results in three principal business segments: the Railcar Leasing and Management Services Group, the Rail Products Group, and All Other. For more information, visit: www.trin.net.
Some statements in this release, which are not historical facts, are “forward-looking statements” as defined by the Private Securities Litigation Reform Act of 1995. Forward-looking statements include statements about Trinity's estimates, expectations, beliefs, intentions or strategies for the future, and the assumptions underlying these forward-looking statements, including, but not limited to, future financial and operating performance, future opportunities and any other statements regarding events or developments that Trinity believes or anticipates will or may occur in the future, including the potential financial and operational impacts of the COVID-19 pandemic. Trinity uses the words “anticipates,” “assumes,” “believes,” “estimates,” “expects,” “intends,” “forecasts,” “may,” “will,” “should,” “guidance,” “projected,” “outlook,” and similar expressions to identify these forward-looking statements. Forward-looking statements speak only as of the date of this release, and Trinity expressly disclaims any obligation or undertaking to disseminate any updates or revisions to any forward-looking statement contained herein to reflect any change in Trinity’s expectations with regard thereto or any change in events, conditions or circumstances on which any such statement is based, except as required by federal securities laws. Forward-looking statements involve risks and uncertainties that could cause actual results to differ materially from historical experience or our present expectations, including but not limited to risks and uncertainties regarding economic, competitive, governmental, and technological factors affecting Trinity’s operations, markets, products, services and prices, and such forward-looking statements are not guarantees of future performance. For a discussion of such risks and uncertainties, which could cause actual results to differ from those contained in the forward-looking statements, see “Risk Factors” and “Forward-Looking Statements” in Trinity’s Annual Report on Form 10-K for the most recent fiscal year, as may be revised and updated by Trinity’s Quarterly Reports on Form 10-Q, and Trinity’s Current Reports on Form 8-K.
| | |
| Investor Contact: |
| Leigh Anne Mann |
| Vice President, Investor Relations |
| Trinity Industries, Inc. |
| (Investors) 214/631-4420 |
|
| Media Contact: |
| Jack L. Todd |
| Vice President, Public Affairs |
| Trinity Industries, Inc. |
| (Media Line) 214/589-8909 |
- TABLES TO FOLLOW -
Trinity Industries, Inc.
Condensed Consolidated Statements of Operations
(in millions, except per share amounts)
(unaudited)
| | | | | | | | | | | | | | | | | | | | | | | |
| Three Months Ended
September 30, | | Nine Months Ended
September 30, |
| 2021 | | 2020 | | 2021 | | 2020 |
| Revenues | $ | 503.5 | | | $ | 459.4 | | | $ | 1,273.8 | | | $ | 1,583.8 | |
| Operating costs: | | | | | | | |
| Cost of revenues | 398.7 | | | 334.5 | | | 953.9 | | | 1,213.1 | |
| Selling, engineering, and administrative expenses | 54.3 | | | 51.2 | | | 166.4 | | | 172.3 | |
| Gains on dispositions of property: | | | | | | | |
| Lease portfolio sales | 32.9 | | | 2.9 | | | 45.7 | | | 17.3 | |
| Other | 8.7 | | | 1.0 | | | 19.5 | | | 2.8 | |
| Impairment of long-lived assets | — | | | — | | | — | | | 369.4 | |
| Restructuring activities, net | (0.1) | | | 4.7 | | | (1.1) | | | 10.5 | |
| 411.3 | | | 386.5 | | | 1,054.0 | | | 1,745.2 | |
| Operating profit (loss) | 92.2 | | | 72.9 | | | 219.8 | | | (161.4) | |
| Interest expense, net | 45.2 | | | 51.7 | | | 147.5 | | | 158.6 | |
| Loss on extinguishment of debt | — | | | — | | | 11.7 | | | 5.0 | |
| | | | | | | |
| Other, net | (0.7) | | | 2.0 | | | 1.3 | | | 0.5 | |
| Income (loss) from continuing operations before income taxes | 47.7 | | | 19.2 | | | 59.3 | | | (325.5) | |
| Provision (benefit) for income taxes: | | | | | | | |
| Current | 0.6 | | | (18.7) | | | 5.9 | | | (471.2) | |
| Deferred | 10.8 | | | 12.0 | | | 10.6 | | | 245.1 | |
| 11.4 | | | (6.7) | | | 16.5 | | | (226.1) | |
| Income (loss) from continuing operations | 36.3 | | | 25.9 | | | 42.8 | | | (99.4) | |
| Loss from discontinued operations, net of income taxes | (0.4) | | | — | | | (0.8) | | | (0.2) | |
| Net income (loss) | 35.9 | | | 25.9 | | | 42.0 | | | (99.6) | |
| Net income (loss) attributable to noncontrolling interest | 3.9 | | | 0.8 | | | (6.0) | | | (79.5) | |
| Net income (loss) attributable to Trinity Industries, Inc. | $ | 32.0 | | | $ | 25.1 | | | $ | 48.0 | | | $ | (20.1) | |
| | | | | | | |
| Basic earnings per common share: | | | | | | | |
| Income (loss) from continuing operations | $ | 0.33 | | | $ | 0.21 | | | $ | 0.47 | | | $ | (0.17) | |
| Income (loss) from discontinued operations | — | | | — | | | (0.01) | | | — | |
| Basic net income (loss) attributable to Trinity Industries, Inc. | $ | 0.33 | | | $ | 0.21 | | | $ | 0.46 | | | $ | (0.17) | |
| Diluted earnings per common share: | | | | | | | |
| Income (loss) from continuing operations | $ | 0.33 | | | $ | 0.21 | | | $ | 0.46 | | | $ | (0.17) | |
| Income (loss) from discontinued operations | — | | | — | | | (0.01) | | | — | |
| Diluted net income (loss) attributable to Trinity Industries, Inc. | $ | 0.33 | | | $ | 0.21 | | | $ | 0.45 | | | $ | (0.17) | |
| Weighted average number of shares outstanding: | | | | | | | |
| Basic | 97.7 | | | 116.4 | | | 103.4 | | | 117.2 | |
| Diluted | 99.5 | | | 117.0 | | | 105.7 | | | 117.2 | |
Trinity has certain unvested restricted stock awards that participate in dividends on a nonforfeitable basis and are therefore considered to be participating securities. Consequently, diluted net income (loss) attributable to Trinity Industries, Inc. per common share is calculated under both the two-class method and the treasury stock method, and the more dilutive of the two calculations is presented. There were no restricted shares and stock options included in the computation of diluted EPS for the nine months ended September 30, 2020 as we incurred a loss for the period, and any effect on loss per common share would have been antidilutive.
Trinity Industries, Inc.
Condensed Segment Data
(in millions)
(unaudited)
| | | | | | | | | | | | | | | | | | | | | | | |
| Three Months Ended
September 30, | | Nine Months Ended
September 30, |
| Revenues: | 2021 | | 2020 | | 2021 | | 2020 |
| Railcar Leasing and Management Services Group | $ | 185.5 | | | $ | 183.9 | | | $ | 554.1 | | | $ | 613.0 | |
| Rail Products Group | 339.9 | | | 381.2 | | | 862.7 | | | 1,296.2 | |
| All Other | 83.7 | | | 62.6 | | | 230.0 | | | 195.3 | |
| Segment Totals before Eliminations | 609.1 | | | 627.7 | | | 1,646.8 | | | 2,104.5 | |
| Eliminations – Lease Subsidiary | (105.3) | | | (166.0) | | | (367.6) | | | (512.4) | |
| Eliminations – Other | (0.3) | | | (2.3) | | | (5.4) | | | (8.3) | |
| Consolidated Total | $ | 503.5 | | | $ | 459.4 | | | $ | 1,273.8 | | | $ | 1,583.8 | |
| | | | | | | |
| Three Months Ended
September 30, | | Nine Months Ended
September 30, |
| Operating profit (loss): | 2021 | | 2020 | | 2021 | | 2020 |
| Railcar Leasing and Management Services Group | $ | 109.3 | | | $ | 89.7 | | | $ | 268.7 | | | $ | 265.5 | |
| Rail Products Group | (3.1) | | | 3.2 | | | (8.7) | | | 36.2 | |
| All Other | 14.7 | | | 7.3 | | | 42.8 | | | 23.9 | |
| Segment Totals before Eliminations, Corporate Expenses, Impairment of long-lived assets, and Restructuring activities | 120.9 | | | 100.2 | | | 302.8 | | | 325.6 | |
| Corporate | (23.9) | | | (21.0) | | | (73.7) | | | (73.3) | |
| Impairment of long-lived assets | — | | | — | | | — | | | (369.4) | |
| Restructuring activities, net | 0.1 | | | (4.7) | | | 1.1 | | | (10.5) | |
| Eliminations – Lease Subsidiary | (4.5) | | | (2.6) | | | (9.3) | | | (33.5) | |
| Eliminations – Other | (0.4) | | | 1.0 | | | (1.1) | | | (0.3) | |
| Consolidated Total | $ | 92.2 | | | $ | 72.9 | | | $ | 219.8 | | | $ | (161.4) | |
Trinity Industries, Inc.
Selected Financial Information – Leasing Group
($ in millions)
(unaudited)
| | | | | | | | | | | | | | | | | | | | | | | |
| Three Months Ended
September 30, | | Nine Months Ended
September 30, |
| | 2021 | | 2020 | | 2021 | | 2020 |
| Revenues: | | | | | | | |
| Leasing and management | $ | 185.5 | | | $ | 183.9 | | | $ | 554.1 | | | $ | 558.6 | |
Sales of railcars owned one year or less at the time of sale (1) | — | | | — | | | — | | | 54.4 | |
| Total revenues | $ | 185.5 | | | $ | 183.9 | | | $ | 554.1 | | | $ | 613.0 | |
Operating profit (2): | | | | | | | |
| Leasing and management | $ | 76.4 | | | $ | 86.8 | | | $ | 223.0 | | | $ | 247.8 | |
Lease portfolio sales (1) | 32.9 | | | 2.9 | | | 45.7 | | | 17.7 | |
| | | | | | | |
| Total operating profit | $ | 109.3 | | | $ | 89.7 | | | $ | 268.7 | | | $ | 265.5 | |
| Total operating profit margin | 58.9 | % | | 48.8 | % | | 48.5 | % | | 43.3 | % |
| | | | | | | |
| Leasing and management operating profit margin | 41.2 | % | | 47.2 | % | | 40.2 | % | | 44.4 | % |
| | | | | | | |
| Selected expense information: | | | | | | | |
Depreciation (3) | $ | 58.7 | | | $ | 51.5 | | | $ | 170.5 | | | $ | 159.1 | |
| Maintenance and compliance | $ | 22.8 | | | $ | 18.5 | | | $ | 73.7 | | | $ | 67.4 | |
| Rent | $ | 1.9 | | | $ | 2.1 | | | $ | 5.3 | | | $ | 8.1 | |
| Selling, engineering, and administrative expenses | $ | 11.6 | | | $ | 11.7 | | | $ | 36.1 | | | $ | 39.0 | |
Interest (4) | $ | 39.9 | | | $ | 47.0 | | | $ | 142.6 | | | $ | 149.2 | |
| | | | | | | | | | | | | | | | | | | | | | | |
| Three Months Ended
September 30, | | Nine Months Ended
September 30, |
| 2021 | | 2020 | | 2021 | | 2020 |
| (in millions) |
| Lease portfolio sales | $ | 322.1 | | | $ | 6.5 | | | $ | 410.9 | | | $ | 193.1 | |
| Operating profit on lease portfolio sales | $ | 32.9 | | | $ | 2.9 | | | $ | 45.7 | | | $ | 17.7 | |
| Operating profit margin on lease portfolio sales | 10.2 | % | | 44.6 | % | | 11.1 | % | | 9.2 | % |
(1) Beginning in the fourth quarter of 2020, we made a prospective change to the presentation of railcar sales and now present all sales of railcars from the lease fleet as a net gain or loss from the disposal of a long-term asset regardless of the age of railcar that is sold. Historically, we presented sales of railcars from the lease fleet on a gross basis in leasing revenues and cost of revenues if the railcars had been owned for one year or less at the time of sale. Sales of railcars from the lease fleet owned for more than one year had historically been presented as a net gain or loss from the disposal of a long-term asset.
(2) Operating profit includes: depreciation; maintenance and compliance; rent; and selling, engineering, and administrative expenses. Amortization of deferred profit on railcars sold from the Rail Products Group to the Leasing Group is included in the operating profit of the Leasing Group, resulting in the recognition of depreciation expense based on the Company's original manufacturing cost of the railcars. Interest expense is not a component of operating profit and includes the effect of hedges.
(3) Depreciation expense increased $4.7 million and $7.3 million for the three and nine months ended September 30, 2021, respectively, as a result of the disposal of certain railcar components associated with our sustainable railcar conversion program. Additionally, depreciation expense related to our small cube covered hopper railcars decreased by approximately $7.0 million for the nine months ended September 30, 2021 relative to the nine months ended September 30, 2020 as a result of the impairment charge recorded in the second quarter of 2020 related to these railcars.
(4) Interest expense for the nine months ended September 30, 2021 includes $11.7 million of loss on extinguishment of debt associated with the refinancing of our partially-owned subsidiaries' debt. Interest expense for the nine months ended September 30, 2020 includes $5.0 million of loss on extinguishment of debt associated with the early redemption of debt.
Trinity Industries, Inc.
Condensed Consolidated Balance Sheets
(in millions)
(unaudited)
| | | | | | | | | | | |
| September 30, 2021 | | December 31, 2020 |
| ASSETS | | | |
| Cash and cash equivalents | $ | 221.8 | | | $ | 132.0 | |
| | | |
| Receivables, net of allowance | 246.3 | | | 199.0 | |
| Income tax receivable | 191.9 | | | 445.8 | |
| Inventories | 403.5 | | | 321.2 | |
| Restricted cash | 123.3 | | | 96.4 | |
| Property, plant, and equipment, net | 6,800.1 | | | 7,003.4 | |
| Goodwill | 215.8 | | | 208.8 | |
| | | |
| Other assets | 292.9 | | | 295.2 | |
| Total assets | $ | 8,495.6 | | | $ | 8,701.8 | |
| | | |
| LIABILITIES AND STOCKHOLDERS' EQUITY | | | |
| Accounts payable | $ | 208.6 | | | $ | 156.4 | |
| Accrued liabilities | 296.4 | | | 314.7 | |
| Debt | 5,176.5 | | | 5,017.0 | |
| | | |
| Deferred income taxes | 1,060.3 | | | 1,047.5 | |
| | | |
| Other liabilities | 157.4 | | | 150.2 | |
| Stockholders' equity: | | | |
| Trinity Industries, Inc. | 1,331.0 | | | 1,738.8 | |
| Noncontrolling interest | 265.4 | | | 277.2 | |
| 1,596.4 | | | 2,016.0 | |
| Total liabilities and stockholders' equity | $ | 8,495.6 | | | $ | 8,701.8 | |
Trinity Industries, Inc.
Additional Balance Sheet Information
(in millions)
(unaudited)
| | | | | | | | | | | |
| September 30, 2021 | | December 31, 2020 |
| Property, Plant, and Equipment | | | |
| Manufacturing/Corporate: | | | |
| Property, plant, and equipment | $ | 946.1 | | | $ | 979.4 | |
| Accumulated depreciation | (561.5) | | | (577.9) | |
| 384.6 | | | 401.5 | |
| Leasing: | | | |
| Wholly-owned subsidiaries: | | | |
| Machinery and other | 20.1 | | | 19.5 | |
| Equipment on lease | 6,917.3 | | | 7,010.6 | |
| Accumulated depreciation | (1,334.0) | | | (1,234.2) | |
| 5,603.4 | | | 5,795.9 | |
| Partially-owned subsidiaries: | | | |
| Equipment on lease | 2,258.9 | | | 2,248.2 | |
| Accumulated depreciation | (664.2) | | | (621.9) | |
| 1,594.7 | | | 1,626.3 | |
| | | |
| Deferred profit on railcars sold to the Leasing Group | (1,044.7) | | | (1,064.7) | |
| Accumulated amortization | 262.1 | | | 244.4 | |
| (782.6) | | | (820.3) | |
| $ | 6,800.1 | | | $ | 7,003.4 | |
| | | | | | | | | | | |
| September 30, 2021 | | December 31, 2020 |
| Debt | | | |
| Corporate – Recourse: | | | |
| Revolving credit facility | $ | — | | | $ | 50.0 | |
Senior notes, net of unamortized discount of $0.2 and $0.2 | 399.8 | | | 399.8 | |
| 399.8 | | | 449.8 | |
| Less: unamortized debt issuance costs | (1.3) | | | (1.6) | |
| Total recourse debt | 398.5 | | | 448.2 | |
| | | |
| Leasing – Non-recourse: | | | |
| Wholly-owned subsidiaries: | | | |
Secured railcar equipment notes, net of unamortized discount of $0.5 and $0.6 | 2,293.3 | | | 2,042.4 | |
2017 promissory notes, net of unamortized discount of $8.4 and $10.1 | 770.8 | | | 802.7 | |
| TILC warehouse facility | 514.4 | | | 519.4 | |
| 3,578.5 | | | 3,364.5 | |
| Less: unamortized debt issuance costs | (25.0) | | | (24.0) | |
| 3,553.5 | | | 3,340.5 | |
| Partially-owned subsidiaries: | | | |
Secured railcar equipment notes, net of unamortized discount of $0.3 and $— | 909.2 | | | 1,237.5 | |
| TRIP Railcar Co. term loan | 327.0 | | | — | |
| Less: unamortized debt issuance costs | (11.7) | | | (9.2) | |
| 1,224.5 | | | 1,228.3 | |
| Total non–recourse debt | 4,778.0 | | | 4,568.8 | |
| Total debt | $ | 5,176.5 | | | $ | 5,017.0 | |
Trinity Industries, Inc.
Condensed Consolidated Statements of Cash Flows
(in millions)
(unaudited)
| | | | | | | | | | | |
| Nine Months Ended
September 30, |
| 2021 | | 2020 |
| Operating activities: | | | |
| Net cash provided by operating activities – continuing operations | $ | 428.0 | | | $ | 456.8 | |
| Net cash used in operating activities – discontinued operations | (0.8) | | | (0.2) | |
| Net cash provided by operating activities | 427.2 | | | 456.6 | |
| | | |
| Investing activities: | | | |
| Proceeds from lease portfolio sales | 404.5 | | | 138.7 | |
| Proceeds from dispositions of property and other assets | 34.4 | | | 19.8 | |
Capital expenditures – leasing (net of sold lease fleet railcars owned one year or less with a net cost of $54.0 for the nine months ended September 30, 2020) | (363.9) | | | (448.8) | |
| Capital expenditures – manufacturing and other | (21.5) | | | (70.7) | |
| Acquisitions, net of cash acquired | (16.5) | | | — | |
| Proceeds from insurance recoveries | 6.5 | | | — | |
| Other | 0.1 | | | — | |
| | | |
| | | |
| Net cash provided by (used in) investing activities | 43.6 | | | (361.0) | |
| | | |
| Financing activities: | | | |
| Net proceeds from (repayments of) debt | 136.9 | | | 40.3 | |
| Shares repurchased | (406.5) | | | (120.4) | |
| Dividends paid to common shareholders | (68.5) | | | (67.8) | |
| Other | (16.0) | | | (3.4) | |
| | | |
| | | |
| Net cash used in financing activities | (354.1) | | | (151.3) | |
| Net increase (decrease) in cash, cash equivalents, and restricted cash | 116.7 | | | (55.7) | |
| Cash, cash equivalents, and restricted cash at beginning of period | 228.4 | | | 277.6 | |
| Cash, cash equivalents, and restricted cash at end of period | $ | 345.1 | | | $ | 221.9 | |
Trinity Industries, Inc.
Reconciliations of Non-GAAP Measures
(in millions, except per share amounts)
(unaudited)
Adjusted Operating Results
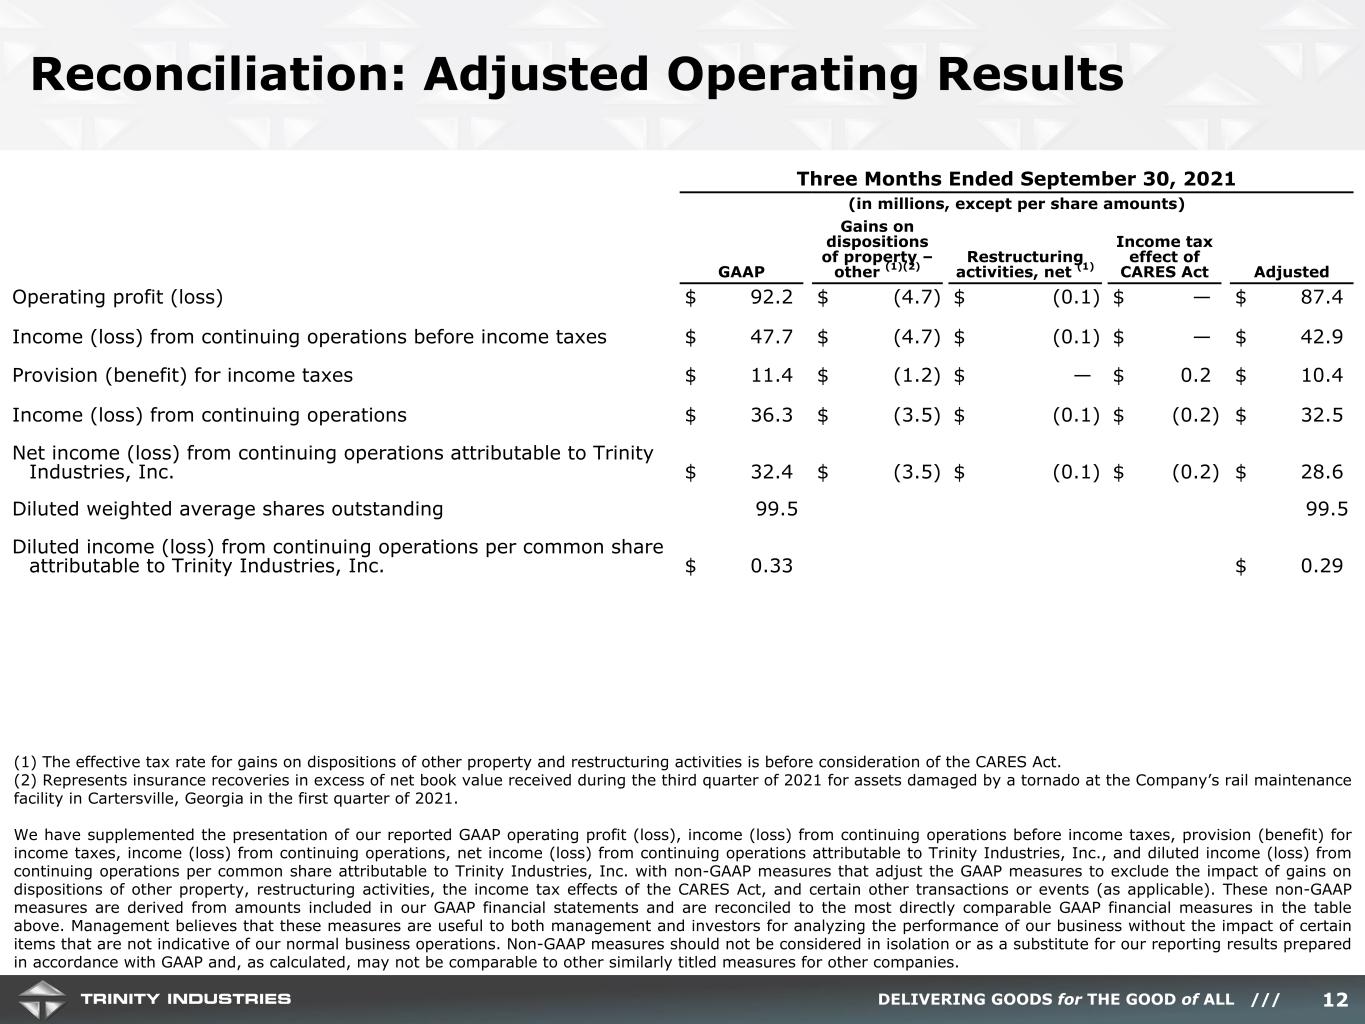
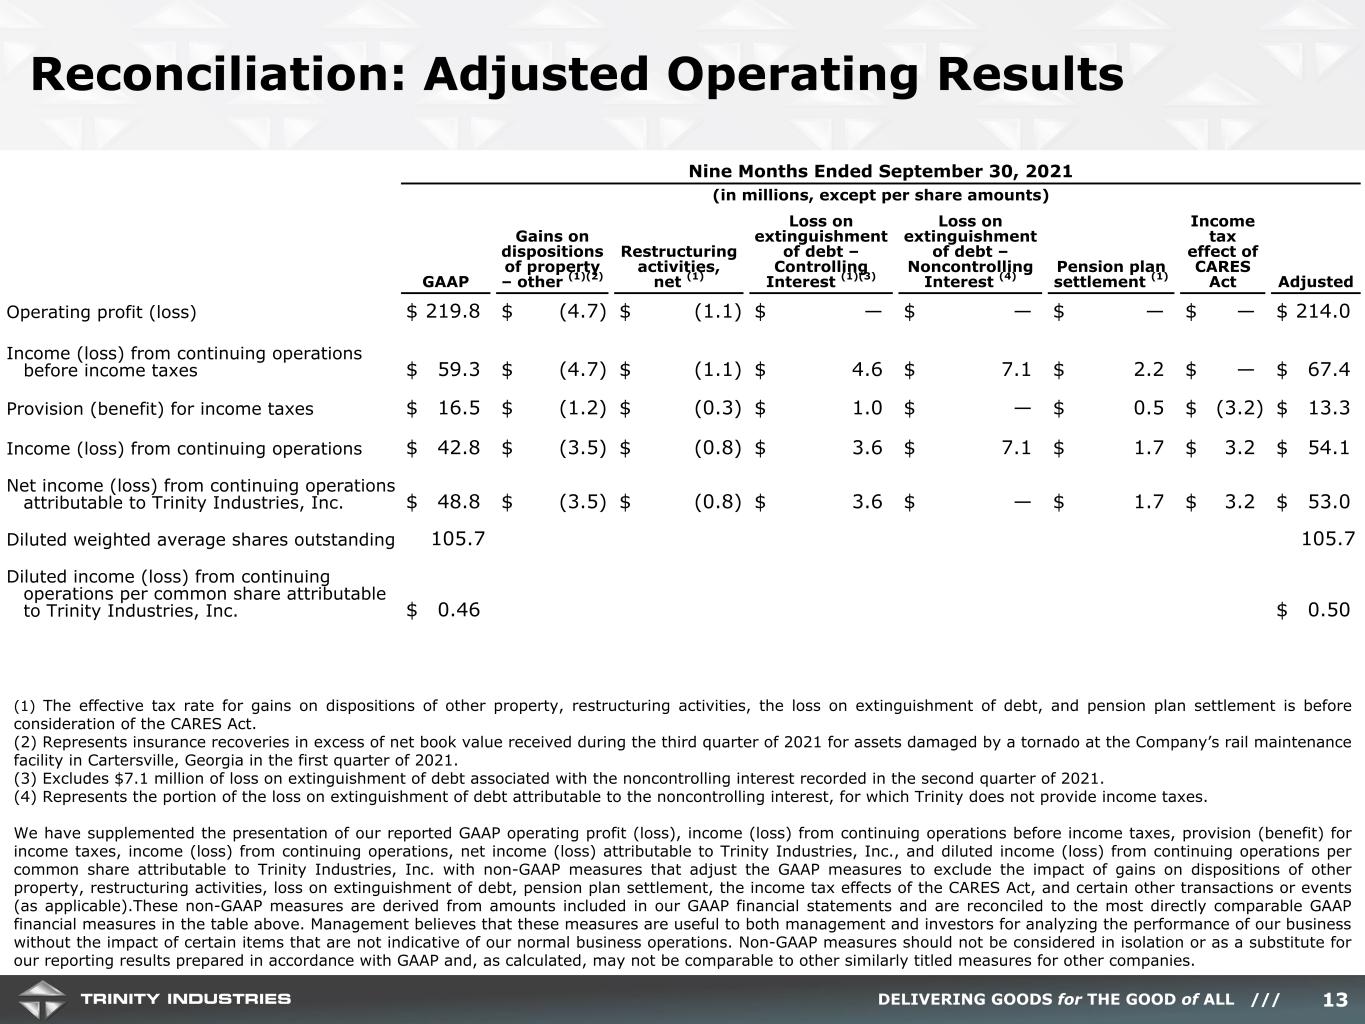
We have supplemented the presentation of our reported GAAP operating profit (loss), income (loss) from continuing operations before income taxes, provision (benefit) for income taxes, income (loss) from continuing operations, net income (loss) from continuing operations attributable to Trinity Industries, Inc., and diluted income (loss) from continuing operations per common share attributable to Trinity Industries, Inc. with non-GAAP measures that adjust the GAAP measures to exclude the impact of gains on dispositions of other property, impairment of long-lived assets, restructuring activities, loss on extinguishment of debt, pension plan settlement, the income tax effects of the CARES Act, and certain other transactions or events (as applicable). These non-GAAP measures are derived from amounts included in our GAAP financial statements and are reconciled to the most directly comparable GAAP financial measures in the tables below. Management believes that these measures are useful to both management and investors for analyzing the performance of our business without the impact of certain items that are not indicative of our normal business operations. Non-GAAP measures should not be considered in isolation or as a substitute for our reporting results prepared in accordance with GAAP and, as calculated, may not be comparable to other similarly titled measures for other companies.
| | | | | | | | | | | | | | | | | | | | | | | | | | | | | | | | | |
| Three Months Ended September 30, 2021 |
| GAAP | | | | Gains on dispositions of property – other (1)(2) | | Restructuring activities, net (1) | | | | Income tax effect of CARES Act | | Adjusted |
| Operating profit (loss) | $ | 92.2 | | | | | $ | (4.7) | | | $ | (0.1) | | | | | $ | — | | | $ | 87.4 | |
| | | | | | | | | | | | | |
| | | | | | | | | | | | | |
| | | | | | | | | | | | | |
| Income (loss) from continuing operations before income taxes | $ | 47.7 | | | | | $ | (4.7) | | | $ | (0.1) | | | | | $ | — | | | $ | 42.9 | |
| | | | | | | | | | | | | |
| Provision (benefit) for income taxes | $ | 11.4 | | | | | $ | (1.2) | | | $ | — | | | | | $ | 0.2 | | | $ | 10.4 | |
| | | | | | | | | | | | | |
| Income (loss) from continuing operations | $ | 36.3 | | | | | $ | (3.5) | | | $ | (0.1) | | | | | $ | (0.2) | | | $ | 32.5 | |
| | | | | | | | | | | | | |
| Net income (loss) from continuing operations attributable to Trinity Industries, Inc. | $ | 32.4 | | | | | $ | (3.5) | | | $ | (0.1) | | | | | $ | (0.2) | | | $ | 28.6 | |
| | | | | | | | | | | | | |
| Diluted weighted average shares outstanding | 99.5 | | | | | | | | | | | | 99.5 |
| | | | | | | | | | | | | |
| Diluted income (loss) from continuing operations per common share attributable to Trinity Industries, Inc. | $ | 0.33 | | | | | | | | | | | | | $ | 0.29 | |
| | | | | | | | | | | | | | | | | | | | | | | | | | | |
| Three Months Ended September 30, 2020 |
| GAAP | | | | | | Restructuring activities, net (1) | | Income tax effect of CARES Act | | Adjusted |
| Operating profit (loss) | $ | 72.9 | | | | | | | $ | 4.7 | | | $ | — | | | $ | 77.6 | |
| | | | | | | | | | | |
| Income (loss) from continuing operations before income taxes | $ | 19.2 | | | | | | | $ | 4.7 | | | $ | — | | | $ | 23.9 | |
| | | | | | | | | | | |
| Provision (benefit) for income taxes | $ | (6.7) | | | | | | | $ | 1.1 | | | $ | 8.6 | | | $ | 3.0 | |
| | | | | | | | | | | |
| Income (loss) from continuing operations | $ | 25.9 | | | | | | | $ | 3.6 | | | $ | (8.6) | | | $ | 20.9 | |
| | | | | | | | | | | |
| Net income (loss) from continuing operations attributable to Trinity Industries, Inc. | $ | 25.1 | | | | | | | $ | 3.6 | | | $ | (8.6) | | | $ | 20.1 | |
| | | | | | | | | | | |
| Diluted weighted average shares outstanding | 117.0 | | | | | | | | | | 117.0 |
| | | | | | | | | | | |
| Diluted income (loss) from continuing operations per common share attributable to Trinity Industries, Inc. | $ | 0.21 | | | | | | | | | | | $ | 0.17 | |
| | | | | | | | | | | | | | | | | | | | | | | | | | | | | | | | | | | | | | | | | | | | | | | |
| Nine Months Ended September 30, 2021 |
| GAAP | | Gains on dispositions of property – other (1)(2) | | Restructuring activities, net (1) | | Loss on extinguishment of debt – Controlling Interest (1)(3) | | Loss on extinguishment of debt – Noncontrolling Interest (4) | | Pension plan settlement (1) | | Income tax effect of CARES Act | | Adjusted |
| Operating profit (loss) | $ | 219.8 | | | $ | (4.7) | | | $ | (1.1) | | | $ | — | | | $ | — | | | $ | — | | | $ | — | | | $ | 214.0 | |
| | | | | | | | | | | | | | | |
| | | | | | | | | | | | | | | |
| | | | | | | | | | | | | | | |
| | | | | | | | | | | | | | | |
| | | | | | | | | | | | | | | |
| Income (loss) from continuing operations before income taxes | $ | 59.3 | | | $ | (4.7) | | | $ | (1.1) | | | $ | 4.6 | | | $ | 7.1 | | | $ | 2.2 | | | $ | — | | | $ | 67.4 | |
| | | | | | | | | | | | | | | |
| Provision (benefit) for income taxes | $ | 16.5 | | | $ | (1.2) | | | $ | (0.3) | | | $ | 1.0 | | | $ | — | | | $ | 0.5 | | | $ | (3.2) | | | $ | 13.3 | |
| | | | | | | | | | | | | | | |
| Income (loss) from continuing operations | $ | 42.8 | | | $ | (3.5) | | | $ | (0.8) | | | $ | 3.6 | | | $ | 7.1 | | | $ | 1.7 | | | $ | 3.2 | | | $ | 54.1 | |
| | | | | | | | | | | | | | | |
| Net income (loss) from continuing operations attributable to Trinity Industries, Inc. | $ | 48.8 | | | $ | (3.5) | | | $ | (0.8) | | | $ | 3.6 | | | $ | — | | | $ | 1.7 | | | $ | 3.2 | | | $ | 53.0 | |
| | | | | | | | | | | | | | | |
| Diluted weighted average shares outstanding | 105.7 | | | | | | | | | | | | | | 105.7 |
| | | | | | | | | | | | | | | |
Diluted income (loss) from continuing operations per common share attributable to Trinity Industries, Inc. | $ | 0.46 | | | | | | | | | | | | | | | $ | 0.50 | |
| | | | | | | | | | | | | | | | | | | | | | | | | | | | | | | | | | | | | | | | | | | |
| Nine Months Ended September 30, 2020 |
| GAAP | | Impairment of long-lived assets – Controlling Interest (1)(5) | | Impairment of long-lived assets – Noncontrolling Interest (4) | | | | Restructuring activities, net (1) | | Loss on extinguishment of debt (1) | | Income tax effect of CARES Act | | Adjusted |
| Operating profit (loss) | $ | (161.4) | | | $ | 288.1 | | | $ | 81.3 | | | | | $ | 10.5 | | | $ | — | | | $ | — | | | $ | 218.5 | |
| | | | | | | | | | | | | | | |
| Income (loss) from continuing operations before income taxes | $ | (325.5) | | | $ | 288.1 | | | $ | 81.3 | | | | | $ | 10.5 | | | $ | 5.0 | | | $ | — | | | $ | 59.4 | |
| | | | | | | | | | | | | | | |
| Provision (benefit) for income taxes | $ | (226.1) | | | $ | 67.4 | | | $ | — | | | | | $ | 2.5 | | | $ | 1.2 | | | $ | 174.6 | | | $ | 19.6 | |
| | | | | | | | | | | | | | | |
| Income (loss) from continuing operations | $ | (99.4) | | | $ | 220.7 | | | $ | 81.3 | | | | | $ | 8.0 | | | $ | 3.8 | | | $ | (174.6) | | | $ | 39.8 | |
| | | | | | | | | | | | | | | |
| Net income (loss) from continuing operations attributable to Trinity Industries, Inc. | $ | (19.9) | | | $ | 220.7 | | | $ | — | | | | | $ | 8.0 | | | $ | 3.8 | | | $ | (174.6) | | | $ | 38.0 | |
| | | | | | | | | | | | | | | |
Diluted weighted average shares outstanding (6) | 117.2 | | | | | | | | | | | | | | 118.4 |
| | | | | | | | | | | | | | | |
Diluted income (loss) from continuing operations per common share attributable to Trinity Industries, Inc. | $ | (0.17) | | | | | | | | | | | | | | | $ | 0.32 | |
(1) The effective tax rate for gains on dispositions of other property, impairment of long-lived assets, restructuring activities, the loss on extinguishment of debt, and pension plan settlement is before consideration of the CARES Act.
(2) Represents insurance recoveries in excess of net book value received during the third quarter of 2021 for assets damaged by a tornado at the Company’s rail maintenance facility in Cartersville, Georgia in the first quarter of 2021.
(3) Excludes $7.1 million of loss on extinguishment of debt associated with the noncontrolling interest recorded in the second quarter of 2021.
(4) Represents the portion of the non-cash impairment of long-lived asset charge and the loss on extinguishment of debt attributable to the noncontrolling interest, for which Trinity does not provide income taxes.
(5) Excludes $81.3 million of non-cash impairment of long-lived asset charges associated with the noncontrolling interest recorded in the second quarter of 2020.
(6) GAAP diluted weighted average shares outstanding excludes 1.2 million shares for the nine months ended September 30, 2020 since the Company was in a net loss position for the period. When adjusting for the items above, these shares become dilutive.
Free Cash Flow
Total Free Cash Flow After Investments and Dividends ("Free Cash Flow") is a non-GAAP financial measure. The change in presentation of sales of railcars from the lease fleet, which was effected on a prospective basis beginning in the fourth quarter of 2020, had no effect on our previously reported Free Cash Flow.
We believe Free Cash Flow is useful to both management and investors as it provides a relevant measure of liquidity and a useful basis for assessing our ability to fund our operations and repay our debt. Free Cash Flow is reconciled to net cash provided by operating activities from continuing operations, the most directly comparable GAAP financial measure, in the following tables.
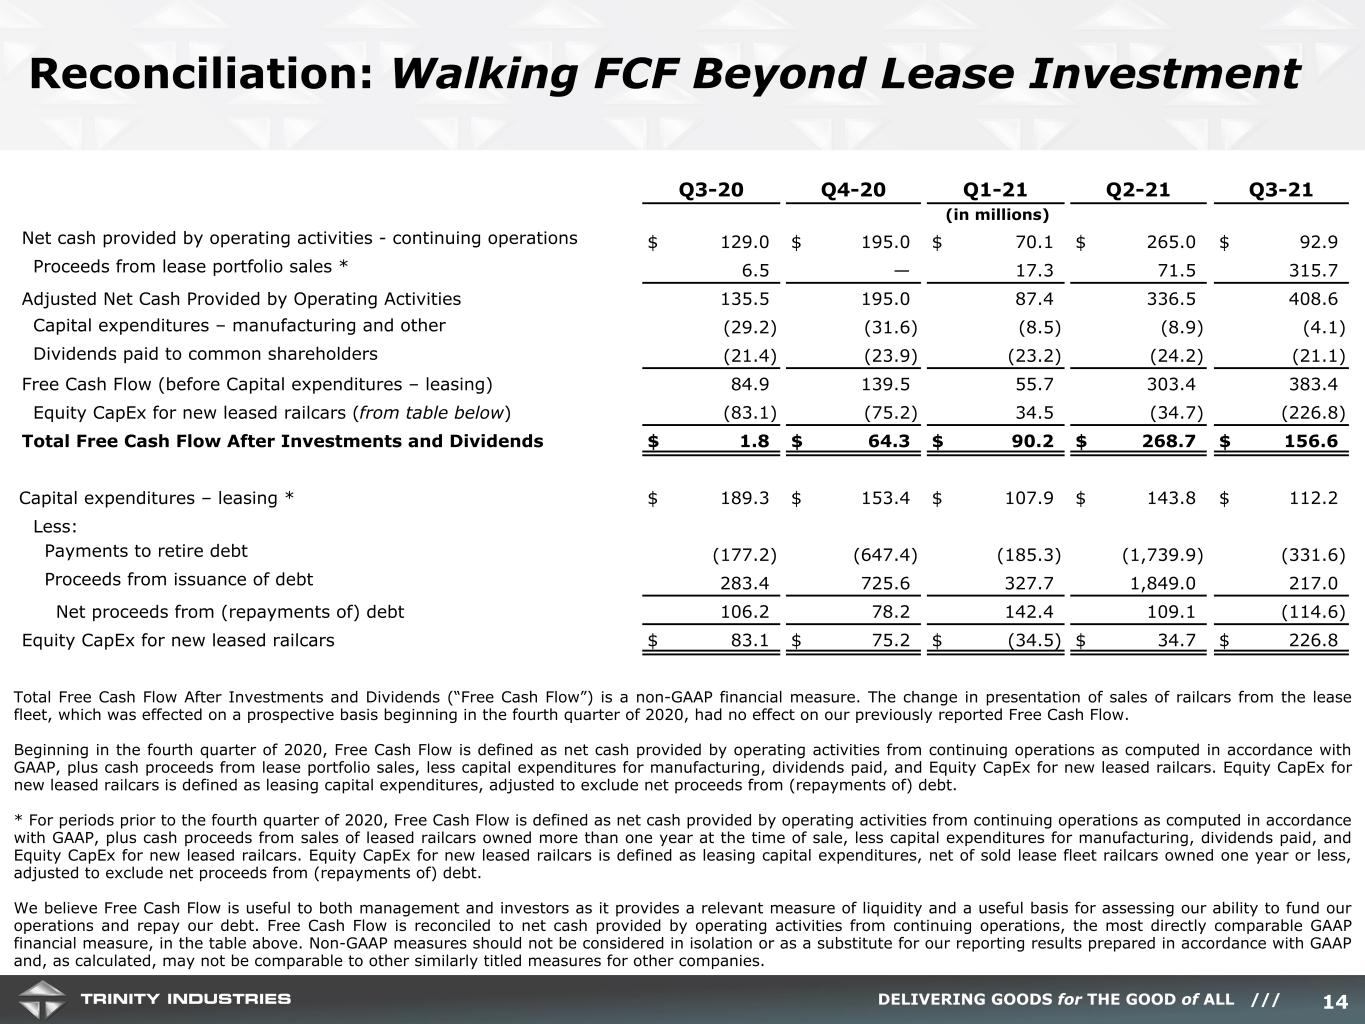
For the nine months ended September 30, 2021, Free Cash Flow is defined as net cash provided by operating activities from continuing operations as computed in accordance with GAAP, plus cash proceeds from lease portfolio sales, less capital expenditures for manufacturing, dividends paid, and Equity CapEx for new leased railcars. Equity CapEx for new leased railcars is defined as leasing capital expenditures, adjusted to exclude net proceeds from (repayments of) debt.
| | | | | |
| Nine Months Ended September 30, 2021 |
| (in millions) |
| Net cash provided by operating activities – continuing operations | $ | 428.0 | |
| Proceeds from lease portfolio sales | 404.5 | |
| Adjusted Net Cash Provided by Operating Activities | 832.5 | |
| Capital expenditures – manufacturing and other | (21.5) | |
| Dividends paid to common stockholders | (68.5) | |
Free Cash Flow (before Capital expenditures – leasing) | 742.5 | |
| Equity CapEx for new leased railcars | (227.0) | |
| Total Free Cash Flow After Investments and Dividends | $ | 515.5 | |
| |
| Capital expenditures – leasing | $ | 363.9 | |
| Less: | |
| Payments to retire debt | (2,256.8) | |
| Proceeds from issuance of debt | 2,393.7 | |
| Net proceeds from (repayments of) debt | 136.9 | |
| Equity CapEx for new leased railcars | $ | 227.0 | |
For the nine months ended September 30, 2020, Free Cash Flow is defined as net cash provided by operating activities from continuing operations as computed in accordance with GAAP, plus cash proceeds from sales of leased railcars owned more than one year at the time of sale, less capital expenditures for manufacturing, dividends paid, and Equity CapEx for new leased railcars. Equity CapEx for new leased railcars is defined as leasing capital expenditures, net of sold lease fleet railcars owned one year or less, adjusted to exclude net proceeds from (repayments of) debt.
| | | | | |
| Nine Months Ended September 30, 2020 |
| (in millions) |
| Net cash provided by operating activities – continuing operations | $ | 456.8 | |
| Proceeds from railcar lease fleet sales owned more than one year at the time of sale | 138.7 | |
| Adjusted Net Cash Provided by Operating Activities | 595.5 | |
| Capital expenditures – manufacturing and other | (70.7) | |
| Dividends paid to common stockholders | (67.8) | |
Free Cash Flow (before Capital expenditures – leasing) | 457.0 | |
| Equity CapEx for new leased railcars | (408.5) | |
| Total Free Cash Flow After Investments and Dividends | $ | 48.5 | |
| |
Capital expenditures – leasing, net of sold lease fleet railcars owned one year or less of $54.0 | $ | 448.8 | |
| Less: | |
| Payments to retire debt | (795.5) | |
| Proceeds from issuance of debt | 835.8 | |
| Net proceeds from (repayments of) debt | 40.3 | |
| Equity CapEx for new leased railcars | $ | 408.5 | |
EBITDA and Adjusted EBITDA
“EBITDA” is defined as income (loss) from continuing operations plus interest expense, income taxes, and depreciation and amortization expense. Adjusted EBITDA is defined as EBITDA plus gains on dispositions of other property, non-cash impairment of long-lived assets, restructuring activities, loss on extinguishment of debt, and pension plan settlement. EBITDA and Adjusted EBITDA are non-GAAP financial measures; however, the amounts included in these calculations are derived from amounts included in our GAAP financial statements. EBITDA and Adjusted EBITDA are reconciled to net income (loss), the most directly comparable GAAP financial measure, in the following table. This information is provided to assist management and investors in making meaningful comparisons of our operating performance between periods. We believe EBITDA is a useful measure for analyzing the performance of our business. We also believe that EBITDA is commonly reported and widely used by investors and other interested parties as a measure of a company’s operating performance and debt servicing ability because it assists in comparing performance on a consistent basis without regard to capital structure, depreciation or amortization (which can vary significantly depending on many factors). EBITDA and Adjusted EBITDA should not be considered as alternatives to net income as indicators of our operating performance, or as alternatives to operating cash flows as measures of liquidity. Non-GAAP measures should not be considered in isolation or as a substitute for our reporting results prepared in accordance with GAAP and, as calculated, may not be comparable to other similarly titled measures for other companies.
| | | | | | | | | | | | | | | | | | | | | | | |
| Three Months Ended
September 30, | | Nine Months Ended
September 30, |
| 2021 | | 2020 | | 2021 | | 2020 |
| Net income (loss) | $ | 35.9 | | | $ | 25.9 | | | $ | 42.0 | | | $ | (99.6) | |
| Less: Loss from discontinued operations, net of income taxes | (0.4) | | | — | | | (0.8) | | | (0.2) | |
| Income (loss) from continuing operations | $ | 36.3 | | | $ | 25.9 | | | $ | 42.8 | | | $ | (99.4) | |
| Interest expense | 45.3 | | | 52.3 | | | 147.8 | | | 161.6 | |
| Provision (benefit) for income taxes | 11.4 | | | (6.7) | | | 16.5 | | | (226.1) | |
| Depreciation and amortization expense | 70.6 | | | 64.9 | | | 206.3 | | | 199.5 | |
EBITDA | $ | 163.6 | | | $ | 136.4 | | | $ | 413.4 | | | $ | 35.6 | |
| Gains on dispositions of property – other | (4.7) | | | — | | | (4.7) | | | — | |
| Impairment of long-lived assets | — | | | — | | | — | | | 369.4 | |
| Restructuring activities, net | (0.1) | | | 4.7 | | | (1.1) | | | 10.5 | |
| Loss on extinguishment of debt | — | | | — | | | 11.7 | | | 5.0 | |
| Pension plan settlement | — | | | — | | | 2.2 | | | — | |
| Adjusted EBITDA | $ | 158.8 | | | $ | 141.1 | | | $ | 421.5 | | | $ | 420.5 | |
Exhibit 99.2
Trinity Industries, Inc.
Earnings Release Conference Call – Q3 2021
October 21, 2021
Leigh Anne Mann
Vice President, Investor Relations
Thank you, Eilee. Good morning everyone. We appreciate you joining us for the Company’s third quarter 2021 financial results conference call.
Our prepared remarks will include comments from Jean Savage, Trinity’s Chief Executive Officer and President, and Eric Marchetto, the Company’s Chief Financial Officer. We will hold a Q&A session following the prepared remarks from our leaders.
During the call today, we will reference slides highlighting key points of discussion, as well as certain non-GAAP financial metrics. The reconciliations of the non-GAAP metrics to comparable GAAP measures are provided in the appendix of our supplemental slides. The supplemental materials are accessible on our IR website at www.trin.net. These slides can be found under the Events and Presentations portion of the website, along with the Third Quarter Earnings Conference Call event link.
It is now my pleasure to turn the call over to Jean.
E. Jean Savage
Chief Executive Officer and President
Thank you, Leigh Anne, and welcome to Trinity. Good morning everyone.
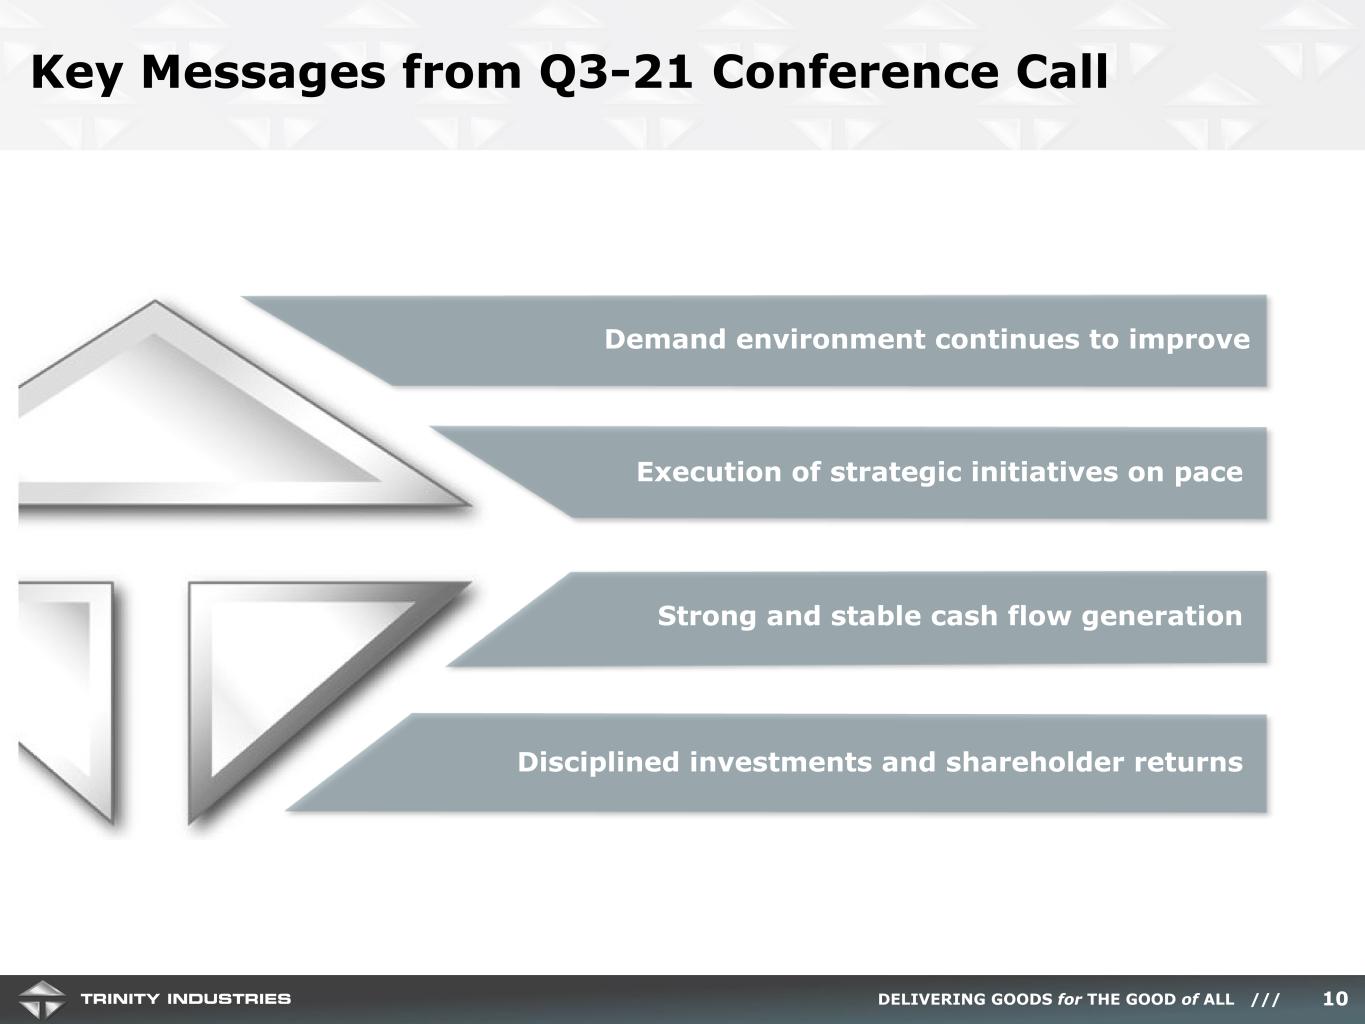
Trinity had another strong quarter on a consolidated basis and continues to make great strides to optimize returns, highlighted by our newly formed joint venture with Wafra and our new $250 million share repurchase plan, both of which Eric and I will talk about later. Overall, we remain very confident in our ability to execute and hit the targets we shared with you at our Investor Day a year ago.
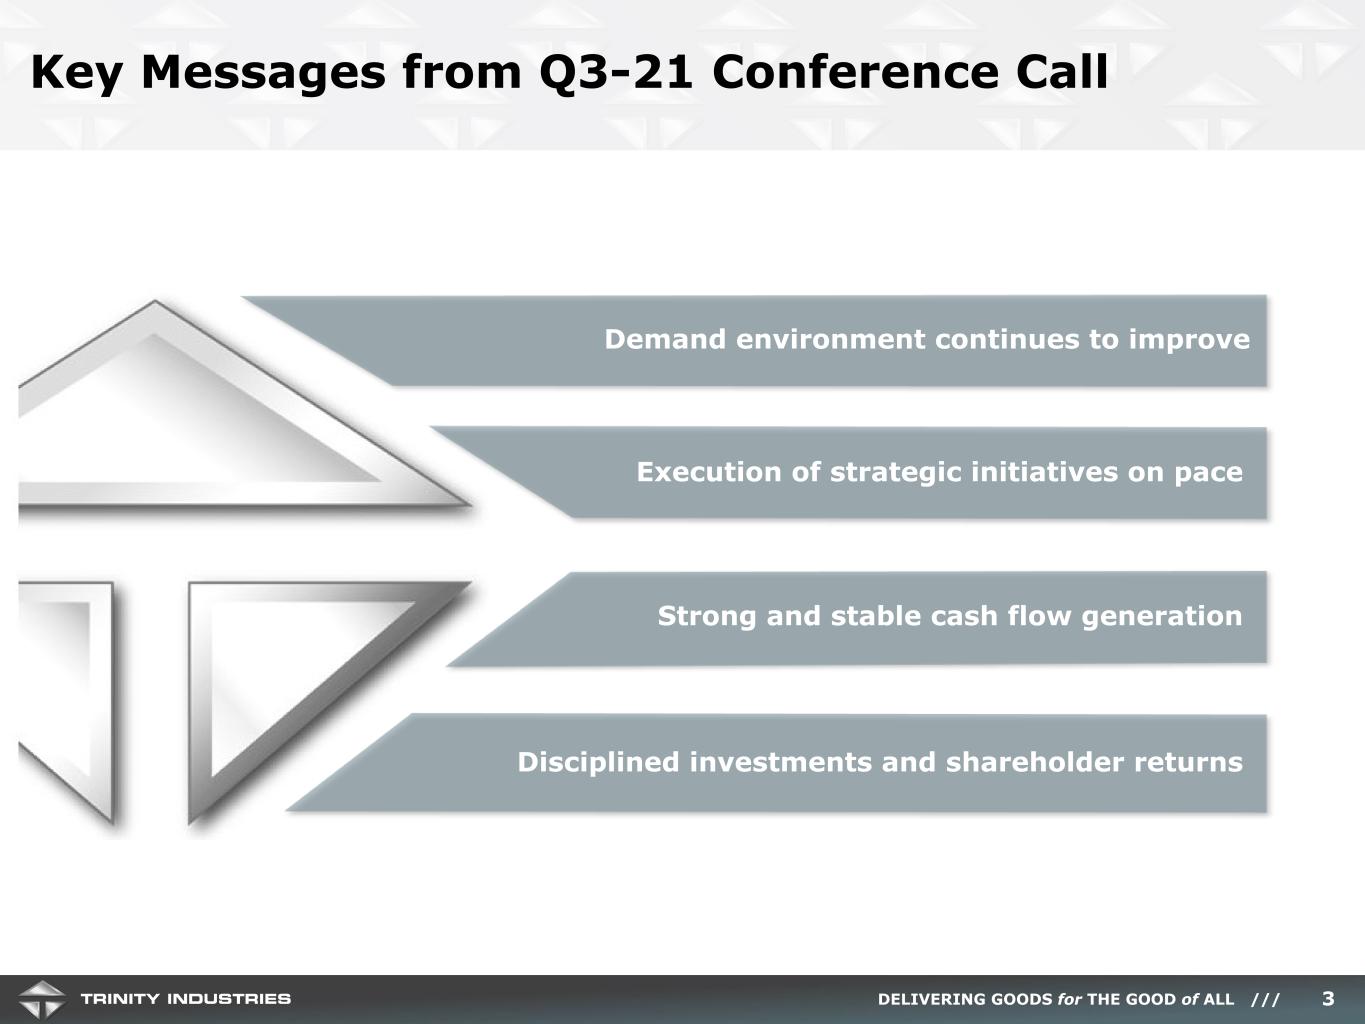
Let me summarize some key themes from our third quarter.
At the industry level, fundamentals continue to improve broadly, but unevenly. While industrial production levels have ebbed and flowed with supply chain disruptions, overall industrial production is approaching pre-pandemic levels, and strong North American economic growth is forecasted over the next few years. With these macroeconomic trends, rail carload volumes are rising from last year’s lows. At the same time, the population of railcars in storage is falling, with elevated scrapping levels
and relatively slower train speeds. From our vantage point, the improving railcar demand recovery will continue into 2022, which is very supportive for fundamentals in both of our rail-focused business lines.
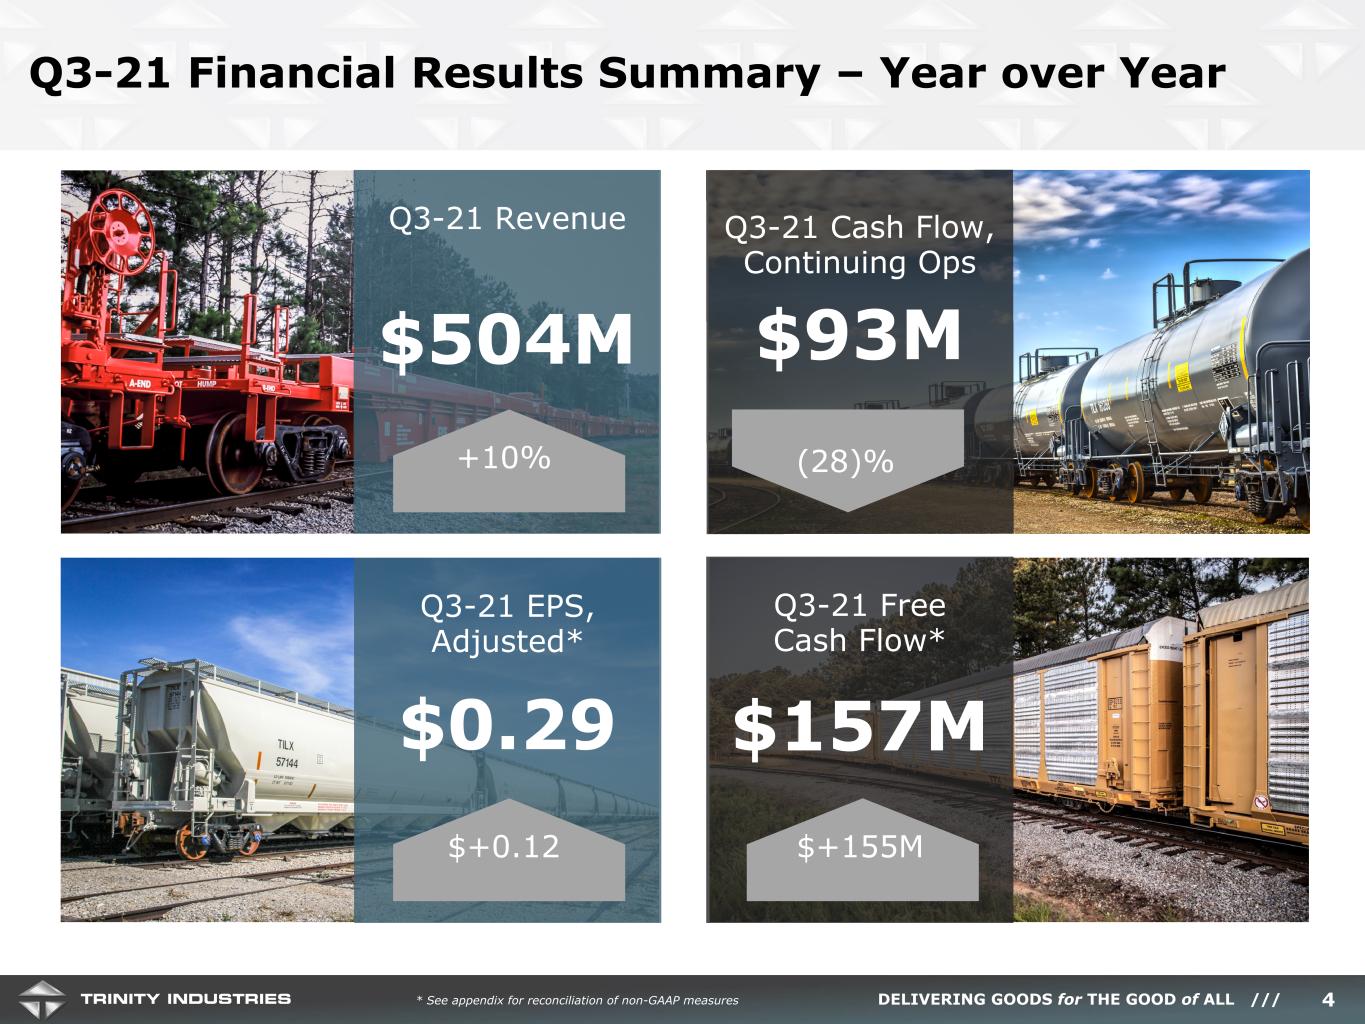
Let’s look at the impact of these trends on our consolidated results highlighted on Slide 4. In the third quarter, Trinity generated revenue of $504 million, up 10% from a year ago. Our GAAP EPS was $0.33, compared to an adjusted EPS of $0.29. We’ll detail both businesses in a few minutes, but I think it’s important to note the strength of our diversified platform.
While our Rail Products Group results may vary from quarter to quarter based on our specific orders delivered, Trinity drove solid and consistent cash flow growth in the third quarter. Cash flow from operations totaled $93 million, and Free Cash Flow, or excess cash after all investments and dividends, was $157 million. Eric will go into more detail, but the important takeaway here is that our model can drive significant value creation through stable cash flow and the return of capital to shareholders.
In summary, we remain pleased with our execution against our returns optimization initiatives and are equally excited to see continued strength in the industry fundamentals that underpin our future results.
Let’s turn to Slide 5, and we can review the railcar market as a whole.
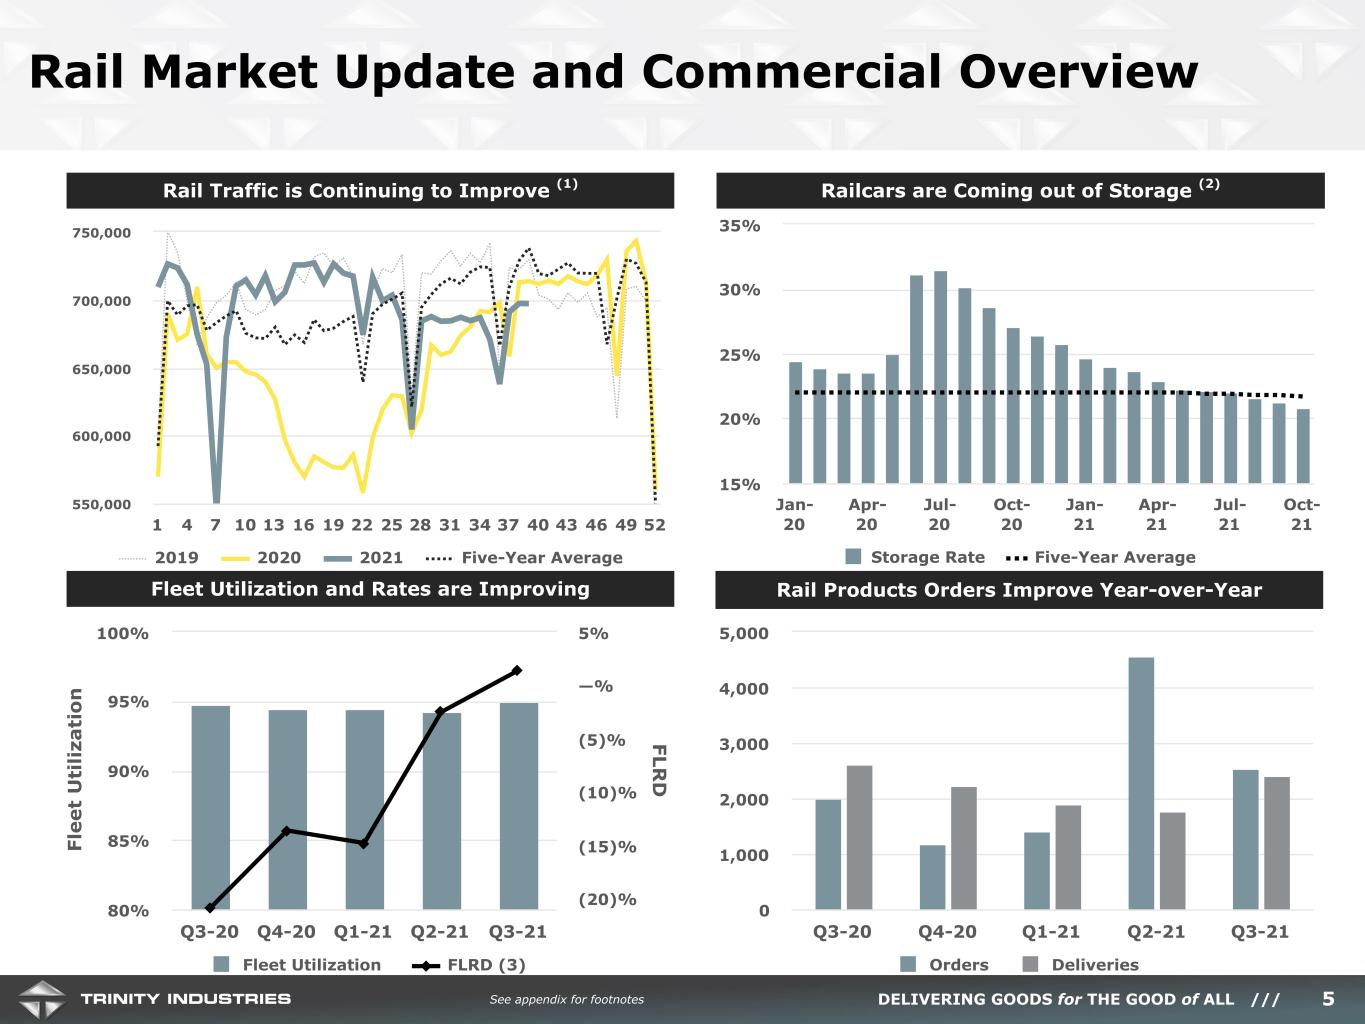
First, rail carloads and traffic continue to improve. The industry carloads are now roughly 6.5% above 2020 year to date, and we are moving closer to pre-pandemic levels last seen in 2019. Railcars in storage declined 6% compared to a quarter ago, aided by continued scrapping activity and continued deployment of idled assets in key markets, like box cars, gondolas, hoppers, and tank cars. Relative to the modest increase in carload levels, slower train speeds are also helping to drive railcar demand as the average railcar in North America is getting fewer turns.
Against that backdrop, Trinity’s fundamental Key Performance Indicators are improving as well. Our utilization improved from last quarter to 95.0%, and the Future Lease Rate Differential, which we call the FLRD, turned positive and now stands at 1.4%, compared to negative 20.9% just a year ago. Demand for new railcars has been exciting as well. In the quarter, we took orders for 2,530 new railcars, up 27% compared to a year ago. As we noted last quarter, we believe stronger underlying leasing dynamics and higher car pricing should continue to positively impact our results. And, new deliveries will likely trend in line with replacement levels in 2022 and 2023. To be clear, the trend may
not be linear each quarter, as our Rail Products segment results prove. That said, we remain very encouraged by the industry dynamics in place today.
On Slide 6, let’s turn to Trinity’s segment results for the quarter.
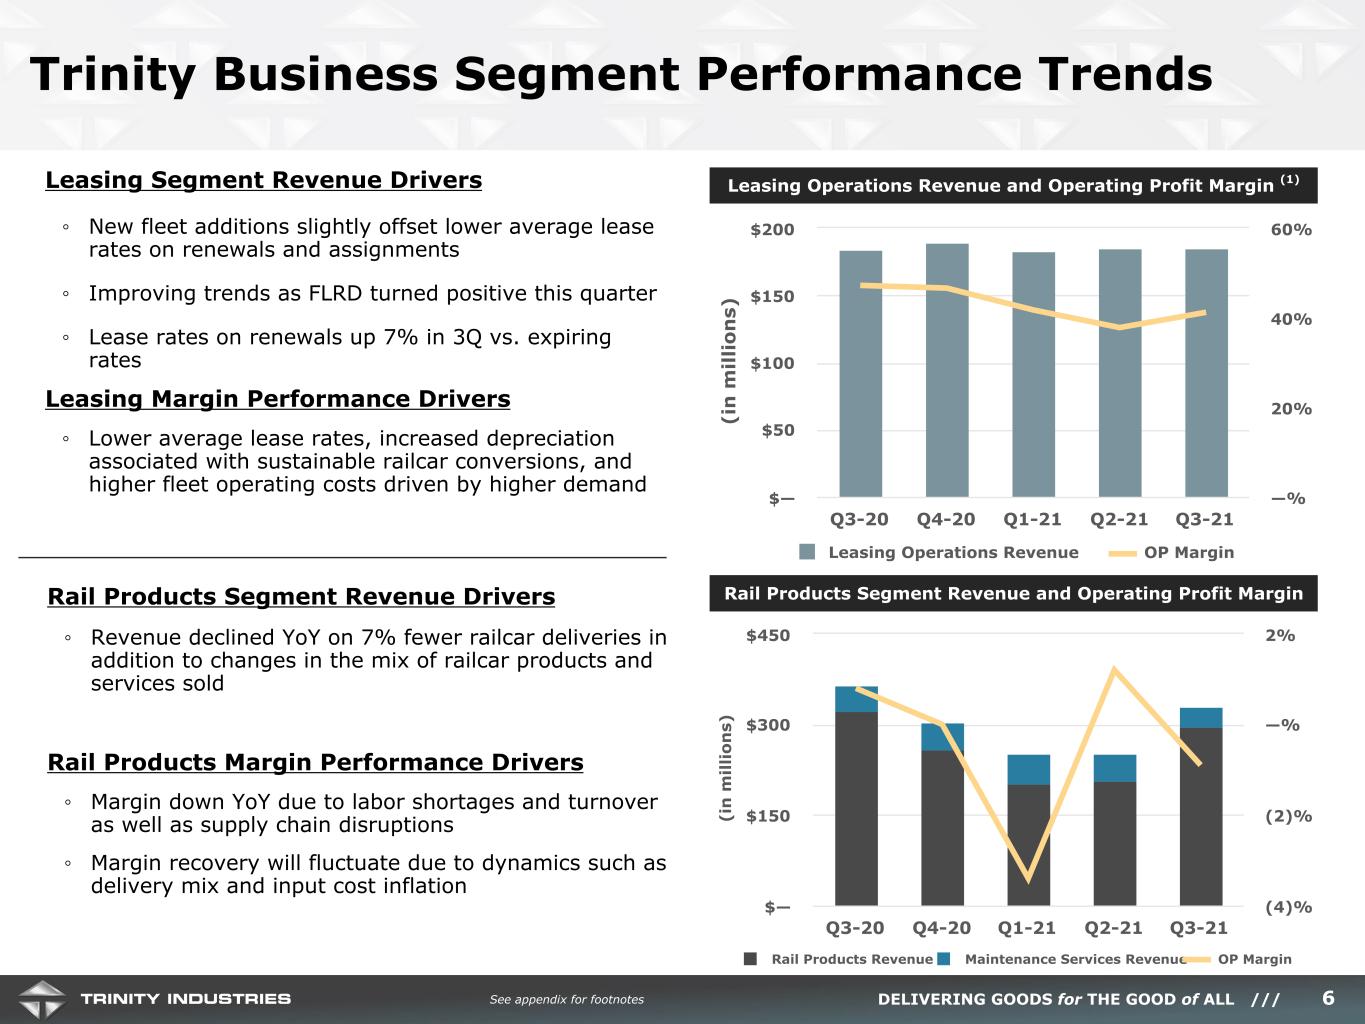
In our leasing business, revenue improved slightly compared to last quarter based on a combination of fleet growth, higher utilization rates, and increased servicer fees. Revenue growth in the quarter was also partially offset by lower average lease rates as we cycle through legacy renewals. To contextualize that impact, it’s important to note that the forward indicators for lease rates are positive. Specifically, our renewal rates in the quarter were 7% higher than expirations, and our view on overall lease rate trends remains positive as evidenced by the trend in the FLRD I mentioned earlier.
Our margins in leasing and management services were also strong, up 340 basis points compared to a quarter ago. Our leasing business benefited from higher servicer fees in the quarter, partially offset by fleet operating costs. We also had modestly higher depreciation, driven by our successful Sustainable Conversion program, which I’ll detail later in my remarks. Recall from our commentary earlier this year that we expect these expenses, required to position the lease fleet for increasing demand, will be a headwind to the leasing segment margin for the year. That said, we believe the headwind in the short-term is a good problem to have given the value being created by rising demand and the resulting long-term returns to Trinity.
Now looking at our results in the Rail Products Group, margin improvement progress year-to-date was offset by labor shortages and turnover, as well as supply chain disruptions.
Specifically, operating margins in the Rail Products Group for the quarter were a negative 0.9% compared to 1.2% last quarter. The path of the recovery in this segment will likely be less linear given quarter to quarter dynamics, like delivery mix, supply chain disruptions, and labor shortages.
That said, we remain confident based on two main indicators for the business. The first is that demand for railcars continues to rise as evidenced by utilization, lease rates, and orders in the quarter.
The second key indicator is railcar values. While higher input costs like steel can serve as a near-term headwind to our deliveries, we remain very confident that higher costs will drive higher railcar values and ultimately margins as older orders work through our pipeline.
Lastly, it’s important to note that while this quarter was challenged, Trinity continues to make significant progress on our expense optimization initiatives in the Rail Products Group.
I’ll move to Slide 7 with an update on our returns optimization initiatives. We were busy and made some great progress over the quarter.
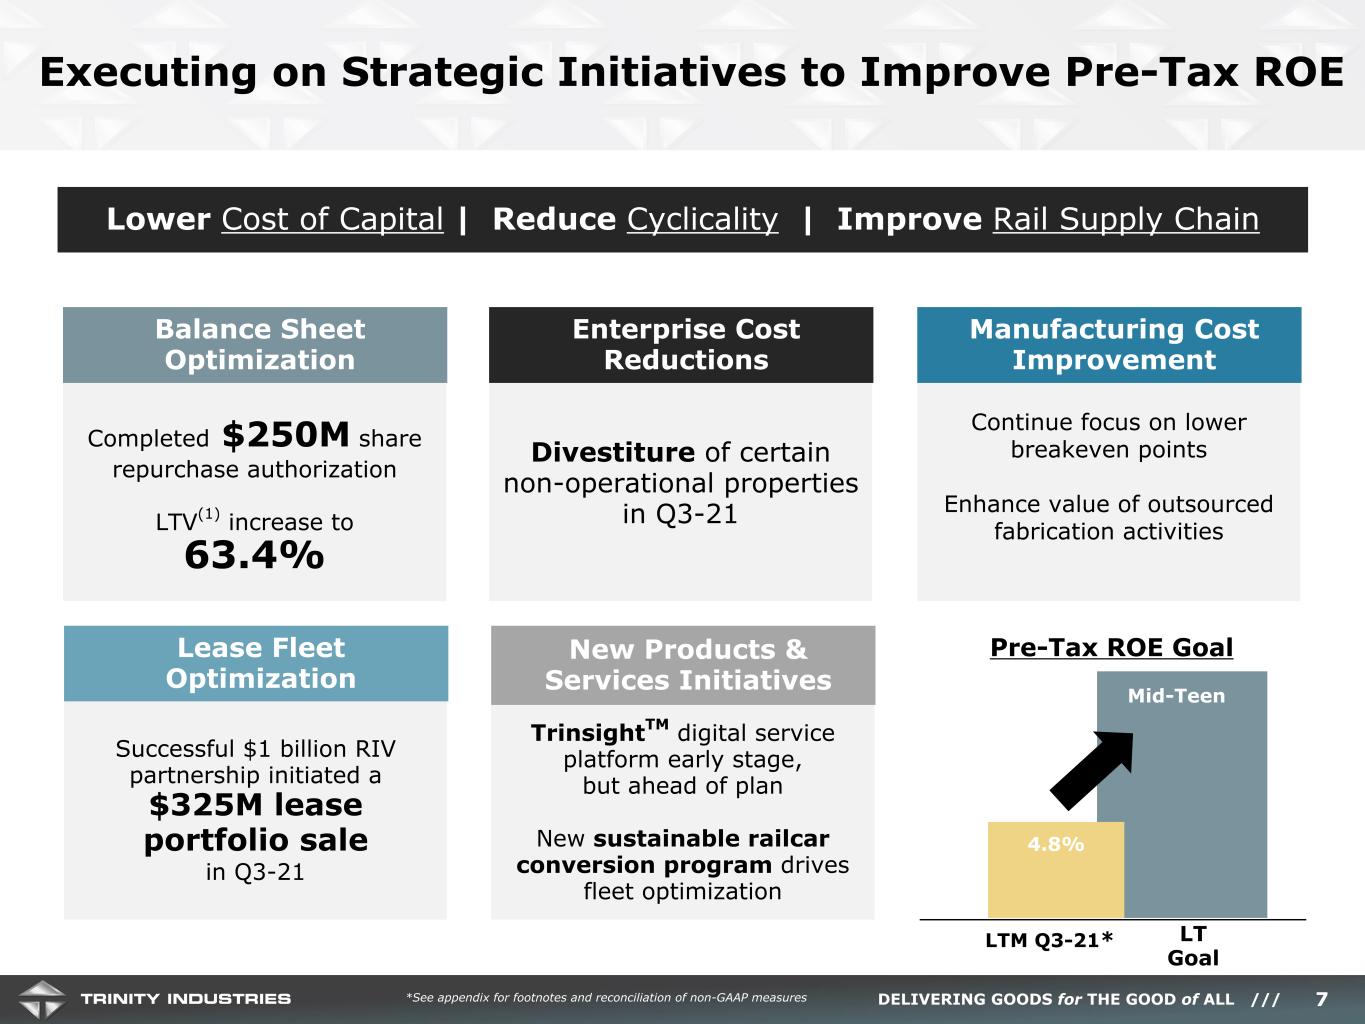
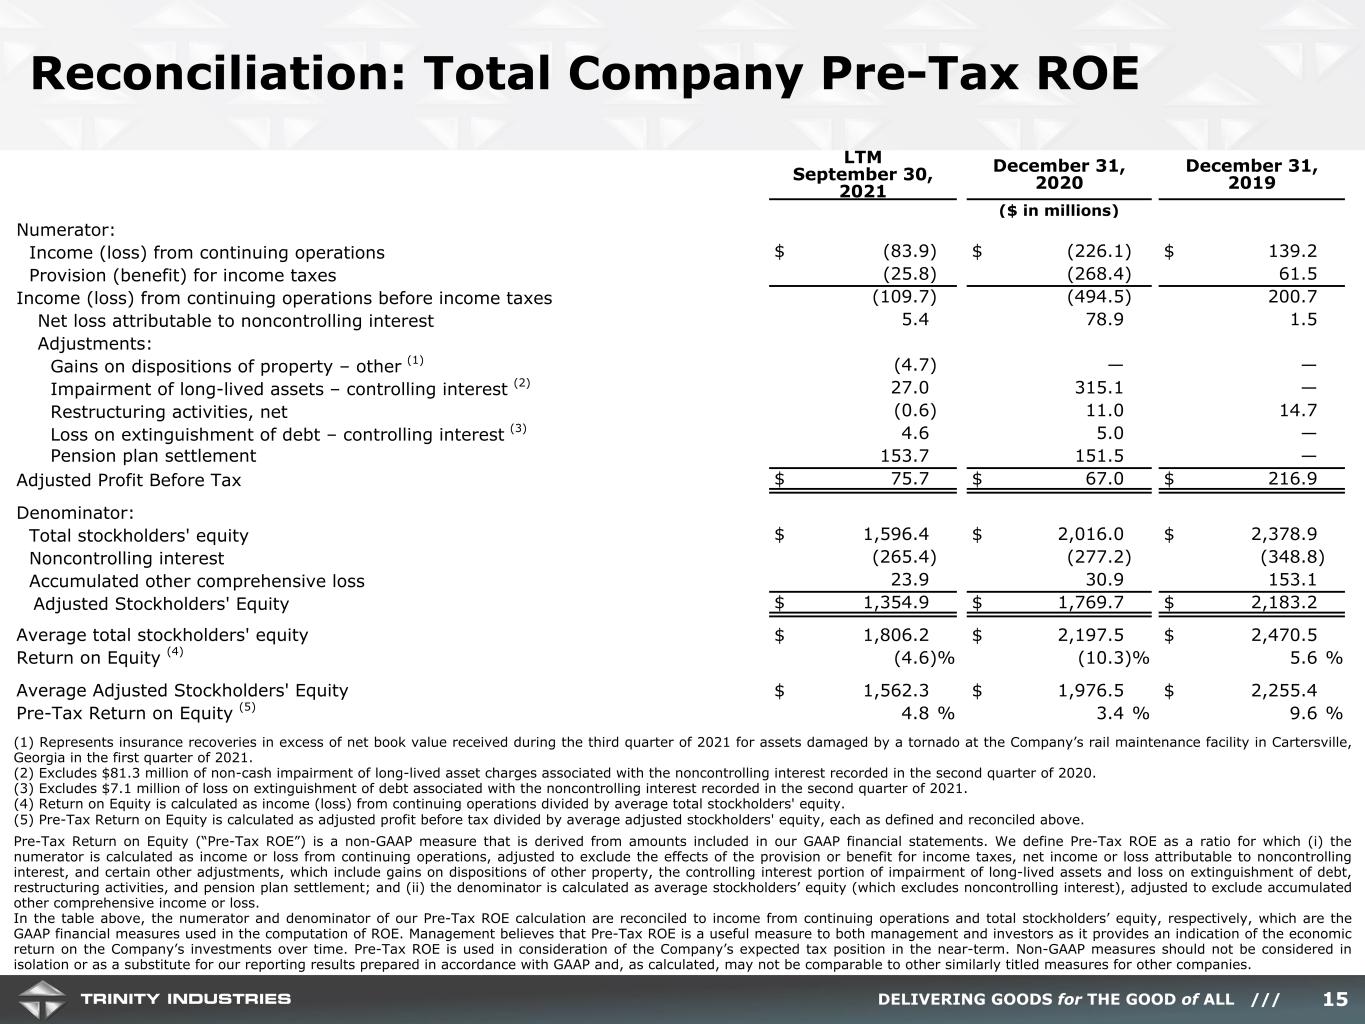
Beginning with our balance sheet, Trinity and Wafra, an institutional investor, announced a joint venture partnership that targets $1 billion of diversified railcar asset sales over the next three years. The joint venture is a significant step in our commitment to optimize Trinity’s balance sheet and drive ROE.
Trinity also renewed our commitment to return capital to shareholders with a new $250 million share repurchase authorization. In our view, shareholders benefit both from the strong free cash flow that Trinity’s portfolio generates and also as we optimize our balance sheet to help drive better returns on equity for the overall enterprise.
Touching on our enterprise cost reduction efforts, Trinity disposed of three properties in the quarter for a total of $8 million in proceeds and $3 million of gains on asset disposal.
In manufacturing, we continue to drive meaningful improvements as our lean initiatives and other cost programs have reduced the breakeven cost of producing a railcar.
Turning to our lease fleet optimization, clearly the Wafra portfolio sale was a key event, driving $325 million in proceeds. Similar to last quarter, we were also busy on the investment side as we spent $112 million in leasing capex to add to and improve our lease fleet during the quarter. Looking at the fourth quarter, we would expect the pace to slow as we onboard and optimize for the actions taken year-to-date. The key takeaway here is that fleet returns have improved both from mix and the accretive re-investment of sale proceeds. In addition to portfolio transactions, Trinity closed on a small $4 million secondary-market acquisition.
In the third quarter, our fleet improved as we doubled the volume of sustainable conversions of tank cars, which totaled 242 compared to 119 last quarter. Through the end of the third quarter, we have received orders for over 1,400 sustainable conversions, which includes a mix of tank and freight cars comprised of internal and external orders. These sustainable conversions allow us to pivot our fleet by converting or upgrading existing railcars to better meet the challenging demands of the market and to improve the yield of our fleet. This is an important piece to our fleet optimization efforts.
Lastly, to update on our new products and services, we are on pace with a number of initiatives. For Trinsight, we now have reached our 2021 goal for customers paying subscription fees for the service. Additionally, new product development will hit our full goal for 2021. In conclusion, Trinity remains very confident in the 3-year plan we outlined at our Investor Day last fall, and we still have a number
of ongoing initiatives to continue to enhance returns, especially as railcar fundamentals continue to improve into 2022 and beyond.
Before I hand the call over to Eric, I’d like to take a moment to discuss our focus on sustainability. Trinity is committed to being a market leader in promoting and enhancing the sustainable environmental benefits of rail transportation. We believe a more sustainable transportation system starts with the shift from highway to rail, as rail reduces emissions to move one ton of freight 75% as compared to on highway, leads to less congestion, and less wear on our critical infrastructure. To promote this transition, we prioritize product and service ideas, which enable shippers to improve the efficiency of their supply chains, moving more freight with fewer railcars and fewer carloads. We’ve discussed a few of our new products that fulfill this forward-thinking, more sustainable vision, including our newest grain car and Trinsight. Trinity has also put great focus in leveraging existing assets to meet new demand through our sustainable conversion program. This eliminates the needs to produce an entirely new railcar in certain markets. Earlier this year, we introduced the railcar leasing industry’s first Green Financing framework and, as of quarter end, approximately $4.3 billion of our railcar-related debt meets this designation. At our facilities, we’ve implemented a number of different programs to reduce emissions, limit water use, and recycle waste. In meeting our purpose to Deliver Goods for the Good of All, we strive to reduce our environmental impact and increase our positive impact on people.
With that, let me hand the call over to Eric for more detail on our results.
Eric R. Marchetto,
Executive Vice President and Chief Financial Officer
Thank you, Jean – and good morning everyone.
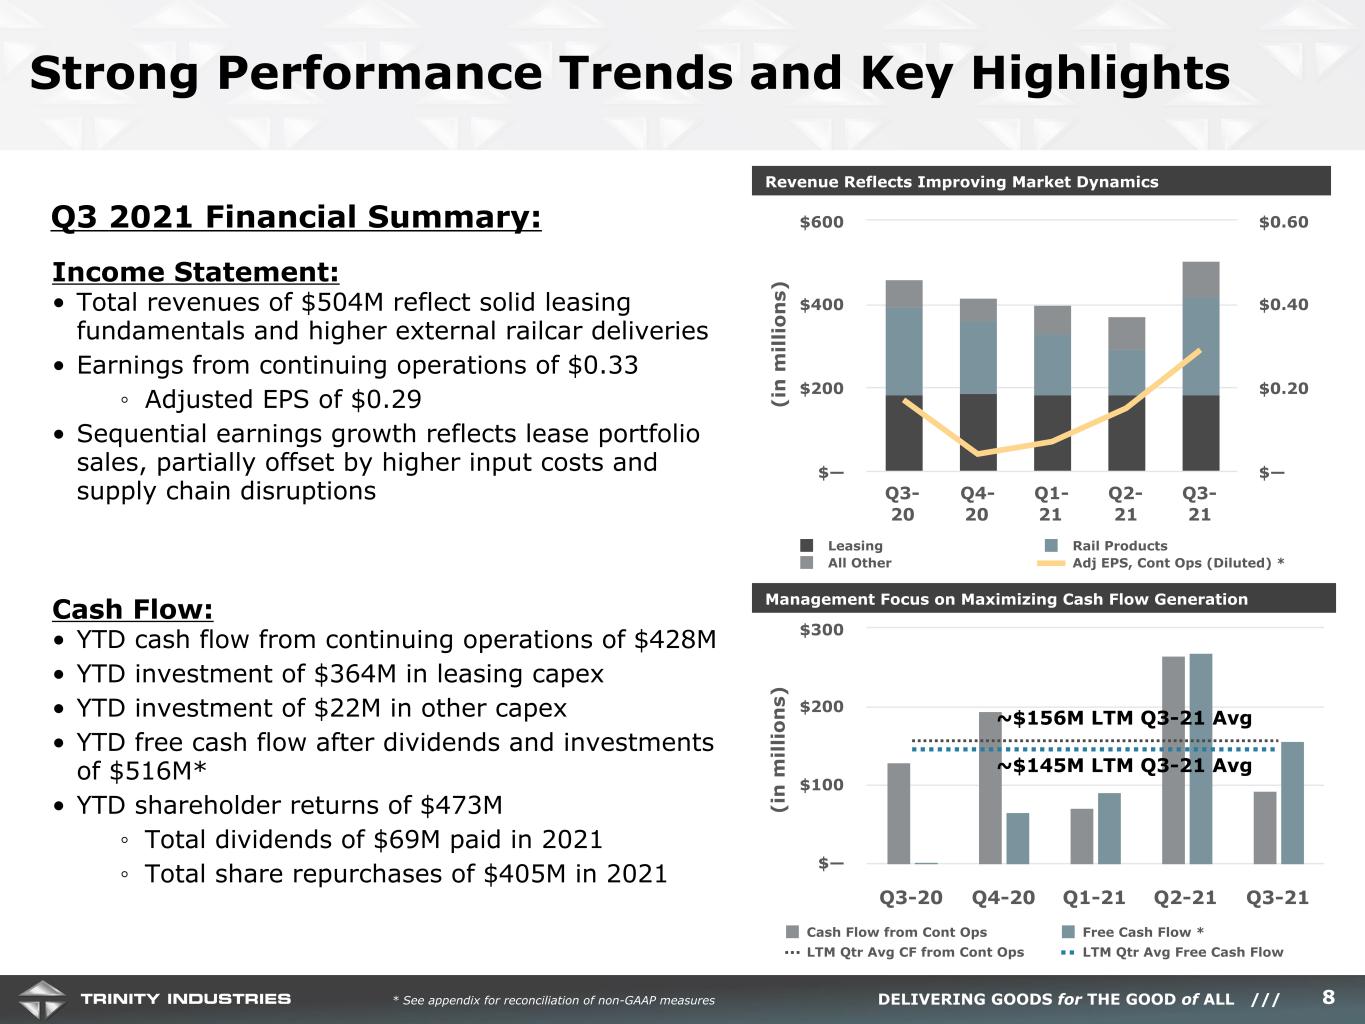
I will begin on Slide 8 with a summary of the quarter. Overall, as Jean said, Trinity continues to benefit from both the steady improvement in railcar demand and our strategic initiatives.
Starting with the income statement, third quarter consolidated revenue totaled $504 million, up nearly 10% compared to a year ago. This was driven by higher external deliveries in our Rail Products Group, as well as continued improvement in leasing fundamentals and the highway business.
Adjusted earnings per share of $0.29 grew both sequentially from $0.15 and year-over-year from $0.17, driven by a combination of better fundamentals, gains on lease portfolio sales, and our share repurchase activity. Our third quarter results were negatively impacted by accelerated depreciation
associated with our sustainable railcar conversion program. Our adjusted EPS number excludes a $0.04 benefit from insurance recoveries related to the tornado damage at our Cartersville facility.
As discussed, our joint venture portfolio sale positively impacted our third quarter earnings, with a gain of $33 million on our $325 million transaction. In this joint venture, Wafra owns 90% of the equity and Trinity owns the remaining 10%. Similar to the improvement in lease fundamentals, our new RIV transaction is another example of the broadening market for leased railcar assets.
Looking forward to next quarter, we expect our consolidated fourth quarter margins to be relatively consistent with our third quarter results, before the impact of lease portfolio sales.
Turning to the cash flow statement, year-to-date cash flow from operations totaled $428 million. Cash flow from operations in the third quarter was $93 million, which includes the collection of $41 million of our tax receivable. Our remaining tax receivable is $192 million, which is not included in our full year cash flow guidance.
Last quarter, we guided to full year cash flow from operations of $600 million to $650 million. Given the higher cost of inventory as well as working capital changes we plan to implement, we are reducing our target. Our revised guidance is a range of $450 to $475 million. This is intentional, as we are focused on strategic sourcing to mitigate inflationary pressures and protect against supply chain constraints as we increase the pace of deliveries.
In the quarter, we had a net reduction in investment for leasing of approximately $204 million, consisting of $112 million of lease fleet investments more than offset by lease portfolio sales. Year-to-date proceeds from lease portfolio sales exceeded the investment in our lease fleet by $41 million. Trinity’s net lease fleet investment for the full year is now expected to be between $40 million and $70 million as we continue to make disciplined investments at attractive returns that support our lease fleet optimization initiative.
Manufacturing capex for the quarter was $4 million, which brings our year-to-date manufacturing capex to $22 million. Our manufacturing capex for the full year is now projected to be between $30 million and $40 million.
Total Free Cash Flow after investments and dividends was $157 million in the third quarter, which brings the year-to-date total to $516 million. As Jean noted, the strength of our platform continues to drive these cash flows and allows Trinity to drive value to shareholders through the return of capital.
Year-to-date, Trinity has returned nearly half a billion dollars to shareholders, with $69 million in dividends and $405 million in share repurchases, which represents approximately 17% of our market capitalization.
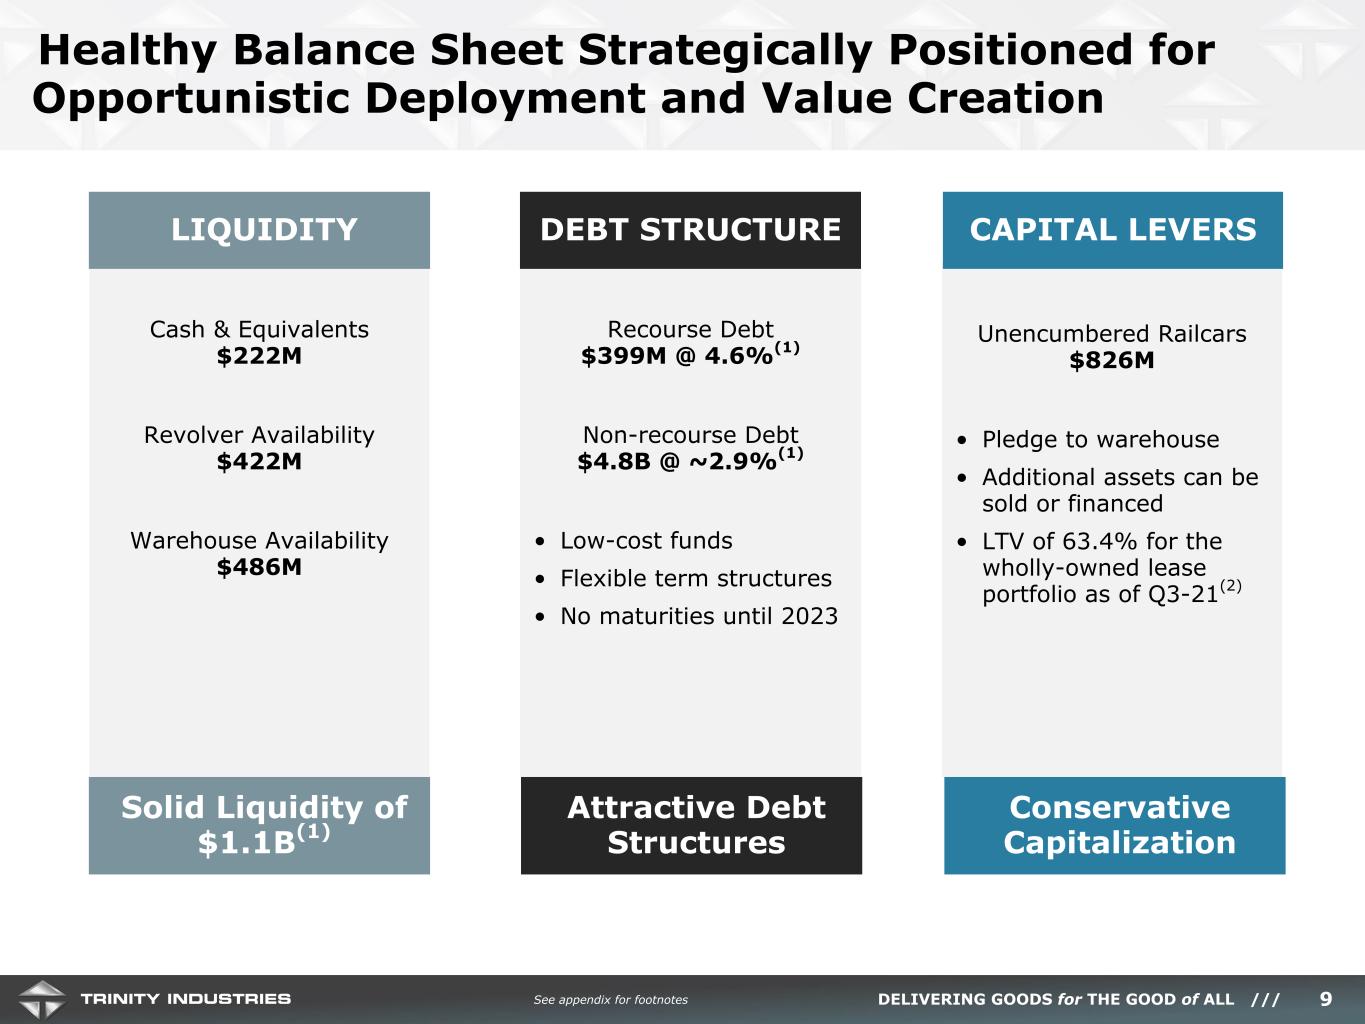
If we turn to Slide 9, let’s review our capitalization. Trinity continues to have a very strong financial position highlighted by quarter-end liquidity of $1.1 billion, even after the return of capital I just discussed. This liquidity provides flexibility as we plan to generate additional shareholder value through disciplined, returns-focused capital allocation.
Our strategy to drive returns over asset growth remains unchanged. While we expect to make investments in our lease fleet for growth, especially in markets where we can meet increasing demand, and we remain committed to the return of capital. As you can see from our actions to date, our strong cash flow affords us the ability to do both.
This quarter, we completed our previous $250 million share repurchase program and launched a new $250 million authorization that runs through 2022. We continue to optimize our balance sheet and improve our return on equity, which is a key focus of our long-term strategy.
In closing, we are progressing well against our strategic plan, and we are proud that Trinity continues to execute against our goals. While Trinity is not immune to the challenges of the current operating environment, our financial position showcases the resilience of our platform and the ability to deliver returns through the cycle. As the market recovers, we will demonstrate the power of our platform to generate attractive risk-adjusted returns.
Eilee, you may now take us to questions from our participants.
Leigh Anne Mann
Vice President, Investor Relations
Thank you, Eilee. A replay of today’s call will be available after 10:30 a.m. Eastern time through midnight on October 28th, 2021. The replay number is (877) 344-7529 with an access code of 10152033. A replay of the webcast will also be available under the Events and Presentations page on our Investor Relations website located at www.trin.net. We look forward to visiting with you again on our next conference call. Thank you for joining us this morning.