NEWS RELEASE
T. ROWE PRICE GROUP REPORTS FIRST QUARTER 2023 RESULTS
BALTIMORE (May 2, 2023) - T. Rowe Price Group, Inc. (NASDAQ-GS: TROW) today reported its results for the first quarter of 2023.
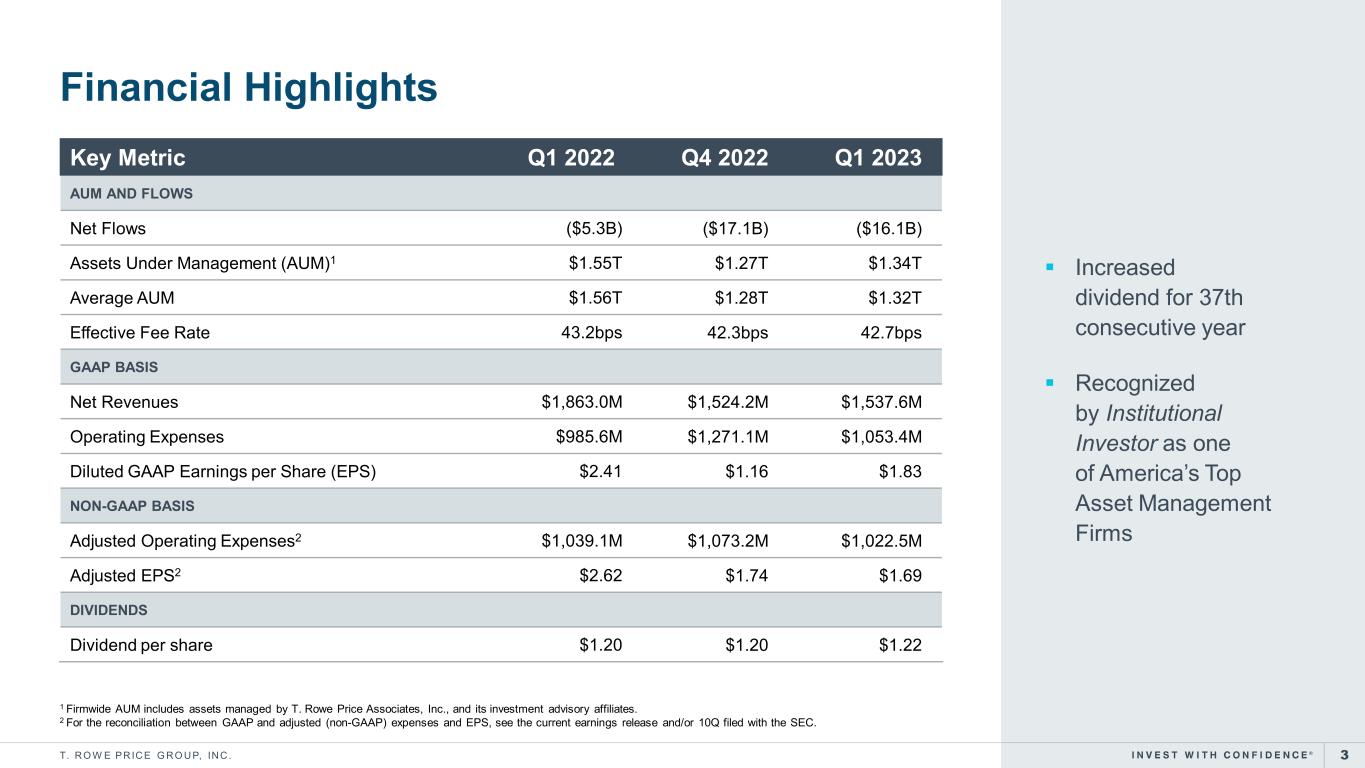
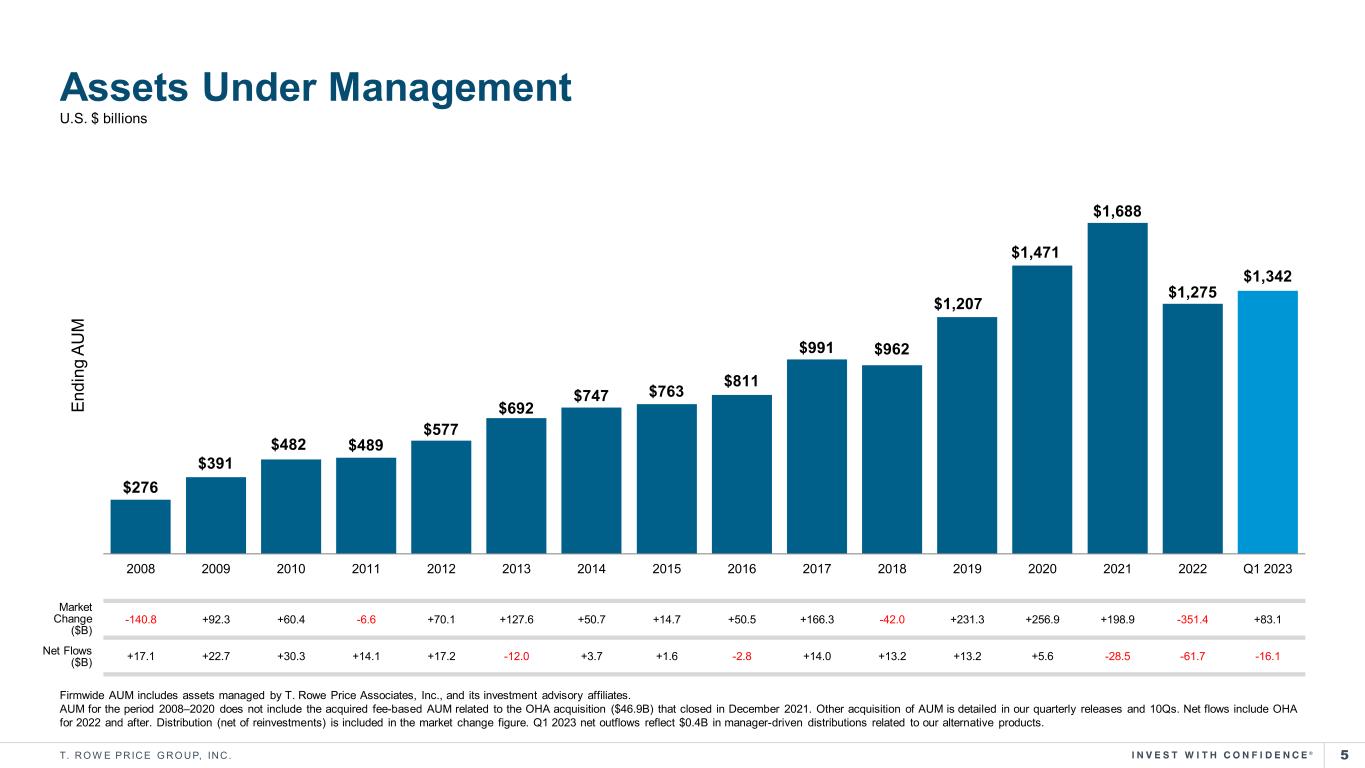
▪Quarter end assets under management of $1.34 trillion
▪Net client outflows of $16.1 billion
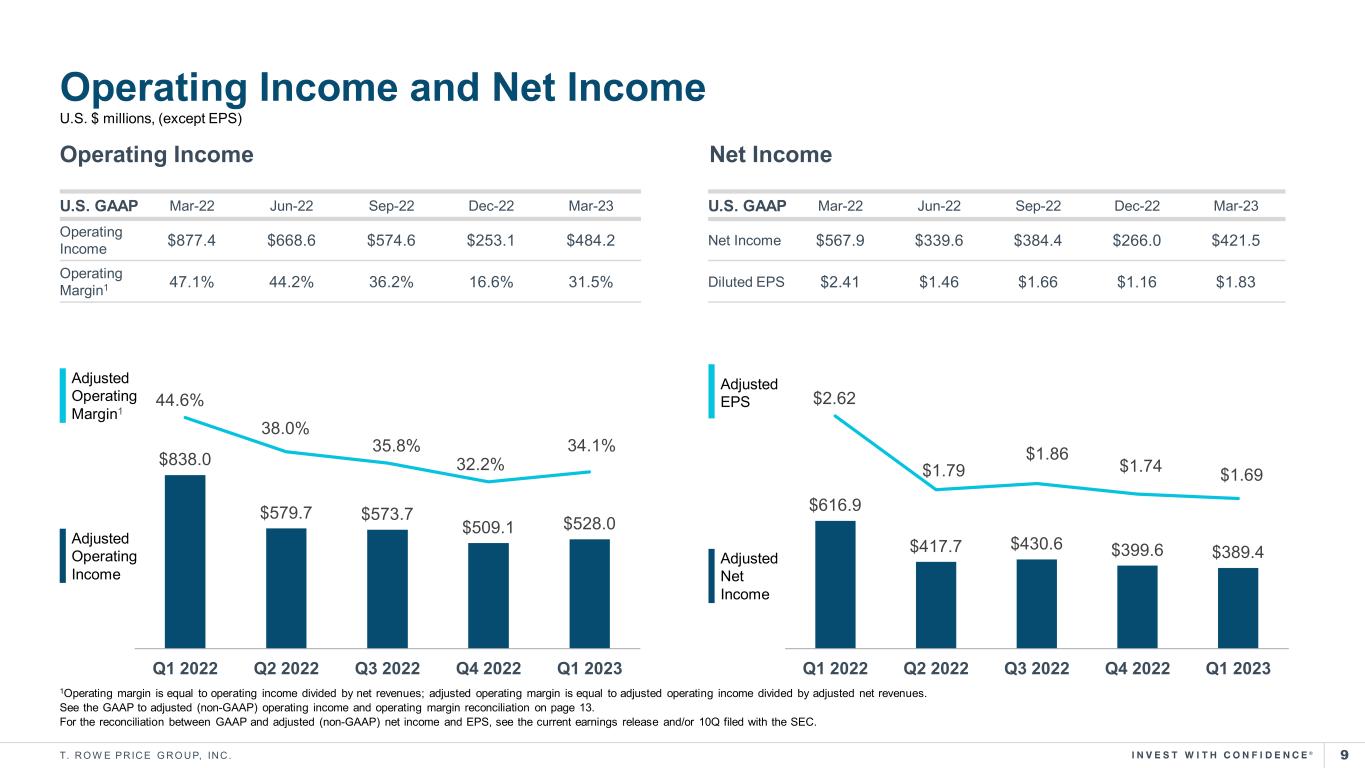
▪Diluted earnings per common share (EPS) of $1.83; Adjusted diluted EPS of $1.69
▪Increased the quarterly dividend for the 37th consecutive year
Rob Sharps, chief executive officer and president, commented, "Our first quarter 2023 showed some encouraging signs, despite the challenging environment. Markets posted gains, our investment performance showed signs of improvement, and we had strong net inflows of $7.5 billion to our target date products. However, the market environment continues to be uncertain and our equity flows remain under pressure."
Financial Highlights
| Three months ended | |||||||||||||||||||||||||||||
| (in millions, except per-share data) | 3/31/2023 | 3/31/2022 | Change | 12/31/2022 | Change | ||||||||||||||||||||||||
| U.S. GAAP basis | |||||||||||||||||||||||||||||
| Investment advisory fees | $ | 1,391.8 | $ | 1,662.1 | (16.3) | % | $ | 1,368.3 | 1.7 | % | |||||||||||||||||||
| Capital allocation-based income | $ | 16.9 | $ | 44.4 | (61.9) | % | $ | 26.5 | (36.2) | % | |||||||||||||||||||
| Net revenues | $ | 1,537.6 | $ | 1,863.0 | (17.5) | % | $ | 1,524.2 | .9 | % | |||||||||||||||||||
| Operating expenses | $ | 1,053.4 | $ | 985.6 | 6.9 | % | $ | 1,271.1 | (17.1) | % | |||||||||||||||||||
| Net operating income | $ | 484.2 | $ | 877.4 | (44.8) | % | $ | 253.1 | 91.3 | % | |||||||||||||||||||
| Non-operating income (loss) | $ | 135.4 | $ | (198.5) | n/m | $ | 135.7 | n/m | |||||||||||||||||||||
| Net income attributable to T. Rowe Price | $ | 421.5 | $ | 567.9 | (25.8) | % | $ | 266.0 | 58.5 | % | |||||||||||||||||||
| Diluted earnings per common share | $ | 1.83 | $ | 2.41 | (24.1) | % | $ | 1.16 | 57.8 | % | |||||||||||||||||||
| Weighted average common shares outstanding assuming dilution | 225.2 | 229.8 | (2.0) | % | 224.6 | .3 | % | ||||||||||||||||||||||
Adjusted basis(1) | |||||||||||||||||||||||||||||
| Operating expenses | $ | 1,022.5 | $ | 1,039.1 | (1.6) | % | $ | 1,073.2 | (4.7) | % | |||||||||||||||||||
| Operating expenses, excluding accrued carried interest compensation | $ | 1,013.9 | $ | 1,016.0 | (.2) | % | $ | 1,039.2 | (2.4) | % | |||||||||||||||||||
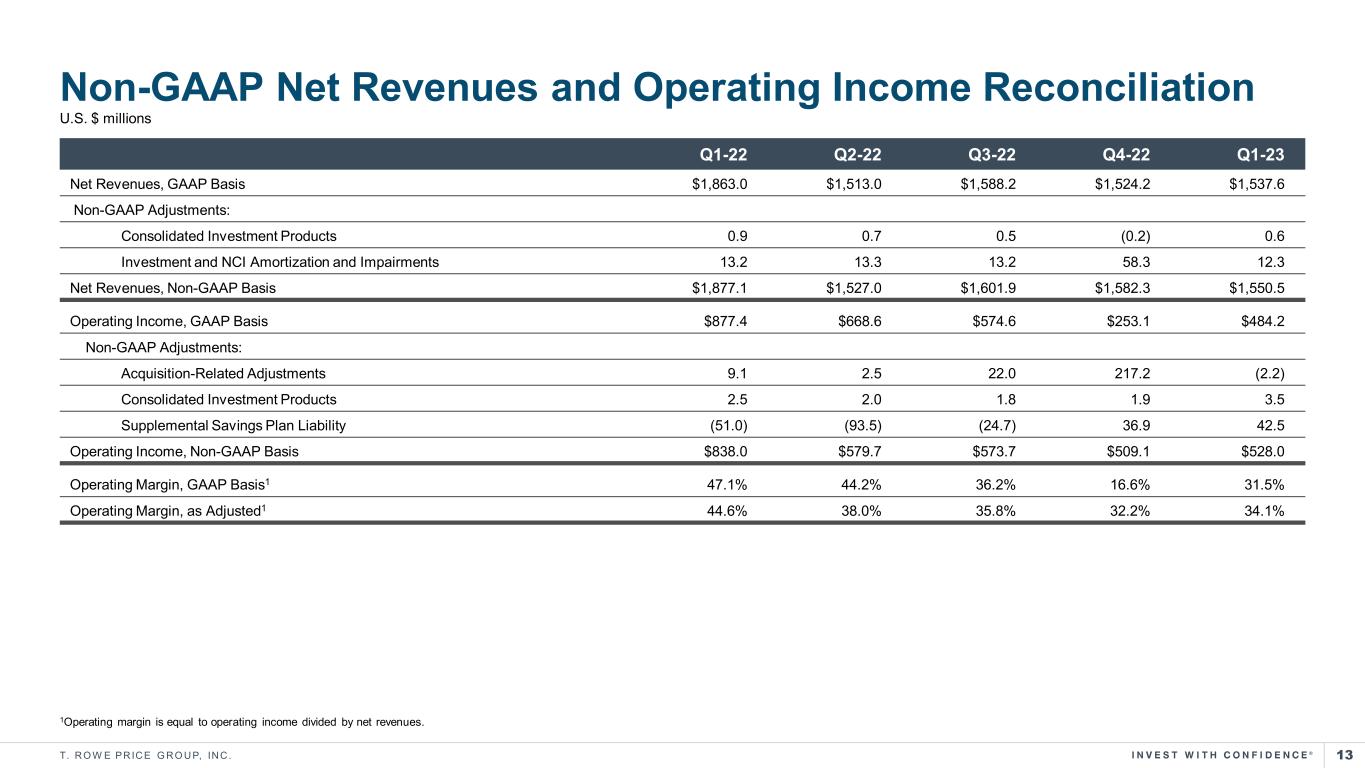
| Net operating income | $ | 528.0 | $ | 838.0 | (37.0) | % | $ | 509.1 | 3.7 | % | |||||||||||||||||||
Non-operating income (loss)(2) | $ | 30.8 | $ | (23.8) | n/m | $ | 33.7 | n/m | |||||||||||||||||||||
| Net income attributable to T. Rowe Price | $ | 389.4 | $ | 616.9 | (36.9) | % | $ | 399.6 | (2.6) | % | |||||||||||||||||||
| Diluted earnings per common share | $ | 1.69 | $ | 2.62 | (35.5) | % | $ | 1.74 | (2.9) | % | |||||||||||||||||||
Assets under management (in billions) | |||||||||||||||||||||||||||||
| Average assets under management | $ | 1,322.9 | $ | 1,559.9 | (15.2) | % | $ | 1,283.8 | 3.0 | % | |||||||||||||||||||
| Ending assets under management | $ | 1,341.7 | $ | 1,551.8 | (13.5) | % | $ | 1,274.7 | 5.3 | % | |||||||||||||||||||
| Investment advisory effective fee rate (bps) | 42.7 | 43.2 | (1.2) | % | 42.3 | .9 | % | ||||||||||||||||||||||
(1) See the reconciliation to the comparable U.S. GAAP measures at the end of this earnings release.
(2) The percentage change is not meaningful (n/m).
1
Assets Under Management
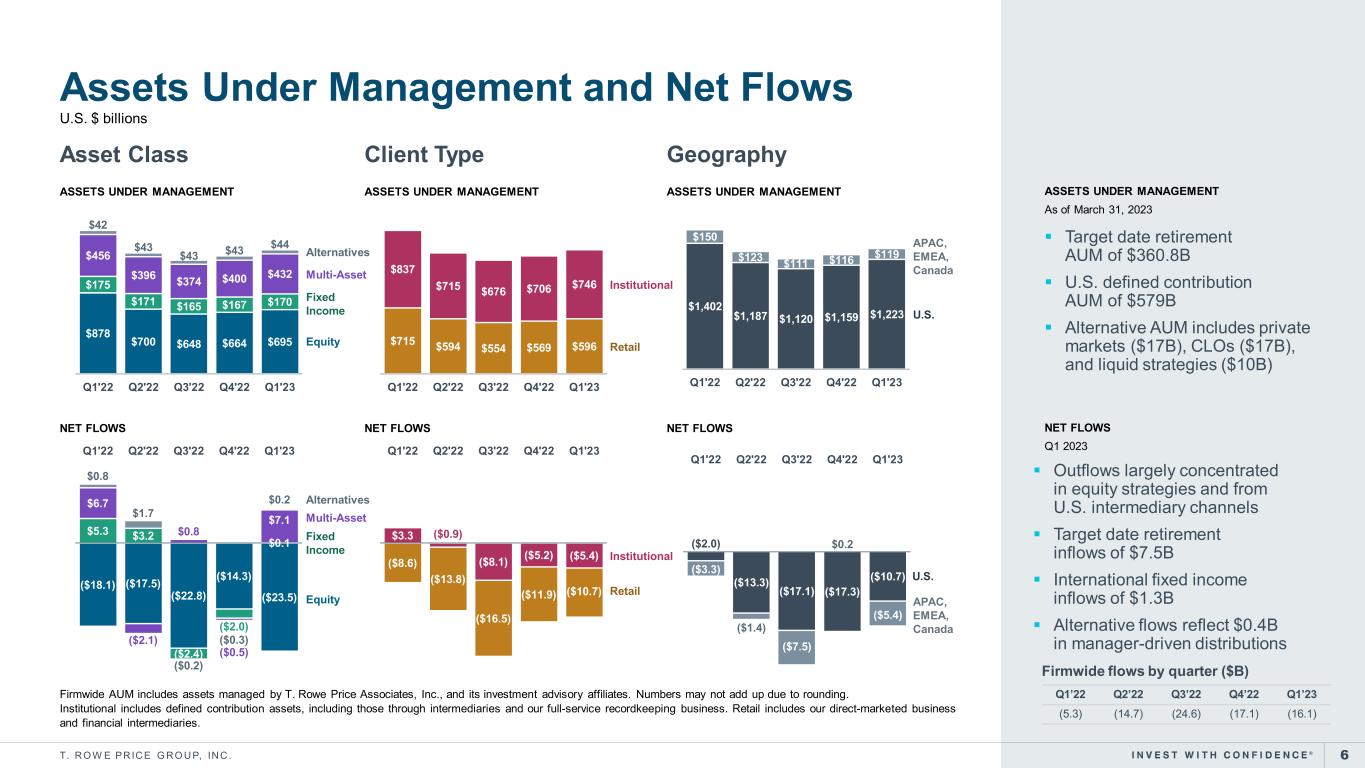
During Q1 2023, assets under management (AUM) increased $67.0 billion to $1.34 trillion. The components of the change in AUM, by asset class, are shown in the table below.
| Three months ended 3/31/2023 | |||||||||||||||||||||||||||||
| (in billions) | Equity | Fixed income, including money market | Multi-asset(1) | Alternatives(2) | Total | ||||||||||||||||||||||||
| Assets under management at beginning of period | $ | 664.2 | $ | 167.0 | $ | 400.1 | $ | 43.4 | $ | 1,274.7 | |||||||||||||||||||
Net cash flows(3) | (23.5) | .1 | 7.1 | .2 | (16.1) | ||||||||||||||||||||||||
Net market appreciation and gains(4) | 54.4 | 3.3 | 24.7 | .7 | 83.1 | ||||||||||||||||||||||||
| Change during the period | 30.9 | 3.4 | 31.8 | .9 | 67.0 | ||||||||||||||||||||||||
| Assets under management at March 31, 2023 | $ | 695.1 | $ | 170.4 | $ | 431.9 | $ | 44.3 | $ | 1,341.7 | |||||||||||||||||||
(1) The underlying AUM of the multi-asset portfolios have been aggregated and presented in this category and not reported in the equity and fixed income columns.
(2) The alternatives asset class includes strategies authorized to invest more than 50% of its holdings in private credit, leveraged loans, mezzanine, real assets/CRE, structured products, stressed/distressed, non-investment grade CLOs, special situations, business development companies, or that have absolute return as its investment objective. Generally, only those strategies with longer than daily liquidity are included. Unfunded capital commitments as of March 31, 2023 were
$11.8 billion and are not reflected in fee basis AUM above.
(3) Alternatives net cash flows include $.4 billion in outflows that represent investment manager-driven distributions.
(4) Includes net distributions not reinvested of $.2 billion.
Investors domiciled outside the United States accounted for 8.9% of the firm's AUM at March 31, 2023 and 9.1% at December 31, 2022.
The firm provides participants accounting and plan administration for defined contribution retirement plans that invest in the firm's U.S. mutual funds and collective investment trusts, as well as funds managed outside of the firm's complex. As of March 31, 2023, the firm's assets under administration were $229 billion, of which $140 billion were assets we manage.
In recent years, the firm began offering non-discretionary advisory services through model delivery and multi-asset solutions for providers to implement. The firm records the revenue earned on these services in administrative fees. The assets under advisement in these portfolios, predominantly in the United States, were $9 billion at
March 31, 2023.
2
Financial Results Highlights
Net Revenues
| Three months ended | |||||||||||||||||||||||||||||
| (in millions) | 3/31/2023 | 3/31/2022 | % Change | 12/31/2022 | % Change | ||||||||||||||||||||||||
| Investment advisory fees | |||||||||||||||||||||||||||||
| Equity | $ | 833.9 | $ | 1,086.0 | (23.2) | % | $ | 835.7 | (.2) | % | |||||||||||||||||||
| Fixed income, including money market | 102.4 | 106.6 | (3.9) | % | 103.3 | (.9) | % | ||||||||||||||||||||||
| Multi-asset | 386.0 | 404.6 | (4.6) | % | 359.6 | 7.3 | % | ||||||||||||||||||||||
| Alternatives | 69.5 | 64.9 | 7.1 | % | 69.7 | (.3) | % | ||||||||||||||||||||||
| Total investment advisory fees | $ | 1,391.8 | $ | 1,662.1 | (16.3) | % | $ | 1,368.3 | 1.7 | % | |||||||||||||||||||
| Capital allocation-based income | $ | 16.9 | $ | 44.4 | (61.9) | % | $ | 26.5 | (36.2) | % | |||||||||||||||||||
| Administrative, distribution, and servicing fees | 128.9 | 156.5 | (17.6) | % | 129.4 | (.4) | % | ||||||||||||||||||||||
| Net revenues | $ | 1,537.6 | $ | 1,863.0 | (17.5) | % | $ | 1,524.2 | .9 | % | |||||||||||||||||||
| Average AUM (in billions): | |||||||||||||||||||||||||||||
| Equity | $ | 687.0 | $ | 886.5 | (22.5) | % | $ | 676.4 | 1.6 | % | |||||||||||||||||||
| Fixed income, including money market | 169.6 | 177.8 | (4.6) | % | 168.8 | .5 | % | ||||||||||||||||||||||
| Multi-asset | 422.2 | 453.7 | (6.9) | % | 395.2 | 6.8 | % | ||||||||||||||||||||||
| Alternatives | 44.1 | 41.9 | 5.3 | % | 43.4 | 1.6 | % | ||||||||||||||||||||||
| Average AUM | $ | 1,322.9 | $ | 1,559.9 | (15.2) | % | $ | 1,283.8 | 3.0 | % | |||||||||||||||||||
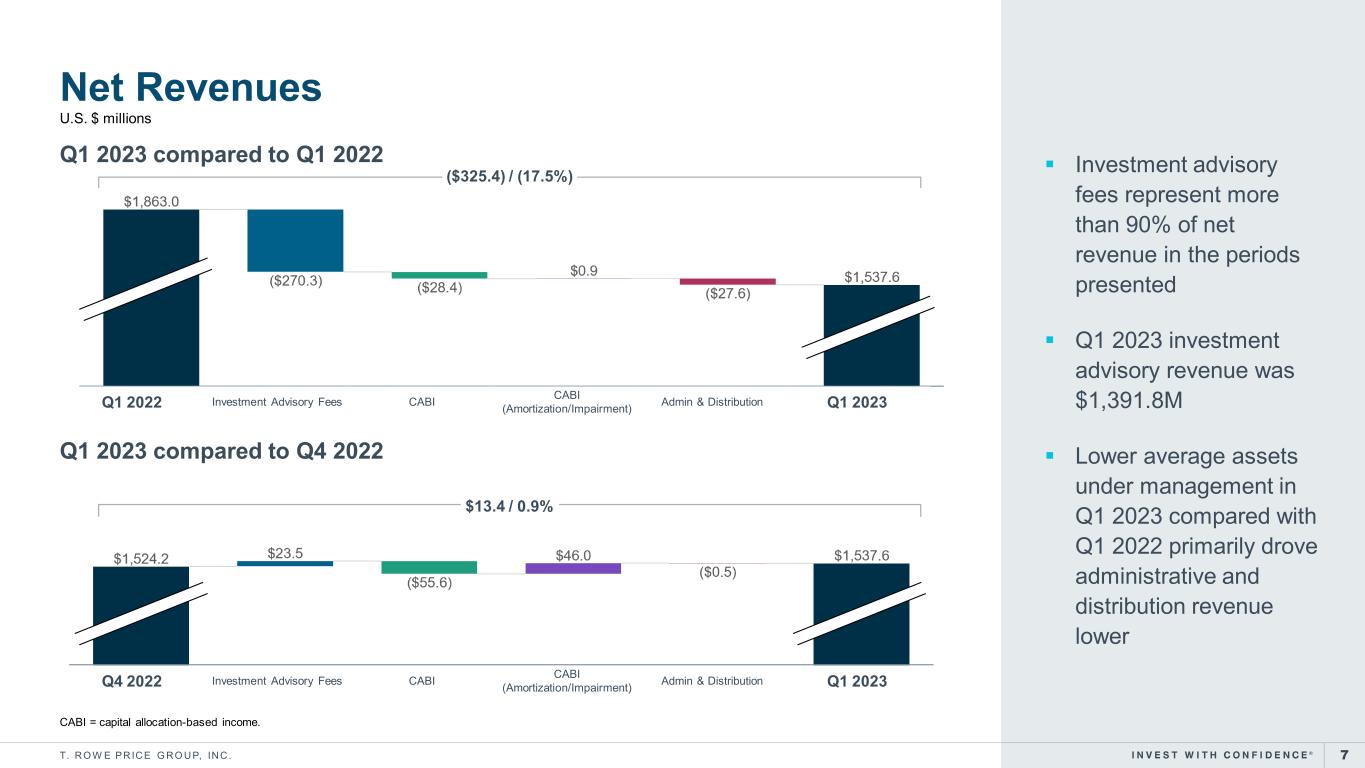
Net revenues earned in Q1 2023 were $1.5 billion, a decrease of 17.5% from Q1 2022 primarily driven by lower markets and net outflows.
▪The investment advisory fee annualized effective fee rate of 42.7 basis points in Q1 2023 decreased from 43.2 basis points earned in Q1 2022 and increased from 42.3 basis points earned in Q4 2022. In comparison with Q1 2022, the annualized effective fee rate was primarily driven by a mix shift toward lower fee asset classes and vehicles as a result of overall market declines and net outflows over the last twelve months.
▪Administrative, distribution, and servicing fees decreased primarily due to lower transfer agent servicing activities provided to the T. Rowe Price mutual funds and lower 12b-1 fees earned from certain share classes of the U.S. mutual funds.
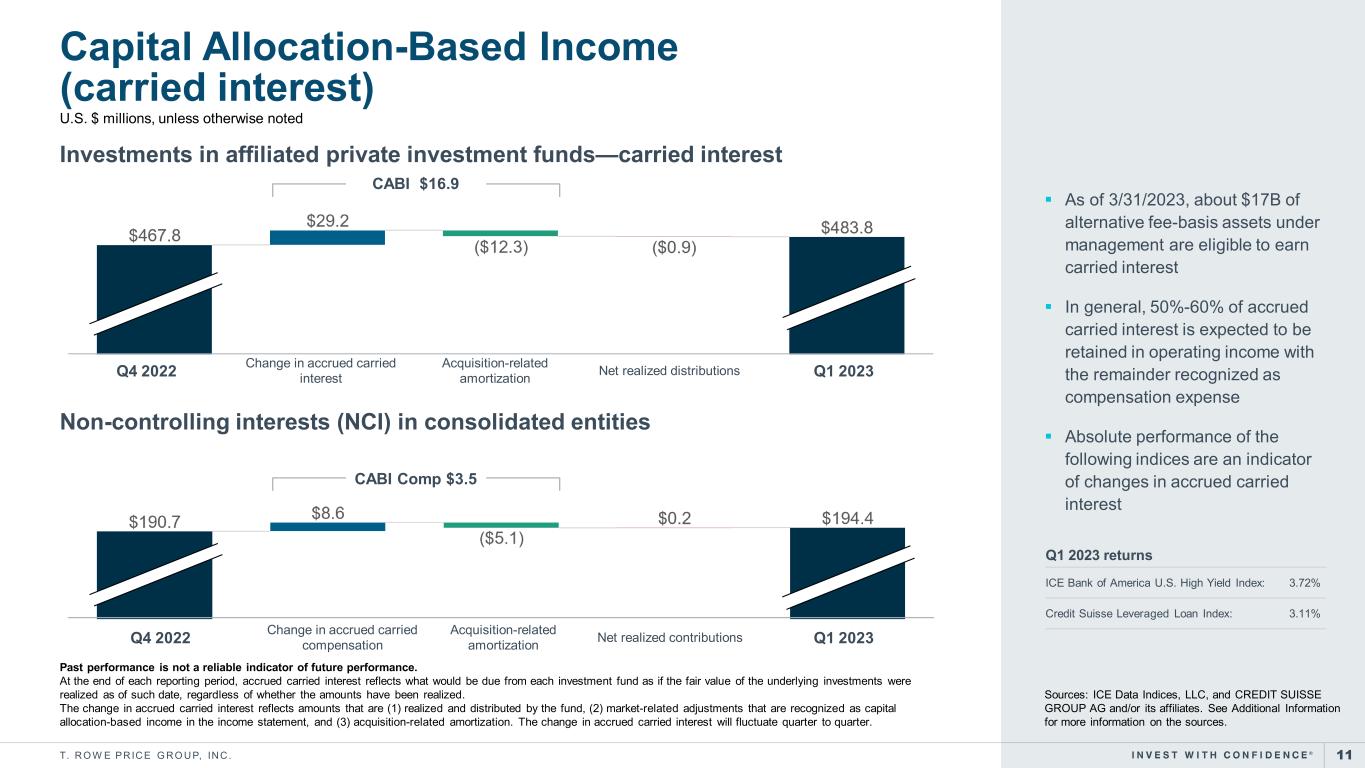
▪Capital allocation-based income in Q1 2023 of $16.9 million includes $29.2 million in additional accrued carried interest, partially offset by $12.3 million in acquisition-related non-cash amortization. Comparatively, the Q1 2022 amount of $44.4 million includes $57.6 million in additional accrued carried interest, partially offset by $13.2 million in non-cash amortization. A portion of the capital allocation-based income is passed through as compensation and recognized in compensation and related costs with the unpaid amount reported as non-controlling interest on the consolidated balance sheet. For detail of the quarterly change in accrued carried interest, which is reported as part of investments on the consolidated balance sheet, and related non-controlling interest, see the applicable tables at the end of this release.
3
Operating Expenses
| Three months ended | |||||||||||||||||||||||||||||
| (in millions) | 3/31/2023 | 3/31/2022 | % Change | 12/31/2022 | % Change | ||||||||||||||||||||||||
| Compensation, benefits, and related costs | $ | 593.3 | $ | 595.9 | (.4) | % | $ | 624.5 | (5.0) | % | |||||||||||||||||||
| Acquisition-related retention agreements | 14.2 | 19.2 | (26.0) | % | 15.9 | (10.7) | % | ||||||||||||||||||||||
| Capital allocation-based income compensation | 3.5 | 17.5 | n/m | 10.4 | n/m | ||||||||||||||||||||||||
| Supplemental savings plan | 42.5 | (51.0) | n/m | 36.9 | n/m | ||||||||||||||||||||||||
| Total compensation and related costs | 653.5 | 581.6 | 12.4 | % | 687.7 | (5.0) | % | ||||||||||||||||||||||
| Distribution and servicing | 71.5 | 85.9 | (16.8) | % | 70.0 | 2.1 | % | ||||||||||||||||||||||
| Advertising and promotion | 25.8 | 23.4 | 10.3 | % | 28.2 | (8.5) | % | ||||||||||||||||||||||
| Product and recordkeeping related costs | 72.1 | 80.4 | (10.3) | % | 67.8 | 6.3 | % | ||||||||||||||||||||||
| Technology, occupancy, and facility costs | 146.6 | 133.9 | 9.5 | % | 148.7 | (1.4) | % | ||||||||||||||||||||||
| General, administrative, and other | 107.5 | 98.8 | 8.8 | % | 102.1 | 5.3 | % | ||||||||||||||||||||||
| Change in fair value of contingent consideration | (49.6) | (45.5) | 9.0 | % | (35.5) | 39.7 | % | ||||||||||||||||||||||
| Acquisition-related amortization and impairment costs | 26.0 | 27.1 | (4.1) | % | 202.1 | (87.1) | % | ||||||||||||||||||||||
| Total operating expenses | $ | 1,053.4 | $ | 985.6 | 6.9 | % | $ | 1,271.1 | (17.1) | % | |||||||||||||||||||
Total adjusted operating expenses(1) | $ | 1,022.5 | $ | 1,039.1 | (1.6) | % | $ | 1,073.2 | (4.7) | % | |||||||||||||||||||
(1) See the reconciliation to the comparable U.S. GAAP measures at the end of this earnings release.
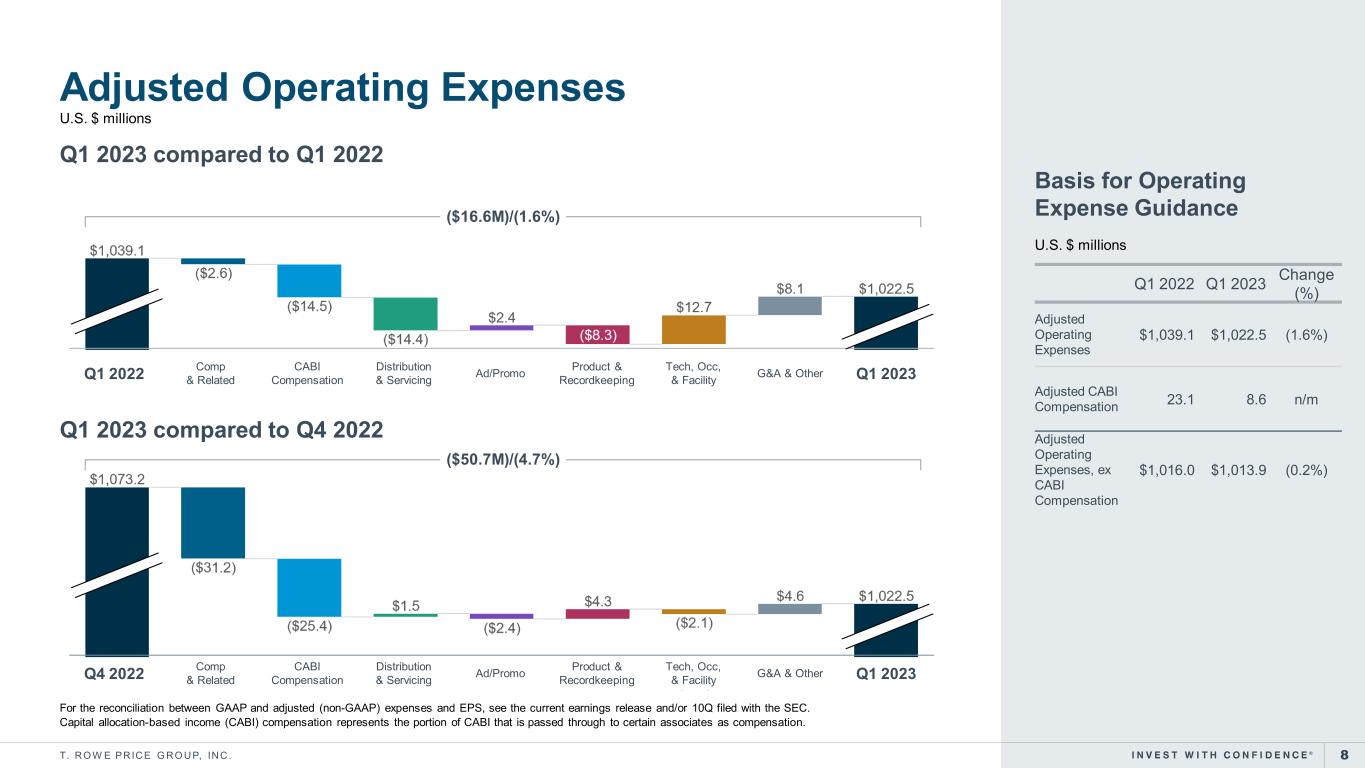
Operating expenses were $1,053.4 million, an increase of 6.9% compared with Q1 2022 and a decrease of 17.1% compared with Q4 2022. On a non-GAAP basis, adjusted operating expenses in Q1 2023 were $1,022.5 million, a 1.6% decrease over Q1 2022 and a 4.7% decrease compared with Q4 2022.
▪Compensation, benefits, and related costs in Q1 2023 of $593.3 million were in line with Q1 2022 as higher salaries and related benefits were offset by a lower interim bonus accrual and stock-based compensation expense. Compensation, benefits, and related costs in Q1 2023 declined $31.2 million from Q4 2022, primarily reflecting lower stock-based compensation expense related to the firm's annual equity grant as well as the absence of severance and other costs associated with the workforce reduction action recognized in Q4 2022. These lower Q1 2023 costs were offset in part by a higher interim bonus accrual as Q4 2022 reflected the final accrual needed to recognize the annual bonus to be paid. The firm employed 7,837 associates at March 31, 2023, a decrease of .4% from the end of 2022 and an increase of 3.5% from March 31, 2022.
▪Distribution and servicing costs in Q1 2023 of $71.5 million, declined $14.4 million from Q1 2022, primarily driven by lower average AUM of certain share classes of the U.S. mutual funds and of the firm's international products, including the Japanese Investment Trusts (ITMs) and certain SICAV share classes.
▪Technology, occupancy, and facility costs in Q1 2023 of $146.6 million, increased $12.7 million from Q1 2022, primarily due to higher depreciation from the firm's ongoing investment in its technology capabilities, and increased office facility costs, mainly related to higher rent expense.
4
Non-operating income (loss)
| (in millions) | Three months ended | ||||||||||||||||
| 3/31/2023 | 3/31/2022 | 12/31/2022 | |||||||||||||||
| Net gains (losses) from non-consolidated T. Rowe Price investment products | |||||||||||||||||
| Cash and discretionary investments | |||||||||||||||||
| Dividend income | $ | 20.2 | $ | .8 | $ | 19.6 | |||||||||||
| Market-related gains (losses) and equity in earnings (losses) | 10.6 | (24.6) | 14.1 | ||||||||||||||
| Total net gains (losses) from cash and discretionary investments | 30.8 | (23.8) | 33.7 | ||||||||||||||
| Seed capital investments | |||||||||||||||||
| Dividend income | .5 | .2 | .2 | ||||||||||||||
| Market-related gains (losses) and equity in earnings (losses) | 15.1 | (22.8) | 17.4 | ||||||||||||||
| Net gains (losses) recognized upon deconsolidation | — | 1.6 | (3.8) | ||||||||||||||
| Investments used to hedge the supplemental savings plan liability | 44.7 | (55.3) | 38.6 | ||||||||||||||
| Total net gains (losses) from non-consolidated T. Rowe Price investment products | 91.1 | (100.1) | 86.1 | ||||||||||||||
| Other investment income | 2.8 | 10.2 | 10.5 | ||||||||||||||
| Net gains (losses) on investments | 93.9 | (89.9) | 96.6 | ||||||||||||||
| Net gains (losses) on consolidated sponsored investment portfolios | 45.4 | (101.4) | 44.2 | ||||||||||||||
| Other losses, including foreign currency losses | (3.9) | (7.2) | (5.1) | ||||||||||||||
| Non-operating income (loss) | $ | 135.4 | $ | (198.5) | $ | 135.7 | |||||||||||
▪On a non-GAAP basis, non-operating income (loss) comprises the investment gains/losses generated from the firm's cash and discretionary investment portfolio. The net investment gains on this portfolio totaled $30.8 million in Q1 2023, compared with net investment losses of $23.8 million in the 2022 period, and net investment gains of $33.7 million in Q4 2022.
Income taxes
The following reconciles the statutory federal income tax rate to the firm's effective tax rate for the first quarter of 2023 and 2022:
| Three months ended | |||||||||||
| 3/31/2023 | 3/31/2022 | ||||||||||
Statutory U.S. federal income tax rate | 21.0 | % | 21.0 | % | |||||||
State income taxes for current year, net of federal income tax benefits(1) | 3.0 | 3.3 | |||||||||
Net (income) losses attributable to redeemable non-controlling interests(2) | (.4) | .3 | |||||||||
Net excess tax benefits from stock-based compensation plans activity | (.4) | (.6) | |||||||||
| Other items, including valuation allowances | 5.5 | .2 | |||||||||
Effective income tax rate | 28.7 | % | 24.2 | % | |||||||
(1) State income tax benefits are reflected in the total benefits for net income attributable to redeemable non-controlling interests and stock-based compensation plans activity.
(2) Net income attributable to redeemable non-controlling interest represents the portion of earnings held in the firm's consolidated investment products, which are not taxable to the firm despite being included in pre-tax income.
5
▪The firm's non-GAAP tax rate was 30.3% for Q1 2023, compared with 24.2% for Q1 2022. The Q1 2023 non-GAAP effective tax rate was unfavorably impacted by an increase in valuation allowances recorded against certain foreign-based deferred tax assets. These unfavorable impacts were partially offset by a lower state effective tax rate as a result of favorable state tax liability settlements.
▪The firm estimates that its effective tax rate for the full year 2023 will be in the range of 26% to 30%, on a U.S. GAAP basis, and 26.5% to 29.5%, on a non-GAAP basis.
Other Matters
The financial results presented in this release are unaudited. The firm expects to file its Form 10-Q Quarterly Report for the first quarter of 2023 with the U.S. Securities and Exchange Commission later today. The Form 10-Q will include additional information on the firm's unaudited consolidated financial statements at March 31, 2023.
Certain statements in this earnings release may represent “forward-looking information,” including information relating to anticipated changes in revenues, net income and earnings per common share, anticipated changes in the amount and composition of assets under management, anticipated expense levels, estimated effective tax rates, the timing and expense related to the integration of OHA with and into our business, general economic conditions, government actions and expectations regarding financial results, future transactions, new products and services, investments, capital expenditures, dividends, stock repurchases, changes in our effective fee rate, the impact of the coronavirus pandemic, and other market conditions. For a discussion concerning risks and other factors that could affect future results, see the firm's 2022 Annual Report on Form 10-K.
Founded in 1937, Baltimore-based T. Rowe Price (troweprice.com) is a global investment management organization that provides a broad array of mutual funds, subadvisory services, and separate account management for individual and institutional investors, retirement plans, and financial intermediaries. The organization also offers a variety of sophisticated investment planning and guidance tools. T. Rowe Price's disciplined, risk-aware investment approach focuses on diversification, style consistency, and fundamental research.
Webcast Information
Chief executive officer and president, Rob Sharps, and chief financial officer, Jen Dardis, will provide an update on business performance, review financial results, and answer questions on a webcast to be held on Tuesday, May 2, 2023 from 8:00 - 8:45 AM (Eastern Time). To access the webcast or to obtain dial in instructions to ask a question, please visit investors.troweprice.com.
Supplemental materials will be available through the webcast platform and on the company's investor relations website. A replay of the webcast will be available on the company's investor relations website shortly after the event.
6
CONTACTS:
| Public Relations | Investor Relations | ||||||||||
| Dasha Smith | Linsley Carruth | ||||||||||
| 410-345-3715 | 410-345-3717 | ||||||||||
| [email protected] | [email protected] | ||||||||||
7
| Unaudited Consolidated Statements of Income | ||||||||||||||||||||
(in millions, except per-share amounts) | ||||||||||||||||||||
| Three months ended | ||||||||||||||||||||
Revenues | 3/31/2023 | 3/31/2022 | 12/31/2022 | |||||||||||||||||
| Investment advisory fees | $ | 1,391.8 | $ | 1,662.1 | $ | 1,368.3 | ||||||||||||||
| Capital allocation-based income | 16.9 | 44.4 | 26.5 | |||||||||||||||||
| Administrative, distribution, and servicing fees | 128.9 | 156.5 | 129.4 | |||||||||||||||||
| Net revenues | 1,537.6 | 1,863.0 | 1,524.2 | |||||||||||||||||
Operating expenses | ||||||||||||||||||||
| Compensation, benefits, and related costs | 593.3 | 595.9 | 624.5 | |||||||||||||||||
| Acquisition-related retention agreements | 14.2 | 19.2 | 15.9 | |||||||||||||||||
| Capital allocation-based income compensation | 3.5 | 17.5 | 10.4 | |||||||||||||||||
| Supplemental savings plan | 42.5 | (51.0) | 36.9 | |||||||||||||||||
| Total compensation and related costs | 653.5 | 581.6 | 687.7 | |||||||||||||||||
| Distribution and servicing | 71.5 | 85.9 | 70.0 | |||||||||||||||||
| Advertising and promotion | 25.8 | 23.4 | 28.2 | |||||||||||||||||
| Product and recordkeeping related costs | 72.1 | 80.4 | 67.8 | |||||||||||||||||
| Technology, occupancy, and facility costs | 146.6 | 133.9 | 148.7 | |||||||||||||||||
| General, administrative, and other | 107.5 | 98.8 | 102.1 | |||||||||||||||||
| Contingent consideration fair value adjustments | (49.6) | (45.5) | (35.5) | |||||||||||||||||
| Acquisition-related amortization and impairment costs | 26.0 | 27.1 | 202.1 | |||||||||||||||||
Total operating expenses | 1,053.4 | 985.6 | 1,271.1 | |||||||||||||||||
Net operating income | 484.2 | 877.4 | 253.1 | |||||||||||||||||
| Non-operating income (loss) | ||||||||||||||||||||
| Net gains (losses) on investments | 93.9 | (89.9) | 96.6 | |||||||||||||||||
| Net gains (losses) on consolidated investment products | 45.4 | (101.4) | 44.2 | |||||||||||||||||
| Other losses | (3.9) | (7.2) | (5.1) | |||||||||||||||||
| Total non-operating income (loss) | 135.4 | (198.5) | 135.7 | |||||||||||||||||
| Income before income taxes | 619.6 | 678.9 | 388.8 | |||||||||||||||||
| Provision for income taxes | 177.9 | 164.5 | 99.2 | |||||||||||||||||
| Net income | 441.7 | 514.4 | 289.6 | |||||||||||||||||
| Less: net income (loss) attributable to redeemable non-controlling interests | 20.2 | (53.5) | 23.6 | |||||||||||||||||
| Net income attributable to T. Rowe Price | 421.5 | 567.9 | 266.0 | |||||||||||||||||
Less: net income allocated to outstanding restricted stock and stock unit holders | 10.5 | 13.0 | 6.5 | |||||||||||||||||
| Net income allocated to T. Rowe Price common stockholders | $ | 411.0 | $ | 554.9 | $ | 259.5 | ||||||||||||||
Earnings per share | ||||||||||||||||||||
Basic | $ | 1.83 | $ | 2.43 | $ | 1.16 | ||||||||||||||
Diluted | $ | 1.83 | $ | 2.41 | $ | 1.16 | ||||||||||||||
Weighted-average common shares | ||||||||||||||||||||
Outstanding | 224.4 | 228.2 | 223.7 | |||||||||||||||||
Outstanding assuming dilution | 225.2 | 229.8 | 224.6 | |||||||||||||||||
8
The following table summarizes the cash flows for 2023 that are attributable to T. Rowe Price Group, our consolidated sponsored investment products, and the related eliminations required.
| Three months ended | |||||||||||||||||||||||
| 3/31/2023 | |||||||||||||||||||||||
(in millions) | Cash flow attributable to T. Rowe Price | Cash flow attributable to consolidated T. Rowe Price investment products | Elims | As reported | |||||||||||||||||||
| Cash flows from operating activities | |||||||||||||||||||||||
| Net income (loss) | $ | 421.5 | $ | 41.8 | $ | (21.6) | $ | 441.7 | |||||||||||||||
| Adjustments to reconcile net income (loss) to net cash provided by operating activities | |||||||||||||||||||||||
| Depreciation, amortization and impairments of property, equipment and software | 58.8 | — | — | 58.8 | |||||||||||||||||||
| Amortization and impairment of acquisition-related assets and retention agreements | 48.2 | — | — | 48.2 | |||||||||||||||||||
| Fair value remeasurement of contingent liability | (49.6) | — | — | (49.6) | |||||||||||||||||||
| Stock-based compensation expense | 58.8 | — | — | 58.8 | |||||||||||||||||||
| Net (gains) losses recognized on investments | (123.9) | — | 21.6 | (102.3) | |||||||||||||||||||
| Net redemptions in sponsored investment products used to economically hedge supplemental savings plan liability | 18.4 | — | — | 18.4 | |||||||||||||||||||
| Net change in trading securities held by consolidated sponsored investment products | — | (200.7) | — | (200.7) | |||||||||||||||||||
| Other changes | 240.5 | (.7) | (1.4) | 238.4 | |||||||||||||||||||
| Net cash provided by (used in) operating activities | 672.7 | (159.6) | (1.4) | 511.7 | |||||||||||||||||||
| Net cash provided by (used in) investing activities | (52.0) | (2.5) | (3.0) | (57.5) | |||||||||||||||||||
| Net cash provided by (used in) financing activities | (282.2) | 133.6 | 4.4 | (144.2) | |||||||||||||||||||
| Effect of exchange rate changes on cash and cash equivalents of consolidated sponsored investment products | — | 1.5 | — | 1.5 | |||||||||||||||||||
| Net change in cash and cash equivalents during period | 338.5 | (27.0) | — | 311.5 | |||||||||||||||||||
| Cash and cash equivalents at beginning of year | 1,755.6 | 119.1 | — | 1,874.7 | |||||||||||||||||||
| Cash and cash equivalents at end of period | $ | 2,094.1 | $ | 92.1 | $ | — | $ | 2,186.2 | |||||||||||||||
| Unaudited Condensed Consolidated Balance Sheet Information (in millions) | As of | ||||||||||
| 3/31/2023 | 12/31/2022 | ||||||||||
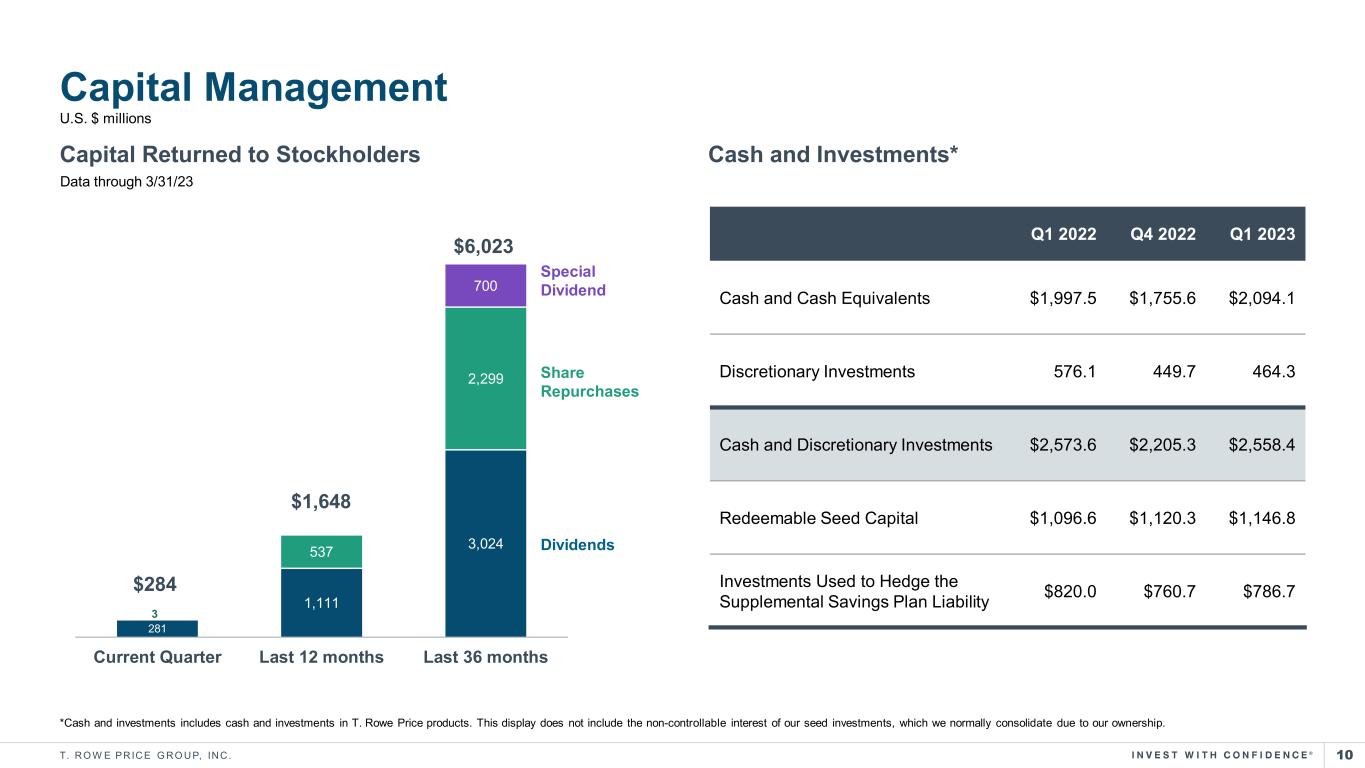
| Cash and cash equivalents | $ | 2,094.1 | $ | 1,755.6 | |||||||
| Accounts receivable and accrued revenue | 730.4 | 748.7 | |||||||||
| Investments | 2,606.2 | 2,539.2 | |||||||||
| Assets of consolidated T. Rowe Price investment products | 1,820.9 | 1,603.4 | |||||||||
| Operating lease assets | 268.5 | 279.4 | |||||||||
| Property, equipment and software, net | 762.2 | 755.7 | |||||||||
| Goodwill and intangible assets | 3,246.6 | 3,272.6 | |||||||||
| Other assets | 627.7 | 688.7 | |||||||||
| Total assets | 12,156.6 | 11,643.3 | |||||||||
| Supplemental savings plan liability | 785.6 | 761.2 | |||||||||
| Contingent consideration | 46.2 | 95.8 | |||||||||
| Total other liabilities, includes $111.4 at March 31, 2023, and $89.1 at December 31, 2022, from consolidated sponsored investment products | 1,250.9 | 1,099.4 | |||||||||
| Non-controlling interests* | 1,028.5 | 847.4 | |||||||||
Stockholders' equity attributable to T. Rowe Price Group, Inc., 224.5 common shares outstanding at March 31, 2023 and 224.3 common shares outstanding at December 31, 2022 | $ | 9,045.4 | $ | 8,839.5 | |||||||
* This includes both redeemable and non-redeemable non-controlling interest in consolidated entities.
9
The following tables detail changes in our investments in affiliated private investment funds - carried interest and non-controlling interest in consolidated entities.
| Three months ended | |||||||||||
| Investments in affiliated private investment funds - carried interest | 3/31/2023 | 3/31/2022 | |||||||||
| Balance at beginning of period | $ | 467.8 | $ | 609.8 | |||||||
| Capital allocation-based income: | |||||||||||
| Change in accrued carried interest | 29.2 | 57.6 | |||||||||
| Acquisition-related amortization | (12.3) | (13.2) | |||||||||
| Net realized distributions | (.9) | (12.1) | |||||||||
Balance at end of period | $ | 483.8 | $ | 642.1 | |||||||
| Three months ended | |||||||||||
| Non-controlling interests (NCI) in consolidated entities | 3/31/2023 | 3/31/2022 | |||||||||
| Balance at beginning of period | $ | 190.7 | $ | 248.7 | |||||||
| Capital allocation-based income compensation: | |||||||||||
| Change in accrued carried interest compensation | 8.6 | 23.1 | |||||||||
| Acquisition-related amortization | (5.1) | (5.6) | |||||||||
| Net contributions | .2 | 6.0 | |||||||||
Balance at end of period | $ | 194.4 | $ | 272.2 | |||||||
Non-GAAP Information and Reconciliation
The firm believes the non-GAAP financial measures below provide relevant and meaningful information to investors about its core operating results. These measures have been established in order to increase transparency for the purpose of evaluating the firm's core business, for comparing current results with prior period results, and to enable more appropriate comparison with industry peers. However, non-GAAP financial measures should not be considered as a substitute for financial measures calculated in accordance with U.S. GAAP and may be calculated differently by other companies.
10
The following schedules reconcile U.S. GAAP financial measures to non-GAAP financial measures for the three months ended March 31, 2023 and 2022 and December 31, 2022.
| Three months ended 3/31/2023 | |||||||||||||||||||||||||||||||||||
| Operating expenses | Net operating income | Non-operating income (loss) | Provision (benefit) for income taxes(6) | Net income attributable to T. Rowe Price | Diluted earnings per share(7) | ||||||||||||||||||||||||||||||
| U.S. GAAP Basis (FS line item) | $ | 1,053.4 | $ | 484.2 | $ | 135.4 | $ | 177.9 | $ | 421.5 | $ | 1.83 | |||||||||||||||||||||||
| Non-GAAP adjustments: | |||||||||||||||||||||||||||||||||||
| Acquisition-related non-GAAP adjustments: | |||||||||||||||||||||||||||||||||||
Investment and NCI amortization and impairments(1) (Capital allocation-based income and Compensation and related costs) | 5.1 | 7.2 | — | 1.5 | 5.7 | .02 | |||||||||||||||||||||||||||||
Acquisition-related retention arrangements(1) (Compensation and related costs) | (14.2) | 14.2 | — | 3.1 | 11.1 | .05 | |||||||||||||||||||||||||||||
Contingent consideration(1) | 49.6 | (49.6) | — | (10.5) | (39.1) | (.17) | |||||||||||||||||||||||||||||
Intangible assets amortization and impairments(1) | (26.0) | 26.0 | — | 5.6 | 20.4 | .09 | |||||||||||||||||||||||||||||
| Total acquisition-related non-GAAP adjustments | 14.5 | (2.2) | — | (.3) | (1.9) | (.01) | |||||||||||||||||||||||||||||
Supplemental savings plan liability(3) (Compensation and related costs) | (42.5) | 42.5 | (44.7) | (.5) | (1.7) | (.01) | |||||||||||||||||||||||||||||
Consolidated T. Rowe Price investment products(4) | (2.9) | 3.5 | (45.4) | (4.6) | (17.1) | (.07) | |||||||||||||||||||||||||||||
Other non-operating income(5) | — | — | (14.5) | (3.1) | (11.4) | (.05) | |||||||||||||||||||||||||||||
| Adjusted Non-GAAP Basis | $ | 1,022.5 | $ | 528.0 | $ | 30.8 | $ | 169.4 | $ | 389.4 | $ | 1.69 | |||||||||||||||||||||||
| Three months ended 3/31/2022 | |||||||||||||||||||||||||||||||||||
| Operating expenses | Net operating income | Non-operating income (loss) | Provision (benefit) for income taxes(6) | Net income attributable to T. Rowe Price | Diluted earnings per share(7) | ||||||||||||||||||||||||||||||
| U.S. GAAP Basis (FS line item) | $ | 985.6 | $ | 877.4 | $ | (198.5) | $ | 164.5 | $ | 567.9 | $ | 2.41 | |||||||||||||||||||||||
| Non-GAAP adjustments: | |||||||||||||||||||||||||||||||||||
| Acquisition-related non-GAAP adjustments: | |||||||||||||||||||||||||||||||||||
Investment and NCI amortization and impairments(1) (Capital allocation-based income and Compensation and related costs) | 5.6 | 7.6 | — | 5.3 | 2.3 | .03 | |||||||||||||||||||||||||||||
Acquisition-related retention arrangements(1) (Compensation and related costs) | (19.2) | 19.2 | — | 5.4 | 13.8 | .04 | |||||||||||||||||||||||||||||
Contingent consideration(1) | 45.5 | (45.5) | — | (18.2) | (27.3) | (.12) | |||||||||||||||||||||||||||||
Intangible assets amortization and impairments(1) | (27.1) | 27.1 | — | 10.8 | 16.3 | .07 | |||||||||||||||||||||||||||||
Transaction costs(2) (General, admin and other) | (.7) | .7 | — | .3 | .4 | — | |||||||||||||||||||||||||||||
| Total acquisition-related non-GAAP adjustments | 4.1 | 9.1 | — | 3.6 | 5.5 | .02 | |||||||||||||||||||||||||||||
Supplemental savings plan liability(3) (Compensation and related costs) | 51.0 | (51.0) | 55.3 | 1.7 | 2.7 | .01 | |||||||||||||||||||||||||||||
Consolidated T. Rowe Price investment products(4) | (1.6) | 2.5 | 101.4 | 20.3 | 30.0 | .13 | |||||||||||||||||||||||||||||
Other non-operating income(5) | — | — | 18.0 | 7.2 | 10.8 | .05 | |||||||||||||||||||||||||||||
| Adjusted Non-GAAP Basis | $ | 1,039.1 | $ | 838.0 | $ | (23.8) | $ | 197.3 | $ | 616.9 | $ | 2.62 | |||||||||||||||||||||||
11
| Three months ended 12/31/2022 | |||||||||||||||||||||||||||||||||||
| Operating expenses | Net operating income | Non-operating income (loss) | Provision (benefit) for income taxes(6) | Net income attributable to T. Rowe Price | Diluted earnings per share(7) | ||||||||||||||||||||||||||||||
| U.S. GAAP Basis (FS line item) | $ | 1,271.1 | $ | 253.1 | $ | 135.7 | $ | 99.2 | $ | 266.0 | $ | 1.16 | |||||||||||||||||||||||
| Non-GAAP adjustments: | |||||||||||||||||||||||||||||||||||
| Acquisition-related non-GAAP adjustments: | |||||||||||||||||||||||||||||||||||
Investment and NCI amortization and impairments(1) (Capital allocation-based income and Compensation and related costs) | 23.6 | 34.7 | — | 9.0 | 25.7 | .11 | |||||||||||||||||||||||||||||
Acquisition-related retention arrangements(1) (Compensation and related costs) | (15.9) | 15.9 | — | 3.4 | 12.5 | .05 | |||||||||||||||||||||||||||||
Contingent consideration(1) | 35.5 | (35.5) | — | (7.6) | (27.9) | (.12) | |||||||||||||||||||||||||||||
Intangible assets amortization and impairments(1) | (202.1) | 202.1 | — | 53.1 | 149.0 | .65 | |||||||||||||||||||||||||||||
| Total acquisition-related non-GAAP adjustments | (158.9) | 217.2 | — | 57.9 | 159.3 | .69 | |||||||||||||||||||||||||||||
Supplemental savings plan liability(3) (Compensation and related costs) | (36.9) | 36.9 | (38.6) | (.6) | (1.1) | (.01) | |||||||||||||||||||||||||||||
Consolidated T. Rowe Price investment products(4) | (2.1) | 1.9 | (44.2) | (6.9) | (11.8) | (.05) | |||||||||||||||||||||||||||||
Other non-operating income(5) | — | — | (19.2) | (6.4) | (12.8) | (.05) | |||||||||||||||||||||||||||||
| Adjusted Non-GAAP Basis | $ | 1,073.2 | $ | 509.1 | $ | 33.7 | $ | 143.2 | $ | 399.6 | $ | 1.74 | |||||||||||||||||||||||
(1) These non-GAAP adjustments remove the impact of acquisition-related amortization and costs including amortization of intangible assets, the recurring fair value remeasurements of the contingent consideration liability, amortization of acquired investment, and non-controlling interest basis differences and amortization of compensation-related arrangements. Management believes adjusting for these charges helps the reader's ability to understand the firm's core operating results and to increase comparability period to period.
(2) This non-GAAP adjustment removes the transaction costs incurred related to the acquisition of OHA. Management believes adjusting for these charges helps the reader's ability to understand the firm's core operating results and to increase comparability period to period.
(3) This non-GAAP adjustment removes the compensation expense impact from market valuation changes in the supplemental savings plan liability and the related net gains (losses) on investments designated as an economic hedge against the related liability. Amounts deferred under the supplemental savings plan are adjusted for appreciation (depreciation) of hypothetical investments chosen by participants. The firm uses T. Rowe Price investment products to economically hedge the exposure to these market movements. Management believes it is useful to offset the non-operating investment income (loss) realized on the economic hedges against the related compensation expense and remove the net impact to help the reader's ability to understand the firm's core operating results and to increase comparability period to period.
(4) These non-GAAP adjustments remove the impact that the consolidated sponsored investment products have on the firm's U.S. GAAP consolidated statements of income. Specifically, the firm adds back the operating expenses and subtracts the investment income of the consolidated sponsored investment products. The adjustment to operating expenses represents the operating expenses of the consolidated products, net of the elimination of related management and administrative fees. The adjustment to net income attributable to T. Rowe Price represents the net income of the consolidated products, net of redeemable non-controlling interests. Management believes the consolidated sponsored investment products may impact the reader’s ability to understand the firm's core operating results.
(5) This non-GAAP adjustment represents the other non-operating income (loss) and the net gains (losses) earned on the firm's non-consolidated investment portfolio that are not designated as economic hedges of the supplemental savings plan liability and that are not part of the cash and discretionary investment portfolio. Management retains the investment gains recognized on the non-consolidated cash and discretionary investments as these assets and related income (loss) are considered part of the firm's core operations. Management believes adjusting for these non-operating income (loss) items helps the reader’s ability to understand the firm's core operating results and increases comparability to prior years. Additionally, management does not emphasize the impact of the portion of non-operating income (loss) removed when managing and evaluating the firm's performance.
12
(6) The income tax impacts were calculated in order to achieve an overall non-GAAP effective tax rate for the three months ended March 31, 2023 and 2022 of 30.3% and 24.2%, respectively. The firm estimates that its effective tax rate for the full-year 2023 on a non-GAAP basis will be in the range of 26.5% to 29.5%.
(7) This non-GAAP measure was calculated by applying the two-class method to adjusted net income attributable to T. Rowe Price Group divided by the weighted-average common shares outstanding assuming dilution. The calculation of adjusted net income allocated to common stockholders is as follows:
| Three months ended | |||||||||||
| 3/31/2023 | 3/31/2022 | 12/31/2022 | |||||||||
| Adjusted net income attributable to T. Rowe Price | $ | 389.4 | $ | 616.9 | $ | 399.6 | |||||
| Less: adjusted net income allocated to outstanding restricted stock and stock unit holders | 9.6 | 14.1 | 9.6 | ||||||||
| Adjusted net income allocated to common stockholders | $ | 379.8 | $ | 602.8 | $ | 390.0 | |||||
13