Exhibit 99.1
 | News Release | |||||||
TransUnion Announces Strong First Quarter 2021 Results
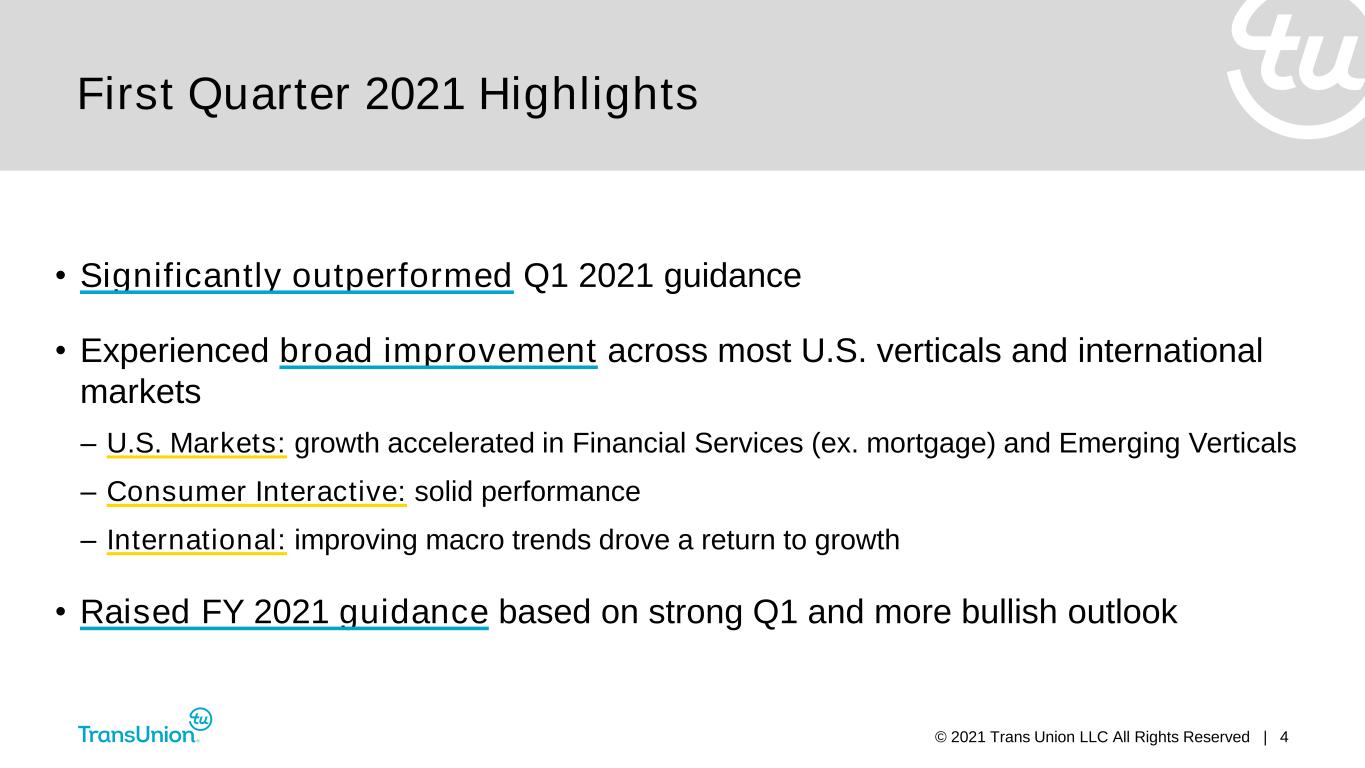
•Delivered strong growth with contributions from all three segments, driven by an accelerated economic recovery across most markets during the quarter and the benefit from ongoing business wins.
•Increased full year 2021 financial guidance to reflect first quarter out-performance and a more bullish view of the remainder of the year.
•Continuing to aggressively invest to position TransUnion for long-term sustained growth.
CHICAGO, April 27, 2021 - TransUnion (NYSE: TRU) (the “Company”) today announced financial results for the quarter ended March 31, 2021.
First Quarter 2021 Results
Revenue:
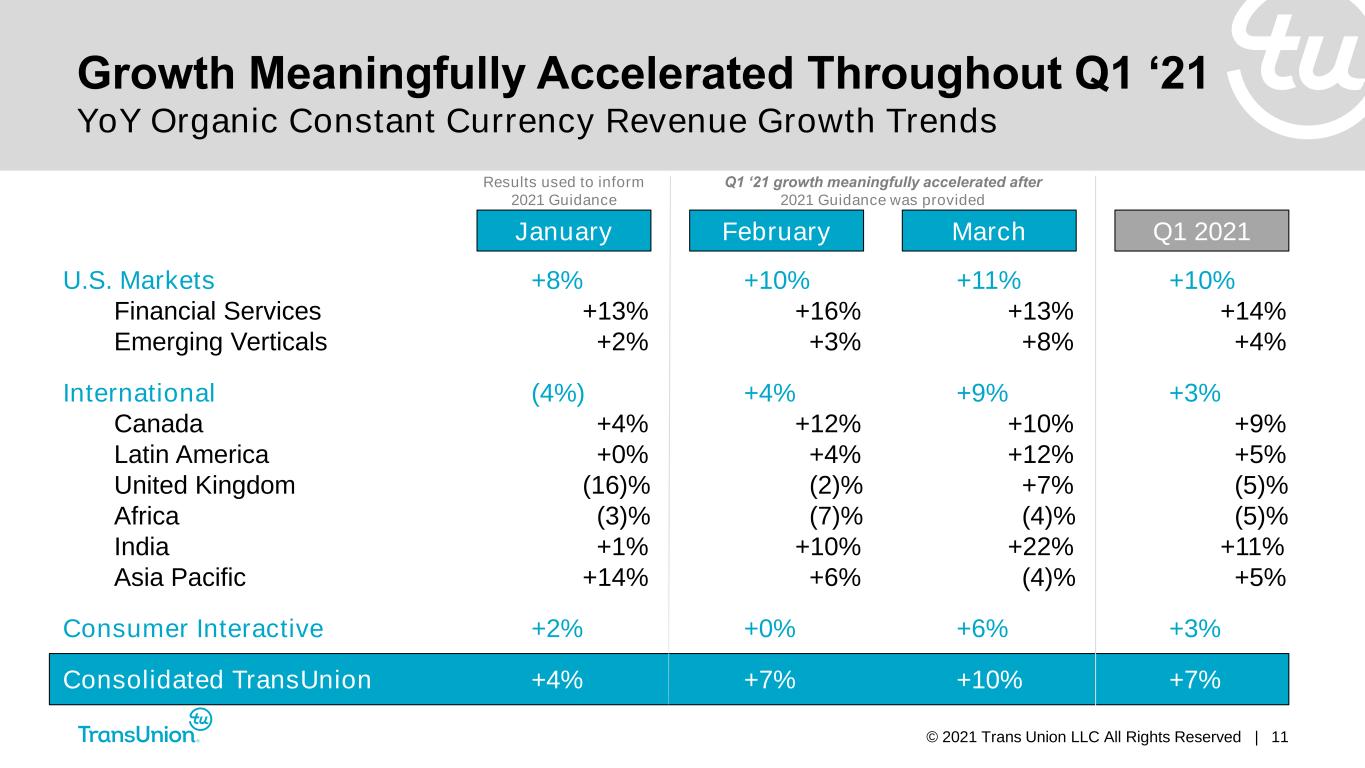
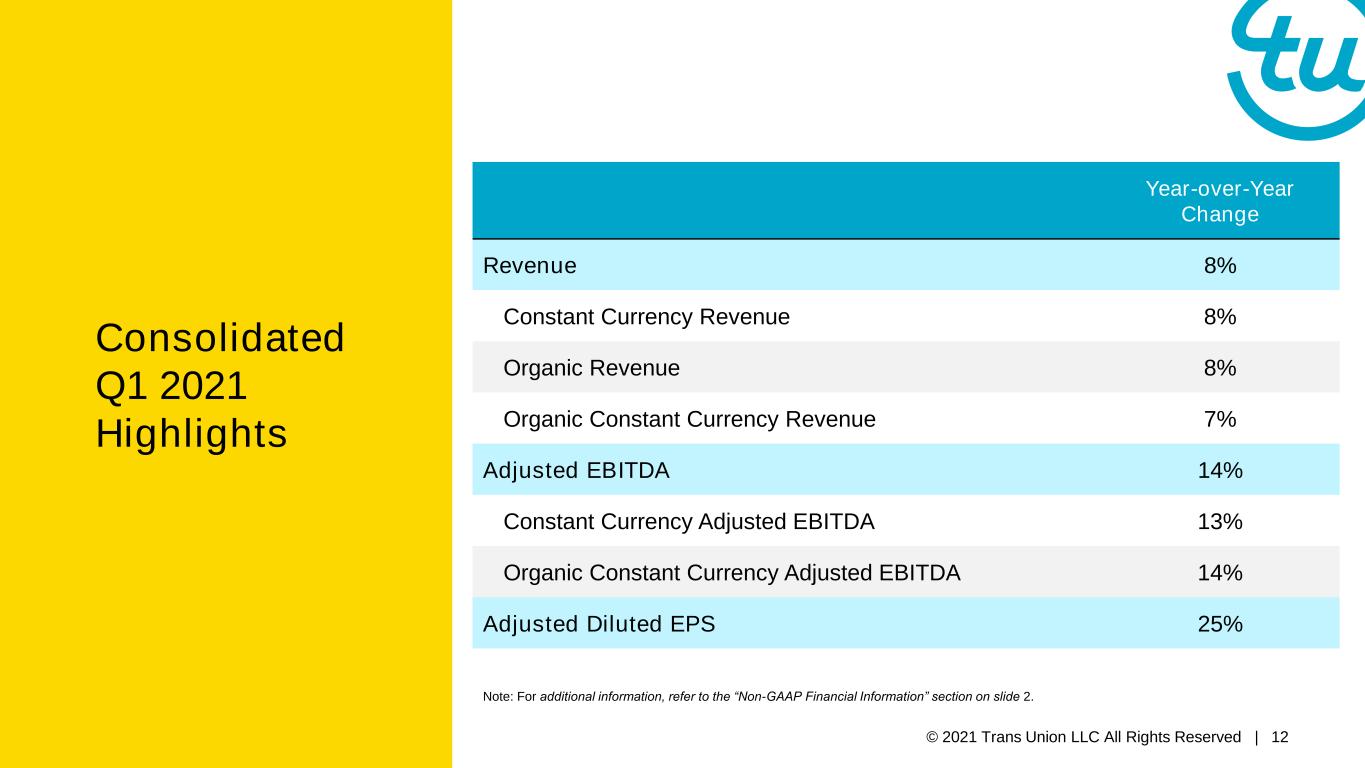
•Total revenue for the quarter was $745 million, an increase of 8 percent (8 percent on a constant currency basis, 7 percent on an organic constant currency basis) compared with the first quarter of 2020.
Earnings:
•Net income attributable to TransUnion was $128 million for the quarter, compared with $70 million for the first quarter of 2020. Diluted earnings per share was $0.67, compared with $0.37 for the first quarter of 2020.
•Adjusted Net Income was $176 million for the quarter, compared with $141 million for the first quarter of 2020. Adjusted Diluted Earnings per Share for the quarter was $0.91, compared with $0.73 for the first quarter of 2020.
•Adjusted EBITDA was $300 million for the quarter, an increase of 14 percent (13 percent on a constant currency basis, 14 percent on an organic constant currency basis) compared with the first quarter of 2020. Adjusted EBITDA margin was 40.3 percent, compared with 38.3 percent for the first quarter of 2020.
“TransUnion delivered a strong quarter driven by accelerating macroeconomic recovery across most of our markets as well as the benefits of our diversified portfolio and ongoing business wins,” said Chris Cartwright, President and CEO. “As a result, we out-performed our guidance and have raised our outlook for the remainder of the year to reflect the stronger underlying business conditions, particularly in the U.S., that have become more visible over the past several months.”
“As always, we remain focused on investing for long-term success and are benefiting from our Global Solutions and Global Operations as we continue to progress on-plan with Project Rise.”
First Quarter 2021 Segment Results
U.S. Markets:
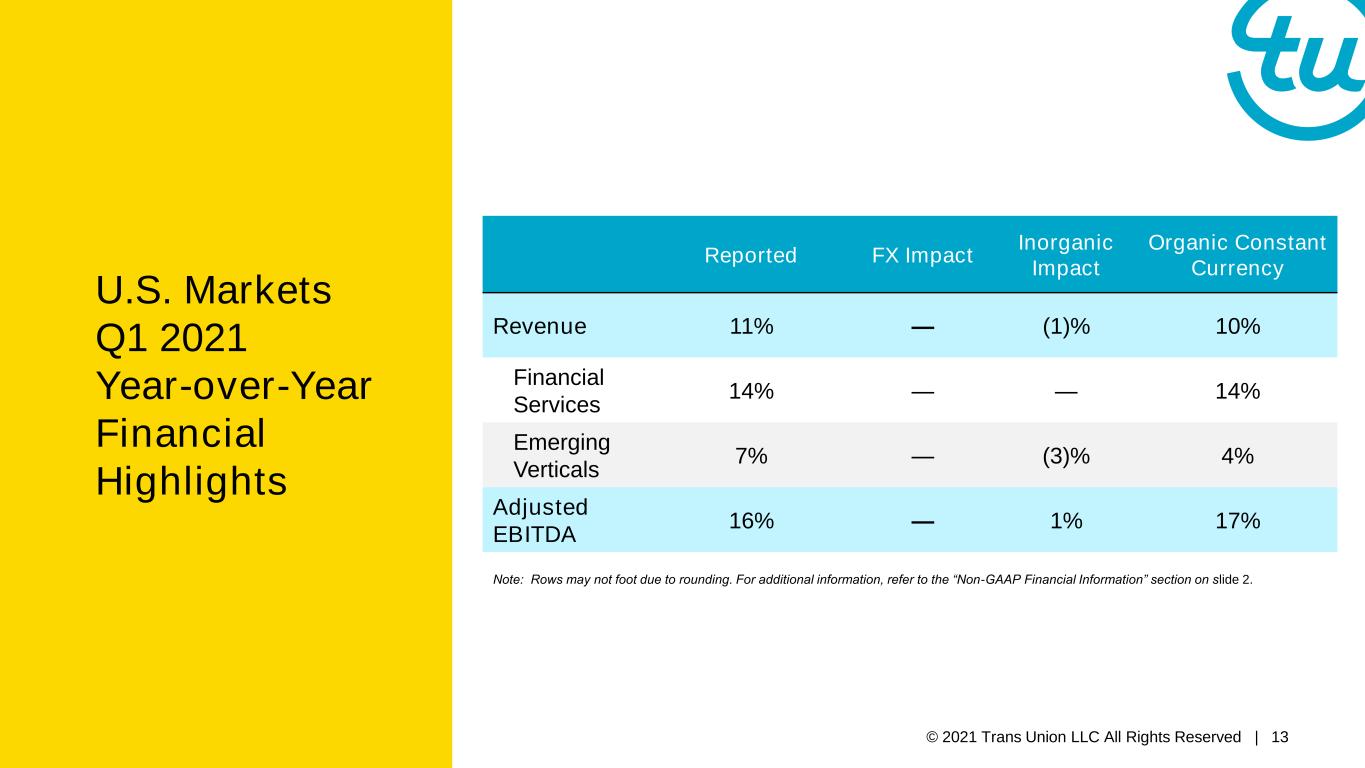
U.S. Markets revenue was $468 million, an increase of 11 percent (10 percent on an organic basis) compared with the first quarter of 2020.
•Financial Services revenue was $263 million, an increase of 14 percent compared with the first quarter of 2020.
•Emerging Verticals revenue, which includes Healthcare, Insurance and all other verticals, was $205 million, an increase of 7 percent (4 percent on an organic basis) compared with the first quarter of 2020.
Adjusted EBITDA was $199 million, an increase of 16 percent (17 percent on an organic basis) compared with the first quarter of 2020.
International:
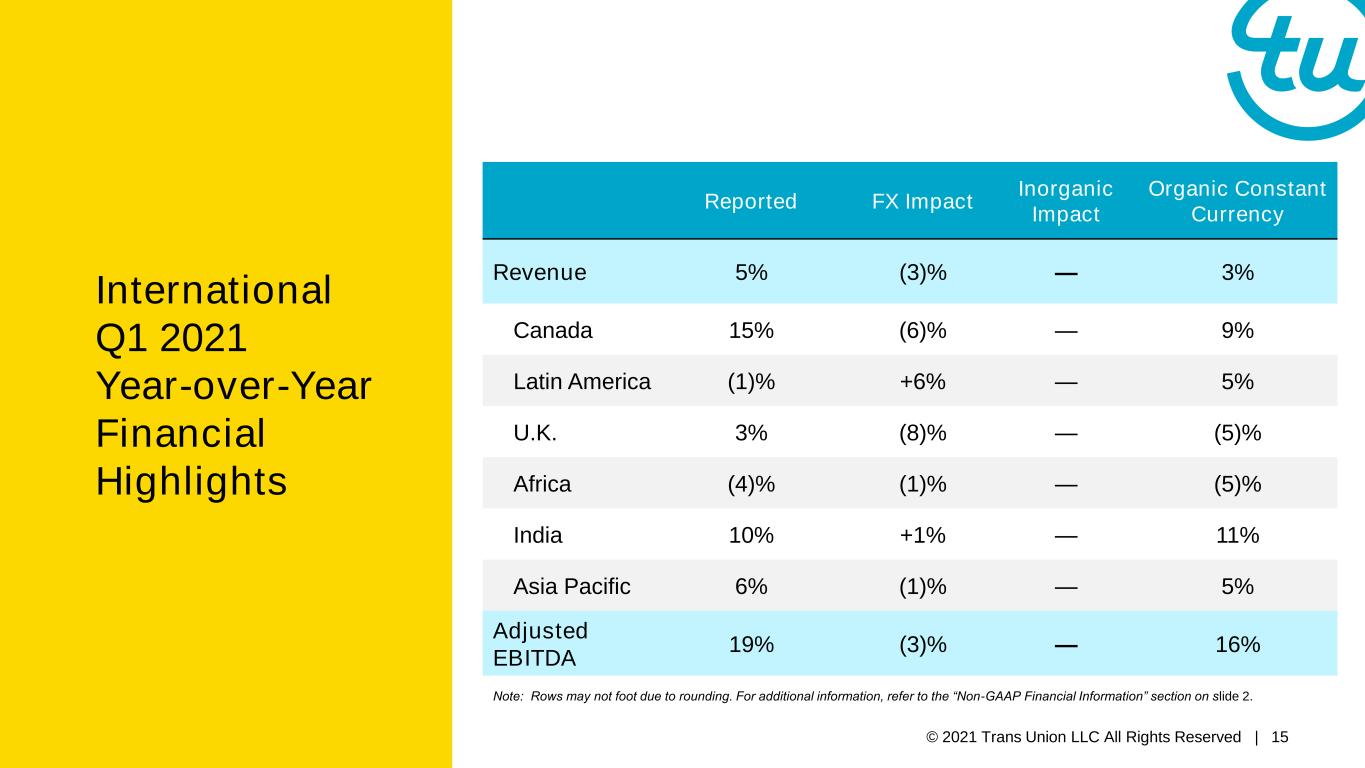
International revenue was $166 million, an increase of 5 percent (3 percent on a constant currency basis) compared with the first quarter of 2020.
•Canada revenue was $30 million, an increase of 15 percent (9 percent on a constant currency basis) compared with the first quarter of 2020.
•Latin America revenue was $24 million, a decrease of 1 percent (an increase of 5 percent on a constant currency basis) compared with the first quarter of 2020.
•United Kingdom revenue was $50 million, an increase of 3 percent (a decrease of 5 percent on a constant currency basis) compared with the first quarter of 2020.
•Africa revenue was $14 million, a decrease of 4 percent (5 percent on a constant currency basis) compared with the first quarter of 2020.
•India revenue was $34 million, an increase of 10 percent (11 percent on a constant currency basis) compared with the first quarter of 2020.
•Asia Pacific revenue was $14 million, an increase of 6 percent (5 percent on a constant currency basis) compared with the first quarter of 2020.
Adjusted EBITDA was $71 million, an increase of 19 percent (16 percent on a constant currency basis) compared with the first quarter of 2020.
Consumer Interactive:
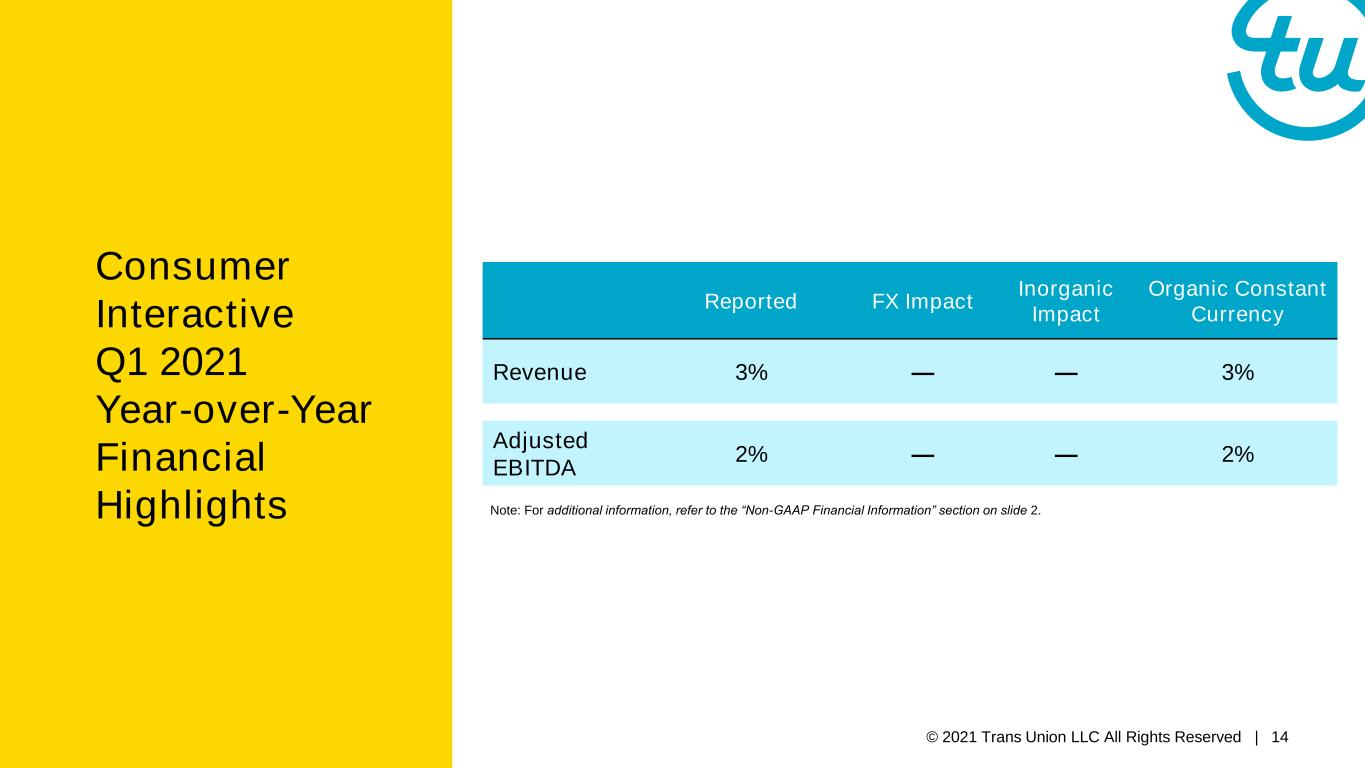
Consumer Interactive revenue was $130 million, an increase of 3 percent compared with the first quarter of 2020.
Adjusted EBITDA was $59 million, an increase of 2 percent compared with the first quarter of 2020.
Liquidity and Capital Resources
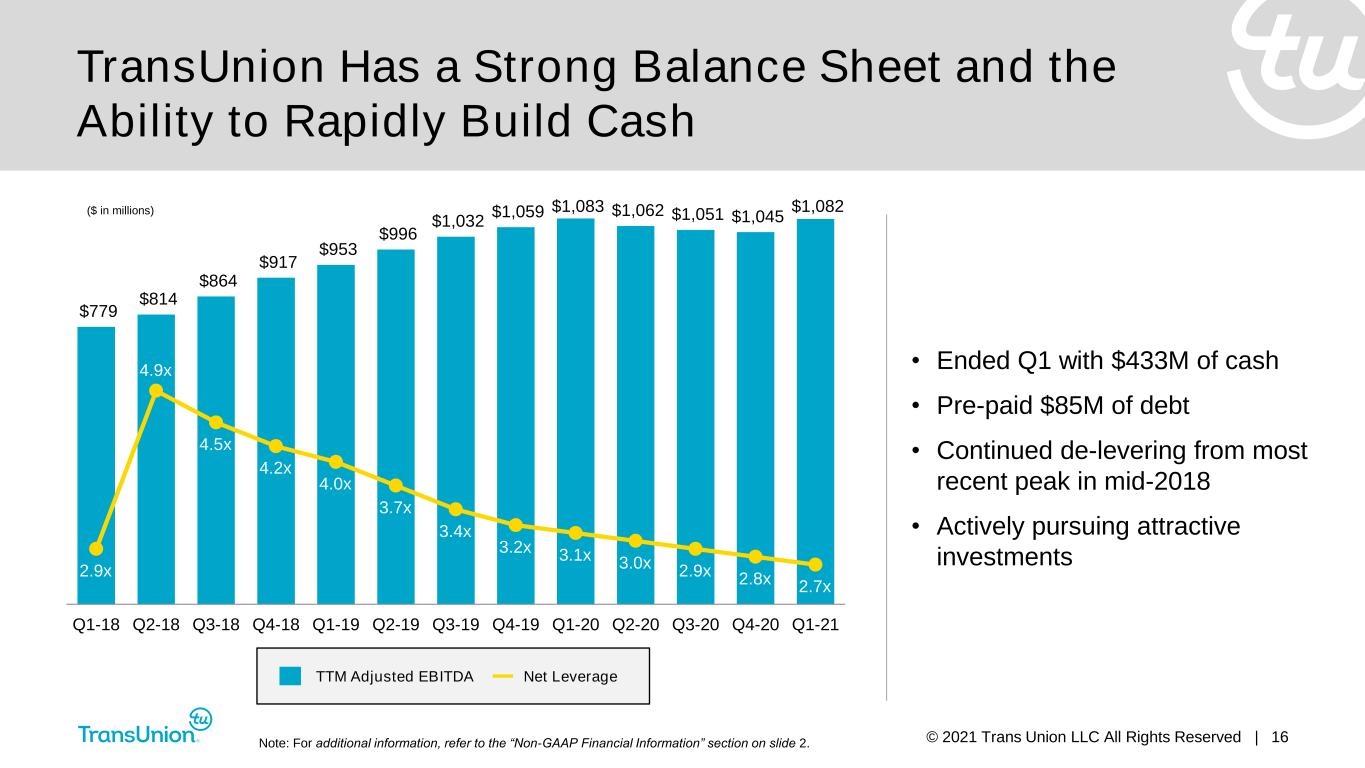
Cash and cash equivalents were $433 million at March 31, 2021 and $493 million at December 31, 2020. In addition, we had $300 million of undrawn capacity on our Senior Secured Revolving Credit Facility. At the end of March 2021, we prepaid $85 million of our debt. For the three months ended March 31, 2021, cash provided by continuing operations was $145 million compared with $126 million in 2020. The increase in cash provided by operations was due primarily to an increase in operating performance and a decrease in interest expense, partially offset by an increase in working capital. Cash used in investing activities was $72 million compared with $26 million in 2020. The increase in cash used in investing activities was due primarily to an increase in net purchases of other investments. Capital expenditures were $43 million compared with $42 million in 2020. Cash used in
financing activities was $132 million compared with $50 million in 2020. The increase in cash used in financing activities was due primarily to our $85 million prepayment of debt.
Second Quarter and Full Year 2021 Outlook
Our guidance is based on a number of assumptions that are subject to change, many of which are outside of the control of the Company. The extent to which COVID-19 impacts our business and results of operations continues to be inherently uncertain and will depend on numerous evolving factors that we may not be able to accurately predict. There can be no assurance that the Company will achieve the results expressed by this guidance.
2021 Full Year Outlook:
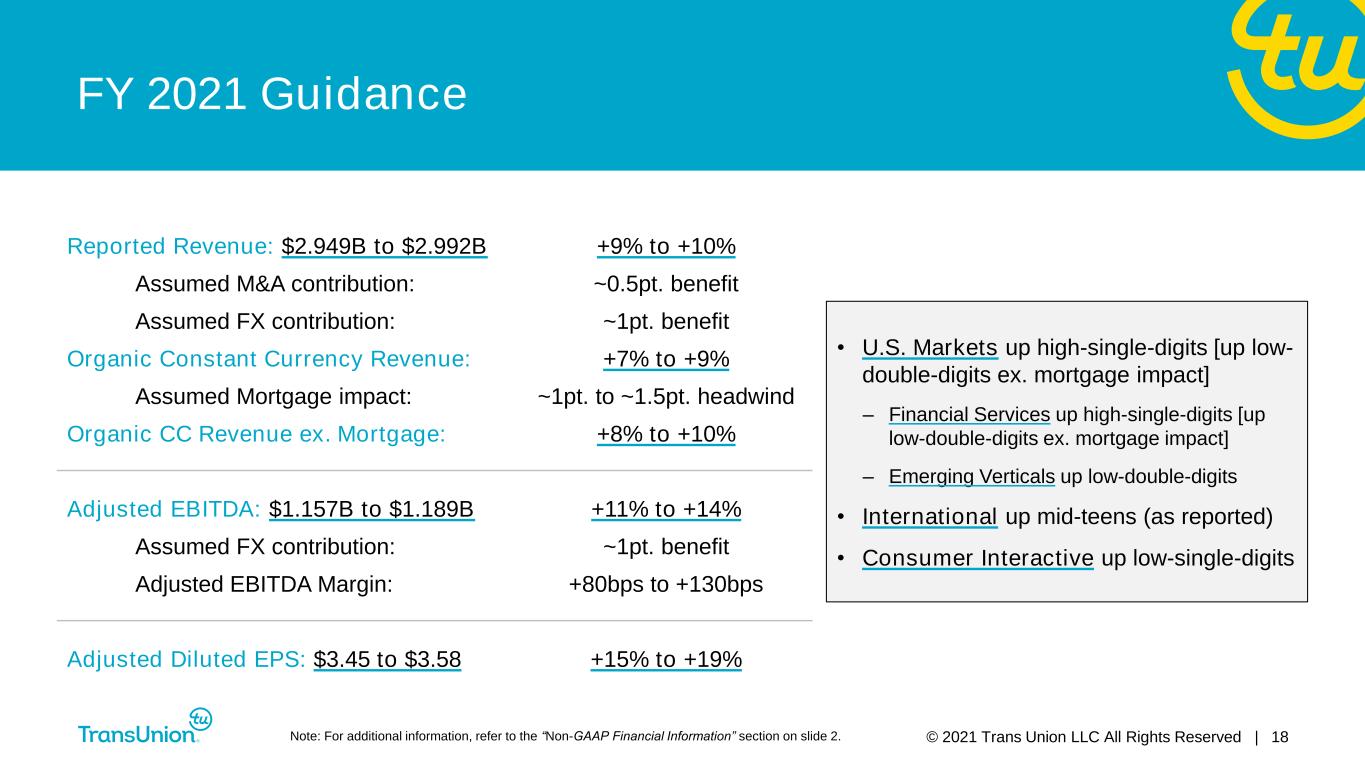
GAAP Outlook: For 2021, revenue is expected to be between $2.949 billion and $2.992 billion, an increase of 9 to 10 percent compared with 2020. Net income attributable to TransUnion is expected to be between $425 million and $449 million, an increase of 24 to 31 percent. Diluted earnings per share is expected to be between $2.20 and $2.33, an increase of 23 to 30 percent. The revenue growth includes approximately 0.5 percent of benefit from acquisitions and 1 percent of benefit from foreign exchange rates. In addition, the revenue growth rates include 1 percent to 1.5 percent of mortgage headwind.
Adjusted Outlook: For 2021, Adjusted EBITDA is expected to be between $1.157 billion and $1.189 billion, an increase of 11 to 14 percent compared with 2020. Adjusted Diluted Earnings per Share is expected to be between $3.45 and $3.58, an increase of 15 to 19 percent. The Adjusted EBITDA growth rates include approximately 1 percent of benefit from foreign exchange rates.
2021 Second Quarter Outlook:
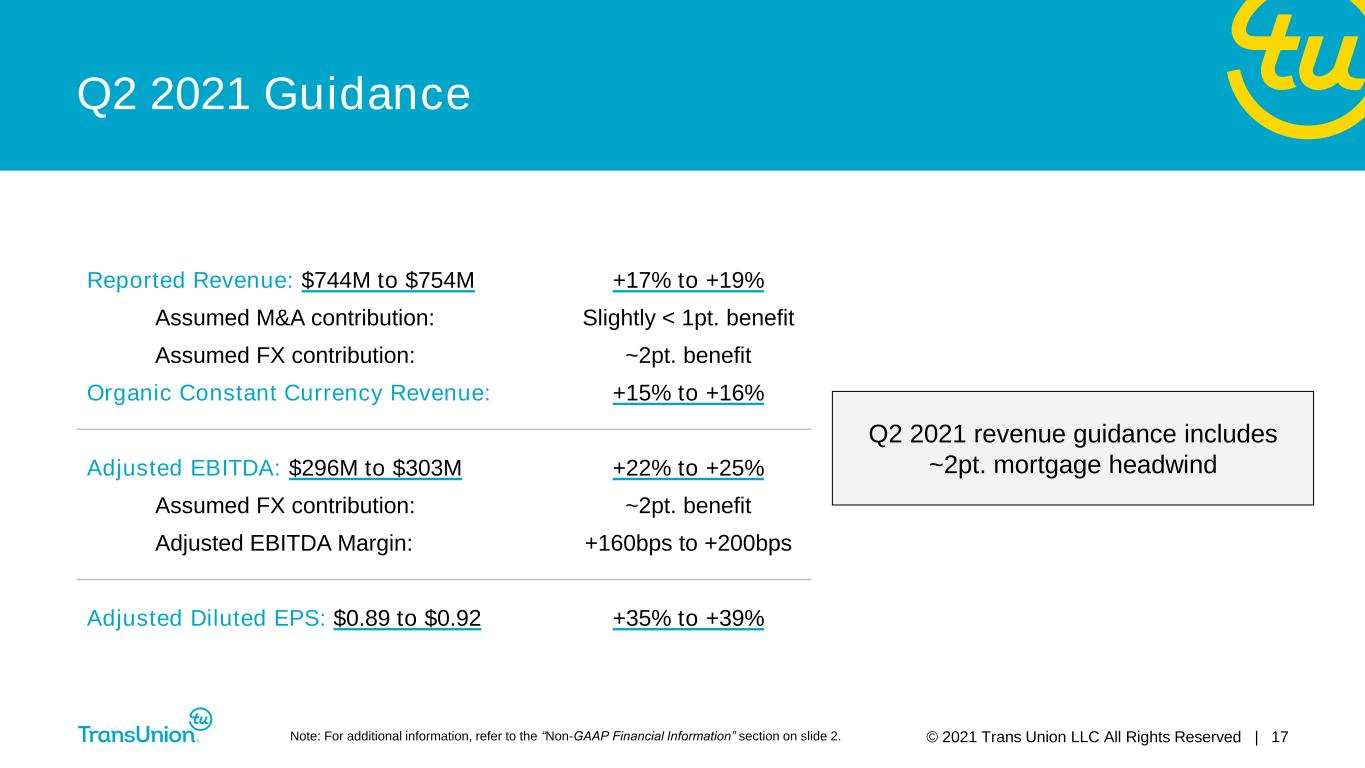
GAAP Outlook: For the second quarter of 2021, revenue is expected to be between $744 million and $754 million, an increase of 17 to 19 percent compared with the second quarter of 2020. Net income attributable to TransUnion is expected to be between $112 million and $117 million, an increase of 63 to 71 percent. Diluted earnings per share is expected to be between $0.58 and $0.61, an increase of 62 to 70 percent. The revenue growth includes slightly less than 1 percent of benefit from acquisitions and 2 percent of benefit from foreign exchange rates. In addition, the revenue growth rates include approximately 2 percent of headwind due to projected lower growth in mortgage revenue.
Adjusted Outlook: For the second quarter of 2021, Adjusted EBITDA is expected to be between $296 million and $303 million, an increase of 22 to 25 percent compared with the second quarter of 2020. Adjusted Diluted Earnings per Share is expected to be between $0.89 and $0.92, an increase of 35 to 39 percent. The Adjusted EBITDA growth rates include approximately 2 percent of benefit from foreign exchange rates.
Earnings Webcast Details
In conjunction with this release, TransUnion will host a conference call and webcast today at 8:30 a.m. Central Time to discuss the business results for the quarter and certain forward-looking information. This session and the accompanying presentation materials may be accessed at www.transunion.com/tru. A replay of the call will also be available at this website following the conclusion of the call.
About TransUnion
TransUnion is a global information and insights company that makes trust possible in the modern economy. We do this by providing a comprehensive picture of each person so they can be reliably and safely represented in the marketplace. As a result, businesses and consumers can transact with confidence and achieve great things. We call this Information for Good.
A leading presence in more than 30 countries across five continents, TransUnion provides solutions that help create economic opportunity, great experiences and personal empowerment for hundreds of millions of people.
http://www.transunion.com/business
Availability of Information on TransUnion’s Website
Investors and others should note that TransUnion routinely announces material information to investors and the marketplace using SEC filings, press releases, public conference calls, webcasts and the TransUnion Investor Relations website. While not all of the information that the Company posts to the TransUnion Investor Relations website is of a material nature, some information could be deemed to be material. Accordingly, the Company encourages investors, the media and others interested in TransUnion to review the information that it shares on www.transunion.com/tru.
Non-GAAP Financial Measures
This earnings release presents constant currency growth rates assuming foreign currency exchange rates are consistent between years. This allows financial results to be evaluated without the impact of fluctuations in foreign currency exchange rates. This earnings release also presents organic constant currency growth rates, which assumes consistent foreign currency exchange rates between years and also eliminates the impact of our recent acquisitions. This allows financial results to be evaluated without the impact of fluctuations in foreign currency exchange rates and the impacts of recent acquisitions.
This earnings release also presents Adjusted EBITDA, Adjusted EBITDA Margin, Adjusted Effective Tax Rate, Adjusted Net Income (Loss) and Adjusted Diluted Earnings per Share for all periods presented. These are important financial measures for the Company but are not financial measures as defined by GAAP. We present Adjusted EBITDA and Adjusted Net Income as supplemental measures of our operating performance because these measures eliminate the impact of certain items that we do not consider indicative of our cash operations and ongoing operating performance. Adjusted EBITDA is also a measure frequently used by securities analysts, investors and other interested parties in their evaluation of the operating performance of companies similar to ours. Our board of directors and executive management team use Adjusted EBITDA as compensation measures. Under the credit agreement governing our Senior Secured Credit Facility, our ability to engage in activities such as incurring additional indebtedness, making investments and paying dividends is tied to a ratio based on Adjusted EBITDA. These financial measures should be reviewed in conjunction with the relevant GAAP financial measures and are not presented as alternative measures of GAAP. Other companies in our industry may define or calculate these measures differently than we do, limiting their usefulness as comparative measures. Because of these limitations, these non-GAAP financial measures should not be considered in isolation or as substitutes for performance measures calculated in accordance with GAAP, including operating income, operating margin, effective tax rate, net income (loss) attributable to the Company, earnings per share or cash provided by operating activities. Reconciliations of these non-GAAP financial measures to the most directly comparable GAAP financial measures are presented in the attached Schedules.
We define Adjusted EBITDA as net income (loss) attributable to TransUnion plus net interest expense, plus (less) provision (benefit) for income taxes, plus depreciation and amortization, plus stock-based compensation, plus mergers, acquisitions, divestitures and business optimization-related expenses, plus certain accelerated technology investment expenses to migrate to the cloud, plus (less) certain other expenses (income). We define Adjusted Net Income as net income (loss) attributable to TransUnion plus stock-based compensation, plus mergers, acquisitions, divestitures and business optimization-related expenses, plus certain accelerated technology investment expenses, plus (less) certain other expenses (income), plus amortization of certain intangible assets, plus or minus the related changes in provision for income taxes. We define Adjusted Diluted Earnings per Share as Adjusted Net Income divided by the weighted-average diluted shares outstanding. The above definitions apply to our calculations for the periods shown on Schedules 1 through 6.
Forward-Looking Statements
This earnings release contains forward-looking statements within the meaning of the Private Securities Litigation Reform Act of 1995. These statements are based on the current beliefs and expectations of TransUnion’s management and are subject to significant risks and uncertainties. Actual results may differ materially from those described in the forward-looking statements. Any statements made in this earnings release that are not statements of historical fact, including statements about our beliefs and expectations, are forward-looking statements. Forward-looking statements include information concerning possible or assumed future results of operations, including our guidance and descriptions of our business plans and strategies. These statements often include words such as “anticipate,” “expect,” “guidance,” “suggest,” “plan,” “believe,” “intend,” “estimate,” “target,” “project,” “should,” “could,” “would,” “may,” “will,” “forecast,” “outlook,” “potential,” “continues,” “seeks,” “predicts,” or the negative of these words and other similar expressions. Factors that could cause actual results to differ materially from those described in the forward-looking statements include: the effects of the COVID-19 pandemic; the duration of the COVID-19 pandemic and the timing of the recovery from the COVID-19 pandemic; the existence and prevalence of variants of the COVID-19 virus; macroeconomic and industry trends and adverse developments in the debt, consumer credit and financial services markets; our ability to provide competitive services and prices; our ability to retain or renew existing agreements with large or long-term customers; our ability to maintain the security and integrity of our data; our ability to deliver services timely without interruption; our ability to maintain our access to data sources; government regulation and changes in the regulatory environment; litigation or regulatory proceedings; regulatory oversight of “critical activities”; our ability to effectively manage our costs; economic and political stability in the United States and international markets where we operate; our ability to effectively develop and maintain strategic alliances and joint ventures; our ability to timely develop new services and the market’s willingness to adopt our new services; our ability to manage and expand our operations and keep up with rapidly changing technologies; our ability to make acquisitions, successfully integrate the operations of acquired businesses and realize the intended benefits of such acquisitions; our ability to protect and enforce our intellectual property, trade secrets and other forms of unpatented intellectual property; our ability to defend our intellectual property from infringement claims by third parties; the ability of our outside service providers and key vendors to fulfill their obligations to us; further consolidation in our end-customer markets; the increased availability of free or inexpensive consumer information; losses against which we do not insure; our ability to make timely payments of principal and interest on our indebtedness; our ability to satisfy covenants in the agreements governing our indebtedness; our ability to maintain our liquidity; share repurchase plans; our reliance on key management personnel; and other one-time events and other factors that can be found in our Annual Report on Form 10-K for the year ended December 31, 2020, and any subsequent Quarterly Report on Form 10-Q or Current Report on Form 8-K, which are filed with the Securities and Exchange Commission and are available on TransUnion’s website (www.transunion.com/tru) and on the Securities and Exchange Commission’s website (www.sec.gov). Many of these factors are beyond our control. The forward-looking statements contained in this earnings release speak only as of the date of this earnings release. We undertake no obligation to publicly release the result of any revisions to these forward-looking statements to reflect the impact of events or circumstances that may arise after the date of this earnings release.
In addition to factors previously disclosed in TransUnion’s reports filed with the Securities and Exchange Commission and those identified elsewhere in this press release, the following factors, among others, could cause actual results to differ materially from forward-looking statements or historical performance: failure to realize the benefits expected from the recent business acquisitions; the effects of pending and future legislation; risks related to disruption of management time from ongoing business operations due to the recent business acquisitions; macroeconomic factors beyond TransUnion’s control; risks related to TransUnion’s indebtedness and other consequences associated with mergers, acquisitions and divestitures, and legislative and regulatory actions and reforms.
For More Information
E-mail: [email protected]
Telephone: 312.985.2860
Exhibit 99.1
TRANSUNION AND SUBSIDIARIES
Consolidated Balance Sheets (Unaudited)
(in millions, except per share data)
| March 31, 2021 | December 31, 2020 | |||||||||||||
| Assets | ||||||||||||||
| Current assets: | ||||||||||||||
| Cash and cash equivalents | $ | 433.0 | $ | 493.0 | ||||||||||
| Trade accounts receivable, net of allowance of $26.9 and $26.6 | 488.1 | 453.7 | ||||||||||||
| Other current assets | 202.3 | 159.5 | ||||||||||||
| Total current assets | 1,123.4 | 1,106.2 | ||||||||||||
| Property, plant and equipment, net of accumulated depreciation and amortization of $582.4 and $548.9 | 215.0 | 223.2 | ||||||||||||
| Goodwill | 3,454.8 | 3,461.5 | ||||||||||||
| Other intangibles, net of accumulated amortization of $1,799.8 and $1,752.2 | 2,242.7 | 2,284.6 | ||||||||||||
| Other assets | 251.7 | 236.1 | ||||||||||||
| Total assets | $ | 7,287.6 | $ | 7,311.6 | ||||||||||
| Liabilities and stockholders’ equity | ||||||||||||||
| Current liabilities: | ||||||||||||||
| Trade accounts payable | $ | 203.5 | $ | 193.2 | ||||||||||
| Short-term debt and current portion of long-term debt | 62.7 | 55.5 | ||||||||||||
| Other current liabilities | 364.0 | 415.8 | ||||||||||||
| Total current liabilities | 630.2 | 664.5 | ||||||||||||
| Long-term debt | 3,293.3 | 3,398.7 | ||||||||||||
| Deferred taxes | 407.8 | 396.8 | ||||||||||||
| Other liabilities | 193.2 | 215.5 | ||||||||||||
| Total liabilities | 4,524.5 | 4,675.5 | ||||||||||||
| Stockholders’ equity: | ||||||||||||||
| Common stock, $0.01 par value; 1.0 billion shares authorized at March 31, 2021 and December 31, 2020, 196.8 million and 195.7 million shares issued at March 31, 2021 and December 31, 2020, respectively, and 191.3 million shares and 190.5 million shares outstanding as of March 31, 2021 and December 31, 2020, respectively | 2.0 | 2.0 | ||||||||||||
| Additional paid-in capital | 2,116.8 | 2,088.1 | ||||||||||||
| Treasury stock at cost; 5.5 million and 5.2 million shares at March 31, 2021 and December 31, 2020, respectively | (243.8) | (215.2) | ||||||||||||
| Retained earnings | 1,050.8 | 937.4 | ||||||||||||
| Accumulated other comprehensive loss | (260.3) | (272.1) | ||||||||||||
| Total TransUnion stockholders’ equity | 2,665.5 | 2,540.2 | ||||||||||||
| Noncontrolling interests | 97.6 | 95.9 | ||||||||||||
| Total stockholders’ equity | 2,763.1 | 2,636.1 | ||||||||||||
| Total liabilities and stockholders’ equity | $ | 7,287.6 | $ | 7,311.6 | ||||||||||
Exhibit 99.1
TRANSUNION AND SUBSIDIARIES
Consolidated Statements of Income (Unaudited)
(in millions, except per share data)
| Three Months Ended March 31, | ||||||||||||||
| 2021 | 2020 | |||||||||||||
| Revenue | $ | 745.3 | $ | 687.6 | ||||||||||
| Operating expenses | ||||||||||||||
| Cost of services (exclusive of depreciation and amortization below) | 243.2 | 225.1 | ||||||||||||
| Selling, general and administrative | 227.2 | 235.4 | ||||||||||||
| Depreciation and amortization | 94.3 | 90.3 | ||||||||||||
| Total operating expenses | 564.6 | 550.8 | ||||||||||||
| Operating income | 180.7 | 136.8 | ||||||||||||
| Non-operating income and (expense) | ||||||||||||||
| Interest expense | (25.8) | (37.7) | ||||||||||||
| Interest income | 0.7 | 1.9 | ||||||||||||
| Earnings from equity method investments | 3.0 | 2.6 | ||||||||||||
| Other income and (expense), net | (0.4) | (7.0) | ||||||||||||
| Total non-operating income and (expense) | (22.5) | (40.2) | ||||||||||||
| Income before income taxes | 158.2 | 96.6 | ||||||||||||
| Provision for income taxes | (27.5) | (22.3) | ||||||||||||
| Net income | 130.6 | 74.3 | ||||||||||||
| Less: net (income) loss attributable to the noncontrolling interests | (2.7) | (4.1) | ||||||||||||
| Net income attributable to TransUnion | $ | 127.9 | $ | 70.2 | ||||||||||
| Weighted-average shares outstanding: | ||||||||||||||
| Basic | 190.9 | 189.2 | ||||||||||||
| Diluted | 192.5 | 192.2 | ||||||||||||
| Earnings per share: | ||||||||||||||
| Basic | $ | 0.67 | $ | 0.37 | ||||||||||
| Diluted | $ | 0.66 | $ | 0.37 | ||||||||||
As a result of displaying amounts in millions, rounding differences may exist in the table above.
Exhibit 99.1
TRANSUNION AND SUBSIDIARIES
Consolidated Statements of Cash Flows (Unaudited)
(in millions)
| Three Months Ended March 31, | ||||||||||||||
| 2021 | 2020 | |||||||||||||
| Cash flows from operating activities: | ||||||||||||||
| Net income | $ | 130.6 | $ | 74.3 | ||||||||||
| Adjustments to reconcile net income to net cash provided by operating activities: | ||||||||||||||
| Depreciation and amortization | 94.3 | 90.3 | ||||||||||||
| Net gain on investments in affiliated companies and assets of businesses held for sale | (0.5) | (1.8) | ||||||||||||
| Deferred taxes | 4.0 | (0.6) | ||||||||||||
| Stock-based compensation | 17.9 | 4.9 | ||||||||||||
| Provision for losses on trade accounts receivable | 1.1 | 6.2 | ||||||||||||
| Other | 0.5 | 1.3 | ||||||||||||
| Changes in assets and liabilities: | ||||||||||||||
| Trade accounts receivable | (35.3) | (40.6) | ||||||||||||
| Other current and long-term assets | (23.4) | (0.5) | ||||||||||||
| Trade accounts payable | 7.2 | 12.3 | ||||||||||||
| Other current and long-term liabilities | (51.6) | (20.3) | ||||||||||||
| Cash provided by operating activities | 144.8 | 125.5 | ||||||||||||
| Cash flows from investing activities: | ||||||||||||||
| Capital expenditures | (43.2) | (42.0) | ||||||||||||
| Proceeds from sale/maturities of other investments | 1.5 | 19.4 | ||||||||||||
| Purchases of other investments | (19.8) | (0.2) | ||||||||||||
| Purchases of convertible notes and investments in nonconsolidated affiliates | (10.0) | (5.2) | ||||||||||||
| Other | (0.4) | 2.5 | ||||||||||||
| Cash used in investing activities | (71.9) | (25.5) | ||||||||||||
| Cash flows from financing activities: | ||||||||||||||
| Repayments of debt | (99.6) | (13.8) | ||||||||||||
| Proceeds from issuance of common stock and exercise of stock options | 10.1 | 10.9 | ||||||||||||
| Dividends to shareholders | (15.0) | (14.7) | ||||||||||||
| Employee taxes paid on restricted stock units recorded as treasury stock | (27.7) | (32.1) | ||||||||||||
| Cash used in financing activities | (132.2) | (49.7) | ||||||||||||
| Effect of exchange rate changes on cash and cash equivalents | (0.7) | (18.7) | ||||||||||||
| Net change in cash and cash equivalents | (60.0) | 31.6 | ||||||||||||
| Cash and cash equivalents, beginning of period | 493.0 | 274.1 | ||||||||||||
| Cash and cash equivalents, end of period | $ | 433.0 | $ | 305.7 | ||||||||||
As a result of displaying amounts in millions, rounding differences may exist in the table above.
Exhibit 99.1
SCHEDULE 1
TRANSUNION AND SUBSIDIARIES
Revenue and Adjusted EBITDA growth rates as Reported, CC, Inorganic, Organic and Organic CC (Unaudited)
| For the Three Months Ended March 31, 2021 compared with the Three Months Ended March 31, 2020 | ||||||||||||||||||||||||||||||||
| Reported | CC Growth(1) | Inorganic(2) | Organic Growth(3) | Organic CC Growth(4) | ||||||||||||||||||||||||||||
| Revenue: | ||||||||||||||||||||||||||||||||
| Consolidated | 8.4 | % | 7.8 | % | 0.8 | % | 7.6 | % | 7.0 | % | ||||||||||||||||||||||
| U.S. Markets | 11.0 | % | 10.9 | % | 1.3 | % | 9.7 | % | 9.7 | % | ||||||||||||||||||||||
| Financial Services | 14.2 | % | 14.2 | % | — | % | 14.1 | % | 14.1 | % | ||||||||||||||||||||||
| Emerging Verticals | 7.1 | % | 7.0 | % | 2.8 | % | 4.3 | % | 4.3 | % | ||||||||||||||||||||||
| International | 5.4 | % | 2.9 | % | — | % | 5.4 | % | 2.9 | % | ||||||||||||||||||||||
| Canada | 14.7 | % | 8.5 | % | — | % | 14.7 | % | 8.5 | % | ||||||||||||||||||||||
| Latin America | (0.9) | % | 4.9 | % | — | % | (0.9) | % | 4.9 | % | ||||||||||||||||||||||
| United Kingdom | 3.1 | % | (4.6) | % | — | % | 3.1 | % | (4.6) | % | ||||||||||||||||||||||
| Africa | (4.2) | % | (4.8) | % | — | % | (4.2) | % | (4.8) | % | ||||||||||||||||||||||
| India | 10.2 | % | 11.0 | % | — | % | 10.2 | % | 11.0 | % | ||||||||||||||||||||||
| Asia Pacific | 5.8 | % | 5.0 | % | — | % | 5.8 | % | 5.0 | % | ||||||||||||||||||||||
| Consumer Interactive | 2.9 | % | 2.9 | % | — | % | 2.9 | % | 2.9 | % | ||||||||||||||||||||||
| Adjusted EBITDA: | ||||||||||||||||||||||||||||||||
| Consolidated | 14.1 | % | 13.5 | % | (0.8) | % | 14.9 | % | 14.3 | % | ||||||||||||||||||||||
| U.S. Markets | 15.9 | % | 15.9 | % | (1.3) | % | 17.2 | % | 17.2 | % | ||||||||||||||||||||||
| International | 18.6 | % | 16.0 | % | — | % | 18.6 | % | 16.0 | % | ||||||||||||||||||||||
| Consumer Interactive | 2.0 | % | 2.0 | % | — | % | 2.0 | % | 2.0 | % | ||||||||||||||||||||||
(1)Constant Currency (“CC”) growth rates assume foreign currency exchange rates are consistent between years. This allows financial results to be evaluated without the impact of fluctuations in foreign currency exchange rates.
(2)Inorganic growth rate represents growth attributable to the first twelve months of activity for recent business acquisitions.
(3)Organic growth rate is the reported growth rate less the inorganic growth rate.
(4)Organic CC growth rate is the CC growth rate less inorganic growth rate.
Exhibit 99.1
SCHEDULE 2
TRANSUNION AND SUBSIDIARIES
Consolidated and Segment Revenue, Adjusted EBITDA, and Adjusted EBITDA Margins (Unaudited)
(dollars in millions)
| Three Months Ended March 31, | |||||||||||
| 2021 | 2020 | ||||||||||
| Revenue: | |||||||||||
| U.S. Markets gross revenue | |||||||||||
| Financial Services | $ | 263.1 | $ | 230.4 | |||||||
| Emerging Verticals | 205.0 | 191.5 | |||||||||
| Total U.S. Markets gross revenue | $ | 468.1 | $ | 421.9 | |||||||
| International gross revenue | |||||||||||
| Canada | $ | 30.4 | $ | 26.5 | |||||||
| Latin America | 24.1 | 24.3 | |||||||||
| United Kingdom | 50.3 | 48.8 | |||||||||
| Africa | 13.7 | 14.3 | |||||||||
| India | 34.0 | 30.8 | |||||||||
| Asia Pacific | 13.8 | 13.0 | |||||||||
| Total International gross revenue | $ | 166.3 | $ | 157.7 | |||||||
| Consumer Interactive gross revenue | $ | 130.4 | $ | 126.7 | |||||||
| Less: intersegment eliminations | |||||||||||
| U.S. Markets | $ | (17.4) | $ | (17.1) | |||||||
| International | (1.4) | (1.3) | |||||||||
| Consumer Interactive | (0.5) | (0.4) | |||||||||
| Total intersegment eliminations | $ | (19.4) | $ | (18.7) | |||||||
| Total revenue, as reported | $ | 745.3 | $ | 687.6 | |||||||
| Adjusted EBITDA: | |||||||||||
| U.S. Markets | $ | 198.8 | $ | 171.5 | |||||||
| International | 71.4 | 60.2 | |||||||||
| Consumer Interactive | 58.5 | 57.4 | |||||||||
| Corporate | (28.4) | (25.8) | |||||||||
| Consolidated Adjusted EBITDA | $ | 300.4 | $ | 263.4 | |||||||
| Adjusted EBITDA margin: | |||||||||||
| U.S. Markets | 42.5 | % | 40.7 | % | |||||||
| International | 42.9 | % | 38.2 | % | |||||||
| Consumer Interactive | 44.9 | % | 45.3 | % | |||||||
| Consolidated | 40.3 | % | 38.3 | % | |||||||
Segment Adjusted EBITDA margins are calculated using segment gross revenue and segment Adjusted EBITDA. Consolidated Adjusted EBITDA margin is calculated using total revenue as reported and consolidated Adjusted EBITDA.
Exhibit 99.1
| Three Months Ended March 31, | |||||||||||
| 2021 | 2020 | ||||||||||
| Reconciliation of net income attributable to TransUnion to consolidated Adjusted EBITDA: | |||||||||||
| Net income attributable to TransUnion | $ | 127.9 | $ | 70.2 | |||||||
| Net interest expense | 25.1 | 35.8 | |||||||||
| Provision for income taxes | 27.5 | 22.3 | |||||||||
| Depreciation and amortization | 94.3 | 90.3 | |||||||||
| EBITDA | 274.8 | 218.5 | |||||||||
| Adjustments to EBITDA: | |||||||||||
Stock-based compensation(1) | 16.3 | 2.3 | |||||||||
Mergers and acquisitions, divestitures and business optimization(2) | 1.8 | 4.3 | |||||||||
Accelerated technology investment(3) | 7.3 | 2.5 | |||||||||
Net other(4) | 0.1 | 35.7 | |||||||||
| Total adjustments to EBITDA | 25.6 | 44.8 | |||||||||
| Consolidated Adjusted EBITDA | $ | 300.4 | $ | 263.4 | |||||||
| Net income attributable to TransUnion as a percentage of revenue | 17.2 | % | 10.2 | % | |||||||
| Consolidated Adjusted EBITDA margin | 40.3 | % | 38.3 | % | |||||||
As a result of displaying amounts in millions, rounding differences may exist in the tables above and footnotes below.
(1)Consisted of stock-based compensation and cash-settled stock-based compensation.
(2)For the three months ended March 31, 2021, consisted of the following adjustments: $1.1 million of adjustments to contingent consideration expense from previous acquisitions; $1.1 million of acquisition expenses; and a $(0.5) gain on the sale of a cost method investment.
For the three months ended March 31, 2020, consisted of the following adjustments: $3.8 million of Callcredit integration costs; $2.1 million of acquisition expenses; $0.3 million of adjustments to contingent consideration expense from previous acquisitions; a ($1.8) million gain on the disposal of assets of a small business in our United Kingdom region that are classified as held-for-sale; and a ($0.1) million reimbursement for transition services provided to the buyers of certain of our discontinued operations.
(3)Represents expenses associated with our accelerated technology investment.
(4)For the three months ended March 31, 2021, consisted of the following adjustments: $0.1 million of net other which includes deferred loan fees written off as a result of prepayments on our debt, loan fees, and gain from currency remeasurement of our foreign operations.
For the three months ended March 31, 2020, consisted of the following adjustments: $30.5 million for certain legal expenses; a $4.9 million loss from currency remeasurement of our foreign operations; and $0.3 million of net other, which includes loan fees, fees related to our new swap agreement, administrative expenses associated with the Fraud Incident, and a reimbursement of fees associated with the refinancing of our Senior Secured Credit Facility.
Exhibit 99.1
SCHEDULE 3
TRANSUNION AND SUBSIDIARIES
Adjusted Net Income and Adjusted Earnings Per Share (Unaudited)
(in millions, except per share data)
| Three Months Ended March 31, | ||||||||||||||
| 2021 | 2020 | |||||||||||||
| Net income attributable to TransUnion | $ | 127.9 | $ | 70.2 | ||||||||||
| Weighted-average shares outstanding: | ||||||||||||||
| Basic | 190.9 | 189.2 | ||||||||||||
| Diluted | 192.5 | 192.2 | ||||||||||||
| Earnings per share: | ||||||||||||||
| Basic | $ | 0.67 | $ | 0.37 | ||||||||||
| Diluted | $ | 0.66 | $ | 0.37 | ||||||||||
| Reconciliation of net income attributable to TransUnion to Adjusted Net Income: | ||||||||||||||
| Net income attributable to TransUnion | $ | 127.9 | $ | 70.2 | ||||||||||
| Adjustments before income tax items: | ||||||||||||||
Stock-based compensation(1) | 16.3 | 2.3 | ||||||||||||
Mergers and acquisitions, divestitures and business optimization(2) | 1.8 | 4.3 | ||||||||||||
Accelerated technology investment(3) | 7.3 | 2.5 | ||||||||||||
Net other(4) | (0.2) | 35.3 | ||||||||||||
Amortization of certain intangible assets(5) | 47.9 | 48.7 | ||||||||||||
| Total adjustments before income tax items | 73.1 | 93.1 | ||||||||||||
| Change in provision for income taxes per schedule 4 | (25.2) | (22.6) | ||||||||||||
| Adjusted Net Income | $ | 175.8 | $ | 140.7 | ||||||||||
Weighted-average shares outstanding(6): | ||||||||||||||
| Basic | 190.9 | 189.2 | ||||||||||||
| Diluted | 192.5 | 192.2 | ||||||||||||
| Adjusted Earnings per Share: | ||||||||||||||
| Basic | $ | 0.92 | $ | 0.74 | ||||||||||
| Diluted | $ | 0.91 | $ | 0.73 | ||||||||||
| Anti-dilutive weighted stock-based awards outstanding | 0.3 | 0.2 | ||||||||||||
As a result of displaying amounts in millions, rounding differences may exist in the table above and footnotes below.
(1)Consisted of stock-based compensation and cash-settled stock-based compensation.
(2)For the three months ended March 31, 2021, consisted of the following adjustments: $1.1 million of adjustments to contingent consideration expense from previous acquisitions; $1.1 million of acquisition expenses; and a $(0.5) gain on the sale of a cost method investment.
For the three months ended March 31, 2020, consisted of the following adjustments: $3.8 million of Callcredit integration costs; $2.1 million of acquisition expenses; $0.3 million of adjustments to contingent consideration expense from previous acquisitions; a ($1.8) million gain on the disposal of assets of a small business in our United Kingdom region that are classified as held-for-sale; and a ($0.1) million reimbursement for transition services provided to the buyers of certain of our discontinued operations.
(3)Represents expenses associated with our accelerated technology investment.
(4)For the three months ended March 31, 2021, consisted of the following adjustments: $(0.2) million of net other, which includes gains from currency remeasurement of our foreign operations and deferred loan fees written off as a result of the prepayments on our debt.
Exhibit 99.1
For the three months ended March 31, 2020, consisted of the following adjustments: $30.5 million for certain legal expenses; a $4.9 million loss from currency remeasurement of our foreign operations; and $(0.1) million of net other, which includes fees related to our new swap agreements, administrative expenses associated with the Fraud Incident and a reimbursement of fees associated with the refinancing of our Senior Secured Credit Facility.
(5)Consisted of amortization of intangible assets from our 2012 change in control transaction and amortization of intangible assets established in business acquisitions after our 2012 change in control transaction.
(6)As of March 31, 2021 and March 31, 2020, there were 0.3 million and 1.3 million contingently-issuable performance-based stock awards outstanding in each respective period that were excluded from the diluted earnings per share calculation because the contingencies had not been met.
Exhibit 99.1
SCHEDULE 4
TRANSUNION AND SUBSIDIARIES
Effective Tax Rate and Adjusted Effective Tax Rate (Unaudited)
(dollars in millions)
| Three Months Ended March 31, | |||||||||||
| 2021 | 2020 | ||||||||||
| Income before income taxes | $ | 158.2 | $ | 96.6 | |||||||
| Total adjustments before income tax items from schedule 3 | 73.1 | 93.1 | |||||||||
| Noncontrolling interest portion of Adjusted Net Income adjustments | — | 0.1 | |||||||||
| Adjusted income before income taxes | $ | 231.3 | $ | 189.8 | |||||||
| (Provision) benefit for income taxes | $ | (27.5) | $ | (22.3) | |||||||
| Adjustments for income taxes: | |||||||||||
Tax effect of above adjustments(1) | (15.5) | (19.2) | |||||||||
Eliminate impact of excess tax benefits for share compensation(2) | (5.8) | (16.2) | |||||||||
Other(3) | (4.0) | 12.9 | |||||||||
| Total adjustments for income taxes | (25.2) | (22.6) | |||||||||
| Adjusted provision for income taxes | $ | (52.8) | $ | (44.9) | |||||||
| Effective tax rate | 17.4 | % | 23.1 | % | |||||||
| Adjusted Effective Tax Rate | 22.8 | % | 23.6 | % | |||||||
As a result of displaying amounts in millions, rounding differences may exist in the table above.
(1)Tax rates used to calculate the tax expense impact are based on the nature of each item.
(2)Eliminates the impact of excess tax benefits for share compensation.
(3)Eliminates impact of state and foreign tax rate changes on deferred taxes, valuation allowances on foreign net operating losses, capital losses and foreign tax credits and other discrete adjustments.
Exhibit 99.1
SCHEDULE 5
TRANSUNION AND SUBSIDIARIES
Segment Depreciation and Amortization (Unaudited)
(in millions)
| Three Months Ended March 31, | |||||||||||
| 2021 | 2020 | ||||||||||
| U.S. Markets | $ | 56.1 | $ | 55.9 | |||||||
| International | 33.0 | 29.4 | |||||||||
| Consumer Interactive | 3.7 | 3.7 | |||||||||
| Corporate | 1.5 | 1.4 | |||||||||
| Total depreciation and amortization | $ | 94.3 | $ | 90.3 | |||||||
As a result of displaying amounts in millions, rounding differences may exist in the table above.
Exhibit 99.1
SCHEDULE 6
TRANSUNION AND SUBSIDIARIES
Reconciliation of Non-GAAP Guidance (Unaudited)
(in millions, except per share data)
| Three Months Ended June 30, 2021 | Twelve Months Ended December 31, 2021 | ||||||||||||||||||||||
| Low | High | Low | High | ||||||||||||||||||||
| Guidance reconciliation of net income attributable to TransUnion to Adjusted EBITDA: | |||||||||||||||||||||||
| Net income attributable to TransUnion | $ | 112 | $ | 117 | $ | 425 | $ | 449 | |||||||||||||||
| Interest, taxes and depreciation and amortization | 151 | 153 | 592 | 599 | |||||||||||||||||||
| EBITDA | 263 | 270 | 1,017 | 1,048 | |||||||||||||||||||
Stock-based compensation, mergers, acquisitions divestitures and business optimization-related expenses and other adjustments(1) | 34 | 34 | 141 | 141 | |||||||||||||||||||
| Adjusted EBITDA | $ | 296 | $ | 303 | $ | 1,157 | $ | 1,189 | |||||||||||||||
| Reconciliation of diluted earnings per share to Adjusted Diluted Earnings per Share: | |||||||||||||||||||||||
| Diluted earnings per share | $ | 0.58 | $ | 0.61 | $ | 2.20 | $ | 2.33 | |||||||||||||||
Adjustments to diluted earnings per share(1) | 0.32 | 0.31 | 1.25 | 1.25 | |||||||||||||||||||
| Adjusted Diluted Earnings per Share | $ | 0.89 | $ | 0.92 | $ | 3.45 | $ | 3.58 | |||||||||||||||
As a result of displaying amounts in millions, rounding differences may exist in the table above.
(1)These adjustments include the same adjustments we make to our Adjusted EBITDA and Adjusted Net Income as discussed in the Non-GAAP Financial Measures section of our Earnings Release.