Exhibit 99.1

Trupanion Reports Fourth Quarter and Full Year 2019 Results
SEATTLE, WA. February 13, 2020 -- Trupanion, Inc. (Nasdaq: TRUP), a leading provider of medical insurance for cats and dogs, today announced financial results for the fourth quarter and year ended December 31, 2019.
“Over the past two decades, we’ve delivered consistent growth while scaling our operating expenses,” said Darryl Rawlings, Founder and CEO of Trupanion. "The consistency of our growth highlights our recurring revenue, supported by industry leading retention rates, and deep competitive moats. Our moats have taken decades for us to dig and position us to benefit from the growing spotlight on our category.”
2019 Financial and Business Highlights
• | Total revenue was $383.9 million, an increase of 26% compared to 2018. |
• | Total enrolled pets (including pets from our other business segment) was 646,728 at December 31, 2019, an increase of 24% over 2018. |
• | Subscription business revenue was $321.2 million, an increase of 22% compared to 2018. |
• | Subscription enrolled pets was 494,026 at December 31, 2019, an increase of 15% over 2018. |
• | Net loss was $(1.8) million, or $(0.05) per basic and diluted share, compared to a net loss of $(0.9) million, or $(0.03) per basic and diluted share, in 2018. |
• | Adjusted EBITDA was $10.6 million, compared to adjusted EBITDA of $8.6 million in 2018. |
• | Operating cash flow was $16.2 million and free cash flow was $10.8 million in 2019. This compared to operating cash flow of $12.7 million and free cash flow of $8.3 million, which excludes the cash outflow of $52.5 million related to the third quarter 2018 purchase of our headquarters building. |
Fourth Quarter 2019 Financial and Business Highlights
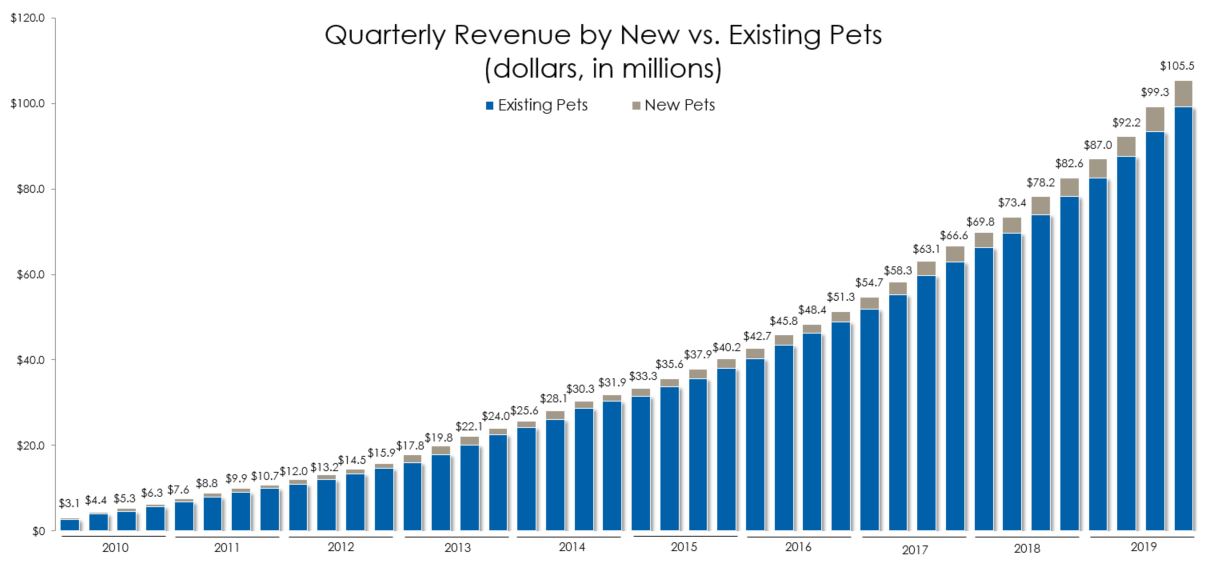
• | Total revenue was $105.5 million, an increase of 28% compared to the fourth quarter of 2018. |
• | Subscription business revenue was $86.6 million, an increase of 22% compared to the fourth quarter of 2018. |
• | Net income was $0.6 million, or $0.02 per basic and diluted share, compared to a net loss of $(0.3) million, or $(0.01) per basic and diluted share, in the fourth quarter of 2018. |
• | Adjusted EBITDA was $3.7 million, compared to adjusted EBITDA of $2.5 million in the fourth quarter of 2018. |
• | Operating cash flow was $4.5 million and free cash flow was $2.7 million for the fourth quarter of 2019. This compared to operating cash flow of $3.7 million and free cash flow of $2.6 million in the fourth quarter of 2018. |
1
Revenue by Quarter
Conference Call
Trupanion’s management will host a conference call today to review its fourth quarter 2019 results. The call is scheduled to begin shortly after 1:30 p.m. PT/ 4:30 p.m. ET. A live webcast will be accessible through the Investor Relations section of Trupanion’s website at http://investors.trupanion.com and will be archived online for 3 months upon completion of the conference call. Participants can access the conference call by dialing 1-877-407-0784 (United States) or 1-201-689-8560 (International). A telephonic replay of the call will also be available after the completion of the call, by dialing 1-844-512-2921 (United States) or 1-412-317-6671 (International) and entering the replay pin number: 13698321.
About Trupanion
Trupanion is a leader in medical insurance for cats and dogs throughout the United States and Canada. For almost two decades, Trupanion has given pet owners peace of mind so they can focus on their pet's recovery, not financial stress. Trupanion is committed to providing pet owners with the highest value in pet medical insurance with unlimited payouts for the life of their pets. Trupanion is listed on NASDAQ under the symbol "TRUP". The company was founded in 2000 and is headquartered in Seattle, WA. Trupanion policies are issued, in the United States, by its wholly-owned insurance entity American Pet Insurance Company and, in Canada, by Omega General Insurance Company. For more information, please visit trupanion.com.
Forward-Looking Statements
This press release contains forward-looking statements within the meaning of Section 27A of the Securities Act of 1933 and Section 21E of the Securities Exchange Act of 1934 relating to, among other things, expectations, plans, prospects and financial results for Trupanion, including, but not limited to, its expectations regarding its ability to execute its business plans. These forward-looking statements are based upon the current expectations and beliefs of Trupanion’s management as of the date of this press release, and are subject to certain risks and uncertainties that could cause actual results to differ materially from those described in the forward-looking statements. All forward-looking statements made in this press release are based on information available to Trupanion as of the date hereof, and Trupanion has no obligation to update these forward-looking statements.
2
In particular, the following factors, among others, could cause results to differ materially from those expressed or implied by such forward-looking statements: the ability to achieve or maintain profitability and/or appropriate levels of cash flow in future periods; the ability to keep growing our membership base and revenue; the accuracy of assumptions used in determining appropriate member acquisition expenditures; the severity and frequency of claims; the ability to maintain high retention rates; the accuracy of assumptions used in pricing medical plan subscriptions and the ability to accurately estimate the impact of new products or offerings on claims frequency; actual claims expense exceeding estimates; regulatory and other constraints on the ability to institute, or the decision to otherwise delay, pricing modifications in response to changes in actual or estimated claims expense; the effectiveness and statutory or regulatory compliance of our Territory Partner model and of our Territory Partners, veterinarians and other third parties in recommending medical plan subscriptions to potential members; the ability to retain existing Territory Partners and increase the number of Territory Partners and active hospitals; compliance by us and those referring us members with laws and regulations that apply to our business, including the sale of a pet medical plan; the ability to maintain the security of our data; fluctuations in the Canadian currency exchange rate; the ability to protect our proprietary and member information; the ability to maintain our culture and team; the ability to maintain the requisite amount of risk-based capital; our ability to implement and maintain effective controls, including over financial reporting; the ability to protect and enforce Trupanion’s intellectual property rights; the ability to continue key contractual relationships with third parties; third-party claims including litigation and regulatory actions; the ability to recognize benefits from investments in new solutions and enhancements to Trupanion’s technology platform and website; and our ability to retain key personnel.
For a detailed discussion of these and other cautionary statements, please refer to the risk factors discussed in filings with the Securities and Exchange Commission (SEC), including but not limited to, Trupanion’s Annual Report on Form 10-K for the year ended December 31, 2018 and any subsequently filed reports on Forms 10-Q and 8-K. All documents are available through the SEC’s Electronic Data Gathering Analysis and Retrieval system at www.sec.gov or the Investor Relations section of Trupanion’s website at http://investors.trupanion.com.
Non-GAAP Financial Measures
Trupanion’s stated results include certain non-GAAP financial measures. These non-GAAP financial measures may not provide information that is directly comparable to that provided by other companies in its industry as other companies in its industry may calculate or use non-GAAP financial measures differently. In addition, there are limitations in using non-GAAP financial measures because the non-GAAP financial measures are not prepared in accordance with GAAP, may be different from non-GAAP financial measures used by other companies and exclude expenses that may have a material impact on Trupanion’s reported financial results. The presentation and utilization of non-GAAP financial measures is not meant to be considered in isolation or as a substitute for the directly comparable financial measures prepared in accordance with GAAP. Trupanion urges its investors to review the reconciliation of its non-GAAP financial measures to the most directly comparable GAAP financial measures in its consolidated financial statements, and not to rely on any single financial or operating measure to evaluate its business. These reconciliations are included below and on Trupanion’s Investor Relations website.
Because of varying available valuation methodologies, subjective assumptions and the variety of equity instruments that can impact a company’s non-cash expenses, Trupanion believes that providing various non-GAAP financial measures that exclude stock-based compensation expense and depreciation and amortization expense allows for more meaningful comparisons between its operating results from period to period. Trupanion offsets sales and marketing expense with sign-up fee revenue in the calculation of net acquisition cost because it collects sign-up fee revenue from new members at the time of enrollment and considers it to be an offset to a portion of Trupanion’s sales and marketing expenses. Trupanion believes this allows it to calculate and present financial measures in a consistent manner across periods. Trupanion’s management believes that the non-GAAP financial measures and the related financial measures derived from them are important tools for financial and operational decision-making and for evaluating operating results over different periods of time.
3
Changes in Presentation of Key Operating Metrics
Trupanion presents various key operating metrics that managements uses to assess the company’s performance. Starting with the year ended December 31, 2019, Trupanion has updated its calculation of lifetime value of a pet (LVP) to include general and administrative and technology expenses, now referred to as lifetime value of a pet, including fixed expenses. This change was made in order to provide a more fulsome metric when calculating the estimated payback period for pet acquisition spend. For further discussion of the key operating metrics Trupanion uses, including a reconciliation between its historical presentation of LVP and its new presentation of lifetime value of a pet, including fixed expenses, please refer to Trupanion’s Annual Report on Form 10-K for the year ended December 31, 2019.
4
Trupanion, Inc. Consolidated Statements of Operations (in thousands, except share data) | |||||||||||||||
Three Months Ended December 31, | Year Ended December 31, | ||||||||||||||
2019 | 2018 | 2019 | 2018 | ||||||||||||
(unaudited) | |||||||||||||||
Revenue: | |||||||||||||||
Subscription business | $ | 86,592 | $ | 70,933 | $ | 321,163 | $ | 263,738 | |||||||
Other business | 18,891 | 11,707 | 62,773 | 40,218 | |||||||||||
Total revenue | 105,483 | 82,640 | 383,936 | 303,956 | |||||||||||
Cost of revenue: | |||||||||||||||
Subscription business(1) | 70,718 | 57,892 | 262,139 | 215,992 | |||||||||||
Other business | 17,031 | 10,543 | 56,873 | 36,598 | |||||||||||
Total cost of revenue(2) | 87,749 | 68,435 | 319,012 | 252,590 | |||||||||||
Gross profit: | |||||||||||||||
Subscription business | 15,874 | 13,041 | 59,024 | 47,746 | |||||||||||
Other business | 1,860 | 1,164 | 5,900 | 3,620 | |||||||||||
Total gross profit | 17,734 | 14,205 | 64,924 | 51,366 | |||||||||||
Operating expenses: | |||||||||||||||
Technology and development(1) | 2,556 | 2,487 | 10,074 | 9,248 | |||||||||||
General and administrative(1) | 5,312 | 4,922 | 20,967 | 18,164 | |||||||||||
Sales and marketing(1) | 9,212 | 6,994 | 35,451 | 24,999 | |||||||||||
Total operating expenses | 17,080 | 14,403 | 66,492 | 52,411 | |||||||||||
Gain (loss) from investment in joint venture | (21 | ) | — | (352 | ) | — | |||||||||
Operating income (loss) | 633 | (198 | ) | (1,920 | ) | (1,045 | ) | ||||||||
Interest expense | 375 | 311 | 1,349 | 1,198 | |||||||||||
Other income, net | (535 | ) | (238 | ) | (1,629 | ) | (1,309 | ) | |||||||
Loss before income taxes | 793 | (271 | ) | (1,640 | ) | (934 | ) | ||||||||
Income tax expense (benefit) | 157 | 4 | 169 | (7 | ) | ||||||||||
Net income (loss) | $ | 636 | $ | (275 | ) | $ | (1,809 | ) | $ | (927 | ) | ||||
Net income (loss) per share: | |||||||||||||||
Basic | $ | 0.02 | $ | (0.01 | ) | $ | (0.05 | ) | $ | (0.03 | ) | ||||
Diluted | 0.02 | (0.01 | ) | (0.05 | ) | (0.03 | ) | ||||||||
Weighted average common shares outstanding: | |||||||||||||||
Basic | 34,876,438 | 33,716,975 | 34,645,345 | 31,961,192 | |||||||||||
Diluted | 36,354,620 | 33,716,975 | 34,645,345 | 31,961,192 | |||||||||||
(1)Includes stock-based compensation expense as follows: | Three Months Ended December 31, | Year Ended December 31, | |||||||||||||
2019 | 2018 | 2019 | 2018 | ||||||||||||
Cost of revenue | $ | 267 | $ | 230 | $ | 1,050 | $ | 927 | |||||||
Technology and development | 97 | 42 | 364 | 209 | |||||||||||
General and administrative | 860 | 595 | 3,312 | 2,304 | |||||||||||
Sales and marketing | 547 | 355 | 2,120 | 1,335 | |||||||||||
Total stock-based compensation expense | $ | 1,771 | $ | 1,222 | $ | 6,846 | $ | 4,775 | |||||||
(2)The breakout of cost of revenue between veterinary invoice expense and other cost of revenue is as follows: | |||||||||||||||
Three Months Ended December 31, | Year Ended December 31, | ||||||||||||||
2019 | 2018 | 2019 | 2018 | ||||||||||||
Veterinary invoice expense | $ | 74,646 | $ | 58,343 | $ | 270,947 | $ | 214,539 | |||||||
Other cost of revenue | 13,103 | 10,092 | 48,065 | 38,051 | |||||||||||
Total cost of revenue | $ | 87,749 | $ | 68,435 | $ | 319,012 | $ | 252,590 | |||||||
5
Trupanion, Inc. Consolidated Balance Sheets (in thousands, except share data) | |||||||
December 31, 2019 | December 31, 2018 | ||||||
Assets | |||||||
Current assets: | |||||||
Cash and cash equivalents | $ | 29,168 | $ | 26,552 | |||
Short-term investments | 69,732 | 54,559 | |||||
Accounts and other receivables | 54,408 | 31,565 | |||||
Prepaid expenses and other assets | 5,513 | 5,300 | |||||
Total current assets | 158,821 | 117,976 | |||||
Restricted cash | 1,400 | 1,400 | |||||
Long-term investments, at fair value | 4,323 | 3,554 | |||||
Property and equipment, net | 70,372 | 69,803 | |||||
Intangible assets, net | 7,731 | 8,071 | |||||
Other long-term assets | 14,553 | 6,706 | |||||
Total assets | $ | 257,200 | $ | 207,510 | |||
Liabilities and stockholders’ equity | |||||||
Current liabilities: | |||||||
Accounts payable | $ | 4,087 | $ | 2,767 | |||
Accrued liabilities and other current liabilities | 13,798 | 11,347 | |||||
Reserve for veterinary invoices | 21,194 | 16,062 | |||||
Deferred revenue | 52,546 | 33,027 | |||||
Total current liabilities | 91,625 | 63,203 | |||||
Long-term debt | 26,086 | 12,862 | |||||
Deferred tax liabilities | 1,118 | 1,002 | |||||
Other liabilities | 1,611 | 1,270 | |||||
Total liabilities | 120,440 | 78,337 | |||||
Stockholders’ equity: | |||||||
Common stock: $0.00001 par value per share, 100,000,000 shares authorized at December 31, 2019 and December 31, 2018, 35,876,882 and 34,947,017 shares issued and outstanding at December 31, 2019; 34,781,121 and 34,025,136 shares issued and outstanding at December 31, 2018 | — | — | |||||
Preferred stock: $0.00001 par value per share, 10,000,000 shares authorized at December 31, 2019 and December 31, 2018, and 0 shares issued and outstanding at December 31, 2019 and December 31, 2018 | — | — | |||||
Additional paid-in capital | 232,731 | 219,838 | |||||
Accumulated other comprehensive loss | 250 | (753 | ) | ||||
Accumulated deficit | (85,520 | ) | (83,711 | ) | |||
Treasury stock, at cost: 929,865 shares at December 31, 2019 and 755,985 shares at December 31, 2018 | (10,701 | ) | (6,201 | ) | |||
Total stockholders’ equity | 136,760 | 129,173 | |||||
Total liabilities and stockholders’ equity | $ | 257,200 | $ | 207,510 | |||
6
Trupanion, Inc. Consolidated Statements of Cash Flows (in thousands) | |||||||||||||||
Three Months Ended December 31, | Year Ended December 31, | ||||||||||||||
2019 | 2018 | 2019 | 2018 | ||||||||||||
(unaudited) | |||||||||||||||
Operating activities | |||||||||||||||
Net income (loss) | $ | 636 | $ | (275 | ) | $ | (1,809 | ) | $ | (927 | ) | ||||
Adjustments to reconcile net loss to cash provided by operating activities: | |||||||||||||||
Depreciation and amortization | 1,274 | 1,486 | 5,632 | 4,512 | |||||||||||
Stock-based compensation expense | 1,771 | 1,222 | 6,846 | 4,775 | |||||||||||
Gain on sale of equity method investment | — | — | — | — | |||||||||||
Other, net | (38 | ) | (5 | ) | 105 | (240 | ) | ||||||||
Changes in operating assets and liabilities: | |||||||||||||||
Accounts and other receivables | (4,190 | ) | 344 | (22,772 | ) | (11,248 | ) | ||||||||
Prepaid expenses and other assets | (707 | ) | (2,079 | ) | (432 | ) | (2,628 | ) | |||||||
Accounts payable, accrued liabilities, and other liabilities | 1,304 | 682 | 4,110 | 4,531 | |||||||||||
Reserve for veterinary invoices | 1,872 | 1,956 | 5,059 | 3,440 | |||||||||||
Deferred revenue | 2,610 | 332 | 19,418 | 10,465 | |||||||||||
Net cash provided by operating activities | 4,532 | 3,663 | 16,157 | 12,680 | |||||||||||
Investing activities | |||||||||||||||
Purchases of investment securities | (20,014 | ) | (23,295 | ) | (65,506 | ) | (52,862 | ) | |||||||
Maturities of investment securities | 21,538 | 8,008 | 49,762 | 35,413 | |||||||||||
Purchases of other investments | (4,000 | ) | — | (4,000 | ) | (3,000 | ) | ||||||||
Acquisition of lease intangibles, related to corporate real estate acquisition | — | — | — | (2,959 | ) | ||||||||||
Purchases of property and equipment | (1,787 | ) | (1,080 | ) | (5,373 | ) | (56,936 | ) | |||||||
Other | (954 | ) | (255 | ) | (2,891 | ) | (1,107 | ) | |||||||
Net cash used in investing activities | (5,217 | ) | (16,622 | ) | (28,008 | ) | (81,451 | ) | |||||||
Financing activities | |||||||||||||||
Proceeds from public offering of common stock, net of offering costs | — | — | — | 65,671 | |||||||||||
Proceeds from exercise of stock options | 727 | 729 | 2,982 | 3,601 | |||||||||||
Shares withheld to satisfy tax withholding | (57 | ) | — | (1,667 | ) | (1,839 | ) | ||||||||
Proceeds from debt financing, net of financing fees | 4,000 | 4,242 | 13,167 | 13,431 | |||||||||||
Repayment of debt financing | — | — | — | (10,000 | ) | ||||||||||
Other financing | — | 581 | (438 | ) | 365 | ||||||||||
Net cash provided by financing activities | 4,670 | 5,552 | 14,044 | 71,229 | |||||||||||
Effect of foreign exchange rate changes on cash, cash equivalents, and restricted cash, net | 156 | (718 | ) | 423 | (812 | ) | |||||||||
Net change in cash, cash equivalents, and restricted cash | 4,141 | (8,125 | ) | 2,616 | 1,646 | ||||||||||
Cash, cash equivalents, and restricted cash at beginning of period | 26,427 | 36,077 | 27,952 | 26,306 | |||||||||||
Cash, cash equivalents, and restricted cash at end of period | $ | 30,568 | $ | 27,952 | $ | 30,568 | $ | 27,952 | |||||||
7
The following tables set forth our key operating metrics: | |||||||||||||||||||||||||||||||
Year Ended December 31, | |||||||||||||||||||||||||||||||
2019 | 2018 | ||||||||||||||||||||||||||||||
Total Business: | |||||||||||||||||||||||||||||||
Total pets enrolled (at period end) | 646,728 | 521,326 | |||||||||||||||||||||||||||||
Subscription Business: | |||||||||||||||||||||||||||||||
Total subscription pets enrolled (at period end) | 494,026 | 430,770 | |||||||||||||||||||||||||||||
Monthly average revenue per pet | $ | 57.52 | $ | 54.34 | |||||||||||||||||||||||||||
Lifetime value of a pet, including fixed expenses | $ | 523 | $ | 449 | |||||||||||||||||||||||||||
Average pet acquisition cost (PAC) | $ | 212 | $ | 164 | |||||||||||||||||||||||||||
Average monthly retention | 98.58 | % | 98.60 | % | |||||||||||||||||||||||||||
Three Months Ended | |||||||||||||||||||||||||||||||
Dec. 31, 2019 | Sept. 30, 2019 | Jun. 30, 2019 | Mar. 31, 2019 | Dec. 31, 2018 | Sept. 30, 2018 | Jun. 30, 2018 | Mar. 31, 2018 | ||||||||||||||||||||||||
Total Business: | |||||||||||||||||||||||||||||||
Total pets enrolled (at period end) | 646,728 | 613,694 | 577,686 | 548,002 | 521,326 | 497,942 | 472,480 | 446,533 | |||||||||||||||||||||||
Subscription Business: | |||||||||||||||||||||||||||||||
Total subscription pets enrolled (at period end) | 494,026 | 479,427 | 461,314 | 445,148 | 430,770 | 416,527 | 401,033 | 385,640 | |||||||||||||||||||||||
Monthly average revenue per pet | $ | 58.58 | $ | 58.12 | $ | 57.11 | $ | 56.13 | $ | 55.15 | $ | 54.55 | $ | 53.96 | $ | 53.62 | |||||||||||||||
Lifetime value of a pet, including fixed expenses | $ | 523 | $ | 511 | $ | 482 | $ | 471 | $ | 449 | $ | 435 | $ | 431 | $ | 419 | |||||||||||||||
Average pet acquisition cost (PAC) | $ | 222 | $ | 208 | $ | 213 | $ | 205 | $ | 186 | $ | 155 | $ | 150 | $ | 165 | |||||||||||||||
Average monthly retention | 98.58 | % | 98.59 | % | 98.57 | % | 98.58 | % | 98.60 | % | 98.61 | % | 98.64 | % | 98.63 | % | |||||||||||||||
8
The following table reflects the reconciliation of cash provided by operating activities to free cash flow (in thousands): | ||||||||||||||||
Three Months Ended December 31, | Year Ended December 31, | |||||||||||||||
2019 | 2018 | 2019 | 2018 | |||||||||||||
Net cash provided by operating activities | $ | 4,532 | $ | 3,663 | $ | 16,157 | $ | 12,680 | ||||||||
Purchases of property and equipment | (1,787 | ) | (1,080 | ) | (5,373 | ) | (56,936 | ) | ||||||||
Free cash flow | $ | 2,745 | $ | 2,583 | $ | 10,784 | $ | (44,256 | ) | |||||||
Exclude building purchase, net of acquired lease intangibles | — | — | — | 52,534 | ||||||||||||
Free cash flow, excluding building purchase, net of acquired lease intangibles | $ | 2,745 | $ | 2,583 | $ | 10,784 | $ | 8,278 | ||||||||
9
The following tables reflect the reconciliation of acquisition cost and net acquisition cost to sales and marketing expense (in thousands): | |||||||||||||||||||||||||||||||
Year Ended December 31, | |||||||||||||||||||||||||||||||
2019 | 2018 | ||||||||||||||||||||||||||||||
Sales and marketing expenses | $ | 35,451 | $ | 24,999 | |||||||||||||||||||||||||||
Excluding: | |||||||||||||||||||||||||||||||
Stock-based compensation expense | (2,120 | ) | (1,335 | ) | |||||||||||||||||||||||||||
Acquisition cost | 33,331 | 23,664 | |||||||||||||||||||||||||||||
Net of: | |||||||||||||||||||||||||||||||
Sign-up fee revenue | (2,957 | ) | (2,587 | ) | |||||||||||||||||||||||||||
Other business segment sales and marketing expense | (414 | ) | (377 | ) | |||||||||||||||||||||||||||
Net acquisition cost | $ | 29,960 | $ | 20,700 | |||||||||||||||||||||||||||
Three Months Ended | |||||||||||||||||||||||||||||||
Dec. 31, 2019 | Sept. 30, 2019 | Jun. 30, 2019 | Mar. 31, 2019 | Dec. 31, 2018 | Sept. 30, 2018 | Jun. 30, 2018 | Mar. 31, 2018 | ||||||||||||||||||||||||
Sales and marketing expenses | $ | 9,212 | $ | 9,255 | $ | 8,757 | $ | 8,227 | $ | 6,994 | $ | 6,365 | $ | 5,702 | $ | 5,938 | |||||||||||||||
Excluding: | |||||||||||||||||||||||||||||||
Stock-based compensation expense | (547 | ) | (577 | ) | (567 | ) | (429 | ) | (355 | ) | (358 | ) | (349 | ) | (273 | ) | |||||||||||||||
Acquisition cost | 8,665 | 8,678 | 8,190 | 7,798 | 6,639 | 6,007 | 5,353 | 5,665 | |||||||||||||||||||||||
Net of: | |||||||||||||||||||||||||||||||
Sign-up fee revenue | (730 | ) | (790 | ) | (734 | ) | (703 | ) | (655 | ) | (693 | ) | (624 | ) | (616 | ) | |||||||||||||||
Other business segment sales and marketing expense | (152 | ) | (94 | ) | (38 | ) | (130 | ) | (102 | ) | (99 | ) | (88 | ) | (87 | ) | |||||||||||||||
Net acquisition cost | $ | 7,783 | $ | 7,794 | $ | 7,418 | $ | 6,965 | $ | 5,882 | $ | 5,215 | $ | 4,641 | $ | 4,962 | |||||||||||||||
10
The following tables reflect the reconciliation of adjusted EBITDA to net income (loss) (in thousands): | |||||||||||||||||||||||||||||||
Year Ended December 31, | |||||||||||||||||||||||||||||||
2019 | 2018 | ||||||||||||||||||||||||||||||
Net loss | $ | (1,809 | ) | $ | (927 | ) | |||||||||||||||||||||||||
Excluding: | |||||||||||||||||||||||||||||||
Stock-based compensation expense | 6,846 | 4,775 | |||||||||||||||||||||||||||||
Depreciation and amortization expense | 5,632 | 4,512 | |||||||||||||||||||||||||||||
Interest income | (1,681 | ) | (862 | ) | |||||||||||||||||||||||||||
Interest expense | 1,349 | 1,198 | |||||||||||||||||||||||||||||
Other non-operating expenses | 201 | — | |||||||||||||||||||||||||||||
Income tax expense (benefit) | 169 | (7 | ) | ||||||||||||||||||||||||||||
Gain from equity method investment | (125 | ) | (107 | ) | |||||||||||||||||||||||||||
Adjusted EBITDA | $ | 10,582 | $ | 8,582 | |||||||||||||||||||||||||||
Three Months Ended | |||||||||||||||||||||||||||||||
Dec. 31, 2019 | Sept. 30, 2019 | Jun. 30, 2019 | Mar. 31, 2019 | Dec. 31, 2018 | Sept. 30, 2018 | Jun. 30, 2018 | Mar. 31, 2018 | ||||||||||||||||||||||||
Net income (loss) | $ | 636 | $ | 782 | $ | (1,931 | ) | $ | (1,296 | ) | $ | (275 | ) | $ | 1,205 | $ | (377 | ) | $ | (1,480 | ) | ||||||||||
Excluding: | |||||||||||||||||||||||||||||||
Stock-based compensation expense | 1,771 | 1,845 | 1,873 | 1,357 | 1,222 | 1,299 | 1,286 | 968 | |||||||||||||||||||||||
Depreciation and amortization expense | 1,274 | 1,181 | 1,564 | 1,613 | 1,485 | 1,136 | 964 | 927 | |||||||||||||||||||||||
Interest income | (516 | ) | (411 | ) | (412 | ) | (342 | ) | (234 | ) | (317 | ) | (179 | ) | (132 | ) | |||||||||||||||
Interest expense | 375 | 340 | 317 | 317 | 311 | 336 | 332 | 219 | |||||||||||||||||||||||
Other non-operating expenses | (22 | ) | 122 | 101 | — | — | — | — | — | ||||||||||||||||||||||
Income tax expense (benefit) | 157 | 18 | (46 | ) | 40 | 4 | (7 | ) | 91 | (95 | ) | ||||||||||||||||||||
(Gain) loss from equity method investment | — | — | (125 | ) | — | — | — | (107 | ) | — | |||||||||||||||||||||
Adjusted EBITDA | $ | 3,675 | $ | 3,877 | $ | 1,341 | $ | 1,689 | $ | 2,513 | $ | 3,652 | $ | 2,010 | $ | 407 | |||||||||||||||
11
Contacts:
Investors:
Laura Bainbridge, Head of Investor Relations
206.607.1929
12